惠普 Pavilion 17z-ak000 (A9-9420, Radeon 530) 笔记本电脑简短评测
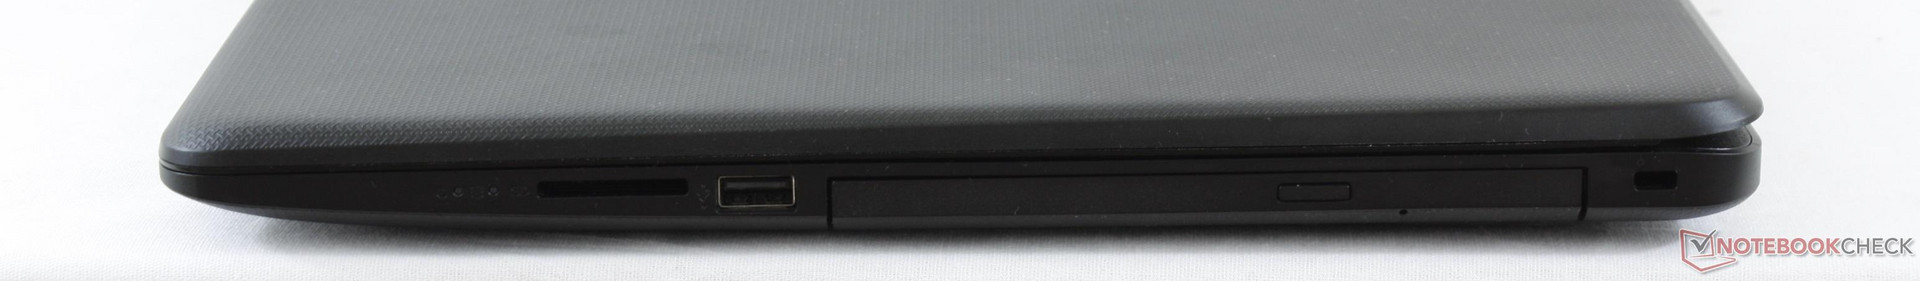
| SD Card Reader | |
| average JPG Copy Test (av. of 3 runs) | |
| HP Pavilion Power 15t-cb2000 | |
| HP Pavilion 17z 1EX13AV | |
| Lenovo Thinkpad 13-20J1001BUS | |
| maximum AS SSD Seq Read Test (1GB) | |
| HP Pavilion Power 15t-cb2000 | |
| HP Pavilion 17z 1EX13AV | |
| Lenovo Thinkpad 13-20J1001BUS | |
| Networking | |
| iperf3 transmit AX12 | |
| Lenovo Thinkpad 13-20J1001BUS | |
| HP Pavilion Power 15t-cb2000 | |
| HP Pavilion 17z 1EX13AV | |
| iperf3 receive AX12 | |
| Lenovo Thinkpad 13-20J1001BUS | |
| HP Pavilion Power 15t-cb2000 | |
| HP Pavilion 17z 1EX13AV | |
| |||||||||||||||||||||||||
Brightness Distribution: 90 %
Center on Battery: 363.6 cd/m²
Contrast: 983:1 (Black: 0.37 cd/m²)
ΔE ColorChecker Calman: 5.8 | ∀{0.5-29.43 Ø4.71}
ΔE Greyscale Calman: 8.8 | ∀{0.09-98 Ø4.96}
87.3% sRGB (Argyll 1.6.3 3D)
57.2% AdobeRGB 1998 (Argyll 1.6.3 3D)
64% AdobeRGB 1998 (Argyll 3D)
87.5% sRGB (Argyll 3D)
64.8% Display P3 (Argyll 3D)
Gamma: 2.16
CCT: 5900 K
| HP Pavilion 17z 1EX13AV ID: AUO109D, Name: AU Optronics B173HW01 V0, IPS, 17.3", 1920x1080 | HP Pavilion 17z 1EX13AV ID: AUO109D, Name: AU Optronics B173HW01 V0, IPS, 17.3", 1920x1080 | HP Pavilion Power 15t-cb2000 AUO41ED , IPS, 15.6", 1920x1080 | Lenovo V510-15IKB 80WQ0002GE LG Philips LP156WF6-SPK3, IPS, 15.6", 1920x1080 | Asus X555DA-BB11 TN LED, 15.6", 1920x1080 | |
|---|---|---|---|---|---|
| Display | 0% | -36% | -37% | -43% | |
| Display P3 Coverage (%) | 64.8 | 64.3 -1% | 39.28 -39% | 38.8 -40% | 35.12 -46% |
| sRGB Coverage (%) | 87.5 | 88.5 1% | 58.9 -33% | 58.1 -34% | 52.7 -40% |
| AdobeRGB 1998 Coverage (%) | 64 | 64.6 1% | 40.59 -37% | 40.12 -37% | 36.29 -43% |
| Response Times | -9% | -30% | -13% | -3% | |
| Response Time Grey 50% / Grey 80% * (ms) | 34 ? | 40.8 ? -20% | 51.6 ? -52% | 39 ? -15% | 42 ? -24% |
| Response Time Black / White * (ms) | 27.2 ? | 26.4 ? 3% | 29.2 ? -7% | 30 ? -10% | 22.4 ? 18% |
| PWM Frequency (Hz) | 20000 ? | ||||
| Screen | 12% | -9% | -7% | -26% | |
| Brightness middle (cd/m²) | 363.6 | 333.5 -8% | 256 -30% | 256 -30% | 242.7 -33% |
| Brightness (cd/m²) | 349 | 323 -7% | 241 -31% | 252 -28% | 232 -34% |
| Brightness Distribution (%) | 90 | 91 1% | 88 -2% | 87 -3% | 88 -2% |
| Black Level * (cd/m²) | 0.37 | 0.32 14% | 0.21 43% | 0.3 19% | 0.52 -41% |
| Contrast (:1) | 983 | 1042 6% | 1219 24% | 853 -13% | 467 -52% |
| Colorchecker dE 2000 * | 5.8 | 4 31% | 5.2 10% | 5.4 7% | 4.9 16% |
| Colorchecker dE 2000 max. * | 10 | 6.9 31% | 19.3 -93% | 9.36 6% | 20.3 -103% |
| Greyscale dE 2000 * | 8.8 | 4.5 49% | 3.5 60% | 5.37 39% | 2.7 69% |
| Gamma | 2.16 102% | 2.19 100% | 2.35 94% | 2.58 85% | 2.34 94% |
| CCT | 5900 110% | 6386 102% | 6576 99% | 6795 96% | 6876 95% |
| Color Space (Percent of AdobeRGB 1998) (%) | 57.2 | 57.5 1% | 37 -35% | 37 -35% | 33.5 -41% |
| Color Space (Percent of sRGB) (%) | 87.3 | 88.1 1% | 59 -32% | 58 -34% | 52.5 -40% |
| Total Average (Program / Settings) | 1% /
7% | -25% /
-17% | -19% /
-14% | -24% /
-26% |
* ... smaller is better
Display Response Times
| ↔ Response Time Black to White | ||
|---|---|---|
| 27.2 ms ... rise ↗ and fall ↘ combined | ↗ 16.4 ms rise | 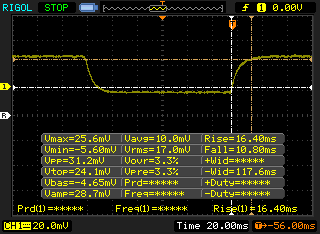 |
| ↘ 10.8 ms fall | ||
| The screen shows relatively slow response rates in our tests and may be too slow for gamers. In comparison, all tested devices range from 0.1 (minimum) to 240 (maximum) ms. » 69 % of all devices are better. This means that the measured response time is worse than the average of all tested devices (19.8 ms). | ||
| ↔ Response Time 50% Grey to 80% Grey | ||
| 34 ms ... rise ↗ and fall ↘ combined | ↗ 15.6 ms rise | 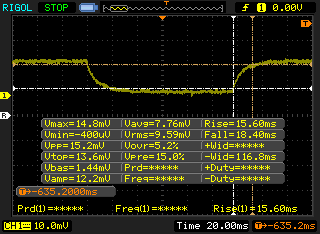 |
| ↘ 18.4 ms fall | ||
| The screen shows slow response rates in our tests and will be unsatisfactory for gamers. In comparison, all tested devices range from 0.165 (minimum) to 636 (maximum) ms. » 47 % of all devices are better. This means that the measured response time is similar to the average of all tested devices (31 ms). | ||
Screen Flickering / PWM (Pulse-Width Modulation)
| Screen flickering / PWM not detected | 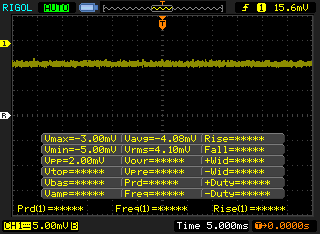 | ||
In comparison: 52 % of all tested devices do not use PWM to dim the display. If PWM was detected, an average of 7751 (minimum: 5 - maximum: 343500) Hz was measured. | |||
| Cinebench R11.5 | |
| CPU Single 64Bit | |
| Lenovo Thinkpad 13-20J1001BUS | |
| HP Pavilion 17z 1EX13AV | |
| HP 15-bw077ax | |
| HP Pavilion 17z 1EX13AV | |
| HP Pavilion 14t-ab000 K9E07AV | |
| HP EliteBook 725 G4 | |
| HP Pavilion 15z-bw000 | |
| Asus X555LD-XX283H | |
| CPU Multi 64Bit | |
| Lenovo Thinkpad 13-20J1001BUS | |
| HP Pavilion 17z 1EX13AV | |
| HP Pavilion 15z-bw000 | |
| HP EliteBook 725 G4 | |
| HP Pavilion 14t-ab000 K9E07AV | |
| Asus X555LD-XX283H | |
| HP Pavilion 17z 1EX13AV | |
| HP 15-bw077ax | |
| Cinebench R10 | |
| Rendering Multiple CPUs 32Bit | |
| Lenovo Thinkpad 13-20J1001BUS | |
| HP Pavilion 15z-bw000 | |
| HP Pavilion 17z 1EX13AV | |
| HP EliteBook 725 G4 | |
| Asus X555LD-XX283H | |
| HP Pavilion 17z 1EX13AV | |
| HP 15-bw077ax | |
| Rendering Single 32Bit | |
| Lenovo Thinkpad 13-20J1001BUS | |
| HP Pavilion 17z 1EX13AV | |
| HP 15-bw077ax | |
| HP Pavilion 17z 1EX13AV | |
| HP EliteBook 725 G4 | |
| Asus X555LD-XX283H | |
| HP Pavilion 15z-bw000 | |
| wPrime 2.10 - 1024m | |
| HP 15-bw077ax | |
| HP Pavilion 14t-ab000 K9E07AV | |
| HP Pavilion 17z 1EX13AV | |
| Lenovo Thinkpad 13-20J1001BUS | |
| HP EliteBook 725 G4 | |
| HP Pavilion 15z-bw000 | |
| HP Pavilion 17z 1EX13AV | |
* ... smaller is better
| PCMark 8 | |
| Home Score Accelerated v2 | |
| HP Pavilion Power 15t-cb2000 | |
| Toshiba Satellite Pro R50-C-16V | |
| HP Pavilion 17z 1EX13AV | |
| Asus X555DA-BB11 | |
| Work Score Accelerated v2 | |
| HP Pavilion Power 15t-cb2000 | |
| HP Pavilion 17z 1EX13AV | |
| Toshiba Satellite Pro R50-C-16V | |
| Asus X555DA-BB11 | |
| Creative Score Accelerated v2 | |
| HP Pavilion Power 15t-cb2000 | |
| Toshiba Satellite Pro R50-C-16V | |
| HP Pavilion 17z 1EX13AV | |
| Asus X555DA-BB11 | |
| PCMark 8 Home Score Accelerated v2 | 2897 points | |
| PCMark 8 Creative Score Accelerated v2 | 3174 points | |
| PCMark 8 Work Score Accelerated v2 | 3976 points | |
| PCMark 10 Score | 2046 points | |
Help | ||
| HP Pavilion 17z 1EX13AV Avolusion MD1TBLSSHD | Asus X555DA-BB11 Seagate Momentus SpinPoint M8 ST1000LM024 HN-M101MBB | Toshiba Satellite Pro R50-C-16V TOSHIBA MQ01ABD075 | Lenovo V510-15IKB 80WQ0002GE Samsung CM871a MZNTY256HDHP | HP Pavilion 17z 1EX13AV WDC Scorpio Blue WD10JPVX-60JC3T1 | |
|---|---|---|---|---|---|
| CrystalDiskMark 3.0 | -2% | -15% | 13527% | 2% | |
| Read Seq (MB/s) | 90 | 106.9 19% | 96.5 7% | 532 491% | 90 0% |
| Write Seq (MB/s) | 93.4 | 97.5 4% | 77.9 -17% | 511 447% | 90.3 -3% |
| Read 512 (MB/s) | 28.71 | 32.28 12% | 20.82 -27% | 414.8 1345% | 28.47 -1% |
| Write 512 (MB/s) | 44.35 | 35.39 -20% | 19.83 -55% | 307.7 594% | 47.07 6% |
| Read 4k (MB/s) | 0.316 | 0.373 18% | 0.342 8% | 39.51 12403% | 0.31 -2% |
| Write 4k (MB/s) | 0.813 | 0.636 -22% | 0.836 3% | 108.1 13196% | 0.3997 -51% |
| Read 4k QD32 (MB/s) | 0.711 | 0.694 -2% | 0.595 -16% | 361.6 50758% | 1.021 44% |
| Write 4k QD32 (MB/s) | 0.87 | 0.682 -22% | 0.706 -19% | 253 28980% | 1.076 24% |

| 3DMark 11 Performance | 2121 points | |
| 3DMark Ice Storm Standard Score | 40215 points | |
| 3DMark Cloud Gate Standard Score | 3749 points | |
| 3DMark Fire Strike Score | 1062 points | |
Help | ||
| Rise of the Tomb Raider - 1024x768 Lowest Preset | |
| Acer Aspire E5-575G-549D | |
| Samsung Notebook 9 NP900X5N-X01US | |
| HP Pavilion 17z 1EX13AV | |
| HP Pavilion 17z 1EX13AV | |
| Apple MacBook Pro 13 2016 | |
| Microsoft Surface Pro (2017) i7 | |
| Asus X302UV-FN016T | |
| HP Pavilion 15z-bw000 | |
| HP 15-bw075ax | |
| Lenovo Yoga 510-14AST | |
| Microsoft Surface Pro (2017) i5 | |
| Doom - 1280x720 Low Preset | |
| Apple MacBook Pro 13 2016 | |
| HP Pavilion 17z 1EX13AV | |
| HP Pavilion 17z 1EX13AV | |
| Overwatch - 1280x720 Low (Render Scale 100 %) AA:FX AF:1x | |
| Acer Aspire E5-575G-549D | |
| Apple MacBook Pro 13 2016 | |
| Samsung Notebook 9 NP900X5N-X01US | |
| Microsoft Surface Pro (2017) i7 | |
| HP Pavilion 17z 1EX13AV | |
| HP Pavilion 17z 1EX13AV | |
| low | med. | high | ultra | |
|---|---|---|---|---|
| StarCraft II: Heart of the Swarm (2013) | 71.5 | 43.4 | 35.2 | 21.9 |
| BioShock Infinite (2013) | 61.7 | 41.7 | 33.8 | 11.9 |
| The Witcher 3 (2015) | 24 | |||
| Batman: Arkham Knight (2015) | 13 | |||
| Rise of the Tomb Raider (2016) | 26.1 | 14.7 | ||
| Doom (2016) | 16.8 | |||
| Overwatch (2016) | 35.8 | 30.4 |
Noise level
| Idle |
| 30.5 / 30.6 / 30.6 dB(A) |
| Load |
| 41.6 / 48 dB(A) |
 | ||
30 dB silent 40 dB(A) audible 50 dB(A) loud |
||
min: | ||
| HP Pavilion 17z 1EX13AV Radeon 530, A9-9420, Avolusion MD1TBLSSHD | HP Pavilion 17z 1EX13AV Radeon R7 M340, A12-9720P, WDC Scorpio Blue WD10JPVX-60JC3T1 | Asus X555DA-BB11 Radeon R6 (Carrizo), A10-8700P, Seagate Momentus SpinPoint M8 ST1000LM024 HN-M101MBB | Toshiba Satellite Pro R50-C-16V HD Graphics 520, 6006U, TOSHIBA MQ01ABD075 | Lenovo V510-15IKB 80WQ0002GE HD Graphics 620, i5-7200U, Samsung CM871a MZNTY256HDHP | Acer Aspire E5-574-53YZ Iris Graphics 550, 6267U, Toshiba MQ02ABD100H | |
|---|---|---|---|---|---|---|
| Noise | 2% | 5% | 6% | 6% | 2% | |
| off / environment * (dB) | 28 | 28 -0% | 28.9 -3% | 30.4 -9% | 30.2 -8% | 28.8 -3% |
| Idle Minimum * (dB) | 30.5 | 30.4 -0% | 31.6 -4% | 31.8 -4% | 30.2 1% | 31 -2% |
| Idle Average * (dB) | 30.6 | 30.5 -0% | 32 -5% | 31.8 -4% | 30.2 1% | 31 -1% |
| Idle Maximum * (dB) | 30.6 | 30.5 -0% | 32.4 -6% | 31.8 -4% | 32 -5% | 31 -1% |
| Load Average * (dB) | 41.6 | 41.5 -0% | 33.3 20% | 31.9 23% | 34.7 17% | 39.1 6% |
| Witcher 3 ultra * (dB) | 48 | 41.8 13% | ||||
| Load Maximum * (dB) | 48 | 48.2 -0% | 35.5 26% | 31.8 34% | 33.9 29% | 41 15% |
* ... smaller is better
(±) The maximum temperature on the upper side is 40.4 °C / 105 F, compared to the average of 36.8 °C / 98 F, ranging from 21 to 71 °C for the class Multimedia.
(±) The bottom heats up to a maximum of 45 °C / 113 F, compared to the average of 39.1 °C / 102 F
(+) In idle usage, the average temperature for the upper side is 25.3 °C / 78 F, compared to the device average of 31.3 °C / 88 F.
(+) The palmrests and touchpad are cooler than skin temperature with a maximum of 30.8 °C / 87.4 F and are therefore cool to the touch.
(-) The average temperature of the palmrest area of similar devices was 28.7 °C / 83.7 F (-2.1 °C / -3.7 F).
HP Pavilion 17z 1EX13AV audio analysis
(-) | not very loud speakers (61.5 dB)
Bass 100 - 315 Hz
(±) | reduced bass - on average 14.7% lower than median
(-) | bass is not linear (15.8% delta to prev. frequency)
Mids 400 - 2000 Hz
(+) | balanced mids - only 2.5% away from median
(±) | linearity of mids is average (10.6% delta to prev. frequency)
Highs 2 - 16 kHz
(+) | balanced highs - only 4.5% away from median
(-) | highs are not linear (15.2% delta to prev. frequency)
Overall 100 - 16.000 Hz
(±) | linearity of overall sound is average (24.7% difference to median)
Compared to same class
» 87% of all tested devices in this class were better, 5% similar, 8% worse
» The best had a delta of 5%, average was 17%, worst was 45%
Compared to all devices tested
» 75% of all tested devices were better, 5% similar, 19% worse
» The best had a delta of 4%, average was 23%, worst was 134%
Apple MacBook 12 (Early 2016) 1.1 GHz audio analysis
(+) | speakers can play relatively loud (83.6 dB)
Bass 100 - 315 Hz
(±) | reduced bass - on average 11.3% lower than median
(±) | linearity of bass is average (14.2% delta to prev. frequency)
Mids 400 - 2000 Hz
(+) | balanced mids - only 2.4% away from median
(+) | mids are linear (5.5% delta to prev. frequency)
Highs 2 - 16 kHz
(+) | balanced highs - only 2% away from median
(+) | highs are linear (4.5% delta to prev. frequency)
Overall 100 - 16.000 Hz
(+) | overall sound is linear (10.2% difference to median)
Compared to same class
» 7% of all tested devices in this class were better, 2% similar, 90% worse
» The best had a delta of 5%, average was 18%, worst was 53%
Compared to all devices tested
» 5% of all tested devices were better, 1% similar, 94% worse
» The best had a delta of 4%, average was 23%, worst was 134%
| Off / Standby | |
| Idle | |
| Load |
|
Key:
min: | |
| HP Pavilion 17z 1EX13AV A9-9420, Radeon 530, Avolusion MD1TBLSSHD, IPS, 1920x1080, 17.3" | HP 17-x066ng 6006U, HD Graphics 520, WDC WD10JPVX-08JC3T5, IPS, 1920x1080, 17.3" | Asus X555DA-BB11 A10-8700P, Radeon R6 (Carrizo), Seagate Momentus SpinPoint M8 ST1000LM024 HN-M101MBB, TN LED, 1920x1080, 15.6" | Lenovo V510-15IKB 80WQ0002GE i5-7200U, HD Graphics 620, Samsung CM871a MZNTY256HDHP, IPS, 1920x1080, 15.6" | Acer Aspire F5-771G-50RD i5-7200U, GeForce GTX 950M, Toshiba MQ01ABD100, TN, 1920x1080, 17.3" | |
|---|---|---|---|---|---|
| Power Consumption | 39% | 28% | 43% | 14% | |
| Idle Minimum * (Watt) | 8.4 | 5.5 35% | 8.3 1% | 4 52% | 6.9 18% |
| Idle Average * (Watt) | 11.7 | 9.9 15% | 8.6 26% | 9.6 18% | 13.6 -16% |
| Idle Maximum * (Watt) | 24.1 | 14.6 39% | 13.1 46% | 9.7 60% | 14.8 39% |
| Load Average * (Watt) | 50.4 | 28 44% | 31.2 38% | 27.7 45% | 41 19% |
| Witcher 3 ultra * (Watt) | 58 | 33 43% | |||
| Load Maximum * (Watt) | 62.8 | 24.6 61% | 43.9 30% | 38.4 39% | 75 -19% |
* ... smaller is better
| HP Pavilion 17z 1EX13AV A9-9420, Radeon 530, 41.6 Wh | HP Pavilion Power 15t-cb2000 i7-7700HQ, Radeon RX 550 (Laptop), 70 Wh | Asus X555DA-BB11 A10-8700P, Radeon R6 (Carrizo), 37 Wh | Toshiba Satellite Pro R50-C-16V 6006U, HD Graphics 520, 44 Wh | Lenovo V510-15IKB 80WQ0002GE i5-7200U, HD Graphics 620, 32 Wh | HP Omen 15-ax213ng i7-7700HQ, GeForce GTX 1050 Ti Mobile, 63.3 Wh | |
|---|---|---|---|---|---|---|
| Battery runtime | 29% | -21% | 28% | -17% | 42% | |
| Reader / Idle (h) | 7.8 | 10.5 35% | 7.3 -6% | 12.8 64% | ||
| WiFi v1.3 (h) | 4.6 | 5.7 24% | 2.9 -37% | 5.9 28% | 3.8 -17% | 7.1 54% |
| Load (h) | 1.5 | 1.9 27% | 1.2 -20% | 1.6 7% |
Pros
Cons

这款基于AMD平台的Pavilion笔记本电脑是对我们耐心的一次极大考验。不仅它的速度迟缓,应用程序每一次也都需要很长时间才能打开。没有人希望等待6秒以上打开一个Word文档,再等6秒打开文件浏览器,或是为了打开浏览器或iTunes等待更长的时间。从这个方面来看,我们并不推荐任何一款搭配机械硬盘的AMD平台Pavilion,不管它的机身品质或屏幕素质。
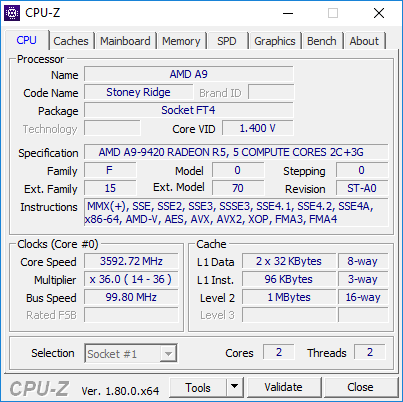
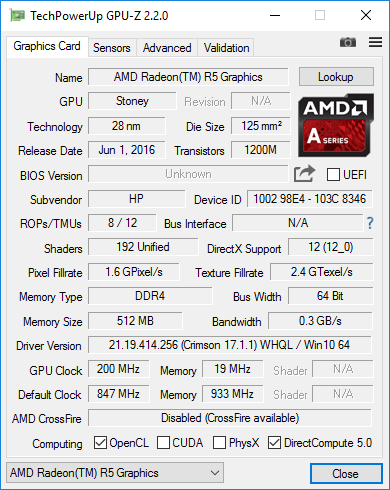
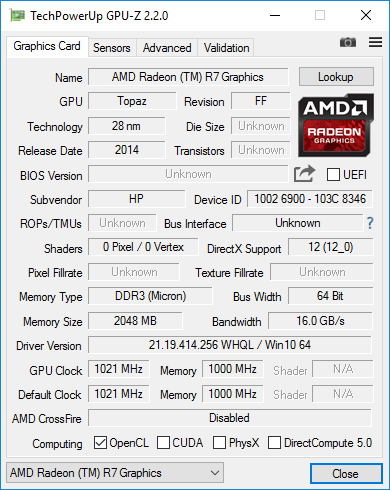
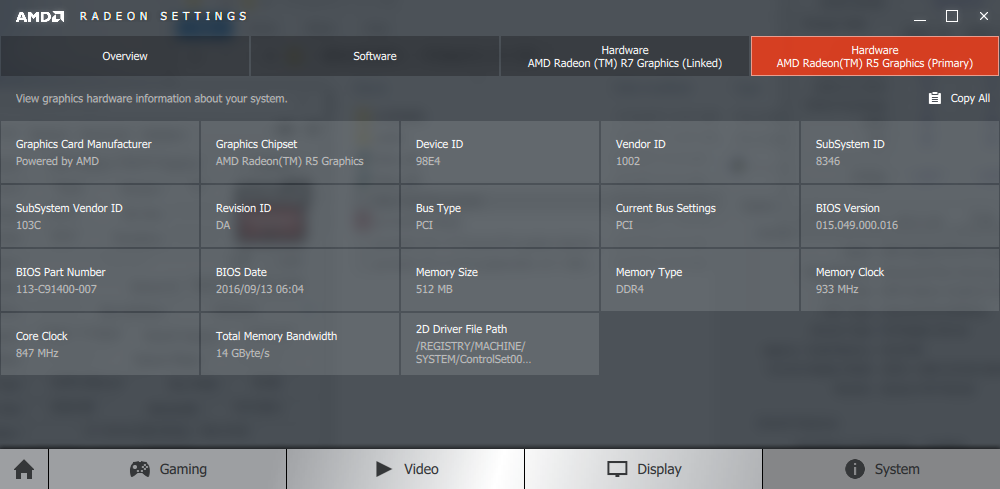
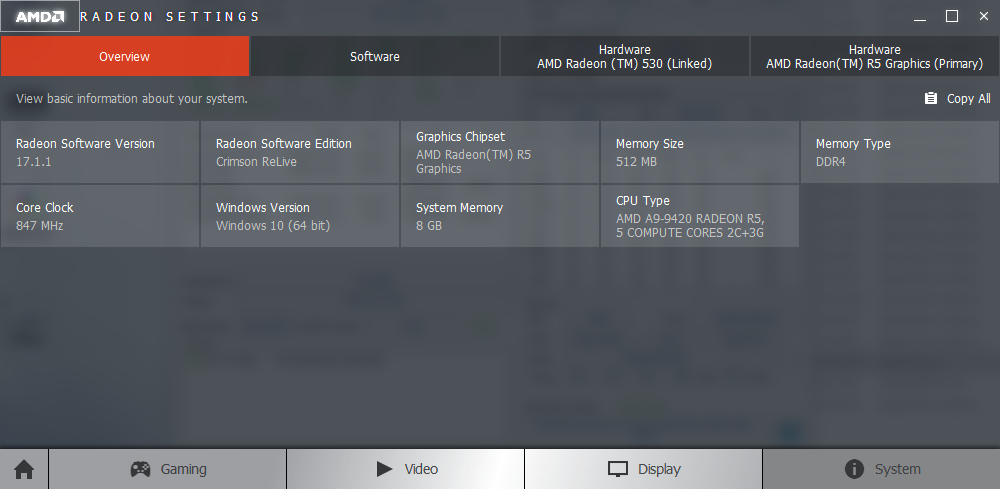
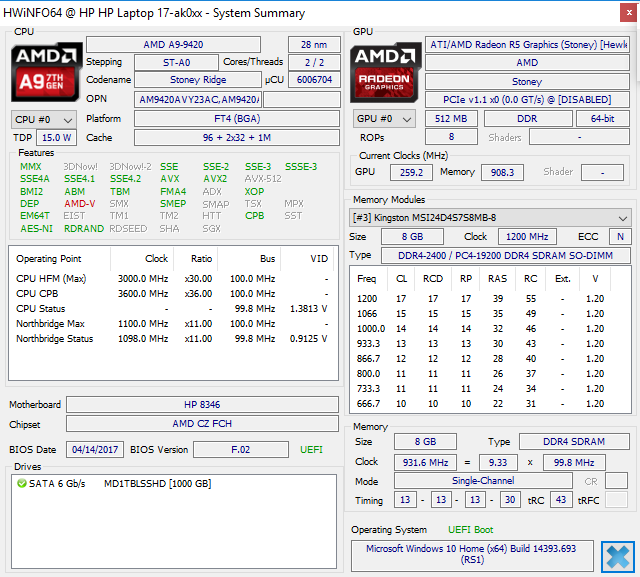
除此之外,Stoney Ridge A9处理器和Radeon 530显卡的搭配也并不相称。类似于我们之前测试的A12-9720P Pavilion 17z机型,我们的A9机型的整体性能受到了缓慢的处理器的拖累。根据游戏不同,运行的帧率可以时而超出高清显卡620达80%,或时而低达只有它的五分之一,而高功耗、短电池续航和很吵的风扇都是需要付出的代价。一台功耗高达GeForce GTX 950M水平的显卡,却只能提供较老的英特尔Iris或高清显卡水平的性能,让人十分难以接受。
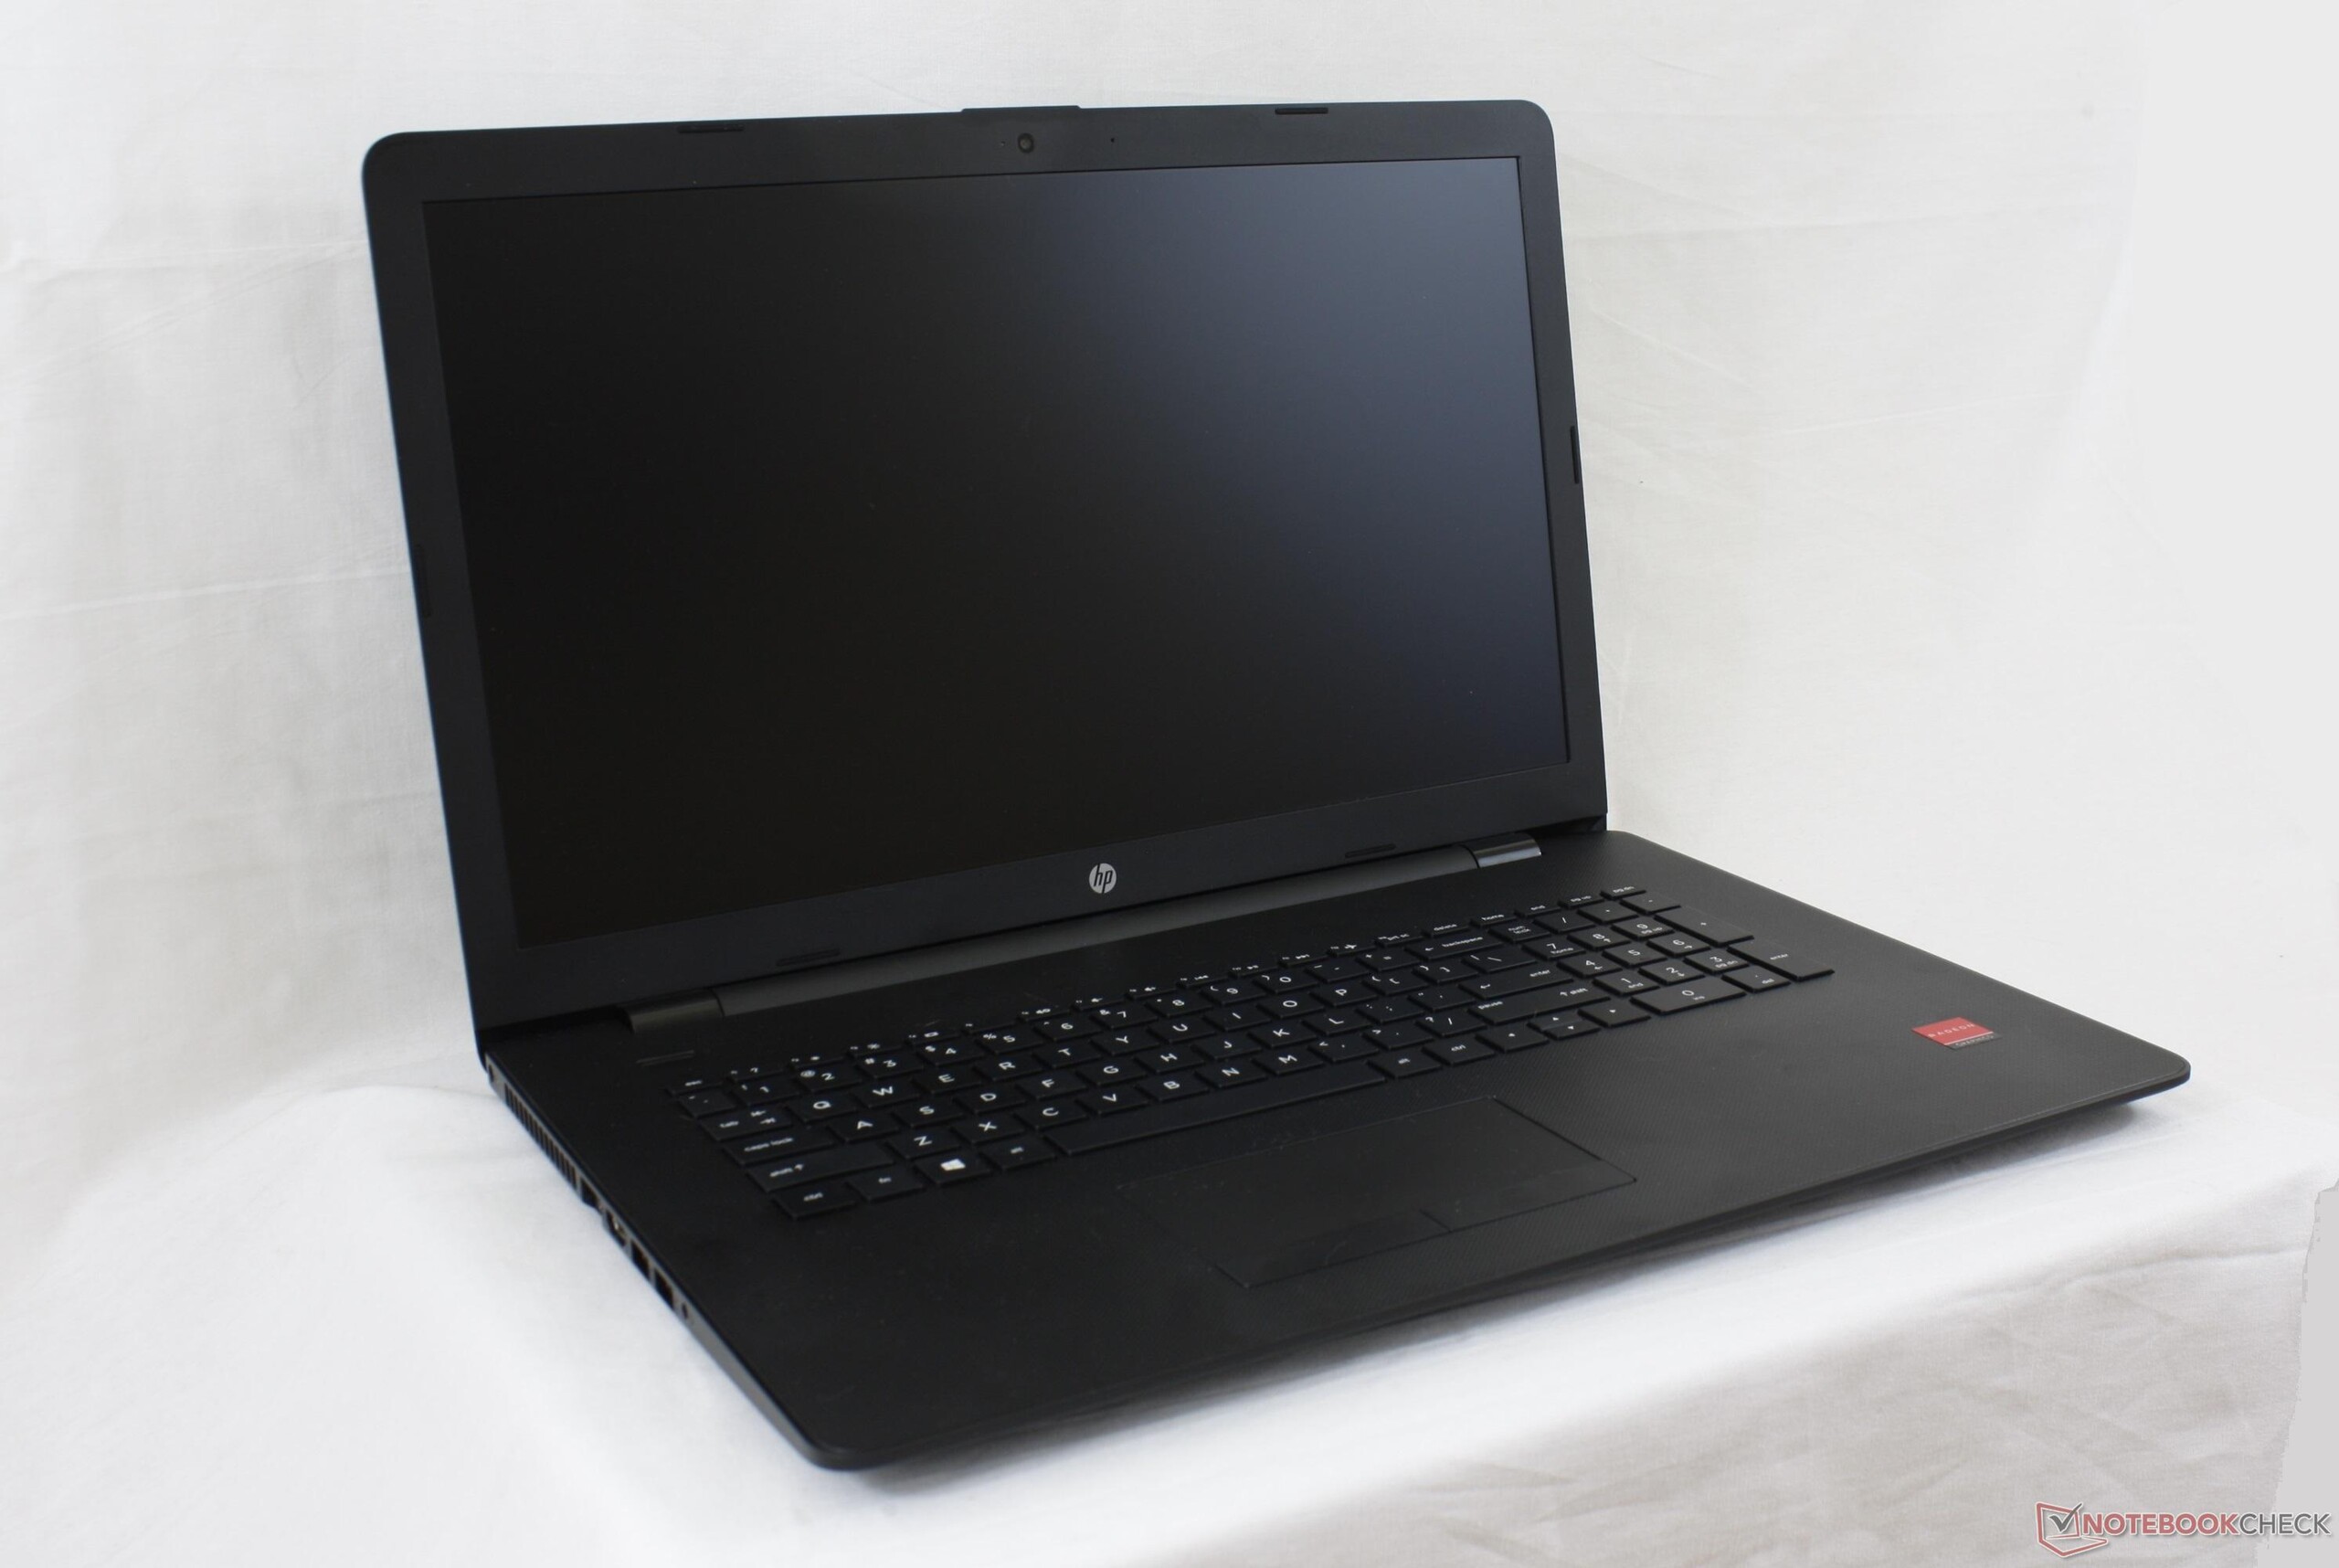
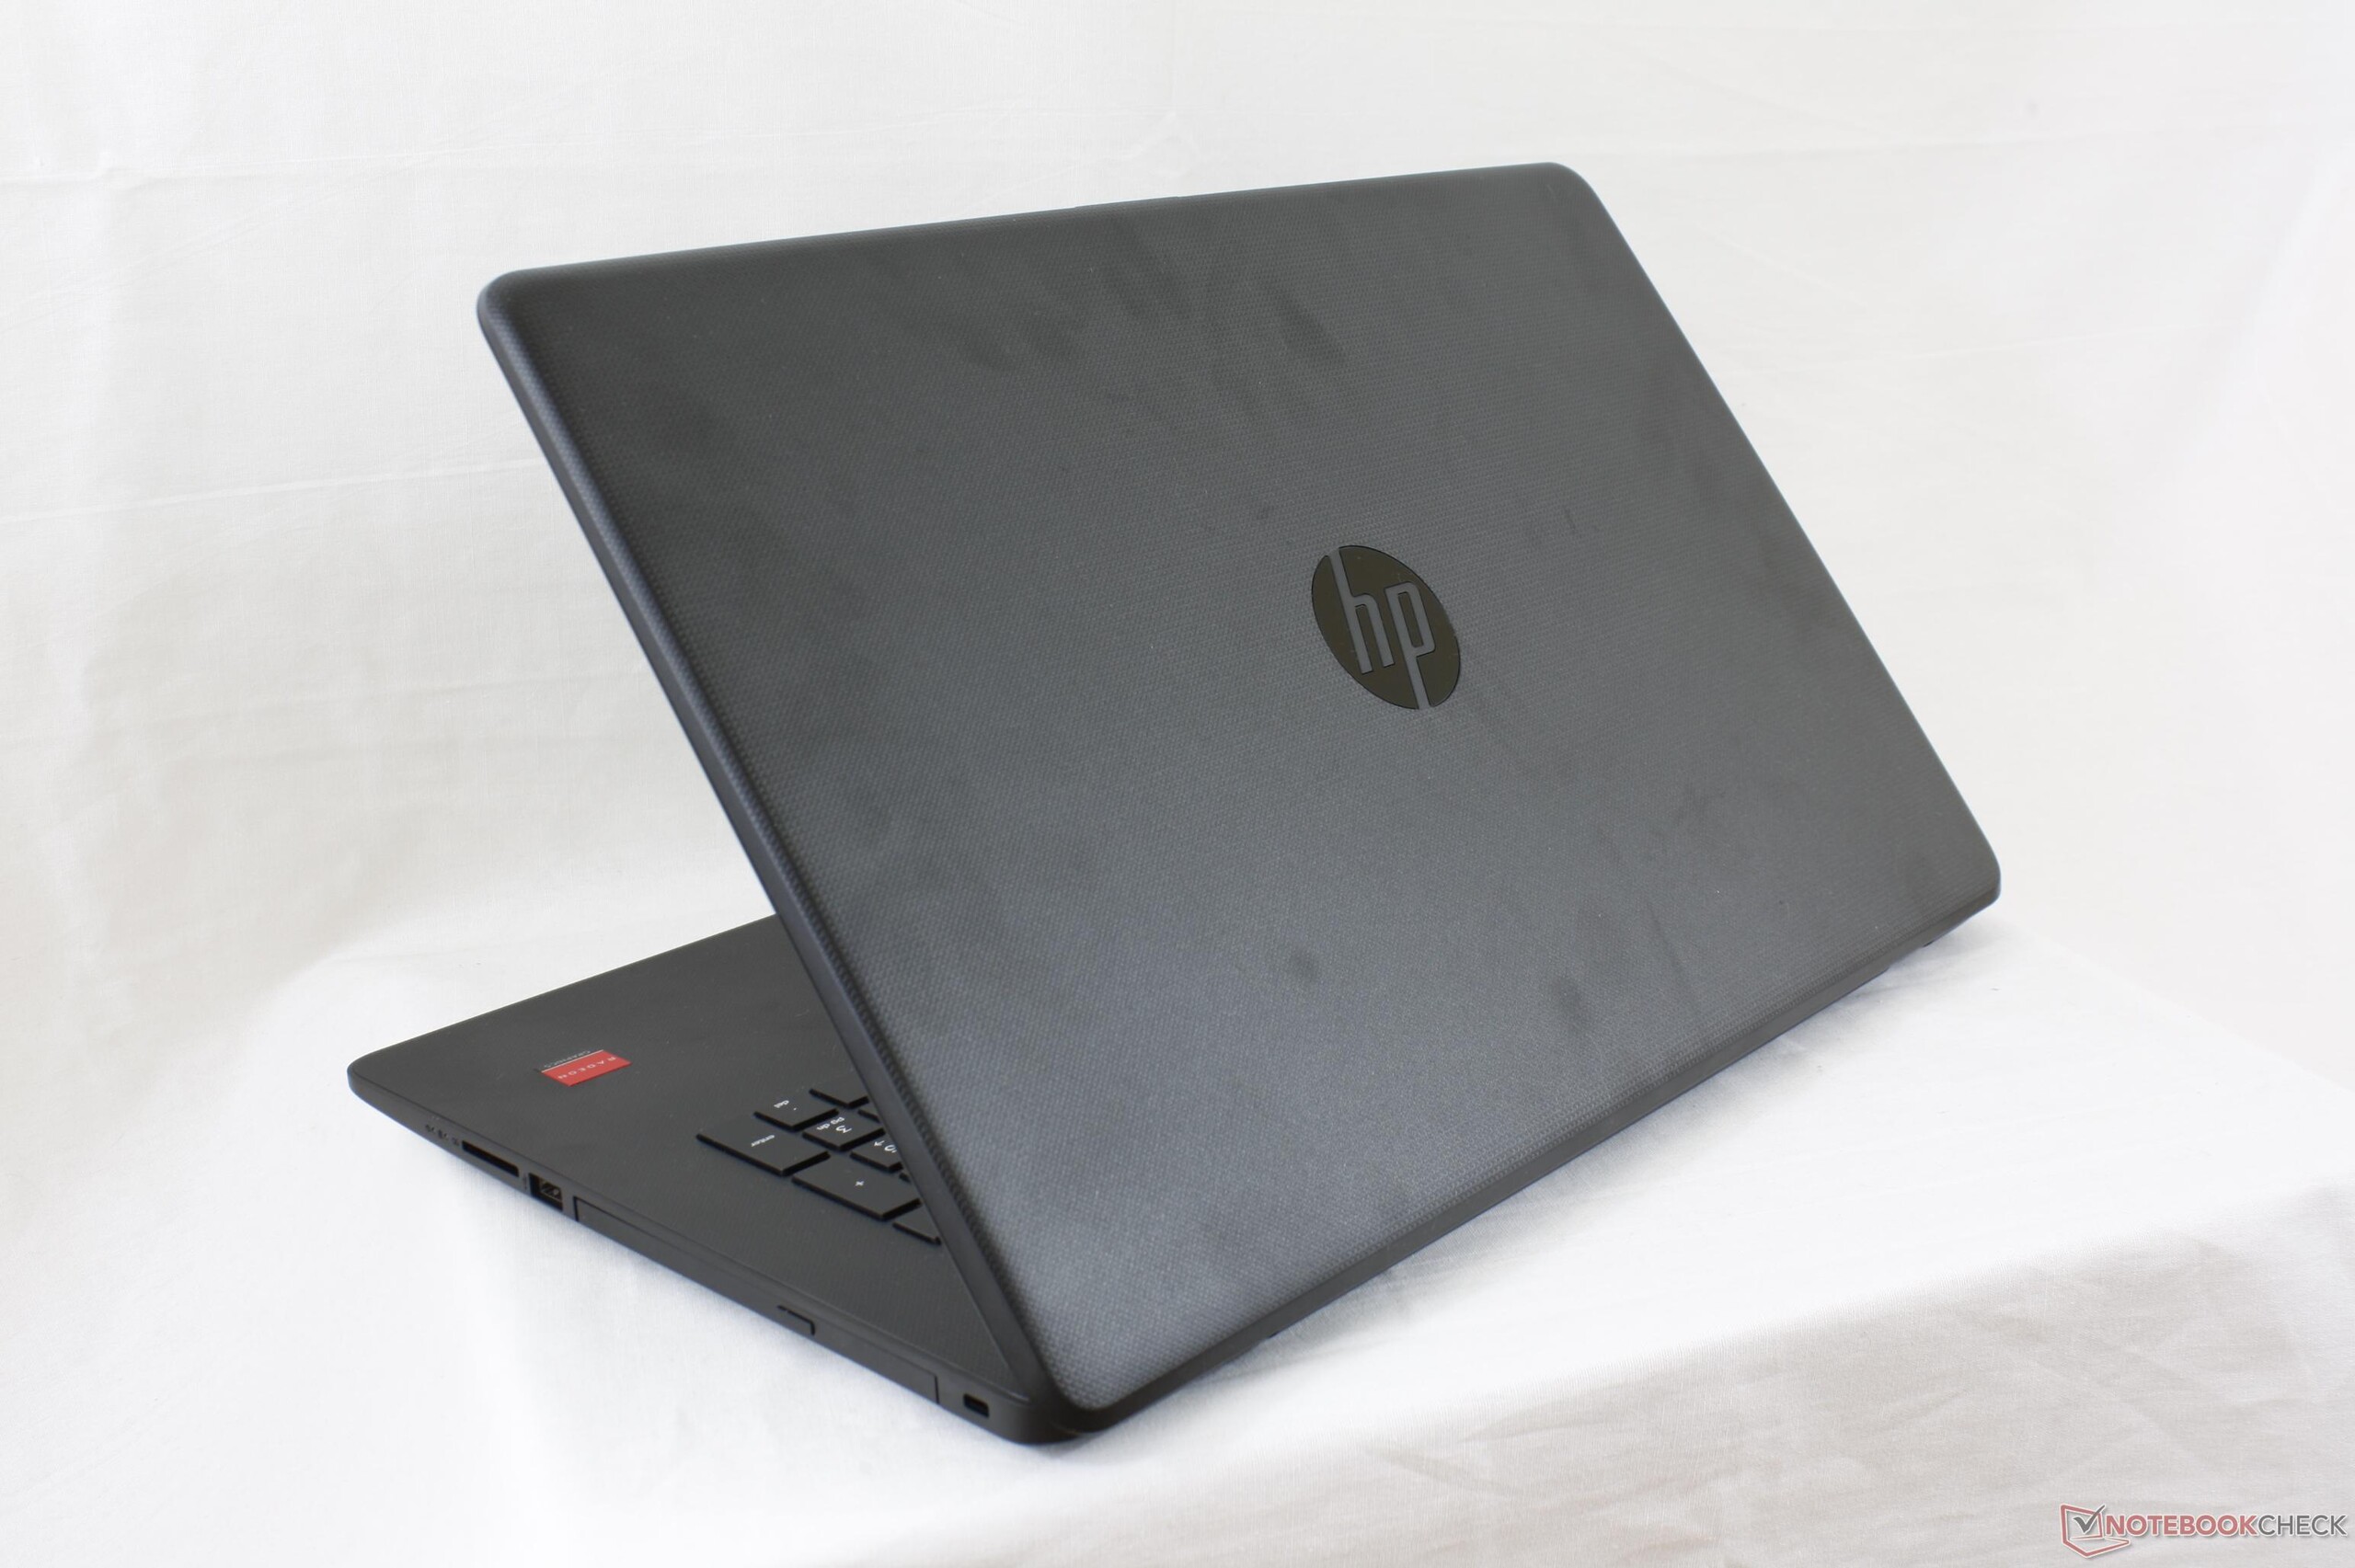
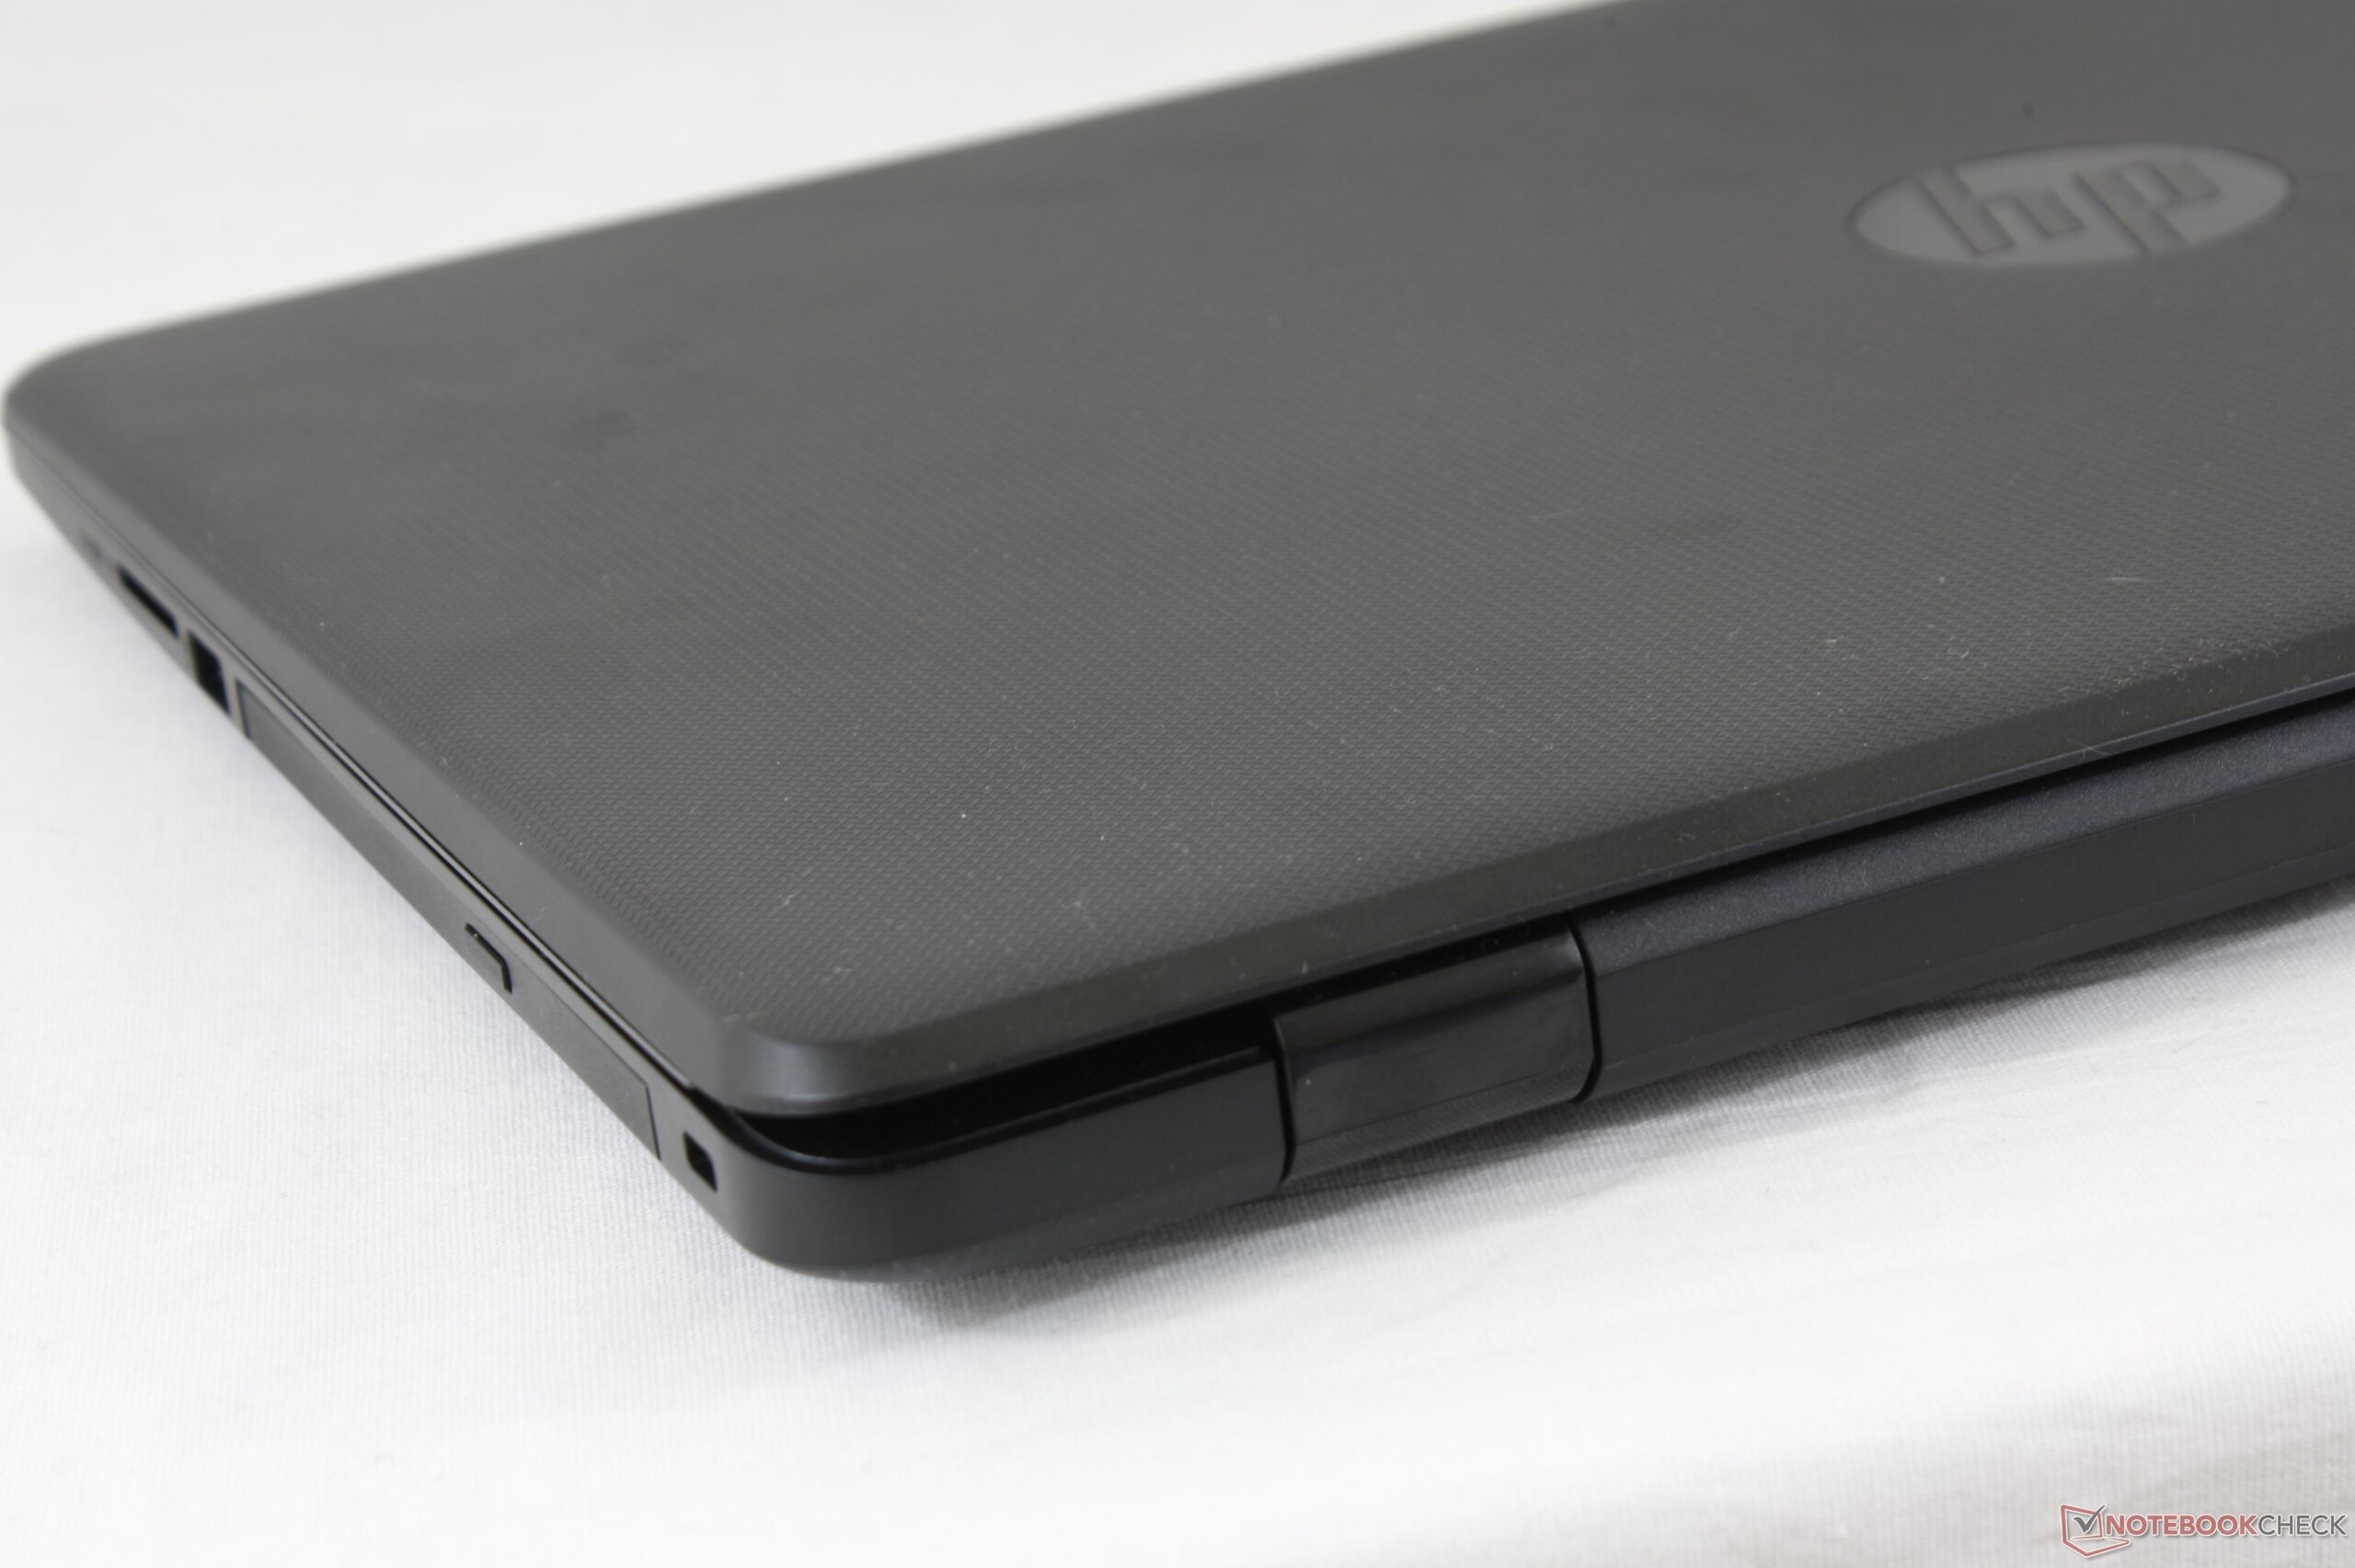
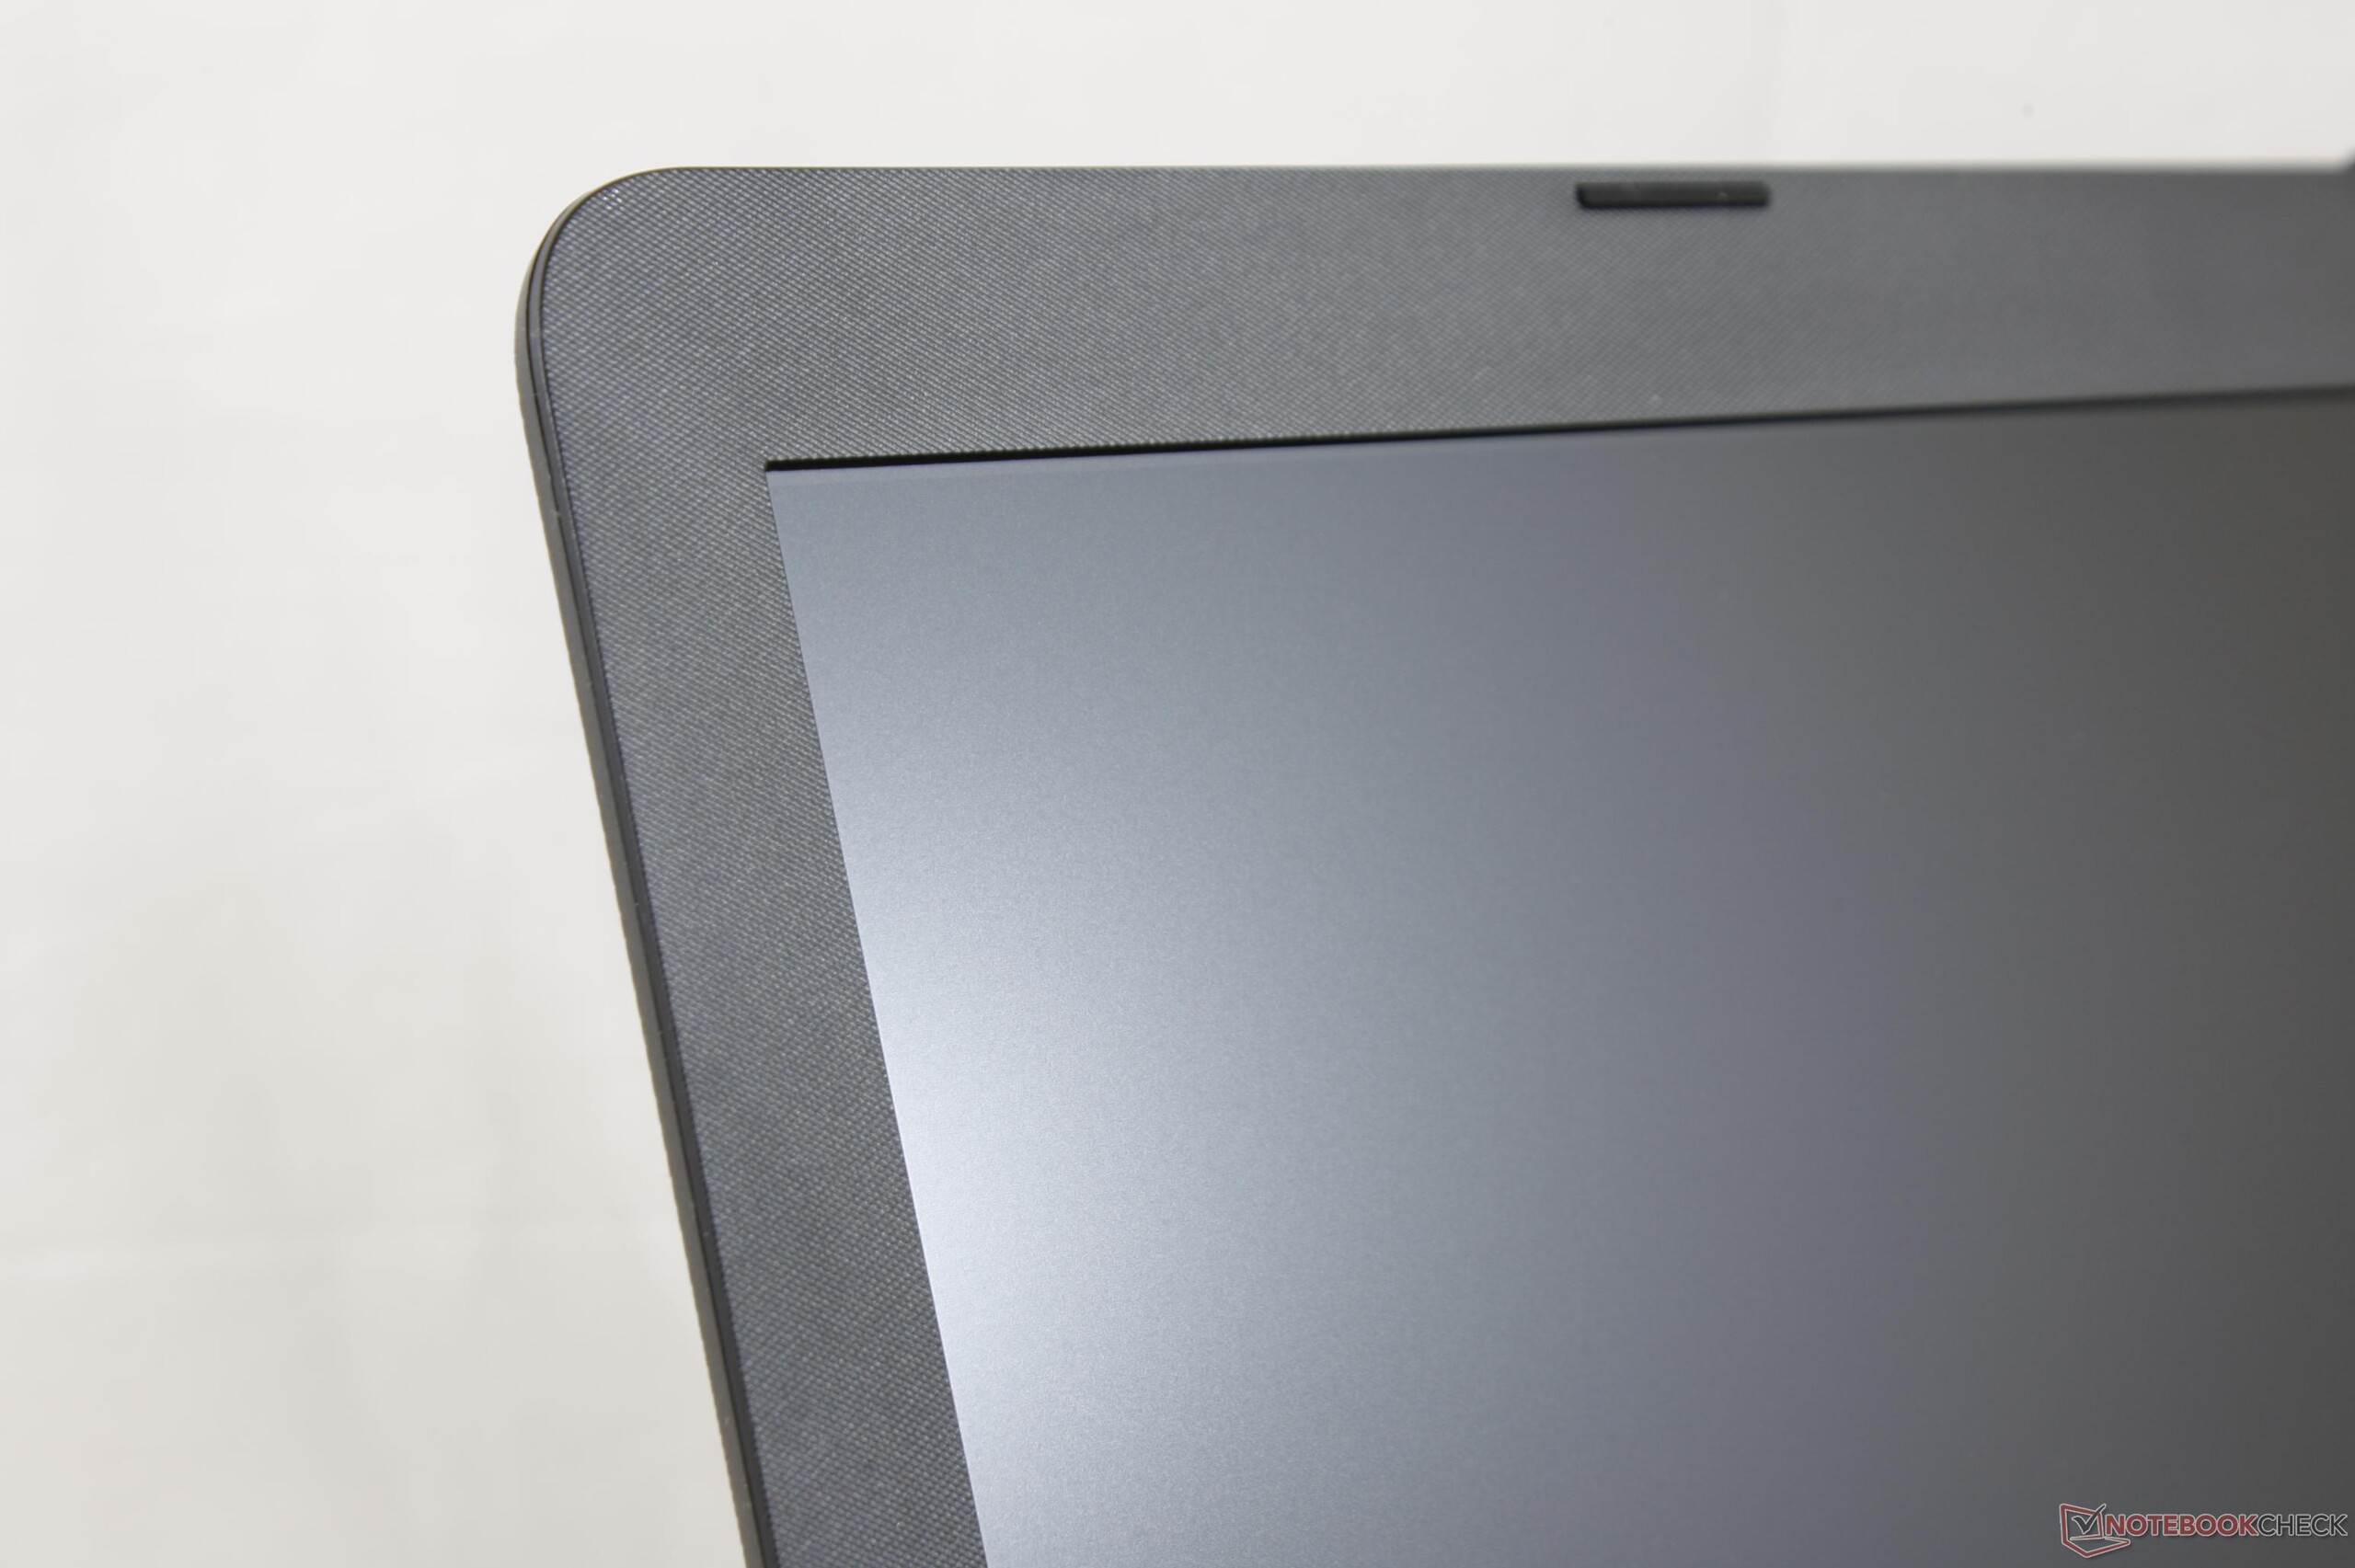
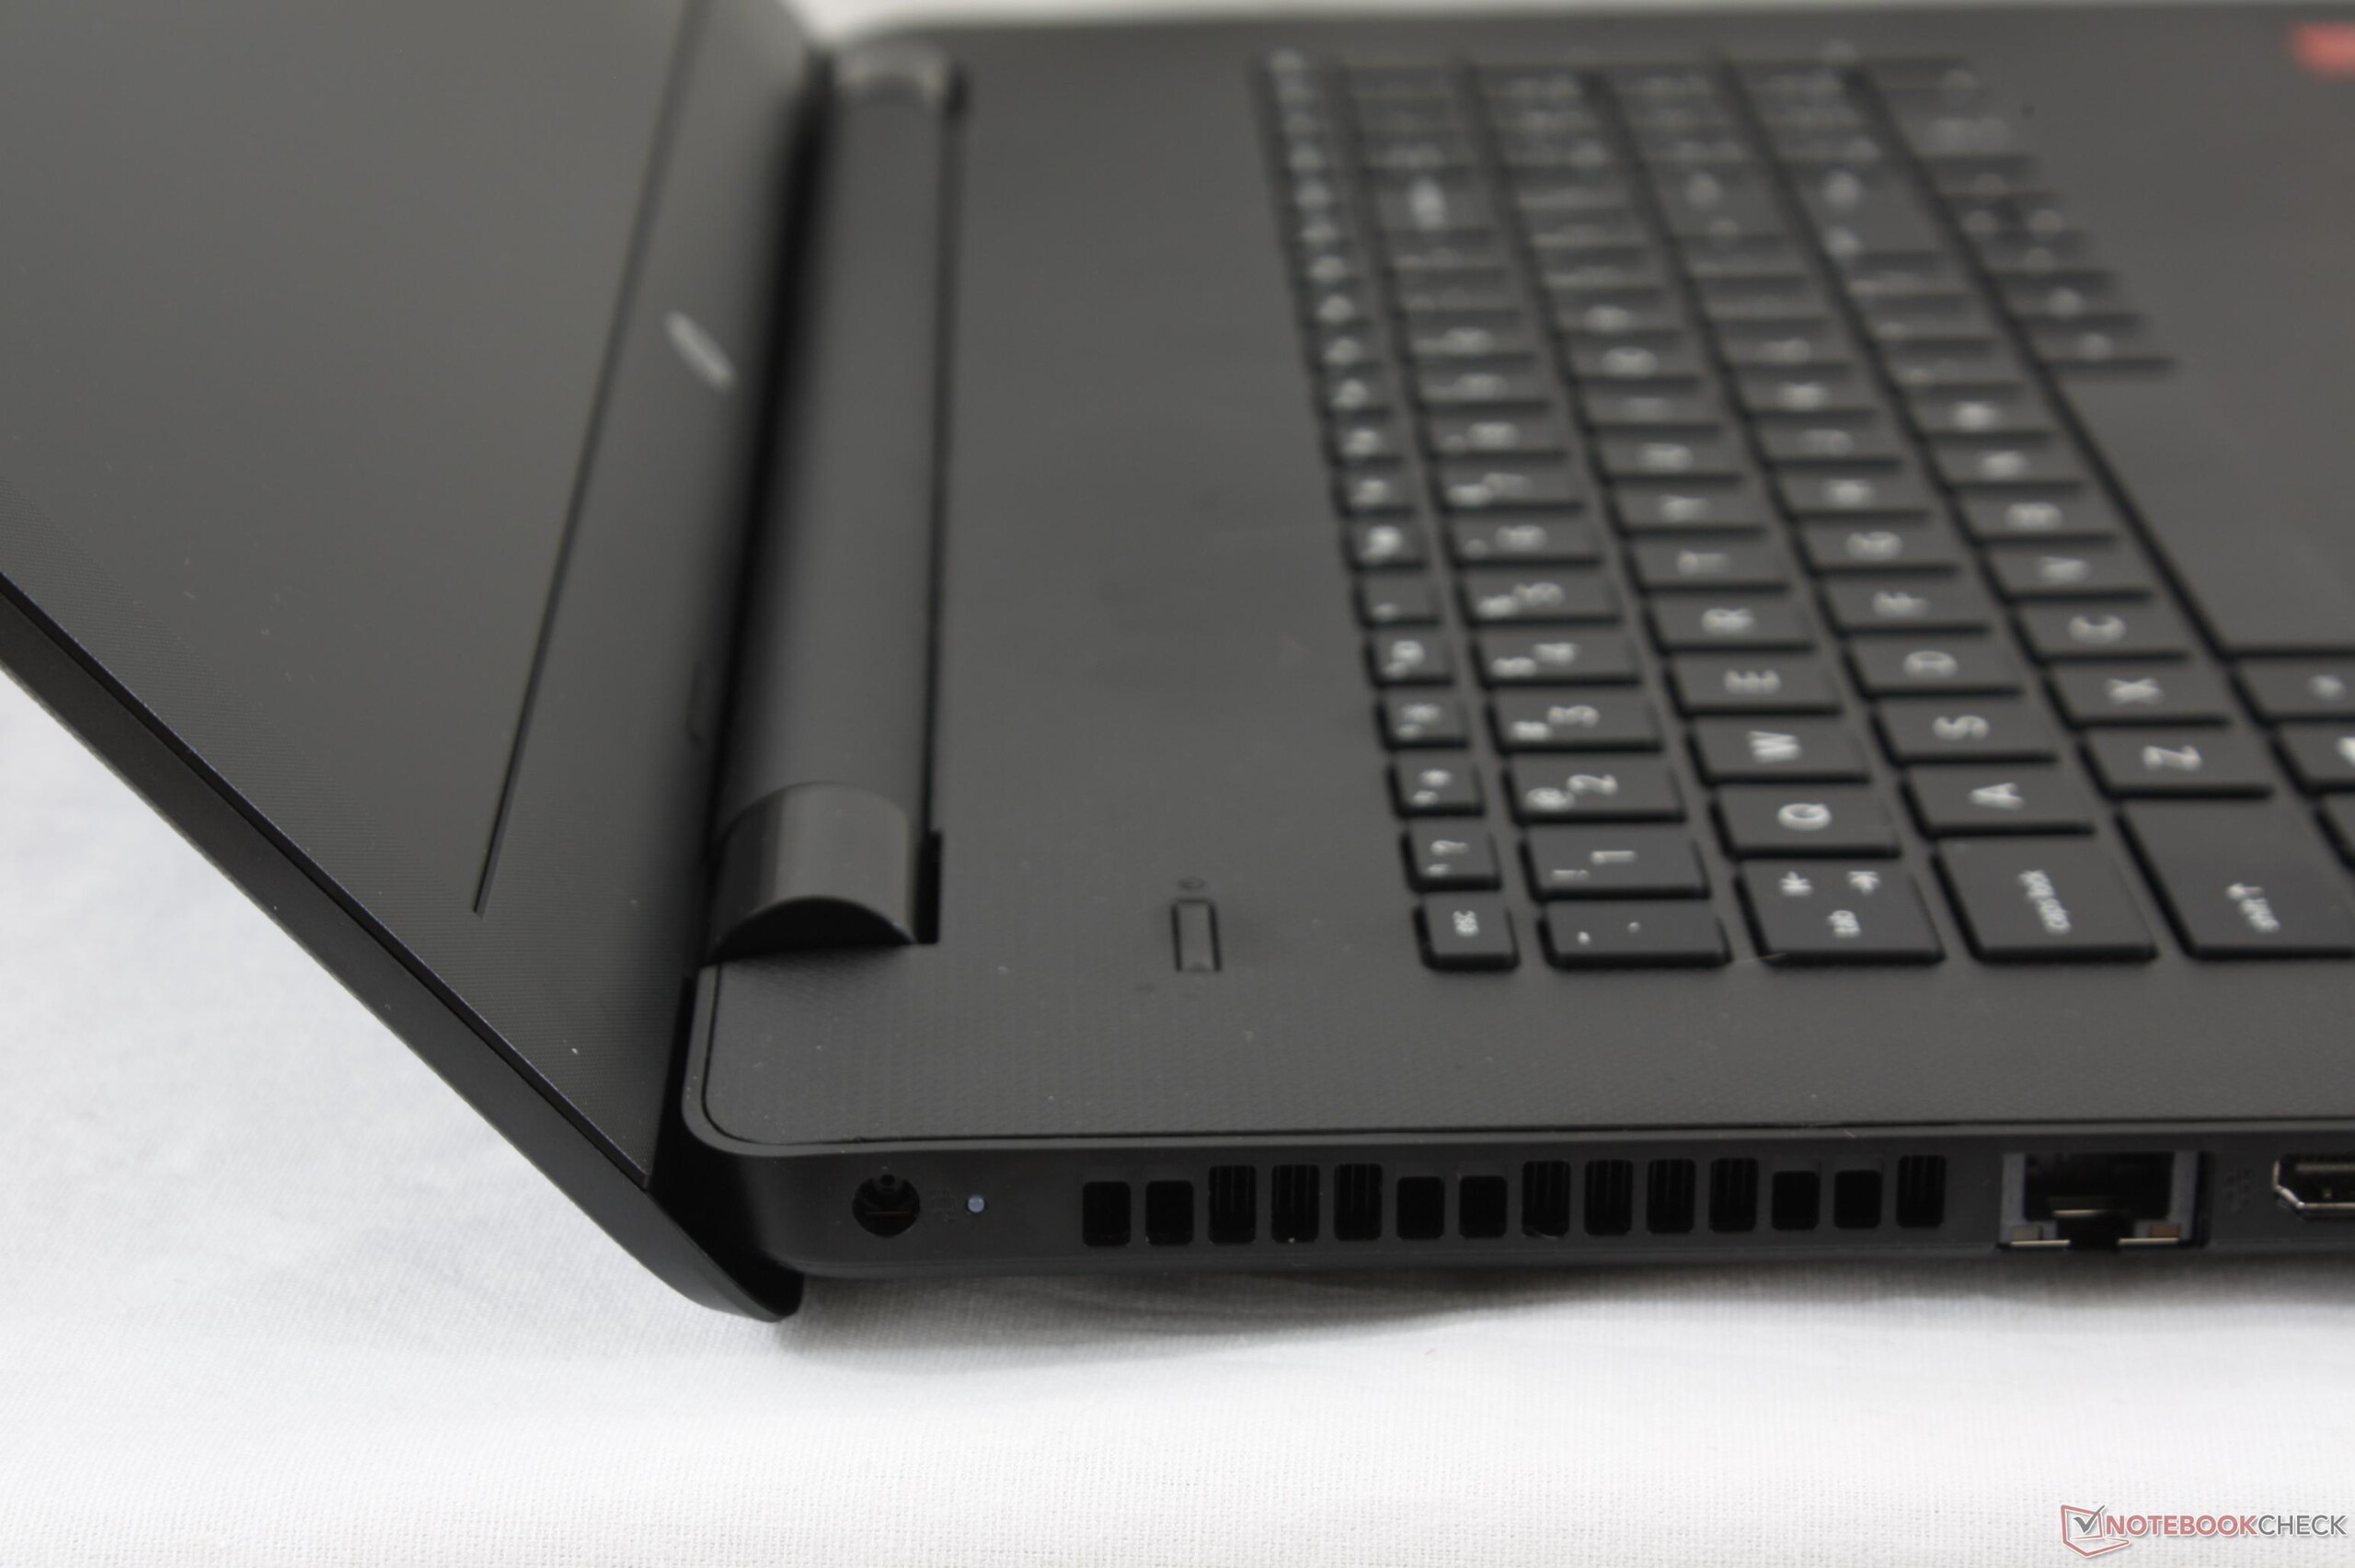
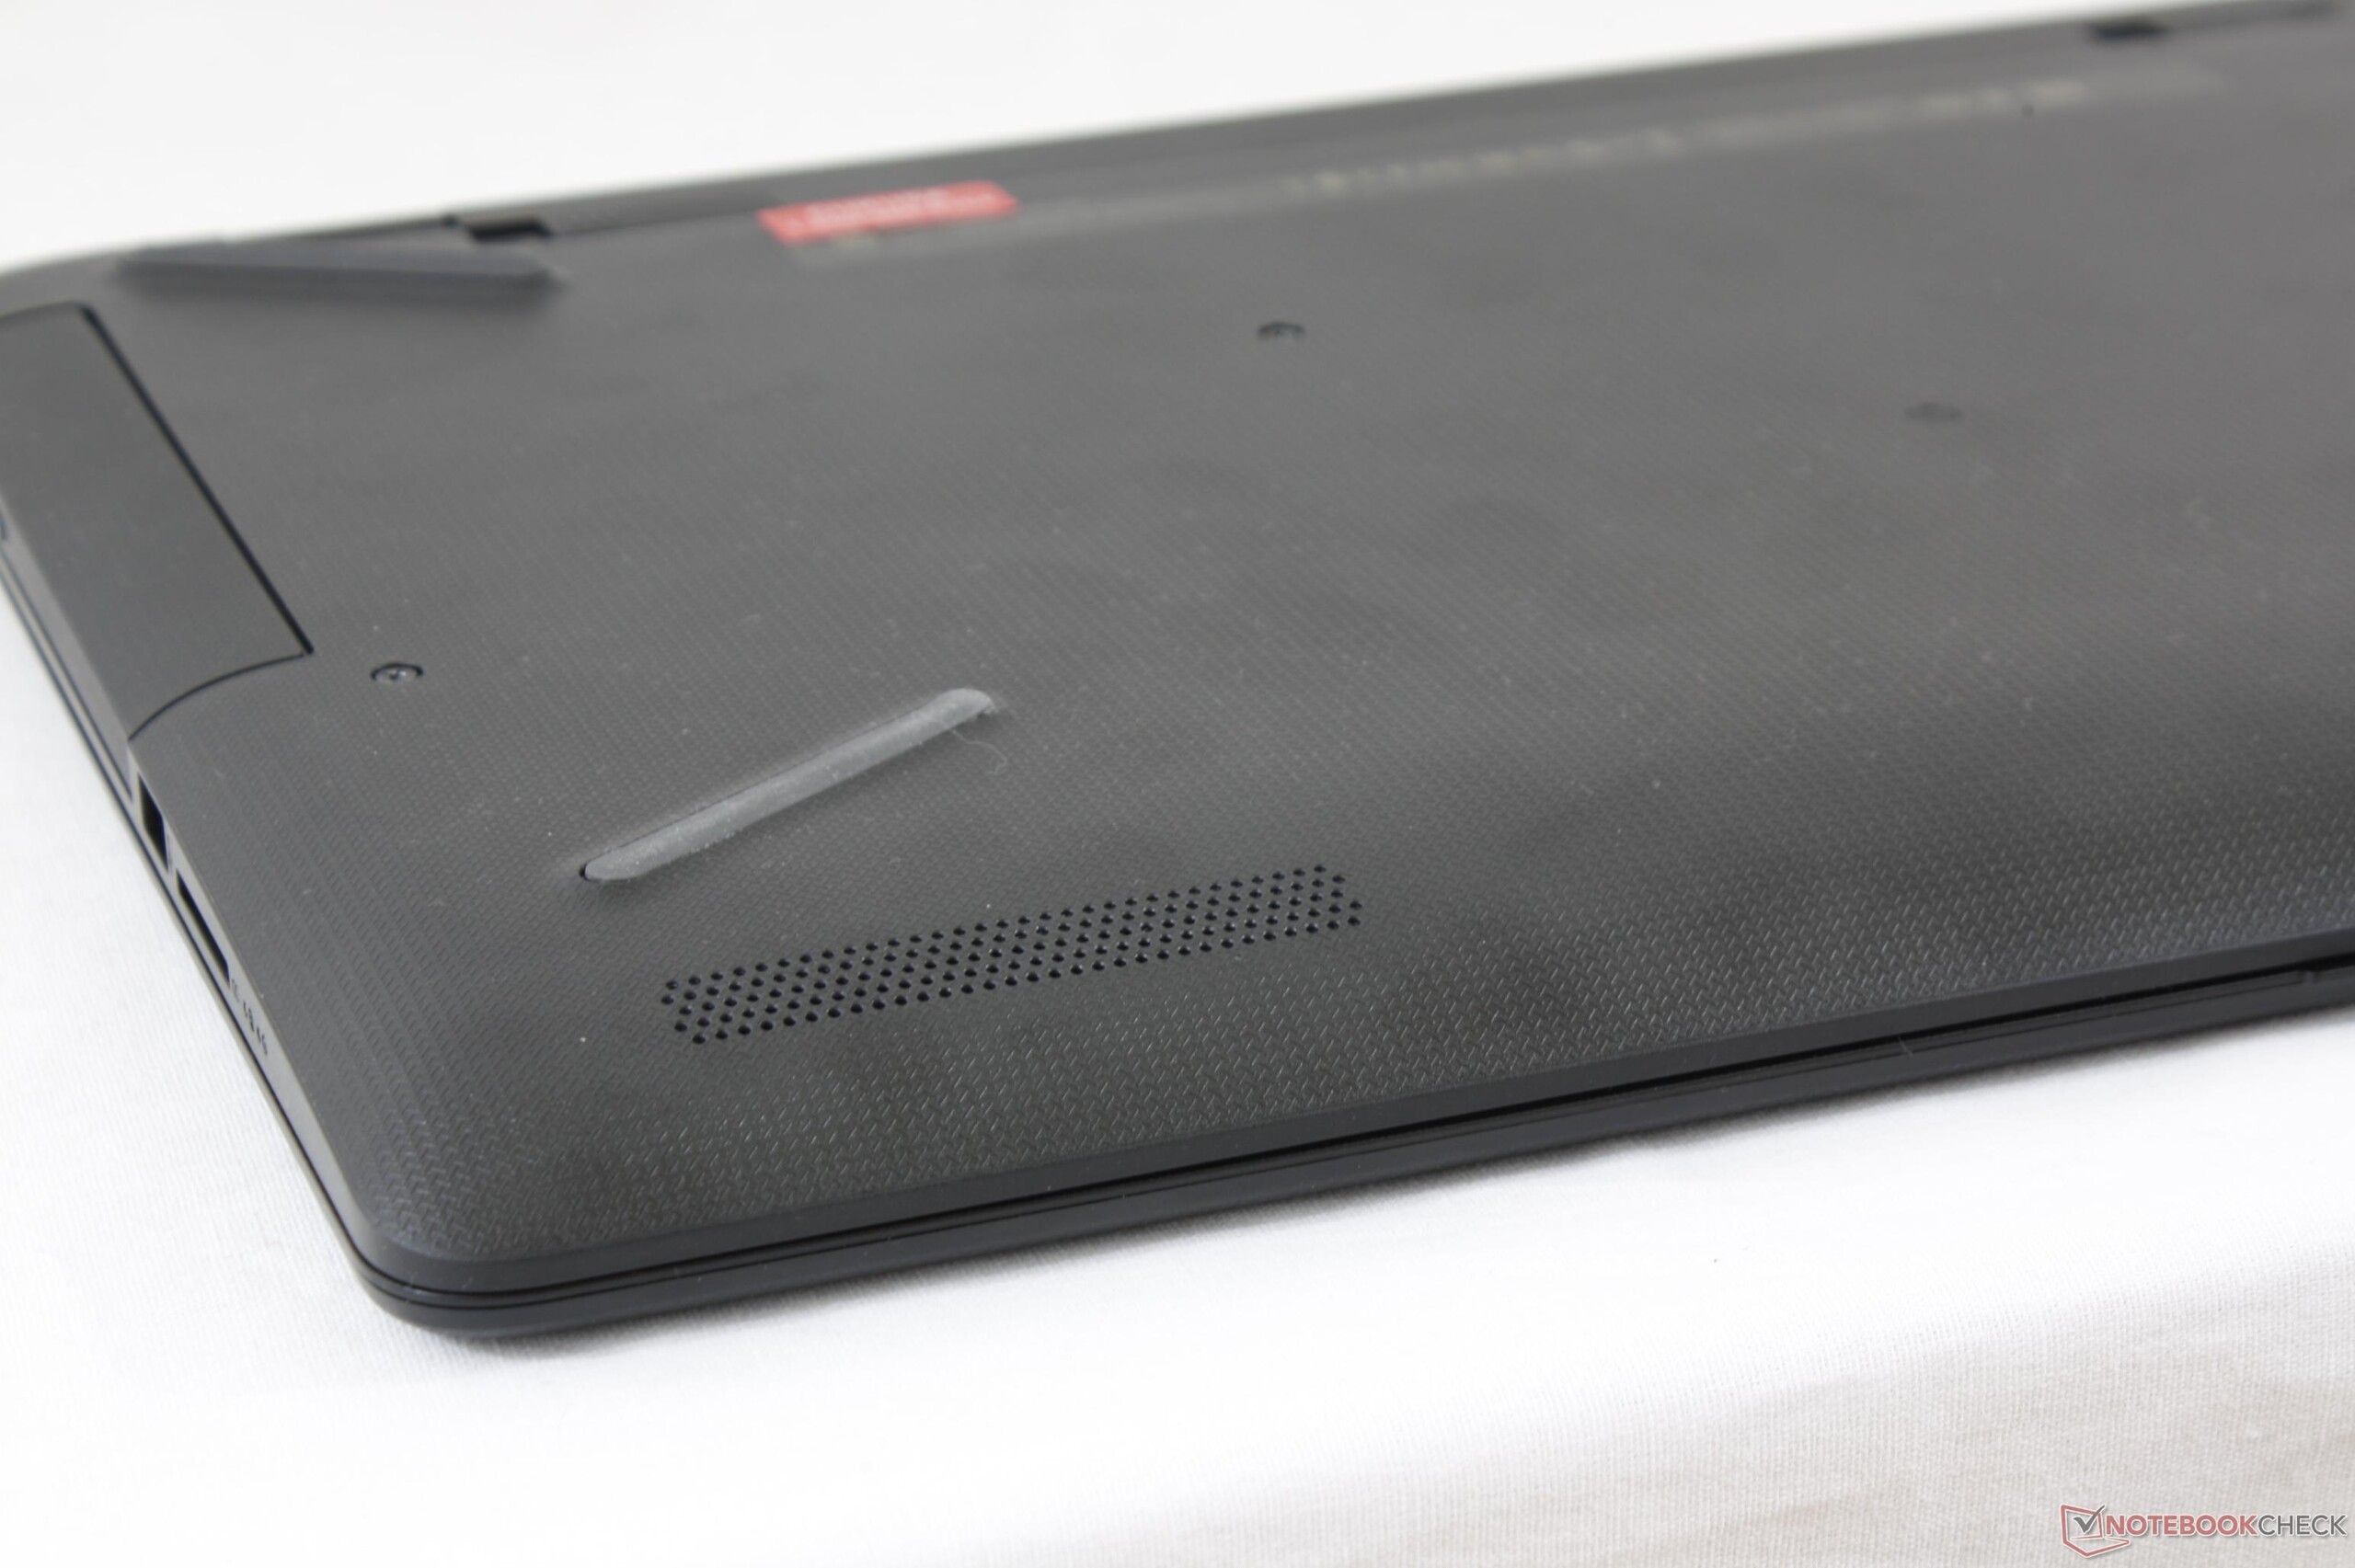
Pavilion 17z的机身品质与其他实惠型设备相当,但也有独特亮点。它的内置扬声器效果很不错,而屏幕亮度和色域覆盖也都超出了我们的预料。除了少数几项优势外,我们希望它在未来更新中可以改进颗粒感很强的雾面屏幕面板,解决屏幕漏光和难以维护升级(特别是对于希望自行安装固态硬盘的用户)的问题。
这台搭载AMD硬件的Pavilion设备让我们很难理解它究竟是希望成为一台实惠低端游戏笔记本电脑还是一台高性能低价办公设备。不过不论从哪个方面来看,它的表现都只算平平。
注:本文是基于完整评测的缩减版本,阅读完整的英文评测,请点击这里。
HP Pavilion 17z 1EX13AV
- 07/18/2017 v6 (old)
Allen Ngo
Price comparison
