
判决
虽然 XMG Core 16 VE 的市场定位是超值版,但这款 16 英寸游戏笔记本电脑并不完全属于最便宜的 RTX 5060 机型。它的起售价为 1,479 欧元(约合人民币 1,711 元),配置价格超过 1,900 欧元(约合人民币 2,198 元,配备 64 GB 内存、2 TB 固态硬盘和 Windows 11),与许多 RTX 5070 Ti 设备的价格相差无几。根据我们的测量和测试,这个价格至少在一定程度上是合理的。
它最大的优势之一是优雅、基本坚固的金属机箱,结合了良好的输入设备、多种端口选择和相当明亮的 IPS 显示屏。维护和升级选项也很可靠。CPU 和 GPU 性能也令人信服。虽然 Ryzen 7 255 与其他游戏 CPU 相比并不强大,但 Zen 4 芯片却能提供稳定的性能。不过,音质还有待提高。内置扬声器提供的音效相当一般。
总体而言,XMG 酷睿 16 VE 的得分与其主要竞争对手联想Legion 7 16 的得分不相上下,但却超过了许多其他 RTX 5060 笔记本电脑,如 Tulpar T6 V3.5 和惠普 Omen 16。我们的对比表格还包括功能更强大的 RTX 5070 或 RTX 5070 Ti 笔记本电脑,以供参考。
Pros
Cons
价格和供应情况
如前所述,XMG Core 16 VE (M25) 可直接从制造商处购买,起价 1479 欧元(约合 1711 美元)。
译者注:XMG 笔记本电脑未在北美正式发售。
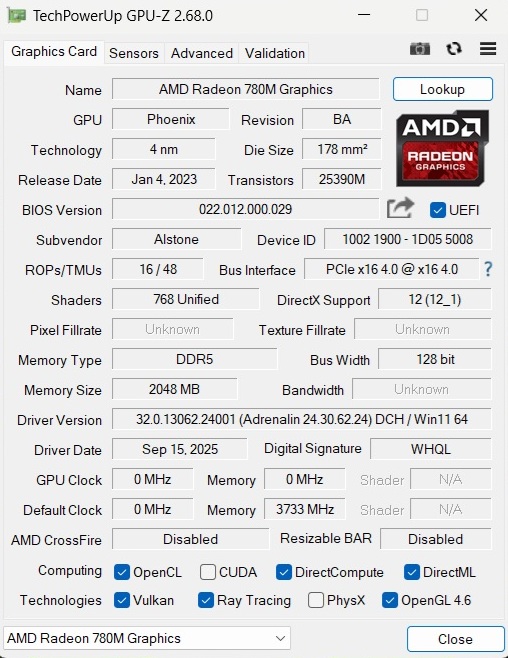
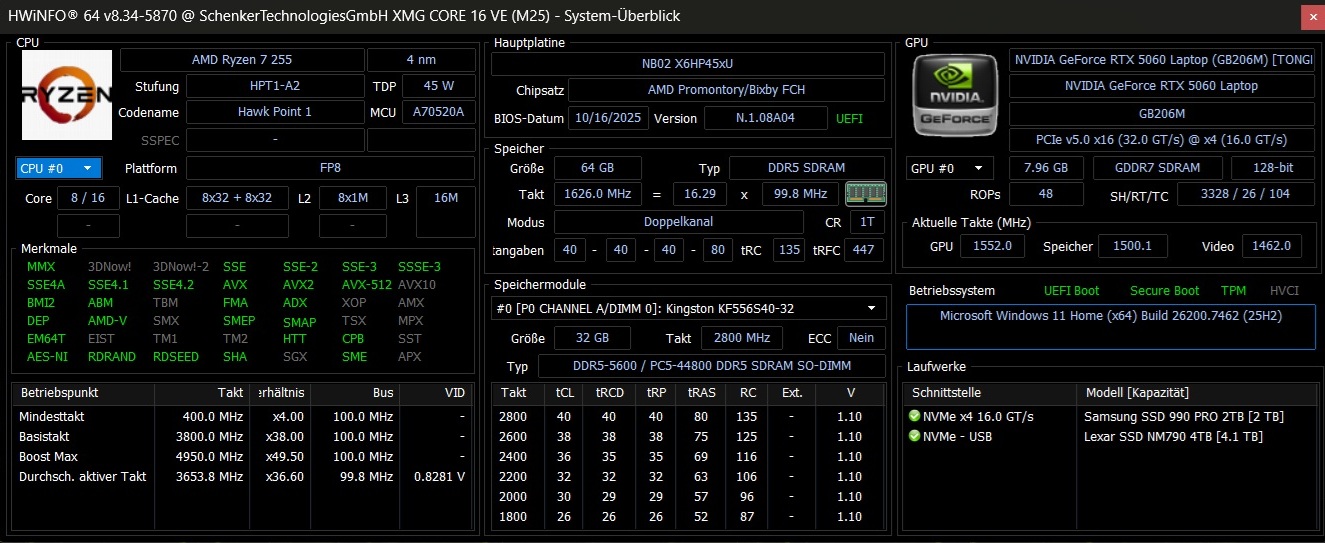
规格
案例
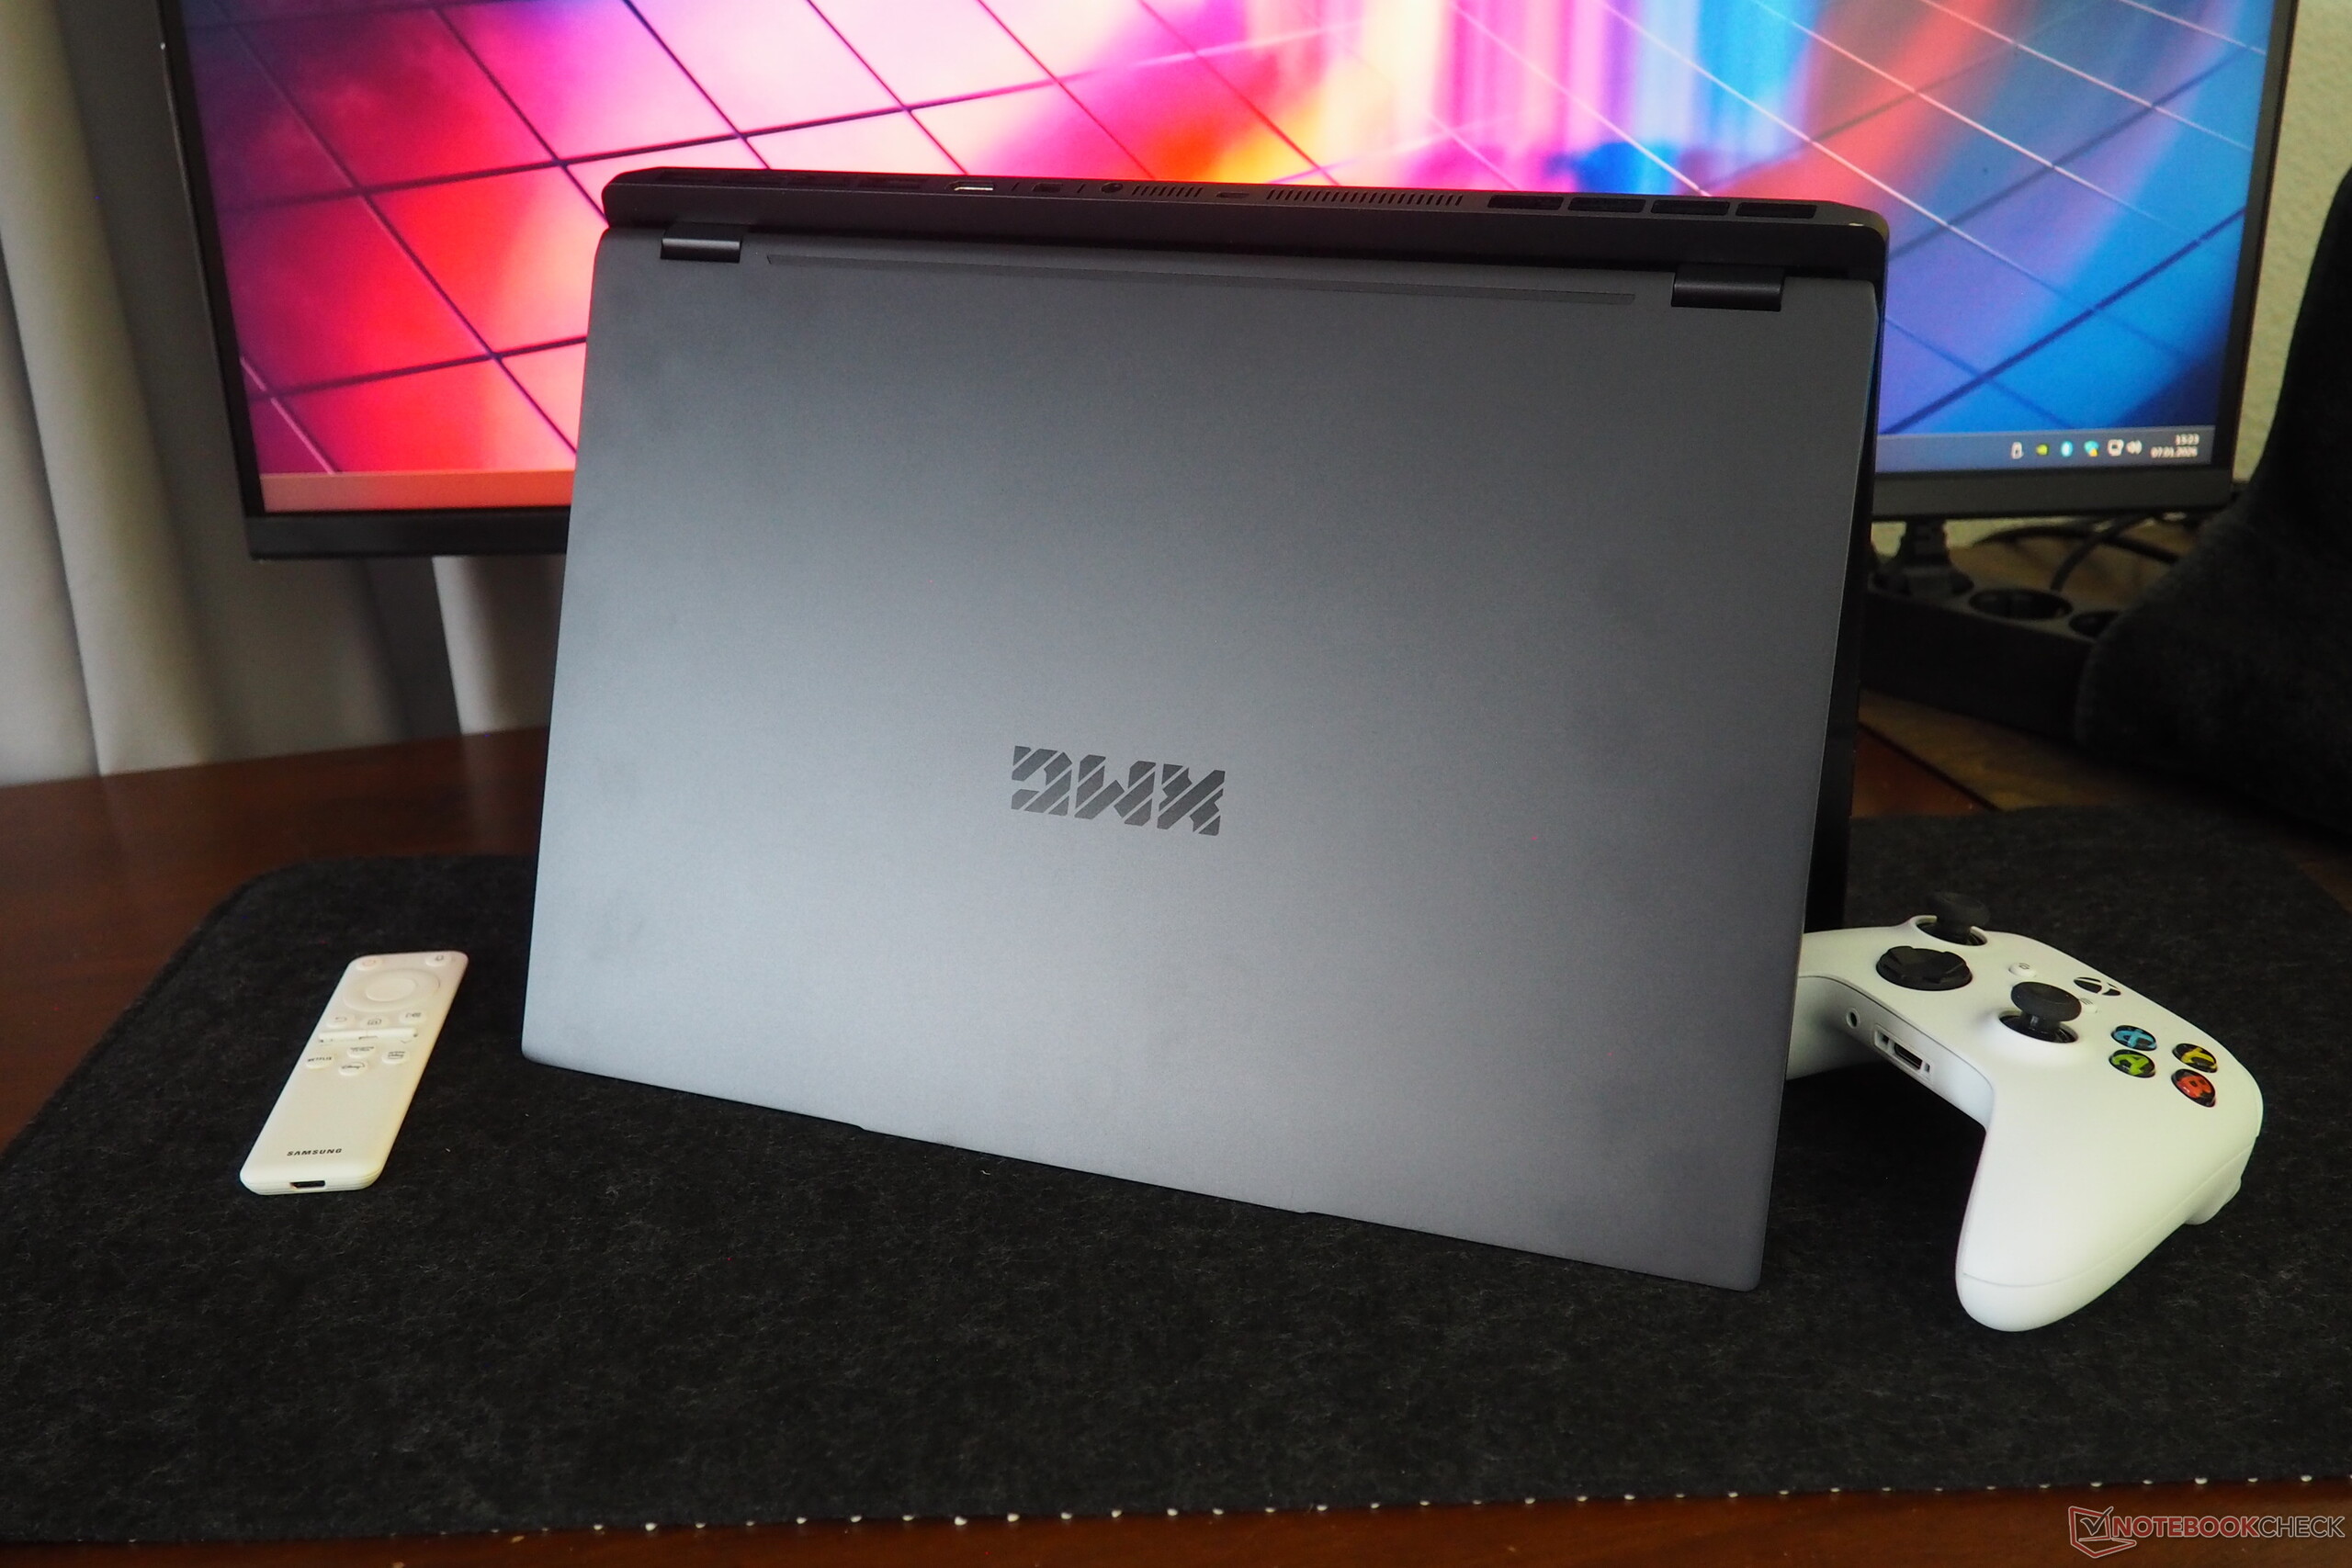
由于使用了金属部件,机身给人一种高级感。虽然深色表面容易留下指纹,但大部分区域的刚性都令人印象深刻。180° 的开合角度也值得称赞。XMG Core 16 VE 的重量为 2.1 千克,在对比组中处于较低水平,因此不会过于沉重。2.3 厘米的厚度也在合理范围之内。

设备
在连接性方面,申克几乎没有什么可抱怨的。除了三个 USB-A 端口和两个 USB-C 端口外,还有两个显示输出端口(HDMI 和 Mini DisplayPort)。此外,该笔记本还包括一个音频插孔、一个 LAN 端口、一个快速读卡器和一个 Kensington 锁插槽。
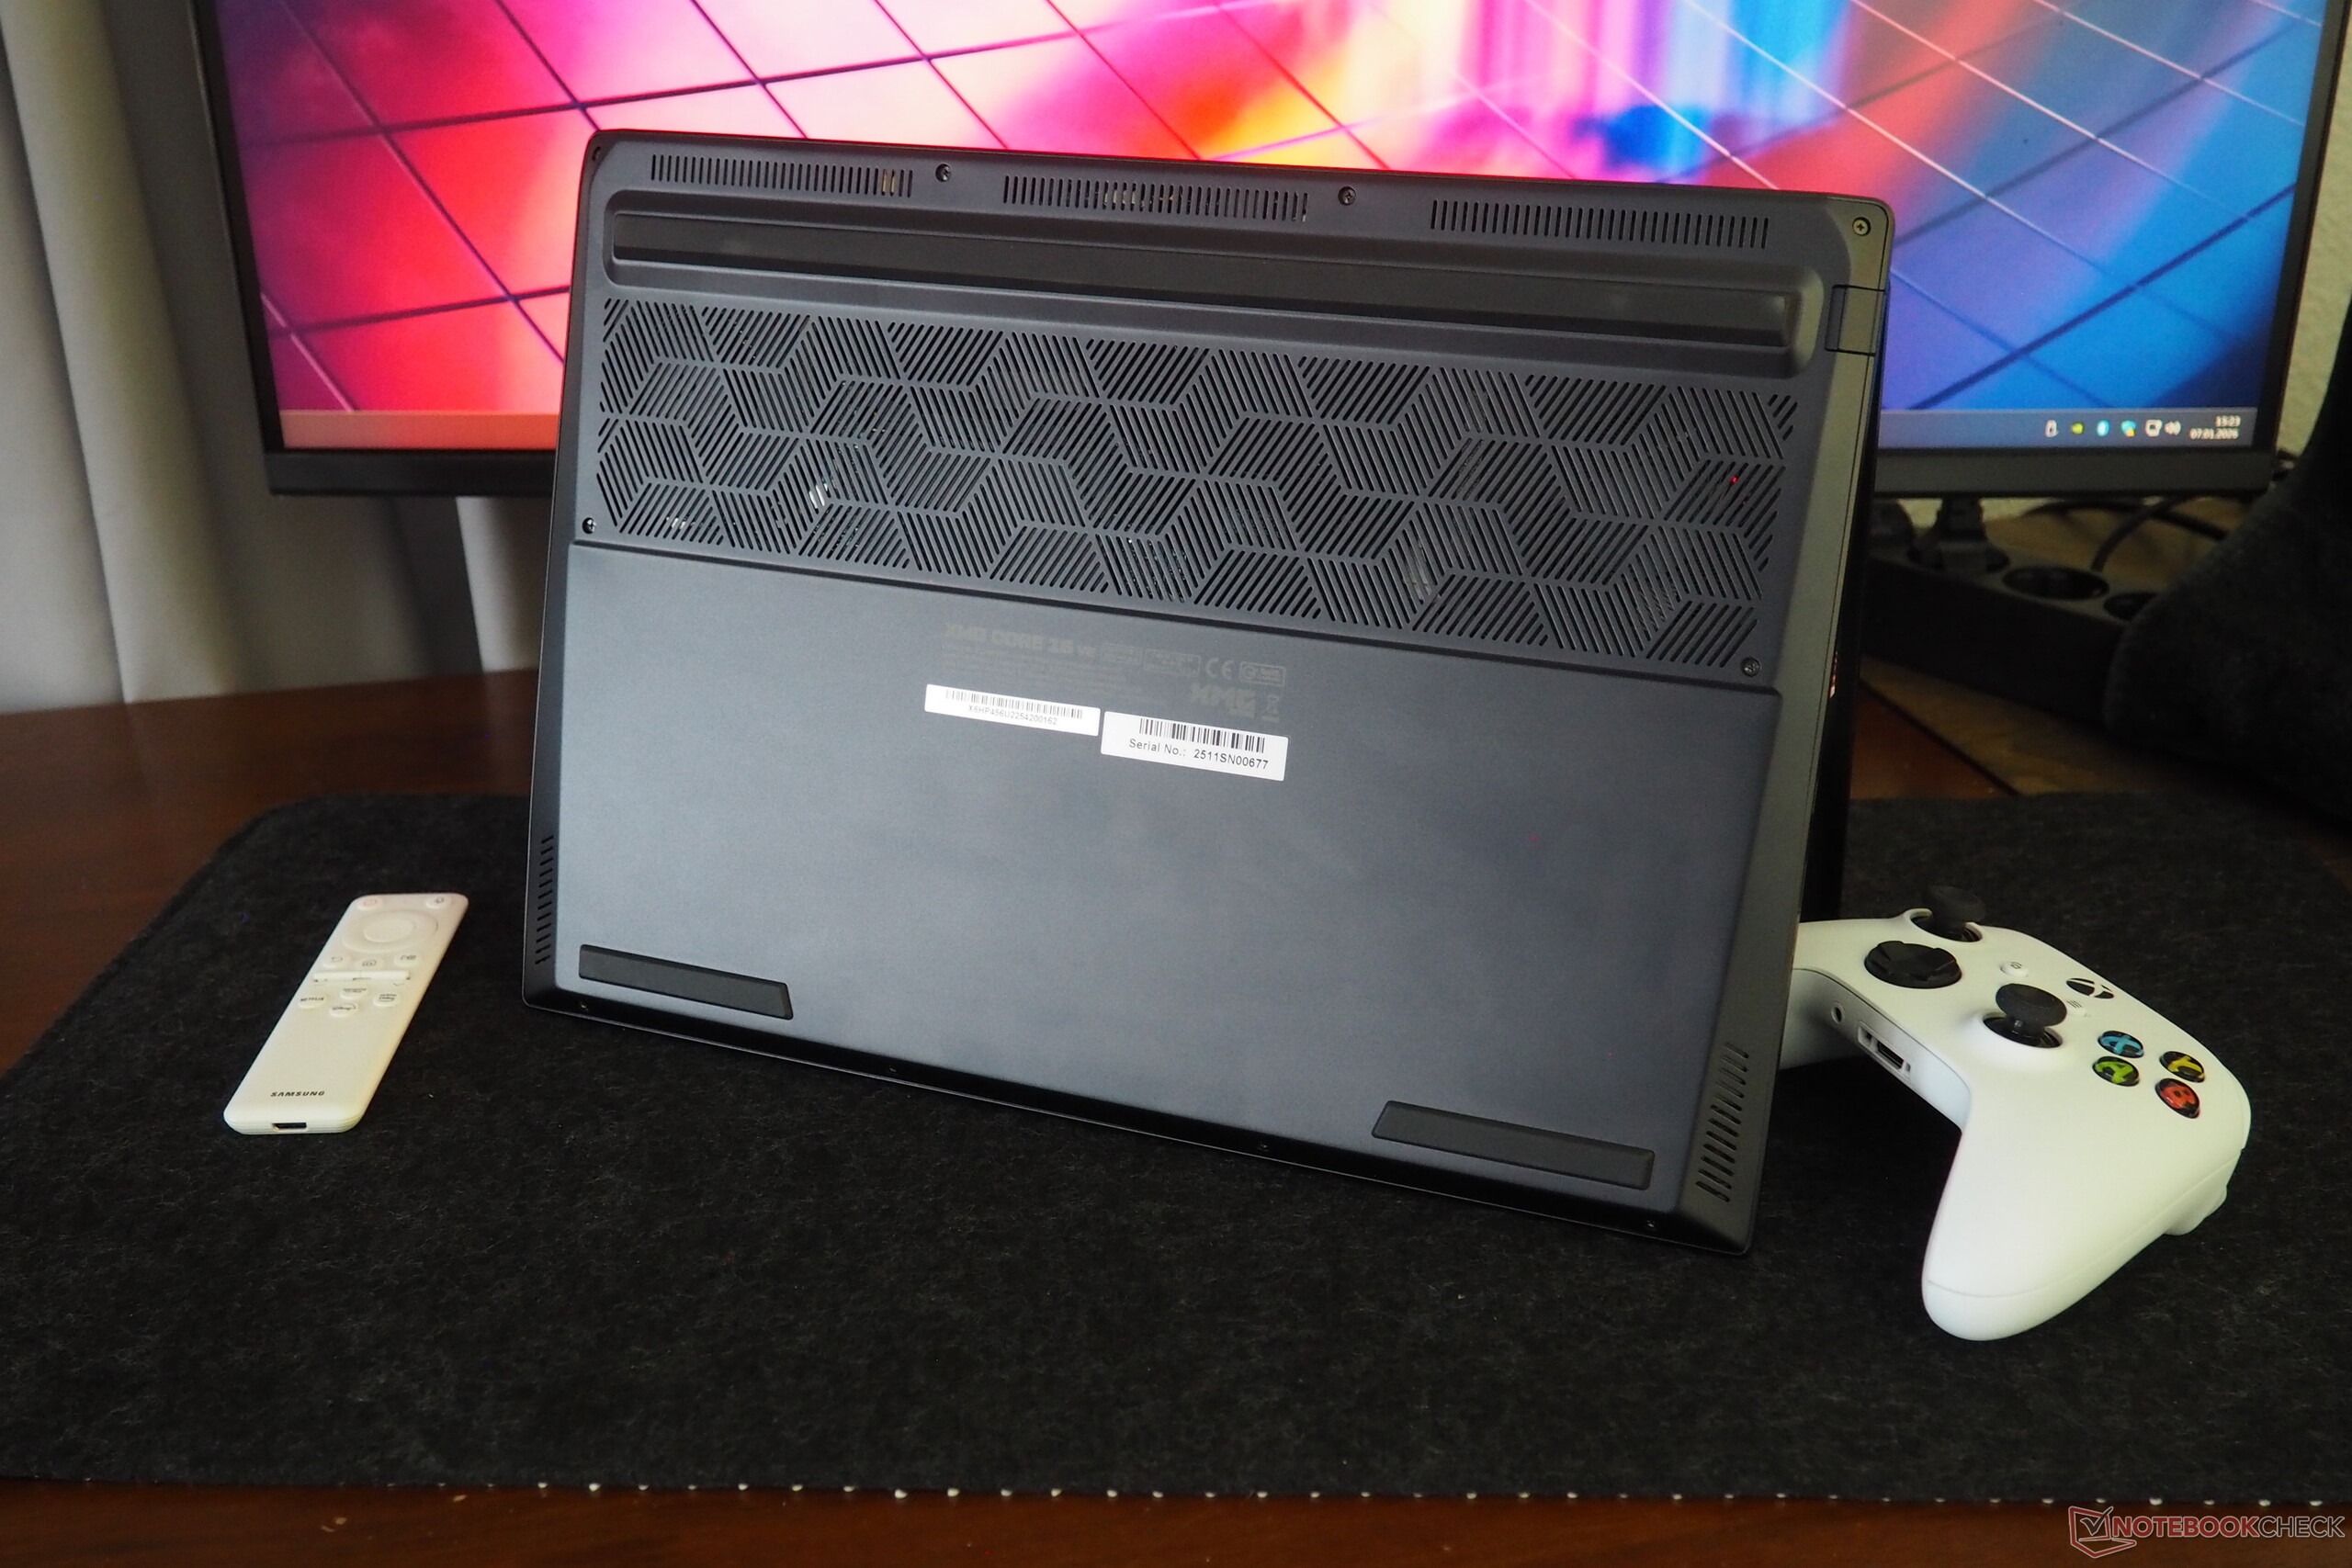
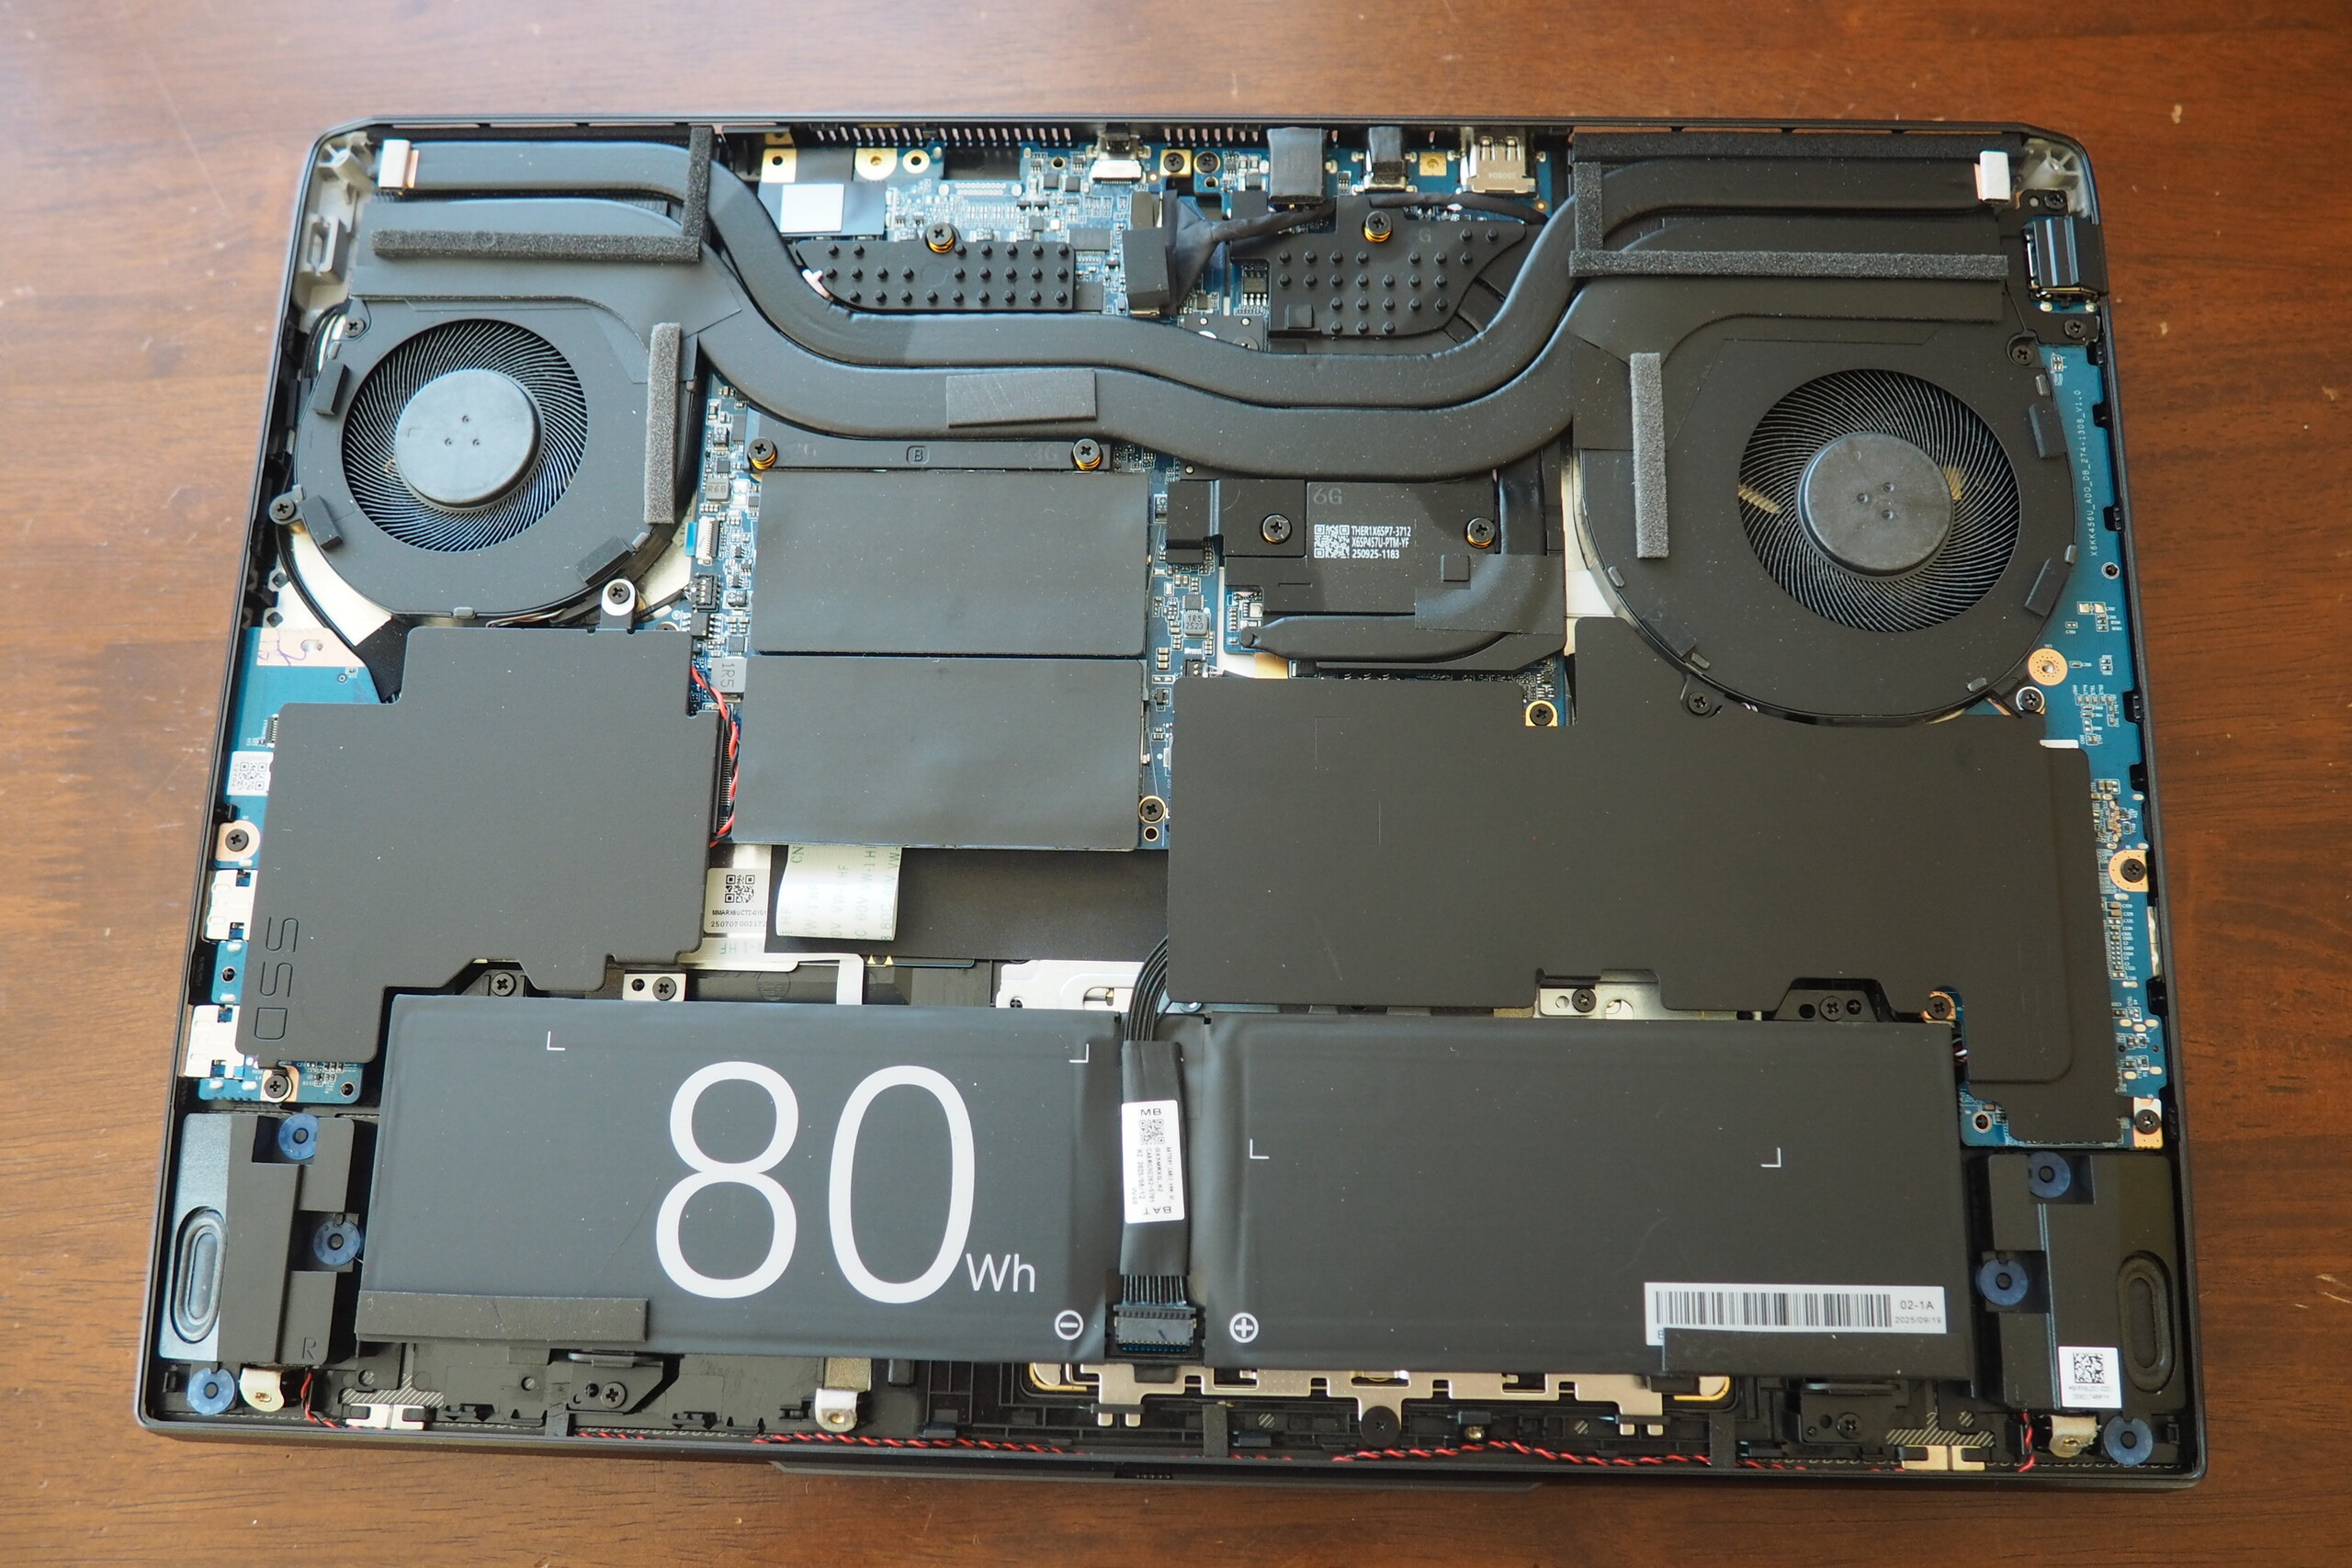
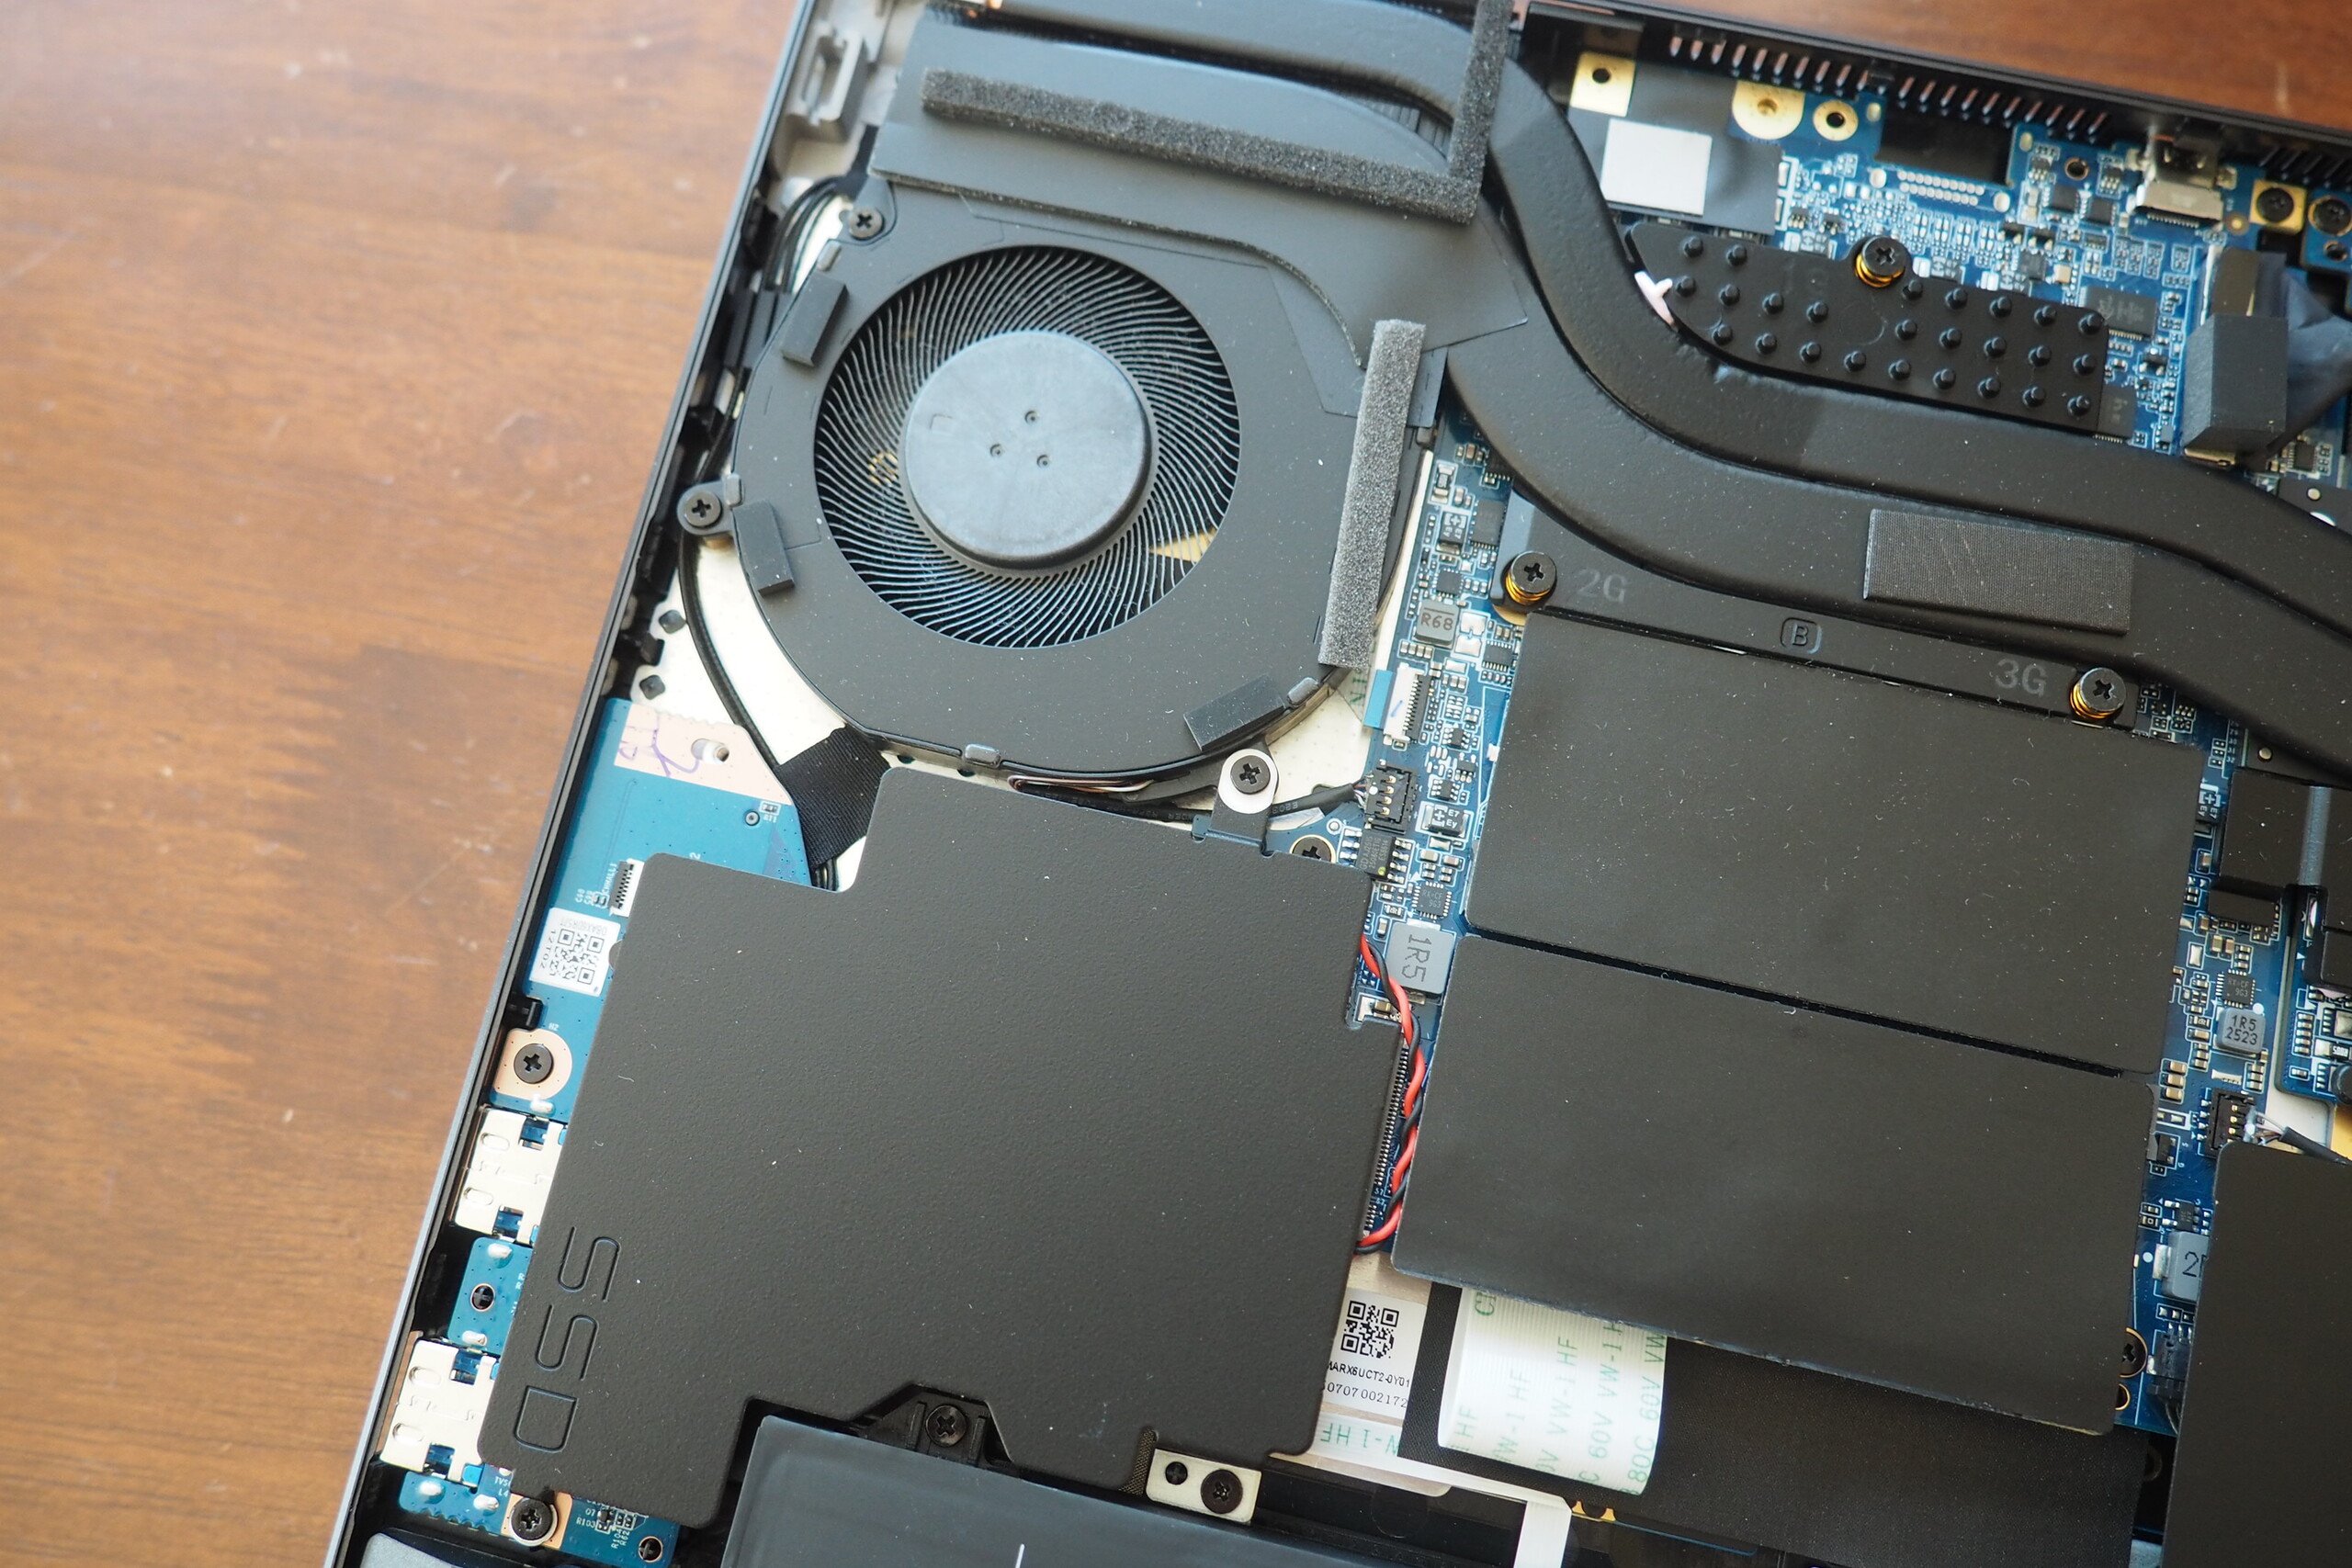
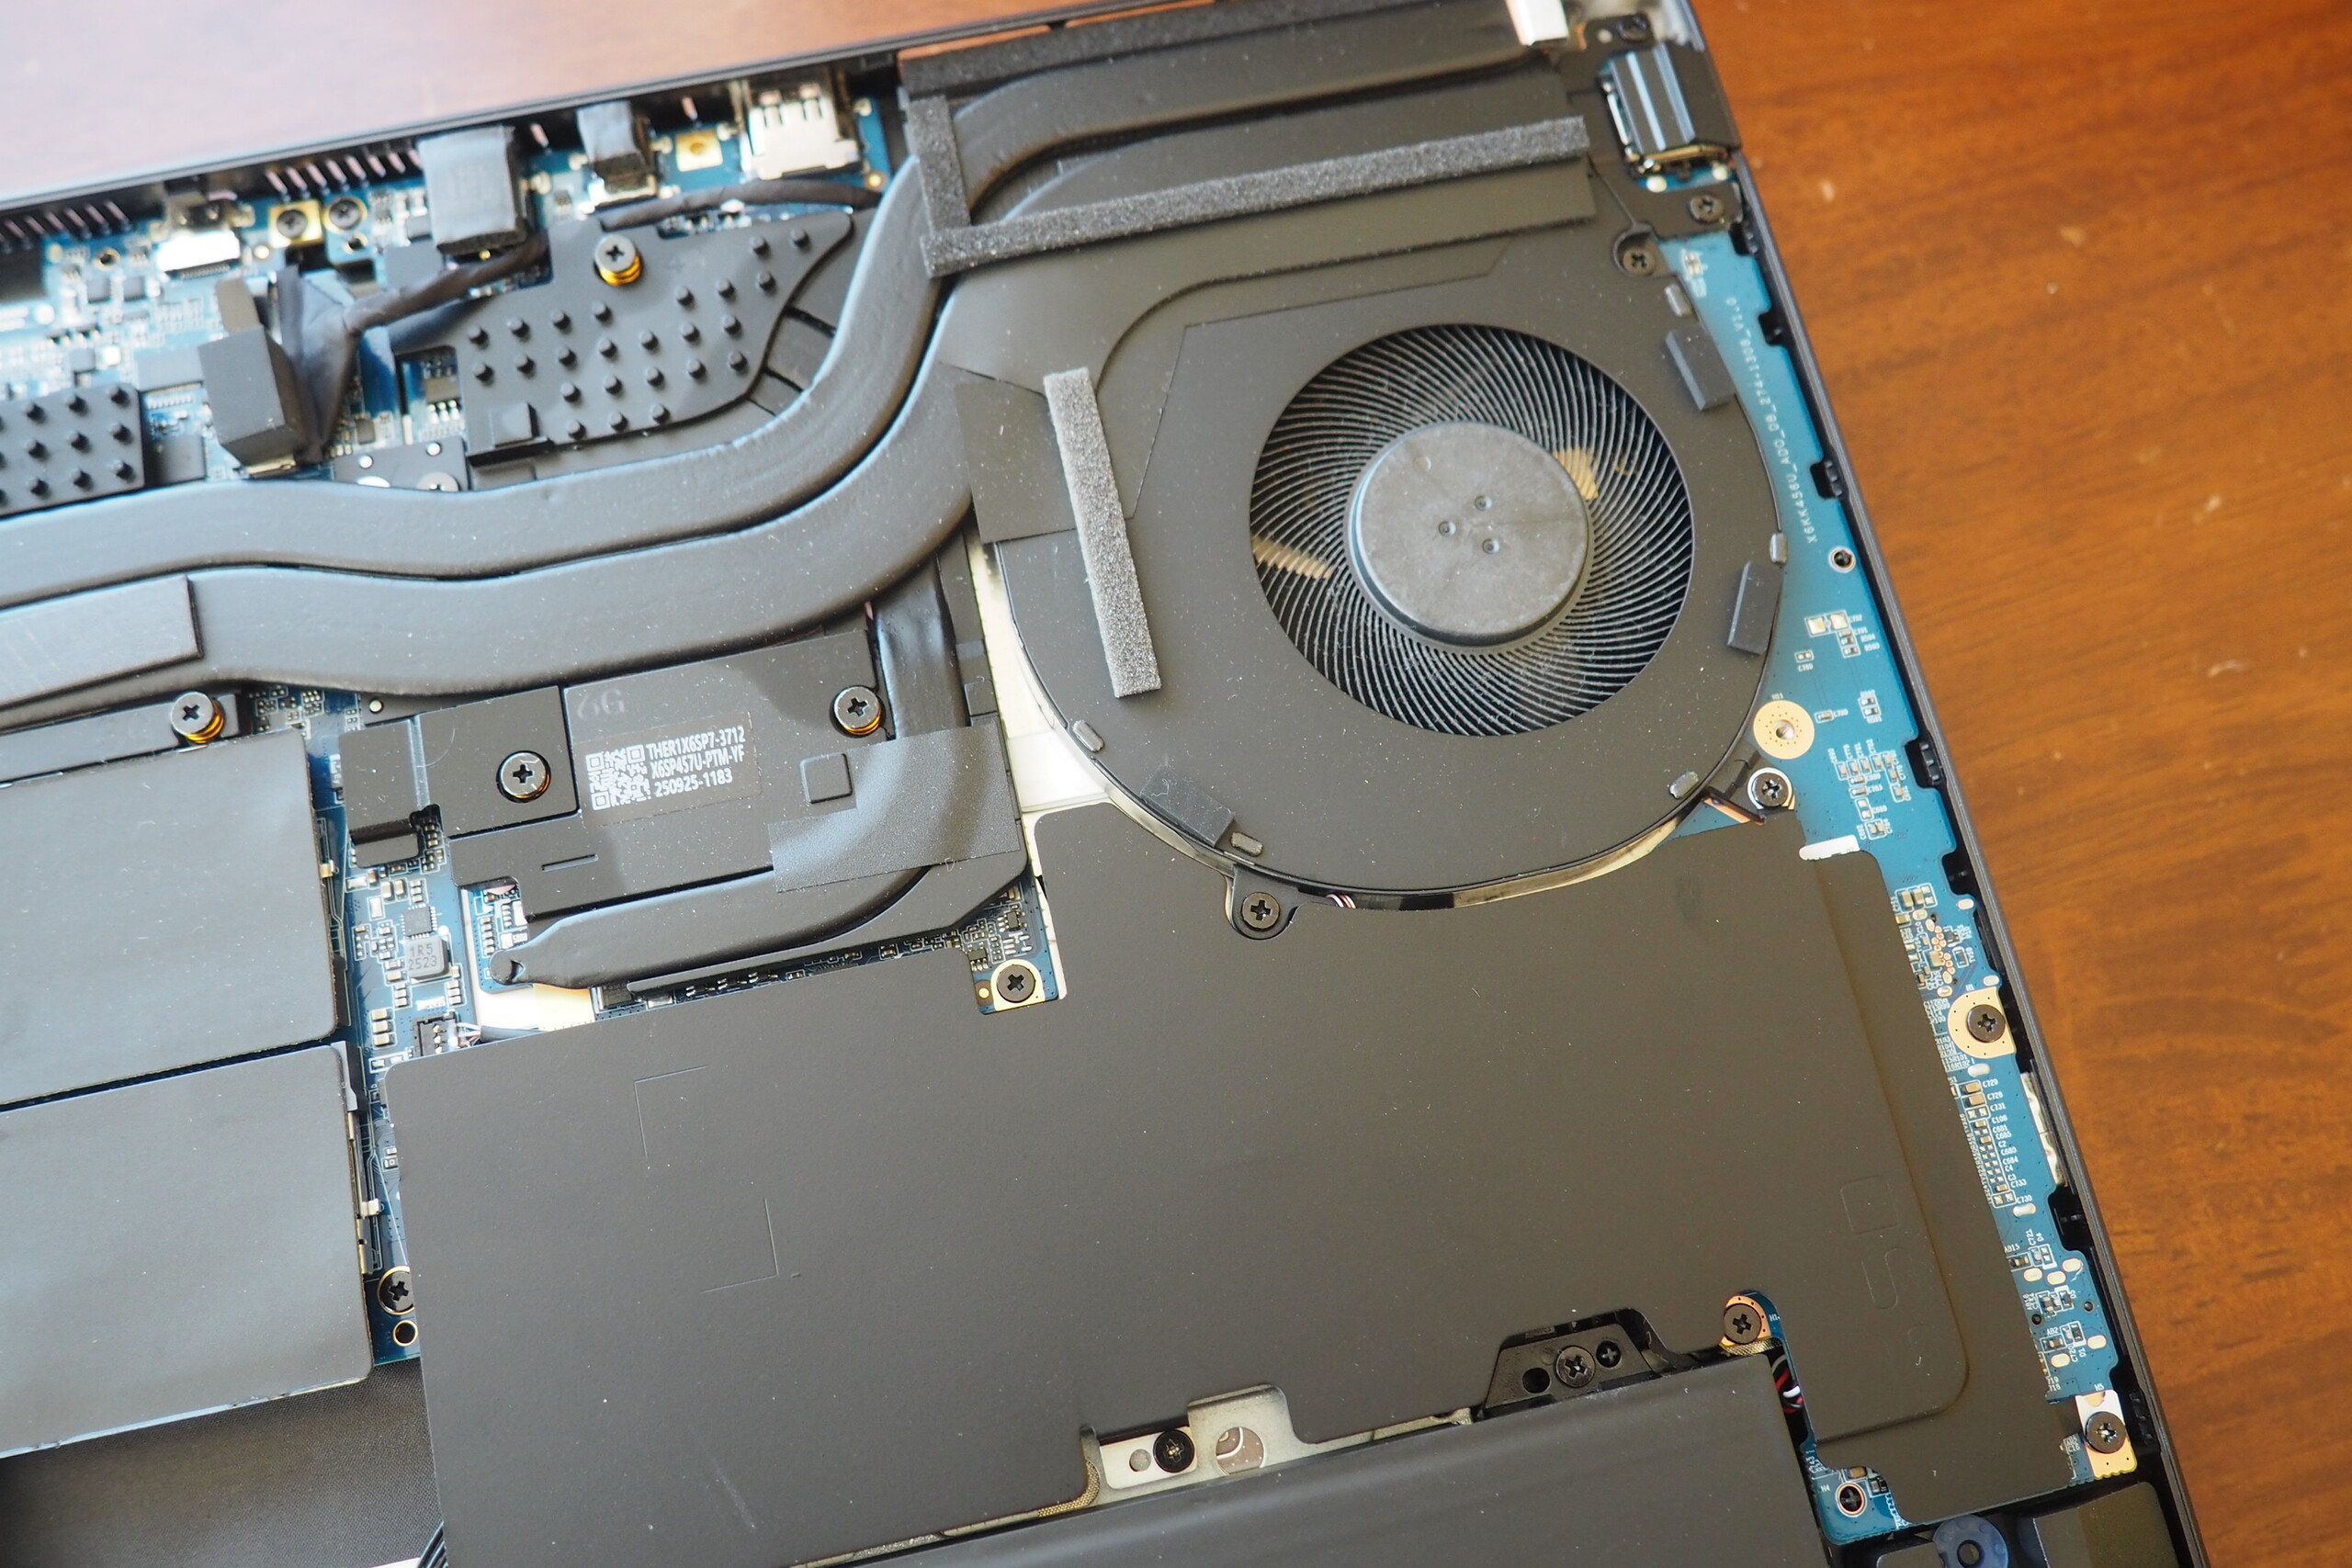
联发科 Wi-Fi 模块可提供不错的上传速度和下载速度。接下来是 FHD 网络摄像头,按照笔记本电脑的标准,它能提供相当清晰的图像,还包括一个物理隐私快门。卸下 10 颗十字头螺钉后,即可轻松进入内部;内部照片如下。


SD 读卡器
| SD Card Reader - average JPG Copy Test (av. of 3 runs) | |
| Schenker XMG Core 16 VE M25 (AV PRO microSD 128 GB V60) | |
| Schenker XMG Core 16 M25 (Angelbird AV Pro V60) | |
| Average of class Gaming (20.9 - 210, n=54, last 2 years) | |
| Lenovo Legion 7 16IAX10 (Toshiba Exceria Pro SDXC 64 GB UHS-II) | |
| Acer Predator Helios Neo 16S AI PHN16S-71-94L9 (AV PRO microSD 128 GB V60) | |
交流
网络摄像头


维护

输入设备
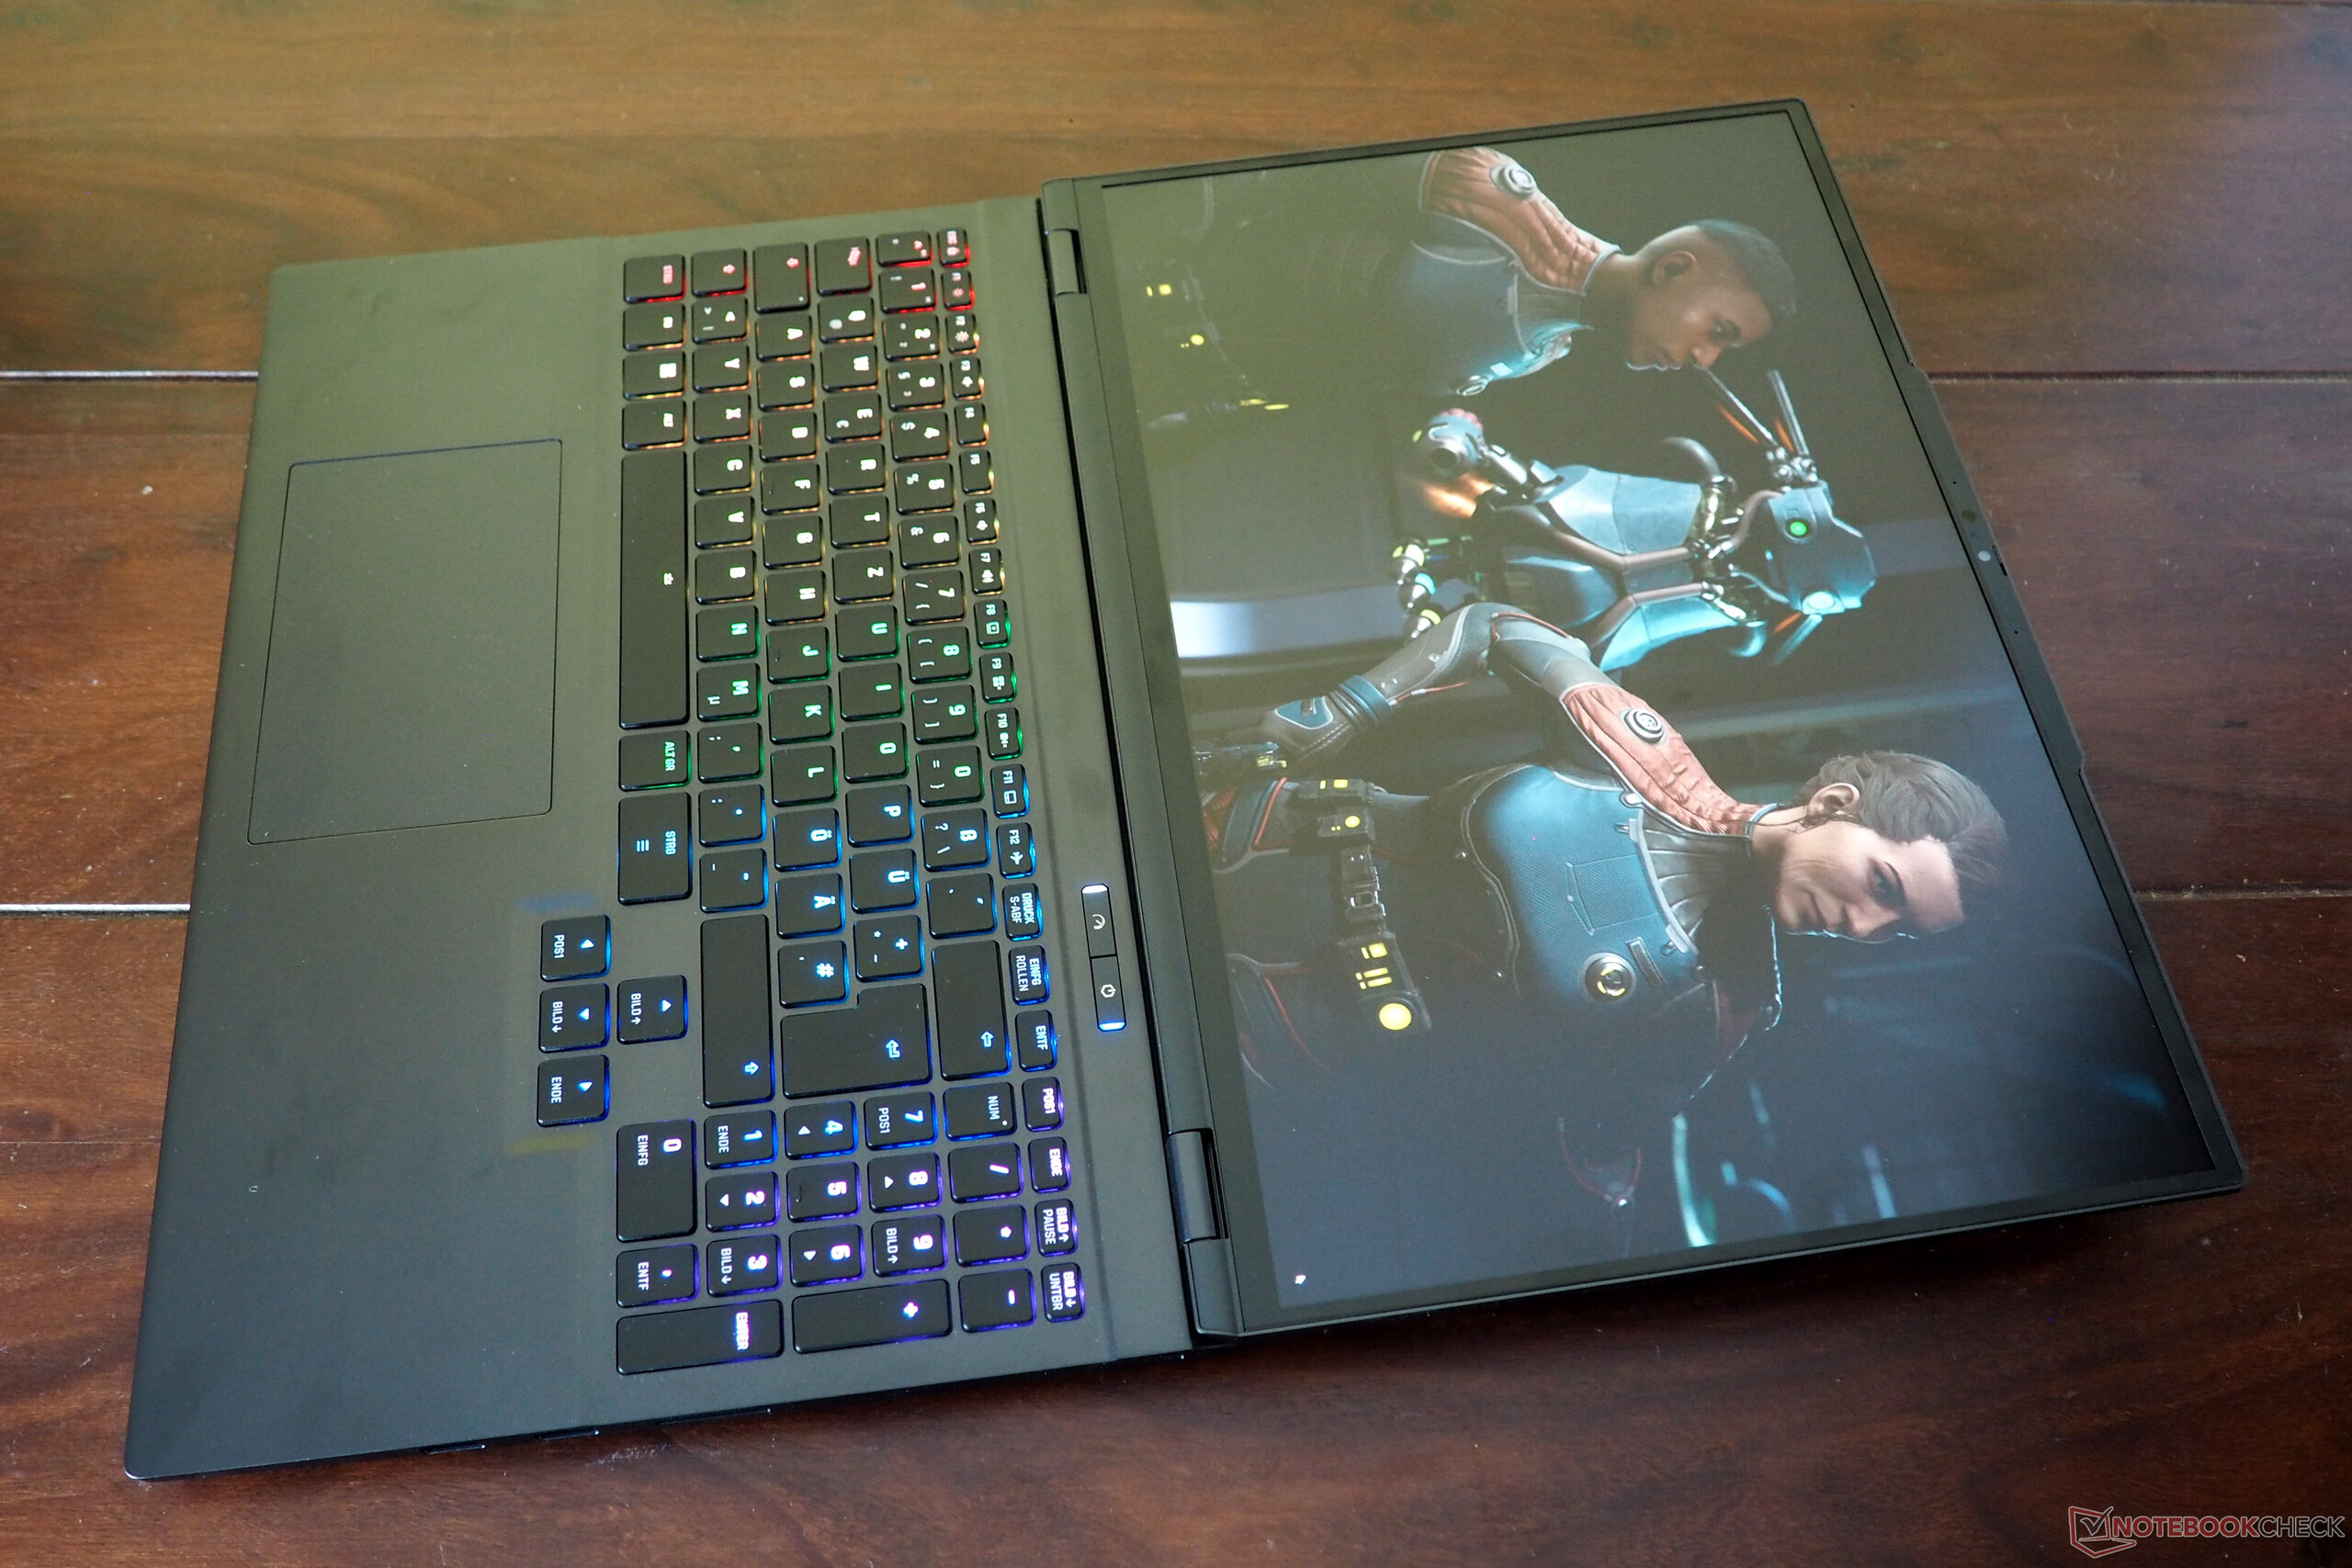
对于橡胶圆顶键盘来说,键入手感相对较好。键盘布局给我们留下了特别深刻的印象,它配备了全尺寸方向键,按键排列也很合理,基本遵循了标准惯例。当然,键盘还配备了 RGB 背光。
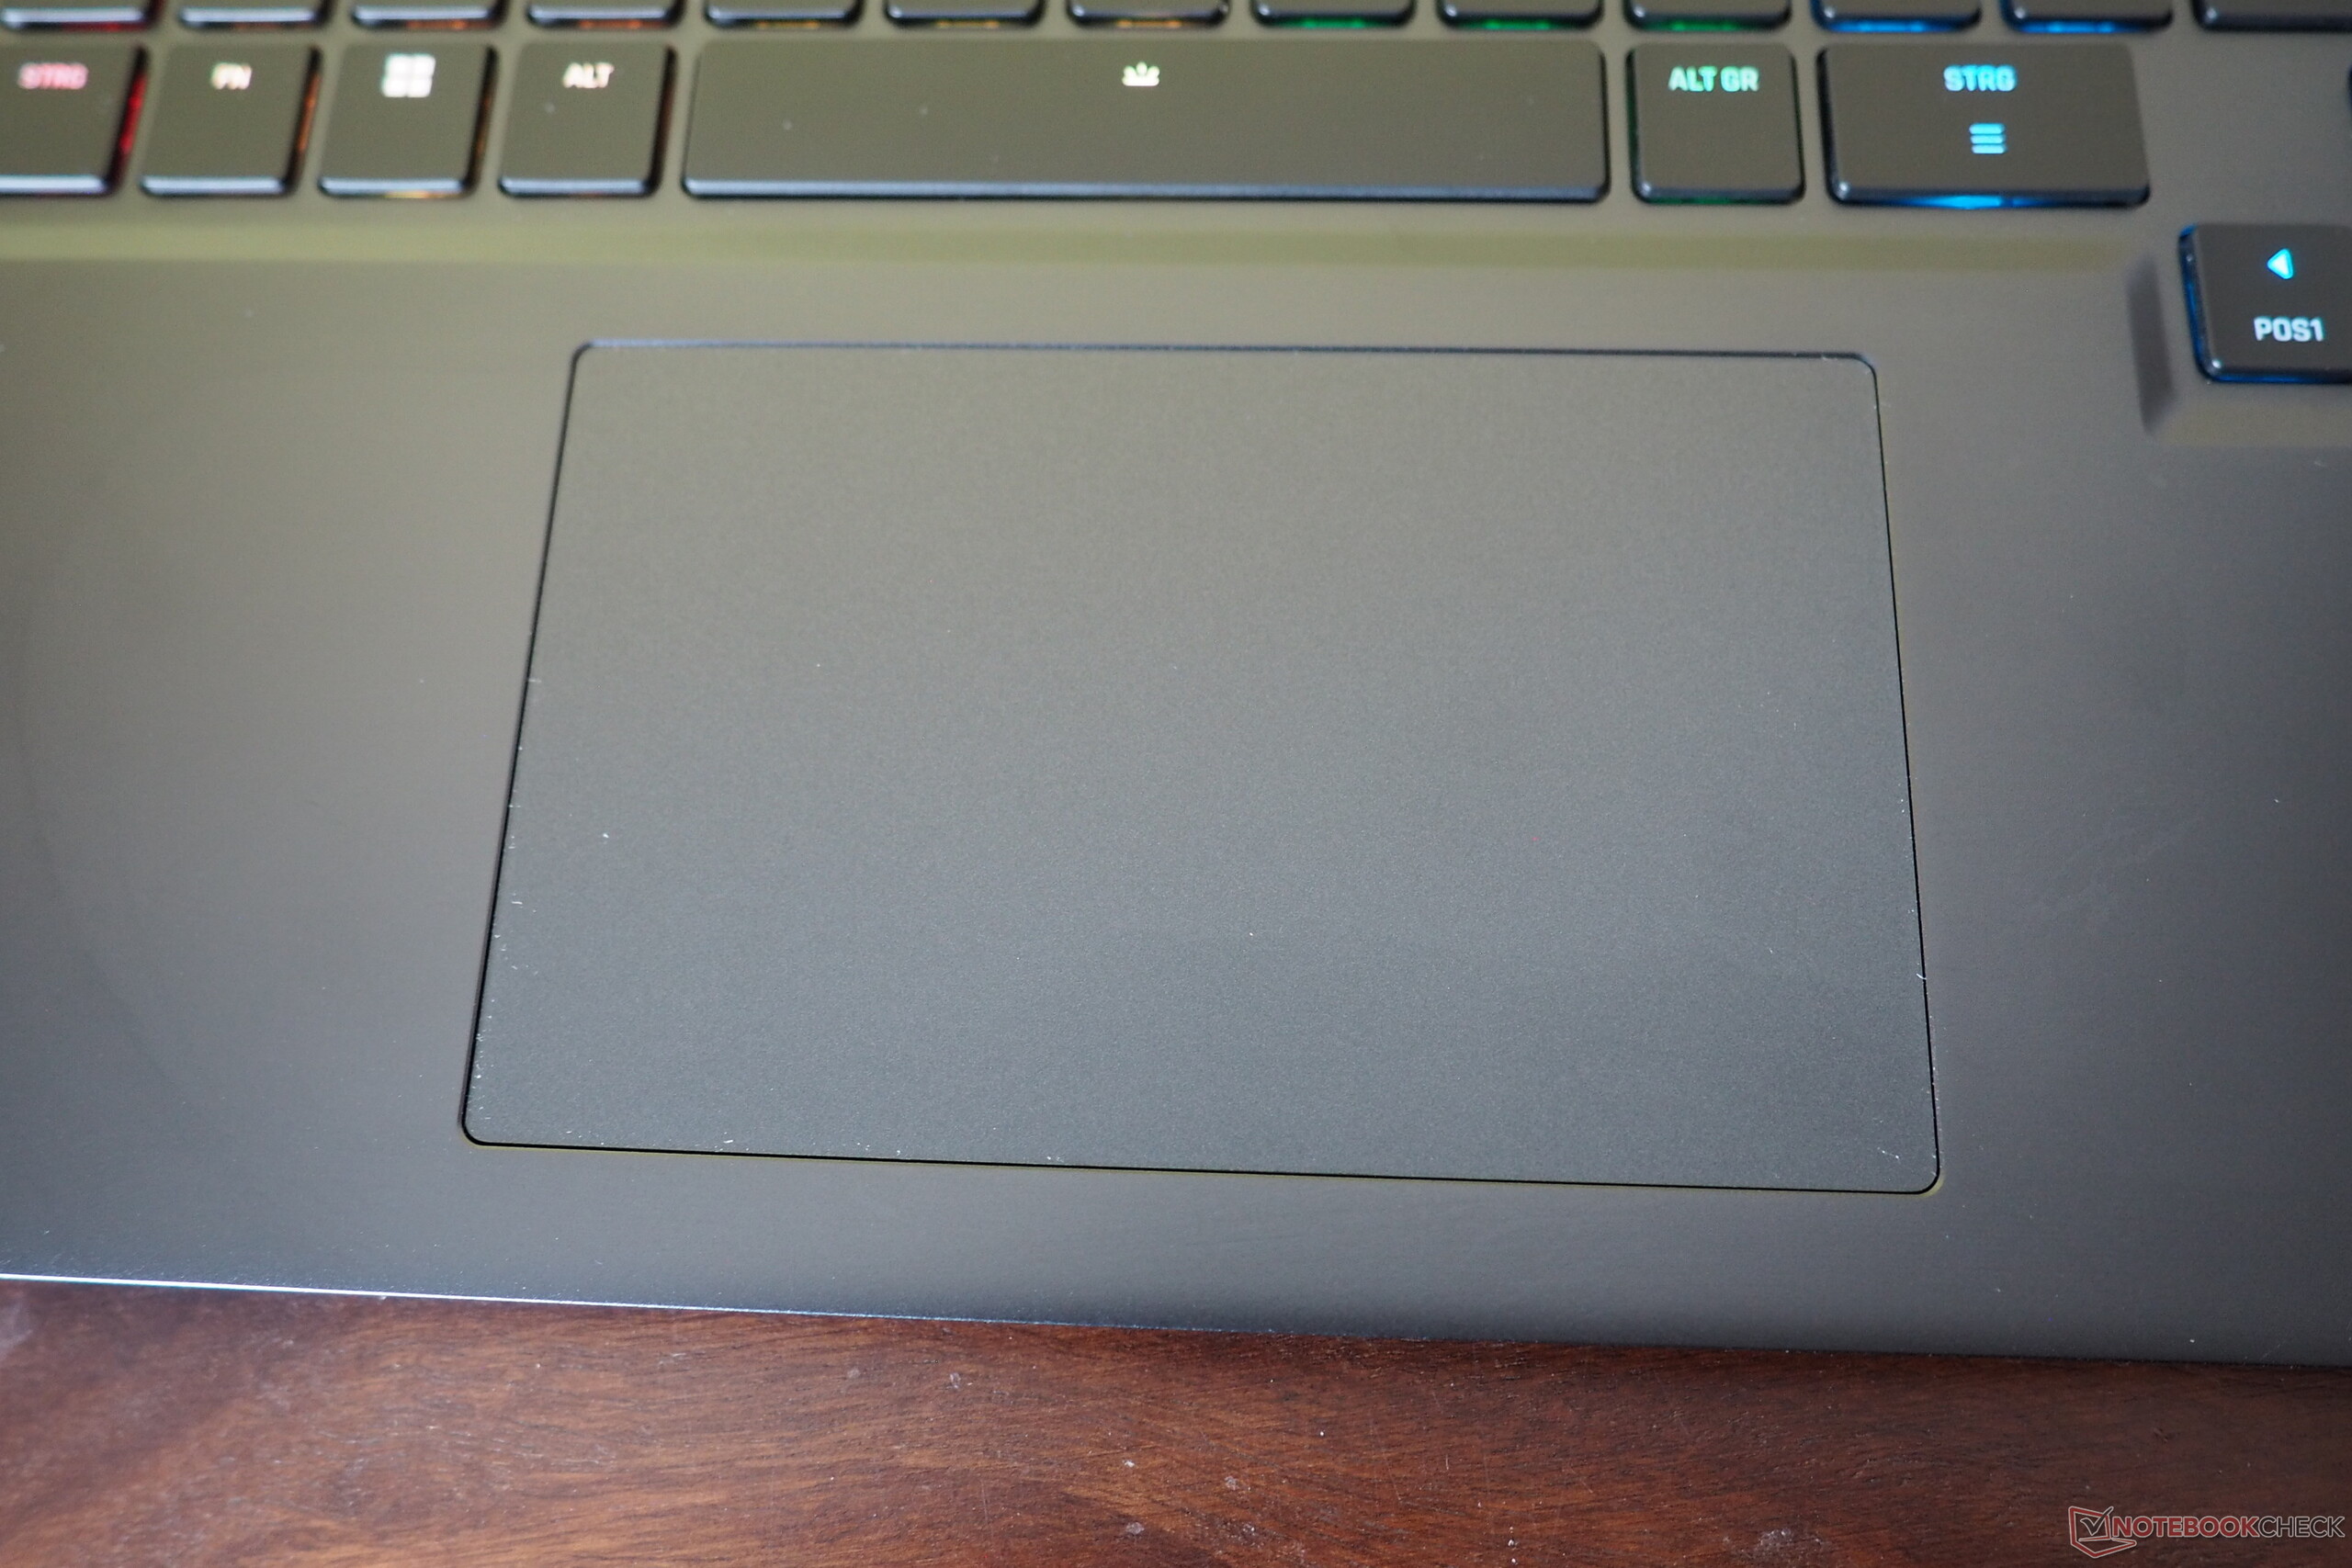
触摸板的尺寸大约为 12.3 × 7.6 厘米,对于这种尺寸的笔记本电脑来说是合适的。一个小缺点是:点击区的声音比较大,感觉有点刺耳。

显示屏
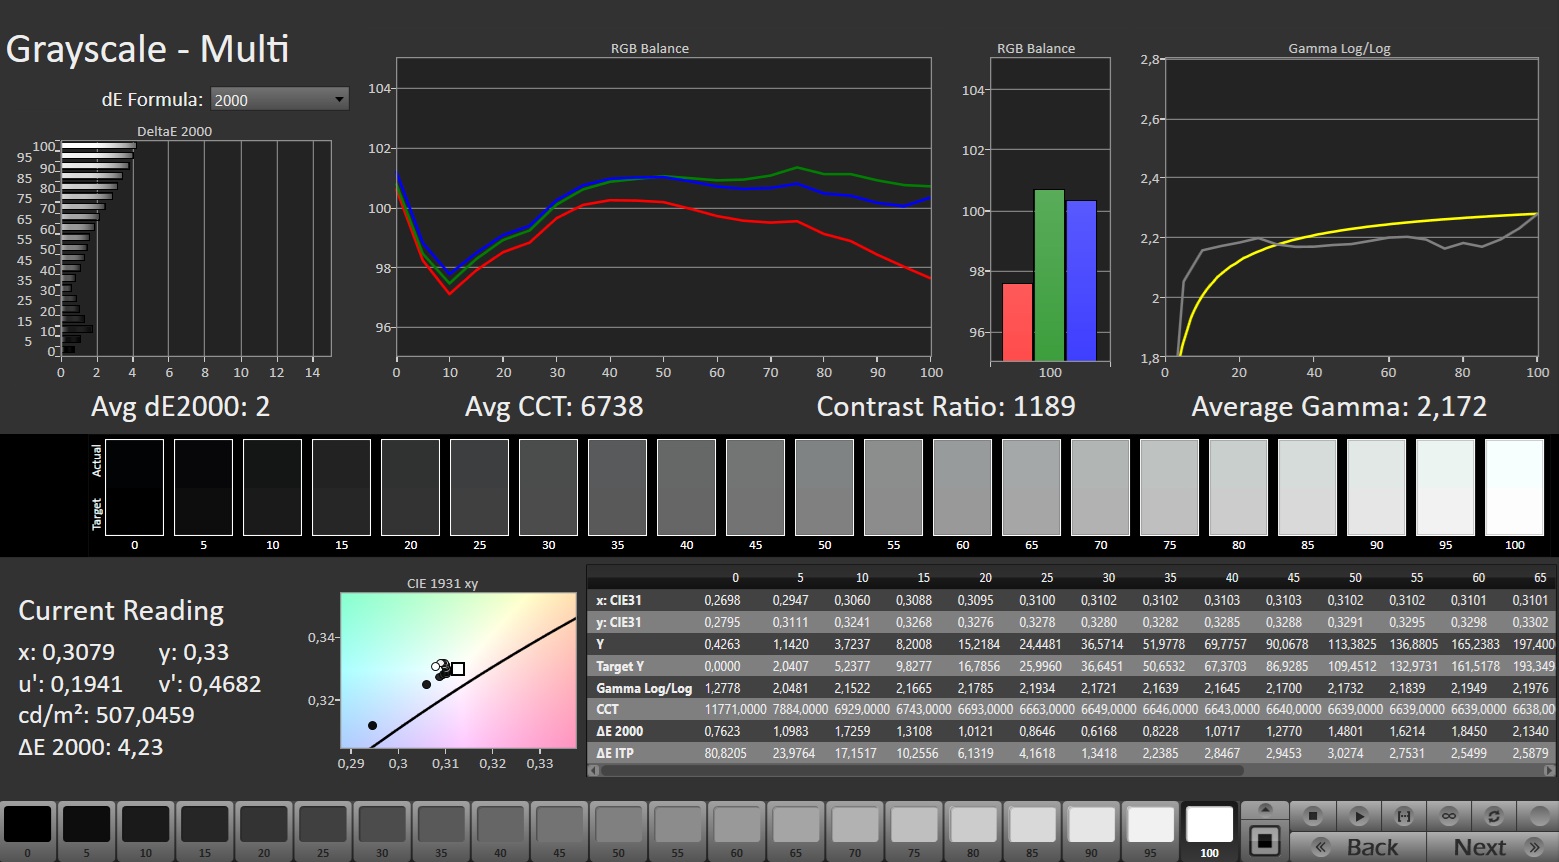
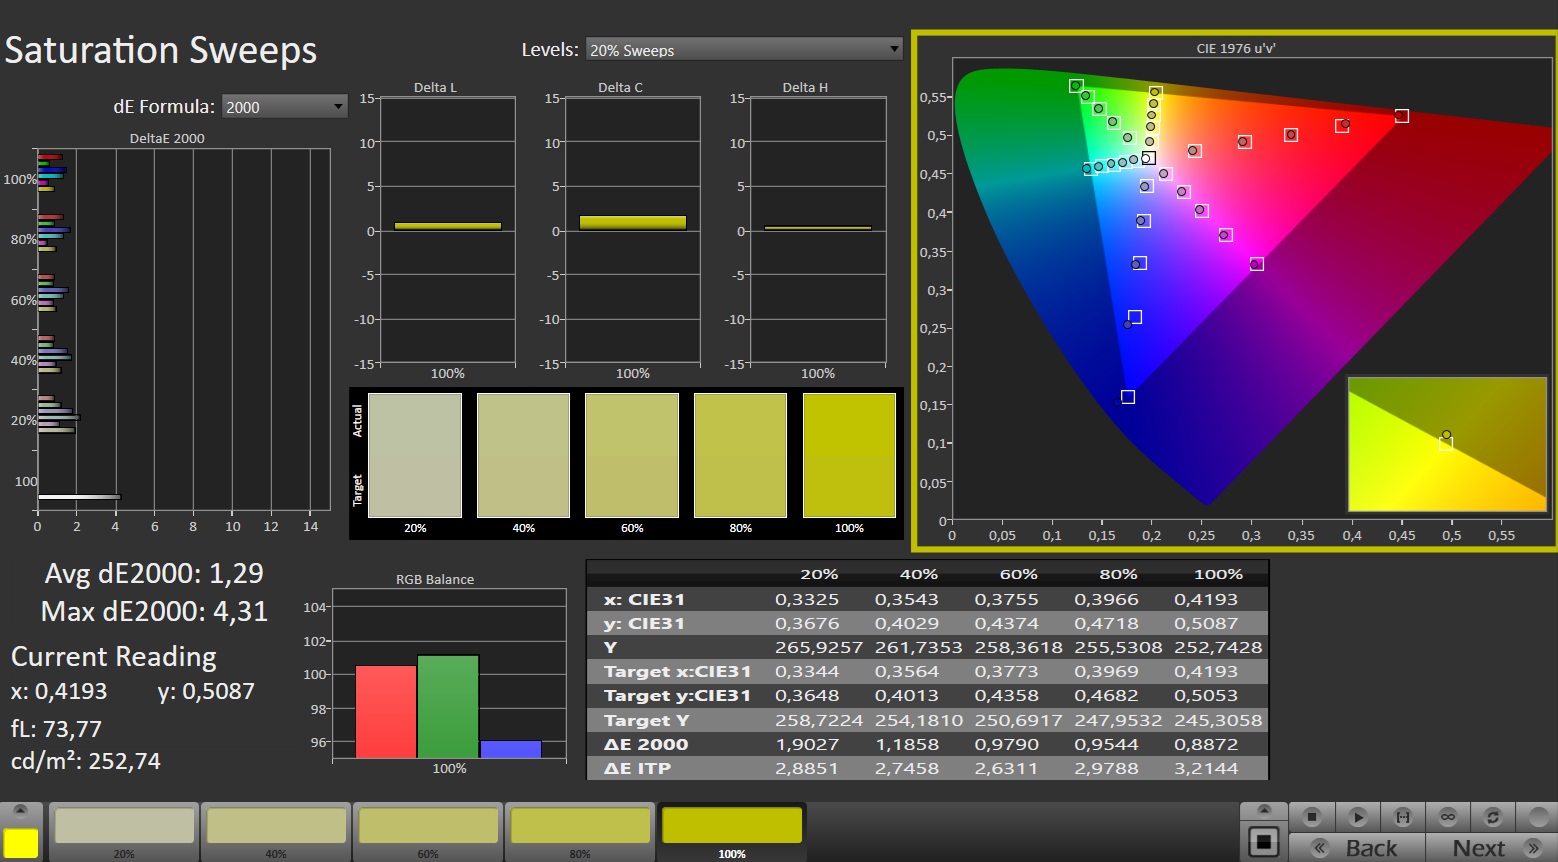
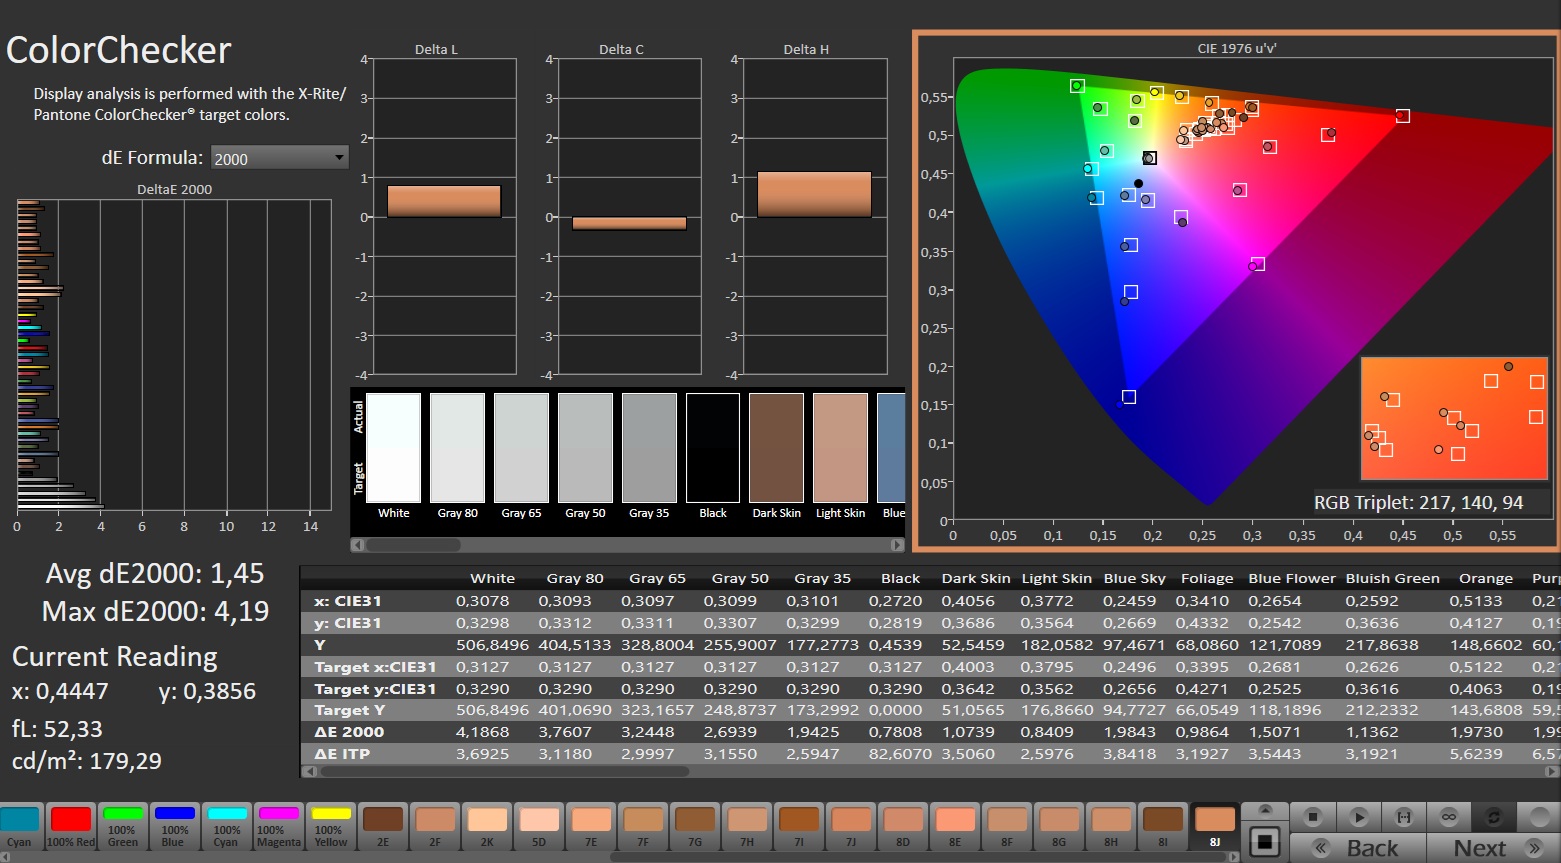
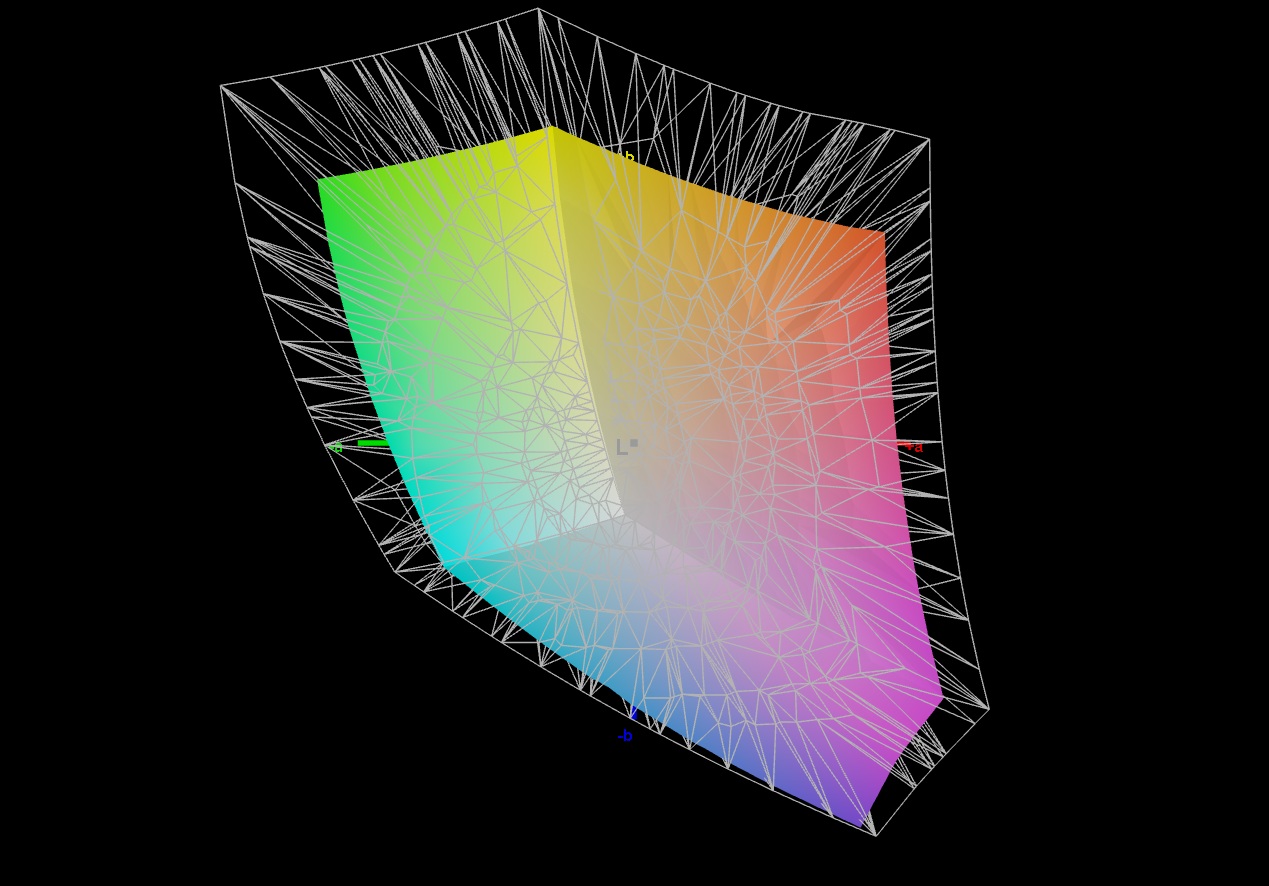
申克没有使用 OLED,而是采用了经典的 IPS 面板,在亮度方面尤其令人满意。平均 488 cd/m² 的亮度相当不错,如果需要,还可以在室外使用。2б560 x 1,600 像素和 180 Hz 也能满足大多数买家的需求。黑阶和对比度是基于典型的 IPS 水平。色彩空间(全 sRGB 覆盖)和可视角度也差不多。在响应时间方面也没什么可抱怨的。
| |||||||||||||||||||||||||
Brightness Distribution: 95 %
Center on Battery: 490 cd/m²
Contrast: 1167:1 (Black: 0.42 cd/m²)
ΔE ColorChecker Calman: 1.45 | ∀{0.5-29.43 Ø4.72}
calibrated: 0.98
ΔE Greyscale Calman: 2 | ∀{0.09-98 Ø4.97}
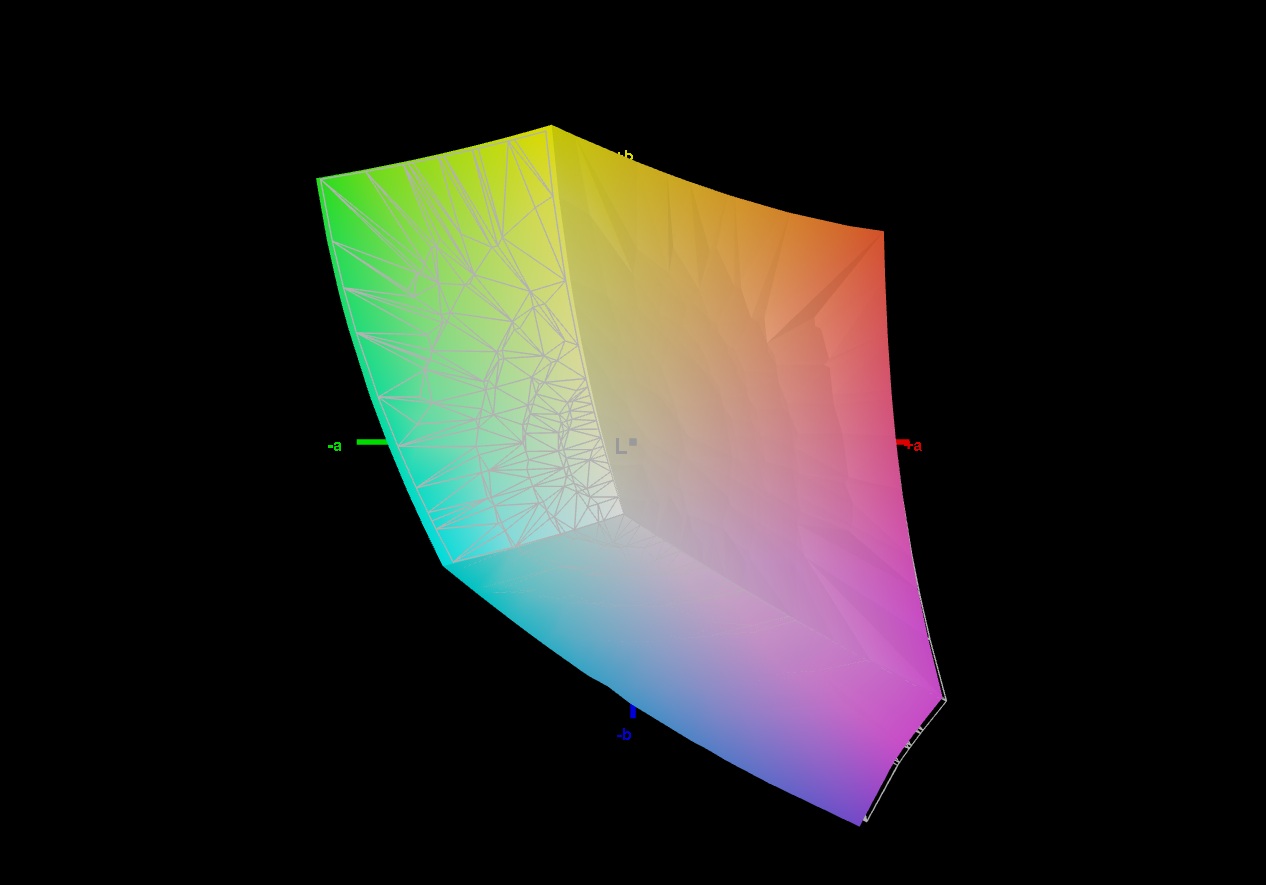
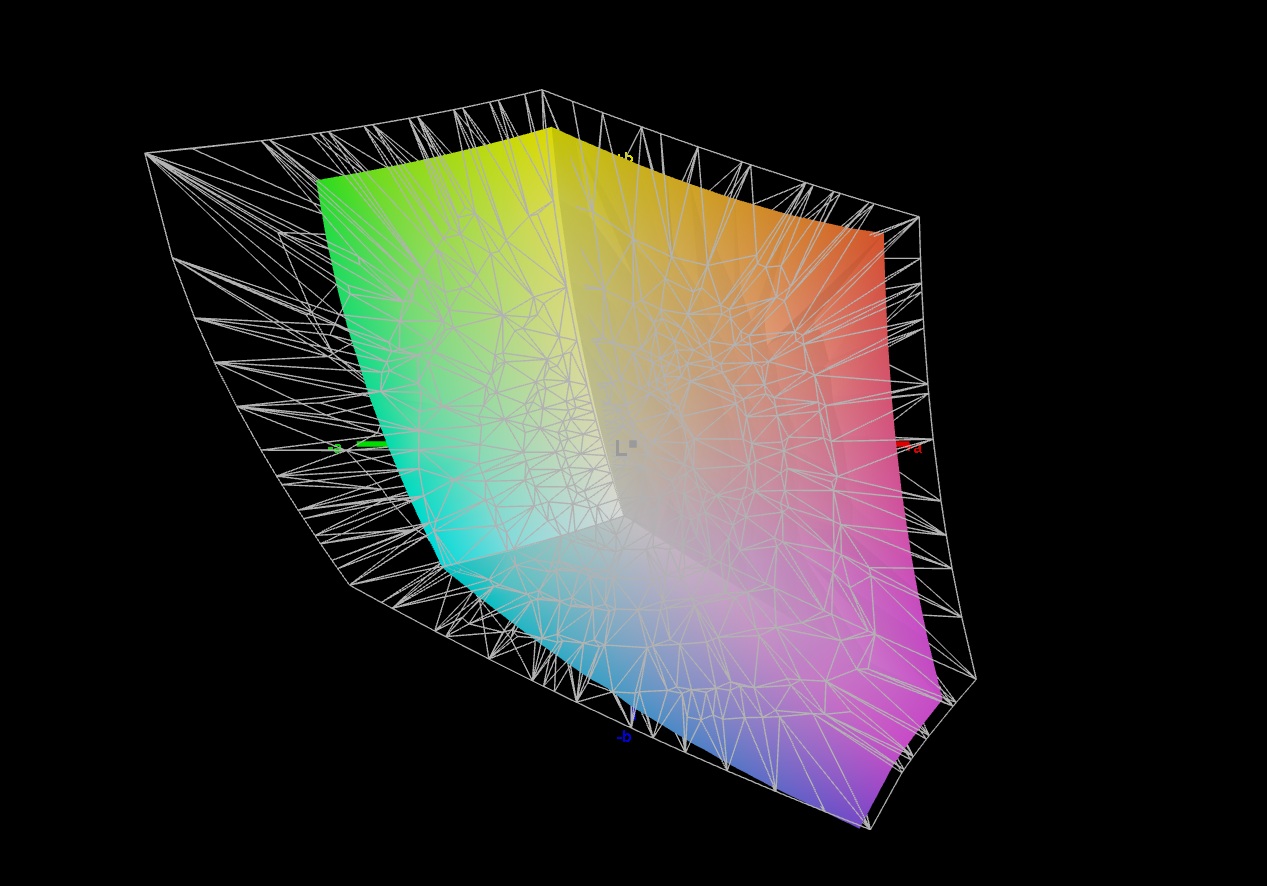
71.4% AdobeRGB 1998 (Argyll 3D)
98.7% sRGB (Argyll 3D)
69% Display P3 (Argyll 3D)
Gamma: 2.172
CCT: 6738 K
| Schenker XMG Core 16 VE M25 MNG007DA5-4, IPS, 2560x1600, 16", 180 Hz | Tulpar T6 V3.5 B160UANAC.J (AUO33B7), IPS, 1920x1200, 16", 165 Hz | HP Omen 16-ap0091ng AUODBB2, IPS, 1920x1200, 16", 144 Hz | Lenovo Legion 7 16IAX10 Samsung ATNA60HS01-0, OLED, 2560x1600, 16", 165 Hz | Schenker XMG Core 16 M25 MNG007DA6-4, IPS, 2560x1600, 16", 300 Hz | Acer Predator Helios Neo 16S AI PHN16S-71-94L9 Samsung ATNA60DL03-0, OLED, 2560x1600, 16", 240 Hz | |
|---|---|---|---|---|---|---|
| Display | -1% | -43% | 25% | 23% | 27% | |
| Display P3 Coverage (%) | 69 | 68.6 -1% | 40 -42% | 99.6 44% | 98.8 43% | 99.9 45% |
| sRGB Coverage (%) | 98.7 | 98.7 0% | 58.1 -41% | 100 1% | 100 1% | 100 1% |
| AdobeRGB 1998 Coverage (%) | 71.4 | 70.6 -1% | 38.7 -46% | 93.5 31% | 88.4 24% | 96.5 35% |
| Response Times | -32% | -208% | 90% | 7% | 97% | |
| Response Time Grey 50% / Grey 80% * (ms) | 12.1 ? | 12.4 ? -2% | 27.6 ? -128% | 0.6 ? 95% | 10.7 ? 12% | 0.2 ? 98% |
| Response Time Black / White * (ms) | 5 ? | 8.1 ? -62% | 19.4 ? -288% | 0.8 ? 84% | 4.9 ? 2% | 0.25 ? 95% |
| PWM Frequency (Hz) | 1317 ? | 960 | ||||
| PWM Amplitude * (%) | 23 | 50 | ||||
| Screen | -33% | -100% | -12% | -12% | 86% | |
| Brightness middle (cd/m²) | 490 | 456 -7% | 328 -33% | 477.6 -3% | 512 4% | 390 -20% |
| Brightness (cd/m²) | 488 | 403 -17% | 313 -36% | 483 -1% | 483 -1% | 394 -19% |
| Brightness Distribution (%) | 95 | 79 -17% | 91 -4% | 95 0% | 91 -4% | 98 3% |
| Black Level * (cd/m²) | 0.42 | 0.39 7% | 0.26 38% | 0.43 -2% | 0.04 90% | |
| Contrast (:1) | 1167 | 1169 0% | 1262 8% | 1191 2% | 9750 735% | |
| Colorchecker dE 2000 * | 1.45 | 3.05 -110% | 4.73 -226% | 3.11 -114% | 2.4 -66% | 1.61 -11% |
| Colorchecker dE 2000 max. * | 4.19 | 6.56 -57% | 17.47 -317% | 5.99 -43% | 3.8 9% | 3.49 17% |
| Colorchecker dE 2000 calibrated * | 0.98 | 1.03 -5% | 4.22 -331% | 0.79 19% | 0.9 8% | 1.59 -62% |
| Greyscale dE 2000 * | 2 | 3.9 -95% | 2.05 -2% | 0.9 55% | 3.1 -55% | 1.2 40% |
| Gamma | 2.172 101% | 2.279 97% | 2.63 84% | 2.18 101% | 2.41 91% | 2.235 98% |
| CCT | 6738 96% | 7198 90% | 6718 97% | 6405 101% | 6534 99% | 6580 99% |
| Total Average (Program / Settings) | -22% /
-26% | -117% /
-103% | 34% /
14% | 6% /
-2% | 70% /
75% |
* ... smaller is better


Screen Flickering / PWM (Pulse-Width Modulation)
| Screen flickering / PWM not detected | 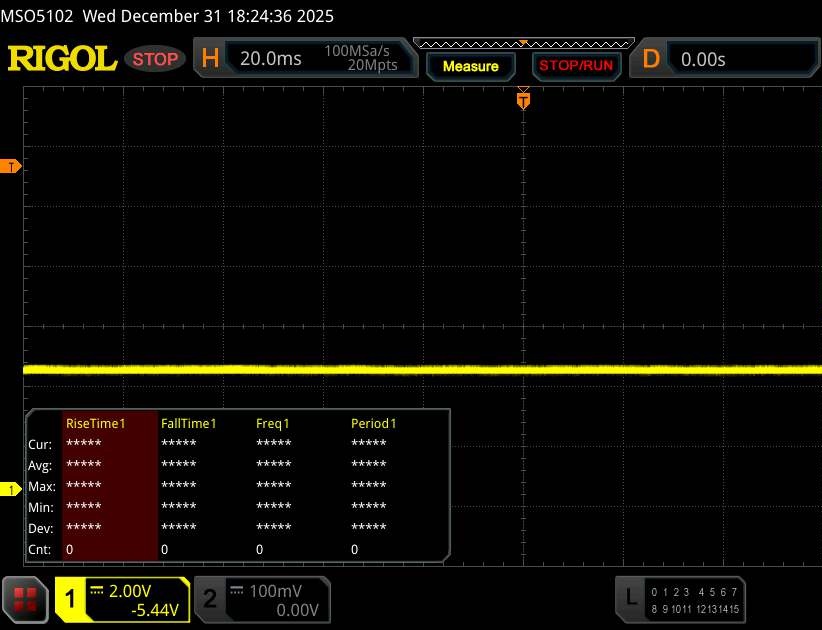 | ||
In comparison: 52 % of all tested devices do not use PWM to dim the display. If PWM was detected, an average of 7747 (minimum: 5 - maximum: 343500) Hz was measured. | |||
Display Response Times
| ↔ Response Time Black to White | ||
|---|---|---|
| 5 ms ... rise ↗ and fall ↘ combined | ↗ 1.8 ms rise | 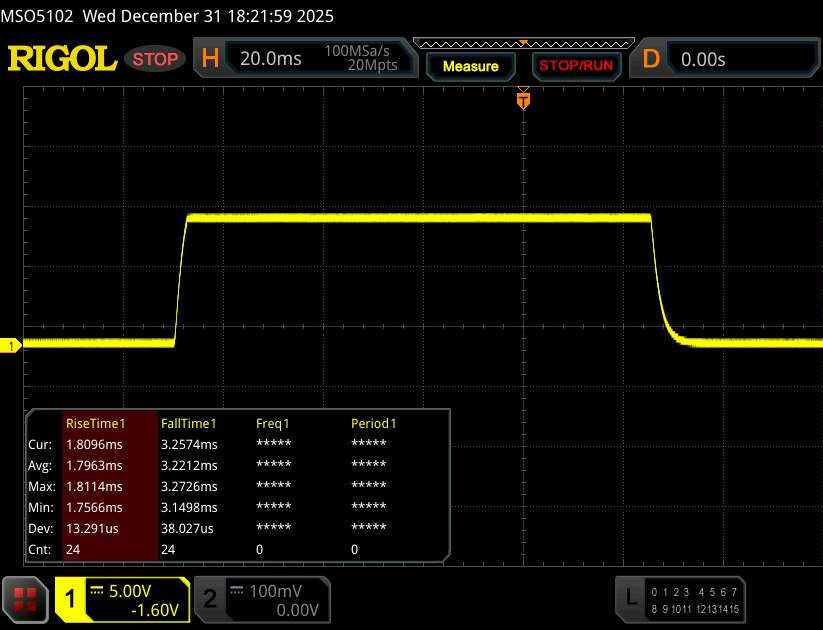 |
| ↘ 3.2 ms fall | ||
| The screen shows very fast response rates in our tests and should be very well suited for fast-paced gaming. In comparison, all tested devices range from 0.1 (minimum) to 240 (maximum) ms. » 18 % of all devices are better. This means that the measured response time is better than the average of all tested devices (19.8 ms). | ||
| ↔ Response Time 50% Grey to 80% Grey | ||
| 12.1 ms ... rise ↗ and fall ↘ combined | ↗ 5.9 ms rise | 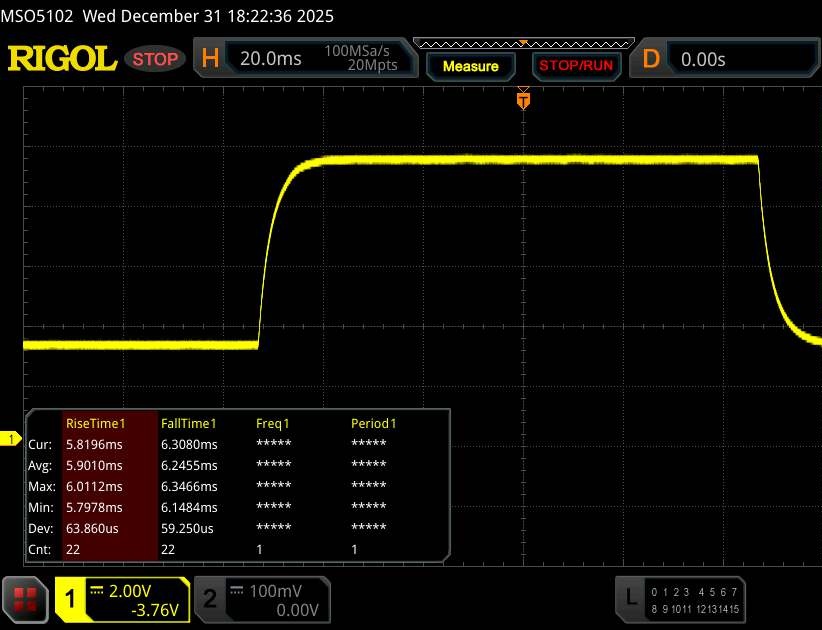 |
| ↘ 6.2 ms fall | ||
| The screen shows good response rates in our tests, but may be too slow for competitive gamers. In comparison, all tested devices range from 0.165 (minimum) to 636 (maximum) ms. » 26 % of all devices are better. This means that the measured response time is better than the average of all tested devices (31 ms). | ||
性能
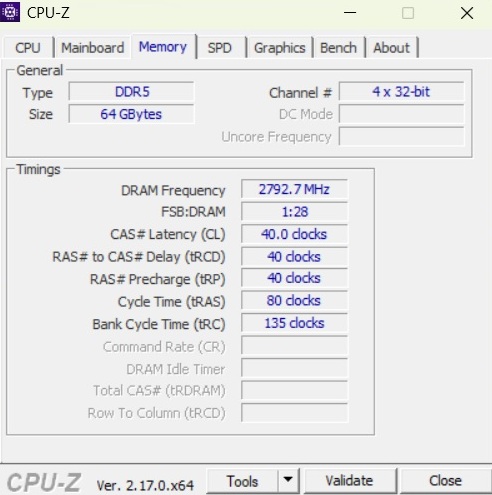
在 CPU 和 GPU 性能方面,XMG Core 16 VE 属于中等水平。两个 SO-DIMM 插槽和两个 M.2 插槽使未来升级更加容易。
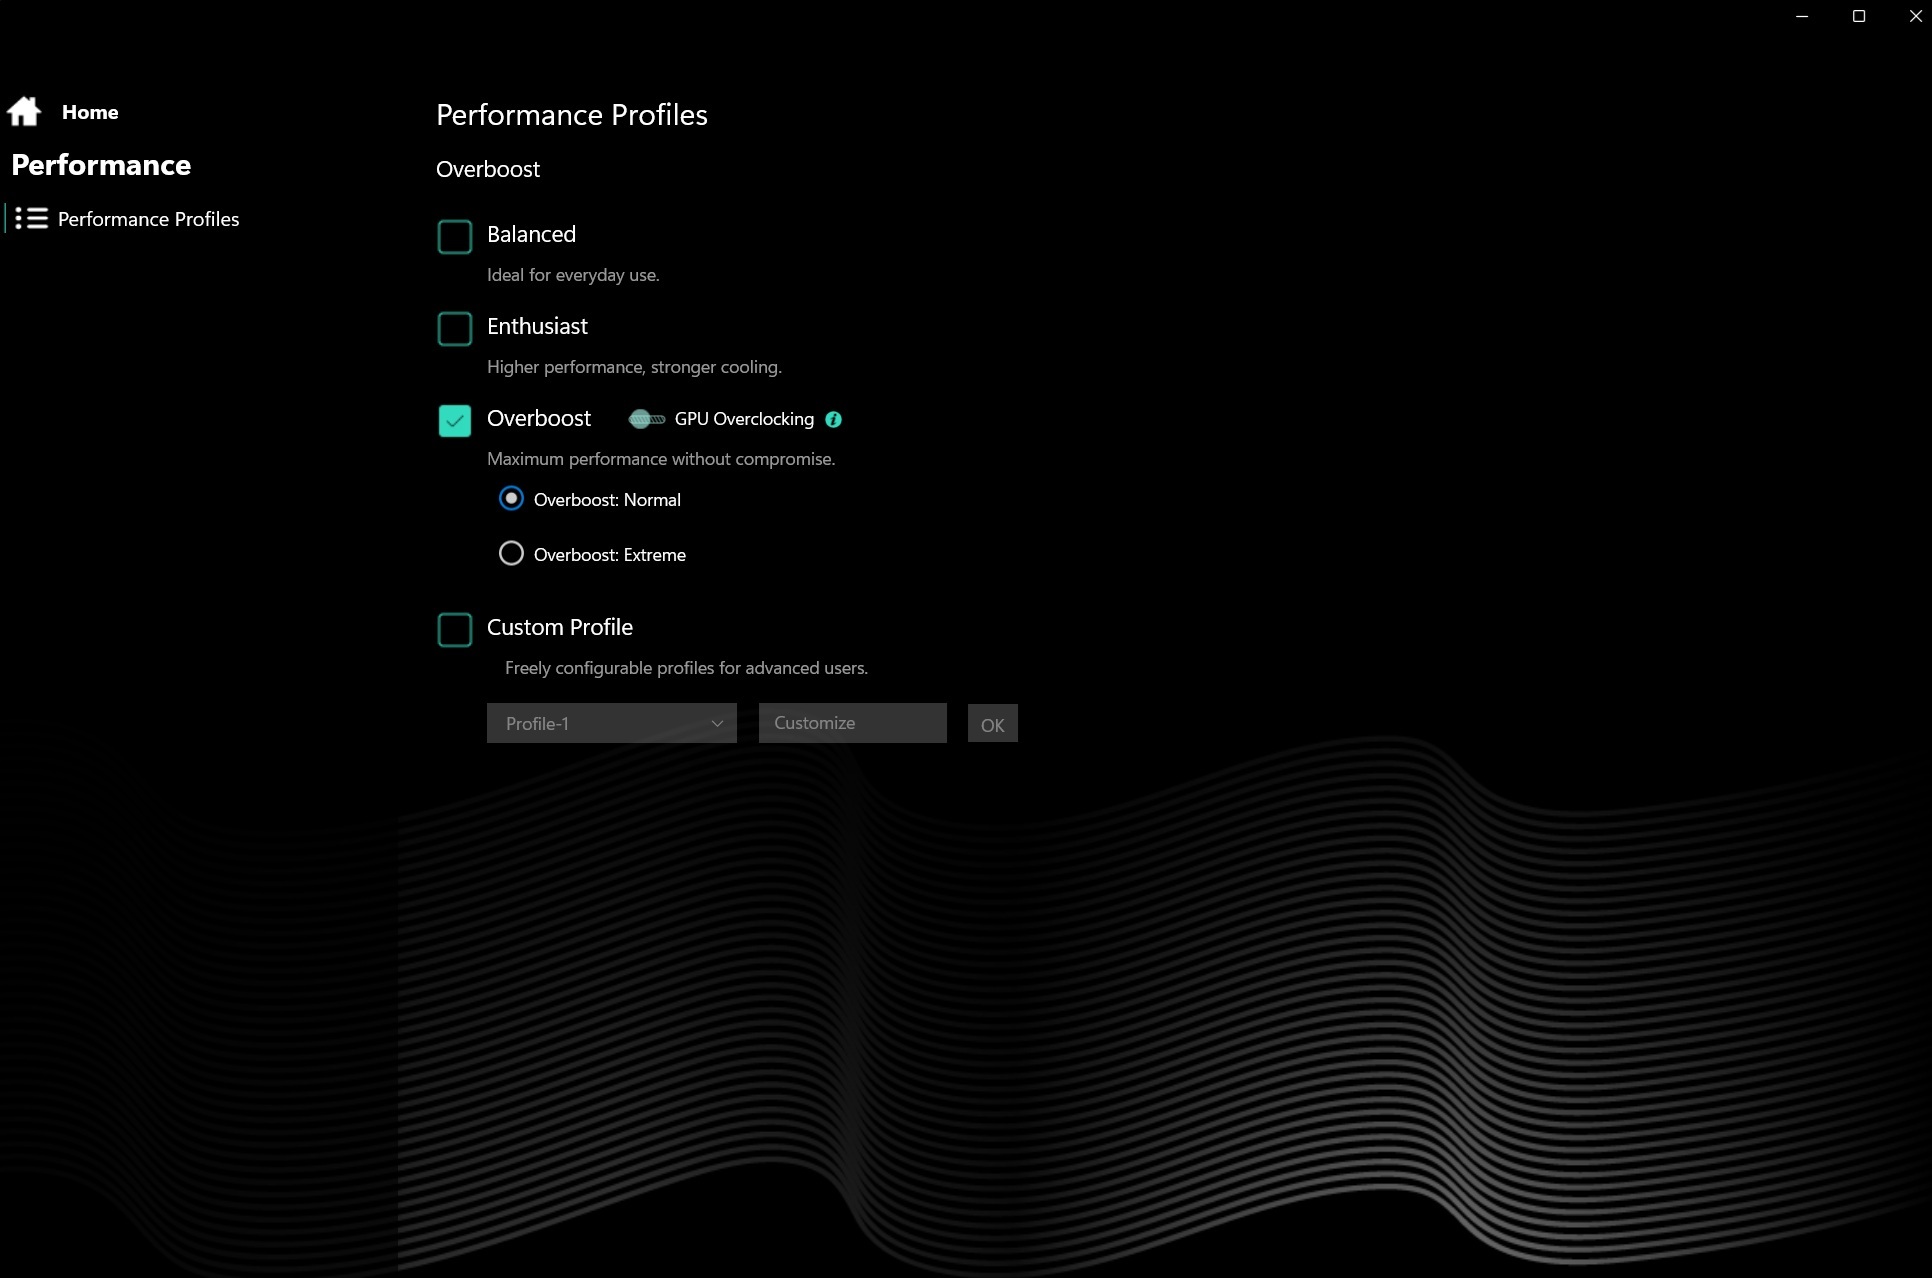
测试条件
在控制中心,用户可以选择三种不同的模式(详见表格)。除电池测试外,所有测量均在不超频 GPU 的 "正常 "超频模式下进行。
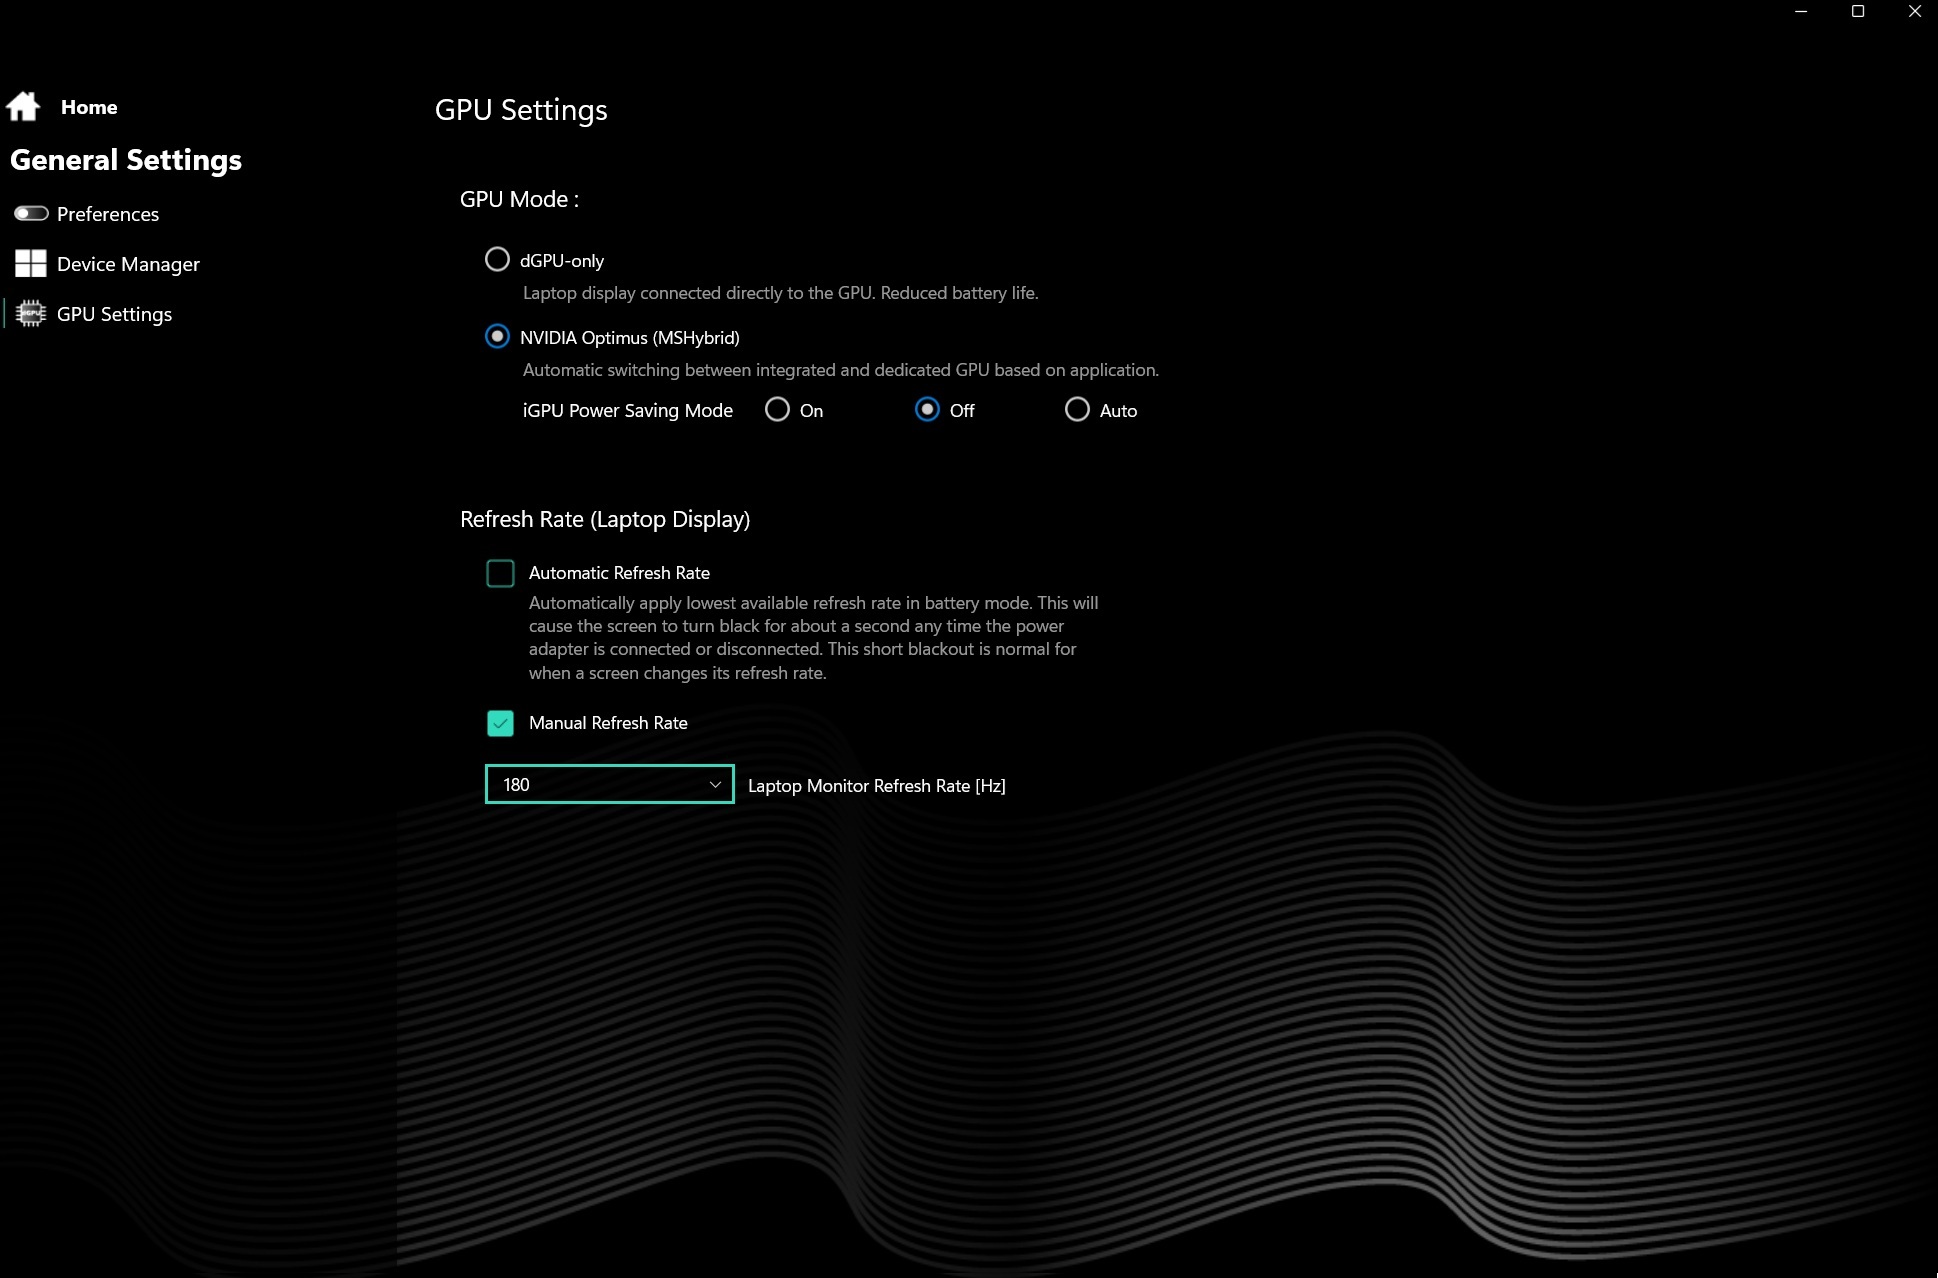
| 模式 | Balanced | Enthusiast | Overboost |
| 赛博朋克 2077 噪音 | 33 dB(A) | 46 dB(A) | 49 dB(A) |
| 赛博朋克 2077》帧速率(FHD/超高清) | 35.4 fps | 78.6 fps | 85 fps |
| GPU 功耗 | ~30 W | ~80 W | ~110 W |
| CPU PL1 | 45 W | 54 W | 70 W |
| CPU PL2 | 65 W | 65 W | 105 W |
| Cinebench R15 Multi Score | 2075 分 | 2670 分 | 2815 分 |
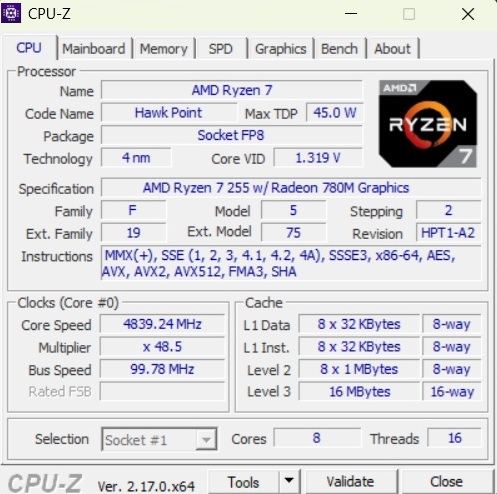
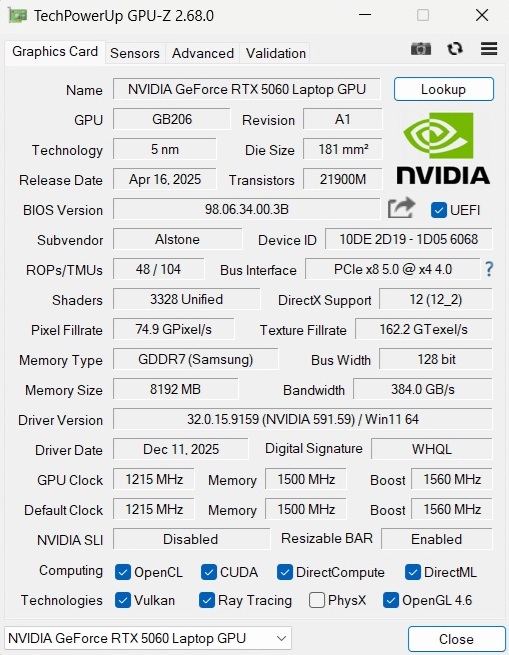
处理器
......(英文 Ryzen 7 255在笔记本电脑中仍然很少见。该芯片采用 4 纳米工艺制造,提供 8 个内核,最多可处理 16 个线程。与 酷睿 i7-14700HXTulpar T6 V3.5 中的酷睿 i7-14700HX 不同,它的性能即使在长时间负载的情况下也能保持稳定--尽管它仍然无法与酷睿 Ultra 7 255HX 等处理器相比。 酷睿至尊 7 255HX, 酷睿至尊 9 275HX, Ryzen 9 8940HX和 Ryzen AI 9 HX 370.
Cinebench R15 多耐久性测试
* ... smaller is better
AIDA64: FP32 Ray-Trace | FPU Julia | CPU SHA3 | CPU Queen | FPU SinJulia | FPU Mandel | CPU AES | CPU ZLib | FP64 Ray-Trace | CPU PhotoWorxx
| Performance rating | |
| HP Omen 16-ap0091ng | |
| Schenker XMG Core 16 M25 | |
| Lenovo Legion 7 16IAX10 | |
| Acer Predator Helios Neo 16S AI PHN16S-71-94L9 | |
| Average of class Gaming | |
| Schenker XMG Core 16 VE M25 | |
| Average AMD Ryzen 7 255 | |
| Tulpar T6 V3.5 | |
| AIDA64 / FP32 Ray-Trace | |
| HP Omen 16-ap0091ng | |
| Schenker XMG Core 16 M25 | |
| Average of class Gaming (10227 - 85542, n=103, last 2 years) | |
| Lenovo Legion 7 16IAX10 | |
| Schenker XMG Core 16 VE M25 | |
| Acer Predator Helios Neo 16S AI PHN16S-71-94L9 | |
| Average AMD Ryzen 7 255 (27202 - 28101, n=2) | |
| Tulpar T6 V3.5 | |
| AIDA64 / FPU Julia | |
| HP Omen 16-ap0091ng | |
| Lenovo Legion 7 16IAX10 | |
| Schenker XMG Core 16 M25 | |
| Acer Predator Helios Neo 16S AI PHN16S-71-94L9 | |
| Average of class Gaming (51376 - 238426, n=103, last 2 years) | |
| Schenker XMG Core 16 VE M25 | |
| Average AMD Ryzen 7 255 (110760 - 114847, n=2) | |
| Tulpar T6 V3.5 | |
| AIDA64 / CPU SHA3 | |
| HP Omen 16-ap0091ng | |
| Lenovo Legion 7 16IAX10 | |
| Acer Predator Helios Neo 16S AI PHN16S-71-94L9 | |
| Average of class Gaming (2180 - 9817, n=103, last 2 years) | |
| Schenker XMG Core 16 M25 | |
| Schenker XMG Core 16 VE M25 | |
| Average AMD Ryzen 7 255 (4831 - 5045, n=2) | |
| Tulpar T6 V3.5 | |
| AIDA64 / CPU Queen | |
| HP Omen 16-ap0091ng | |
| Lenovo Legion 7 16IAX10 | |
| Tulpar T6 V3.5 | |
| Schenker XMG Core 16 VE M25 | |
| Acer Predator Helios Neo 16S AI PHN16S-71-94L9 | |
| Average AMD Ryzen 7 255 (118448 - 124528, n=2) | |
| Average of class Gaming (49785 - 173351, n=89, last 2 years) | |
| Schenker XMG Core 16 M25 | |
| AIDA64 / FPU SinJulia | |
| HP Omen 16-ap0091ng | |
| Schenker XMG Core 16 M25 | |
| Schenker XMG Core 16 VE M25 | |
| Average AMD Ryzen 7 255 (15213 - 15342, n=2) | |
| Average of class Gaming (4424 - 33636, n=103, last 2 years) | |
| Lenovo Legion 7 16IAX10 | |
| Acer Predator Helios Neo 16S AI PHN16S-71-94L9 | |
| Tulpar T6 V3.5 | |
| AIDA64 / FPU Mandel | |
| HP Omen 16-ap0091ng | |
| Schenker XMG Core 16 M25 | |
| Lenovo Legion 7 16IAX10 | |
| Acer Predator Helios Neo 16S AI PHN16S-71-94L9 | |
| Average of class Gaming (25115 - 128721, n=103, last 2 years) | |
| Schenker XMG Core 16 VE M25 | |
| Average AMD Ryzen 7 255 (59408 - 61675, n=2) | |
| Tulpar T6 V3.5 | |
| AIDA64 / CPU AES | |
| HP Omen 16-ap0091ng | |
| Schenker XMG Core 16 M25 | |
| Lenovo Legion 7 16IAX10 | |
| Average of class Gaming (39258 - 247074, n=103, last 2 years) | |
| Acer Predator Helios Neo 16S AI PHN16S-71-94L9 | |
| Schenker XMG Core 16 VE M25 | |
| Average AMD Ryzen 7 255 (88405 - 90655, n=2) | |
| Tulpar T6 V3.5 | |
| AIDA64 / CPU ZLib | |
| Lenovo Legion 7 16IAX10 | |
| HP Omen 16-ap0091ng | |
| Acer Predator Helios Neo 16S AI PHN16S-71-94L9 | |
| Average of class Gaming (574 - 2531, n=103, last 2 years) | |
| Schenker XMG Core 16 M25 | |
| Schenker XMG Core 16 VE M25 | |
| Average AMD Ryzen 7 255 (1088 - 1134, n=2) | |
| Tulpar T6 V3.5 | |
| AIDA64 / FP64 Ray-Trace | |
| HP Omen 16-ap0091ng | |
| Schenker XMG Core 16 M25 | |
| Average of class Gaming (5509 - 45446, n=103, last 2 years) | |
| Lenovo Legion 7 16IAX10 | |
| Acer Predator Helios Neo 16S AI PHN16S-71-94L9 | |
| Schenker XMG Core 16 VE M25 | |
| Average AMD Ryzen 7 255 (13661 - 14945, n=2) | |
| Tulpar T6 V3.5 | |
| AIDA64 / CPU PhotoWorxx | |
| Acer Predator Helios Neo 16S AI PHN16S-71-94L9 | |
| Schenker XMG Core 16 M25 | |
| Lenovo Legion 7 16IAX10 | |
| Tulpar T6 V3.5 | |
| Schenker XMG Core 16 VE M25 | |
| Average of class Gaming (12271 - 89891, n=103, last 2 years) | |
| Average AMD Ryzen 7 255 (39932 - 45359, n=2) | |
| HP Omen 16-ap0091ng | |
系统性能
从积极意义上讲,系统的整体性能并不突出。测试过程中没有出现异常值。
PCMark 10: Score | Essentials | Productivity | Digital Content Creation
CrossMark: Overall | Productivity | Creativity | Responsiveness
WebXPRT 3: Overall
WebXPRT 4: Overall
Mozilla Kraken 1.1: Total
| Performance rating | |
| Acer Predator Helios Neo 16S AI PHN16S-71-94L9 | |
| Schenker XMG Core 16 M25 -4! | |
| Average of class Gaming | |
| Lenovo Legion 7 16IAX10 | |
| Schenker XMG Core 16 VE M25 | |
| Average AMD Ryzen 7 255, NVIDIA GeForce RTX 5060 Laptop | |
| HP Omen 16-ap0091ng | |
| Tulpar T6 V3.5 | |
| PCMark 10 / Score | |
| Average of class Gaming (5828 - 11730, n=92, last 2 years) | |
| Acer Predator Helios Neo 16S AI PHN16S-71-94L9 | |
| Schenker XMG Core 16 VE M25 | |
| Average AMD Ryzen 7 255, NVIDIA GeForce RTX 5060 Laptop (n=1) | |
| HP Omen 16-ap0091ng | |
| Lenovo Legion 7 16IAX10 | |
| Tulpar T6 V3.5 | |
| PCMark 10 / Essentials | |
| Lenovo Legion 7 16IAX10 | |
| Acer Predator Helios Neo 16S AI PHN16S-71-94L9 | |
| HP Omen 16-ap0091ng | |
| Average of class Gaming (8810 - 11935, n=96, last 2 years) | |
| Tulpar T6 V3.5 | |
| Schenker XMG Core 16 VE M25 | |
| Average AMD Ryzen 7 255, NVIDIA GeForce RTX 5060 Laptop (n=1) | |
| PCMark 10 / Productivity | |
| Schenker XMG Core 16 VE M25 | |
| Average AMD Ryzen 7 255, NVIDIA GeForce RTX 5060 Laptop (n=1) | |
| Average of class Gaming (6845 - 21327, n=94, last 2 years) | |
| Lenovo Legion 7 16IAX10 | |
| HP Omen 16-ap0091ng | |
| Acer Predator Helios Neo 16S AI PHN16S-71-94L9 | |
| Tulpar T6 V3.5 | |
| PCMark 10 / Digital Content Creation | |
| Acer Predator Helios Neo 16S AI PHN16S-71-94L9 | |
| Average of class Gaming (7602 - 19954, n=94, last 2 years) | |
| HP Omen 16-ap0091ng | |
| Tulpar T6 V3.5 | |
| Schenker XMG Core 16 VE M25 | |
| Average AMD Ryzen 7 255, NVIDIA GeForce RTX 5060 Laptop (n=1) | |
| Lenovo Legion 7 16IAX10 | |
| CrossMark / Overall | |
| Acer Predator Helios Neo 16S AI PHN16S-71-94L9 | |
| Lenovo Legion 7 16IAX10 | |
| Schenker XMG Core 16 M25 | |
| Average of class Gaming (1366 - 2409, n=93, last 2 years) | |
| Schenker XMG Core 16 VE M25 | |
| Average AMD Ryzen 7 255, NVIDIA GeForce RTX 5060 Laptop (n=1) | |
| HP Omen 16-ap0091ng | |
| Tulpar T6 V3.5 | |
| CrossMark / Productivity | |
| Acer Predator Helios Neo 16S AI PHN16S-71-94L9 | |
| Lenovo Legion 7 16IAX10 | |
| Average of class Gaming (1386 - 2254, n=93, last 2 years) | |
| HP Omen 16-ap0091ng | |
| Schenker XMG Core 16 M25 | |
| Schenker XMG Core 16 VE M25 | |
| Average AMD Ryzen 7 255, NVIDIA GeForce RTX 5060 Laptop (n=1) | |
| Tulpar T6 V3.5 | |
| CrossMark / Creativity | |
| Schenker XMG Core 16 M25 | |
| Acer Predator Helios Neo 16S AI PHN16S-71-94L9 | |
| Lenovo Legion 7 16IAX10 | |
| Tulpar T6 V3.5 | |
| Average of class Gaming (1343 - 2729, n=93, last 2 years) | |
| HP Omen 16-ap0091ng | |
| Schenker XMG Core 16 VE M25 | |
| Average AMD Ryzen 7 255, NVIDIA GeForce RTX 5060 Laptop (n=1) | |
| CrossMark / Responsiveness | |
| Lenovo Legion 7 16IAX10 | |
| Acer Predator Helios Neo 16S AI PHN16S-71-94L9 | |
| Average of class Gaming (1226 - 2334, n=93, last 2 years) | |
| Schenker XMG Core 16 VE M25 | |
| Average AMD Ryzen 7 255, NVIDIA GeForce RTX 5060 Laptop (n=1) | |
| Schenker XMG Core 16 M25 | |
| HP Omen 16-ap0091ng | |
| Tulpar T6 V3.5 | |
| WebXPRT 3 / Overall | |
| Schenker XMG Core 16 M25 | |
| Lenovo Legion 7 16IAX10 | |
| Acer Predator Helios Neo 16S AI PHN16S-71-94L9 | |
| HP Omen 16-ap0091ng | |
| Average of class Gaming (220 - 532, n=97, last 2 years) | |
| Tulpar T6 V3.5 | |
| Schenker XMG Core 16 VE M25 | |
| Average AMD Ryzen 7 255, NVIDIA GeForce RTX 5060 Laptop (n=1) | |
| WebXPRT 4 / Overall | |
| Schenker XMG Core 16 M25 | |
| Lenovo Legion 7 16IAX10 | |
| Acer Predator Helios Neo 16S AI PHN16S-71-94L9 | |
| Tulpar T6 V3.5 | |
| Average of class Gaming (165 - 354, n=97, last 2 years) | |
| Schenker XMG Core 16 VE M25 | |
| Average AMD Ryzen 7 255, NVIDIA GeForce RTX 5060 Laptop (n=1) | |
| HP Omen 16-ap0091ng | |
| Mozilla Kraken 1.1 / Total | |
| HP Omen 16-ap0091ng | |
| Schenker XMG Core 16 VE M25 | |
| Average AMD Ryzen 7 255, NVIDIA GeForce RTX 5060 Laptop (n=1) | |
| Tulpar T6 V3.5 | |
| Average of class Gaming (391 - 590, n=99, last 2 years) | |
| Lenovo Legion 7 16IAX10 | |
| Schenker XMG Core 16 M25 | |
| Acer Predator Helios Neo 16S AI PHN16S-71-94L9 | |
* ... smaller is better
| PCMark 10 Score | 8166 points | |
Help | ||
| AIDA64 / Memory Copy | |
| Lenovo Legion 7 16IAX10 | |
| Acer Predator Helios Neo 16S AI PHN16S-71-94L9 | |
| Tulpar T6 V3.5 | |
| Schenker XMG Core 16 M25 | |
| Average of class Gaming (21750 - 129946, n=103, last 2 years) | |
| Schenker XMG Core 16 VE M25 | |
| Average AMD Ryzen 7 255 (67909 - 69008, n=2) | |
| HP Omen 16-ap0091ng | |
| AIDA64 / Memory Read | |
| Acer Predator Helios Neo 16S AI PHN16S-71-94L9 | |
| Tulpar T6 V3.5 | |
| Lenovo Legion 7 16IAX10 | |
| Schenker XMG Core 16 M25 | |
| Average of class Gaming (22956 - 118858, n=103, last 2 years) | |
| Average AMD Ryzen 7 255 (60500 - 61434, n=2) | |
| Schenker XMG Core 16 VE M25 | |
| HP Omen 16-ap0091ng | |
| AIDA64 / Memory Write | |
| Acer Predator Helios Neo 16S AI PHN16S-71-94L9 | |
| Schenker XMG Core 16 VE M25 | |
| Average AMD Ryzen 7 255 (82539 - 83452, n=2) | |
| Schenker XMG Core 16 M25 | |
| Lenovo Legion 7 16IAX10 | |
| Tulpar T6 V3.5 | |
| Average of class Gaming (22297 - 135096, n=103, last 2 years) | |
| HP Omen 16-ap0091ng | |
| AIDA64 / Memory Latency | |
| Acer Predator Helios Neo 16S AI PHN16S-71-94L9 | |
| Average of class Gaming (75.3 - 259, n=103, last 2 years) | |
| Lenovo Legion 7 16IAX10 | |
| Average AMD Ryzen 7 255 (87 - 91.2, n=2) | |
| Schenker XMG Core 16 VE M25 | |
| Schenker XMG Core 16 M25 | |
| Tulpar T6 V3.5 | |
| HP Omen 16-ap0091ng | |
* ... smaller is better
DPC 延迟
在延迟方面,XMG Core 16 VE 在同类产品中处于中等水平。
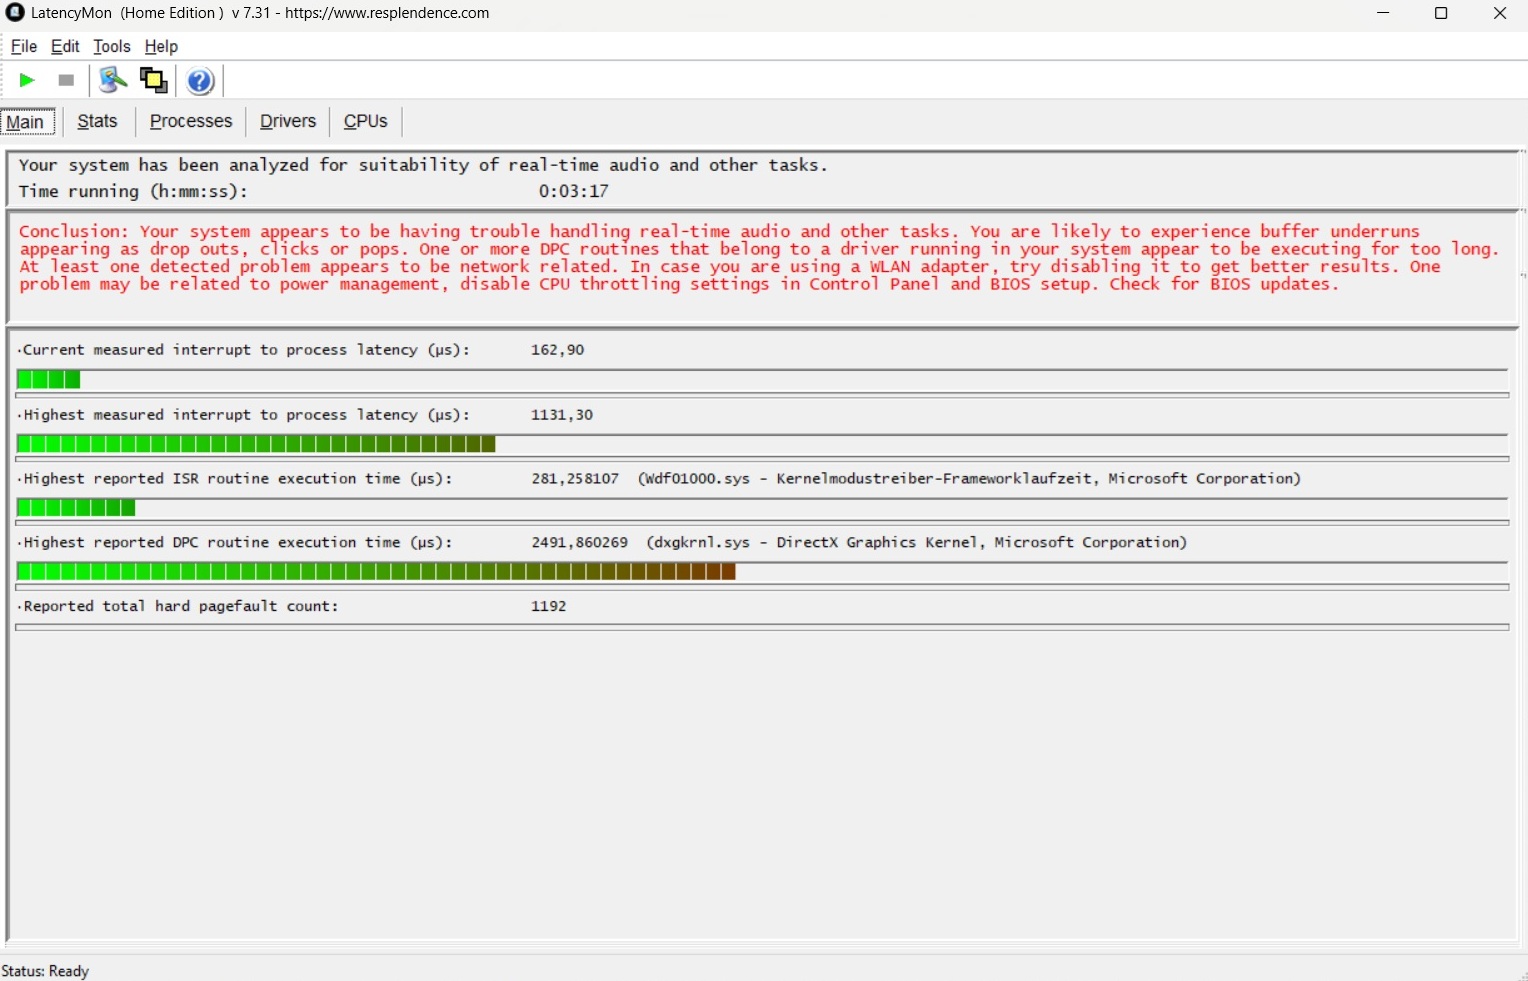
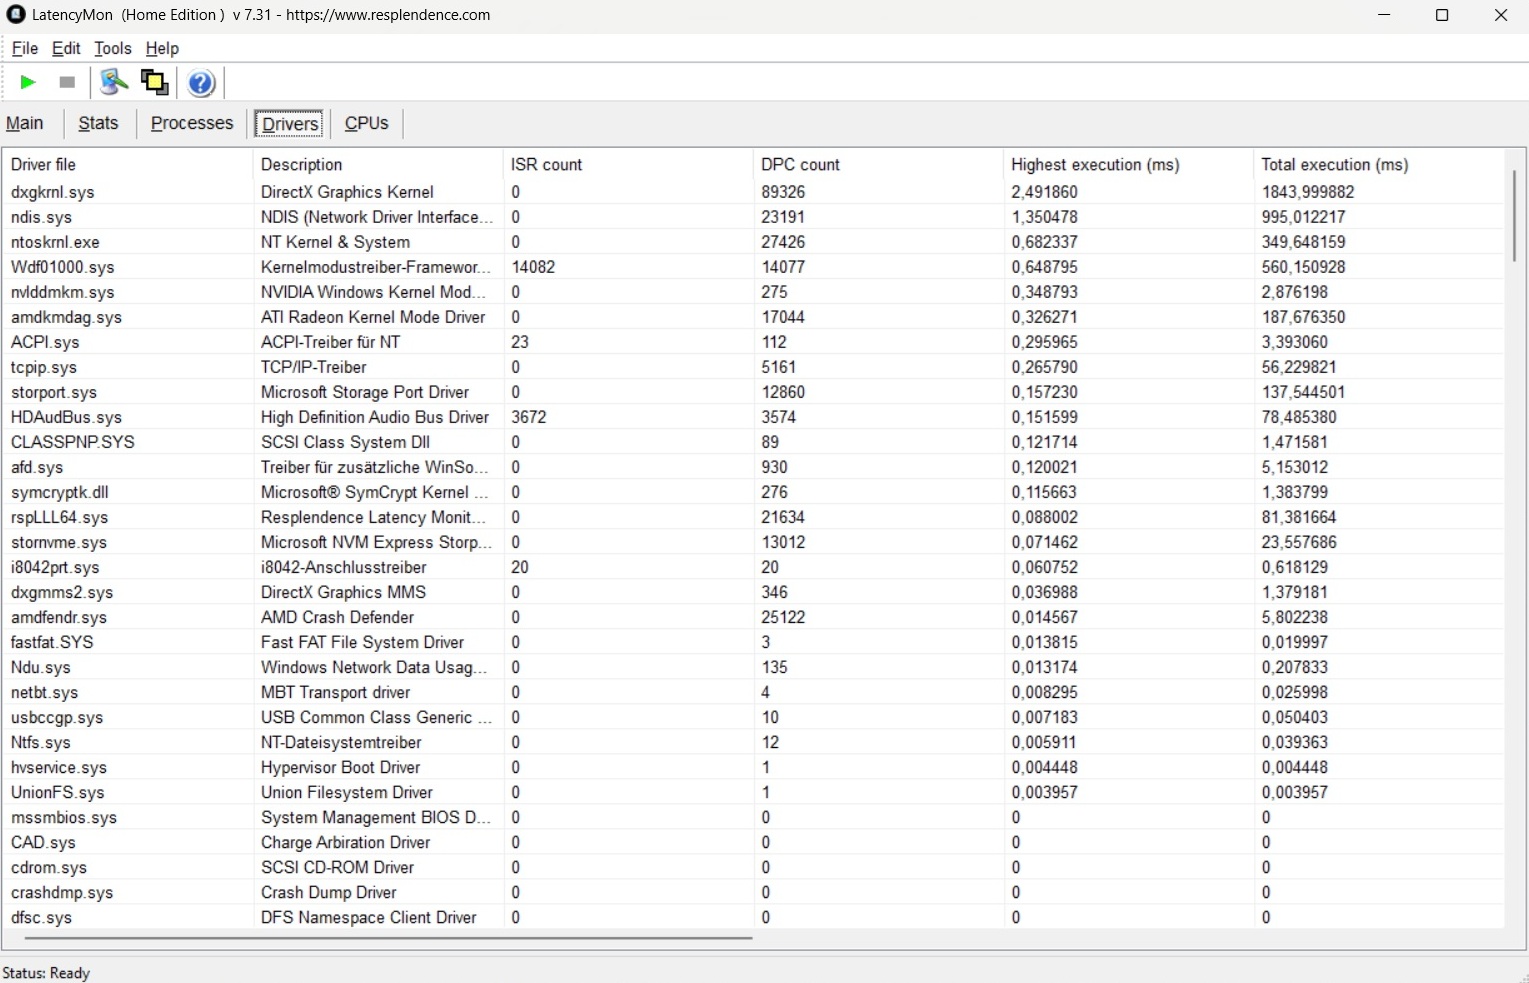
| DPC Latencies / LatencyMon - interrupt to process latency (max), Web, Youtube, Prime95 | |
| Tulpar T6 V3.5 | |
| Acer Predator Helios Neo 16S AI PHN16S-71-94L9 | |
| HP Omen 16-ap0091ng | |
| Schenker XMG Core 16 VE M25 | |
| Lenovo Legion 7 16IAX10 | |
| Schenker XMG Core 16 M25 | |
* ... smaller is better
存储设备
我们测试设备的一大亮点是速度相对较快的固态硬盘。三星 990 Pro 在 AS SSD 基准测试中取得了优异的总分。

* ... smaller is better
连续读取性能DiskSpd 读取循环,队列深度 8
图形处理器性能
| 3DMark 11 Performance | 33268 points | |
| 3DMark Cloud Gate Standard Score | 50474 points | |
| 3DMark Fire Strike Score | 25692 points | |
| 3DMark Time Spy Score | 11440 points | |
Help | ||
* ... smaller is better
游戏性能
如果没有 DLSS 和类似技术,以原始分辨率(2,560 × 1,440)运行有时会有些吃力。CPU密集型游戏,如 外部世界 2, 安诺 117 和 黑色行动 7只有在启用升频或降低设置的情况下才能流畅运行。
在 ARC Raiders为例:在最高设置下,游戏可提供稳定的 48 FPS。相比之下,DLSS 画质可将性能提升至 76 FPS,而 4×Frame Generation 则可将性能提升至 174 FPS(实际流畅度可能会有所不同)。
| Final Fantasy XV Benchmark - 1920x1080 High Quality | |
| Average of class Gaming (41 - 215, n=94, last 2 years) | |
| Schenker XMG Core 16 M25 | |
| Lenovo Legion 7 16IAX10 | |
| Average NVIDIA GeForce RTX 5060 Laptop (107 - 133.6, n=12) | |
| HP Omen 16-ap0091ng | |
| Tulpar T6 V3.5 | |
| Schenker XMG Core 16 VE M25 | |
| low | med. | high | ultra | QHD | |
|---|---|---|---|---|---|
| Dota 2 Reborn (2015) | 145.2 | 140.7 | 133.2 | ||
| Final Fantasy XV Benchmark (2018) | 143.9 | 107 | |||
| X-Plane 11.11 (2018) | 97.7 | 79.6 | |||
| Baldur's Gate 3 (2023) | 114.2 | 95.4 | 90.7 | ||
| Cyberpunk 2077 (2023) | 107.6 | 93.4 | 85 | ||
| The Outer Worlds 2 (2025) | 91.7 | 72.7 | 40.9 | 26.7 | |
| ARC Raiders (2025) | 136.7 | 104.9 | 70.2 | 47.8 | |
| Anno 117: Pax Romana (2025) | 91.3 | 67 | 33.9 | 23.4 | |
| Call of Duty Black Ops 7 (2025) | 138 | 103 | 38 | 18 |
| ARC Raiders | |
| 1920x1080 Epic Preset + Epic Raytracing AA:TSR | |
| Acer Predator Helios Neo 16S AI PHN16S-71-94L9 | |
| Schenker XMG Core 16 VE M25 | |
| Average of class Gaming (43.5 - 98.6, n=11, last 2 years) | |
| Average NVIDIA GeForce RTX 5060 Laptop (55 - 70.2, n=4) | |
| Tulpar T6 V3.5 | |
| 2560x1440 Epic Preset + Epic Raytracing AA:TSR | |
| Average of class Gaming (47.8 - 68.3, n=5, last 2 years) | |
| Acer Predator Helios Neo 16S AI PHN16S-71-94L9 | |
| Schenker XMG Core 16 VE M25 | |
| Average NVIDIA GeForce RTX 5060 Laptop (n=1) | |
| The Outer Worlds 2 | |
| 1920x1080 Very High Preset AA:T | |
| Acer Predator Helios Neo 16S AI PHN16S-71-94L9 | |
| Schenker XMG Core 16 VE M25 | |
| Average of class Gaming (26.4 - 58.4, n=11, last 2 years) | |
| Average NVIDIA GeForce RTX 5060 Laptop (31.1 - 40.9, n=4) | |
| Tulpar T6 V3.5 | |
| 2560x1440 Very High Preset AA:T | |
| Acer Predator Helios Neo 16S AI PHN16S-71-94L9 | |
| Average of class Gaming (21.5 - 37.8, n=6, last 2 years) | |
| Schenker XMG Core 16 VE M25 | |
| Average NVIDIA GeForce RTX 5060 Laptop (n=1) | |
| Call of Duty Black Ops 7 | |
| 1920x1080 Extreme Preset + Raytracing | |
| Acer Predator Helios Neo 16S AI PHN16S-71-94L9 | |
| Average of class Gaming (24 - 60, n=11, last 2 years) | |
| Schenker XMG Core 16 VE M25 | |
| Average NVIDIA GeForce RTX 5060 Laptop (32 - 38, n=4) | |
| Tulpar T6 V3.5 | |
| 2560x1440 Extreme Preset + Raytracing | |
| Acer Predator Helios Neo 16S AI PHN16S-71-94L9 | |
| Average of class Gaming (18 - 39, n=7, last 2 years) | |
| Average NVIDIA GeForce RTX 5060 Laptop (18 - 23, n=2) | |
| Schenker XMG Core 16 VE M25 | |
赛博朋克 2077》超 FPS 图表
排放与能源
噪音排放
在负载情况下,噪音水平与 HP Omen 16 和 "普通 "Core 16 相似。在 赛博朋克 2077中,风扇的声音清晰可闻,但并不过分响亮。空闲时,16 英寸笔记本电脑通常会保持令人愉悦的安静。风扇要么完全关闭,要么以相当低的噪音运行。
Noise level
| Idle |
| 24 / 27 / 32 dB(A) |
| Load |
| 41 / 50 dB(A) |
 | ||
30 dB silent 40 dB(A) audible 50 dB(A) loud |
||
min: | ||
| Schenker XMG Core 16 VE M25 Ryzen 7 255, GeForce RTX 5060 Laptop | Tulpar T6 V3.5 i7-14700HX, GeForce RTX 5060 Laptop | HP Omen 16-ap0091ng R9 8940HX, GeForce RTX 5060 Laptop | Lenovo Legion 7 16IAX10 Ultra 7 255HX, GeForce RTX 5060 Laptop | Schenker XMG Core 16 M25 Ryzen AI 9 HX 370, GeForce RTX 5070 Laptop | Acer Predator Helios Neo 16S AI PHN16S-71-94L9 Ultra 9 275HX, GeForce RTX 5070 Ti Laptop | |
|---|---|---|---|---|---|---|
| Noise | -7% | 1% | 1% | 3% | -9% | |
| off / environment * (dB) | 24 | 24 -0% | 23 4% | 23.9 -0% | 24.8 -3% | 24 -0% |
| Idle Minimum * (dB) | 24 | 26 -8% | 23 4% | 24 -0% | 24.8 -3% | 24 -0% |
| Idle Average * (dB) | 27 | 29 -7% | 23 15% | 26 4% | 24.8 8% | 30 -11% |
| Idle Maximum * (dB) | 32 | 31 3% | 27.64 14% | 29.4 8% | 27.1 15% | 35 -9% |
| Load Average * (dB) | 41 | 52 -27% | 49.5 -21% | 35.4 14% | 40.2 2% | 53 -29% |
| Cyberpunk 2077 ultra * (dB) | 49 | 52 -6% | 49.5 -1% | 54.6 -11% | 49.2 -0% | 52 -6% |
| Load Maximum * (dB) | 50 | 53 -6% | 52.73 -5% | 54.7 -9% | 49.2 2% | 54 -8% |
* ... smaller is better
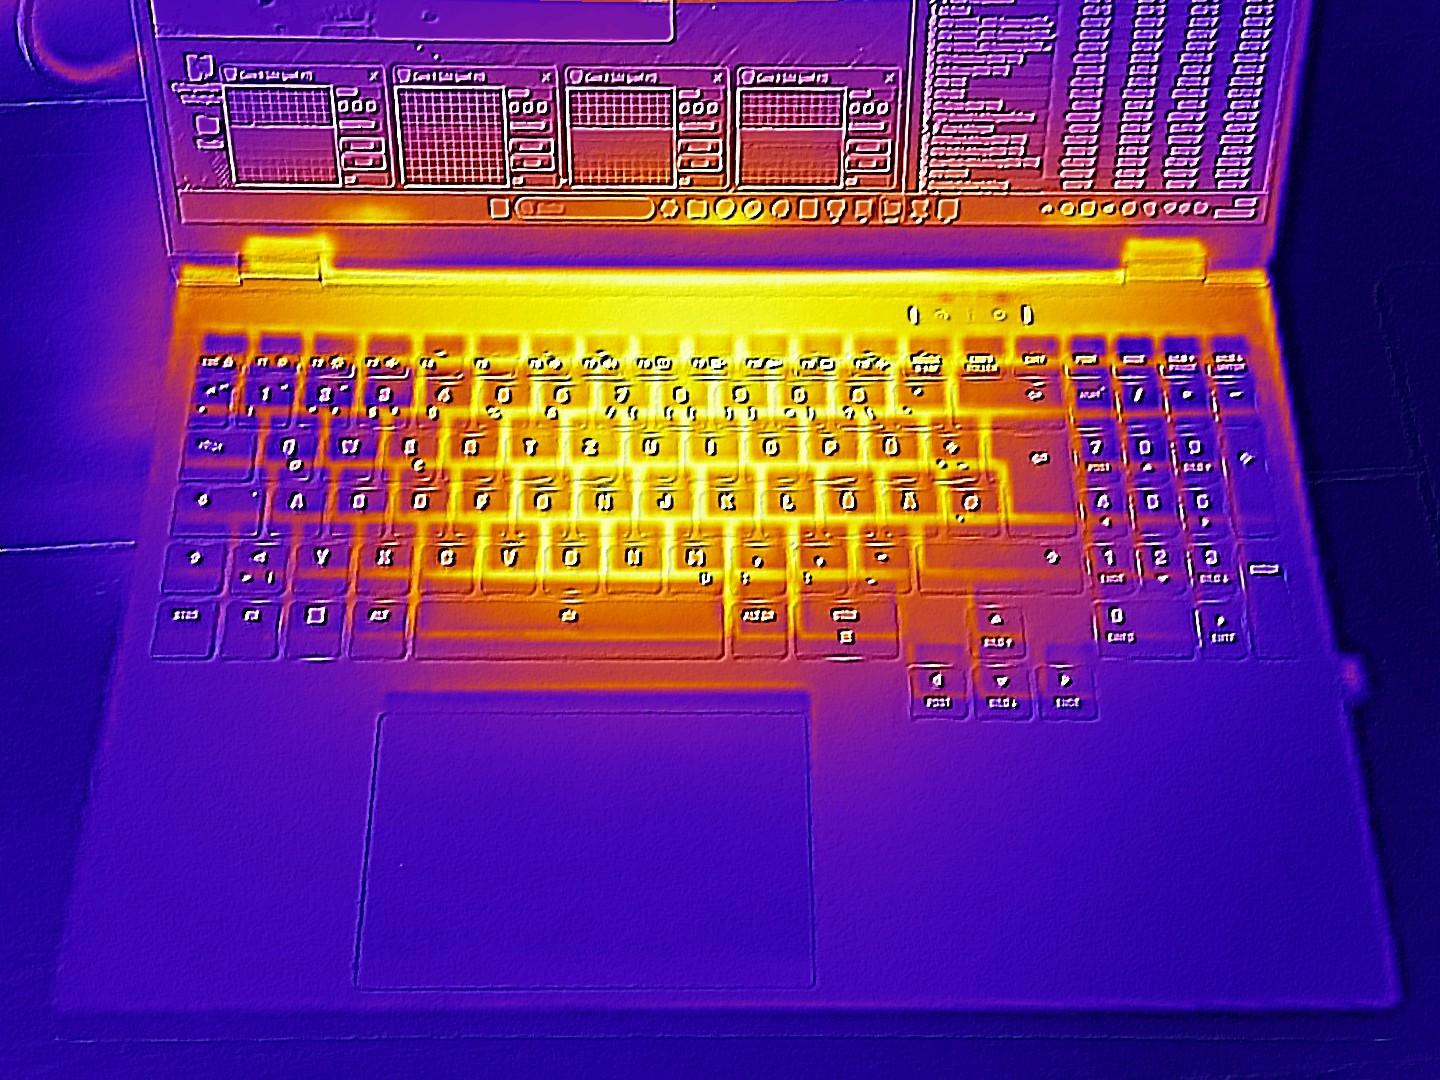
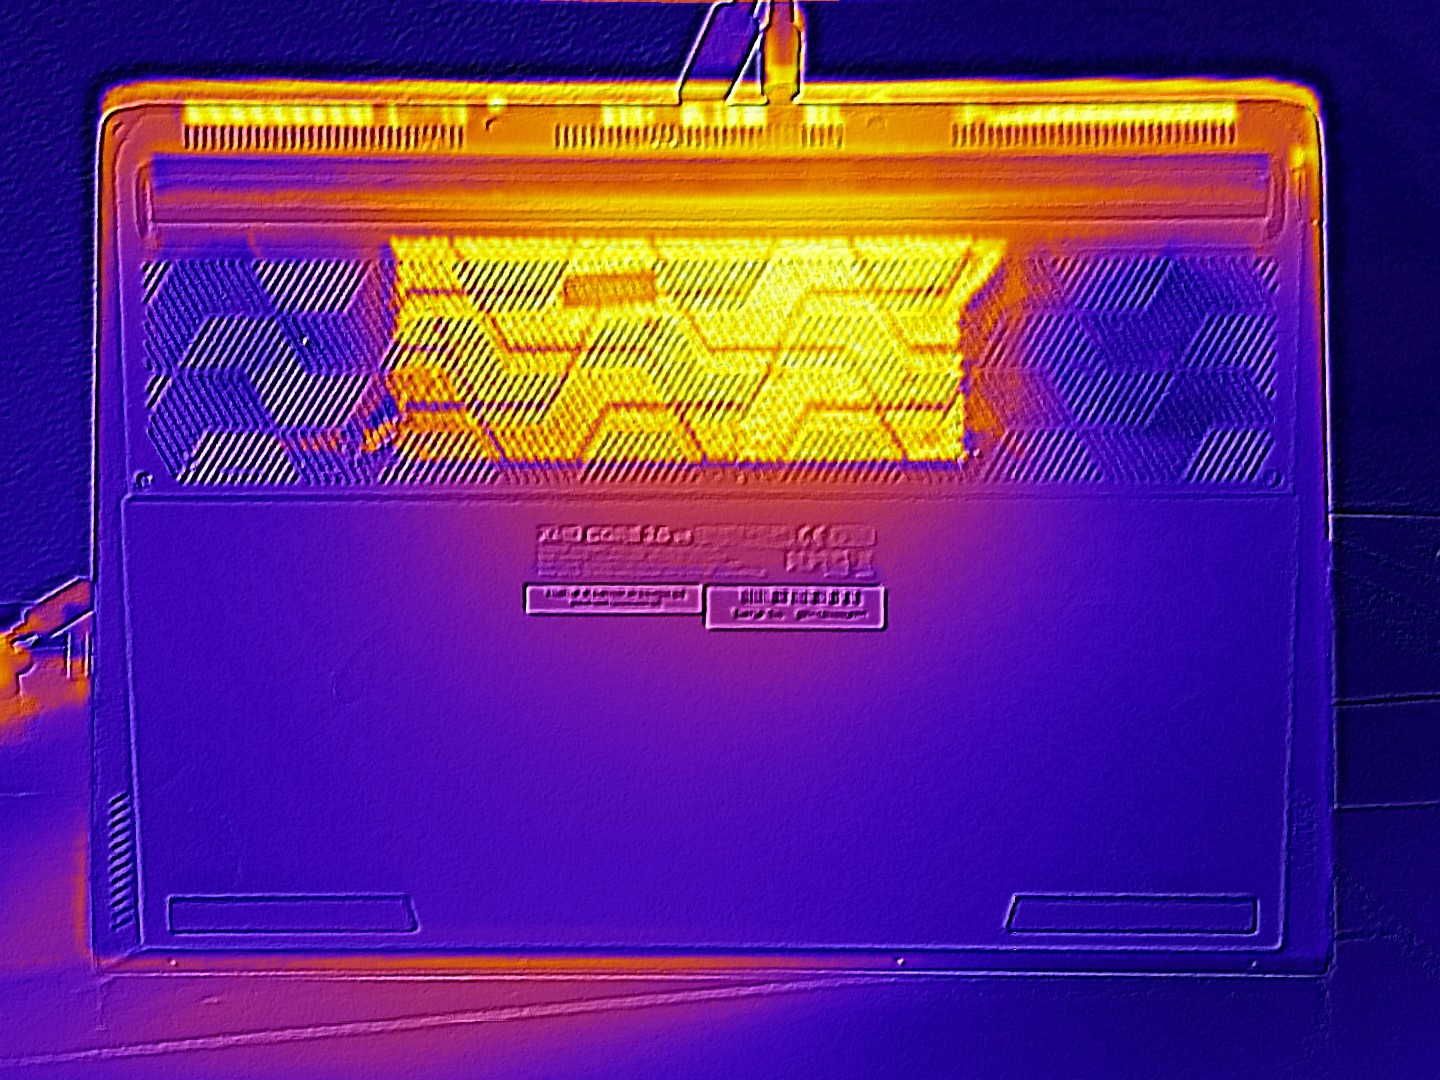
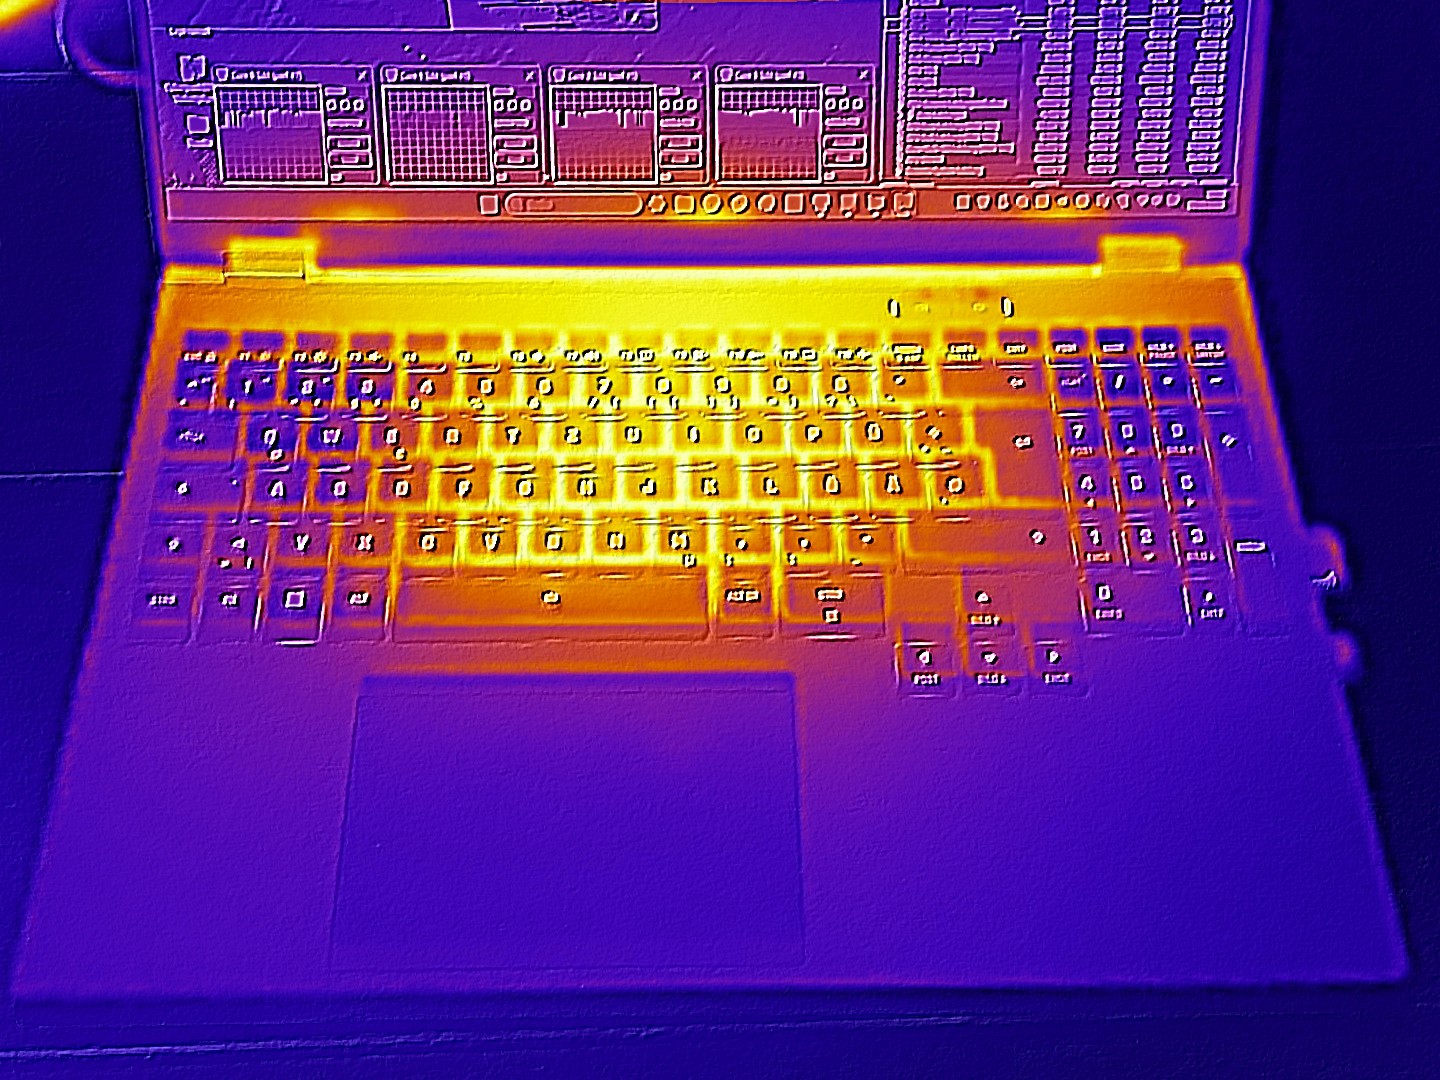
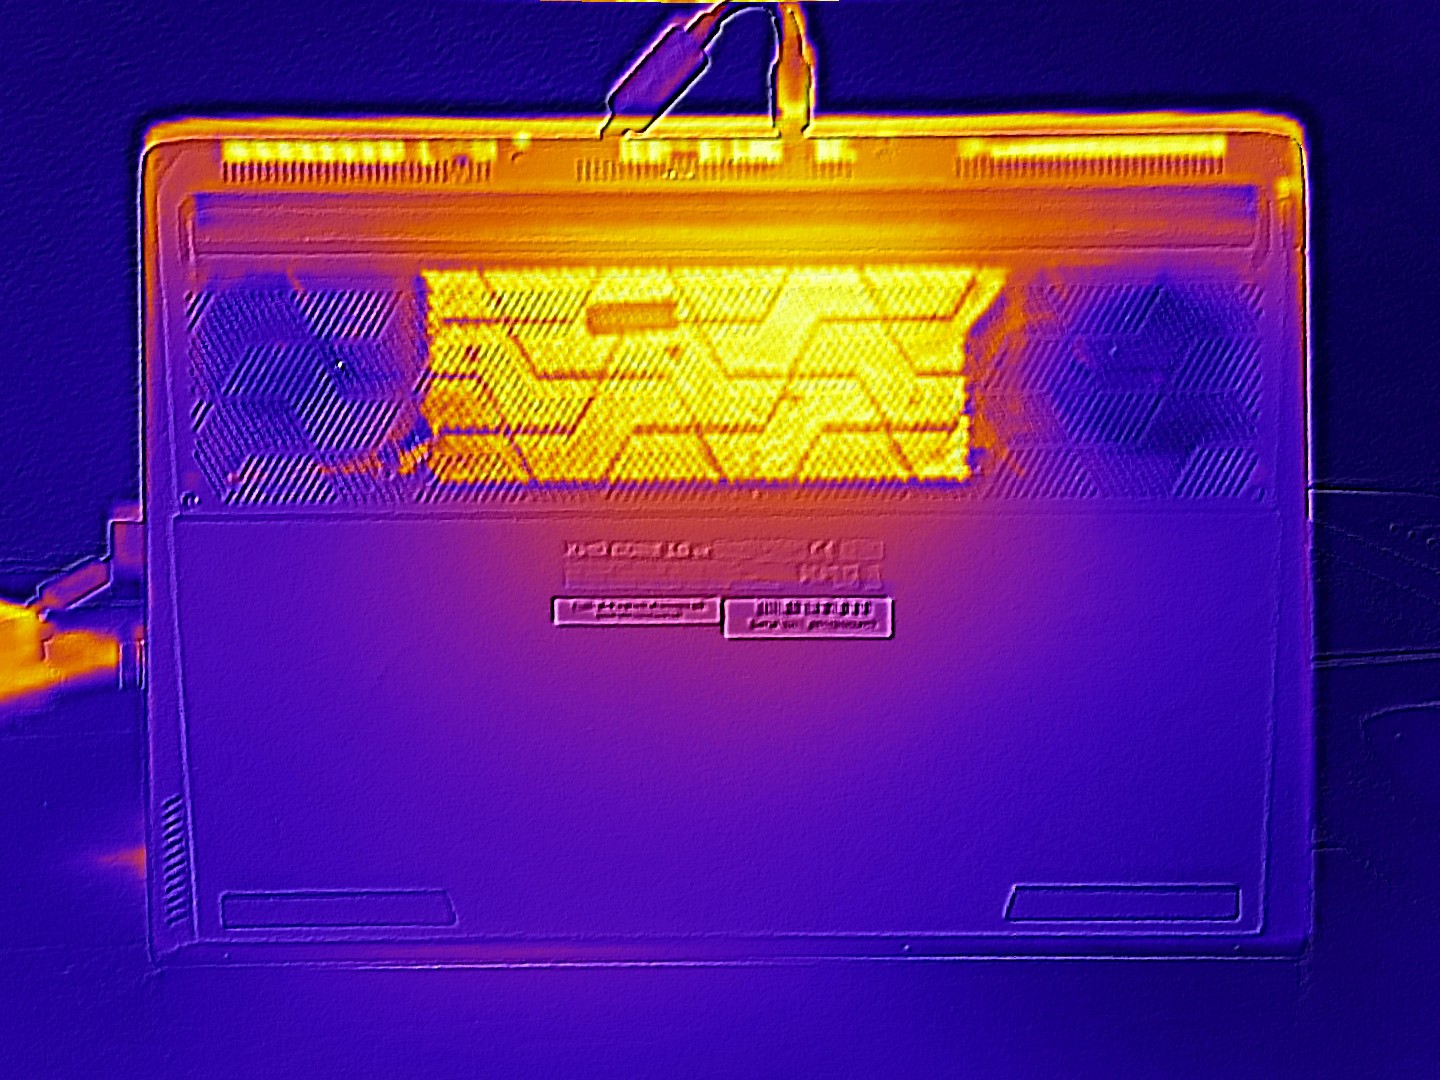
温度
在负载情况下,机箱底部升温较快,最高温度可达 57 °C,而顶部的峰值为 46 °C。在闲置情况下,机箱温度控制在 25 至 31 °C。
(-) The maximum temperature on the upper side is 46 °C / 115 F, compared to the average of 40.4 °C / 105 F, ranging from 21.2 to 68.8 °C for the class Gaming.
(-) The bottom heats up to a maximum of 57 °C / 135 F, compared to the average of 43.2 °C / 110 F
(+) In idle usage, the average temperature for the upper side is 27.3 °C / 81 F, compared to the device average of 33.9 °C / 93 F.
(-) 3: The average temperature for the upper side is 39.7 °C / 103 F, compared to the average of 33.9 °C / 93 F for the class Gaming.
(+) The palmrests and touchpad are cooler than skin temperature with a maximum of 31 °C / 87.8 F and are therefore cool to the touch.
(-) The average temperature of the palmrest area of similar devices was 28.8 °C / 83.8 F (-2.2 °C / -4 F).
| Schenker XMG Core 16 VE M25 Ryzen 7 255, GeForce RTX 5060 Laptop | Tulpar T6 V3.5 i7-14700HX, GeForce RTX 5060 Laptop | HP Omen 16-ap0091ng R9 8940HX, GeForce RTX 5060 Laptop | Lenovo Legion 7 16IAX10 Ultra 7 255HX, GeForce RTX 5060 Laptop | Schenker XMG Core 16 M25 Ryzen AI 9 HX 370, GeForce RTX 5070 Laptop | Acer Predator Helios Neo 16S AI PHN16S-71-94L9 Ultra 9 275HX, GeForce RTX 5070 Ti Laptop | |
|---|---|---|---|---|---|---|
| Heat | 4% | 13% | -4% | 0% | 3% | |
| Maximum Upper Side * (°C) | 46 | 40 13% | 36 22% | 47 -2% | 46.7 -2% | 47 -2% |
| Maximum Bottom * (°C) | 57 | 47 18% | 37 35% | 44 23% | 58.5 -3% | 55 4% |
| Idle Upper Side * (°C) | 29 | 30 -3% | 30 -3% | 35.6 -23% | 28.3 2% | 28 3% |
| Idle Bottom * (°C) | 31 | 35 -13% | 32 -3% | 35.2 -14% | 29.9 4% | 29 6% |
* ... smaller is better
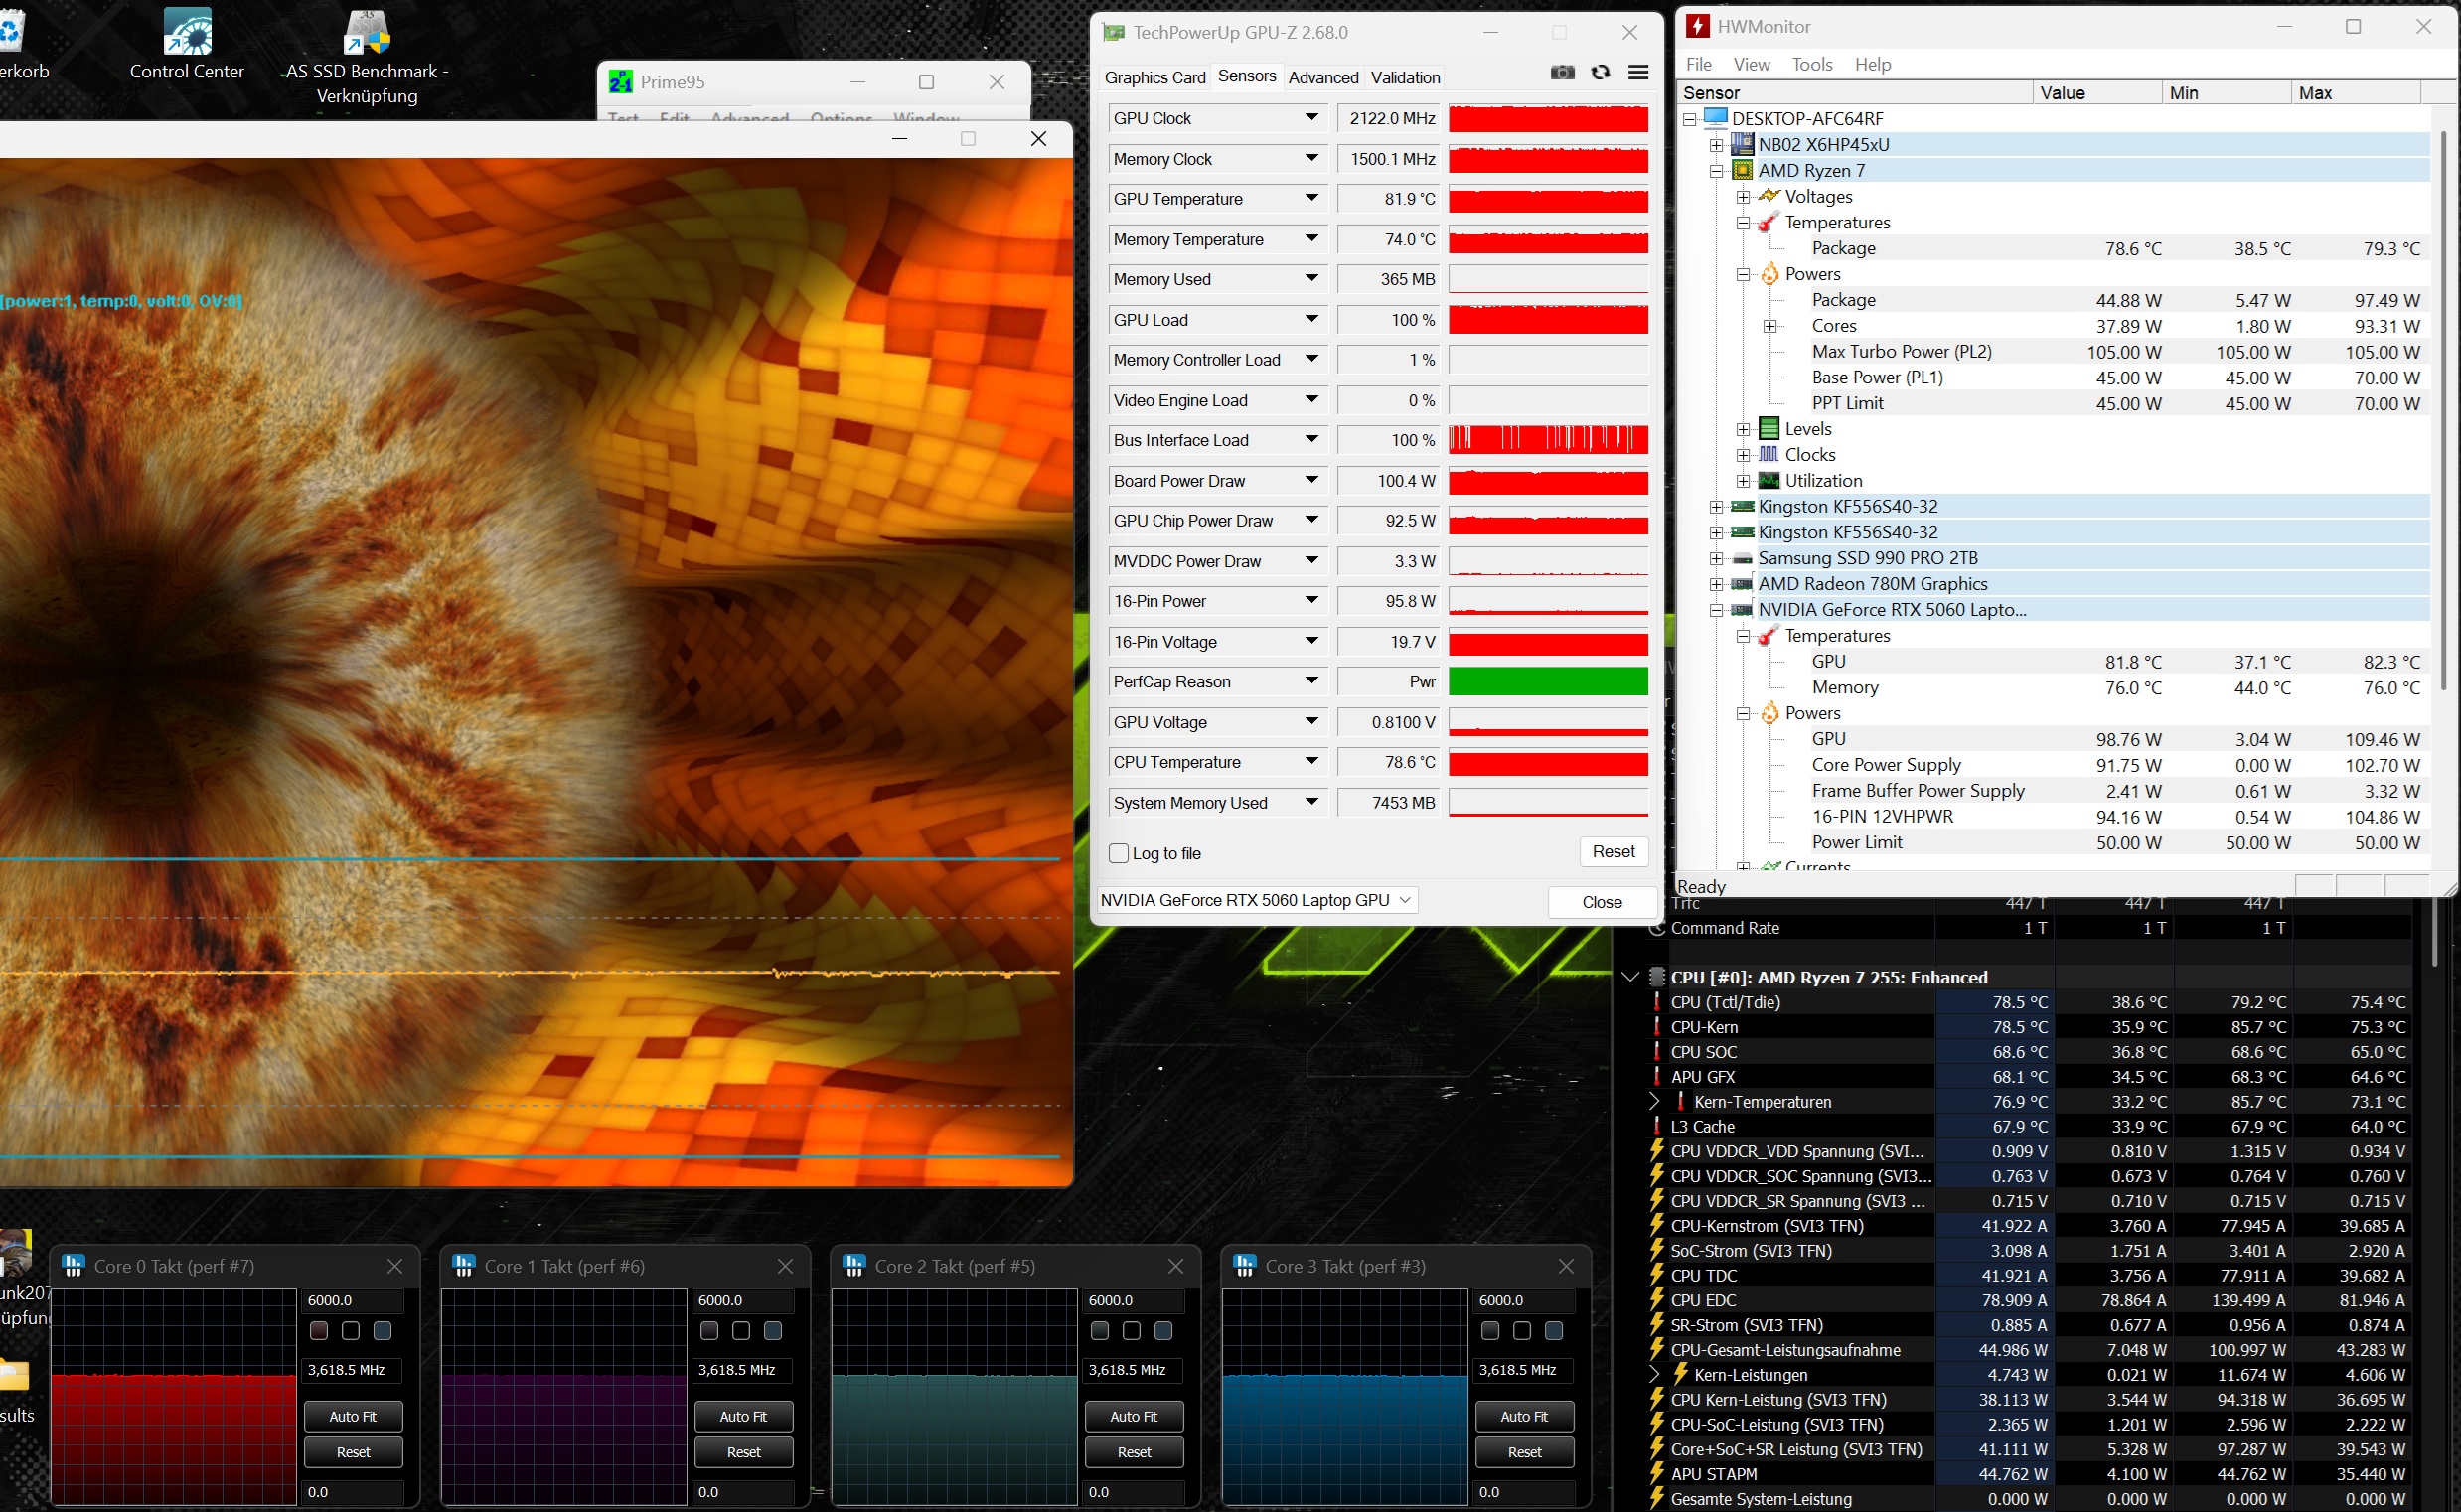
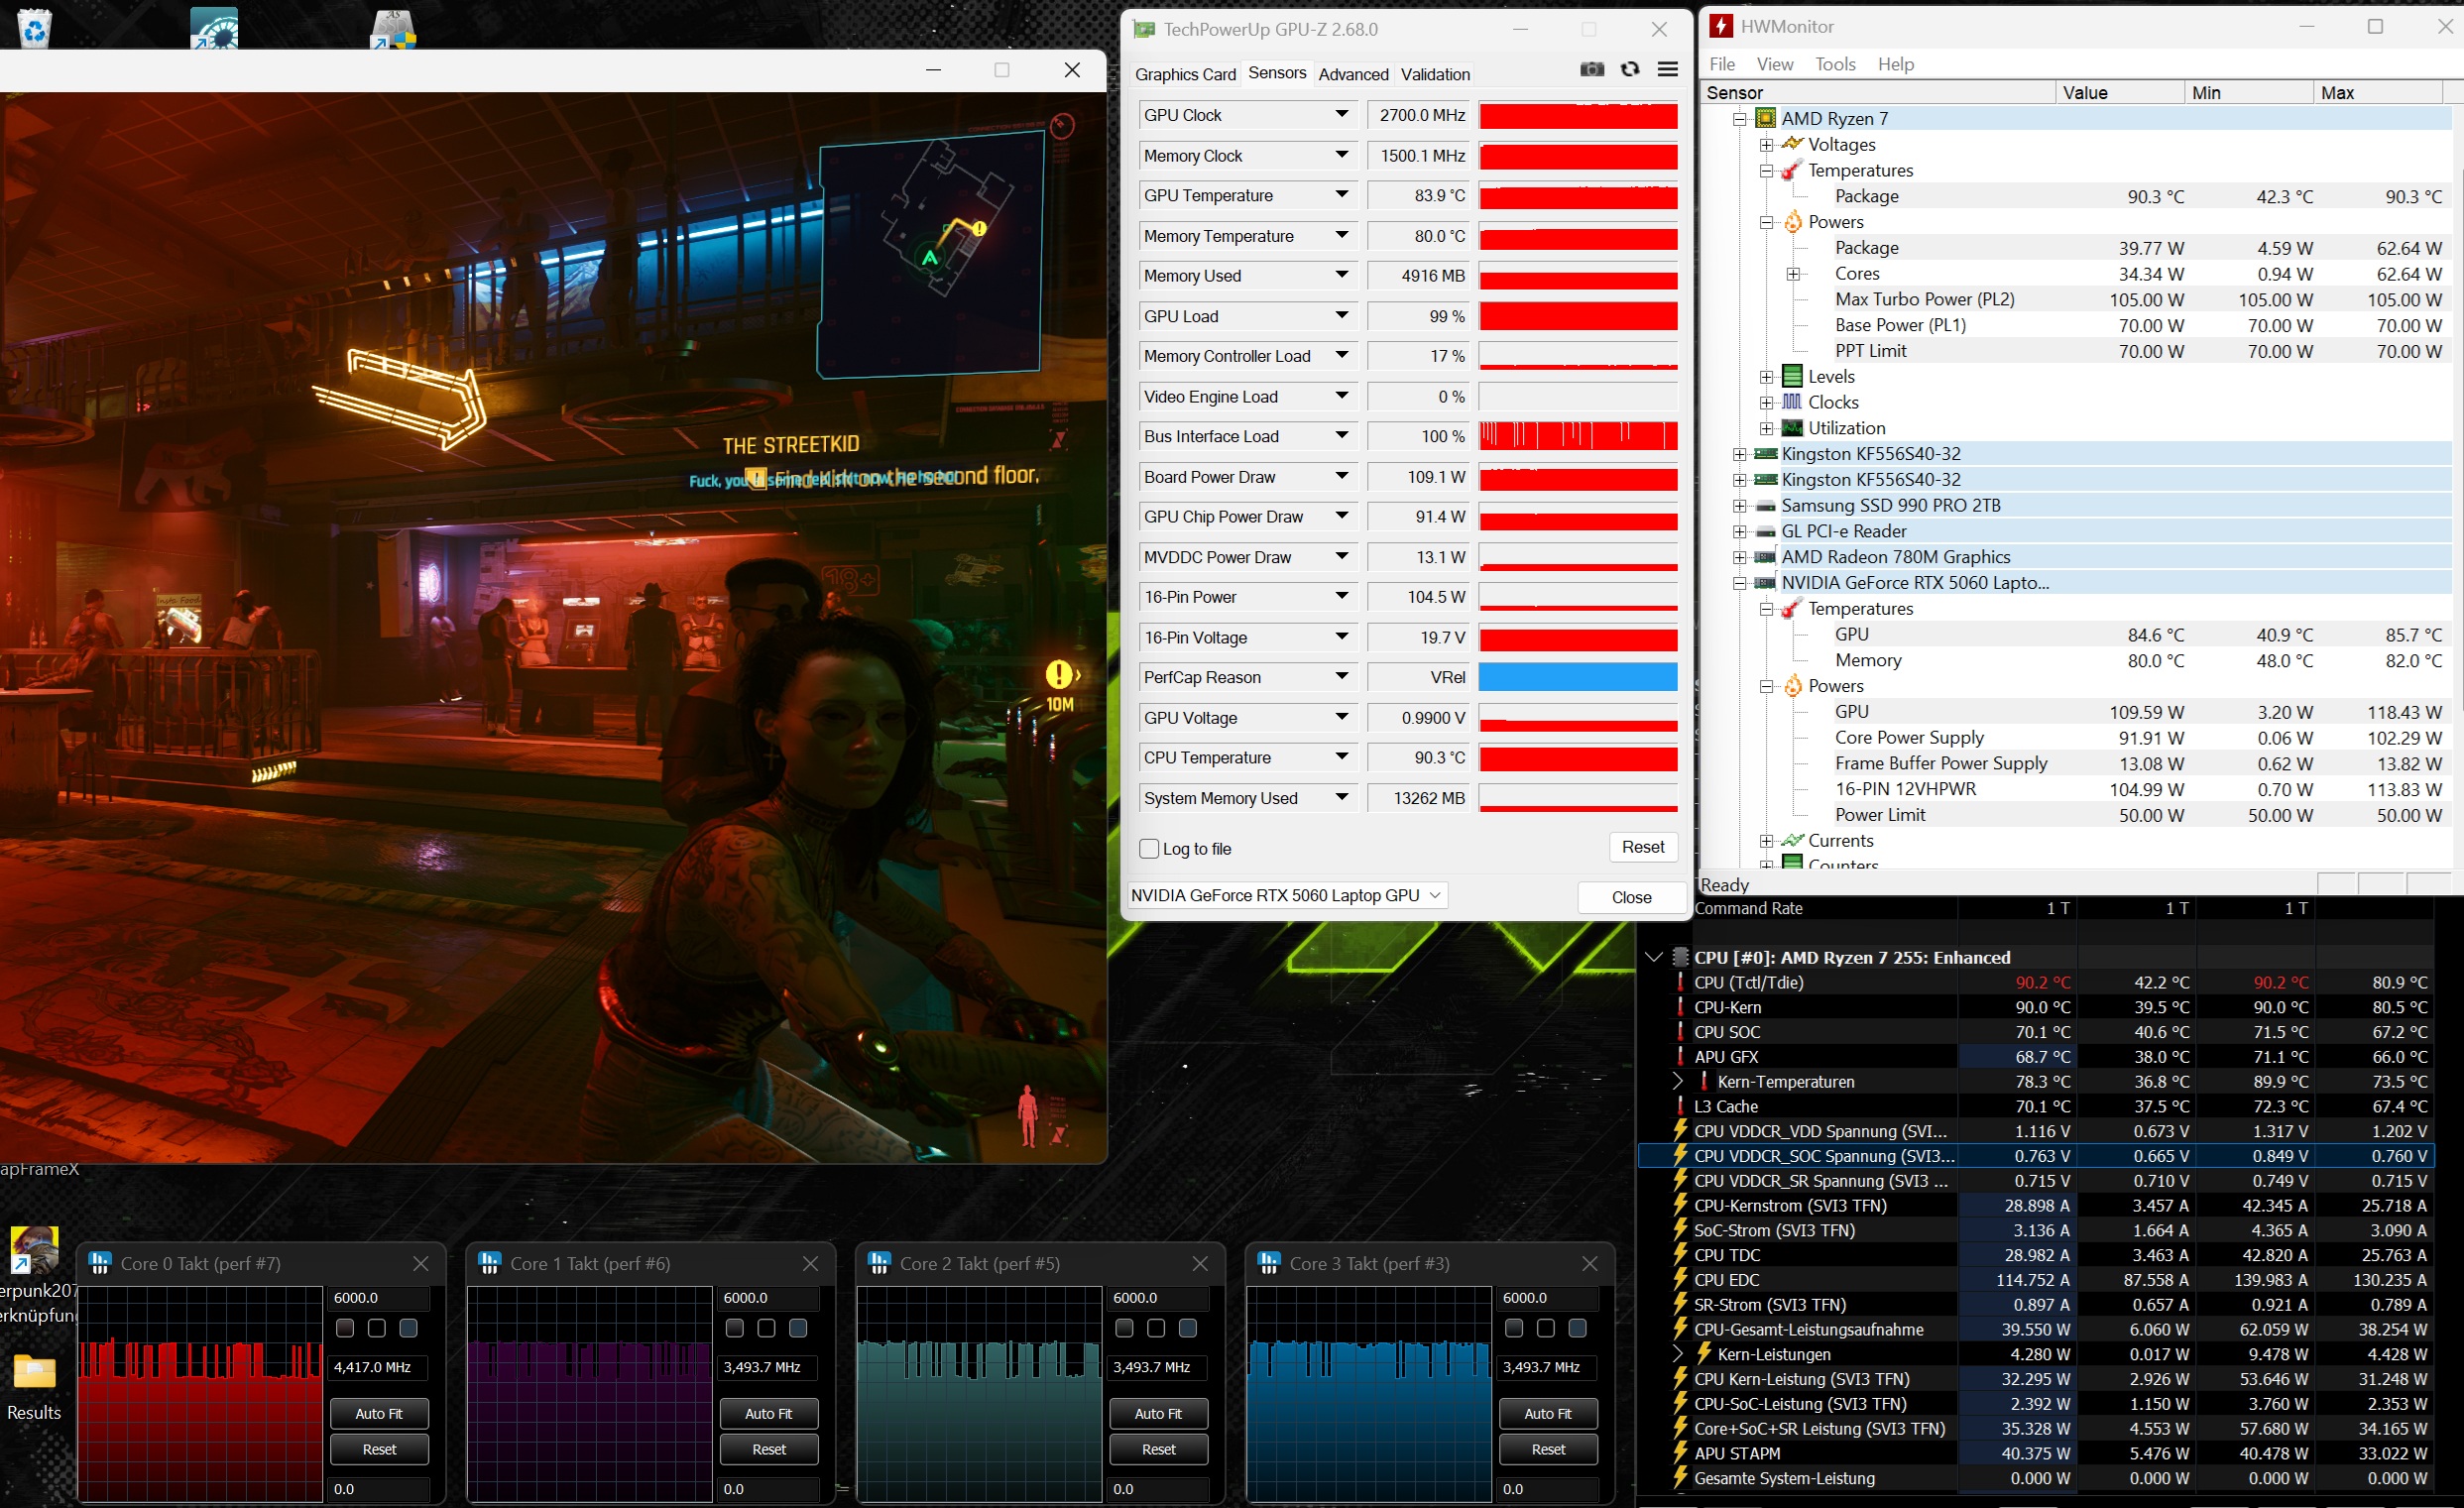
压力测试
组件也不会因发热而死亡。我们使用 Furmark 和 Prime 工具进行了压力测试,CPU 和 GPU 的温度略低于 80 °C。
发言人
音质较弱。联想Legion 7 在这方面的表现明显更好。
Schenker XMG Core 16 VE M25 audio analysis
(±) | speaker loudness is average but good (76 dB)
Bass 100 - 315 Hz
(-) | nearly no bass - on average 19.1% lower than median
(±) | linearity of bass is average (10.5% delta to prev. frequency)
Mids 400 - 2000 Hz
(±) | higher mids - on average 6.3% higher than median
(±) | linearity of mids is average (7.2% delta to prev. frequency)
Highs 2 - 16 kHz
(+) | balanced highs - only 1.8% away from median
(+) | highs are linear (6% delta to prev. frequency)
Overall 100 - 16.000 Hz
(±) | linearity of overall sound is average (18.7% difference to median)
Compared to same class
» 62% of all tested devices in this class were better, 8% similar, 30% worse
» The best had a delta of 6%, average was 18%, worst was 132%
Compared to all devices tested
» 43% of all tested devices were better, 8% similar, 50% worse
» The best had a delta of 4%, average was 23%, worst was 134%
Lenovo Legion 7 16IAX10 audio analysis
(±) | speaker loudness is average but good (77.6 dB)
Bass 100 - 315 Hz
(±) | reduced bass - on average 9.5% lower than median
(±) | linearity of bass is average (9.8% delta to prev. frequency)
Mids 400 - 2000 Hz
(+) | balanced mids - only 1.5% away from median
(+) | mids are linear (4% delta to prev. frequency)
Highs 2 - 16 kHz
(+) | balanced highs - only 3% away from median
(+) | highs are linear (4.9% delta to prev. frequency)
Overall 100 - 16.000 Hz
(+) | overall sound is linear (11.5% difference to median)
Compared to same class
» 10% of all tested devices in this class were better, 3% similar, 87% worse
» The best had a delta of 6%, average was 18%, worst was 132%
Compared to all devices tested
» 8% of all tested devices were better, 2% similar, 90% worse
» The best had a delta of 4%, average was 23%, worst was 134%
能源消耗
能源消耗
空闲时功耗为 10 至 19 瓦,负载时功耗为 181 至 246 瓦,功耗符合预期。
| Off / Standby | |
| Idle | |
| Load |
|
Key:
min: | |
| Schenker XMG Core 16 VE M25 Ryzen 7 255, GeForce RTX 5060 Laptop | Tulpar T6 V3.5 i7-14700HX, GeForce RTX 5060 Laptop | HP Omen 16-ap0091ng R9 8940HX, GeForce RTX 5060 Laptop | Lenovo Legion 7 16IAX10 Ultra 7 255HX, GeForce RTX 5060 Laptop | Schenker XMG Core 16 M25 Ryzen AI 9 HX 370, GeForce RTX 5070 Laptop | Acer Predator Helios Neo 16S AI PHN16S-71-94L9 Ultra 9 275HX, GeForce RTX 5070 Ti Laptop | Average of class Gaming | |
|---|---|---|---|---|---|---|---|
| Power Consumption | 8% | 11% | -12% | 5% | 22% | -26% | |
| Idle Minimum * (Watt) | 10.5 | 6.7 36% | 7.8 26% | 9.4 10% | 7.4 30% | 3.9 63% | 13 ? -24% |
| Idle Average * (Watt) | 13 | 13.7 -5% | 8.8 32% | 10.6 18% | 14.9 -15% | 11 15% | 18.7 ? -44% |
| Idle Maximum * (Watt) | 18.8 | 21.8 -16% | 21.5 -14% | 36.4 -94% | 15.2 19% | 16.9 10% | 24.3 ? -29% |
| Cyberpunk 2077 ultra * (Watt) | 182.5 | 156.7 14% | 192 -5% | 188 -3% | 184.8 -1% | 152.7 16% | |
| Cyberpunk 2077 ultra external monitor * (Watt) | 181.1 | 151.9 16% | 164.5 9% | 187.5 -4% | 181.4 -0% | 144.9 20% | |
| Load Maximum * (Watt) | 246 | 242 2% | 208 15% | 247 -0% | 251.1 -2% | 229 7% | 258 ? -5% |
| Load Average * (Watt) | 127 | 119 | 107.7 | 100.8 | 123 | 110.2 ? |
* ... smaller is better
能耗 赛博朋克/压力测试
带外部监控器的能耗
电池寿命
我们认为电池续航时间相对较好。在我们的 Wi-Fi 测试中(亮度降至 150 cd/m²),几乎没有同类设备的续航时间超过 7 小时。配备 99 Wh(而不是 80 Wh)电池的普通 Core 16 甚至能达到 11 小时左右。
| Schenker XMG Core 16 VE M25 Ryzen 7 255, GeForce RTX 5060 Laptop, 80 Wh | Tulpar T6 V3.5 i7-14700HX, GeForce RTX 5060 Laptop, 53.35 Wh | HP Omen 16-ap0091ng R9 8940HX, GeForce RTX 5060 Laptop, 70 Wh | Lenovo Legion 7 16IAX10 Ultra 7 255HX, GeForce RTX 5060 Laptop, 84 Wh | Schenker XMG Core 16 M25 Ryzen AI 9 HX 370, GeForce RTX 5070 Laptop, 99.8 Wh | Acer Predator Helios Neo 16S AI PHN16S-71-94L9 Ultra 9 275HX, GeForce RTX 5070 Ti Laptop, 76 Wh | Average of class Gaming | |
|---|---|---|---|---|---|---|---|
| Battery runtime | -40% | -32% | -36% | 49% | -32% | -2% | |
| WiFi v1.3 (h) | 7.3 | 4.4 -40% | 5 -32% | 4.7 -36% | 10.9 49% | 5 -32% | 7.15 ? -2% |
| H.264 (h) | 5.1 | 8.64 ? | |||||
| Load (h) | 1.3 | 1.502 ? |
Notebookcheck 总体评分
即使 XMG Core 16 VE 略逊于联想 Legion 7 16,但它仍被证明是一款全面、高品质的游戏笔记本电脑,几乎没有弱点。
Schenker XMG Core 16 VE M25
- 01/09/2026 v8
Florian Glaser
 Total Sustainability Score:
 可比较的替代品
Image | Model / Review | Price | Weight | Height | Display |
|---|---|---|---|---|---|
1. 83.9%  | Schenker XMG Core 16 VE M25 AMD Ryzen 7 255 ⎘ NVIDIA GeForce RTX 5060 Laptop ⎘ 64 GB Memory, 2048 GB SSD | Amazon: List Price: 1935 EUR | 2.1 kg | 23 mm | 16.00" 2560x1600 189 PPI IPS |
2. 77.8%  | Tulpar T6 V3.5 Intel Core i7-14700HX ⎘ NVIDIA GeForce RTX 5060 Laptop ⎘ 32 GB Memory, 1000 GB SSD | Amazon: List Price: 1160 EUR | 2.4 kg | 25 mm | 16.00" 1920x1200 142 PPI IPS |
3. 82.5%  | HP Omen 16-ap0091ng AMD Ryzen 9 8940HX ⎘ NVIDIA GeForce RTX 5060 Laptop ⎘ 16 GB Memory, 1000 GB SSD | Amazon: List Price: 1500 Euro | 2.4 kg | 23.7 mm | 16.00" 1920x1200 162 PPI IPS |
4. 86.6%  | Lenovo Legion 7 16IAX10 Intel Core Ultra 7 255HX ⎘ NVIDIA GeForce RTX 5060 Laptop ⎘ 32 GB Memory, 1024 GB SSD | Amazon: List Price: 1650 USD | 2 kg | 17.9 mm | 16.00" 2560x1600 189 PPI OLED |
5. 86.2%  | Schenker XMG Core 16 M25 AMD Ryzen AI 9 HX 370 ⎘ NVIDIA GeForce RTX 5070 Laptop ⎘ 64 GB Memory, 2048 GB SSD | Amazon: List Price: 2100€ | 2.1 kg | 23 mm | 16.00" 2560x1600 189 PPI IPS |
6. 82%  | Acer Predator Helios Neo 16S AI PHN16S-71-94L9 Intel Core Ultra 9 275HX ⎘ NVIDIA GeForce RTX 5070 Ti Laptop ⎘ 32 GB Memory, 1024 GB SSD | Amazon: List Price: 2400 EUR | 2.2 kg | 19.9 mm | 16.00" 2560x1600 189 PPI OLED |
Transparency
The selection of devices to be reviewed is made by our editorial team. The test sample was provided to the author as a loan by the manufacturer or retailer for the purpose of this review. The lender had no influence on this review, nor did the manufacturer receive a copy of this review before publication. There was no obligation to publish this review. As an independent media company, Notebookcheck is not subjected to the authority of manufacturers, retailers or publishers.
This is how Notebookcheck is testing
Every year, Notebookcheck independently reviews hundreds of laptops and smartphones using standardized procedures to ensure that all results are comparable. We have continuously developed our test methods for around 20 years and set industry standards in the process. In our test labs, high-quality measuring equipment is utilized by experienced technicians and editors. These tests involve a multi-stage validation process. Our complex rating system is based on hundreds of well-founded measurements and benchmarks, which maintains objectivity. Further information on our test methods can be found here.
