




结论
此前 此前 评测过一款搭载 GeForce RTX 5070 的配置后,我们发现 TUF Gaming A18 的 RTX 5060 版本同样是一款性能均衡的 18 英寸笔记本,且价格相对公道。 我们测试的 FA808UM-S8060W 配置搭载了 16 GB DDR5 内存(采用 2 × 8 GB 双通道配置)以及 1 TB NVMe 固态硬盘。 显示屏的分辨率仍被限制在 1,920 × 1,200 像素,对于如此大尺寸的屏幕而言,这一规格显得有些保守。不过,其优点在于几乎所有游戏在原生分辨率下开启最高画质时都能流畅运行。 画质总体上与价格相称,特别是在对比度和色域覆盖方面。除了极其吵闹的Turbo模式外,满载时的发热情况仍控制得相当不错。扬声器、输入设备和接口配置也几乎无可挑剔。最让我们印象深刻的是电池续航能力,TUF Gaming A18在我们的对比测试中超越了所有竞争对手。
Pros
Cons
价格与供货情况
本文评测的华硕 TUF Gaming A18 FA808UM-S8060W 可在多家欧洲在线零售商处购买,包括Galaxus,起售价约为1,300欧元。这大致相当于1,125英镑或1,525美元,不过各地的实际价格、税费及供货情况可能因地区而异。

- $1,123.54ASUS 2025 TUF Gaming A18 18” WUXGA 144Hz IPS Laptop 8-Core AMD Ryzen 7 260 NVIDIA GeForce RTX 5060 16GB DDR5 1TB NVMe SSD WiFi AX RJ-45 BT Webcam HDMI2.1 RGB Backlit KB Windows 11 Home w/RE USB
- $1,509.00ASUS TUF A18 Gaming Laptop, NVIDIA RTX 5060, 16GB DDR5, 1TB SSD
- $1,629.00ASUS TUF Gaming A18 AI Laptop 18" WUXGA IPS 144Hz (100% sRGB, GSYNC) AMD 8-core Ryzen 7 260 16GB RAM 1TB SSD GeForce RTX 5060 GDDR7 (Up to 572 AI Tops) RGB Backlit USB4 Win11Pro ICP Acc
Table of Contents
技术规格
机箱、功能和输入设备
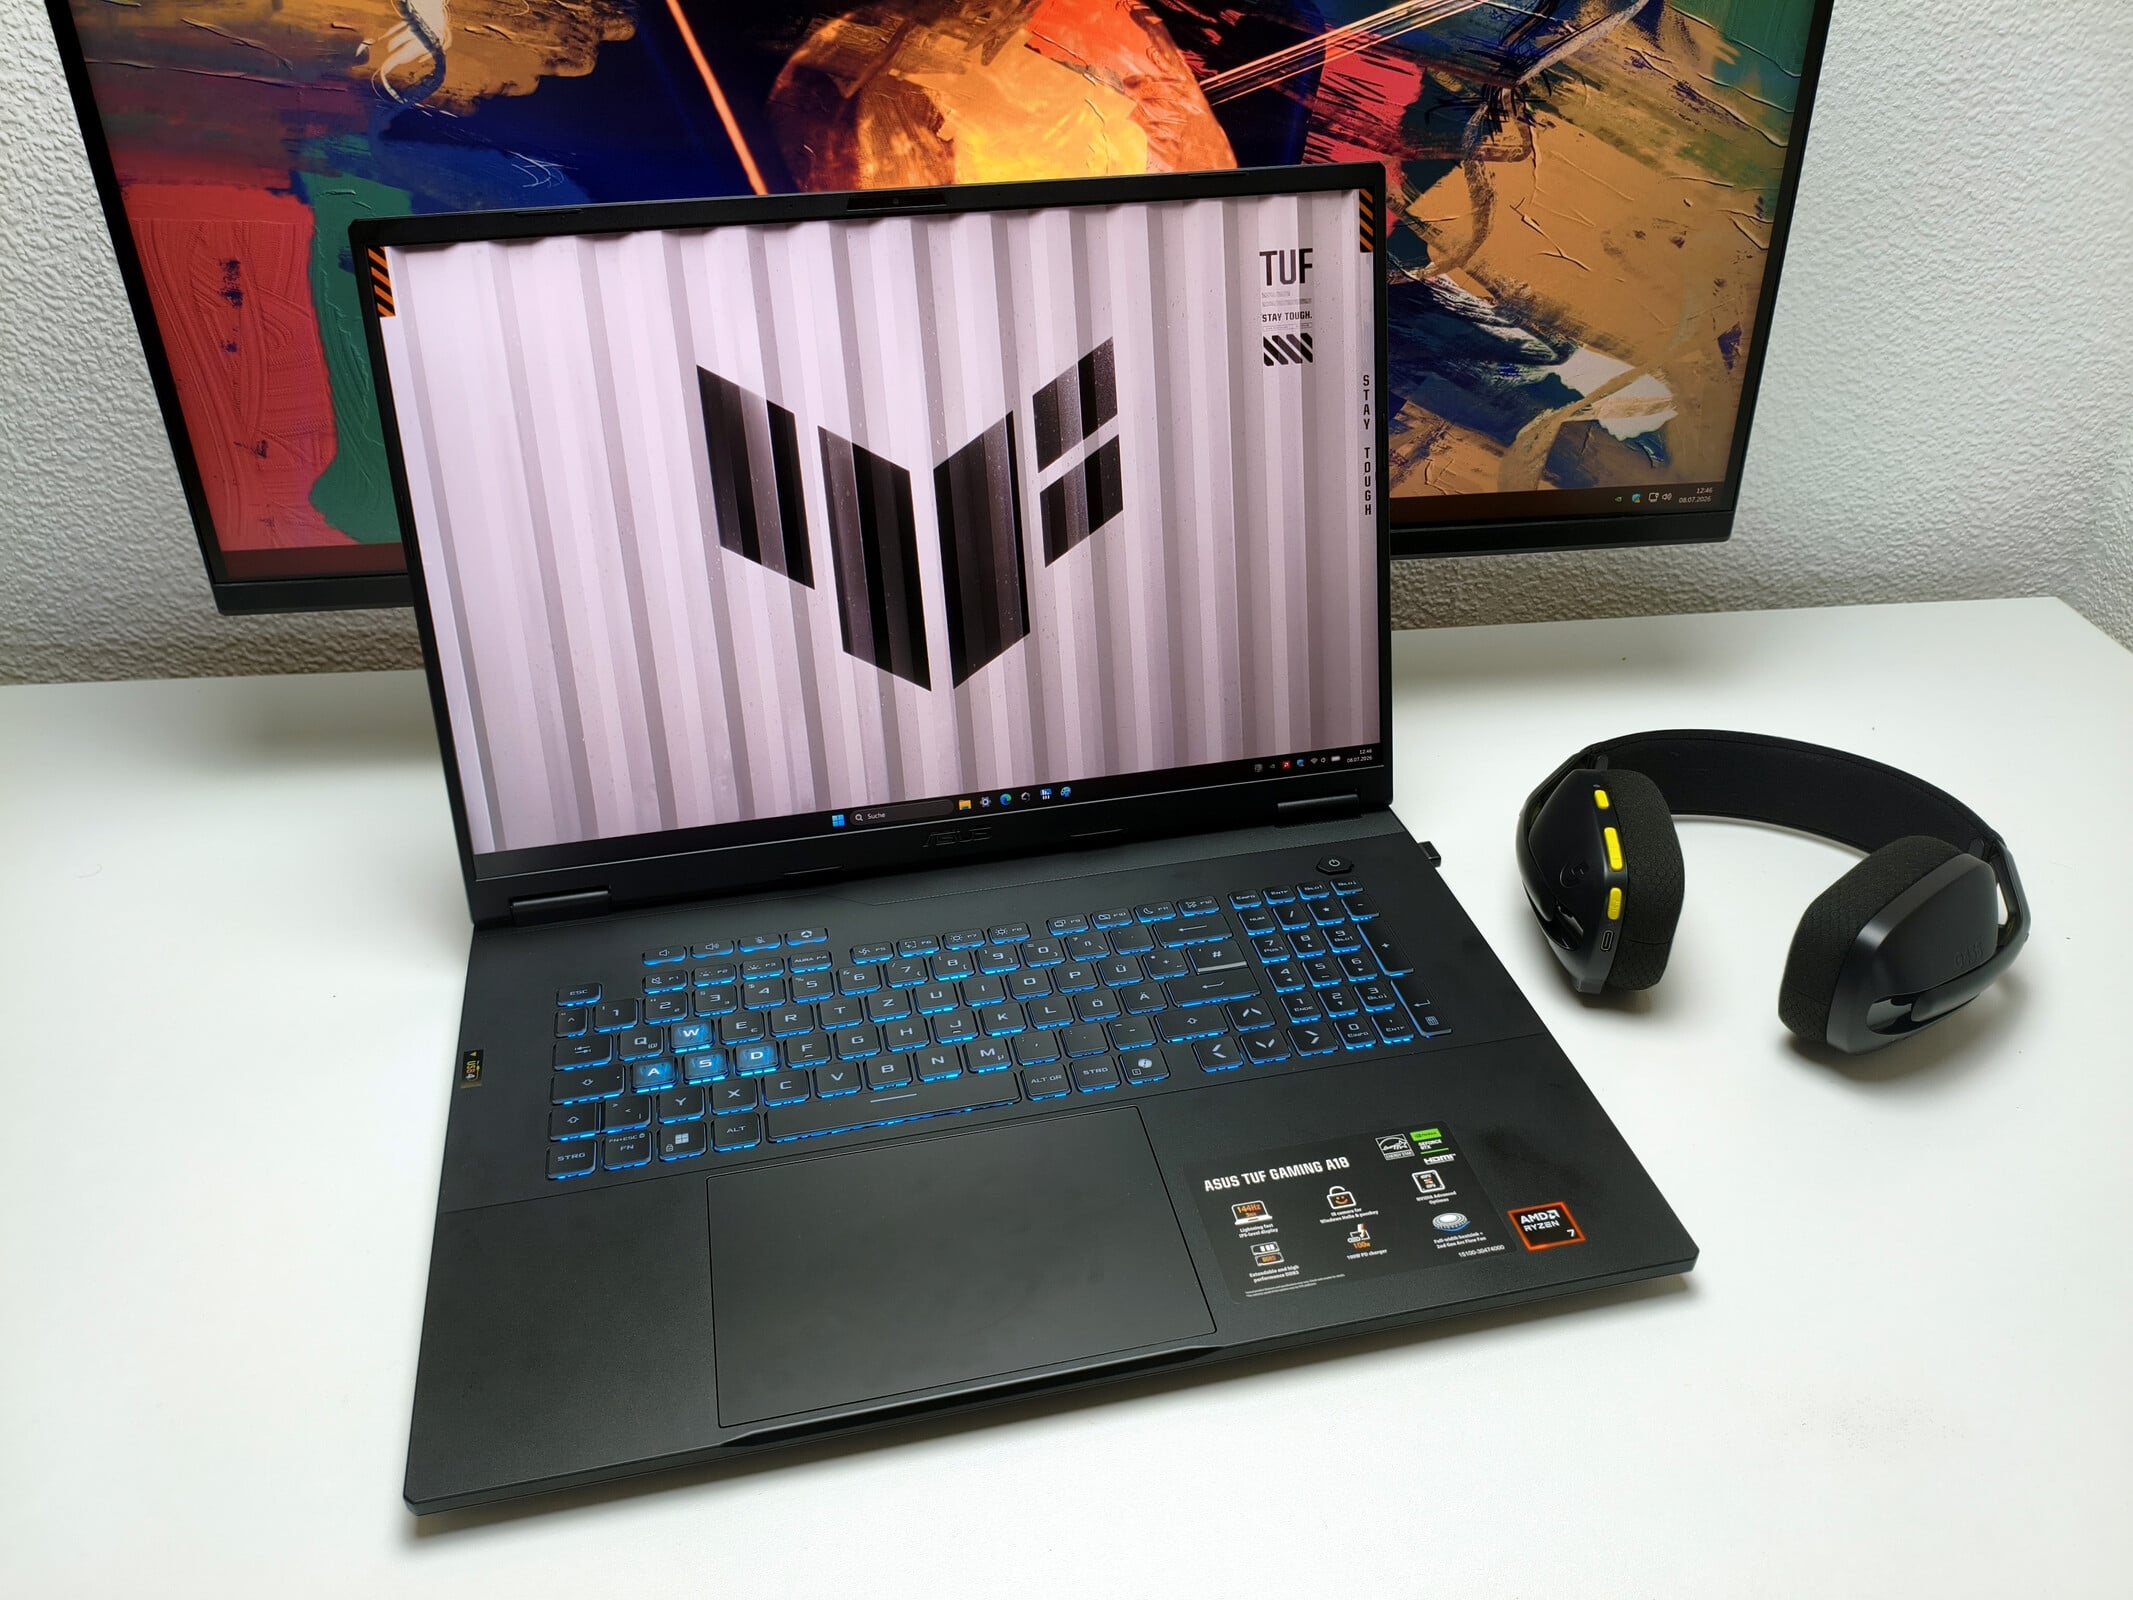
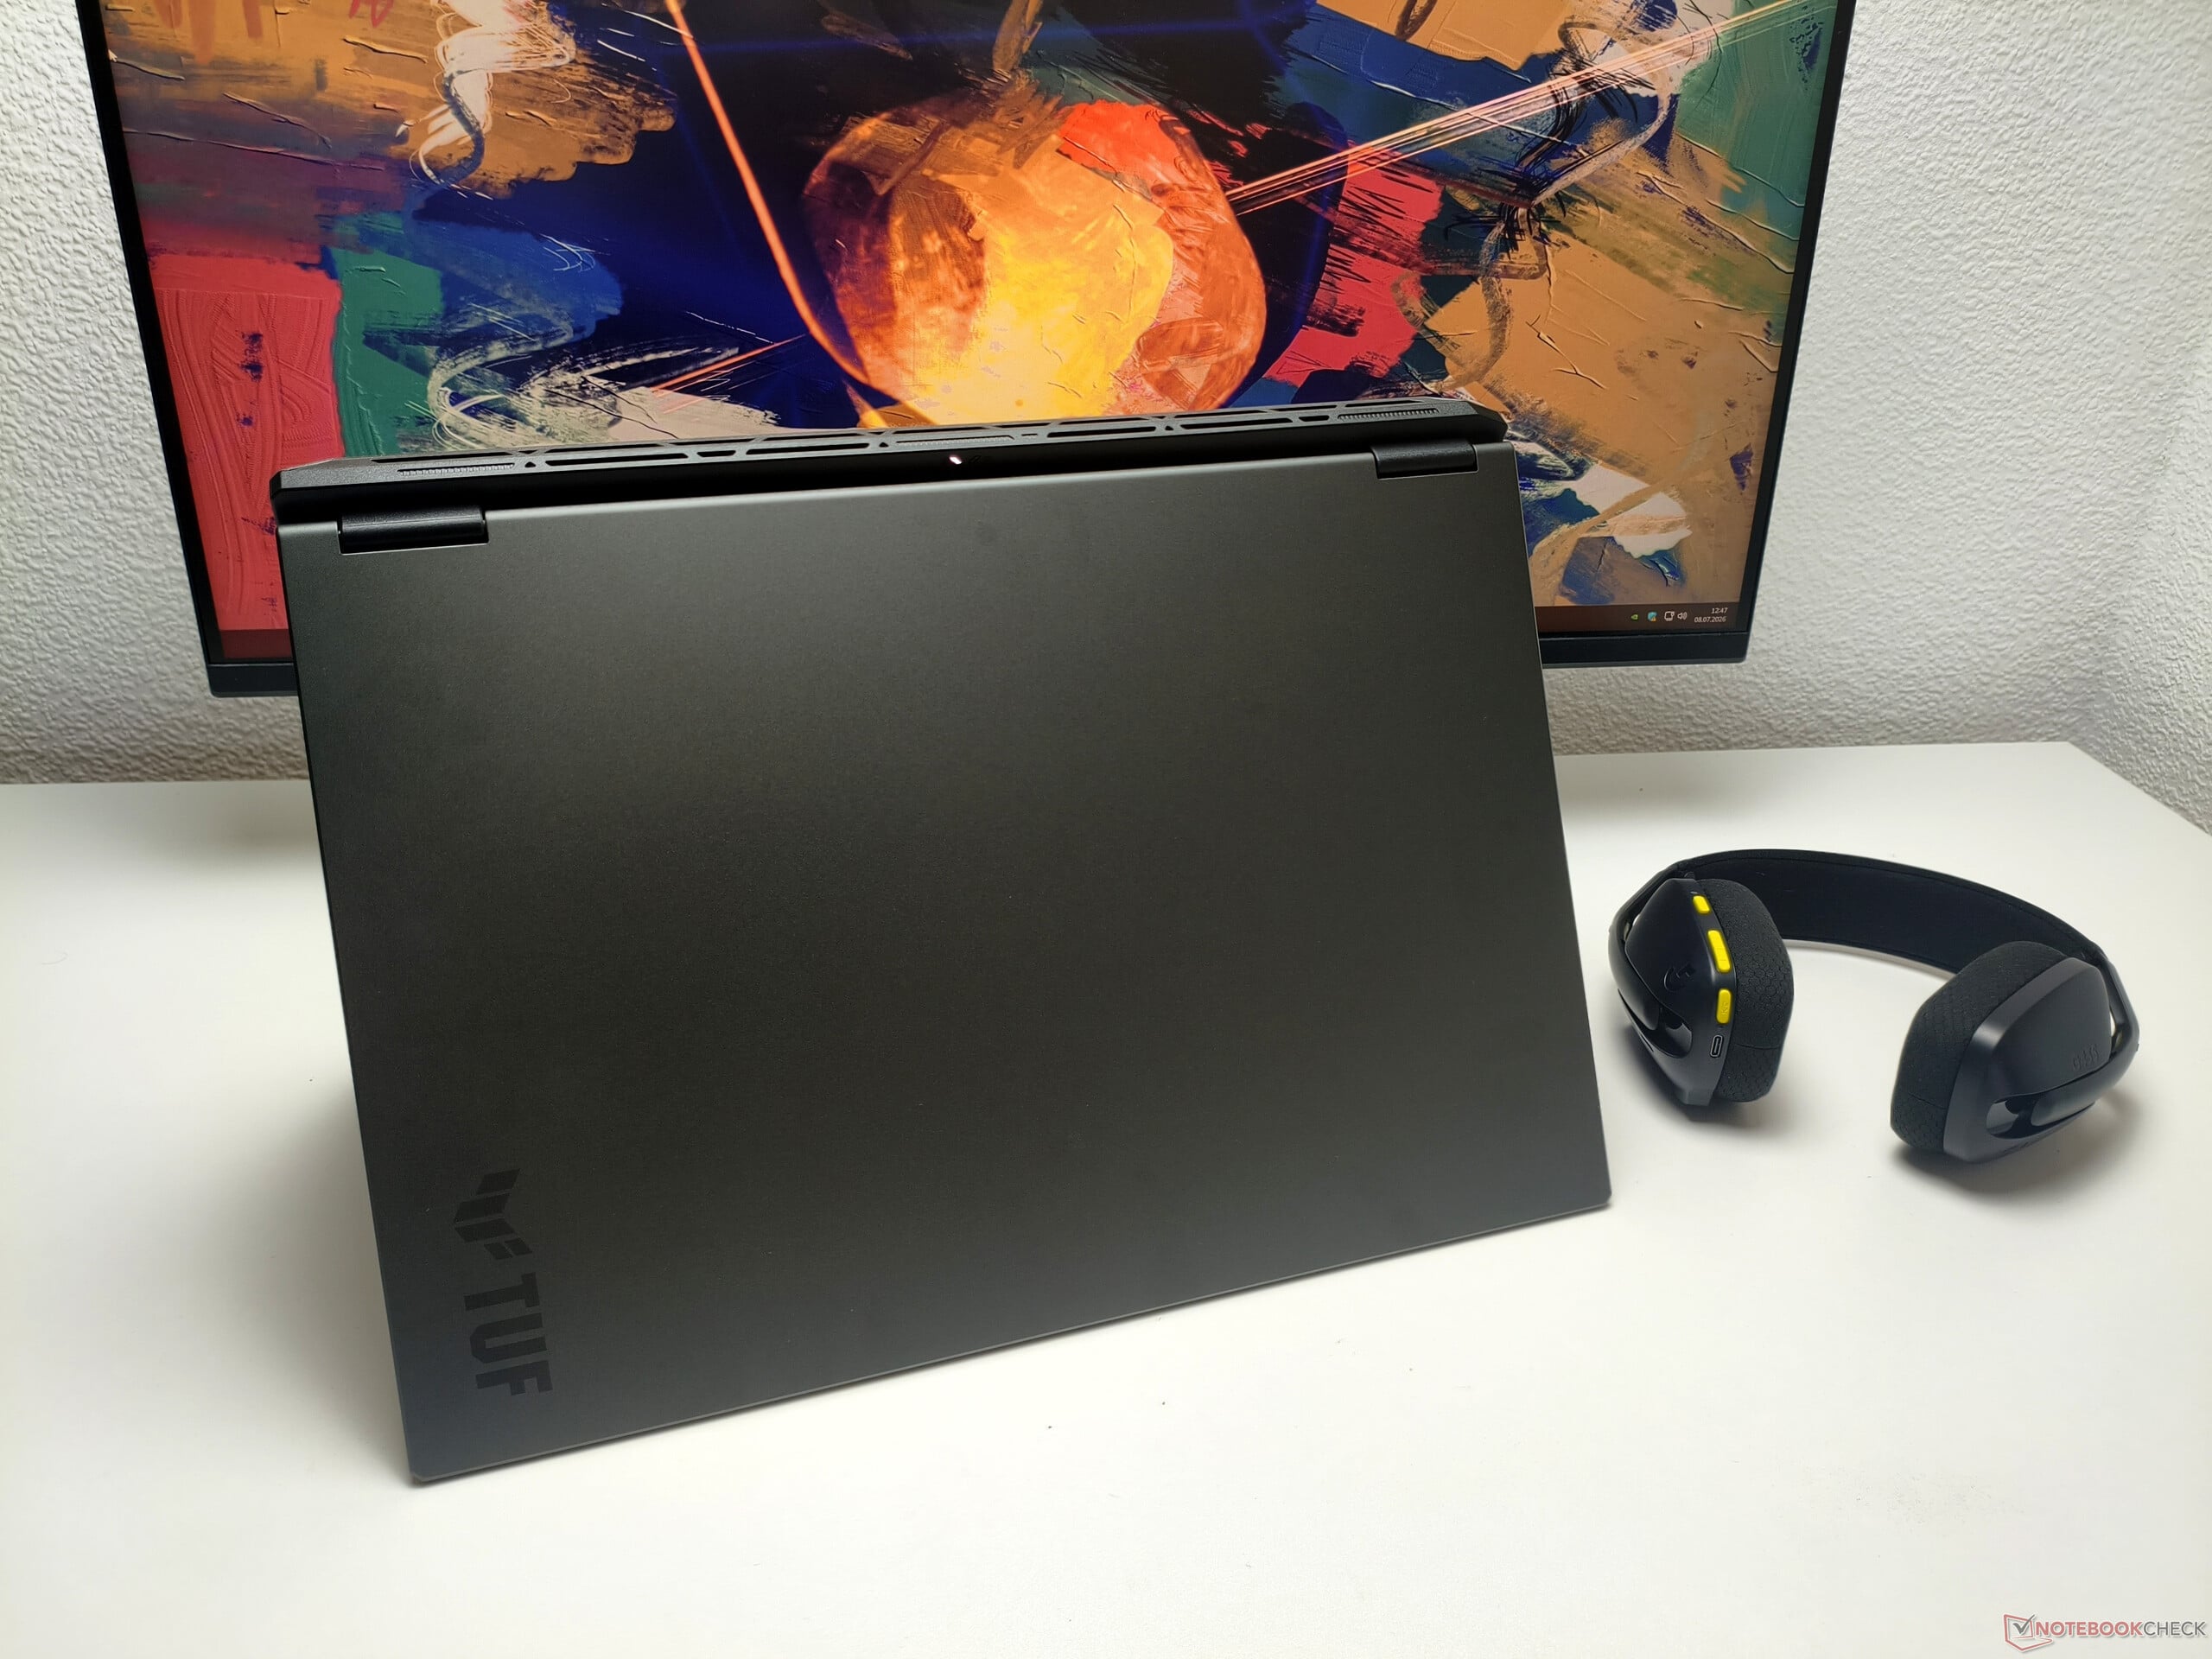
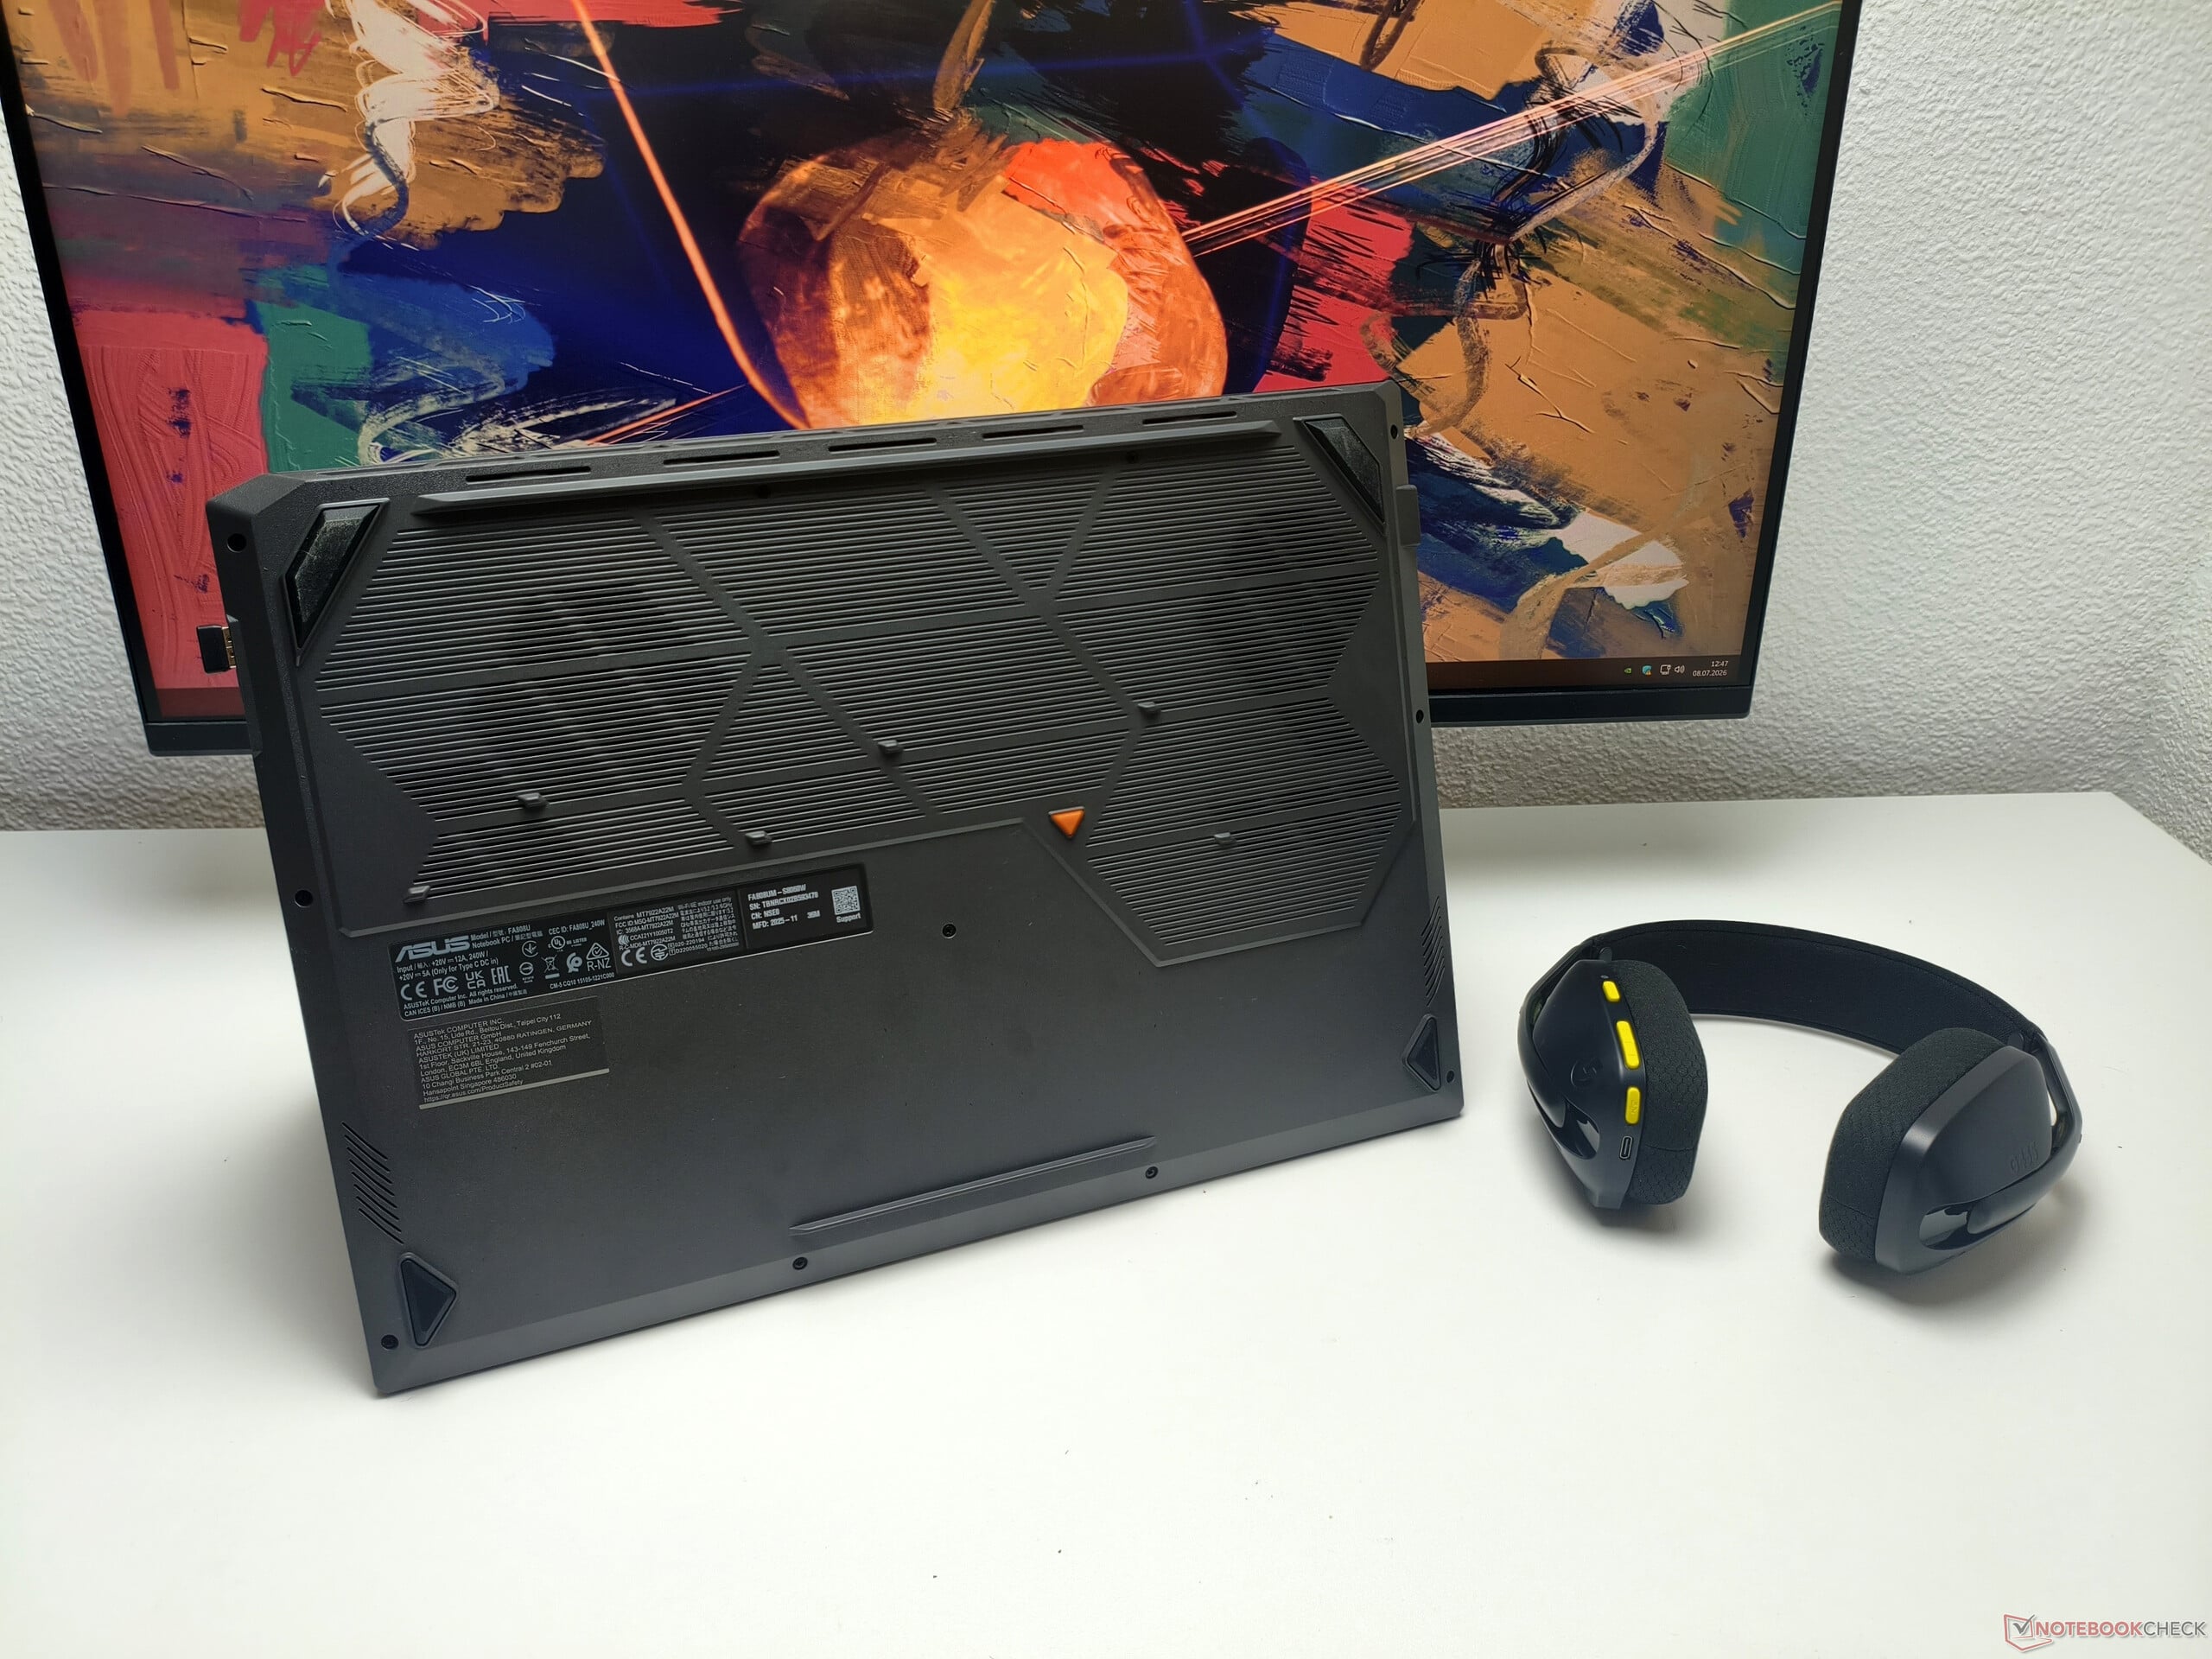
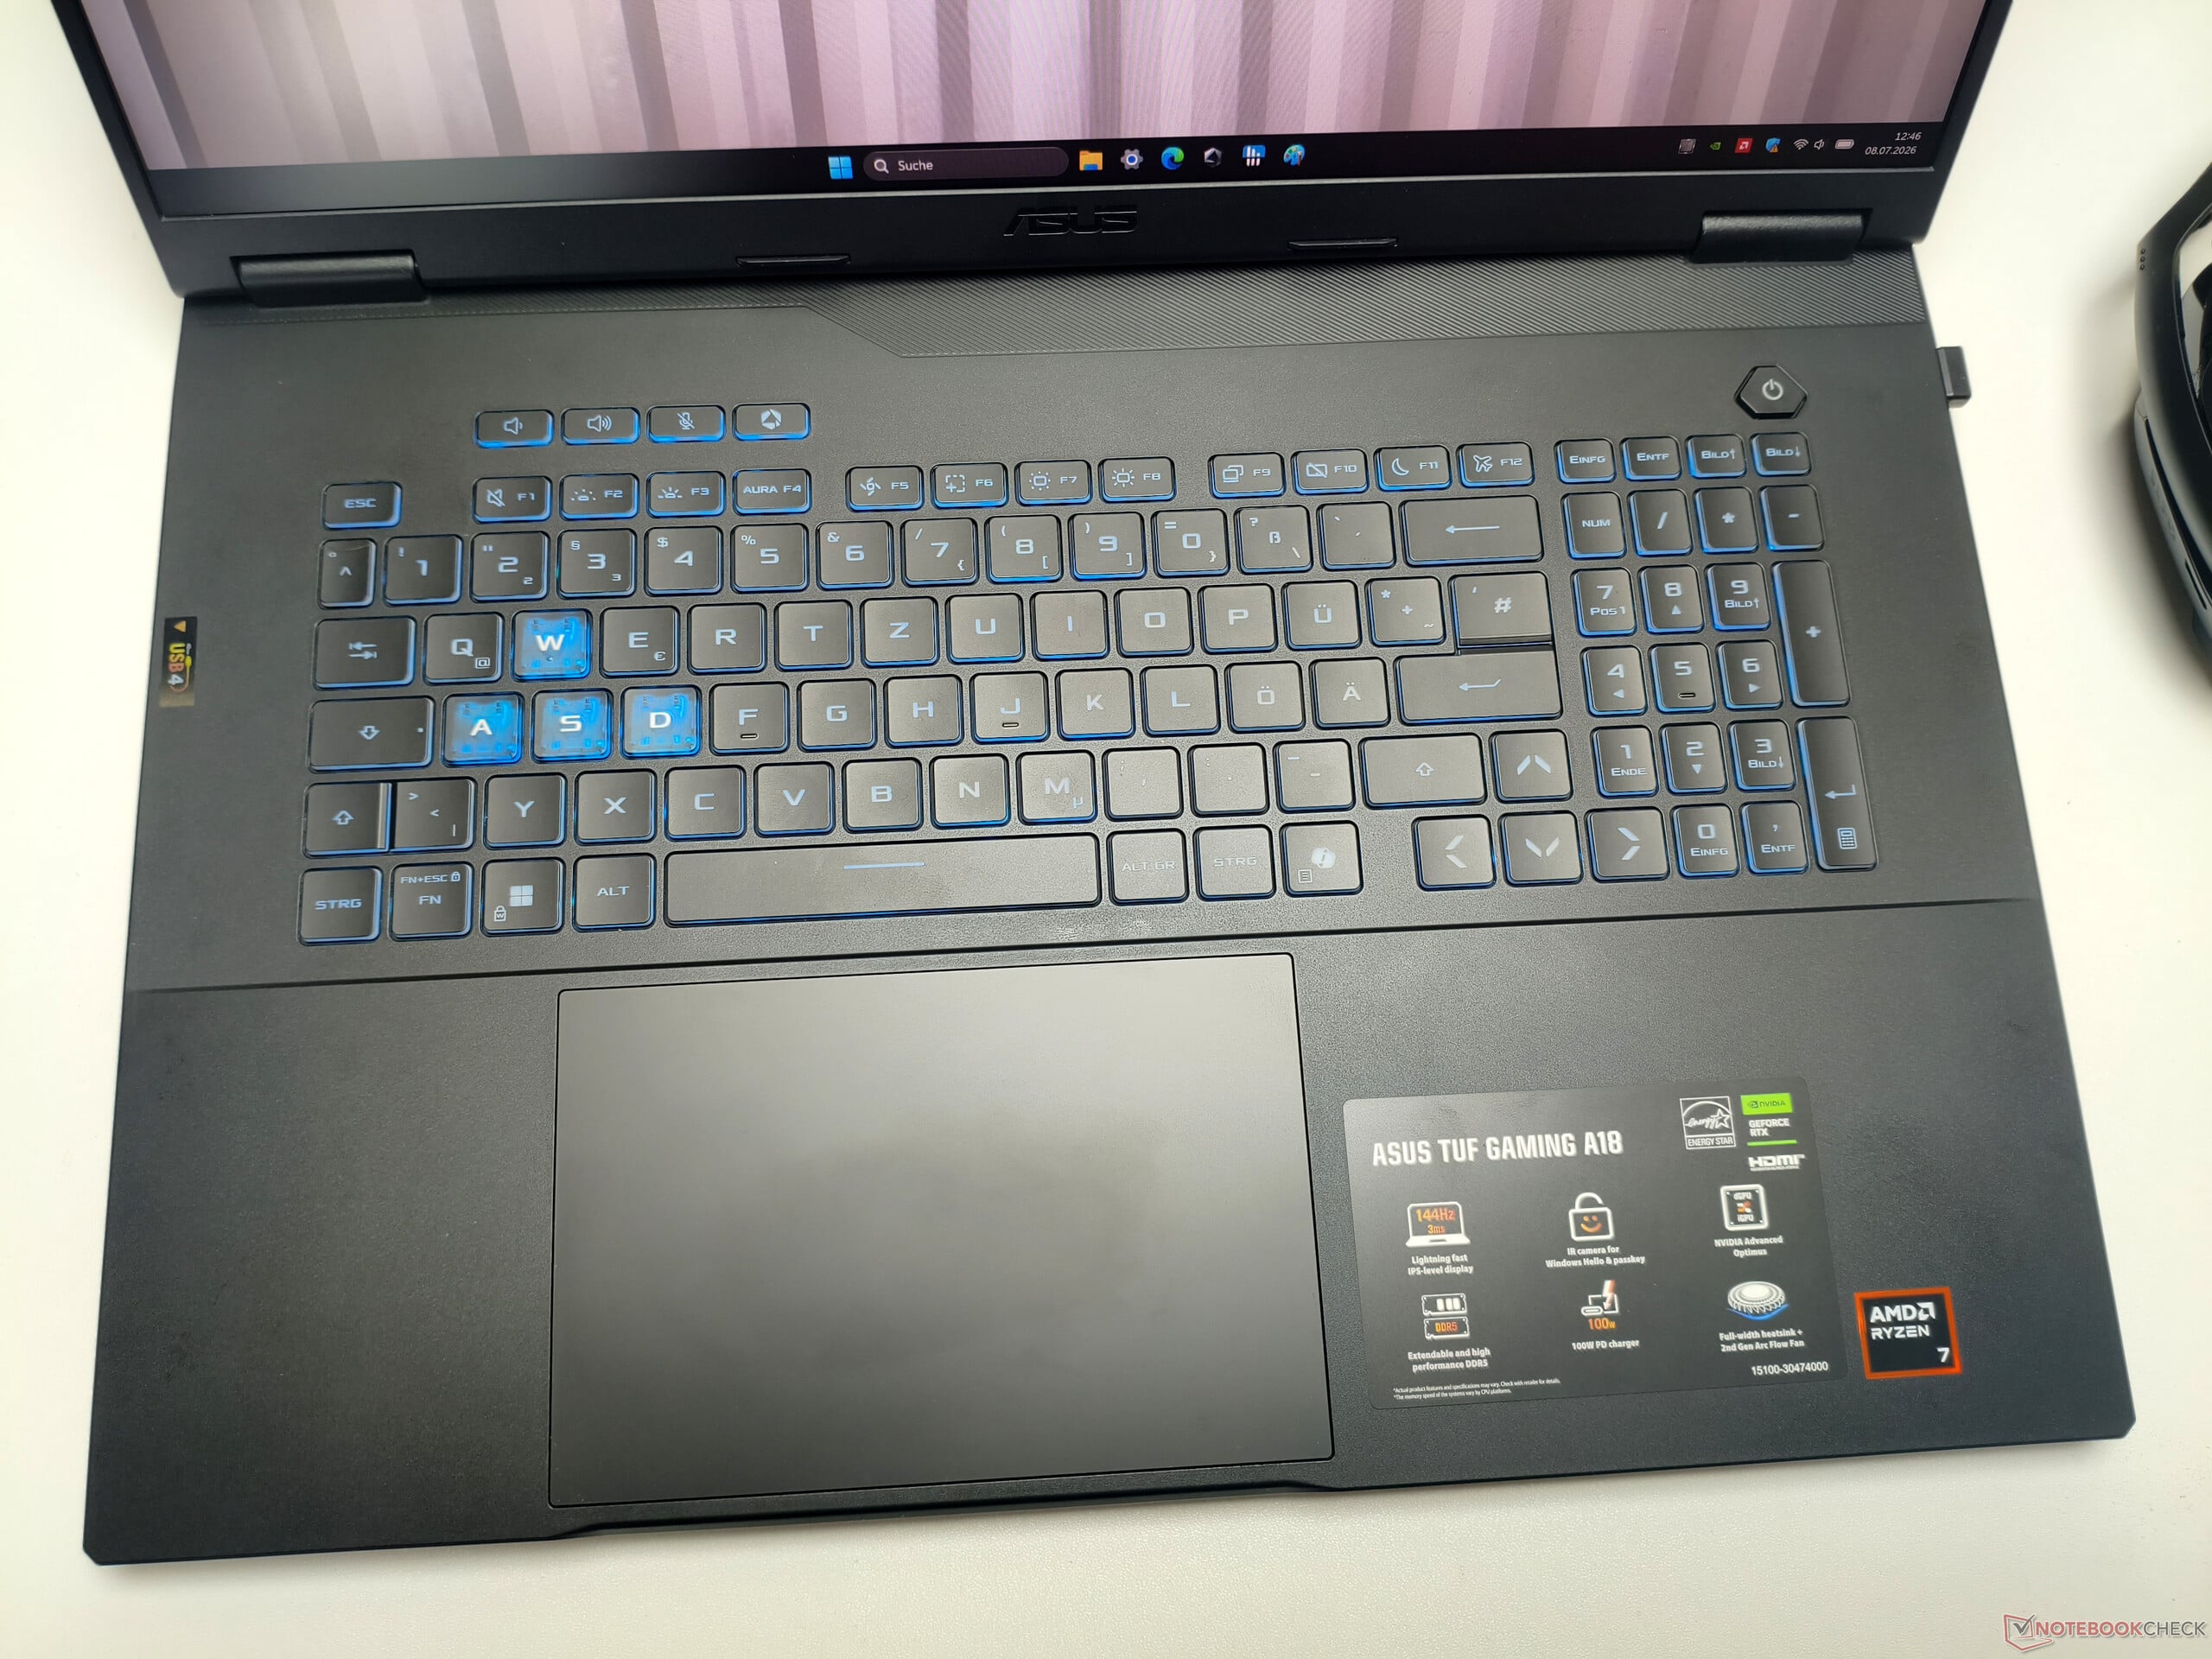
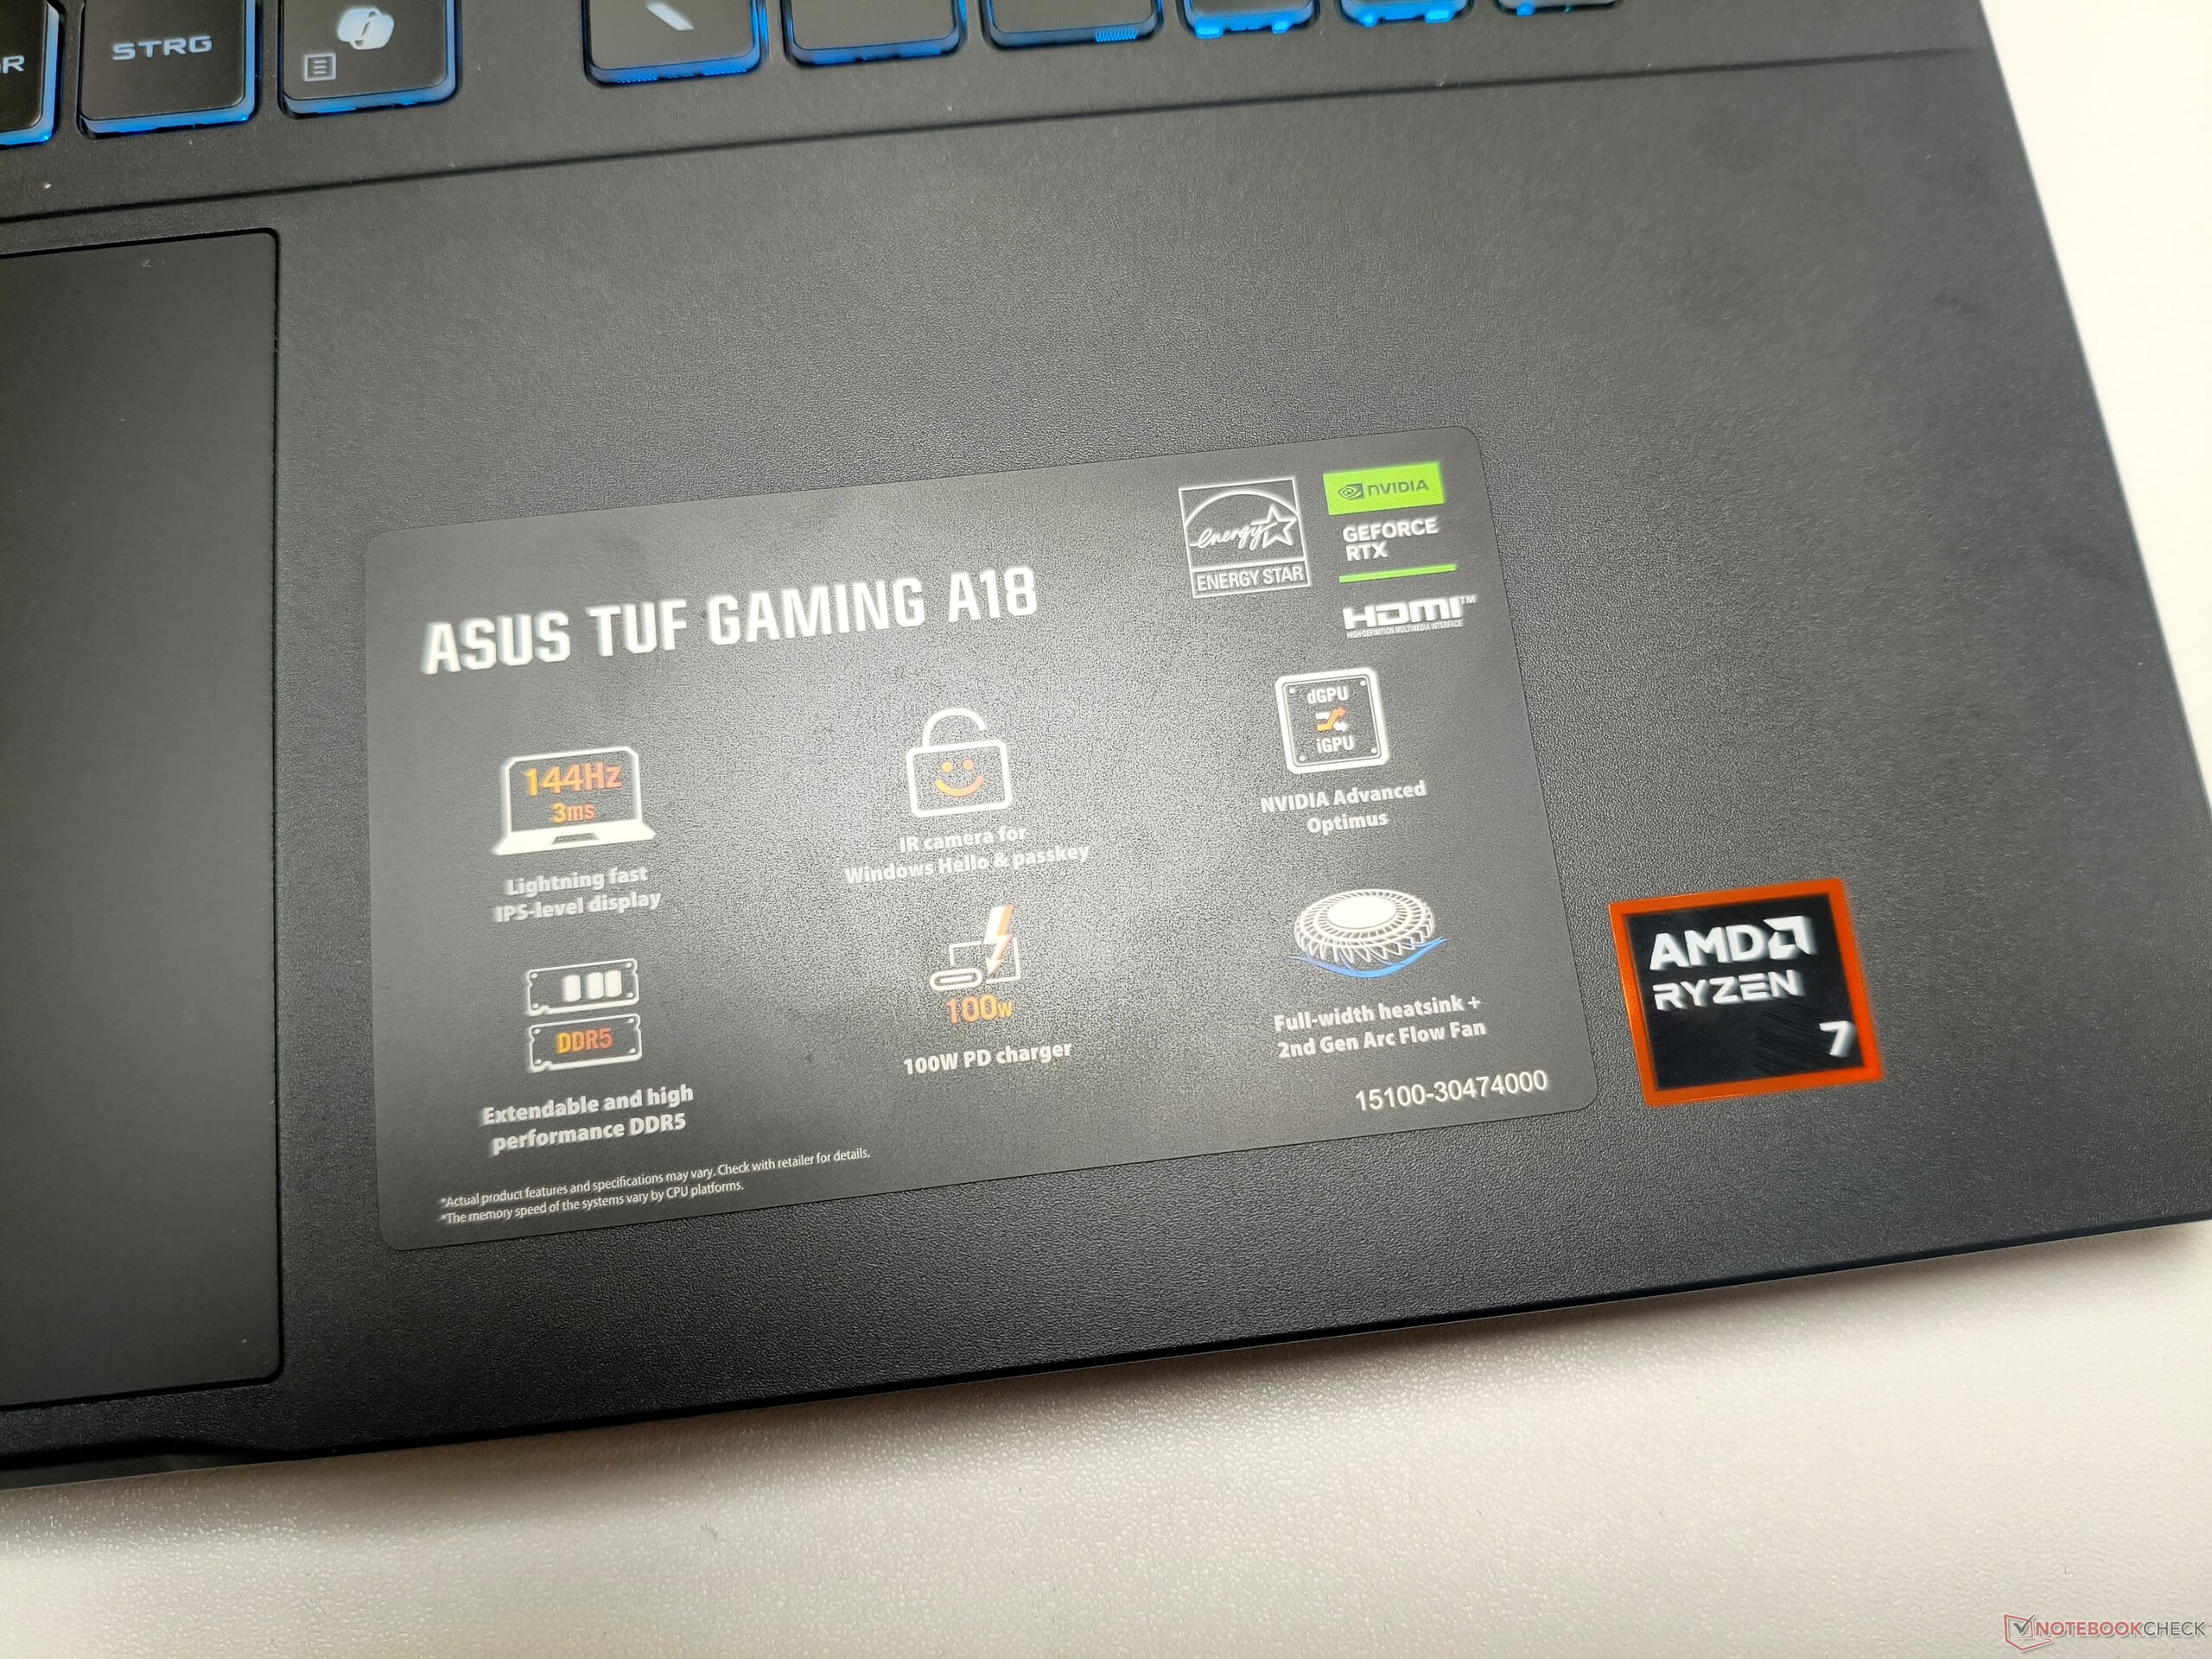
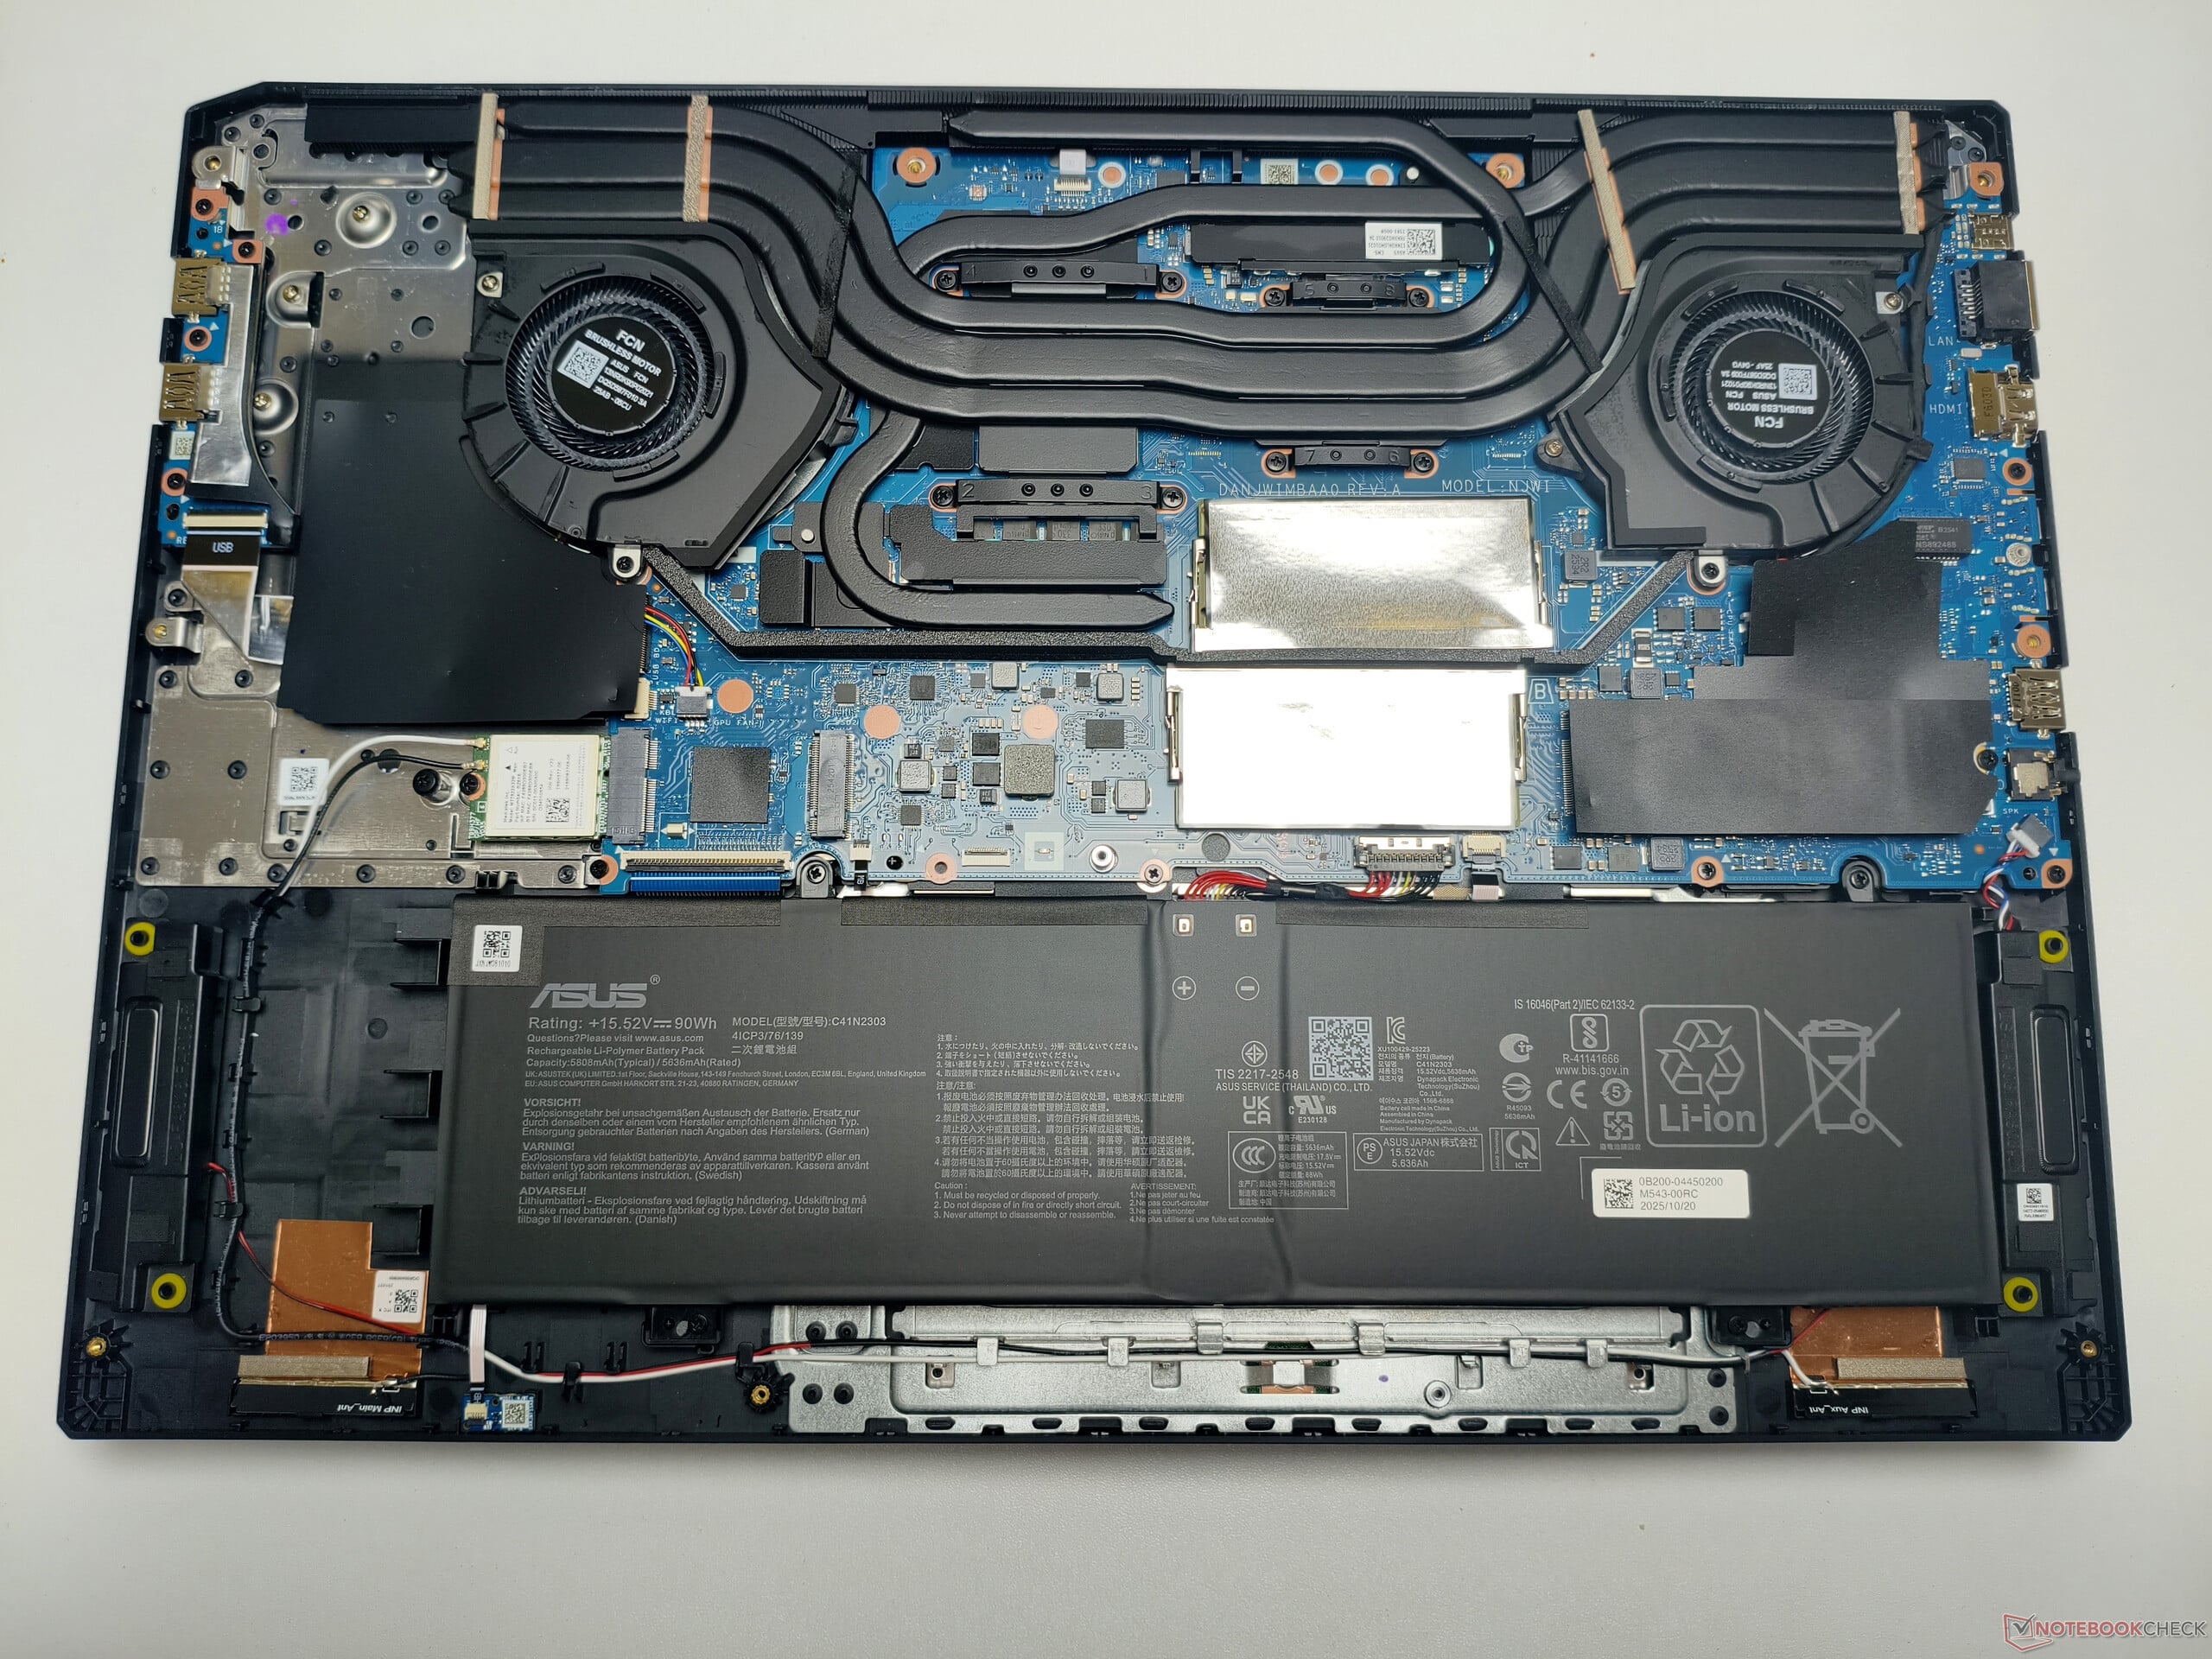
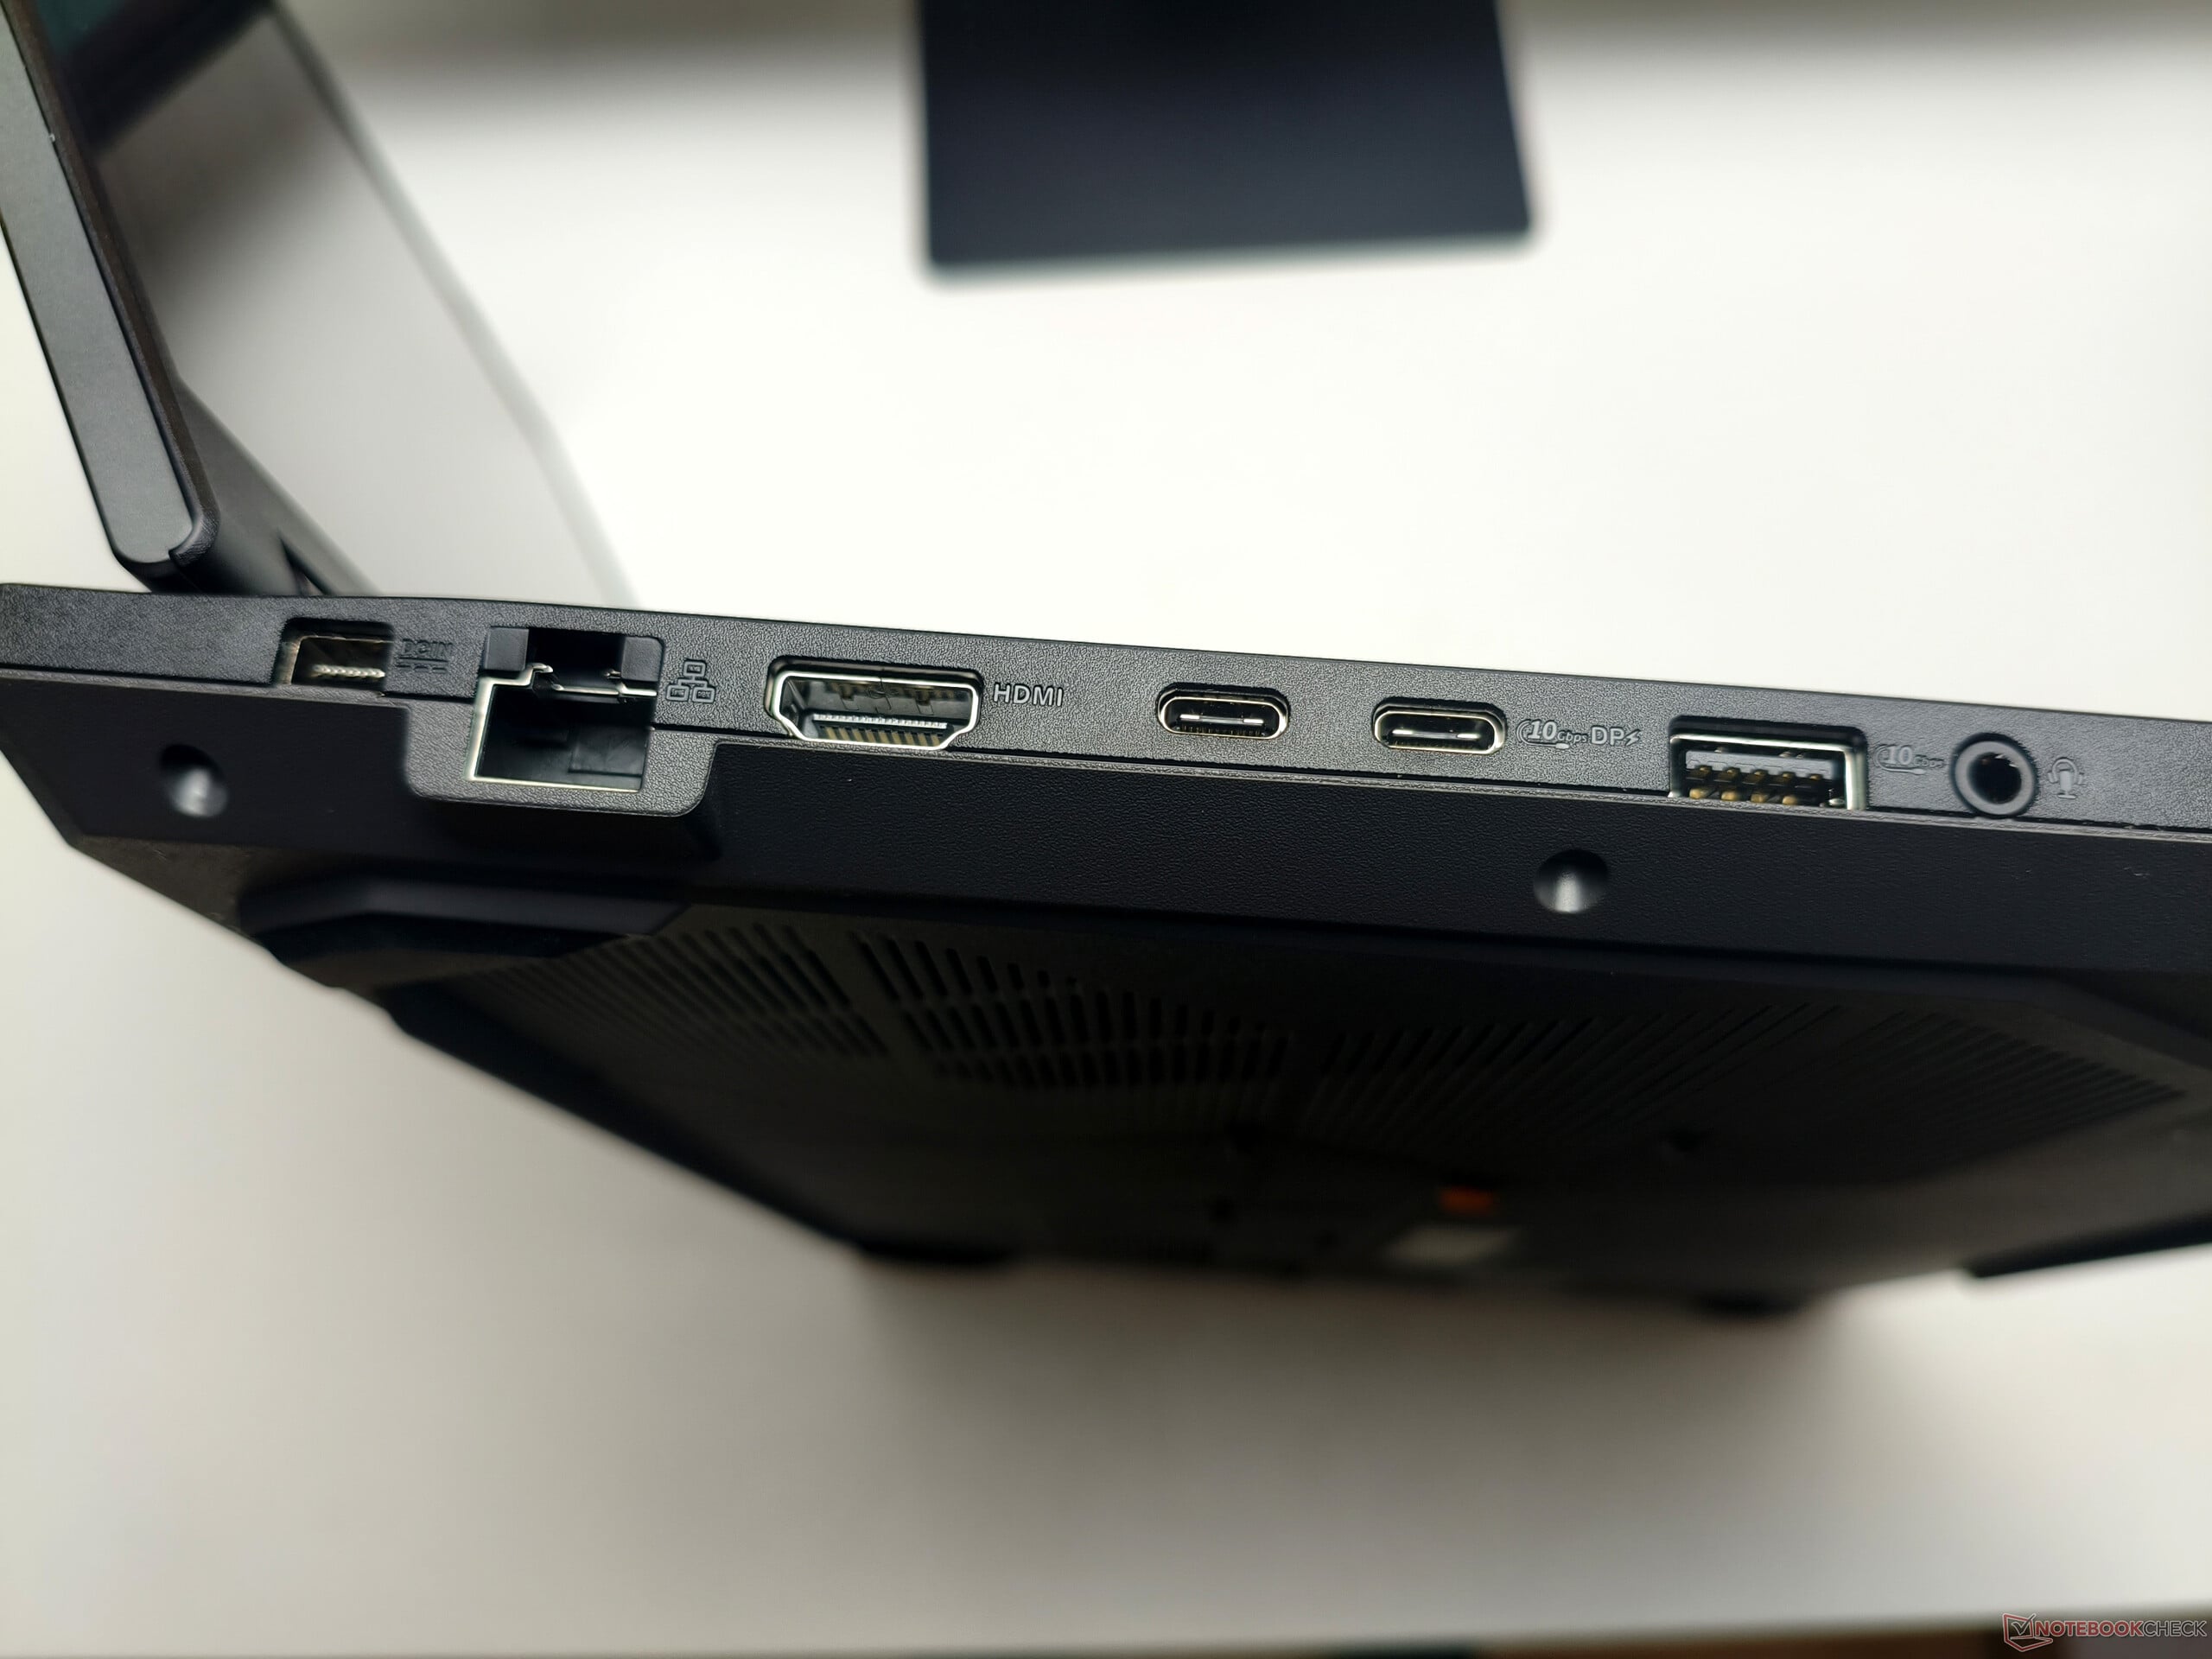
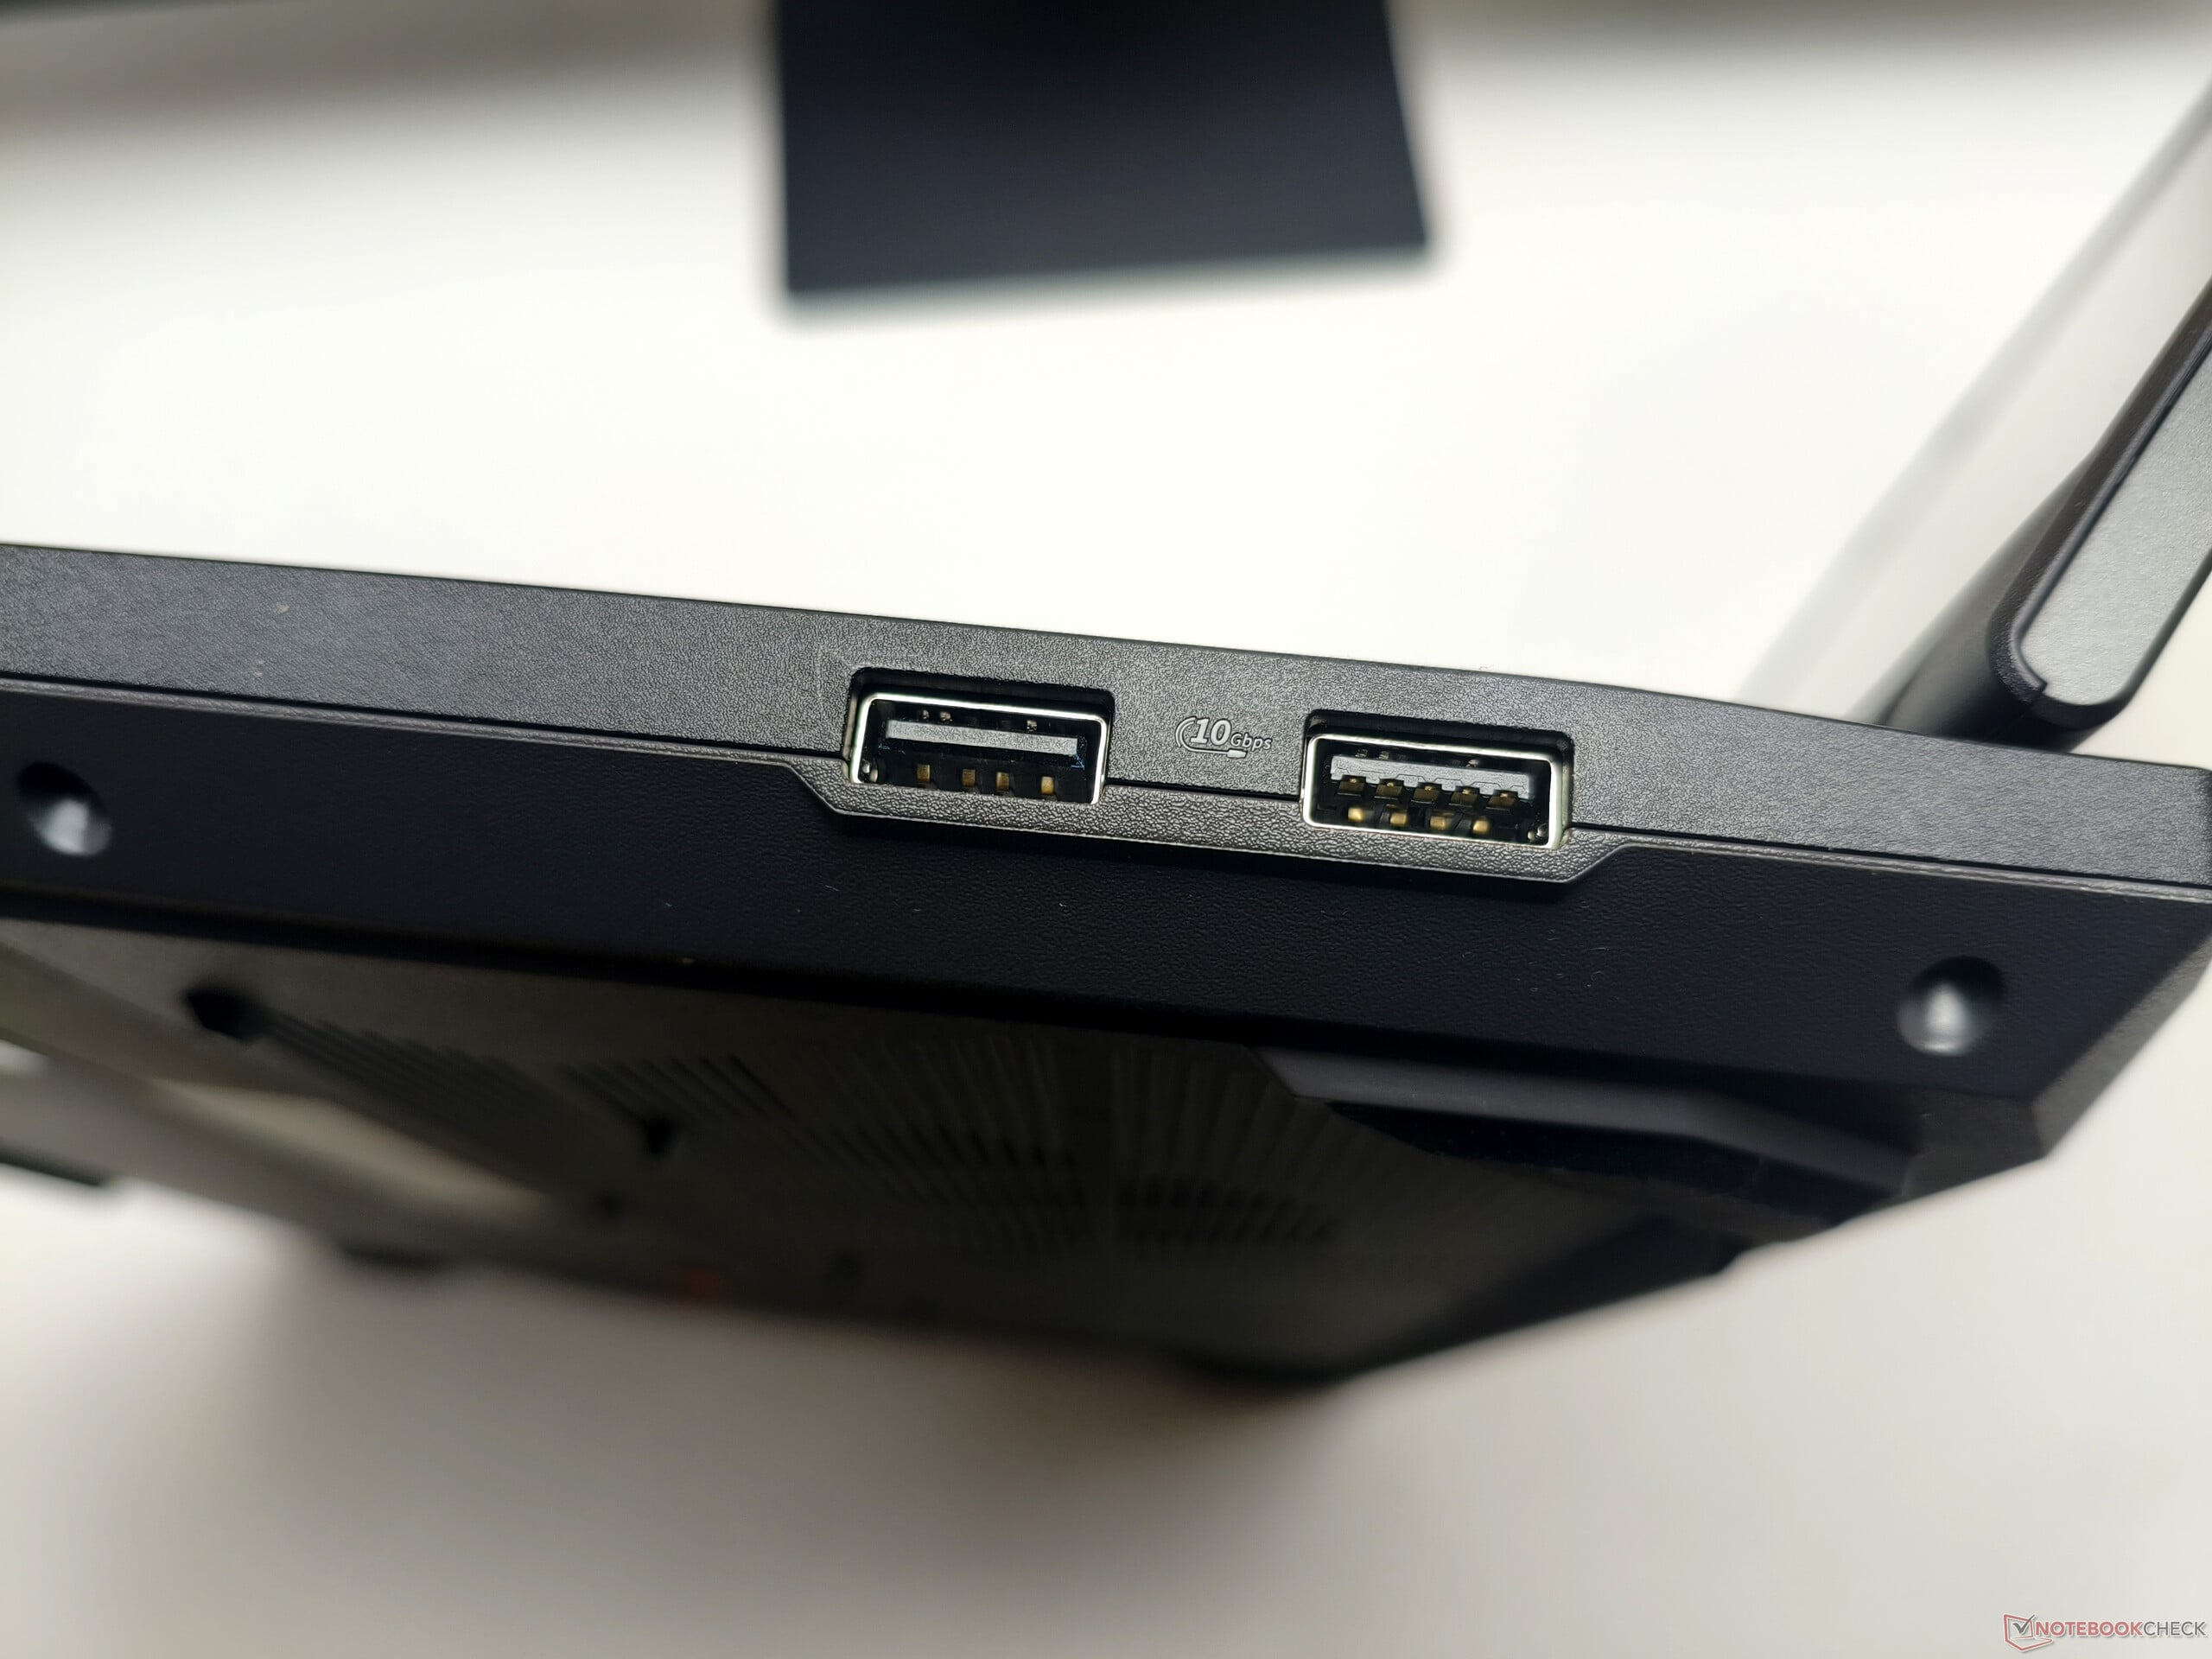
这款做工精良的机身主要由塑料制成,其出色的刚性与宽大的掌托令人印象深刻。其转轴可打开至180度,这在游戏本中仍属罕见。这款华硕设备的重量不到2.7公斤,比许多同类产品都要轻。该 宏碁 Nitro 18 AI 和 微星Crosshair 18 HX,其重量均在3公斤或以上。拆下十一颗十字螺丝后即可打开机身。散热系统由两个风扇和多根热管组成。两个内存插槽均已被占用,而两个M.2插槽中仍有其中一个处于空闲状态。在输入设备方面,那块尺寸巨大的15×10厘米触控板尤为令人印象深刻。 键盘配备RGB背光和实用的专用音量键。接口配置包括五个USB端口,其中一个USB-C端口支持USB4。该机型未配备读卡器。尽管无线模块仅支持Wi-Fi 6E而非Wi-Fi 7,但我们的测试数据显示,其传输速度依然相当可观。 全高清网络摄像头拍摄的图像和视频效果尚可,尽管表现并非完全令人信服。包装盒内附带一个240 W电源适配器。
| Networking | |
| iperf3 transmit Wi-Fi6/7 RT-BE96U | |
| Average of class Gaming (718 - 4473, n=11, last 2 years) | |
| Asus TUF Gaming A18 FA808UM | |
| Average MediaTek Wi-Fi 6E MT7922 160MHz Wireless LAN Card (973 - 1953, n=4) | |
| Lenovo LOQ 15AHP11 | |
| iperf3 receive Wi-Fi6/7 RT-BE96U | |
| Average of class Gaming (788 - 3208, n=11, last 2 years) | |
| Asus TUF Gaming A18 FA808UM | |
| Average MediaTek Wi-Fi 6E MT7922 160MHz Wireless LAN Card (1498 - 1910, n=4) | |
| Lenovo LOQ 15AHP11 | |


显示
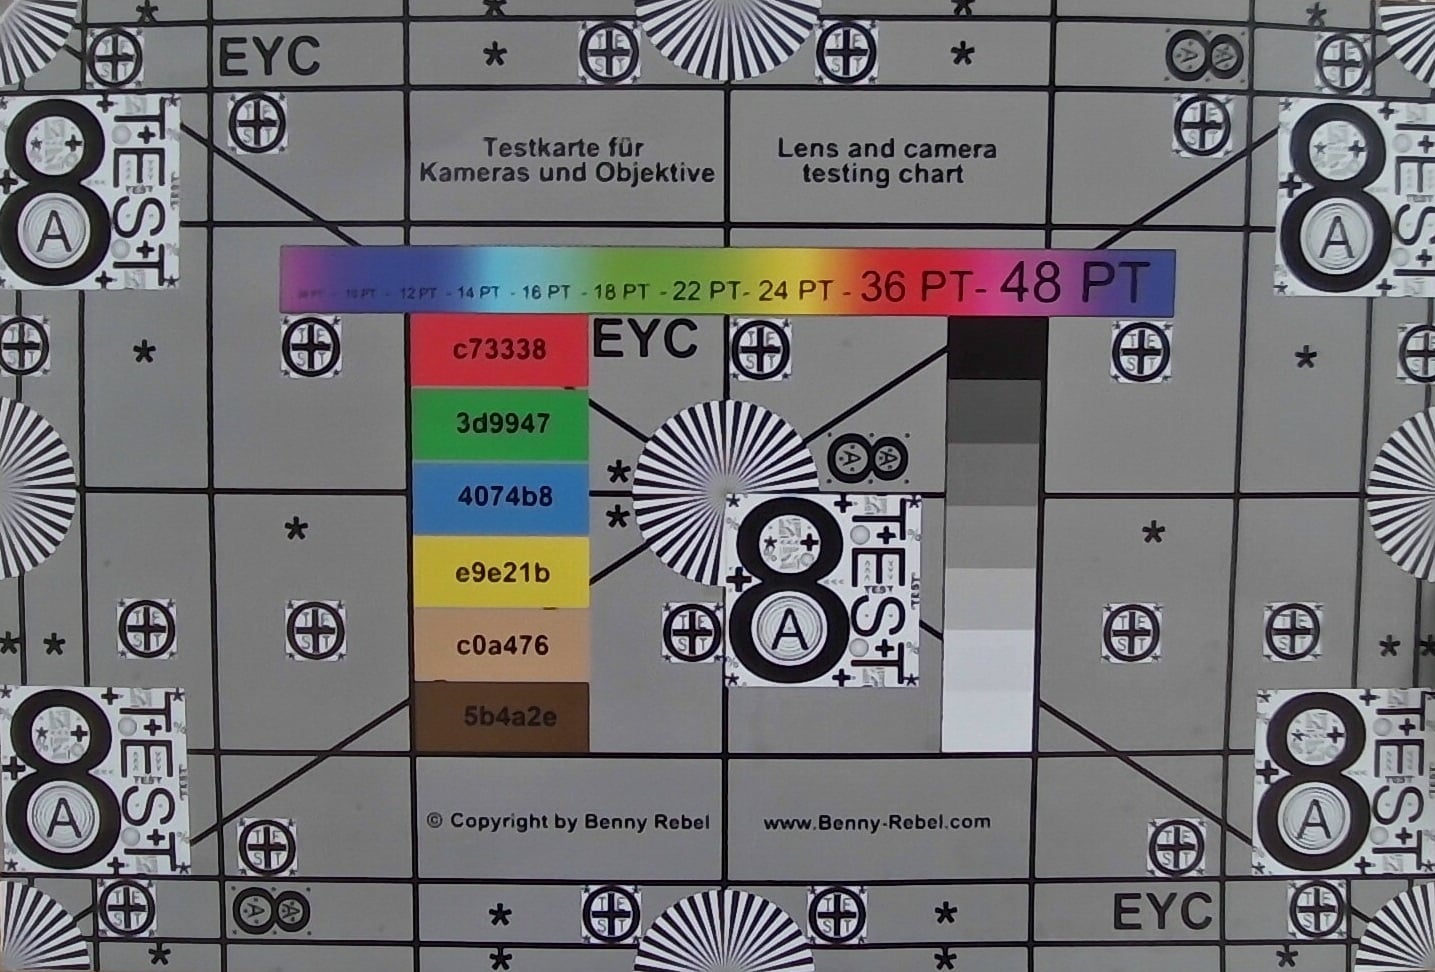
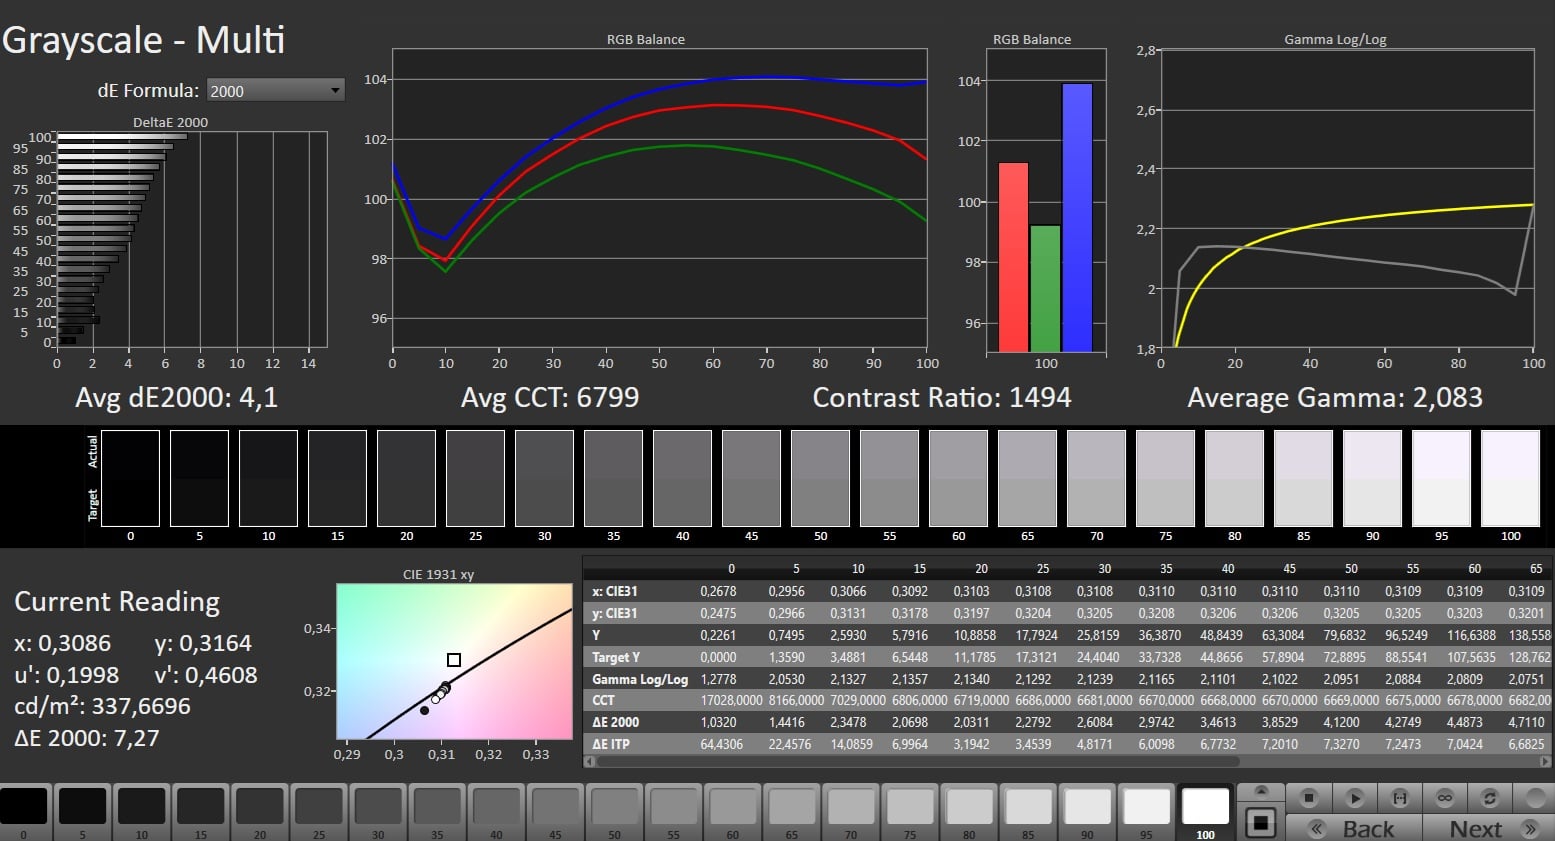
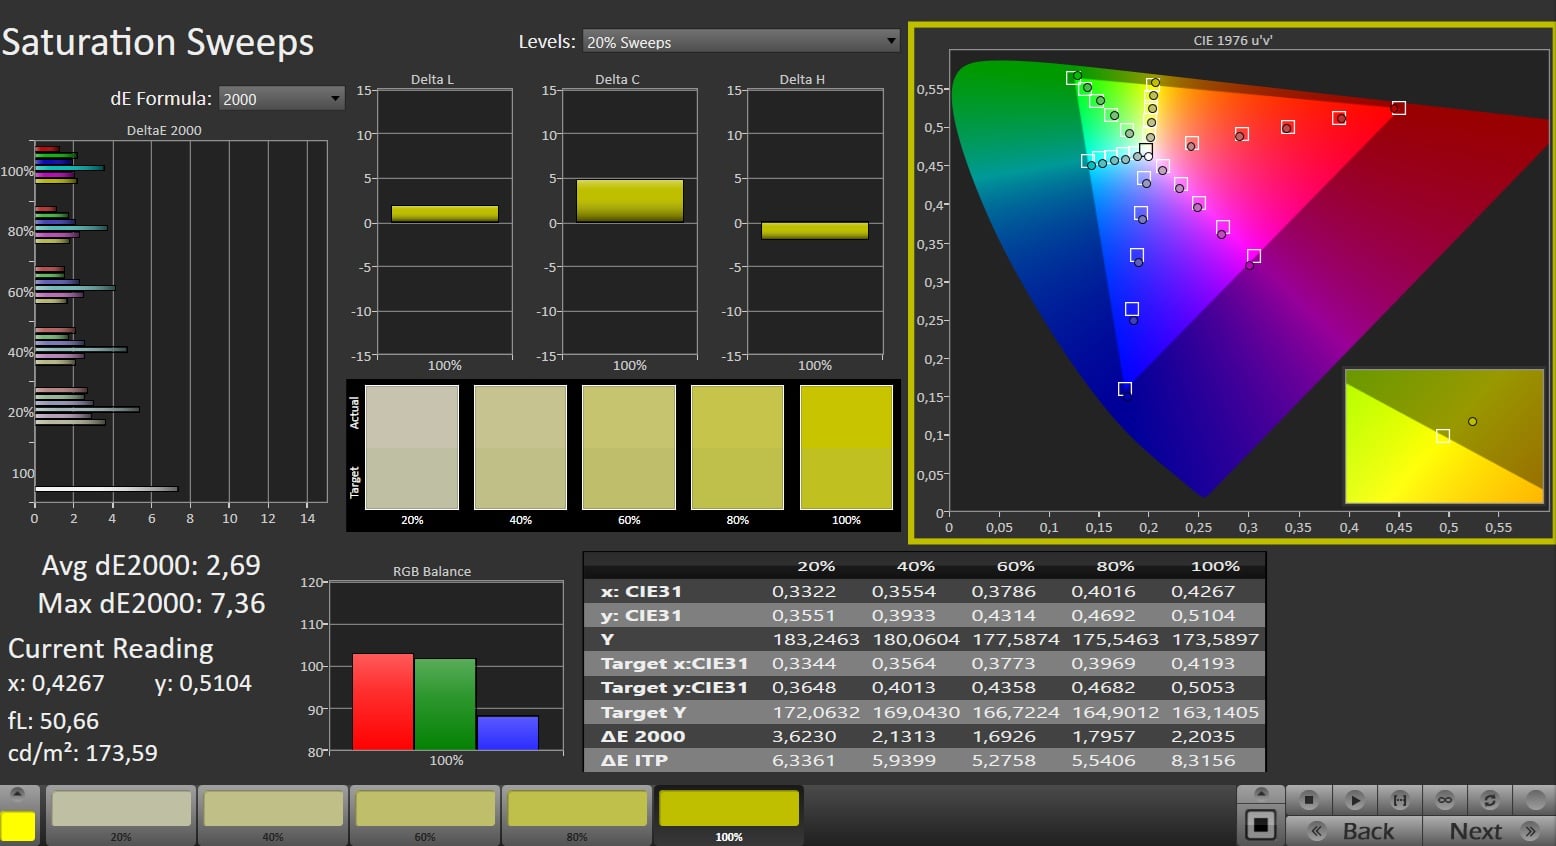
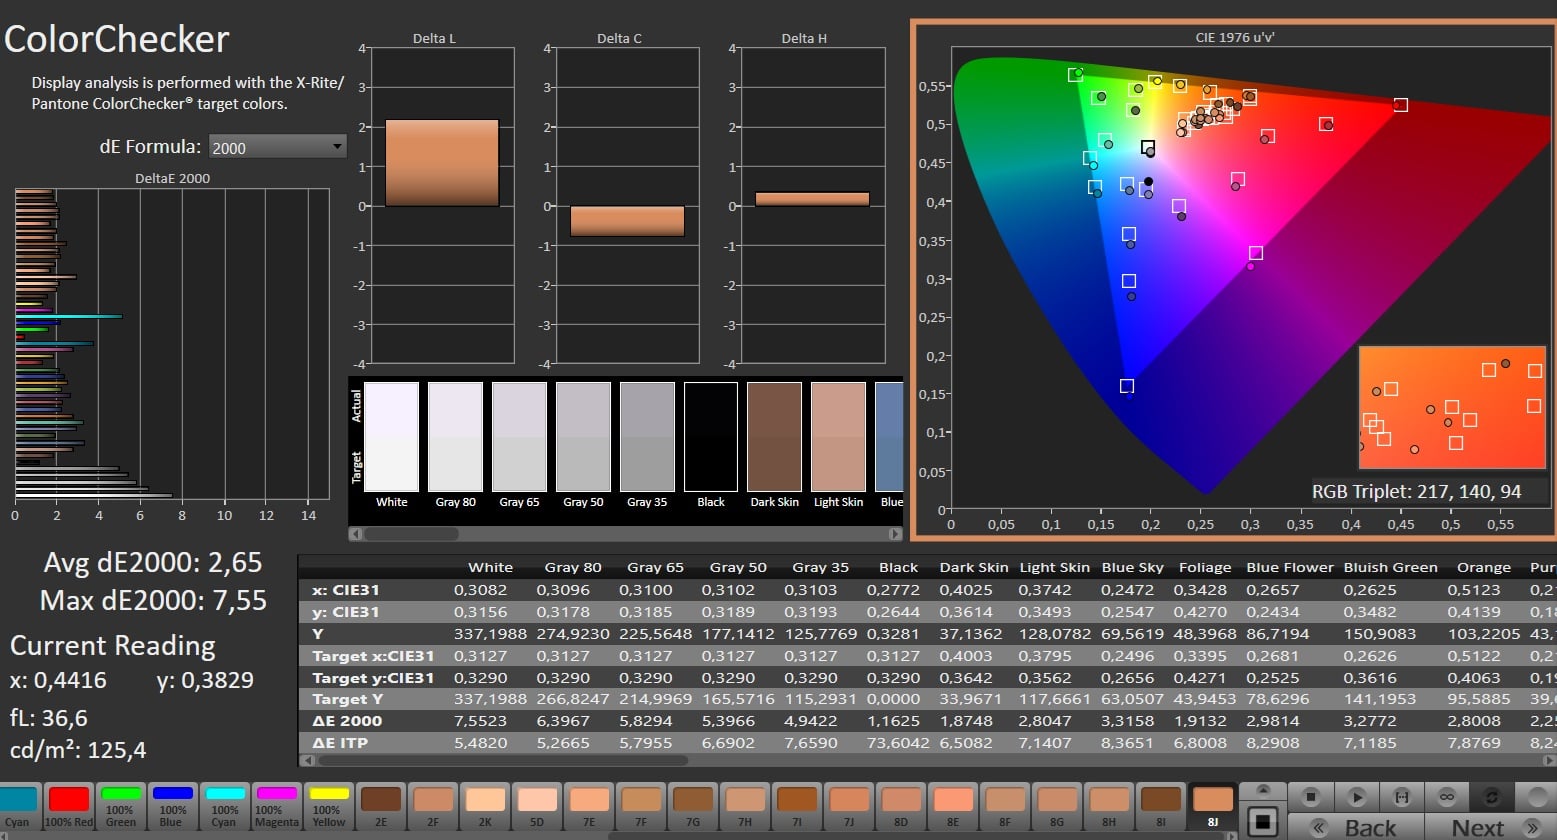
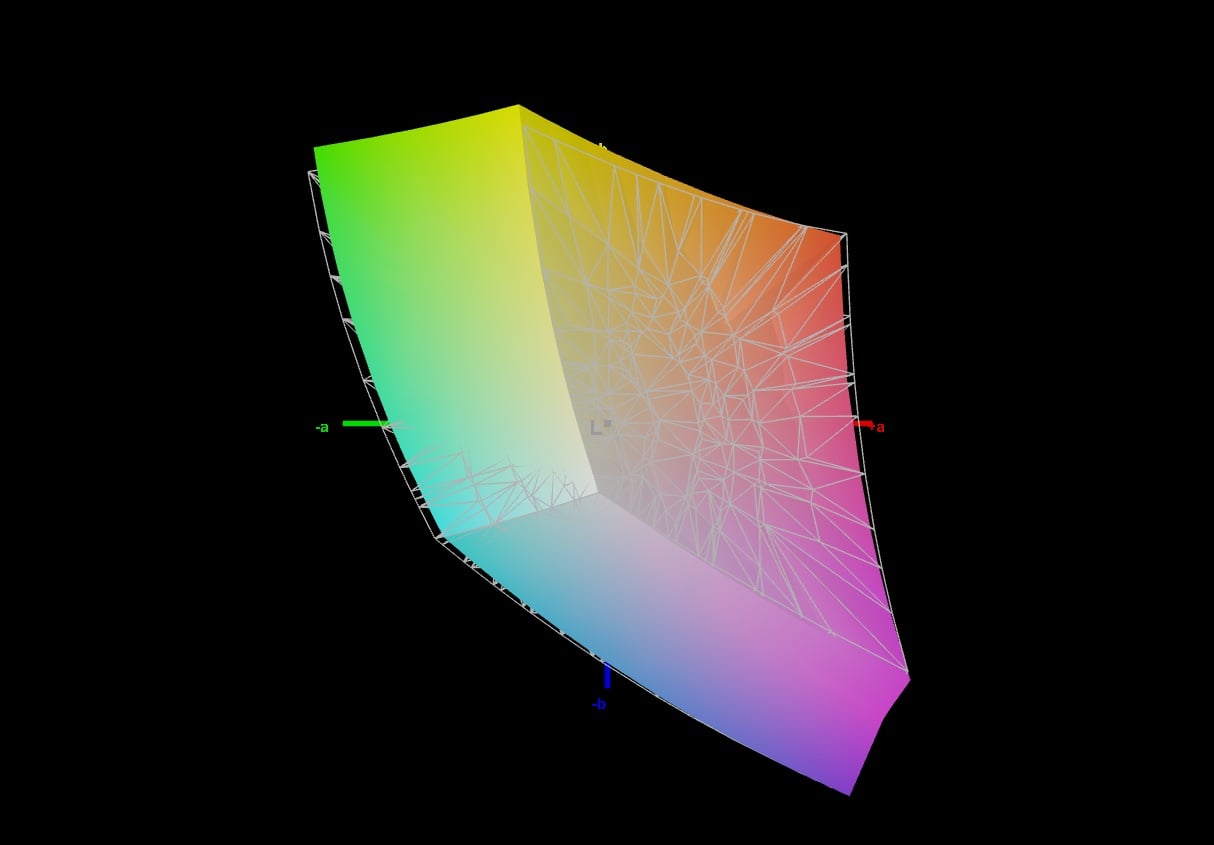
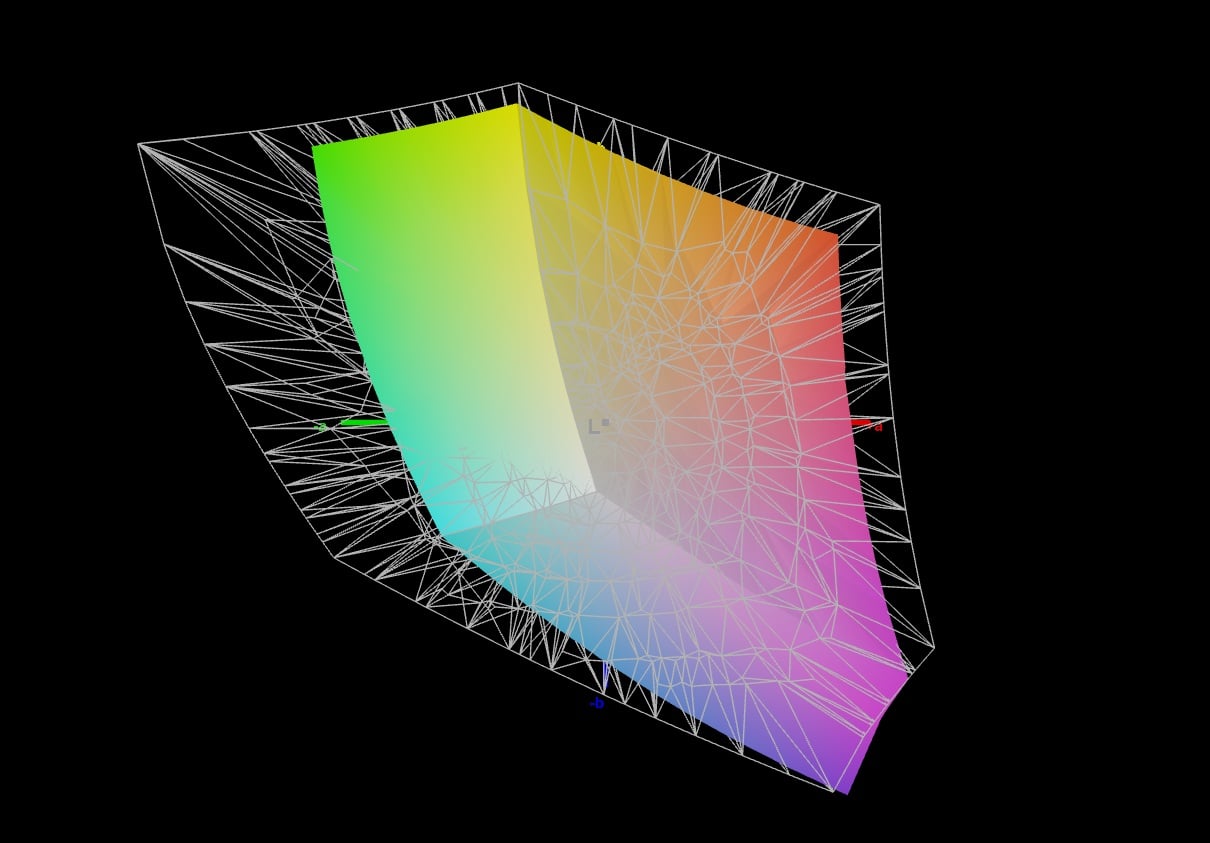
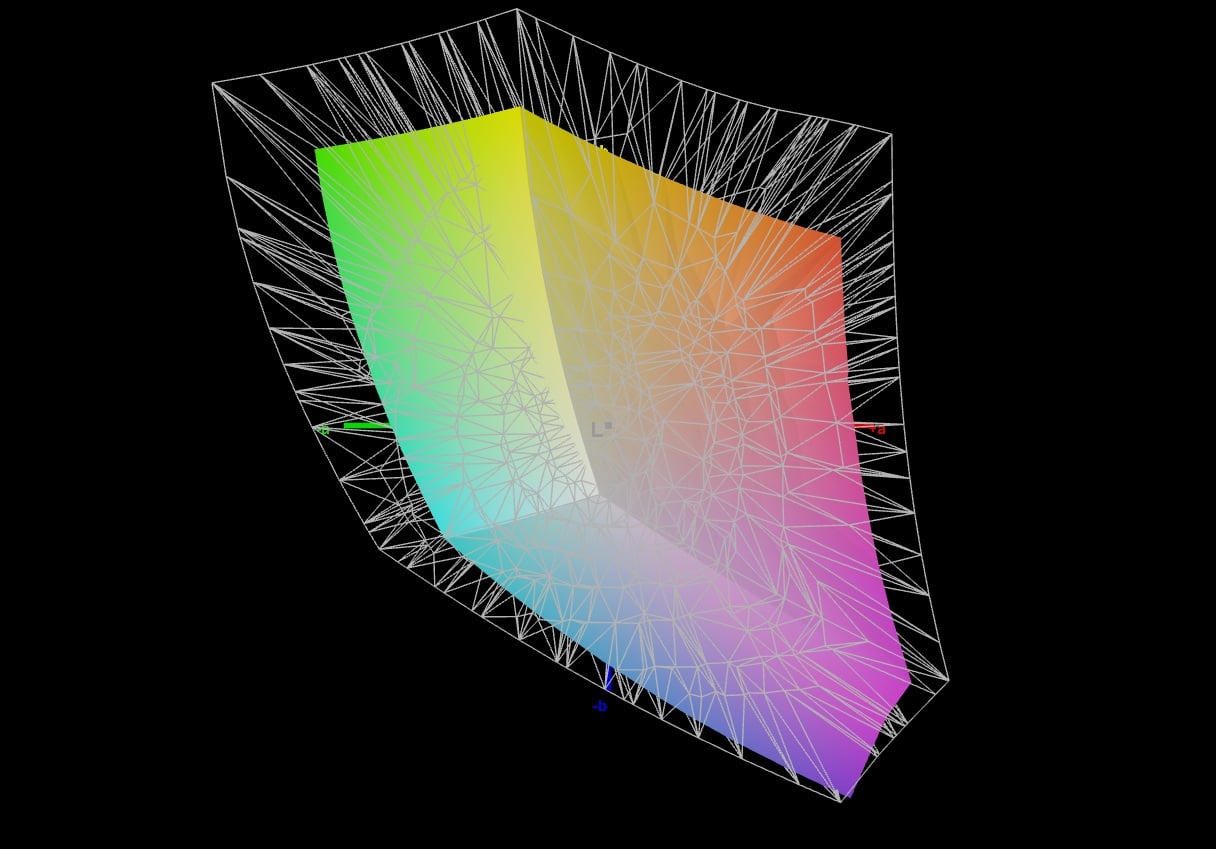
这款16:10、144 Hz的显示屏表现平平,与TUF Gaming A18的RTX 5070版本所采用的面板完全相同。该IPS面板亮度尚可,但平均亮度仅为323 cd/m²,因此仅在有限程度上适合户外使用。 对比度超过1,400:1,sRGB色域覆盖率几乎达到100%。可视角度和响应时间也符合IPS面板的一般预期。我们未检测到通常与OLED面板相关的屏幕闪烁现象。
| |||||||||||||||||||||||||
Brightness Distribution: 93 %
Center on Battery: 325 cd/m²
Contrast: 1413:1 (Black: 0.23 cd/m²)
ΔE ColorChecker Calman: 2.65 | ∀{0.5-29.43 Ø4.69}
ΔE Greyscale Calman: 4.1 | ∀{0.09-98 Ø4.94}
68.4% AdobeRGB 1998 (Argyll 3D)
96.6% sRGB (Argyll 3D)
66.7% Display P3 (Argyll 3D)
Gamma: 2.083
CCT: 6799 K
| Asus TUF Gaming A18 FA808UM NE180WUM-NY3, IPS, 1920x1200, 18", 144 Hz | MSI Cyborg 17 B13WFKG BOEhydis NV173FHM-NX4, IPS, 1920x1080, 17.3", 144 Hz | Acer Nitro 18 AI AN18-61-R10V BOEhydis NE180QDM-NY1, IPS, 2560x1600, 18", 165 Hz | Asus ROG Strix G18 2025 G814 NE180QDM-NZC, IPS, 2560x1600, 18", 240 Hz | MSI Crosshair 18 HX AI A2XW BOE NE180QDM-NZ4, IPS, 2560x1600, 18", 240 Hz | Asus TUF Gaming A18 FA808UP-S8022W NE180WUM-NY3 (BOE0CEF), IPS, 1920x1200, 18", 144 Hz | |
|---|---|---|---|---|---|---|
| Display | -49% | 24% | 27% | 26% | 2% | |
| Display P3 Coverage (%) | 66.7 | 33.7 -49% | 97.2 46% | 99.4 49% | 98 47% | 69.3 4% |
| sRGB Coverage (%) | 96.6 | 50.7 -48% | 99.9 3% | 100 4% | 100 4% | 98.1 2% |
| AdobeRGB 1998 Coverage (%) | 68.4 | 34.8 -49% | 84.8 24% | 87.7 28% | 86.1 26% | 67.9 -1% |
| Response Times | -172% | -12% | 35% | 0% | -27% | |
| Response Time Grey 50% / Grey 80% * (ms) | 6.2 ? | 21.9 ? -253% | 6.8 ? -10% | 3.8 ? 39% | 4.7 ? 24% | 8 ? -29% |
| Response Time Black / White * (ms) | 8.3 ? | 15.8 ? -90% | 9.4 ? -13% | 5.8 ? 30% | 10.3 ? -24% | 10.4 ? -25% |
| PWM Frequency (Hz) | ||||||
| Screen | -37% | -18% | 30% | -8% | -4% | |
| Brightness middle (cd/m²) | 325 | 274 -16% | 317 -2% | 582 79% | 581.4 79% | 351 8% |
| Brightness (cd/m²) | 323 | 252 -22% | 288 -11% | 557 72% | 534 65% | 332 3% |
| Brightness Distribution (%) | 93 | 85 -9% | 87 -6% | 93 0% | 84 -10% | 89 -4% |
| Black Level * (cd/m²) | 0.23 | 0.29 -26% | 0.28 -22% | 0.4 -74% | 0.46 -100% | 0.26 -13% |
| Contrast (:1) | 1413 | 945 -33% | 1132 -20% | 1455 3% | 1264 -11% | 1350 -4% |
| Colorchecker dE 2000 * | 2.65 | 5.19 -96% | 5.16 -95% | 1.4 47% | 3.89 -47% | 2.89 -9% |
| Colorchecker dE 2000 max. * | 7.55 | 19.99 -165% | 0.75 90% | 3.4 55% | 7.94 -5% | 7.91 -5% |
| Greyscale dE 2000 * | 4.1 | 1.2 71% | 7.4 -80% | 1.8 56% | 5.6 -37% | 4.46 -9% |
| Gamma | 2.083 106% | 2.121 104% | 2.093 105% | 2.24 98% | 2.1 105% | 2.46 89% |
| CCT | 6799 96% | 6597 99% | 6553 99% | 6633 98% | 6835 95% | 7132 91% |
| Colorchecker dE 2000 calibrated * | 5.02 | 2.42 | 0.7 | 0.97 | 0.93 | |
| Total Average (Program / Settings) | -86% /
-60% | -2% /
-7% | 31% /
30% | 6% /
1% | -10% /
-6% |
* ... smaller is better
Display Response Times
| ↔ Response Time Black to White | ||
|---|---|---|
| 8.3 ms ... rise ↗ and fall ↘ combined | ↗ 4.1 ms rise | 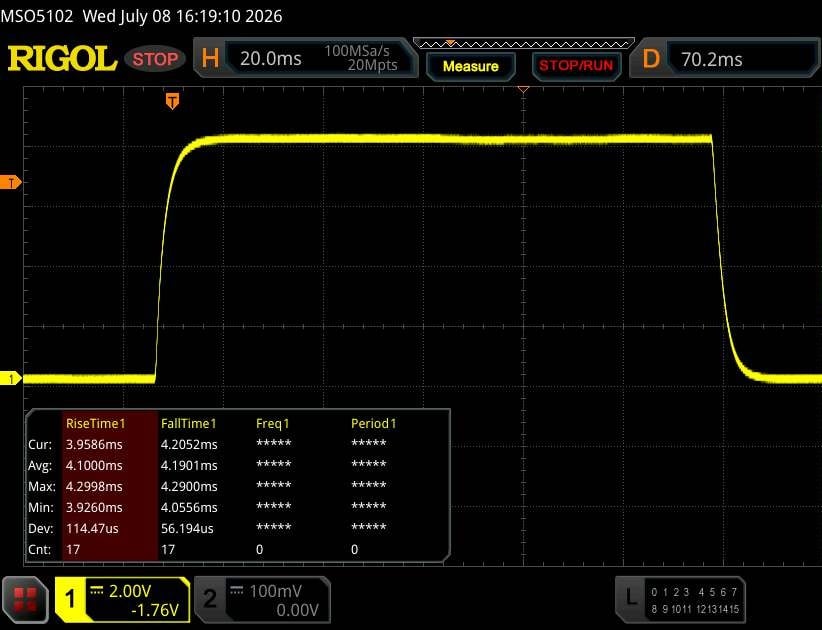 |
| ↘ 4.2 ms fall | ||
| The screen shows fast response rates in our tests and should be suited for gaming. In comparison, all tested devices range from 0.1 (minimum) to 240 (maximum) ms. » 24 % of all devices are better. This means that the measured response time is better than the average of all tested devices (19.6 ms). | ||
| ↔ Response Time 50% Grey to 80% Grey | ||
| 6.2 ms ... rise ↗ and fall ↘ combined | ↗ 2.7 ms rise | 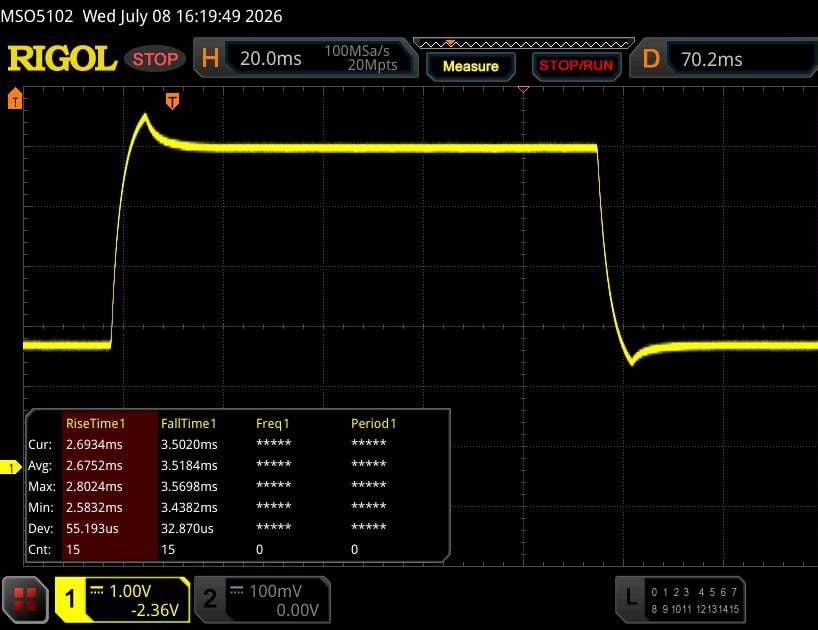 |
| ↘ 3.5 ms fall | ||
| The screen shows very fast response rates in our tests and should be very well suited for fast-paced gaming. In comparison, all tested devices range from 0.13 (minimum) to 636 (maximum) ms. » 20 % of all devices are better. This means that the measured response time is better than the average of all tested devices (30.7 ms). | ||
Screen Flickering / PWM (Pulse-Width Modulation)
| Screen flickering / PWM not detected | 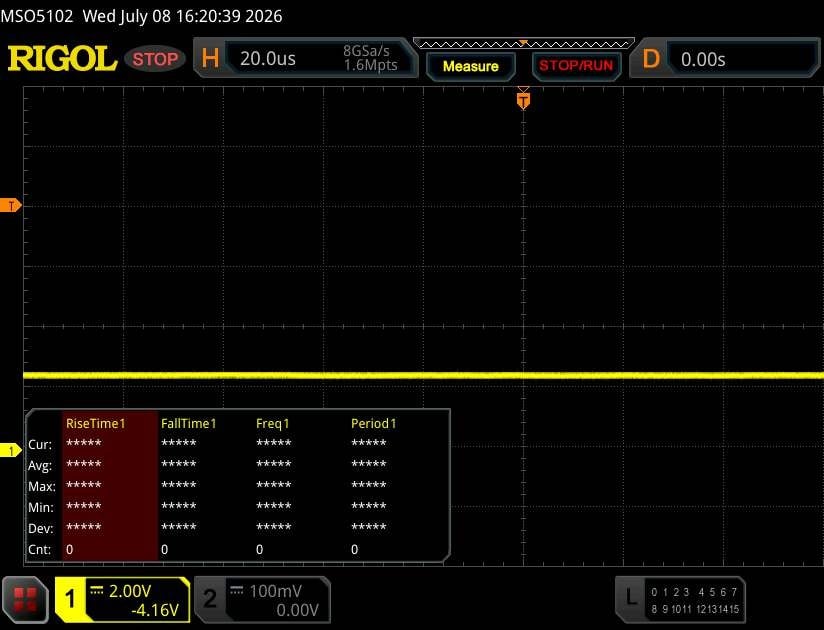 | ||
In comparison: 52 % of all tested devices do not use PWM to dim the display. If PWM was detected, an average of 7594 (minimum: 5 - maximum: 343500) Hz was measured. | |||
性能
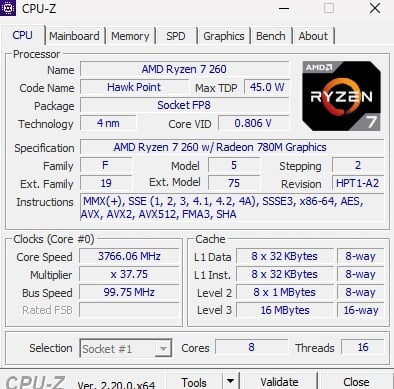
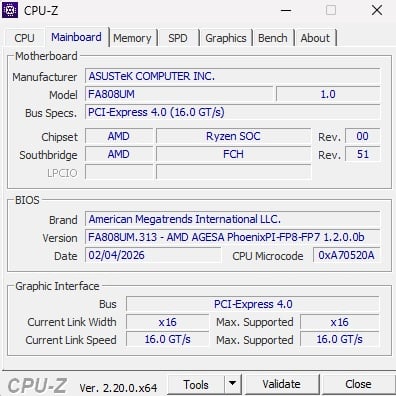
RTX 5060 的性能非常适合中端市场。虽然其处理器在一段时间内仍能保持良好性能,但 8 GB 的显存在某些情况下已开始显现瓶颈。
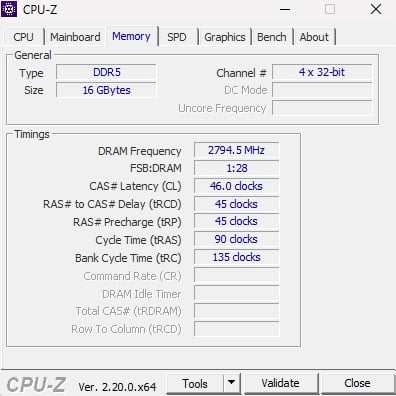
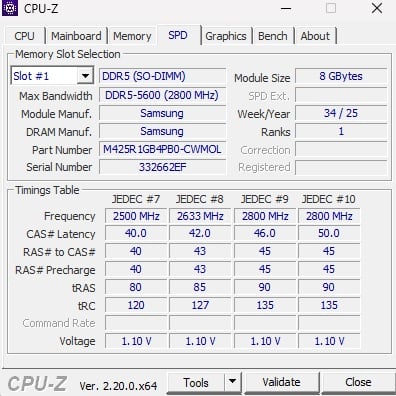
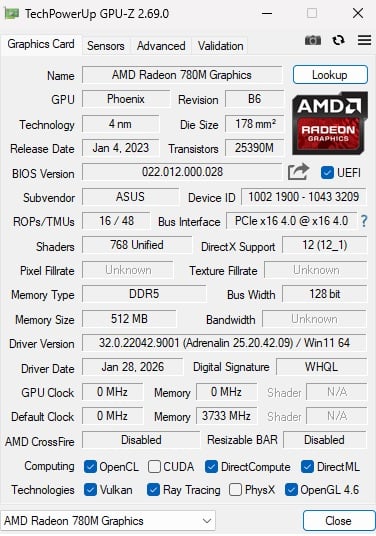
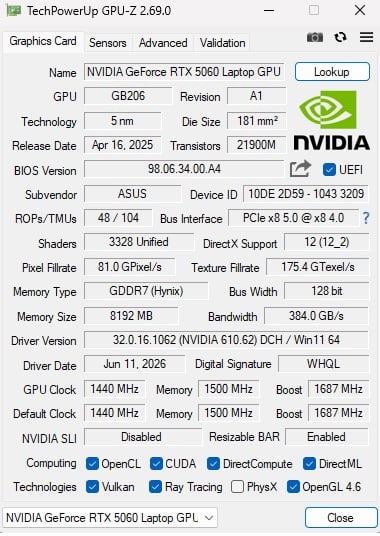
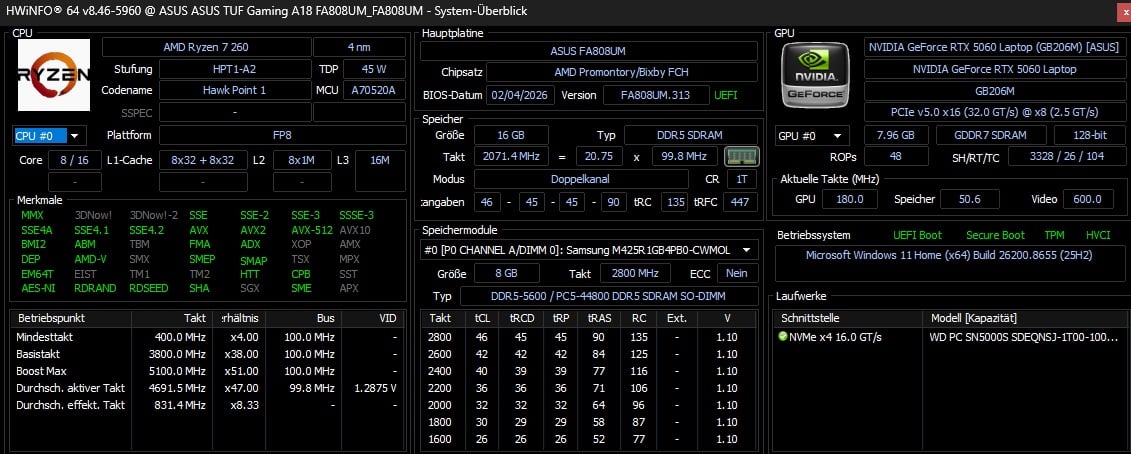
测试条件
与往常一样,华硕 Armoury Crate 提供了多种性能配置文件。与 RTX 5070 配置相同,我们所有的测试均在“性能”模式下进行。各模式之间的差异如下表所示。
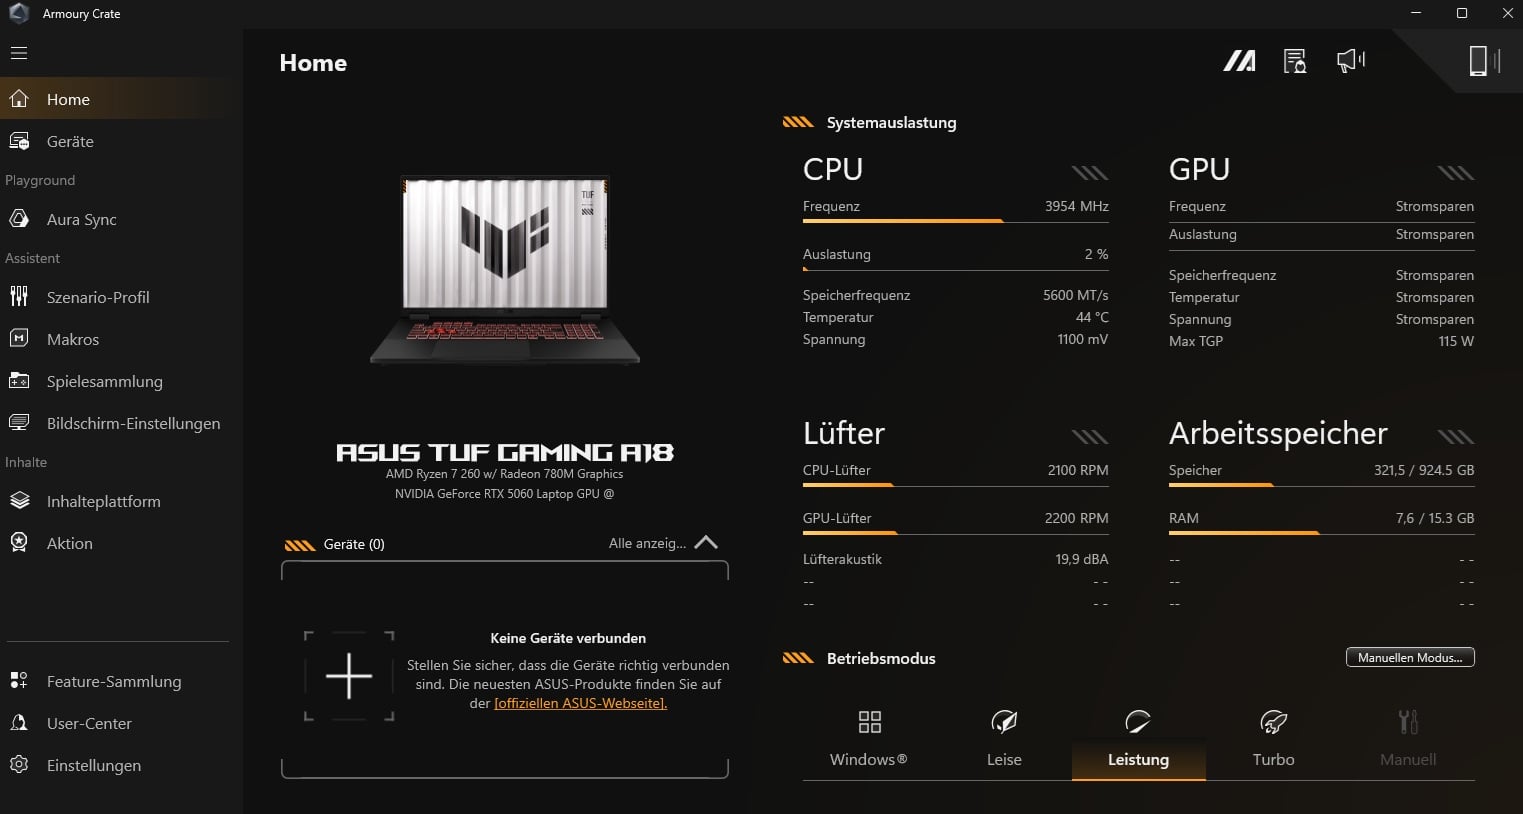
| 模式 | 静音 | 性能 | 涡轮 |
| 《赛博朋克2077》噪音 | 40 dB(A) | 43 dB(A) | 55 dB(A) |
| 《赛博朋克2077》帧率(FHD/极高画质) | 73.2 fps | 85.8 fps | 95.6 fps |
| GPU功耗 | 55 W | 80 W | 105 W |
| CPU PL1 | 54 W | 70 W | 80 W |
| CPU PL2 | 65 W | 80 W | 80 W |
| Cinebench R15 多核得分 | 2565 分 | 2742 分 | 2744 分 |
处理器性能
AMD的 锐龙 7 260 是 Zen 4 架构下一款性能相当强劲的八核处理器,最多可同时处理 16 个线程。在我们的 CPU 基准测试套件中,这款 4 纳米芯片表现出了非常稳定的性能,其整体水平大致与更新款的 锐龙 AI 7 350大致相当。
Cinebench R15 多核耐力测试
* ... smaller is better
AIDA64: FP32 Ray-Trace | FPU Julia | CPU SHA3 | FPU SinJulia | FPU Mandel | CPU AES | CPU ZLib | FP64 Ray-Trace | CPU PhotoWorxx
| Performance rating | |
| Asus ROG Strix G18 2025 G814 | |
| MSI Crosshair 18 HX AI A2XW | |
| Average of class Gaming | |
| Asus TUF Gaming A18 FA808UP-S8022W | |
| Asus TUF Gaming A18 FA808UM | |
| Average AMD Ryzen 7 260 | |
| Acer Nitro 18 AI AN18-61-R10V | |
| MSI Cyborg 17 B13WFKG | |
| AIDA64 / FP32 Ray-Trace | |
| Asus ROG Strix G18 2025 G814 (v6.92.6600) | |
| MSI Crosshair 18 HX AI A2XW (v6.92.6600) | |
| Average of class Gaming (10227 - 85542, n=102, last 2 years) | |
| Acer Nitro 18 AI AN18-61-R10V (v6.92.6600) | |
| Asus TUF Gaming A18 FA808UM (v8.20.8100) | |
| Average AMD Ryzen 7 260 (25995 - 29330, n=6) | |
| Asus TUF Gaming A18 FA808UP-S8022W (v6.92.6600) | |
| MSI Cyborg 17 B13WFKG (v6.92.6600) | |
| AIDA64 / FPU Julia | |
| Asus ROG Strix G18 2025 G814 (v6.92.6600) | |
| MSI Crosshair 18 HX AI A2XW (v6.92.6600) | |
| Average of class Gaming (51376 - 372155, n=102, last 2 years) | |
| Asus TUF Gaming A18 FA808UP-S8022W (v6.92.6600) | |
| Asus TUF Gaming A18 FA808UM (v8.20.8100) | |
| Average AMD Ryzen 7 260 (106250 - 121427, n=6) | |
| Acer Nitro 18 AI AN18-61-R10V (v6.92.6600) | |
| MSI Cyborg 17 B13WFKG (v6.92.6600) | |
| AIDA64 / CPU SHA3 | |
| Asus ROG Strix G18 2025 G814 (v6.92.6600) | |
| MSI Crosshair 18 HX AI A2XW (v6.92.6600) | |
| Average of class Gaming (2180 - 10115, n=102, last 2 years) | |
| Asus TUF Gaming A18 FA808UP-S8022W (v6.92.6600) | |
| Asus TUF Gaming A18 FA808UM (v8.20.8100) | |
| Average AMD Ryzen 7 260 (4636 - 5026, n=6) | |
| Acer Nitro 18 AI AN18-61-R10V (v6.92.6600) | |
| MSI Cyborg 17 B13WFKG (v6.92.6600) | |
| AIDA64 / FPU SinJulia | |
| Asus ROG Strix G18 2025 G814 (v6.92.6600) | |
| Asus TUF Gaming A18 FA808UP-S8022W (v6.92.6600) | |
| Asus TUF Gaming A18 FA808UM (v8.20.8100) | |
| Average AMD Ryzen 7 260 (14810 - 15497, n=6) | |
| Average of class Gaming (4424 - 33636, n=102, last 2 years) | |
| Acer Nitro 18 AI AN18-61-R10V (v6.92.6600) | |
| MSI Crosshair 18 HX AI A2XW (v6.92.6600) | |
| MSI Cyborg 17 B13WFKG (v6.92.6600) | |
| AIDA64 / FPU Mandel | |
| Asus ROG Strix G18 2025 G814 (v6.92.6600) | |
| MSI Crosshair 18 HX AI A2XW (v6.92.6600) | |
| Average of class Gaming (25115 - 196829, n=102, last 2 years) | |
| Asus TUF Gaming A18 FA808UM (v8.20.8100) | |
| Asus TUF Gaming A18 FA808UP-S8022W (v6.92.6600) | |
| Average AMD Ryzen 7 260 (56974 - 65308, n=6) | |
| Acer Nitro 18 AI AN18-61-R10V (v6.92.6600) | |
| MSI Cyborg 17 B13WFKG (v6.92.6600) | |
| AIDA64 / CPU AES | |
| Asus ROG Strix G18 2025 G814 (v6.92.6600) | |
| MSI Crosshair 18 HX AI A2XW (v6.92.6600) | |
| Average of class Gaming (39258 - 247074, n=102, last 2 years) | |
| Asus TUF Gaming A18 FA808UM (v8.20.8100) | |
| Asus TUF Gaming A18 FA808UP-S8022W (v6.92.6600) | |
| Acer Nitro 18 AI AN18-61-R10V (v6.92.6600) | |
| Average AMD Ryzen 7 260 (66825 - 91381, n=6) | |
| MSI Cyborg 17 B13WFKG (v6.92.6600) | |
| AIDA64 / CPU ZLib | |
| Asus ROG Strix G18 2025 G814 (v6.92.6600) | |
| MSI Crosshair 18 HX AI A2XW (v6.92.6600) | |
| Average of class Gaming (574 - 2531, n=102, last 2 years) | |
| Acer Nitro 18 AI AN18-61-R10V (v6.92.6600) | |
| Asus TUF Gaming A18 FA808UP-S8022W (v6.92.6600) | |
| Asus TUF Gaming A18 FA808UM (v8.20.8100) | |
| Average AMD Ryzen 7 260 (1039 - 1133, n=6) | |
| MSI Cyborg 17 B13WFKG (v6.92.6600) | |
| AIDA64 / FP64 Ray-Trace | |
| Asus ROG Strix G18 2025 G814 (v6.92.6600) | |
| MSI Crosshair 18 HX AI A2XW (v6.92.6600) | |
| Average of class Gaming (5509 - 45446, n=102, last 2 years) | |
| Asus TUF Gaming A18 FA808UP-S8022W (v6.92.6600) | |
| Acer Nitro 18 AI AN18-61-R10V (v6.92.6600) | |
| Average AMD Ryzen 7 260 (13944 - 15751, n=6) | |
| Asus TUF Gaming A18 FA808UM (v8.20.8100) | |
| MSI Cyborg 17 B13WFKG (v6.92.6600) | |
| AIDA64 / CPU PhotoWorxx | |
| MSI Crosshair 18 HX AI A2XW (v6.92.6600) | |
| Average of class Gaming (12271 - 89891, n=102, last 2 years) | |
| Asus ROG Strix G18 2025 G814 (v6.92.6600) | |
| Asus TUF Gaming A18 FA808UP-S8022W (v6.92.6600) | |
| Average AMD Ryzen 7 260 (23097 - 40796, n=6) | |
| Asus TUF Gaming A18 FA808UM (v8.20.8100) | |
| Acer Nitro 18 AI AN18-61-R10V (v6.92.6600) | |
| MSI Cyborg 17 B13WFKG (v6.92.6600) | |
系统和存储性能
在系统性能方面,这款笔记本也处于中低端水平。遗憾的是,与搭载 RTX 5070 的机型一样,内置的 1 TB SSD 在处理较重的工作负载时会出现性能下降的情况。
PCMark 10: Score | Essentials | Productivity | Digital Content Creation
CrossMark: Overall | Productivity | Creativity | Responsiveness
WebXPRT 3: Overall
WebXPRT 4: Overall
Mozilla Kraken 1.1: Total
| Performance rating | |
| Asus ROG Strix G18 2025 G814 | |
| Acer Nitro 18 AI AN18-61-R10V -1! | |
| MSI Crosshair 18 HX AI A2XW | |
| Average of class Gaming | |
| Average AMD Ryzen 7 260, NVIDIA GeForce RTX 5060 Laptop | |
| Asus TUF Gaming A18 FA808UM | |
| Asus TUF Gaming A18 FA808UP-S8022W | |
| MSI Cyborg 17 B13WFKG | |
| PCMark 10 / Score | |
| Acer Nitro 18 AI AN18-61-R10V | |
| Asus ROG Strix G18 2025 G814 | |
| Average of class Gaming (5828 - 12414, n=93, last 2 years) | |
| Asus TUF Gaming A18 FA808UM | |
| Average AMD Ryzen 7 260, NVIDIA GeForce RTX 5060 Laptop (8241 - 8567, n=2) | |
| MSI Crosshair 18 HX AI A2XW | |
| MSI Cyborg 17 B13WFKG | |
| Asus TUF Gaming A18 FA808UP-S8022W | |
| PCMark 10 / Essentials | |
| Asus ROG Strix G18 2025 G814 | |
| MSI Crosshair 18 HX AI A2XW | |
| Average of class Gaming (8810 - 12187, n=97, last 2 years) | |
| Acer Nitro 18 AI AN18-61-R10V | |
| Average AMD Ryzen 7 260, NVIDIA GeForce RTX 5060 Laptop (9920 - 10806, n=2) | |
| Asus TUF Gaming A18 FA808UP-S8022W | |
| Asus TUF Gaming A18 FA808UM | |
| MSI Cyborg 17 B13WFKG | |
| PCMark 10 / Productivity | |
| Acer Nitro 18 AI AN18-61-R10V | |
| Asus TUF Gaming A18 FA808UM | |
| MSI Cyborg 17 B13WFKG | |
| Average AMD Ryzen 7 260, NVIDIA GeForce RTX 5060 Laptop (10163 - 14632, n=2) | |
| Average of class Gaming (6845 - 25323, n=95, last 2 years) | |
| Asus ROG Strix G18 2025 G814 | |
| MSI Crosshair 18 HX AI A2XW | |
| Asus TUF Gaming A18 FA808UP-S8022W | |
| PCMark 10 / Digital Content Creation | |
| Average of class Gaming (7602 - 19954, n=95, last 2 years) | |
| Asus ROG Strix G18 2025 G814 | |
| MSI Crosshair 18 HX AI A2XW | |
| Average AMD Ryzen 7 260, NVIDIA GeForce RTX 5060 Laptop (11756 - 13832, n=2) | |
| Asus TUF Gaming A18 FA808UP-S8022W | |
| Acer Nitro 18 AI AN18-61-R10V | |
| Asus TUF Gaming A18 FA808UM | |
| MSI Cyborg 17 B13WFKG | |
| CrossMark / Overall | |
| Asus ROG Strix G18 2025 G814 | |
| MSI Crosshair 18 HX AI A2XW | |
| Average of class Gaming (1366 - 2409, n=95, last 2 years) | |
| Asus TUF Gaming A18 FA808UP-S8022W | |
| Average AMD Ryzen 7 260, NVIDIA GeForce RTX 5060 Laptop (1658 - 1792, n=2) | |
| Acer Nitro 18 AI AN18-61-R10V | |
| Asus TUF Gaming A18 FA808UM | |
| MSI Cyborg 17 B13WFKG | |
| CrossMark / Productivity | |
| Asus ROG Strix G18 2025 G814 | |
| MSI Crosshair 18 HX AI A2XW | |
| Average of class Gaming (1386 - 2254, n=95, last 2 years) | |
| Asus TUF Gaming A18 FA808UP-S8022W | |
| Average AMD Ryzen 7 260, NVIDIA GeForce RTX 5060 Laptop (1610 - 1712, n=2) | |
| Acer Nitro 18 AI AN18-61-R10V | |
| Asus TUF Gaming A18 FA808UM | |
| MSI Cyborg 17 B13WFKG | |
| CrossMark / Creativity | |
| Asus ROG Strix G18 2025 G814 | |
| MSI Crosshair 18 HX AI A2XW | |
| Average of class Gaming (1343 - 2786, n=95, last 2 years) | |
| Asus TUF Gaming A18 FA808UP-S8022W | |
| Acer Nitro 18 AI AN18-61-R10V | |
| Average AMD Ryzen 7 260, NVIDIA GeForce RTX 5060 Laptop (1827 - 1957, n=2) | |
| Asus TUF Gaming A18 FA808UM | |
| MSI Cyborg 17 B13WFKG | |
| CrossMark / Responsiveness | |
| MSI Crosshair 18 HX AI A2XW | |
| Asus ROG Strix G18 2025 G814 | |
| Average of class Gaming (1241 - 2334, n=95, last 2 years) | |
| Average AMD Ryzen 7 260, NVIDIA GeForce RTX 5060 Laptop (1355 - 1580, n=2) | |
| Asus TUF Gaming A18 FA808UP-S8022W | |
| Acer Nitro 18 AI AN18-61-R10V | |
| Asus TUF Gaming A18 FA808UM | |
| MSI Cyborg 17 B13WFKG | |
| WebXPRT 3 / Overall | |
| Asus ROG Strix G18 2025 G814 | |
| MSI Crosshair 18 HX AI A2XW | |
| Average of class Gaming (220 - 532, n=100, last 2 years) | |
| Acer Nitro 18 AI AN18-61-R10V | |
| Average AMD Ryzen 7 260, NVIDIA GeForce RTX 5060 Laptop (286 - 308, n=2) | |
| Asus TUF Gaming A18 FA808UP-S8022W | |
| Asus TUF Gaming A18 FA808UM | |
| MSI Cyborg 17 B13WFKG | |
| WebXPRT 4 / Overall | |
| MSI Crosshair 18 HX AI A2XW | |
| Asus ROG Strix G18 2025 G814 | |
| Average of class Gaming (165 - 354, n=100, last 2 years) | |
| Acer Nitro 18 AI AN18-61-R10V | |
| Average AMD Ryzen 7 260, NVIDIA GeForce RTX 5060 Laptop (234 - 261, n=2) | |
| Asus TUF Gaming A18 FA808UP-S8022W | |
| Asus TUF Gaming A18 FA808UM | |
| MSI Cyborg 17 B13WFKG | |
| Mozilla Kraken 1.1 / Total | |
| Asus TUF Gaming A18 FA808UP-S8022W | |
| MSI Cyborg 17 B13WFKG | |
| Asus TUF Gaming A18 FA808UM | |
| Average AMD Ryzen 7 260, NVIDIA GeForce RTX 5060 Laptop (494 - 533, n=2) | |
| Average of class Gaming (391 - 590, n=102, last 2 years) | |
| MSI Crosshair 18 HX AI A2XW | |
| Asus ROG Strix G18 2025 G814 | |
* ... smaller is better
| PCMark 10 Score | 8567 points | |
Help | ||
| AIDA64 / Memory Copy | |
| MSI Crosshair 18 HX AI A2XW | |
| Average of class Gaming (21750 - 129946, n=102, last 2 years) | |
| Asus TUF Gaming A18 FA808UP-S8022W | |
| Asus TUF Gaming A18 FA808UM | |
| Asus ROG Strix G18 2025 G814 | |
| Average AMD Ryzen 7 260 (35762 - 69413, n=6) | |
| Acer Nitro 18 AI AN18-61-R10V | |
| MSI Cyborg 17 B13WFKG | |
| AIDA64 / Memory Read | |
| MSI Crosshair 18 HX AI A2XW | |
| Average of class Gaming (22956 - 118858, n=102, last 2 years) | |
| Asus ROG Strix G18 2025 G814 | |
| Asus TUF Gaming A18 FA808UM | |
| Asus TUF Gaming A18 FA808UP-S8022W | |
| Average AMD Ryzen 7 260 (30070 - 61363, n=6) | |
| Acer Nitro 18 AI AN18-61-R10V | |
| MSI Cyborg 17 B13WFKG | |
| AIDA64 / Memory Write | |
| Asus TUF Gaming A18 FA808UP-S8022W | |
| Asus TUF Gaming A18 FA808UM | |
| MSI Crosshair 18 HX AI A2XW | |
| Average of class Gaming (22297 - 135096, n=102, last 2 years) | |
| Average AMD Ryzen 7 260 (42757 - 87114, n=6) | |
| Asus ROG Strix G18 2025 G814 | |
| Acer Nitro 18 AI AN18-61-R10V | |
| MSI Cyborg 17 B13WFKG | |
| AIDA64 / Memory Latency | |
| MSI Crosshair 18 HX AI A2XW | |
| Average of class Gaming (75.3 - 151.7, n=102, last 2 years) | |
| Asus ROG Strix G18 2025 G814 | |
| MSI Cyborg 17 B13WFKG | |
| Average AMD Ryzen 7 260 (90.8 - 94.1, n=6) | |
| Asus TUF Gaming A18 FA808UP-S8022W | |
| Acer Nitro 18 AI AN18-61-R10V | |
| Asus TUF Gaming A18 FA808UM | |
* ... smaller is better

* ... smaller is better
持续读取性能:DiskSpd 读取循环,队列深度为 8
GPU 和游戏性能
| 3DMark 11 Performance | 32735 points | |
| 3DMark Cloud Gate Standard Score | 65437 points | |
| 3DMark Fire Strike Score | 28481 points | |
| 3DMark Time Spy Score | 11603 points | |
Help | ||
* ... smaller is better
| Performance rating - Percent | |
| Average of class Gaming | |
| Lenovo LOQ 15AHP11 | |
| Average NVIDIA GeForce RTX 5060 Laptop | |
| Asus TUF Gaming A18 FA808UM | |
| 007 First Light | |
| 1920x1080 High Settings AF:16x | |
| Average of class Gaming (60.2 - 111.8, n=6, last 2 years) | |
| Lenovo LOQ 15AHP11 | |
| Asus TUF Gaming A18 FA808UM | |
| Average NVIDIA GeForce RTX 5060 Laptop (57.7 - 62.8, n=3) | |
| 1920x1080 Ultra Settings AF:16x | |
| Average of class Gaming (57.3 - 108.2, n=6, last 2 years) | |
| Lenovo LOQ 15AHP11 | |
| Average NVIDIA GeForce RTX 5060 Laptop (55.2 - 60.4, n=3) | |
| Asus TUF Gaming A18 FA808UM | |
| Death Stranding 2 | |
| 1920x1080 High Preset | |
| Average of class Gaming (9.45 - 109.5, n=6, last 2 years) | |
| Lenovo LOQ 15AHP11 | |
| Average NVIDIA GeForce RTX 5060 Laptop (61.6 - 64.5, n=3) | |
| Asus TUF Gaming A18 FA808UM | |
| 1920x1080 Very High Preset | |
| Average of class Gaming (7.22 - 87.5, n=6, last 2 years) | |
| Lenovo LOQ 15AHP11 | |
| Average NVIDIA GeForce RTX 5060 Laptop (47.2 - 51.7, n=3) | |
| Asus TUF Gaming A18 FA808UM | |
| Resident Evil Requiem | |
| 1920x1080 High Settings (no upscaling) | |
| Average of class Gaming (90.4 - 168.3, n=6, last 2 years) | |
| Asus TUF Gaming A18 FA808UM | |
| Average NVIDIA GeForce RTX 5060 Laptop (90.4 - 94.1, n=3) | |
| Lenovo LOQ 15AHP11 | |
| 1920x1080 Max Settings + High Ray Tracing (no upscaling) | |
| Average of class Gaming (46.7 - 87.5, n=6, last 2 years) | |
| Lenovo LOQ 15AHP11 | |
| Asus TUF Gaming A18 FA808UM | |
| Average NVIDIA GeForce RTX 5060 Laptop (43.4 - 47.7, n=3) | |
| Pragmata - 1920x1080 Quality Preset | |
| Average of class Gaming (8.66 - 164.9, n=8, last 2 years) | |
| Lenovo LOQ 15AHP11 | |
| Average NVIDIA GeForce RTX 5060 Laptop (80.6 - 83.1, n=3) | |
| Asus TUF Gaming A18 FA808UM | |
| low | med. | high | ultra | |
|---|---|---|---|---|
| Dota 2 Reborn (2015) | 129.7 | 120.4 | ||
| X-Plane 11.11 (2018) | 79.6 | |||
| Cyberpunk 2077 (2023) | 95.7 | 85.8 | ||
| Resident Evil Requiem (2026) | 92.6 | 46.7 | ||
| Death Stranding 2 (2026) | 61.6 | 48.3 | ||
| Crimson Desert (2026) | 60 | 49.9 | ||
| Pragmata (2026) | 80.6 | |||
| 007 First Light (2026) | 60.2 | 57.3 |
《赛博朋克2077》超高清画质帧率图表
排放与能源
噪声排放
在3D负载下,只要启用“性能”模式,这款华硕笔记本电脑的运行表现相较于竞品仍相对克制。36至46分贝(A)的噪音水平虽然清晰可闻,但并不刺耳。除了偶尔短暂的风扇转速提升外,在空闲运行时也几乎无可挑剔。
Noise level
| Idle |
| 25 / 26 / 33 dB(A) |
| Load |
| 36 / 46 dB(A) |
 | ||
30 dB silent 40 dB(A) audible 50 dB(A) loud |
||
min:  , med: , med:  , max: , max:  Earthworks M23R, Arta (15 cm distance) environment noise: 25 dB(A) Earthworks M23R, Arta (15 cm distance) environment noise: 25 dB(A) | ||
| Asus TUF Gaming A18 FA808UM R7 260, GeForce RTX 5060 Laptop | MSI Cyborg 17 B13WFKG i7-13620H, GeForce RTX 5060 Laptop | Acer Nitro 18 AI AN18-61-R10V Ryzen AI 7 350, GeForce RTX 5070 Laptop | Asus ROG Strix G18 2025 G814 R9 9955HX, GeForce RTX 5070 Laptop | MSI Crosshair 18 HX AI A2XW Ultra 9 275HX, GeForce RTX 5070 Laptop | |
|---|---|---|---|---|---|
| Noise | -7% | -14% | -3% | -4% | |
| off / environment * (dB) | 25 | 25 -0% | 24 4% | 24.6 2% | 23.1 8% |
| Idle Minimum * (dB) | 25 | 25 -0% | 28 -12% | 24.6 2% | 27.3 -9% |
| Idle Average * (dB) | 26 | 27 -4% | 29 -12% | 30 -15% | 27.3 -5% |
| Idle Maximum * (dB) | 33 | 34 -3% | 31 6% | 30 9% | 27.6 16% |
| Load Average * (dB) | 36 | 44 -22% | 49 -36% | 34.4 4% | 30.1 16% |
| Cyberpunk 2077 ultra * (dB) | 43 | 48 -12% | 54 -26% | 49.7 -16% | 54.4 -27% |
| Load Maximum * (dB) | 46 | 50 -9% | 56 -22% | 49.7 -8% | 58.6 -27% |
* ... smaller is better
温度
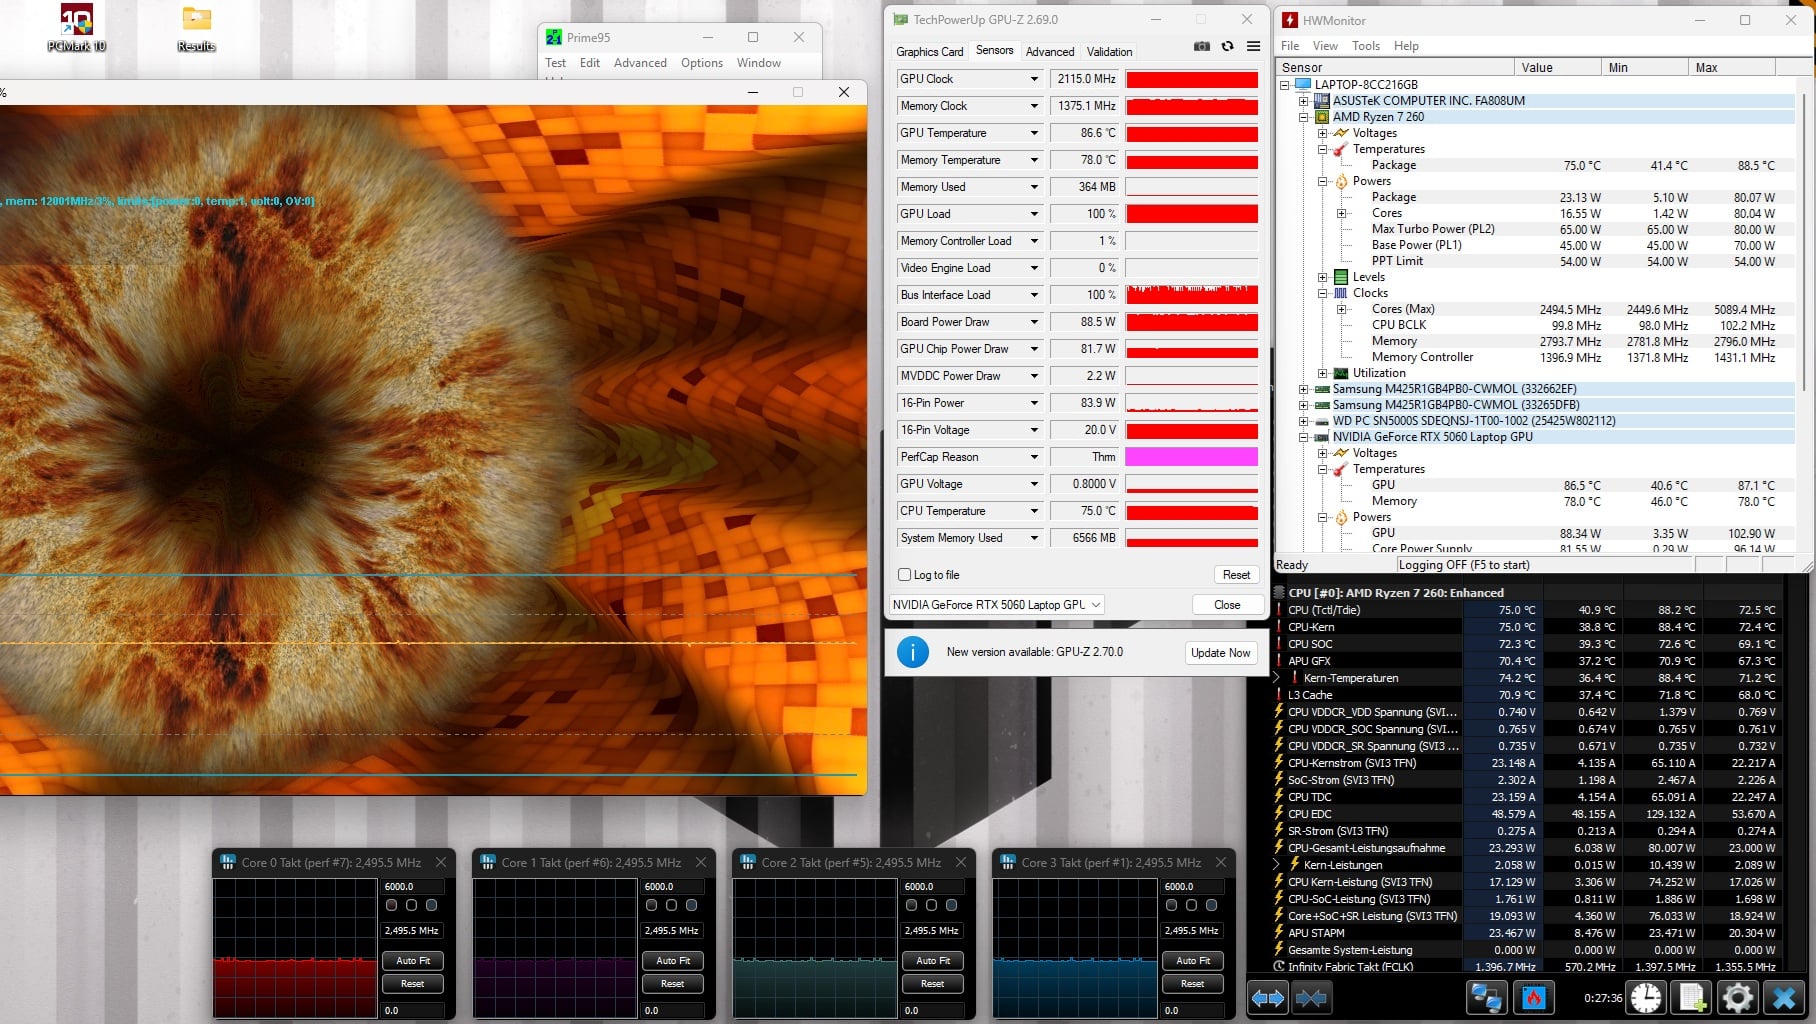
在使用FurMark和Prime95进行压力测试时,机箱底部的温度超过了50 °C,而顶部整体温度则低了几度。CPU平均温度为75 °C,而GPU在运行一段时间后达到略低于87 °C。
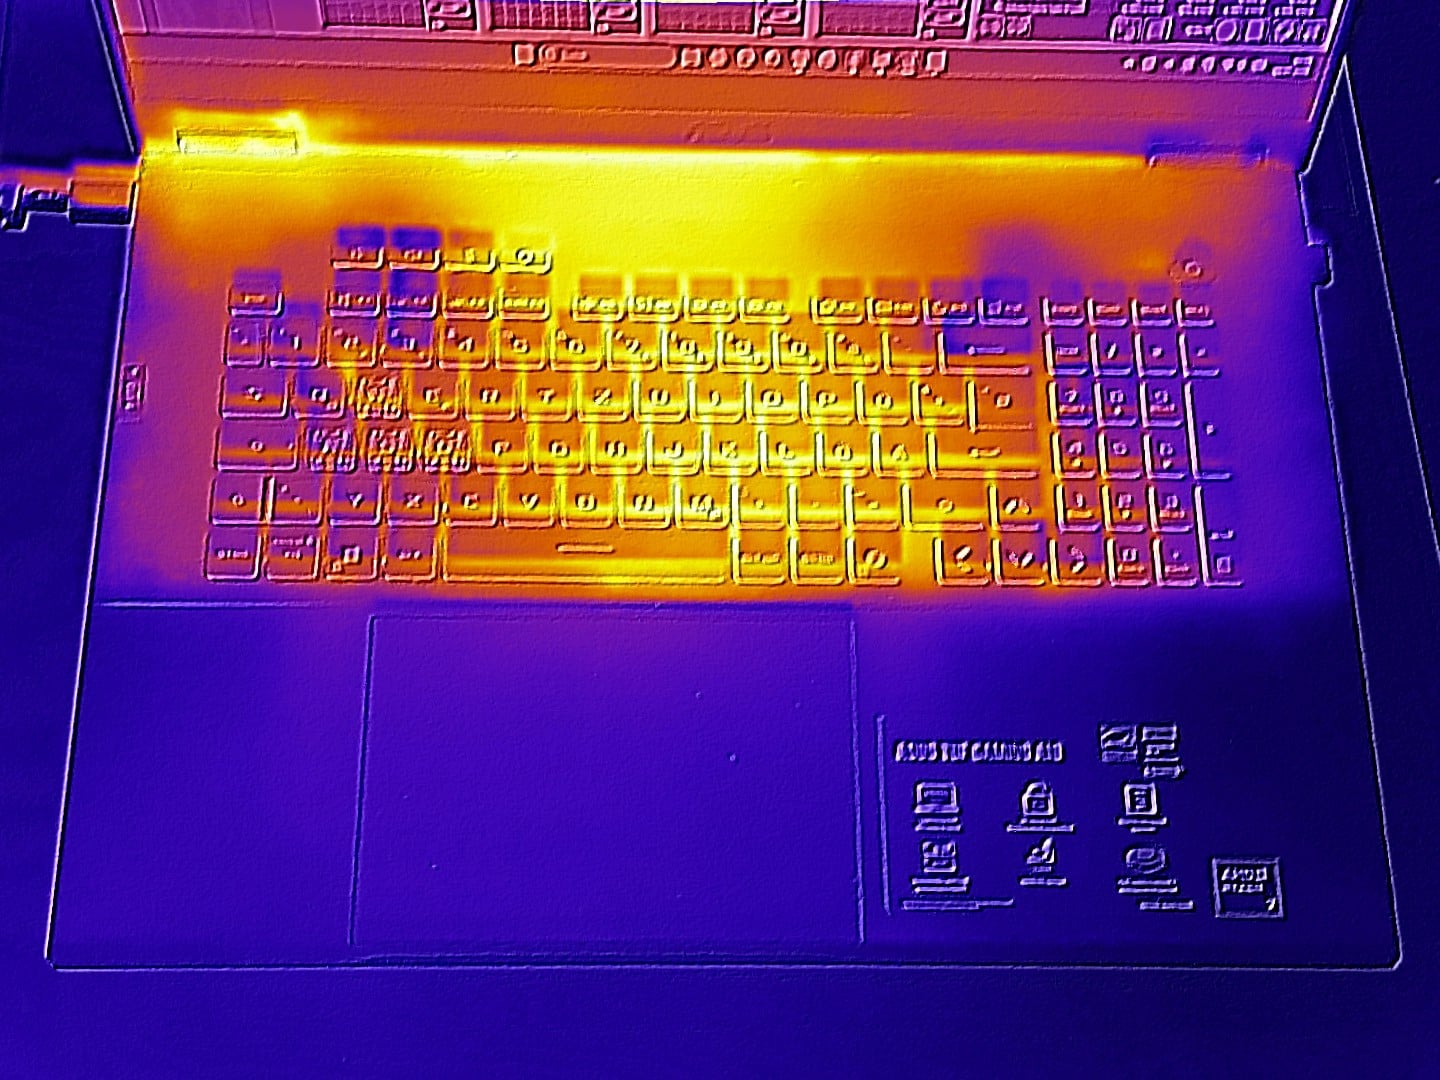
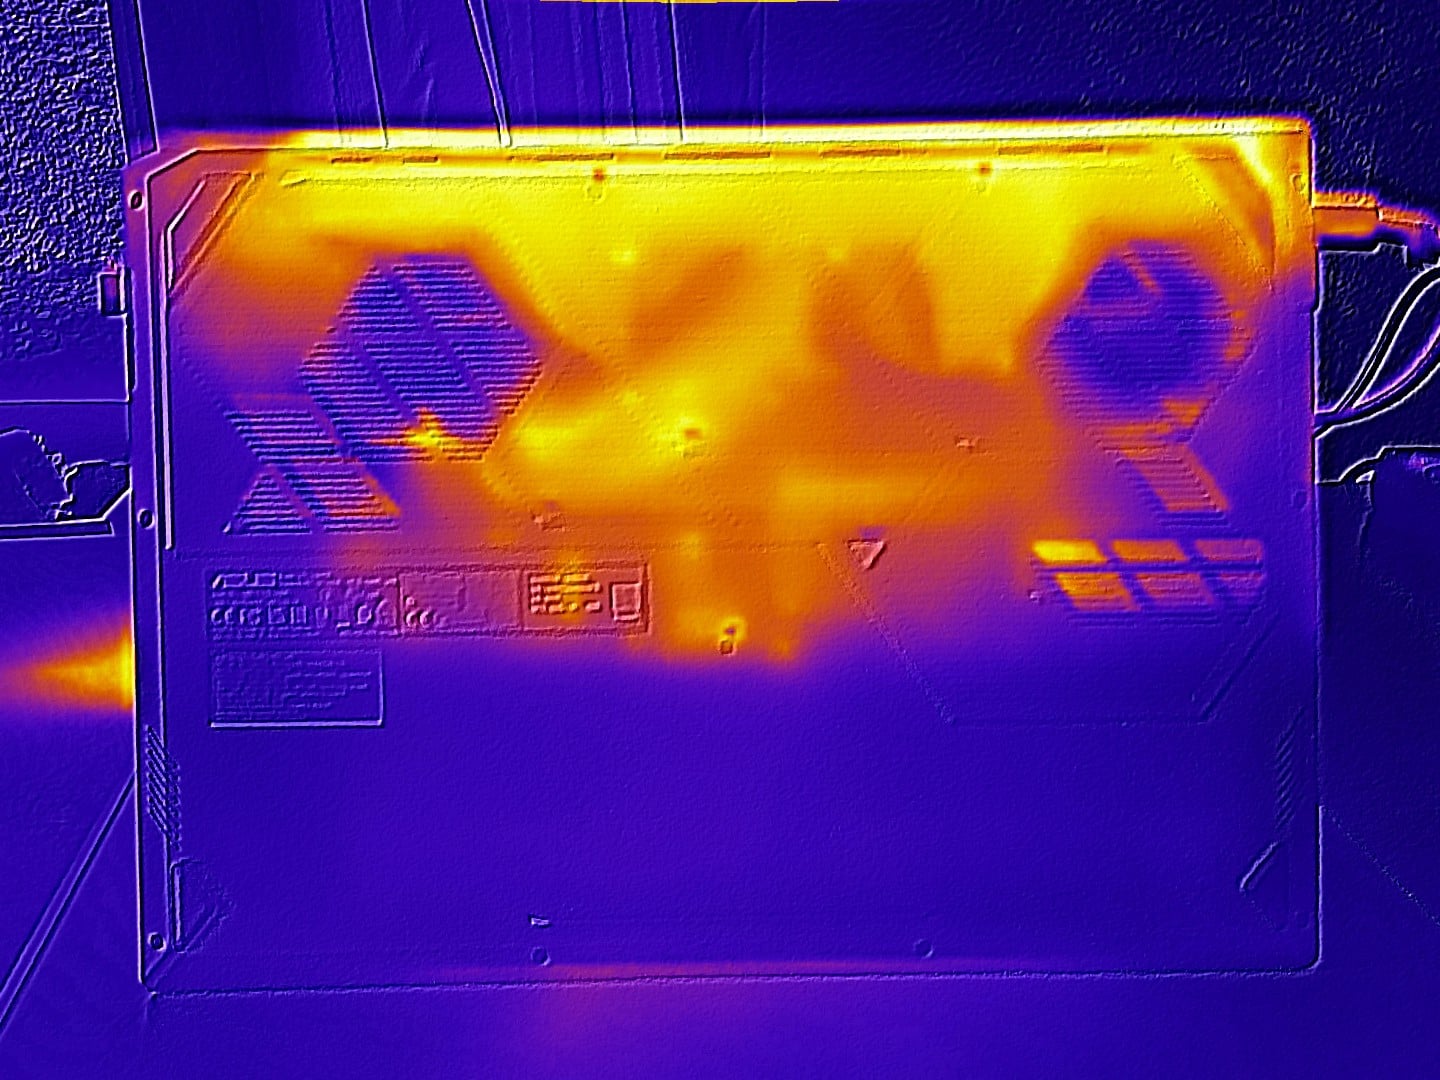
(-) The maximum temperature on the upper side is 46 °C / 115 F, compared to the average of 40.4 °C / 105 F, ranging from 21.2 to 68.8 °C for the class Gaming.
(-) The bottom heats up to a maximum of 51 °C / 124 F, compared to the average of 43.2 °C / 110 F
(+) The palmrests and touchpad are cooler than skin temperature with a maximum of 30 °C / 86 F and are therefore cool to the touch.
(±) The average temperature of the palmrest area of similar devices was 28.8 °C / 83.8 F (-1.2 °C / -2.2 F).
| Asus TUF Gaming A18 FA808UM R7 260, GeForce RTX 5060 Laptop | MSI Cyborg 17 B13WFKG i7-13620H, GeForce RTX 5060 Laptop | Acer Nitro 18 AI AN18-61-R10V Ryzen AI 7 350, GeForce RTX 5070 Laptop | Asus ROG Strix G18 2025 G814 R9 9955HX, GeForce RTX 5070 Laptop | MSI Crosshair 18 HX AI A2XW Ultra 9 275HX, GeForce RTX 5070 Laptop | |
|---|---|---|---|---|---|
| Heat | -2% | -4% | 11% | 14% | |
| Maximum Upper Side * (°C) | 46 | 49 -7% | 44 4% | 42.8 7% | 40.2 13% |
| Maximum Bottom * (°C) | 51 | 49 4% | 57 -12% | 43.1 15% | 44 14% |
| Idle Upper Side * (°C) | 37 | 25 | 26.8 | 25.6 | |
| Idle Bottom * (°C) | 39 | 28 | 26.6 | 26.8 |
* ... smaller is better
演讲嘉宾
除了低音稍显薄弱外,音质相当不错。在参测设备中,只有华硕自家的 ROG Strix G18 的音质更胜一筹。
Asus TUF Gaming A18 FA808UM audio analysis
(±) | speaker loudness is average but good (77 dB)
Bass 100 - 315 Hz
(±) | reduced bass - on average 9.5% lower than median
(±) | linearity of bass is average (11.3% delta to prev. frequency)
Mids 400 - 2000 Hz
(+) | balanced mids - only 4.8% away from median
(+) | mids are linear (4.6% delta to prev. frequency)
Highs 2 - 16 kHz
(+) | balanced highs - only 3.3% away from median
(±) | linearity of highs is average (7.1% delta to prev. frequency)
Overall 100 - 16.000 Hz
(+) | overall sound is linear (14% difference to median)
Compared to same class
» 23% of all tested devices in this class were better, 8% similar, 69% worse
» The best had a delta of 6%, average was 18%, worst was 132%
Compared to all devices tested
» 17% of all tested devices were better, 4% similar, 79% worse
» The best had a delta of 4%, average was 23%, worst was 136%
MSI Cyborg 17 B13WFKG audio analysis
(+) | speakers can play relatively loud (86 dB)
Bass 100 - 315 Hz
(-) | nearly no bass - on average 23% lower than median
(±) | linearity of bass is average (14% delta to prev. frequency)
Mids 400 - 2000 Hz
(+) | balanced mids - only 2.5% away from median
(+) | mids are linear (4.3% delta to prev. frequency)
Highs 2 - 16 kHz
(±) | higher highs - on average 5.1% higher than median
(+) | highs are linear (4% delta to prev. frequency)
Overall 100 - 16.000 Hz
(±) | linearity of overall sound is average (15.2% difference to median)
Compared to same class
» 34% of all tested devices in this class were better, 6% similar, 60% worse
» The best had a delta of 6%, average was 18%, worst was 132%
Compared to all devices tested
» 22% of all tested devices were better, 4% similar, 74% worse
» The best had a delta of 4%, average was 23%, worst was 136%
Acer Nitro 18 AI AN18-61-R10V audio analysis
(±) | speaker loudness is average but good (80 dB)
Bass 100 - 315 Hz
(-) | nearly no bass - on average 25% lower than median
(±) | linearity of bass is average (14.4% delta to prev. frequency)
Mids 400 - 2000 Hz
(+) | balanced mids - only 2% away from median
(+) | mids are linear (3.9% delta to prev. frequency)
Highs 2 - 16 kHz
(+) | balanced highs - only 3.1% away from median
(+) | highs are linear (6.6% delta to prev. frequency)
Overall 100 - 16.000 Hz
(±) | linearity of overall sound is average (16.9% difference to median)
Compared to same class
» 45% of all tested devices in this class were better, 11% similar, 44% worse
» The best had a delta of 6%, average was 18%, worst was 132%
Compared to all devices tested
» 31% of all tested devices were better, 8% similar, 62% worse
» The best had a delta of 4%, average was 23%, worst was 136%
Asus ROG Strix G18 2025 G814 audio analysis
(+) | speakers can play relatively loud (83.3 dB)
Bass 100 - 315 Hz
(±) | reduced bass - on average 11% lower than median
(±) | linearity of bass is average (8.4% delta to prev. frequency)
Mids 400 - 2000 Hz
(+) | balanced mids - only 4.4% away from median
(+) | mids are linear (3.1% delta to prev. frequency)
Highs 2 - 16 kHz
(+) | balanced highs - only 2.7% away from median
(+) | highs are linear (4.8% delta to prev. frequency)
Overall 100 - 16.000 Hz
(+) | overall sound is linear (12.1% difference to median)
Compared to same class
» 13% of all tested devices in this class were better, 4% similar, 84% worse
» The best had a delta of 6%, average was 18%, worst was 132%
Compared to all devices tested
» 10% of all tested devices were better, 2% similar, 88% worse
» The best had a delta of 4%, average was 23%, worst was 136%
MSI Crosshair 18 HX AI A2XW audio analysis
(+) | speakers can play relatively loud (84.5 dB)
Bass 100 - 315 Hz
(±) | reduced bass - on average 14.8% lower than median
(±) | linearity of bass is average (14.7% delta to prev. frequency)
Mids 400 - 2000 Hz
(±) | higher mids - on average 11.9% higher than median
(±) | linearity of mids is average (10% delta to prev. frequency)
Highs 2 - 16 kHz
(+) | balanced highs - only 3% away from median
(+) | highs are linear (4.9% delta to prev. frequency)
Overall 100 - 16.000 Hz
(±) | linearity of overall sound is average (22.3% difference to median)
Compared to same class
» 80% of all tested devices in this class were better, 6% similar, 14% worse
» The best had a delta of 6%, average was 18%, worst was 132%
Compared to all devices tested
» 65% of all tested devices were better, 6% similar, 29% worse
» The best had a delta of 4%, average was 23%, worst was 136%
Asus TUF Gaming A18 FA808UP-S8022W audio analysis
(±) | speaker loudness is average but good (74.53 dB)
Bass 100 - 315 Hz
(±) | reduced bass - on average 12.9% lower than median
(±) | linearity of bass is average (7.5% delta to prev. frequency)
Mids 400 - 2000 Hz
(±) | higher mids - on average 5.1% higher than median
(+) | mids are linear (5.9% delta to prev. frequency)
Highs 2 - 16 kHz
(+) | balanced highs - only 4.1% away from median
(+) | highs are linear (6.9% delta to prev. frequency)
Overall 100 - 16.000 Hz
(±) | linearity of overall sound is average (16.9% difference to median)
Compared to same class
» 45% of all tested devices in this class were better, 11% similar, 44% worse
» The best had a delta of 6%, average was 18%, worst was 132%
Compared to all devices tested
» 31% of all tested devices were better, 8% similar, 62% worse
» The best had a delta of 4%, average was 23%, worst was 136%
功耗与电池续航时间
这款18英寸笔记本电脑在空闲状态下的功耗出人意料地低,平均仅为9瓦左右。部分得益于容量充裕的90瓦时电池,这款华硕笔记本电脑在脱离电源插座时能提供令人印象深刻的续航时间。 在我们的Wi-Fi测试中,将屏幕亮度调至150 cd/m²后,其电池续航时间达到了13小时,表现非常出色。
| Off / Standby | 0.1 / 0.8 Watt |
| Idle | 6 / 8.8 / 11 Watt |
| Load |
75 / 195 Watt |
   
| |
Key:
min: ,
med: ,
max: Metrahit Energy | |
| Asus TUF Gaming A18 FA808UM R7 260, GeForce RTX 5060 Laptop | MSI Cyborg 17 B13WFKG i7-13620H, GeForce RTX 5060 Laptop | Acer Nitro 18 AI AN18-61-R10V Ryzen AI 7 350, GeForce RTX 5070 Laptop | Asus ROG Strix G18 2025 G814 R9 9955HX, GeForce RTX 5070 Laptop | MSI Crosshair 18 HX AI A2XW Ultra 9 275HX, GeForce RTX 5070 Laptop | Asus TUF Gaming A18 FA808UP-S8022W R7 260, GeForce RTX 5070 Laptop | Average of class Gaming | |
|---|---|---|---|---|---|---|---|
| Power Consumption | -16% | -17% | -82% | -84% | -19% | -87% | |
| Idle Minimum * (Watt) | 6 | 7.9 -32% | 5.9 2% | 13.1 -118% | 8.8 -47% | 6.7 -12% | 12.8 ? -113% |
| Idle Average * (Watt) | 8.8 | 12.7 -44% | 9.6 -9% | 20.6 -134% | 14.1 -60% | 11.6 -32% | 18.5 ? -110% |
| Idle Maximum * (Watt) | 11 | 18.1 -65% | 17 -55% | 21.1 -92% | 35.4 -222% | 17.7 -61% | 24.7 ? -125% |
| Load Average * (Watt) | 75 | 90 -20% | 89 -19% | 123.4 -65% | 106.2 -42% | 85 -13% | 113 ? -51% |
| Cyberpunk 2077 ultra * (Watt) | 141 | 109.7 22% | 160.4 -14% | 215 -52% | 233 -65% | 144 -2% | |
| Load Maximum * (Watt) | 195 | 115 41% | 210 -8% | 249.7 -28% | 322.3 -65% | 187 4% | 262 ? -34% |
| Cyberpunk 2077 ultra external monitor * (Watt) | 108.4 | 154.6 | 179.2 | 225 | 139 |
* ... smaller is better
| Asus TUF Gaming A18 FA808UM R7 260, GeForce RTX 5060 Laptop, 90 Wh | MSI Cyborg 17 B13WFKG i7-13620H, GeForce RTX 5060 Laptop, 55.2 Wh | Acer Nitro 18 AI AN18-61-R10V Ryzen AI 7 350, GeForce RTX 5070 Laptop, 90 Wh | Asus ROG Strix G18 2025 G814 R9 9955HX, GeForce RTX 5070 Laptop, 90 Wh | MSI Crosshair 18 HX AI A2XW Ultra 9 275HX, GeForce RTX 5070 Laptop, 90 Wh | Asus TUF Gaming A18 FA808UP-S8022W R7 260, GeForce RTX 5070 Laptop, 90 Wh | Average of class Gaming | |
|---|---|---|---|---|---|---|---|
| Battery runtime | |||||||
| WiFi v1.3 (h) | 13.2 | 3.8 -71% | 11.1 -16% | 7.1 -46% | 10.9 -17% | 11.9 -10% | 7.22 ? -45% |
Notebookcheck 综合评分
任何想要一款性能强劲且价格合理的XXL笔记本电脑的用户,都会发现TUF Gaming A18有很多值得称道之处。华硕几乎没有犯错,因此获得了不错的总体评价。
Asus TUF Gaming A18 FA808UM
- 07/10/2026 v8
Florian Glaser
 Total Sustainability Score:
 替代方案一览
Image | Model / Review | Price | Weight | Height | Display |
|---|---|---|---|---|---|
1. 82.4%  | Asus TUF Gaming A18 FA808UM AMD Ryzen 7 260 ⎘ NVIDIA GeForce RTX 5060 Laptop ⎘ 16 GB Memory, 1024 GB SSD | List Price: 1300 EUR | 2.7 kg | 26.7 mm | 18.00" 1920x1200 126 PPI IPS |
2. 76.3%  | MSI Cyborg 17 B13WFKG Intel Core i7-13620H ⎘ NVIDIA GeForce RTX 5060 Laptop ⎘ 16 GB Memory, 512 GB SSD | List Price: 1200 EUR | 2.6 kg | 22.2 mm | 17.30" 1920x1080 127 PPI IPS |
3. 81.2%  | Acer Nitro 18 AI AN18-61-R10V AMD Ryzen AI 7 350 ⎘ NVIDIA GeForce RTX 5070 Laptop ⎘ 16 GB Memory, 1000 GB SSD | List Price: 1900 EUR | 3 kg | 25 mm | 18.00" 2560x1600 168 PPI IPS |
4. 86.4%  | Asus ROG Strix G18 2025 G814 AMD Ryzen 9 9955HX ⎘ NVIDIA GeForce RTX 5070 Laptop ⎘ 32 GB Memory, 1024 GB SSD | List Price: 2299€ | 2.9 kg | 30.8 mm | 18.00" 2560x1600 168 PPI IPS |
5. 81.7%  | MSI Crosshair 18 HX AI A2XW Intel Core Ultra 9 275HX ⎘ NVIDIA GeForce RTX 5070 Laptop ⎘ 32 GB Memory, 1024 GB SSD | Amazon: 1. $2,799.00 msi Crosshair 18 HX AI Gamin... 2. $1,799.00 msi Crosshair 18 HX AI 18" 2... 3. $1,699.00 msi Crosshair 18 HX AI 18" 2... List Price: 1700 USD | 3.1 kg | 29.9 mm | 18.00" 2560x1600 168 PPI IPS |
6. 83.8%  | Asus TUF Gaming A18 FA808UP-S8022W AMD Ryzen 7 260 ⎘ NVIDIA GeForce RTX 5070 Laptop ⎘ 32 GB Memory, 1024 GB SSD | List Price: 2199 Euro | 2.6 kg | 26.7 mm | 18.00" 1920x1200 126 PPI IPS |
Transparency
The selection of devices to be reviewed is made by our editorial team. The test sample was provided to the author as a loan by the manufacturer or retailer for the purpose of this review. The lender had no influence on this review, nor did the manufacturer receive a copy of this review before publication. There was no obligation to publish this review. As an independent media company, Notebookcheck is not subjected to the authority of manufacturers, retailers or publishers.
This is how Notebookcheck is testing
Every year, Notebookcheck independently reviews hundreds of laptops and smartphones using standardized procedures to ensure that all results are comparable. We have continuously developed our test methods for around 20 years and set industry standards in the process. In our test labs, high-quality measuring equipment is utilized by experienced technicians and editors. These tests involve a multi-stage validation process. Our complex rating system is based on hundreds of well-founded measurements and benchmarks, which maintains objectivity. Further information on our test methods can be found here.
 Add as a preferred source on Google