结论 - 精调且重量不足 2 公斤
Legion 7 16IAX10 是一款有趣的机型。它是少数配备 Arrow Lake-HX CPU 但没有 RTX 5070 以外 GPU 选项的 16 英寸游戏笔记本电脑之一。另一方面,由于其 115 W TGP 目标值较高,它是我们测试过的采用相同 RTX 5060 GPU 的游戏笔记本电脑中最轻、速度最快的一款。该系统最大限度地提高了便携性,同时从高端 CPU 和中端 GPU 中榨取了尽可能多的性能。对于喜欢旅行的游戏玩家或专业用户来说,Legion 7 16 Gen 10 既轻便又便宜,是 RTX 5060 的替代品。 雷蛇刀锋 16尤其是在集成数字键盘派上用场的情况下。
该机型的主要缺点是前面提到的 RTX 5070 限制。RTX 5070 Ti 的速度明显快于 RTX 5070,但其高功耗要求很可能将其排除在系统之外。因此,需要更强大图形处理能力的用户将不得不把目光投向Legion 7 16 之外,如前面提到的 Blade 16 或更大更重的 Legion Pro 5 16而不是前述的 Blade 16 或更大更重的 Pro 5 16。
该机型的其他缺点也是超薄高性能游戏笔记本电脑的通病。核心温度相对较高,电池续航时间充其量只能算一般,如果在性能模式下玩游戏,风扇的噪音是不可避免的。由于Legion 7 16 比其他大多数超轻型竞争对手更轻,因此这些不利因素在它身上表现得更为明显。
如果用户不需要 Arrow Lake-HX 的额外性能,可以考虑使用 联想 Yoga Pro 9i 16IAH G10 Aura它提供类似的 RTX 5060 图形处理器和 1800p OLED 显示屏,但采用的是 Arrow Lake-H 处理器。
Pros
Cons
价格和供应情况
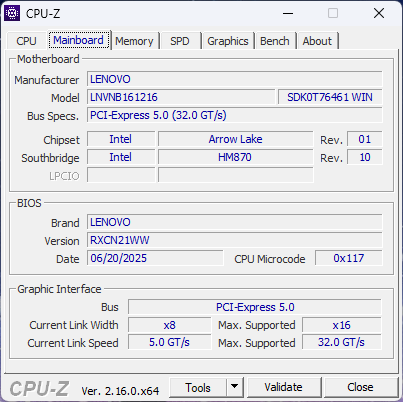
Legion 7 16IAX10(又称Legion 7i 16 Gen 10)是联想Legion 系列中最薄、最轻的游戏笔记本电脑之一。它是 2024Legion 7 16IRX9的直接继承者,配备了全新的 Arrow Lake-HX 处理器,机箱设计也焕然一新。
我们的测试机为低配置,配备酷睿至尊 7 255HX CPU、115 WGeForce RTX 5070 GPU 和 165 Hz 1600p 光面 OLED 显示屏,售价约 1650 美元。高端产品则配备酷睿至尊 9 275HX、RTX 5070 和 240 Hz OLED 显示屏。
Legion 7 16IAX10 的替代产品包括其他 16 英寸中端或超薄游戏笔记本电脑,如 Alienware 16X 极光基本配置 Razer Blade 16或 华硕 TUF GAMING A16或 Zephyrus G16.Legion 7 16 不应与更大、更重的 Legion Pro 7 16.该型号还有一种价格较低的 15 英寸版本,称为 Legion 5 15AHP10配备类似的 115 W RTX 5060 显卡。
更多联想评测:
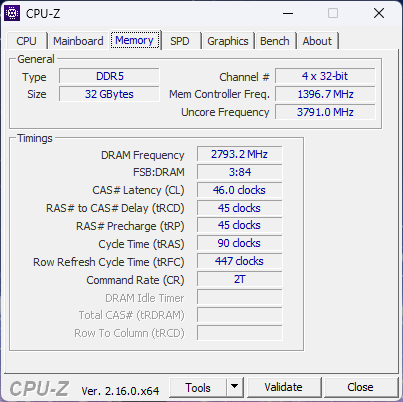
规格
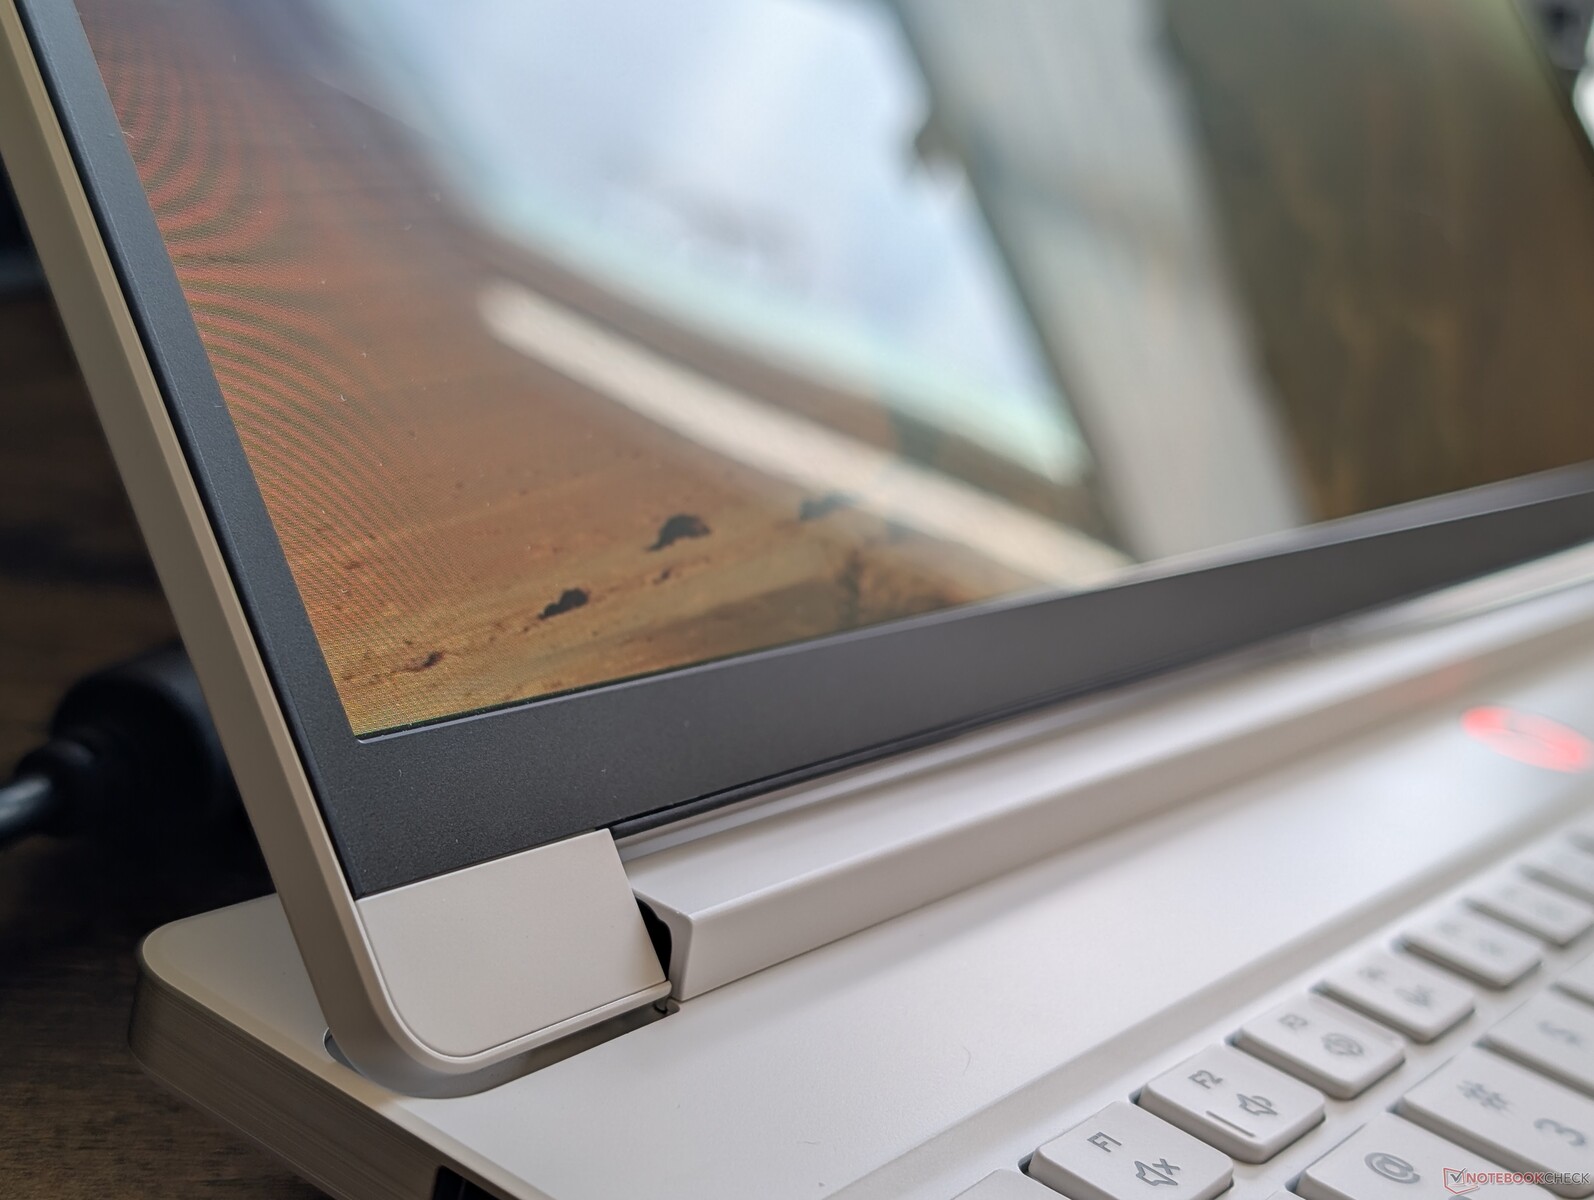
案例
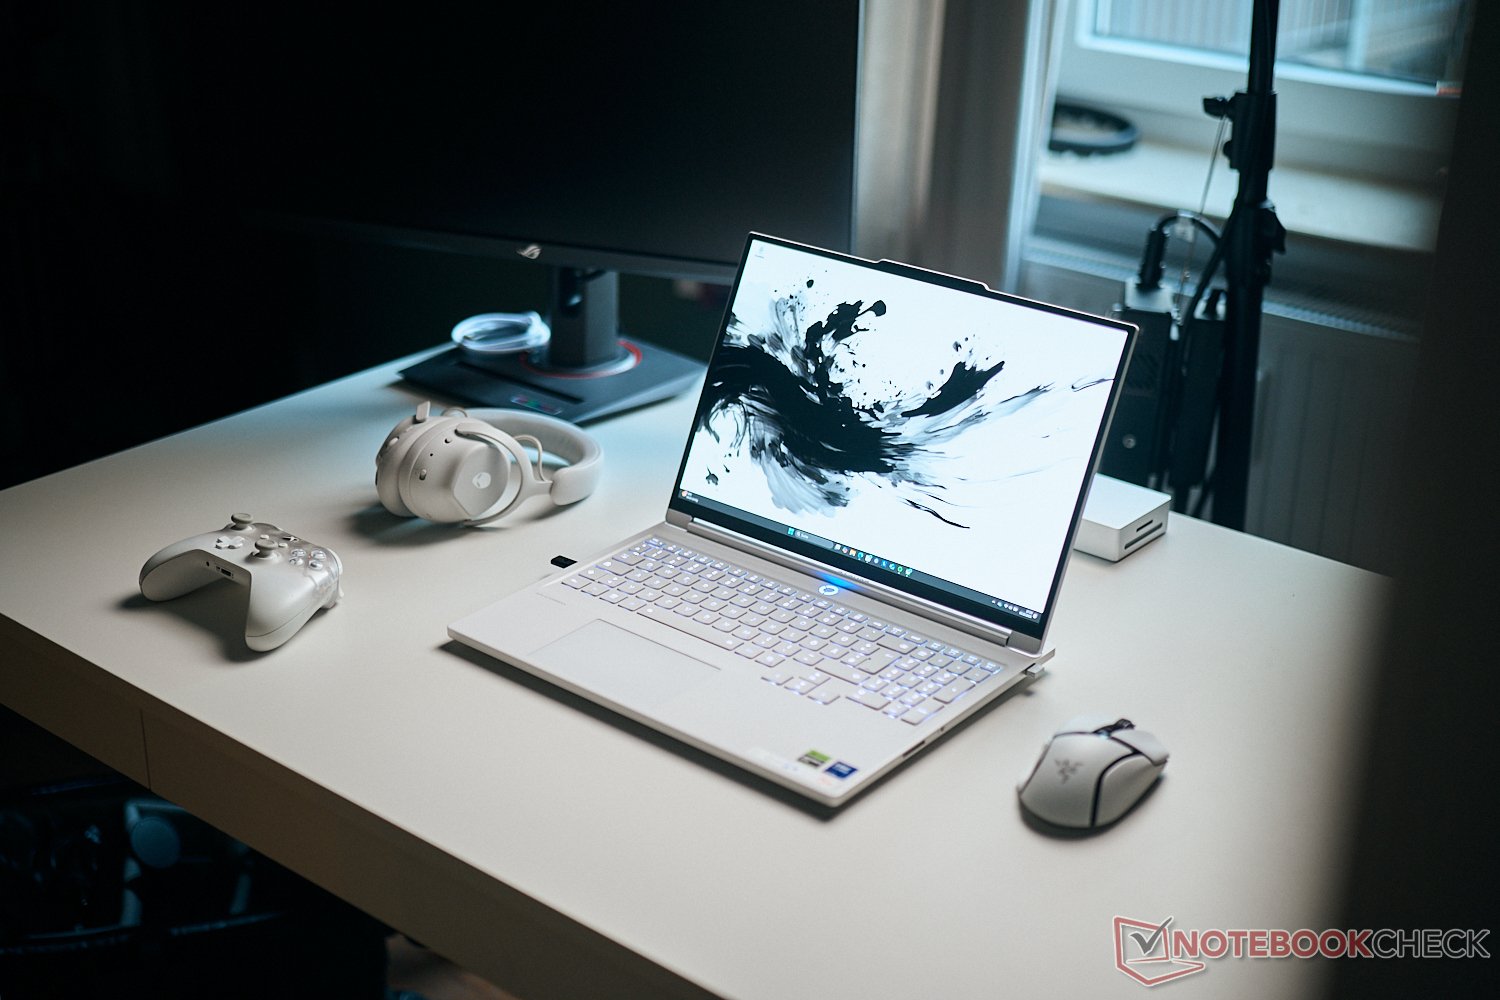
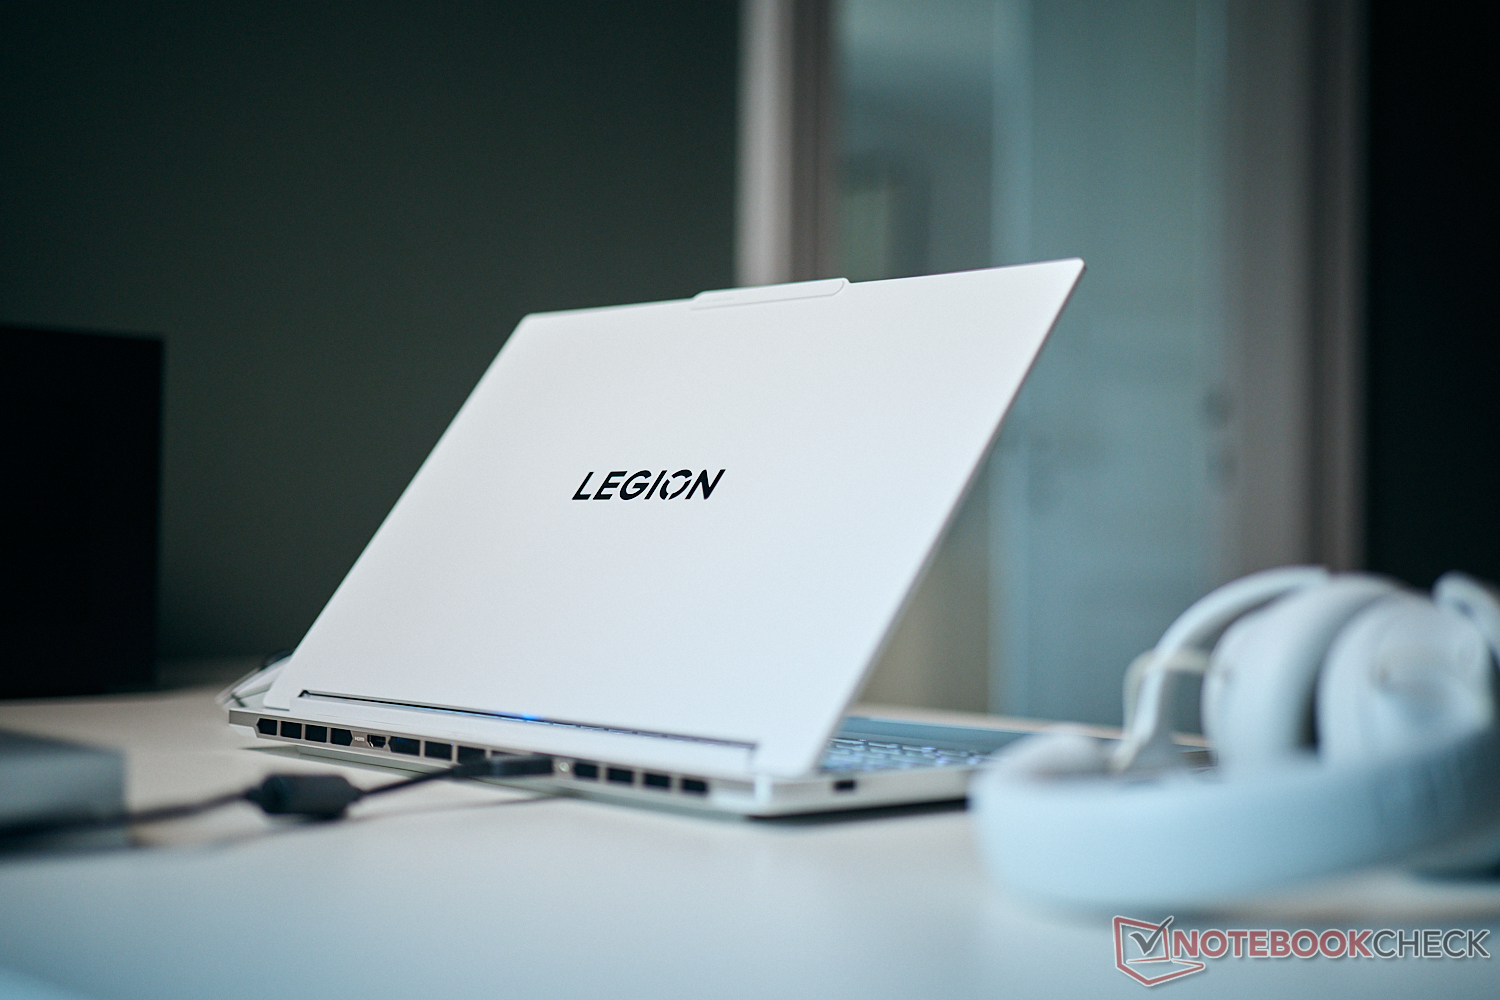
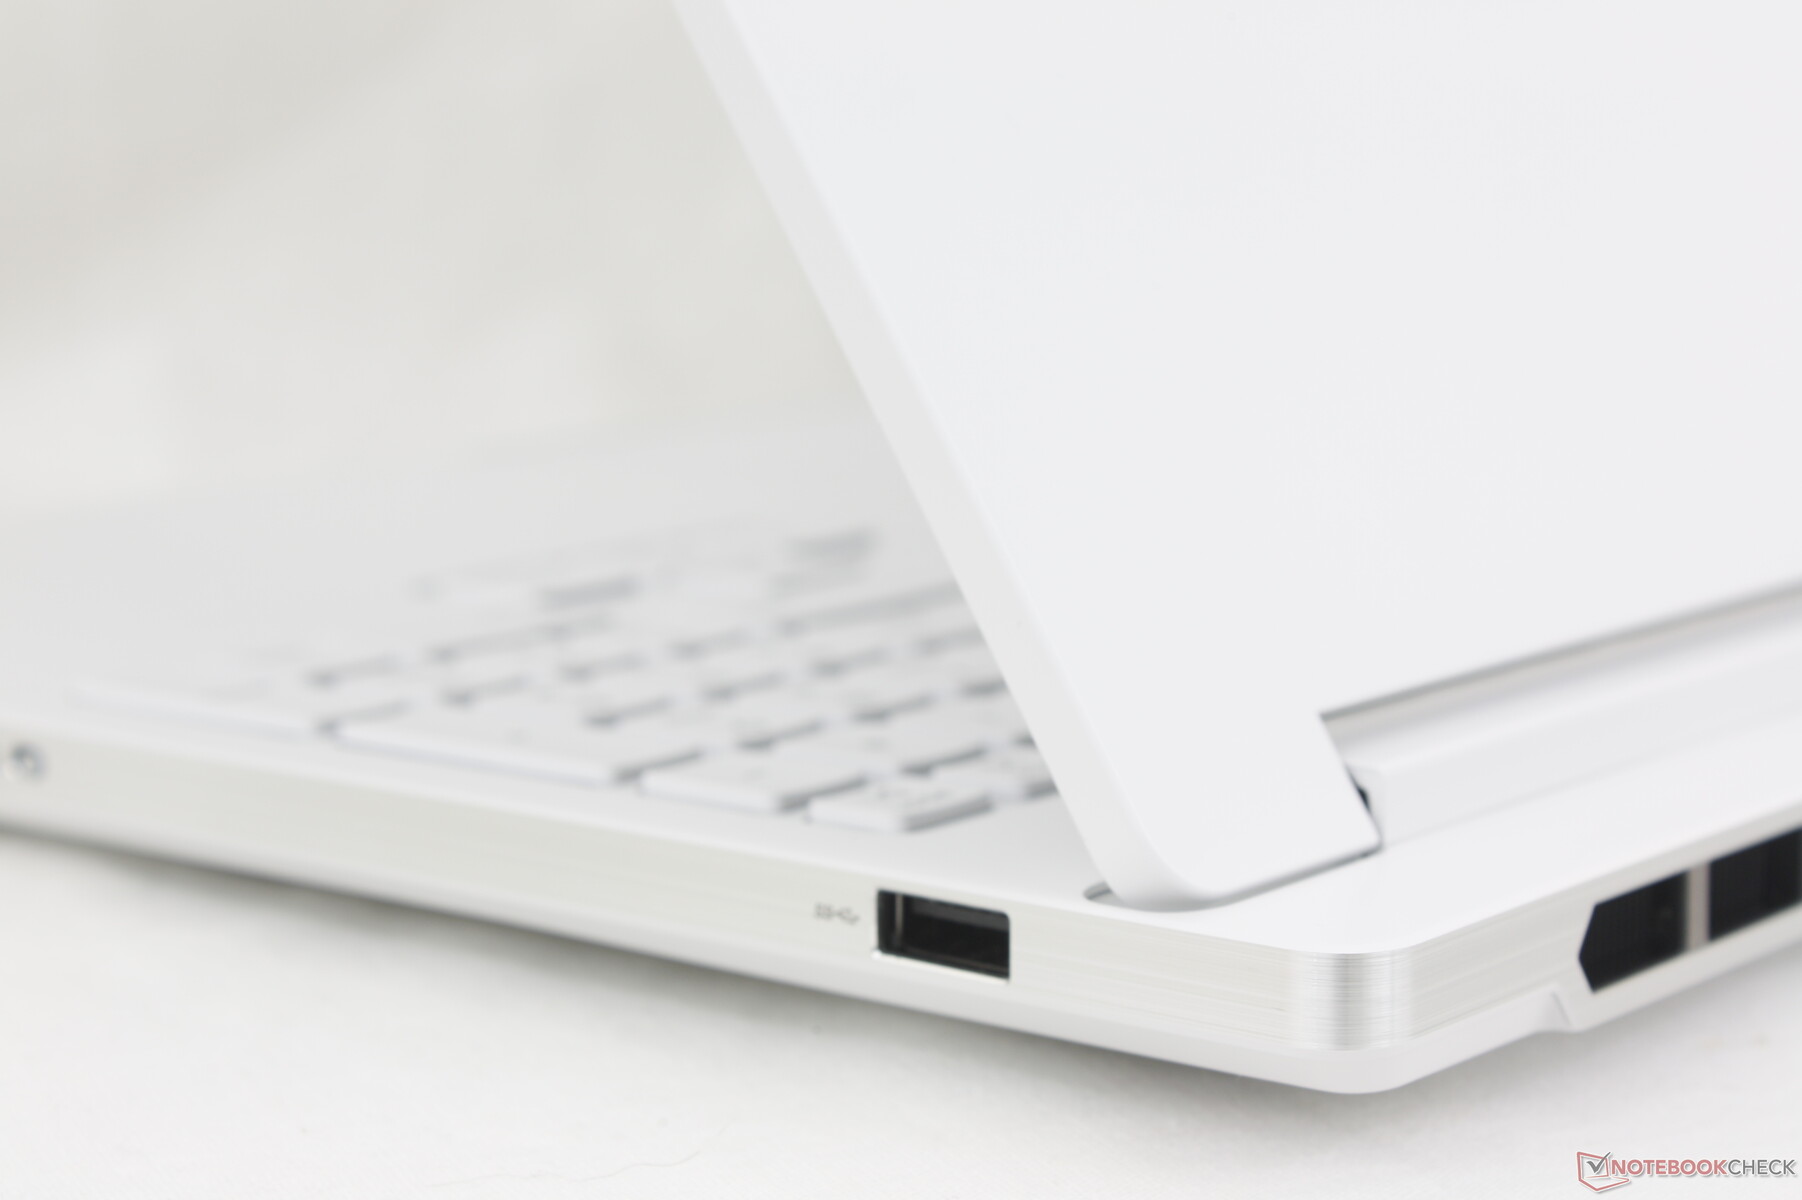
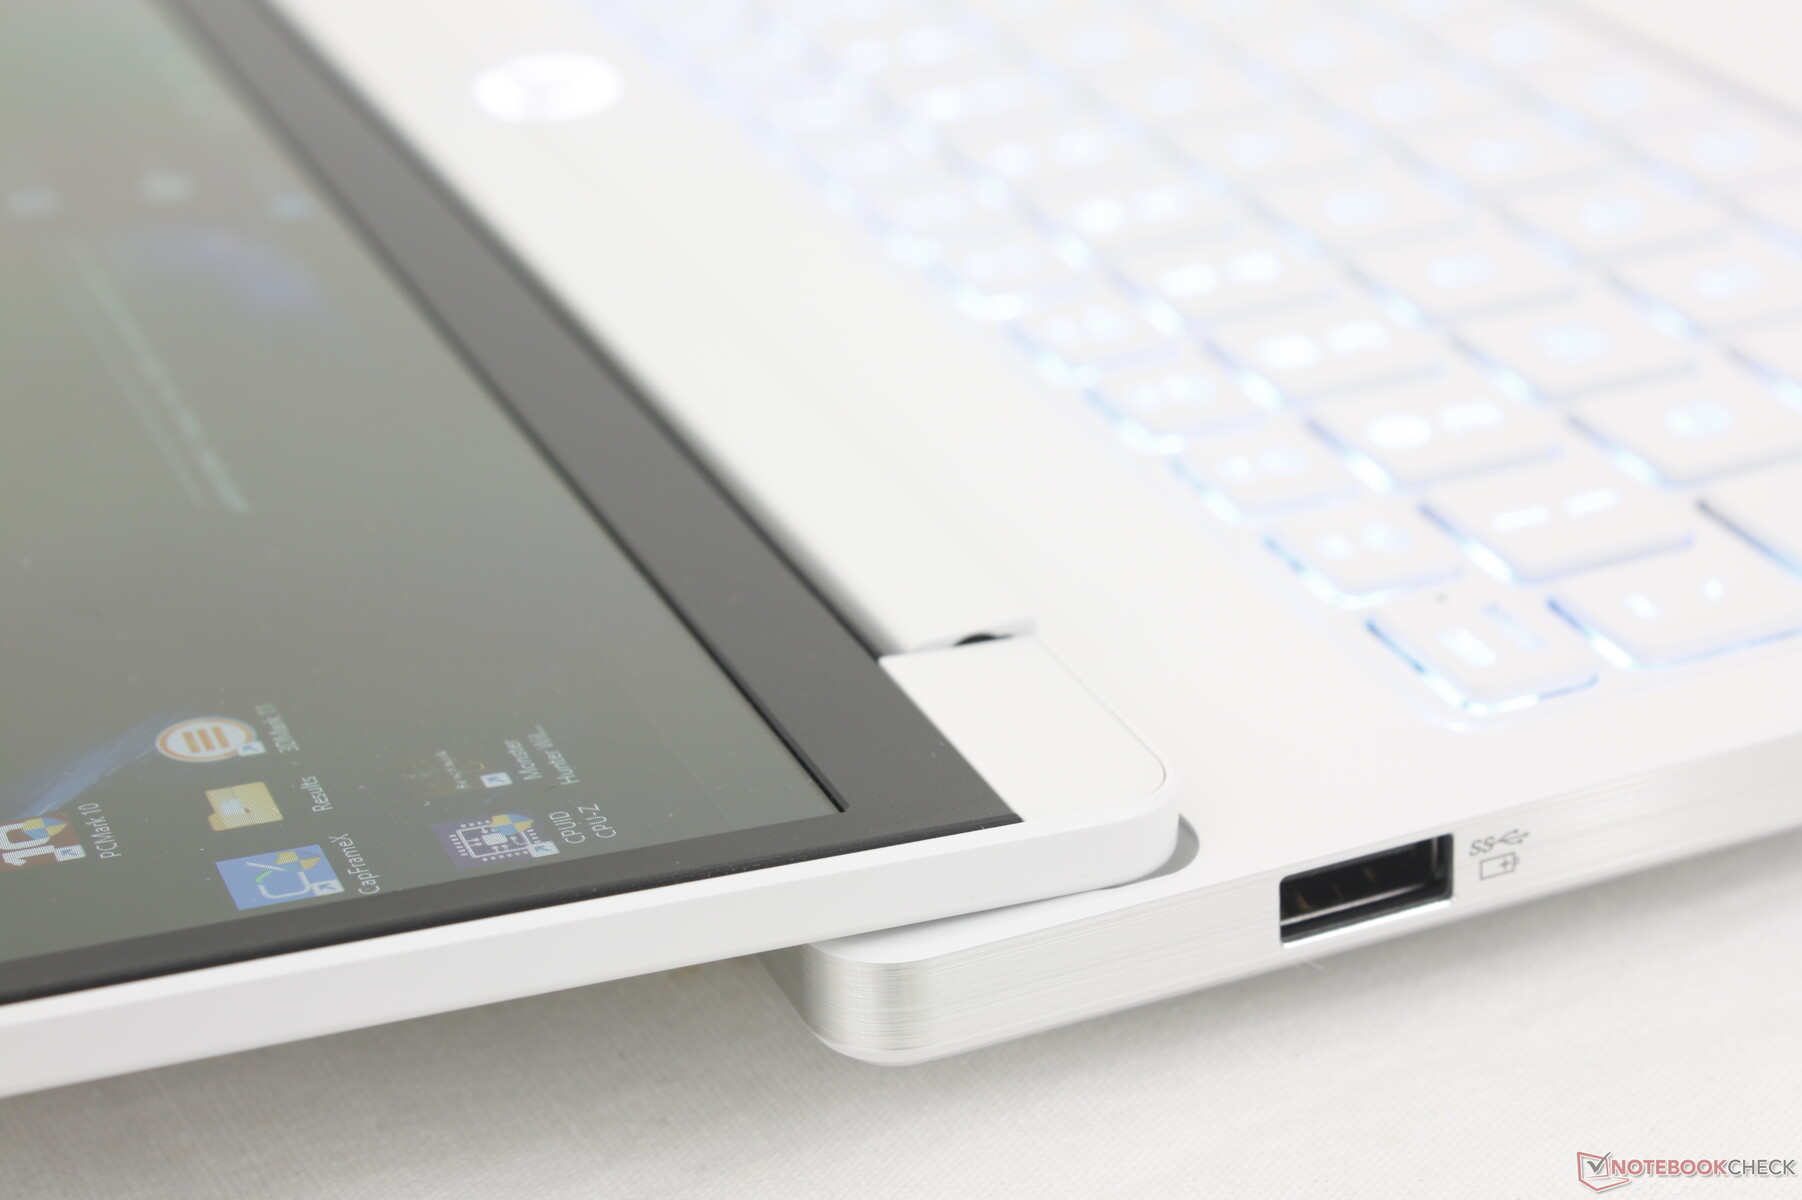
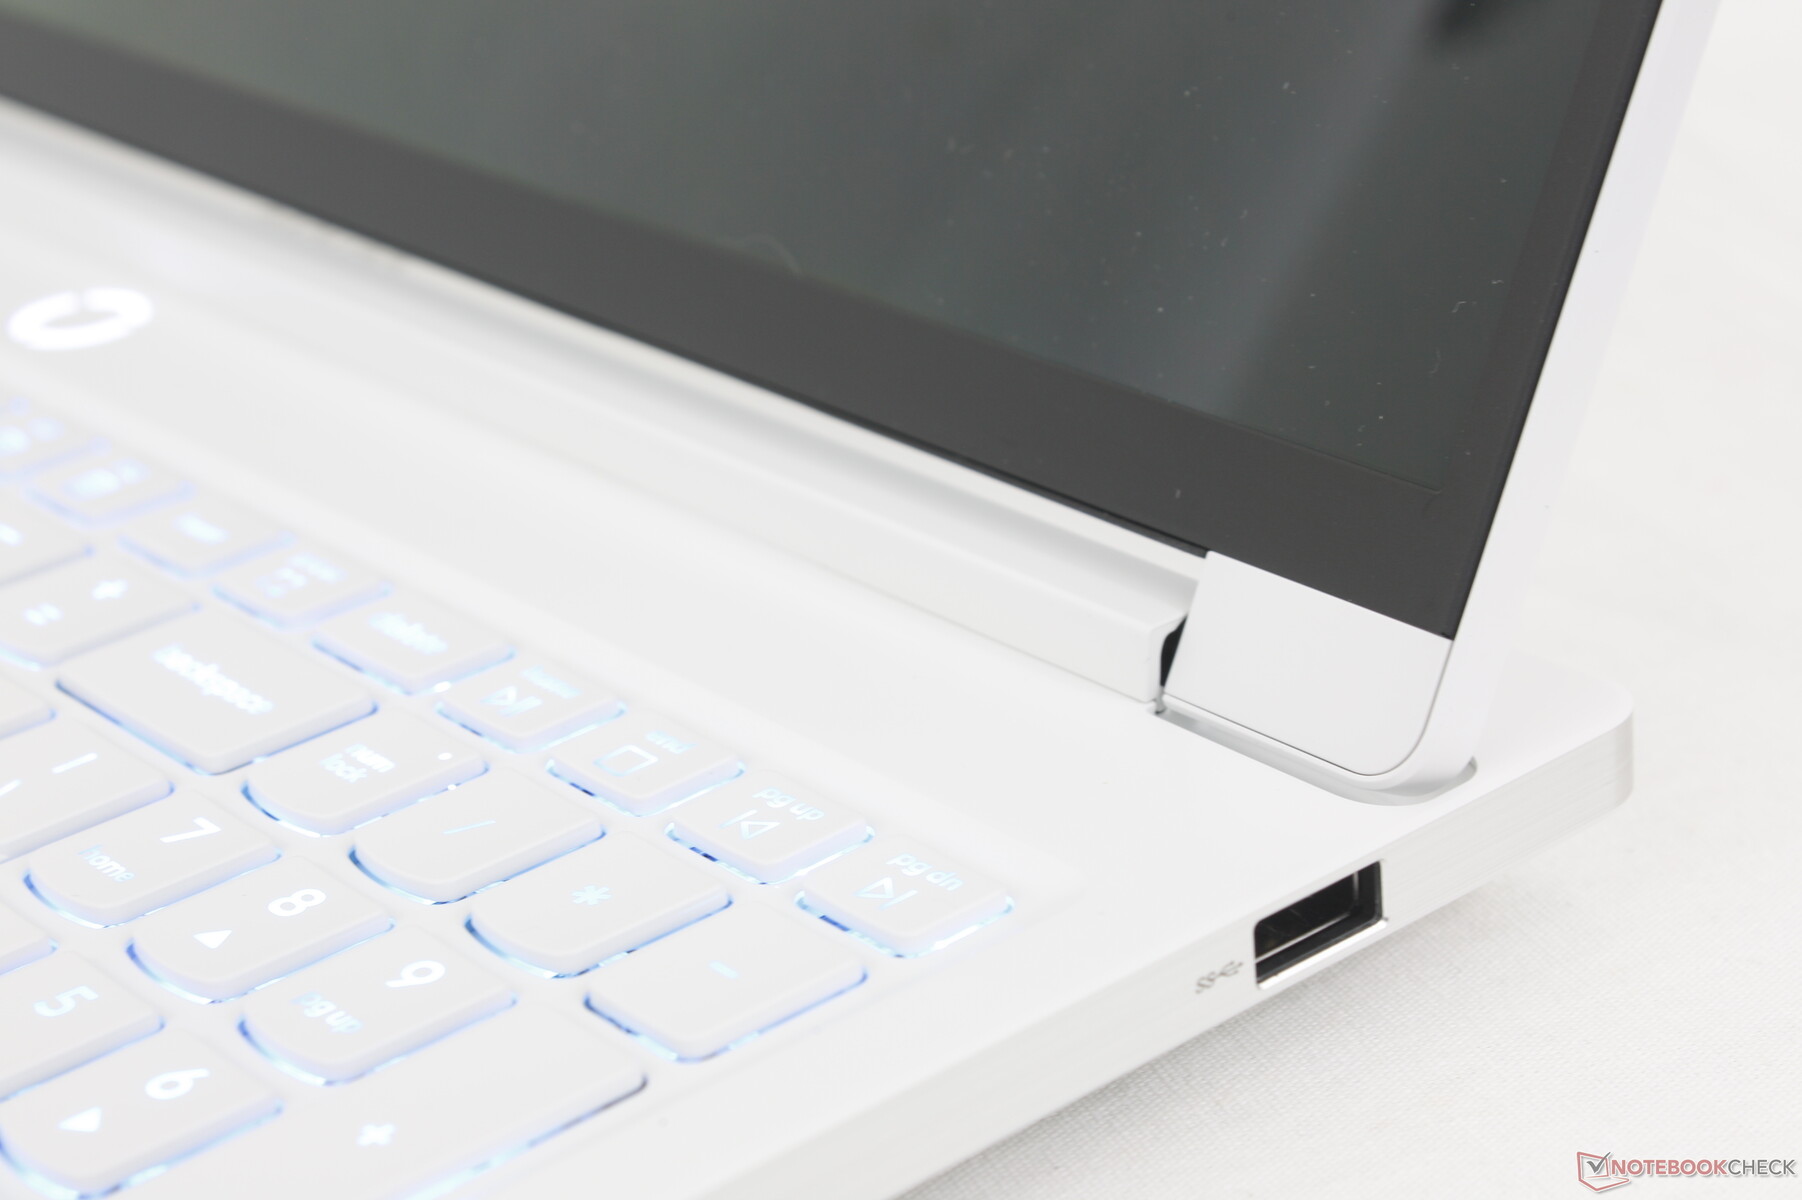
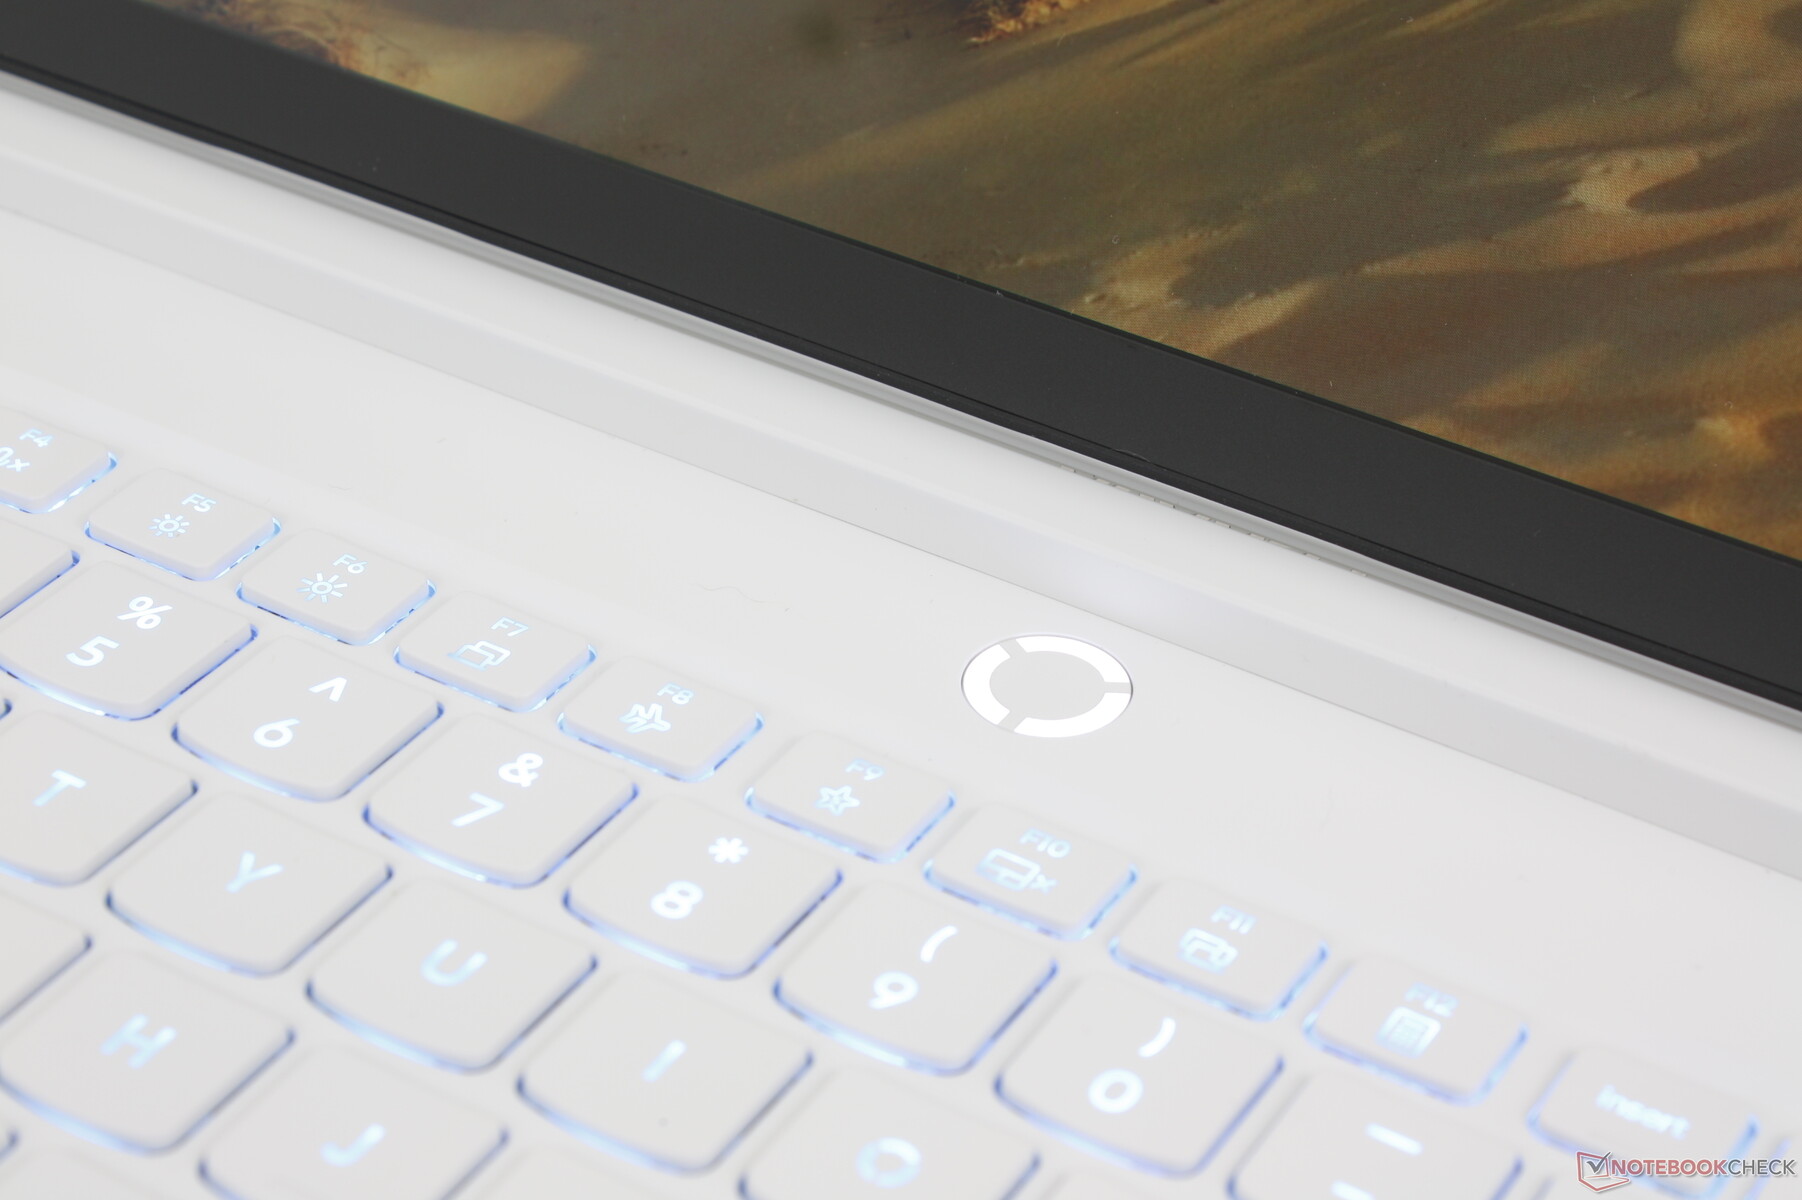
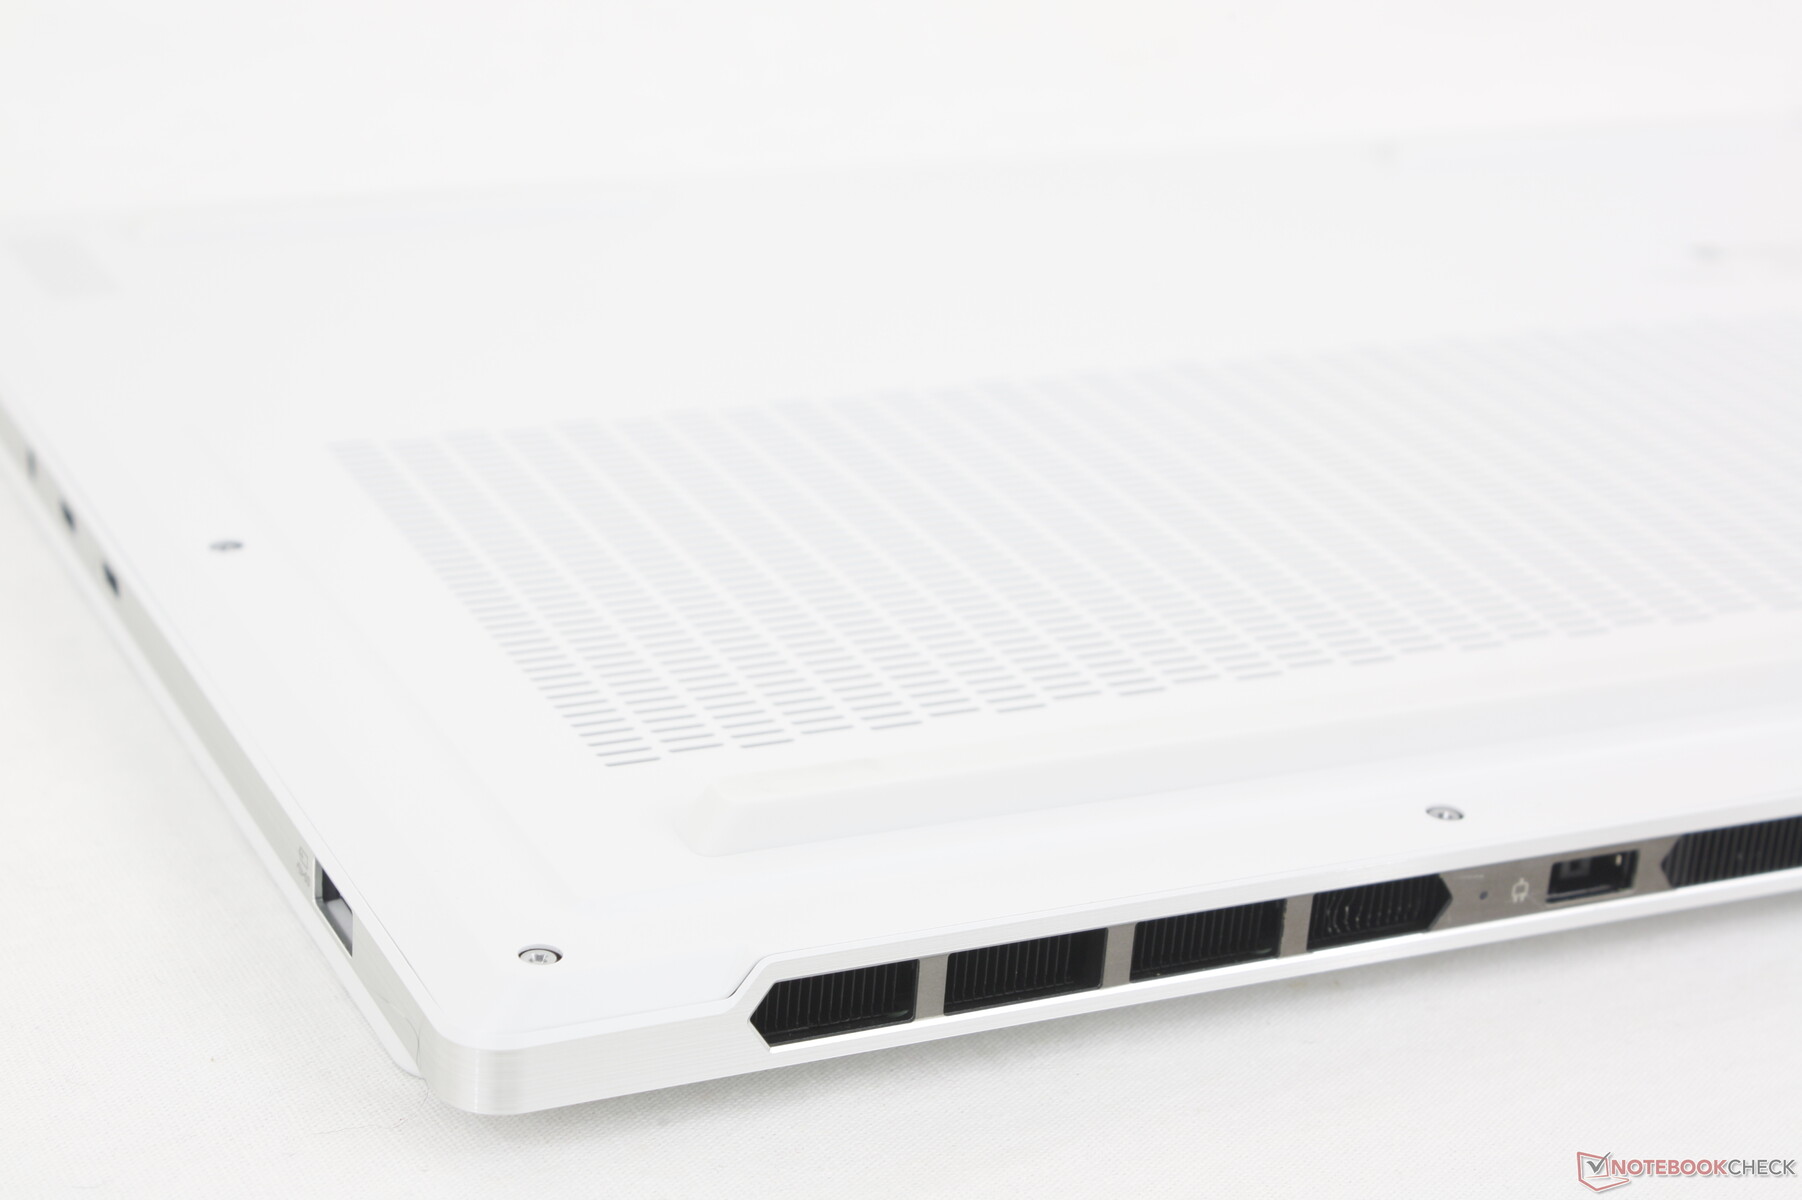
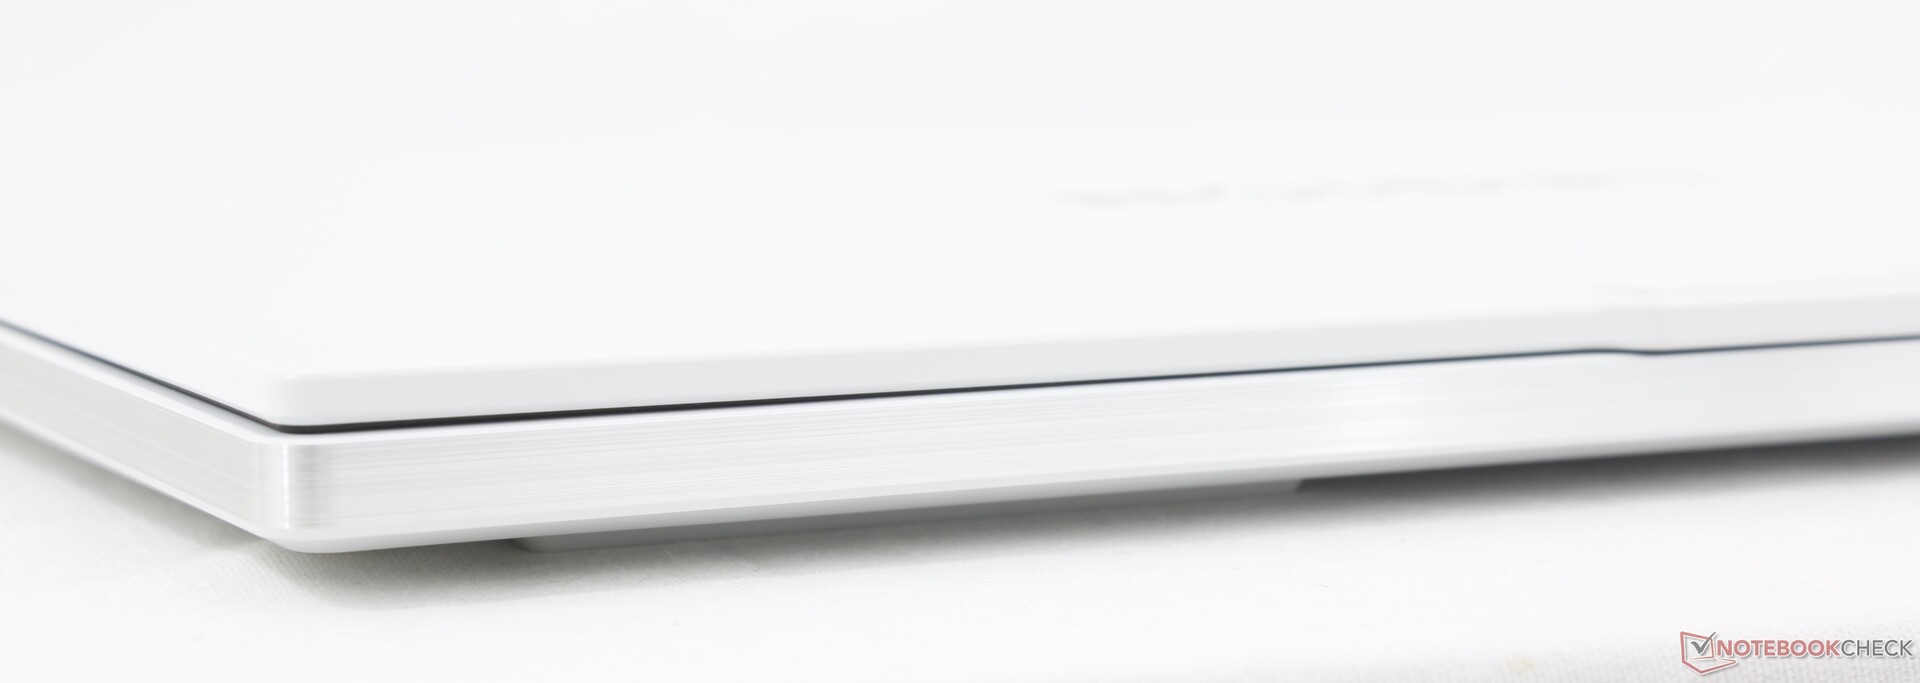
与大多数其他游戏笔记本电脑的深色调不同,这款笔记本电脑的机身采用了白色哑光配色。从美学角度看,白色能很好地隐藏指纹,但划痕和磕碰可能更容易出现。机身外壳采用了与其他大多数Legion 笔记本电脑类似的铝合金材料和阳极氧化外层纹理。
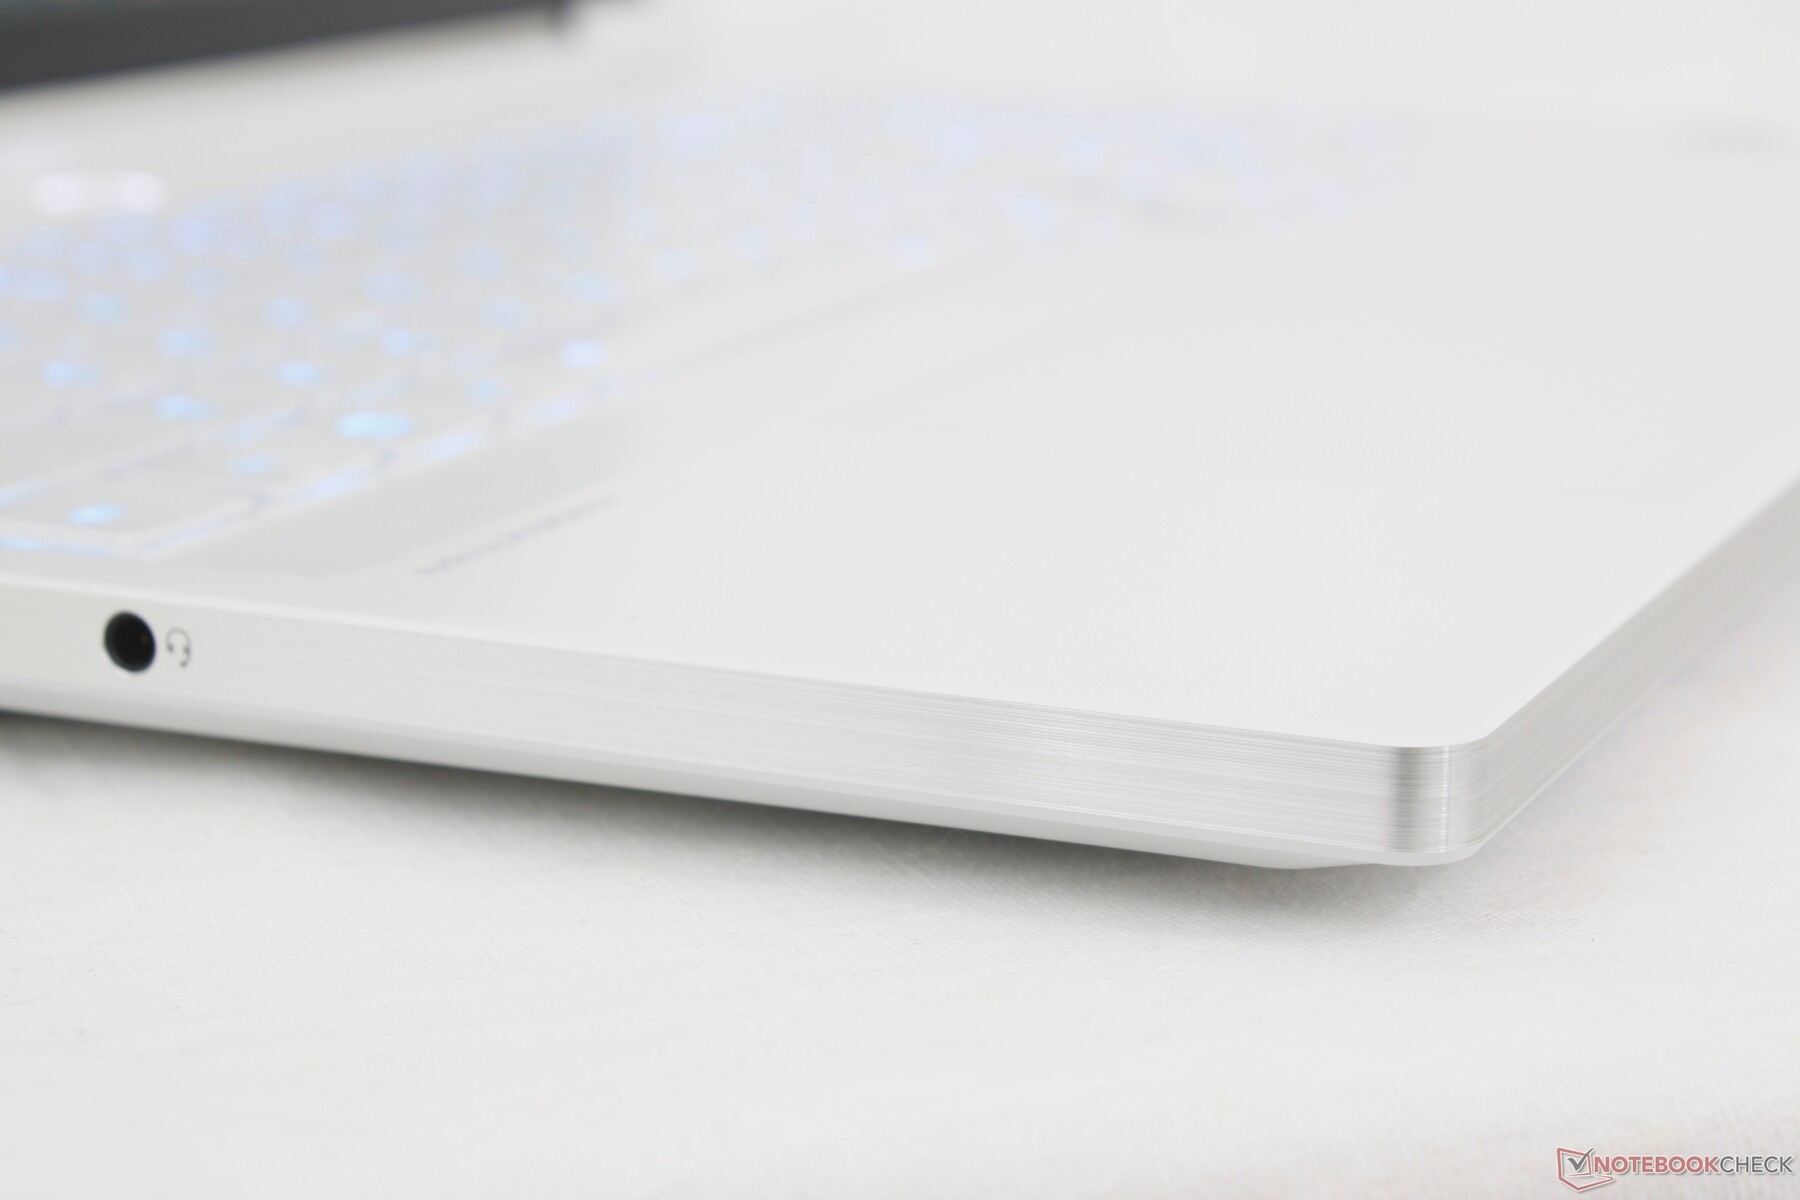
底座的刚性非常好,几乎没有翘曲或弯曲。铰链虽小,但仍令人满意;铰链可完全打开 180 度,但感觉比刀锋 16 的铰链稍弱。 刀锋 16.
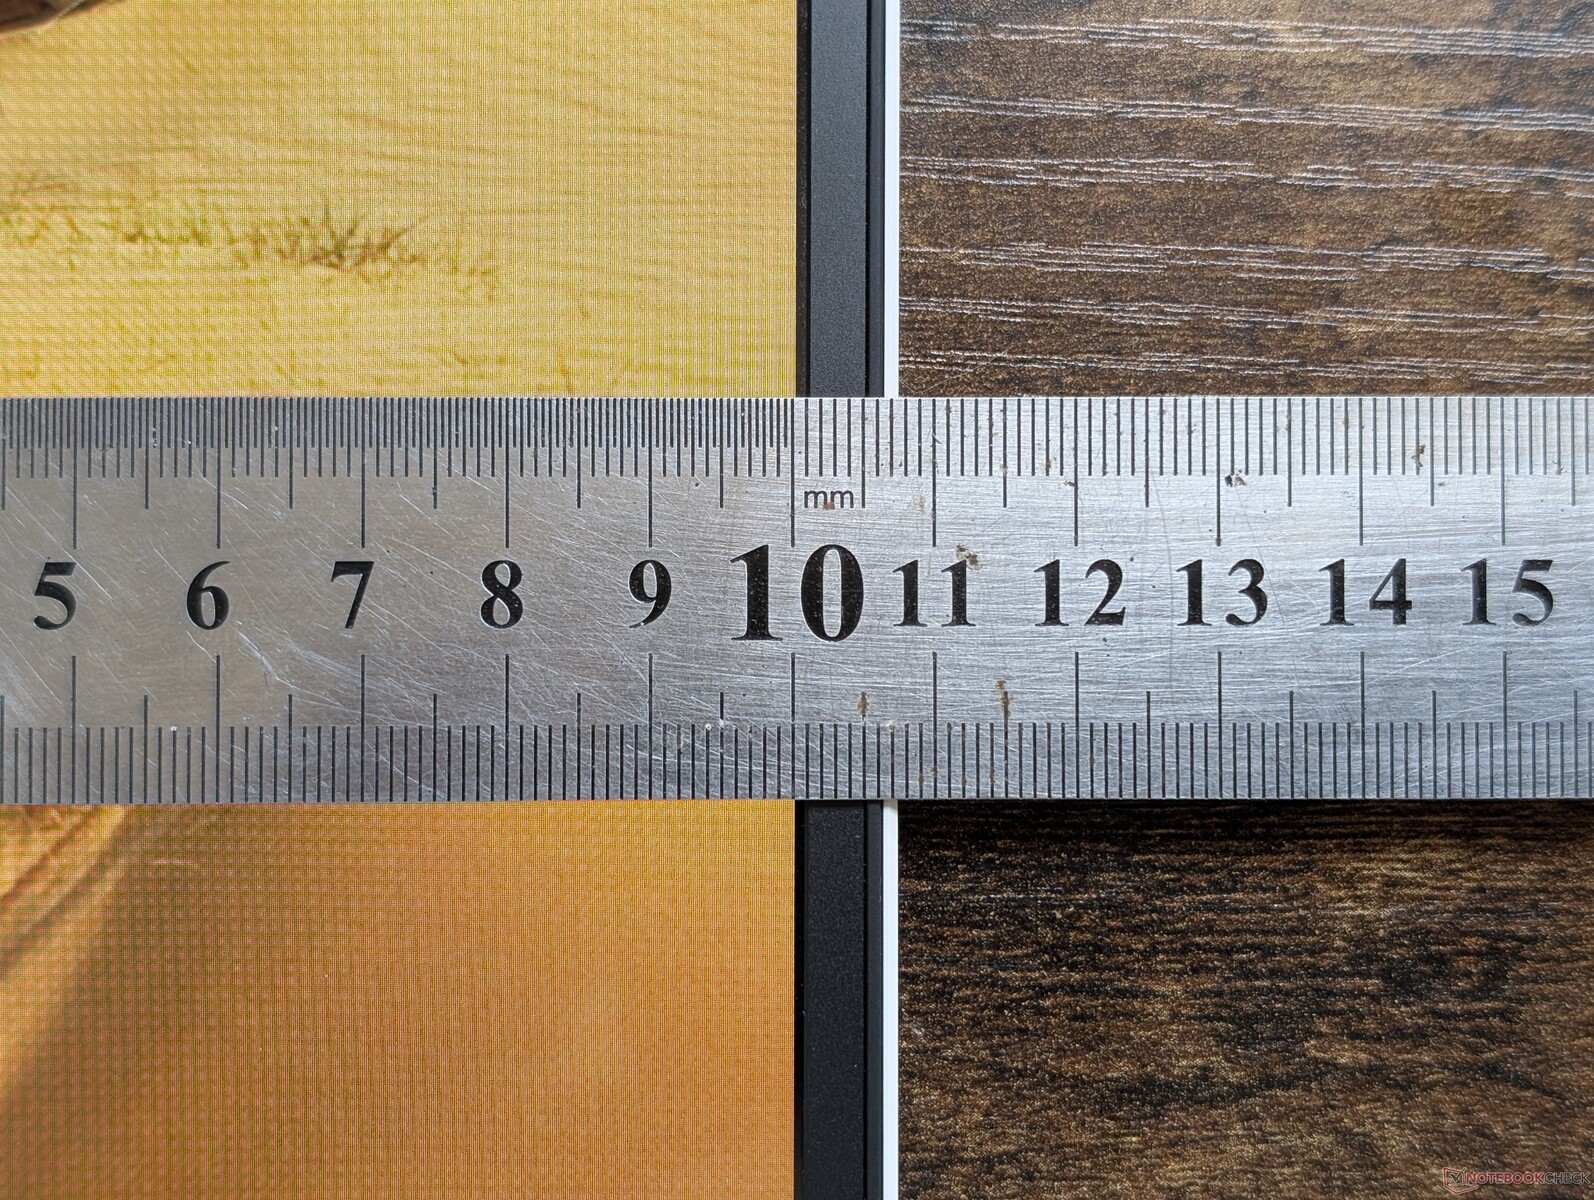
Legion 7 16IAX10 最显著的特点是重量轻,只有不到 2 千克。这比大多数 16 英寸游戏笔记本电脑都要轻得多,甚至包括超轻的 HP Omen Transcend 16或 Razer Blade 16 各轻了 200 克。尽管如此,最近的 Zephyrus G16还要轻 100 克,而联想的尺寸或厚度仍略高于包括上述 Razer 或 Alienware 在内的一些竞争对手。
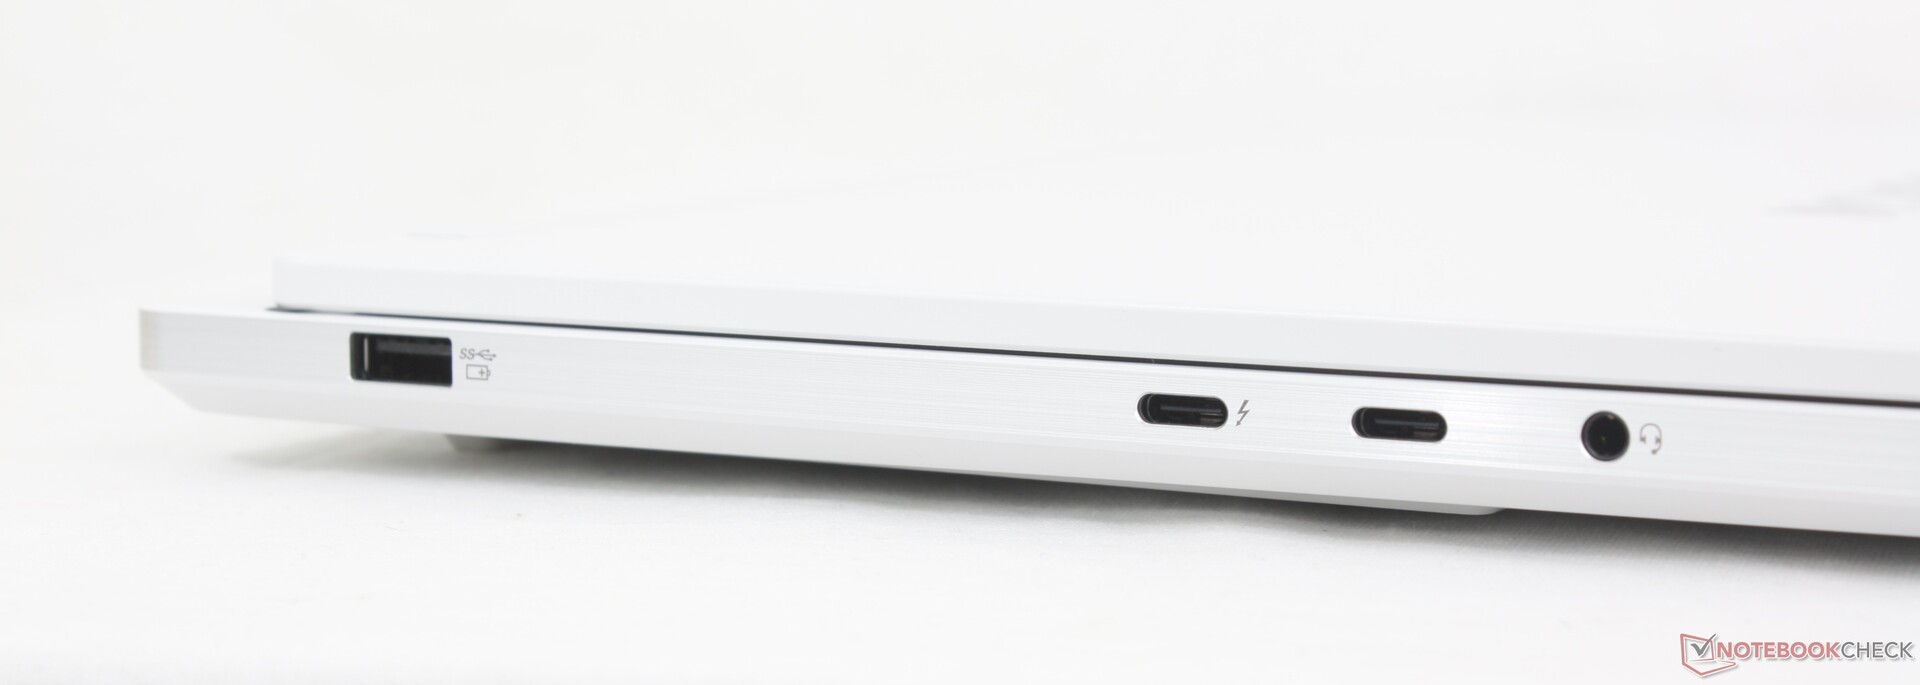
连接性
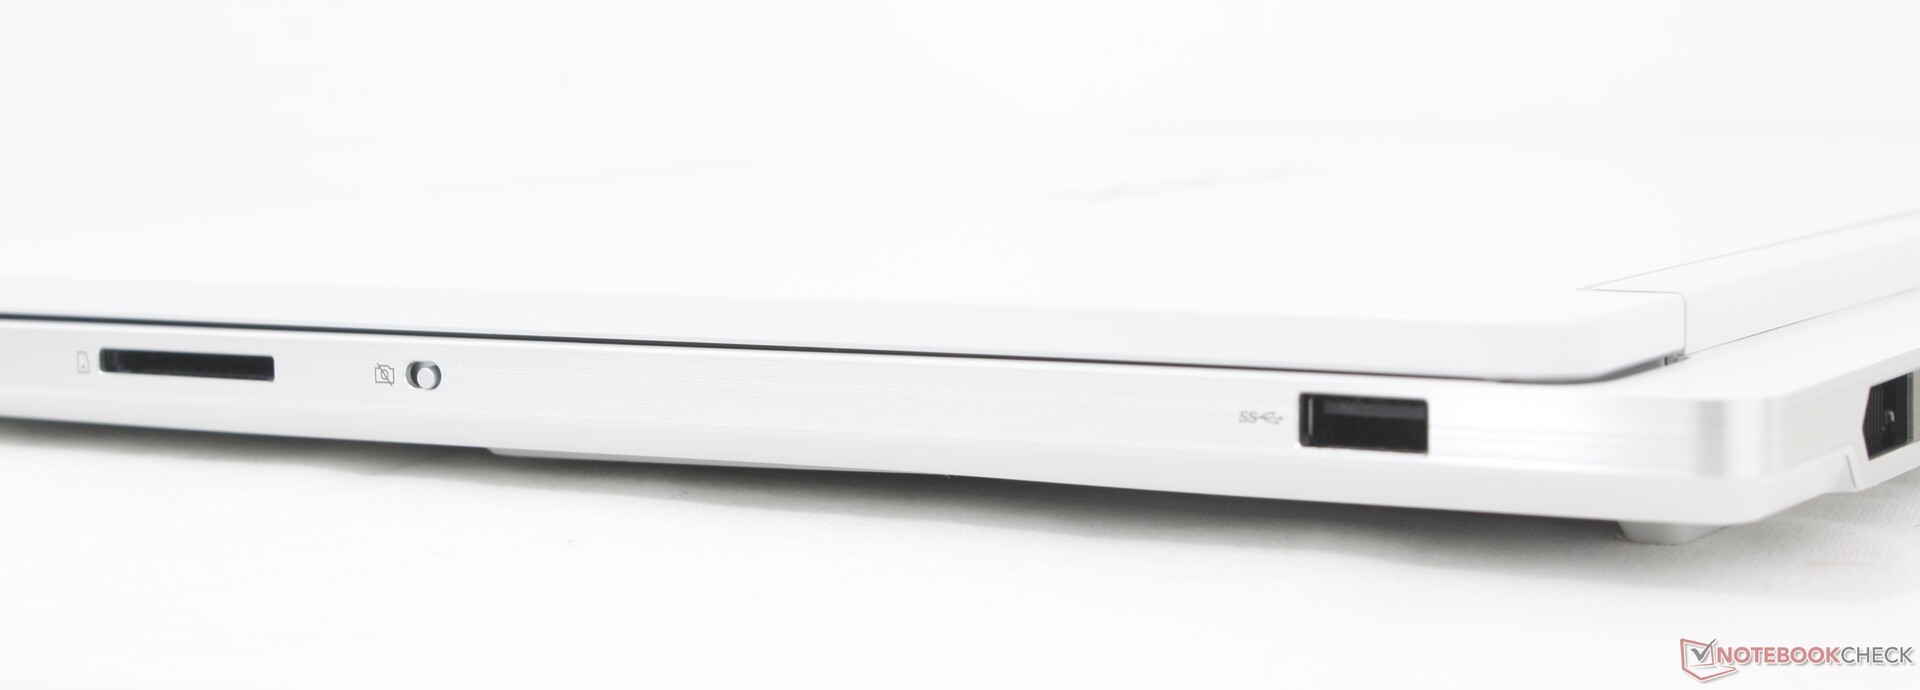
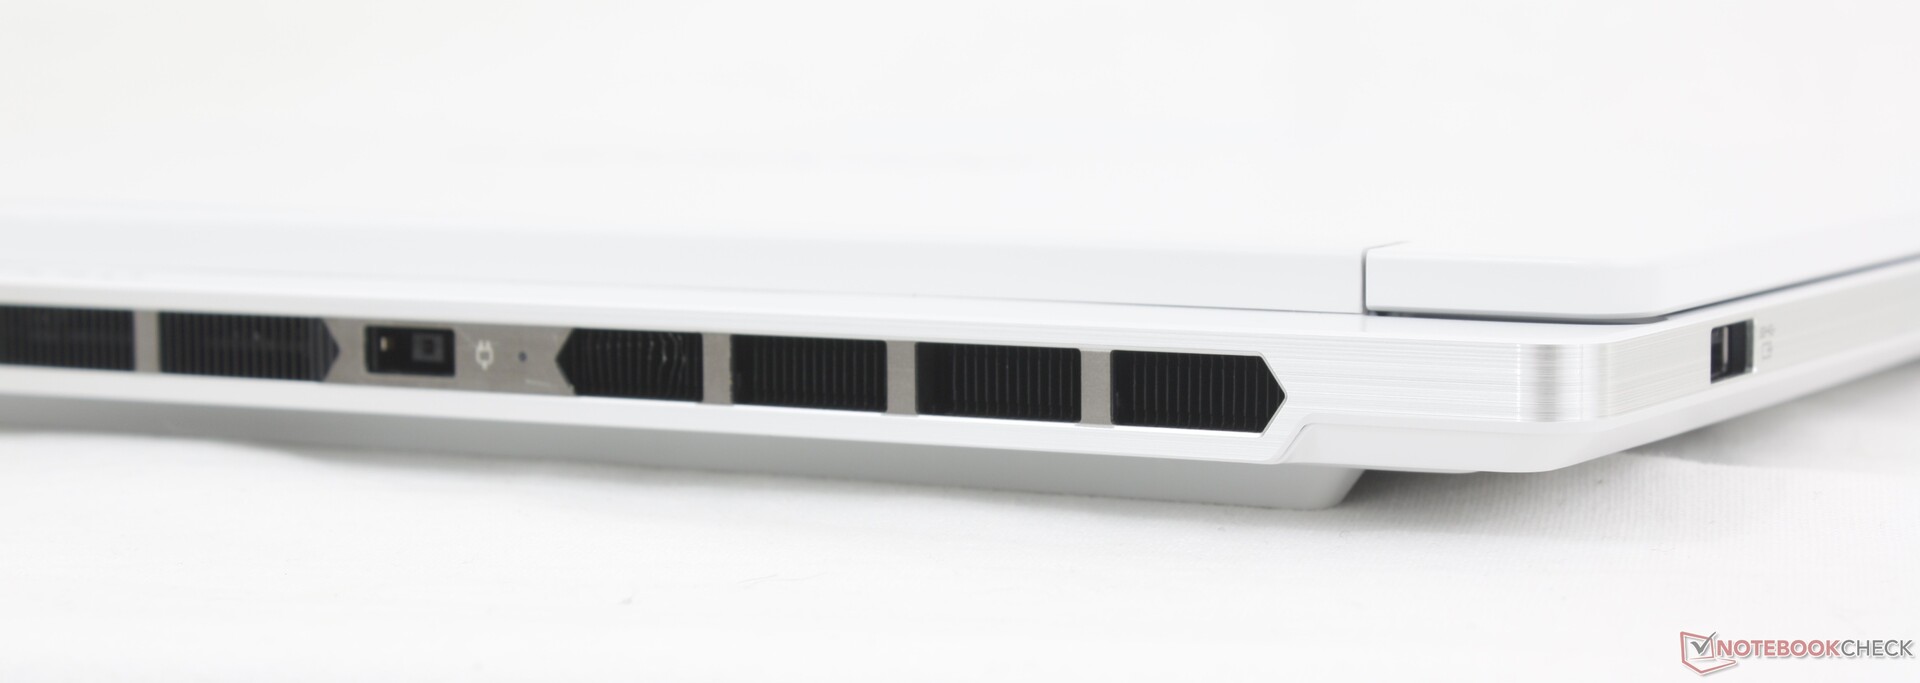
除了右侧边缘的第三个 USB-C 端口外,该系统继承了去年Legion 7 16IRX9 上的所有端口。与同类产品相比,如 华硕 TUF GAMING A16相比,联想的 USB-A 端口更少,而且没有 RJ-45 端口。
请记住,两个 USB-C 端口中只有一个支持 USB4 或 Thunderbolt 4 配件。
SD 读卡器
| SD Card Reader | |
| average JPG Copy Test (av. of 3 runs) | |
| Lenovo Legion 7 16IAX10 (Toshiba Exceria Pro SDXC 64 GB UHS-II) | |
| MSI Vector 16 HX AI A2XWHG (AV PRO microSD 128 GB V60) | |
| maximum AS SSD Seq Read Test (1GB) | |
| Lenovo Legion 7 16IAX10 (Toshiba Exceria Pro SDXC 64 GB UHS-II) | |
| MSI Vector 16 HX AI A2XWHG (AV PRO microSD 128 GB V60) | |
交流
| Networking | |
| iperf3 transmit AXE11000 | |
| Asus TUF Gaming A16 FA608UP | |
| Gigabyte Gaming A16 GA6H | |
| Lenovo Legion 7 16IAX10 | |
| MSI Vector 16 HX AI A2XWHG | |
| Lenovo Legion 5 Pro 16IAX10H | |
| iperf3 receive AXE11000 | |
| Asus TUF Gaming A16 FA608UP | |
| MSI Vector 16 HX AI A2XWHG | |
| Gigabyte Gaming A16 GA6H | |
| Lenovo Legion 7 16IAX10 | |
| Lenovo Legion 5 Pro 16IAX10H | |
| iperf3 transmit AXE11000 6GHz | |
| Lenovo Legion 7 16IAX10 | |
| iperf3 receive AXE11000 6GHz | |
| Lenovo Legion 7 16IAX10 | |
网络摄像头
标配 500 万像素网络摄像头,带红外和电子快门。


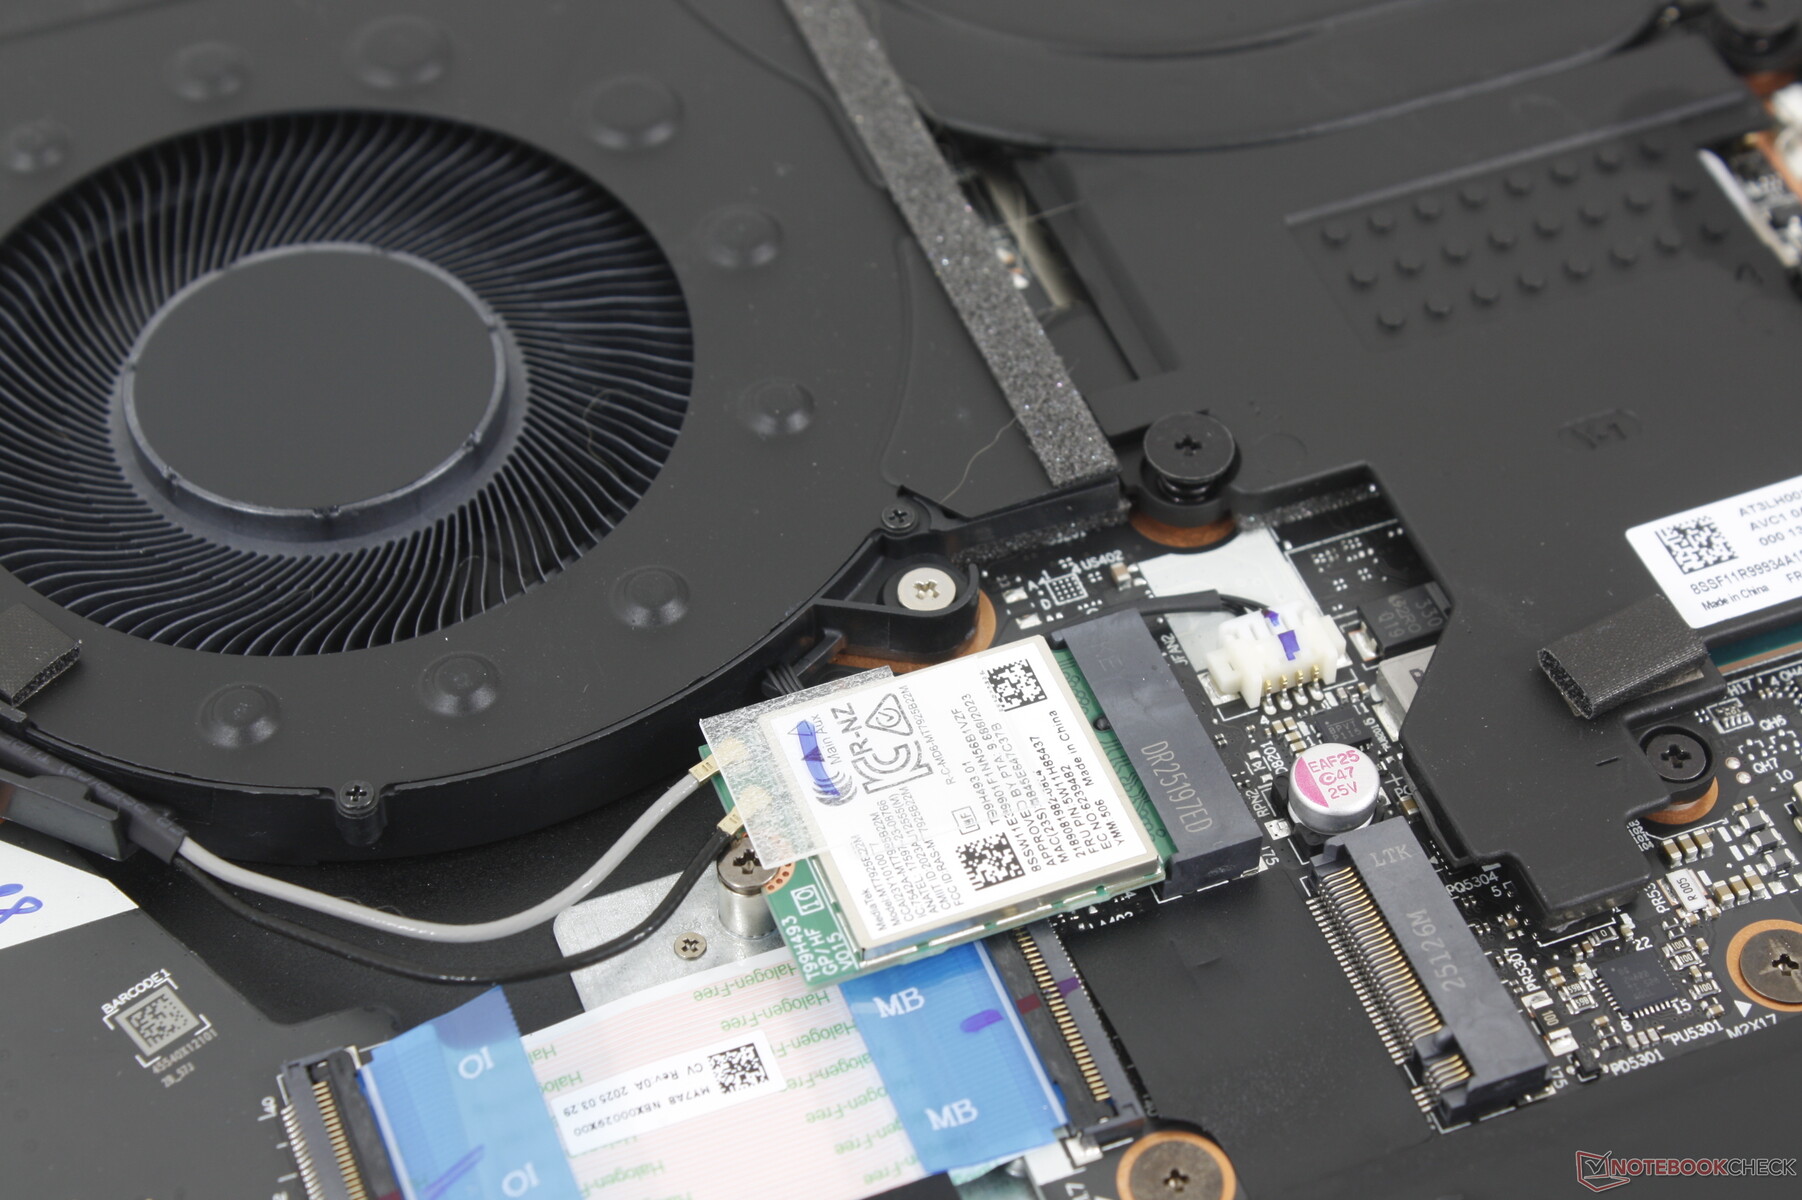
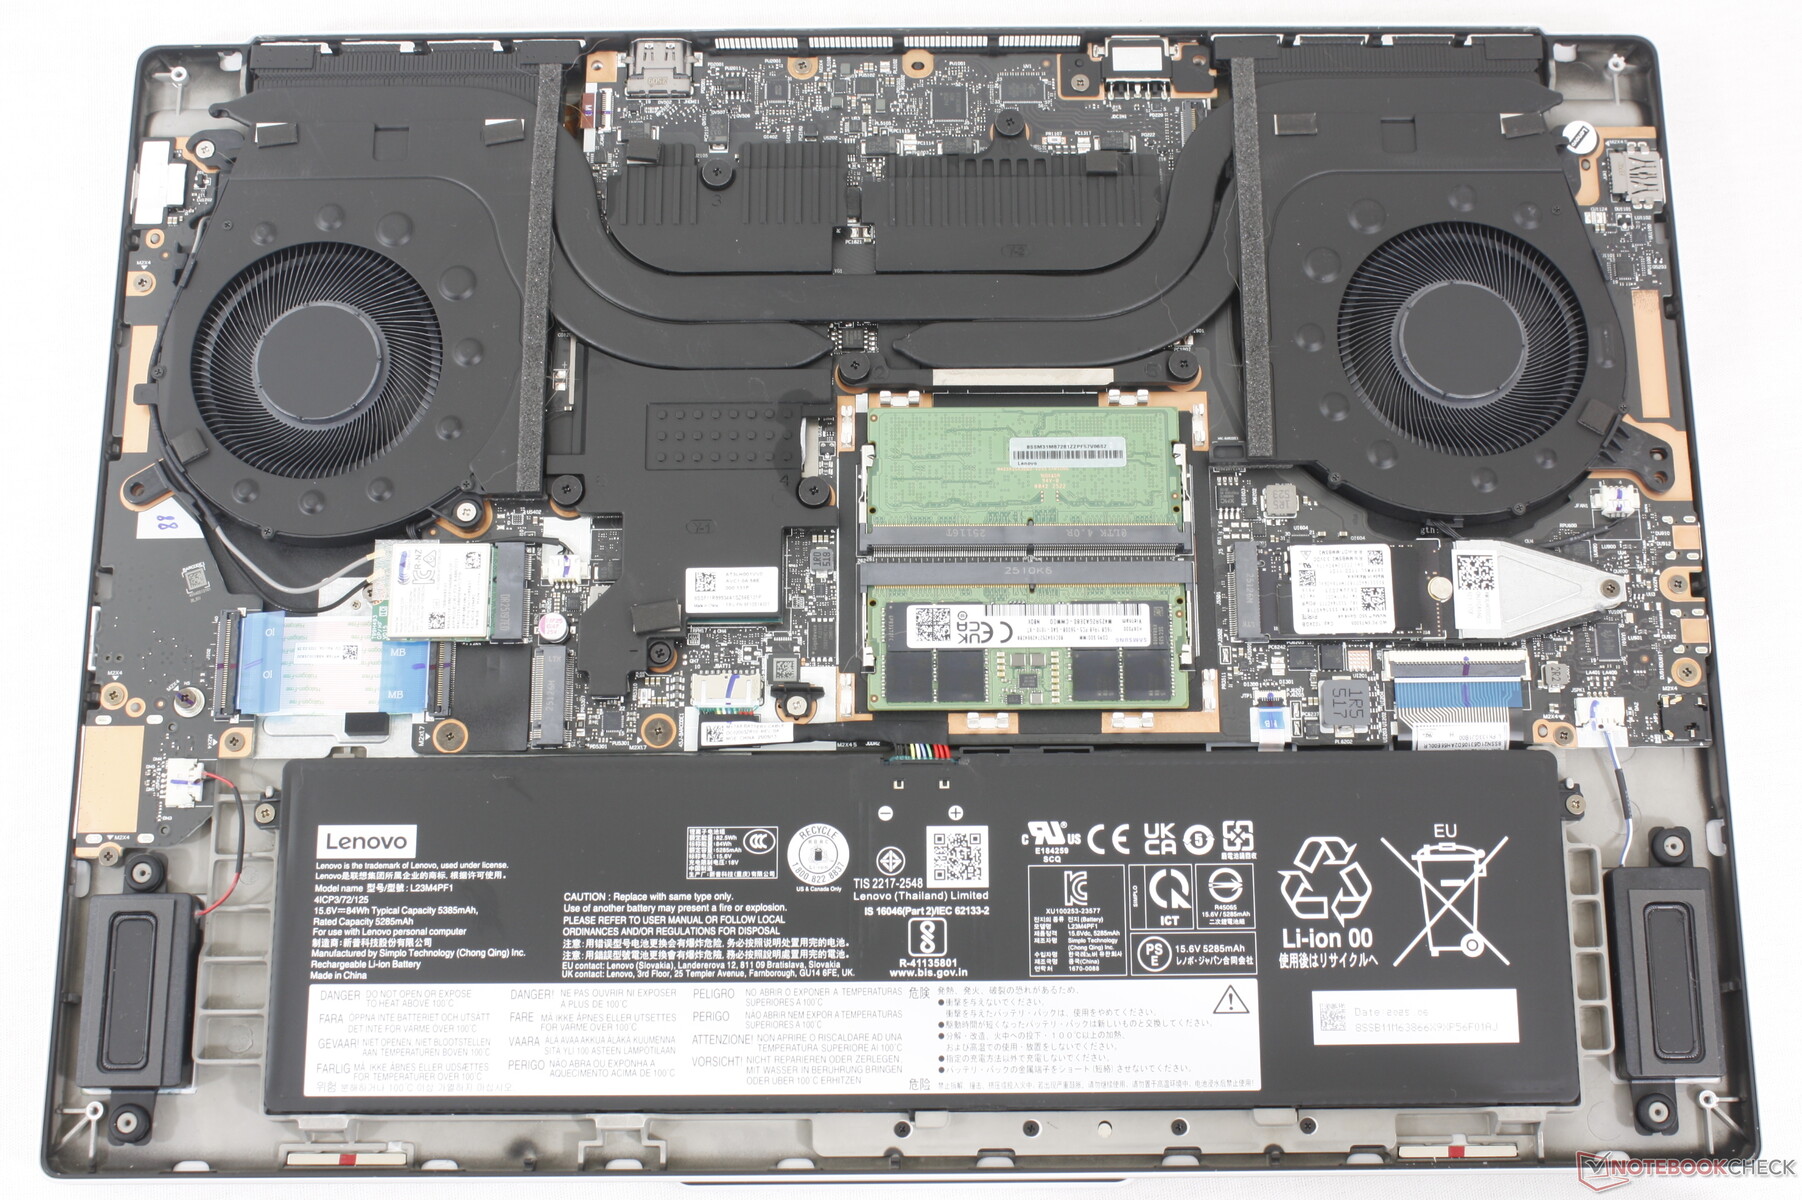
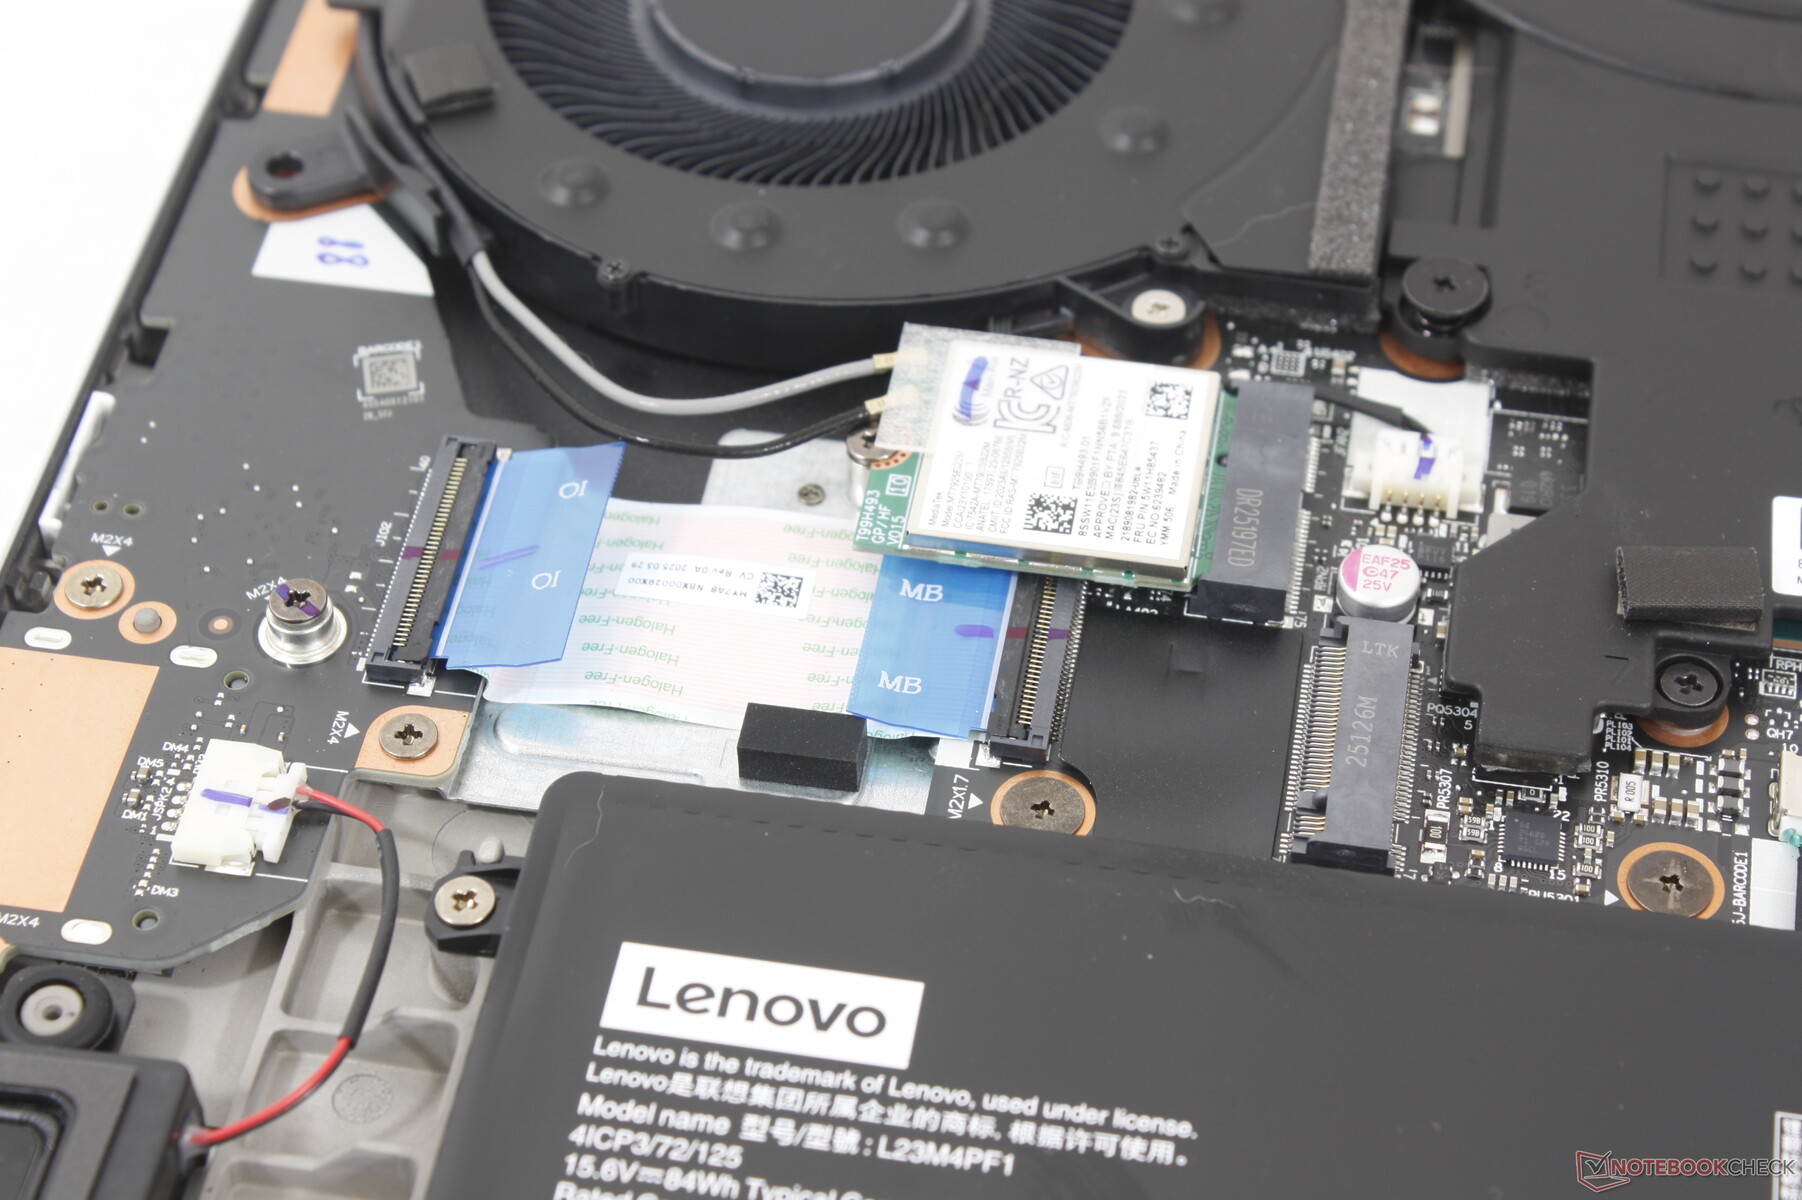
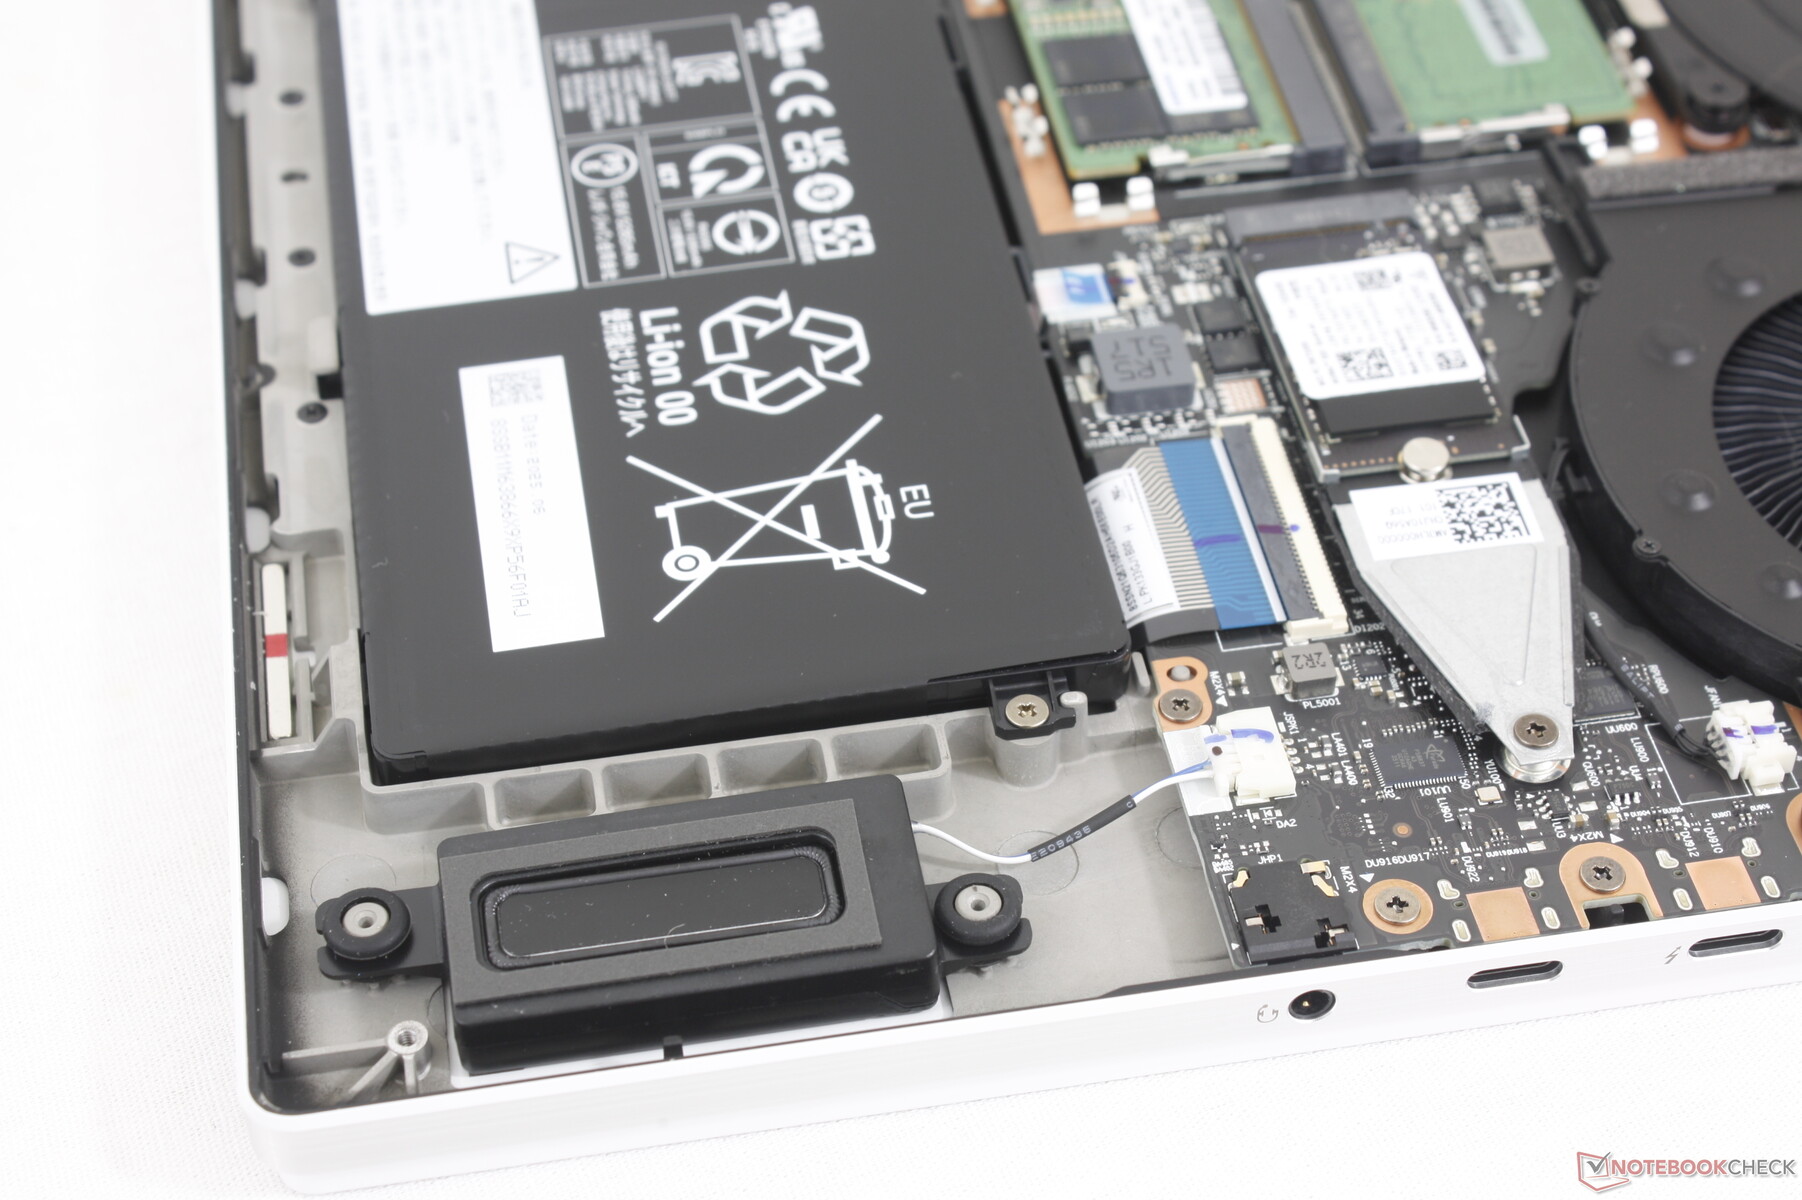
维护
使用十字螺丝刀可轻松拆下底部面板,露出两个 DDR5 SODIMM 插槽和两个 M.2 2280 PCIe4 x4 SSD 插槽。
可持续性
联想没有提及该机型在制造过程中使用了可回收材料。零售包装盒由纸张和塑料包装组成,其中塑料包装由 90% 的海洋塑料组成。
配件和保修
零售包装盒内除了交流适配器和文件外,没有任何其他附件。如果在美国购买,通常适用一年有限制造商保修。
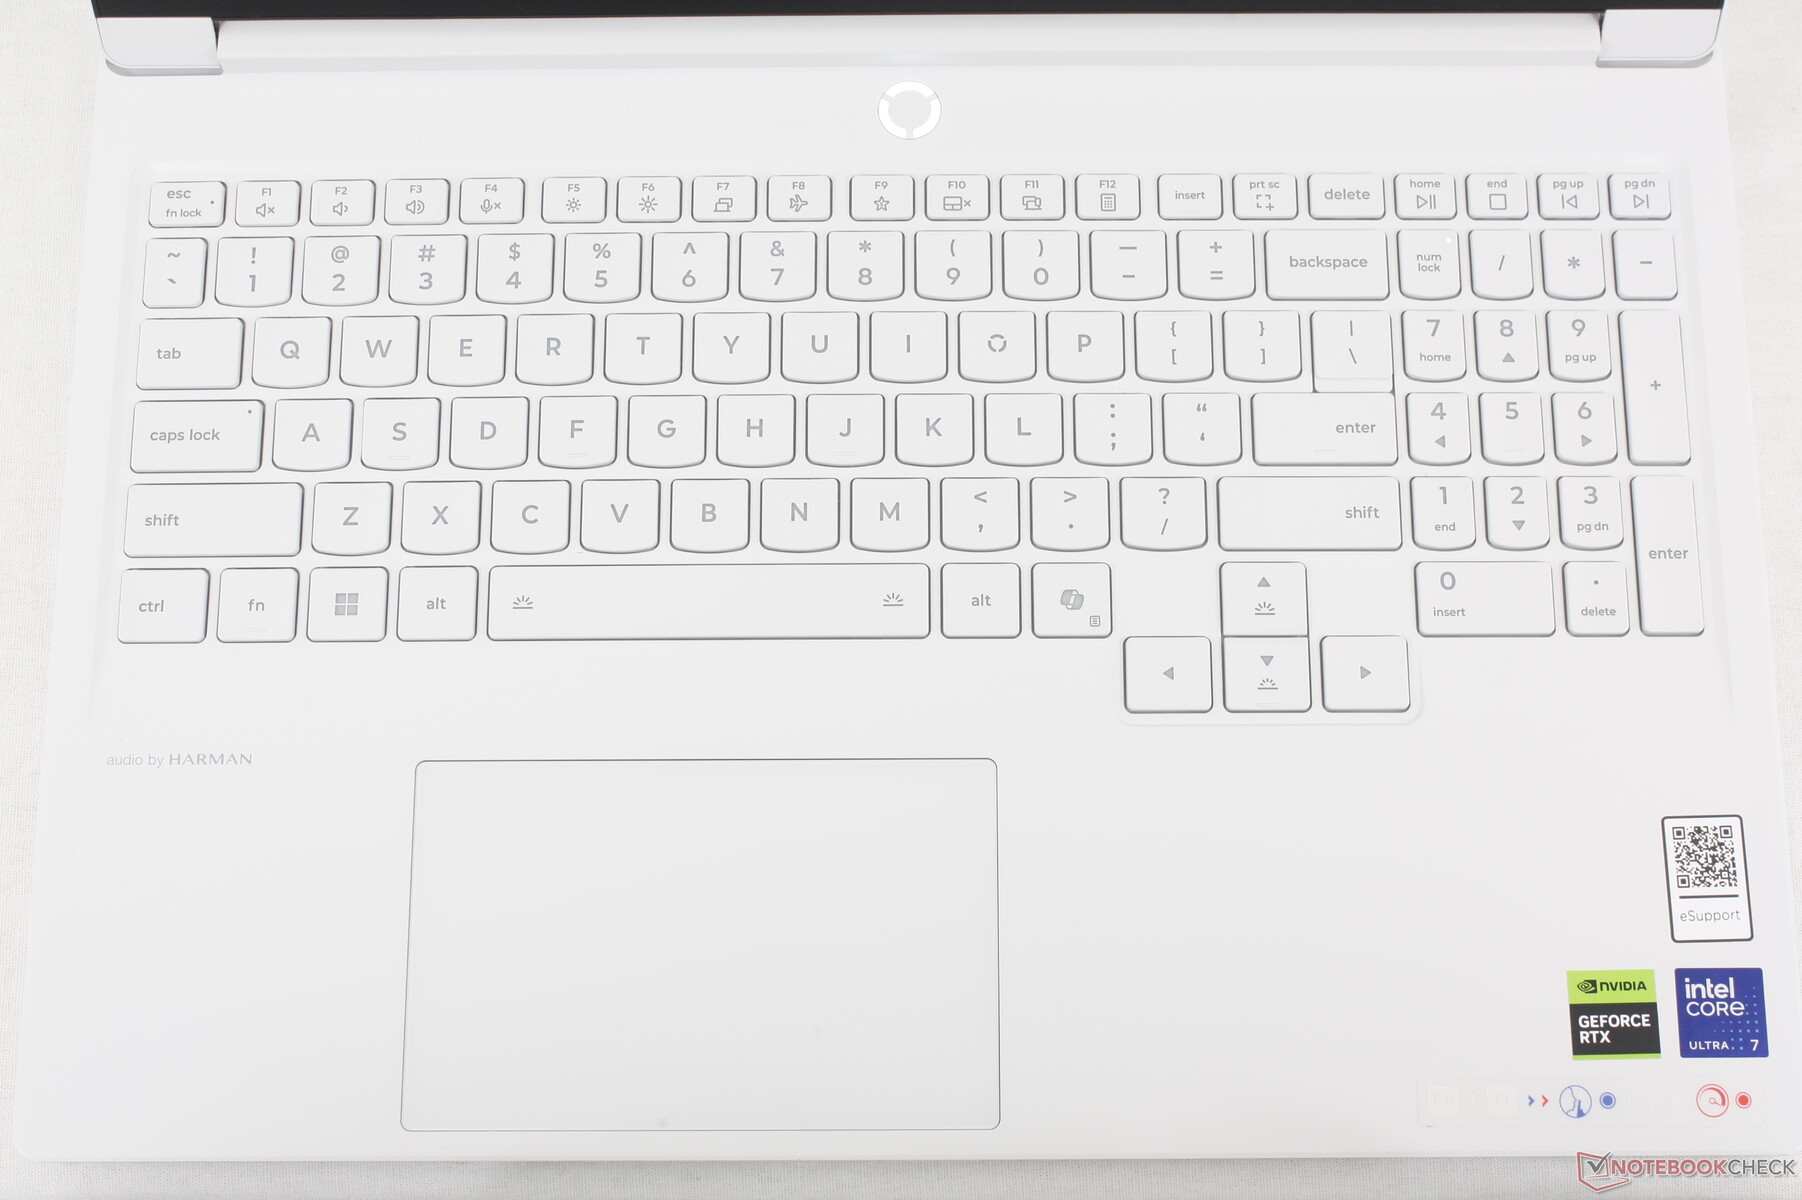
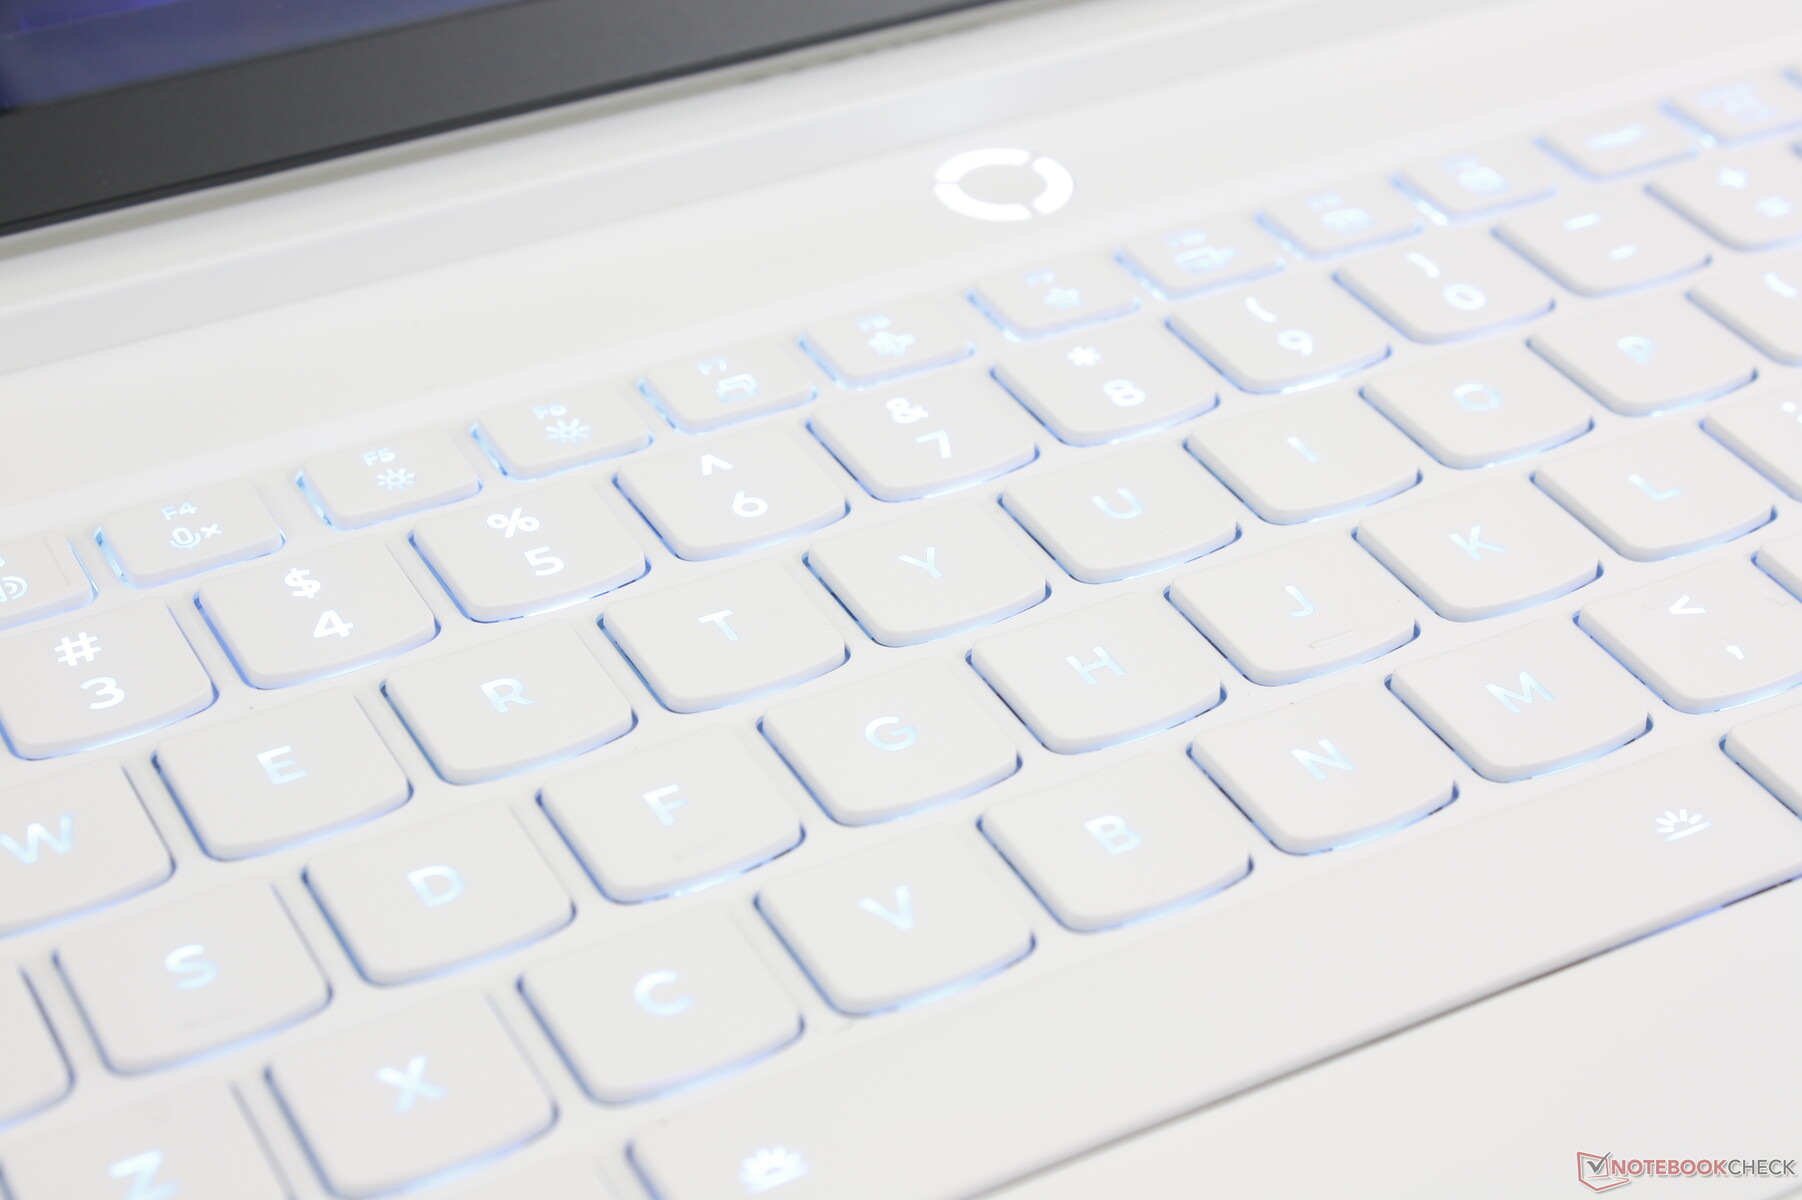
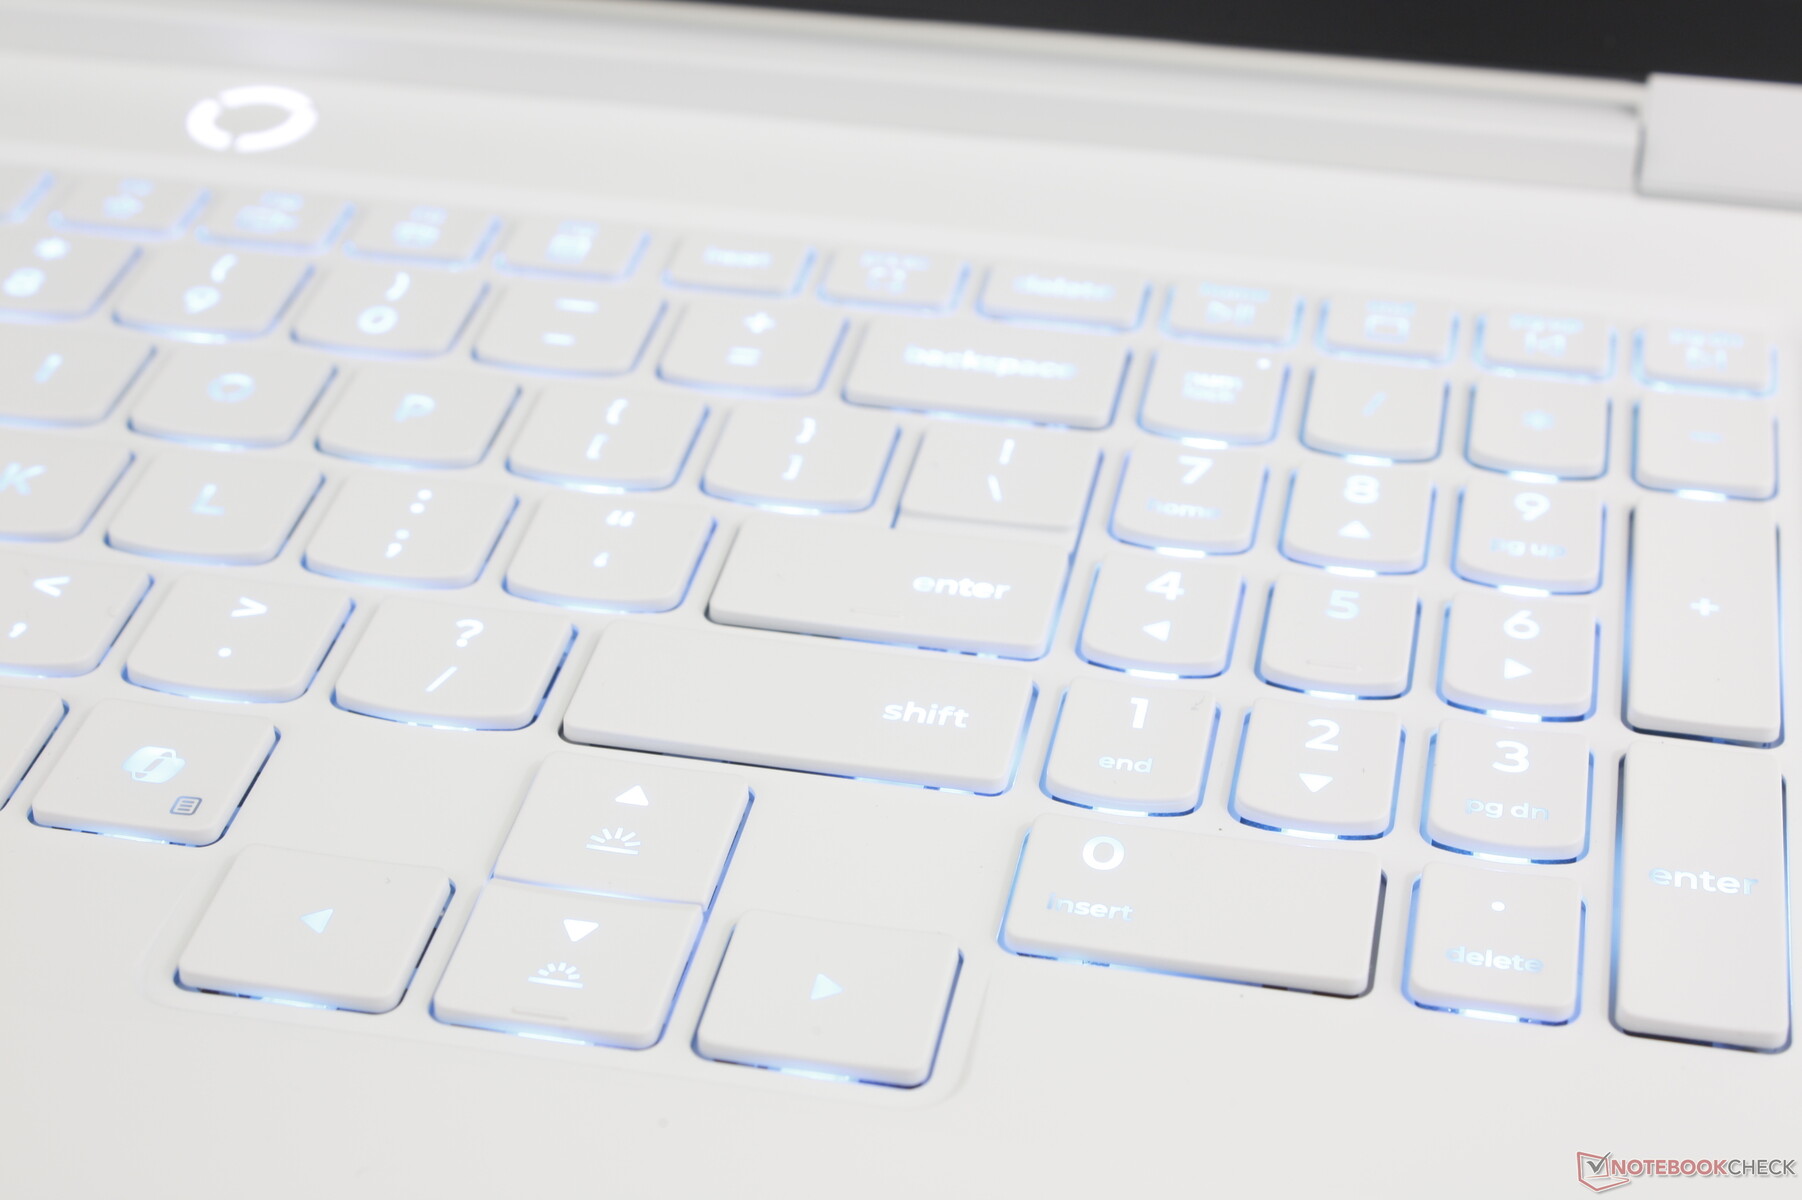
输入设备
键盘
尽管尺寸和价格不同,但输入体验与最近推出的 18 英寸Legion 9 18 旗舰机型完全相同。事实上,两款产品的键盘和布局完全相同。与大多数其他游戏笔记本电脑相比,按键的反馈更清晰,但也带来了更大的噪音。
触摸板
点击板的尺寸为 12 x 7.5 厘米,与Legion 5 Pro 16 上的点击板尺寸相同,仅比 5 Pro 16 上的点击板稍大一些。 Alienware 16X Aurora.尽管如此,它的尺寸还是偏小,尤其是在垂直光标控制方面。空格键和点击板之间有大量未使用的空间,本可以用来制作更宽敞的点击板。

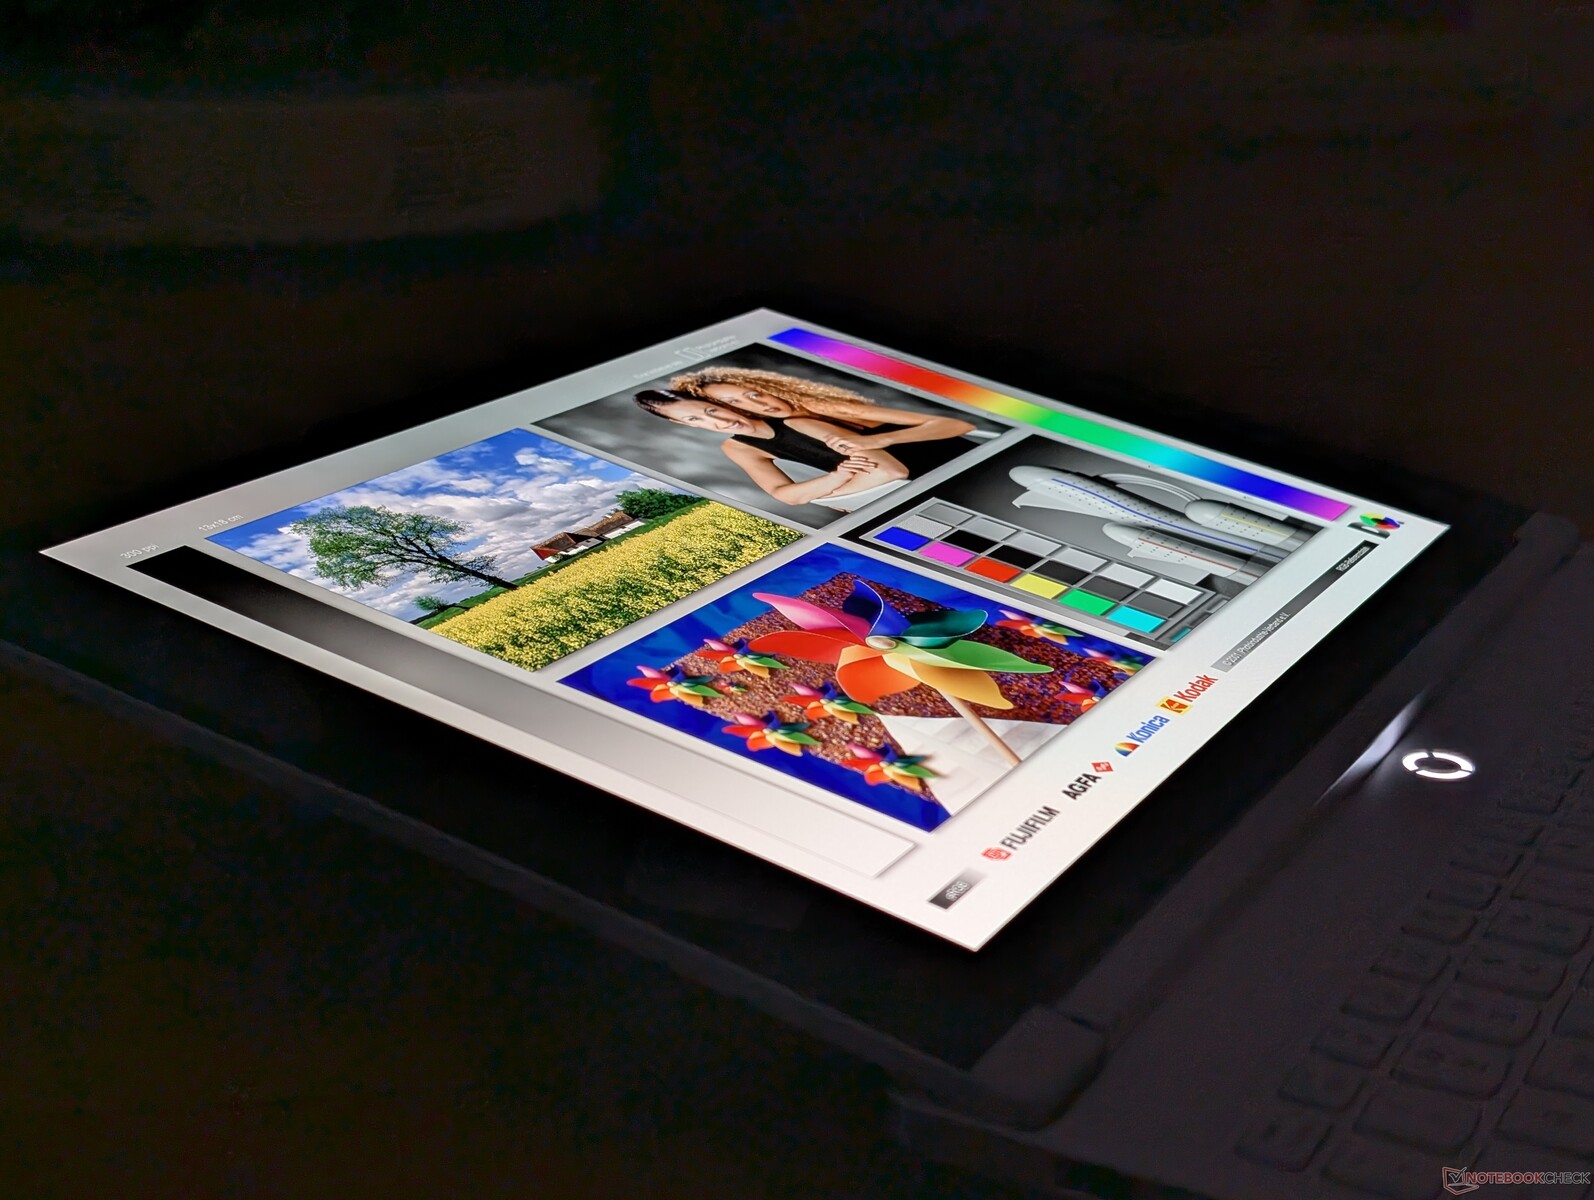
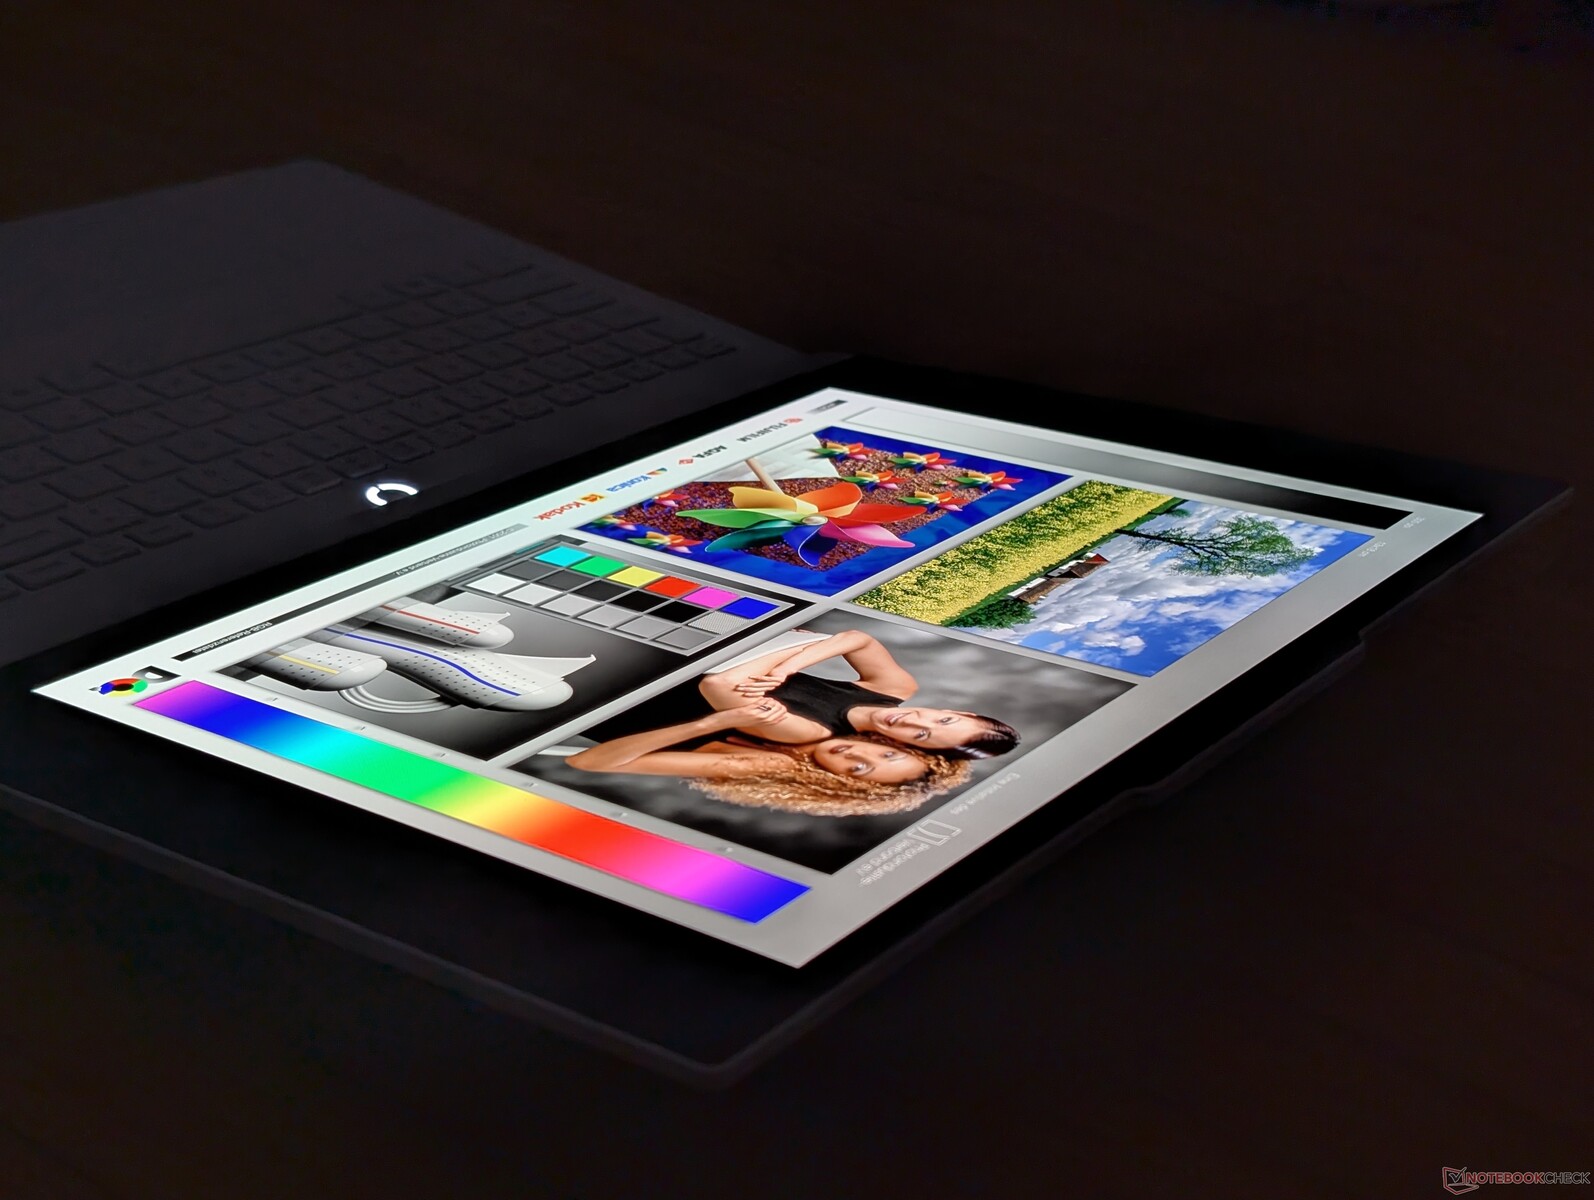
显示屏 - 仅 OLED

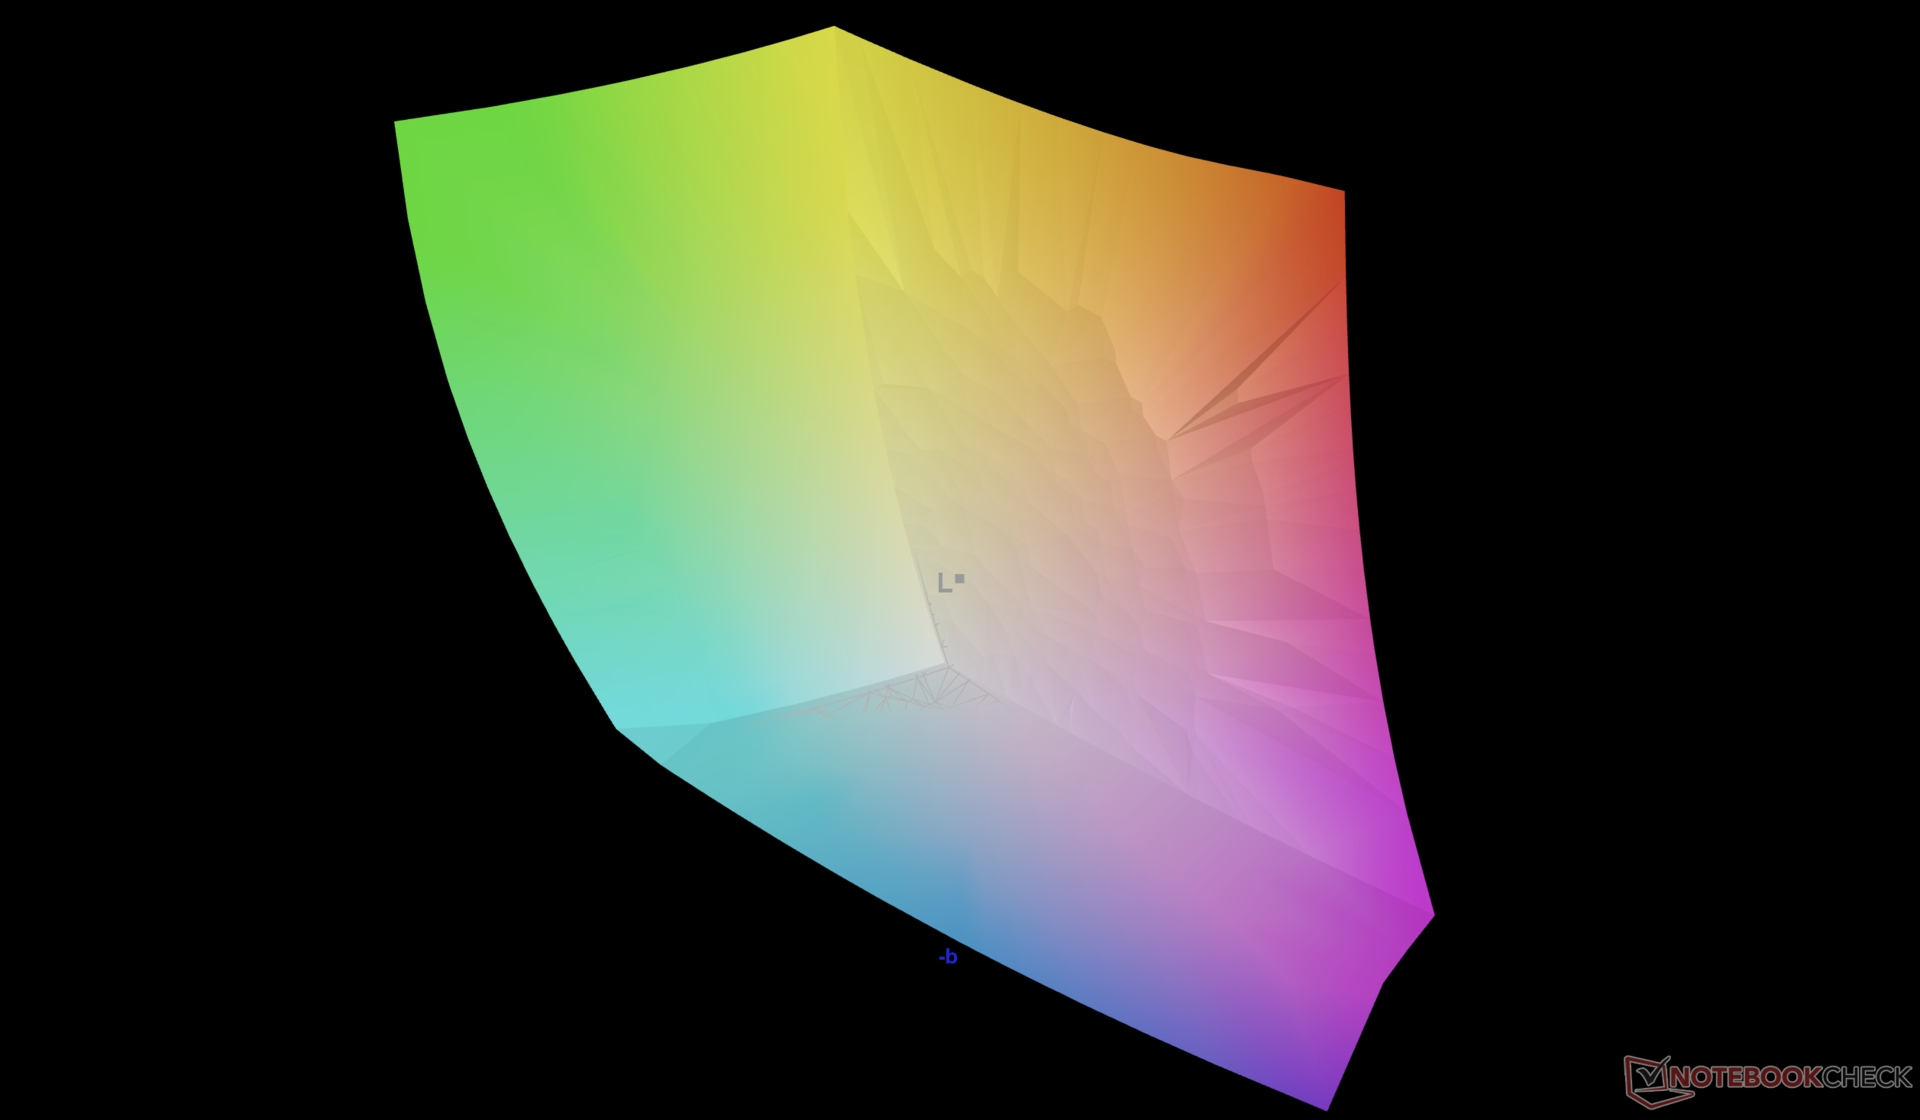
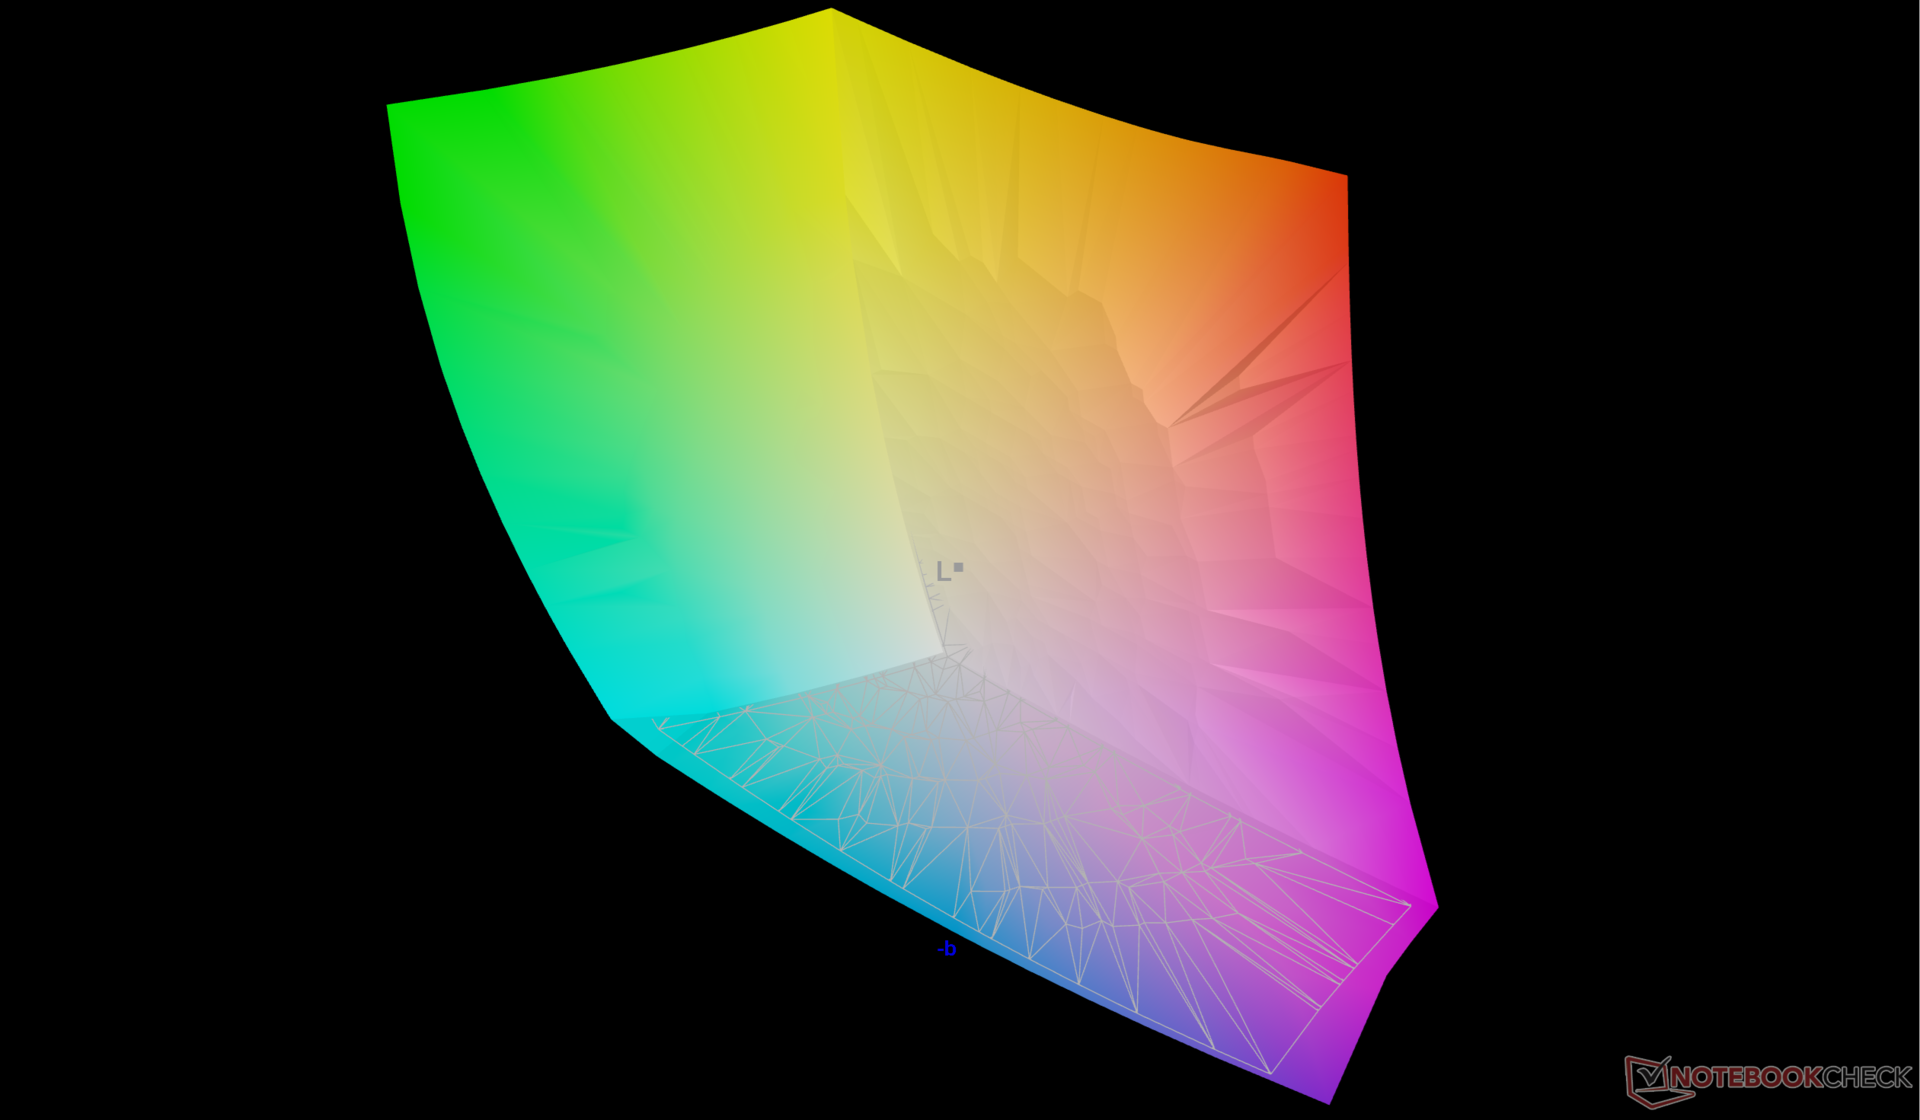
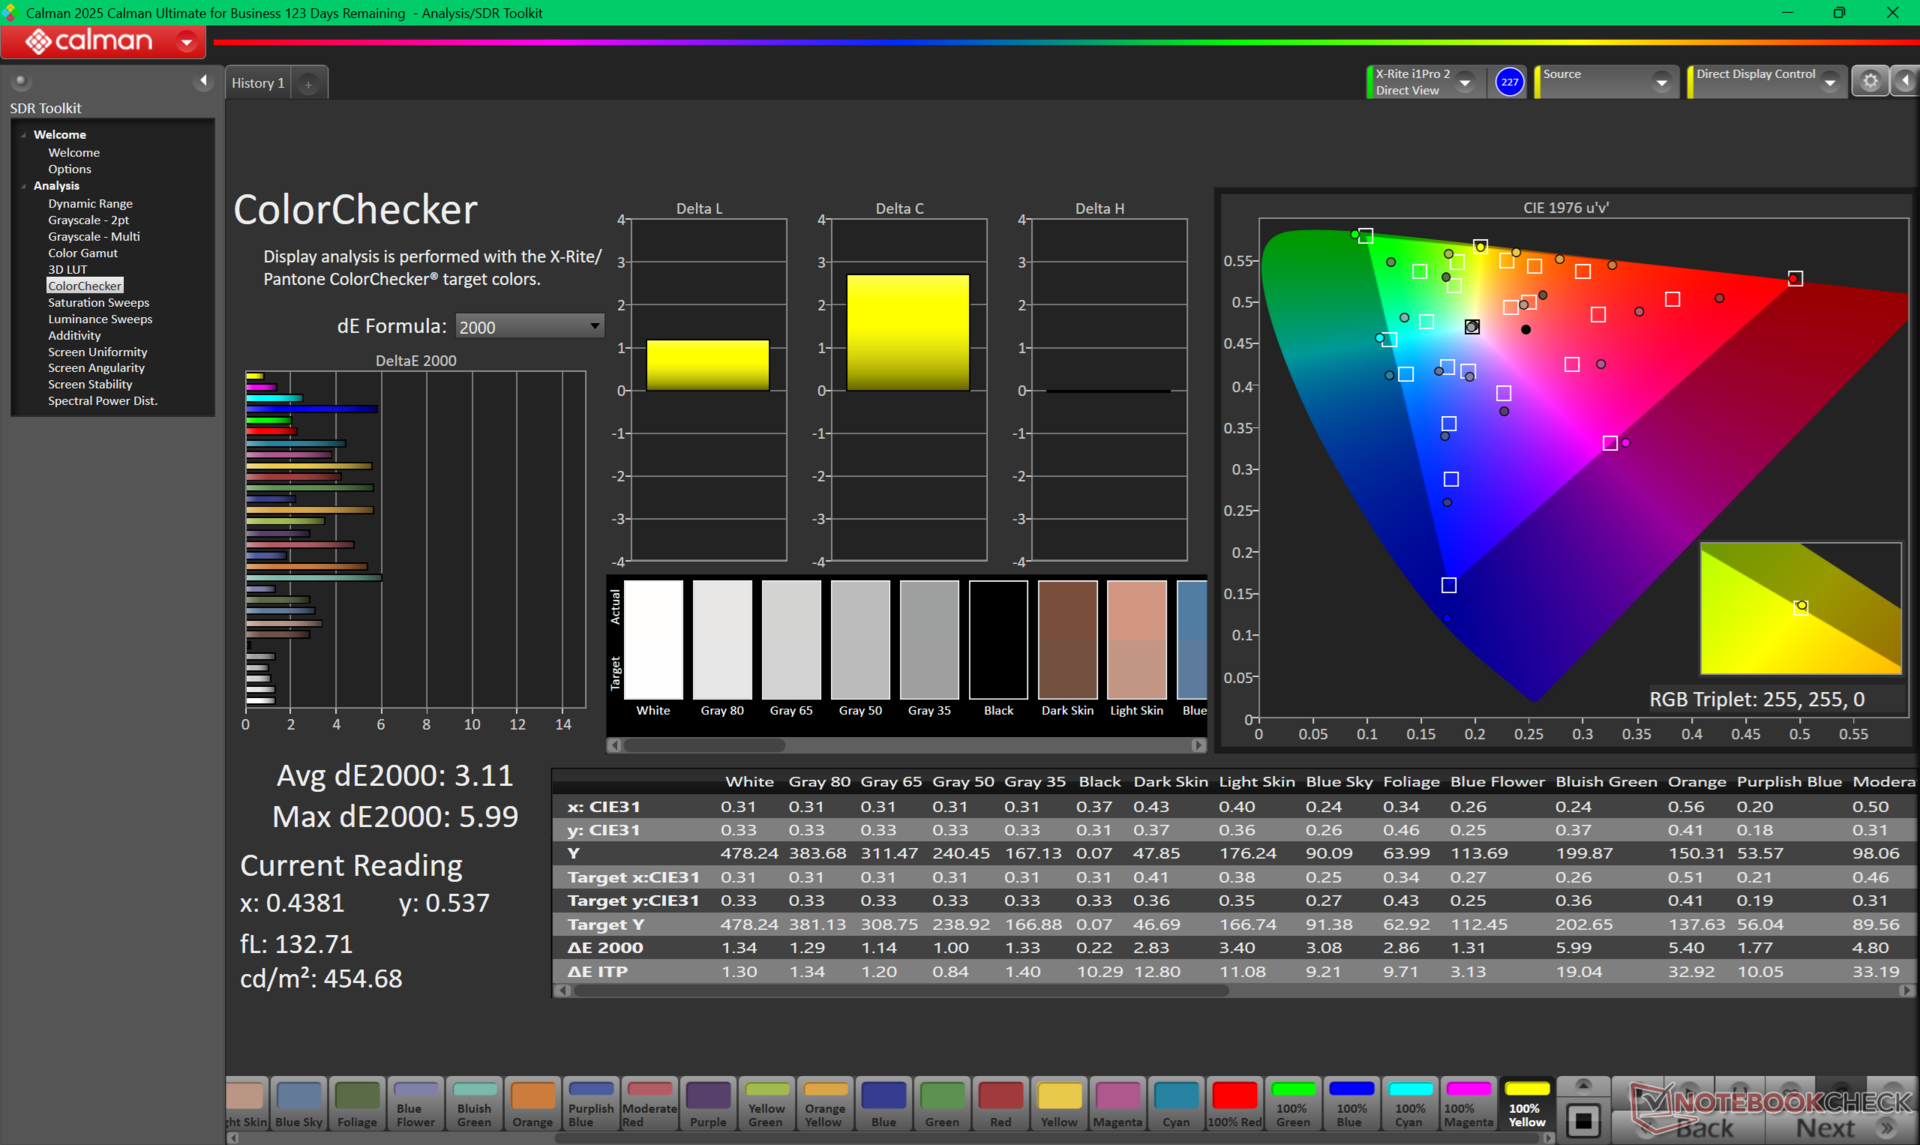
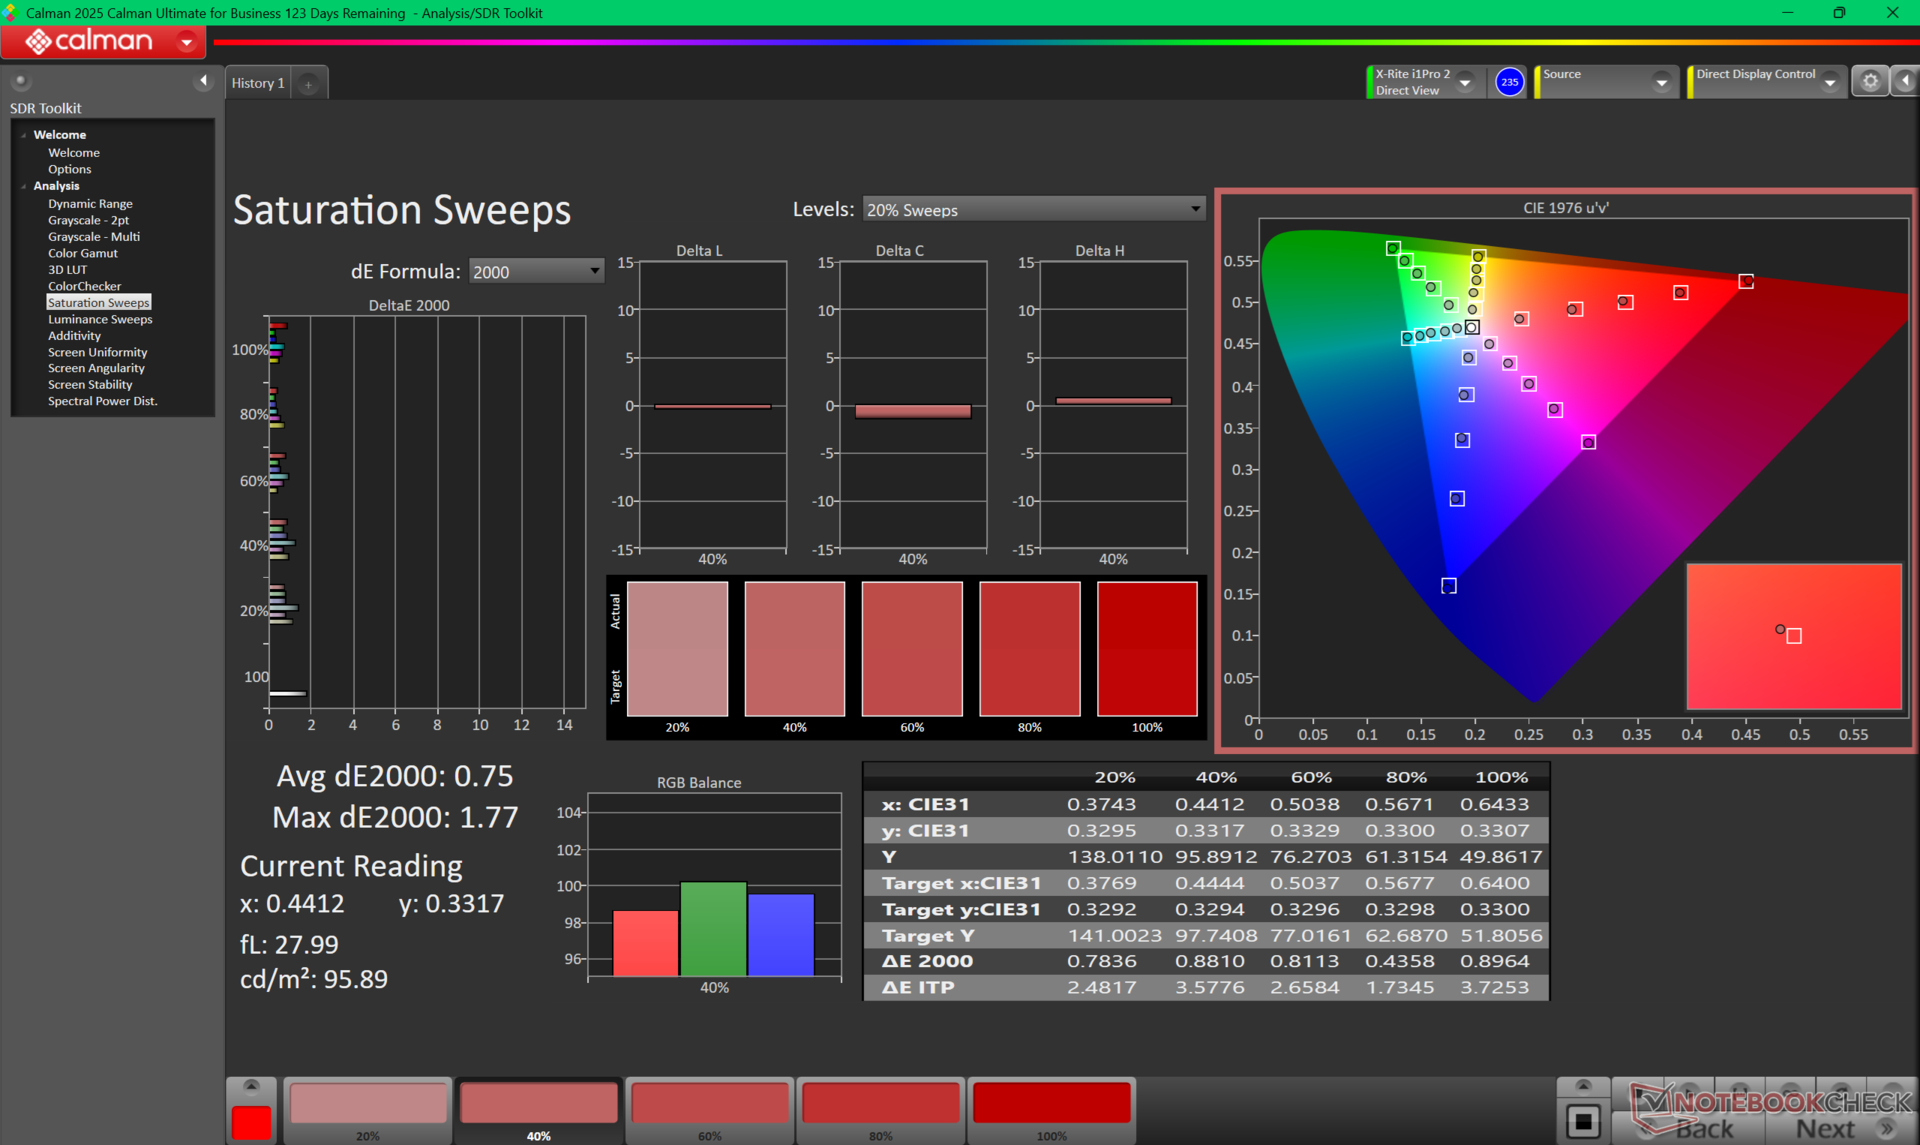
联想是为数不多的在许多游戏笔记本电脑(包括我们的Legion 7 16IAX10)上采用光面 OLED 的主要制造商之一。与传统的 IPS 相比,OLED 具有更出色的 HDR 支持、更明亮的光线、P3 色彩和更快的黑白响应时间,但代价是更高的功耗和价格。我们测试机上的 165 Hz 面板与 5 Pro 16IAX10H 上的三星 ATNA60HS01-0 面板相同。 Legion 5 Pro 16IAX10H可获得相似的观看体验。第二个 OLED 选项提供更快的 240 Hz 刷新率,很可能与 Razer 在其 Blade 16 上使用的三星面板相同。
在 HDR 模式下,最高亮度可达约 867 尼特;在 SDR 模式下,最高亮度可达约 495 尼特。
尽管只有设置为 dGPU 模式时才支持 G-Sync。在图形模式之间切换需要软重启。
| |||||||||||||||||||||||||
Brightness Distribution: 95 %
Center on Battery: 477.6 cd/m²
Contrast: ∞:1 (Black: 0 cd/m²)
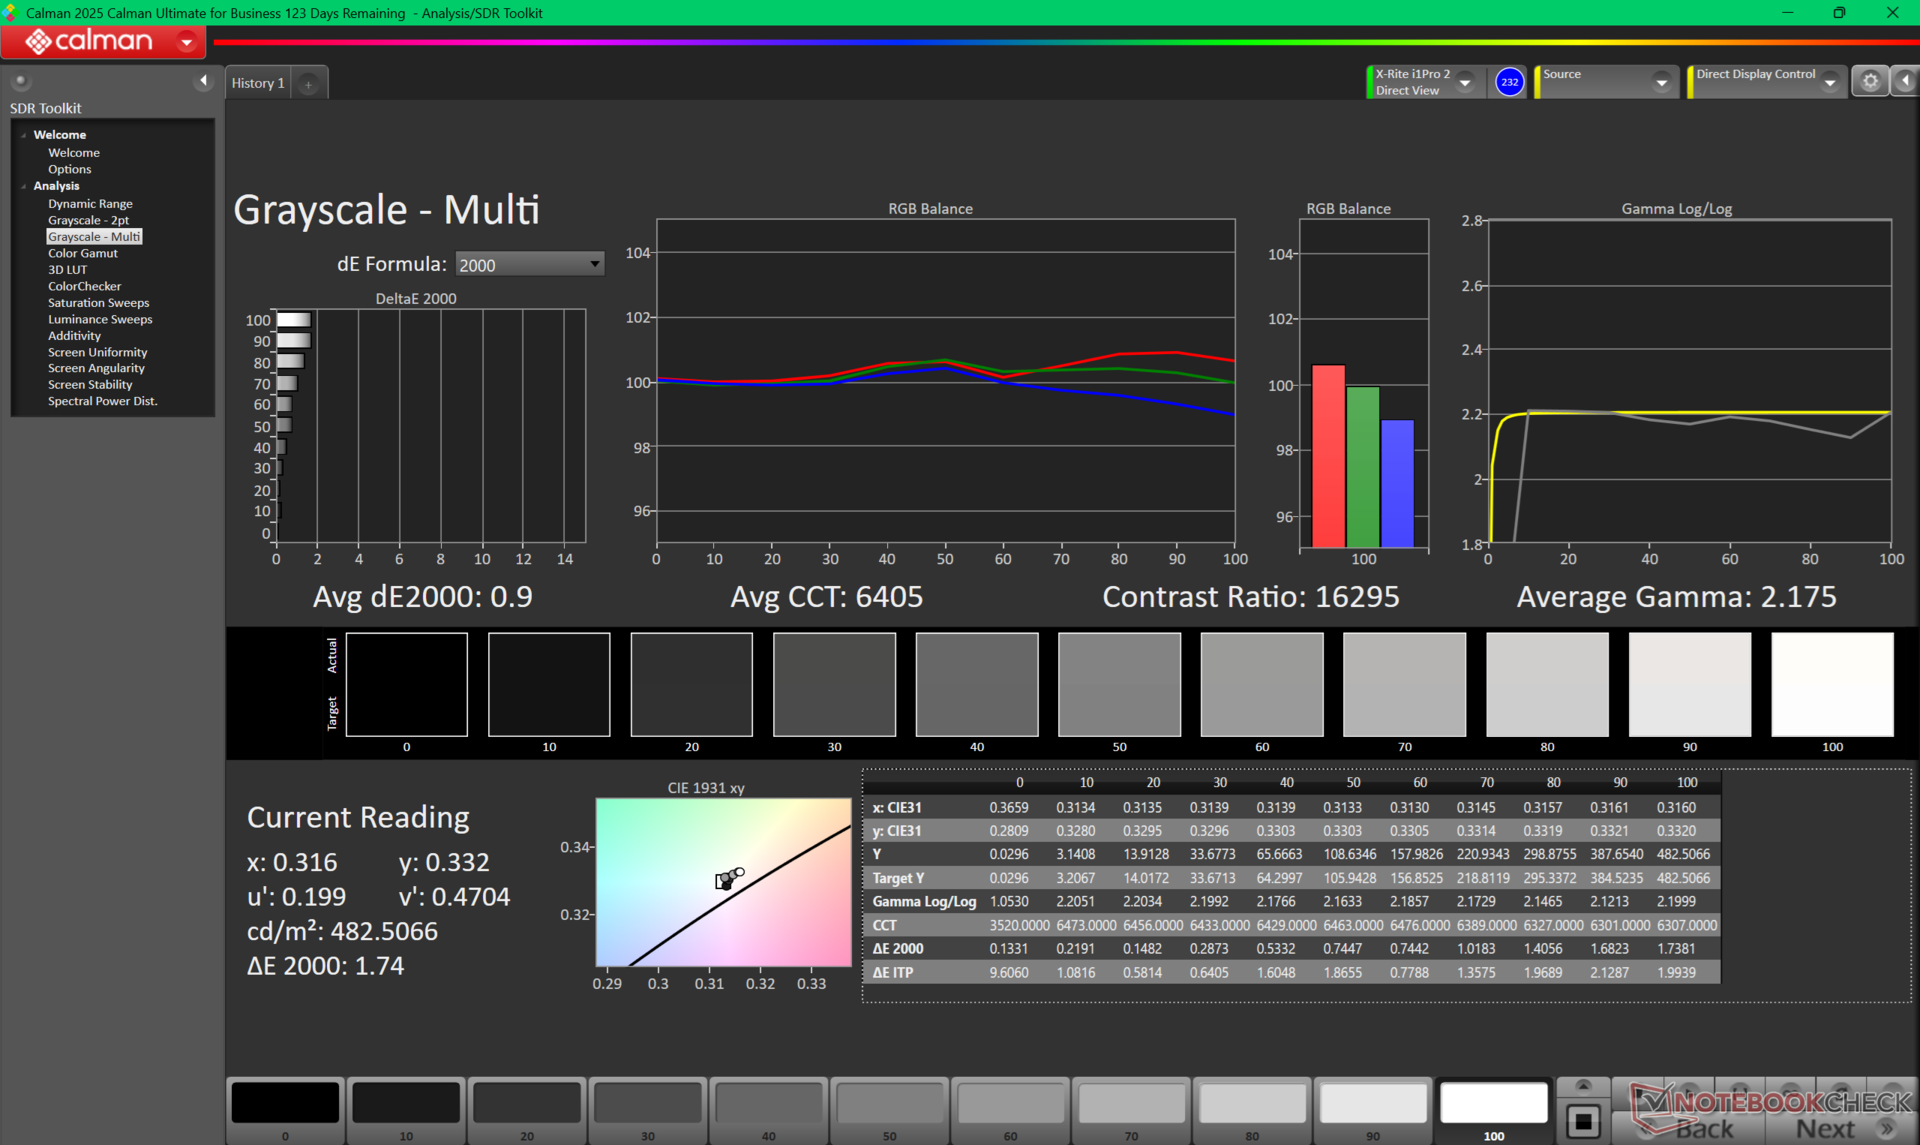
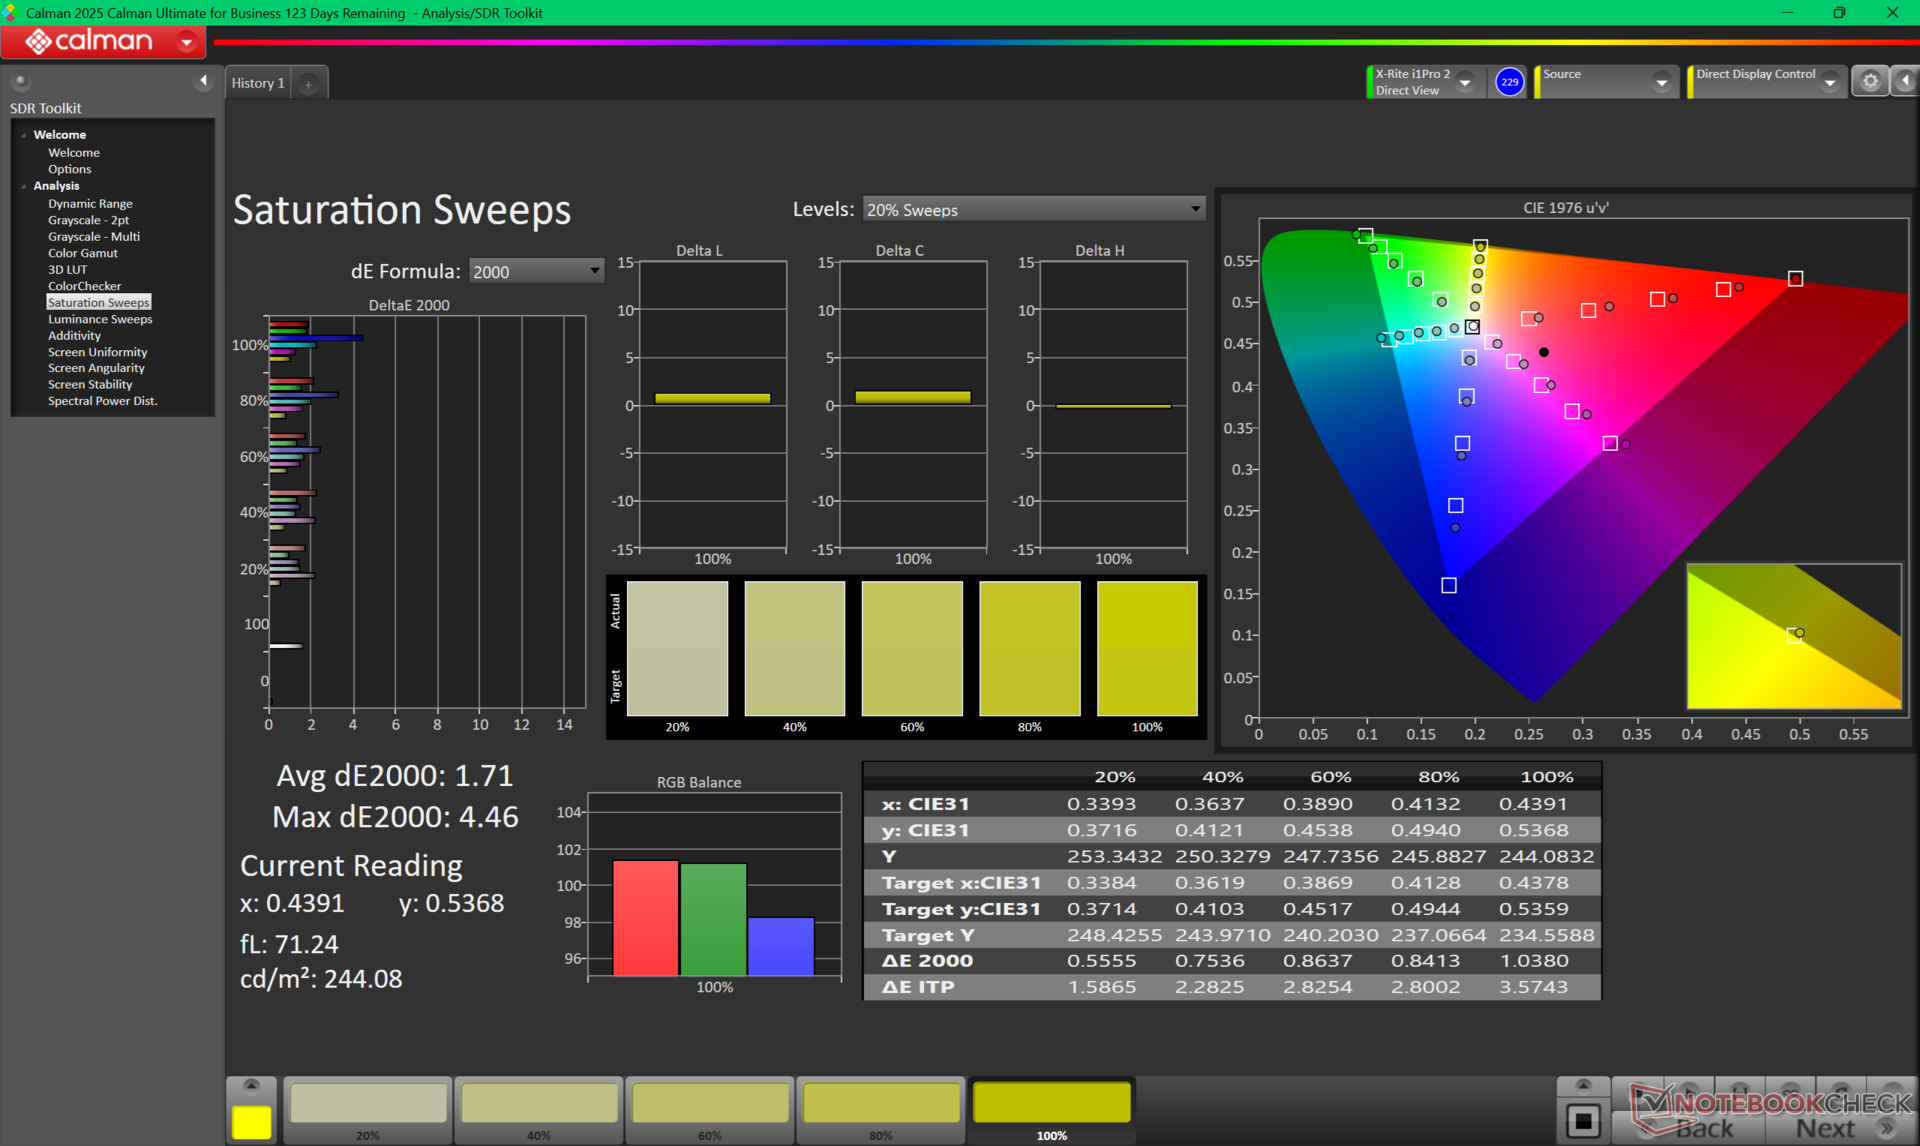
ΔE ColorChecker Calman: 3.11 | ∀{0.5-29.43 Ø4.72}
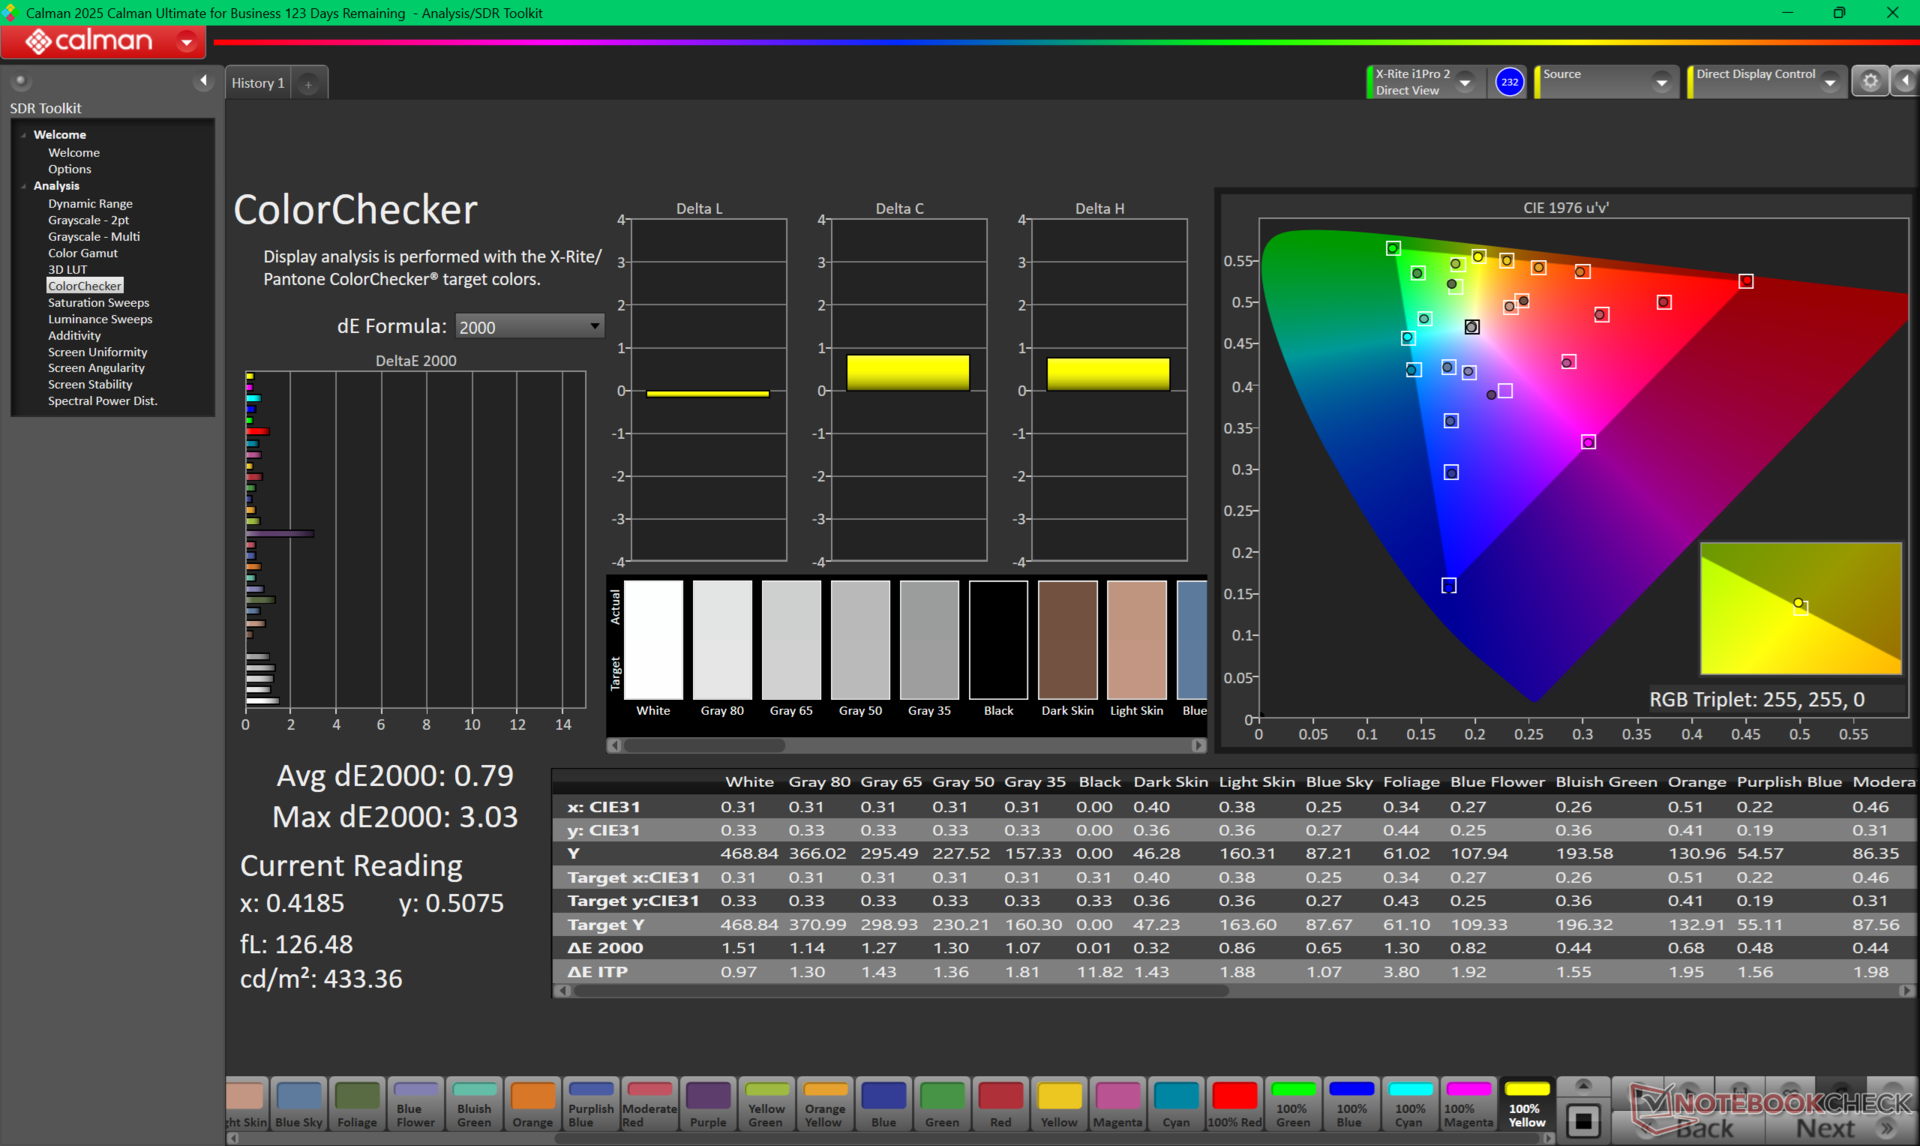
calibrated: 0.79
ΔE Greyscale Calman: 0.9 | ∀{0.09-98 Ø4.97}
93.5% AdobeRGB 1998 (Argyll 3D)
100% sRGB (Argyll 3D)
99.6% Display P3 (Argyll 3D)
Gamma: 2.18
CCT: 6405 K
| Lenovo Legion 7 16IAX10 Samsung ATNA60HS01-0, OLED, 2560x1600, 16", 165 Hz | Alienware 16 Aurora BOE NE16N41, IPS, 2560x1600, 16", 120 Hz | Asus TUF Gaming A16 FA608UP MNG007DA5-3, IPS, 2560x1600, 16", 165 Hz | Gigabyte Gaming A16 GA6H NE160QDM-NYJ (BOE0C80), IPS, 2560x1600, 16", 165 Hz | MSI Vector 16 HX AI A2XWHG B160QAN02.3 (AUO7DB2), IPS, 2560x1600, 16", 240 Hz | Lenovo Legion 5 Pro 16IAX10H ATNA60HS01-0 (Samsung SDC420A), OLED, 2560x1600, 16", 165 Hz | |
|---|---|---|---|---|---|---|
| Display | -17% | -19% | -18% | -4% | 0% | |
| Display P3 Coverage (%) | 99.6 | 70.8 -29% | 69.4 -30% | 69.4 -30% | 96.6 -3% | 99.9 0% |
| sRGB Coverage (%) | 100 | 99.9 0% | 97.2 -3% | 99.5 0% | 99.8 0% | 100 0% |
| AdobeRGB 1998 Coverage (%) | 93.5 | 72.1 -23% | 71.9 -23% | 71.6 -23% | 84.4 -10% | 94.1 1% |
| Response Times | -5857% | -725% | -1529% | -634% | -94% | |
| Response Time Grey 50% / Grey 80% * (ms) | 0.6 ? | 49.5 ? -8150% | 6.3 ? -950% | 14.3 ? -2283% | 4.3 ? -617% | 2 ? -233% |
| Response Time Black / White * (ms) | 0.8 ? | 29.3 ? -3563% | 4.8 ? -500% | 7 ? -775% | 6 ? -650% | 1.4 ? -75% |
| PWM Frequency (Hz) | 1317 ? | 1300 | ||||
| PWM Amplitude * (%) | 23 | 16.7 27% | ||||
| Screen | -69% | 1% | -109% | -53% | -51% | |
| Brightness middle (cd/m²) | 477.6 | 345.3 -28% | 480 1% | 432 -10% | 473 -1% | 518 8% |
| Brightness (cd/m²) | 483 | 324 -33% | 456 -6% | 425 -12% | 426 -12% | 522 8% |
| Brightness Distribution (%) | 95 | 88 -7% | 91 -4% | 91 -4% | 85 -11% | 97 2% |
| Black Level * (cd/m²) | 0.23 | 0.32 | 0.37 | 0.42 | ||
| Colorchecker dE 2000 * | 3.11 | 3.22 -4% | 1.4 55% | 4.76 -53% | 3.47 -12% | 2.49 20% |
| Colorchecker dE 2000 max. * | 5.99 | 5.68 5% | 2.5 58% | 8.59 -43% | 7.24 -21% | 5.25 12% |
| Colorchecker dE 2000 calibrated * | 0.79 | 0.93 -18% | 1.3 -65% | 1.18 -49% | 1.36 -72% | 2.15 -172% |
| Greyscale dE 2000 * | 0.9 | 4.5 -400% | 1.2 -33% | 6.2 -589% | 3.1 -244% | 3.02 -236% |
| Gamma | 2.18 101% | 2.1 105% | 2.16 102% | 2.079 106% | 2.486 88% | 2.37 93% |
| CCT | 6405 101% | 7041 92% | 6620 98% | 6690 97% | 6832 95% | 6426 101% |
| Contrast (:1) | 1501 | 1500 | 1168 | 1126 | ||
| Total Average (Program / Settings) | -1981% /
-1021% | -248% /
-125% | -552% /
-323% | -230% /
-138% | -48% /
-49% |
* ... smaller is better

Display Response Times
| ↔ Response Time Black to White | ||
|---|---|---|
| 0.8 ms ... rise ↗ and fall ↘ combined | ↗ 0.3 ms rise | 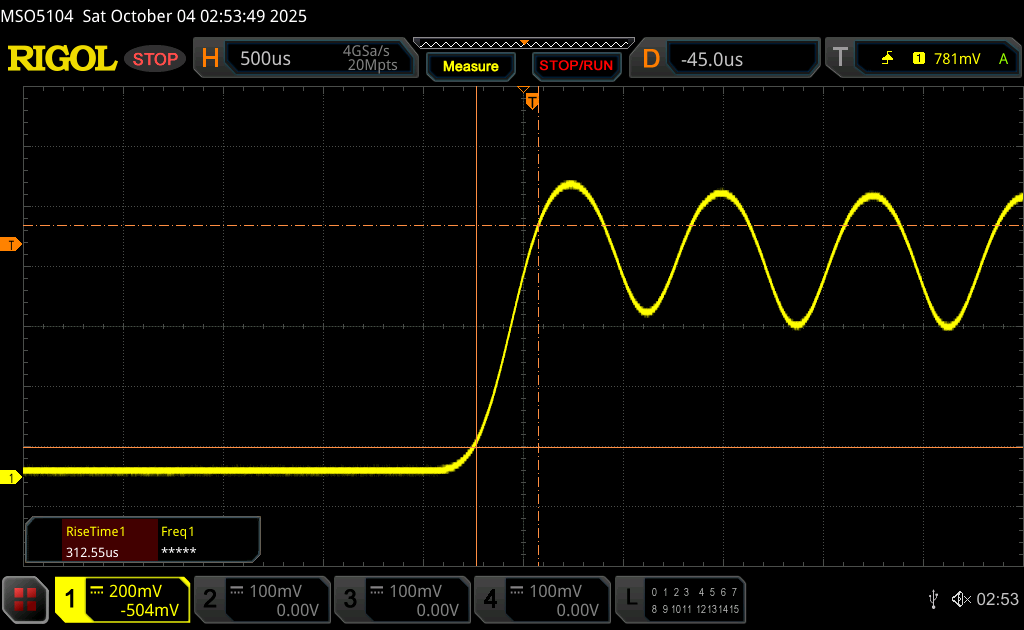 |
| ↘ 0.5 ms fall | ||
| The screen shows very fast response rates in our tests and should be very well suited for fast-paced gaming. In comparison, all tested devices range from 0.1 (minimum) to 240 (maximum) ms. » 2 % of all devices are better. This means that the measured response time is better than the average of all tested devices (19.8 ms). | ||
| ↔ Response Time 50% Grey to 80% Grey | ||
| 0.6 ms ... rise ↗ and fall ↘ combined | ↗ 0.2 ms rise | 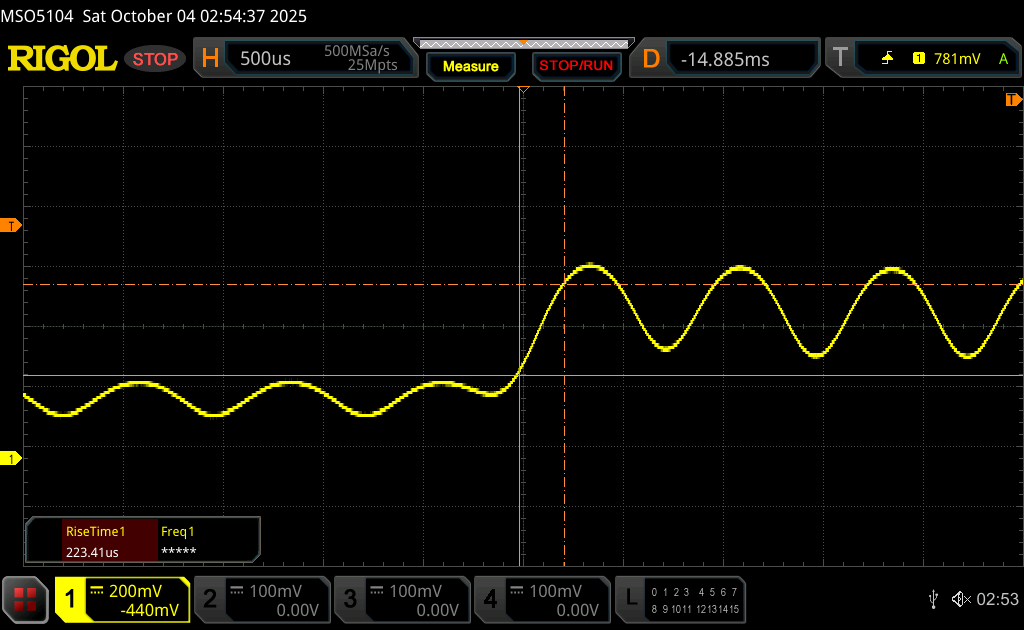 |
| ↘ 0.4 ms fall | ||
| The screen shows very fast response rates in our tests and should be very well suited for fast-paced gaming. In comparison, all tested devices range from 0.165 (minimum) to 636 (maximum) ms. » 1 % of all devices are better. This means that the measured response time is better than the average of all tested devices (31 ms). | ||
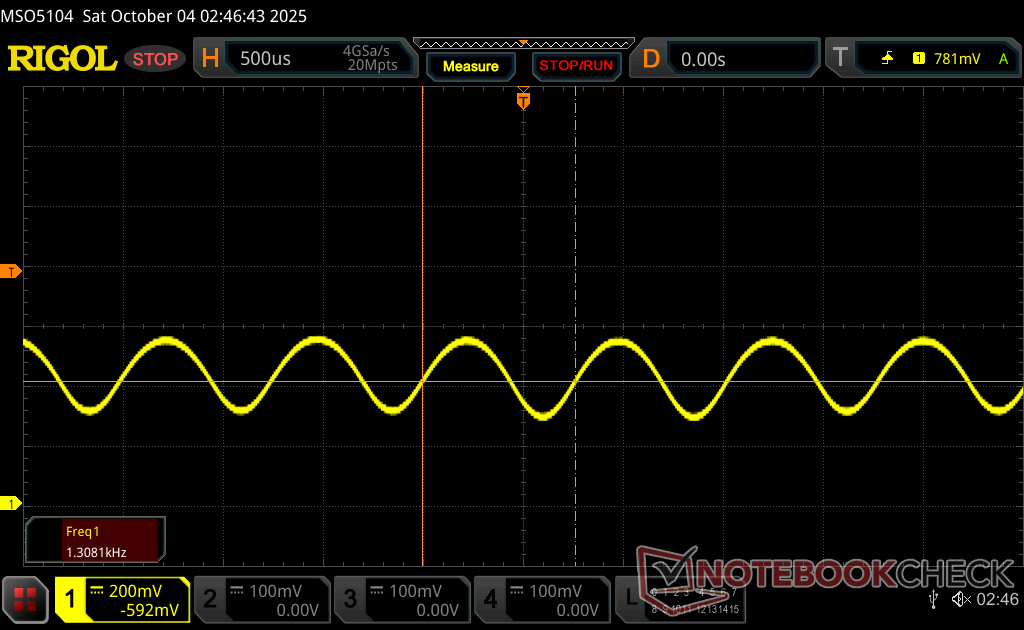
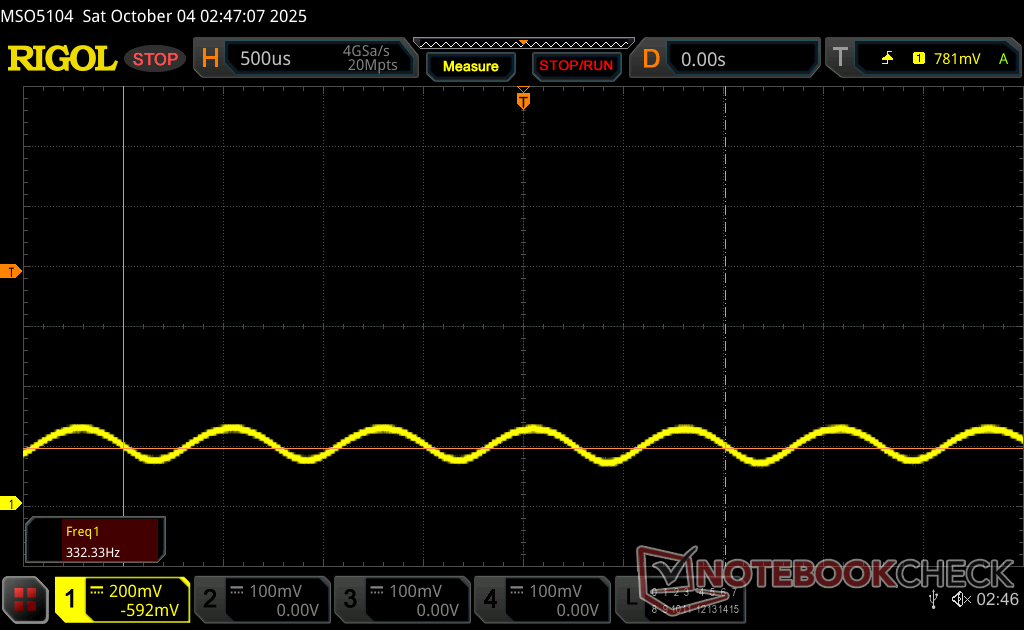
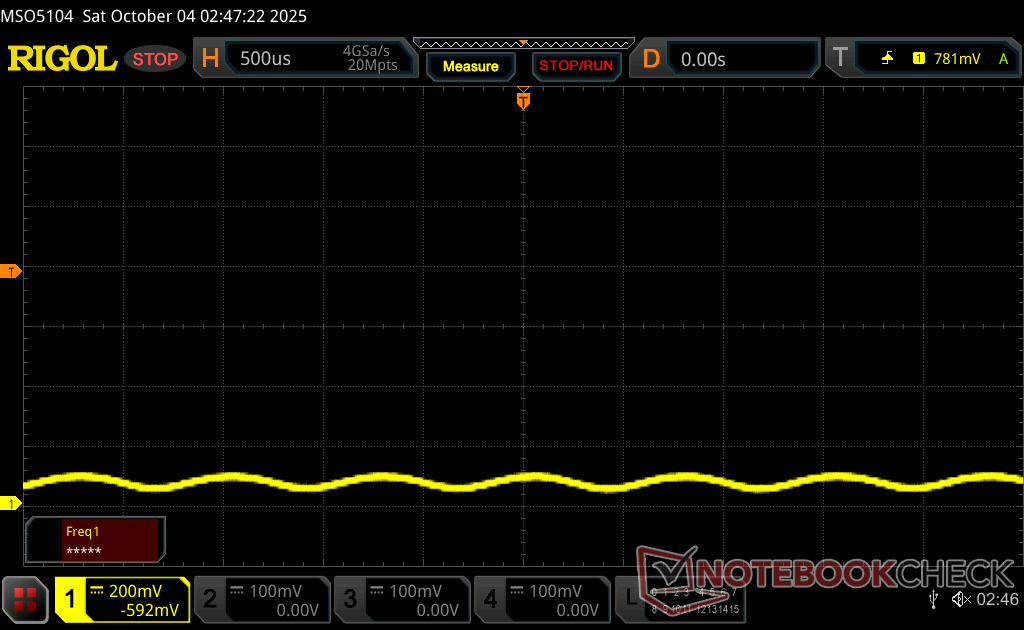
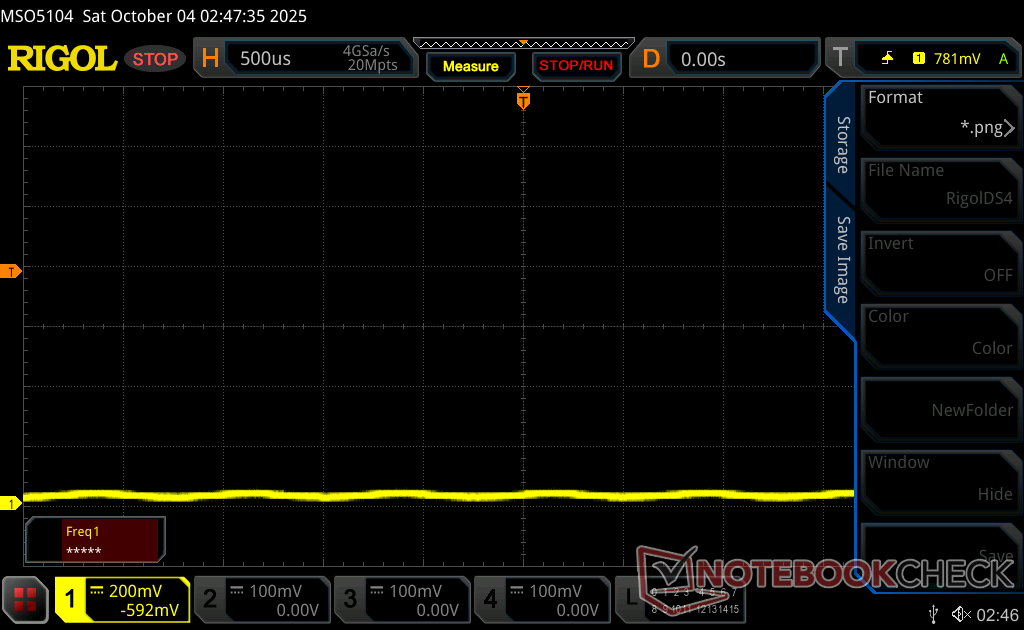
Screen Flickering / PWM (Pulse-Width Modulation)
| Screen flickering / PWM detected | 1317 Hz Amplitude: 23 % | ≤ 100 % brightness setting | 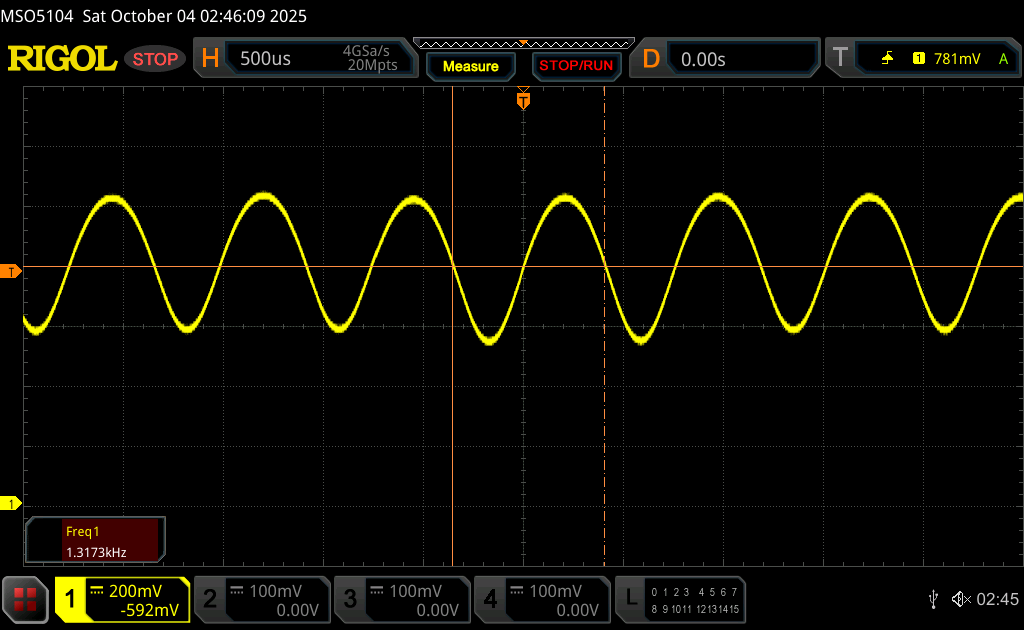 |
The display backlight flickers at 1317 Hz (worst case, e.g., utilizing PWM) Flickering detected at a brightness setting of 100 % and below. There should be no flickering or PWM above this brightness setting. The frequency of 1317 Hz is quite high, so most users sensitive to PWM should not notice any flickering. In comparison: 52 % of all tested devices do not use PWM to dim the display. If PWM was detected, an average of 7772 (minimum: 5 - maximum: 343500) Hz was measured. | |||
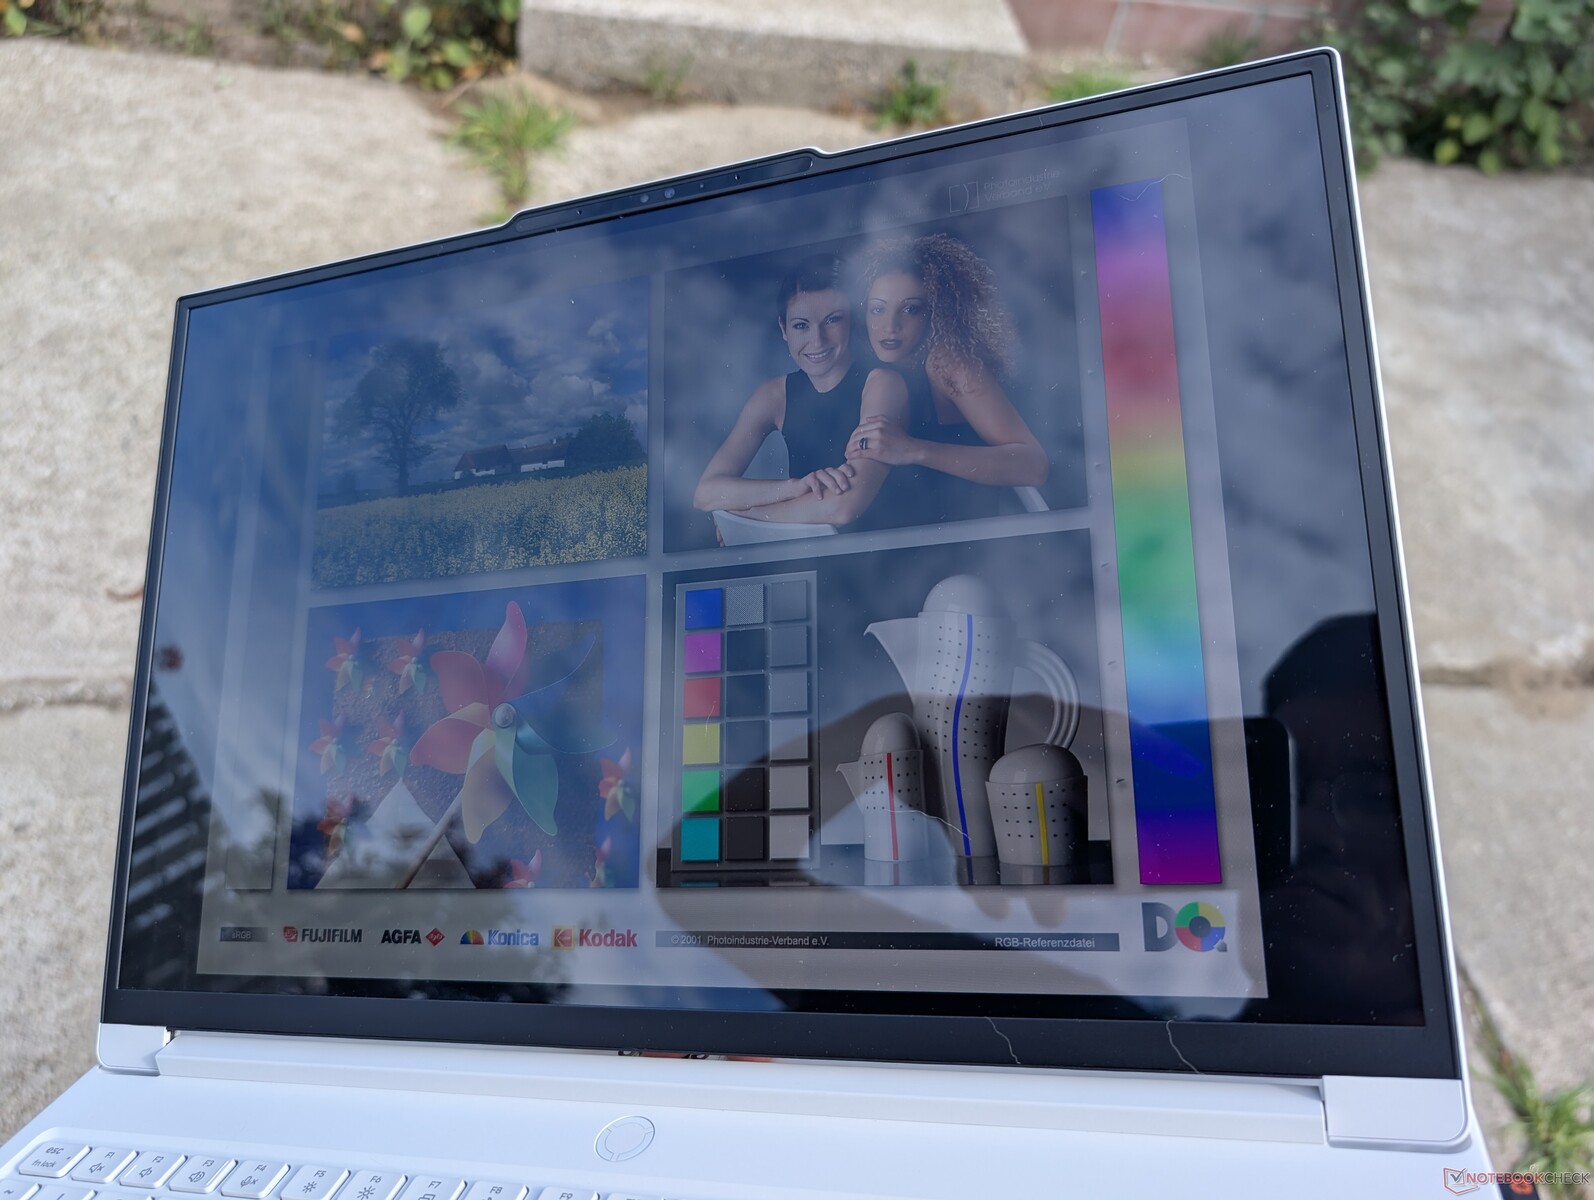
尽管 OLED 屏幕相对较亮,但由于采用了光面覆盖层,室外可视性很差。技嘉 Gaming A16 或微星 Vector 16 HX 的屏幕可能会稍暗一些,但由于眩光不会那么普遍,因此在室外还是比较容易看到的。


性能
测试条件
在运行以下基准测试之前,我们将 LegionSpace 设置为性能模式和独立 GPU 模式。
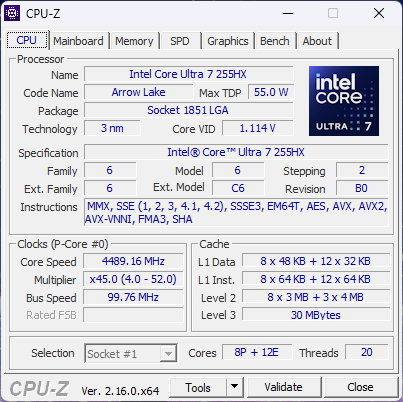
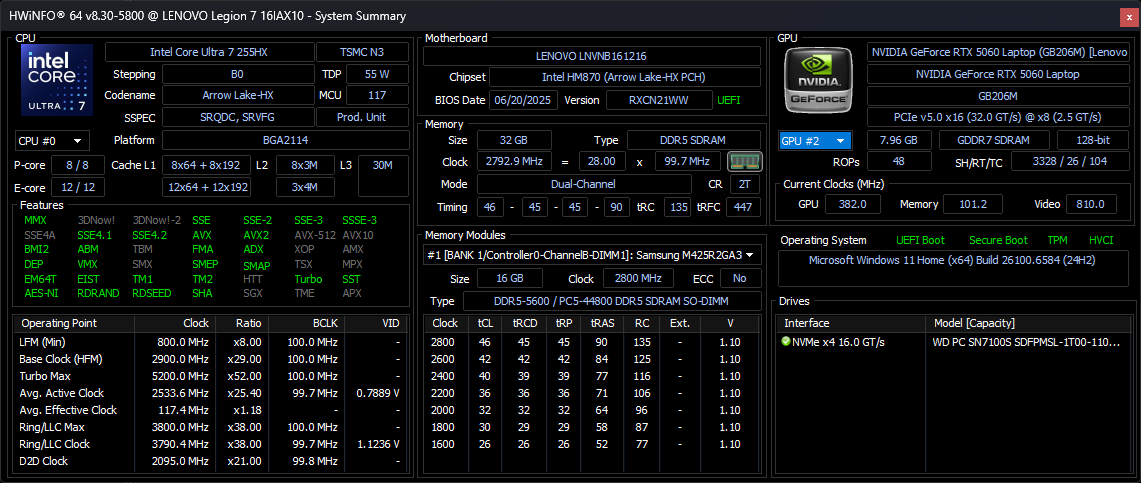
处理器
酷睿至尊 7 255HX 酷睿至尊 7 255HX与去年的 酷睿 i7-14700HX提升了近 50%,而 酷睿至尊 9 285H和 Zephyrus G16 中的 Core Ultra 9 285H 相比,也有类似幅度的提升。它的性能也远远超过大多数 AMD 移动 CPU,包括 Ryzen AI 9 HX 370Razer Blade 16 中的 Ryzen AI 9 HX 370。比酷睿 Ultra 7 255HX 更快的 AMD CPU 是 Ryzen 9 9955HX但这种处理器只出现在更厚更重的游戏笔记本电脑上,如 微星 Vector A18 HX目前还没有。
升级到 酷睿至尊 9 275HX根据我们在 Alienware 16X Aurora 上的使用情况,升级到酷睿 Ultra 9 275HX 配置有望将性能提高 10%。
性能的可持续性很好,但并不完美。如下图所示,在我们的压力测试中,CineBench R15 xT 分数在几个周期后会下降约 9%。
Cinebench R15 多回路运行
Cinebench R23: Multi Core | Single Core
Cinebench R20: CPU (Multi Core) | CPU (Single Core)
Cinebench R15: CPU Multi 64Bit | CPU Single 64Bit
Blender: v2.79 BMW27 CPU
7-Zip 18.03: 7z b 4 | 7z b 4 -mmt1
Geekbench 6.7: Multi-Core | Single-Core
Geekbench 5.5: Multi-Core | Single-Core
HWBOT x265 Benchmark v2.2: 4k Preset
LibreOffice : 20 Documents To PDF
R Benchmark 2.5: Overall mean
| CPU Performance rating | |
| Alienware 16X Aurora, RTX 5070 | |
| Lenovo Legion 7 16IAX10 | |
| Average Intel Core Ultra 7 255HX | |
| Razer Blade 16 2025 RTX 5090 | |
| MSI Sword 16 HX B14VGKG | |
| Asus ROG Zephyrus G16 GU605CX | |
| Razer Blade 16 RTX 5080 | |
| Asus TUF Gaming A16 FA608UP | |
| Alienware 16 Aurora | |
| Dell G16 7620 -2! | |
| Asus TUF Gaming A16 FA617 -2! | |
| Cinebench R20 / CPU (Multi Core) | |
| Alienware 16X Aurora, RTX 5070 | |
| Lenovo Legion 7 16IAX10 | |
| Average Intel Core Ultra 7 255HX (10626 - 13056, n=5) | |
| Razer Blade 16 2025 RTX 5090 | |
| MSI Sword 16 HX B14VGKG | |
| Asus ROG Zephyrus G16 GU605CX | |
| Razer Blade 16 RTX 5080 | |
| Asus TUF Gaming A16 FA608UP | |
| Dell G16 7620 | |
| Alienware 16 Aurora | |
| Asus TUF Gaming A16 FA617 | |
| Cinebench R20 / CPU (Single Core) | |
| Alienware 16X Aurora, RTX 5070 | |
| Lenovo Legion 7 16IAX10 | |
| Average Intel Core Ultra 7 255HX (822 - 835, n=5) | |
| Asus ROG Zephyrus G16 GU605CX | |
| MSI Sword 16 HX B14VGKG | |
| Razer Blade 16 2025 RTX 5090 | |
| Razer Blade 16 RTX 5080 | |
| Alienware 16 Aurora | |
| Asus TUF Gaming A16 FA608UP | |
| Dell G16 7620 | |
| Asus TUF Gaming A16 FA617 | |
| Cinebench R15 / CPU Multi 64Bit | |
| Alienware 16X Aurora, RTX 5070 | |
| Lenovo Legion 7 16IAX10 | |
| Average Intel Core Ultra 7 255HX (4114 - 5190, n=5) | |
| Razer Blade 16 2025 RTX 5090 | |
| Asus ROG Zephyrus G16 GU605CX | |
| MSI Sword 16 HX B14VGKG | |
| Razer Blade 16 RTX 5080 | |
| Asus TUF Gaming A16 FA608UP | |
| Dell G16 7620 | |
| Alienware 16 Aurora | |
| Asus TUF Gaming A16 FA617 | |
| Cinebench R15 / CPU Single 64Bit | |
| Alienware 16X Aurora, RTX 5070 | |
| Lenovo Legion 7 16IAX10 | |
| Average Intel Core Ultra 7 255HX (322 - 328, n=5) | |
| Asus ROG Zephyrus G16 GU605CX | |
| Razer Blade 16 2025 RTX 5090 | |
| Razer Blade 16 RTX 5080 | |
| MSI Sword 16 HX B14VGKG | |
| Asus TUF Gaming A16 FA608UP | |
| Alienware 16 Aurora | |
| Asus TUF Gaming A16 FA617 | |
| Dell G16 7620 | |
| Geekbench 6.7 / Multi-Core | |
| Alienware 16X Aurora, RTX 5070 | |
| Average Intel Core Ultra 7 255HX (16396 - 19623, n=6) | |
| Lenovo Legion 7 16IAX10 | |
| Asus ROG Zephyrus G16 GU605CX | |
| Razer Blade 16 2025 RTX 5090 | |
| MSI Sword 16 HX B14VGKG | |
| Razer Blade 16 RTX 5080 | |
| Alienware 16 Aurora | |
| Asus TUF Gaming A16 FA608UP | |
| Geekbench 6.7 / Single-Core | |
| Alienware 16X Aurora, RTX 5070 | |
| Average Intel Core Ultra 7 255HX (2917 - 3028, n=6) | |
| Razer Blade 16 2025 RTX 5090 | |
| Lenovo Legion 7 16IAX10 | |
| Asus ROG Zephyrus G16 GU605CX | |
| Razer Blade 16 RTX 5080 | |
| MSI Sword 16 HX B14VGKG | |
| Asus TUF Gaming A16 FA608UP | |
| Alienware 16 Aurora | |
| HWBOT x265 Benchmark v2.2 / 4k Preset | |
| Alienware 16X Aurora, RTX 5070 | |
| Lenovo Legion 7 16IAX10 | |
| Average Intel Core Ultra 7 255HX (30.4 - 36.9, n=5) | |
| Razer Blade 16 2025 RTX 5090 | |
| Asus ROG Zephyrus G16 GU605CX | |
| Razer Blade 16 RTX 5080 | |
| MSI Sword 16 HX B14VGKG | |
| Asus TUF Gaming A16 FA608UP | |
| Alienware 16 Aurora | |
| Dell G16 7620 | |
| Asus TUF Gaming A16 FA617 | |
| LibreOffice / 20 Documents To PDF | |
| Razer Blade 16 RTX 5080 | |
| Asus TUF Gaming A16 FA617 | |
| Asus TUF Gaming A16 FA608UP | |
| Dell G16 7620 | |
| Alienware 16 Aurora | |
| Razer Blade 16 2025 RTX 5090 | |
| MSI Sword 16 HX B14VGKG | |
| Asus ROG Zephyrus G16 GU605CX | |
| Average Intel Core Ultra 7 255HX (35.4 - 45.9, n=5) | |
| Alienware 16X Aurora, RTX 5070 | |
| Lenovo Legion 7 16IAX10 | |
| R Benchmark 2.5 / Overall mean | |
| Dell G16 7620 | |
| Asus TUF Gaming A16 FA617 | |
| Alienware 16 Aurora | |
| Asus TUF Gaming A16 FA608UP | |
| Asus ROG Zephyrus G16 GU605CX | |
| Lenovo Legion 7 16IAX10 | |
| Average Intel Core Ultra 7 255HX (0.4209 - 0.4287, n=5) | |
| Alienware 16X Aurora, RTX 5070 | |
| Razer Blade 16 RTX 5080 | |
| Razer Blade 16 2025 RTX 5090 | |
| MSI Sword 16 HX B14VGKG | |
* ... smaller is better
AIDA64: FP32 Ray-Trace | FPU Julia | CPU SHA3 | CPU Queen | FPU SinJulia | FPU Mandel | CPU AES | CPU ZLib | FP64 Ray-Trace | CPU PhotoWorxx
| Performance rating | |
| Lenovo Legion 5 Pro 16IAX10H | |
| Average Intel Core Ultra 7 255HX | |
| Lenovo Legion 7 16IAX10 | |
| MSI Vector 16 HX AI A2XWHG | |
| Asus TUF Gaming A16 FA608UP | |
| Alienware 16 Aurora | |
| Gigabyte Gaming A16 GA6H | |
| AIDA64 / FP32 Ray-Trace | |
| Lenovo Legion 5 Pro 16IAX10H | |
| Average Intel Core Ultra 7 255HX (27732 - 34250, n=5) | |
| Lenovo Legion 7 16IAX10 | |
| Asus TUF Gaming A16 FA608UP | |
| MSI Vector 16 HX AI A2XWHG | |
| Alienware 16 Aurora | |
| Gigabyte Gaming A16 GA6H | |
| AIDA64 / FPU Julia | |
| Lenovo Legion 5 Pro 16IAX10H | |
| Average Intel Core Ultra 7 255HX (140290 - 167758, n=5) | |
| Lenovo Legion 7 16IAX10 | |
| MSI Vector 16 HX AI A2XWHG | |
| Asus TUF Gaming A16 FA608UP | |
| Alienware 16 Aurora | |
| Gigabyte Gaming A16 GA6H | |
| AIDA64 / CPU SHA3 | |
| Lenovo Legion 5 Pro 16IAX10H | |
| Average Intel Core Ultra 7 255HX (6445 - 7694, n=5) | |
| Lenovo Legion 7 16IAX10 | |
| MSI Vector 16 HX AI A2XWHG | |
| Asus TUF Gaming A16 FA608UP | |
| Alienware 16 Aurora | |
| Gigabyte Gaming A16 GA6H | |
| AIDA64 / CPU Queen | |
| Lenovo Legion 5 Pro 16IAX10H | |
| Lenovo Legion 7 16IAX10 | |
| Average Intel Core Ultra 7 255HX (115802 - 135237, n=5) | |
| Asus TUF Gaming A16 FA608UP | |
| MSI Vector 16 HX AI A2XWHG | |
| Alienware 16 Aurora | |
| Gigabyte Gaming A16 GA6H | |
| AIDA64 / FPU SinJulia | |
| Asus TUF Gaming A16 FA608UP | |
| Lenovo Legion 5 Pro 16IAX10H | |
| Lenovo Legion 7 16IAX10 | |
| Average Intel Core Ultra 7 255HX (11066 - 12286, n=5) | |
| MSI Vector 16 HX AI A2XWHG | |
| Alienware 16 Aurora | |
| Gigabyte Gaming A16 GA6H | |
| AIDA64 / FPU Mandel | |
| Lenovo Legion 5 Pro 16IAX10H | |
| Average Intel Core Ultra 7 255HX (72938 - 87947, n=5) | |
| Lenovo Legion 7 16IAX10 | |
| MSI Vector 16 HX AI A2XWHG | |
| Asus TUF Gaming A16 FA608UP | |
| Alienware 16 Aurora | |
| Gigabyte Gaming A16 GA6H | |
| AIDA64 / CPU AES | |
| Lenovo Legion 5 Pro 16IAX10H | |
| Lenovo Legion 7 16IAX10 | |
| Average Intel Core Ultra 7 255HX (96832 - 116158, n=5) | |
| MSI Vector 16 HX AI A2XWHG | |
| Asus TUF Gaming A16 FA608UP | |
| Alienware 16 Aurora | |
| Gigabyte Gaming A16 GA6H | |
| AIDA64 / CPU ZLib | |
| Lenovo Legion 5 Pro 16IAX10H | |
| Lenovo Legion 7 16IAX10 | |
| Average Intel Core Ultra 7 255HX (1510 - 1850, n=5) | |
| MSI Vector 16 HX AI A2XWHG | |
| Asus TUF Gaming A16 FA608UP | |
| Alienware 16 Aurora | |
| Gigabyte Gaming A16 GA6H | |
| AIDA64 / FP64 Ray-Trace | |
| Lenovo Legion 5 Pro 16IAX10H | |
| Average Intel Core Ultra 7 255HX (15137 - 18315, n=5) | |
| Lenovo Legion 7 16IAX10 | |
| Asus TUF Gaming A16 FA608UP | |
| MSI Vector 16 HX AI A2XWHG | |
| Alienware 16 Aurora | |
| Gigabyte Gaming A16 GA6H | |
| AIDA64 / CPU PhotoWorxx | |
| Lenovo Legion 7 16IAX10 | |
| Lenovo Legion 5 Pro 16IAX10H | |
| Average Intel Core Ultra 7 255HX (39697 - 54070, n=5) | |
| Asus TUF Gaming A16 FA608UP | |
| Alienware 16 Aurora | |
| MSI Vector 16 HX AI A2XWHG | |
| Gigabyte Gaming A16 GA6H | |
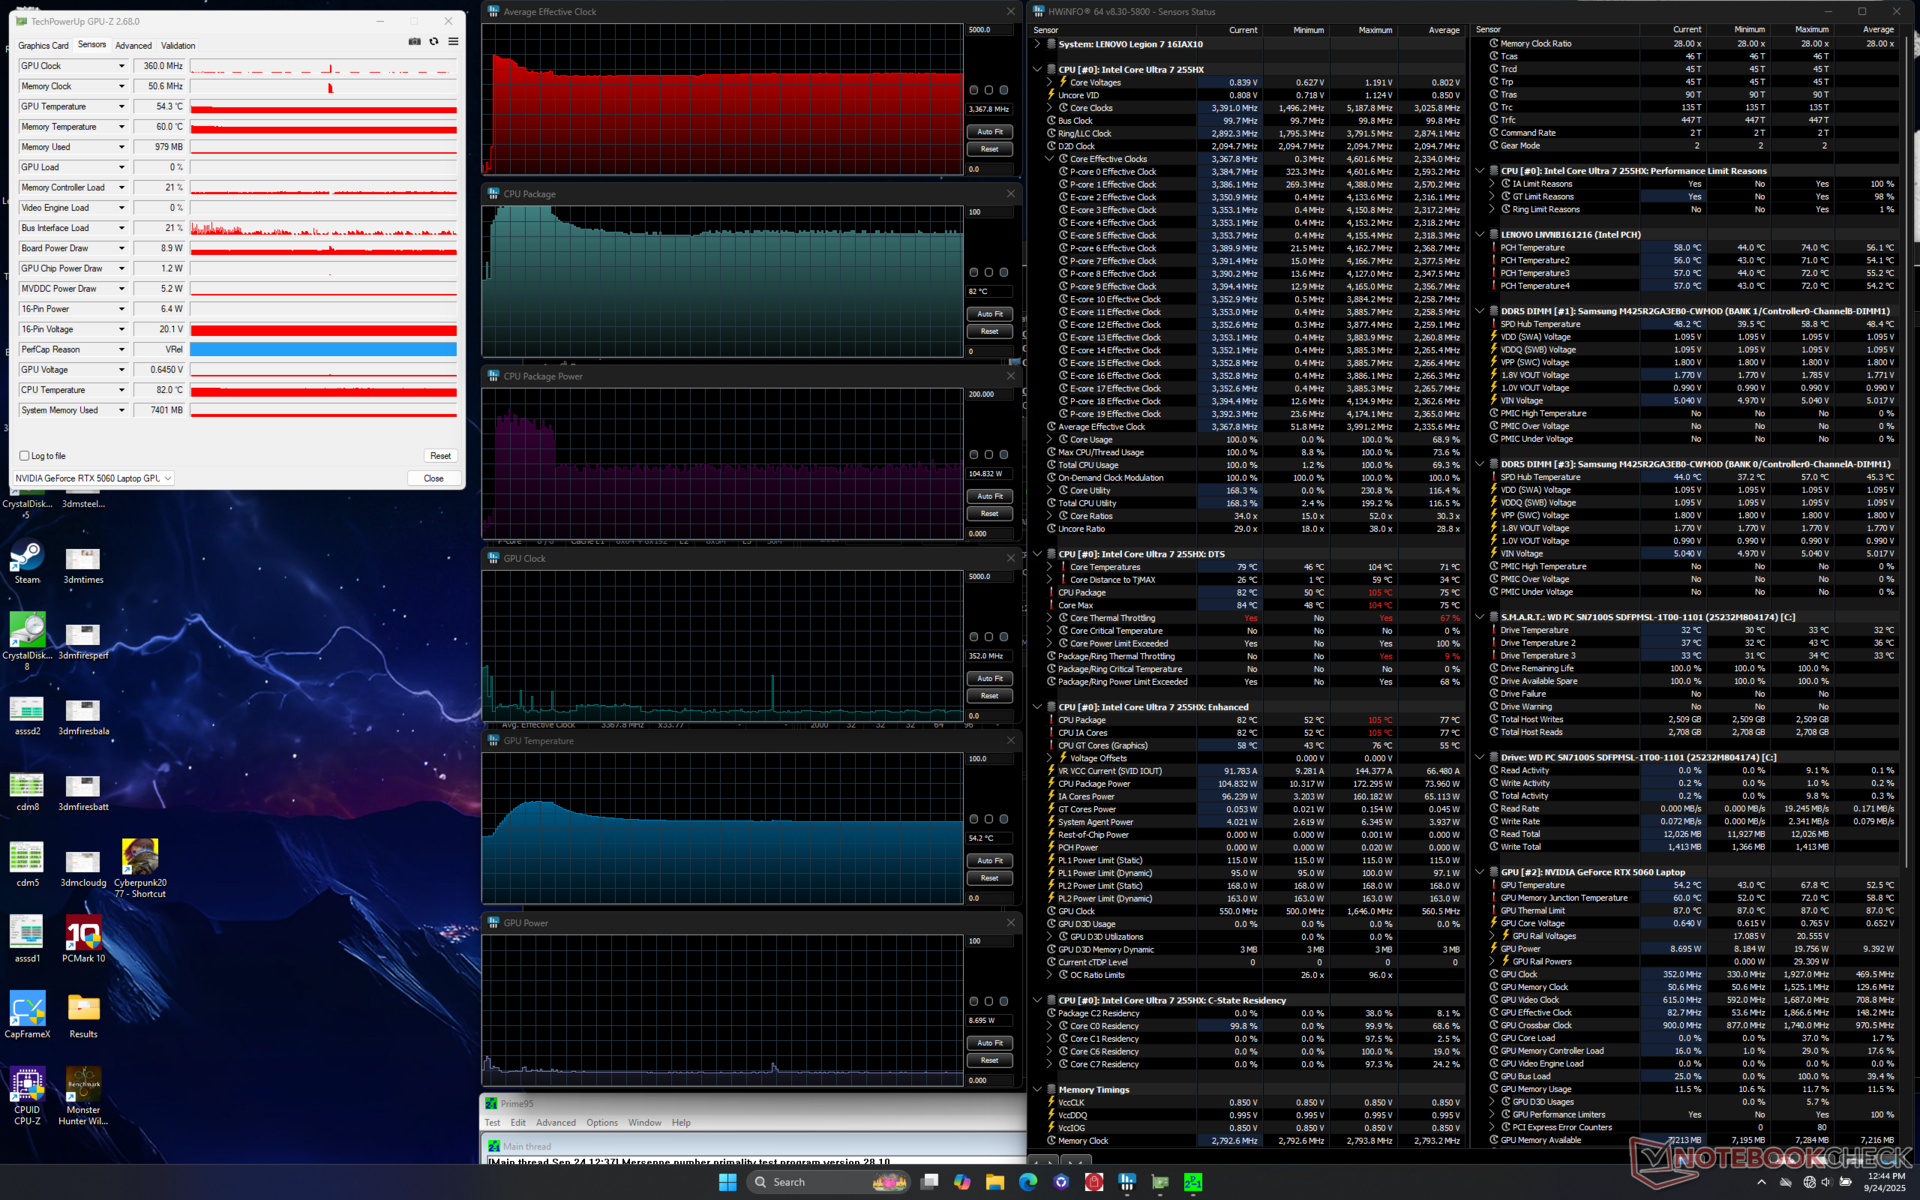
压力测试
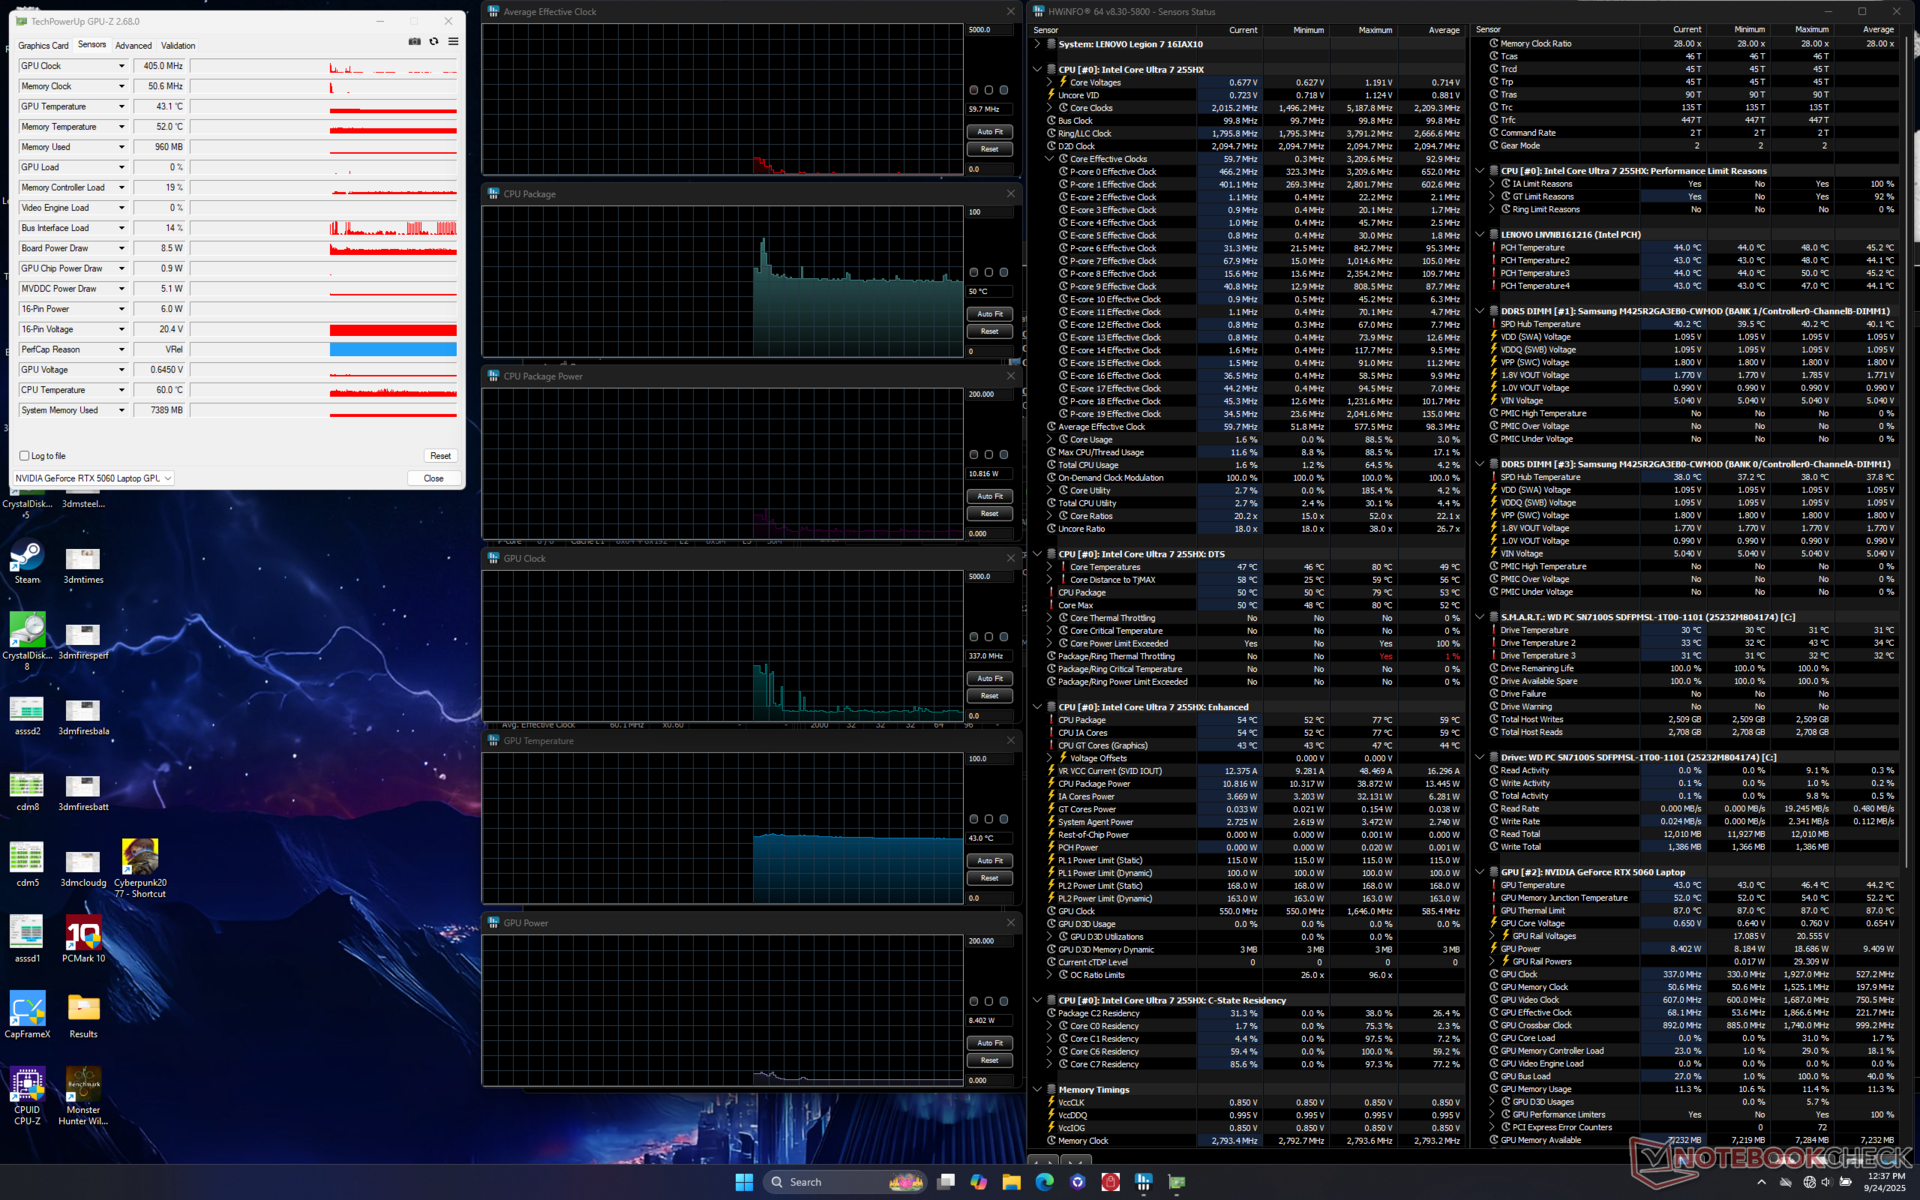
显然,Arrow Lake-HX CPU 正在将轻量级散热解决方案推向极限。最大 Turbo Boost 时钟速率无法长时间维持,这与我们在上文提到的 CineBench R15 xT 循环观察结果一致。
在性能模式下运行《赛博朋克 2077》时,GPU 的频率稳定在 2722 MHz,功耗为 105 W,温度为 82 C,相比之下,Alienware 16 Aurora 的频率为 2085 MHz,温度为 74 C。 Alienware 16 极光.如果在平衡模式下进行游戏,GPU 时钟速率和温度都会下降,如下表和截图所示。
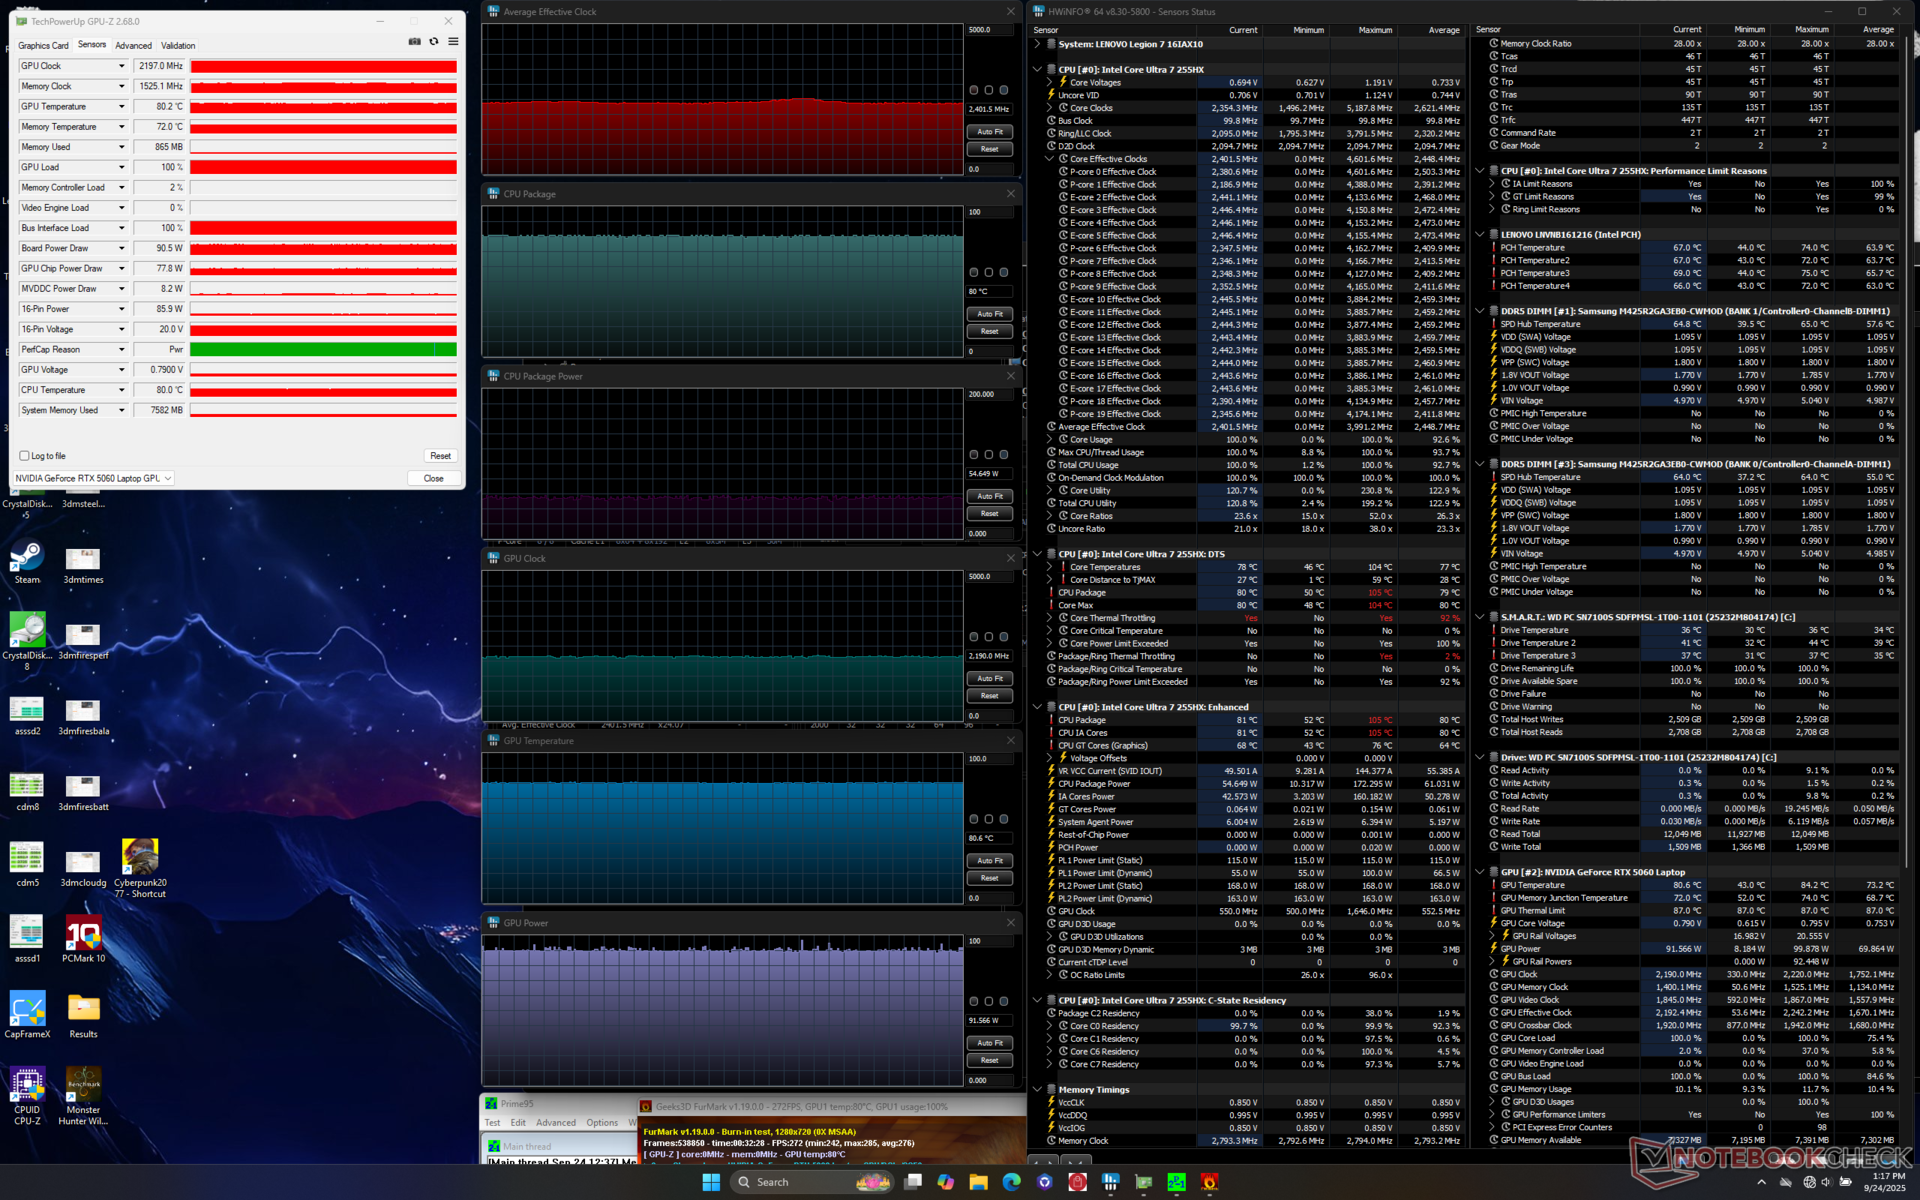
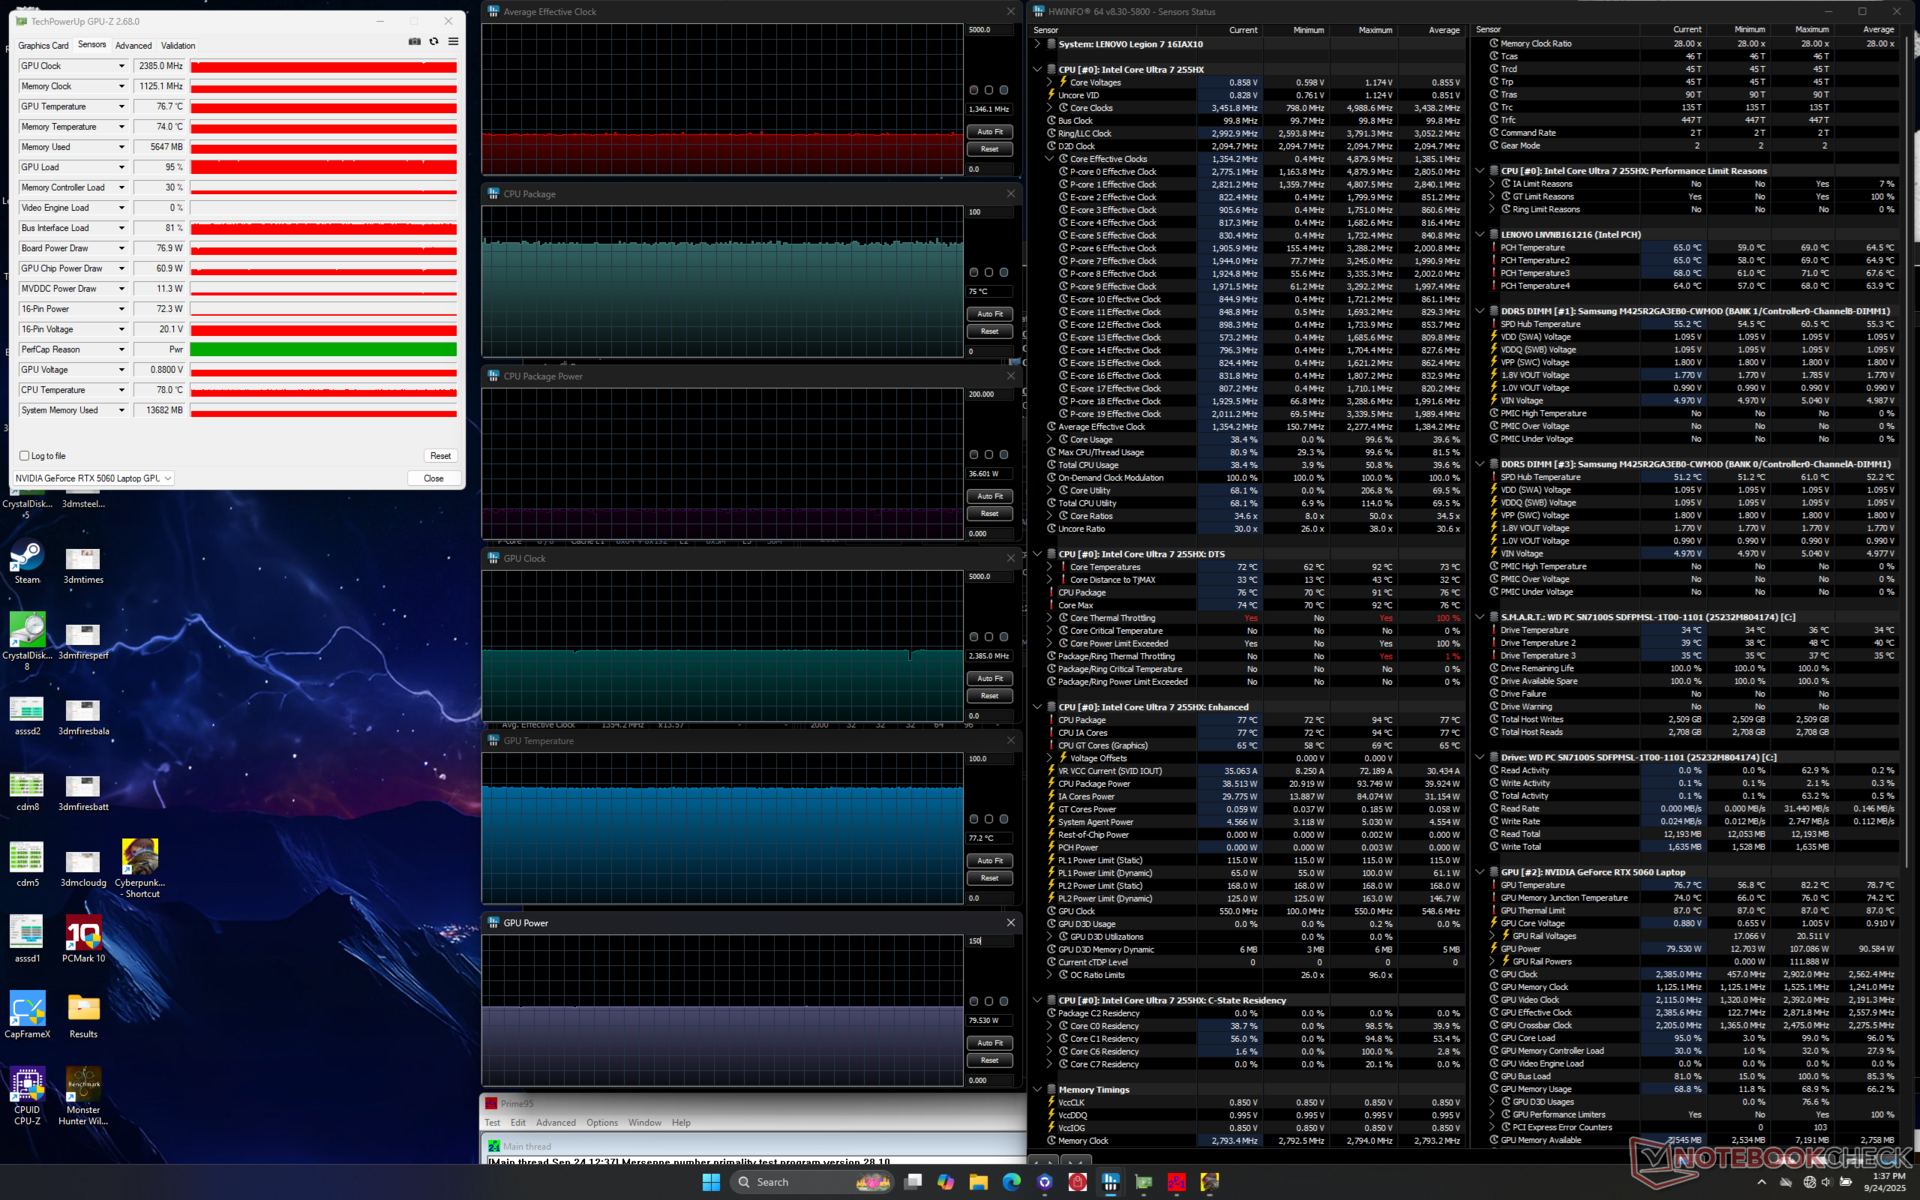
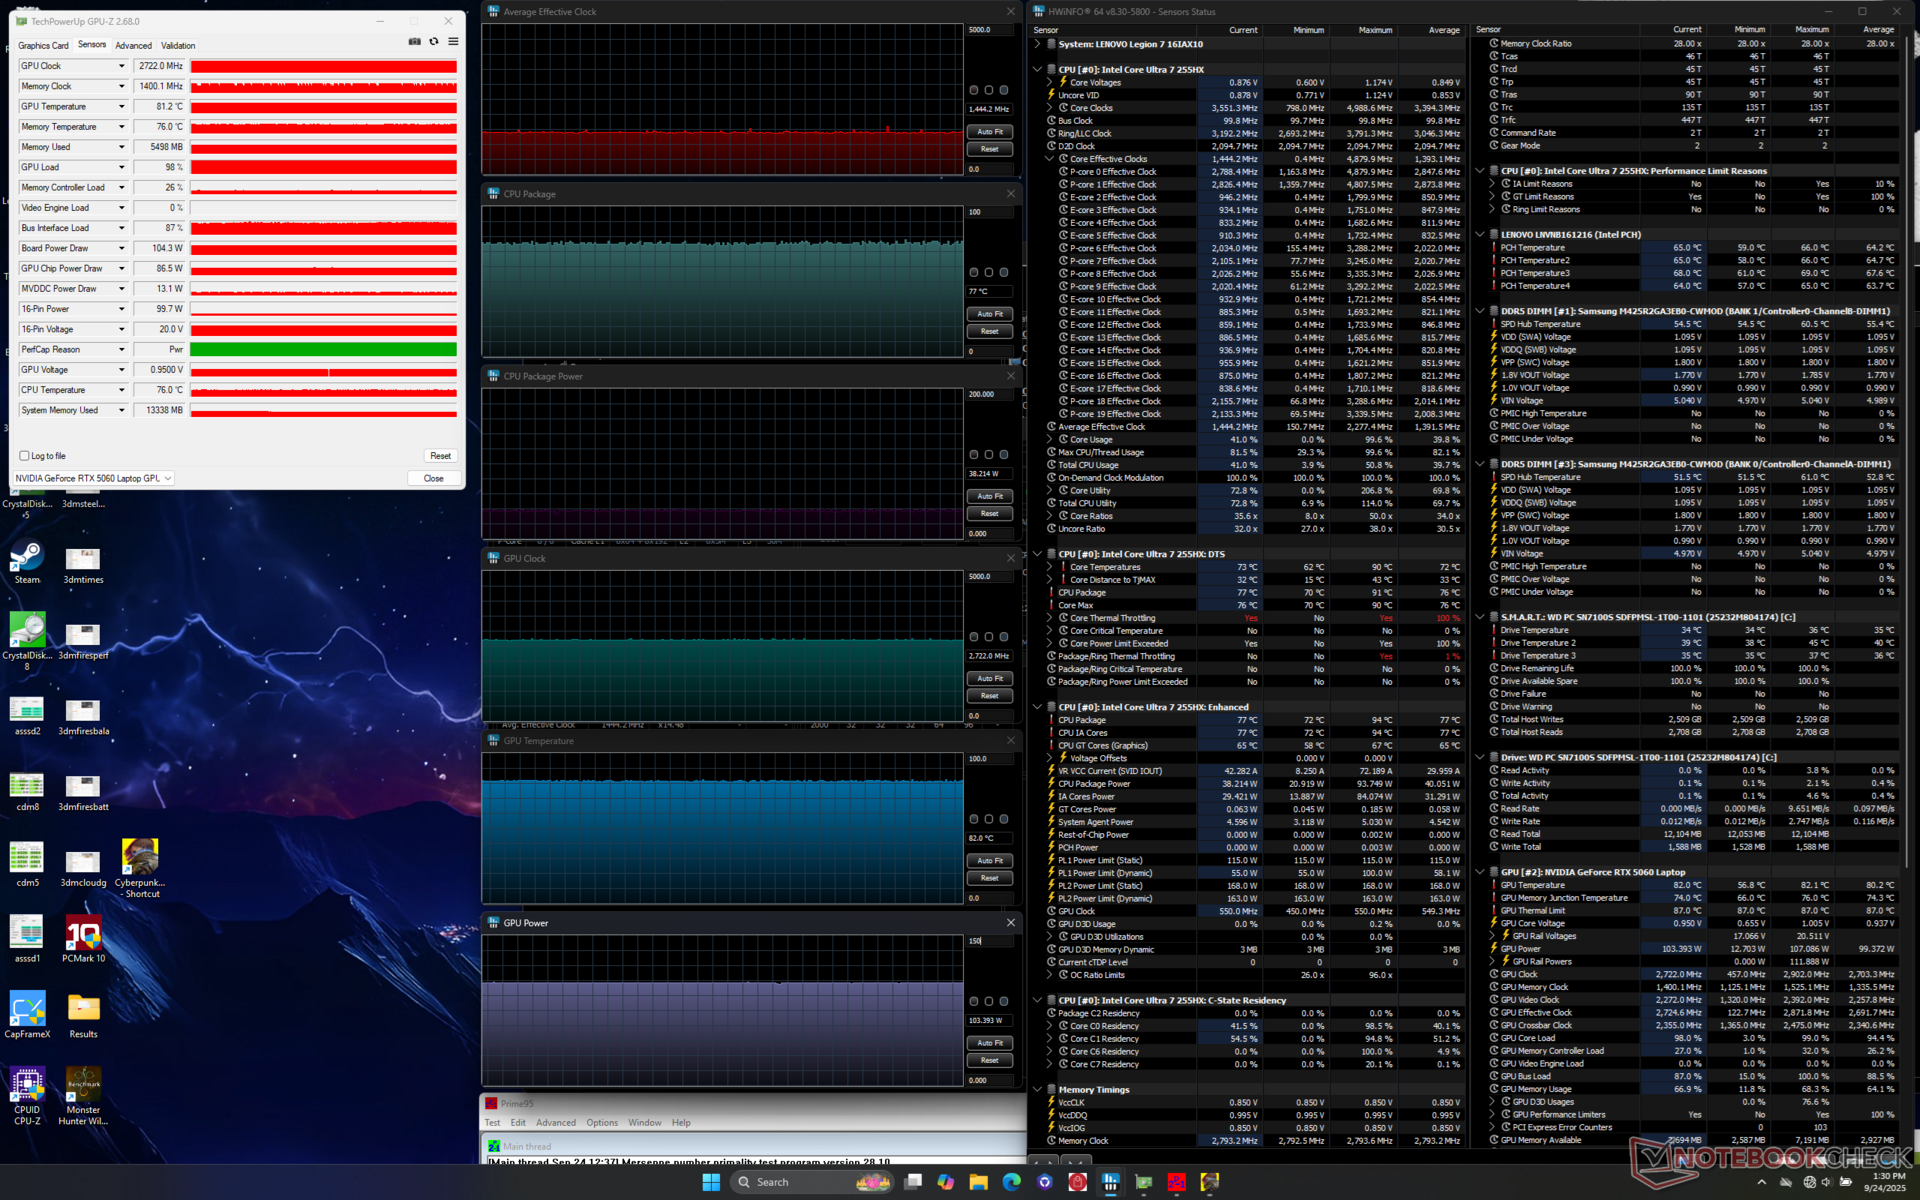
| 平均 CPU 时钟 (GHz) | GPU 时钟 (MHz) | 平均 CPU 温度 (°C) | 平均 GPU 温度 (°C) | |
| 系统闲置 | -- | -- | 50 | 43 |
| Prime95 压力 | 3.4 | -- | 82 | 54 |
| Prime95 + FurMark Stress | 2.4 | 2197 | 80 | 81 |
| 赛博朋克 2077》压力(平衡模式) | 1.3 | 2385 | 75 | 77 |
| 赛博朋克 2077》压力(性能模式) | 1.4 | 2722 | 77 | 82 |
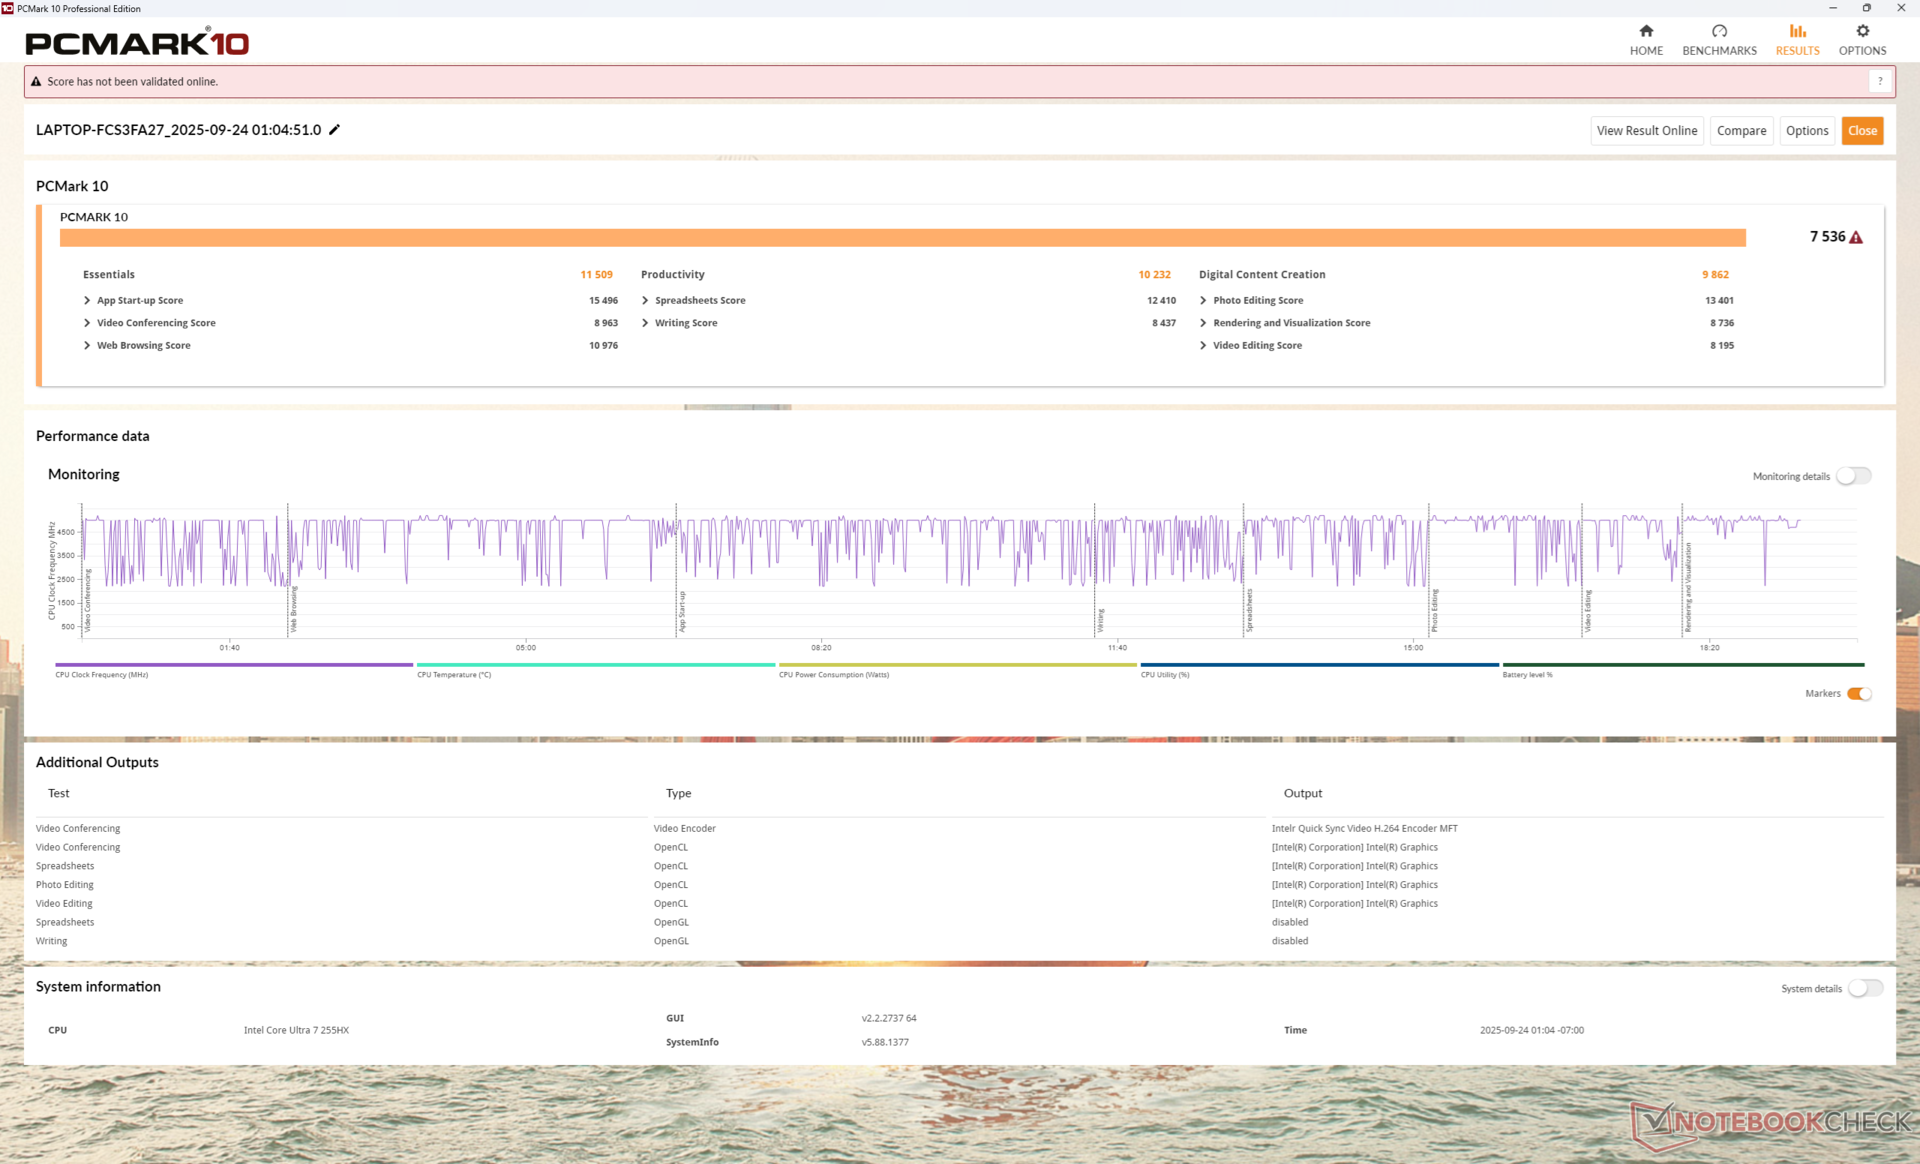
系统性能
PCMark 10 只能在 iGPU 模式下运行,否则就会崩溃,因此我们的 "数字内容创建 "得分偏低。除此之外,由于采用了快速的 Arrow Lake-HX CPU,PCMark Essentials 或 Productivity 等重 CPU 的基准测试得分高于其他大多数 16 英寸游戏笔记本电脑。
PCMark 10: Score | Essentials | Productivity | Digital Content Creation
CrossMark: Overall | Productivity | Creativity | Responsiveness
WebXPRT 3: Overall
WebXPRT 4: Overall
Mozilla Kraken 1.1: Total
| Performance rating | |
| Lenovo Legion 5 Pro 16IAX10H | |
| Average Intel Core Ultra 7 255HX, NVIDIA GeForce RTX 5060 Laptop | |
| Lenovo Legion 7 16IAX10 | |
| MSI Vector 16 HX AI A2XWHG | |
| Alienware 16 Aurora -4! | |
| Gigabyte Gaming A16 GA6H | |
| Asus TUF Gaming A16 FA608UP -4! | |
| PCMark 10 / Score | |
| Average Intel Core Ultra 7 255HX, NVIDIA GeForce RTX 5060 Laptop (7536 - 10386, n=2) | |
| Lenovo Legion 5 Pro 16IAX10H | |
| MSI Vector 16 HX AI A2XWHG | |
| Lenovo Legion 7 16IAX10 | |
| Gigabyte Gaming A16 GA6H | |
| PCMark 10 / Essentials | |
| Average Intel Core Ultra 7 255HX, NVIDIA GeForce RTX 5060 Laptop (11509 - 11664, n=2) | |
| Lenovo Legion 7 16IAX10 | |
| Lenovo Legion 5 Pro 16IAX10H | |
| MSI Vector 16 HX AI A2XWHG | |
| Gigabyte Gaming A16 GA6H | |
| PCMark 10 / Productivity | |
| Average Intel Core Ultra 7 255HX, NVIDIA GeForce RTX 5060 Laptop (10232 - 16048, n=2) | |
| Lenovo Legion 7 16IAX10 | |
| Lenovo Legion 5 Pro 16IAX10H | |
| MSI Vector 16 HX AI A2XWHG | |
| Gigabyte Gaming A16 GA6H | |
| PCMark 10 / Digital Content Creation | |
| Lenovo Legion 5 Pro 16IAX10H | |
| Average Intel Core Ultra 7 255HX, NVIDIA GeForce RTX 5060 Laptop (9862 - 16240, n=2) | |
| MSI Vector 16 HX AI A2XWHG | |
| Gigabyte Gaming A16 GA6H | |
| Lenovo Legion 7 16IAX10 | |
| CrossMark / Overall | |
| Lenovo Legion 5 Pro 16IAX10H | |
| Average Intel Core Ultra 7 255HX, NVIDIA GeForce RTX 5060 Laptop (2059 - 2066, n=2) | |
| Lenovo Legion 7 16IAX10 | |
| Alienware 16 Aurora | |
| MSI Vector 16 HX AI A2XWHG | |
| Gigabyte Gaming A16 GA6H | |
| Asus TUF Gaming A16 FA608UP | |
| CrossMark / Productivity | |
| Lenovo Legion 5 Pro 16IAX10H | |
| Lenovo Legion 7 16IAX10 | |
| Average Intel Core Ultra 7 255HX, NVIDIA GeForce RTX 5060 Laptop (1943 - 1951, n=2) | |
| Alienware 16 Aurora | |
| MSI Vector 16 HX AI A2XWHG | |
| Gigabyte Gaming A16 GA6H | |
| Asus TUF Gaming A16 FA608UP | |
| CrossMark / Creativity | |
| Lenovo Legion 5 Pro 16IAX10H | |
| Average Intel Core Ultra 7 255HX, NVIDIA GeForce RTX 5060 Laptop (2288 - 2384, n=2) | |
| Lenovo Legion 7 16IAX10 | |
| MSI Vector 16 HX AI A2XWHG | |
| Alienware 16 Aurora | |
| Asus TUF Gaming A16 FA608UP | |
| Gigabyte Gaming A16 GA6H | |
| CrossMark / Responsiveness | |
| Alienware 16 Aurora | |
| Lenovo Legion 5 Pro 16IAX10H | |
| Gigabyte Gaming A16 GA6H | |
| Lenovo Legion 7 16IAX10 | |
| Average Intel Core Ultra 7 255HX, NVIDIA GeForce RTX 5060 Laptop (1617 - 1765, n=2) | |
| MSI Vector 16 HX AI A2XWHG | |
| Asus TUF Gaming A16 FA608UP | |
| WebXPRT 3 / Overall | |
| Lenovo Legion 5 Pro 16IAX10H | |
| Lenovo Legion 7 16IAX10 | |
| Average Intel Core Ultra 7 255HX, NVIDIA GeForce RTX 5060 Laptop (317 - 344, n=2) | |
| MSI Vector 16 HX AI A2XWHG | |
| Asus TUF Gaming A16 FA608UP | |
| Alienware 16 Aurora | |
| Gigabyte Gaming A16 GA6H | |
| WebXPRT 4 / Overall | |
| Lenovo Legion 5 Pro 16IAX10H | |
| Lenovo Legion 7 16IAX10 | |
| Average Intel Core Ultra 7 255HX, NVIDIA GeForce RTX 5060 Laptop (313 - 317, n=2) | |
| MSI Vector 16 HX AI A2XWHG | |
| Alienware 16 Aurora | |
| Gigabyte Gaming A16 GA6H | |
| Asus TUF Gaming A16 FA608UP | |
| Mozilla Kraken 1.1 / Total | |
| Asus TUF Gaming A16 FA608UP | |
| Alienware 16 Aurora | |
| Gigabyte Gaming A16 GA6H | |
| Lenovo Legion 7 16IAX10 | |
| Average Intel Core Ultra 7 255HX, NVIDIA GeForce RTX 5060 Laptop (423 - 436, n=2) | |
| MSI Vector 16 HX AI A2XWHG | |
| Lenovo Legion 5 Pro 16IAX10H | |
* ... smaller is better
| PCMark 10 Score | 7536 points | |
Help | ||
| AIDA64 / Memory Copy | |
| Lenovo Legion 7 16IAX10 | |
| Average Intel Core Ultra 7 255HX (68939 - 104987, n=5) | |
| Lenovo Legion 5 Pro 16IAX10H | |
| MSI Vector 16 HX AI A2XWHG | |
| Asus TUF Gaming A16 FA608UP | |
| Alienware 16 Aurora | |
| Gigabyte Gaming A16 GA6H | |
| AIDA64 / Memory Read | |
| Average Intel Core Ultra 7 255HX (82336 - 95821, n=5) | |
| Lenovo Legion 5 Pro 16IAX10H | |
| Lenovo Legion 7 16IAX10 | |
| MSI Vector 16 HX AI A2XWHG | |
| Alienware 16 Aurora | |
| Asus TUF Gaming A16 FA608UP | |
| Gigabyte Gaming A16 GA6H | |
| AIDA64 / Memory Write | |
| Average Intel Core Ultra 7 255HX (66479 - 133486, n=5) | |
| Asus TUF Gaming A16 FA608UP | |
| Lenovo Legion 5 Pro 16IAX10H | |
| Lenovo Legion 7 16IAX10 | |
| MSI Vector 16 HX AI A2XWHG | |
| Alienware 16 Aurora | |
| Gigabyte Gaming A16 GA6H | |
| AIDA64 / Memory Latency | |
| Lenovo Legion 5 Pro 16IAX10H | |
| Average Intel Core Ultra 7 255HX (104.2 - 110, n=5) | |
| Lenovo Legion 7 16IAX10 | |
| Alienware 16 Aurora | |
| MSI Vector 16 HX AI A2XWHG | |
| Gigabyte Gaming A16 GA6H | |
| Asus TUF Gaming A16 FA608UP | |
* ... smaller is better
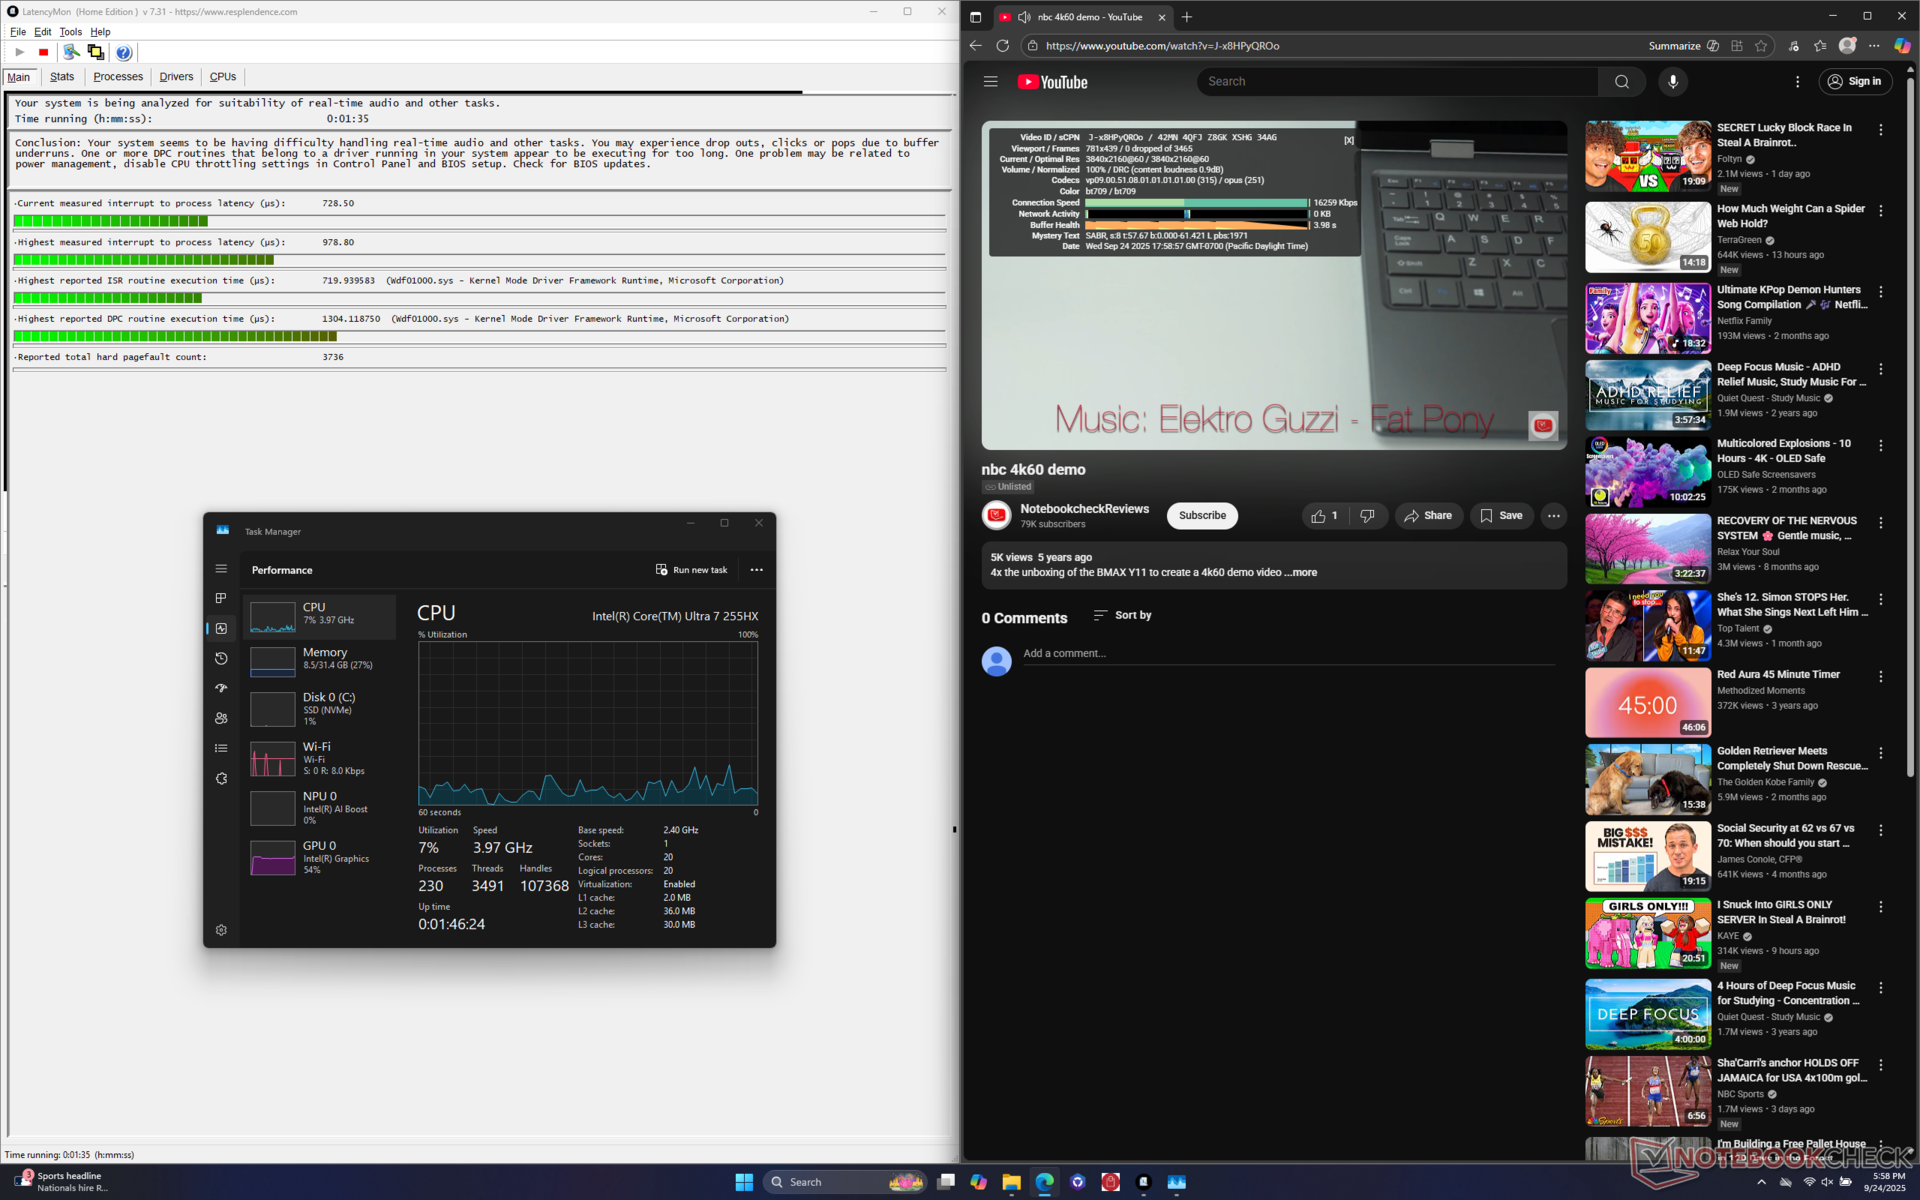
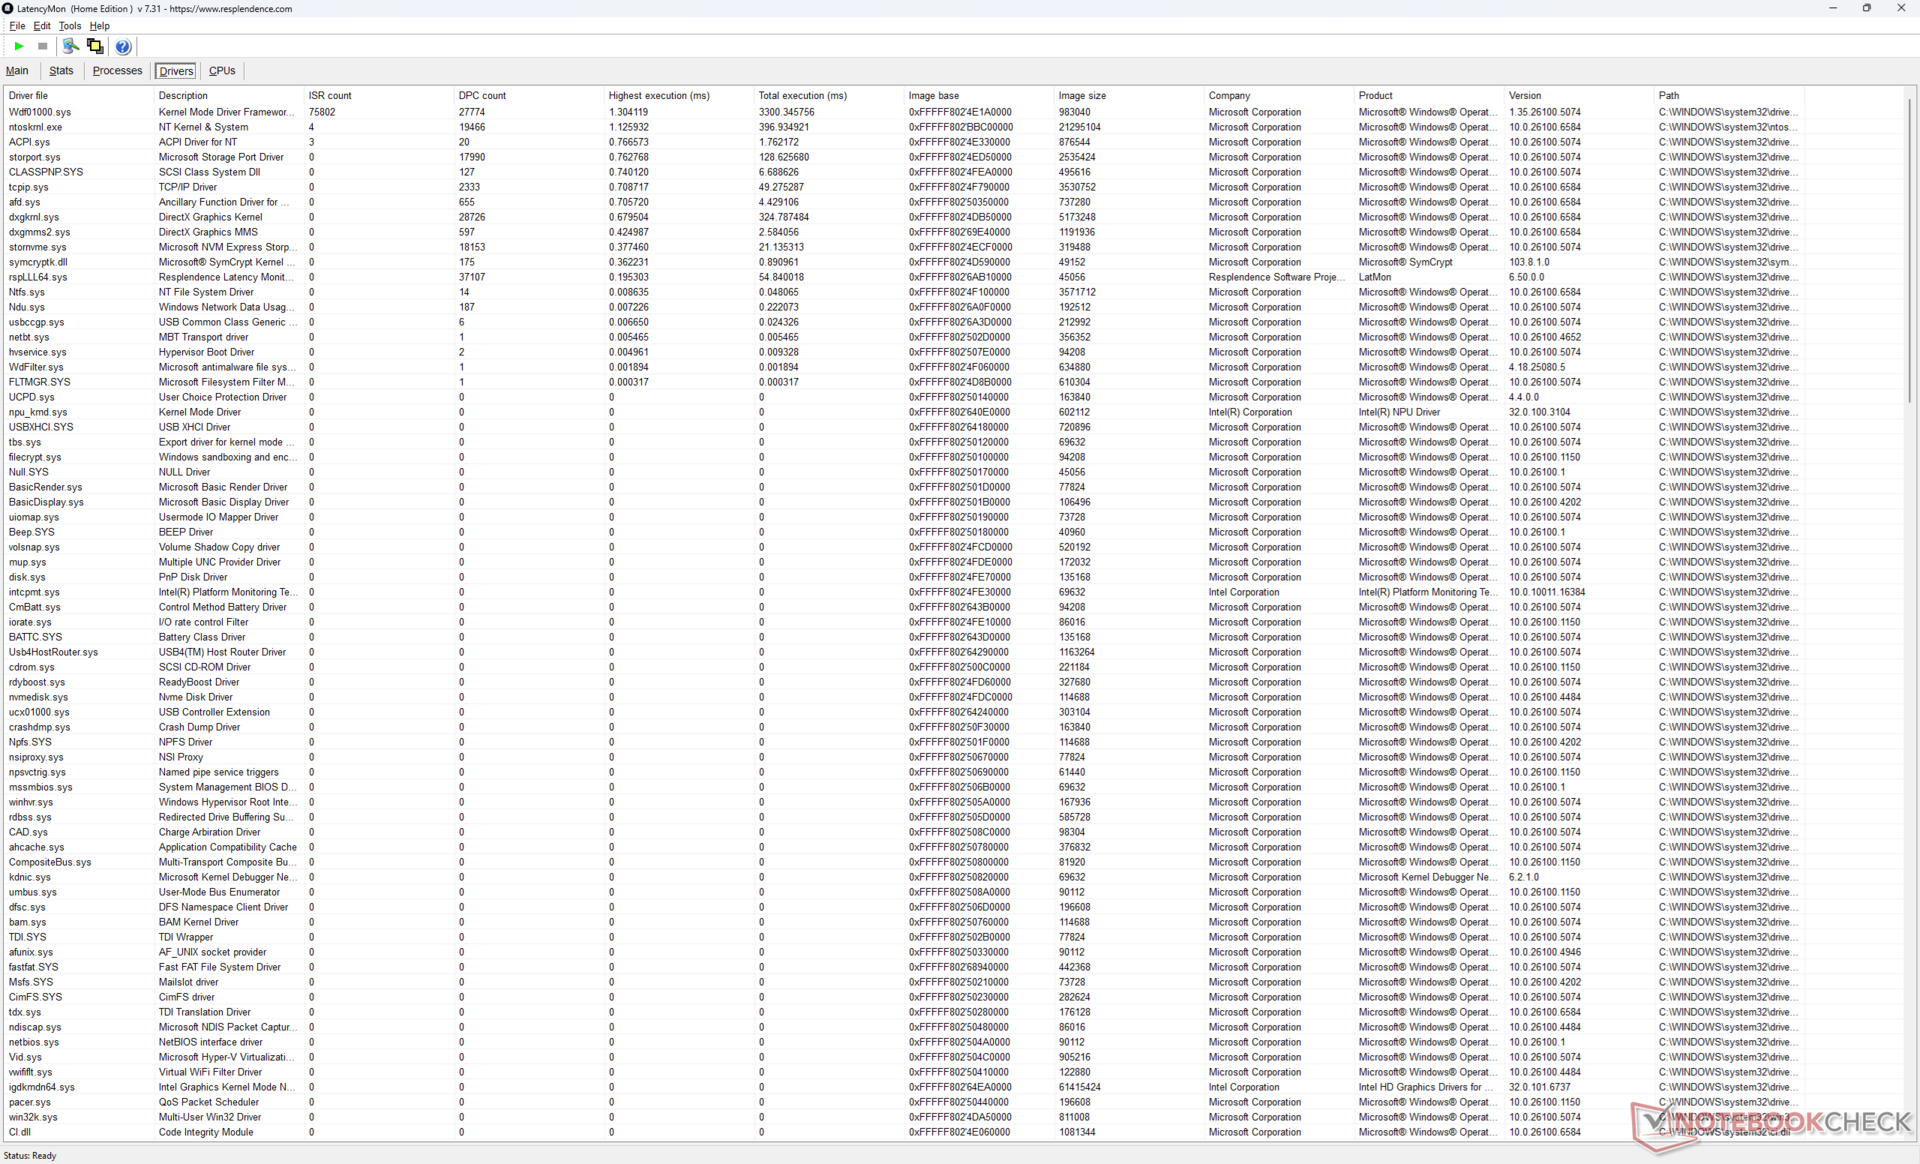
DPC 延迟
在 4K60 视频播放测试中,LatencyMon 只显示了轻微的 DPC 问题,没有记录到丢帧现象。
| DPC Latencies / LatencyMon - interrupt to process latency (max), Web, Youtube, Prime95 | |
| MSI Vector 16 HX AI A2XWHG | |
| Gigabyte Gaming A16 GA6H | |
| Lenovo Legion 5 Pro 16IAX10H | |
| Lenovo Legion 7 16IAX10 | |
| Asus TUF Gaming A16 FA608UP | |
* ... smaller is better
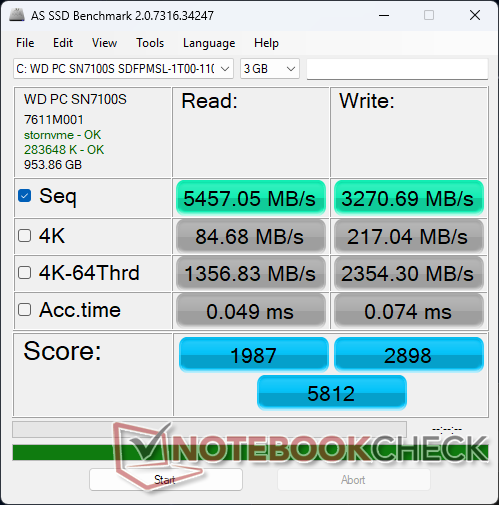
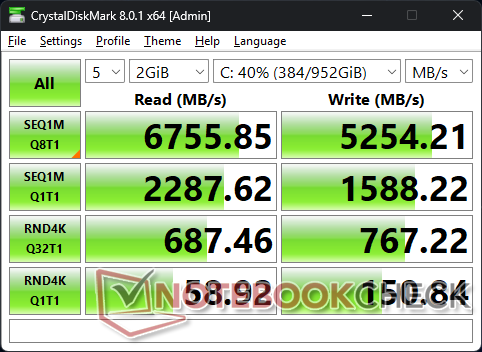
存储设备
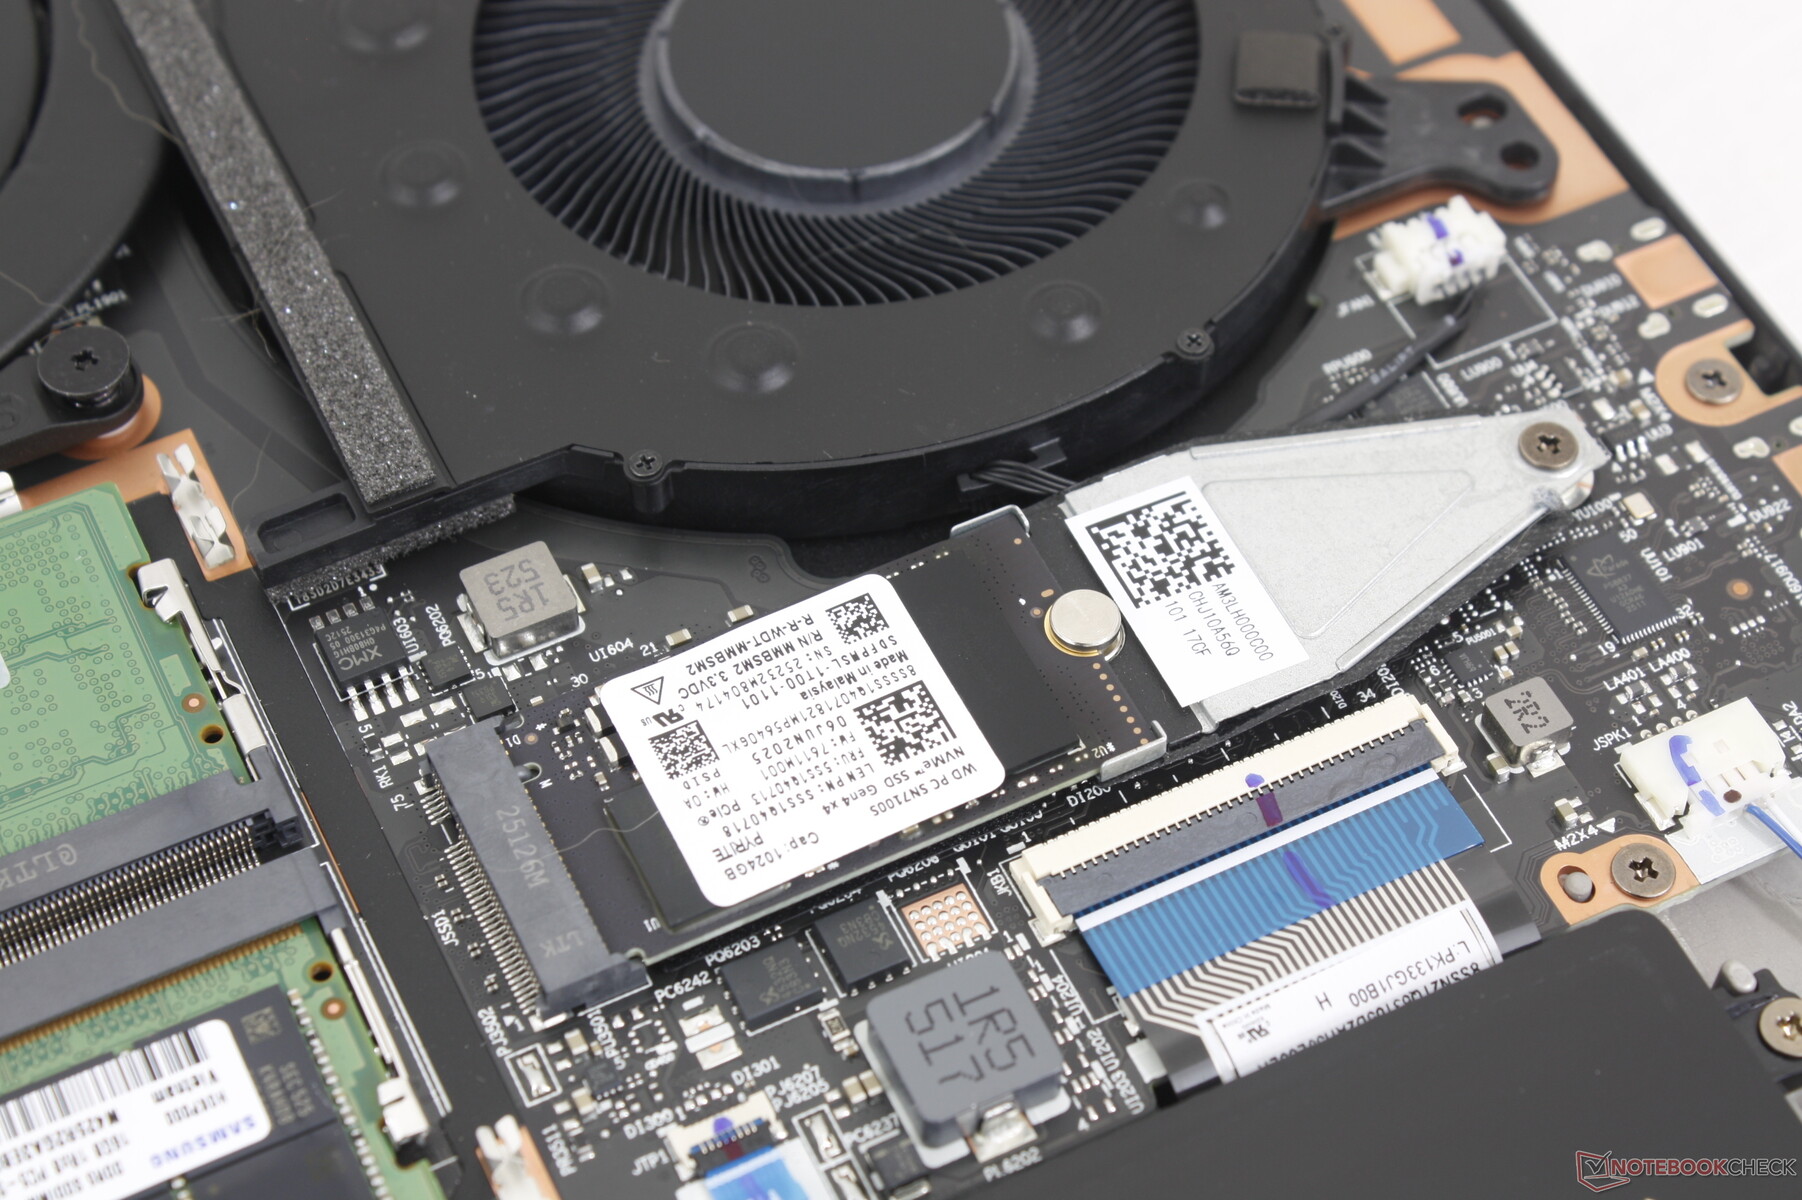
主固态硬盘附带散热垫和散热器。传输速率在受压时保持在 6900 MB/s,不会出现节流问题。

| Drive Performance rating - Percent | |
| Gigabyte Gaming A16 GA6H | |
| Lenovo Legion 5 Pro 16IAX10H | |
| Lenovo Legion 7 16IAX10 | |
| Asus TUF Gaming A16 FA608UP | |
| MSI Vector 16 HX AI A2XWHG | |
* ... smaller is better
磁盘节流DiskSpd 读取循环,队列深度 8
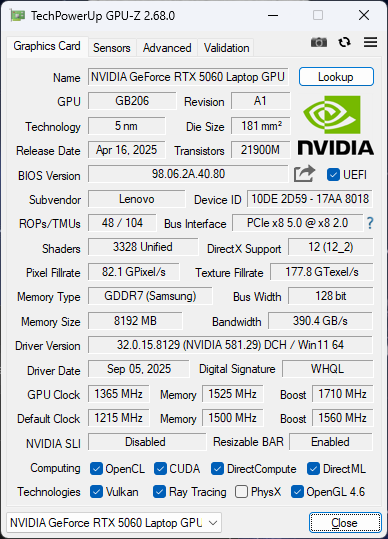
图形处理器性能
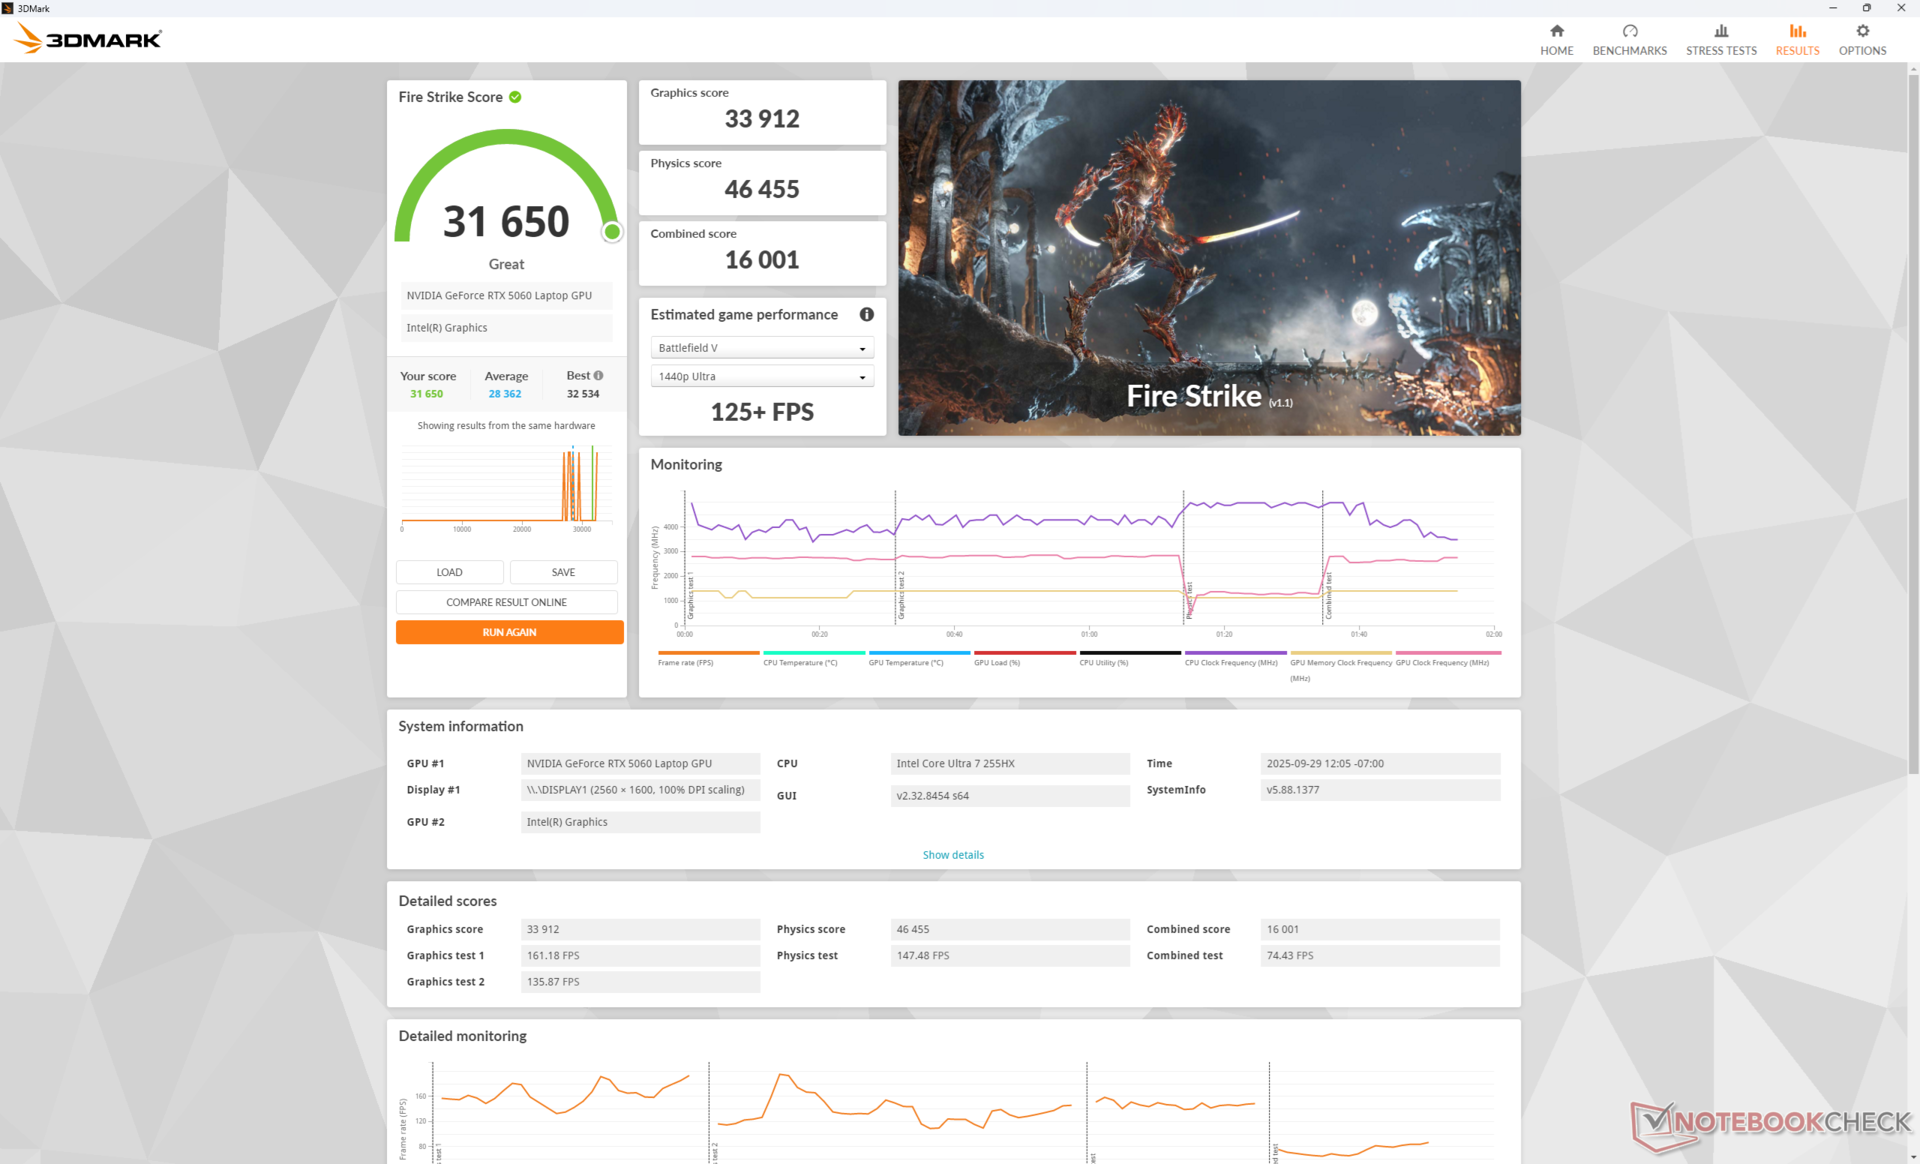
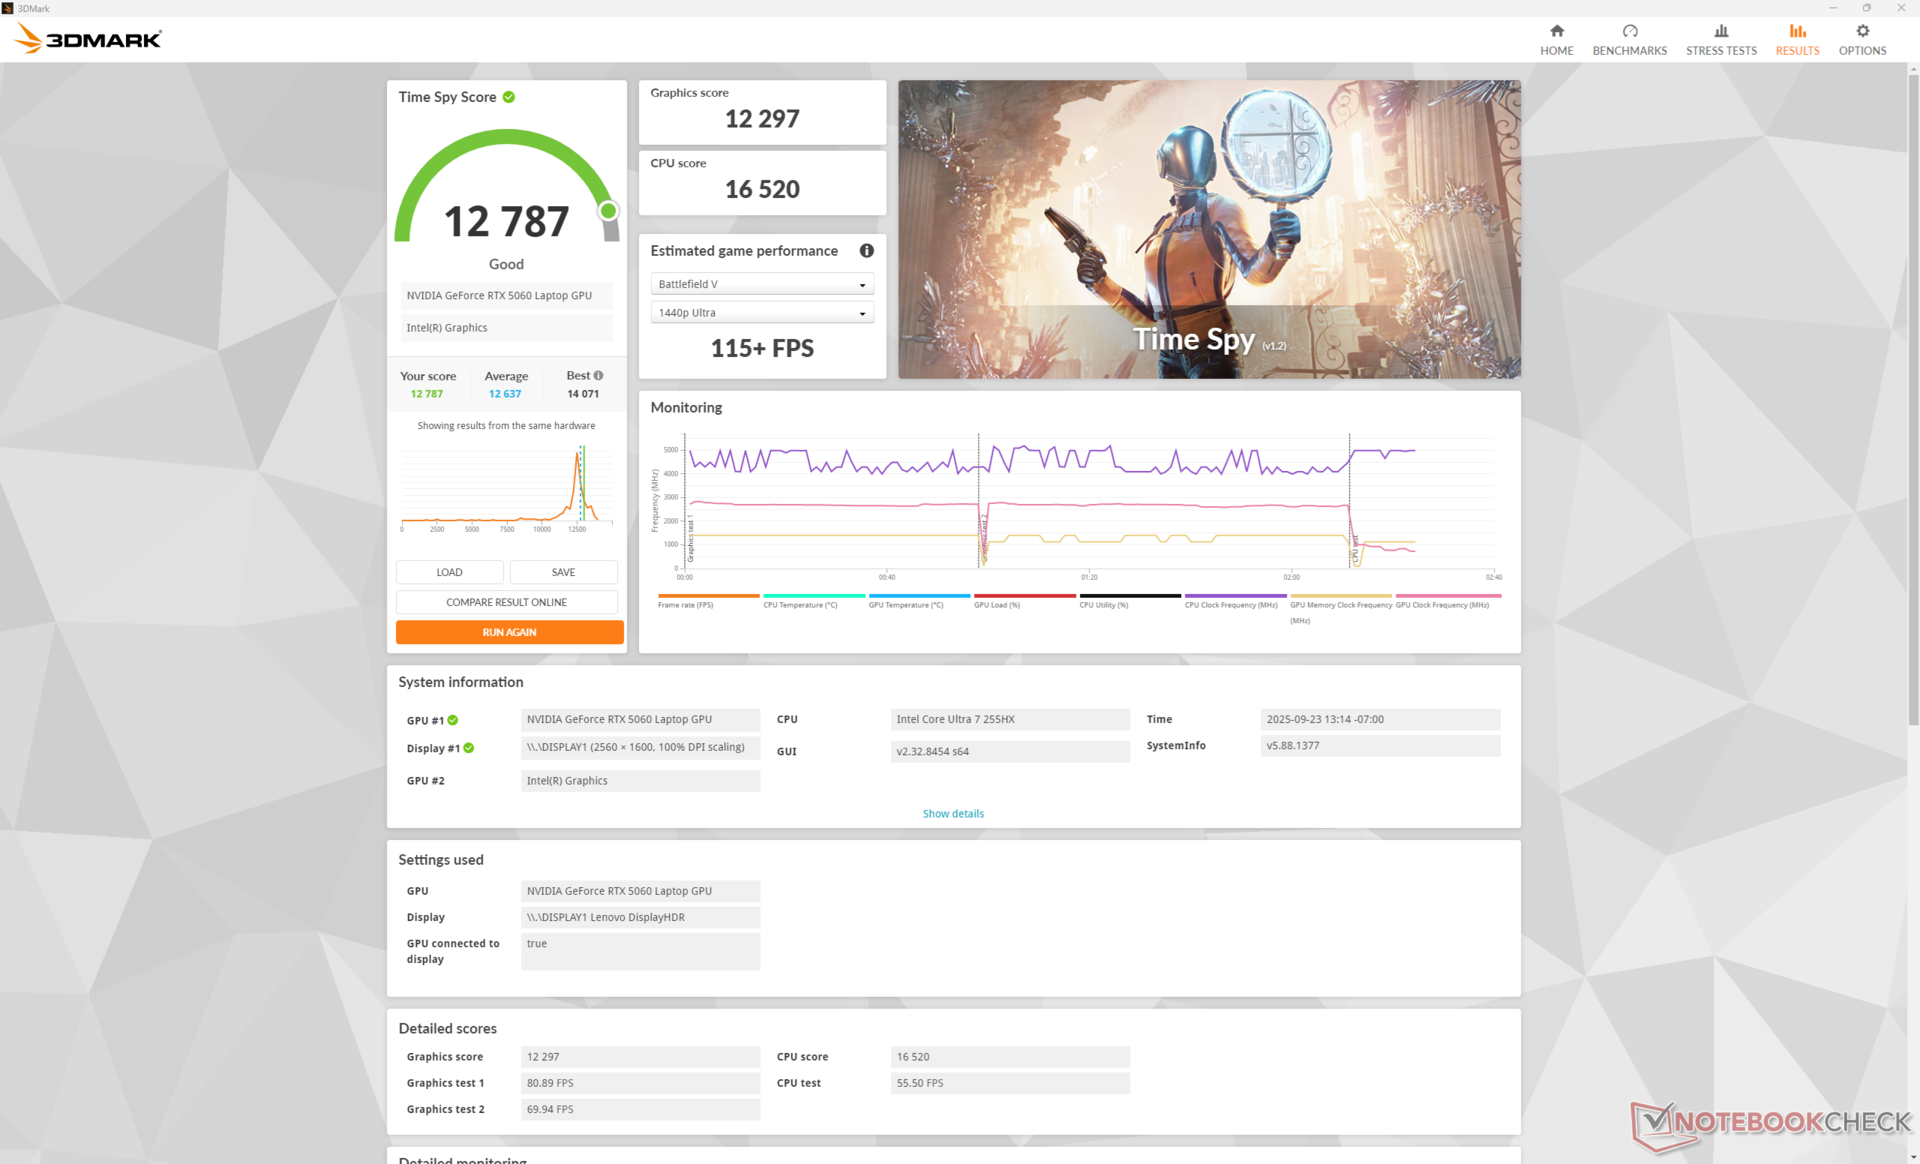
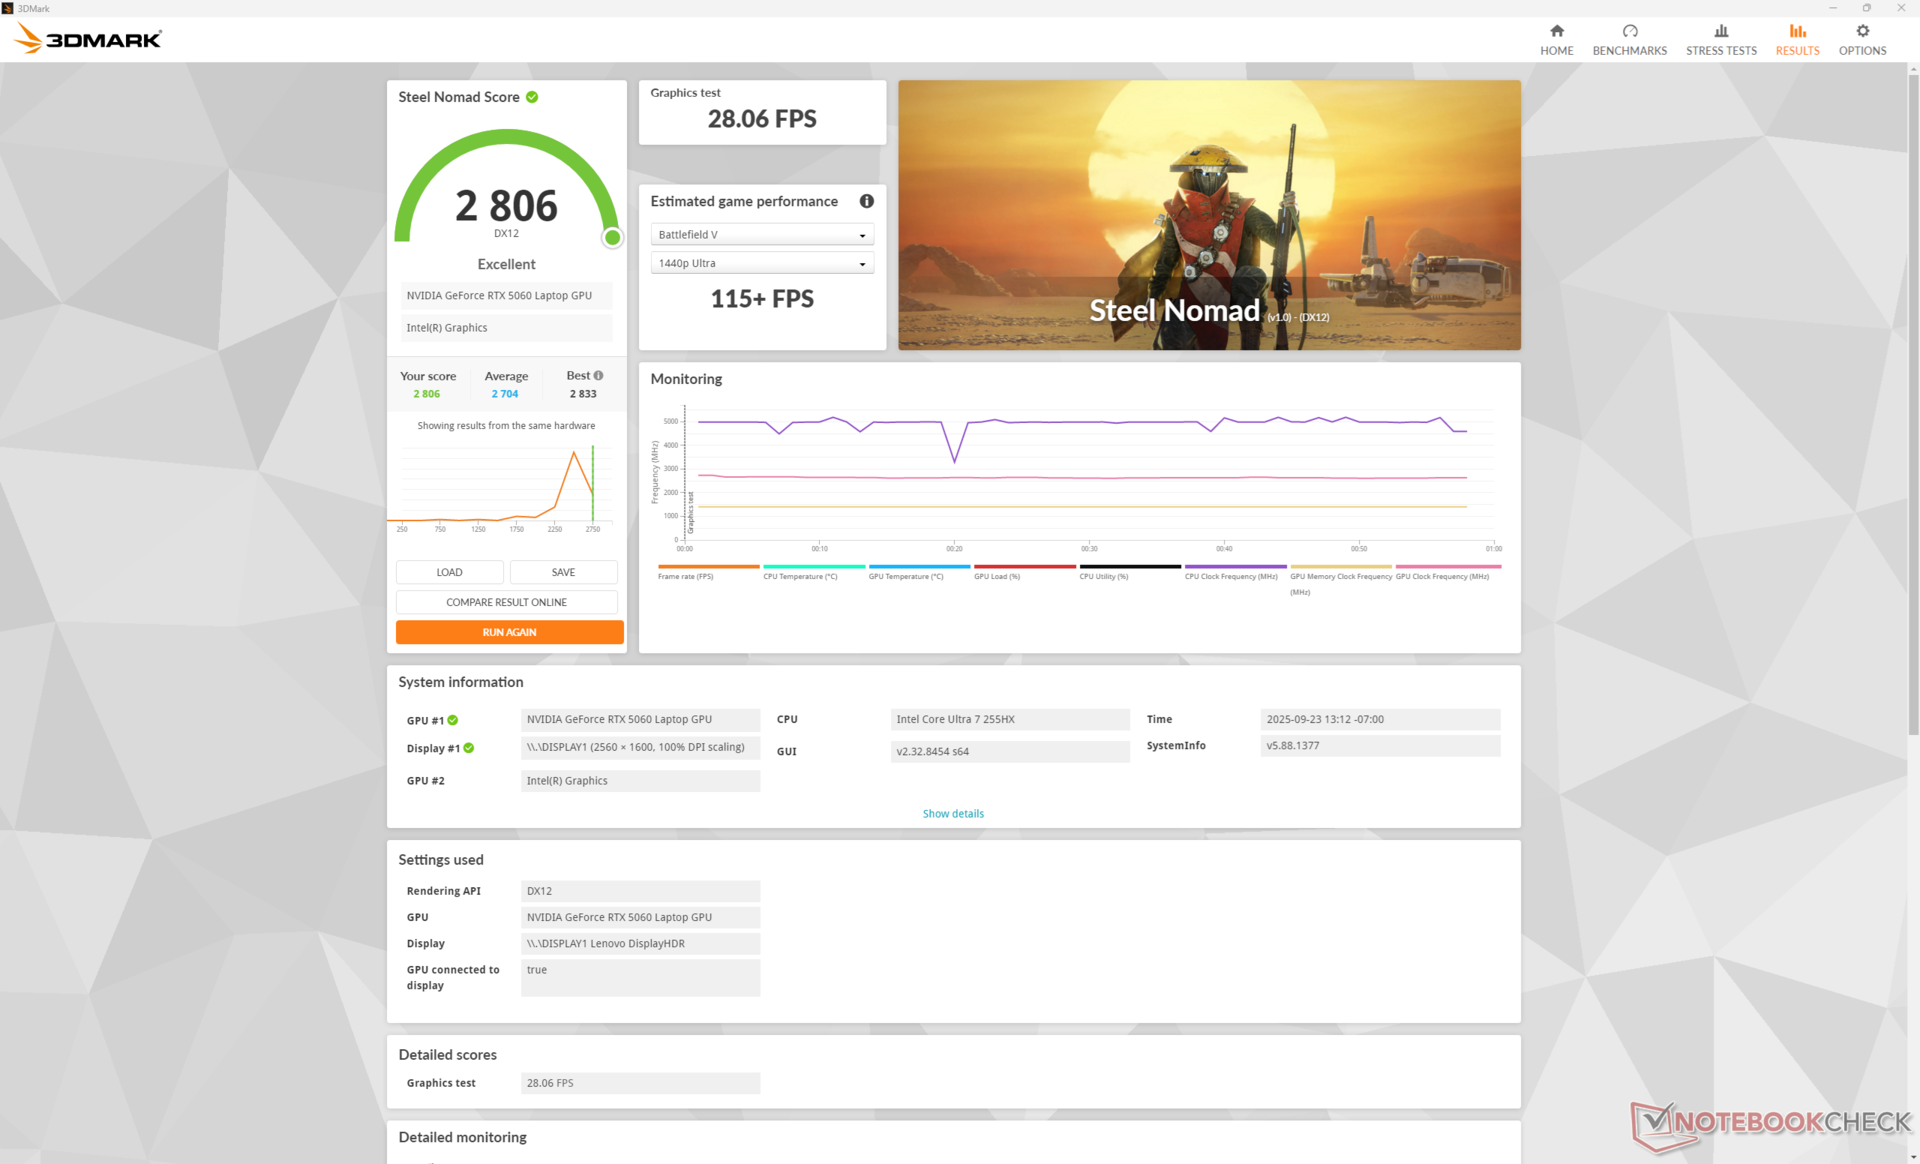
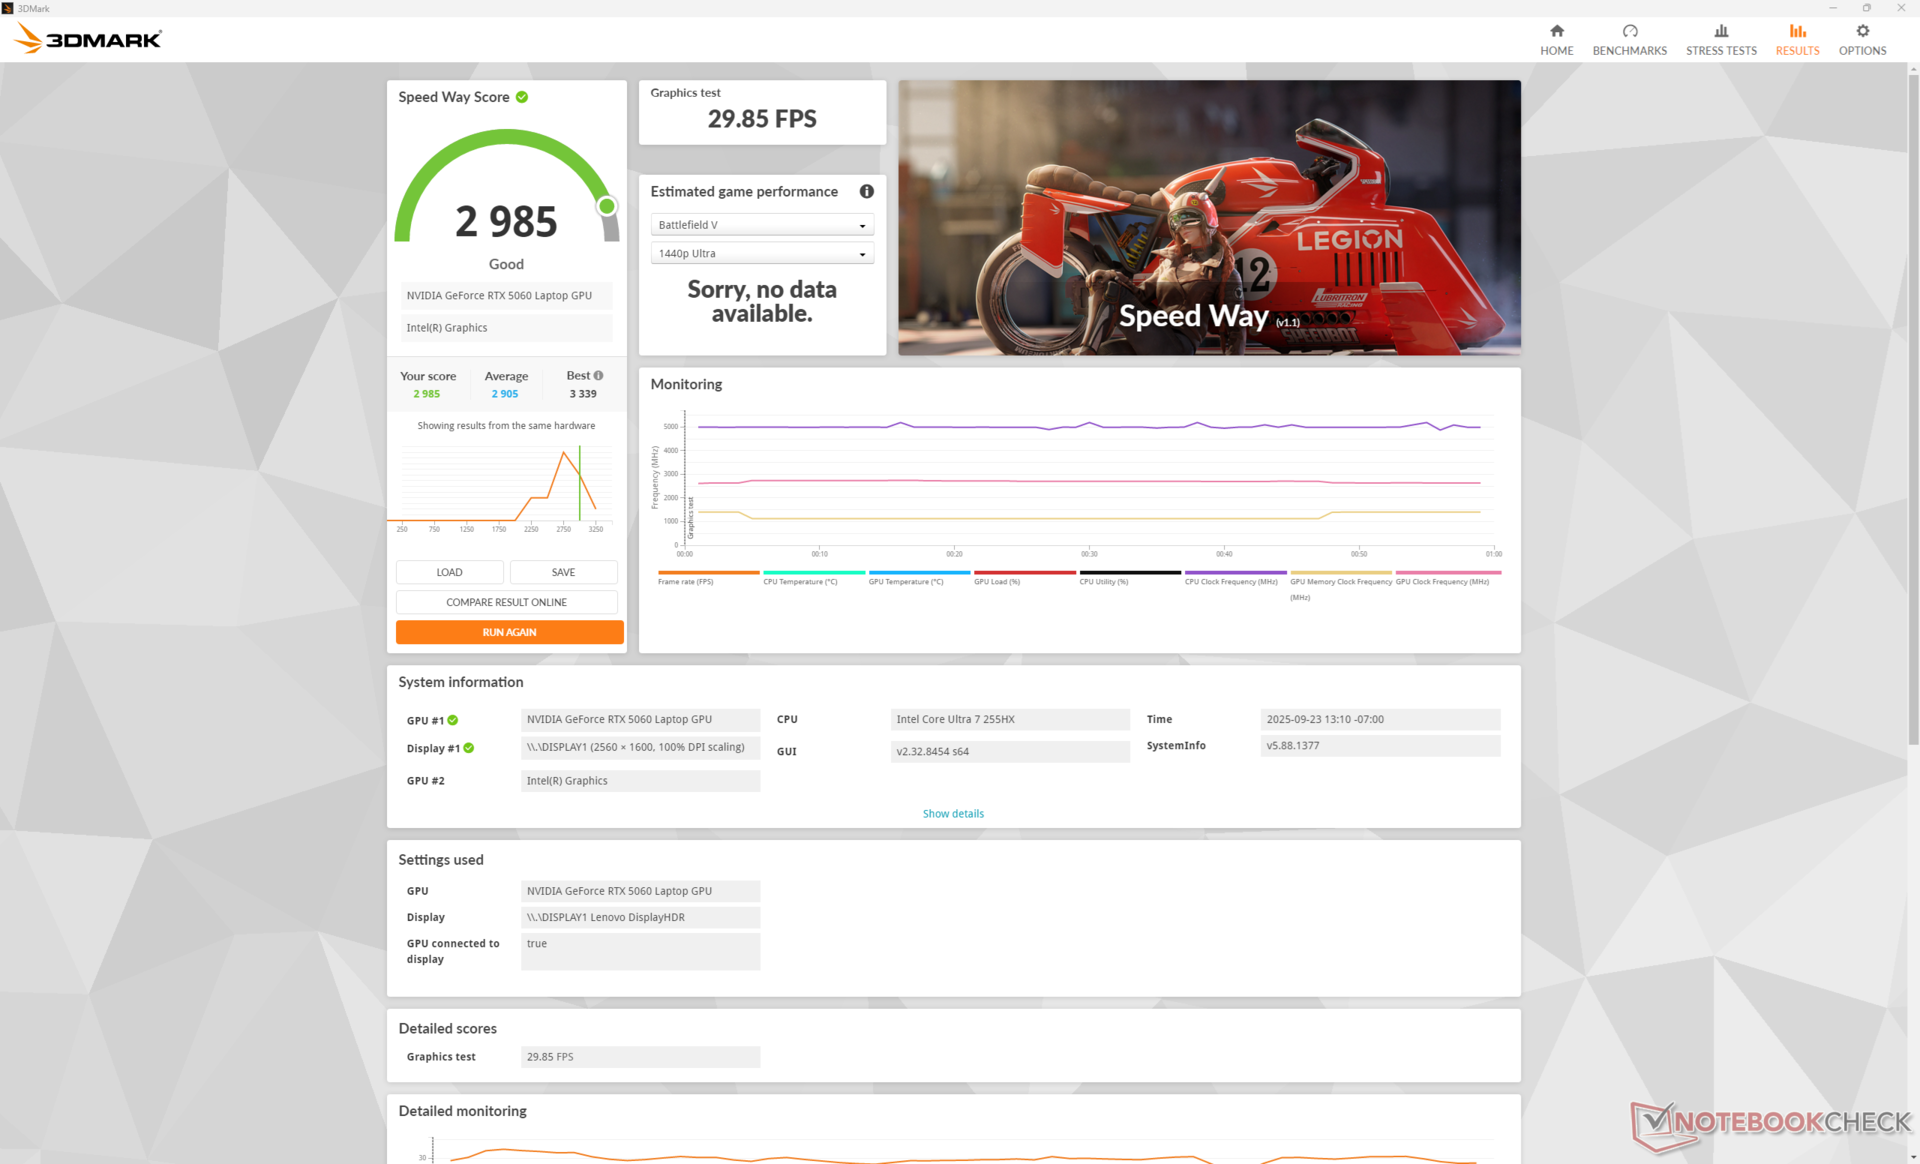
移动版GeForce RTX 5060 已通过广泛的基准测试,如我们的 GPU 专页.对于Legion 7 16IAX10,如果使用性能模式,GPU 的功耗稳定在 105 W;如果使用平衡模式,功耗仅为 77 W,根据 3DMarkFire Strike ,性能下降约 10%。
升级到移动 RTX 5070 配置将使图形性能提高约 15%。遗憾的是,没有 RTX 5070 Ti 选项。
从旧版 RTX 3060 笔记本电脑在应用 DLSS 升频或帧生成功能之前,原始性能将有 30% 至 40% 的大幅提升。
| 电源配置文件 | 图形得分 | 物理得分 | 综合得分 |
| 性能模式(105 瓦 GPU) | 33912 | 46455 | 16001 |
| 平衡模式(77 瓦 GPU) | 30456 (-10%) | 44872 (-3%) | 14652 (-8%) |
| 电池电量 | 24709 (-27%) | 26926 (-42%) | 11171 (-30%) |
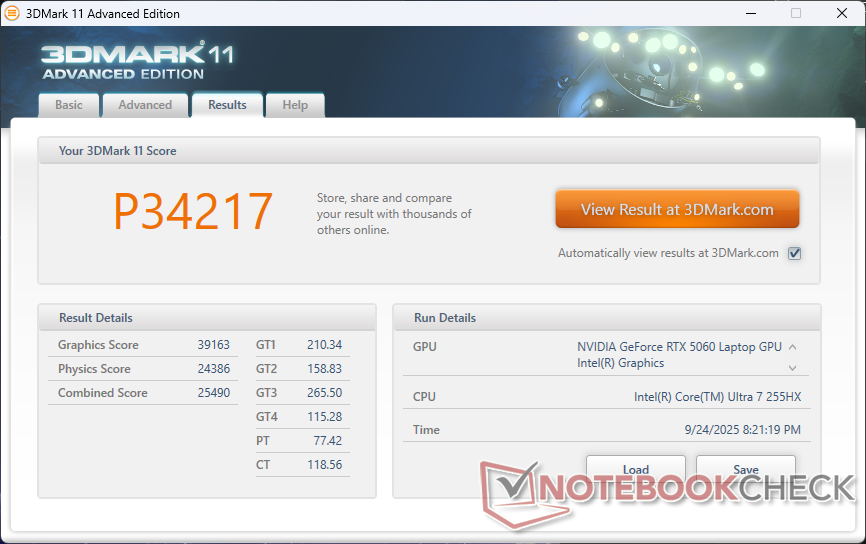
| 3DMark 11 Performance | 34217 points | |
| 3DMark Cloud Gate Standard Score | 69955 points | |
| 3DMark Fire Strike Score | 31650 points | |
| 3DMark Time Spy Score | 12787 points | |
| 3DMark Steel Nomad Score | 2806 points | |
Help | ||
* ... smaller is better
游戏性能
使用相同的 RTX 5060 GPU,在较低的 80 W TGP 目标值下运行时,联想的性能始终优于 Alienware 16 Aurora。根据设置不同,在《赛博朋克 2077》等游戏中的优势可以达到约 20%,在《刺客信条:暗影》 中甚至可以达到 30%。速度更快的 Arrow Lake-HX CPU 在提高游戏性能方面也发挥了重要作用。
尽管如此,8 GB 的 VRAM 仍然限制了系统以极高的设置运行大多数要求苛刻的游戏。例如,在 2K 分辨率和高 RT 设置下,《艾伦-觉醒 2》的平均帧数仅为 19.3。启用 DLSS 品质模式和 2 倍帧生成功能可将 19.3 FPS 的平均帧数提升到更流畅的 61 FPS,但即使在激活 Reflex 功能的情况下,高输入延迟依然明显。
| Performance rating - Percent | |
| Lenovo Legion 5 Pro 16IAX10H | |
| MSI Vector 16 HX AI A2XWHG -1! | |
| Lenovo Legion 7 16IAX10 | |
| Asus TUF Gaming A16 FA608UP | |
| Alienware 16 Aurora | |
| Gigabyte Gaming A16 GA6H | |
| Cyberpunk 2077 - 1920x1080 Ultra Preset (FSR off) | |
| Lenovo Legion 5 Pro 16IAX10H | |
| MSI Vector 16 HX AI A2XWHG | |
| Asus TUF Gaming A16 FA608UP | |
| Lenovo Legion 7 16IAX10 | |
| Gigabyte Gaming A16 GA6H | |
| Alienware 16 Aurora | |
| Baldur's Gate 3 - 1920x1080 Ultra Preset AA:T | |
| MSI Vector 16 HX AI A2XWHG | |
| Lenovo Legion 5 Pro 16IAX10H | |
| Asus TUF Gaming A16 FA608UP | |
| Lenovo Legion 7 16IAX10 | |
| Alienware 16 Aurora | |
| Gigabyte Gaming A16 GA6H | |
| GTA V - 1920x1080 Highest AA:4xMSAA + FX AF:16x | |
| Lenovo Legion 5 Pro 16IAX10H | |
| MSI Vector 16 HX AI A2XWHG | |
| Lenovo Legion 7 16IAX10 | |
| Asus TUF Gaming A16 FA608UP | |
| Alienware 16 Aurora | |
| Gigabyte Gaming A16 GA6H | |
| Final Fantasy XV Benchmark - 1920x1080 High Quality | |
| Lenovo Legion 5 Pro 16IAX10H | |
| MSI Vector 16 HX AI A2XWHG | |
| Asus TUF Gaming A16 FA608UP | |
| Lenovo Legion 7 16IAX10 | |
| Alienware 16 Aurora | |
| Gigabyte Gaming A16 GA6H | |
| Strange Brigade - 1920x1080 ultra AA:ultra AF:16 | |
| Lenovo Legion 5 Pro 16IAX10H | |
| Lenovo Legion 7 16IAX10 | |
| Asus TUF Gaming A16 FA608UP | |
| Gigabyte Gaming A16 GA6H | |
| Alienware 16 Aurora | |
| Dota 2 Reborn - 1920x1080 ultra (3/3) best looking | |
| Lenovo Legion 5 Pro 16IAX10H | |
| MSI Vector 16 HX AI A2XWHG | |
| Lenovo Legion 7 16IAX10 | |
| Alienware 16 Aurora | |
| Gigabyte Gaming A16 GA6H | |
| Asus TUF Gaming A16 FA608UP | |
| X-Plane 11.11 - 1920x1080 high (fps_test=3) | |
| Lenovo Legion 5 Pro 16IAX10H | |
| MSI Vector 16 HX AI A2XWHG | |
| Lenovo Legion 7 16IAX10 | |
| Gigabyte Gaming A16 GA6H | |
| Alienware 16 Aurora | |
| Asus TUF Gaming A16 FA608UP | |
| Monster Hunter Wilds | |
| 1920x1080 lowest, no upscaling | |
| Zotac GeForce RTX 5060 AMP | |
| Lenovo Legion 7 16IAX10 | |
| Average NVIDIA GeForce RTX 5060 Laptop (49.4 - 80.1, n=3) | |
| Alienware 16 Aurora | |
| 1920x1080 medium, no upscaling | |
| Alienware 16X Aurora, RTX 5070 | |
| Zotac GeForce RTX 5060 AMP | |
| Lenovo Legion 7 16IAX10 | |
| Average NVIDIA GeForce RTX 5060 Laptop (45.2 - 68.3, n=4) | |
| Alienware 16 Aurora | |
| 1920x1080 ultra, RT: high, no upscaling | |
| Razer Blade 16 RTX 5080 | |
| Zotac GeForce RTX 5060 AMP | |
| Alienware 16X Aurora, RTX 5070 | |
| Alienware 16 Aurora | |
| Average NVIDIA GeForce RTX 5060 Laptop (16.6 - 36.5, n=4) | |
| Lenovo Legion 7 16IAX10 | |
| 2560x1440 ultra, RT: high, no upscaling | |
| Razer Blade 16 RTX 5080 | |
| Alienware 16X Aurora, RTX 5070 | |
| Alienware 16 Aurora | |
| Average NVIDIA GeForce RTX 5060 Laptop (13.9 - 20.9, n=3) | |
| Lenovo Legion 7 16IAX10 | |
| 2560x1440 ultra, RT: high, DLSS3 quality | |
| Razer Blade 16 RTX 5080 | |
| Lenovo Legion 7 16IAX10 | |
| Average NVIDIA GeForce RTX 5060 Laptop (n=1) | |
赛博朋克 2077》超 FPS 图表
| low | med. | high | ultra | QHD DLSS | QHD | |
|---|---|---|---|---|---|---|
| GTA V (2015) | 184.7 | 181.9 | 142.9 | 115.2 | ||
| Dota 2 Reborn (2015) | 206 | 182.1 | 176.6 | 163.7 | ||
| Final Fantasy XV Benchmark (2018) | 228 | 177.6 | 133.6 | 95.8 | ||
| X-Plane 11.11 (2018) | 142.5 | 126.8 | 105.6 | |||
| Strange Brigade (2018) | 610 | 343 | 275 | 239 | 165 | |
| Baldur's Gate 3 (2023) | 173.3 | 144.6 | 112.8 | 111.2 | 119.1 | 78.4 |
| Cyberpunk 2077 (2023) | 153.3 | 125.1 | 104.4 | 94.9 | 69.6 | 59.2 |
| Alan Wake 2 (2023) | 79 | 71.6 | 66.6 | 36.7 | ||
| F1 24 (2024) | 273 | 268 | 219 | 71.6 | 71.4 | 45.7 |
| Black Myth: Wukong (2024) | 100 | 73 | 58 | 32 | 36 | 23 |
| Indiana Jones and the Great Circle (2024) | 127.7 | 52.8 | 6.3 | 4.2 | ||
| Monster Hunter Wilds (2025) | 80.1 | 68.3 | 16.6 | 25.1 | 13.9 | |
| Assassin's Creed Shadows (2025) | 66 | 61 | 53 | 40 | 41 | 34 |
| Battlefield 6 (2025) | 70.1 | 47.8 | 36 |
排放量
系统噪音
在 "静音 "模式下,风扇噪音很低,而且很慵懒。不过,如果使用平衡模式或性能模式,则会更频繁地出现脉动噪音,最高可达近 30 dB(A),而浏览网页或流媒体时的背景噪音仅为 24 dB(A)。
在平衡模式或性能模式下进行游戏时,风扇噪音将分别稳定在 45.9 分贝(A)或 54.6 分贝(A)。这个差值非常大,这意味着用户可能需要考虑在平衡模式下进行游戏,以获得更安静的体验,尽管这会导致 10% 的性能损失。否则,建议使用耳机在 "性能 "模式下进行游戏。50 分贝(A)的中间范围与我们在 华硕 TUF GAMING A16但比更厚的微星 Vector 16 HX 噪音要大得多。
Noise level
| Idle |
| 24 / 26 / 29.4 dB(A) |
| Load |
| 35.4 / 54.7 dB(A) |
 | ||
30 dB silent 40 dB(A) audible 50 dB(A) loud |
||
min: | ||
| Lenovo Legion 7 16IAX10 GeForce RTX 5060 Laptop, Ultra 7 255HX, WD PC SN7100S SDFPMSL-1T00-1101 | Alienware 16 Aurora GeForce RTX 5060 Laptop, Core 7 240H | Asus TUF Gaming A16 FA608UP GeForce RTX 5070 Laptop, R7 260, Western Digital PC SN5000S SDEQNSJ-1T00 | Gigabyte Gaming A16 GA6H GeForce RTX 5070 Laptop, i7-13620H, Kingston OM8PGP41024Q-A0 | MSI Vector 16 HX AI A2XWHG GeForce RTX 5070 Ti Laptop, Ultra 7 255HX, Micron 2400 MTFDKBA512QFM | Lenovo Legion 5 Pro 16IAX10H GeForce RTX 5070 Ti Laptop, Ultra 9 275HX, Western Digital PC SN8000S SDEPNRK-1T00 | |
|---|---|---|---|---|---|---|
| Noise | -1% | -12% | -7% | -16% | -9% | |
| off / environment * (dB) | 23.9 | 22.9 4% | 25.1 -5% | 24 -0% | 25 -5% | 24 -0% |
| Idle Minimum * (dB) | 24 | 24 -0% | 32.2 -34% | 25 -4% | 33 -38% | 24 -0% |
| Idle Average * (dB) | 26 | 25.6 2% | 32.2 -24% | 26 -0% | 34 -31% | 24 8% |
| Idle Maximum * (dB) | 29.4 | 25.6 13% | 32.2 -10% | 27 8% | 38 -29% | 30.9 -5% |
| Load Average * (dB) | 35.4 | 46.8 -32% | 38.1 -8% | 54 -53% | 46 -30% | 55.9 -58% |
| Cyberpunk 2077 ultra * (dB) | 54.6 | 49.9 9% | 53.9 1% | 54 1% | 47 14% | 56.72 -4% |
| Load Maximum * (dB) | 54.7 | 55.6 -2% | 57.1 -4% | 55 -1% | 49 10% | 56.72 -4% |
* ... smaller is better
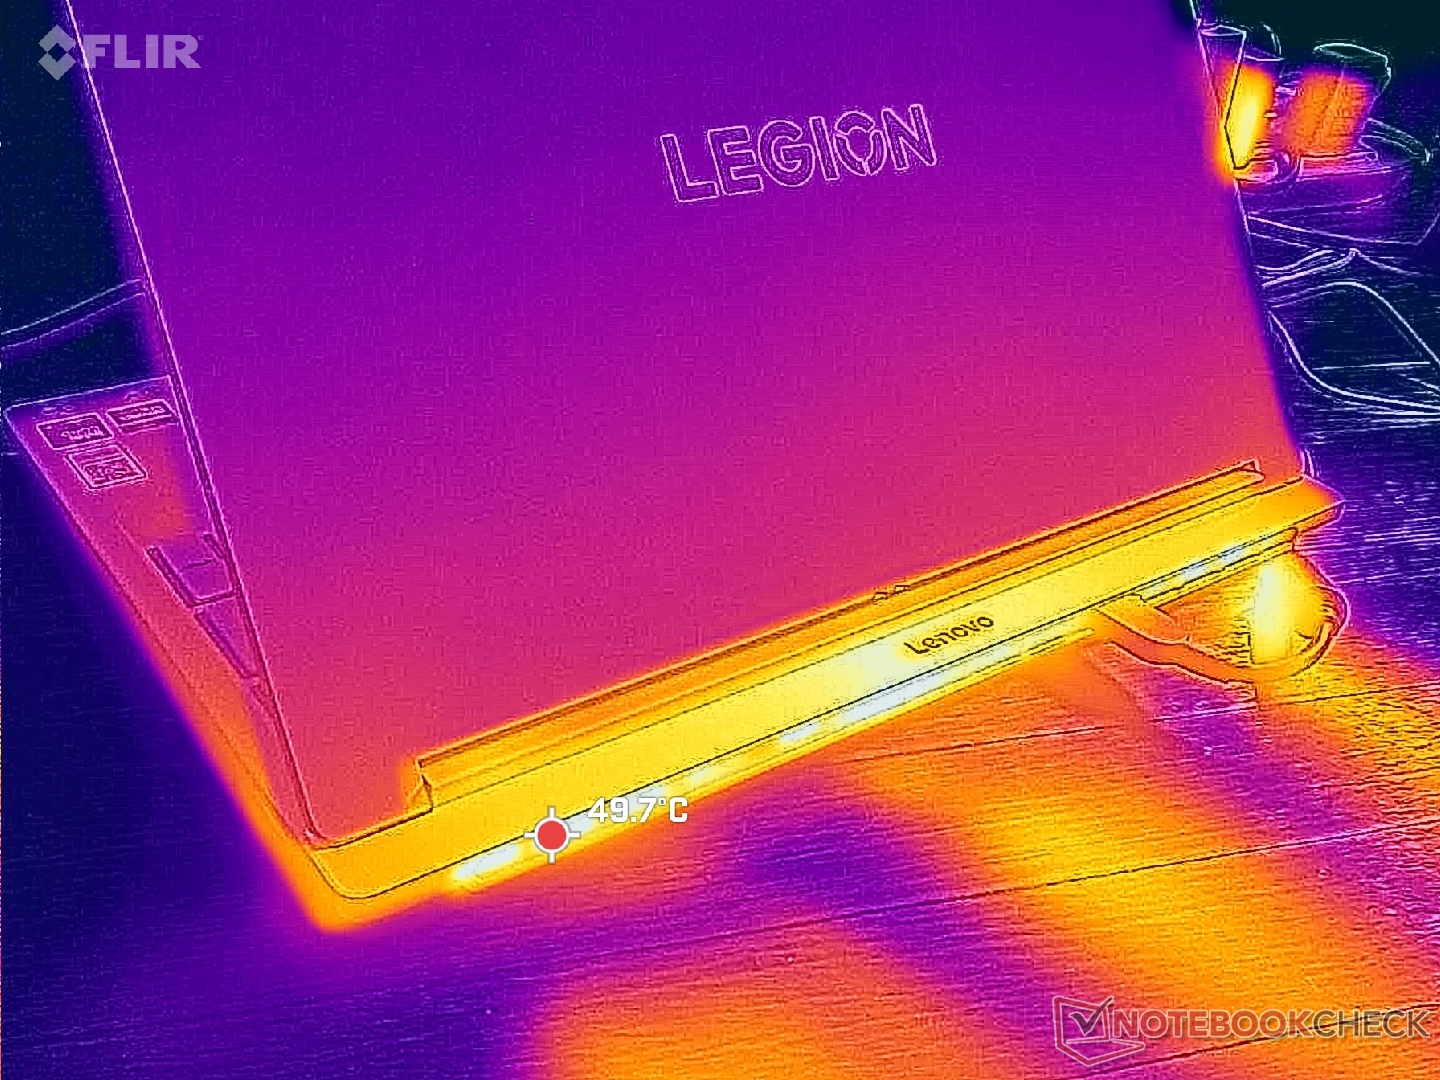
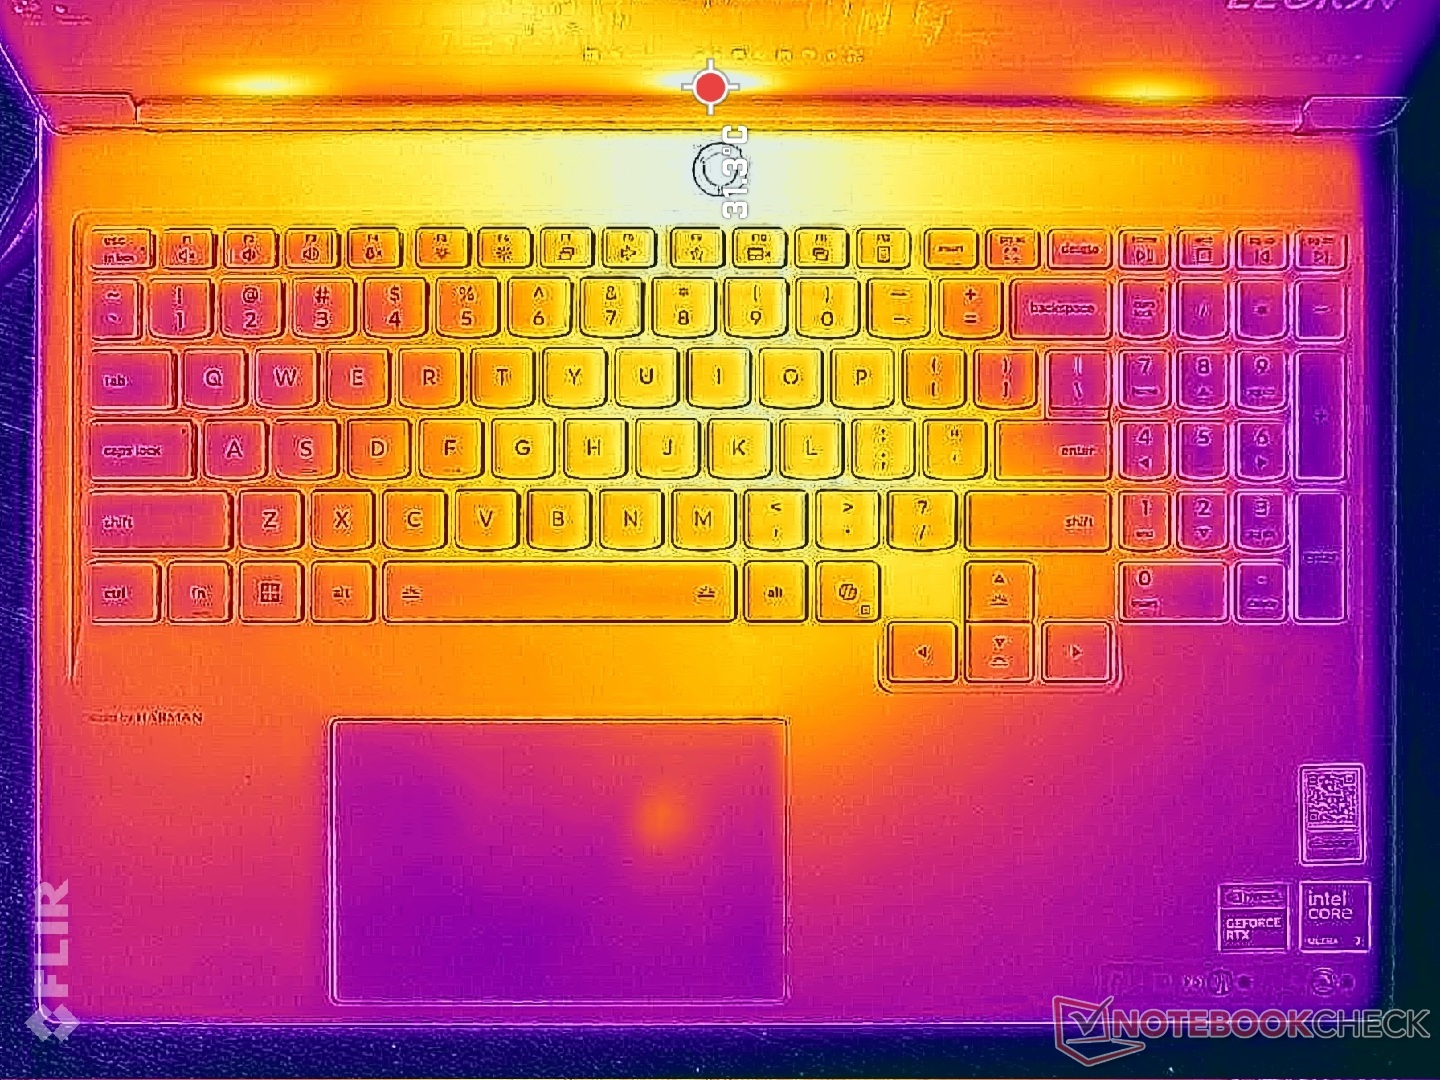
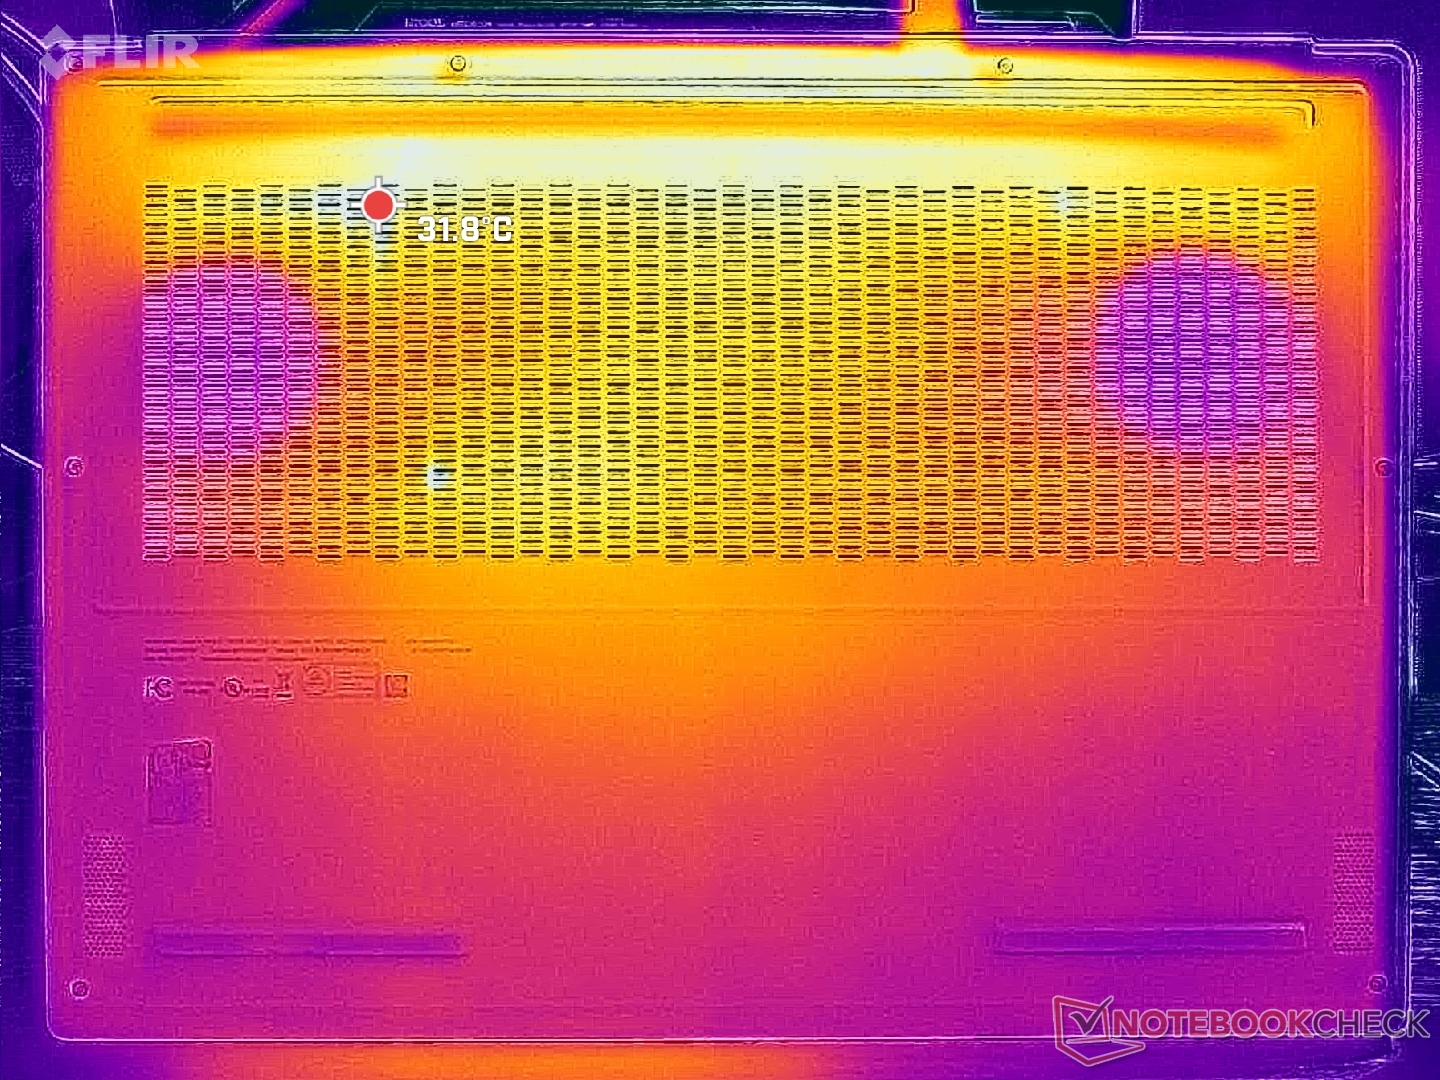
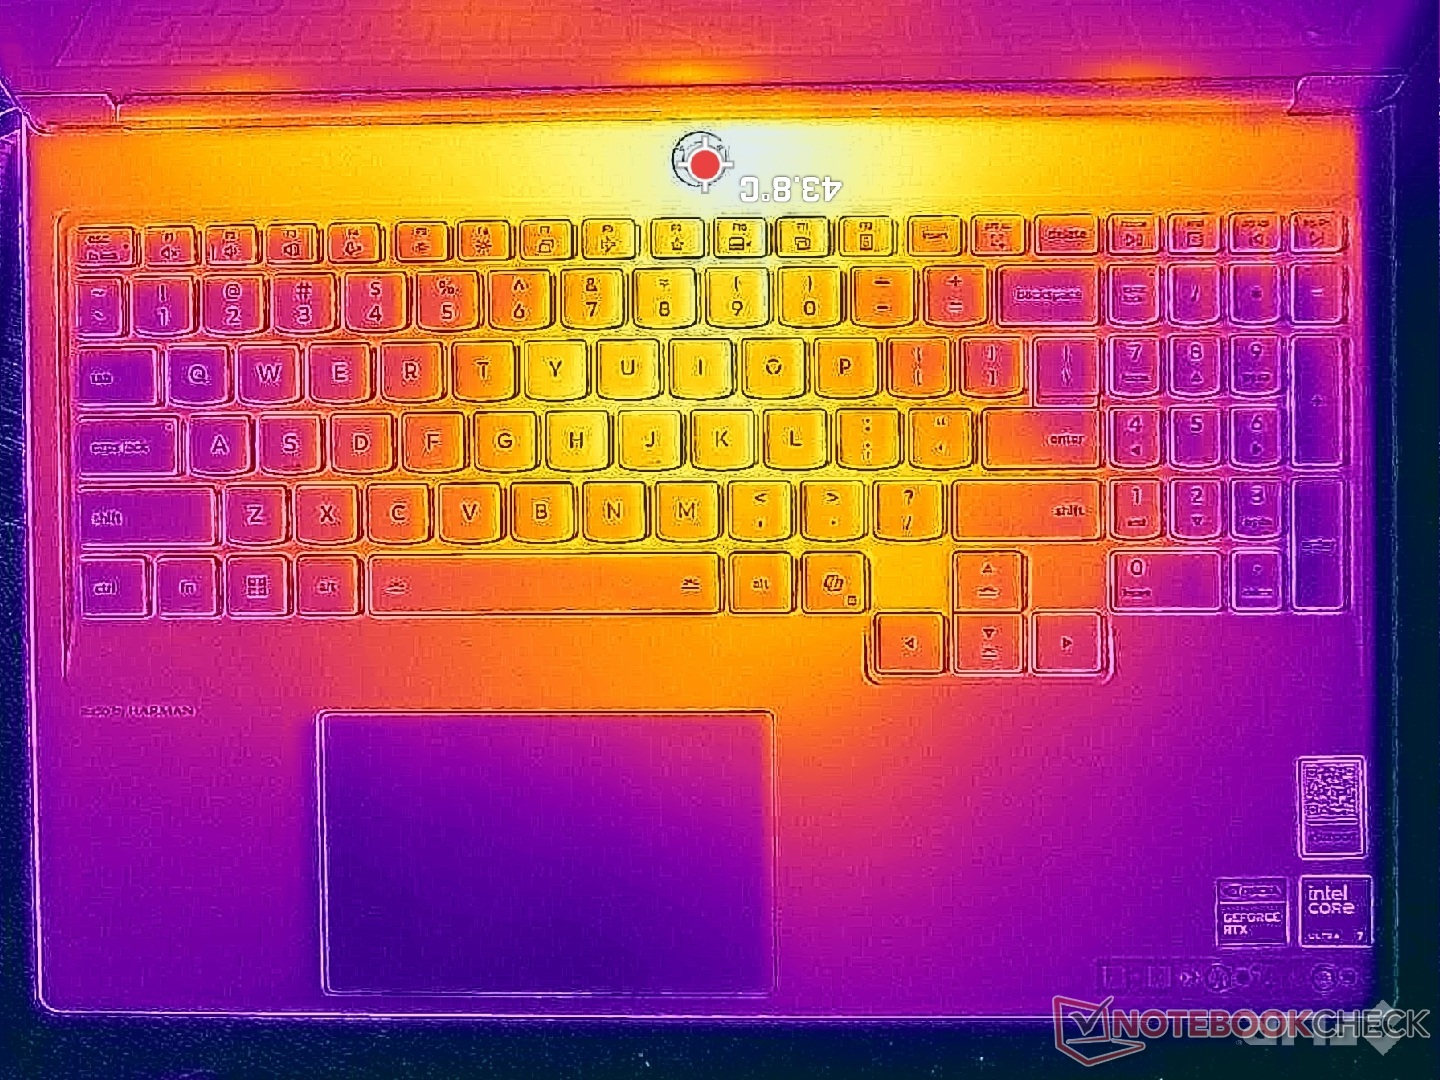
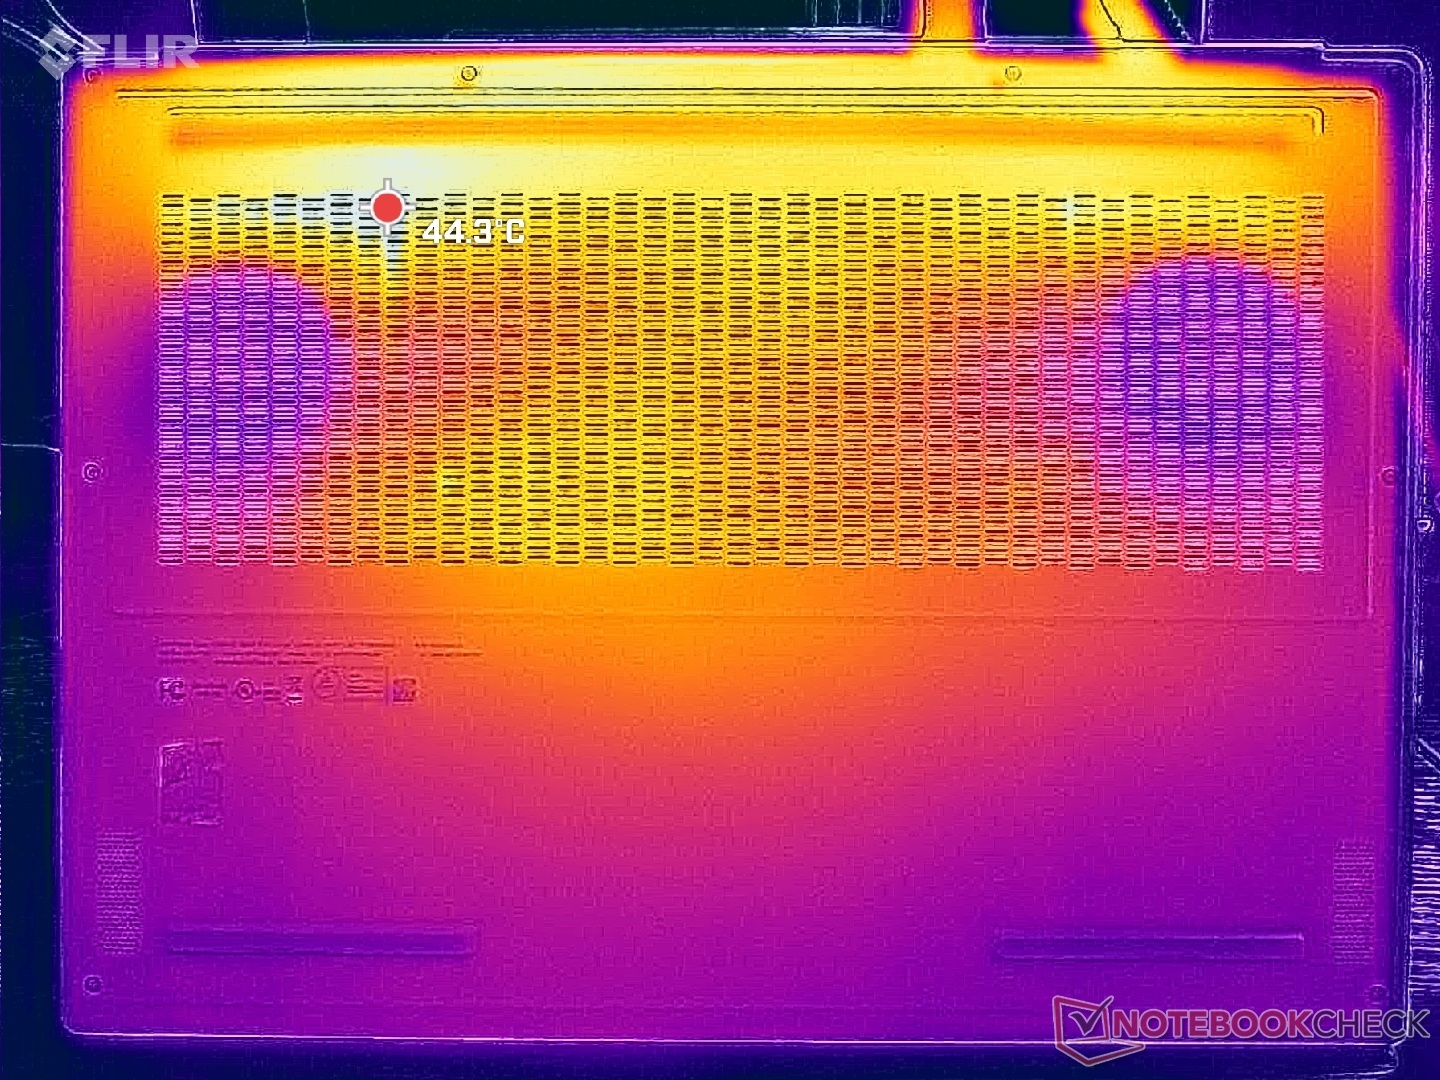
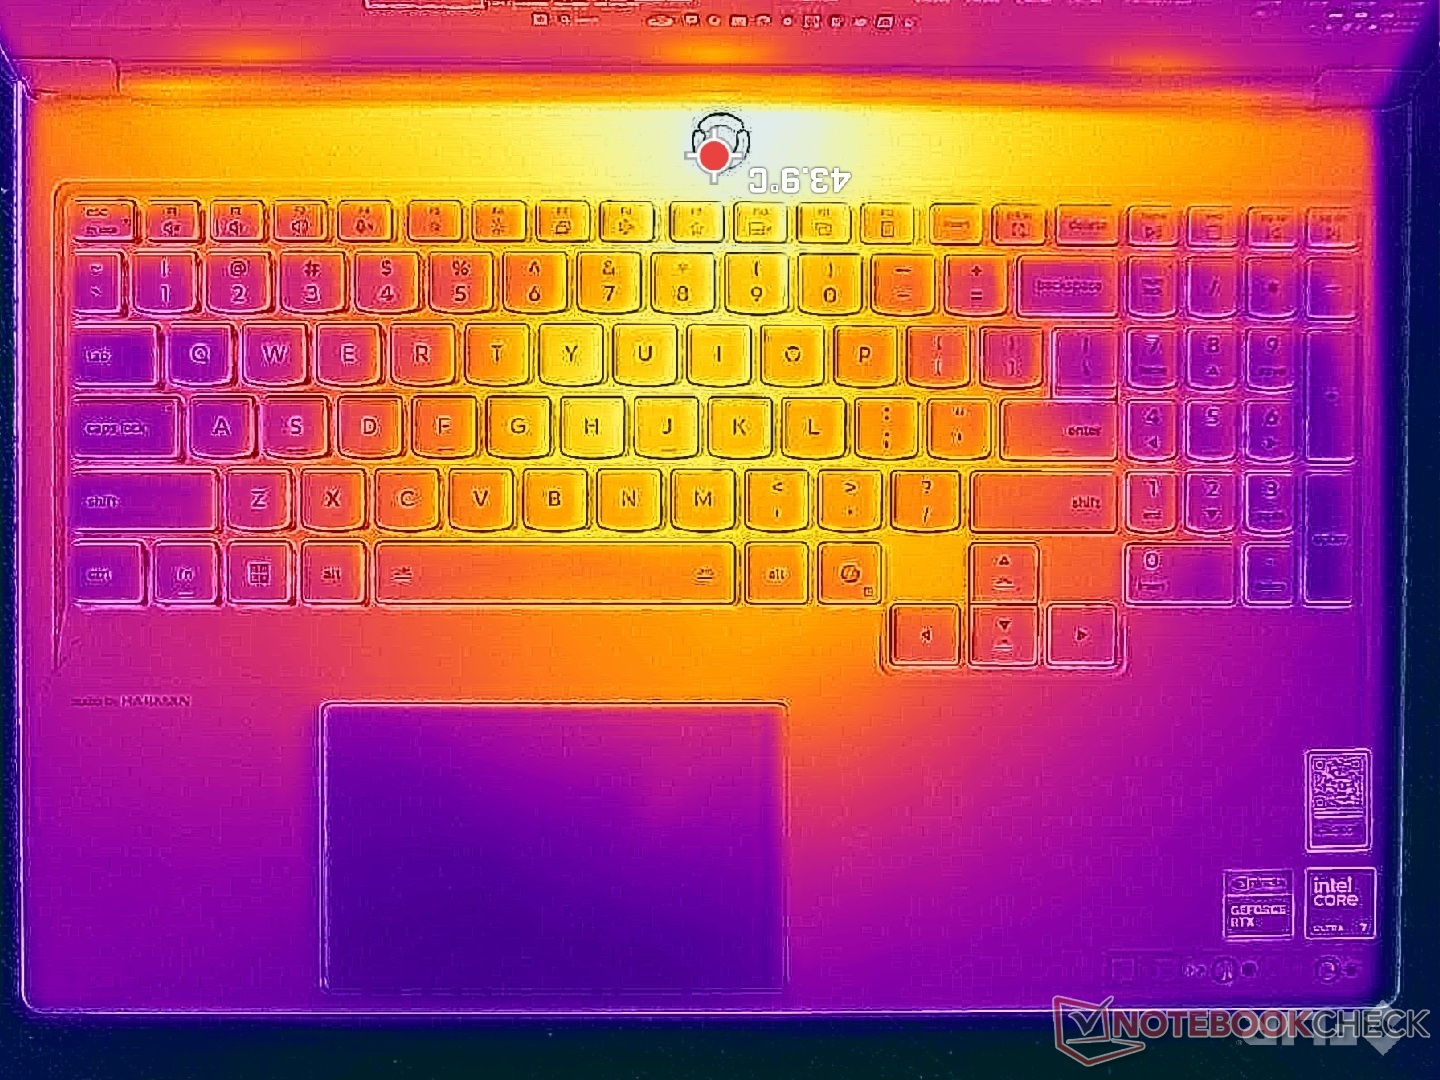
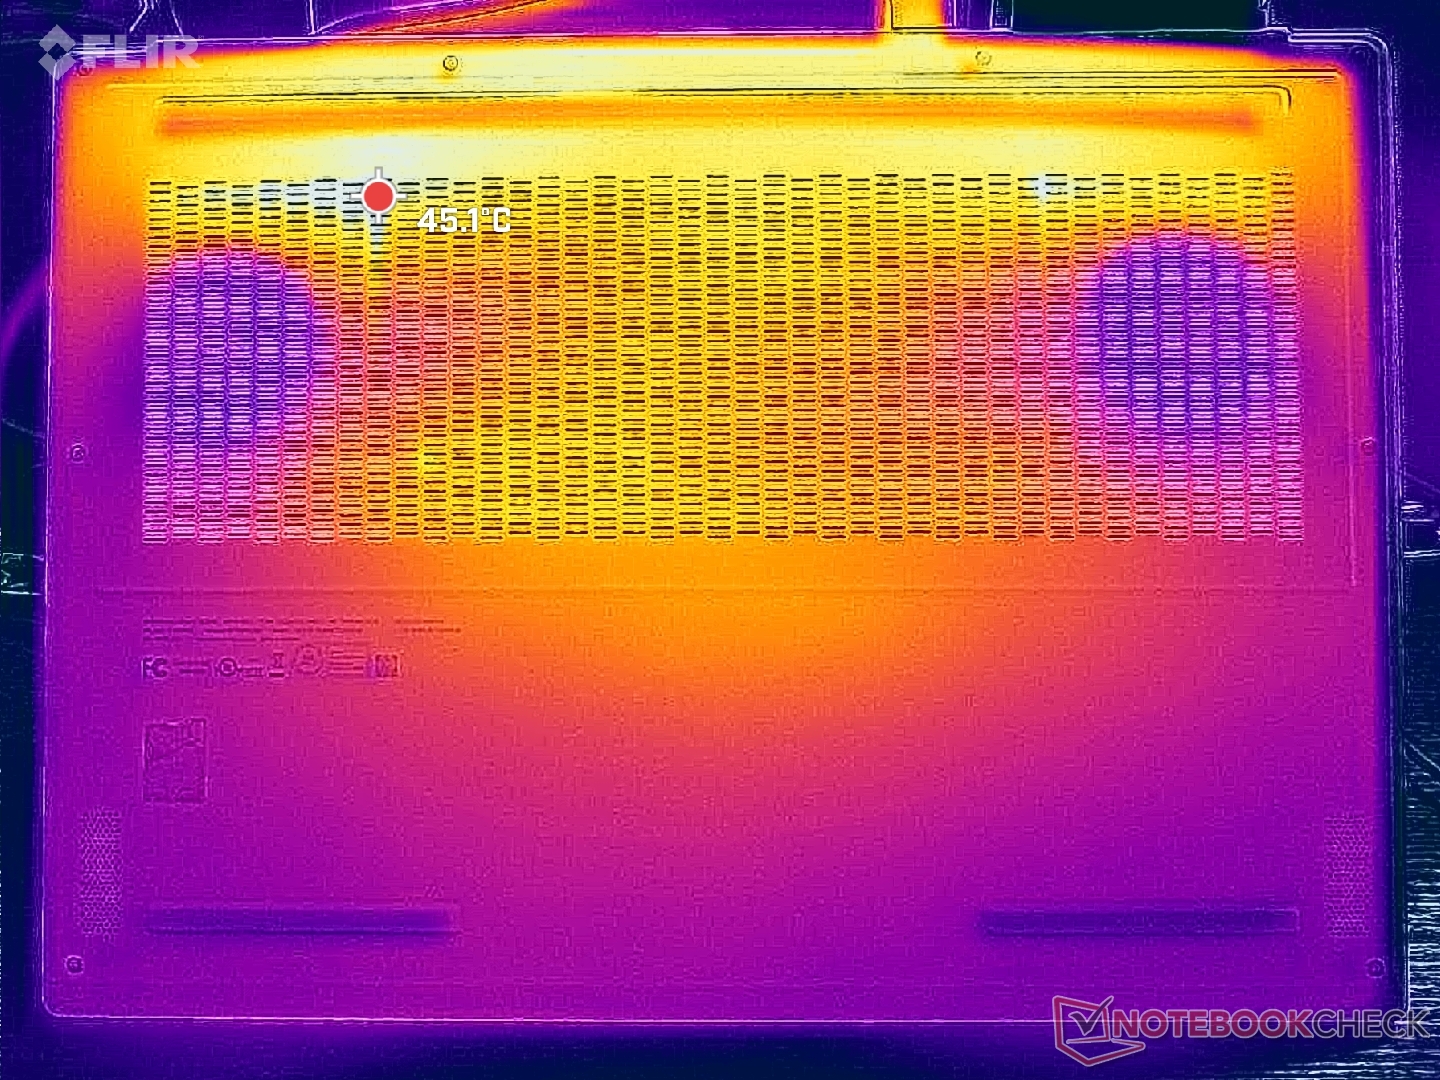
温度
即使只是在桌面上空转,表面温度也很高。游戏时,底座上下两侧的热点温度分别高达 47 摄氏度和 41 摄氏度,但幸好这些区域都在电源按钮附近,手指不太容易接触到。不过,平均温度比我们在华硕 TUF Gaming A16 上体验到的温度要高。
(-) The maximum temperature on the upper side is 47 °C / 117 F, compared to the average of 40.4 °C / 105 F, ranging from 21.2 to 68.8 °C for the class Gaming.
(±) The bottom heats up to a maximum of 44 °C / 111 F, compared to the average of 43.2 °C / 110 F
(+) In idle usage, the average temperature for the upper side is 30.5 °C / 87 F, compared to the device average of 33.9 °C / 93 F.
(±) 3: The average temperature for the upper side is 36.3 °C / 97 F, compared to the average of 33.9 °C / 93 F for the class Gaming.
(+) The palmrests and touchpad are cooler than skin temperature with a maximum of 31.4 °C / 88.5 F and are therefore cool to the touch.
(-) The average temperature of the palmrest area of similar devices was 28.8 °C / 83.8 F (-2.6 °C / -4.7 F).
| Lenovo Legion 7 16IAX10 Intel Core Ultra 7 255HX, NVIDIA GeForce RTX 5060 Laptop | Alienware 16X Aurora, RTX 5070 Intel Core Ultra 9 275HX, NVIDIA GeForce RTX 5070 Laptop | Asus TUF Gaming A16 FA608UP AMD Ryzen 7 260, NVIDIA GeForce RTX 5070 Laptop | Gigabyte Gaming A16 GA6H Intel Core i7-13620H, NVIDIA GeForce RTX 5070 Laptop | MSI Vector 16 HX AI A2XWHG Intel Core Ultra 7 255HX, NVIDIA GeForce RTX 5070 Ti Laptop | Lenovo Legion 5 Pro 16IAX10H Intel Core Ultra 9 275HX, NVIDIA GeForce RTX 5070 Ti Laptop | |
|---|---|---|---|---|---|---|
| Heat | 6% | 17% | -3% | -2% | -11% | |
| Maximum Upper Side * (°C) | 47 | 51 -9% | 39.5 16% | 50 -6% | 53 -13% | 48 -2% |
| Maximum Bottom * (°C) | 44 | 45.6 -4% | 45.1 -3% | 49 -11% | 52 -18% | 50 -14% |
| Idle Upper Side * (°C) | 35.6 | 29.8 16% | 25.7 28% | 35 2% | 33 7% | 38 -7% |
| Idle Bottom * (°C) | 35.2 | 27.4 22% | 25.5 28% | 34 3% | 29 18% | 42 -19% |
* ... smaller is better
发言人
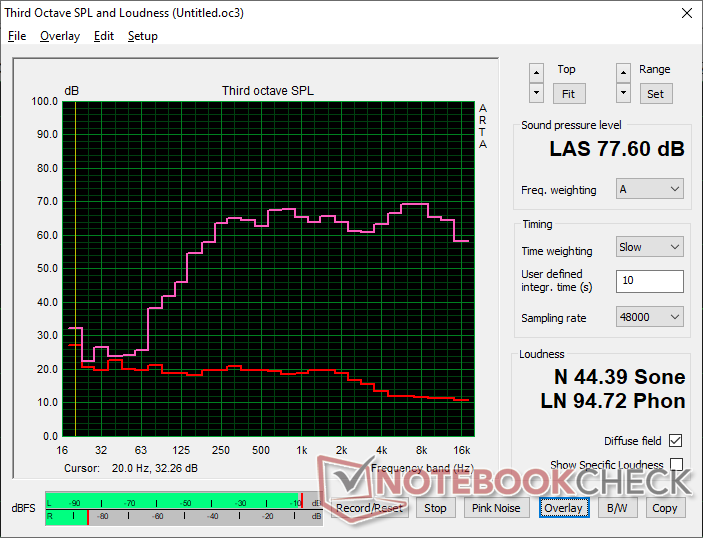
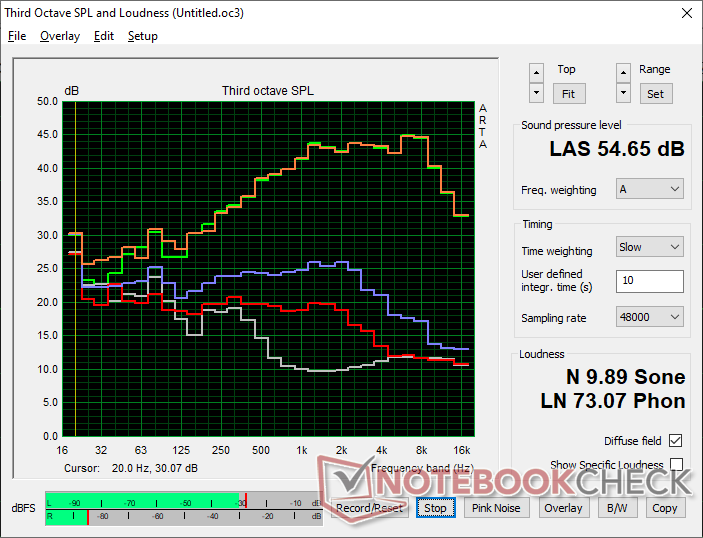
Lenovo Legion 7 16IAX10 audio analysis
(±) | speaker loudness is average but good (77.6 dB)
Bass 100 - 315 Hz
(±) | reduced bass - on average 9.5% lower than median
(±) | linearity of bass is average (9.8% delta to prev. frequency)
Mids 400 - 2000 Hz
(+) | balanced mids - only 1.5% away from median
(+) | mids are linear (4% delta to prev. frequency)
Highs 2 - 16 kHz
(+) | balanced highs - only 3% away from median
(+) | highs are linear (4.9% delta to prev. frequency)
Overall 100 - 16.000 Hz
(+) | overall sound is linear (11.5% difference to median)
Compared to same class
» 10% of all tested devices in this class were better, 3% similar, 87% worse
» The best had a delta of 6%, average was 18%, worst was 132%
Compared to all devices tested
» 8% of all tested devices were better, 2% similar, 90% worse
» The best had a delta of 4%, average was 24%, worst was 134%
Apple MacBook Pro 16 2021 M1 Pro audio analysis
(+) | speakers can play relatively loud (84.7 dB)
Bass 100 - 315 Hz
(+) | good bass - only 3.8% away from median
(+) | bass is linear (5.2% delta to prev. frequency)
Mids 400 - 2000 Hz
(+) | balanced mids - only 1.3% away from median
(+) | mids are linear (2.1% delta to prev. frequency)
Highs 2 - 16 kHz
(+) | balanced highs - only 1.9% away from median
(+) | highs are linear (2.7% delta to prev. frequency)
Overall 100 - 16.000 Hz
(+) | overall sound is linear (4.6% difference to median)
Compared to same class
» 0% of all tested devices in this class were better, 0% similar, 100% worse
» The best had a delta of 5%, average was 17%, worst was 45%
Compared to all devices tested
» 0% of all tested devices were better, 0% similar, 100% worse
» The best had a delta of 4%, average was 24%, worst was 134%
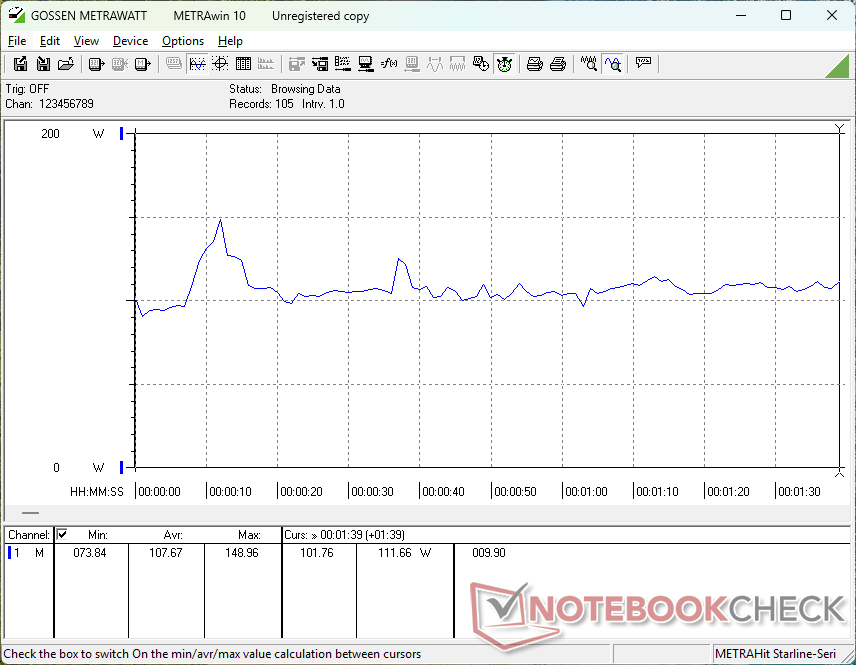
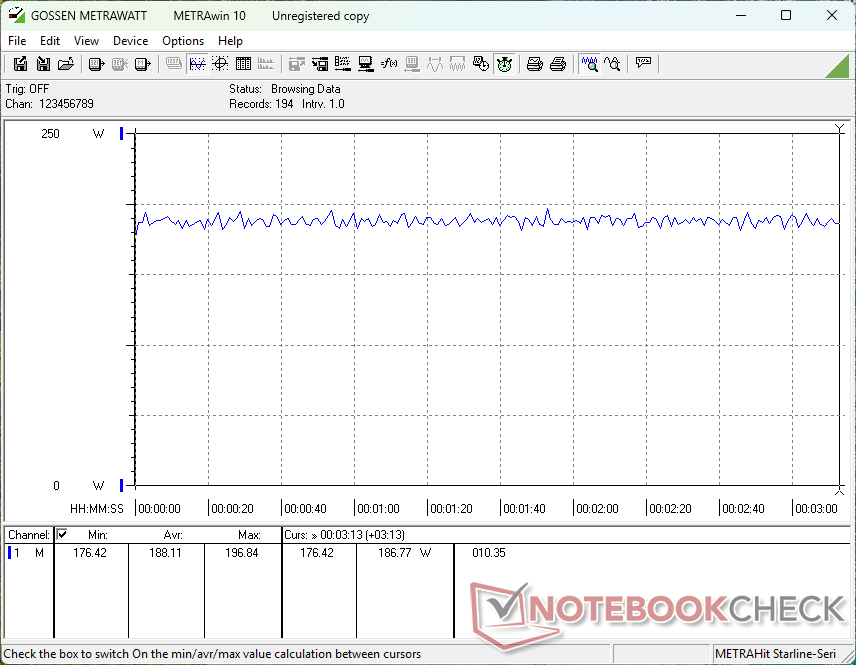
能源管理
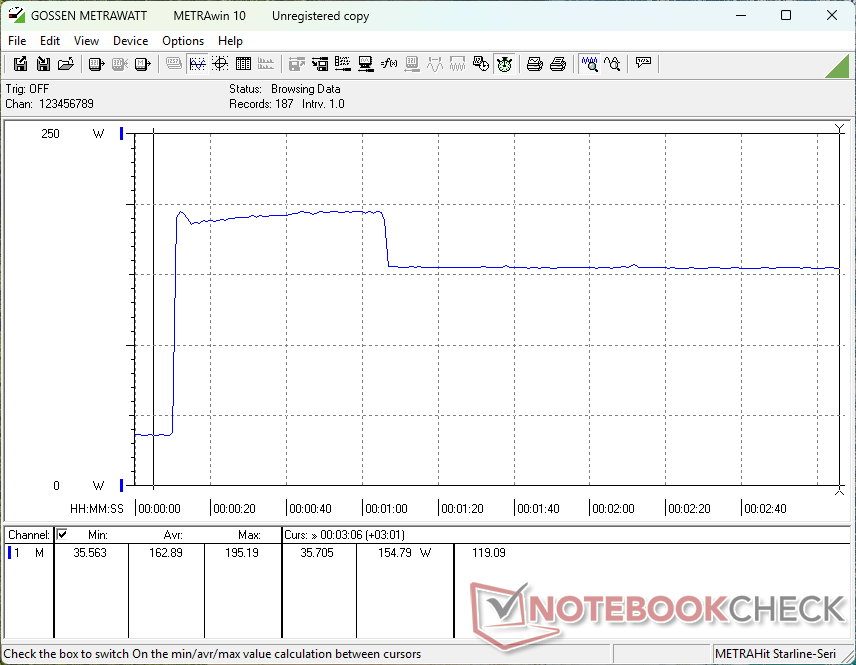
耗电量
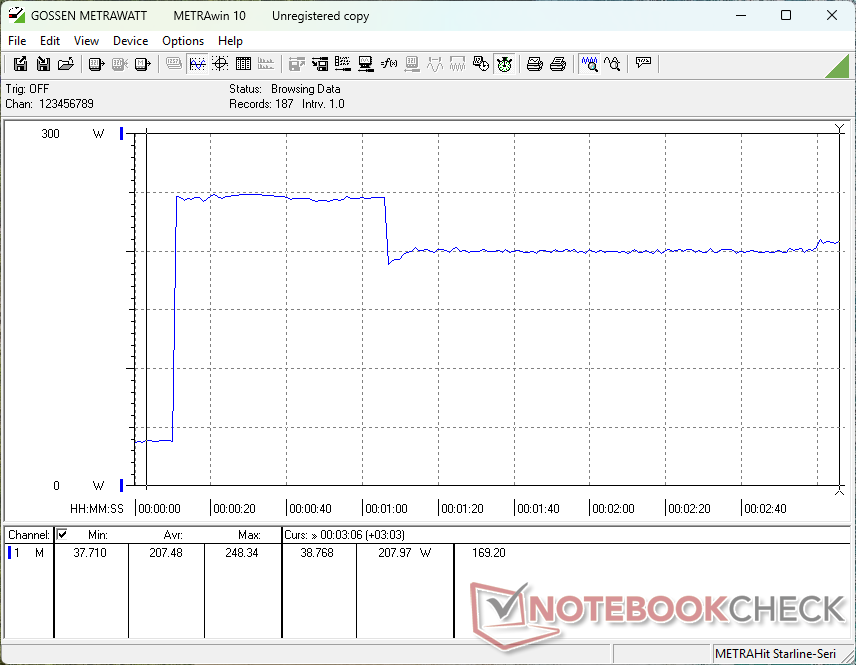
对于 RTX 5060 笔记本电脑来说,整体功耗要求相当高,因为大多数采用相同 GPU 的其他笔记本电脑通常不会配备 Core-HX 系列 CPU。例如,Alienware 16 Aurora 在运行《赛博朋克 2077》时的功耗仅为 123 W,而我们的功耗为 188 W。 Razer Blade 16Razer Blade 16 配备了性能更强的 RTX 5080 GPU,与我们的Legion 7 16 相比,只需多消耗 4% 的电能,游戏性能就能大幅提升 60% 至 90%。
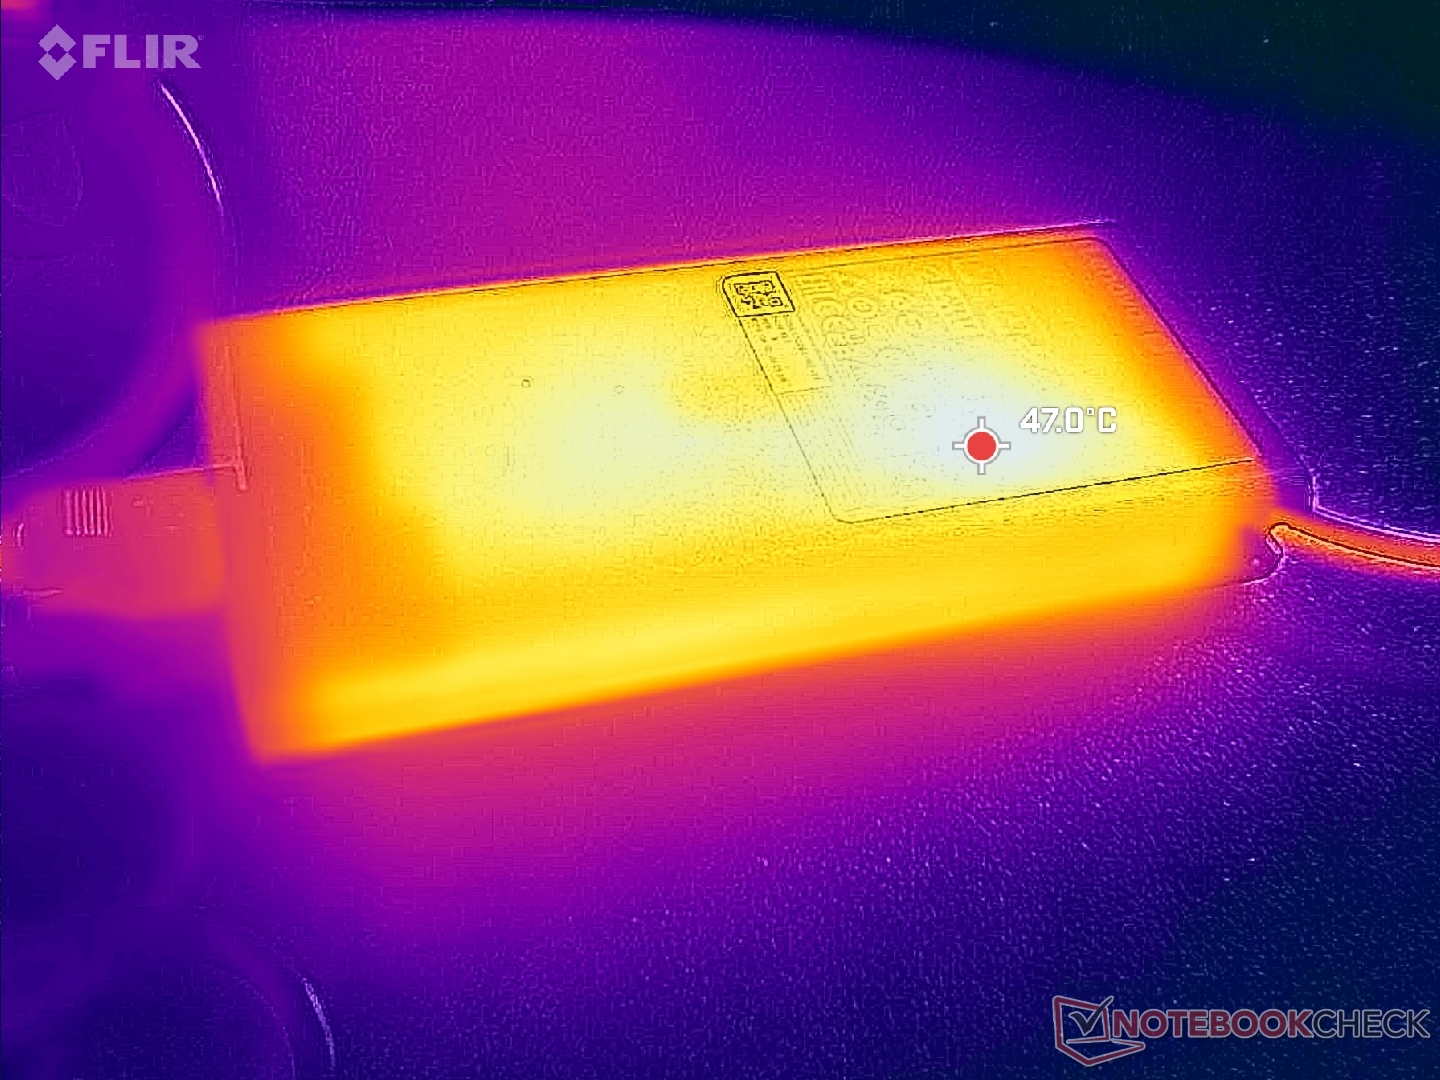
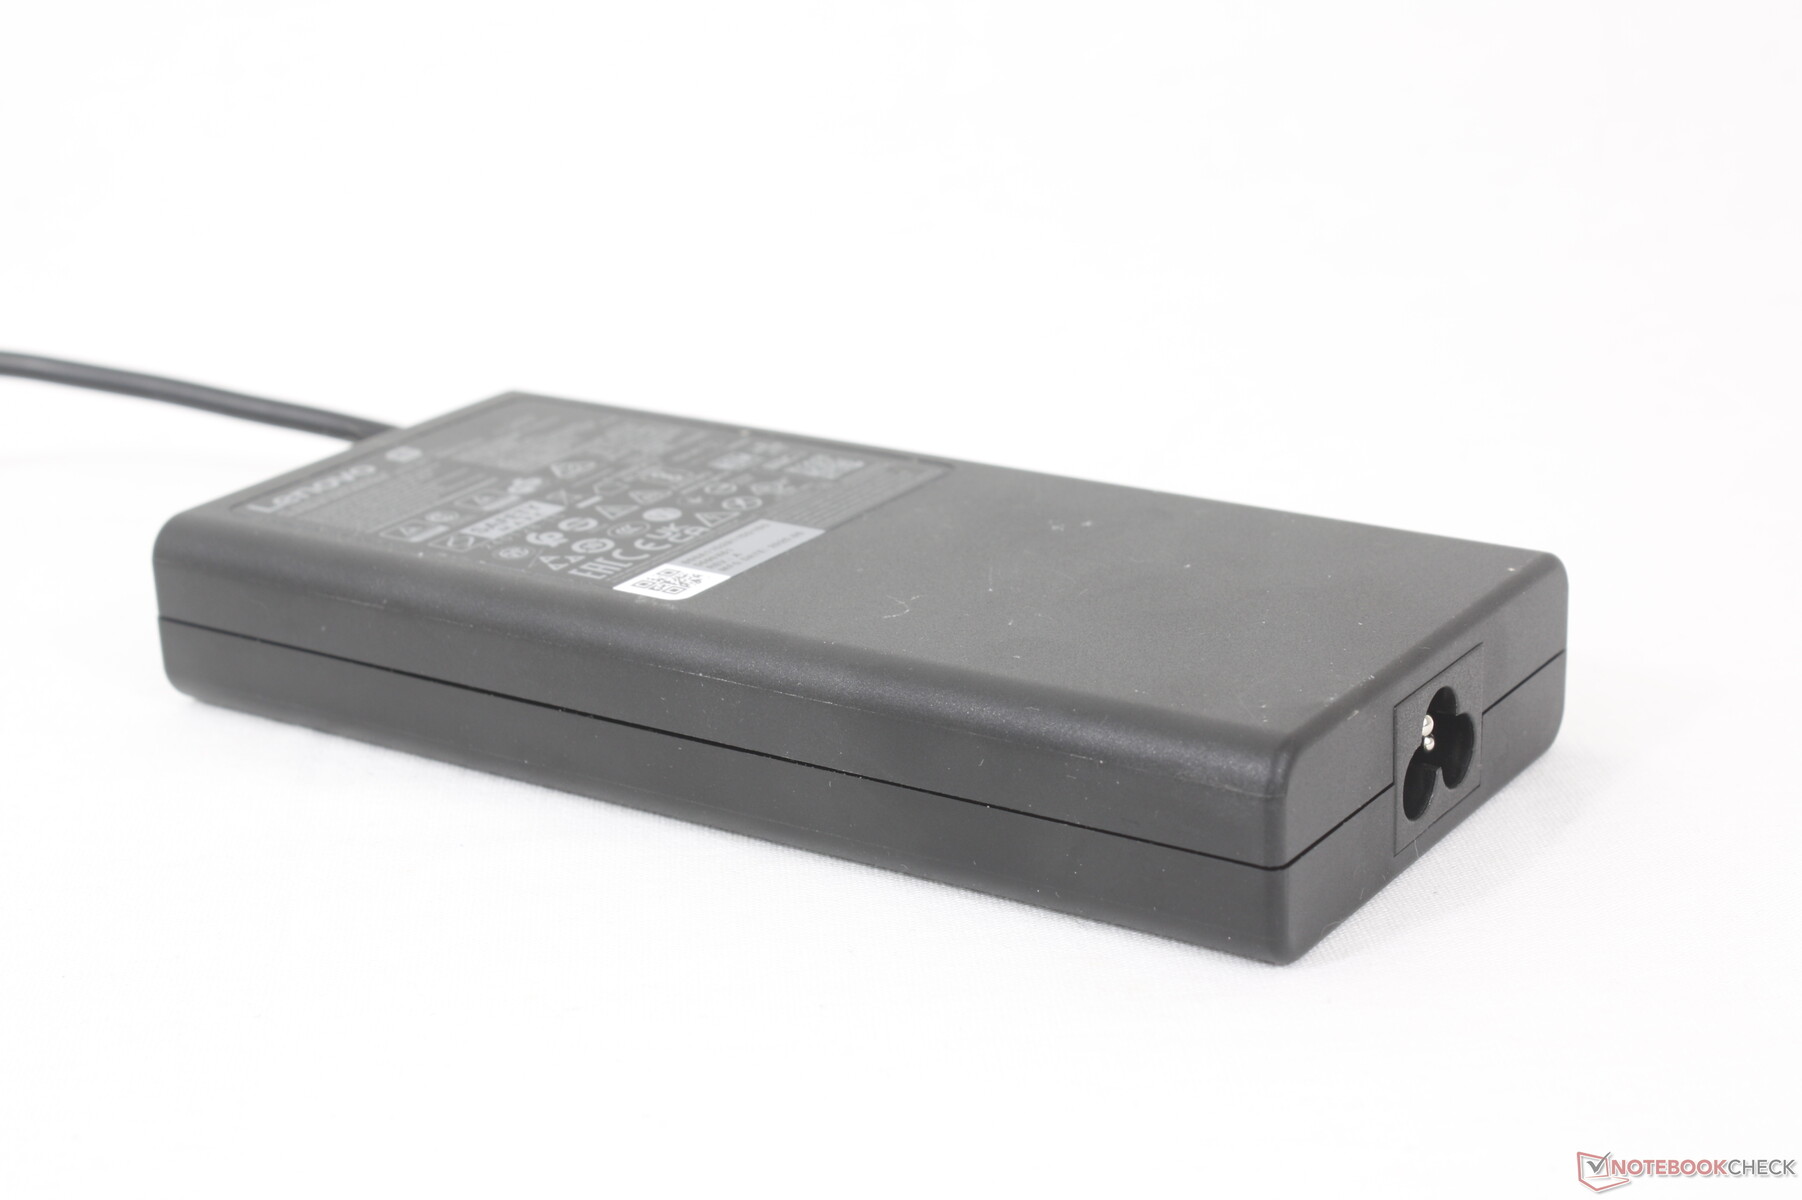
该系统配备了一个相对紧凑的 245 W AC 适配器,尺寸仅为 16.5 x 7.5 x 2.5 厘米。最大功耗明显高于 Alienware 16 Aurora、 华硕 TUF Gaming A16或 技嘉游戏 A16尽管华硕也配备了类似的 240 W 适配器。
| Off / Standby | |
| Idle | |
| Load |
|
Key:
min: | |
| Lenovo Legion 7 16IAX10 Ultra 7 255HX, GeForce RTX 5060 Laptop, WD PC SN7100S SDFPMSL-1T00-1101, OLED, 2560x1600, 16" | Alienware 16 Aurora Core 7 240H, GeForce RTX 5060 Laptop, , IPS, 2560x1600, 16" | Asus TUF Gaming A16 FA608UP R7 260, GeForce RTX 5070 Laptop, Western Digital PC SN5000S SDEQNSJ-1T00, IPS, 2560x1600, 16" | Gigabyte Gaming A16 GA6H i7-13620H, GeForce RTX 5070 Laptop, Kingston OM8PGP41024Q-A0, IPS, 2560x1600, 16" | MSI Vector 16 HX AI A2XWHG Ultra 7 255HX, GeForce RTX 5070 Ti Laptop, Micron 2400 MTFDKBA512QFM, IPS, 2560x1600, 16" | Lenovo Legion 5 Pro 16IAX10H Ultra 9 275HX, GeForce RTX 5070 Ti Laptop, Western Digital PC SN8000S SDEPNRK-1T00, OLED, 2560x1600, 16" | |
|---|---|---|---|---|---|---|
| Power Consumption | 21% | 22% | 22% | -13% | -28% | |
| Idle Minimum * (Watt) | 9.4 | 4.4 53% | 4.6 51% | 9 4% | 7.1 24% | 14 -49% |
| Idle Average * (Watt) | 10.6 | 18 -70% | 9.8 8% | 11 -4% | 15.9 -50% | 14.3 -35% |
| Idle Maximum * (Watt) | 36.4 | 18.2 50% | 10.2 72% | 23 37% | 29.5 19% | 20.1 45% |
| Load Average * (Watt) | 107.7 | 87.1 19% | 76.1 29% | 91 16% | 124 -15% | 177 -64% |
| Cyberpunk 2077 ultra external monitor * (Watt) | 187.5 | 120.6 36% | 198.1 -6% | 130 31% | 217 -16% | 255 -36% |
| Cyberpunk 2077 ultra * (Watt) | 188 | 123 35% | 198.9 -6% | 132.5 30% | 222 -18% | 255 -36% |
| Load Maximum * (Watt) | 247 | 183 26% | 235.2 5% | 155 37% | 336 -36% | 294 -19% |
* ... smaller is better
功耗 赛博朋克/压力测试
外部显示器功耗
电池寿命
HX 系列 CPU、OLED 显示屏和同类产品中稍小的电池组合缩短了运行时间。在平衡和 iGPU 模式下,WLAN 浏览仅能持续 4.5 小时多一点,而 Alienware 16 Aurora 或技嘉 Gaming A16 等其他产品则能持续 7 小时以上。
此外,从空电到满电的充电时间也很快,不到 90 分钟。
| Lenovo Legion 7 16IAX10 Ultra 7 255HX, GeForce RTX 5060 Laptop, 84 Wh | Alienware 16 Aurora Core 7 240H, GeForce RTX 5060 Laptop, 96 Wh | Asus TUF Gaming A16 FA608UP R7 260, GeForce RTX 5070 Laptop, 90 Wh | Gigabyte Gaming A16 GA6H i7-13620H, GeForce RTX 5070 Laptop, 76 Wh | MSI Vector 16 HX AI A2XWHG Ultra 7 255HX, GeForce RTX 5070 Ti Laptop, 90 Wh | Lenovo Legion 5 Pro 16IAX10H Ultra 9 275HX, GeForce RTX 5070 Ti Laptop, 80 Wh | |
|---|---|---|---|---|---|---|
| Battery runtime | 60% | 177% | 64% | 49% | 4% | |
| WiFi v1.3 (h) | 4.7 | 7.5 60% | 13 177% | 7.7 64% | 7 49% | 4.9 4% |
| H.264 (h) | 4.8 | |||||
| Load (h) | 1.7 |
笔记本检查评级
超轻型 16 英寸游戏笔记本电脑,搭配快速的 Arrow Lake-HX 系列 CPU 和中端GeForce RTX 5060 或 5070 GPU。
Lenovo Legion 7 16IAX10
- 10/03/2025 v8
Allen Ngo
 Total Sustainability Score:
 潜在竞争对手比较
Image | Model / Review | Price | Weight | Height | Display |
|---|---|---|---|---|---|
1. 86.6%  | Lenovo Legion 7 16IAX10 Intel Core Ultra 7 255HX ⎘ NVIDIA GeForce RTX 5060 Laptop ⎘ 32 GB Memory, 1024 GB SSD | Amazon: List Price: 1650 USD | 2 kg | 17.9 mm | 16.00" 2560x1600 189 PPI OLED |
2. 76.2%  | Alienware 16 Aurora Intel Core 7 240H ⎘ NVIDIA GeForce RTX 5060 Laptop ⎘ 32 GB Memory | Amazon: List Price: 1100 USD | 2.6 kg | 15.2 mm | 16.00" 2560x1600 189 PPI IPS |
3. 83.8%  | Asus TUF Gaming A16 FA608UP AMD Ryzen 7 260 ⎘ NVIDIA GeForce RTX 5070 Laptop ⎘ 32 GB Memory, 1024 GB SSD | Amazon: List Price: 2199€ | 2.2 kg | 25.7 mm | 16.00" 2560x1600 189 PPI IPS |
4. 80.1%  | Gigabyte Gaming A16 GA6H Intel Core i7-13620H ⎘ NVIDIA GeForce RTX 5070 Laptop ⎘ 16 GB Memory, 1024 GB SSD | Amazon: 1. $1,370.21 GIGABYTE - Gaming A16 Gaming... 2. $1,226.99 GIGABYTE - Gaming A16 Gaming... 3. $1,029.00 GIGABYTE - Gaming A16 Gaming... List Price: 1700 EUR | 2.3 kg | 23 mm | 16.00" 2560x1600 189 PPI IPS |
5. 84%  | MSI Vector 16 HX AI A2XWHG Intel Core Ultra 7 255HX ⎘ NVIDIA GeForce RTX 5070 Ti Laptop ⎘ 16 GB Memory, 512 GB SSD | Amazon: List Price: 2000 EUR | 2.6 kg | 28.6 mm | 16.00" 2560x1600 189 PPI IPS |
6. 84.5%  | Lenovo Legion 5 Pro 16IAX10H Intel Core Ultra 9 275HX ⎘ NVIDIA GeForce RTX 5070 Ti Laptop ⎘ 32 GB Memory, 1024 GB SSD | Amazon: 1. $2,731.15 Lenovo Legion Pro 7 16IAX10H... 2. $1,749.99 Lenovo Legion Pro 5 AI Gamin... 3. $2,474.00 Lenovo Legion Pro 5i Gen 10 ... List Price: 2500 Euro | 2.4 kg | 25.95 mm | 16.00" 2560x1600 189 PPI OLED |
Transparency
The selection of devices to be reviewed is made by our editorial team. The test sample was provided to the author as a loan by the manufacturer or retailer for the purpose of this review. The lender had no influence on this review, nor did the manufacturer receive a copy of this review before publication. There was no obligation to publish this review. As an independent media company, Notebookcheck is not subjected to the authority of manufacturers, retailers or publishers.
This is how Notebookcheck is testing
Every year, Notebookcheck independently reviews hundreds of laptops and smartphones using standardized procedures to ensure that all results are comparable. We have continuously developed our test methods for around 20 years and set industry standards in the process. In our test labs, high-quality measuring equipment is utilized by experienced technicians and editors. These tests involve a multi-stage validation process. Our complex rating system is based on hundreds of well-founded measurements and benchmarks, which maintains objectivity. Further information on our test methods can be found here.

