结论 - XMG Apex 17 值得购买吗?
凭借 Apex 17,Schenker/XMG 再次在简洁、低调的机箱中实现了不受限制的性能。极快的 Ryzen 9 9955HX、释放的 RTX 5060、稳定的 1440p 显示屏、快速的 Wi-Fi 和高速固态硬盘的组合,构成了一个引人注目的整体方案。
Apex 17 完全面向那些希望以合理的价格获得最快的 RTX 5060 笔记本电脑的游戏玩家。即使在明显更安静的娱乐模式下,性能也不会落后于竞争对手。
高性能的缺点是在性能模式下噪音和功耗同样很高。端口选择也可以更加现代化。
Pros
Cons
我们最近评测了 Apex 16 Max,它具有全面的游戏性能和 Mini-LED 面板,但 2800 欧元的售价并不适合所有人。因此,我们对售价 1899 欧元的 Apex 17 进行了深入了解。它是否能以更低的价格提供类似的性能和体验?让我们一探究竟。
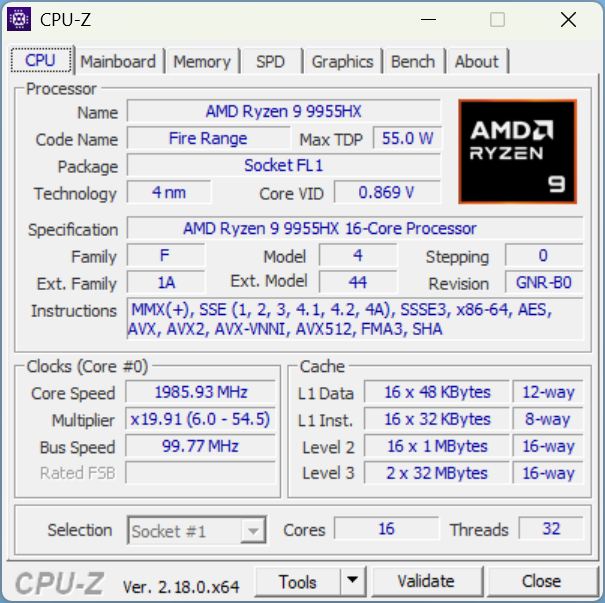
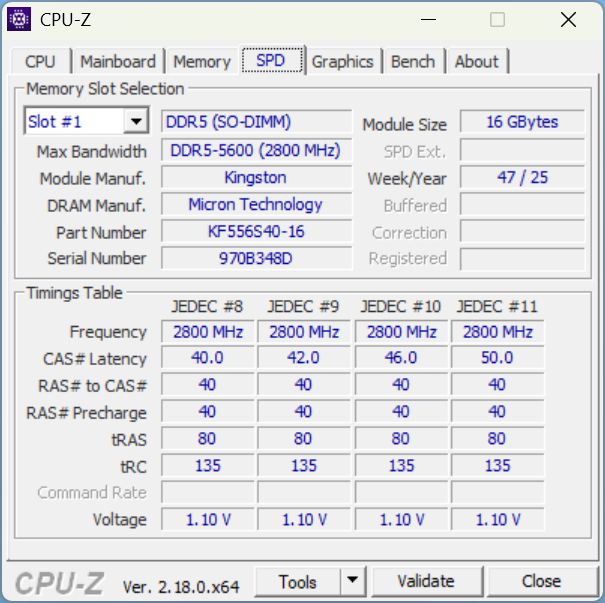
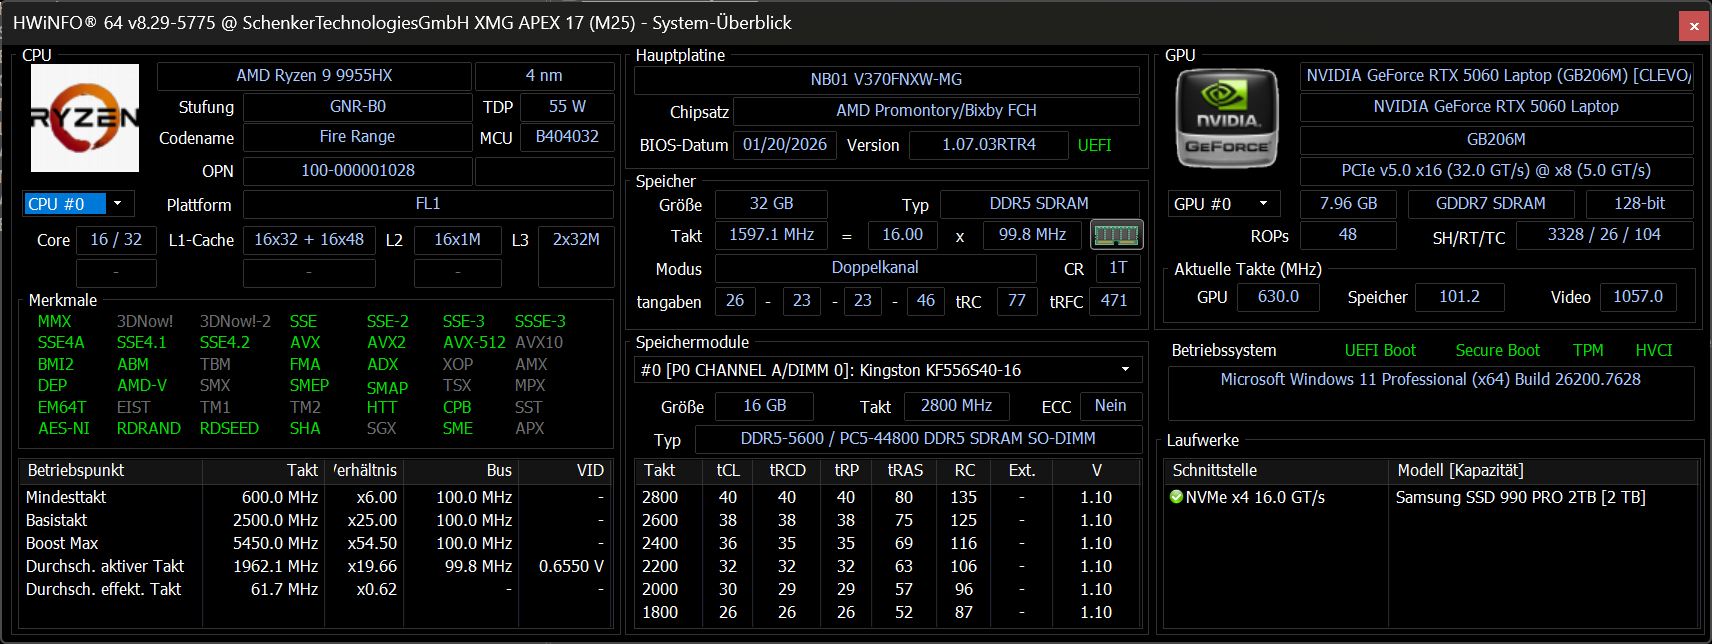
规格 - Ryzen 9 9955HX 和 RTX 5060
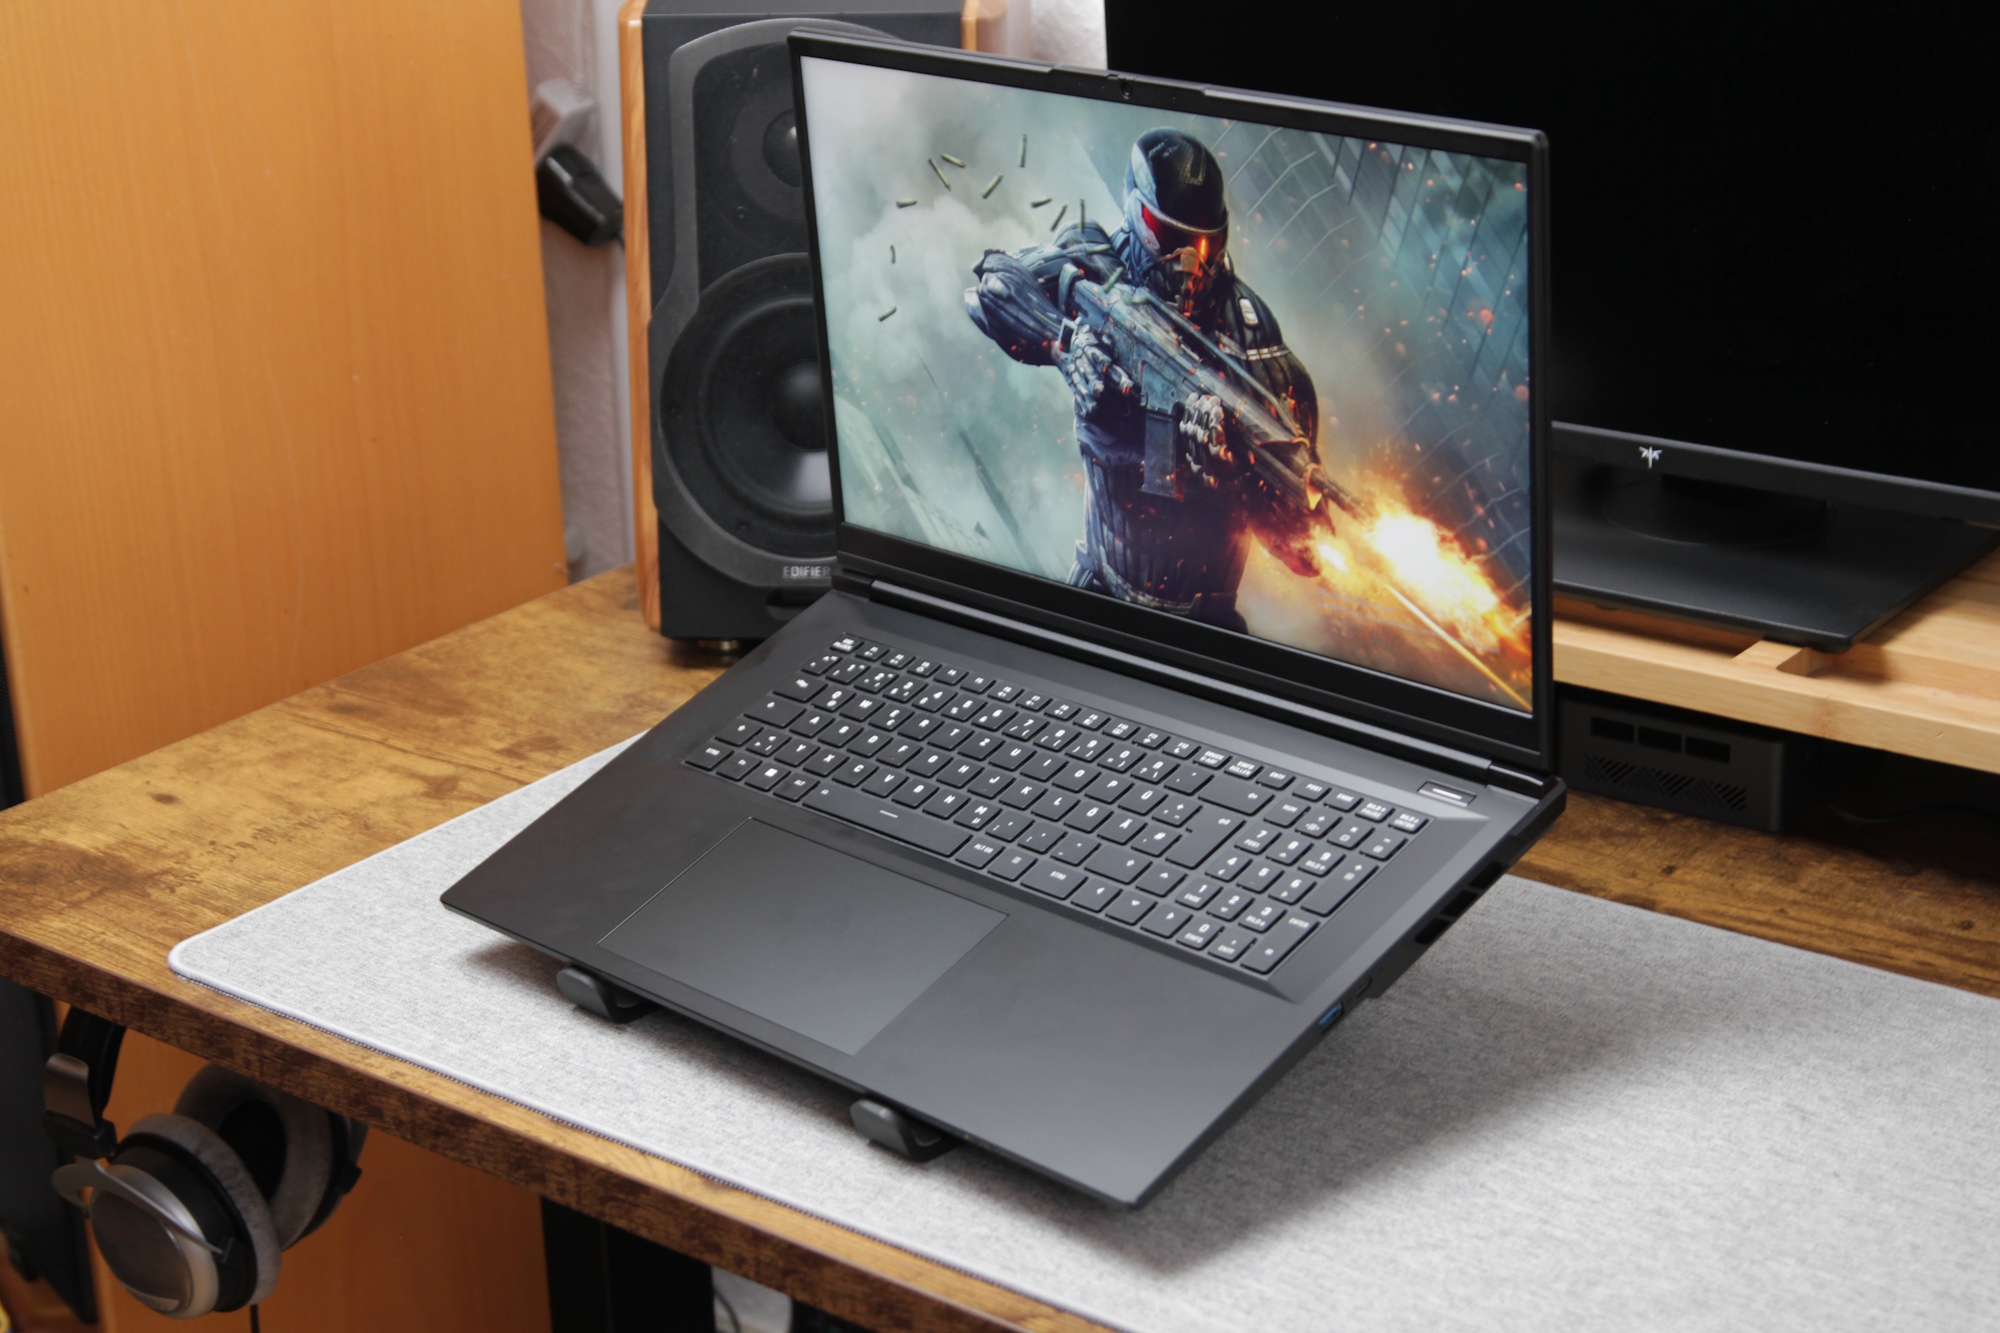
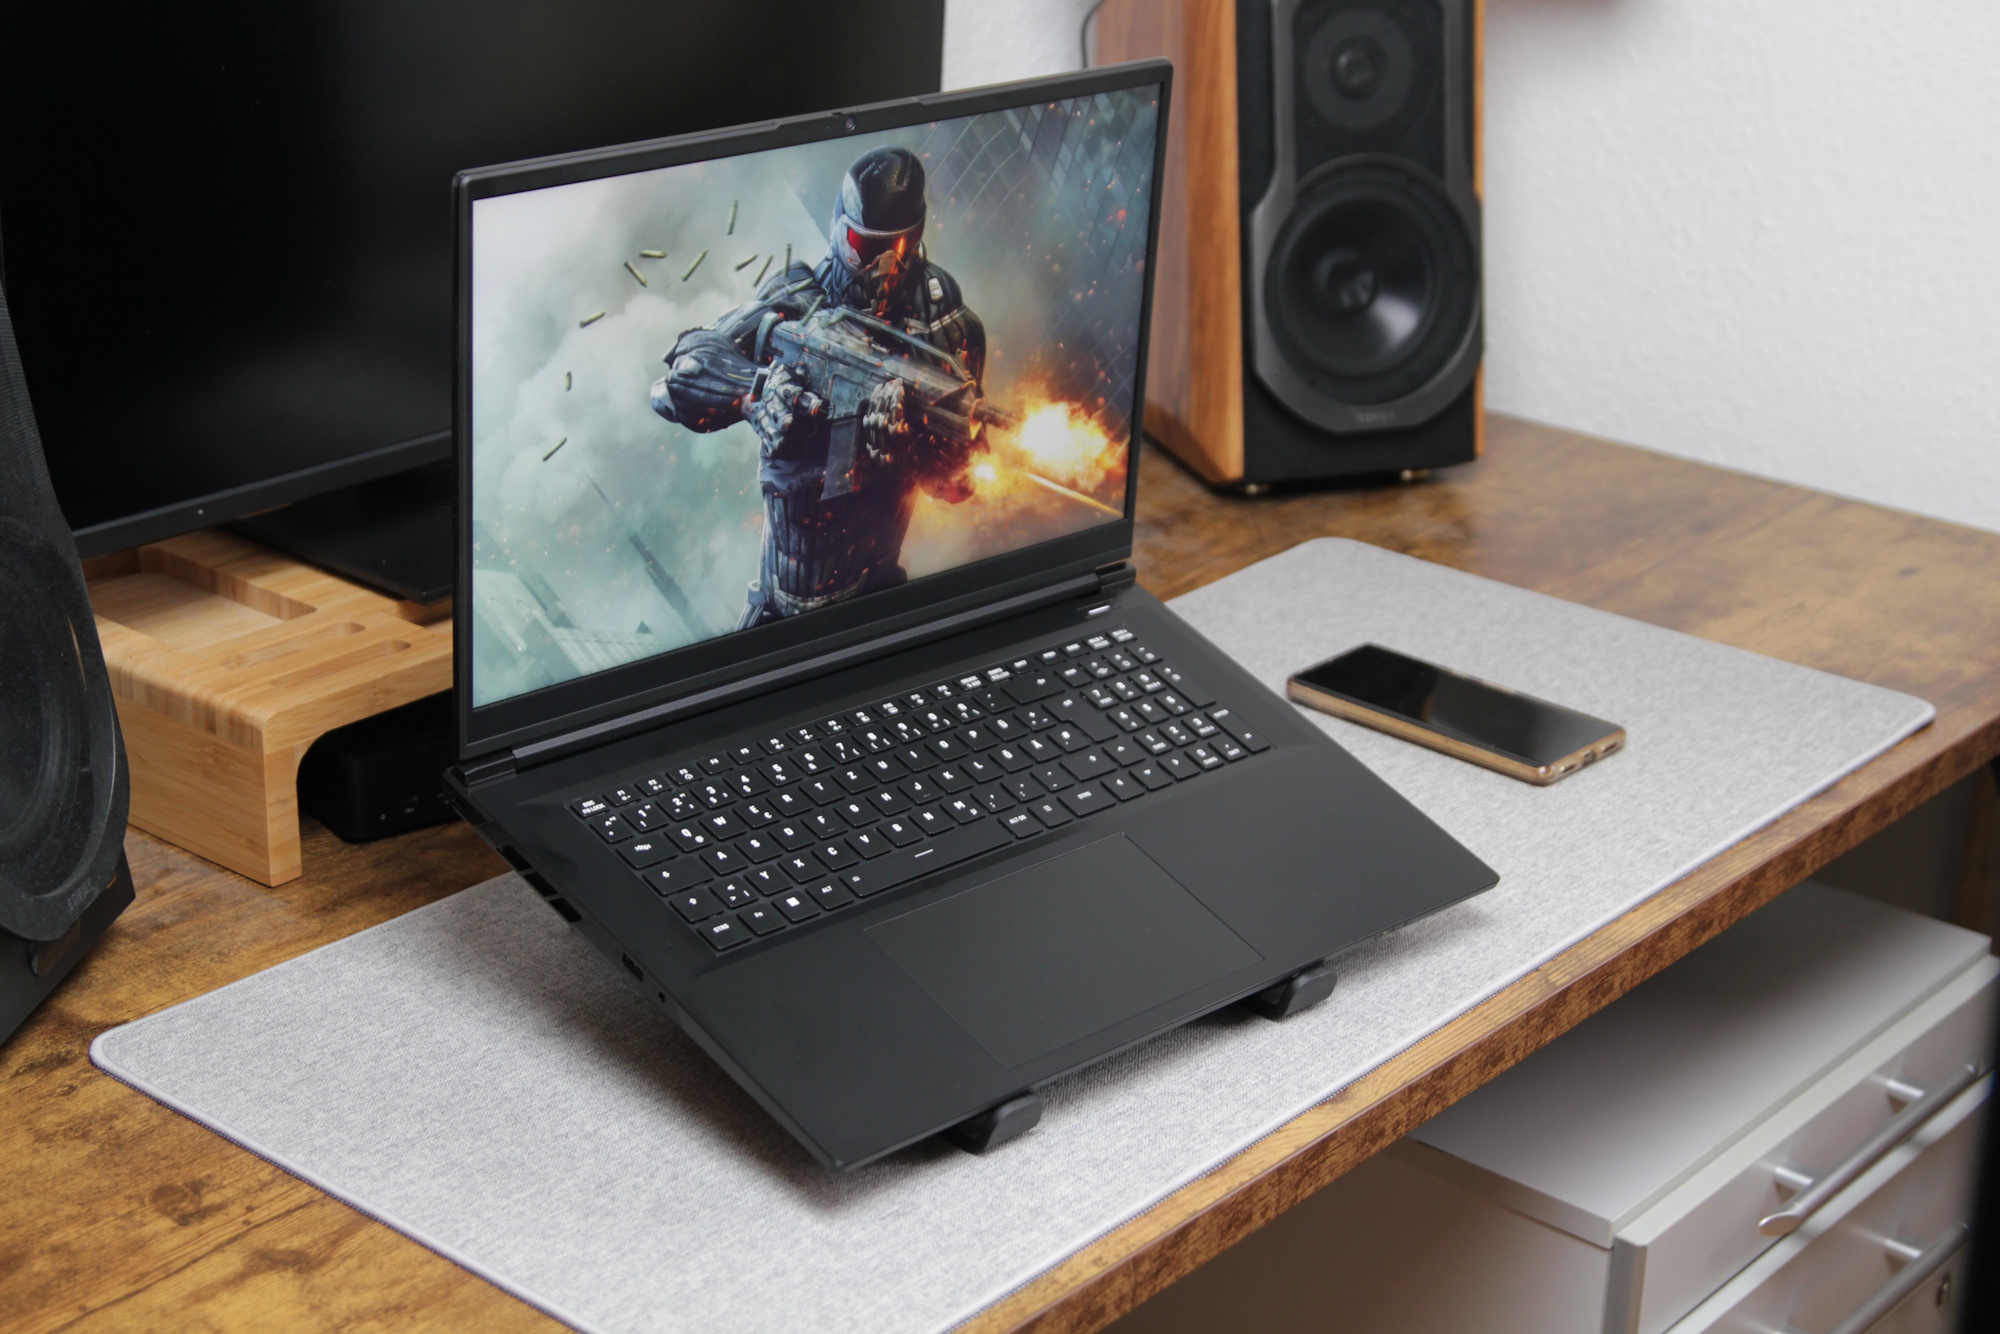
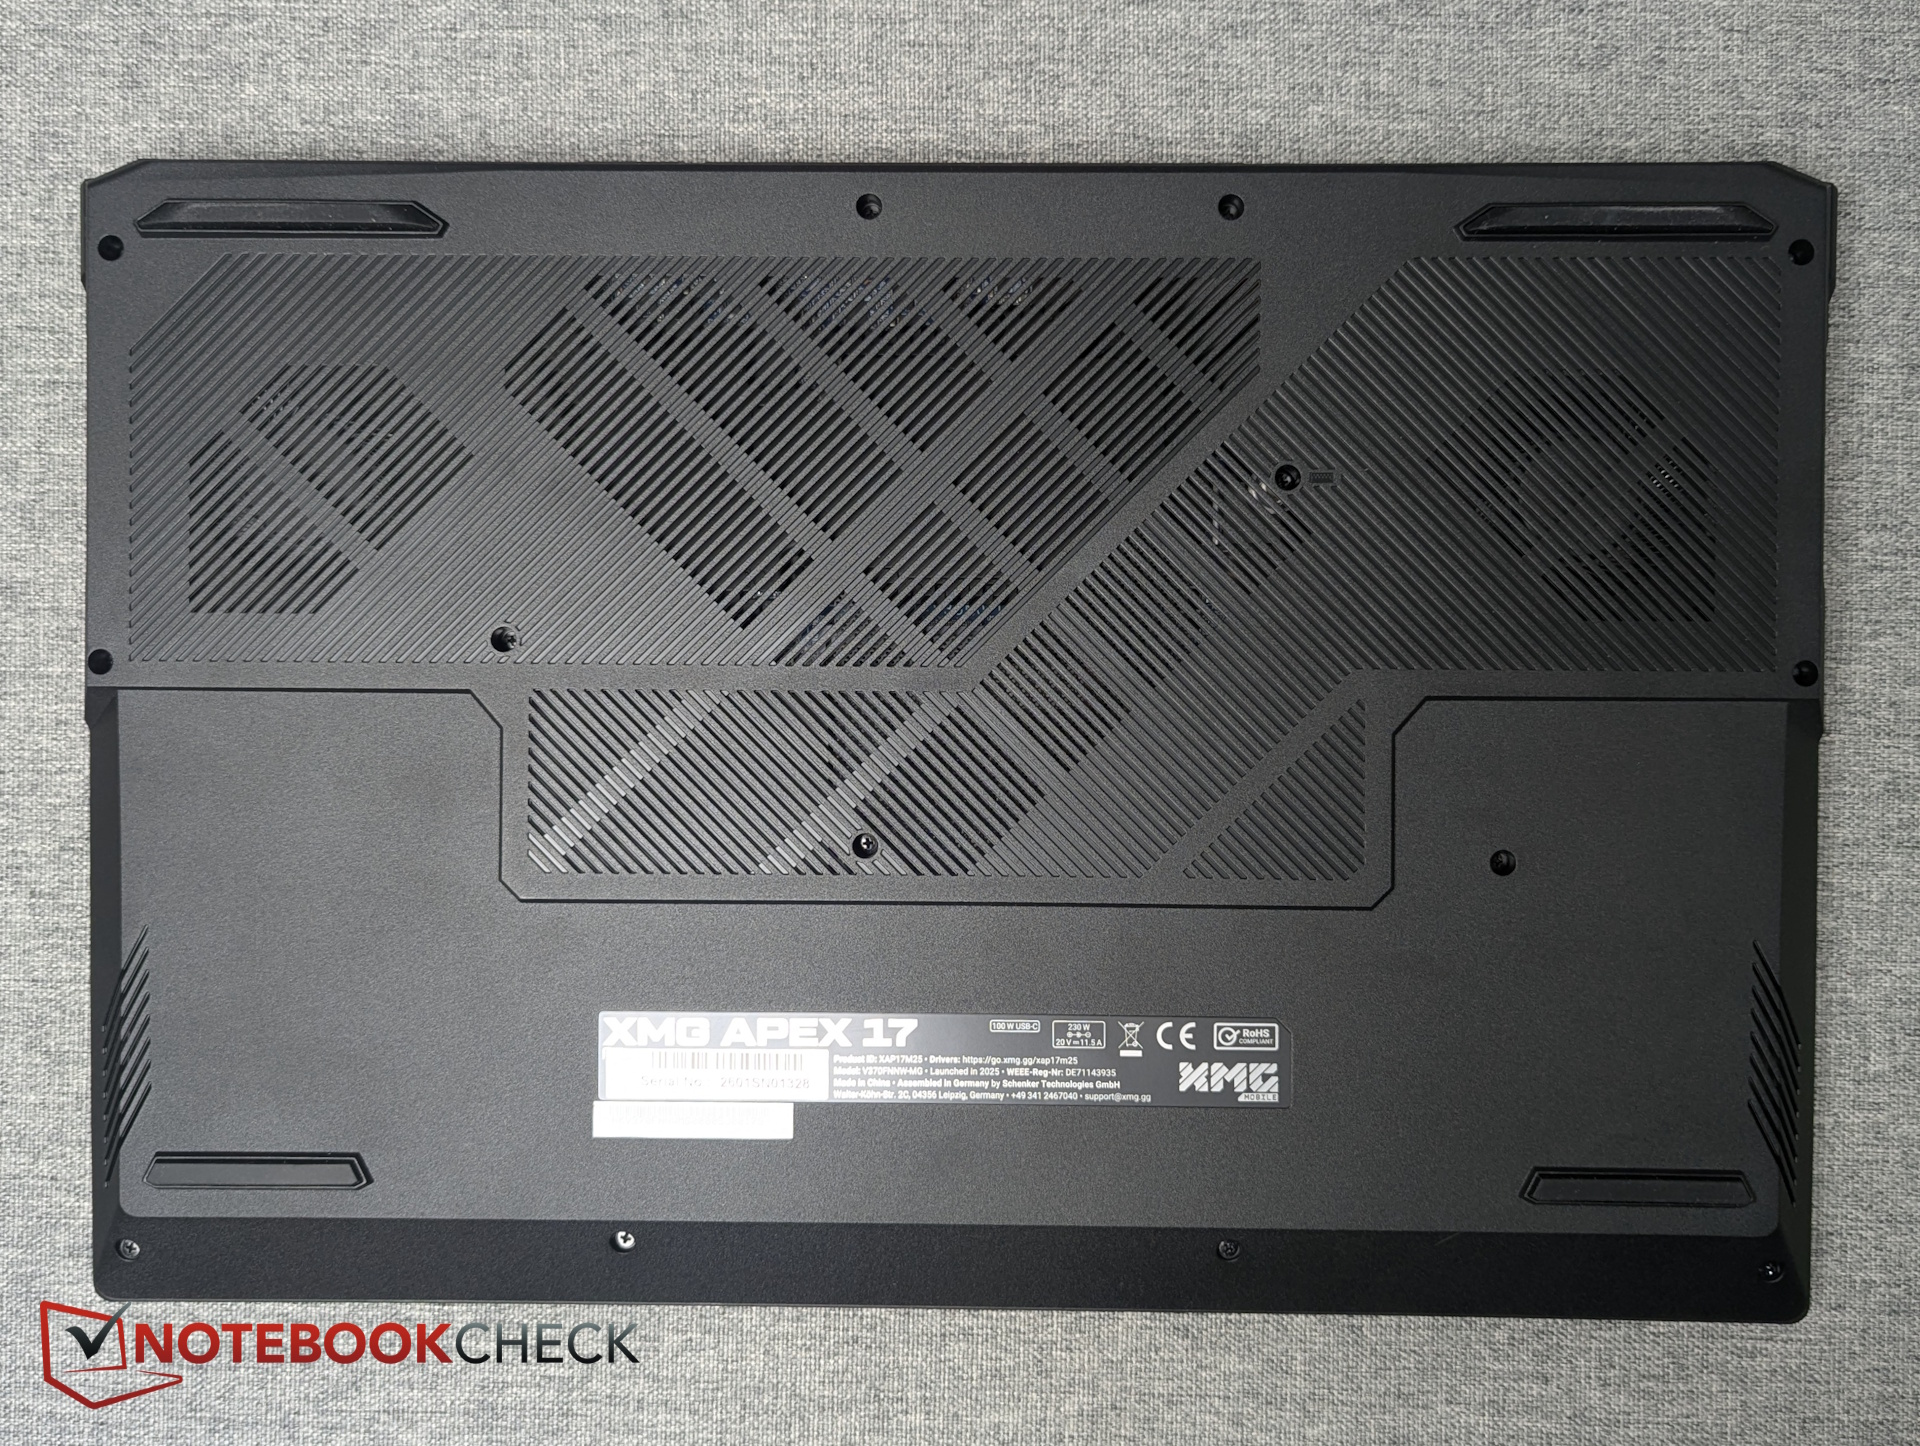
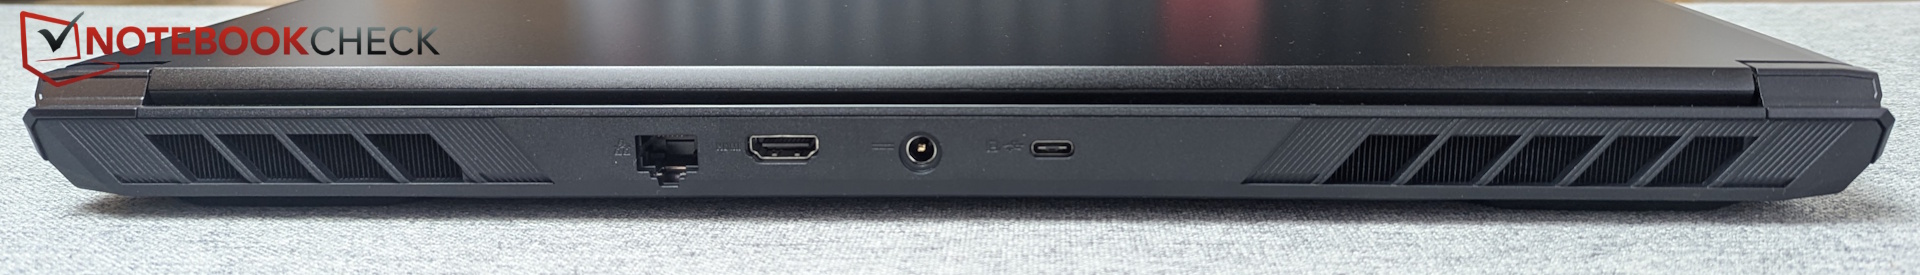
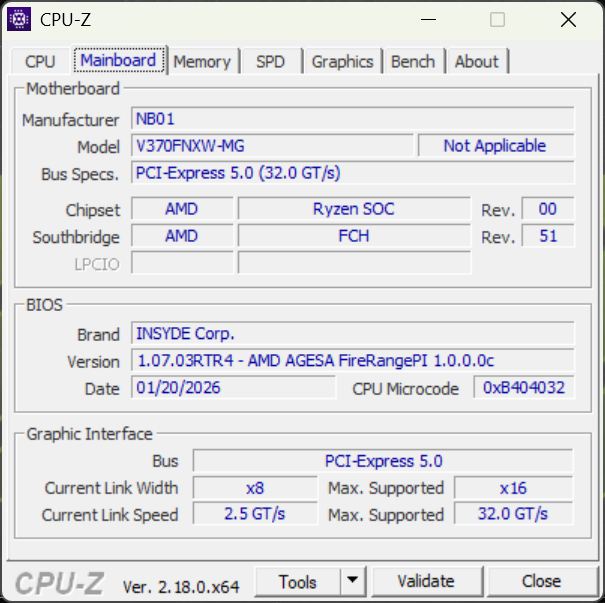
机箱和连接性 - 17 英寸简洁设计,但有一些端口限制
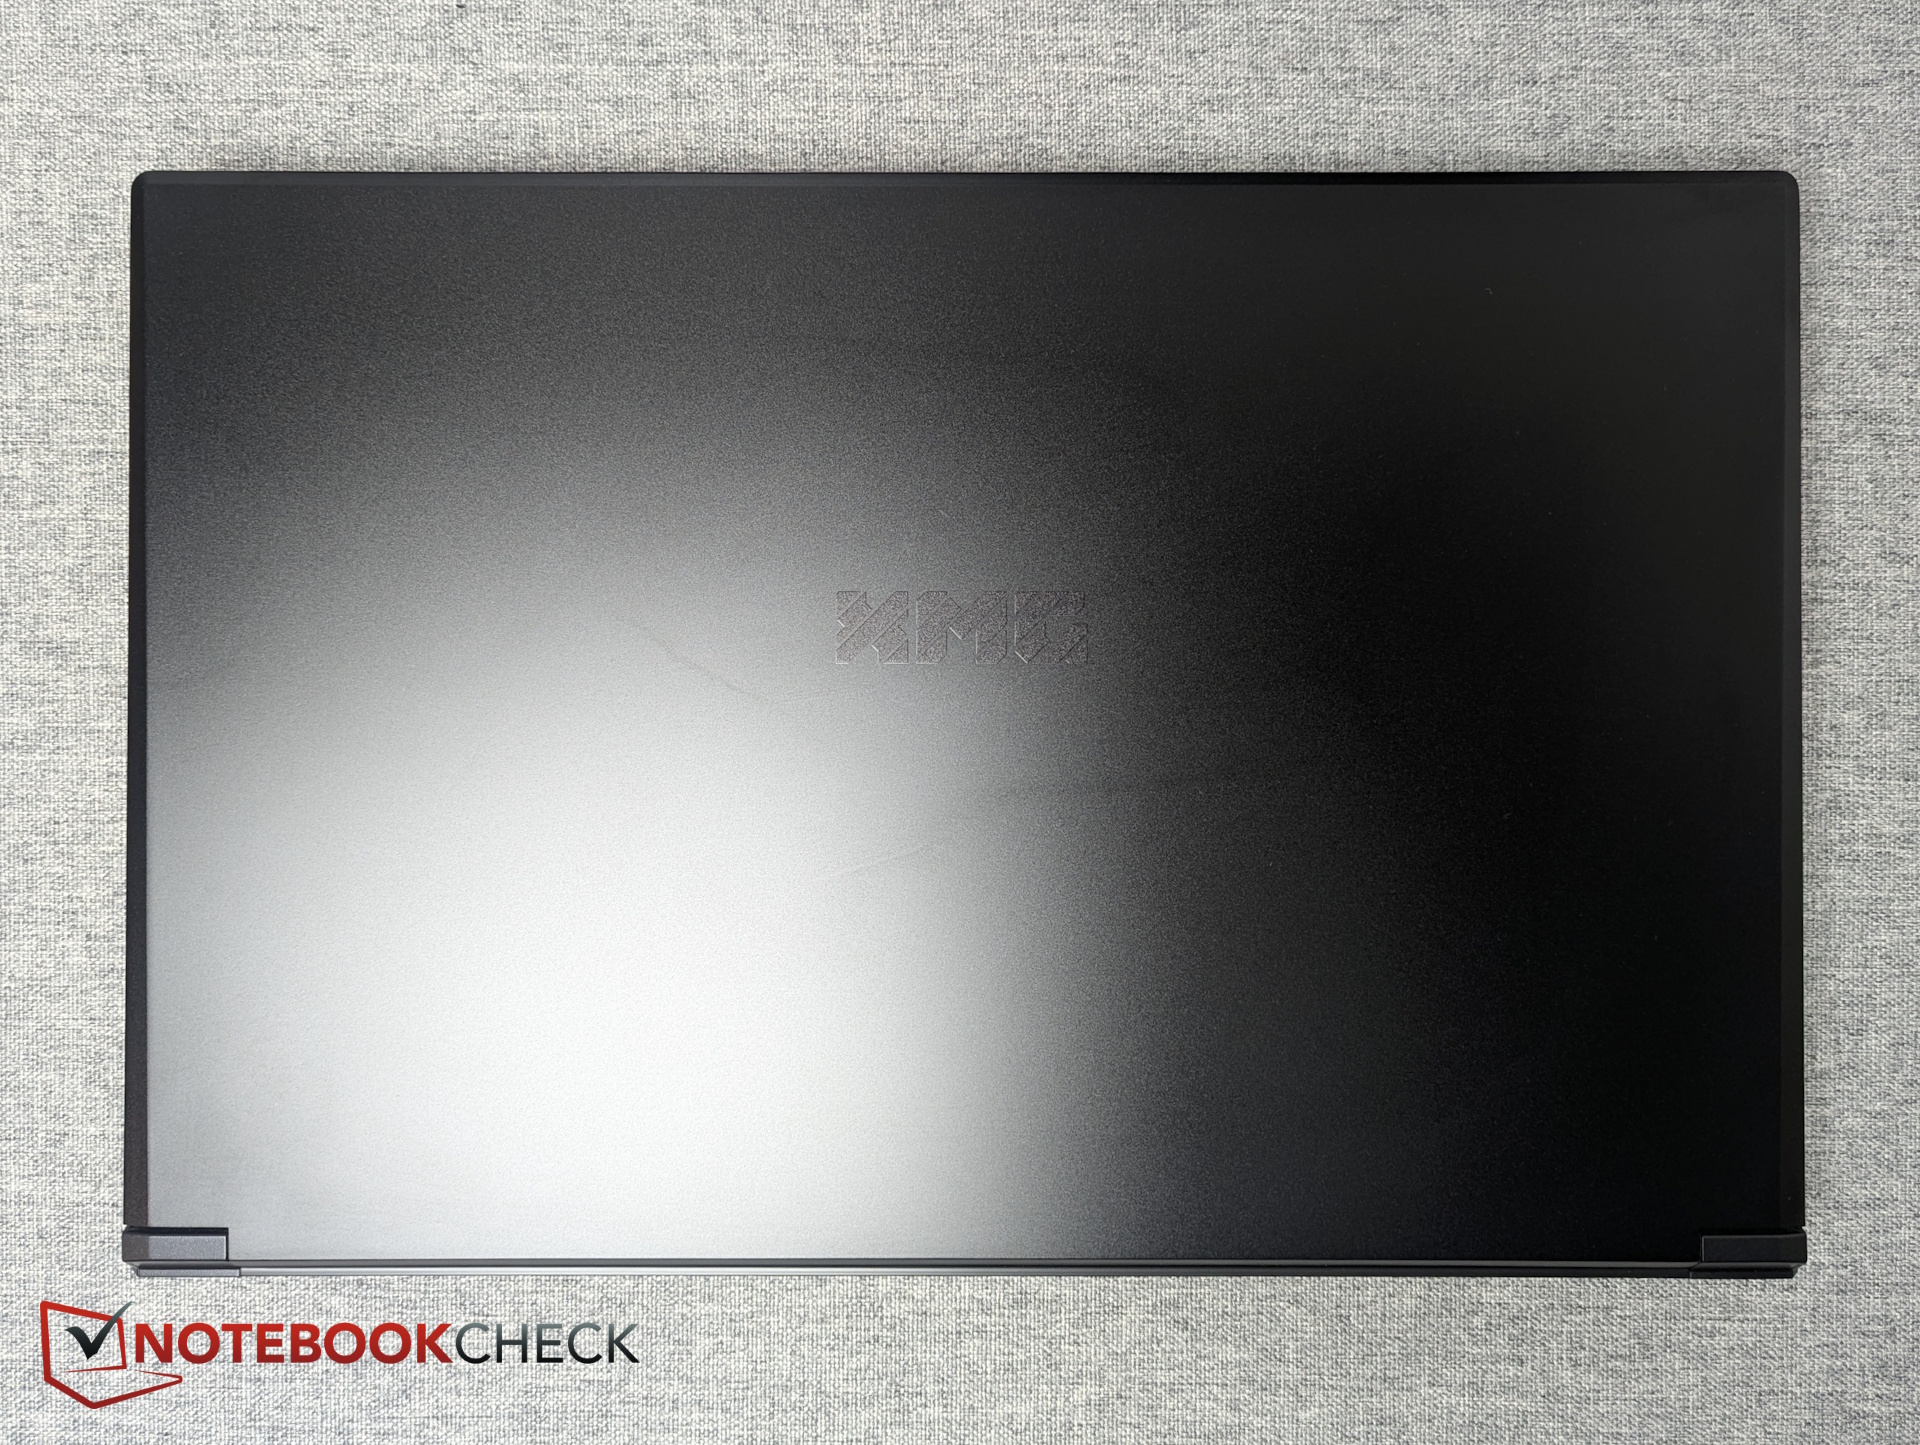
从外观上看,坚固、低调的黑色机箱更接近 Focus 17 M25,而不是 Apex 16 Max。机箱盖由金属制成(容易留下指纹),机箱的其他部分则使用硬质塑料。机箱内部有两个 SO-DIMM 插槽和两个 M.2 PCIe 4.0 插槽。
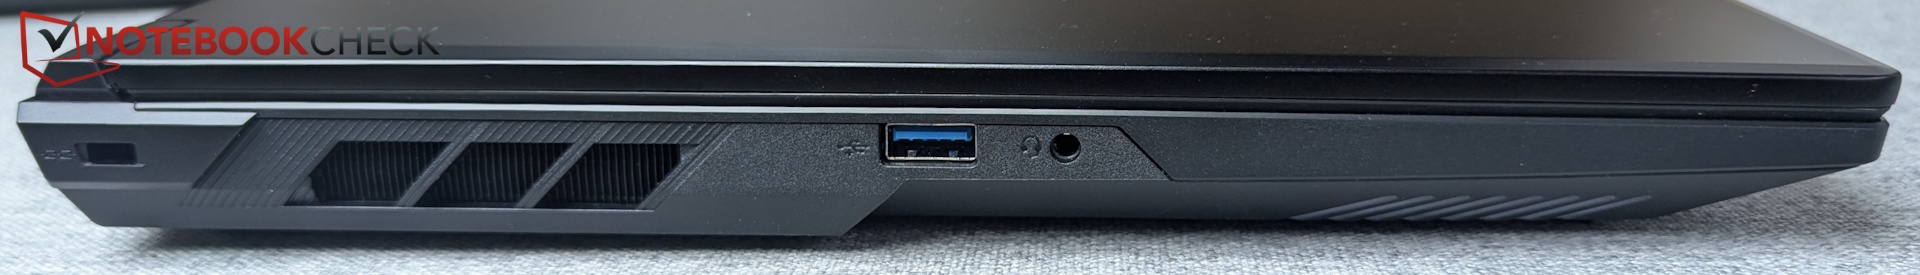
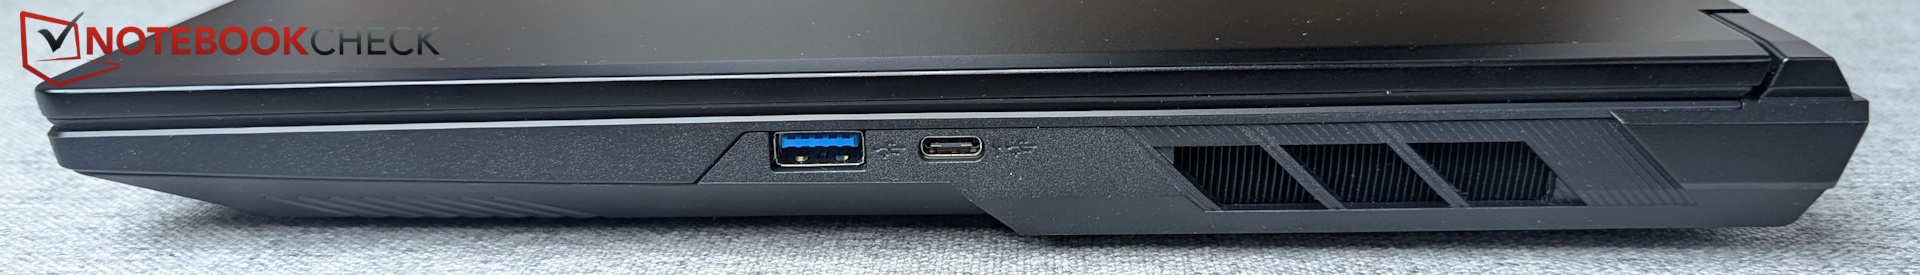
端口选择方面,缺少 SD 读卡器以及 USB4 和 Thunderbolt,这意味着最大传输速率只能达到 10 Gb/s。在尺寸和重量方面,它大致处于 17 英寸机型的中间位置。由于采用 16:9 显示屏,它通常比同类 17 英寸机型更窄。

网络摄像头
全高清红外网络摄像头包括一个物理快门。色彩还原可以接受,但图像清晰度可能会更好。


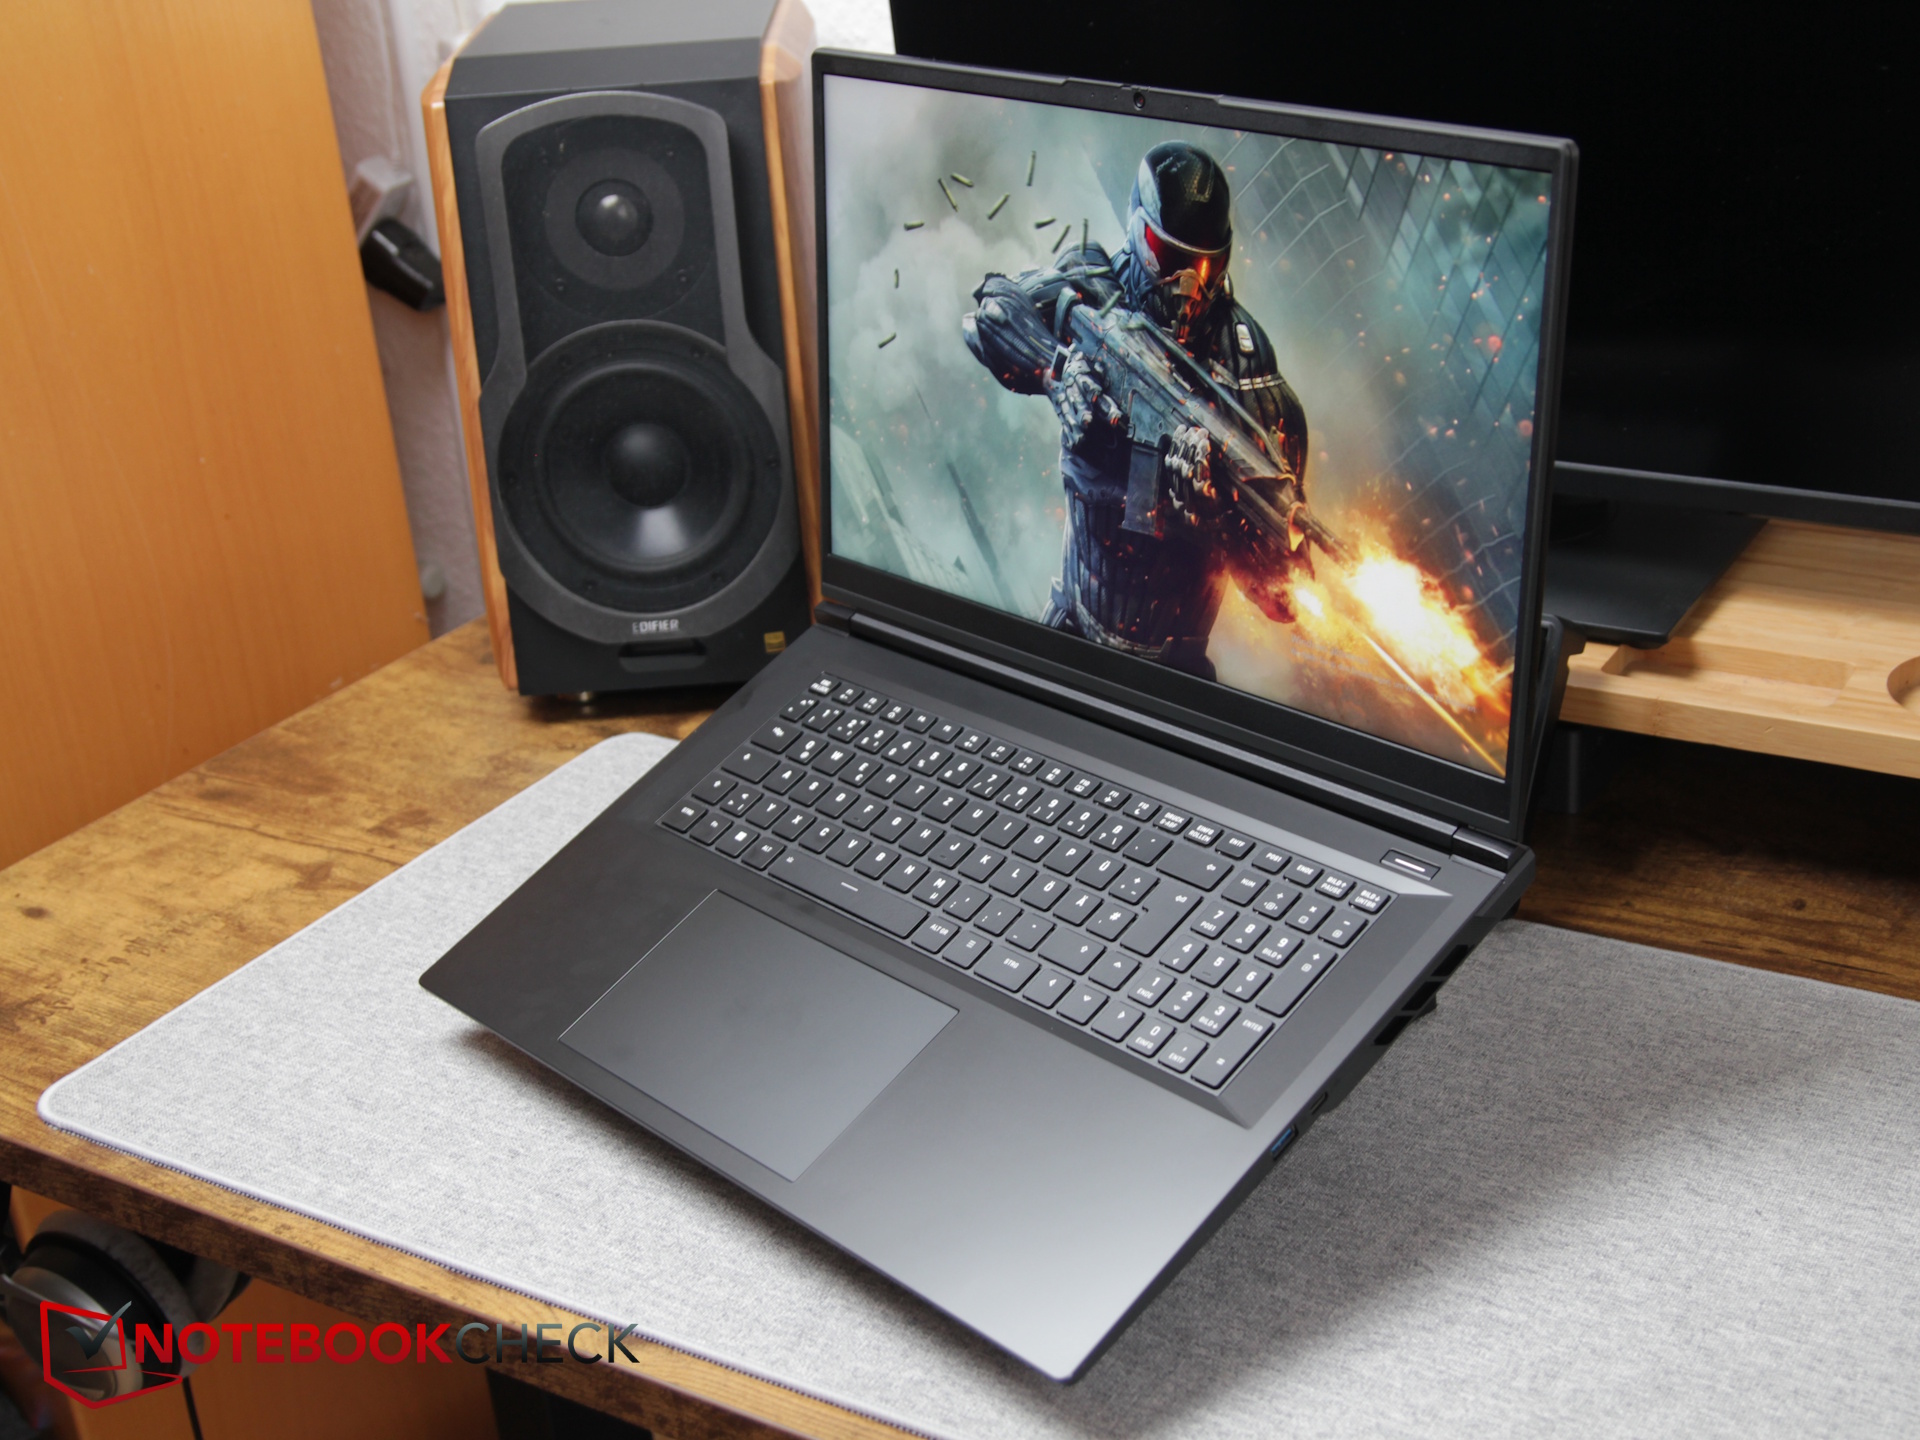
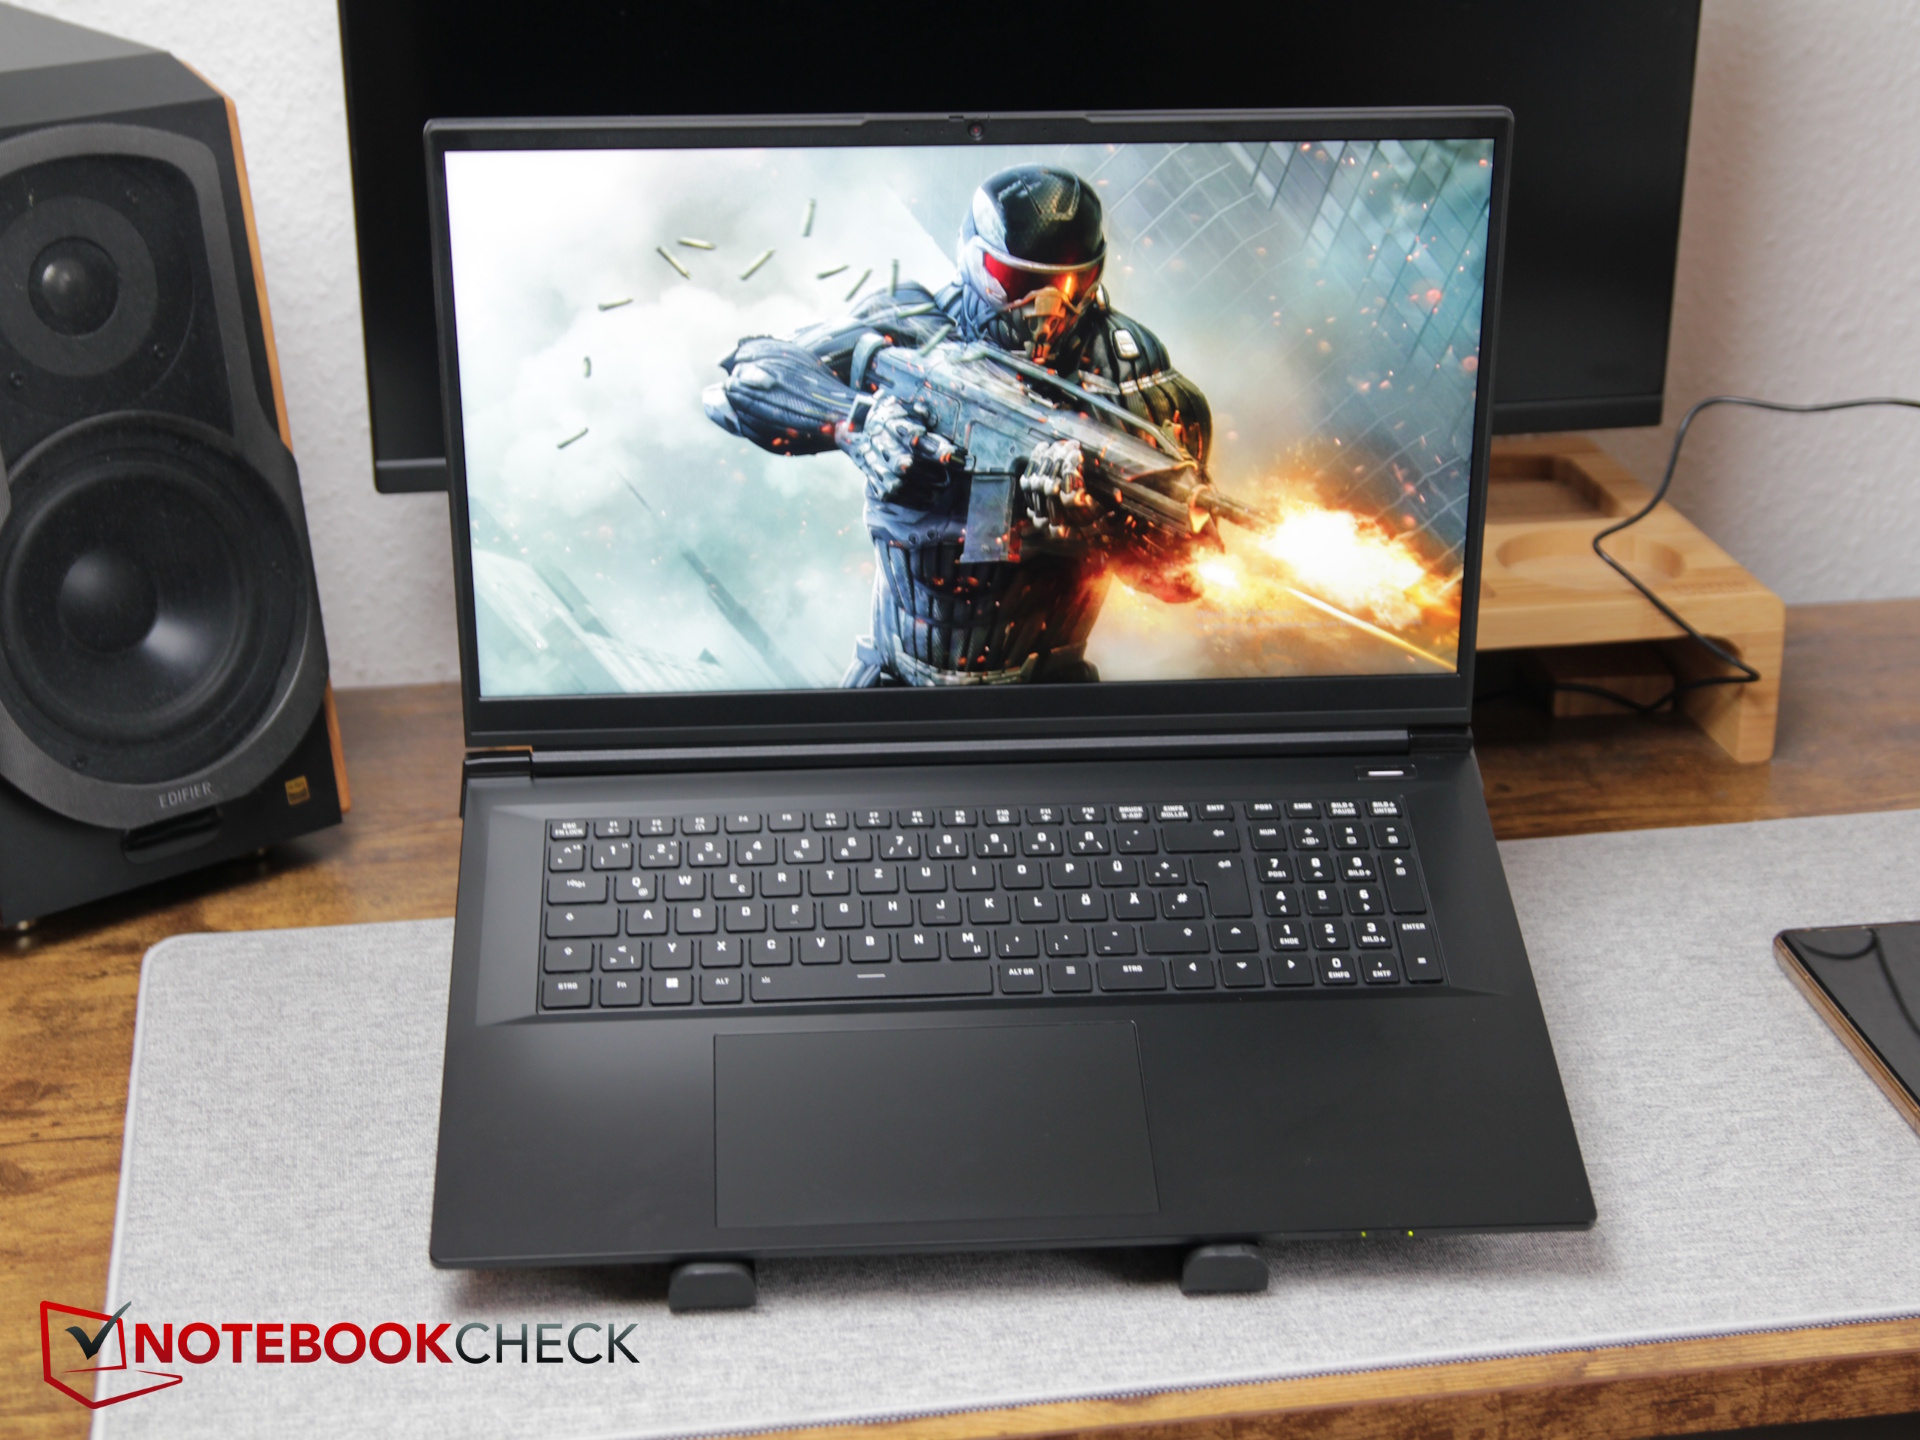
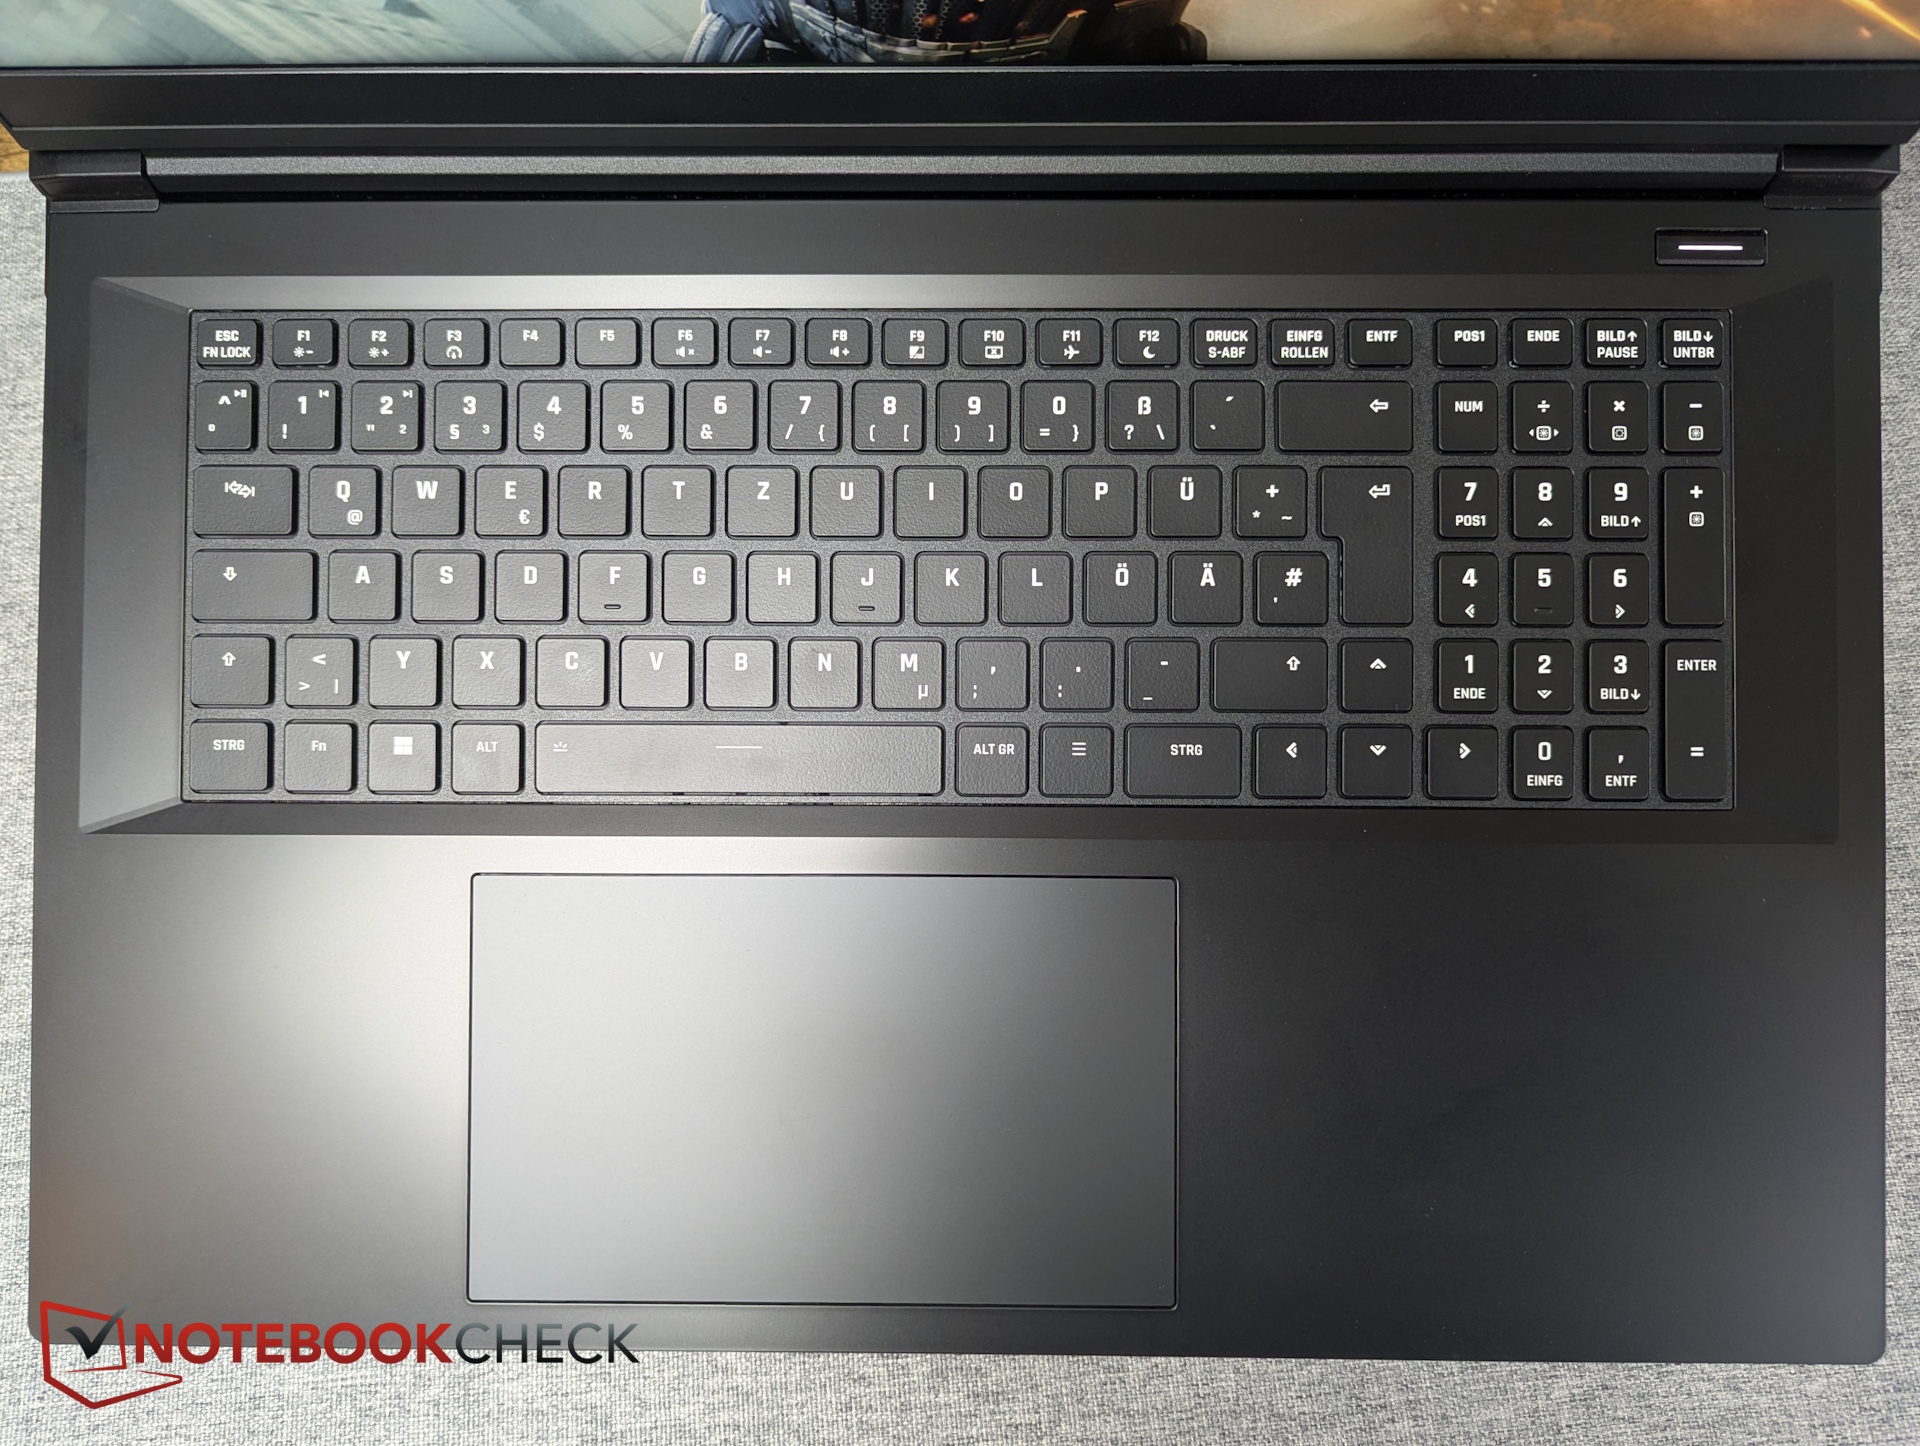
输入设备 - 键程较浅,15 厘米大触摸板
与大多数 XMG 笔记本电脑不同的是,方向键没有从主键组中分离出来,这与 Focus 17 类似。除此之外,键盘布局简洁,右侧还有一个专用数字键盘。
键程很浅,虽然压力点很明显,但反馈可以更明显。尽管如此,打字仍然快速而舒适。
15 x 9 厘米的大触摸板具有良好的滑动性能。它的集成按键响应可靠,噪音适中,敲击时不会发出嘎嘎声。
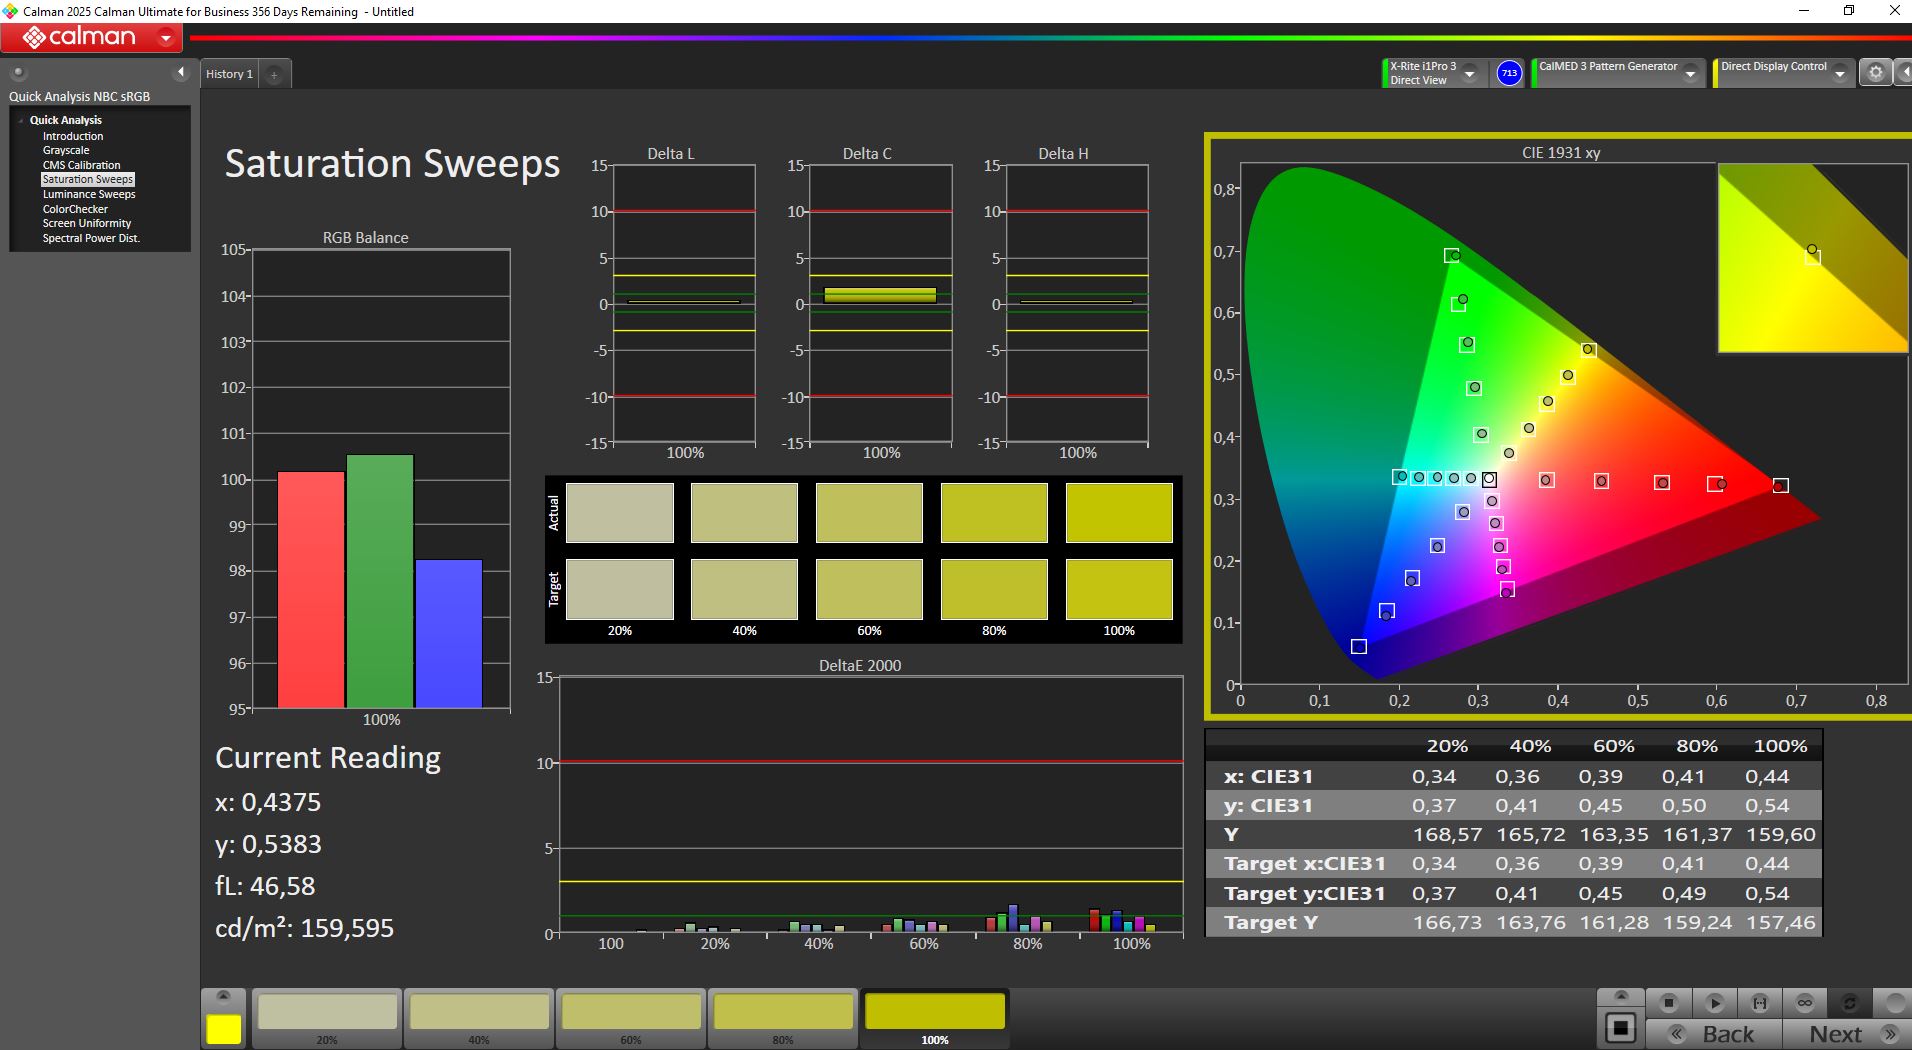
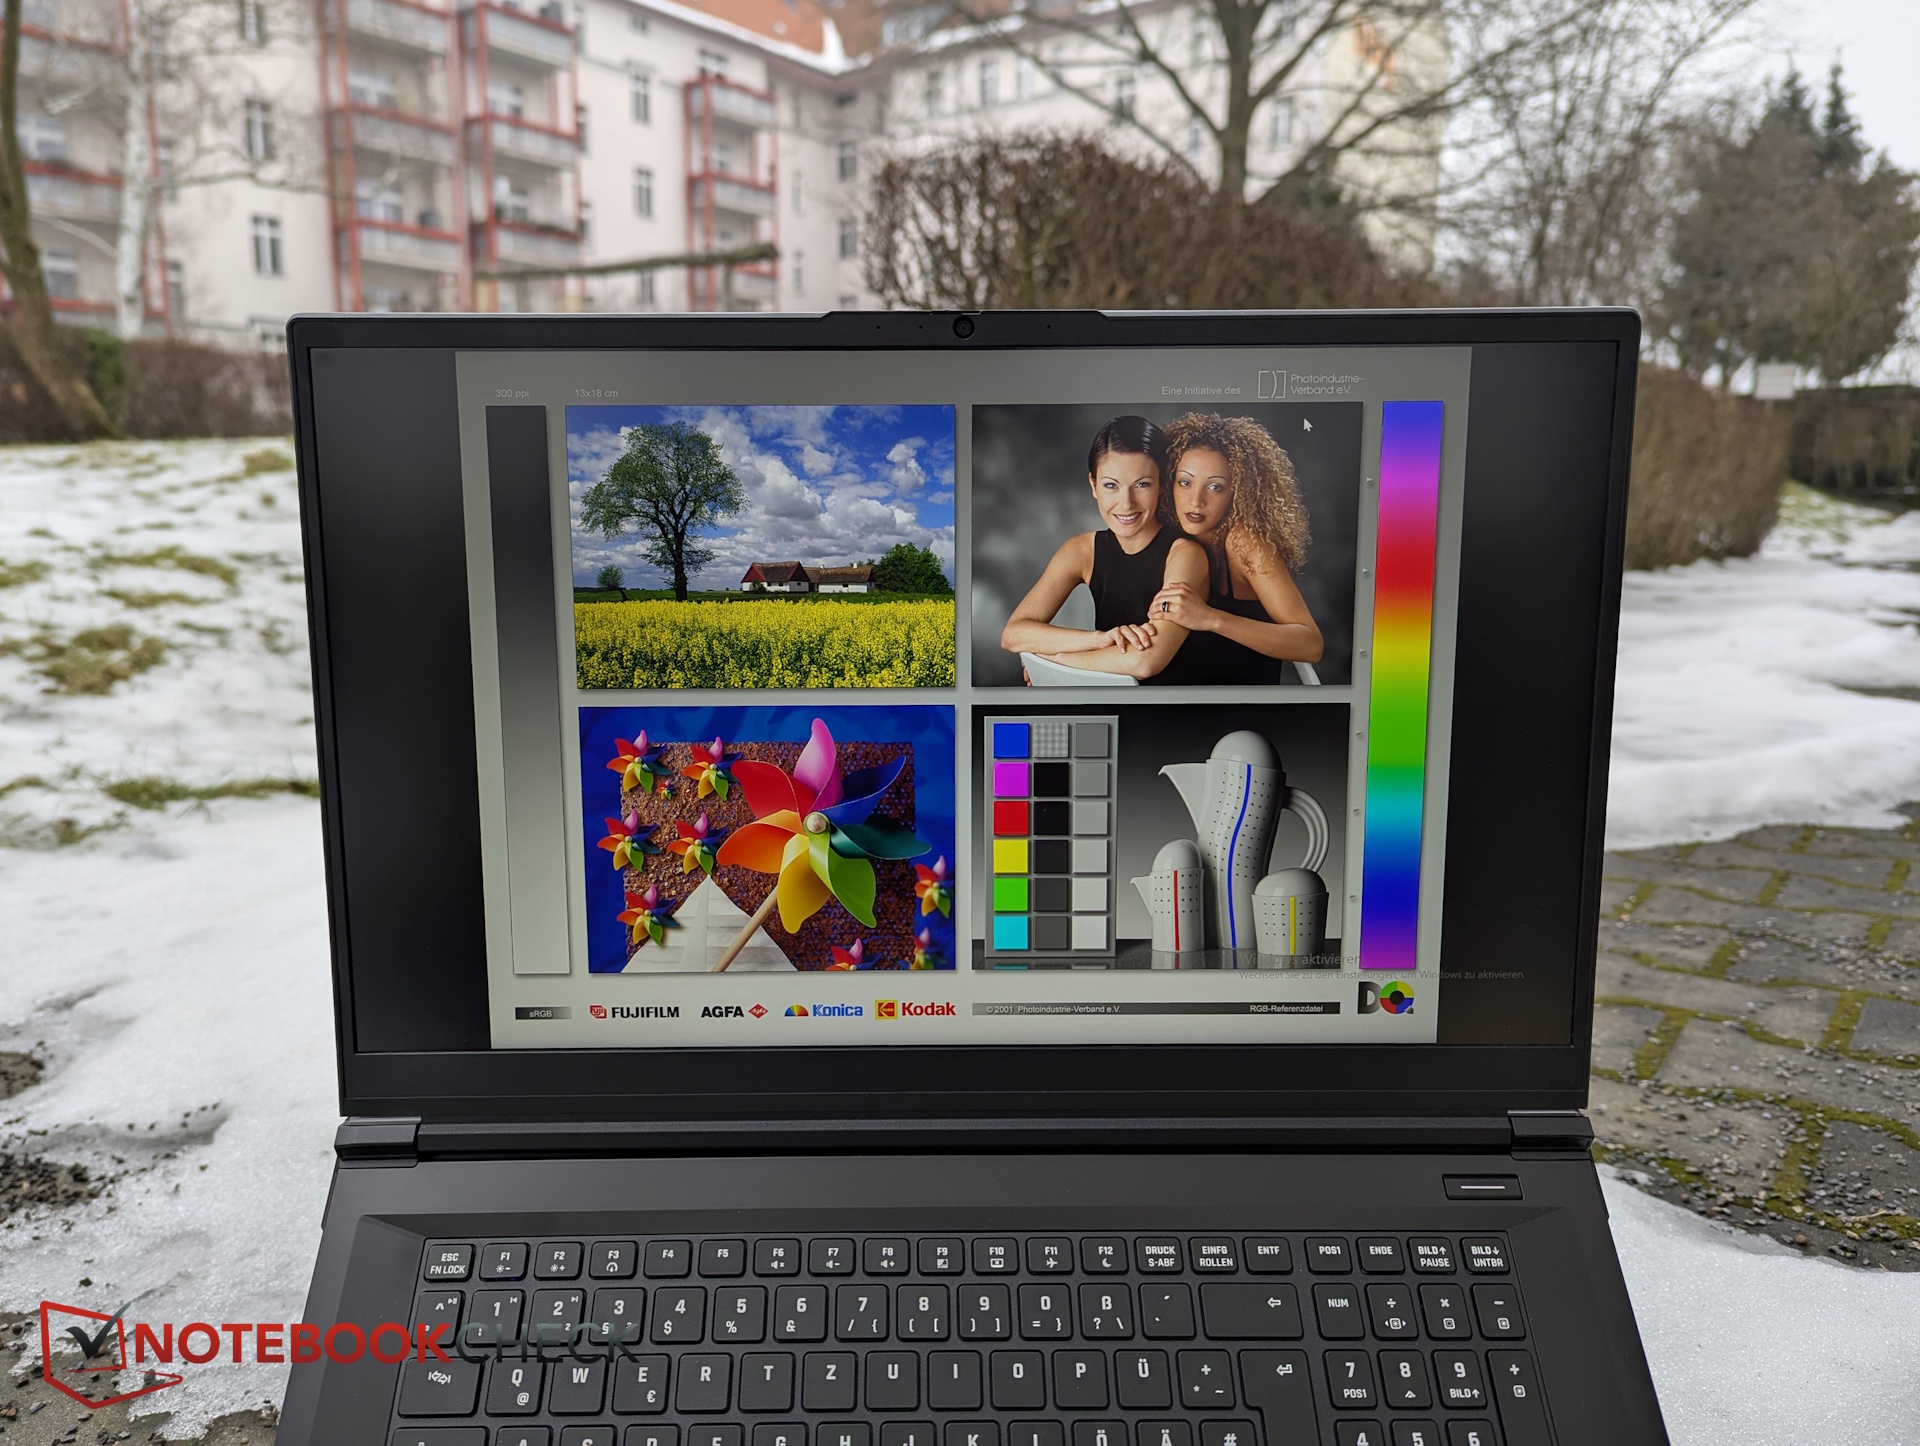
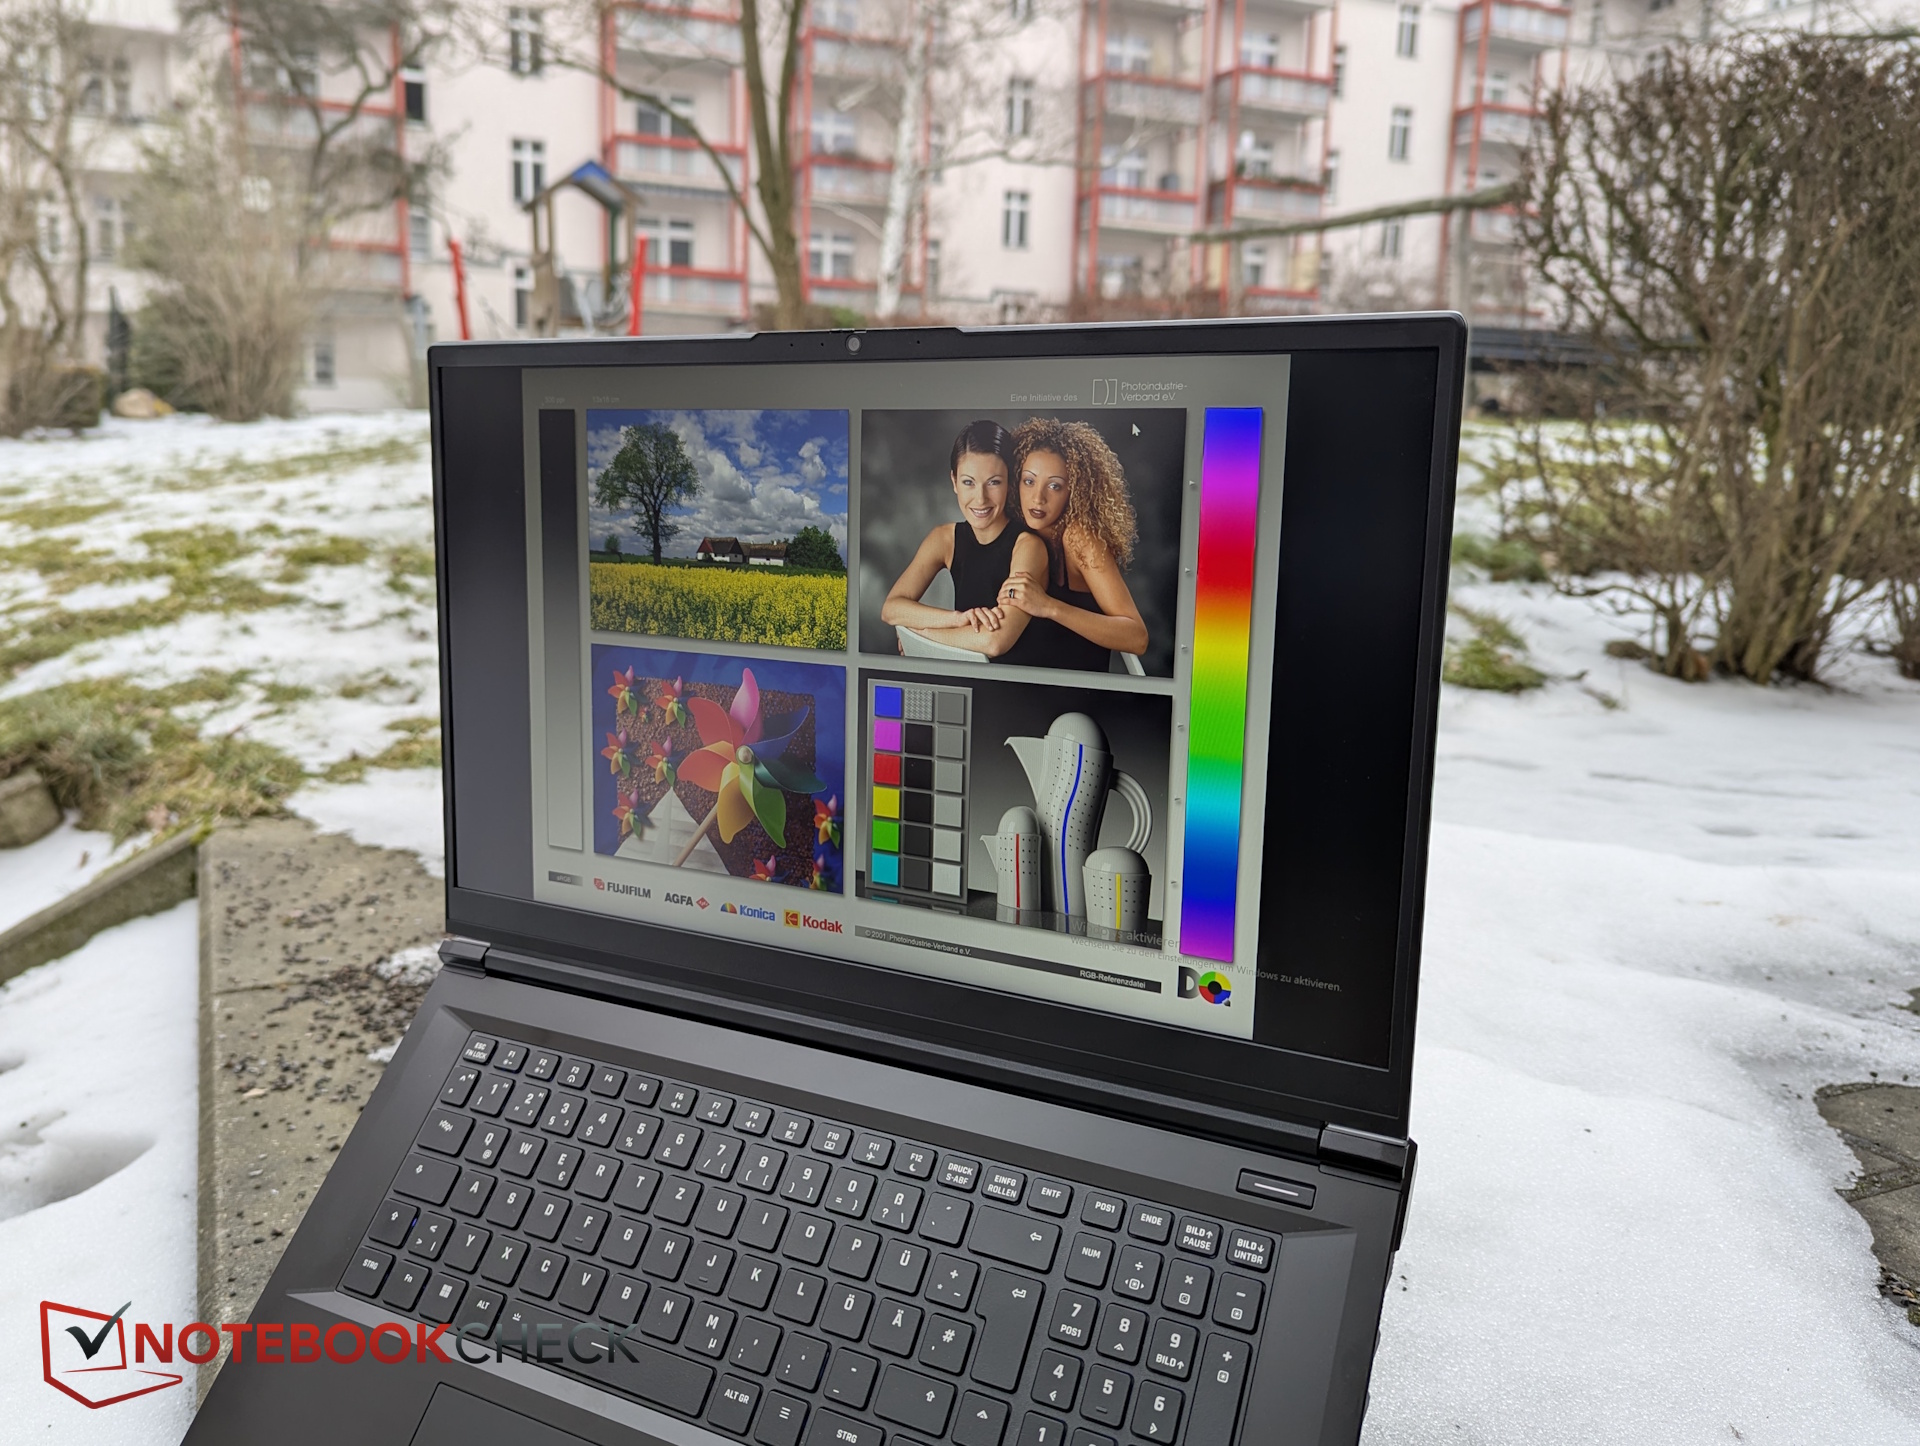
显示屏 - QHD 240 Hz 面板性能如何?
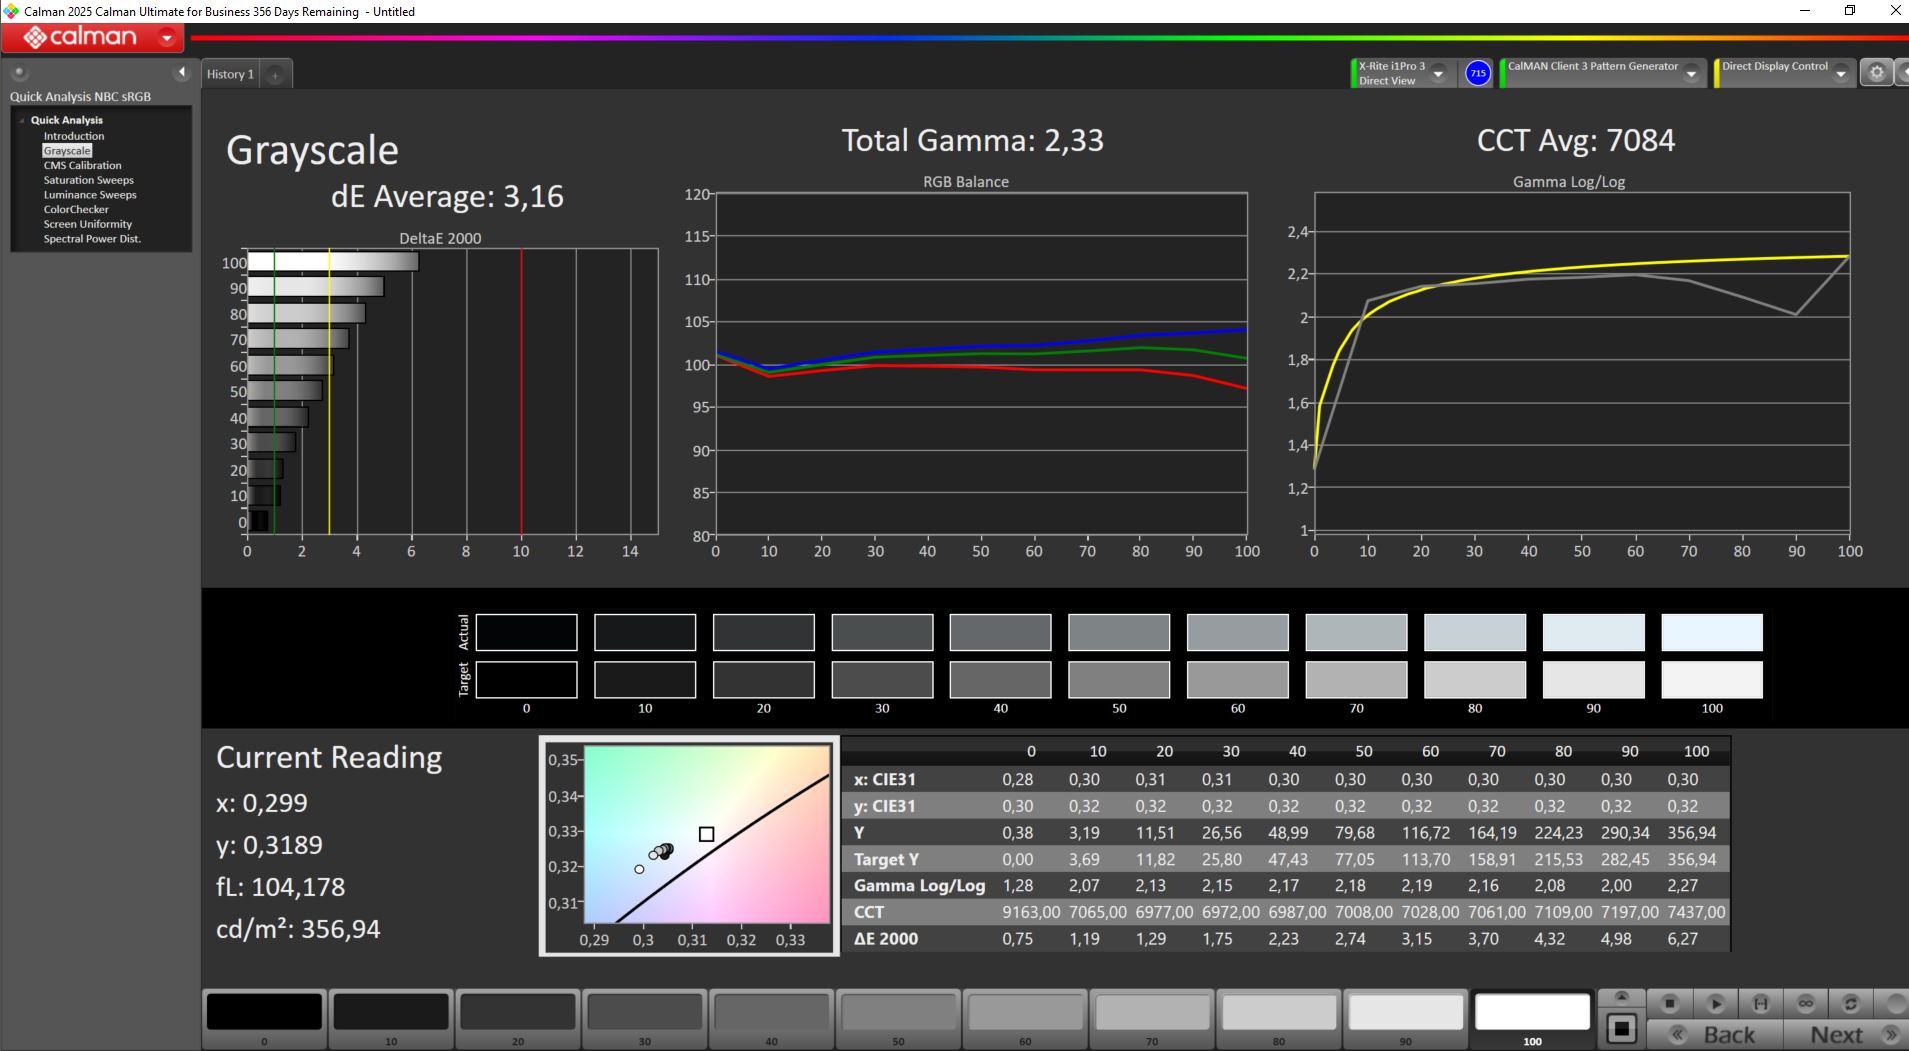
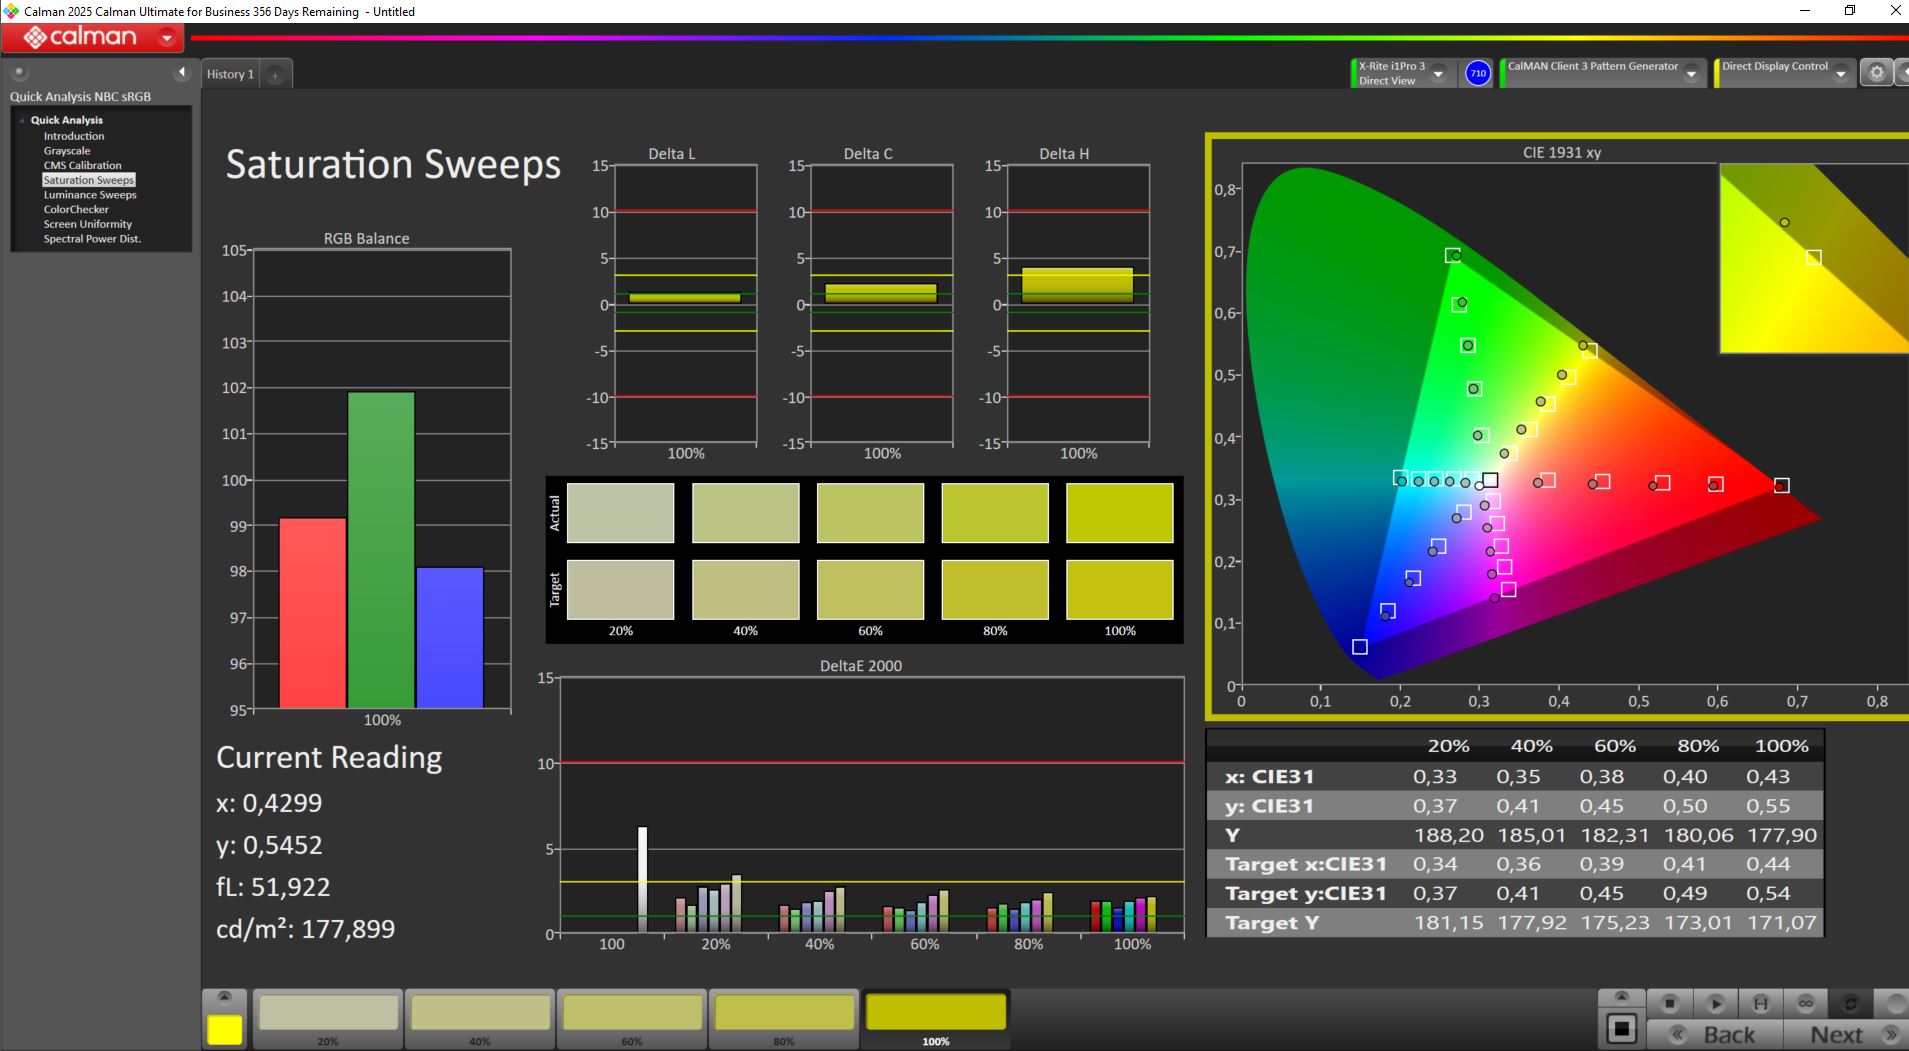
17.3 英寸哑光面板(240 Hz)的分辨率为 2,560 x 1,440,涵盖 sRGB 和 DCI-P3。
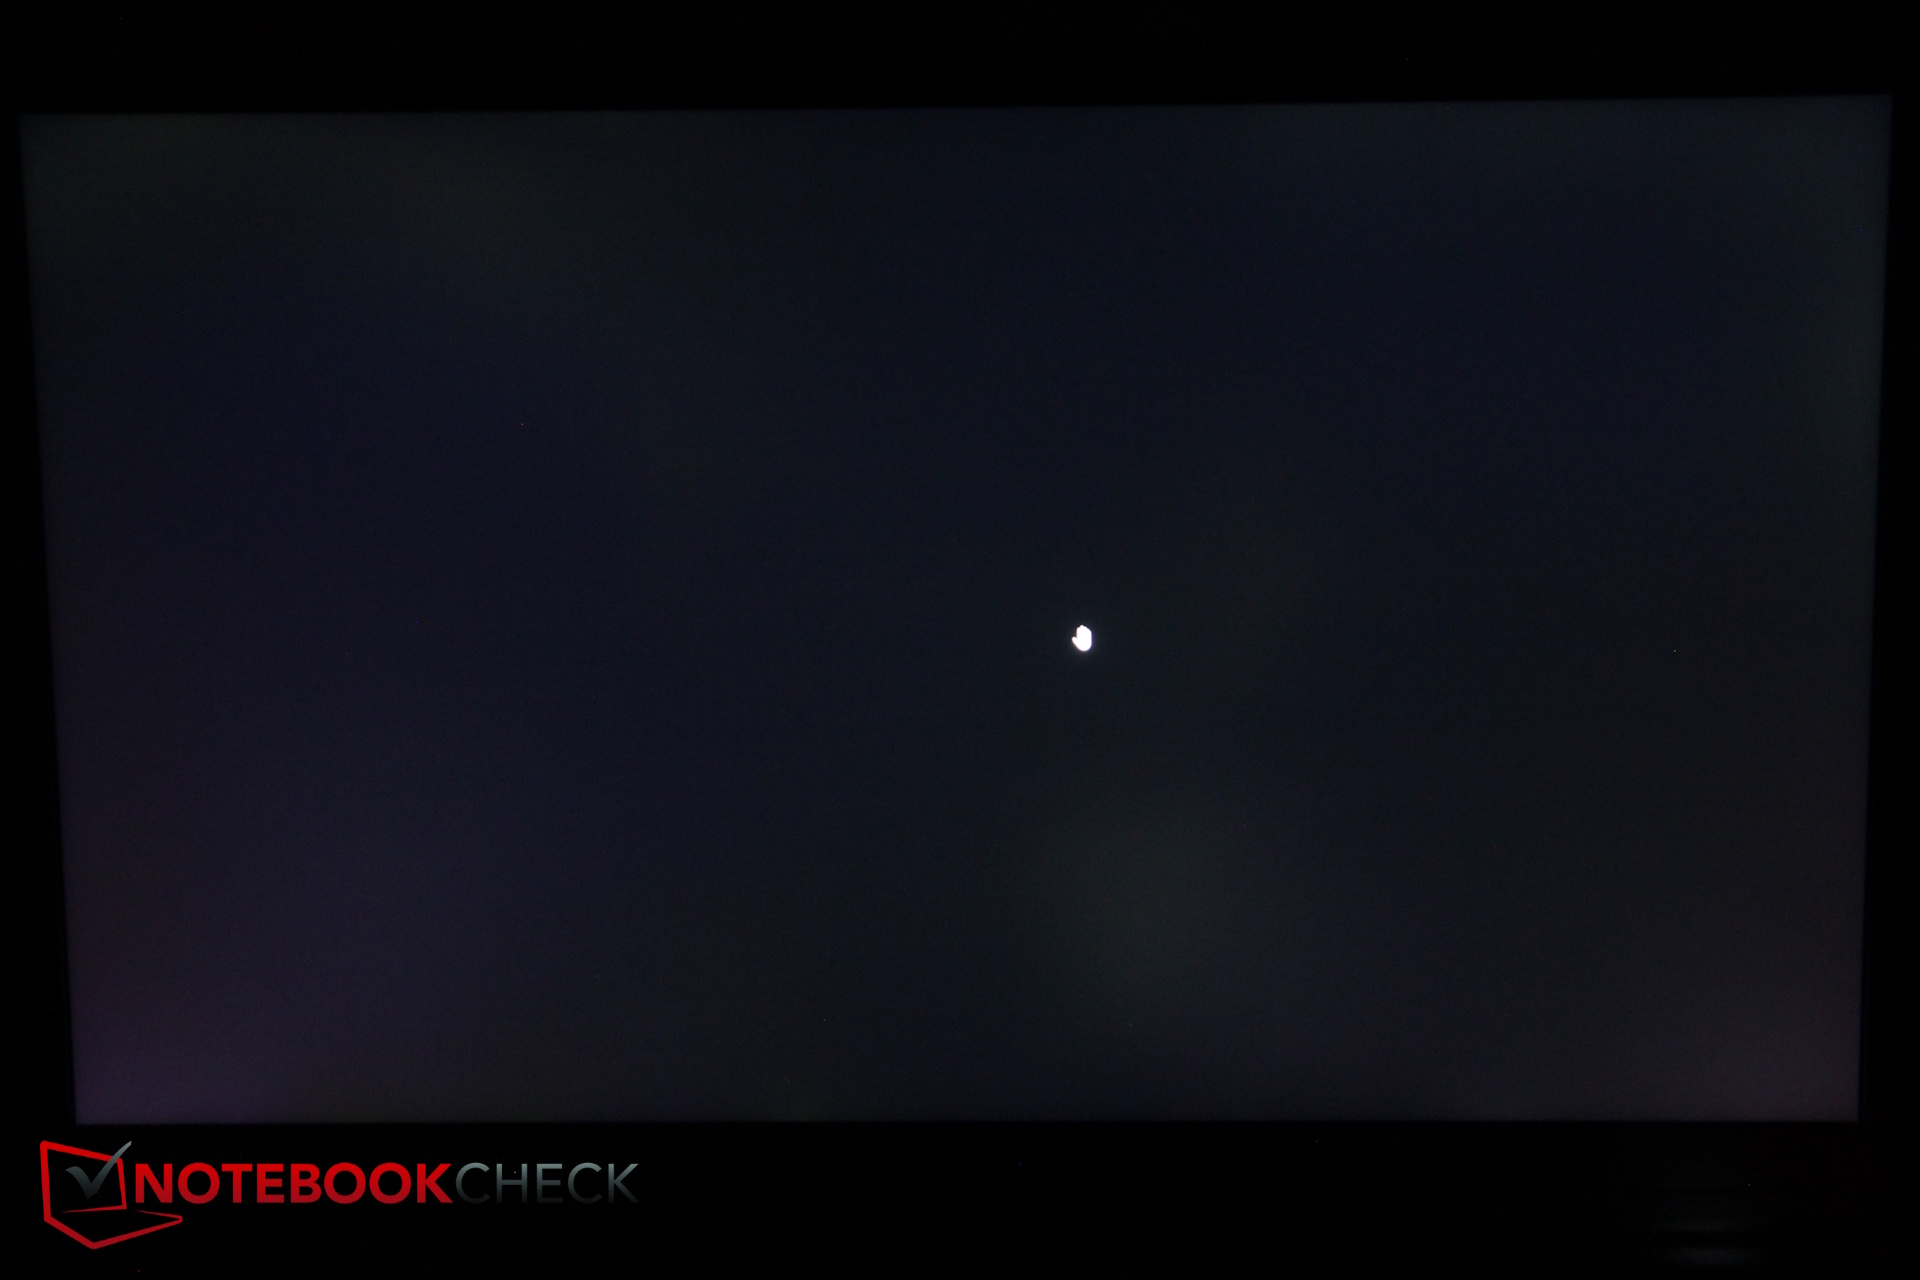
我们测得的平均亮度为 325 尼特。黑屏亮度有所提高,对比度略有降低。没有使用 PWM,响应时间足够快。

| |||||||||||||||||||||||||
Brightness Distribution: 85 %
Center on Battery: 355 cd/m²
Contrast: 890:1 (Black: 0.4 cd/m²)
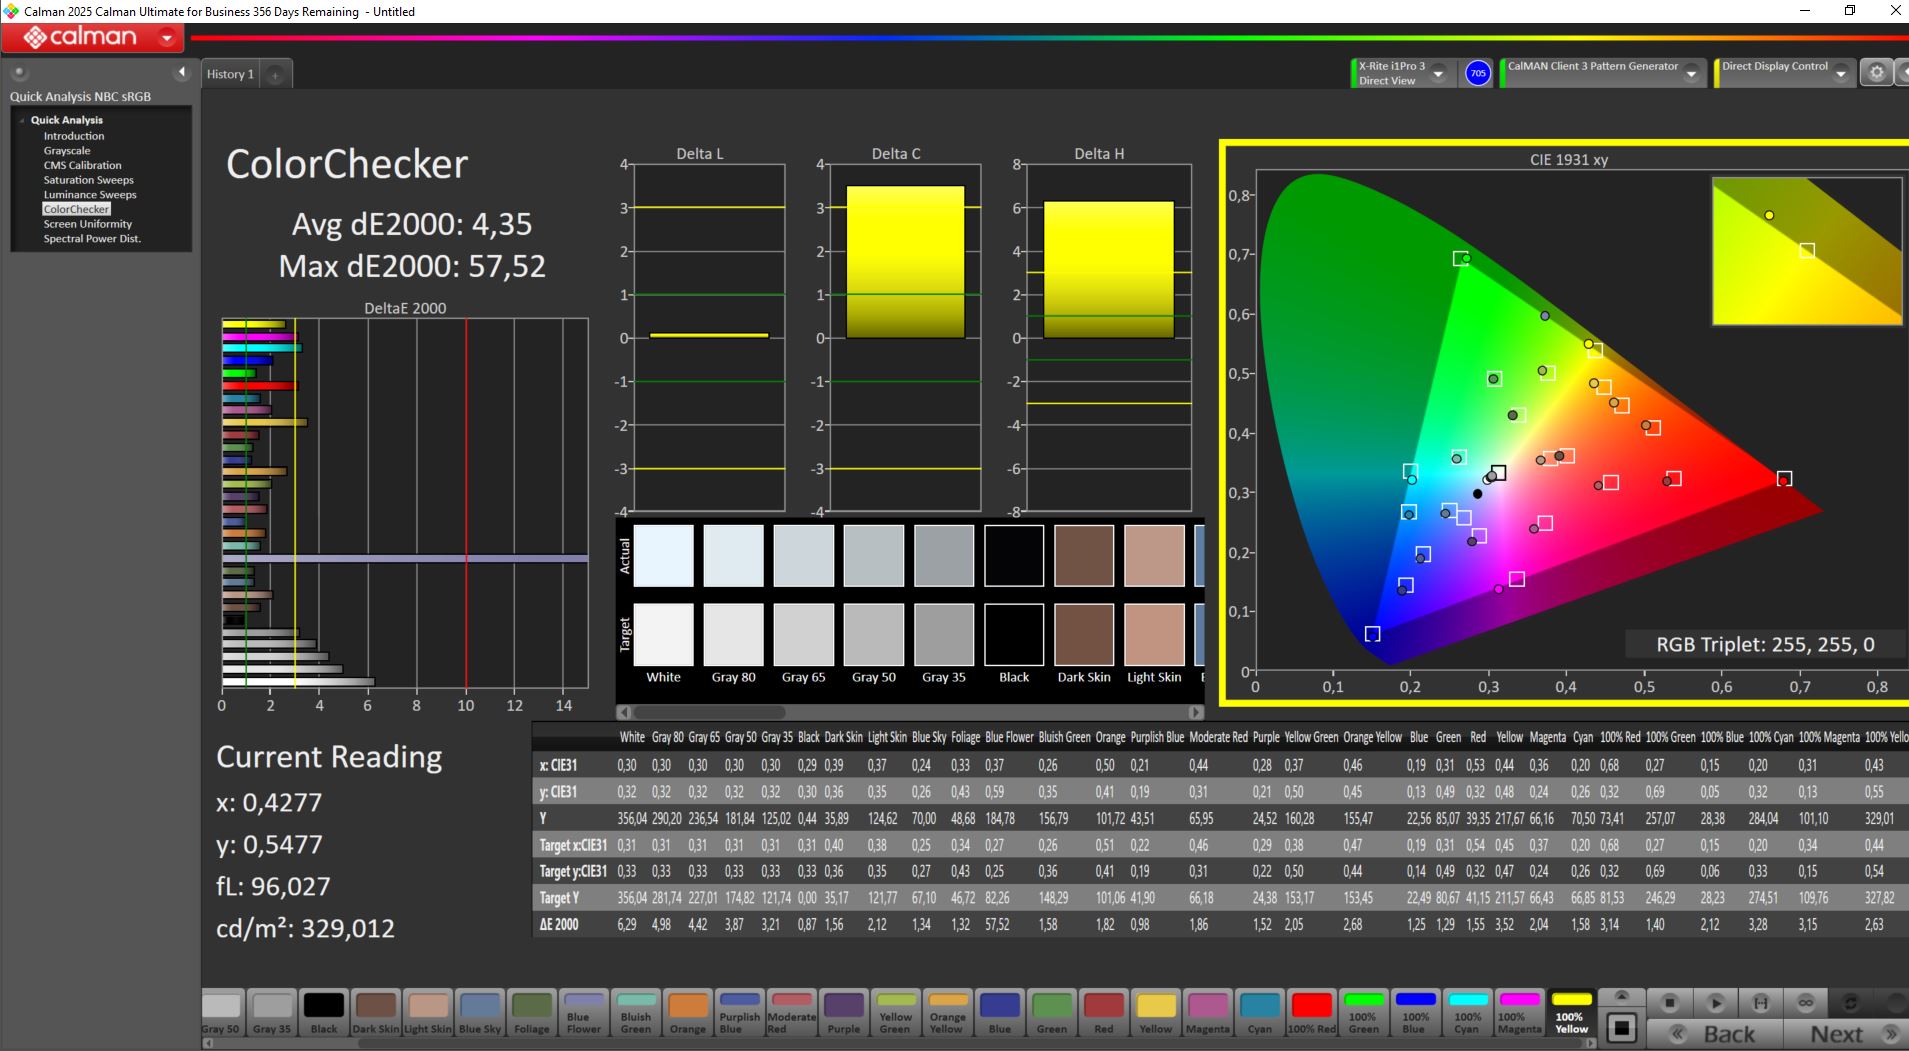
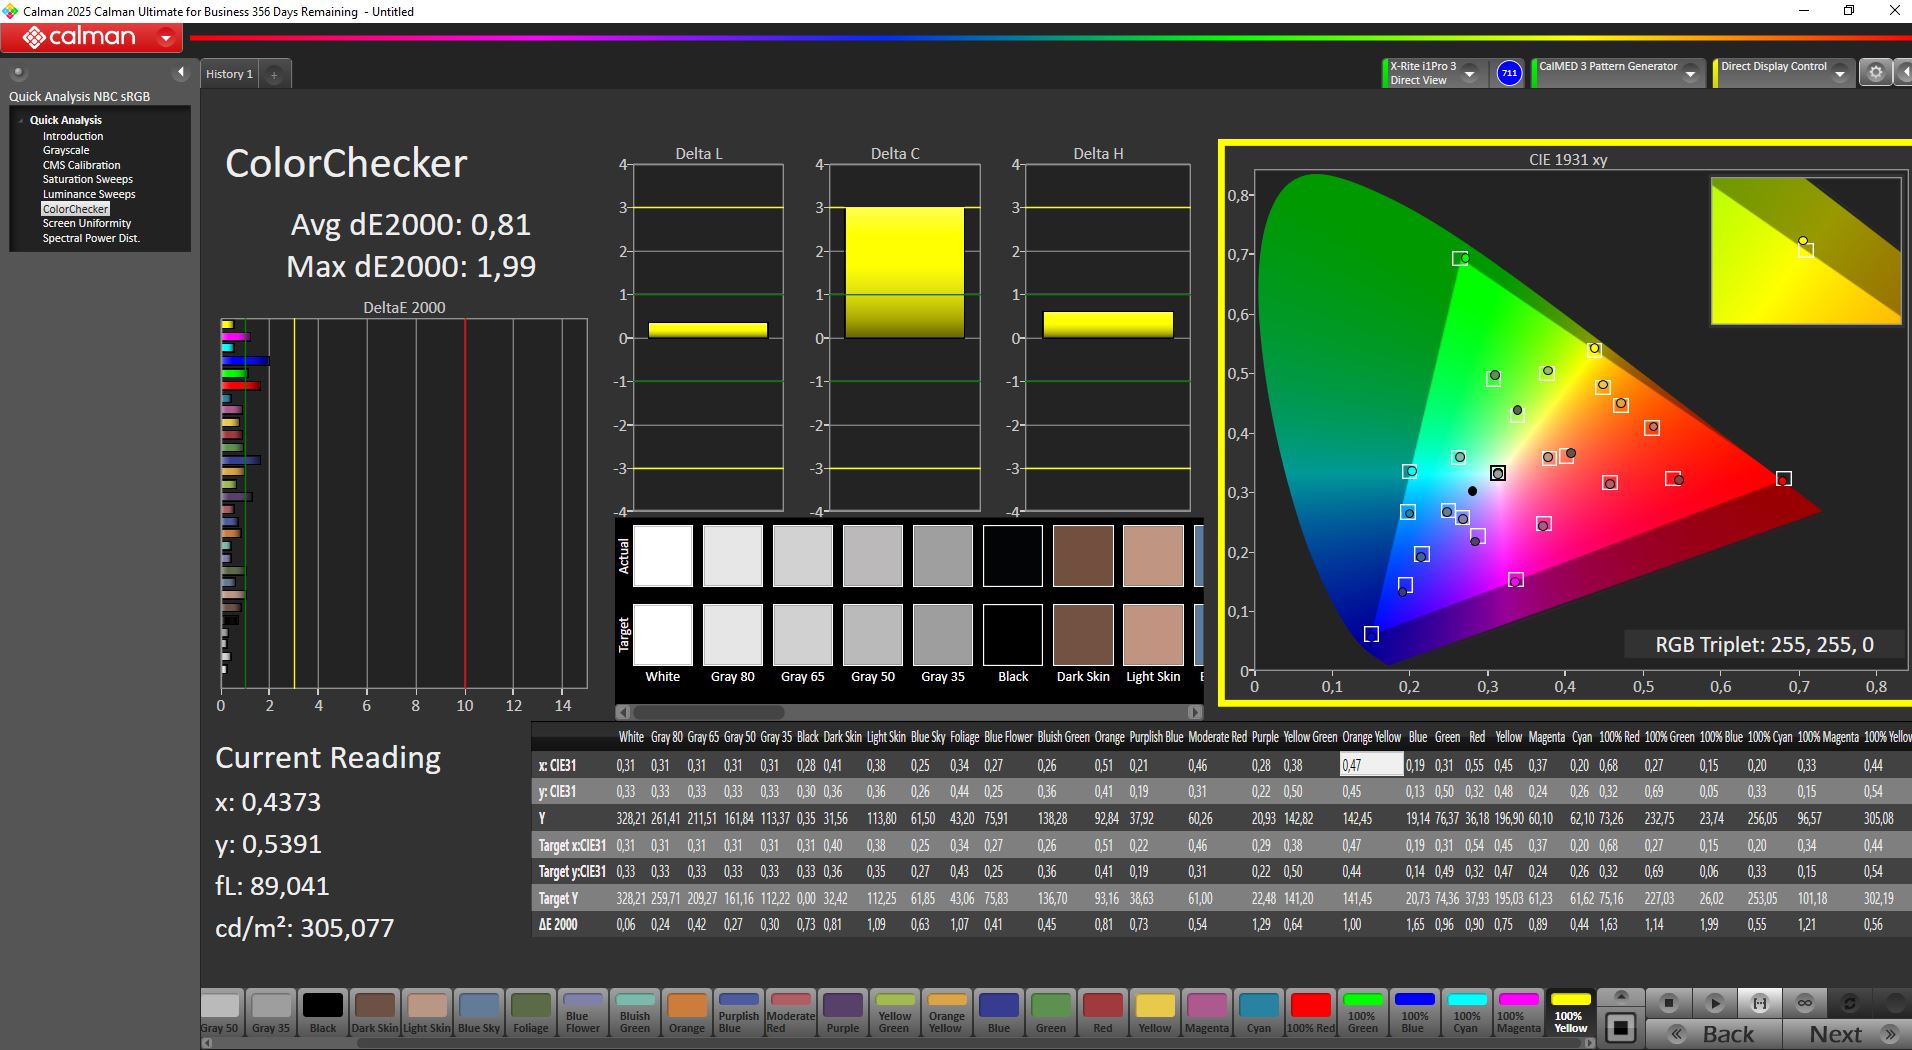
ΔE ColorChecker Calman: 4.35 | ∀{0.5-29.43 Ø4.73}
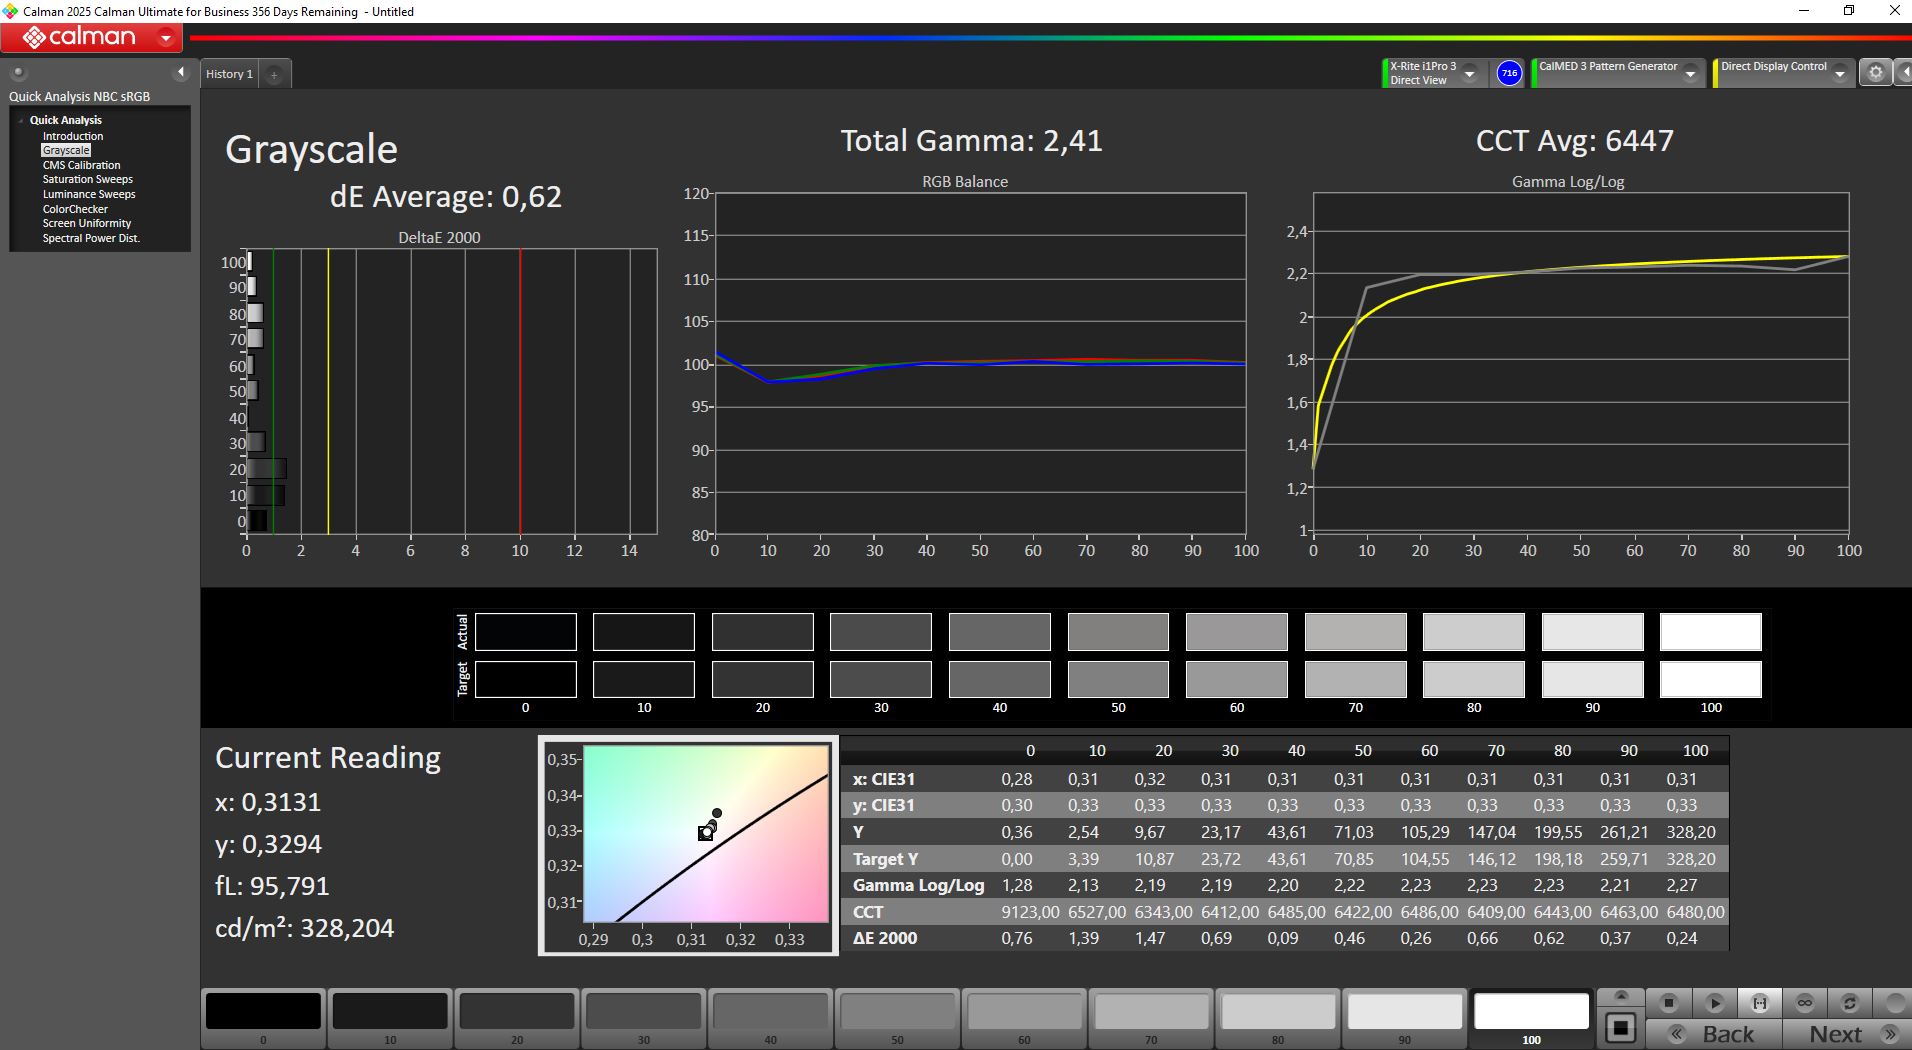
calibrated: 0.81
ΔE Greyscale Calman: 3.16 | ∀{0.09-98 Ø4.97}
85.1% AdobeRGB 1998 (Argyll 3D)
99.9% sRGB (Argyll 3D)
97.4% Display P3 (Argyll 3D)
Gamma: 2.33
CCT: 7084 K
| Schenker XMG Apex 17 M25 BOE09F9 (NE173QHM-NZ1), IPS, 2560x1440, 17.3", 240 Hz | HP Omen 17z-db100 BOE0B67, IPS, 2560x1440, 17.3", 240 Hz | Acer Nitro v 17 (ANV17-41-R4CJ) AUOB39E (B173HAN04.9), IPS, 1920x1080, 17.3", 144 Hz | MSI Crosshair A17 HX D8WGKG B170QAN01.2, IPS, 2560x1600, 17", 240 Hz | MSI Katana 17 HX B14WGK CSOT MNH301CA3-1, IPS, 2560x1440, 17.3", 240 Hz | |
|---|---|---|---|---|---|
| Display | -18% | -49% | 0% | 2% | |
| Display P3 Coverage (%) | 97.4 | 66.6 -32% | 42.2 -57% | 97.1 0% | 97.3 0% |
| sRGB Coverage (%) | 99.9 | 96.8 -3% | 60.9 -39% | 99.9 0% | 99.6 0% |
| AdobeRGB 1998 Coverage (%) | 85.1 | 68.6 -19% | 40.8 -52% | 84.9 0% | 89 5% |
| Response Times | -18% | -218% | 20% | 29% | |
| Response Time Grey 50% / Grey 80% * (ms) | 14 ? | 15.1 ? -8% | 42 ? -200% | 13.3 ? 5% | 5.2 ? 63% |
| Response Time Black / White * (ms) | 8.8 ? | 11.3 ? -28% | 29.6 ? -236% | 5.7 ? 35% | 9.2 ? -5% |
| PWM Frequency (Hz) | |||||
| PWM Amplitude * (%) | |||||
| Screen | -5% | -66% | 23% | 23% | |
| Brightness middle (cd/m²) | 356 | 373.2 5% | 258 -28% | 471 32% | 296 -17% |
| Brightness (cd/m²) | 325 | 341 5% | 238 -27% | 468 44% | 272 -16% |
| Brightness Distribution (%) | 85 | 84 -1% | 82 -4% | 96 13% | 87 2% |
| Black Level * (cd/m²) | 0.4 | 0.62 -55% | 0.19 52% | 0.4 -0% | 0.27 32% |
| Contrast (:1) | 890 | 602 -32% | 1358 53% | 1178 32% | 1096 23% |
| Colorchecker dE 2000 * | 4.35 | 2.53 42% | 7.4 -70% | 2.72 37% | 1.35 69% |
| Colorchecker dE 2000 max. * | 57.52 | 5.03 91% | 19.59 66% | 5.49 90% | 4.76 92% |
| Colorchecker dE 2000 calibrated * | 0.81 | 1.39 -72% | 5.88 -626% | 1.12 -38% | 0.78 4% |
| Greyscale dE 2000 * | 3.16 | 4.1 -30% | 3.54 -12% | 3.2 -1% | 2.7 15% |
| Gamma | 2.33 94% | 2.23 99% | 2.1 105% | 2.227 99% | 2.201 100% |
| CCT | 7084 92% | 6257 104% | 6836 95% | 6925 94% | 6770 96% |
| Total Average (Program / Settings) | -14% /
-10% | -111% /
-84% | 14% /
18% | 18% /
19% |
* ... smaller is better
开箱后,校准效果很差,DeltaE 偏差很大。经过手动重新校准后,我们将灰度和色彩偏差降至 1 以下,效果极佳。我们的校准 ICC 配置文件可在上面下载。
Display Response Times
| ↔ Response Time Black to White | ||
|---|---|---|
| 8.8 ms ... rise ↗ and fall ↘ combined | ↗ 3.4 ms rise | 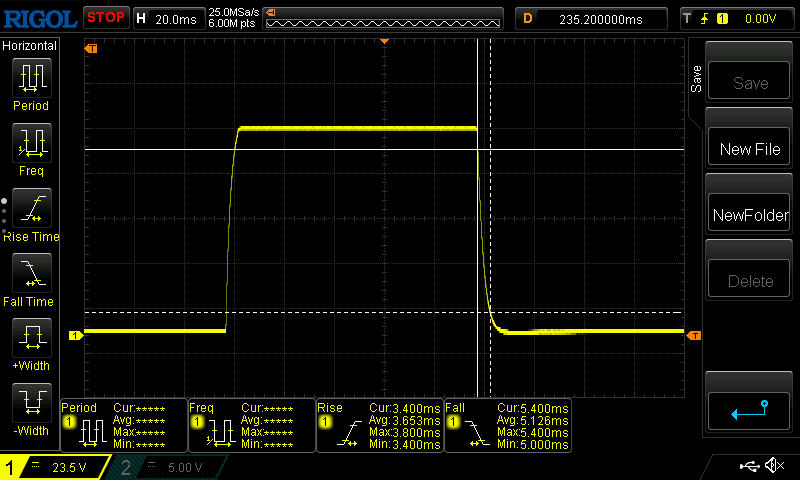 |
| ↘ 5.4 ms fall | ||
| The screen shows fast response rates in our tests and should be suited for gaming. In comparison, all tested devices range from 0.1 (minimum) to 240 (maximum) ms. » 24 % of all devices are better. This means that the measured response time is better than the average of all tested devices (19.9 ms). | ||
| ↔ Response Time 50% Grey to 80% Grey | ||
| 14 ms ... rise ↗ and fall ↘ combined | ↗ 6.6 ms rise | 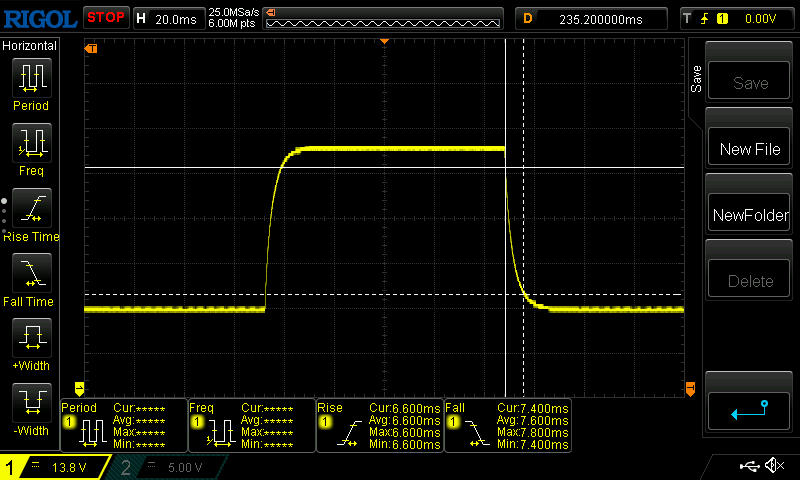 |
| ↘ 7.4 ms fall | ||
| The screen shows good response rates in our tests, but may be too slow for competitive gamers. In comparison, all tested devices range from 0.165 (minimum) to 636 (maximum) ms. » 28 % of all devices are better. This means that the measured response time is better than the average of all tested devices (31.1 ms). | ||
Screen Flickering / PWM (Pulse-Width Modulation)
| Screen flickering / PWM not detected |  | ||
In comparison: 52 % of all tested devices do not use PWM to dim the display. If PWM was detected, an average of 7794 (minimum: 5 - maximum: 343500) Hz was measured. | |||
由于采用了亚光表面处理,亮度超过 300 尼特,因此在室外阴暗环境下也能轻松看到内容。


性能 - Apex 17 到底有多快?
配备 AMD Ryzen 9 9955HX, RTX 5060和 32 GB 内存,Apex 非常适合全高清游戏。其低调的设计和校准良好的 QHD 显示屏也可能吸引内容创作者。
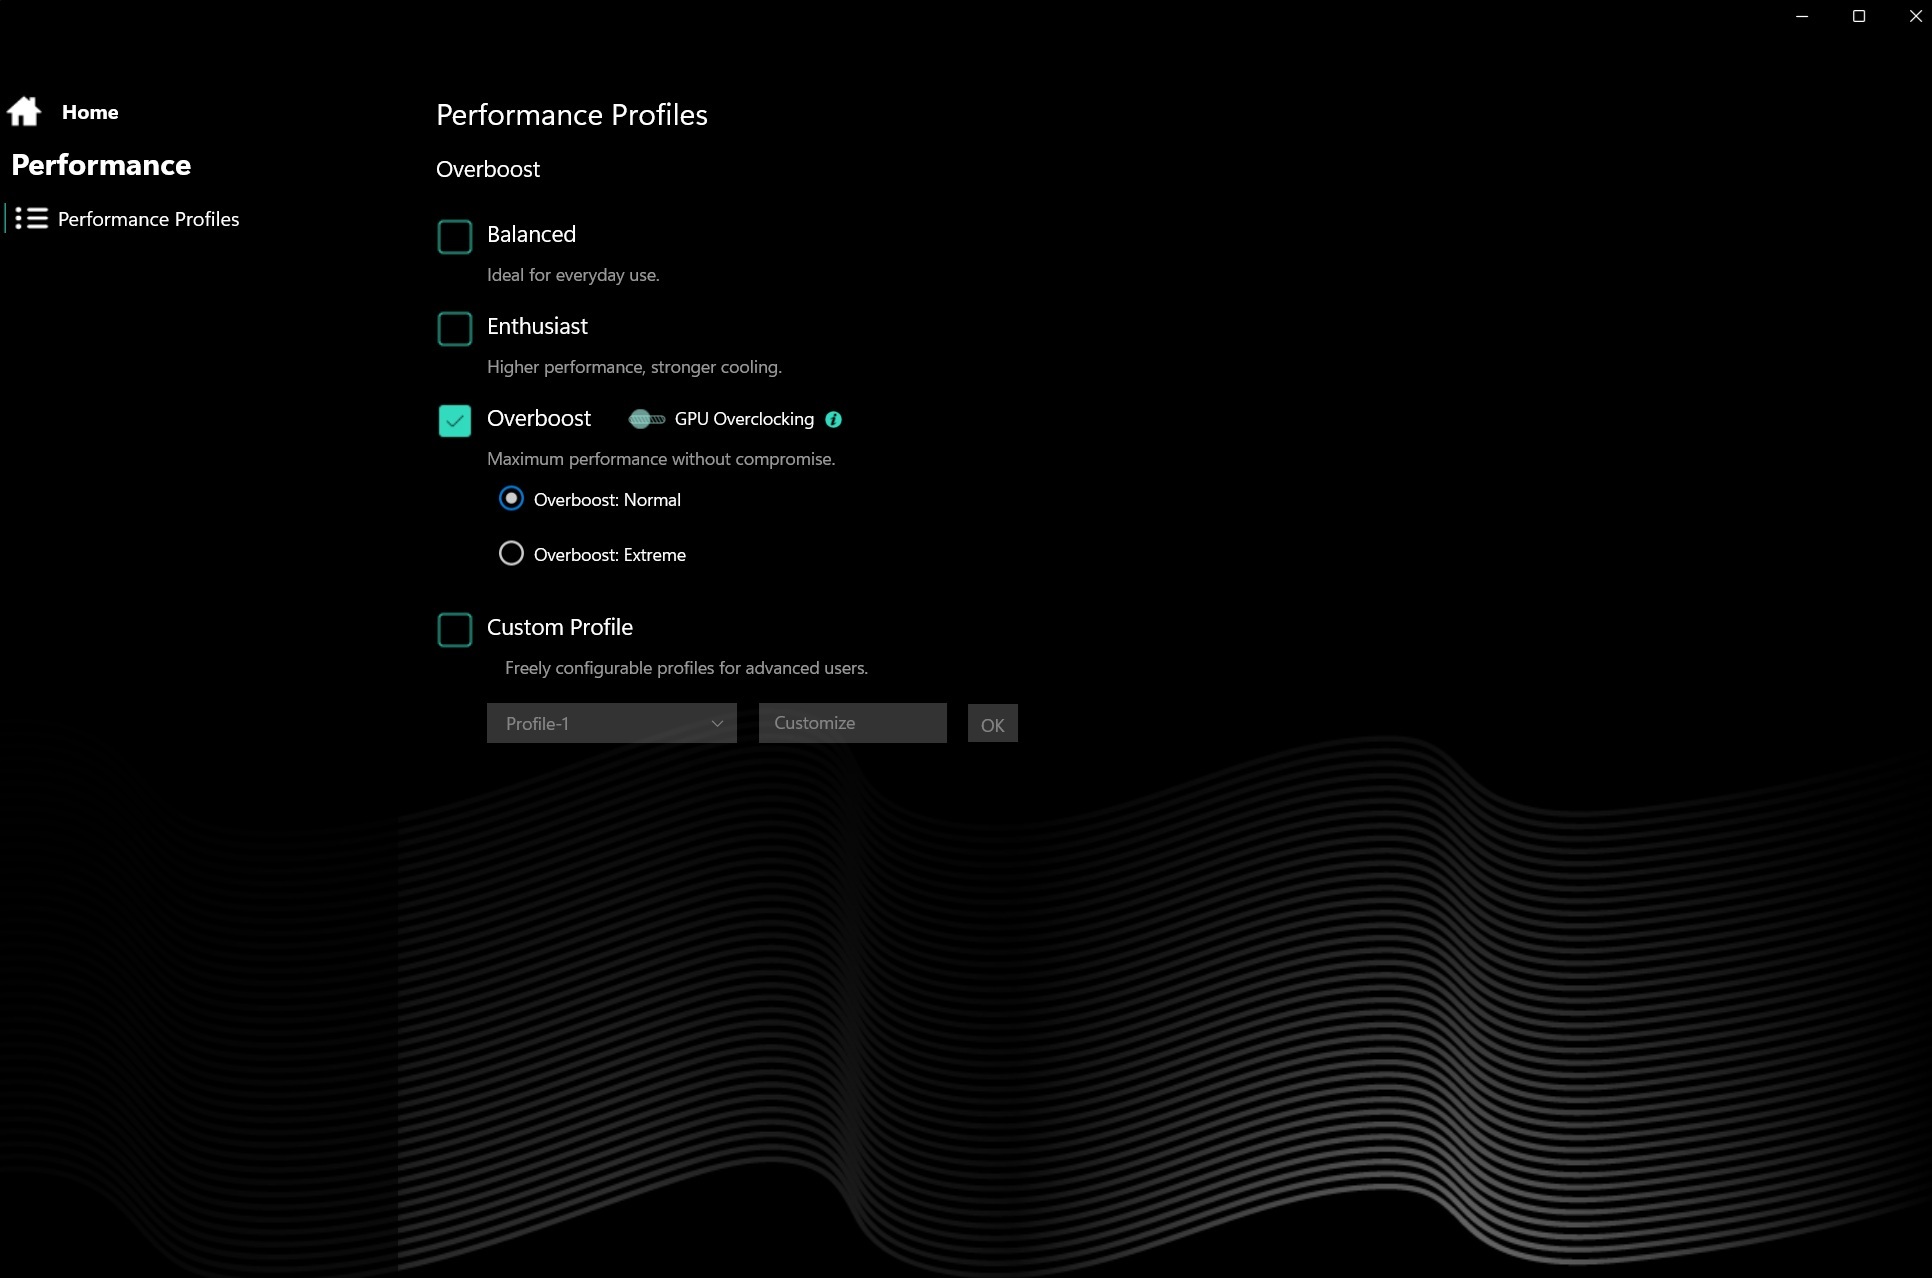
测试条件
为了进行基准测试,我们在控制中心使用了性能模式(性能、娱乐、静音)。
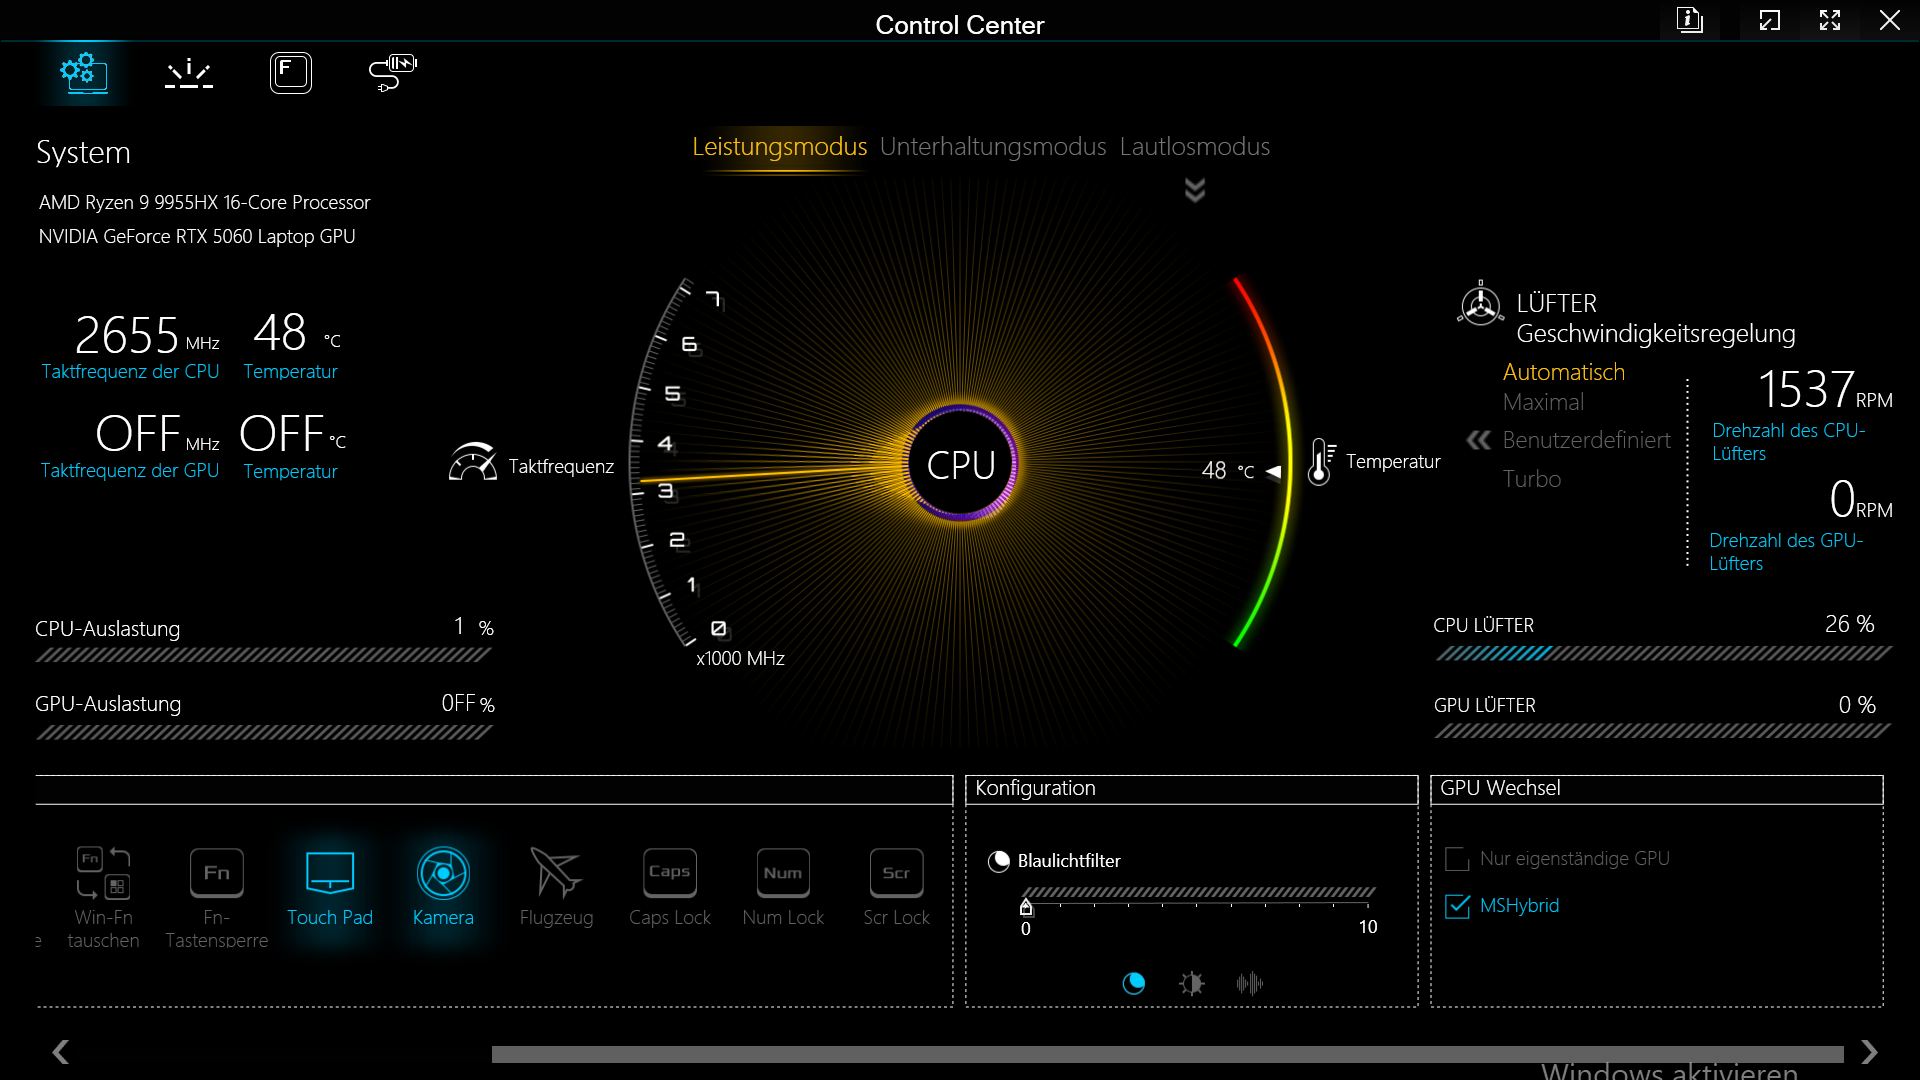
| 性能模式 | Cinebench R15 Multi | Fire Strike 图形 | 赛博朋克 2077 FHD Ultra (fps) | 风扇噪音 赛博朋克 (dB) | 功耗 赛博朋克 (W) |
|---|---|---|---|---|---|
| 性能 | 5739 | 33011 | 84.4 | 55.05 | 220 |
| 娱乐 | 4921 | 29792 | 74.4 | 40.5 - 43.5 | 170 |
| 安静 | 1227 | 23364 | 34.9 | 29 | 100 |
| 电池(性能) | 2759 | 2578 | 30 | 23.5 - 33.5 |
处理器 - 在 Cinebench 循环中名列前茅
......(英文 AMD Ryzen 9 9955HX配备 16 个 Zen 5 内核,在 Cinebench 循环中提供了极其稳定的性能,在同类产品中获得了最高的 CPU 分数。
在更安静的娱乐模式下,Cinebench R15 的性能仍可媲美 Legion 7.在电池供电模式下,CPU 性能下降超过 50%,但仍与插电模式下的 卡塔纳 17或 欧曼 17z.
Cinebench R15 多回路运行
Cinebench R23: Multi Core | Single Core
Cinebench R20: CPU (Multi Core) | CPU (Single Core)
Cinebench R15: CPU Multi 64Bit | CPU Single 64Bit
Blender: v2.79 BMW27 CPU
7-Zip 18.03: 7z b 4 | 7z b 4 -mmt1
Geekbench 6.7: Multi-Core | Single-Core
Geekbench 5.5: Multi-Core | Single-Core
HWBOT x265 Benchmark v2.2: 4k Preset
LibreOffice : 20 Documents To PDF
R Benchmark 2.5: Overall mean
| CPU Performance rating | |
| Average AMD Ryzen 9 9955HX | |
| Schenker XMG Apex 17 M25 | |
| Lenovo Legion 7 16IAX10 | |
| MSI Crosshair A17 HX D8WGKG | |
| Average of class Gaming | |
| MSI Katana 17 HX B14WGK | |
| HP Omen 17z-db100 | |
| Acer Nitro v 17 (ANV17-41-R4CJ) | |
| Cinebench R23 / Multi Core | |
| Average AMD Ryzen 9 9955HX (35960 - 39690, n=9) | |
| Schenker XMG Apex 17 M25 | |
| Lenovo Legion 7 16IAX10 | |
| MSI Crosshair A17 HX D8WGKG | |
| Average of class Gaming (10488 - 40970, n=112, last 2 years) | |
| HP Omen 17z-db100 | |
| MSI Katana 17 HX B14WGK | |
| Acer Nitro v 17 (ANV17-41-R4CJ) | |
| Cinebench R23 / Single Core | |
| Schenker XMG Apex 17 M25 | |
| Lenovo Legion 7 16IAX10 | |
| Average AMD Ryzen 9 9955HX (1828 - 2183, n=9) | |
| Average of class Gaming (1166 - 2356, n=112, last 2 years) | |
| MSI Katana 17 HX B14WGK | |
| HP Omen 17z-db100 | |
| MSI Crosshair A17 HX D8WGKG | |
| Acer Nitro v 17 (ANV17-41-R4CJ) | |
| Cinebench R20 / CPU (Multi Core) | |
| Average AMD Ryzen 9 9955HX (13963 - 15524, n=9) | |
| Schenker XMG Apex 17 M25 | |
| Lenovo Legion 7 16IAX10 | |
| MSI Crosshair A17 HX D8WGKG | |
| Average of class Gaming (4029 - 16108, n=111, last 2 years) | |
| HP Omen 17z-db100 | |
| Acer Nitro v 17 (ANV17-41-R4CJ) | |
| MSI Katana 17 HX B14WGK | |
| Cinebench R20 / CPU (Single Core) | |
| Schenker XMG Apex 17 M25 | |
| Average AMD Ryzen 9 9955HX (819 - 856, n=9) | |
| Lenovo Legion 7 16IAX10 | |
| Average of class Gaming (442 - 895, n=111, last 2 years) | |
| HP Omen 17z-db100 | |
| MSI Katana 17 HX B14WGK | |
| MSI Crosshair A17 HX D8WGKG | |
| Acer Nitro v 17 (ANV17-41-R4CJ) | |
| Cinebench R15 / CPU Multi 64Bit | |
| Average AMD Ryzen 9 9955HX (5624 - 6103, n=9) | |
| Schenker XMG Apex 17 M25 | |
| MSI Crosshair A17 HX D8WGKG | |
| Lenovo Legion 7 16IAX10 | |
| Average of class Gaming (1578 - 6271, n=111, last 2 years) | |
| MSI Katana 17 HX B14WGK | |
| HP Omen 17z-db100 | |
| Acer Nitro v 17 (ANV17-41-R4CJ) | |
| Cinebench R15 / CPU Single 64Bit | |
| Schenker XMG Apex 17 M25 | |
| Average AMD Ryzen 9 9955HX (320 - 338, n=9) | |
| Lenovo Legion 7 16IAX10 | |
| HP Omen 17z-db100 | |
| Average of class Gaming (188.8 - 343, n=111, last 2 years) | |
| MSI Crosshair A17 HX D8WGKG | |
| MSI Katana 17 HX B14WGK | |
| Acer Nitro v 17 (ANV17-41-R4CJ) | |
| Blender / v2.79 BMW27 CPU | |
| MSI Katana 17 HX B14WGK | |
| Acer Nitro v 17 (ANV17-41-R4CJ) | |
| HP Omen 17z-db100 | |
| Average of class Gaming (80 - 330, n=109, last 2 years) | |
| Lenovo Legion 7 16IAX10 | |
| MSI Crosshair A17 HX D8WGKG | |
| Schenker XMG Apex 17 M25 | |
| Average AMD Ryzen 9 9955HX (80 - 91, n=9) | |
| 7-Zip 18.03 / 7z b 4 | |
| Average AMD Ryzen 9 9955HX (132435 - 144064, n=9) | |
| MSI Crosshair A17 HX D8WGKG | |
| Schenker XMG Apex 17 M25 | |
| Lenovo Legion 7 16IAX10 | |
| Average of class Gaming (33491 - 148086, n=110, last 2 years) | |
| MSI Katana 17 HX B14WGK | |
| Acer Nitro v 17 (ANV17-41-R4CJ) | |
| HP Omen 17z-db100 | |
| 7-Zip 18.03 / 7z b 4 -mmt1 | |
| Schenker XMG Apex 17 M25 | |
| MSI Crosshair A17 HX D8WGKG | |
| Average AMD Ryzen 9 9955HX (7061 - 7462, n=9) | |
| Acer Nitro v 17 (ANV17-41-R4CJ) | |
| Lenovo Legion 7 16IAX10 | |
| Average of class Gaming (4199 - 7436, n=110, last 2 years) | |
| MSI Katana 17 HX B14WGK | |
| HP Omen 17z-db100 | |
| Geekbench 6.7 / Multi-Core | |
| Schenker XMG Apex 17 M25 | |
| Average AMD Ryzen 9 9955HX (16313 - 19725, n=9) | |
| Lenovo Legion 7 16IAX10 | |
| MSI Crosshair A17 HX D8WGKG | |
| Average of class Gaming (6625 - 22104, n=111, last 2 years) | |
| MSI Katana 17 HX B14WGK | |
| HP Omen 17z-db100 | |
| Acer Nitro v 17 (ANV17-41-R4CJ) | |
| Geekbench 6.7 / Single-Core | |
| Schenker XMG Apex 17 M25 | |
| Average AMD Ryzen 9 9955HX (3156 - 3259, n=9) | |
| Lenovo Legion 7 16IAX10 | |
| MSI Crosshair A17 HX D8WGKG | |
| Average of class Gaming (1490 - 3259, n=111, last 2 years) | |
| MSI Katana 17 HX B14WGK | |
| Acer Nitro v 17 (ANV17-41-R4CJ) | |
| HP Omen 17z-db100 | |
| Geekbench 5.5 / Multi-Core | |
| Average AMD Ryzen 9 9955HX (20576 - 22716, n=9) | |
| Schenker XMG Apex 17 M25 | |
| MSI Crosshair A17 HX D8WGKG | |
| Lenovo Legion 7 16IAX10 | |
| Average of class Gaming (6460 - 27010, n=110, last 2 years) | |
| MSI Katana 17 HX B14WGK | |
| HP Omen 17z-db100 | |
| Acer Nitro v 17 (ANV17-41-R4CJ) | |
| Geekbench 5.5 / Single-Core | |
| Schenker XMG Apex 17 M25 | |
| Average AMD Ryzen 9 9955HX (2307 - 2474, n=9) | |
| Lenovo Legion 7 16IAX10 | |
| Average of class Gaming (986 - 2474, n=110, last 2 years) | |
| MSI Katana 17 HX B14WGK | |
| MSI Crosshair A17 HX D8WGKG | |
| Acer Nitro v 17 (ANV17-41-R4CJ) | |
| HP Omen 17z-db100 | |
| HWBOT x265 Benchmark v2.2 / 4k Preset | |
| Average AMD Ryzen 9 9955HX (38.9 - 43, n=9) | |
| Schenker XMG Apex 17 M25 | |
| MSI Crosshair A17 HX D8WGKG | |
| Lenovo Legion 7 16IAX10 | |
| Average of class Gaming (11.5 - 44.3, n=110, last 2 years) | |
| HP Omen 17z-db100 | |
| Acer Nitro v 17 (ANV17-41-R4CJ) | |
| MSI Katana 17 HX B14WGK | |
| LibreOffice / 20 Documents To PDF | |
| Acer Nitro v 17 (ANV17-41-R4CJ) | |
| MSI Katana 17 HX B14WGK | |
| Schenker XMG Apex 17 M25 | |
| HP Omen 17z-db100 | |
| Average of class Gaming (19 - 88.8, n=110, last 2 years) | |
| Average AMD Ryzen 9 9955HX (42.2 - 52.4, n=9) | |
| MSI Crosshair A17 HX D8WGKG | |
| Lenovo Legion 7 16IAX10 | |
| R Benchmark 2.5 / Overall mean | |
| Acer Nitro v 17 (ANV17-41-R4CJ) | |
| MSI Crosshair A17 HX D8WGKG | |
| Average of class Gaming (0.3439 - 0.759, n=111, last 2 years) | |
| Lenovo Legion 7 16IAX10 | |
| MSI Katana 17 HX B14WGK | |
| HP Omen 17z-db100 | |
| Schenker XMG Apex 17 M25 | |
| Average AMD Ryzen 9 9955HX (0.3439 - 0.3737, n=9) | |
* ... smaller is better
AIDA64: FP32 Ray-Trace | FPU Julia | CPU SHA3 | CPU Queen | FPU SinJulia | FPU Mandel | CPU AES | CPU ZLib | FP64 Ray-Trace | CPU PhotoWorxx
| Performance rating | |
| Average AMD Ryzen 9 9955HX | |
| Schenker XMG Apex 17 M25 | |
| MSI Crosshair A17 HX D8WGKG | |
| Lenovo Legion 7 16IAX10 | |
| Average of class Gaming | |
| HP Omen 17z-db100 | |
| Acer Nitro v 17 (ANV17-41-R4CJ) | |
| MSI Katana 17 HX B14WGK | |
| AIDA64 / FP32 Ray-Trace | |
| Average AMD Ryzen 9 9955HX (66596 - 85542, n=9) | |
| Schenker XMG Apex 17 M25 | |
| MSI Crosshair A17 HX D8WGKG | |
| Average of class Gaming (10227 - 85542, n=109, last 2 years) | |
| Lenovo Legion 7 16IAX10 | |
| HP Omen 17z-db100 | |
| Acer Nitro v 17 (ANV17-41-R4CJ) | |
| MSI Katana 17 HX B14WGK | |
| AIDA64 / FPU Julia | |
| Average AMD Ryzen 9 9955HX (191535 - 232031, n=9) | |
| Schenker XMG Apex 17 M25 | |
| MSI Crosshair A17 HX D8WGKG | |
| Lenovo Legion 7 16IAX10 | |
| Average of class Gaming (51376 - 238426, n=109, last 2 years) | |
| Acer Nitro v 17 (ANV17-41-R4CJ) | |
| HP Omen 17z-db100 | |
| MSI Katana 17 HX B14WGK | |
| AIDA64 / CPU SHA3 | |
| Average AMD Ryzen 9 9955HX (8489 - 9780, n=9) | |
| MSI Crosshair A17 HX D8WGKG | |
| Schenker XMG Apex 17 M25 | |
| Lenovo Legion 7 16IAX10 | |
| Average of class Gaming (2180 - 9817, n=109, last 2 years) | |
| Acer Nitro v 17 (ANV17-41-R4CJ) | |
| HP Omen 17z-db100 | |
| MSI Katana 17 HX B14WGK | |
| AIDA64 / CPU Queen | |
| MSI Crosshair A17 HX D8WGKG | |
| Average AMD Ryzen 9 9955HX (153027 - 164154, n=9) | |
| Schenker XMG Apex 17 M25 | |
| Lenovo Legion 7 16IAX10 | |
| Acer Nitro v 17 (ANV17-41-R4CJ) | |
| Average of class Gaming (49785 - 173351, n=100, last 2 years) | |
| MSI Katana 17 HX B14WGK | |
| HP Omen 17z-db100 | |
| AIDA64 / FPU SinJulia | |
| Average AMD Ryzen 9 9955HX (29876 - 32647, n=9) | |
| Schenker XMG Apex 17 M25 | |
| MSI Crosshair A17 HX D8WGKG | |
| Acer Nitro v 17 (ANV17-41-R4CJ) | |
| Average of class Gaming (4424 - 33636, n=109, last 2 years) | |
| HP Omen 17z-db100 | |
| Lenovo Legion 7 16IAX10 | |
| MSI Katana 17 HX B14WGK | |
| AIDA64 / FPU Mandel | |
| Average AMD Ryzen 9 9955HX (101131 - 128721, n=9) | |
| MSI Crosshair A17 HX D8WGKG | |
| Schenker XMG Apex 17 M25 | |
| Lenovo Legion 7 16IAX10 | |
| Average of class Gaming (25115 - 128721, n=109, last 2 years) | |
| HP Omen 17z-db100 | |
| Acer Nitro v 17 (ANV17-41-R4CJ) | |
| MSI Katana 17 HX B14WGK | |
| AIDA64 / CPU AES | |
| Average AMD Ryzen 9 9955HX (146979 - 218385, n=9) | |
| MSI Crosshair A17 HX D8WGKG | |
| Schenker XMG Apex 17 M25 | |
| Lenovo Legion 7 16IAX10 | |
| Average of class Gaming (39258 - 247074, n=109, last 2 years) | |
| HP Omen 17z-db100 | |
| Acer Nitro v 17 (ANV17-41-R4CJ) | |
| MSI Katana 17 HX B14WGK | |
| AIDA64 / CPU ZLib | |
| Average AMD Ryzen 9 9955HX (2186 - 2531, n=9) | |
| Schenker XMG Apex 17 M25 | |
| MSI Crosshair A17 HX D8WGKG | |
| Lenovo Legion 7 16IAX10 | |
| Average of class Gaming (574 - 2531, n=109, last 2 years) | |
| HP Omen 17z-db100 | |
| Acer Nitro v 17 (ANV17-41-R4CJ) | |
| MSI Katana 17 HX B14WGK | |
| AIDA64 / FP64 Ray-Trace | |
| Average AMD Ryzen 9 9955HX (35252 - 45446, n=9) | |
| Schenker XMG Apex 17 M25 | |
| MSI Crosshair A17 HX D8WGKG | |
| Average of class Gaming (5509 - 45446, n=109, last 2 years) | |
| Lenovo Legion 7 16IAX10 | |
| HP Omen 17z-db100 | |
| Acer Nitro v 17 (ANV17-41-R4CJ) | |
| MSI Katana 17 HX B14WGK | |
| AIDA64 / CPU PhotoWorxx | |
| Lenovo Legion 7 16IAX10 | |
| HP Omen 17z-db100 | |
| Average of class Gaming (12271 - 89891, n=109, last 2 years) | |
| Schenker XMG Apex 17 M25 | |
| Average AMD Ryzen 9 9955HX (35974 - 42495, n=9) | |
| MSI Crosshair A17 HX D8WGKG | |
| MSI Katana 17 HX B14WGK | |
| Acer Nitro v 17 (ANV17-41-R4CJ) | |
系统性能
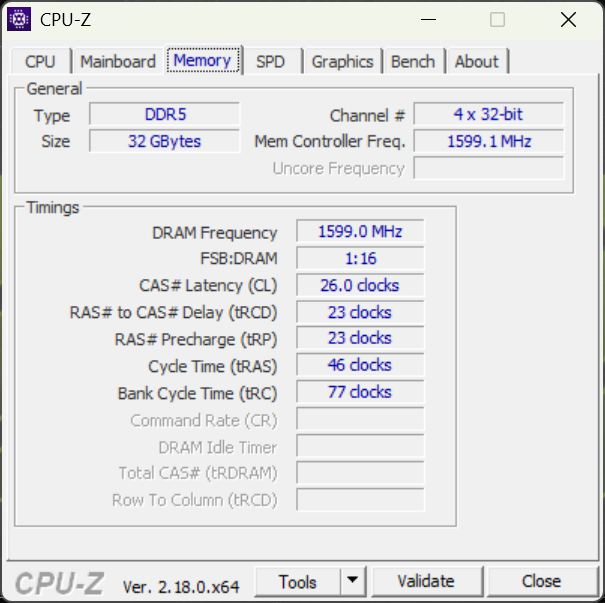
在 PCMark 10 和 CrossMark 中,Apex 都领先于对比组。主观感觉上,系统反应非常灵敏。AIDA 内存基准测试结果一般。
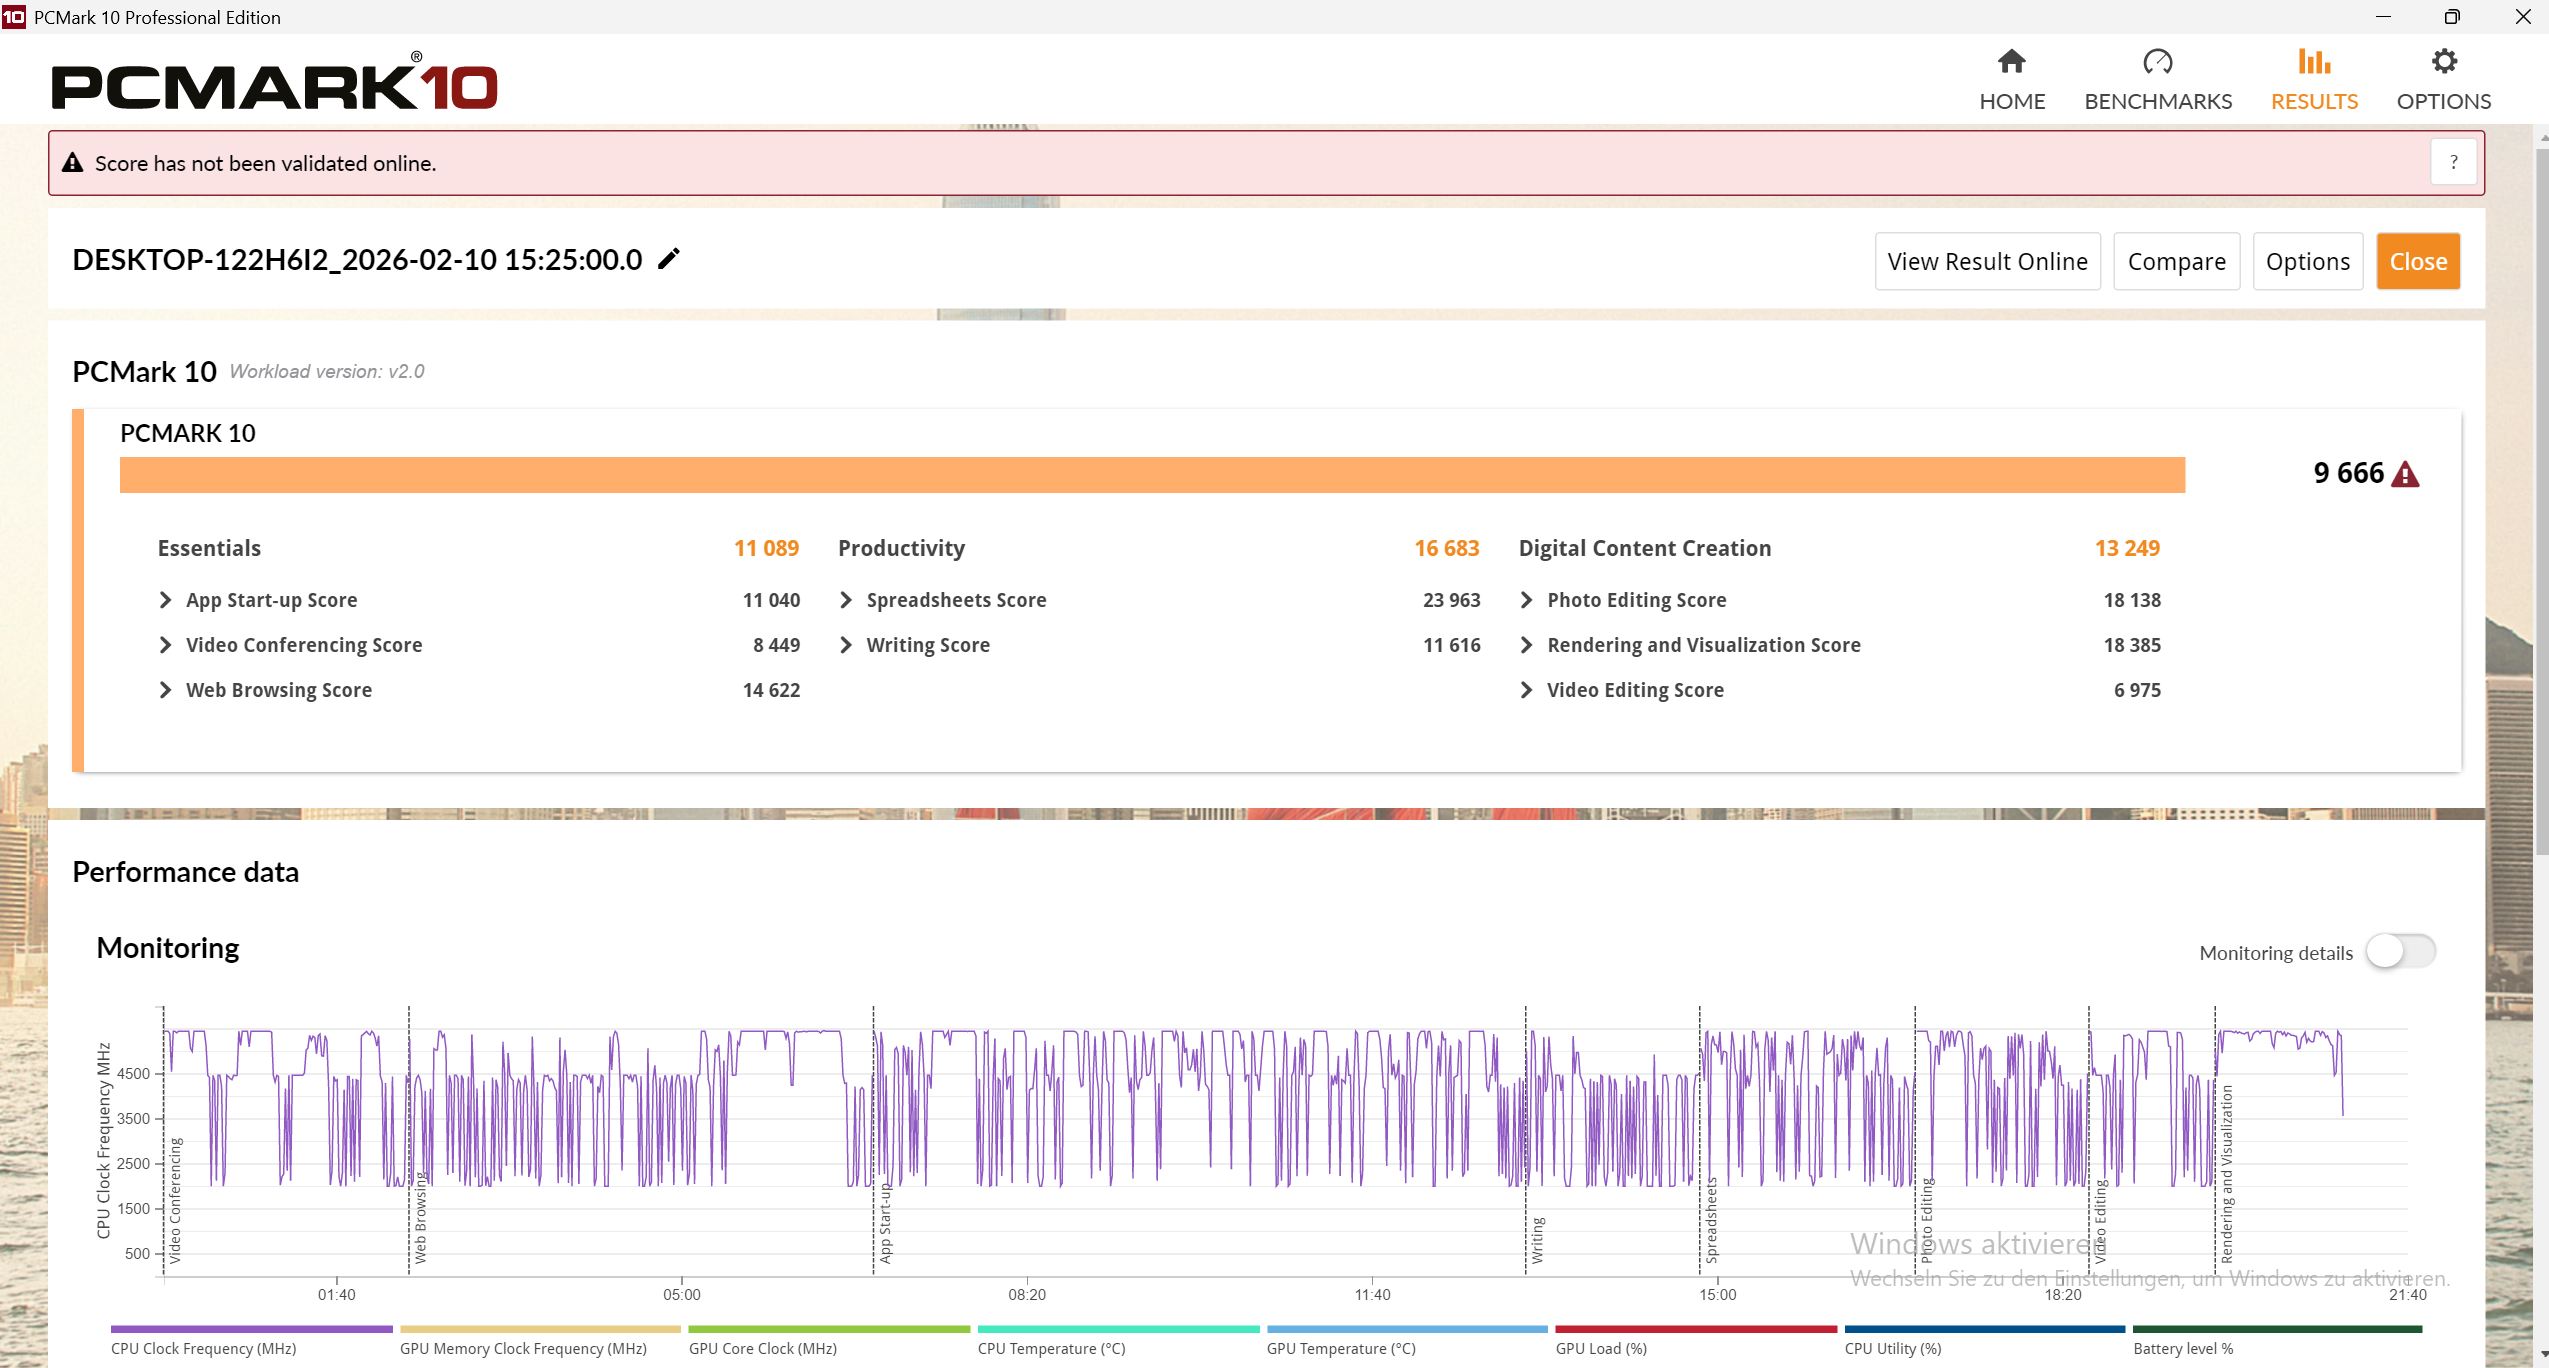
PCMark 10: Score | Essentials | Productivity | Digital Content Creation
CrossMark: Overall | Productivity | Creativity | Responsiveness
WebXPRT 3: Overall
WebXPRT 4: Overall
Mozilla Kraken 1.1: Total
| Performance rating | |
| Schenker XMG Apex 17 M25 | |
| Average AMD Ryzen 9 9955HX, NVIDIA GeForce RTX 5060 Laptop | |
| Lenovo Legion 7 16IAX10 | |
| Average of class Gaming | |
| MSI Crosshair A17 HX D8WGKG | |
| MSI Katana 17 HX B14WGK | |
| HP Omen 17z-db100 | |
| Acer Nitro v 17 (ANV17-41-R4CJ) | |
| PCMark 10 / Score | |
| Schenker XMG Apex 17 M25 | |
| Average AMD Ryzen 9 9955HX, NVIDIA GeForce RTX 5060 Laptop (n=1) | |
| Average of class Gaming (5828 - 11574, n=95, last 2 years) | |
| MSI Crosshair A17 HX D8WGKG | |
| Acer Nitro v 17 (ANV17-41-R4CJ) | |
| HP Omen 17z-db100 | |
| Lenovo Legion 7 16IAX10 | |
| MSI Katana 17 HX B14WGK | |
| PCMark 10 / Essentials | |
| HP Omen 17z-db100 | |
| Lenovo Legion 7 16IAX10 | |
| MSI Crosshair A17 HX D8WGKG | |
| Schenker XMG Apex 17 M25 | |
| Average AMD Ryzen 9 9955HX, NVIDIA GeForce RTX 5060 Laptop (n=1) | |
| Average of class Gaming (8810 - 12600, n=99, last 2 years) | |
| MSI Katana 17 HX B14WGK | |
| Acer Nitro v 17 (ANV17-41-R4CJ) | |
| PCMark 10 / Productivity | |
| Schenker XMG Apex 17 M25 | |
| Average AMD Ryzen 9 9955HX, NVIDIA GeForce RTX 5060 Laptop (n=1) | |
| Acer Nitro v 17 (ANV17-41-R4CJ) | |
| HP Omen 17z-db100 | |
| Average of class Gaming (6845 - 18766, n=97, last 2 years) | |
| Lenovo Legion 7 16IAX10 | |
| MSI Crosshair A17 HX D8WGKG | |
| MSI Katana 17 HX B14WGK | |
| PCMark 10 / Digital Content Creation | |
| Average of class Gaming (7602 - 19657, n=97, last 2 years) | |
| MSI Crosshair A17 HX D8WGKG | |
| Schenker XMG Apex 17 M25 | |
| Average AMD Ryzen 9 9955HX, NVIDIA GeForce RTX 5060 Laptop (n=1) | |
| MSI Katana 17 HX B14WGK | |
| Acer Nitro v 17 (ANV17-41-R4CJ) | |
| Lenovo Legion 7 16IAX10 | |
| HP Omen 17z-db100 | |
| CrossMark / Overall | |
| Schenker XMG Apex 17 M25 | |
| Average AMD Ryzen 9 9955HX, NVIDIA GeForce RTX 5060 Laptop (n=1) | |
| Lenovo Legion 7 16IAX10 | |
| Average of class Gaming (1366 - 2409, n=97, last 2 years) | |
| MSI Crosshair A17 HX D8WGKG | |
| MSI Katana 17 HX B14WGK | |
| HP Omen 17z-db100 | |
| Acer Nitro v 17 (ANV17-41-R4CJ) | |
| CrossMark / Productivity | |
| Schenker XMG Apex 17 M25 | |
| Average AMD Ryzen 9 9955HX, NVIDIA GeForce RTX 5060 Laptop (n=1) | |
| Lenovo Legion 7 16IAX10 | |
| MSI Katana 17 HX B14WGK | |
| Average of class Gaming (1386 - 2254, n=97, last 2 years) | |
| MSI Crosshair A17 HX D8WGKG | |
| HP Omen 17z-db100 | |
| Acer Nitro v 17 (ANV17-41-R4CJ) | |
| CrossMark / Creativity | |
| Schenker XMG Apex 17 M25 | |
| Average AMD Ryzen 9 9955HX, NVIDIA GeForce RTX 5060 Laptop (n=1) | |
| Lenovo Legion 7 16IAX10 | |
| Average of class Gaming (1343 - 2729, n=97, last 2 years) | |
| MSI Crosshair A17 HX D8WGKG | |
| HP Omen 17z-db100 | |
| MSI Katana 17 HX B14WGK | |
| Acer Nitro v 17 (ANV17-41-R4CJ) | |
| CrossMark / Responsiveness | |
| Schenker XMG Apex 17 M25 | |
| Average AMD Ryzen 9 9955HX, NVIDIA GeForce RTX 5060 Laptop (n=1) | |
| MSI Katana 17 HX B14WGK | |
| Lenovo Legion 7 16IAX10 | |
| MSI Crosshair A17 HX D8WGKG | |
| Average of class Gaming (1226 - 2334, n=97, last 2 years) | |
| HP Omen 17z-db100 | |
| Acer Nitro v 17 (ANV17-41-R4CJ) | |
| WebXPRT 3 / Overall | |
| Lenovo Legion 7 16IAX10 | |
| Average of class Gaming (242 - 532, n=100, last 2 years) | |
| Schenker XMG Apex 17 M25 | |
| Average AMD Ryzen 9 9955HX, NVIDIA GeForce RTX 5060 Laptop (n=1) | |
| MSI Katana 17 HX B14WGK | |
| HP Omen 17z-db100 | |
| Acer Nitro v 17 (ANV17-41-R4CJ) | |
| MSI Crosshair A17 HX D8WGKG | |
| WebXPRT 4 / Overall | |
| Lenovo Legion 7 16IAX10 | |
| Schenker XMG Apex 17 M25 | |
| Average AMD Ryzen 9 9955HX, NVIDIA GeForce RTX 5060 Laptop (n=1) | |
| Average of class Gaming (176.4 - 354, n=100, last 2 years) | |
| MSI Katana 17 HX B14WGK | |
| HP Omen 17z-db100 | |
| Acer Nitro v 17 (ANV17-41-R4CJ) | |
| MSI Crosshair A17 HX D8WGKG | |
| Mozilla Kraken 1.1 / Total | |
| Acer Nitro v 17 (ANV17-41-R4CJ) | |
| MSI Crosshair A17 HX D8WGKG | |
| MSI Katana 17 HX B14WGK | |
| HP Omen 17z-db100 | |
| Average of class Gaming (391 - 590, n=105, last 2 years) | |
| Lenovo Legion 7 16IAX10 | |
| Schenker XMG Apex 17 M25 | |
| Average AMD Ryzen 9 9955HX, NVIDIA GeForce RTX 5060 Laptop (n=1) | |
* ... smaller is better
| PCMark 10 Score | 9666 points | |
Help | ||
| AIDA64 / Memory Copy | |
| Lenovo Legion 7 16IAX10 | |
| HP Omen 17z-db100 | |
| Average of class Gaming (21750 - 129946, n=109, last 2 years) | |
| Schenker XMG Apex 17 M25 | |
| Average AMD Ryzen 9 9955HX (53598 - 62777, n=9) | |
| MSI Katana 17 HX B14WGK | |
| MSI Crosshair A17 HX D8WGKG | |
| Acer Nitro v 17 (ANV17-41-R4CJ) | |
| AIDA64 / Memory Read | |
| Lenovo Legion 7 16IAX10 | |
| Average of class Gaming (22956 - 118858, n=109, last 2 years) | |
| MSI Katana 17 HX B14WGK | |
| Schenker XMG Apex 17 M25 | |
| Average AMD Ryzen 9 9955HX (63953 - 67256, n=9) | |
| HP Omen 17z-db100 | |
| MSI Crosshair A17 HX D8WGKG | |
| Acer Nitro v 17 (ANV17-41-R4CJ) | |
| AIDA64 / Memory Write | |
| HP Omen 17z-db100 | |
| Lenovo Legion 7 16IAX10 | |
| Average of class Gaming (22297 - 135096, n=109, last 2 years) | |
| Schenker XMG Apex 17 M25 | |
| Average AMD Ryzen 9 9955HX (65421 - 72060, n=9) | |
| MSI Crosshair A17 HX D8WGKG | |
| MSI Katana 17 HX B14WGK | |
| Acer Nitro v 17 (ANV17-41-R4CJ) | |
| AIDA64 / Memory Latency | |
| Lenovo Legion 7 16IAX10 | |
| Average of class Gaming (75.3 - 259, n=109, last 2 years) | |
| HP Omen 17z-db100 | |
| Average AMD Ryzen 9 9955HX (92.1 - 103.5, n=9) | |
| Schenker XMG Apex 17 M25 | |
| MSI Katana 17 HX B14WGK | |
| Acer Nitro v 17 (ANV17-41-R4CJ) | |
| MSI Crosshair A17 HX D8WGKG | |
* ... smaller is better
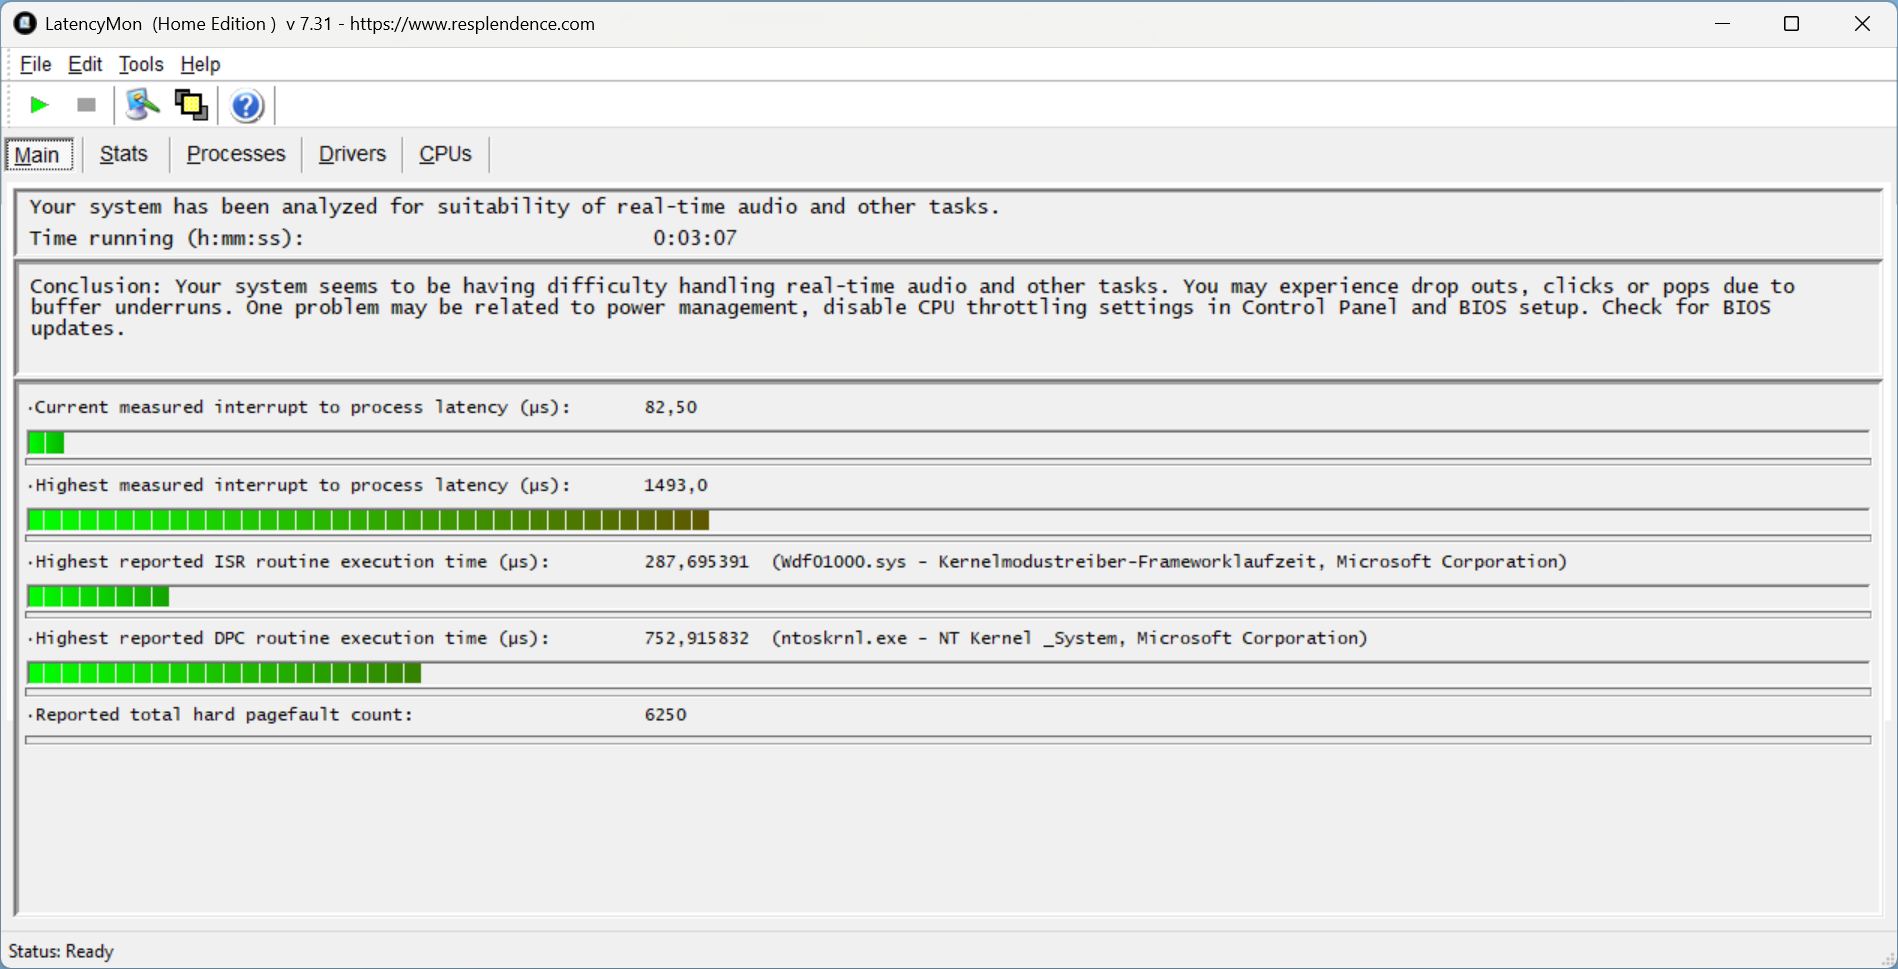
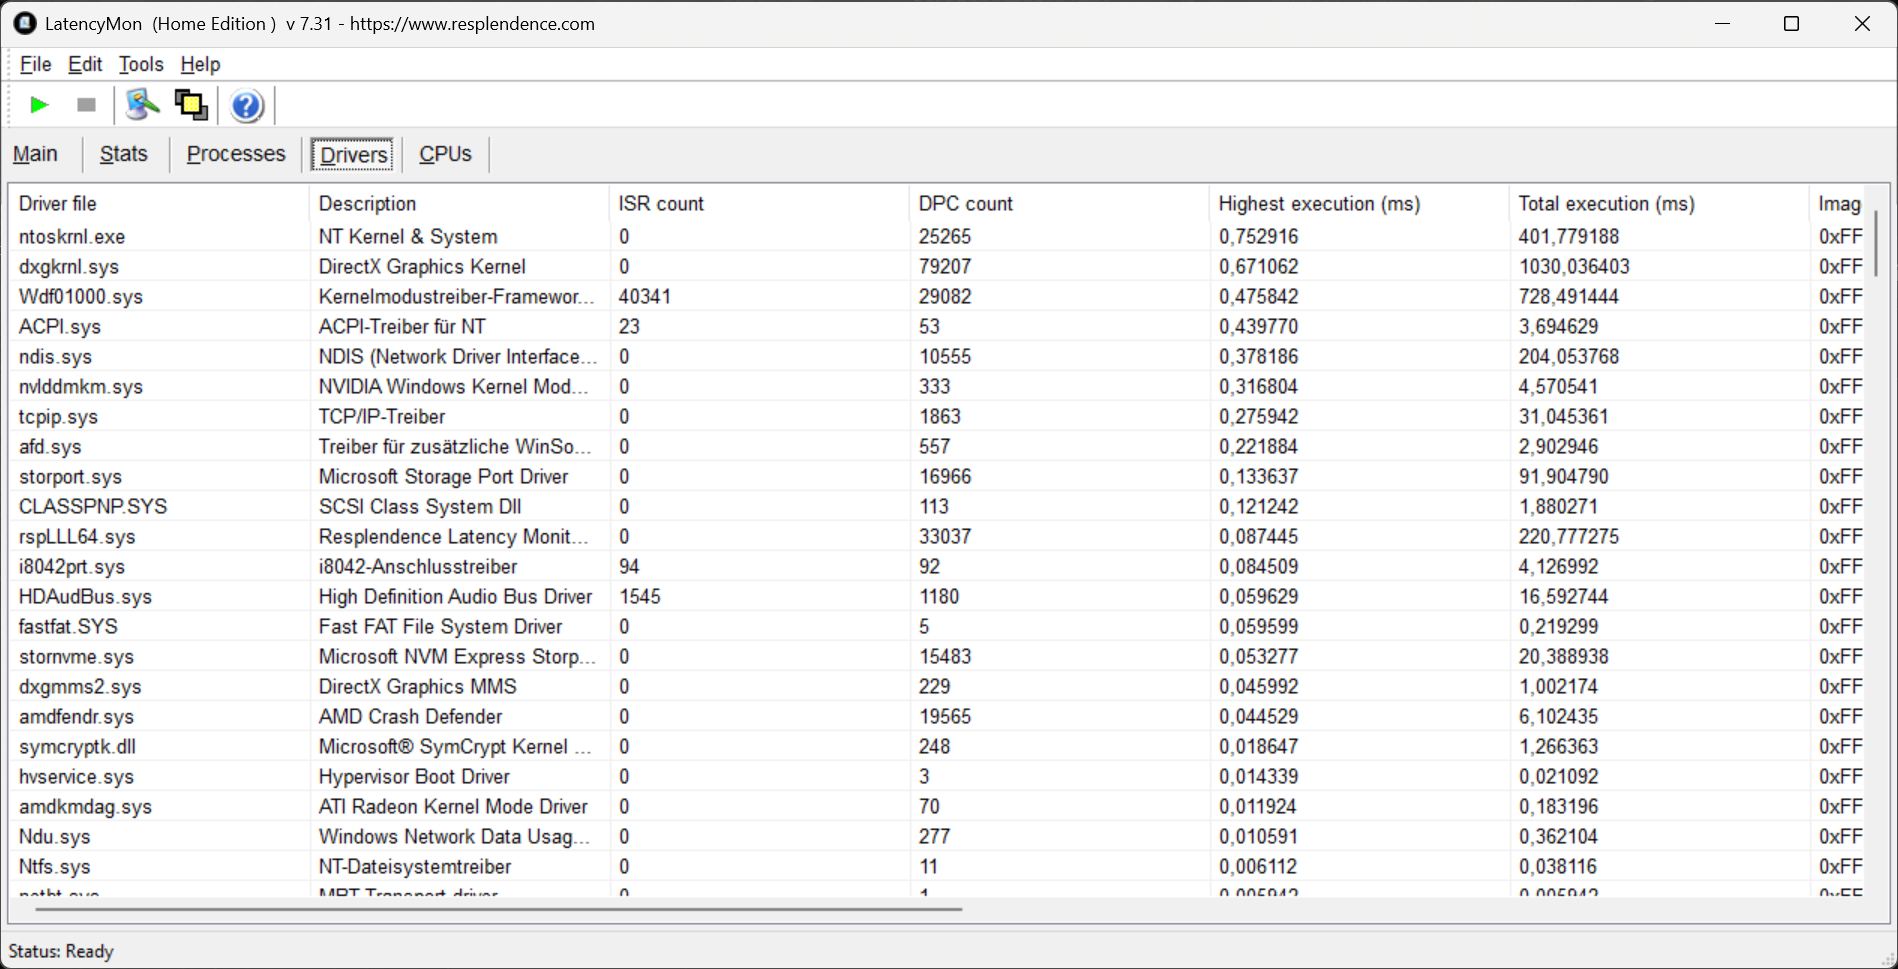
DPC 延迟
打开多个浏览器标签页时会出现延迟峰值。总体而言,虽然在 YouTube 播放过程中出现了 9 次丢帧,但数值仍在可接受的范围内。
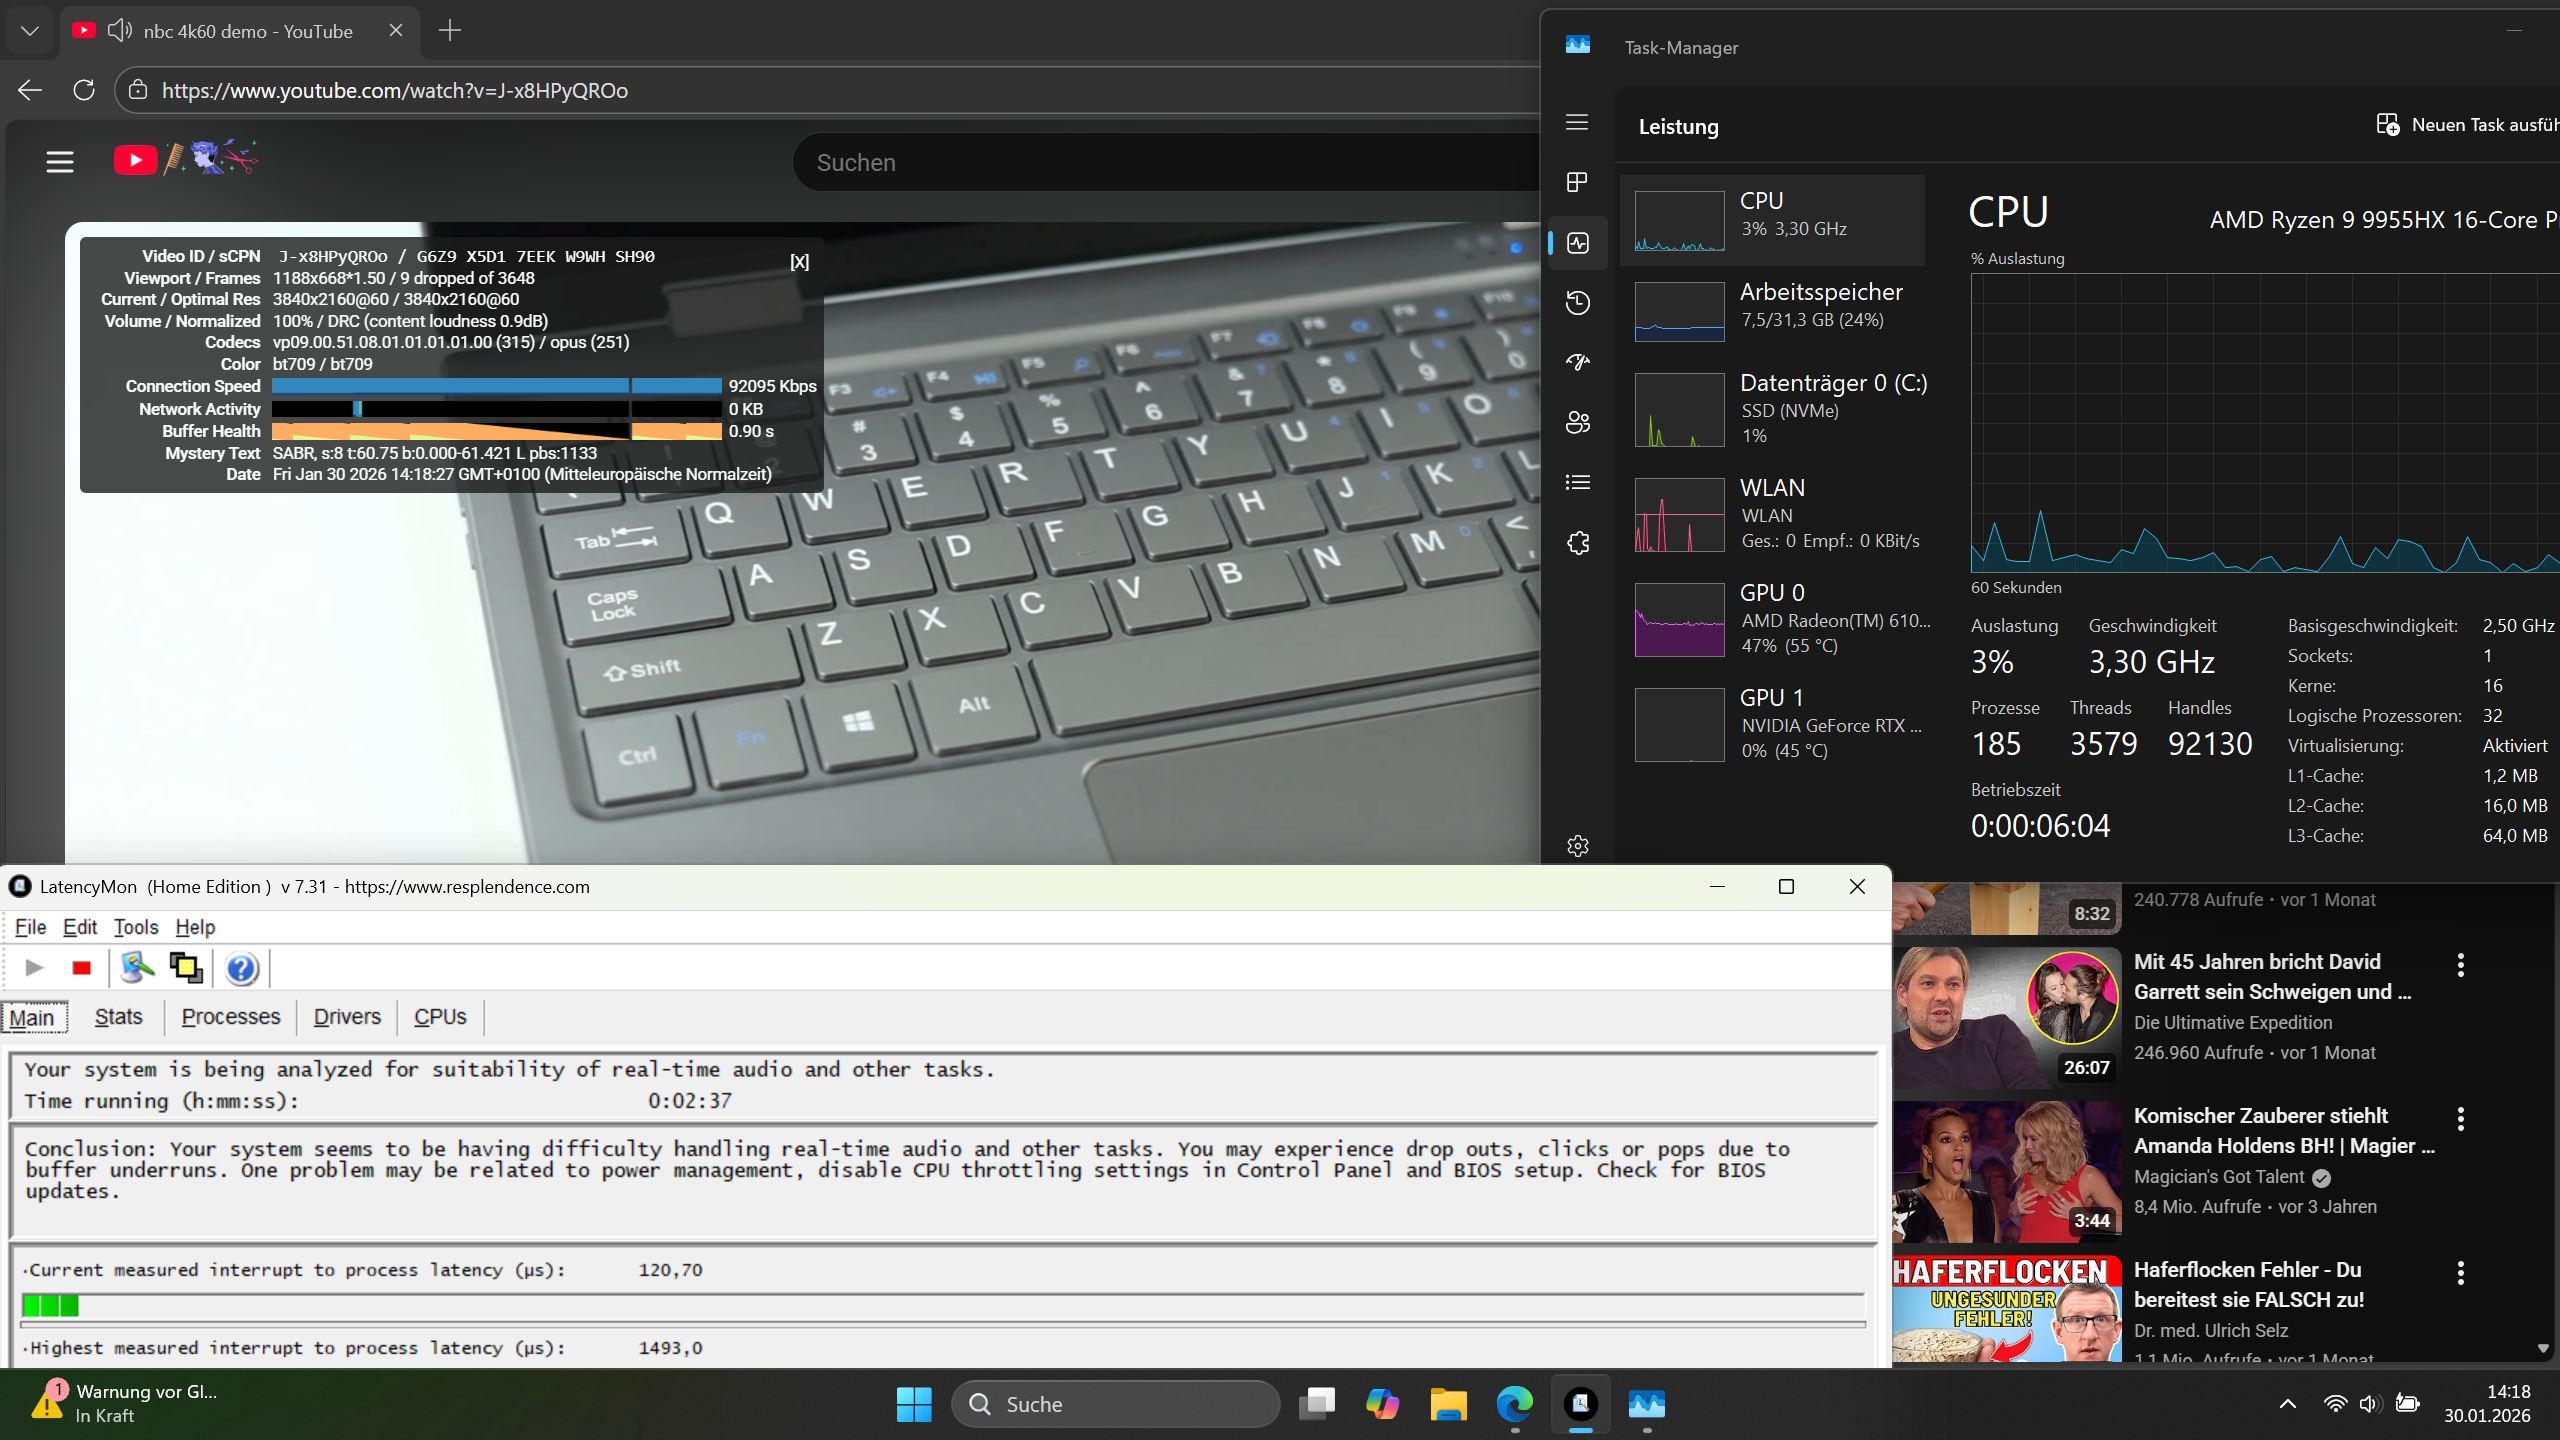
| DPC Latencies / LatencyMon - interrupt to process latency (max), Web, Youtube, Prime95 | |
| HP Omen 17z-db100 | |
| MSI Katana 17 HX B14WGK | |
| Acer Nitro v 17 (ANV17-41-R4CJ) | |
| Schenker XMG Apex 17 M25 | |
| HP Omen 16-ap0091ng | |
| Lenovo Legion 7 16IAX10 | |
| MSI Crosshair A17 HX D8WGKG | |
* ... smaller is better
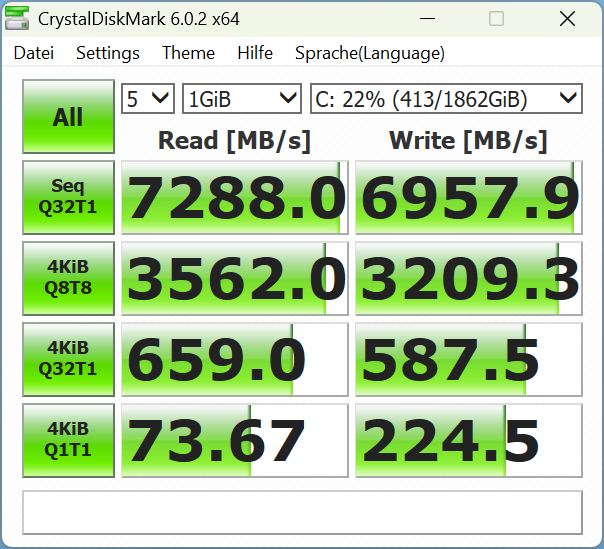
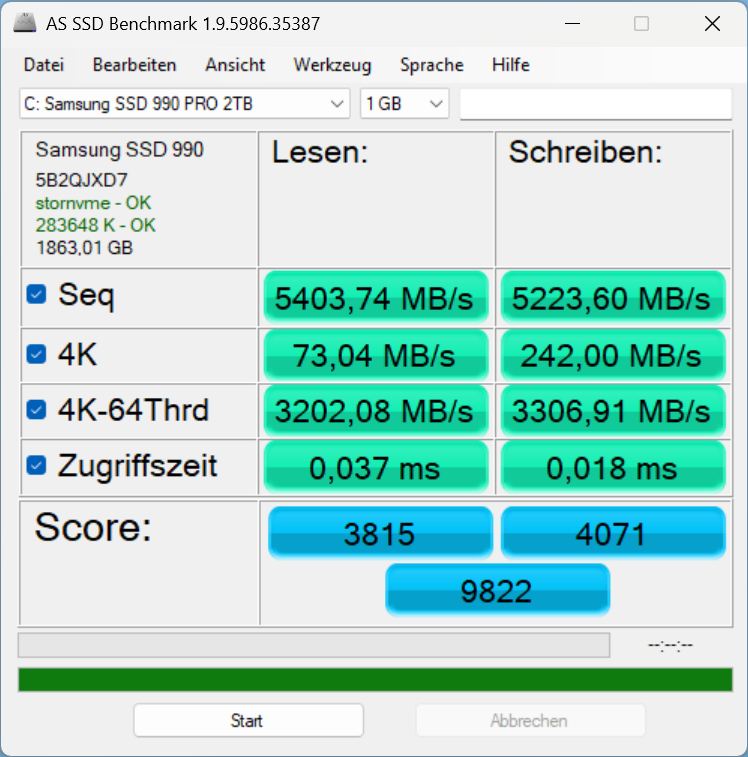
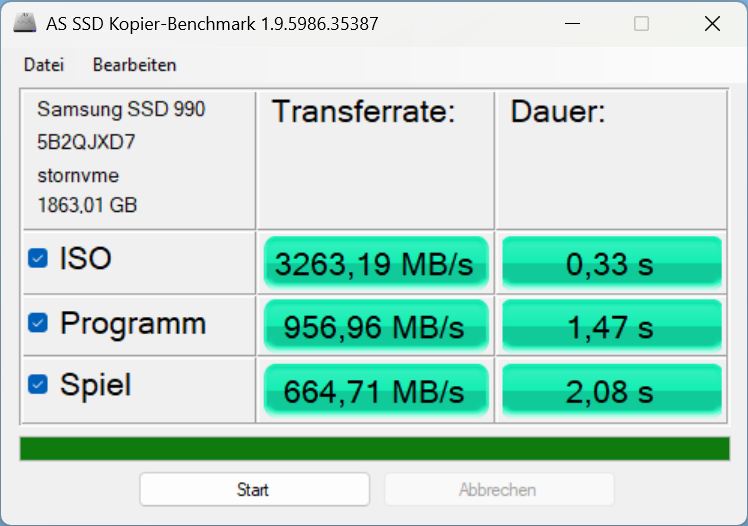
大容量存储器
我们的三星 990 Pro(2 TB)比标准的 1 TB WD Blue SN5100 多花了 146 欧元。即使在持续负载的情况下,性能也能保持稳定,并超过同类产品。

* ... smaller is better
连续读取:DiskSpd 循环读取,队列深度 8
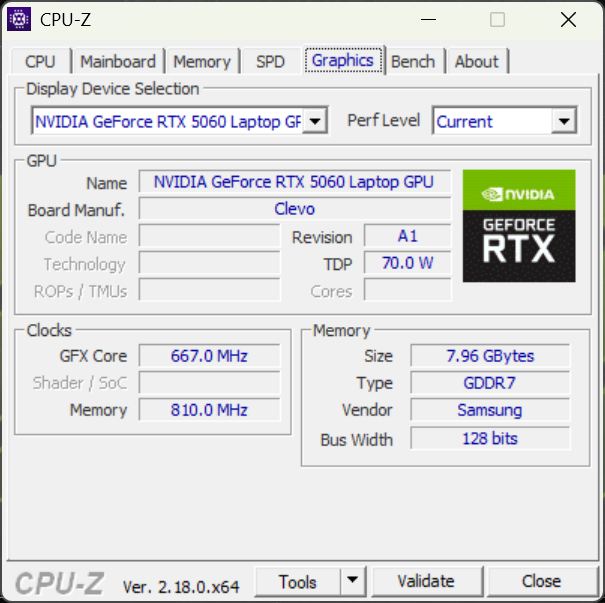
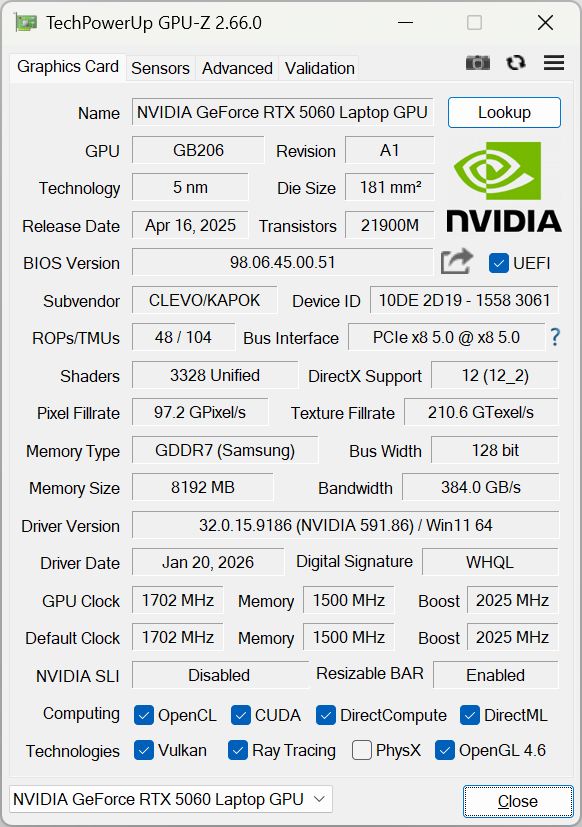
GPU 性能--对比最快的 RTX 5060 笔记本电脑?
在合成 3DMark 测试中,RTX 5060 RTX 5060明显优于其他 RTX 5060 竞争对手。在娱乐模式下,它的表现与竞争对手相当。在电池供电情况下,GPU 在《赛博朋克》中的帧数为 30 fps。
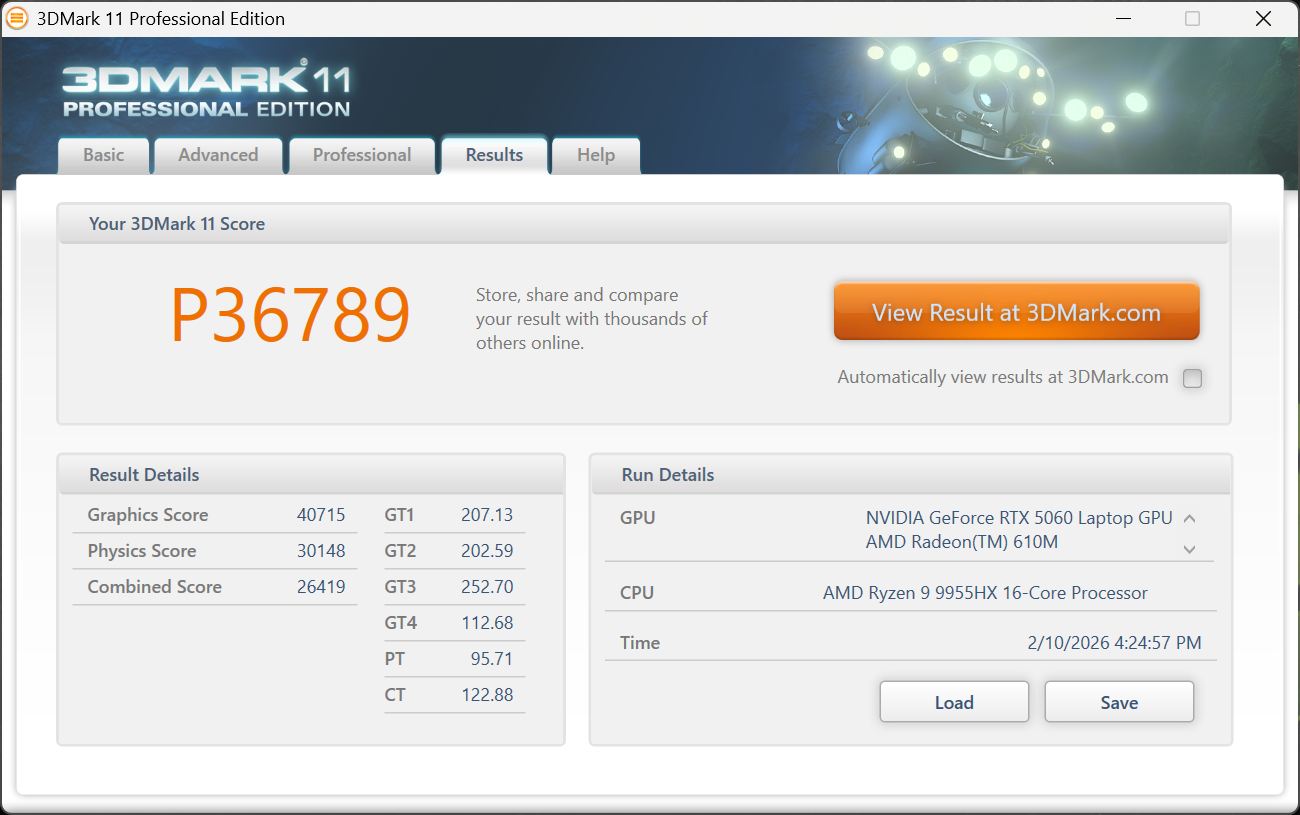
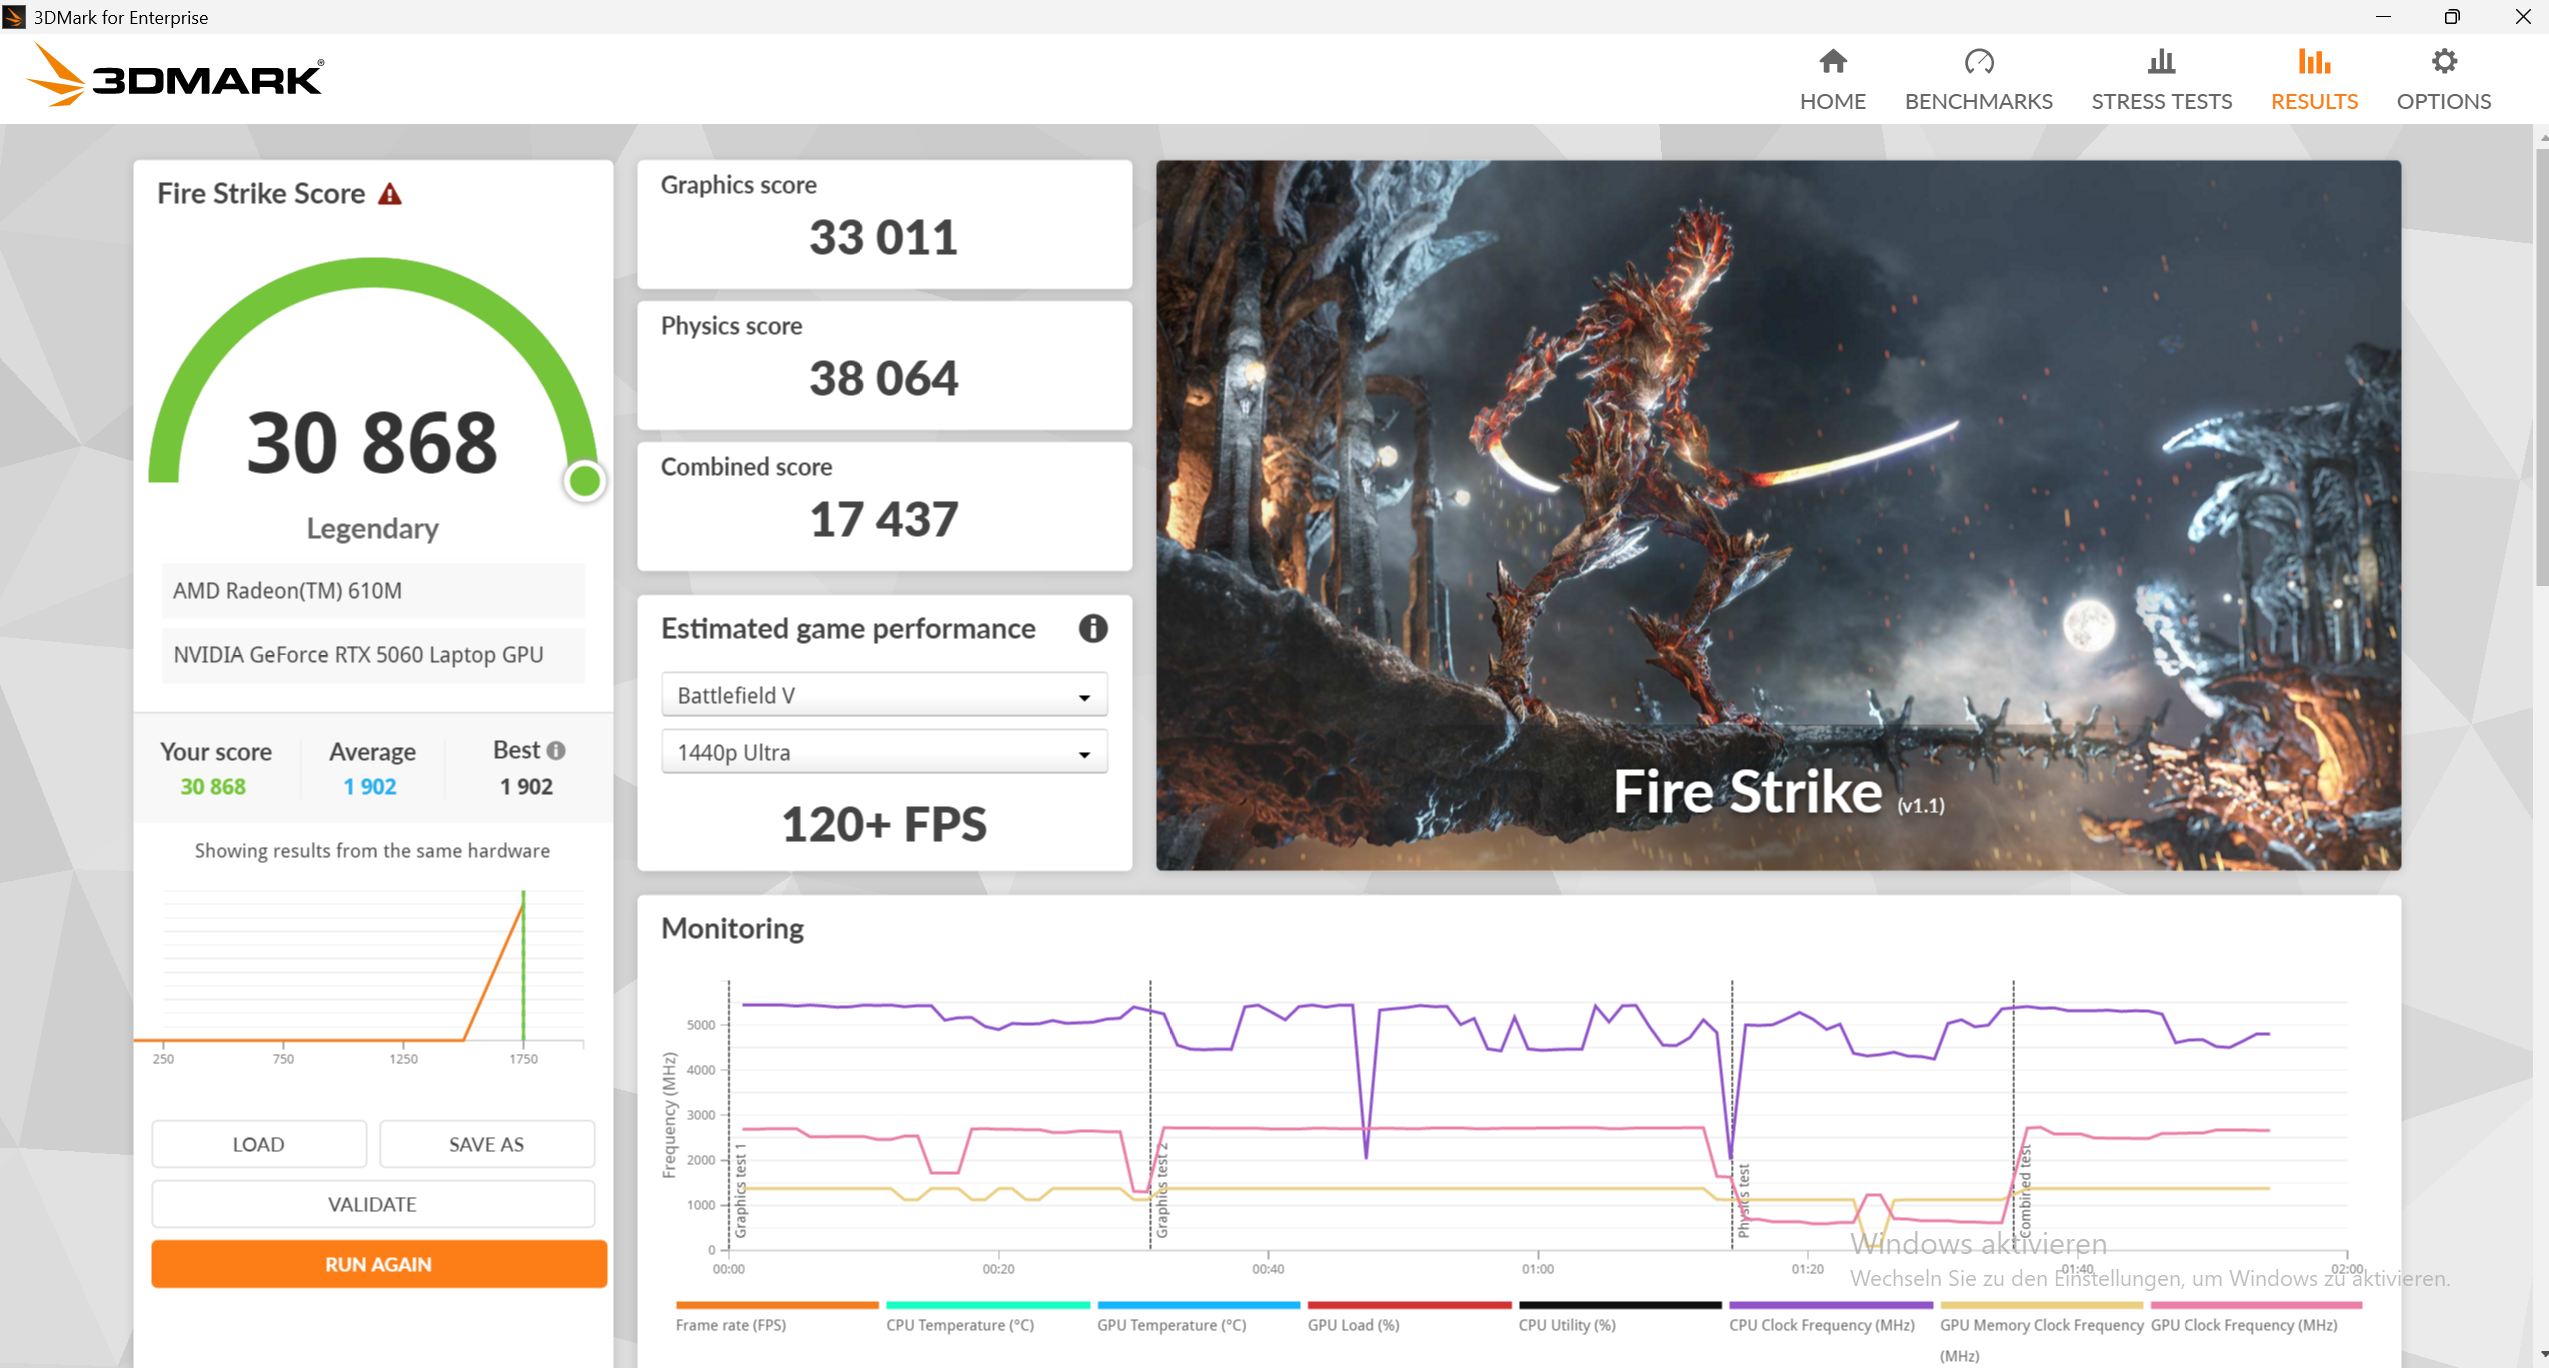
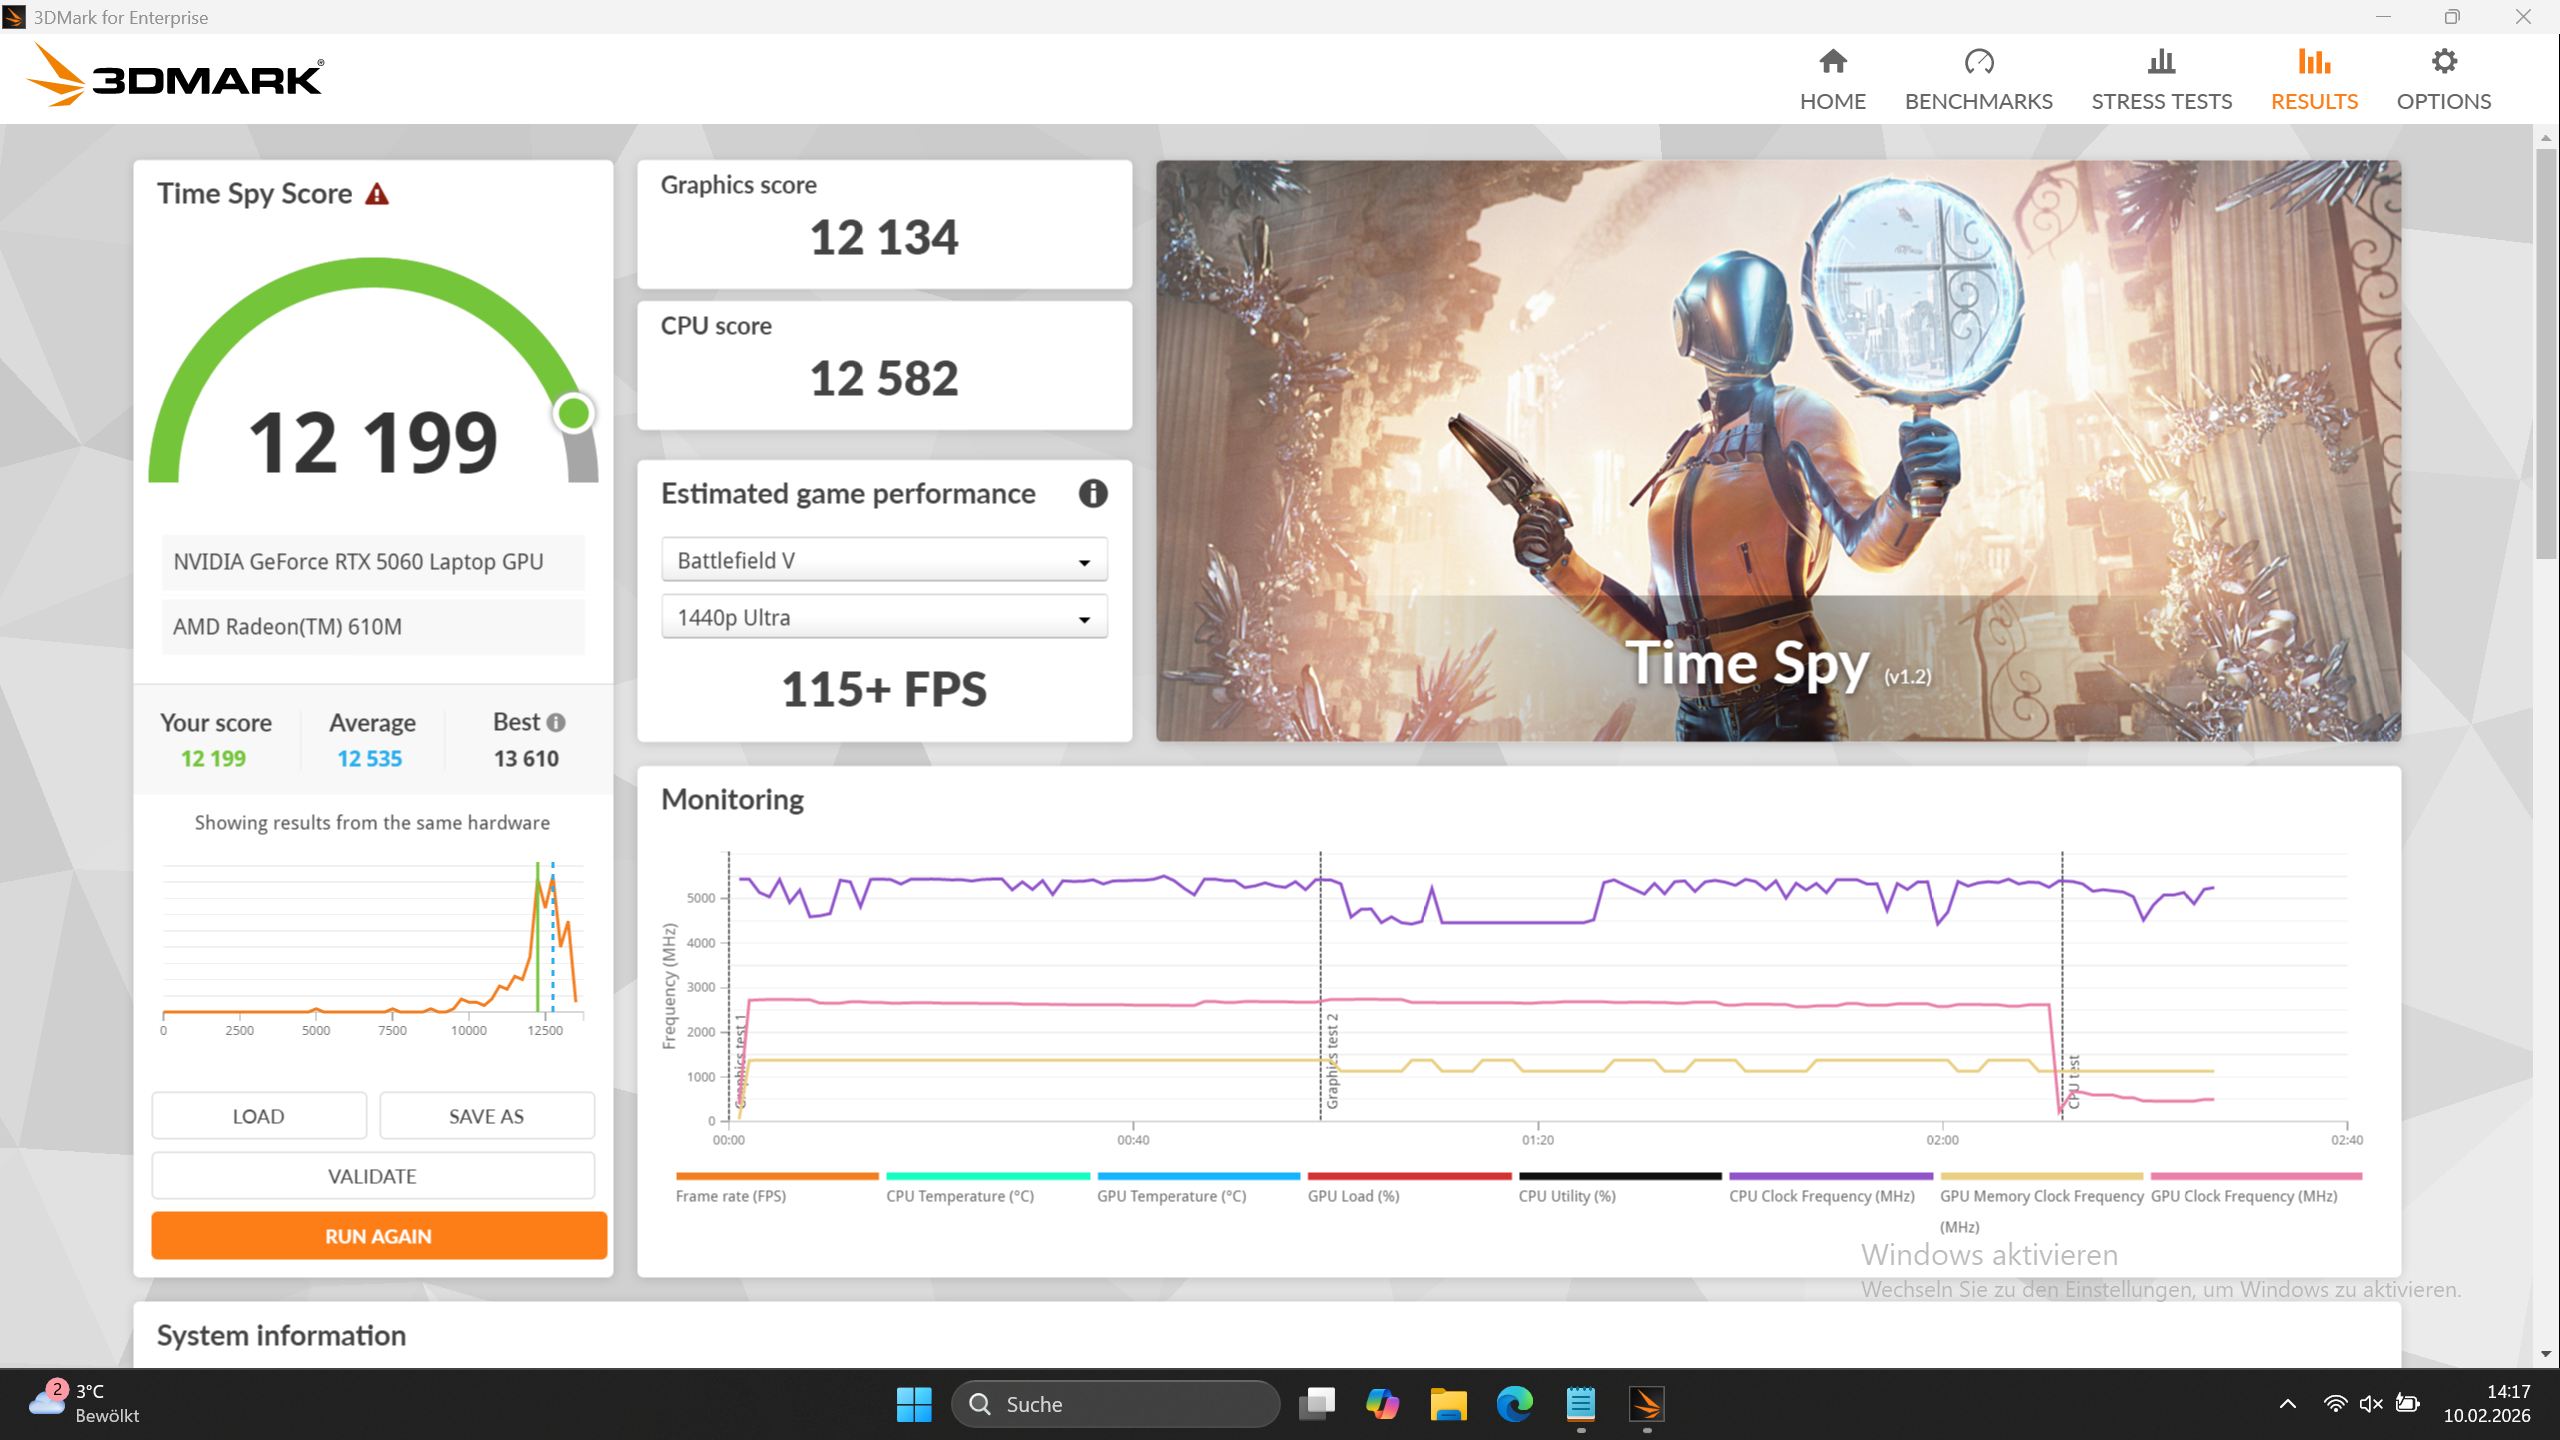
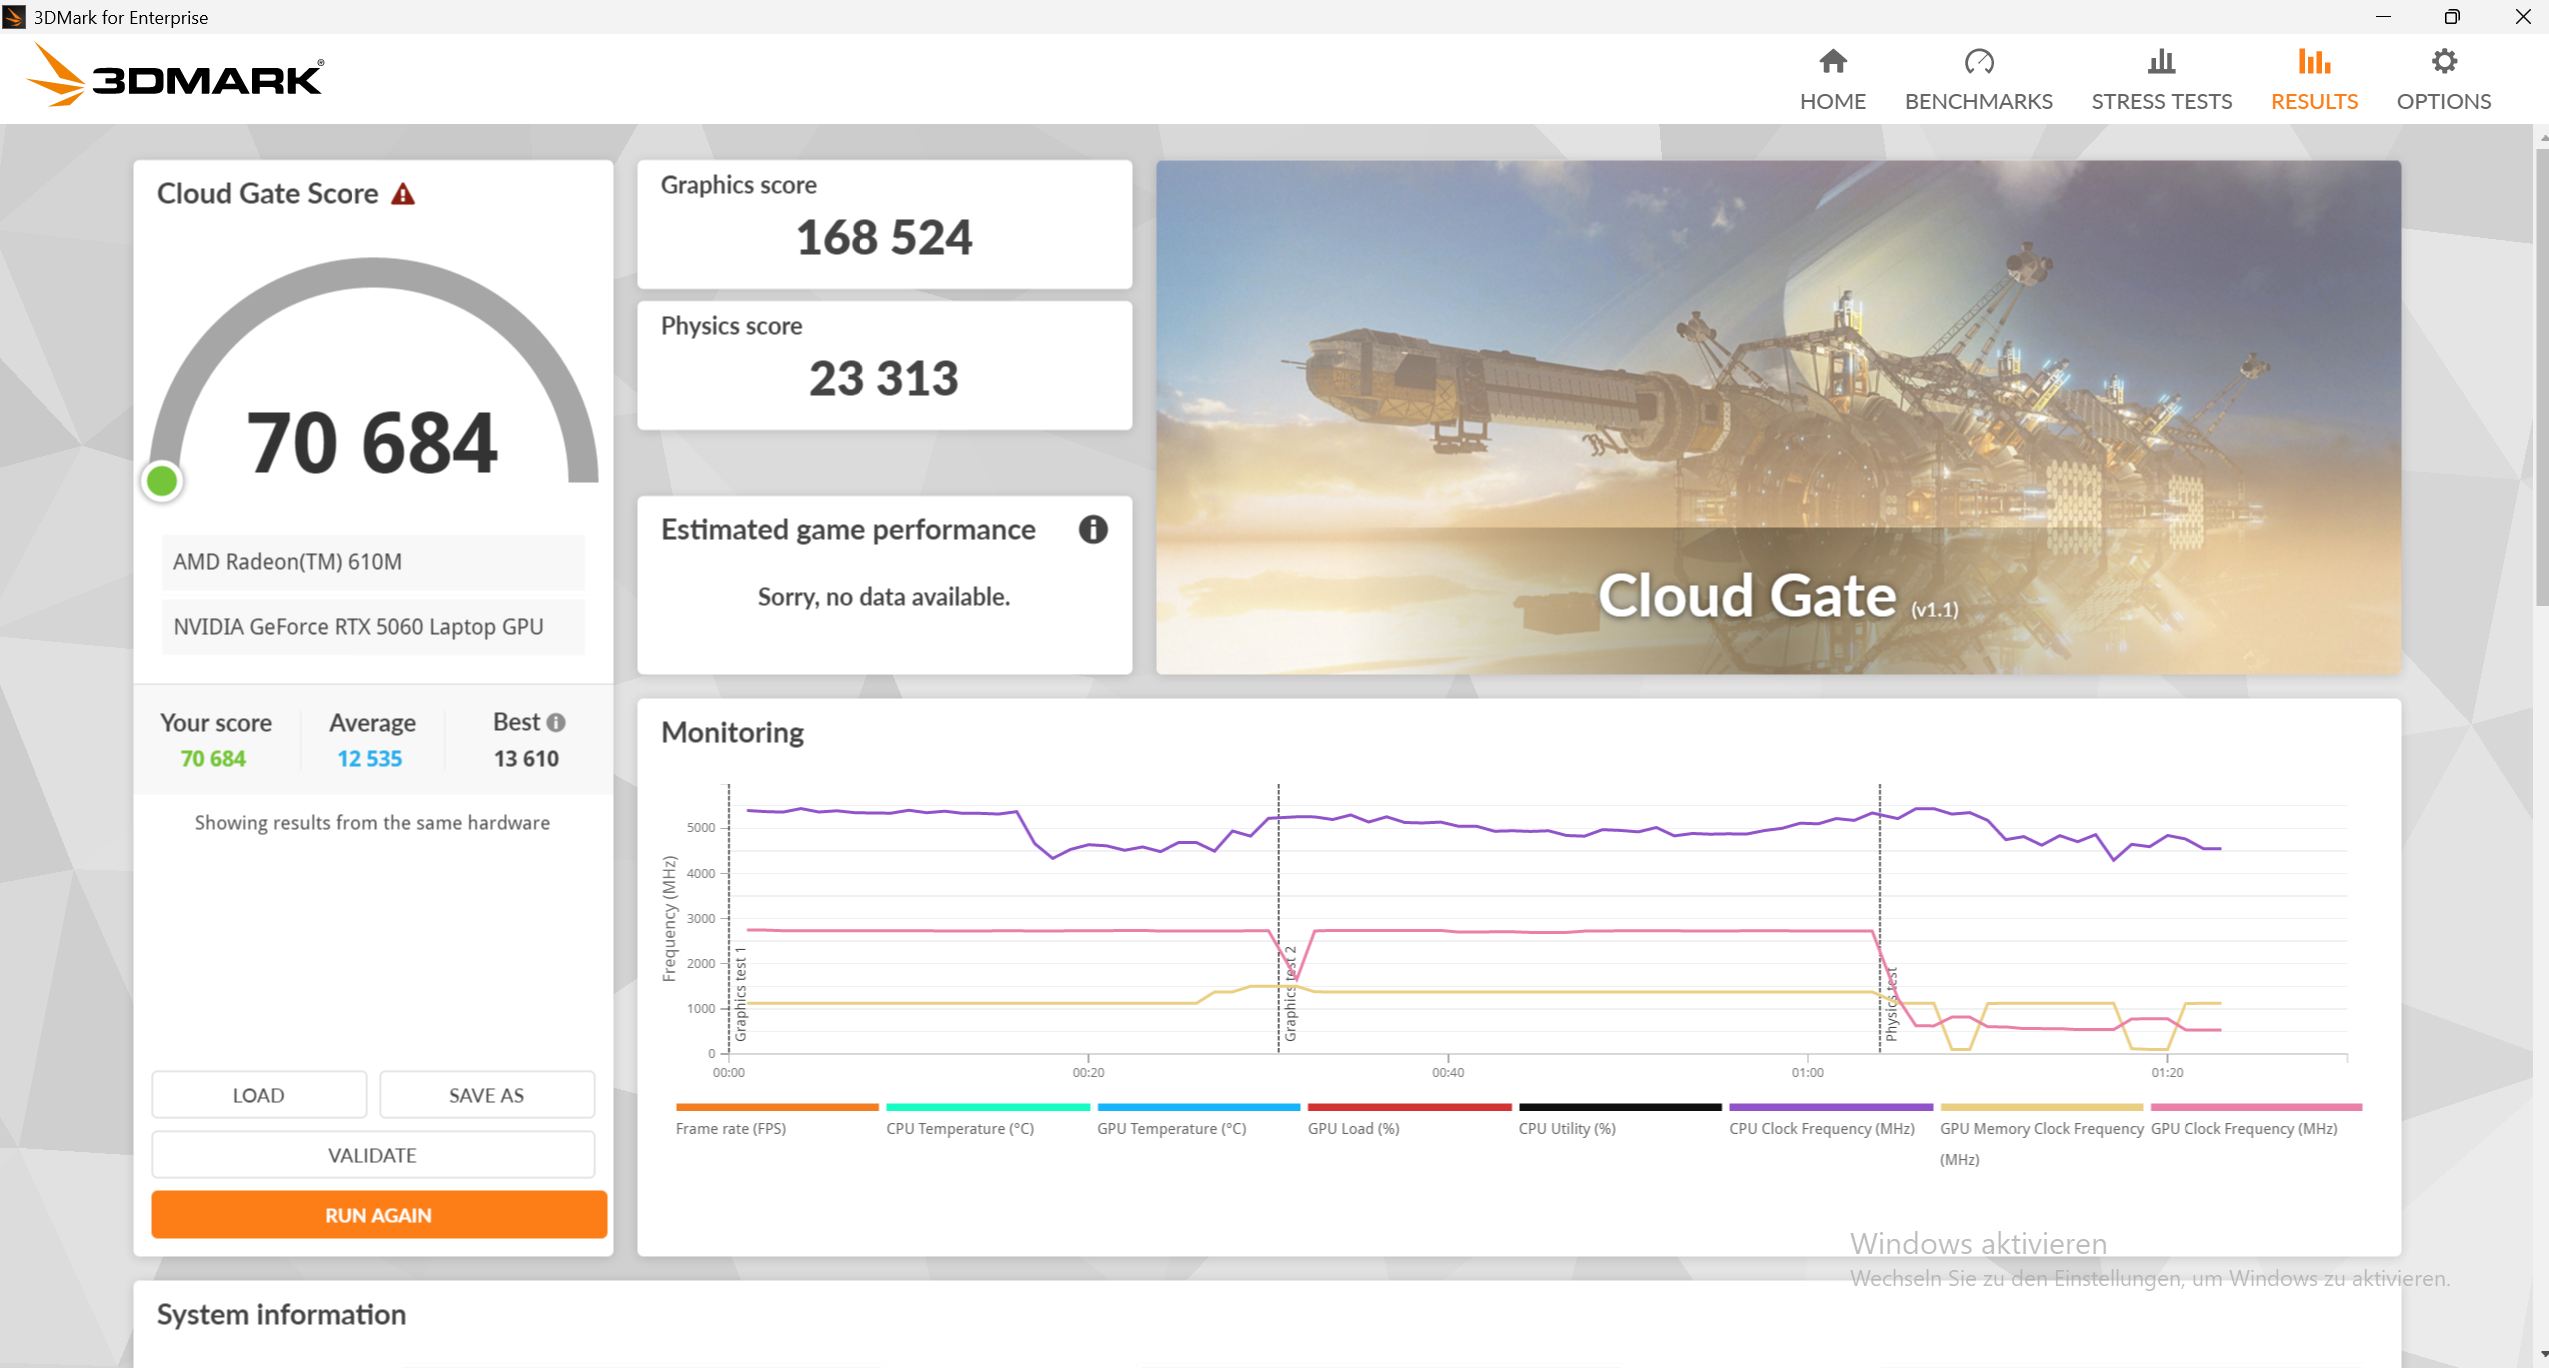
| 3DMark 11 Performance | 36789 points | |
| 3DMark Cloud Gate Standard Score | 70684 points | |
| 3DMark Fire Strike Score | 30868 points | |
| 3DMark Time Spy Score | 12199 points | |
Help | ||
* ... smaller is better
游戏性能
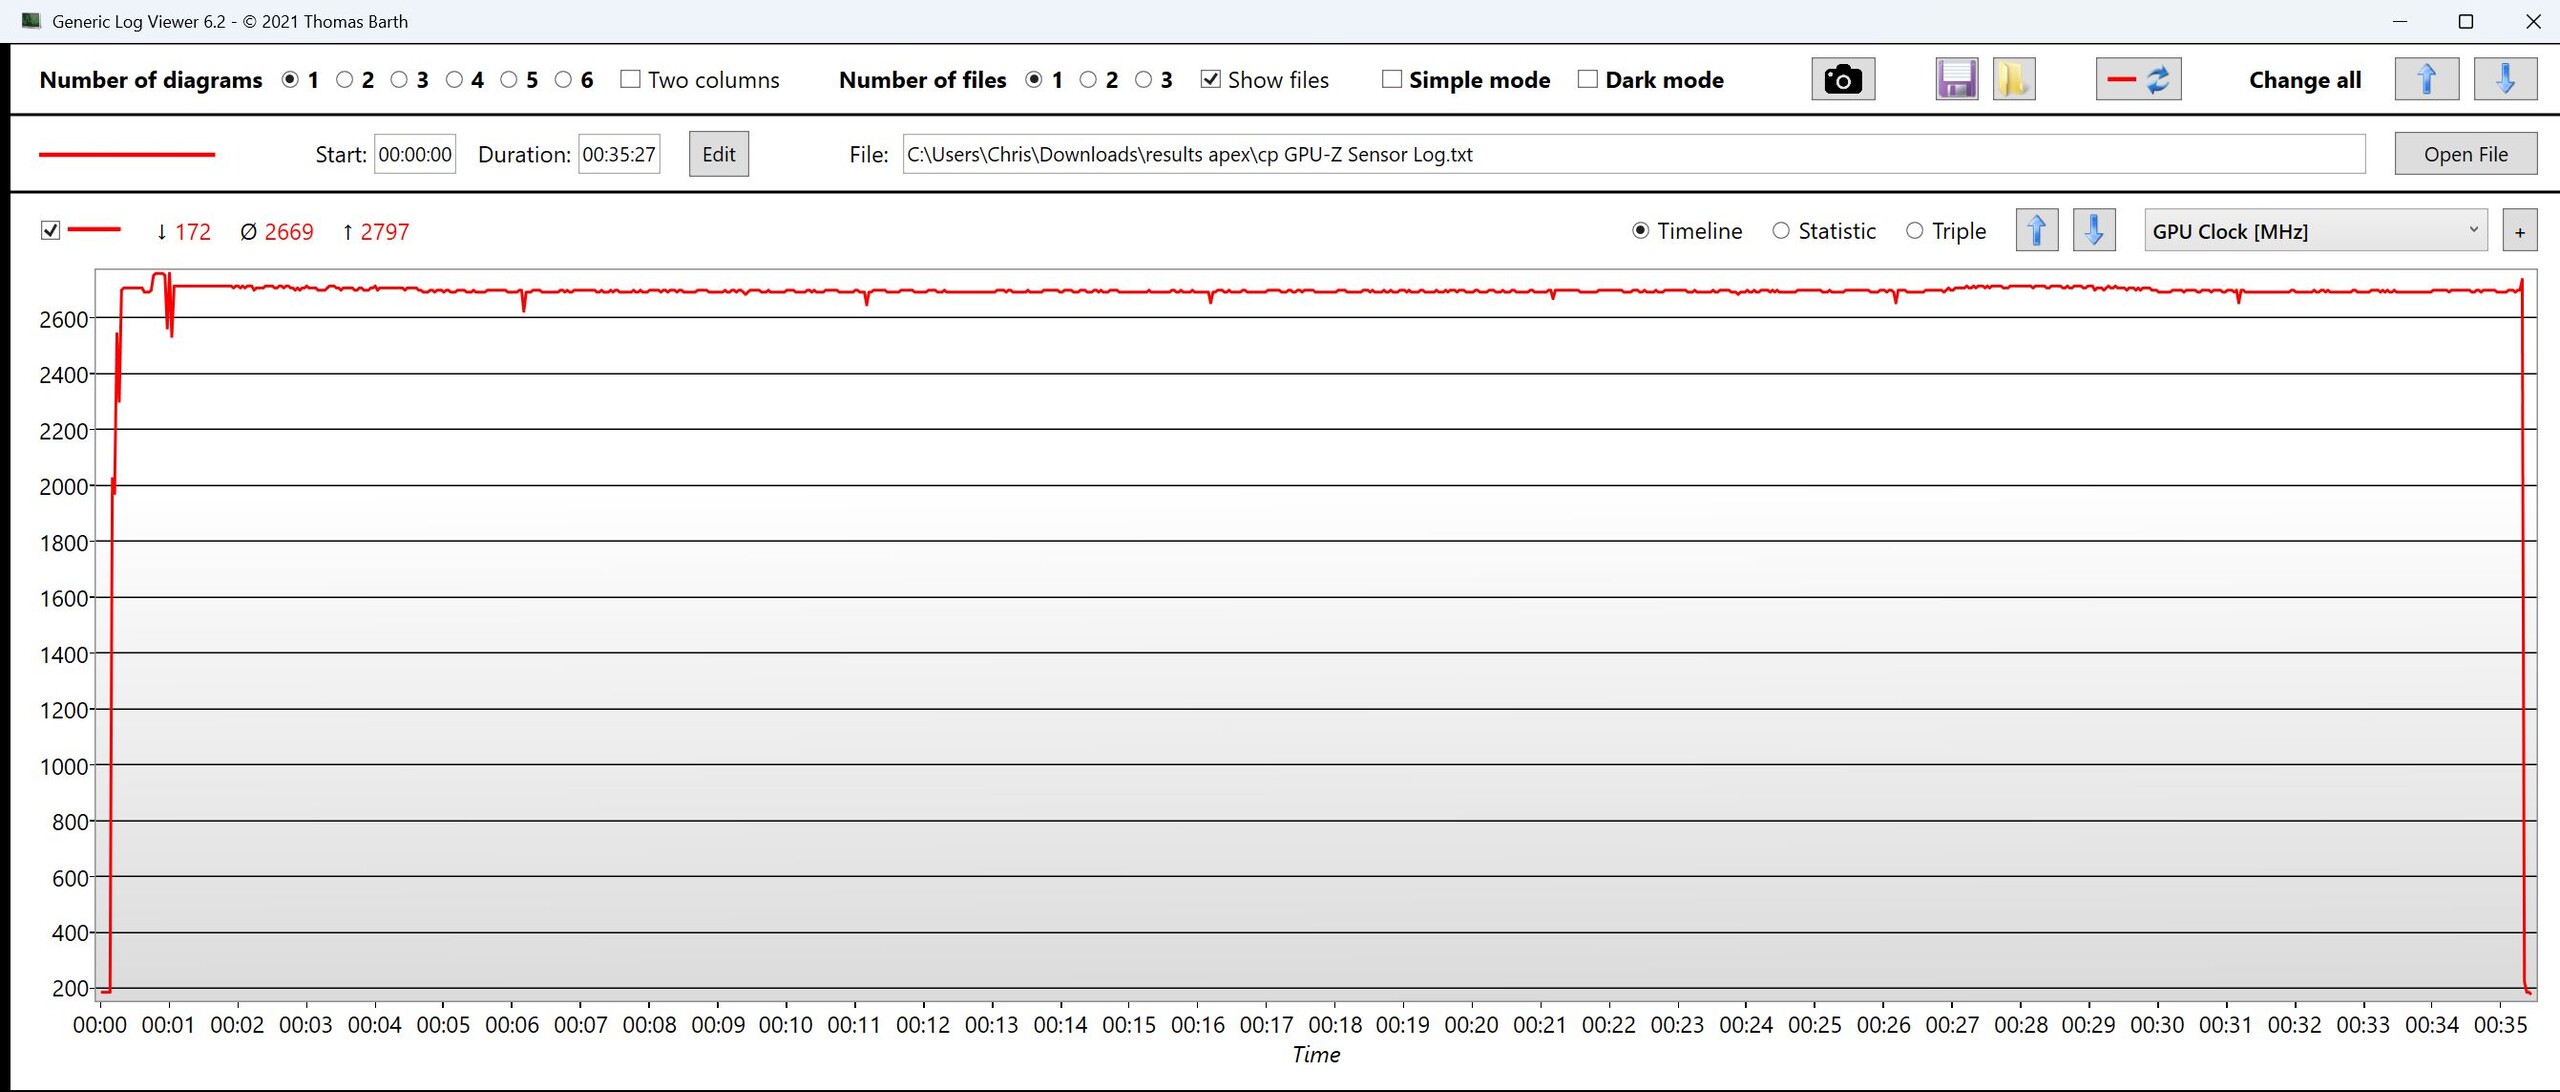
在所有测试游戏中,Apex 的表现甚至超过了一些性能较弱的 RTX 5070 笔记本电脑(例如宏碁 Nitro V17, 预兆 17z).在《赛博朋克》中,它也能提供非常高且完全稳定的持续性能。
在娱乐模式下,游戏性能下降约 12%。
在没有光线追踪或路径追踪的情况下,所有游戏都能在高设置下以原始分辨率流畅运行。虽然经常需要使用 DLSS,但仍有 QHD 的空间。在 4K 分辨率下,主要是较老的游戏仍可正常运行,而现代游戏即使进行了升频也很吃力。
| Final Fantasy XV Benchmark - 1920x1080 High Quality | |
| Average of class Gaming (41 - 215, n=103, last 2 years) | |
| HP Omen 17z-db100 | |
| Lenovo Legion 7 16IAX10 | |
| Acer Nitro v 17 (ANV17-41-R4CJ) | |
| Schenker XMG Apex 17 M25 | |
| HP Omen 16-ap0091ng | |
| Tulpar T6 V3.5 | |
| Alienware 16 Aurora | |
| Strange Brigade - 1920x1080 ultra AA:ultra AF:16 | |
| Average of class Gaming (76.3 - 456, n=93, last 2 years) | |
| HP Omen 17z-db100 | |
| Lenovo Legion 7 16IAX10 | |
| Acer Nitro v 17 (ANV17-41-R4CJ) | |
| Schenker XMG Apex 17 M25 | |
| HP Omen 16-ap0091ng | |
| Tulpar T6 V3.5 | |
| Alienware 16 Aurora | |
赛博朋克 2077》超 FPS 图表

| low | med. | high | ultra | QHD DLSS | QHD | 4K DLSS | 4K | |
|---|---|---|---|---|---|---|---|---|
| GTA V (2015) | 187.9 | 187.8 | 185.7 | 146.3 | 114.3 | 106 | ||
| Dota 2 Reborn (2015) | 268 | 232 | 223 | 201 | 124.4 | |||
| Final Fantasy XV Benchmark (2018) | 227 | 167.4 | 119.5 | 89.9 | 50.7 | |||
| X-Plane 11.11 (2018) | 164.2 | 142.9 | 118.4 | 99.2 | ||||
| Strange Brigade (2018) | 648 | 348 | 273 | 231 | 162 | 86.1 | ||
| Baldur's Gate 3 (2023) | 170 | 133 | 118 | 113.4 | 114.1 | 78.1 | 65.8 | 38.8 |
| Cyberpunk 2077 (2023) | 128.9 | 124.5 | 104 | 87.2 | 70 | 58.8 | 32.7 | 25.1 |
| Doom: The Dark Ages (2025) | 58.5 | 49.6 | 44.1 | 43.8 | 48 | 30.4 | 22.7 | 11.7 |
| F1 25 (2025) | 263 | 217 | 174.4 | 25.8 |
排放和功率 - Apex 17 在游戏负载下的声音有多大?
噪音排放
在负载情况下,风扇的噪音普遍高于部分功率受限的竞争对手。即使在 3DMark06 中,噪音也超过了 50 分贝。在游戏过程中,它是比较中噪音最大的系统,尽管较弱的 Legion 7也不遑多让。
在更安静的娱乐模式下,它的运行比竞争对手更安静,同时还能保持极具竞争力的性能。
风扇的行为有些激进和不稳定,即使在空闲时也会偶尔短暂升高。
Noise level
| Idle |
| 23 / 23 / 23 dB(A) |
| Load |
| 51.41 / 55.5 dB(A) |
 | ||
30 dB silent 40 dB(A) audible 50 dB(A) loud |
||
min: | ||
| Schenker XMG Apex 17 M25 R9 9955HX, GeForce RTX 5060 Laptop | Lenovo Legion 7 16IAX10 Ultra 7 255HX, GeForce RTX 5060 Laptop | HP Omen 16-ap0091ng R9 8940HX, GeForce RTX 5060 Laptop | MSI Cyborg 17 B13WFKG i7-13620H, GeForce RTX 5060 Laptop | Tulpar T6 V3.5 i7-14700HX, GeForce RTX 5060 Laptop | Alienware 16 Aurora Core 7 240H, GeForce RTX 5060 Laptop | |
|---|---|---|---|---|---|---|
| Noise | -2% | 0% | -6% | -10% | -1% | |
| off / environment * (dB) | 23 | 23.9 -4% | 23 -0% | 25 -9% | 24 -4% | 22.9 -0% |
| Idle Minimum * (dB) | 23 | 24 -4% | 23 -0% | 25 -9% | 26 -13% | 24 -4% |
| Idle Average * (dB) | 23 | 26 -13% | 23 -0% | 27 -17% | 29 -26% | 25.6 -11% |
| Idle Maximum * (dB) | 23 | 29.4 -28% | 27.64 -20% | 34 -48% | 31 -35% | 25.6 -11% |
| Load Average * (dB) | 51.41 | 35.4 31% | 49.5 4% | 44 14% | 52 -1% | 46.8 9% |
| Cyberpunk 2077 ultra * (dB) | 55.5 | 54.6 2% | 49.5 11% | 48 14% | 52 6% | 49.9 10% |
| Load Maximum * (dB) | 55.5 | 54.7 1% | 52.73 5% | 50 10% | 53 5% | 55.6 -0% |
* ... smaller is better
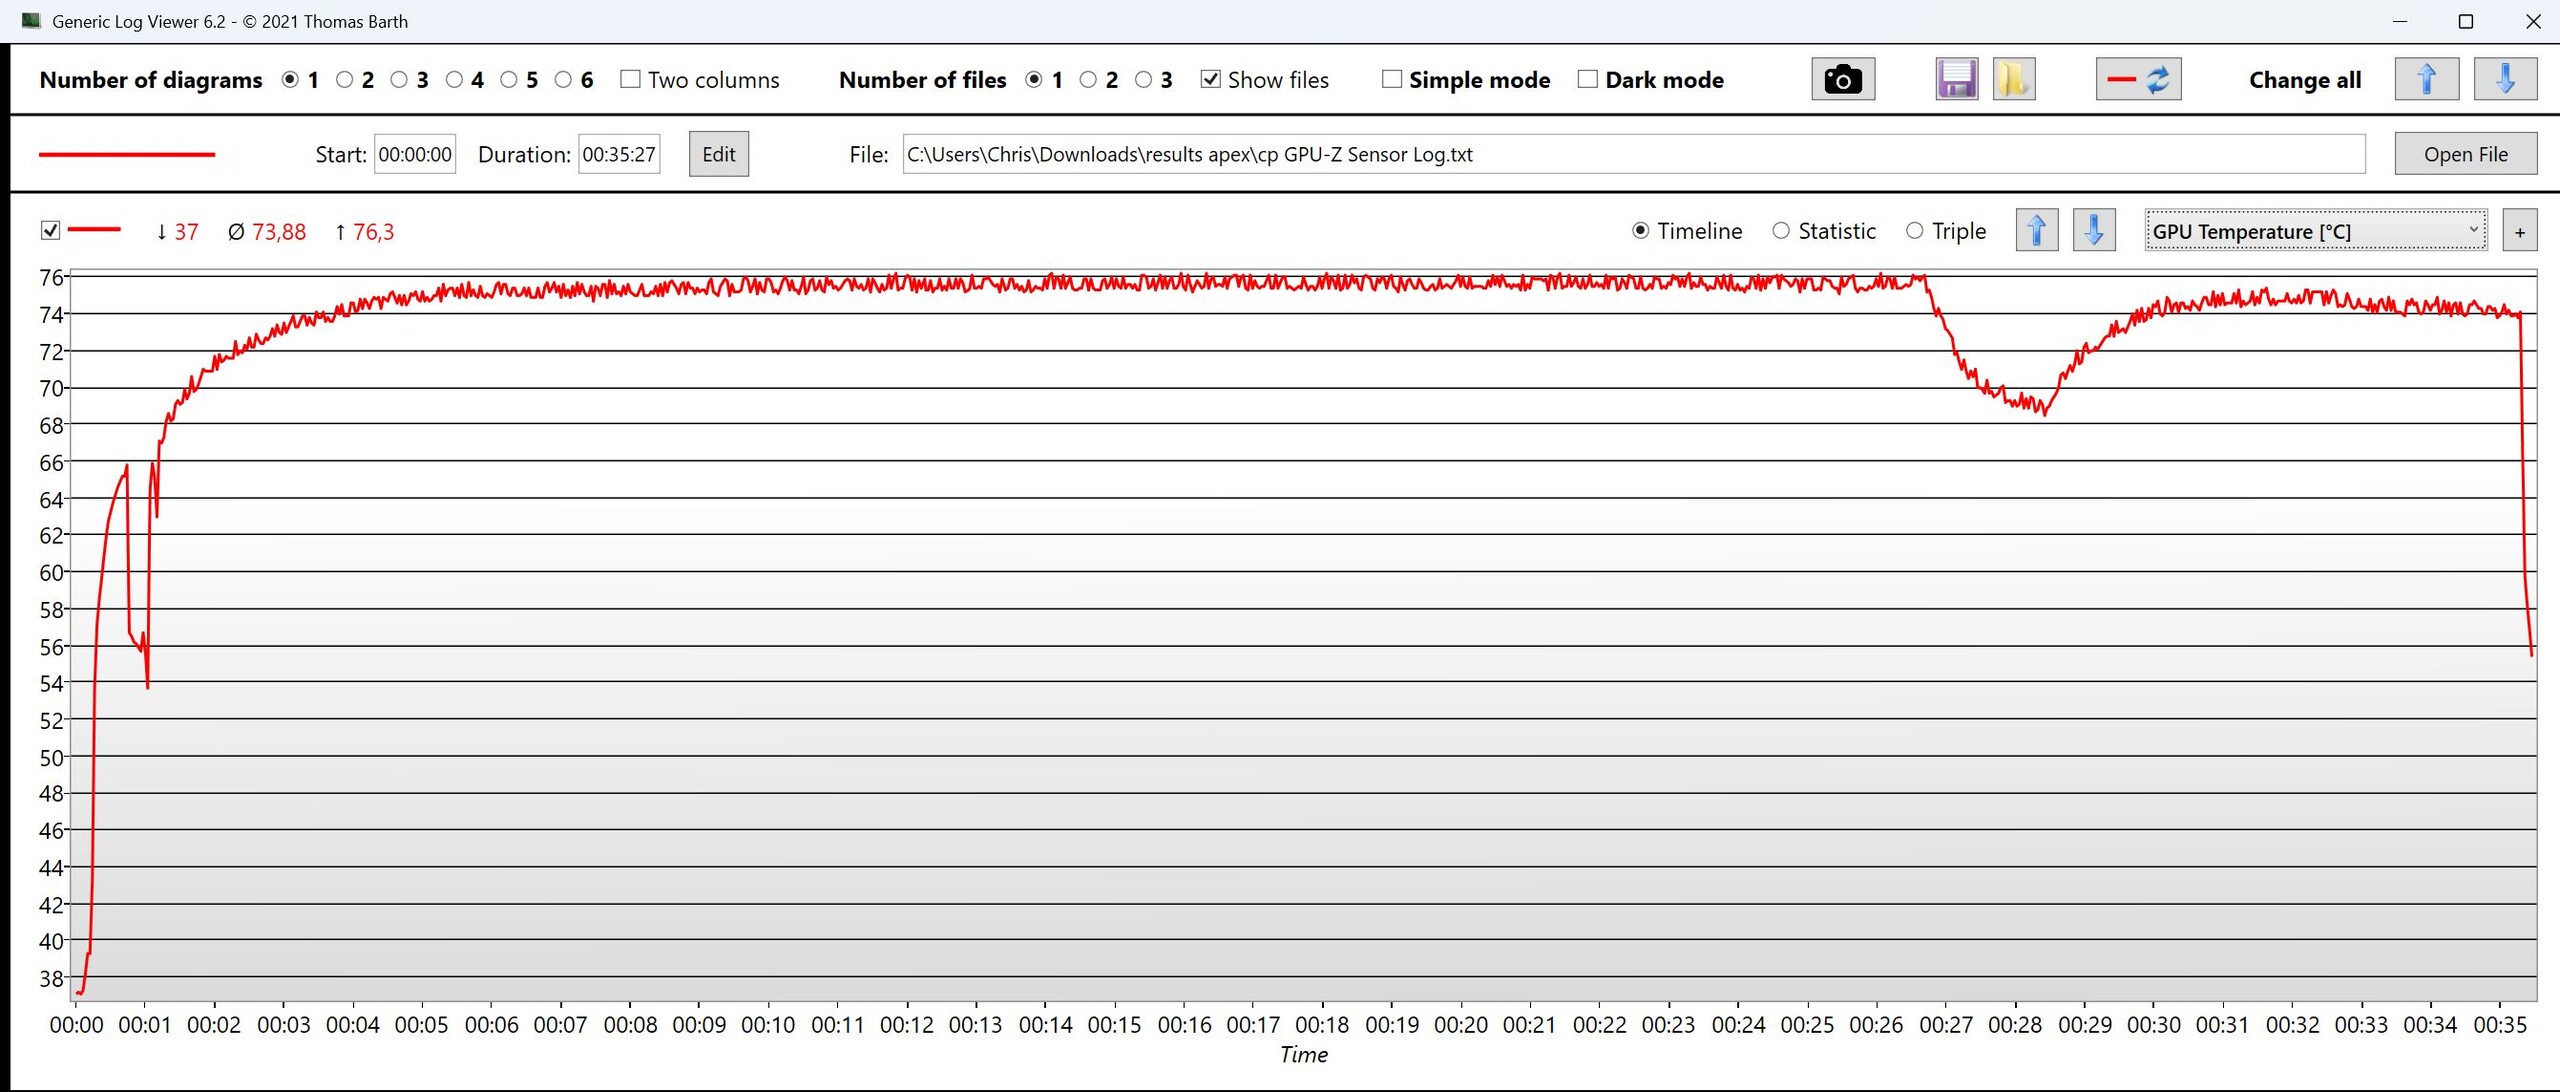
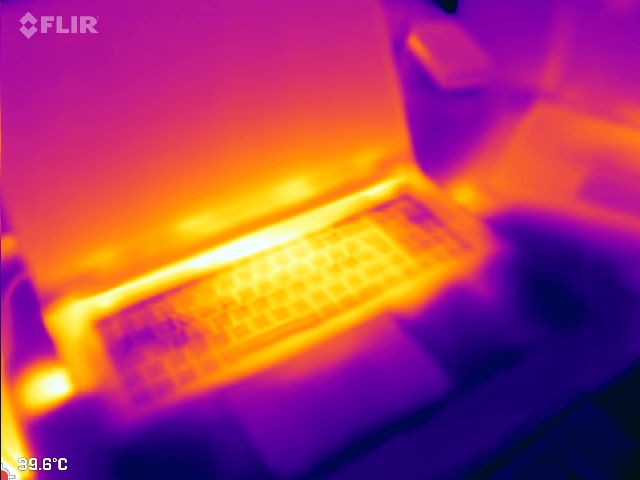
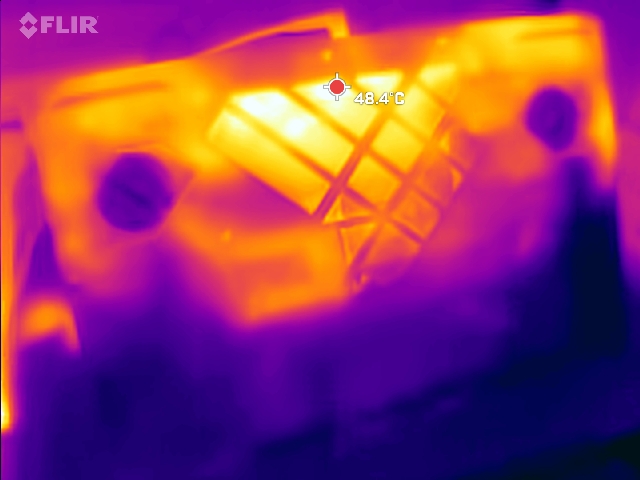
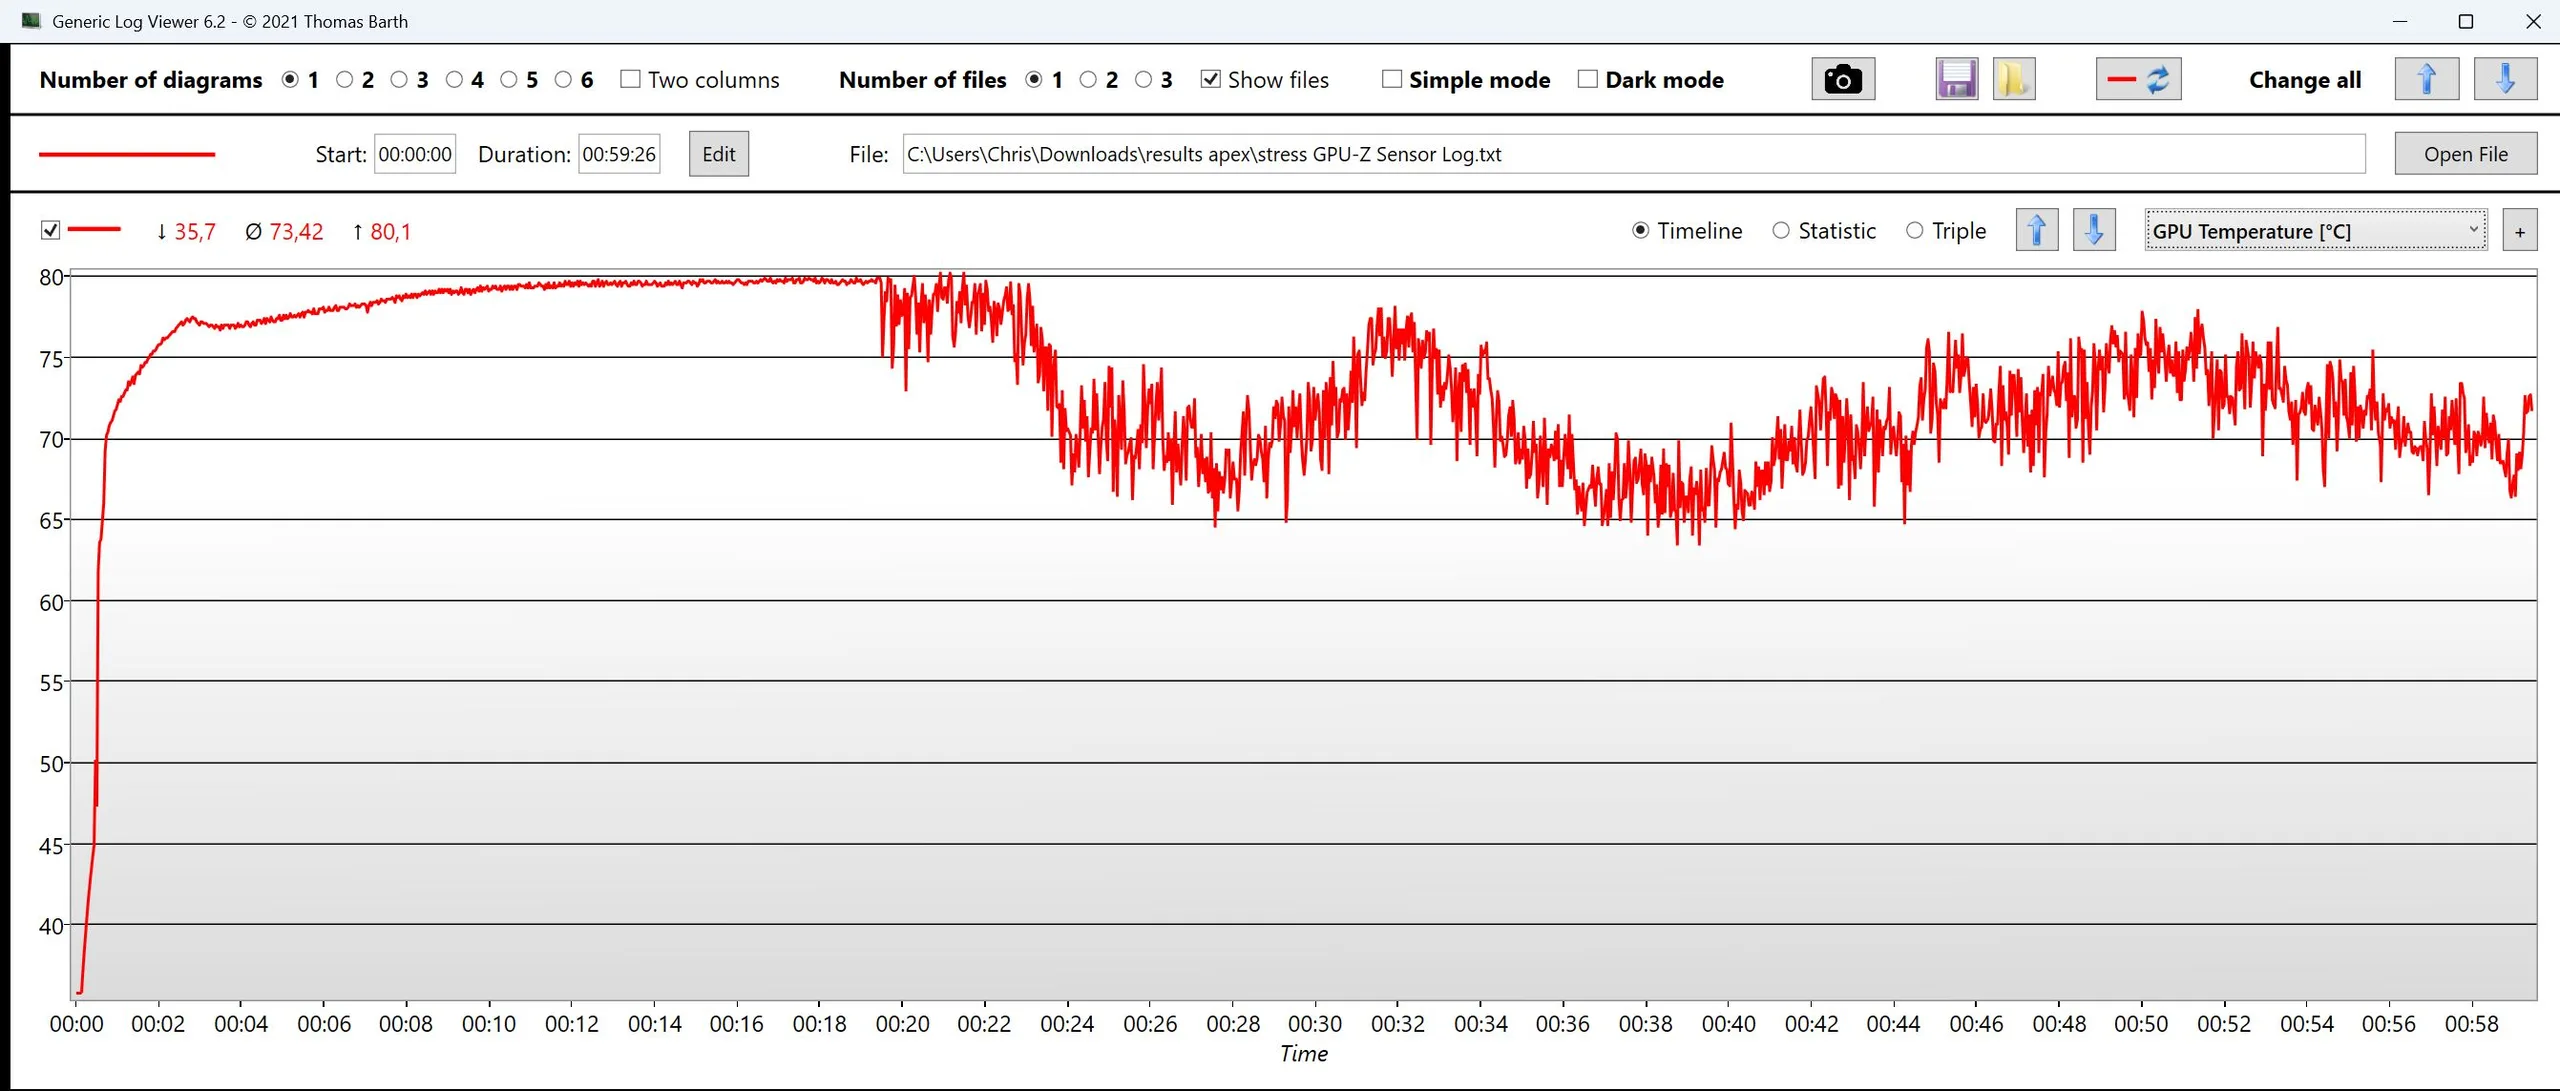
温度
响亮的冷却系统使温度普遍较低。在负载情况下,底部中央测得的热点温度约为 45°C,而其他区域的温度则要低得多。
(+) The maximum temperature on the upper side is 36 °C / 97 F, compared to the average of 40.4 °C / 105 F, ranging from 21.2 to 68.8 °C for the class Gaming.
(±) The bottom heats up to a maximum of 43 °C / 109 F, compared to the average of 43.2 °C / 110 F
(+) In idle usage, the average temperature for the upper side is 24.4 °C / 76 F, compared to the device average of 33.9 °C / 93 F.
(+) 3: The average temperature for the upper side is 29.4 °C / 85 F, compared to the average of 33.9 °C / 93 F for the class Gaming.
(+) The palmrests and touchpad are cooler than skin temperature with a maximum of 27 °C / 80.6 F and are therefore cool to the touch.
(±) The average temperature of the palmrest area of similar devices was 28.8 °C / 83.8 F (+1.8 °C / 3.2 F).
| Schenker XMG Apex 17 M25 R9 9955HX, GeForce RTX 5060 Laptop | Lenovo Legion 7 16IAX10 Ultra 7 255HX, GeForce RTX 5060 Laptop | HP Omen 16-ap0091ng R9 8940HX, GeForce RTX 5060 Laptop | MSI Cyborg 17 B13WFKG i7-13620H, GeForce RTX 5060 Laptop | Tulpar T6 V3.5 i7-14700HX, GeForce RTX 5060 Laptop | |
|---|---|---|---|---|---|
| Heat | -24% | -4% | -33% | -15% | |
| Maximum Upper Side * (°C) | 36 | 47 -31% | 36 -0% | 49 -36% | 40 -11% |
| Maximum Bottom * (°C) | 43 | 44 -2% | 37 14% | 49 -14% | 47 -9% |
| Idle Upper Side * (°C) | 27 | 35.6 -32% | 30 -11% | 37 -37% | 30 -11% |
| Idle Bottom * (°C) | 27 | 35.2 -30% | 32 -19% | 39 -44% | 35 -30% |
* ... smaller is better
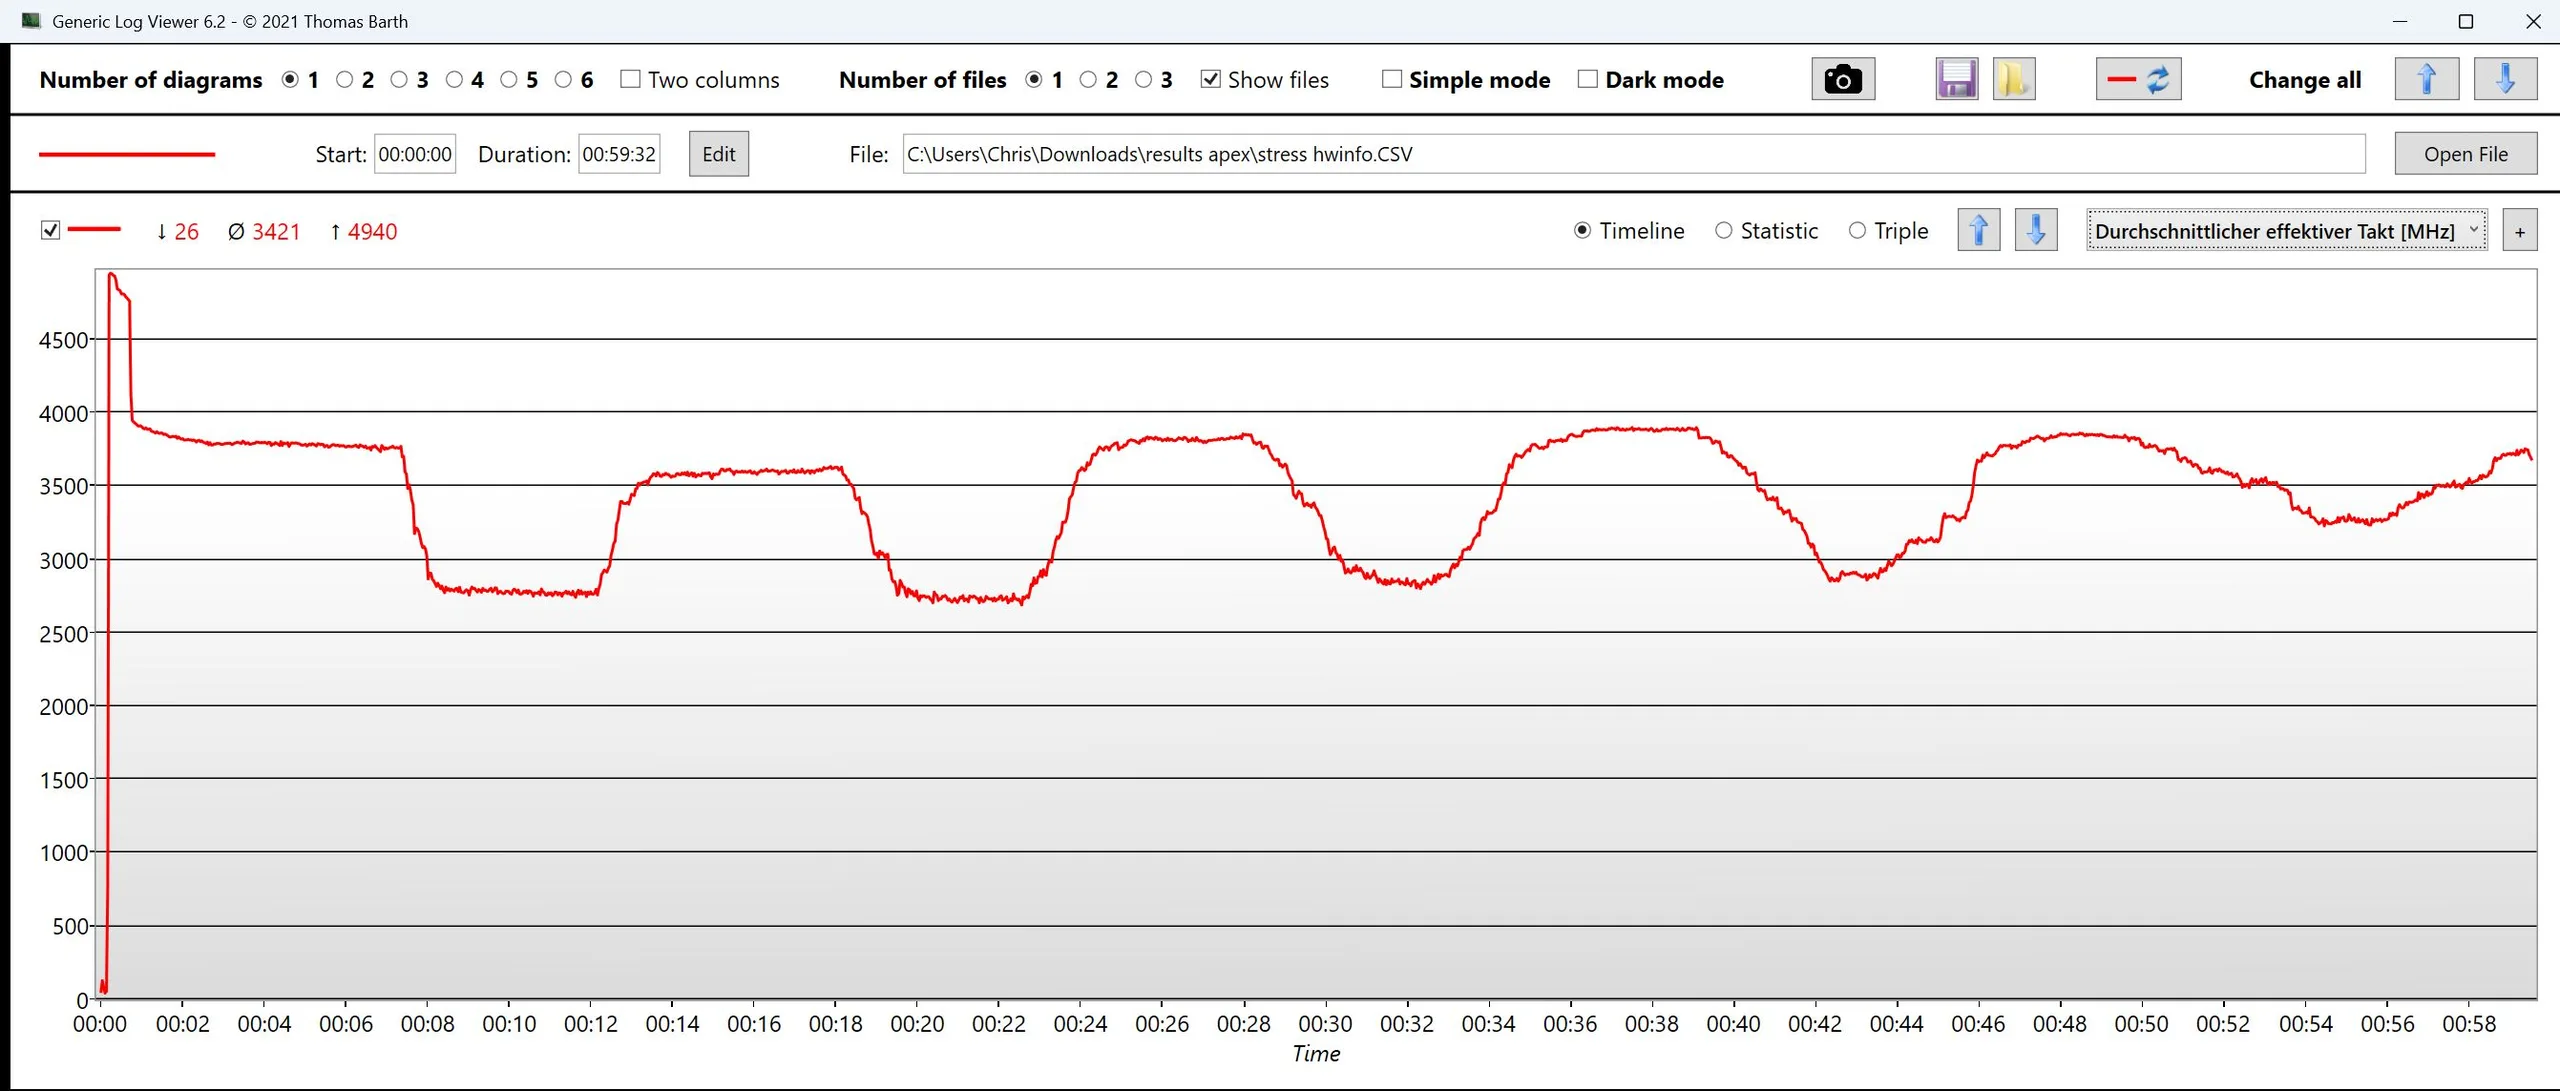
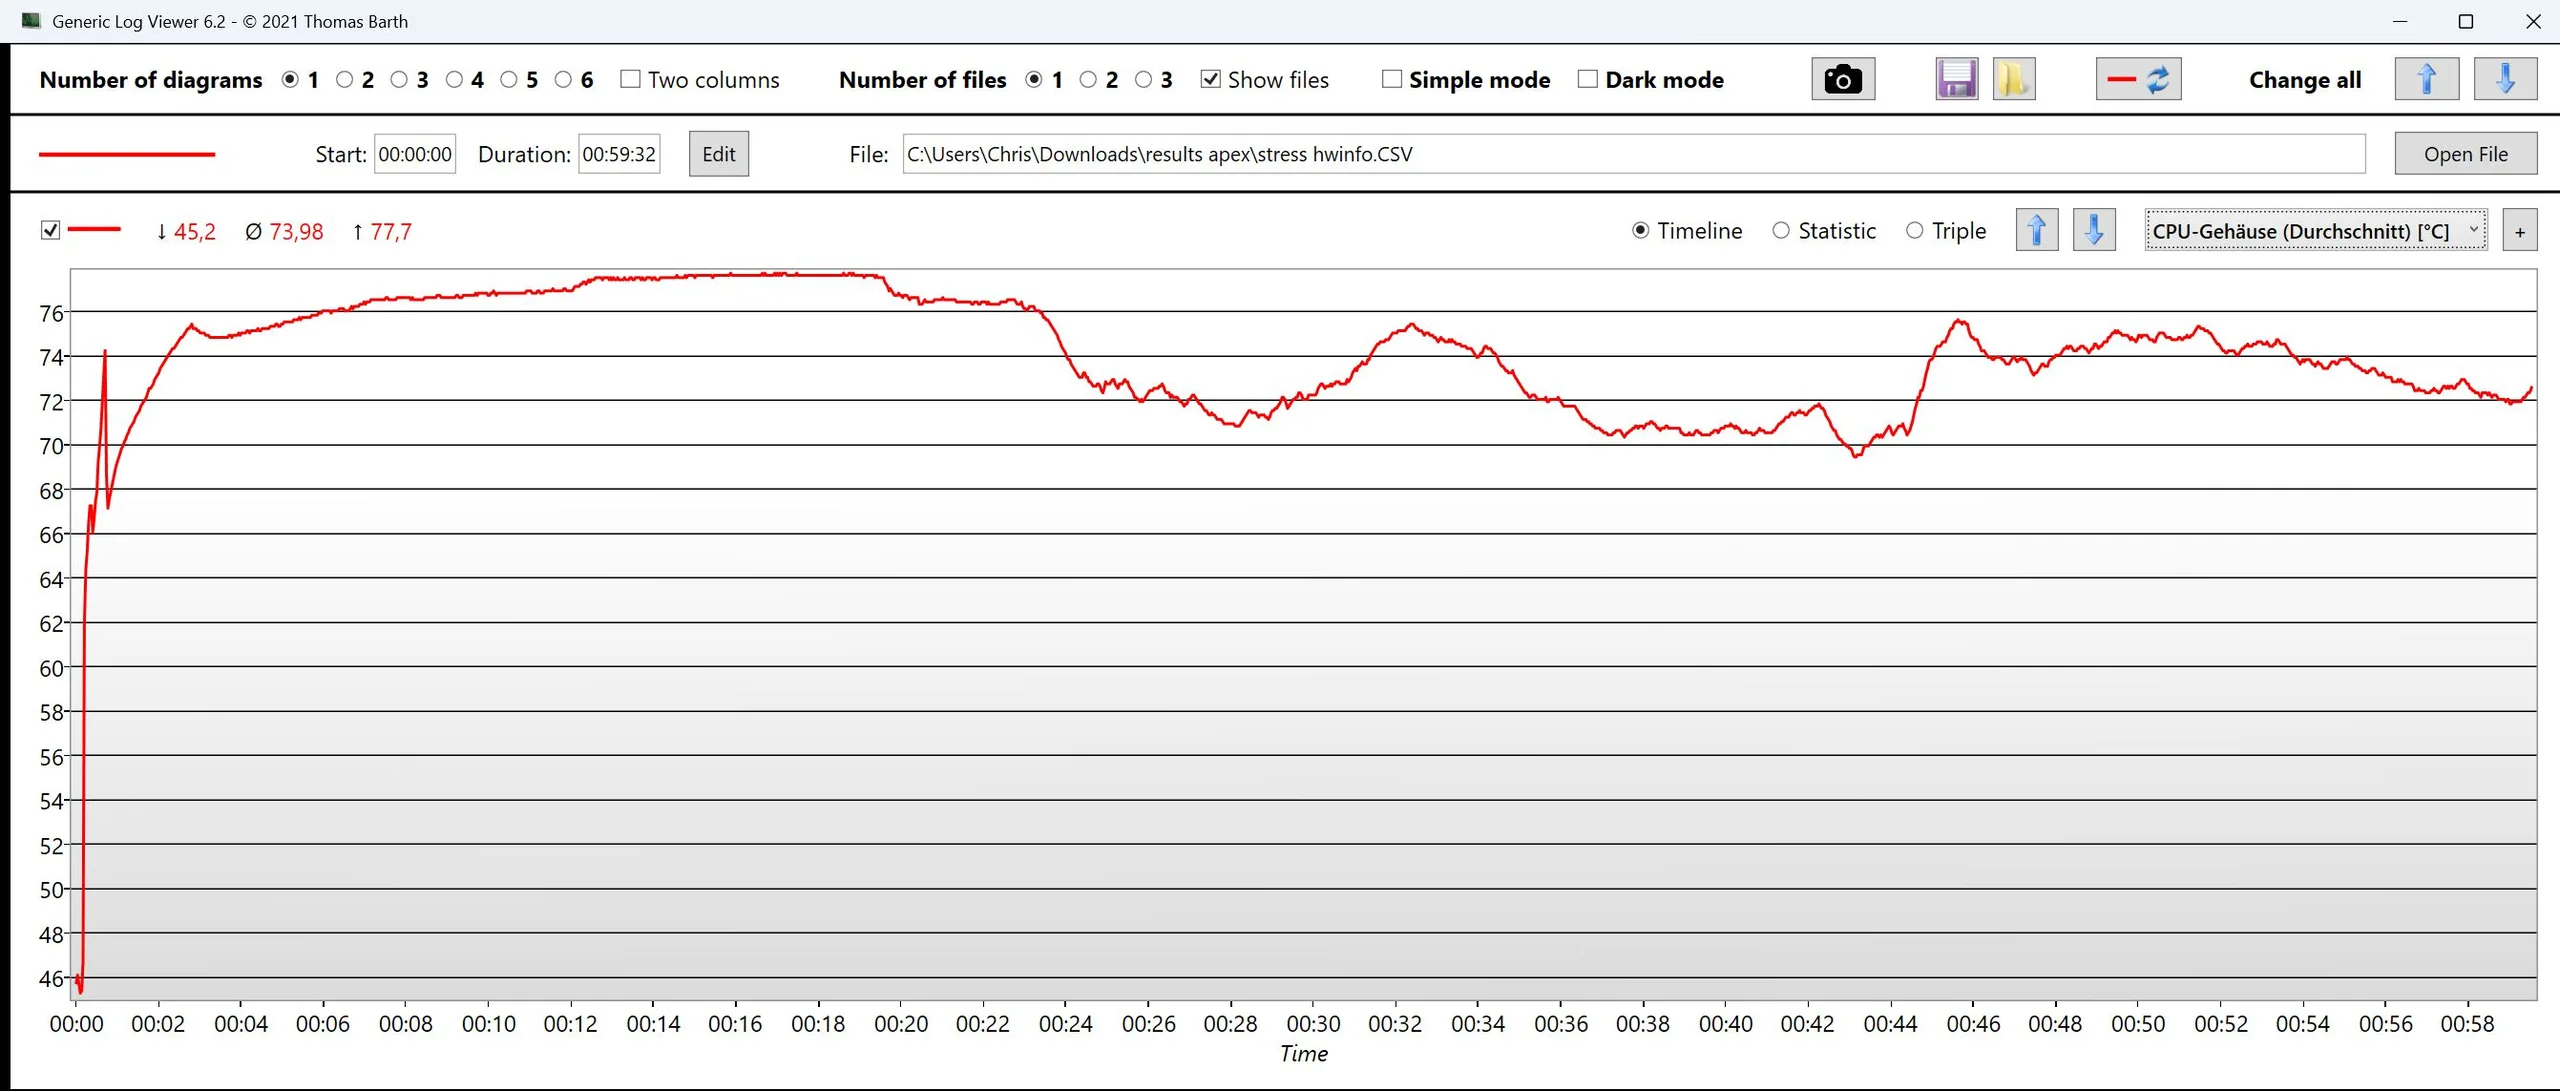
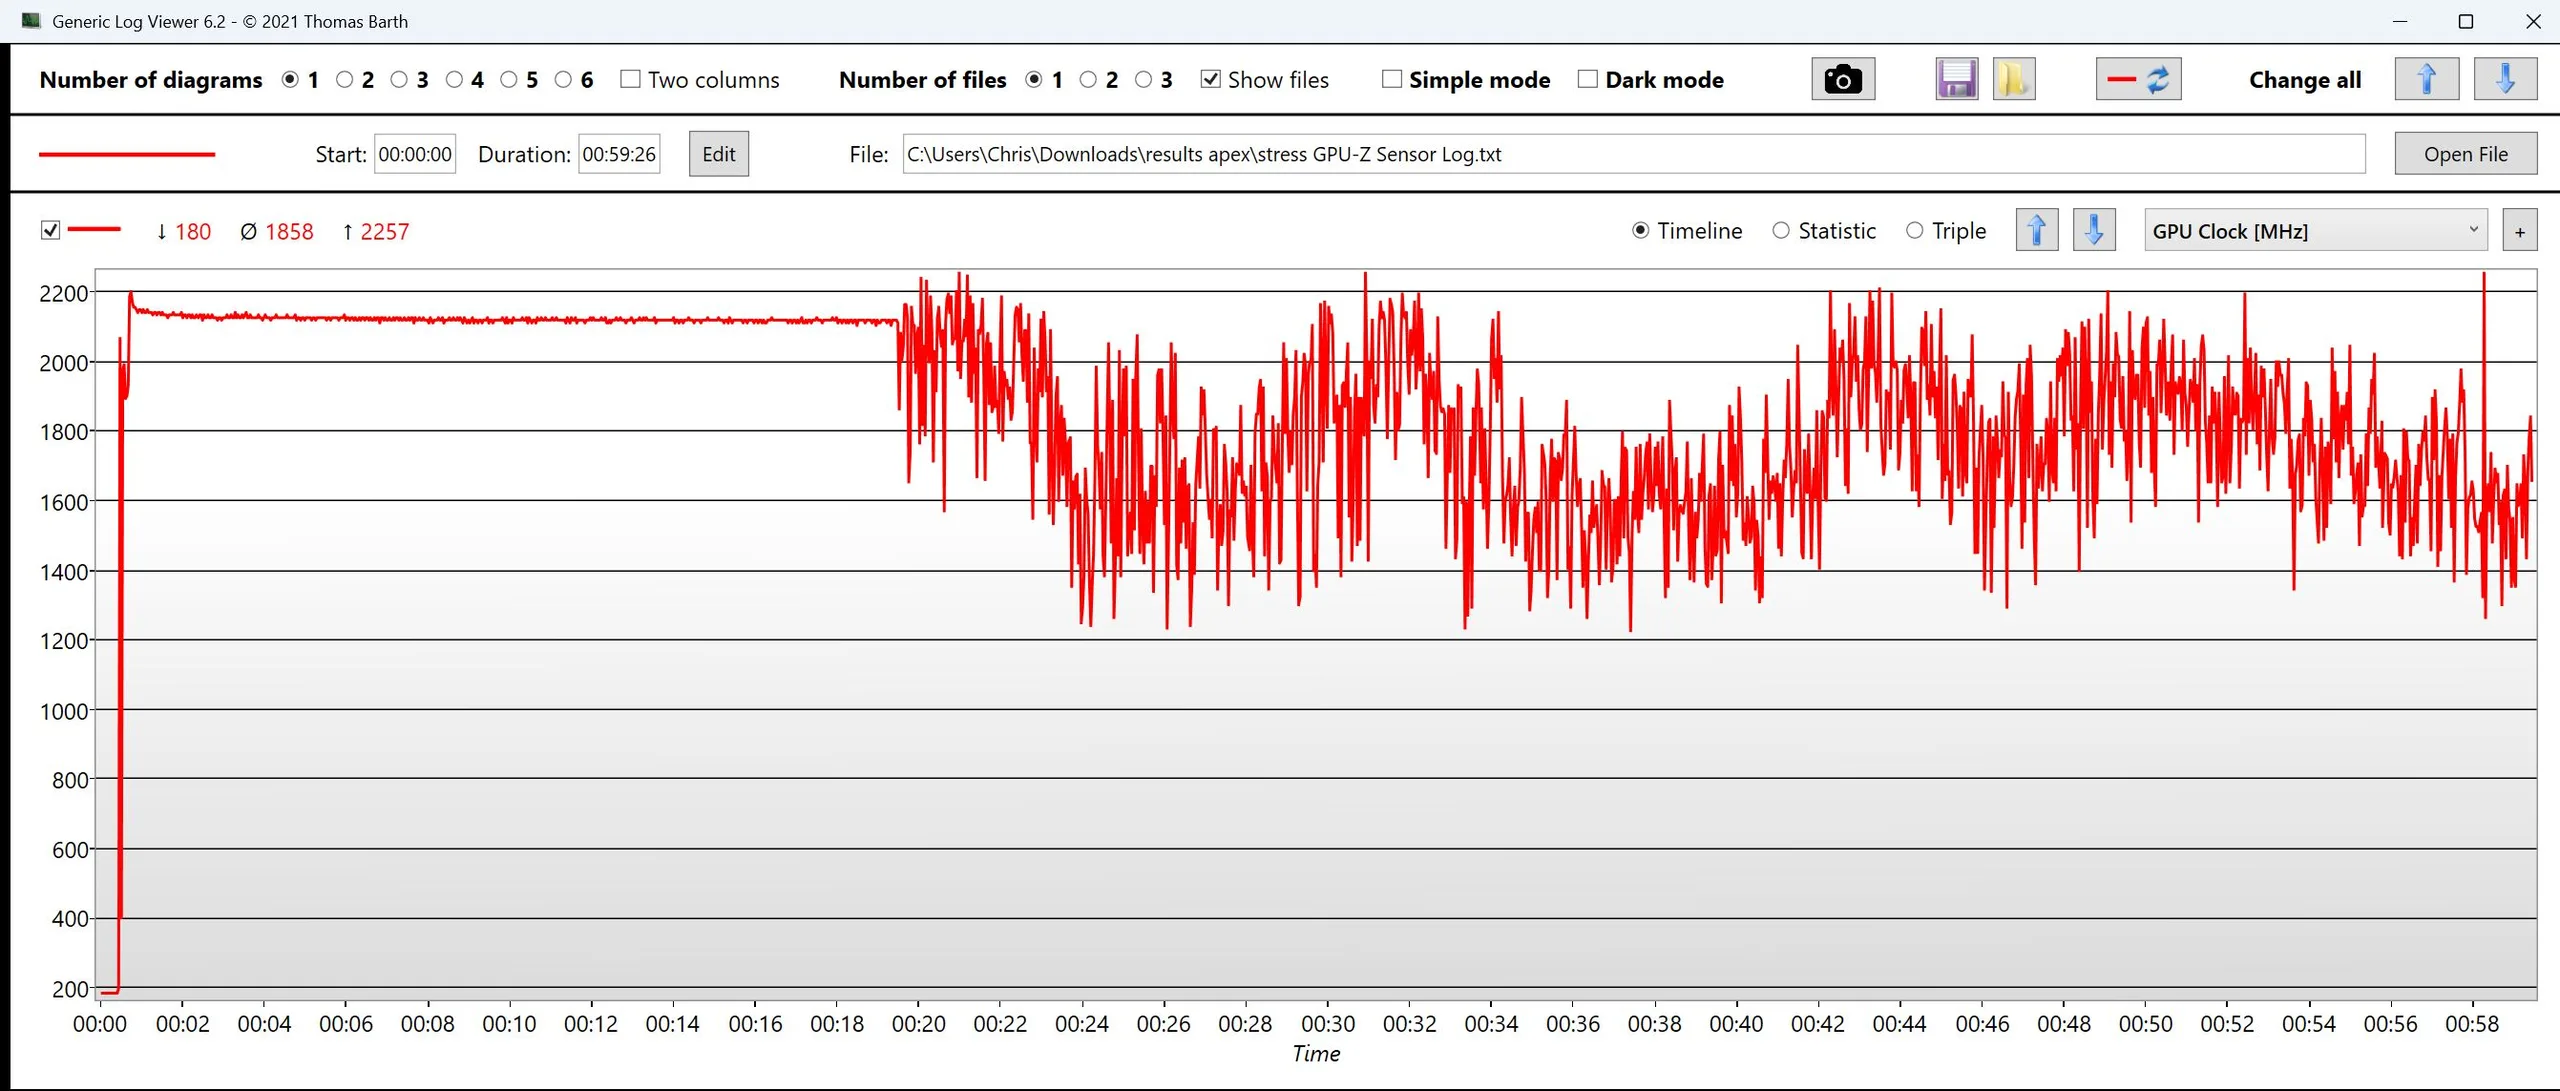
| CPU 时钟 (GHz) | GPU 时钟 (MHz) | CPU 平均温度 (°C) | GPU 平均温度 (°C) | |
| Prime95 + FurMark Stress | 3.4 | 1853 | 74 | 73 |
| 赛博朋克 2077》压力测试 | 1.1 | 2700 | 84 | 74 |
发言人
高音和中音均衡,但低音几乎没有,整体输出功率略显不足。扬声器质量一般。附带一个组合音频插孔。
Schenker XMG Apex 17 M25 audio analysis
(±) | speaker loudness is average but good (80.19 dB)
Bass 100 - 315 Hz
(-) | nearly no bass - on average 29.9% lower than median
(±) | linearity of bass is average (14.6% delta to prev. frequency)
Mids 400 - 2000 Hz
(+) | balanced mids - only 4.7% away from median
(+) | mids are linear (6.7% delta to prev. frequency)
Highs 2 - 16 kHz
(+) | balanced highs - only 4.1% away from median
(+) | highs are linear (6% delta to prev. frequency)
Overall 100 - 16.000 Hz
(±) | linearity of overall sound is average (22.3% difference to median)
Compared to same class
» 80% of all tested devices in this class were better, 6% similar, 14% worse
» The best had a delta of 6%, average was 18%, worst was 132%
Compared to all devices tested
» 65% of all tested devices were better, 6% similar, 29% worse
» The best had a delta of 4%, average was 24%, worst was 134%
Lenovo Legion 7 16IAX10 audio analysis
(±) | speaker loudness is average but good (77.6 dB)
Bass 100 - 315 Hz
(±) | reduced bass - on average 9.5% lower than median
(±) | linearity of bass is average (9.8% delta to prev. frequency)
Mids 400 - 2000 Hz
(+) | balanced mids - only 1.5% away from median
(+) | mids are linear (4% delta to prev. frequency)
Highs 2 - 16 kHz
(+) | balanced highs - only 3% away from median
(+) | highs are linear (4.9% delta to prev. frequency)
Overall 100 - 16.000 Hz
(+) | overall sound is linear (11.5% difference to median)
Compared to same class
» 10% of all tested devices in this class were better, 3% similar, 87% worse
» The best had a delta of 6%, average was 18%, worst was 132%
Compared to all devices tested
» 8% of all tested devices were better, 2% similar, 90% worse
» The best had a delta of 4%, average was 24%, worst was 134%
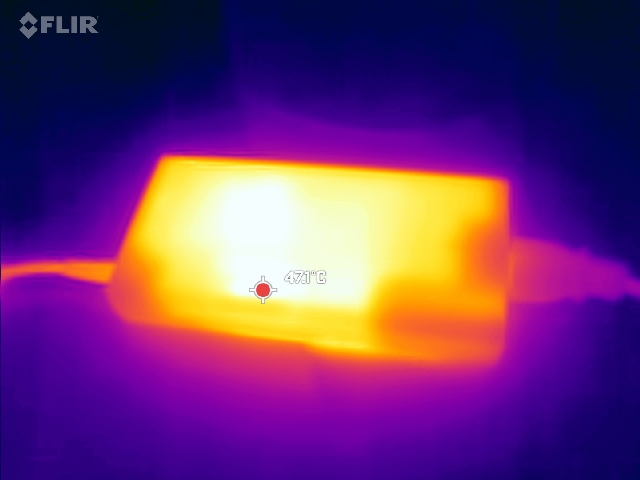
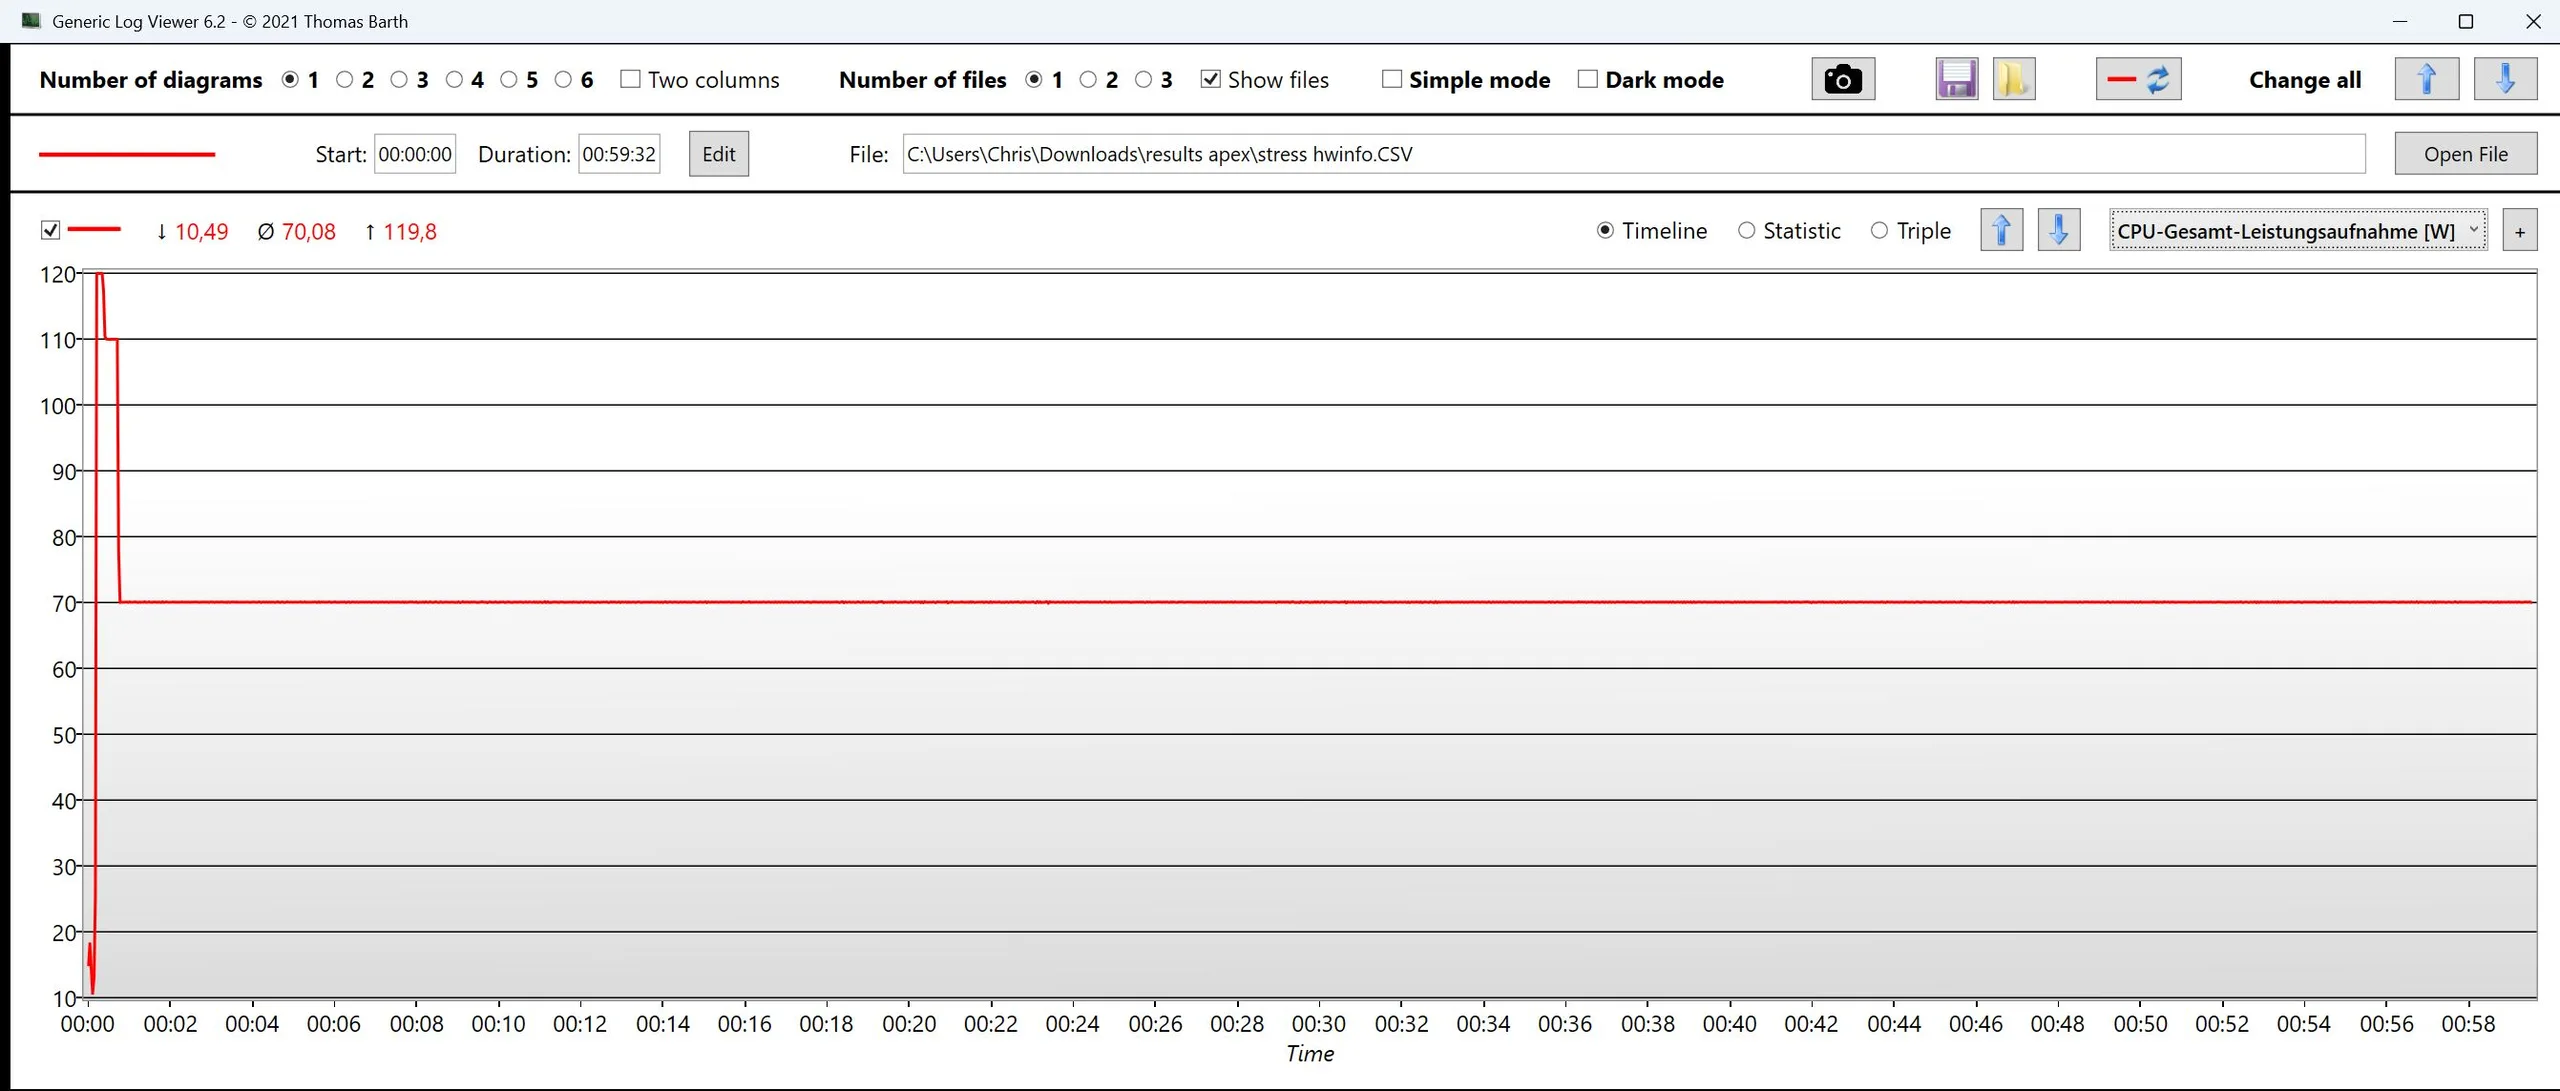
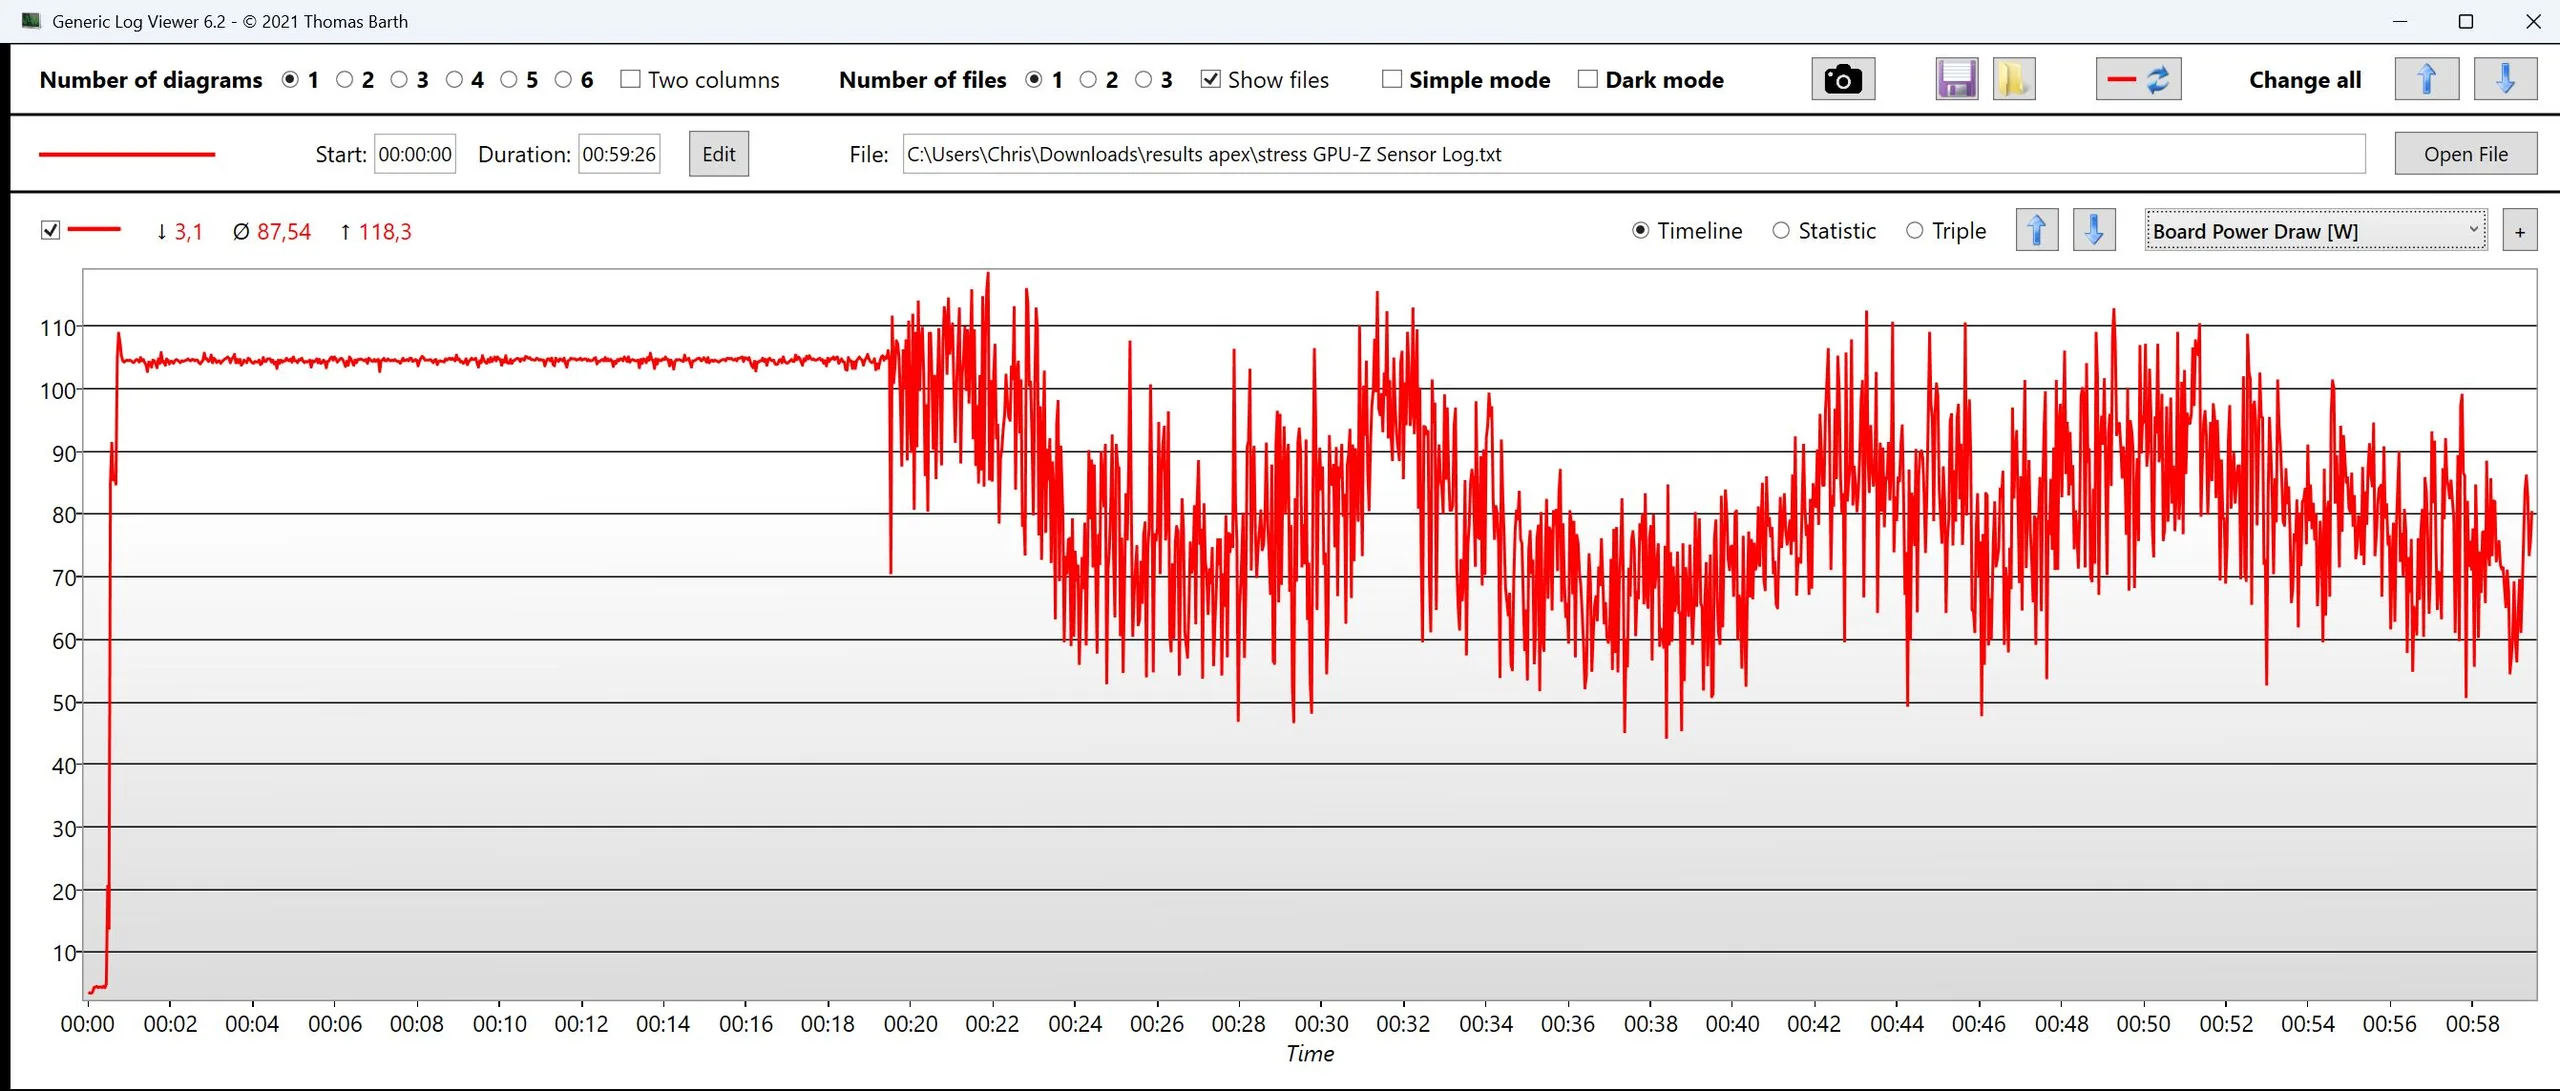
耗电量
与竞争对手相比,高性能的代价是更高的负载功耗。怠速功耗尤其需要优化,因为系统需要很长时间才能稳定在相对较高的怠速水平。
附带的 230 W 电源适配器可能有些过小。虽然游戏功耗平均在 220 W 左右,但也会出现高达 280 W 的短时峰值。
| Off / Standby | |
| Idle | |
| Load |
|
Key:
min: | |
| Schenker XMG Apex 17 M25 R9 9955HX, GeForce RTX 5060 Laptop, Samsung 990 Pro 2 TB MZVL72T0HDLB, IPS, 2560x1440, 17.3" | Lenovo Legion 7 16IAX10 Ultra 7 255HX, GeForce RTX 5060 Laptop, WD PC SN7100S SDFPMSL-1T00-1101, OLED, 2560x1600, 16" | HP Omen 16-ap0091ng R9 8940HX, GeForce RTX 5060 Laptop, Samsung PM9C1b MZVL81T0HFLB-00BH1, IPS, 1920x1200, 16" | MSI Cyborg 17 B13WFKG i7-13620H, GeForce RTX 5060 Laptop, Western Digital PC SN5000S SDEPMSJ-512G, IPS, 1920x1080, 17.3" | Tulpar T6 V3.5 i7-14700HX, GeForce RTX 5060 Laptop, Western Digital PC SN5000S SDEPNSJ-1T00-1006, IPS, 1920x1200, 16" | Alienware 16 Aurora Core 7 240H, GeForce RTX 5060 Laptop, , IPS, 2560x1600, 16" | Average NVIDIA GeForce RTX 5060 Laptop | Average of class Gaming | |
|---|---|---|---|---|---|---|---|---|
| Power Consumption | 4% | 19% | 36% | 17% | 31% | 17% | -5% | |
| Idle Minimum * (Watt) | 11.3 | 9.4 17% | 7.8 31% | 7.9 30% | 6.7 41% | 4.4 61% | 9.32 ? 18% | 13.2 ? -17% |
| Idle Average * (Watt) | 16.7 | 10.6 37% | 8.8 47% | 12.7 24% | 13.7 18% | 18 -8% | 13.9 ? 17% | 18.9 ? -13% |
| Idle Maximum * (Watt) | 20.7 | 36.4 -76% | 21.5 -4% | 18.1 13% | 21.8 -5% | 18.2 12% | 19.6 ? 5% | 24.3 ? -17% |
| Load Average * (Watt) | 121 | 107.7 11% | 119 2% | 90 26% | 127 -5% | 87.1 28% | 94.9 ? 22% | 108 ? 11% |
| Cyberpunk 2077 ultra * (Watt) | 220 | 188 15% | 192 13% | 109.7 50% | 156.7 29% | 123 44% | ||
| Cyberpunk 2077 ultra external monitor * (Watt) | 209 | 187.5 10% | 164.5 21% | 108.4 48% | 151.9 27% | 120.6 42% | ||
| Load Maximum * (Watt) | 281 | 247 12% | 208 26% | 115 59% | 242 14% | 183 35% | 211 ? 25% | 254 ? 10% |
* ... smaller is better
功耗 赛博朋克/压力测试
带外部监视器时的耗电量
电池寿命
电池容量为 73 Wh,在同类产品中处于较低水平。不过,在我们的 Wi-Fi 测试中,Apex 的续航时间略低于 6 小时,这是一个不错的成绩。
| Schenker XMG Apex 17 M25 R9 9955HX, GeForce RTX 5060 Laptop, 73 Wh | HP Omen 17z-db100 Ryzen AI 7 350, GeForce RTX 5070 Laptop, 83 Wh | Acer Nitro v 17 (ANV17-41-R4CJ) R7 260, GeForce RTX 5070 Laptop, 76 Wh | MSI Katana 17 HX B14WGK i7-14650HX, GeForce RTX 5070 Laptop, 75 Wh | Lenovo Legion 7 16IAX10 Ultra 7 255HX, GeForce RTX 5060 Laptop, 84 Wh | Average of class Gaming | |
|---|---|---|---|---|---|---|
| Battery runtime | ||||||
| WiFi v1.3 (h) | 5.8 | 8 38% | 4.7 -19% | 5.1 -12% | 4.7 -19% | 7.02 ? 21% |
Schenker XMG Apex 17 M25
- 02/12/2026 v8
Christian Hintze
 Total Sustainability Score:
 可比较的替代品
Image | Model / Review | Price | Weight | Height | Display |
|---|---|---|---|---|---|
1. 82.1%  | Schenker XMG Apex 17 M25 AMD Ryzen 9 9955HX ⎘ NVIDIA GeForce RTX 5060 Laptop ⎘ 32 GB Memory, 2048 GB SSD | Amazon: List Price: 1899 Euro | 2.8 kg | 28.6 mm | 17.30" 2560x1440 170 PPI IPS |
2. 81.8%  | HP Omen 17z-db100 AMD Ryzen AI 7 350 ⎘ NVIDIA GeForce RTX 5070 Laptop ⎘ 96 GB Memory, 4000 GB SSD | Amazon: List Price: 1550 USD | 2.9 kg | 30.1 mm | 17.30" 2560x1440 170 PPI IPS |
3. 80.2%  | Acer Nitro v 17 (ANV17-41-R4CJ) AMD Ryzen 7 260 ⎘ NVIDIA GeForce RTX 5070 Laptop ⎘ 16 GB Memory, 1024 GB SSD | Amazon: List Price: 1199 Euro | 2.7 kg | 24 mm | 17.30" 1920x1080 127 PPI IPS |
4. 79.6%  | MSI Crosshair A17 HX D8WGKG AMD Ryzen 9 8940HX ⎘ NVIDIA GeForce RTX 5070 Laptop ⎘ 32 GB Memory, 1024 GB SSD | Amazon: List Price: 2000 EUR | 2.9 kg | 29.7 mm | 17.00" 2560x1600 178 PPI IPS |
5. 77.3%  | MSI Katana 17 HX B14WGK Intel Core i7-14650HX ⎘ NVIDIA GeForce RTX 5070 Laptop ⎘ 16 GB Memory, 1024 GB SSD | Amazon: List Price: 1800 EUR | 2.7 kg | 28 mm | 17.30" 2560x1440 170 PPI IPS |
6. 86.6% 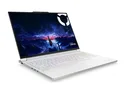 | Lenovo Legion 7 16IAX10 Intel Core Ultra 7 255HX ⎘ NVIDIA GeForce RTX 5060 Laptop ⎘ 32 GB Memory, 1024 GB SSD | Amazon: List Price: 1650 USD | 2 kg | 17.9 mm | 16.00" 2560x1600 189 PPI OLED |
7. 82.5% 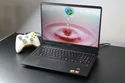 | HP Omen 16-ap0091ng AMD Ryzen 9 8940HX ⎘ NVIDIA GeForce RTX 5060 Laptop ⎘ 16 GB Memory, 1000 GB SSD | Amazon: List Price: 1500 Euro | 2.4 kg | 23.7 mm | 16.00" 1920x1200 162 PPI IPS |
Transparency
The selection of devices to be reviewed is made by our editorial team. The test sample was provided to the author as a loan by the manufacturer or retailer for the purpose of this review. The lender had no influence on this review, nor did the manufacturer receive a copy of this review before publication. There was no obligation to publish this review. As an independent media company, Notebookcheck is not subjected to the authority of manufacturers, retailers or publishers.
This is how Notebookcheck is testing
Every year, Notebookcheck independently reviews hundreds of laptops and smartphones using standardized procedures to ensure that all results are comparable. We have continuously developed our test methods for around 20 years and set industry standards in the process. In our test labs, high-quality measuring equipment is utilized by experienced technicians and editors. These tests involve a multi-stage validation process. Our complex rating system is based on hundreds of well-founded measurements and benchmarks, which maintains objectivity. Further information on our test methods can be found here.

