结论--联想Legion 7a 16 比以前更轻,但也更慢了
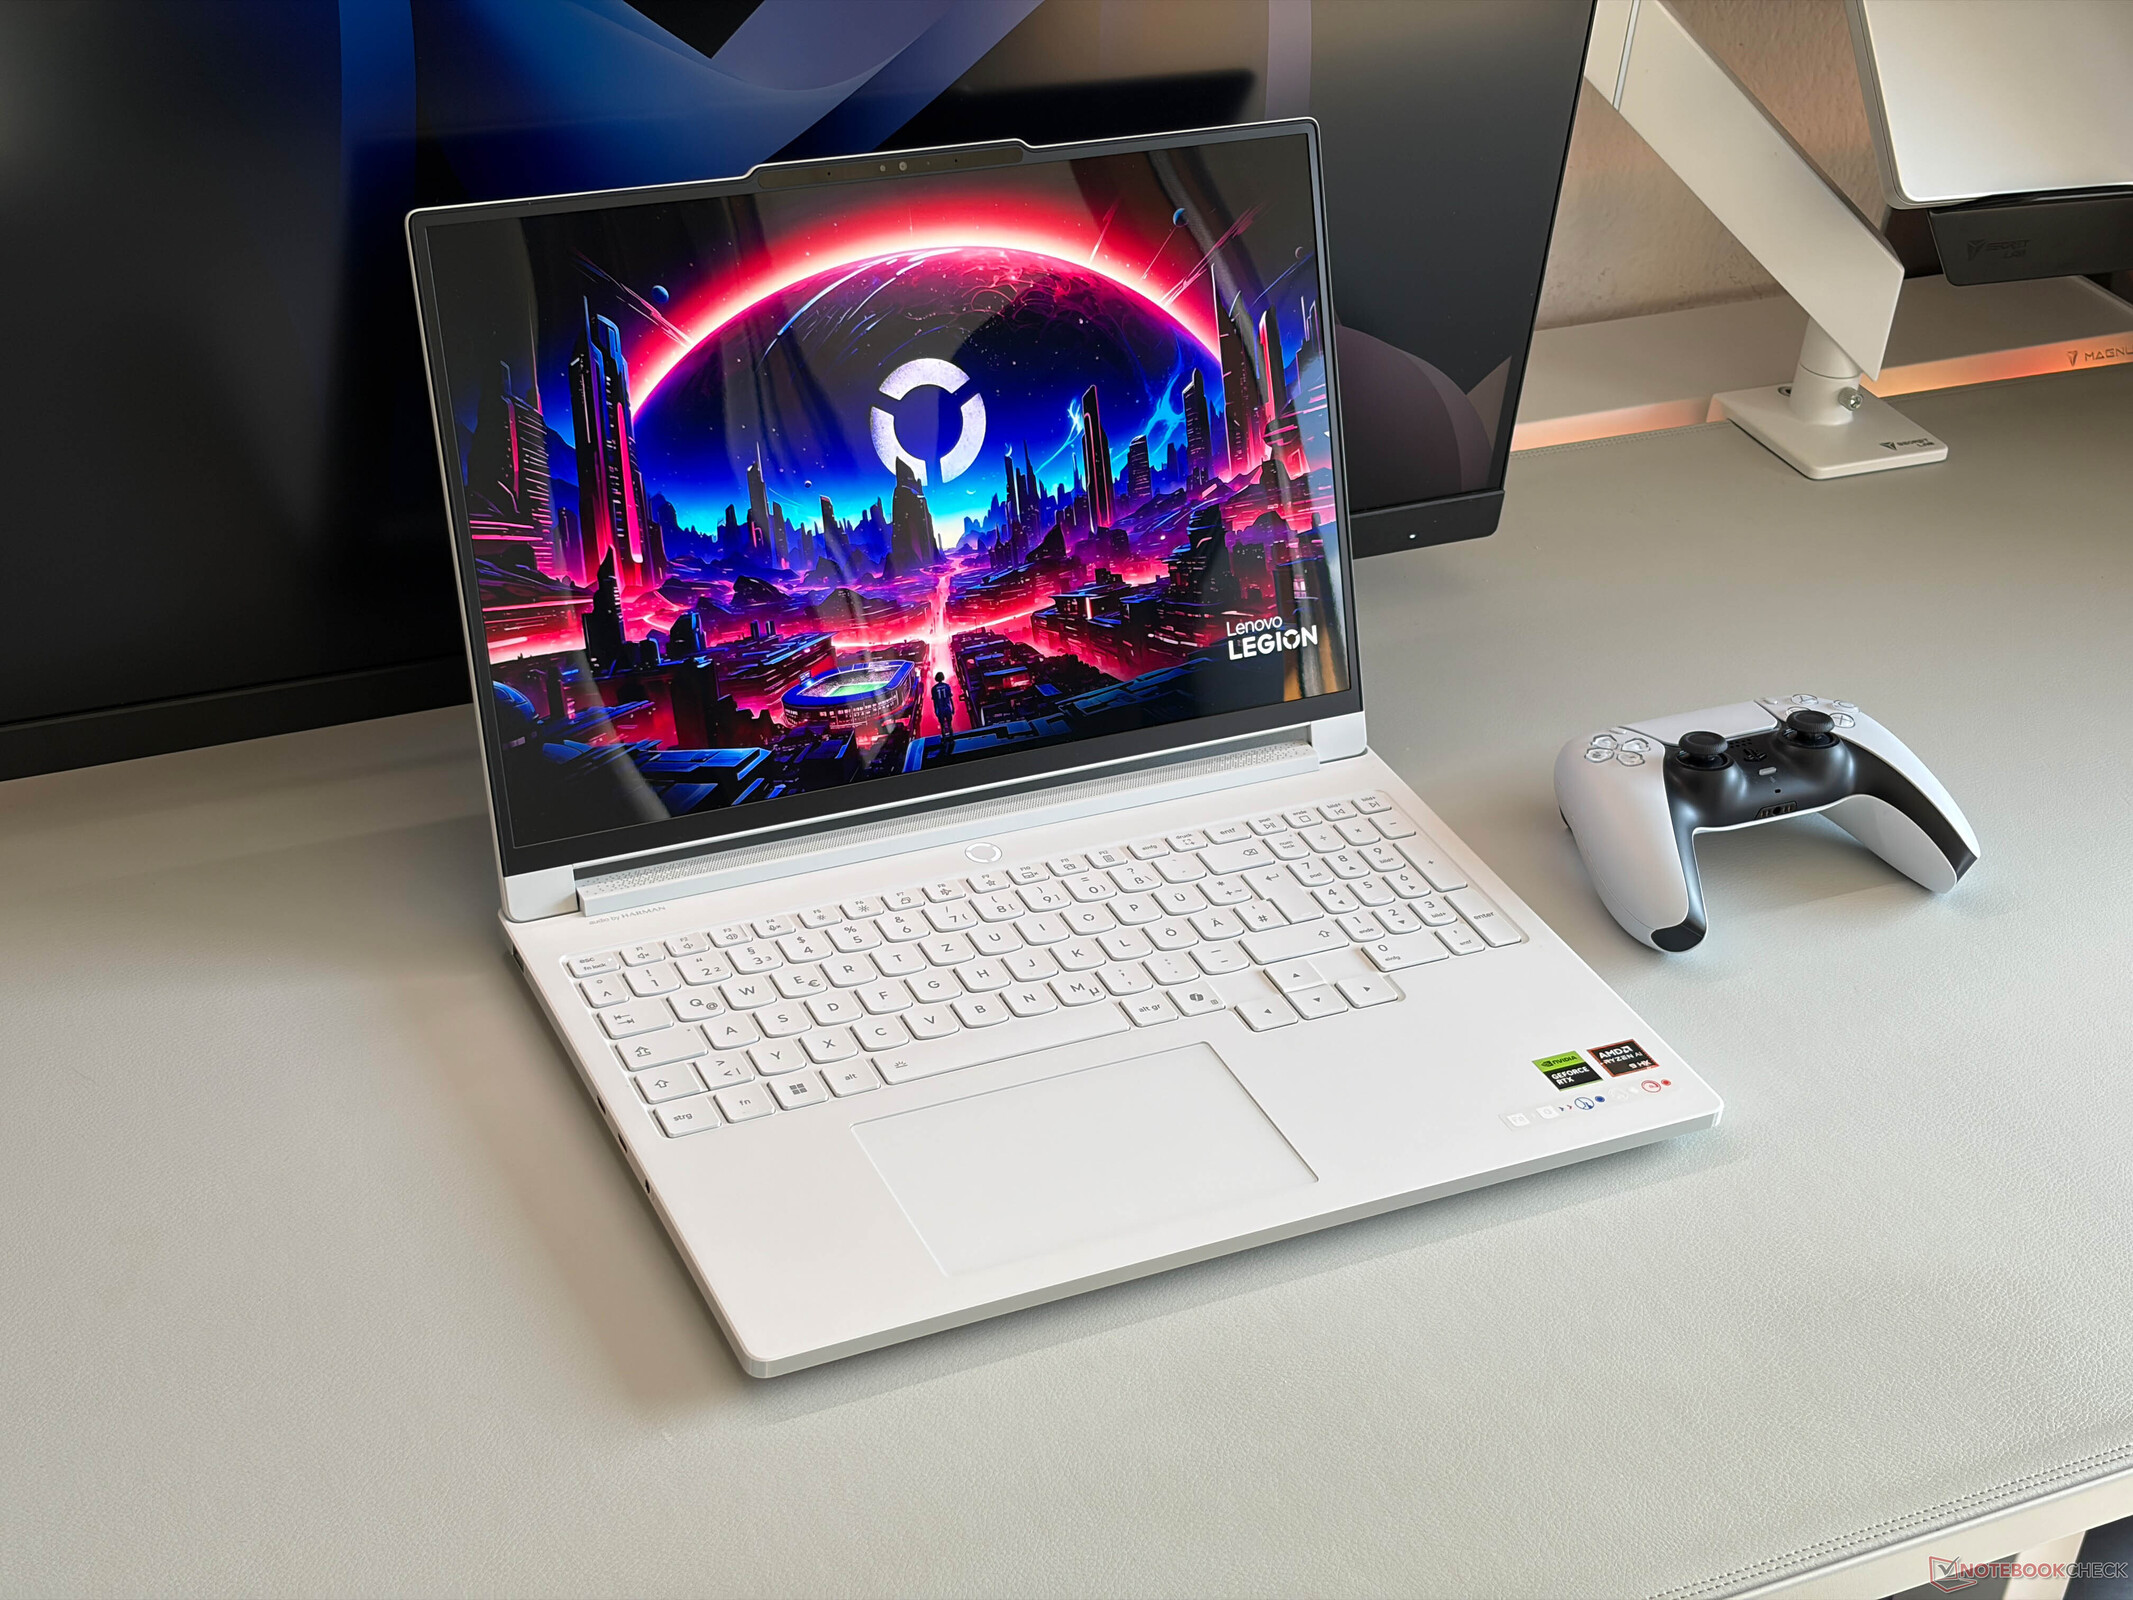
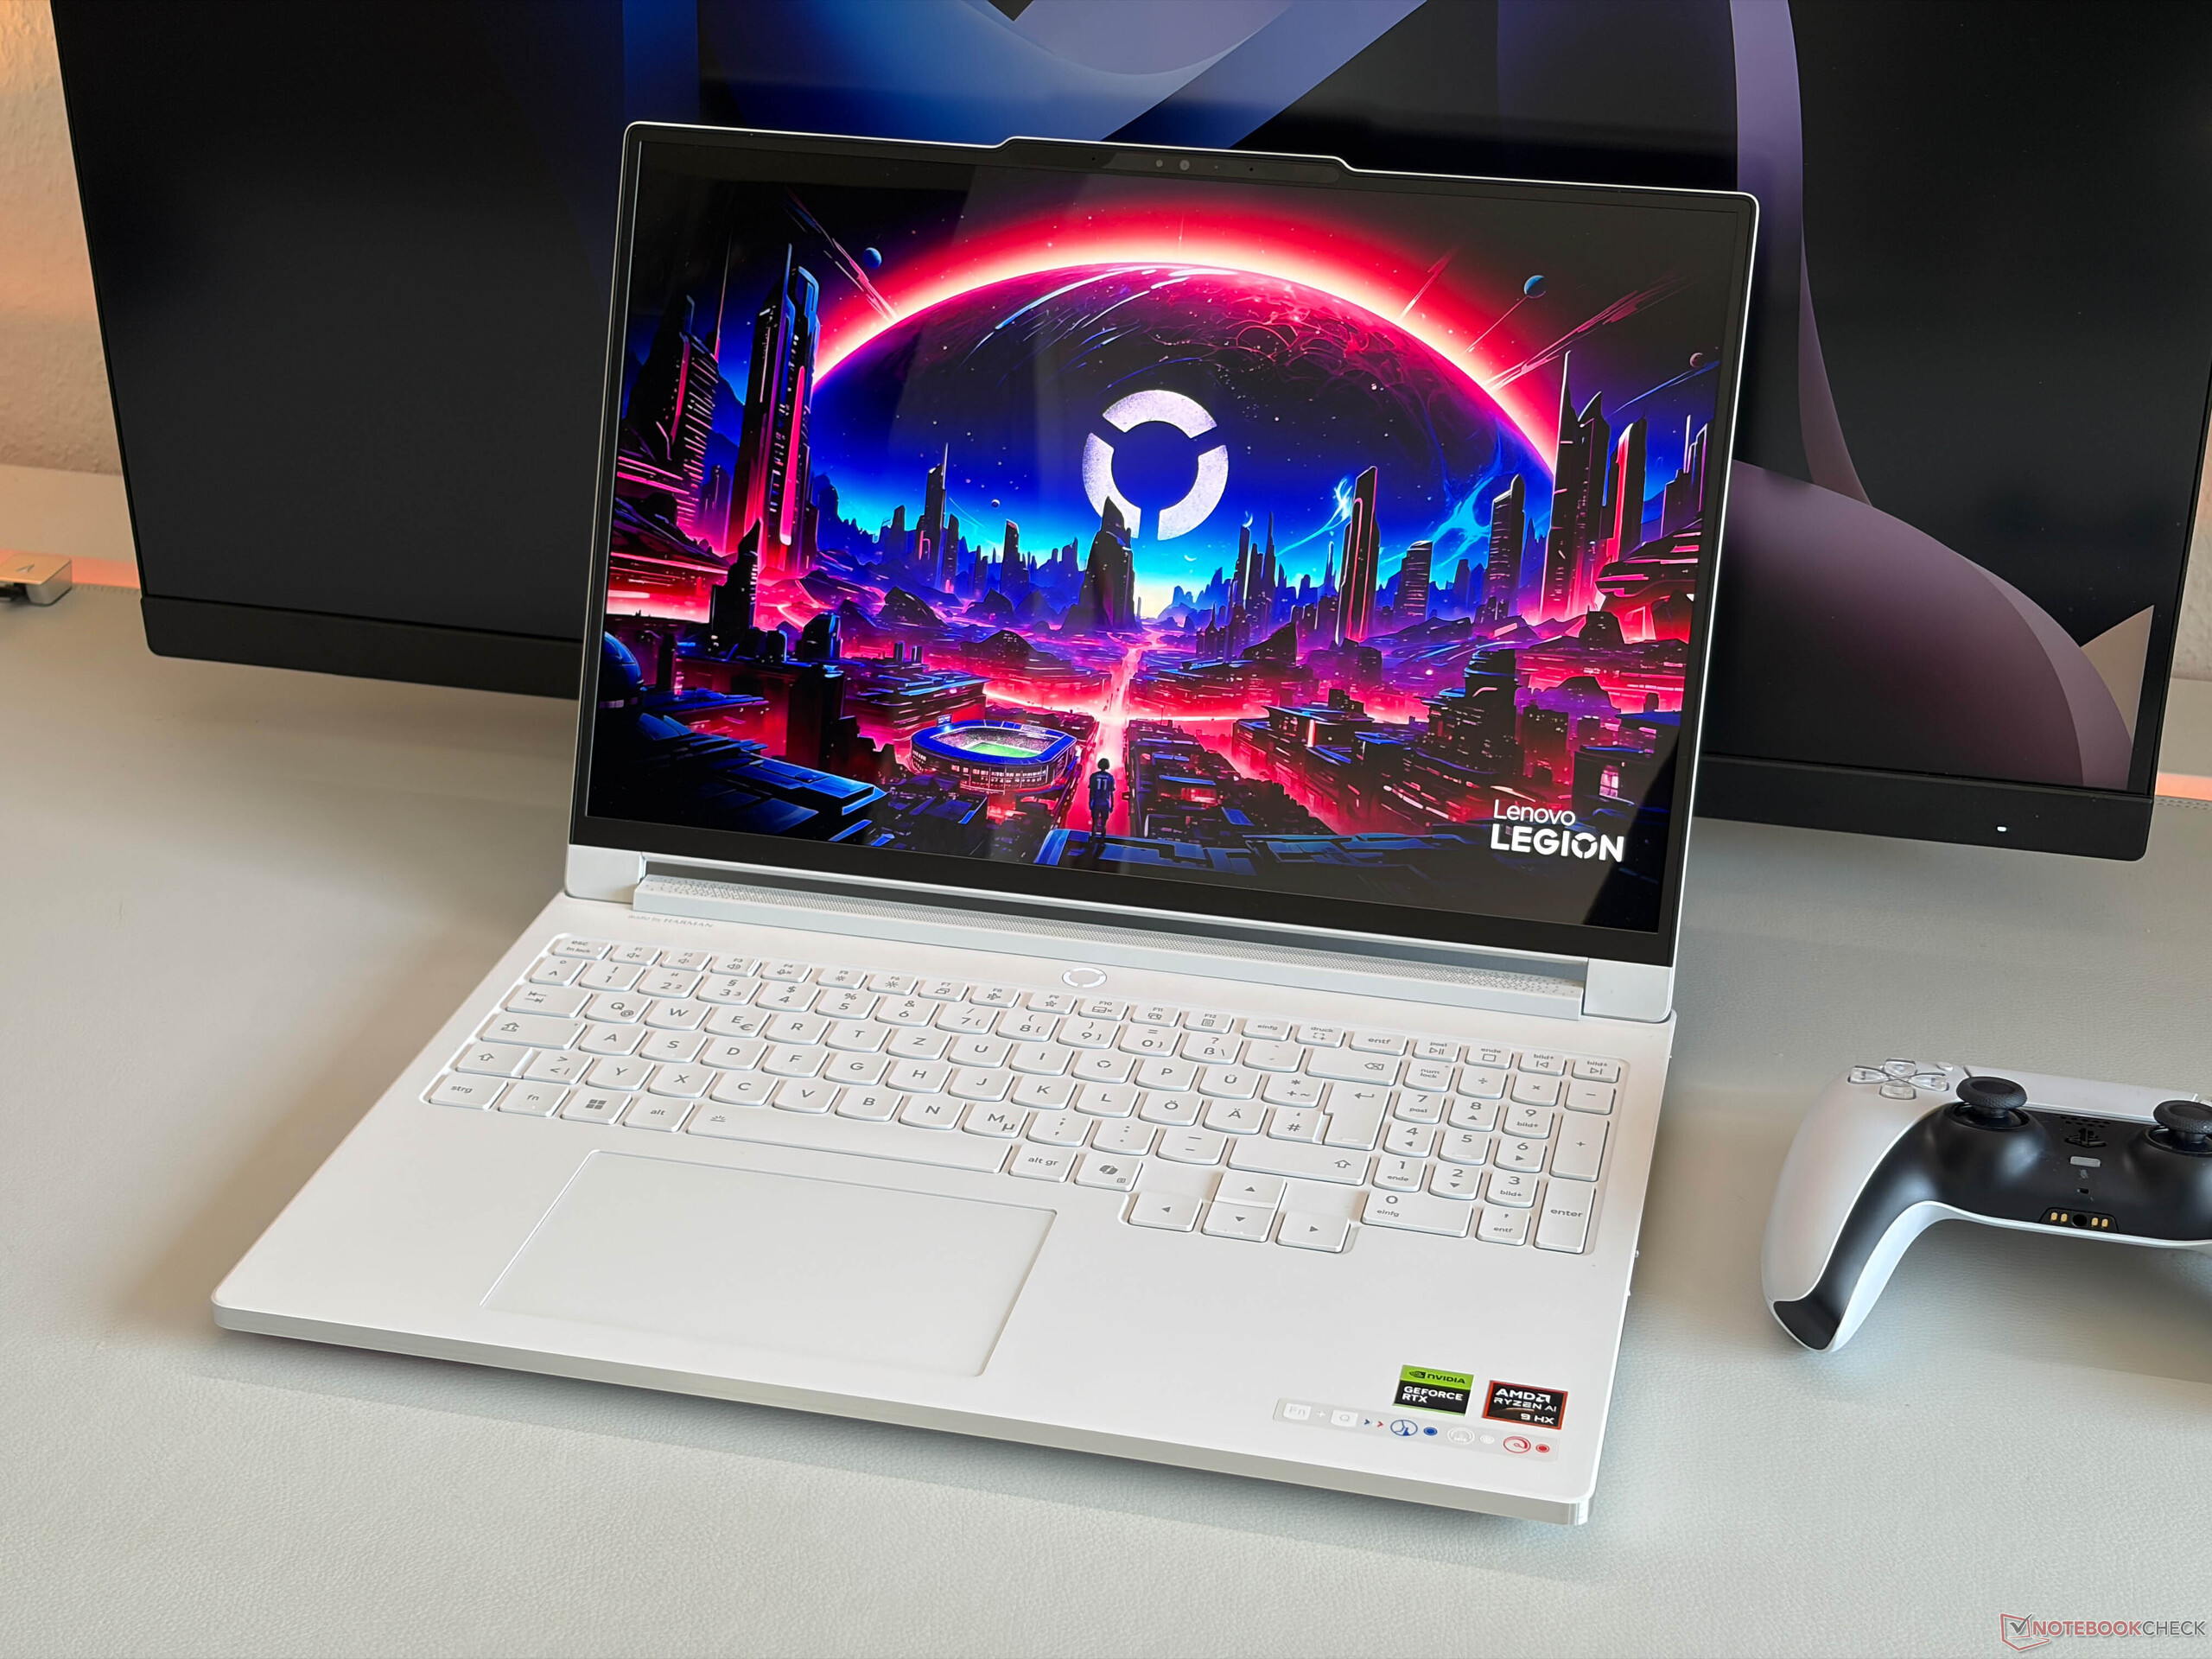
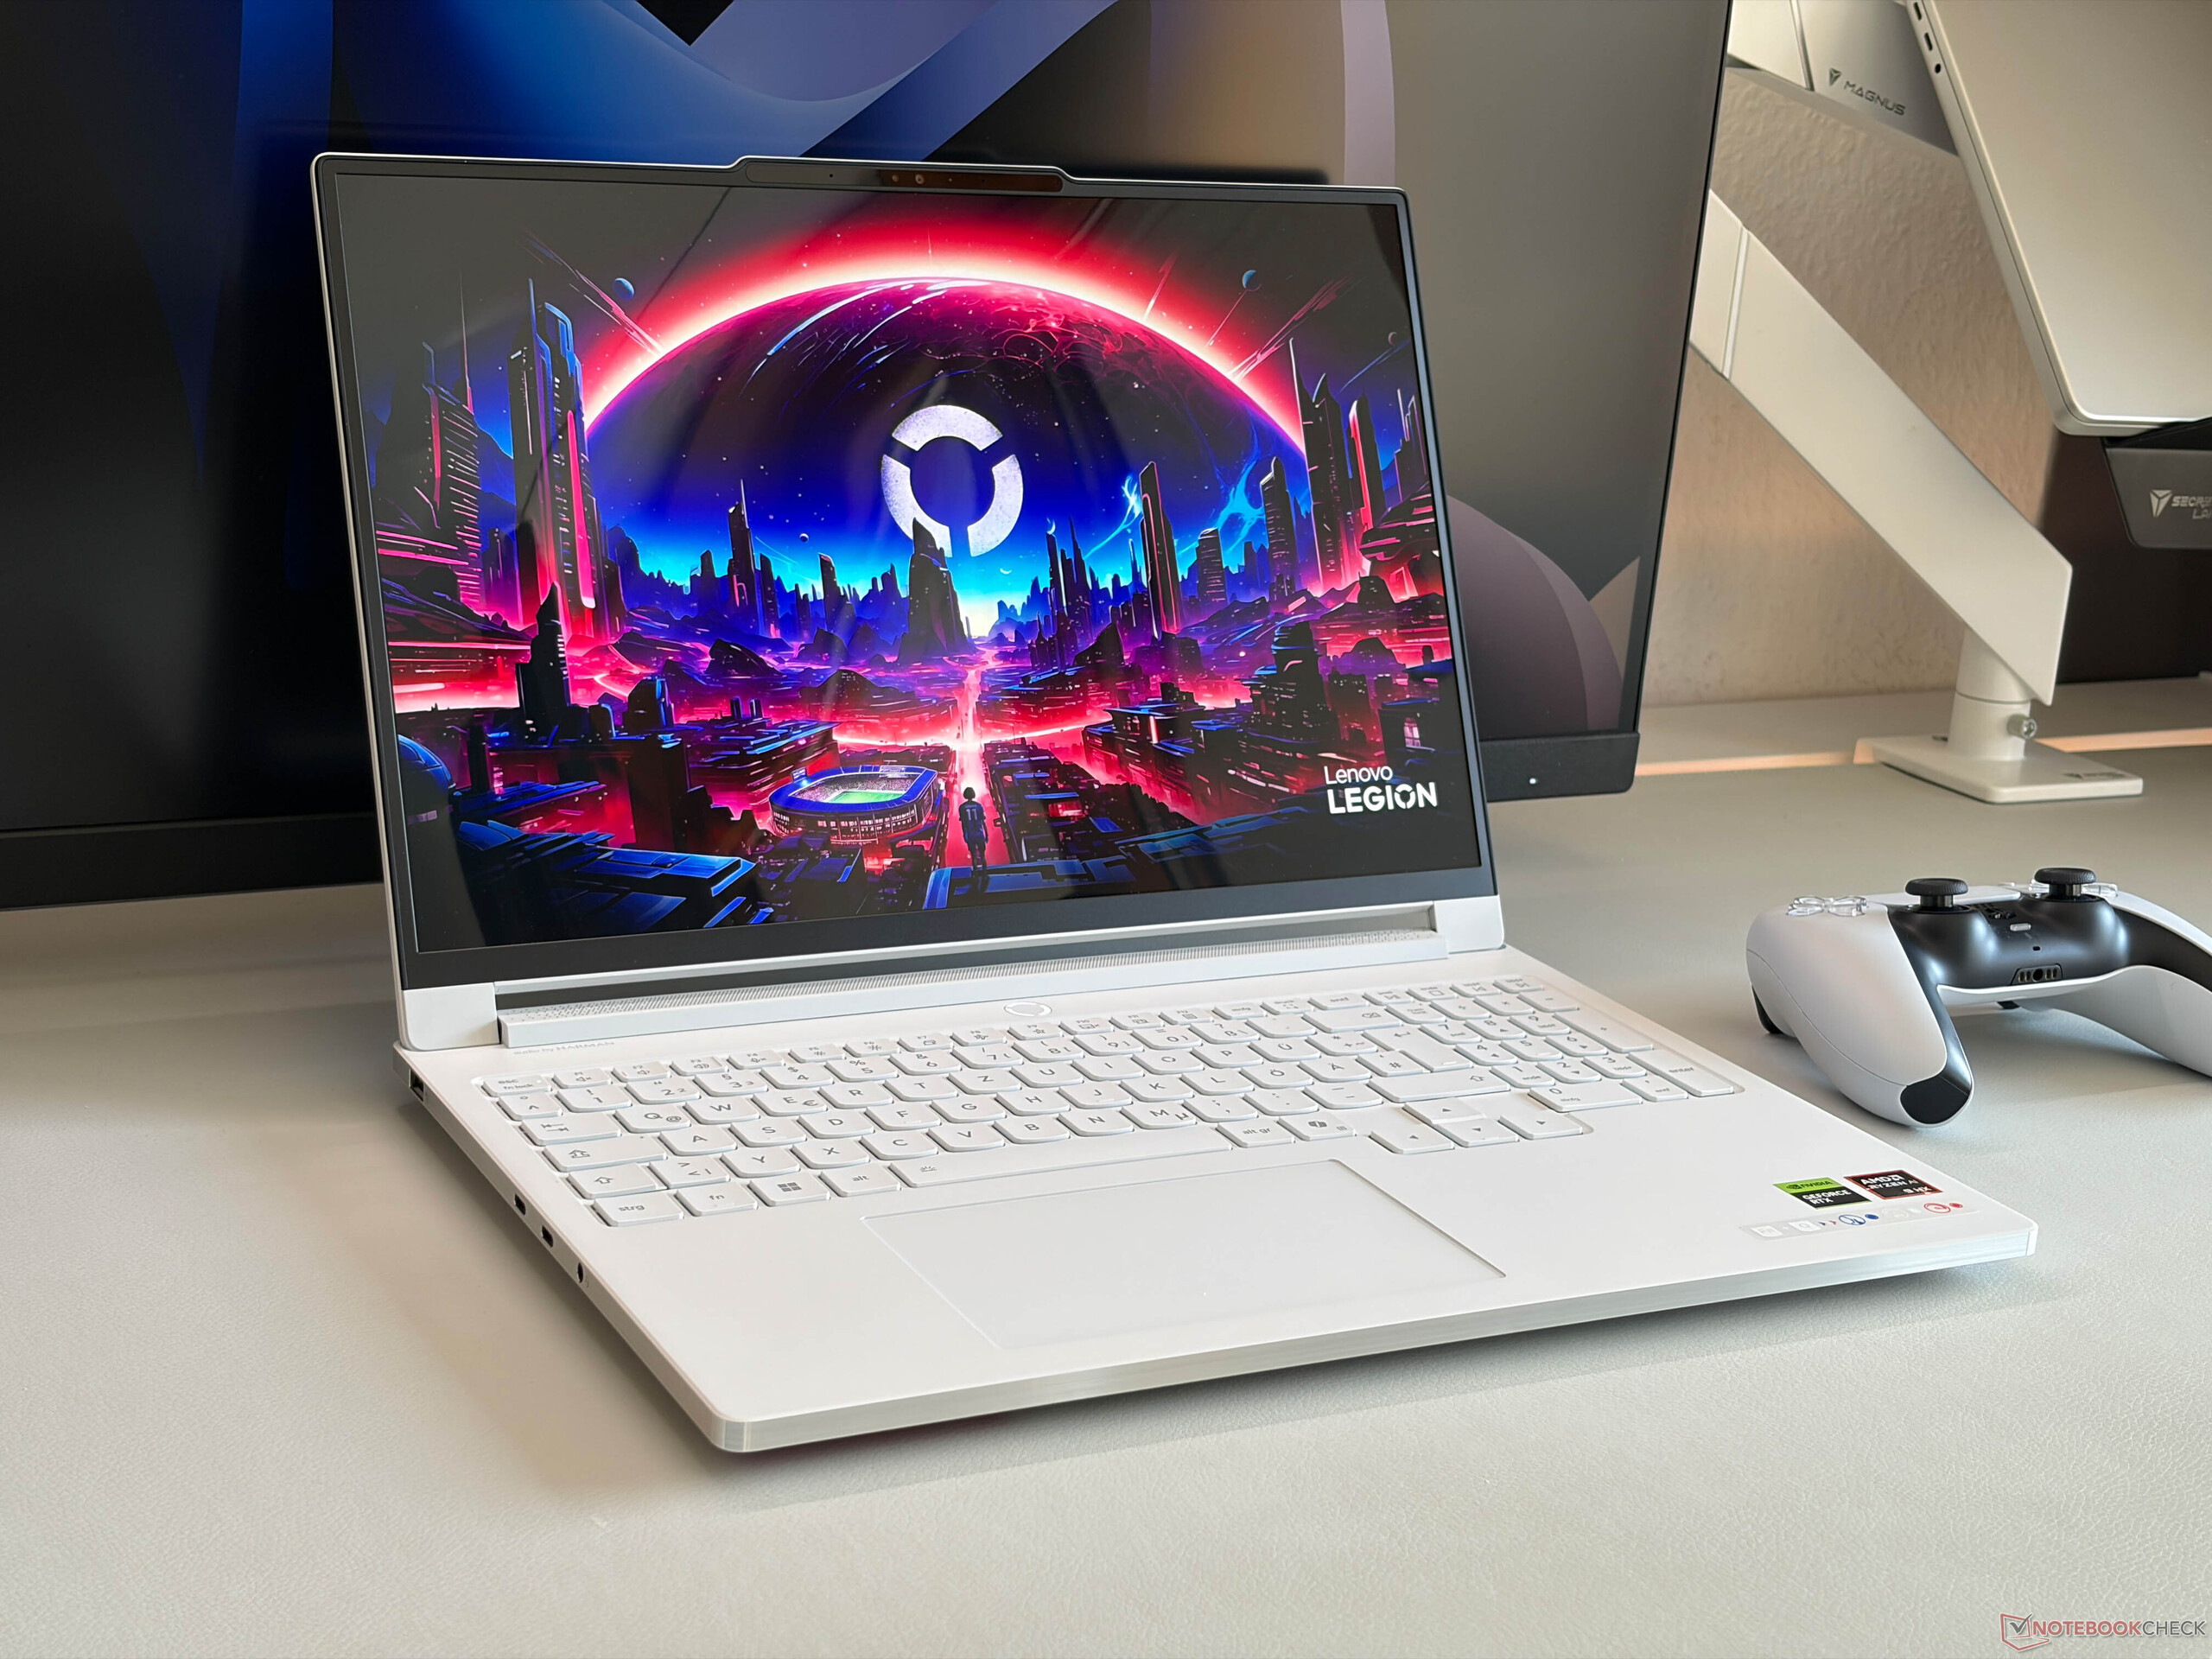
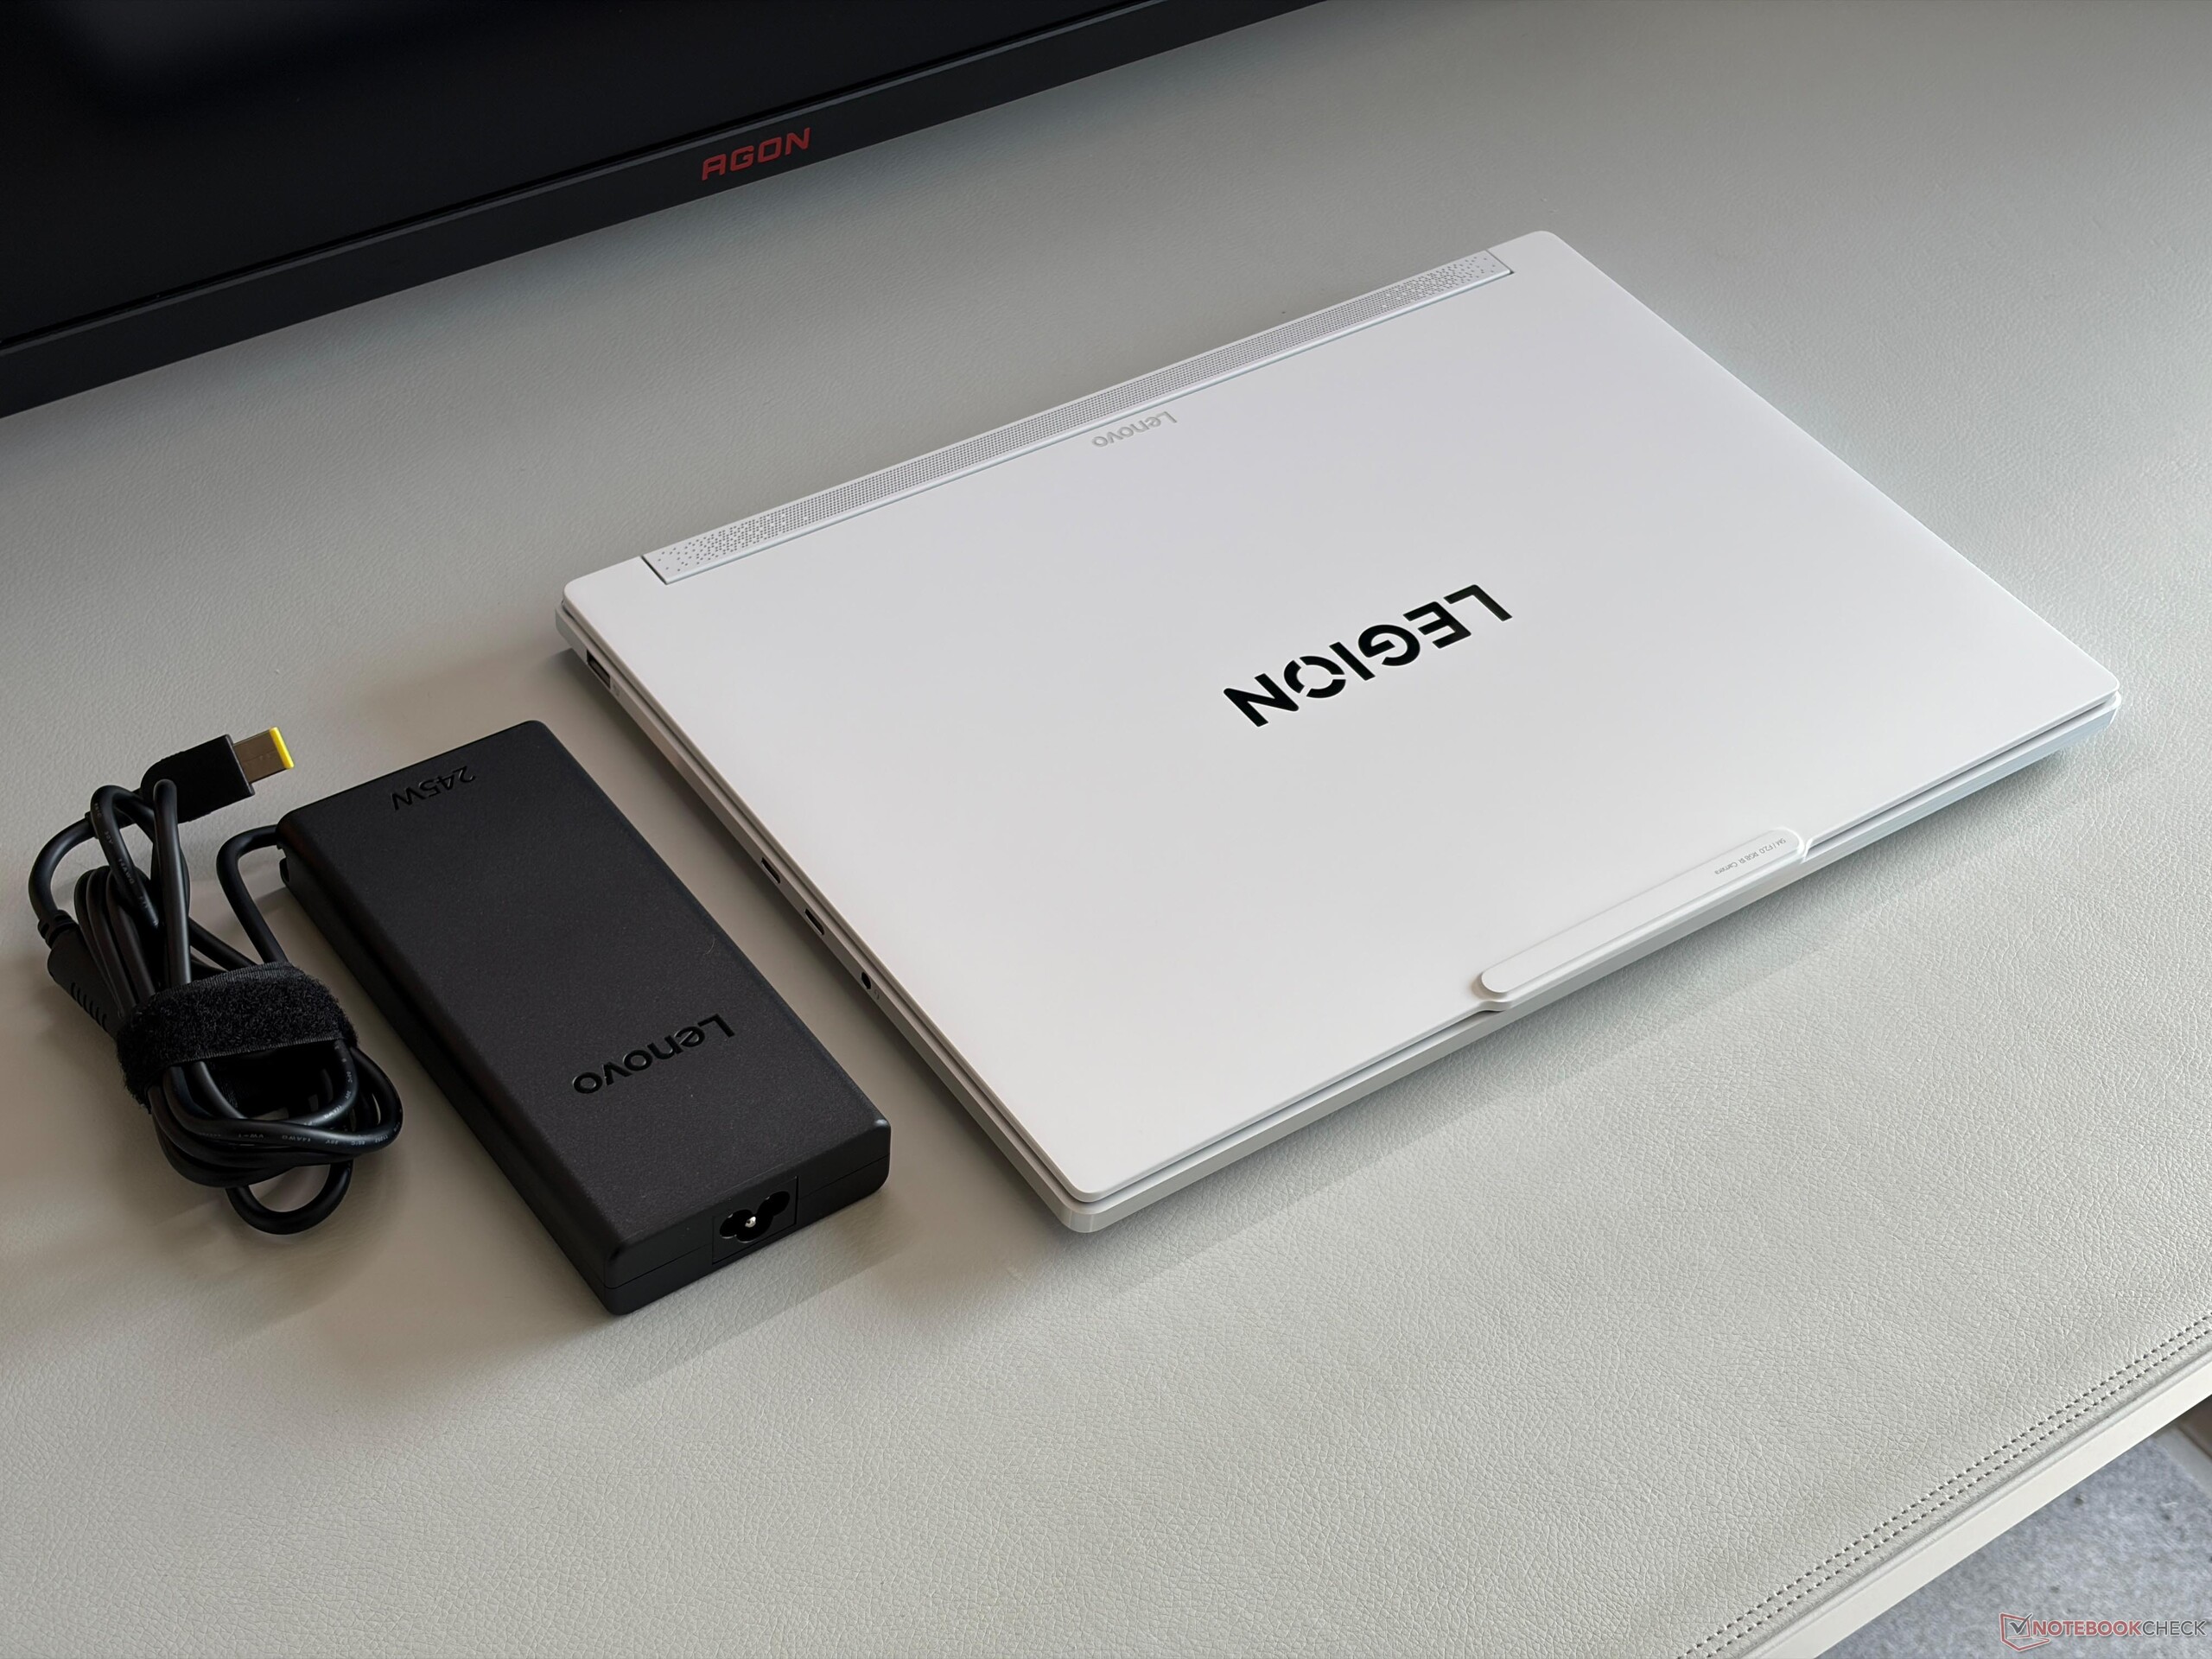
联想新推出的Legion 7a 16 Gen 11 是一款时尚轻巧的 16 英寸游戏笔记本电脑,配备华丽的 OLED 屏幕(240 Hz、VRR、G-Sync)。铝制机箱非常坚固,外观漂亮,虽然可以安装两个固态硬盘,但遗憾的是内存是焊接的。此外,还有足够数量的端口、非常舒适的键盘和不错的扬声器。
问题是,重量的降低也会影响性能,因为联想只使用了 Ryzen AI 9 HX470,它的性能赶不上老式的英特尔酷睿至尊 7 255HX,而且移动GeForce RTX 5060 现在在性能模式下最高只能运行 95 瓦,而不是 115 瓦。你可以使用手动模式,将 TGP 调至 115 瓦,但这并不实用,而且手动模式只能在应用程序中选择。
如果你正在寻找一款时尚、移动的 16 英寸游戏机,新的Legion 7a 16 是一个不错的选择,但你必须在性能方面做出一些妥协。现在,更好的选择可能是老款 G10 代的Legion 7 16,它的性能更强一些,提供可升级的内存,价格也更低,但缺少高级擎天柱。
Pros
Cons
- $2,249.99Lenovo Legion 7a Gen 11 16" Gaming Laptop with AMD Ryzen AI 9 HX 470 Processor, NVIDIA GeForce RTX 5060, OLED WQXGA 240Hz Non-Touch Display, 32GB LPDDR5X-8533MT RAM, 1TB SSD, and Windows 11 Home
- $3,450.00Lenovo Legion Pro 7 16IAX10H OLED 16" 240Hz Glossy Display, Gaming Laptop, Intel Core Ultra 9 275HX 2.1GHz; NVIDIA GeForce RTX 5070 Ti 12GB GDDR7; 32GB DDR5-6400 RAM; 2X 1TB SSD
- $3,649.99Lenovo Legion Pro 7i Gen 10 16" Gaming Laptop (2025 Model) Intel Core Ultra 9 275HX 24C, NVIDIA GeForce RTX 5080 16GB, 32GB RAM, 1TB Gen 5 NVMe SSD, 16.0" WQXGA OLED 500 nits 240Hz, Windows 11 Pro
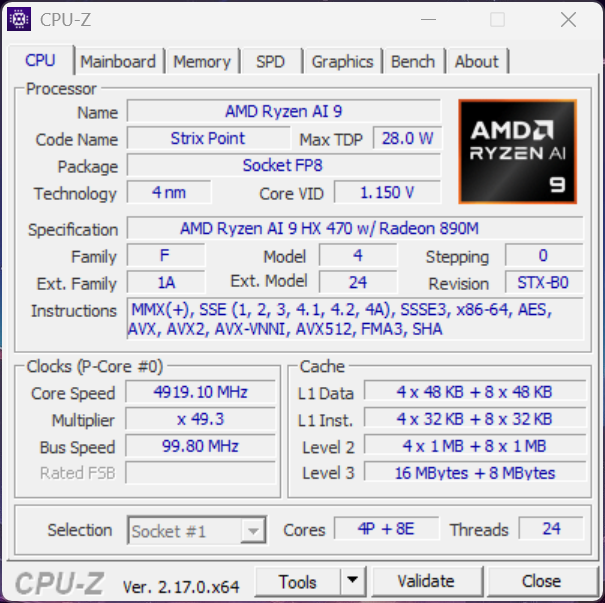
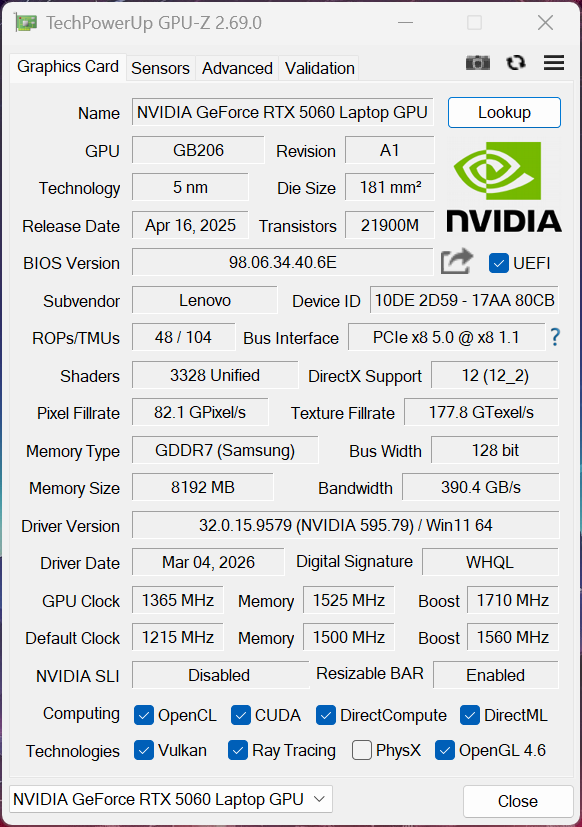
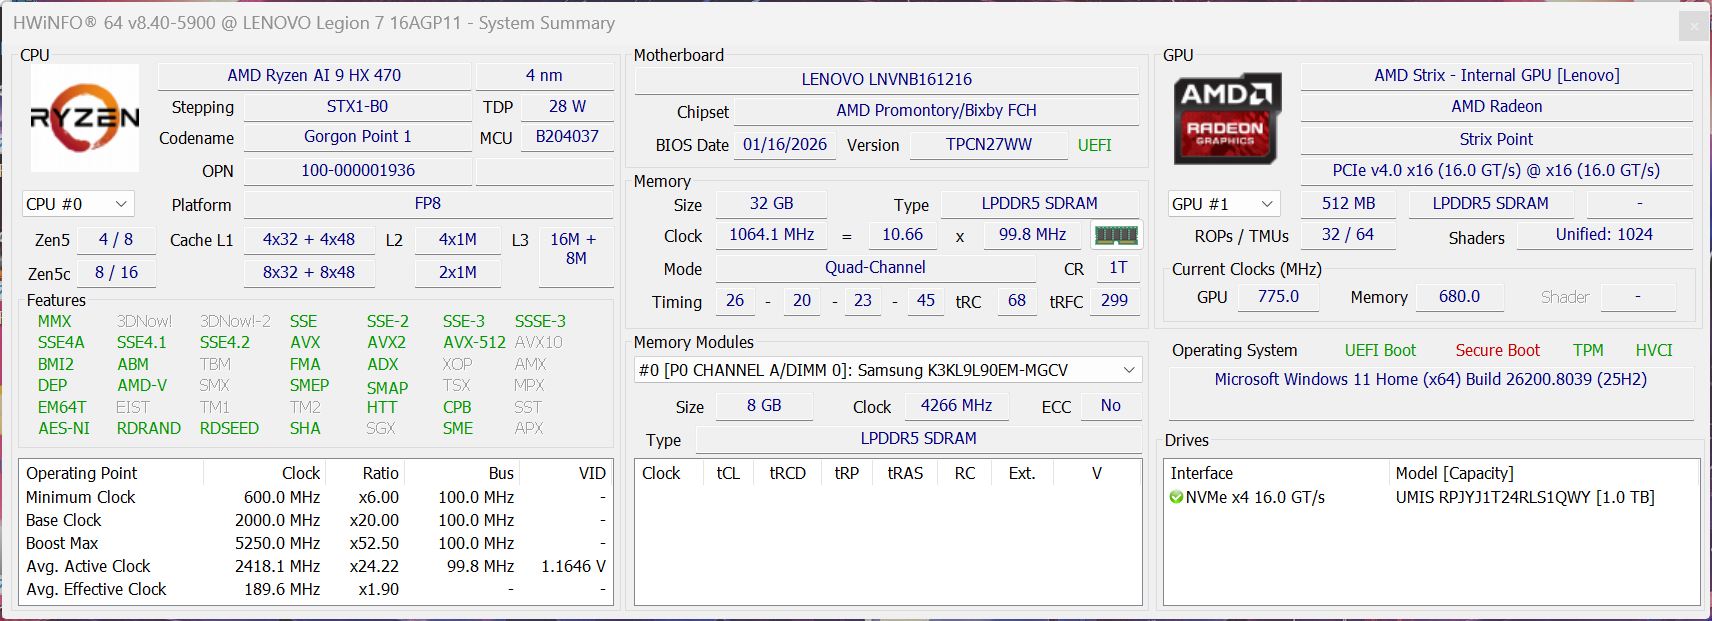
联想推出新版 16 英寸游戏笔记本电脑Legion 7,新的Legion 7a G11 型号使用 AMD Ryzen 400 处理器。GPU 选项仅限于移动版的 NvidiaGeForce RTX 5060,现在支持高级 Optimus 图形切换。起售价为 2079 美元,而我们的评测机配备了速度更快的 Ryzen AI 9 HX 470 CPU,售价为 2279 美元。
规格
案例
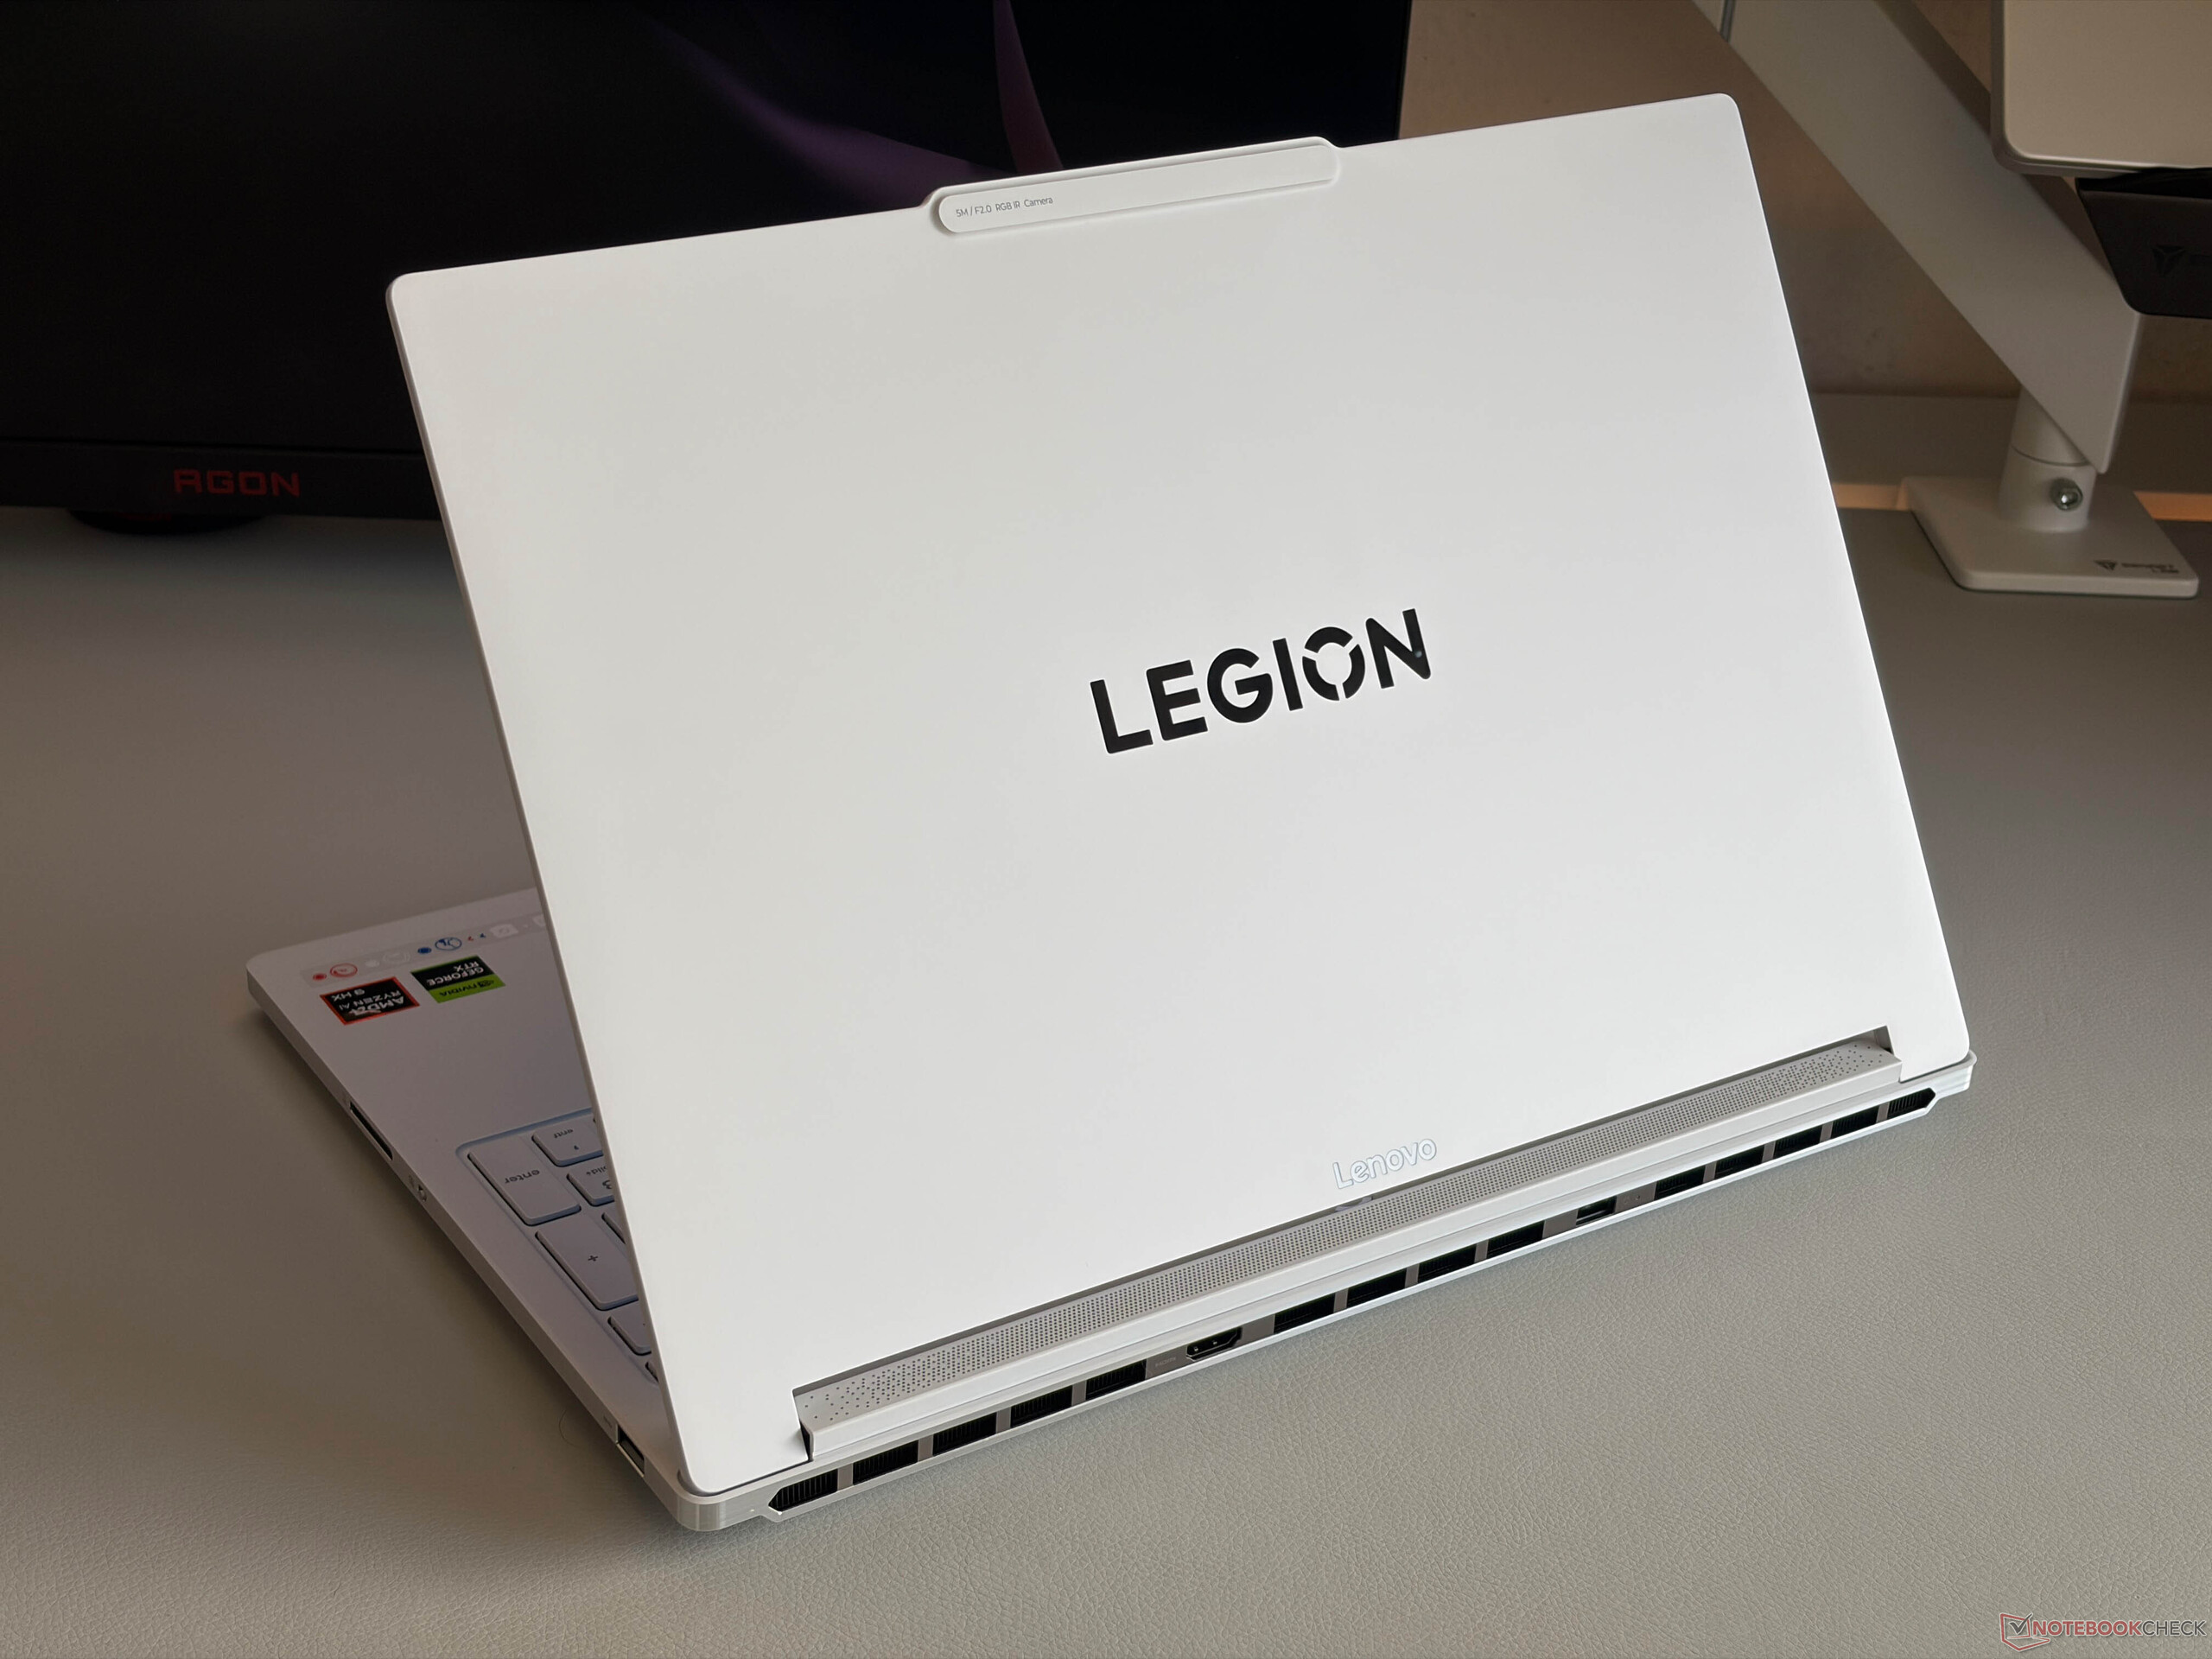
新款Legion 7a 16 的设计与旧款基本相同,您可以再次选择冰川白或星云蓝。Legion 7i 16 G10 的重量仅为 1.978 千克,已经相当轻了,而新款Legion 7a 16 甚至轻了 200 克(1.78 千克),因此显然也是我们对比组中最轻的设备。
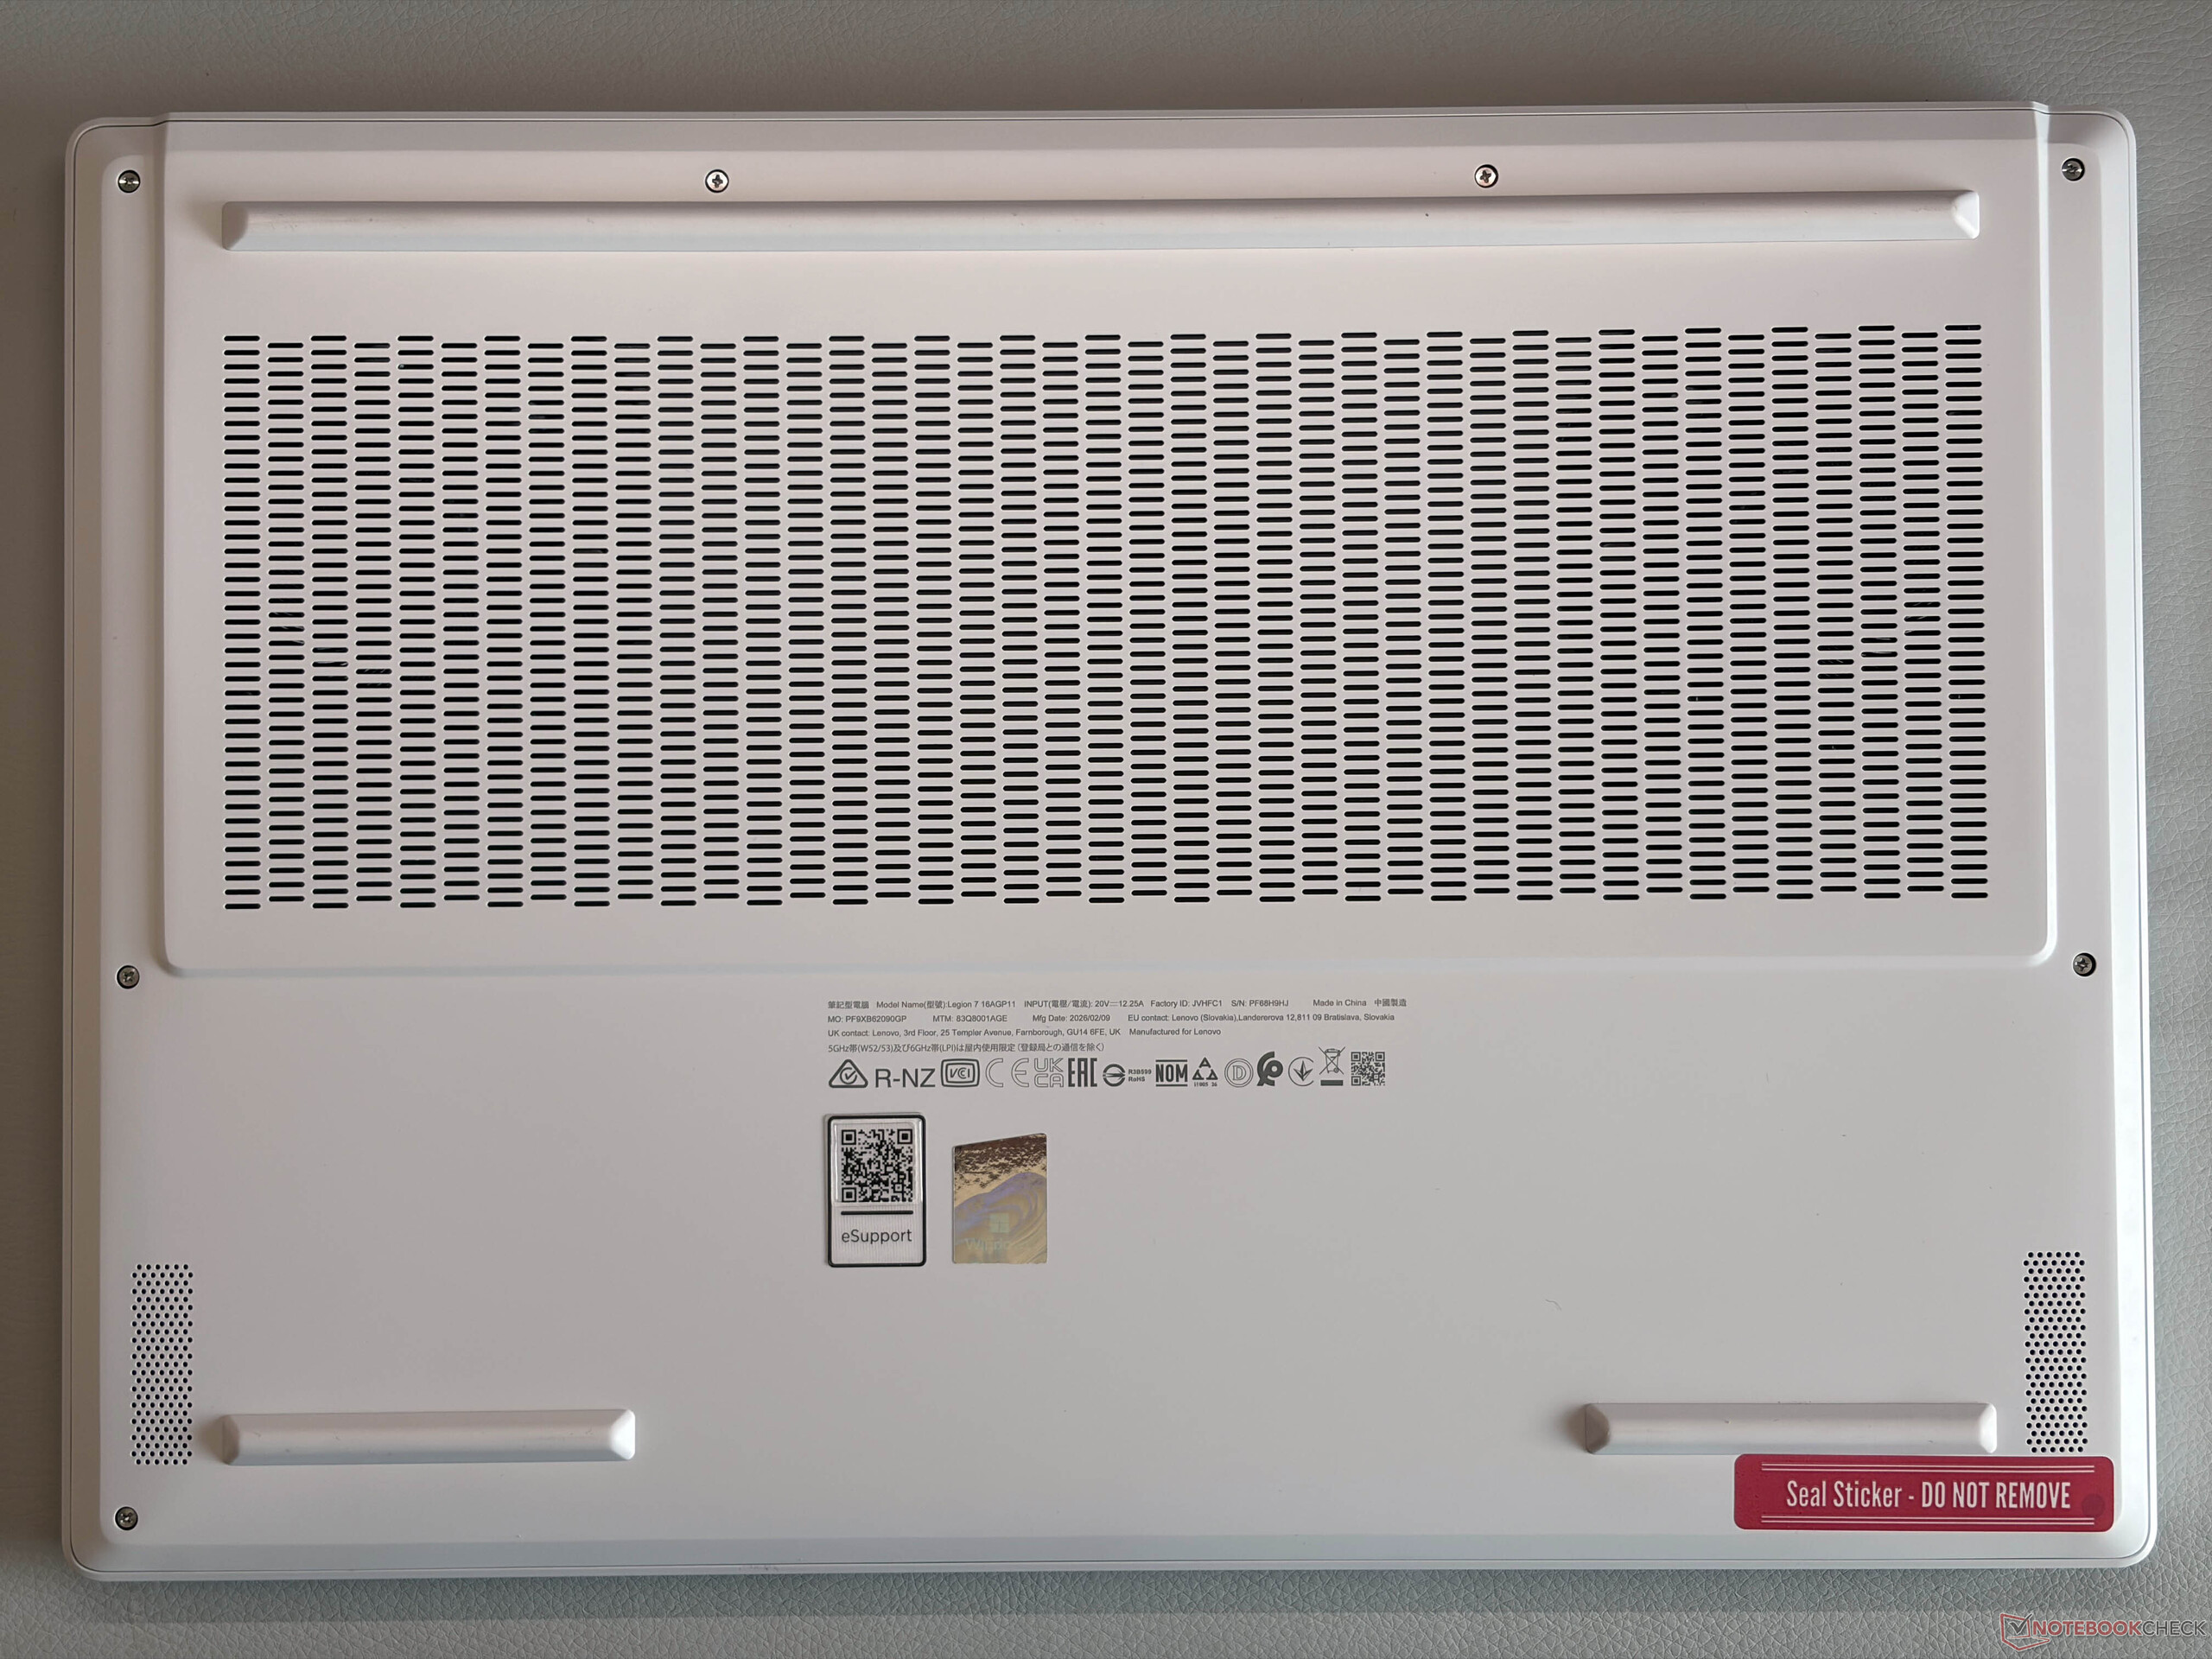
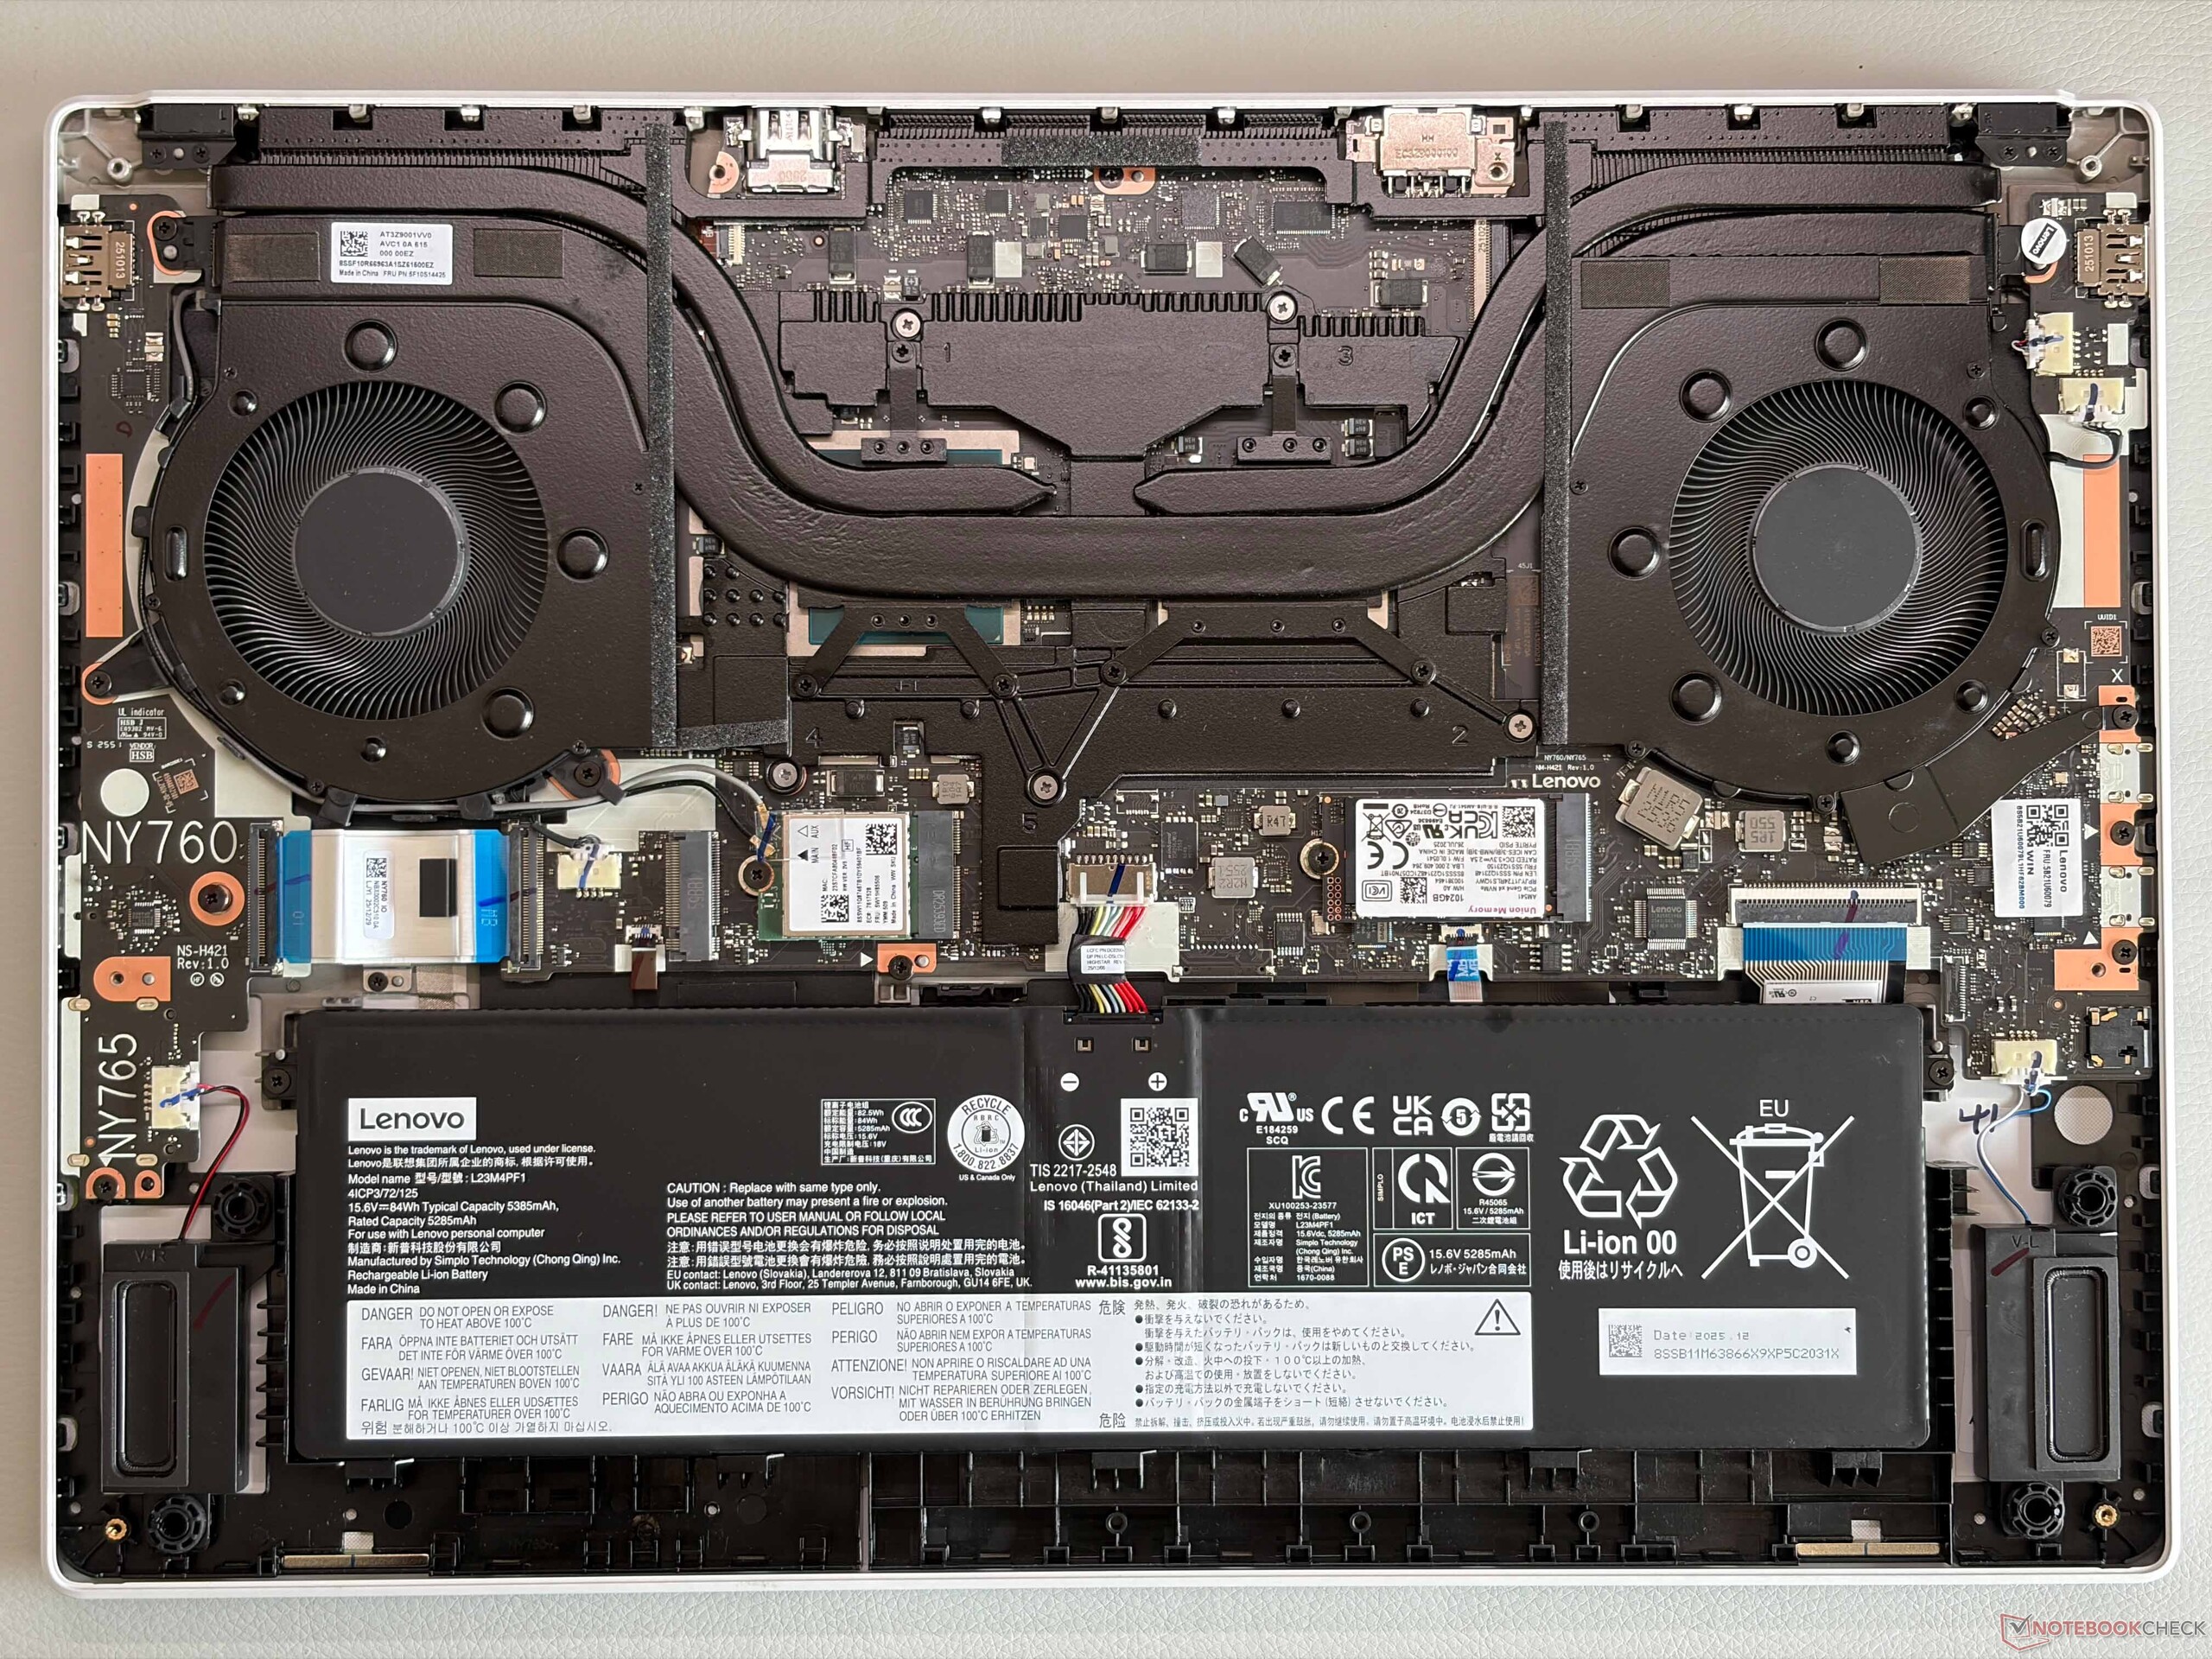
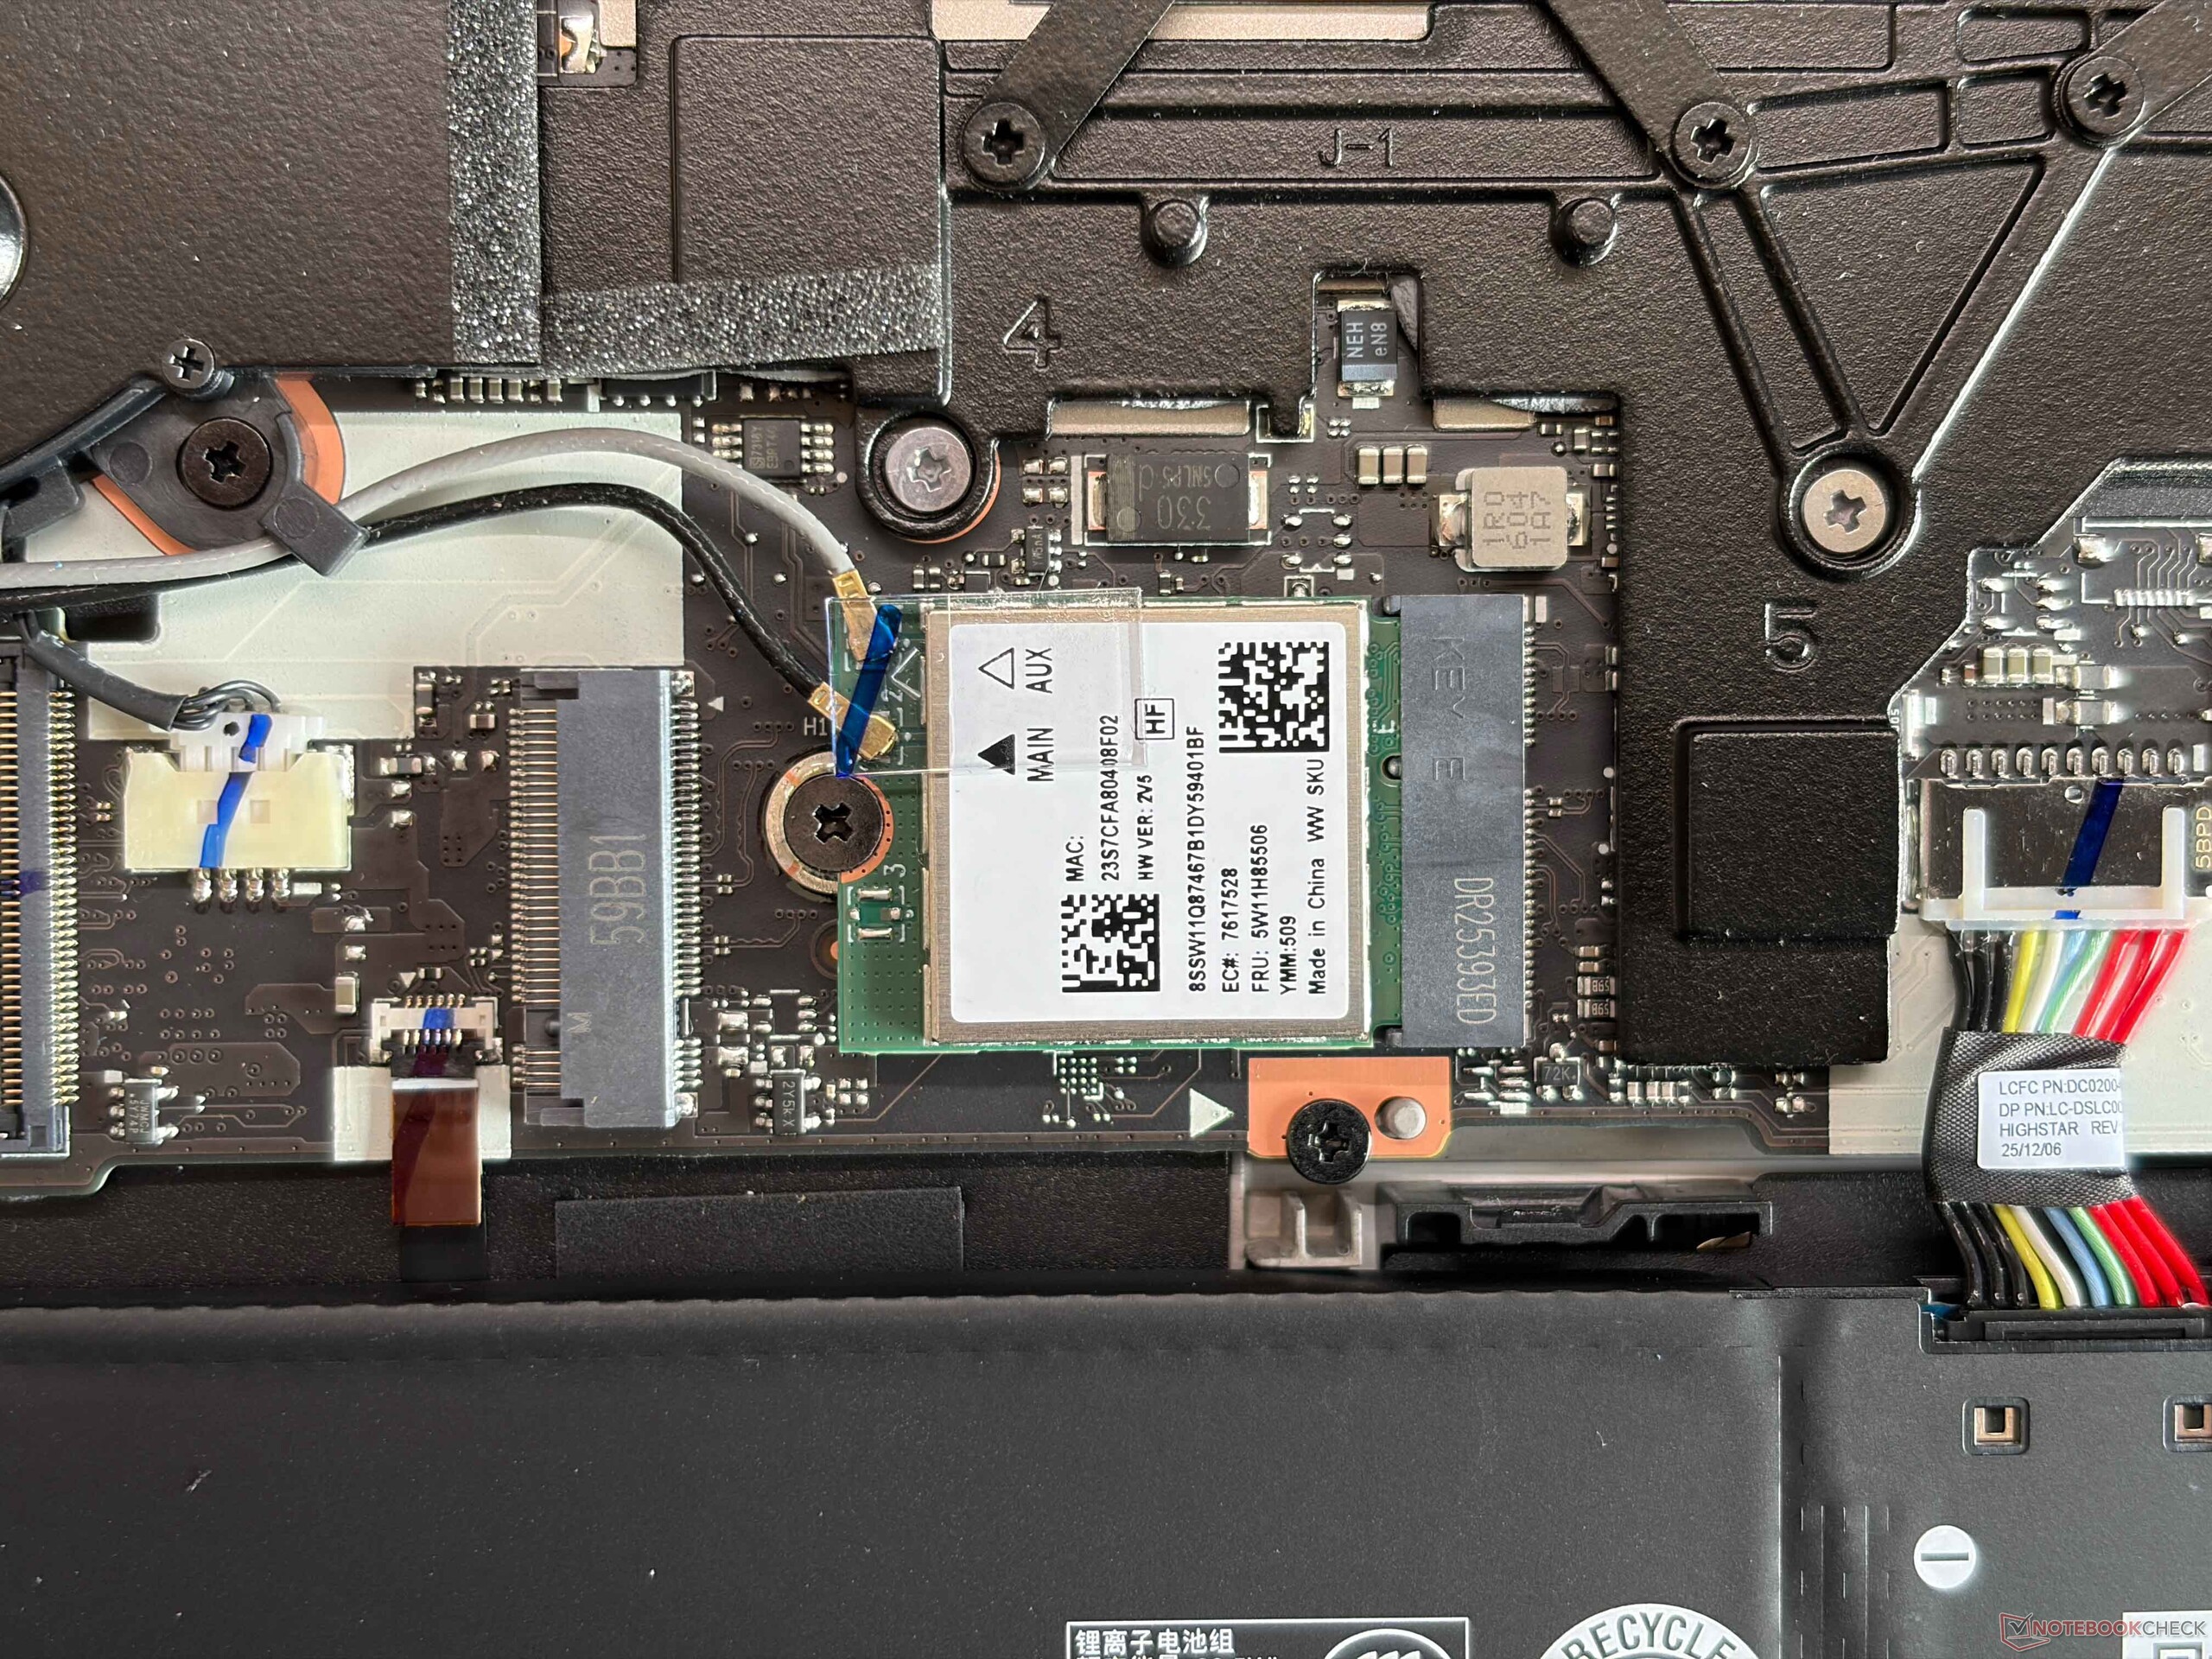
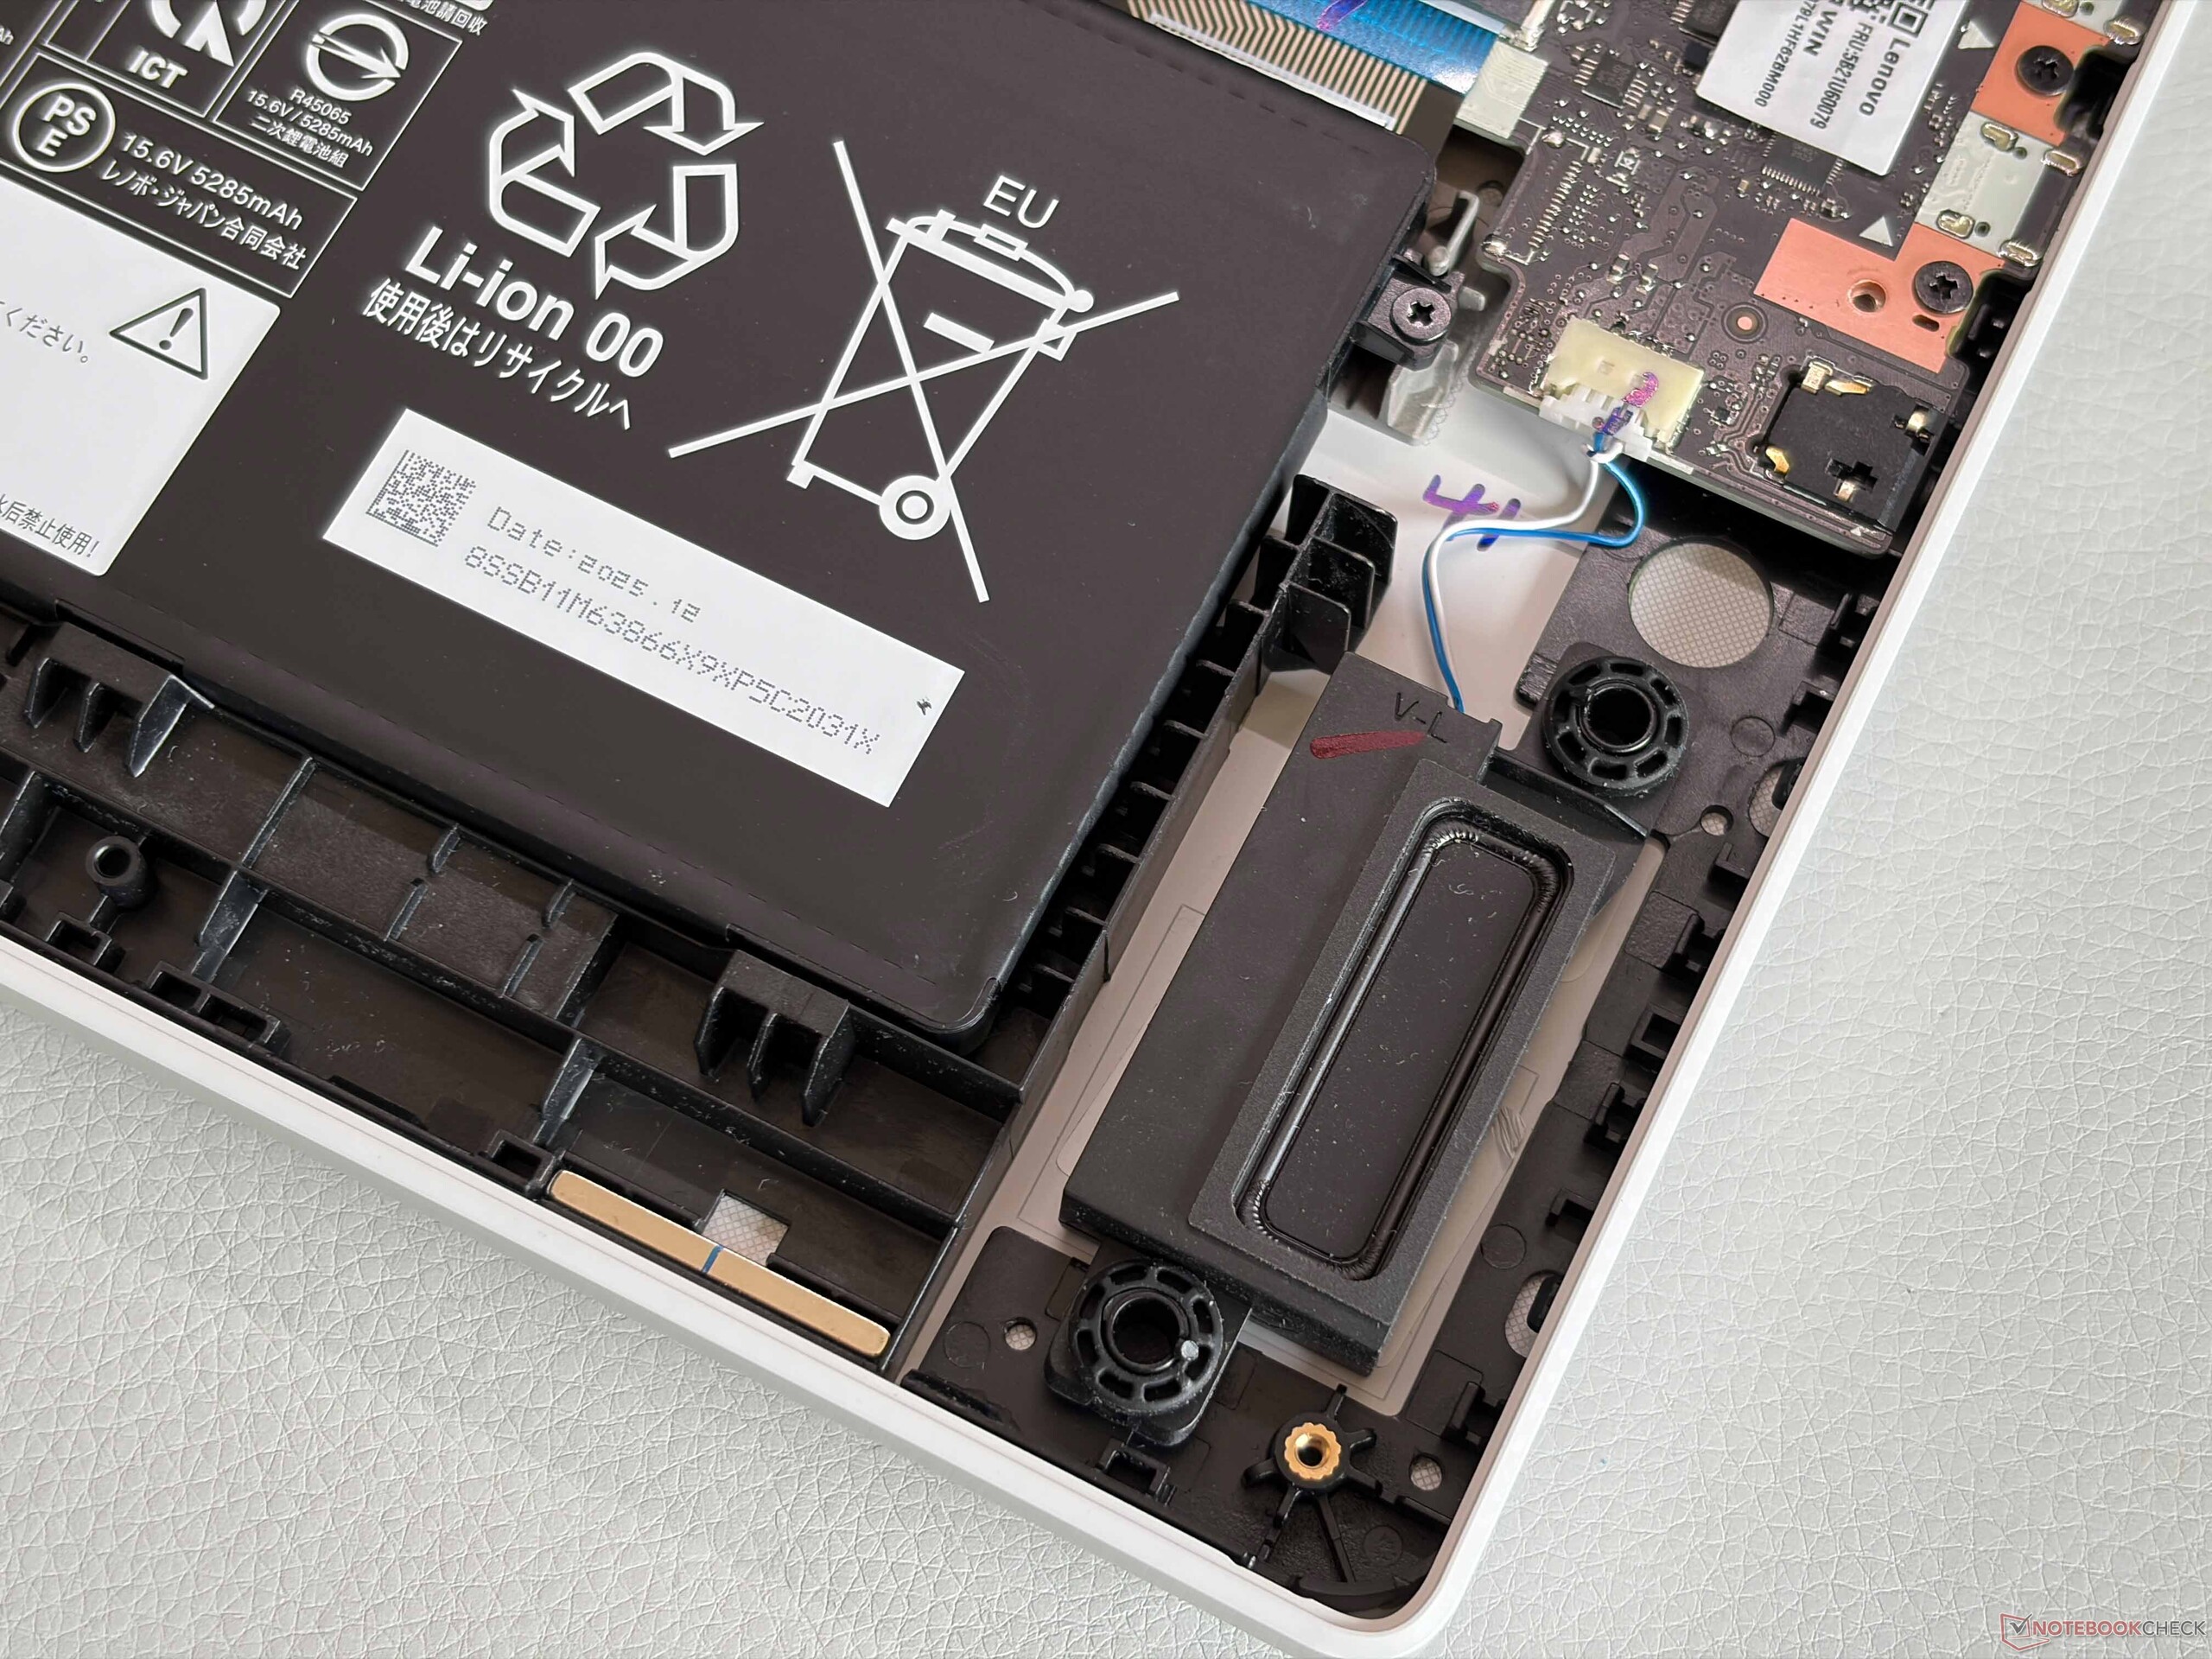
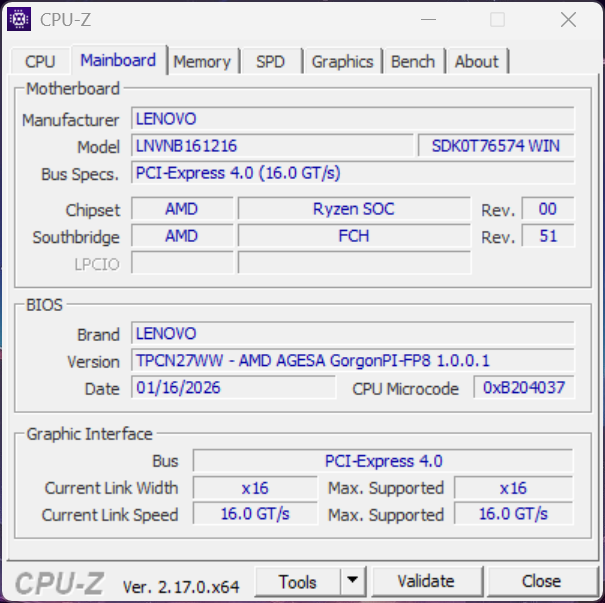
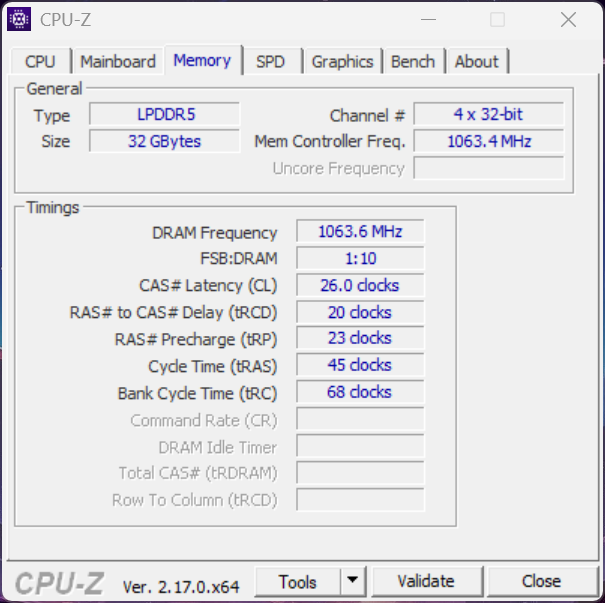
我们的白色评测机看起来非常漂亮,铝制表面不会吸附指纹或灰尘,因此非常容易保持清洁。照明元素保持在最低限度。重量的减轻并没有影响稳定性,AMD 的新机型和以前一样坚固。铰链(最大开启角度为 180 度)也调整得很好,将弹跳降至最低。维护选项仅限于 M.2-2242 固态硬盘、一个空闲的 M.2-2280 插槽、Wi-Fi 模块以及风扇的清洁,而内存是焊接的。
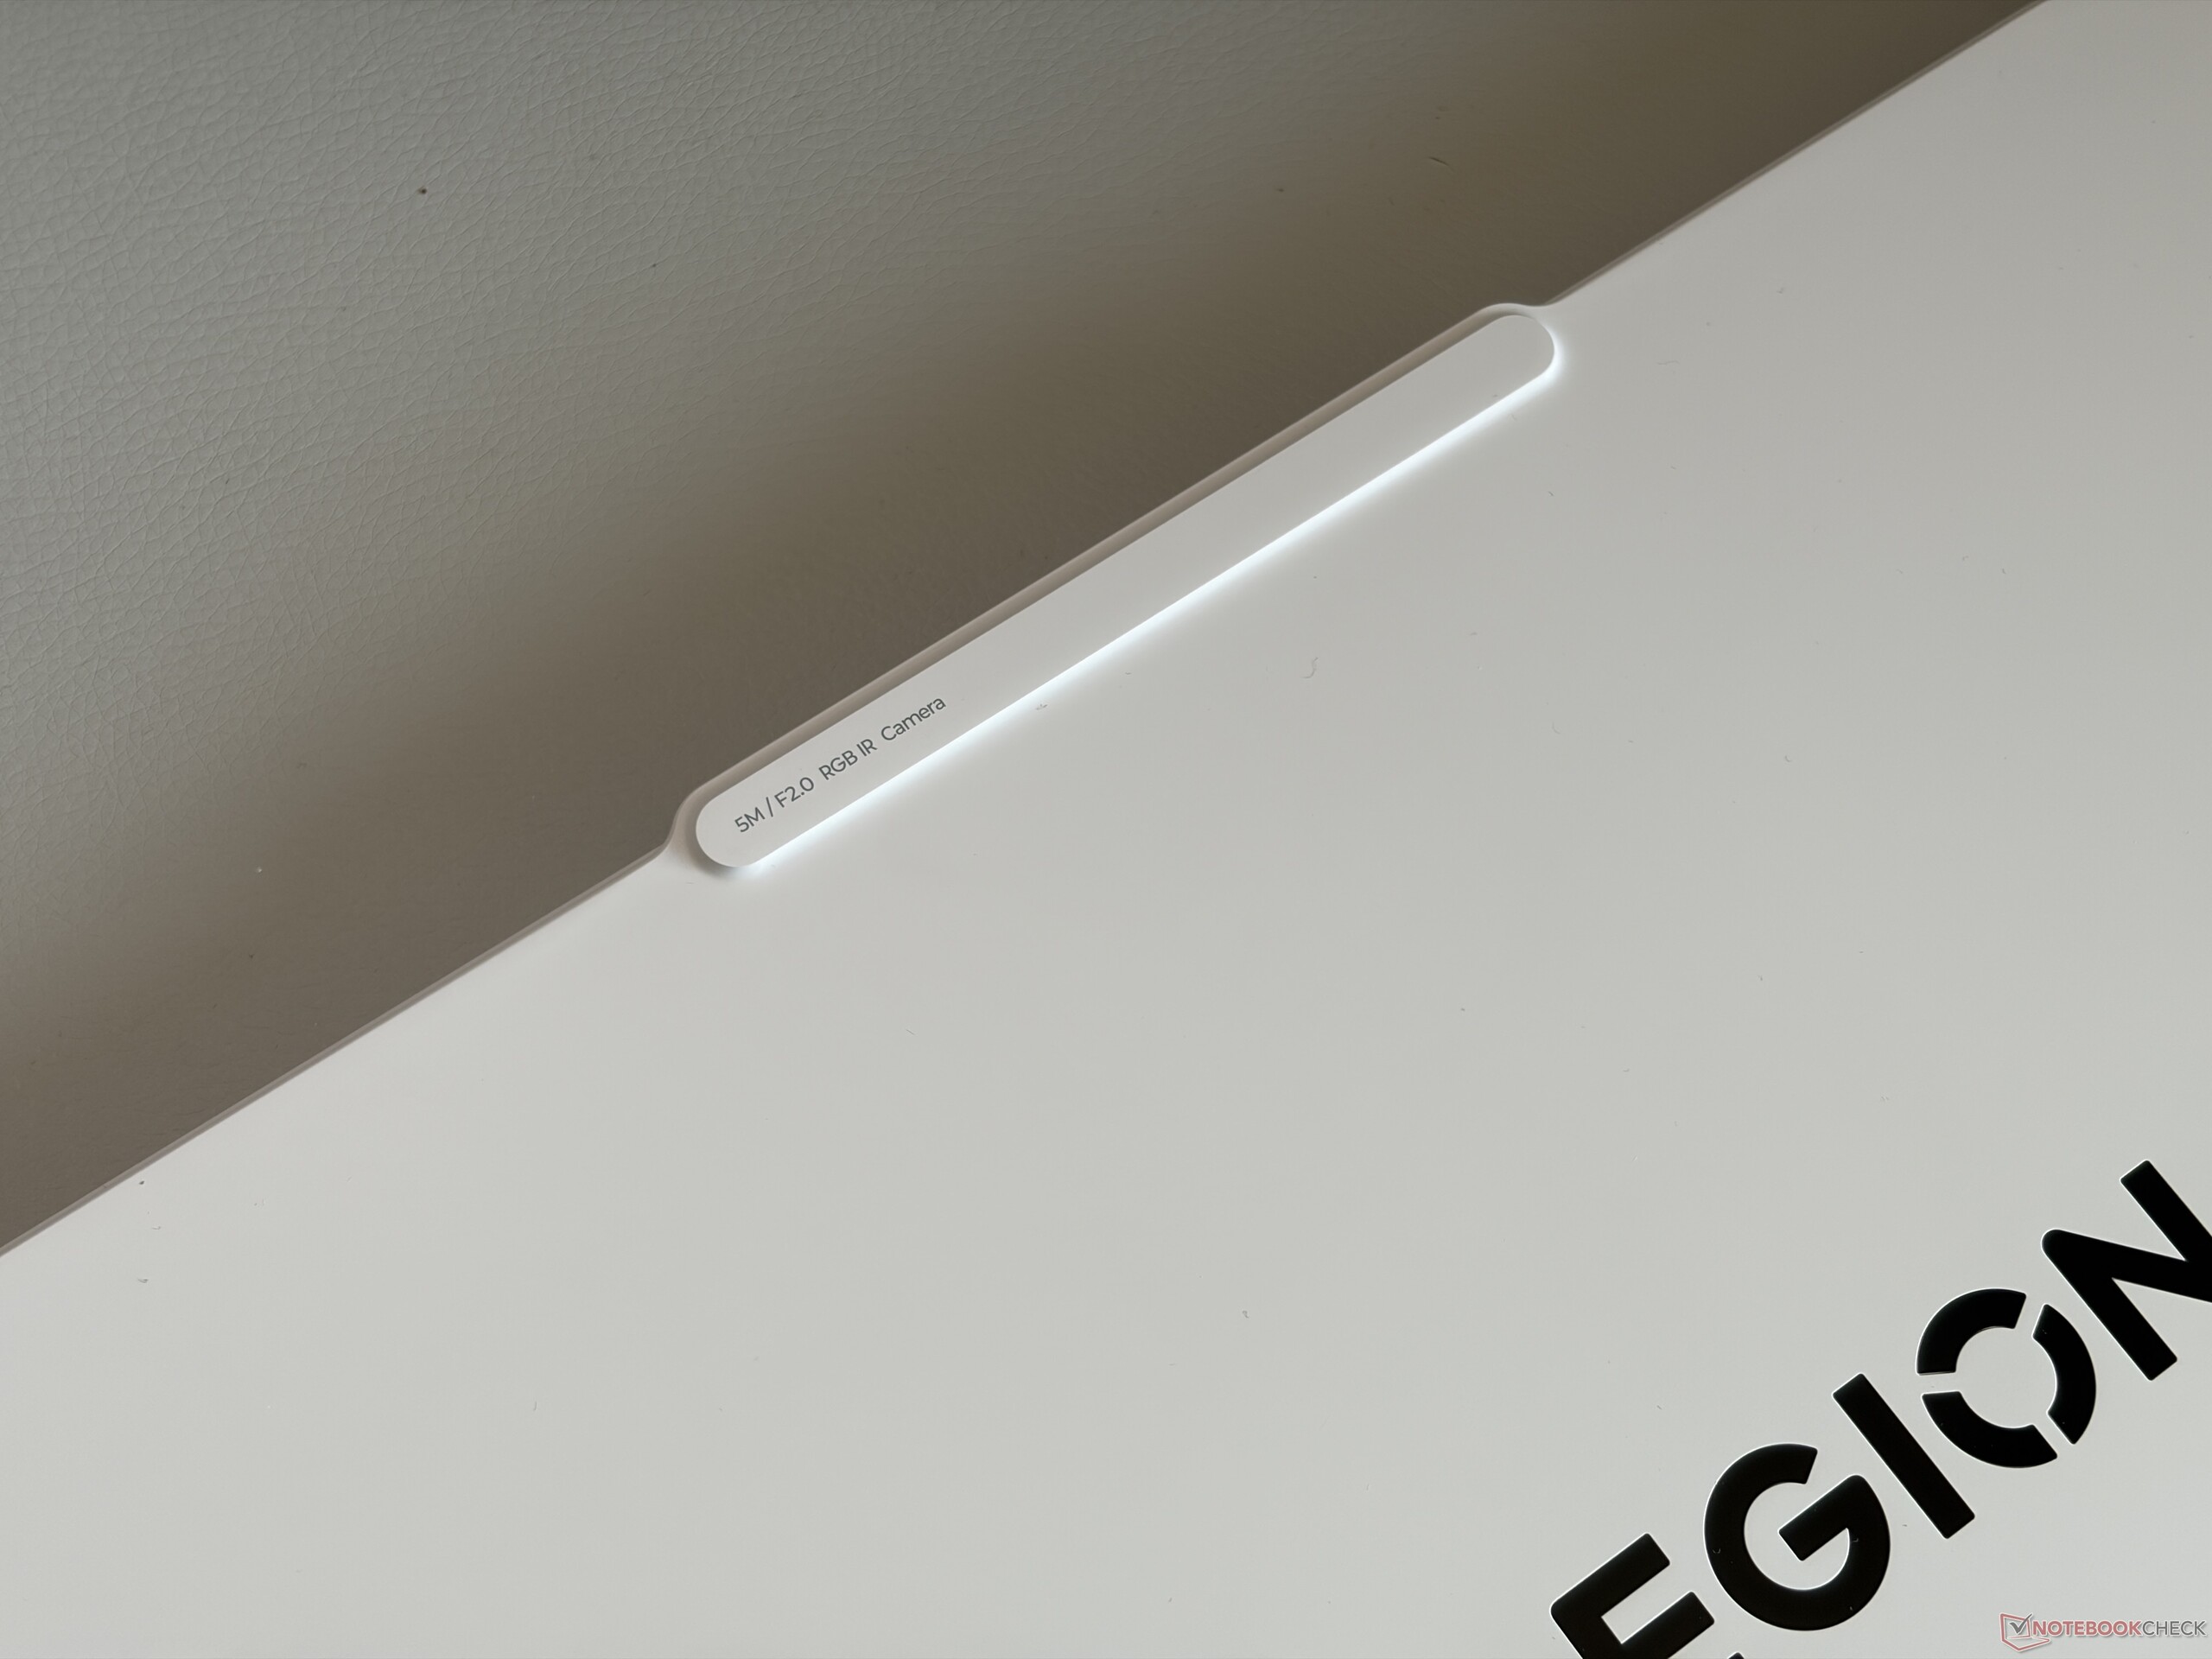
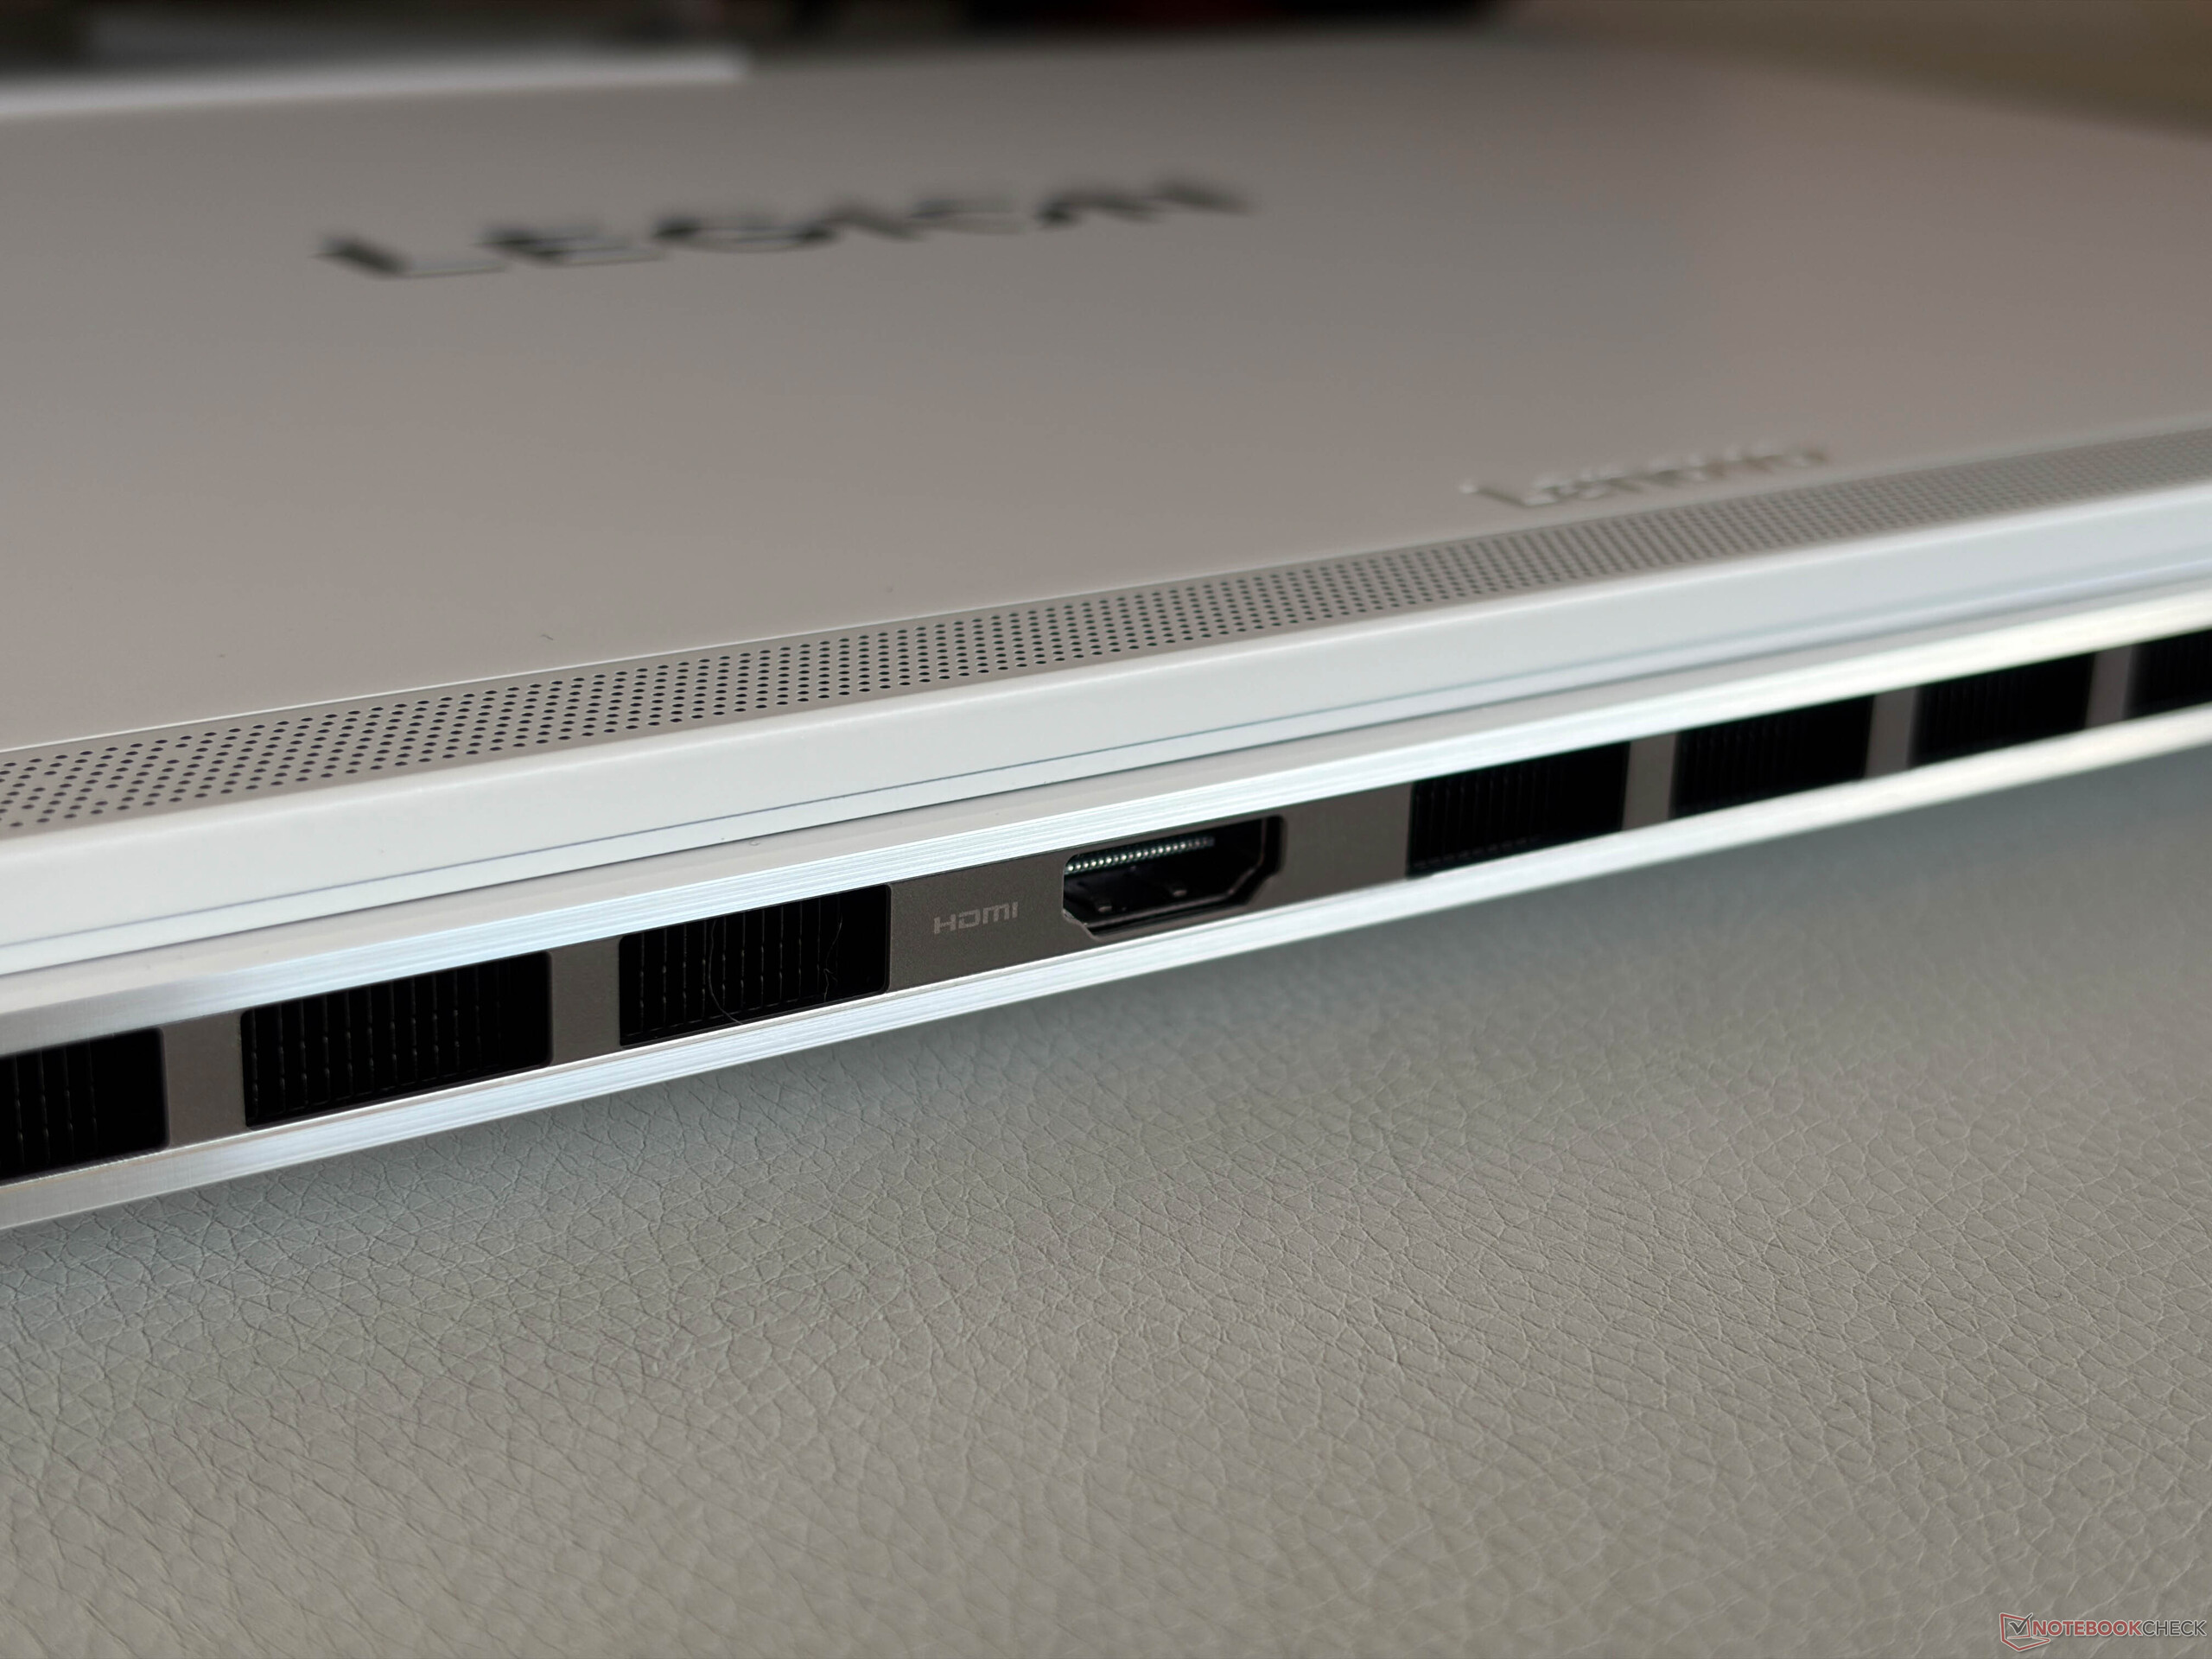
两个 USB-C 端口、HDMI 和两个普通 USB-A 端口的连接性非常稳定。此外,尽管不支持 SD Express 标准,但还提供了一个快速的 SD 卡读卡器。Legion 还支持最新的 Wi-Fi 7 标准,但 RealTek 8922AE 模块的传输速率尚可。不过,我们在评测期间没有遇到任何连接问题。没有以太网连接器。500 万像素摄像头(电子快门)拍摄的图像效果不错。


| SD Card Reader | |
| average JPG Copy Test (av. of 3 runs) | |
| Schenker XMG Core 16 VE M25 (AV PRO microSD 128 GB V60) | |
| Lenovo Legion 7 16 AGP11 (Angelbird AV Pro V60) | |
| Average of class Gaming (20.9 - 210, n=54, last 2 years) | |
| Lenovo Legion 7 16IAX10 (Toshiba Exceria Pro SDXC 64 GB UHS-II) | |
| Schenker XMG FUSION 16 (M25) (Angelbird AV Pro V60) | |
| maximum AS SSD Seq Read Test (1GB) | |
| Lenovo Legion 7 16IAX10 (Toshiba Exceria Pro SDXC 64 GB UHS-II) | |
| Lenovo Legion 7 16 AGP11 (Angelbird AV Pro V60) | |
| Average of class Gaming (25.5 - 261, n=51, last 2 years) | |
| Schenker XMG FUSION 16 (M25) (Angelbird AV Pro V60) | |
| Networking | |
| Lenovo Legion 7 16 AGP11 | |
| iperf3 transmit RT-BE96U WiFi7 | |
| iperf3 receive RT-BE96U WiFi7 | |
| Schenker XMG Core 16 VE M25 | |
| iperf3 transmit AXE11000 | |
| iperf3 receive AXE11000 | |
| Schenker XMG FUSION 16 (M25) | |
| iperf3 transmit AXE11000 | |
| iperf3 receive AXE11000 | |
| HP Omen 16-ap0091ng | |
| iperf3 transmit AXE11000 | |
| iperf3 receive AXE11000 | |
| Asus TUF Gaming A16 FA608UP | |
| iperf3 transmit AXE11000 | |
| iperf3 receive AXE11000 | |
| Lenovo Legion 7 16IAX10 | |
| iperf3 transmit AXE11000 | |
| iperf3 receive AXE11000 | |
| iperf3 transmit AXE11000 6GHz | |
| iperf3 receive AXE11000 6GHz | |
| Lenovo Legion 5 15AHP G10 | |
| iperf3 transmit AXE11000 | |
| iperf3 receive AXE11000 | |


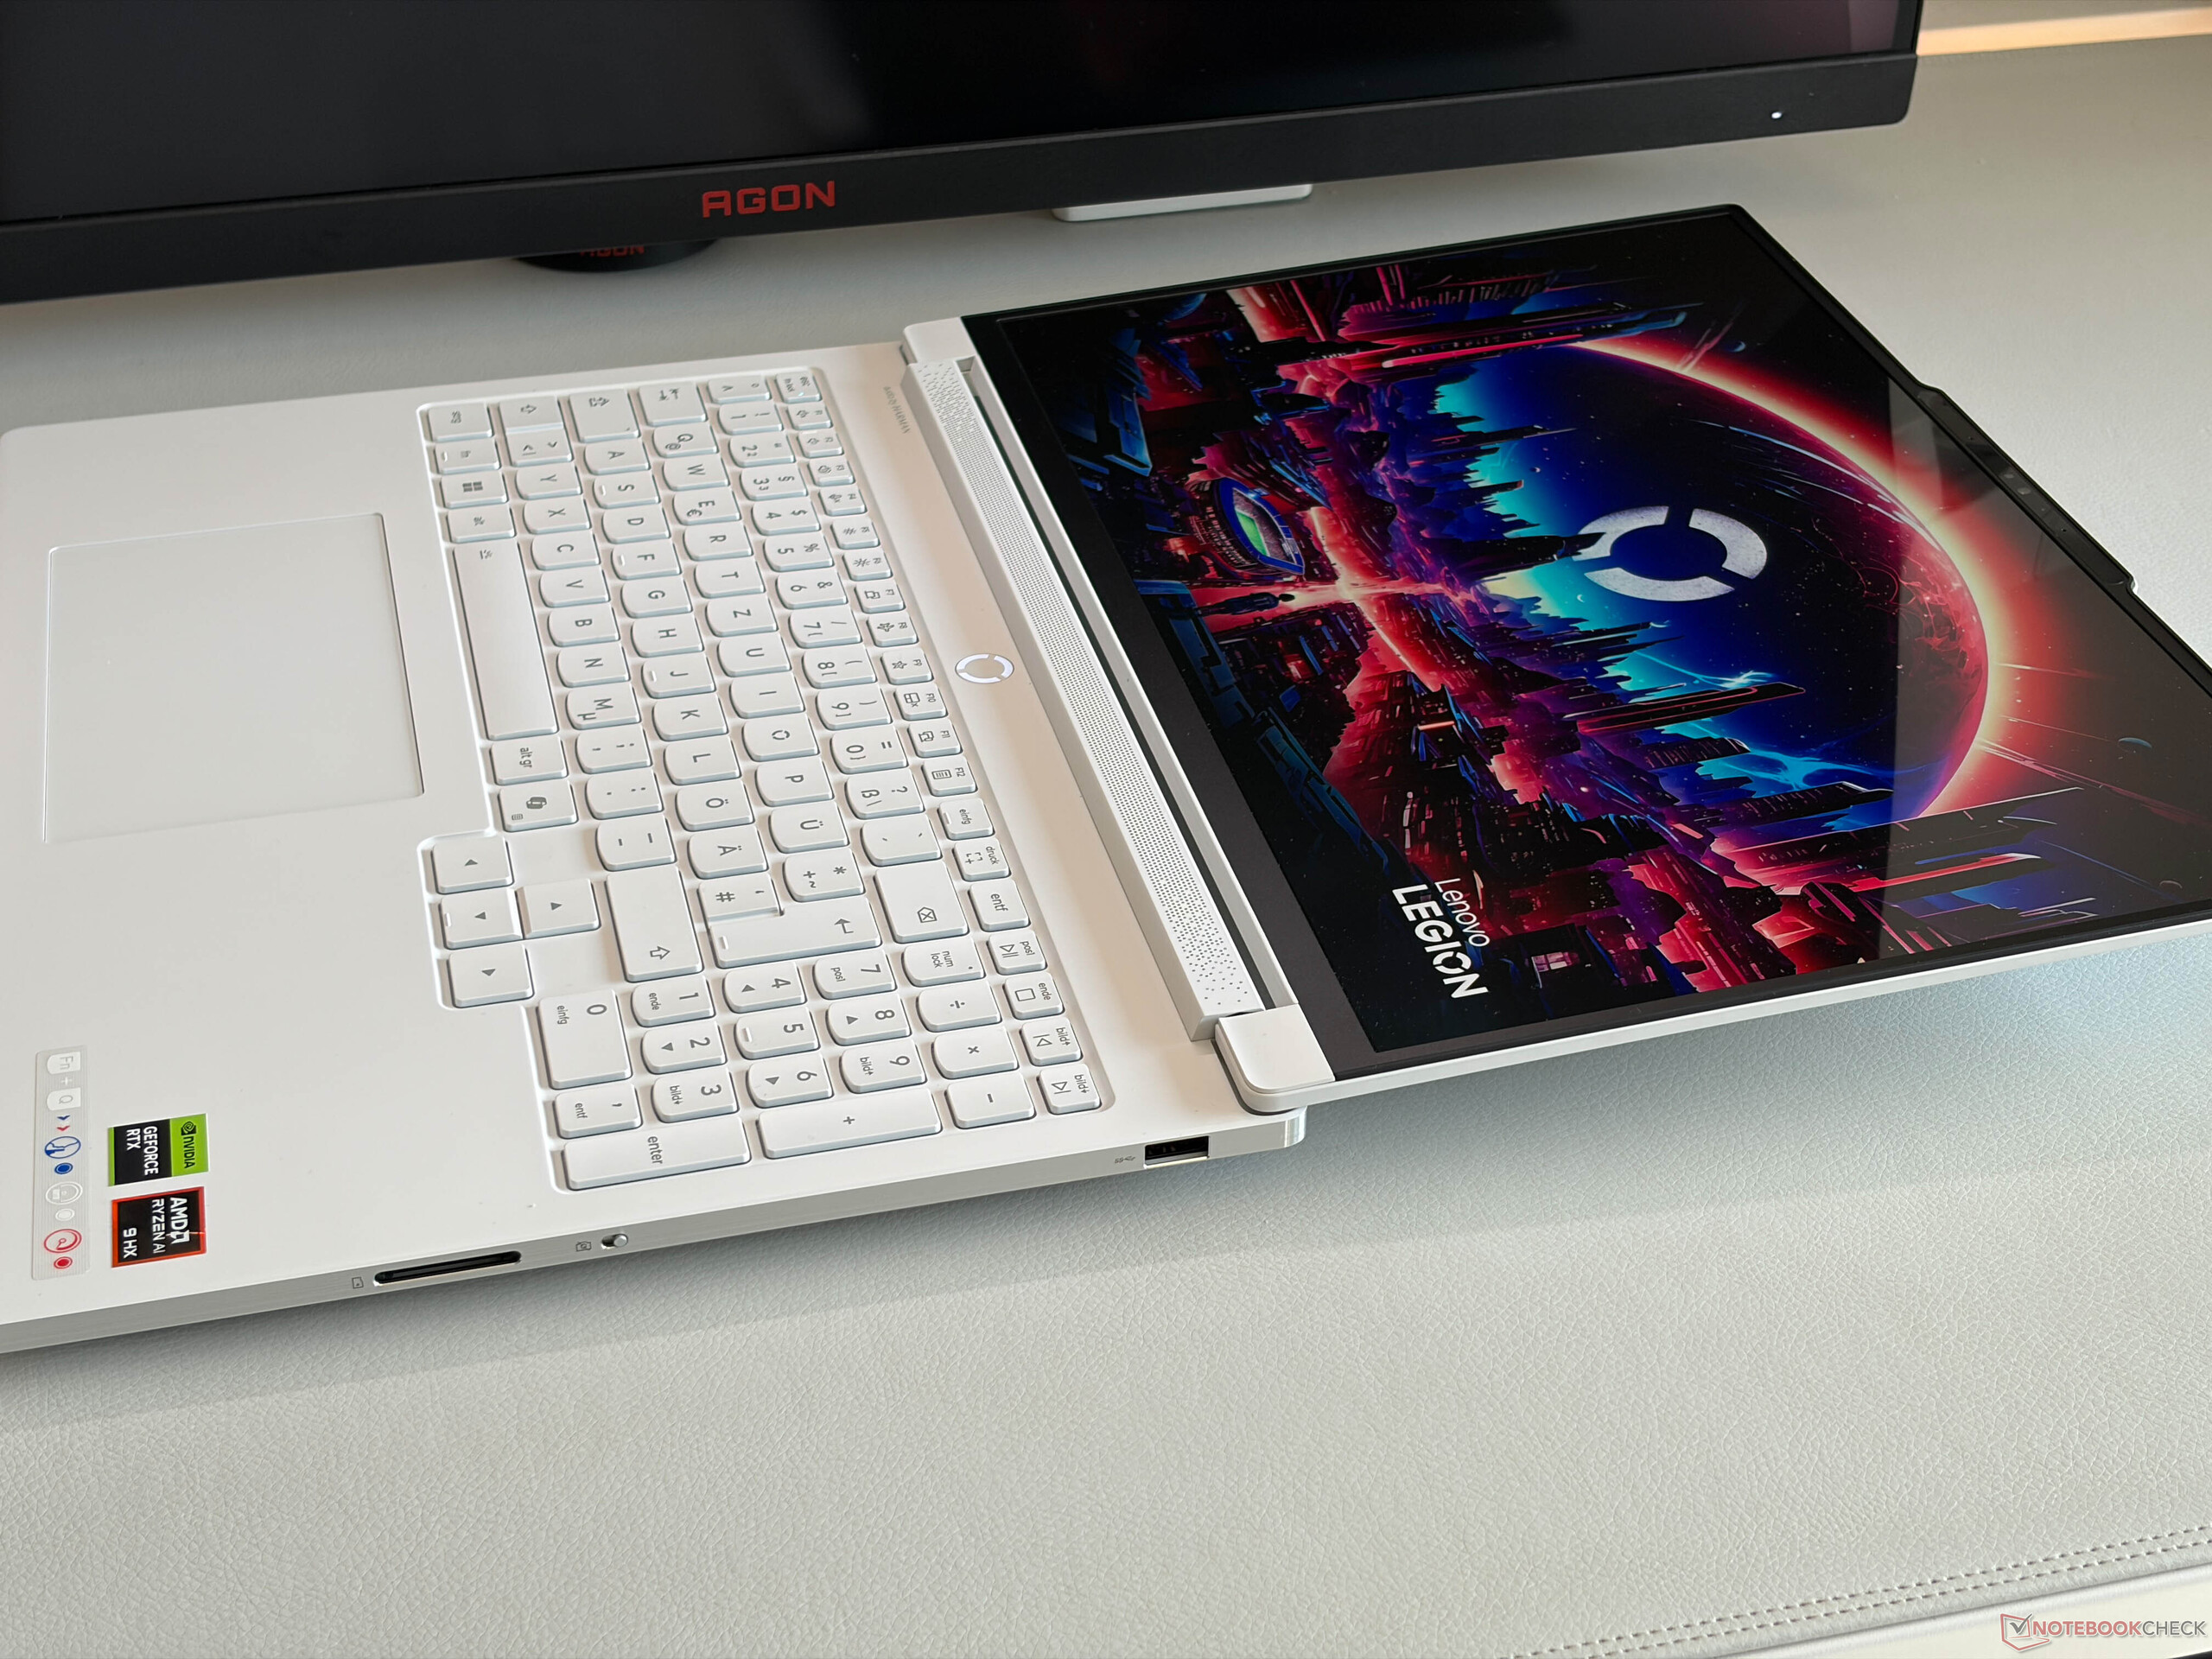
输入设备 - RGB 键盘,1.6 毫米行程
联想的键盘非常舒适,键程为 1.6 毫米,采用 RGB 背光(24 区)。您还可以获得大尺寸方向键和专用数字键盘,尽管这些按键略窄。这款键盘非常适合游戏和日常活动。点击板略微偏向左侧,具有良好的滑动性能。它不会发出嘎吱嘎吱的响声,但下半部分的机械咔哒声相当响亮。


显示屏 - 炫目的 OLED 显示屏,240 Hz 和 VRR
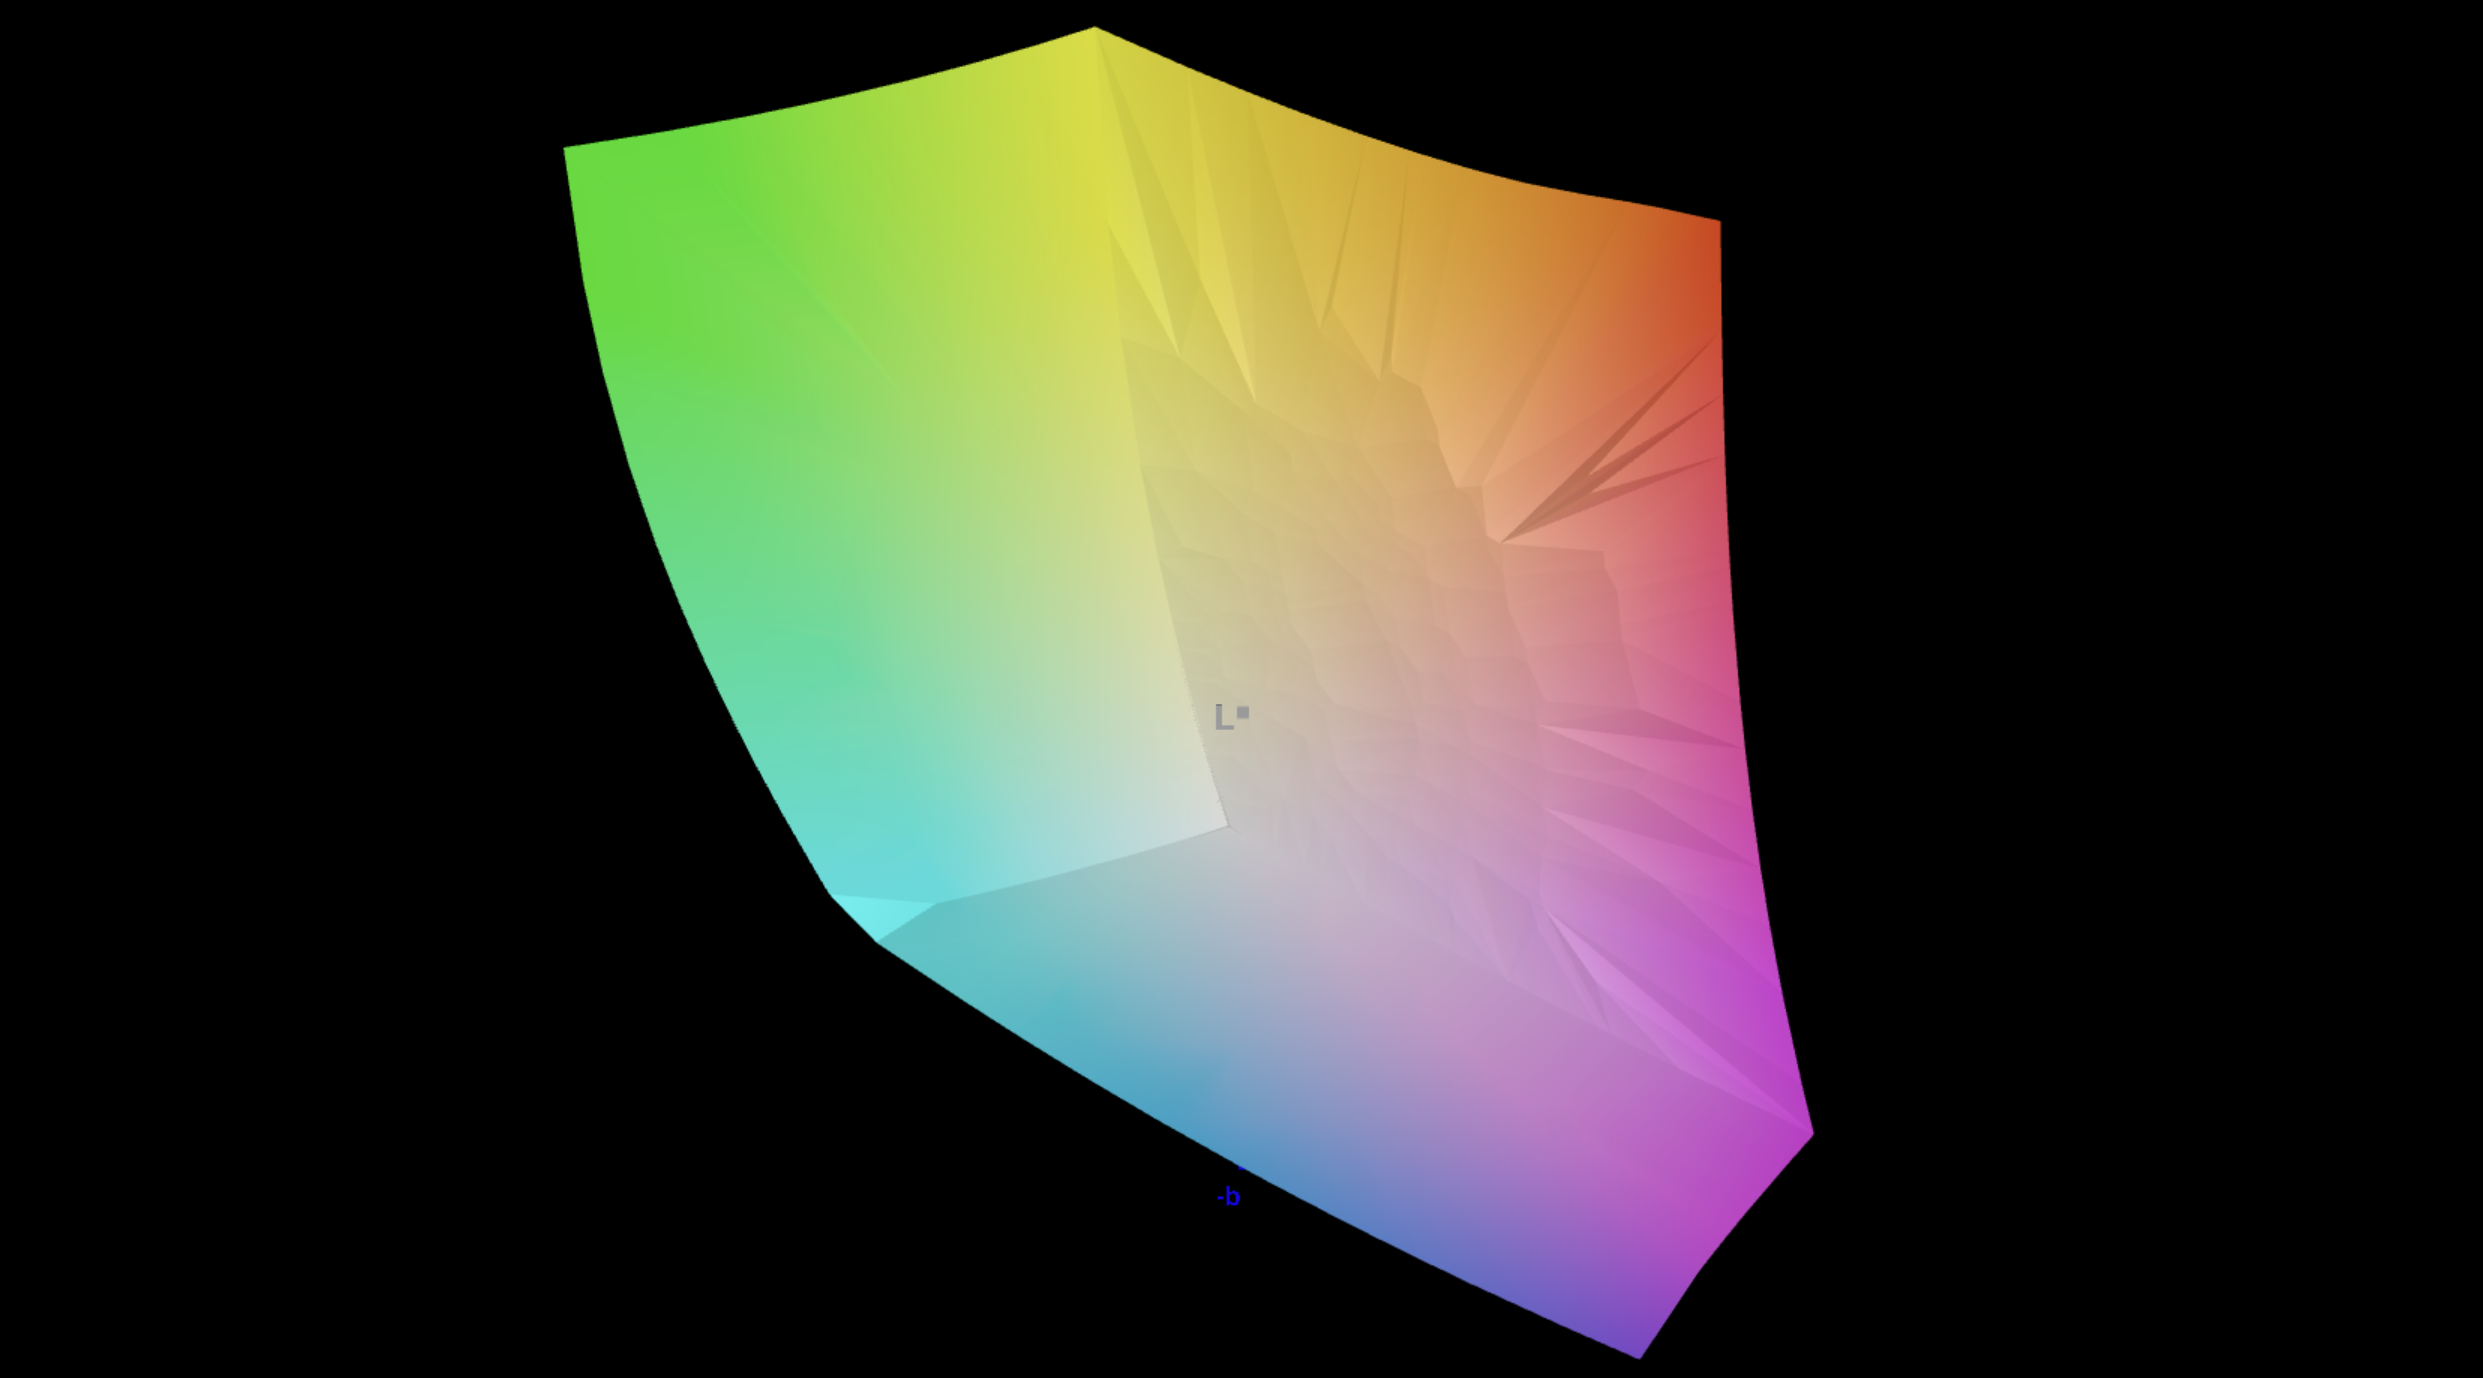
联想使用的是三星的亮面 OLED 面板(2560 x 1600),画质非常出色:令人印象深刻的色彩、完美的黑色、240 Hz 的流畅运动以及快速响应时间、VRR 和 G-Sync。虽然存在 PWM 闪烁,但频率高达 1.4 kHz。无论是 SDR 还是 HDR(面板亮度也高达 1100 尼特),游戏看起来都非常震撼。SDR 的亮度也达到了 500 尼特,联想还提供了开箱即用的精确色彩配置文件,因此您也可以编辑图片/视频(P3 和 sRGB)。我们自己的校准并没有进一步改善图像质量。
| |||||||||||||||||||||||||
Brightness Distribution: 98 %
Center on Battery: 499 cd/m²
Contrast: 24950:1 (Black: 0.02 cd/m²)
ΔE ColorChecker Calman: 2.5 | ∀{0.5-29.43 Ø4.71}
ΔE Greyscale Calman: 4.7 | ∀{0.09-98 Ø4.96}
90.2% AdobeRGB 1998 (Argyll 3D)
100% sRGB (Argyll 3D)
99.2% Display P3 (Argyll 3D)
Gamma: 2.21
CCT: 6715 K
| Lenovo Legion 7 16 AGP11 ATNA60HU02-0, OLED, 2560x1600, 16", 240 Hz | Lenovo Legion 7 16IAX10 Samsung ATNA60HS01-0, OLED, 2560x1600, 16", 165 Hz | Schenker XMG Core 16 VE M25 MNG007DA5-4, IPS, 2560x1600, 16", 180 Hz | Schenker XMG FUSION 16 (M25) ATNA60CL10_0, OLED, 2880x1800, 16", 120 Hz | HP Omen 16-ap0091ng AUODBB2, IPS, 1920x1200, 16", 144 Hz | Asus TUF Gaming A16 FA608UP MNG007DA5-3, IPS, 2560x1600, 16", 165 Hz | no name Hz | Lenovo Legion 5 15AHP G10 LEN151WQXGA, OLED, 2560x1600, 15.1", 165 Hz | |
|---|---|---|---|---|---|---|---|---|
| Display | 1% | -17% | 1% | -53% | -18% | 3% | ||
| Display P3 Coverage (%) | 99.2 | 99.6 0% | 69 -30% | 99.9 1% | 40 -60% | 69.4 -30% | 99.9 1% | |
| sRGB Coverage (%) | 100 | 100 0% | 98.7 -1% | 100 0% | 58.1 -42% | 97.2 -3% | 100 0% | |
| AdobeRGB 1998 Coverage (%) | 90.2 | 93.5 4% | 71.4 -21% | 93.3 3% | 38.7 -57% | 71.9 -20% | 98.3 9% | |
| Response Times | -38% | -1329% | -10% | -4759% | -1084% | 28% | ||
| Response Time Grey 50% / Grey 80% * (ms) | 1.41 ? | 0.6 ? 57% | 12.1 ? -758% | 0.56 ? 60% | 27.6 ? -1857% | 6.3 ? -347% | 0.42 ? 70% | |
| Response Time Black / White * (ms) | 0.25 ? | 0.8 ? -220% | 5 ? -1900% | 0.58 ? -132% | 19.4 ? -7660% | 4.8 ? -1820% | 0.4 ? -60% | |
| PWM Frequency (Hz) | 1440 ? | 1317 ? | 480 ? | 1152 ? | ||||
| PWM Amplitude * (%) | 44 | 23 48% | 26 41% | 11 75% | ||||
| Screen | 12% | -245% | 3% | -191% | -179% | -152% | 35% | |
| Brightness middle (cd/m²) | 499 | 477.6 -4% | 490 -2% | 434 -13% | 328 -34% | 480 -4% | 345.3 -31% | 492 -1% |
| Brightness (cd/m²) | 502 | 483 -4% | 488 -3% | 433 -14% | 313 -38% | 456 -9% | 324 -35% | 495 -1% |
| Brightness Distribution (%) | 98 | 95 -3% | 95 -3% | 99 1% | 91 -7% | 91 -7% | 88 -10% | 92 -6% |
| Black Level * (cd/m²) | 0.02 | 0.42 -2000% | 0.26 -1200% | 0.32 -1500% | 0.23 -1050% | |||
| Contrast (:1) | 24950 | 1167 -95% | 1262 -95% | 1500 -94% | 1501 -94% | |||
| Colorchecker dE 2000 * | 2.5 | 3.11 -24% | 1.45 42% | 3 -20% | 4.73 -89% | 1.4 44% | 3.22 -29% | 0.9 64% |
| Colorchecker dE 2000 max. * | 7.8 | 5.99 23% | 4.19 46% | 5.1 35% | 17.47 -124% | 2.5 68% | 5.68 27% | 1.8 77% |
| Greyscale dE 2000 * | 4.7 | 0.9 81% | 2 57% | 3.4 28% | 2.05 56% | 1.2 74% | 4.5 4% | 1.2 74% |
| Gamma | 2.21 100% | 2.18 101% | 2.172 101% | 2.47 89% | 2.63 84% | 2.16 102% | 2.1 105% | 2.16 102% |
| CCT | 6715 97% | 6405 101% | 6738 96% | 6452 101% | 6718 97% | 6620 98% | 7041 92% | 6291 103% |
| Colorchecker dE 2000 calibrated * | 0.79 | 0.98 | 1.4 | 4.22 | 1.3 | 0.93 | ||
| Total Average (Program / Settings) | -8% /
-4% | -530% /
-359% | -2% /
-1% | -1668% /
-862% | -427% /
-281% | -152% /
-152% | 22% /
25% |
* ... smaller is better


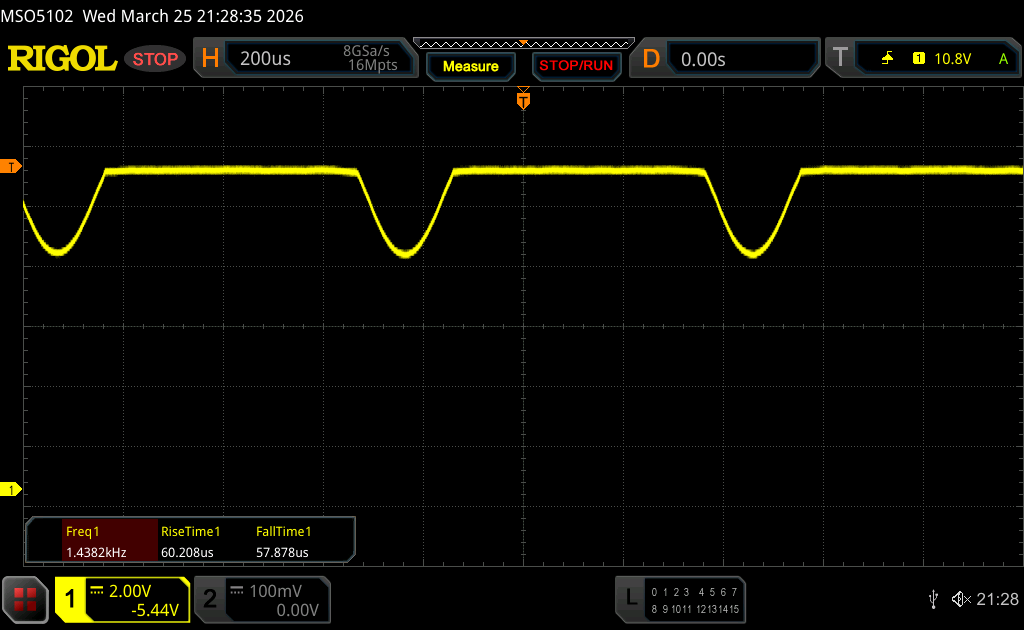
Display Response Times
| ↔ Response Time Black to White | ||
|---|---|---|
| 0.25 ms ... rise ↗ and fall ↘ combined | ↗ 0.13 ms rise | 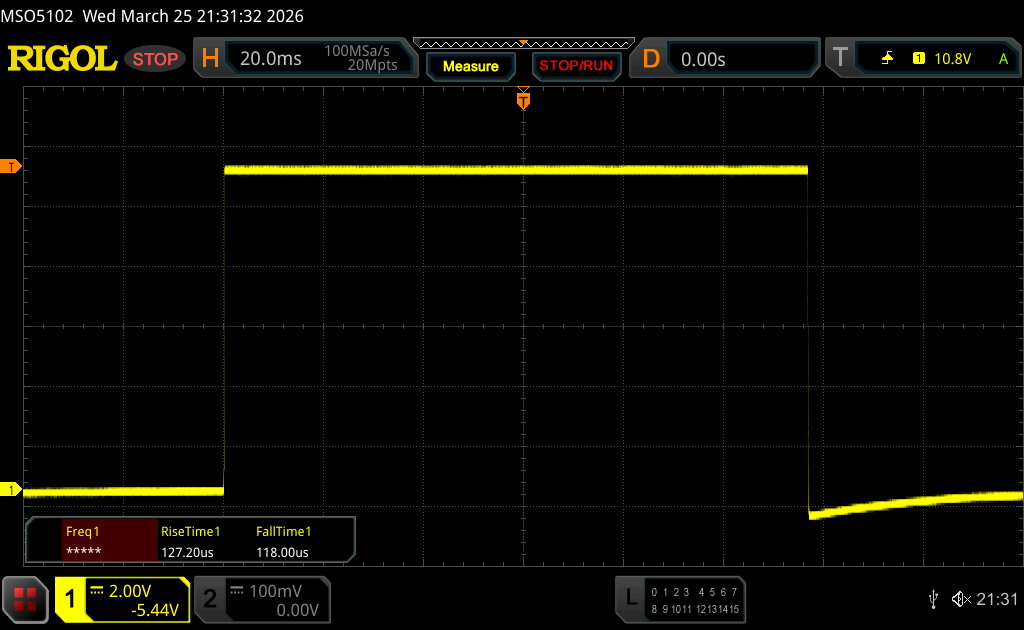 |
| ↘ 0.12 ms fall | ||
| The screen shows very fast response rates in our tests and should be very well suited for fast-paced gaming. In comparison, all tested devices range from 0.1 (minimum) to 240 (maximum) ms. » 0 % of all devices are better. This means that the measured response time is better than the average of all tested devices (19.8 ms). | ||
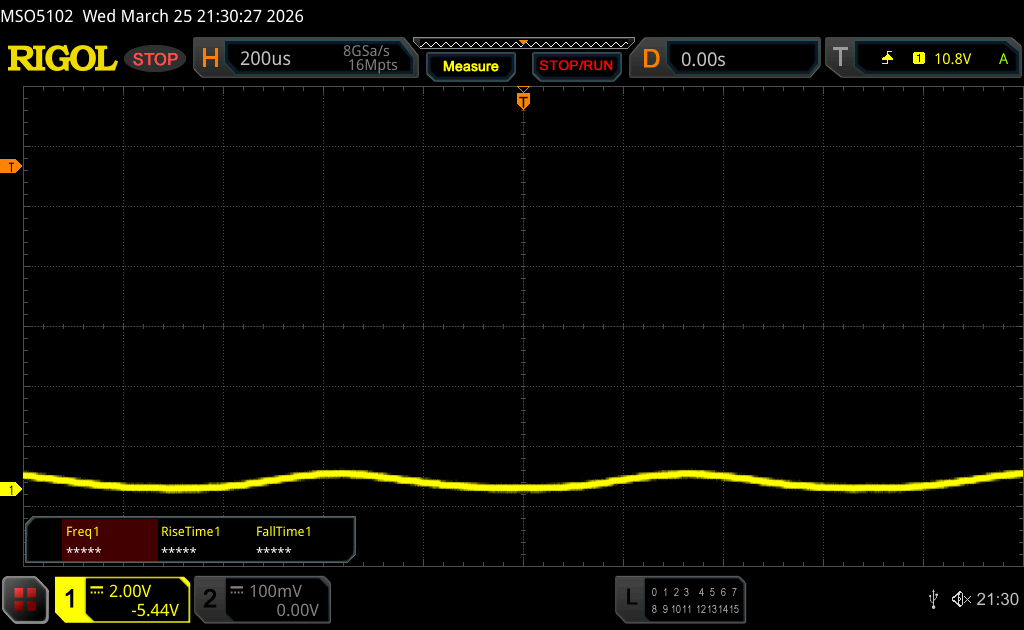
| ↔ Response Time 50% Grey to 80% Grey | ||
| 1.41 ms ... rise ↗ and fall ↘ combined | ↗ 0.7 ms rise | 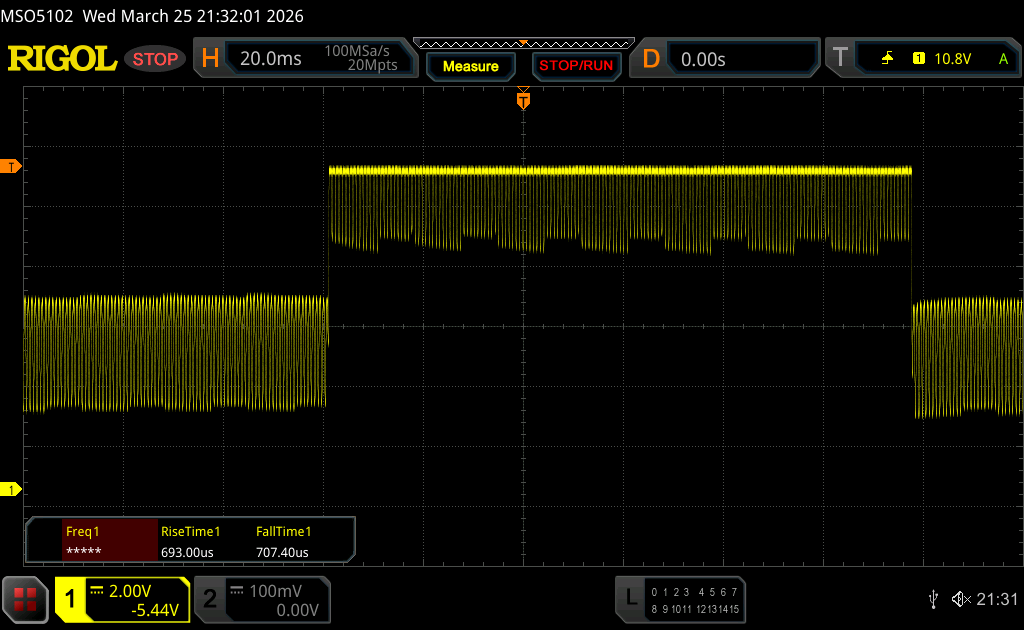 |
| ↘ 0.71 ms fall | ||
| The screen shows very fast response rates in our tests and should be very well suited for fast-paced gaming. In comparison, all tested devices range from 0.165 (minimum) to 636 (maximum) ms. » 7 % of all devices are better. This means that the measured response time is better than the average of all tested devices (31 ms). | ||
Screen Flickering / PWM (Pulse-Width Modulation)
| Screen flickering / PWM detected | 1440 Hz Amplitude: 44 % | ≤ 90 % brightness setting | 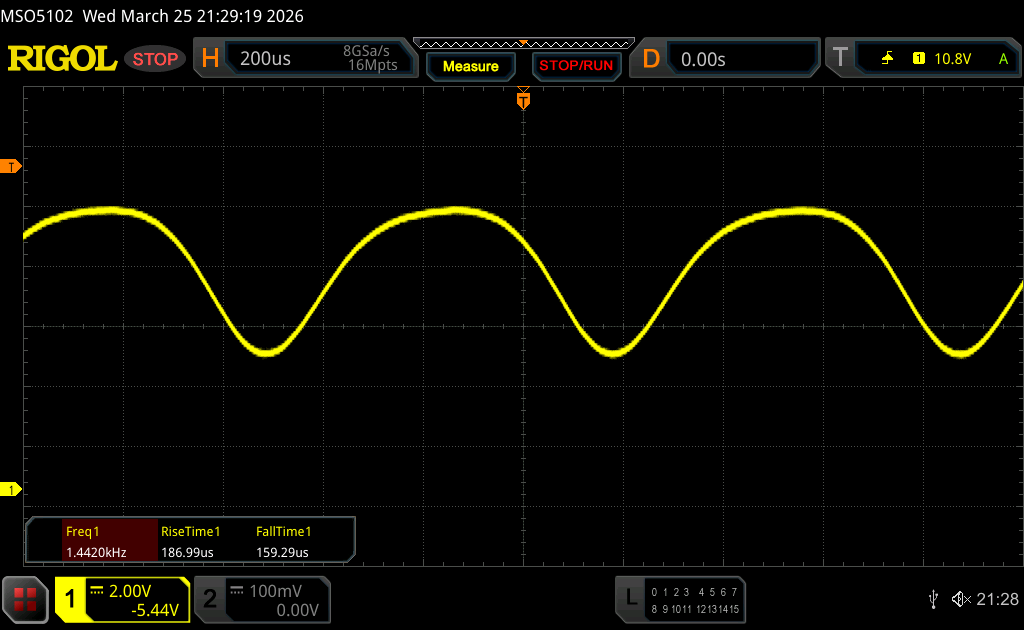 |
The display backlight flickers at 1440 Hz (worst case, e.g., utilizing PWM) Flickering detected at a brightness setting of 90 % and below. There should be no flickering or PWM above this brightness setting. The frequency of 1440 Hz is quite high, so most users sensitive to PWM should not notice any flickering. In comparison: 52 % of all tested devices do not use PWM to dim the display. If PWM was detected, an average of 7747 (minimum: 5 - maximum: 343500) Hz was measured. | |||


性能 - Ryzen 400 和 Blackwell
测试条件
联想提供了不同的电源配置文件(与 Windows 设置相关),您必须使用 "性能"模式才能获得最高的 GPU 性能。不过,对于轻度工作负载,您可以轻松使用 "安静 " 模式。我们在性能 模式下进行了基准测试。您可以使用手动 模式将 GPU TGP 提高到 115 瓦,但必须手动调整,而且不能使用快捷键(Fn+Q)进入手动 模式,这非常不实用。
| 能耗曲线 | CPU TDP | CB24 Multi | GPU TGP | Time Spy Graphics | 赛博朋克 2077 QHD Ultra | 最大风扇噪音 |
|---|---|---|---|---|---|---|
| 静音 | 45 W | 1127 pts | 60 W | 9688 pts | 45.9 fps | 41.3 dB(A) |
| 自动 | 80 W | 1220 pts | 75 W | 10747 pts | 50.9 fps | 46.5 dB(A) |
| 性能 | 90/85 W | 1241 pts | 95 W | 12071 pts | 56.2 fps | 53 dB(A) |
| 电池(自动) | 45 W | 1088 分 | 55 W | 9071 分 | 42.1 帧/秒 | 45.9 dB(A) |
处理器
餈 AMD Ryzen AI 9 HX470提供了良好而稳定的 CPU 性能,但与上一代产品中的英特尔 HX 处理器相比,速度也要慢得多。 Legion 7 16 G10.我们的不同功率模式表还显示,CPU 并没有真正从更高的功率限制中获益,因为从 45W 到 80-90W 的性能提升非常小(10%)。
Cinebench R15 多回路运行
Cinebench 2024: CPU Multi Core | CPU Single Core
Cinebench R23: Multi Core | Single Core
Cinebench R20: CPU (Multi Core) | CPU (Single Core)
Cinebench R15: CPU Multi 64Bit | CPU Single 64Bit
Blender: v2.79 BMW27 CPU
7-Zip 18.03: 7z b 4 | 7z b 4 -mmt1
Geekbench 6.7: Multi-Core | Single-Core
Geekbench 5.5: Multi-Core | Single-Core
HWBOT x265 Benchmark v2.2: 4k Preset
LibreOffice : 20 Documents To PDF
R Benchmark 2.5: Overall mean
| CPU Performance rating | |
| Schenker XMG FUSION 16 (M25) | |
| Lenovo Legion 7 16IAX10 | |
| Average of class Gaming | |
| HP Omen 16-ap0091ng -2! | |
| Lenovo Legion 7 16 AGP11 | |
| Average AMD Ryzen AI 9 HX 470 | |
| Lenovo Legion 5 15AHP G10 | |
| Schenker XMG Core 16 VE M25 | |
| Asus TUF Gaming A16 FA608UP | |
| Cinebench 2024 / CPU Multi Core | |
| Schenker XMG FUSION 16 (M25) | |
| Lenovo Legion 7 16IAX10 | |
| Average of class Gaming (486 - 2327, n=89, last 2 years) | |
| Lenovo Legion 7 16 AGP11 | |
| Average AMD Ryzen AI 9 HX 470 (1087 - 1247, n=5) | |
| Lenovo Legion 5 15AHP G10 | |
| Asus TUF Gaming A16 FA608UP | |
| Schenker XMG Core 16 VE M25 | |
| Cinebench 2024 / CPU Single Core | |
| Schenker XMG FUSION 16 (M25) | |
| Lenovo Legion 7 16IAX10 | |
| Average of class Gaming (95 - 141, n=89, last 2 years) | |
| Average AMD Ryzen AI 9 HX 470 (119 - 122, n=5) | |
| Lenovo Legion 7 16 AGP11 | |
| Lenovo Legion 5 15AHP G10 | |
| Asus TUF Gaming A16 FA608UP | |
| Schenker XMG Core 16 VE M25 | |
| Cinebench R23 / Multi Core | |
| Schenker XMG FUSION 16 (M25) | |
| Lenovo Legion 7 16IAX10 | |
| HP Omen 16-ap0091ng | |
| Average of class Gaming (10488 - 42661, n=107, last 2 years) | |
| Lenovo Legion 7 16 AGP11 | |
| Average AMD Ryzen AI 9 HX 470 (22589 - 23997, n=5) | |
| Lenovo Legion 5 15AHP G10 | |
| Schenker XMG Core 16 VE M25 | |
| Asus TUF Gaming A16 FA608UP | |
| Cinebench R23 / Single Core | |
| Schenker XMG FUSION 16 (M25) | |
| Lenovo Legion 7 16IAX10 | |
| Average AMD Ryzen AI 9 HX 470 (2061 - 2091, n=5) | |
| Lenovo Legion 7 16 AGP11 | |
| Average of class Gaming (1166 - 2415, n=107, last 2 years) | |
| HP Omen 16-ap0091ng | |
| Lenovo Legion 5 15AHP G10 | |
| Asus TUF Gaming A16 FA608UP | |
| Schenker XMG Core 16 VE M25 | |
| Cinebench R20 / CPU (Multi Core) | |
| Schenker XMG FUSION 16 (M25) | |
| Lenovo Legion 7 16IAX10 | |
| HP Omen 16-ap0091ng | |
| Average of class Gaming (4029 - 16433, n=106, last 2 years) | |
| Lenovo Legion 7 16 AGP11 | |
| Average AMD Ryzen AI 9 HX 470 (8746 - 9354, n=5) | |
| Lenovo Legion 5 15AHP G10 | |
| Schenker XMG Core 16 VE M25 | |
| Asus TUF Gaming A16 FA608UP | |
| Cinebench R20 / CPU (Single Core) | |
| Schenker XMG FUSION 16 (M25) | |
| Lenovo Legion 7 16IAX10 | |
| Average AMD Ryzen AI 9 HX 470 (806 - 822, n=5) | |
| Lenovo Legion 7 16 AGP11 | |
| Average of class Gaming (442 - 913, n=106, last 2 years) | |
| HP Omen 16-ap0091ng | |
| Lenovo Legion 5 15AHP G10 | |
| Asus TUF Gaming A16 FA608UP | |
| Schenker XMG Core 16 VE M25 | |
| Cinebench R15 / CPU Multi 64Bit | |
| Schenker XMG FUSION 16 (M25) | |
| Lenovo Legion 7 16IAX10 | |
| HP Omen 16-ap0091ng | |
| Average of class Gaming (1578 - 6330, n=105, last 2 years) | |
| Lenovo Legion 7 16 AGP11 | |
| Average AMD Ryzen AI 9 HX 470 (3372 - 3607, n=5) | |
| Schenker XMG Core 16 VE M25 | |
| Lenovo Legion 5 15AHP G10 | |
| Asus TUF Gaming A16 FA608UP | |
| Cinebench R15 / CPU Single 64Bit | |
| Schenker XMG FUSION 16 (M25) | |
| Lenovo Legion 7 16IAX10 | |
| Average of class Gaming (188.8 - 350, n=106, last 2 years) | |
| Average AMD Ryzen AI 9 HX 470 (192.7 - 322, n=5) | |
| HP Omen 16-ap0091ng | |
| Lenovo Legion 5 15AHP G10 | |
| Schenker XMG Core 16 VE M25 | |
| Asus TUF Gaming A16 FA608UP | |
| Lenovo Legion 7 16 AGP11 | |
| Blender / v2.79 BMW27 CPU | |
| Schenker XMG Core 16 VE M25 | |
| Lenovo Legion 5 15AHP G10 | |
| Asus TUF Gaming A16 FA608UP | |
| Average of class Gaming (79 - 330, n=104, last 2 years) | |
| Average AMD Ryzen AI 9 HX 470 (140 - 149, n=5) | |
| Lenovo Legion 7 16 AGP11 | |
| HP Omen 16-ap0091ng | |
| Lenovo Legion 7 16IAX10 | |
| Schenker XMG FUSION 16 (M25) | |
| 7-Zip 18.03 / 7z b 4 | |
| Schenker XMG FUSION 16 (M25) | |
| HP Omen 16-ap0091ng | |
| Lenovo Legion 7 16IAX10 | |
| Average of class Gaming (33491 - 148086, n=105, last 2 years) | |
| Lenovo Legion 7 16 AGP11 | |
| Average AMD Ryzen AI 9 HX 470 (73258 - 84545, n=5) | |
| Schenker XMG Core 16 VE M25 | |
| Lenovo Legion 5 15AHP G10 | |
| Asus TUF Gaming A16 FA608UP | |
| 7-Zip 18.03 / 7z b 4 -mmt1 | |
| HP Omen 16-ap0091ng | |
| Schenker XMG FUSION 16 (M25) | |
| Schenker XMG Core 16 VE M25 | |
| Lenovo Legion 7 16IAX10 | |
| Lenovo Legion 5 15AHP G10 | |
| Average AMD Ryzen AI 9 HX 470 (6244 - 6562, n=5) | |
| Average of class Gaming (4199 - 7436, n=105, last 2 years) | |
| Lenovo Legion 7 16 AGP11 | |
| Asus TUF Gaming A16 FA608UP | |
| Geekbench 6.7 / Multi-Core | |
| Schenker XMG FUSION 16 (M25) | |
| Lenovo Legion 7 16IAX10 | |
| Lenovo Legion 7 16 AGP11 | |
| Average of class Gaming (6625 - 22850, n=106, last 2 years) | |
| Average AMD Ryzen AI 9 HX 470 (11437 - 16116, n=7) | |
| Schenker XMG Core 16 VE M25 | |
| Lenovo Legion 5 15AHP G10 | |
| Asus TUF Gaming A16 FA608UP | |
| HP Omen 16-ap0091ng | |
| Geekbench 6.7 / Single-Core | |
| Schenker XMG FUSION 16 (M25) | |
| Lenovo Legion 7 16 AGP11 | |
| Average AMD Ryzen AI 9 HX 470 (2872 - 3000, n=7) | |
| Lenovo Legion 7 16IAX10 | |
| Average of class Gaming (1490 - 3259, n=106, last 2 years) | |
| HP Omen 16-ap0091ng | |
| Lenovo Legion 5 15AHP G10 | |
| Asus TUF Gaming A16 FA608UP | |
| Schenker XMG Core 16 VE M25 | |
| Geekbench 5.5 / Multi-Core | |
| Schenker XMG FUSION 16 (M25) | |
| Lenovo Legion 7 16IAX10 | |
| Average of class Gaming (6460 - 28263, n=105, last 2 years) | |
| Lenovo Legion 7 16 AGP11 | |
| Average AMD Ryzen AI 9 HX 470 (12418 - 16002, n=5) | |
| HP Omen 16-ap0091ng | |
| Schenker XMG Core 16 VE M25 | |
| Lenovo Legion 5 15AHP G10 | |
| Asus TUF Gaming A16 FA608UP | |
| Geekbench 5.5 / Single-Core | |
| Schenker XMG FUSION 16 (M25) | |
| Lenovo Legion 7 16 AGP11 | |
| Lenovo Legion 7 16IAX10 | |
| Average AMD Ryzen AI 9 HX 470 (1950 - 2193, n=5) | |
| Average of class Gaming (986 - 2474, n=105, last 2 years) | |
| Lenovo Legion 5 15AHP G10 | |
| HP Omen 16-ap0091ng | |
| Asus TUF Gaming A16 FA608UP | |
| Schenker XMG Core 16 VE M25 | |
| HWBOT x265 Benchmark v2.2 / 4k Preset | |
| Schenker XMG FUSION 16 (M25) | |
| Lenovo Legion 7 16IAX10 | |
| Average of class Gaming (11.5 - 44.4, n=105, last 2 years) | |
| Lenovo Legion 7 16 AGP11 | |
| Average AMD Ryzen AI 9 HX 470 (24.9 - 28.5, n=5) | |
| HP Omen 16-ap0091ng | |
| Lenovo Legion 5 15AHP G10 | |
| Schenker XMG Core 16 VE M25 | |
| Asus TUF Gaming A16 FA608UP | |
| LibreOffice / 20 Documents To PDF | |
| Average AMD Ryzen AI 9 HX 470 (53.8 - 59.9, n=5) | |
| Schenker XMG Core 16 VE M25 | |
| Asus TUF Gaming A16 FA608UP | |
| Lenovo Legion 7 16 AGP11 | |
| Schenker XMG FUSION 16 (M25) | |
| Average of class Gaming (33.2 - 88.8, n=105, last 2 years) | |
| Lenovo Legion 5 15AHP G10 | |
| HP Omen 16-ap0091ng | |
| Lenovo Legion 7 16IAX10 | |
| R Benchmark 2.5 / Overall mean | |
| Schenker XMG Core 16 VE M25 | |
| Asus TUF Gaming A16 FA608UP | |
| Lenovo Legion 5 15AHP G10 | |
| Lenovo Legion 7 16IAX10 | |
| Average of class Gaming (0.3439 - 0.759, n=106, last 2 years) | |
| HP Omen 16-ap0091ng | |
| Lenovo Legion 7 16 AGP11 | |
| Schenker XMG FUSION 16 (M25) | |
| Average AMD Ryzen AI 9 HX 470 (0.3848 - 0.4157, n=5) | |
* ... smaller is better
AIDA64: FP32 Ray-Trace | FPU Julia | CPU SHA3 | CPU Queen | FPU SinJulia | FPU Mandel | CPU AES | CPU ZLib | FP64 Ray-Trace | CPU PhotoWorxx | CPU CheckMate
| Performance rating | |
| HP Omen 16-ap0091ng -1! | |
| Schenker XMG FUSION 16 (M25) -1! | |
| Lenovo Legion 7 16 AGP11 -1! | |
| Lenovo Legion 7 16IAX10 -1! | |
| Average of class Gaming | |
| Average AMD Ryzen AI 9 HX 470 | |
| Schenker XMG Core 16 VE M25 -1! | |
| Lenovo Legion 5 15AHP G10 -1! | |
| Asus TUF Gaming A16 FA608UP -1! | |
| AIDA64 / FP32 Ray-Trace | |
| HP Omen 16-ap0091ng (v6.92.6600) | |
| Lenovo Legion 7 16 AGP11 (v8.20.8100) | |
| Average AMD Ryzen AI 9 HX 470 (31969 - 38491, n=8) | |
| Schenker XMG FUSION 16 (M25) (v6.92.6600) | |
| Average of class Gaming (10227 - 85542, n=105, last 2 years) | |
| Lenovo Legion 5 15AHP G10 (v6.92.6600) | |
| Lenovo Legion 7 16IAX10 (v6.92.6600) | |
| Asus TUF Gaming A16 FA608UP (v6.92.6600) | |
| Schenker XMG Core 16 VE M25 (v6.92.6600) | |
| AIDA64 / FPU Julia | |
| Schenker XMG FUSION 16 (M25) (v6.92.6600) | |
| HP Omen 16-ap0091ng (v6.92.6600) | |
| Lenovo Legion 7 16IAX10 (v6.92.6600) | |
| Lenovo Legion 7 16 AGP11 (v8.20.8100) | |
| Average of class Gaming (51376 - 238426, n=105, last 2 years) | |
| Average AMD Ryzen AI 9 HX 470 (117908 - 152422, n=8) | |
| Lenovo Legion 5 15AHP G10 (v6.92.6600) | |
| Asus TUF Gaming A16 FA608UP (v6.92.6600) | |
| Schenker XMG Core 16 VE M25 (v6.92.6600) | |
| AIDA64 / CPU SHA3 | |
| Schenker XMG FUSION 16 (M25) (v6.92.6600) | |
| HP Omen 16-ap0091ng (v6.92.6600) | |
| Lenovo Legion 7 16IAX10 (v6.92.6600) | |
| Average of class Gaming (2180 - 10115, n=105, last 2 years) | |
| Lenovo Legion 7 16 AGP11 (v8.20.8100) | |
| Average AMD Ryzen AI 9 HX 470 (5074 - 5821, n=8) | |
| Schenker XMG Core 16 VE M25 (v6.92.6600) | |
| Asus TUF Gaming A16 FA608UP (v6.92.6600) | |
| Lenovo Legion 5 15AHP G10 (v6.92.6600) | |
| AIDA64 / CPU Queen | |
| HP Omen 16-ap0091ng (v6.92.6600) | |
| Lenovo Legion 7 16IAX10 (v6.92.6600) | |
| Schenker XMG FUSION 16 (M25) (v6.92.6600) | |
| Schenker XMG Core 16 VE M25 (v6.92.6600) | |
| Lenovo Legion 5 15AHP G10 (v6.92.6600) | |
| Asus TUF Gaming A16 FA608UP (v6.92.6600) | |
| Average of class Gaming (49785 - 173351, n=90, last 2 years) | |
| Average AMD Ryzen AI 9 HX 470 (89114 - 100242, n=3) | |
| AIDA64 / FPU SinJulia | |
| HP Omen 16-ap0091ng (v6.92.6600) | |
| Lenovo Legion 7 16 AGP11 (v8.20.8100) | |
| Average AMD Ryzen AI 9 HX 470 (17747 - 19320, n=8) | |
| Schenker XMG Core 16 VE M25 (v6.92.6600) | |
| Lenovo Legion 5 15AHP G10 (v6.92.6600) | |
| Asus TUF Gaming A16 FA608UP (v6.92.6600) | |
| Average of class Gaming (4424 - 33636, n=105, last 2 years) | |
| Schenker XMG FUSION 16 (M25) (v6.92.6600) | |
| Lenovo Legion 7 16IAX10 (v6.92.6600) | |
| AIDA64 / FPU Mandel | |
| HP Omen 16-ap0091ng (v6.92.6600) | |
| Schenker XMG FUSION 16 (M25) (v6.92.6600) | |
| Lenovo Legion 7 16IAX10 (v6.92.6600) | |
| Lenovo Legion 7 16 AGP11 (v8.20.8100) | |
| Average of class Gaming (25115 - 128721, n=105, last 2 years) | |
| Average AMD Ryzen AI 9 HX 470 (66324 - 78045, n=8) | |
| Lenovo Legion 5 15AHP G10 (v6.92.6600) | |
| Asus TUF Gaming A16 FA608UP (v6.92.6600) | |
| Schenker XMG Core 16 VE M25 (v6.92.6600) | |
| AIDA64 / CPU AES | |
| HP Omen 16-ap0091ng (v6.92.6600) | |
| Schenker XMG FUSION 16 (M25) (v6.92.6600) | |
| Lenovo Legion 7 16 AGP11 (v8.20.8100) | |
| Lenovo Legion 7 16IAX10 (v6.92.6600) | |
| Average of class Gaming (39258 - 247074, n=105, last 2 years) | |
| Schenker XMG Core 16 VE M25 (v6.92.6600) | |
| Asus TUF Gaming A16 FA608UP (v6.92.6600) | |
| Average AMD Ryzen AI 9 HX 470 (78626 - 117375, n=8) | |
| Lenovo Legion 5 15AHP G10 (v6.92.6600) | |
| AIDA64 / CPU ZLib | |
| Schenker XMG FUSION 16 (M25) (v6.92.6600) | |
| Lenovo Legion 7 16IAX10 (v6.92.6600) | |
| HP Omen 16-ap0091ng (v6.92.6600) | |
| Average of class Gaming (574 - 2531, n=105, last 2 years) | |
| Lenovo Legion 7 16 AGP11 (v8.20.8100) | |
| Average AMD Ryzen AI 9 HX 470 (1434 - 1549, n=8) | |
| Schenker XMG Core 16 VE M25 (v6.92.6600) | |
| Lenovo Legion 5 15AHP G10 (v6.92.6600) | |
| Asus TUF Gaming A16 FA608UP (v6.92.6600) | |
| AIDA64 / FP64 Ray-Trace | |
| HP Omen 16-ap0091ng (v6.92.6600) | |
| Lenovo Legion 7 16 AGP11 (v8.20.8100) | |
| Average AMD Ryzen AI 9 HX 470 (16687 - 20313, n=8) | |
| Schenker XMG FUSION 16 (M25) (v6.92.6600) | |
| Average of class Gaming (5509 - 45446, n=105, last 2 years) | |
| Lenovo Legion 7 16IAX10 (v6.92.6600) | |
| Lenovo Legion 5 15AHP G10 (v6.92.6600) | |
| Asus TUF Gaming A16 FA608UP (v6.92.6600) | |
| Schenker XMG Core 16 VE M25 (v6.92.6600) | |
| AIDA64 / CPU PhotoWorxx | |
| Lenovo Legion 7 16 AGP11 (v8.20.8100) | |
| Schenker XMG FUSION 16 (M25) (v6.92.6600) | |
| Lenovo Legion 7 16IAX10 (v6.92.6600) | |
| Schenker XMG Core 16 VE M25 (v6.92.6600) | |
| Average of class Gaming (12271 - 89891, n=105, last 2 years) | |
| Lenovo Legion 5 15AHP G10 (v6.92.6600) | |
| Asus TUF Gaming A16 FA608UP (v6.92.6600) | |
| Average AMD Ryzen AI 9 HX 470 (23851 - 54302, n=8) | |
| HP Omen 16-ap0091ng (v6.92.6600) | |
| AIDA64 / CPU CheckMate | |
| Lenovo Legion 7 16 AGP11 (v8.20.8100) | |
| Average AMD Ryzen AI 9 HX 470 (7688 - 8080, n=5) | |
| Average of class Gaming (2930 - 11788, n=14, last 2 years) | |
系统性能
系统整体性能出色,我们没有遇到任何稳定性问题。
PCMark 10: Score | Essentials | Productivity | Digital Content Creation
CrossMark: Overall | Productivity | Creativity | Responsiveness
WebXPRT 3: Overall
WebXPRT 4: Overall
Mozilla Kraken 1.1: Total
| Performance rating | |
| Schenker XMG FUSION 16 (M25) | |
| Average of class Gaming | |
| Lenovo Legion 7 16IAX10 | |
| Average AMD Ryzen AI 9 HX 470, NVIDIA GeForce RTX 5060 Laptop | |
| Lenovo Legion 7 16 AGP11 | |
| Schenker XMG Core 16 VE M25 | |
| HP Omen 16-ap0091ng | |
| Lenovo Legion 5 15AHP G10 | |
| Asus TUF Gaming A16 FA608UP -4! | |
| PCMark 10 / Score | |
| Schenker XMG FUSION 16 (M25) | |
| Lenovo Legion 7 16 AGP11 | |
| Average AMD Ryzen AI 9 HX 470, NVIDIA GeForce RTX 5060 Laptop (n=1) | |
| Average of class Gaming (5828 - 12414, n=93, last 2 years) | |
| Lenovo Legion 5 15AHP G10 | |
| Schenker XMG Core 16 VE M25 | |
| HP Omen 16-ap0091ng | |
| Lenovo Legion 7 16IAX10 | |
| PCMark 10 / Essentials | |
| Lenovo Legion 7 16IAX10 | |
| Lenovo Legion 5 15AHP G10 | |
| HP Omen 16-ap0091ng | |
| Average of class Gaming (8810 - 11935, n=97, last 2 years) | |
| Lenovo Legion 7 16 AGP11 | |
| Average AMD Ryzen AI 9 HX 470, NVIDIA GeForce RTX 5060 Laptop (n=1) | |
| Schenker XMG FUSION 16 (M25) | |
| Schenker XMG Core 16 VE M25 | |
| PCMark 10 / Productivity | |
| Schenker XMG FUSION 16 (M25) | |
| Lenovo Legion 7 16 AGP11 | |
| Average AMD Ryzen AI 9 HX 470, NVIDIA GeForce RTX 5060 Laptop (n=1) | |
| Schenker XMG Core 16 VE M25 | |
| Average of class Gaming (6845 - 25323, n=95, last 2 years) | |
| Lenovo Legion 7 16IAX10 | |
| Lenovo Legion 5 15AHP G10 | |
| HP Omen 16-ap0091ng | |
| PCMark 10 / Digital Content Creation | |
| Schenker XMG FUSION 16 (M25) | |
| Lenovo Legion 7 16 AGP11 | |
| Average AMD Ryzen AI 9 HX 470, NVIDIA GeForce RTX 5060 Laptop (n=1) | |
| Average of class Gaming (7602 - 19954, n=95, last 2 years) | |
| Lenovo Legion 5 15AHP G10 | |
| HP Omen 16-ap0091ng | |
| Schenker XMG Core 16 VE M25 | |
| Lenovo Legion 7 16IAX10 | |
| CrossMark / Overall | |
| Schenker XMG FUSION 16 (M25) | |
| Lenovo Legion 7 16IAX10 | |
| Average of class Gaming (1366 - 2409, n=94, last 2 years) | |
| Schenker XMG Core 16 VE M25 | |
| HP Omen 16-ap0091ng | |
| Lenovo Legion 5 15AHP G10 | |
| Asus TUF Gaming A16 FA608UP | |
| Lenovo Legion 7 16 AGP11 | |
| Average AMD Ryzen AI 9 HX 470, NVIDIA GeForce RTX 5060 Laptop (n=1) | |
| CrossMark / Productivity | |
| Lenovo Legion 7 16IAX10 | |
| Schenker XMG FUSION 16 (M25) | |
| Average of class Gaming (1386 - 2254, n=94, last 2 years) | |
| HP Omen 16-ap0091ng | |
| Schenker XMG Core 16 VE M25 | |
| Lenovo Legion 5 15AHP G10 | |
| Asus TUF Gaming A16 FA608UP | |
| Lenovo Legion 7 16 AGP11 | |
| Average AMD Ryzen AI 9 HX 470, NVIDIA GeForce RTX 5060 Laptop (n=1) | |
| CrossMark / Creativity | |
| Schenker XMG FUSION 16 (M25) | |
| Lenovo Legion 7 16IAX10 | |
| Average of class Gaming (1343 - 2786, n=94, last 2 years) | |
| HP Omen 16-ap0091ng | |
| Schenker XMG Core 16 VE M25 | |
| Lenovo Legion 5 15AHP G10 | |
| Asus TUF Gaming A16 FA608UP | |
| Lenovo Legion 7 16 AGP11 | |
| Average AMD Ryzen AI 9 HX 470, NVIDIA GeForce RTX 5060 Laptop (n=1) | |
| CrossMark / Responsiveness | |
| Lenovo Legion 7 16IAX10 | |
| Schenker XMG FUSION 16 (M25) | |
| Average of class Gaming (1226 - 2334, n=94, last 2 years) | |
| Schenker XMG Core 16 VE M25 | |
| Lenovo Legion 5 15AHP G10 | |
| HP Omen 16-ap0091ng | |
| Lenovo Legion 7 16 AGP11 | |
| Average AMD Ryzen AI 9 HX 470, NVIDIA GeForce RTX 5060 Laptop (n=1) | |
| Asus TUF Gaming A16 FA608UP | |
| WebXPRT 3 / Overall | |
| Lenovo Legion 7 16IAX10 | |
| Schenker XMG FUSION 16 (M25) | |
| Lenovo Legion 7 16 AGP11 | |
| Average AMD Ryzen AI 9 HX 470, NVIDIA GeForce RTX 5060 Laptop (n=1) | |
| HP Omen 16-ap0091ng | |
| Average of class Gaming (220 - 532, n=98, last 2 years) | |
| Lenovo Legion 5 15AHP G10 | |
| Asus TUF Gaming A16 FA608UP | |
| Schenker XMG Core 16 VE M25 | |
| WebXPRT 4 / Overall | |
| Lenovo Legion 7 16IAX10 | |
| Schenker XMG FUSION 16 (M25) | |
| Average of class Gaming (165 - 354, n=98, last 2 years) | |
| Average AMD Ryzen AI 9 HX 470, NVIDIA GeForce RTX 5060 Laptop (n=1) | |
| Lenovo Legion 7 16 AGP11 | |
| Schenker XMG Core 16 VE M25 | |
| Lenovo Legion 5 15AHP G10 | |
| HP Omen 16-ap0091ng | |
| Asus TUF Gaming A16 FA608UP | |
| Mozilla Kraken 1.1 / Total | |
| Asus TUF Gaming A16 FA608UP | |
| HP Omen 16-ap0091ng | |
| Schenker XMG Core 16 VE M25 | |
| Lenovo Legion 5 15AHP G10 | |
| Average of class Gaming (391 - 590, n=100, last 2 years) | |
| Lenovo Legion 7 16IAX10 | |
| Schenker XMG FUSION 16 (M25) | |
| Lenovo Legion 7 16 AGP11 | |
| Average AMD Ryzen AI 9 HX 470, NVIDIA GeForce RTX 5060 Laptop (n=1) | |
* ... smaller is better
| PCMark 10 Score | 9485 points | |
Help | ||
| AIDA64 / Memory Copy | |
| Lenovo Legion 7 16IAX10 | |
| Lenovo Legion 7 16 AGP11 | |
| Schenker XMG FUSION 16 (M25) | |
| Average of class Gaming (21750 - 129946, n=105, last 2 years) | |
| Lenovo Legion 5 15AHP G10 | |
| Schenker XMG Core 16 VE M25 | |
| Asus TUF Gaming A16 FA608UP | |
| Average AMD Ryzen AI 9 HX 470 (38489 - 86767, n=8) | |
| HP Omen 16-ap0091ng | |
| AIDA64 / Memory Read | |
| Lenovo Legion 7 16 AGP11 | |
| Schenker XMG FUSION 16 (M25) | |
| Lenovo Legion 7 16IAX10 | |
| Average of class Gaming (22956 - 118858, n=105, last 2 years) | |
| Average AMD Ryzen AI 9 HX 470 (39901 - 93860, n=8) | |
| Asus TUF Gaming A16 FA608UP | |
| Lenovo Legion 5 15AHP G10 | |
| Schenker XMG Core 16 VE M25 | |
| HP Omen 16-ap0091ng | |
| AIDA64 / Memory Write | |
| Lenovo Legion 7 16 AGP11 | |
| Lenovo Legion 5 15AHP G10 | |
| Asus TUF Gaming A16 FA608UP | |
| Schenker XMG Core 16 VE M25 | |
| Schenker XMG FUSION 16 (M25) | |
| Lenovo Legion 7 16IAX10 | |
| Average of class Gaming (22297 - 135096, n=105, last 2 years) | |
| Average AMD Ryzen AI 9 HX 470 (40283 - 118364, n=8) | |
| HP Omen 16-ap0091ng | |
| AIDA64 / Memory Latency | |
| Schenker XMG FUSION 16 (M25) | |
| Average of class Gaming (75.3 - 259, n=105, last 2 years) | |
| Lenovo Legion 7 16IAX10 | |
| Lenovo Legion 7 16 AGP11 | |
| Average AMD Ryzen AI 9 HX 470 (88.1 - 104.5, n=8) | |
| Asus TUF Gaming A16 FA608UP | |
| Lenovo Legion 5 15AHP G10 | |
| Schenker XMG Core 16 VE M25 | |
| HP Omen 16-ap0091ng | |
* ... smaller is better
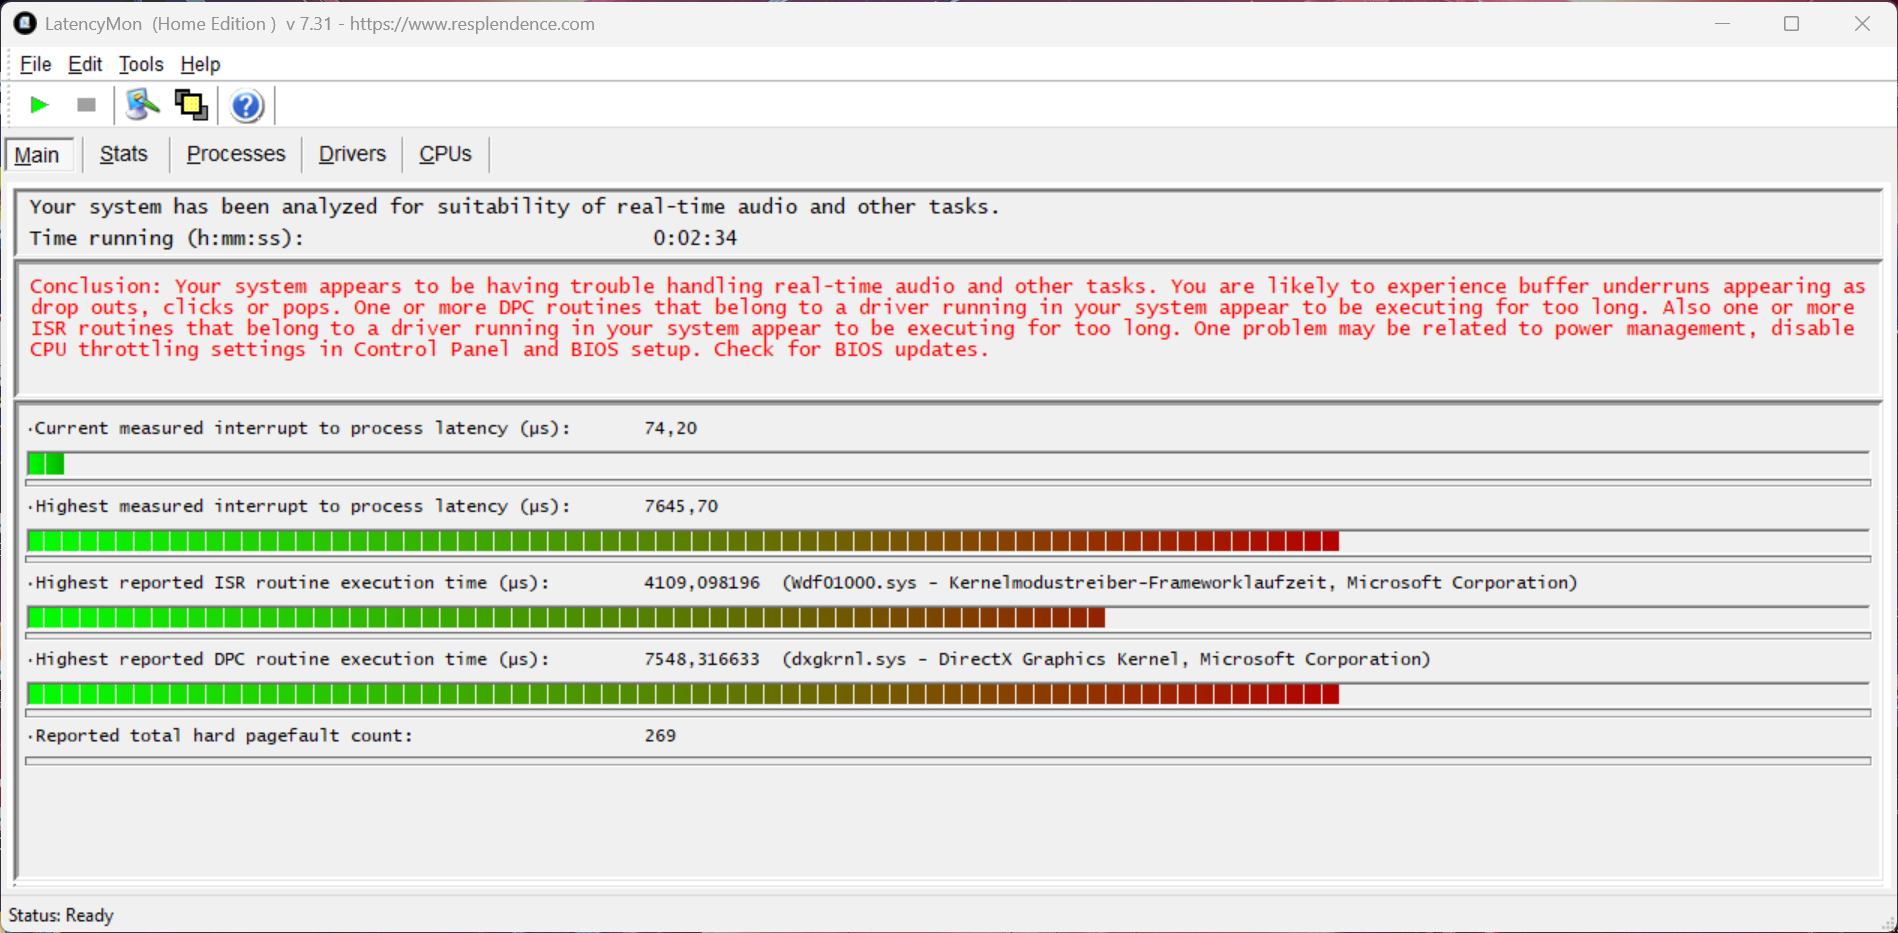
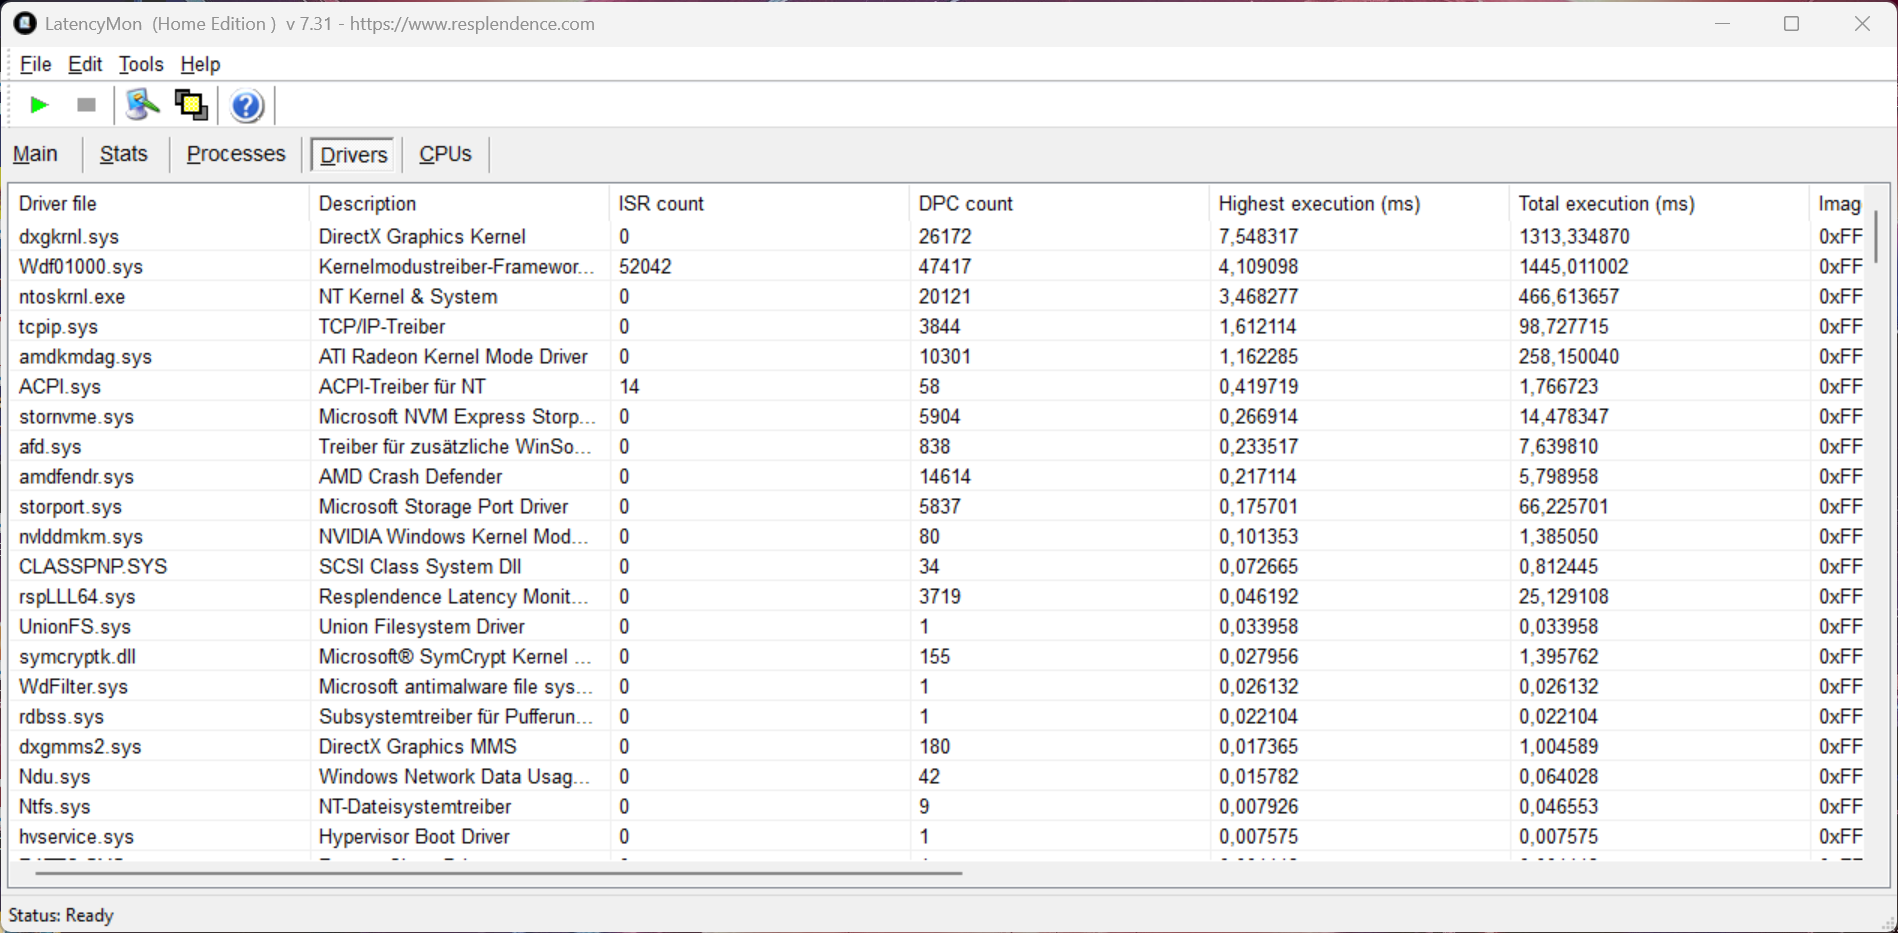
DPC 延迟
我们的标准化延迟测试表明,在当前 BIOS 版本下,评测设备存在问题,因此它不是实时音频应用的理想选择。
| DPC Latencies / LatencyMon - interrupt to process latency (max), Web, Youtube, Prime95 | |
| Lenovo Legion 7 16 AGP11 | |
| Lenovo Legion 5 15AHP G10 | |
| HP Omen 16-ap0091ng | |
| Schenker XMG Core 16 VE M25 | |
| Lenovo Legion 7 16IAX10 | |
| Schenker XMG FUSION 16 (M25) | |
| Asus TUF Gaming A16 FA608UP | |
* ... smaller is better
存储设备
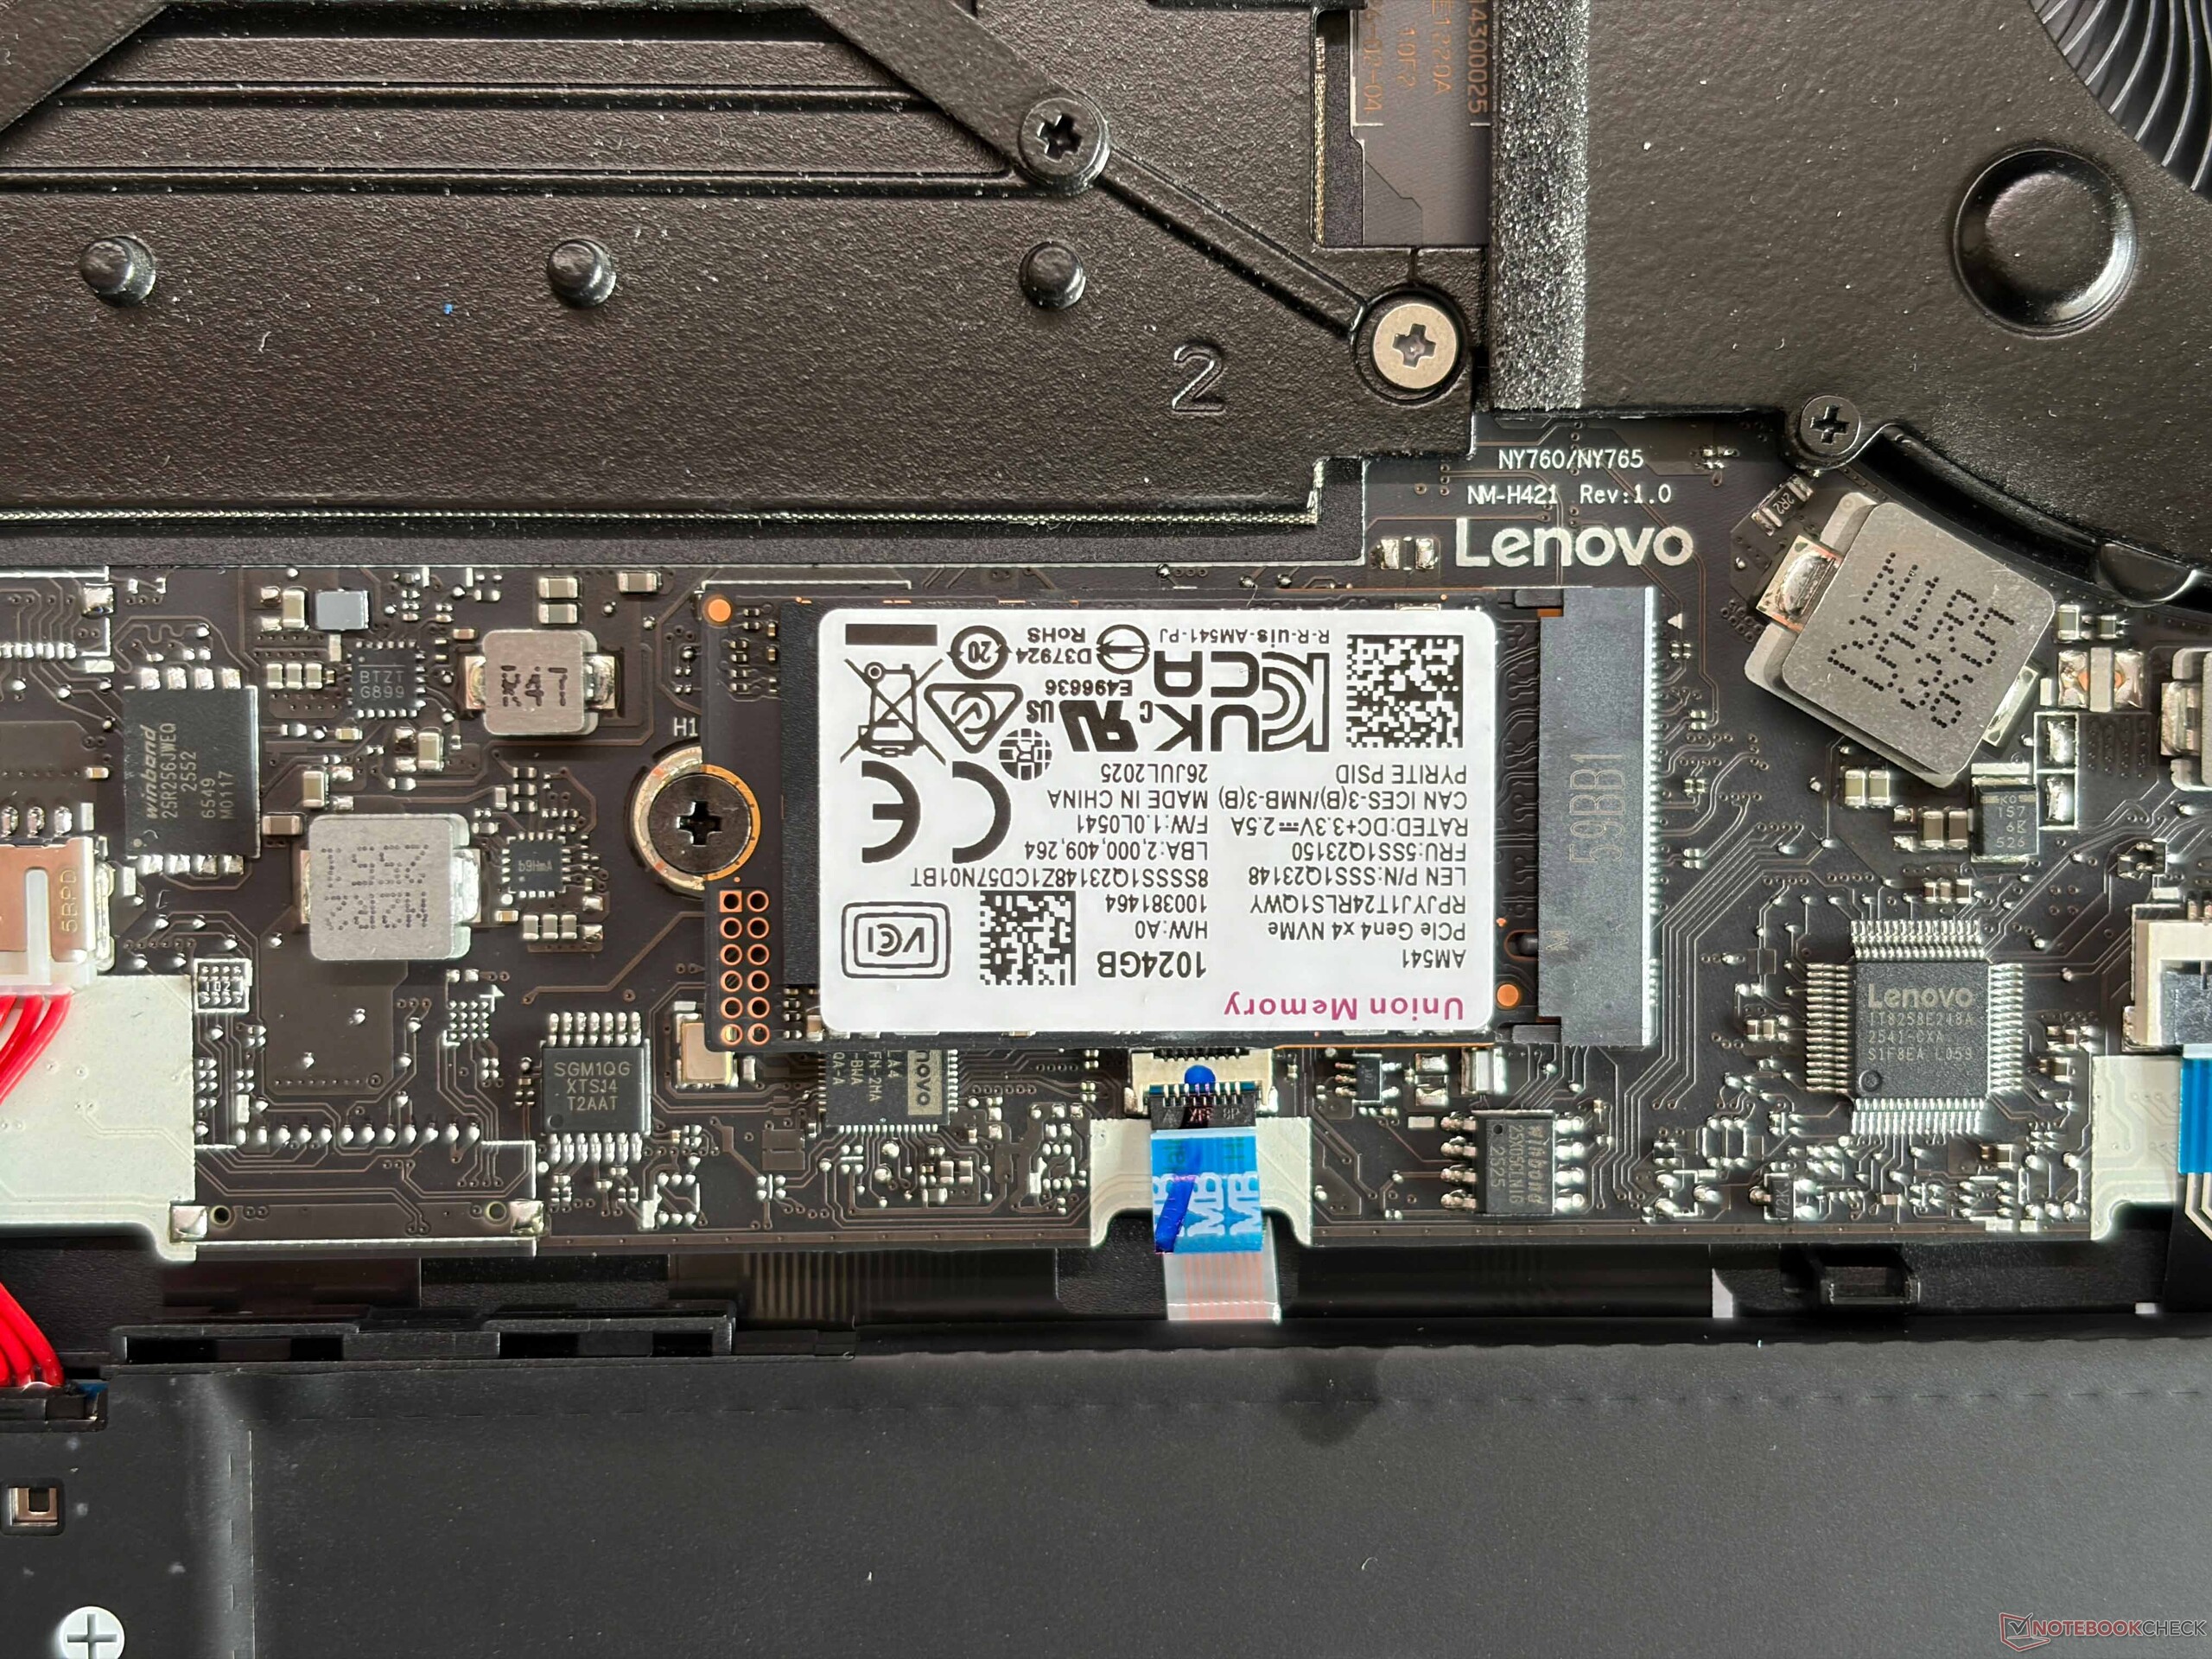
我们的评测机配备了联想自己的 UMIS AM541 1 TB PCIe 4.0 硬盘(870 GB 可用),紧凑型 M.2-2242 的传输速率尚可,但在持续工作负载下并不稳定。此外,还有一个空闲的 M.2-2280 插槽可用于另一块固态硬盘,但仅限于 PCIe 4.0 x2,因此传输速率上限约为 3.5-4 GB/s。

* ... smaller is better
磁盘节流DiskSpd 读取循环,队列深度 8
图形处理器性能
联想再次使用移动GeForce RTX 5060,但这次支持高级 Optimus。不过,与之前的Legion 7 16 G10 相比,TGP 从 115 瓦下降到 95 瓦,因此 GPU 性能也略有下降。游戏性能也受到了影响,而速度较慢的 AMD CPU 也无济于事。在我们的标准化游戏基准测试中,新款Legion 7a 16 G11 比旧款慢了约 10%,这只是轻薄设计所必须付出的代价。
| 3DMark 11 Performance | 34353 points | |
| 3DMark Fire Strike Score | 28519 points | |
| 3DMark Time Spy Score | 11735 points | |
| 3DMark Steel Nomad Score | 2605 points | |
| 3DMark Steel Nomad Light Score | 12141 points | |
Help | ||
| Blender / v3.3 Classroom OPTIX/RTX | |
| Average NVIDIA GeForce RTX 5060 Laptop (20 - 28, n=18) | |
| Lenovo Legion 5 15AHP G10 | |
| Lenovo Legion 7 16IAX10 | |
| HP Omen 16-ap0091ng | |
| Schenker XMG Core 16 VE M25 | |
| Lenovo Legion 7 16 AGP11 | |
| Asus TUF Gaming A16 FA608UP | |
| Schenker XMG FUSION 16 (M25) | |
| Average of class Gaming (9 - 32, n=106, last 2 years) | |
| Blender / v3.3 Classroom CUDA | |
| Average NVIDIA GeForce RTX 5060 Laptop (38 - 186, n=19) | |
| Lenovo Legion 7 16 AGP11 | |
| Schenker XMG Core 16 VE M25 | |
| Lenovo Legion 5 15AHP G10 | |
| Lenovo Legion 7 16IAX10 | |
| HP Omen 16-ap0091ng | |
| Schenker XMG FUSION 16 (M25) | |
| Asus TUF Gaming A16 FA608UP | |
| Average of class Gaming (15 - 228, n=106, last 2 years) | |
| Blender / v3.3 Classroom CPU | |
| Schenker XMG Core 16 VE M25 | |
| Asus TUF Gaming A16 FA608UP | |
| Lenovo Legion 5 15AHP G10 | |
| Average NVIDIA GeForce RTX 5060 Laptop (133 - 511, n=18) | |
| Average of class Gaming (122 - 565, n=102, last 2 years) | |
| Lenovo Legion 7 16 AGP11 | |
| HP Omen 16-ap0091ng | |
| Lenovo Legion 7 16IAX10 | |
| Schenker XMG FUSION 16 (M25) | |
* ... smaller is better
| GTA V - 1920x1080 Highest AA:4xMSAA + FX AF:16x | |
| Schenker XMG FUSION 16 (M25) | |
| Lenovo Legion 7 16IAX10 | |
| Average of class Gaming (48.3 - 186.9, n=93, last 2 years) | |
| Lenovo Legion 7 16 AGP11 | |
| HP Omen 16-ap0091ng | |
| Asus TUF Gaming A16 FA608UP | |
| Lenovo Legion 5 15AHP G10 | |
| Strange Brigade - 1920x1080 ultra AA:ultra AF:16 | |
| Average of class Gaming (76.3 - 456, n=86, last 2 years) | |
| Schenker XMG FUSION 16 (M25) | |
| Lenovo Legion 7 16IAX10 | |
| Lenovo Legion 5 15AHP G10 | |
| Lenovo Legion 7 16 AGP11 | |
| Asus TUF Gaming A16 FA608UP | |
| HP Omen 16-ap0091ng | |

赛博朋克 2077》超 FPS 图表
| low | med. | high | ultra | QHD DLSS | QHD | |
|---|---|---|---|---|---|---|
| GTA V (2015) | 129.7 | 108.1 | ||||
| Dota 2 Reborn (2015) | 190.6 | 164.3 | 156.5 | 147.8 | ||
| Final Fantasy XV Benchmark (2018) | 197.3 | 162.6 | 121.7 | 89.2 | ||
| X-Plane 11.11 (2018) | 105.8 | 98.8 | 78.4 | |||
| Strange Brigade (2018) | 436 | 321 | 264 | 223 | 155.2 | |
| Baldur's Gate 3 (2023) | 162 | 132 | 115 | 112.2 | 76.4 | |
| Cyberpunk 2077 (2023) | 129.8 | 116.1 | 100.3 | 90.5 | 66.7 | 56.2 |
| F1 24 (2024) | 223 | 208 | 74.3 | 74.5 | 47.2 | |
| F1 25 (2025) | 176.8 | 180.8 | 160.9 | 26.6 | 26.5 | 9.78 |
排放量
系统噪音

Legion 是一款非常安静的日常伴侣,负载情况下的风扇噪音在很大程度上取决于电源模式。在 "性能 "模式下,我们可以测得游戏时的噪音高达 53 dB(A),因此你需要一个耳机。其他模式噪音较小(自动:46.5 分贝;安静:41.3 分贝),但游戏性能会降低。在我们的设备上,我们没有发现任何线圈啸叫。
Noise level
| Idle |
| 24.5 / 24.5 / 27.1 dB(A) |
| Load |
| 34.6 / 53 dB(A) |
 | ||
30 dB silent 40 dB(A) audible 50 dB(A) loud |
||
min: | ||
| Lenovo Legion 7 16 AGP11 Ryzen AI 9 HX 470, GeForce RTX 5060 Laptop | Schenker XMG Core 16 VE M25 Ryzen 7 255, GeForce RTX 5060 Laptop | Schenker XMG FUSION 16 (M25) Ultra 9 275HX, GeForce RTX 5070 Laptop | HP Omen 16-ap0091ng R9 8940HX, GeForce RTX 5060 Laptop | Asus TUF Gaming A16 FA608UP R7 260, GeForce RTX 5070 Laptop | no name | Lenovo Legion 7 16IAX10 Ultra 7 255HX, GeForce RTX 5060 Laptop | Lenovo Legion 5 15AHP G10 R7 260, GeForce RTX 5060 Laptop | |
|---|---|---|---|---|---|---|---|---|
| Noise | -4% | -3% | -3% | -15% | -3% | -3% | -0% | |
| off / environment * (dB) | 24.5 | 24 2% | 25.7 -5% | 23 6% | 25.1 -2% | 22.9 7% | 23.9 2% | 25.5 -4% |
| Idle Minimum * (dB) | 24.5 | 24 2% | 25.7 -5% | 23 6% | 32.2 -31% | 24 2% | 24 2% | 25.5 -4% |
| Idle Average * (dB) | 24.5 | 27 -10% | 25.7 -5% | 23 6% | 32.2 -31% | 25.6 -4% | 26 -6% | 25.5 -4% |
| Idle Maximum * (dB) | 27.1 | 32 -18% | 28 -3% | 27.64 -2% | 32.2 -19% | 25.6 6% | 29.4 -8% | 26.9 1% |
| Load Average * (dB) | 34.6 | 41 -18% | 38.9 -12% | 49.5 -43% | 38.1 -10% | 46.8 -35% | 35.4 -2% | 34.6 -0% |
| Cyberpunk 2077 ultra * (dB) | 53 | 49 8% | 49.7 6% | 49.5 7% | 53.9 -2% | 49.9 6% | 54.6 -3% | 50.1 5% |
| Load Maximum * (dB) | 53 | 50 6% | 49.7 6% | 52.73 1% | 57.1 -8% | 55.6 -5% | 54.7 -3% | 50.1 5% |
* ... smaller is better
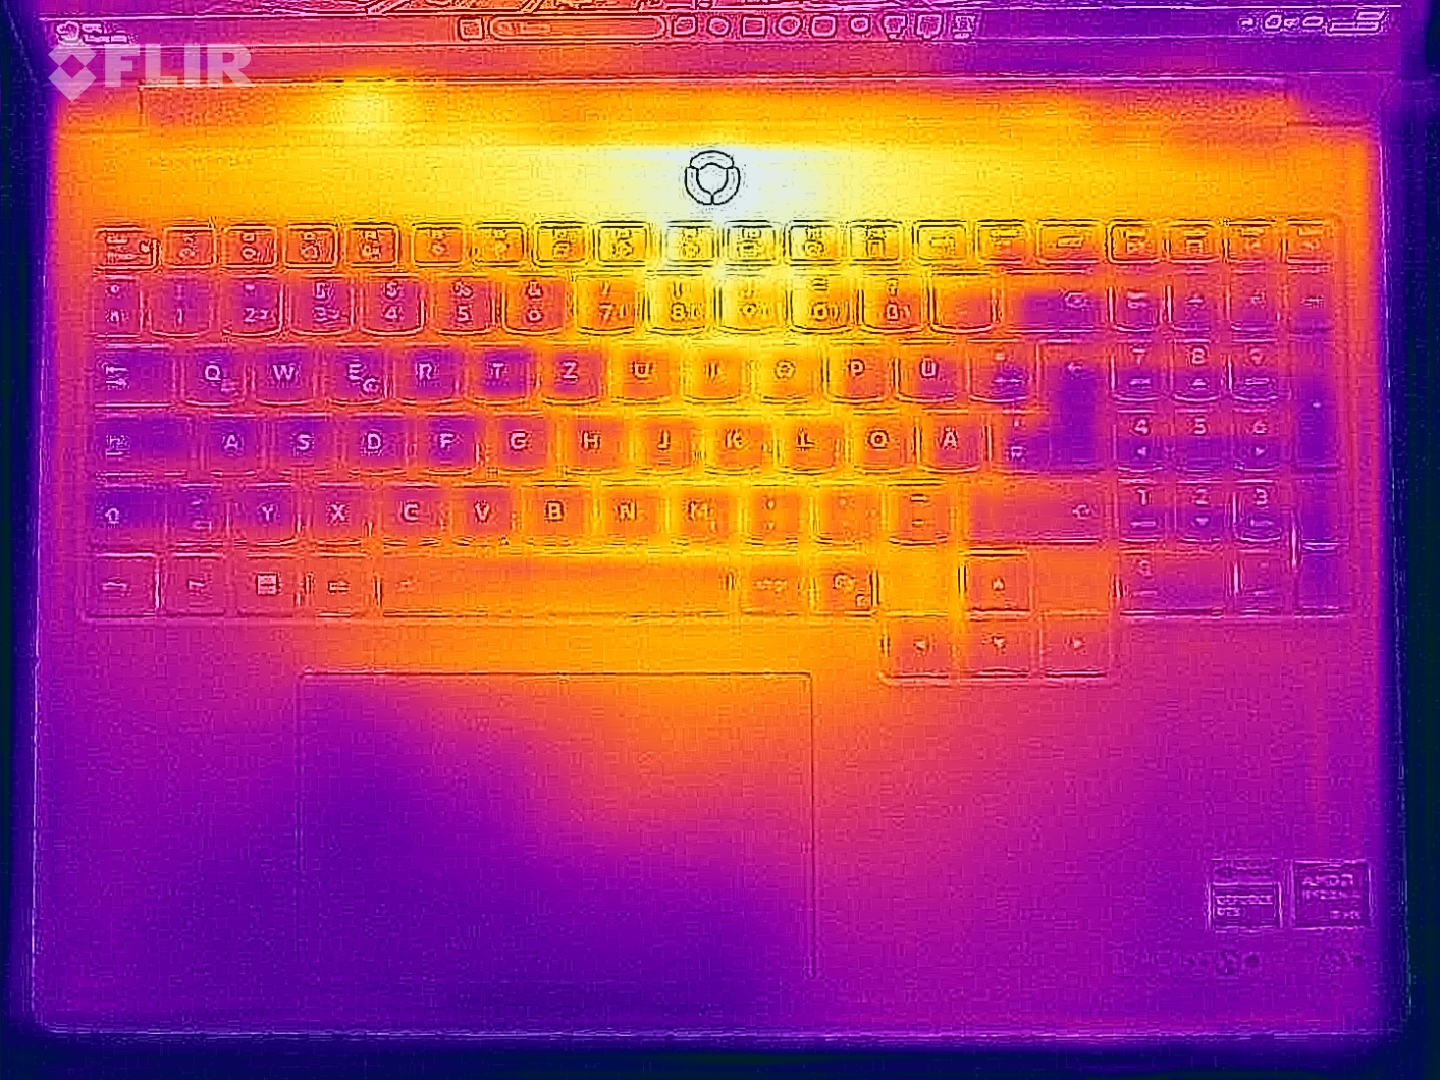
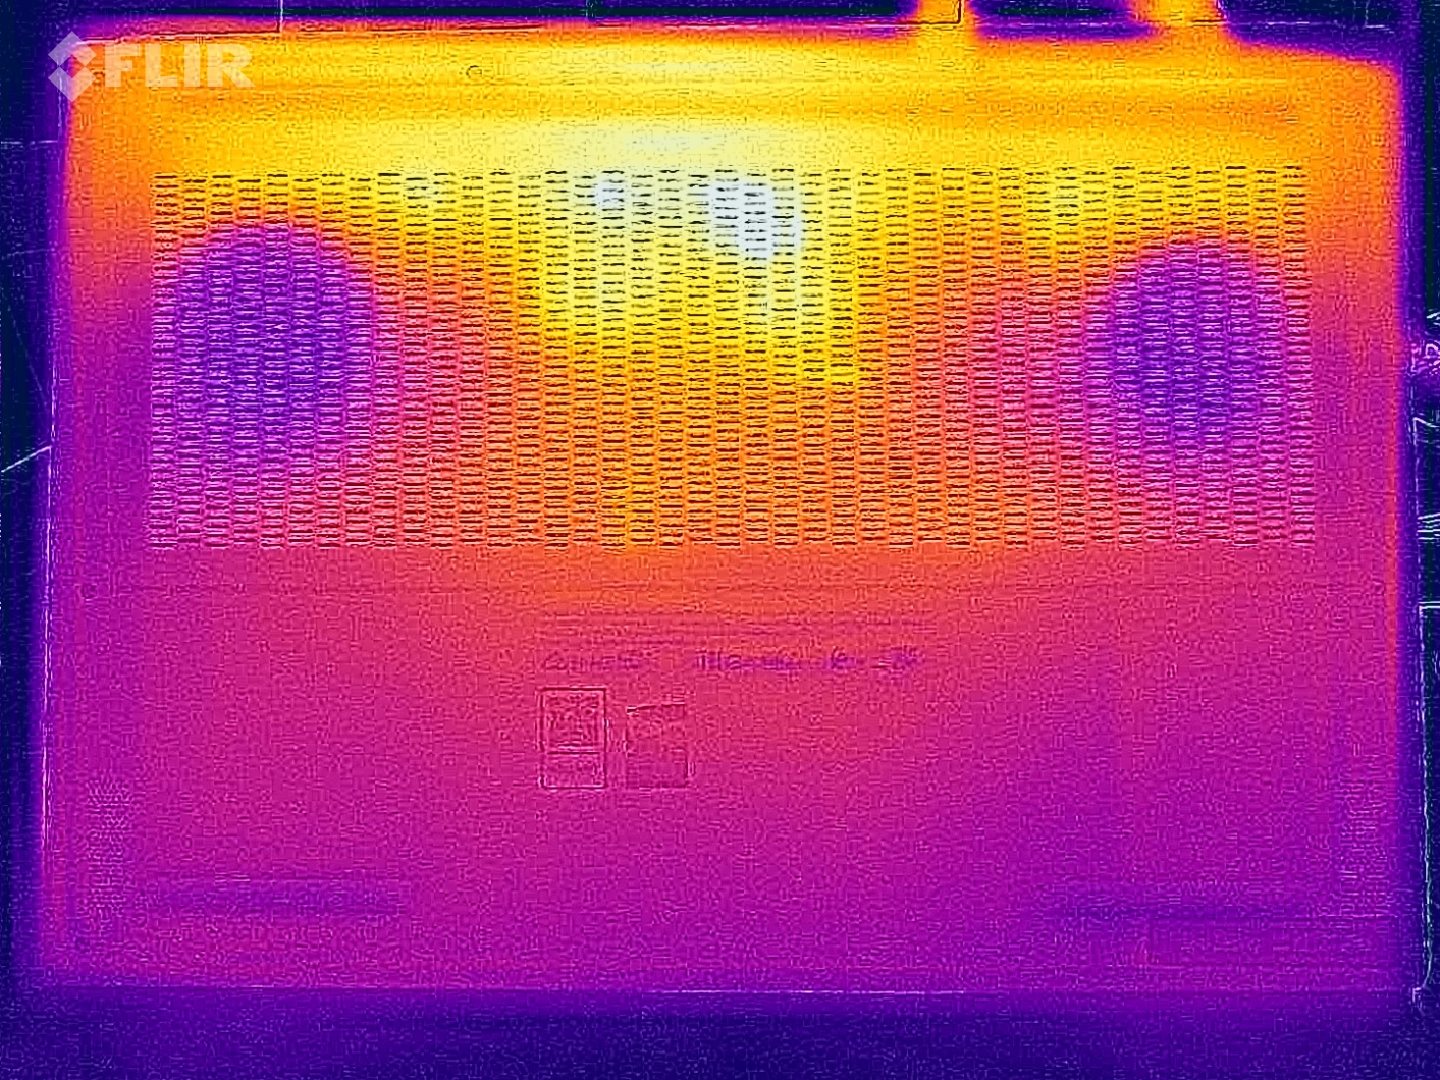
温度
在日常情况下,表面温度较低,但在对笔记本电脑进行真正的压力测试时,我们在后部底部测得的温度可达 50 °C,因此在这种情况下,不应将笔记本电脑放在膝上使用。在压力测试中,CPU 达到 45 瓦(76 °C),GPU 达到 80 瓦(76 °C)。

(±) The maximum temperature on the upper side is 44.9 °C / 113 F, compared to the average of 40.4 °C / 105 F, ranging from 21.2 to 68.8 °C for the class Gaming.
(-) The bottom heats up to a maximum of 50.5 °C / 123 F, compared to the average of 43.2 °C / 110 F
(+) In idle usage, the average temperature for the upper side is 25.8 °C / 78 F, compared to the device average of 33.9 °C / 93 F.
(±) 3: The average temperature for the upper side is 37.2 °C / 99 F, compared to the average of 33.9 °C / 93 F for the class Gaming.
(±) The palmrests and touchpad can get very hot to the touch with a maximum of 37.4 °C / 99.3 F.
(-) The average temperature of the palmrest area of similar devices was 28.8 °C / 83.8 F (-8.6 °C / -15.5 F).
| Lenovo Legion 7 16 AGP11 Ryzen AI 9 HX 470, GeForce RTX 5060 Laptop | Schenker XMG Core 16 VE M25 Ryzen 7 255, GeForce RTX 5060 Laptop | Schenker XMG FUSION 16 (M25) Ultra 9 275HX, GeForce RTX 5070 Laptop | HP Omen 16-ap0091ng R9 8940HX, GeForce RTX 5060 Laptop | Asus TUF Gaming A16 FA608UP R7 260, GeForce RTX 5070 Laptop | no name | Lenovo Legion 7 16IAX10 Ultra 7 255HX, GeForce RTX 5060 Laptop | Lenovo Legion 5 15AHP G10 R7 260, GeForce RTX 5060 Laptop | |
|---|---|---|---|---|---|---|---|---|
| Heat | -9% | 3% | 5% | 9% | -13% | -2% | ||
| Maximum Upper Side * (°C) | 44.9 | 46 -2% | 43.2 4% | 36 20% | 39.5 12% | 47 -5% | 42.2 6% | |
| Maximum Bottom * (°C) | 50.5 | 57 -13% | 48 5% | 37 27% | 45.1 11% | 44 13% | 51.7 -2% | |
| Idle Upper Side * (°C) | 27.3 | 29 -6% | 26.6 3% | 30 -10% | 25.7 6% | 35.6 -30% | 28.5 -4% | |
| Idle Bottom * (°C) | 27.5 | 31 -13% | 27.6 -0% | 32 -16% | 25.5 7% | 35.2 -28% | 29.2 -6% |
* ... smaller is better
发言人
音响系统使用四个模块(每个模块 2 瓦),音质良好。
Lenovo Legion 7 16 AGP11 audio analysis
(±) | speaker loudness is average but good (79 dB)
Bass 100 - 315 Hz
(±) | reduced bass - on average 11.4% lower than median
(±) | linearity of bass is average (8.7% delta to prev. frequency)
Mids 400 - 2000 Hz
(+) | balanced mids - only 3.1% away from median
(+) | mids are linear (2.4% delta to prev. frequency)
Highs 2 - 16 kHz
(+) | balanced highs - only 2.1% away from median
(+) | highs are linear (5% delta to prev. frequency)
Overall 100 - 16.000 Hz
(+) | overall sound is linear (11.7% difference to median)
Compared to same class
» 11% of all tested devices in this class were better, 4% similar, 85% worse
» The best had a delta of 6%, average was 18%, worst was 132%
Compared to all devices tested
» 8% of all tested devices were better, 3% similar, 89% worse
» The best had a delta of 4%, average was 23%, worst was 134%
Schenker XMG Core 16 VE M25 audio analysis
(±) | speaker loudness is average but good (76 dB)
Bass 100 - 315 Hz
(-) | nearly no bass - on average 19.1% lower than median
(±) | linearity of bass is average (10.5% delta to prev. frequency)
Mids 400 - 2000 Hz
(±) | higher mids - on average 6.3% higher than median
(±) | linearity of mids is average (7.2% delta to prev. frequency)
Highs 2 - 16 kHz
(+) | balanced highs - only 1.8% away from median
(+) | highs are linear (6% delta to prev. frequency)
Overall 100 - 16.000 Hz
(±) | linearity of overall sound is average (18.7% difference to median)
Compared to same class
» 62% of all tested devices in this class were better, 8% similar, 30% worse
» The best had a delta of 6%, average was 18%, worst was 132%
Compared to all devices tested
» 43% of all tested devices were better, 8% similar, 50% worse
» The best had a delta of 4%, average was 23%, worst was 134%
Schenker XMG FUSION 16 (M25) audio analysis
(+) | speakers can play relatively loud (85.1 dB)
Bass 100 - 315 Hz
(-) | nearly no bass - on average 17.9% lower than median
(±) | linearity of bass is average (10.5% delta to prev. frequency)
Mids 400 - 2000 Hz
(±) | higher mids - on average 5.7% higher than median
(+) | mids are linear (4.6% delta to prev. frequency)
Highs 2 - 16 kHz
(+) | balanced highs - only 3.1% away from median
(+) | highs are linear (4.8% delta to prev. frequency)
Overall 100 - 16.000 Hz
(+) | overall sound is linear (14.8% difference to median)
Compared to same class
» 30% of all tested devices in this class were better, 7% similar, 63% worse
» The best had a delta of 6%, average was 18%, worst was 132%
Compared to all devices tested
» 20% of all tested devices were better, 4% similar, 76% worse
» The best had a delta of 4%, average was 23%, worst was 134%
HP Omen 16-ap0091ng audio analysis
(±) | speaker loudness is average but good (79.91 dB)
Bass 100 - 315 Hz
(-) | nearly no bass - on average 18% lower than median
(±) | linearity of bass is average (11.1% delta to prev. frequency)
Mids 400 - 2000 Hz
(±) | higher mids - on average 6.9% higher than median
(±) | linearity of mids is average (7.5% delta to prev. frequency)
Highs 2 - 16 kHz
(+) | balanced highs - only 2.1% away from median
(±) | linearity of highs is average (7.5% delta to prev. frequency)
Overall 100 - 16.000 Hz
(±) | linearity of overall sound is average (17.8% difference to median)
Compared to same class
» 53% of all tested devices in this class were better, 10% similar, 37% worse
» The best had a delta of 6%, average was 18%, worst was 132%
Compared to all devices tested
» 36% of all tested devices were better, 8% similar, 56% worse
» The best had a delta of 4%, average was 23%, worst was 134%
Asus TUF Gaming A16 FA608UP audio analysis
(±) | speaker loudness is average but good (80.2 dB)
Bass 100 - 315 Hz
(±) | reduced bass - on average 11.8% lower than median
(±) | linearity of bass is average (8.7% delta to prev. frequency)
Mids 400 - 2000 Hz
(+) | balanced mids - only 3% away from median
(+) | mids are linear (3% delta to prev. frequency)
Highs 2 - 16 kHz
(+) | balanced highs - only 4.4% away from median
(±) | linearity of highs is average (7.4% delta to prev. frequency)
Overall 100 - 16.000 Hz
(+) | overall sound is linear (12.6% difference to median)
Compared to same class
» 16% of all tested devices in this class were better, 4% similar, 81% worse
» The best had a delta of 6%, average was 18%, worst was 132%
Compared to all devices tested
» 11% of all tested devices were better, 3% similar, 86% worse
» The best had a delta of 4%, average was 23%, worst was 134%
Lenovo Legion 7 16IAX10 audio analysis
(±) | speaker loudness is average but good (77.6 dB)
Bass 100 - 315 Hz
(±) | reduced bass - on average 9.5% lower than median
(±) | linearity of bass is average (9.8% delta to prev. frequency)
Mids 400 - 2000 Hz
(+) | balanced mids - only 1.5% away from median
(+) | mids are linear (4% delta to prev. frequency)
Highs 2 - 16 kHz
(+) | balanced highs - only 3% away from median
(+) | highs are linear (4.9% delta to prev. frequency)
Overall 100 - 16.000 Hz
(+) | overall sound is linear (11.5% difference to median)
Compared to same class
» 10% of all tested devices in this class were better, 3% similar, 87% worse
» The best had a delta of 6%, average was 18%, worst was 132%
Compared to all devices tested
» 8% of all tested devices were better, 2% similar, 90% worse
» The best had a delta of 4%, average was 23%, worst was 134%
Lenovo Legion 5 15AHP G10 audio analysis
(±) | speaker loudness is average but good (81.5 dB)
Bass 100 - 315 Hz
(-) | nearly no bass - on average 21% lower than median
(±) | linearity of bass is average (8.2% delta to prev. frequency)
Mids 400 - 2000 Hz
(+) | balanced mids - only 4.7% away from median
(+) | mids are linear (5.4% delta to prev. frequency)
Highs 2 - 16 kHz
(+) | balanced highs - only 3.1% away from median
(+) | highs are linear (6.4% delta to prev. frequency)
Overall 100 - 16.000 Hz
(±) | linearity of overall sound is average (16.7% difference to median)
Compared to same class
» 43% of all tested devices in this class were better, 10% similar, 47% worse
» The best had a delta of 6%, average was 18%, worst was 132%
Compared to all devices tested
» 29% of all tested devices were better, 7% similar, 64% worse
» The best had a delta of 4%, average was 23%, worst was 134%
能源管理
耗电量

Legion 在空载时效率很高,负载数据也比上一代机型低。在压力测试中,我们看到的最高功率为 235 瓦,但这一数值很快就稳定在 170 瓦左右,因此 245 瓦的 PSU 已经足够。
| Off / Standby | |
| Idle | |
| Load |
|
Key:
min: | |
| Lenovo Legion 7 16 AGP11 Ryzen AI 9 HX 470, GeForce RTX 5060 Laptop, Lenovo UMIS AM541 1TB, OLED, 2560x1600, 16" | Schenker XMG Core 16 VE M25 Ryzen 7 255, GeForce RTX 5060 Laptop, Samsung 990 Pro 2 TB MZVL72T0HDLB, IPS, 2560x1600, 16" | Schenker XMG FUSION 16 (M25) Ultra 9 275HX, GeForce RTX 5070 Laptop, Samsung 9100 Pro 2 TB, OLED, 2880x1800, 16" | HP Omen 16-ap0091ng R9 8940HX, GeForce RTX 5060 Laptop, Samsung PM9C1b MZVL81T0HFLB-00BH1, IPS, 1920x1200, 16" | Asus TUF Gaming A16 FA608UP R7 260, GeForce RTX 5070 Laptop, Western Digital PC SN5000S SDEQNSJ-1T00, IPS, 2560x1600, 16" | no name | Lenovo Legion 7 16IAX10 Ultra 7 255HX, GeForce RTX 5060 Laptop, WD PC SN7100S SDFPMSL-1T00-1101, OLED, 2560x1600, 16" | Lenovo Legion 5 15AHP G10 R7 260, GeForce RTX 5060 Laptop, SK hynix PVC10 HFS001TEM4X182N, OLED, 2560x1600, 15.1" | Average NVIDIA GeForce RTX 5060 Laptop | Average of class Gaming | |
|---|---|---|---|---|---|---|---|---|---|---|
| Power Consumption | -46% | -56% | -32% | -6% | -16% | -64% | -7% | -40% | -89% | |
| Idle Minimum * (Watt) | 5.7 | 10.5 -84% | 15.3 -168% | 7.8 -37% | 4.6 19% | 4.4 23% | 9.4 -65% | 6.9 -21% | 8.97 ? -57% | 13 ? -128% |
| Idle Average * (Watt) | 8.7 | 13 -49% | 16.8 -93% | 8.8 -1% | 9.8 -13% | 18 -107% | 10.6 -22% | 10.7 -23% | 12.9 ? -48% | 18.7 ? -115% |
| Idle Maximum * (Watt) | 9.1 | 18.8 -107% | 17.3 -90% | 21.5 -136% | 10.2 -12% | 18.2 -100% | 36.4 -300% | 11.3 -24% | 18.3 ? -101% | 24.3 ? -167% |
| Load Average * (Watt) | 88.7 | 94.7 -7% | 119 -34% | 76.1 14% | 87.1 2% | 107.7 -21% | 69.7 21% | 92 ? -4% | 110.2 ? -24% | |
| Cyberpunk 2077 ultra external monitor * (Watt) | 156.9 | 181.1 -15% | 180.9 -15% | 164.5 -5% | 198.1 -26% | 120.6 23% | 187.5 -20% | 165 -5% | ||
| Cyberpunk 2077 ultra * (Watt) | 160.3 | 182.5 -14% | 185.3 -16% | 192 -20% | 198.9 -24% | 123 23% | 188 -17% | 162.6 -1% | ||
| Load Maximum * (Watt) | 234.9 | 246 -5% | 242.7 -3% | 208 11% | 235.2 -0% | 183 22% | 247 -5% | 233.6 1% | 213 ? 9% | 258 ? -10% |
* ... smaller is better
功耗 赛博朋克/压力测试
外部显示器功耗
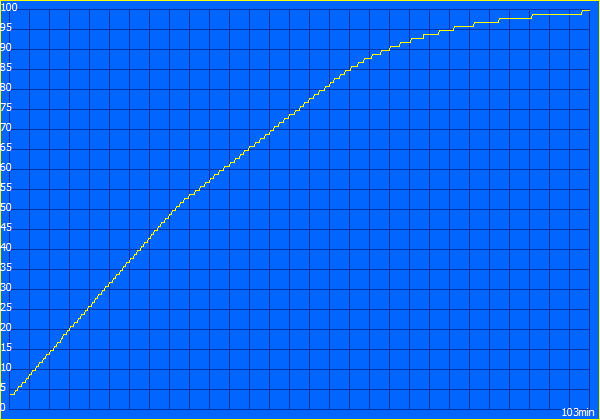
电池寿命
83 瓦时电池的续航时间表现一般。在 150 尼特亮度下,我们记录的 Wi-Fi 运行时间约为 9 小时,最大亮度下约为 6 小时。

笔记本检查评级
Lenovo Legion 7 16 AGP11
- 04/25/2026 v8
Andreas Osthoff
 Total Sustainability Score:
 潜在竞争对手比较
Image | Model / Review | Price | Weight | Height | Display |
|---|---|---|---|---|---|
1. 86.4%  | Lenovo Legion 7 16 AGP11 AMD Ryzen AI 9 HX 470 ⎘ NVIDIA GeForce RTX 5060 Laptop ⎘ 32 GB Memory, 1024 GB SSD | Amazon: List Price: 2500€ | 1.8 kg | 16.9 mm | 16.00" 2560x1600 189 PPI OLED |
2. 83.9%  | Schenker XMG Core 16 VE M25 AMD Ryzen 7 255 ⎘ NVIDIA GeForce RTX 5060 Laptop ⎘ 64 GB Memory, 2048 GB SSD | Amazon: List Price: 1935 EUR | 2.1 kg | 23 mm | 16.00" 2560x1600 189 PPI IPS |
3. 87.5%  | Schenker XMG FUSION 16 (M25) Intel Core Ultra 9 275HX ⎘ NVIDIA GeForce RTX 5070 Laptop ⎘ 64 GB Memory, 2048 GB SSD | Amazon: List Price: 2700€ | 2.1 kg | 23 mm | 16.00" 2880x1800 212 PPI OLED |
4. 82.5%  | HP Omen 16-ap0091ng AMD Ryzen 9 8940HX ⎘ NVIDIA GeForce RTX 5060 Laptop ⎘ 16 GB Memory, 1000 GB SSD | Amazon: List Price: 1500 Euro | 2.4 kg | 23.7 mm | 16.00" 1920x1200 162 PPI IPS |
5. 83.8%  | Asus TUF Gaming A16 FA608UP AMD Ryzen 7 260 ⎘ NVIDIA GeForce RTX 5070 Laptop ⎘ 32 GB Memory, 1024 GB SSD | Amazon: List Price: 2199€ | 2.2 kg | 25.7 mm | 16.00" 2560x1600 189 PPI IPS |
| no name ⎘ ⎘ | Amazon: 1. $23.19 No Name 2. No Name 3. $12.99 The Paper with No Name! | ||||
7. 86.6%  | Lenovo Legion 7 16IAX10 Intel Core Ultra 7 255HX ⎘ NVIDIA GeForce RTX 5060 Laptop ⎘ 32 GB Memory, 1024 GB SSD | Amazon: List Price: 1650 USD | 2 kg | 17.9 mm | 16.00" 2560x1600 189 PPI OLED |
8. 87.2%  | Lenovo Legion 5 15AHP G10 AMD Ryzen 7 260 ⎘ NVIDIA GeForce RTX 5060 Laptop ⎘ 32 GB Memory, 1024 GB SSD | Amazon: List Price: 1449€ | 1.9 kg | 21.5 mm | 15.10" 2560x1600 200 PPI OLED |
Transparency
The selection of devices to be reviewed is made by our editorial team. The test sample was provided to the author as a loan by the manufacturer or retailer for the purpose of this review. The lender had no influence on this review, nor did the manufacturer receive a copy of this review before publication. There was no obligation to publish this review. As an independent media company, Notebookcheck is not subjected to the authority of manufacturers, retailers or publishers.
This is how Notebookcheck is testing
Every year, Notebookcheck independently reviews hundreds of laptops and smartphones using standardized procedures to ensure that all results are comparable. We have continuously developed our test methods for around 20 years and set industry standards in the process. In our test labs, high-quality measuring equipment is utilized by experienced technicians and editors. These tests involve a multi-stage validation process. Our complex rating system is based on hundreds of well-founded measurements and benchmarks, which maintains objectivity. Further information on our test methods can be found here.

