评语--适合注重价格的玩家的 Blackwell
基于RTX 5070以上的游戏笔记本通常价格不菲,而RTX 5060设备的价格往往在1200美元左右,这对许多用户来说特别有吸引力。联想的 LOQ 系列一直代表着稳健的性价比,因此对于潜在买家来说,RTX 5060 应该是一个合适的选择。虽然显卡仅有 8GB GDDR7 的限制,但即使使用更高的设置,大多数游戏仍能在设备上流畅运行--至少在全高清状态下是如此。
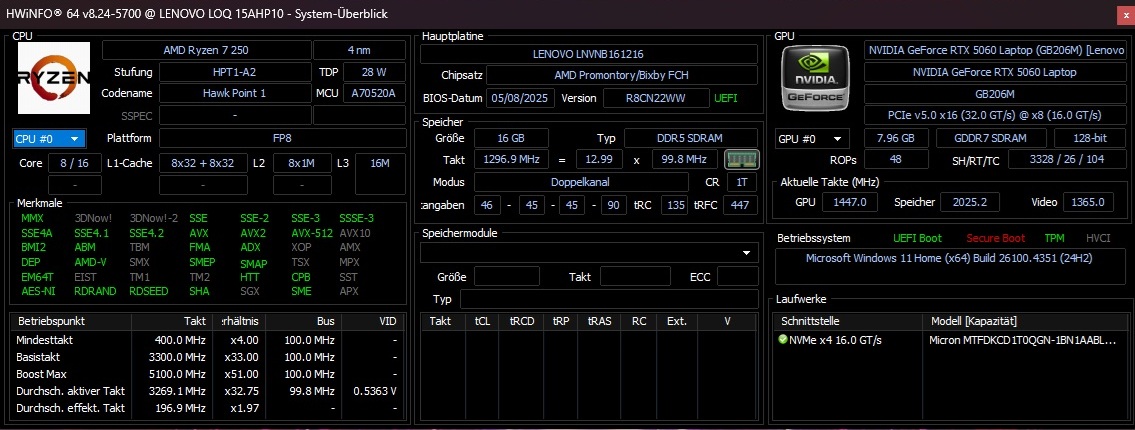
我们的测试机型后缀为 AHP10,与之搭配的是 Ryzen 7 250,这也是一款中端机型。16GB DDR5 内存(遗憾的是只有单通道)和 1TB NVMe 固态硬盘为其整体配置锦上添花。制造商采用了经典的 IPS 面板,分辨率为 1,920 x 1,080 像素,指定刷新率为 144 Hz,在我们的测试中表现出色。
如果不考虑空闲模式下较高的工作噪音(仅影响性能配置文件),我们所发现的这款笔记本电脑的弱点对于游戏笔记本电脑来说都是次要的。例如,它的电池寿命/容量可能会更高,第二个内存条和更好的固态硬盘散热会让这款 15 英寸笔记本电脑受益匪浅。
Pros
Cons
LOQ 15 的竞争对手包括其他基于 Blackwell 的中端游戏笔记本电脑,如前面提到的 Legion 5 15(RTX 5060),以及 技嘉 Aero X16和 微星卡塔纳 17(均为 RTX 5070)。所有这些设备都作为对比机型出现在表格中。
规格
案例
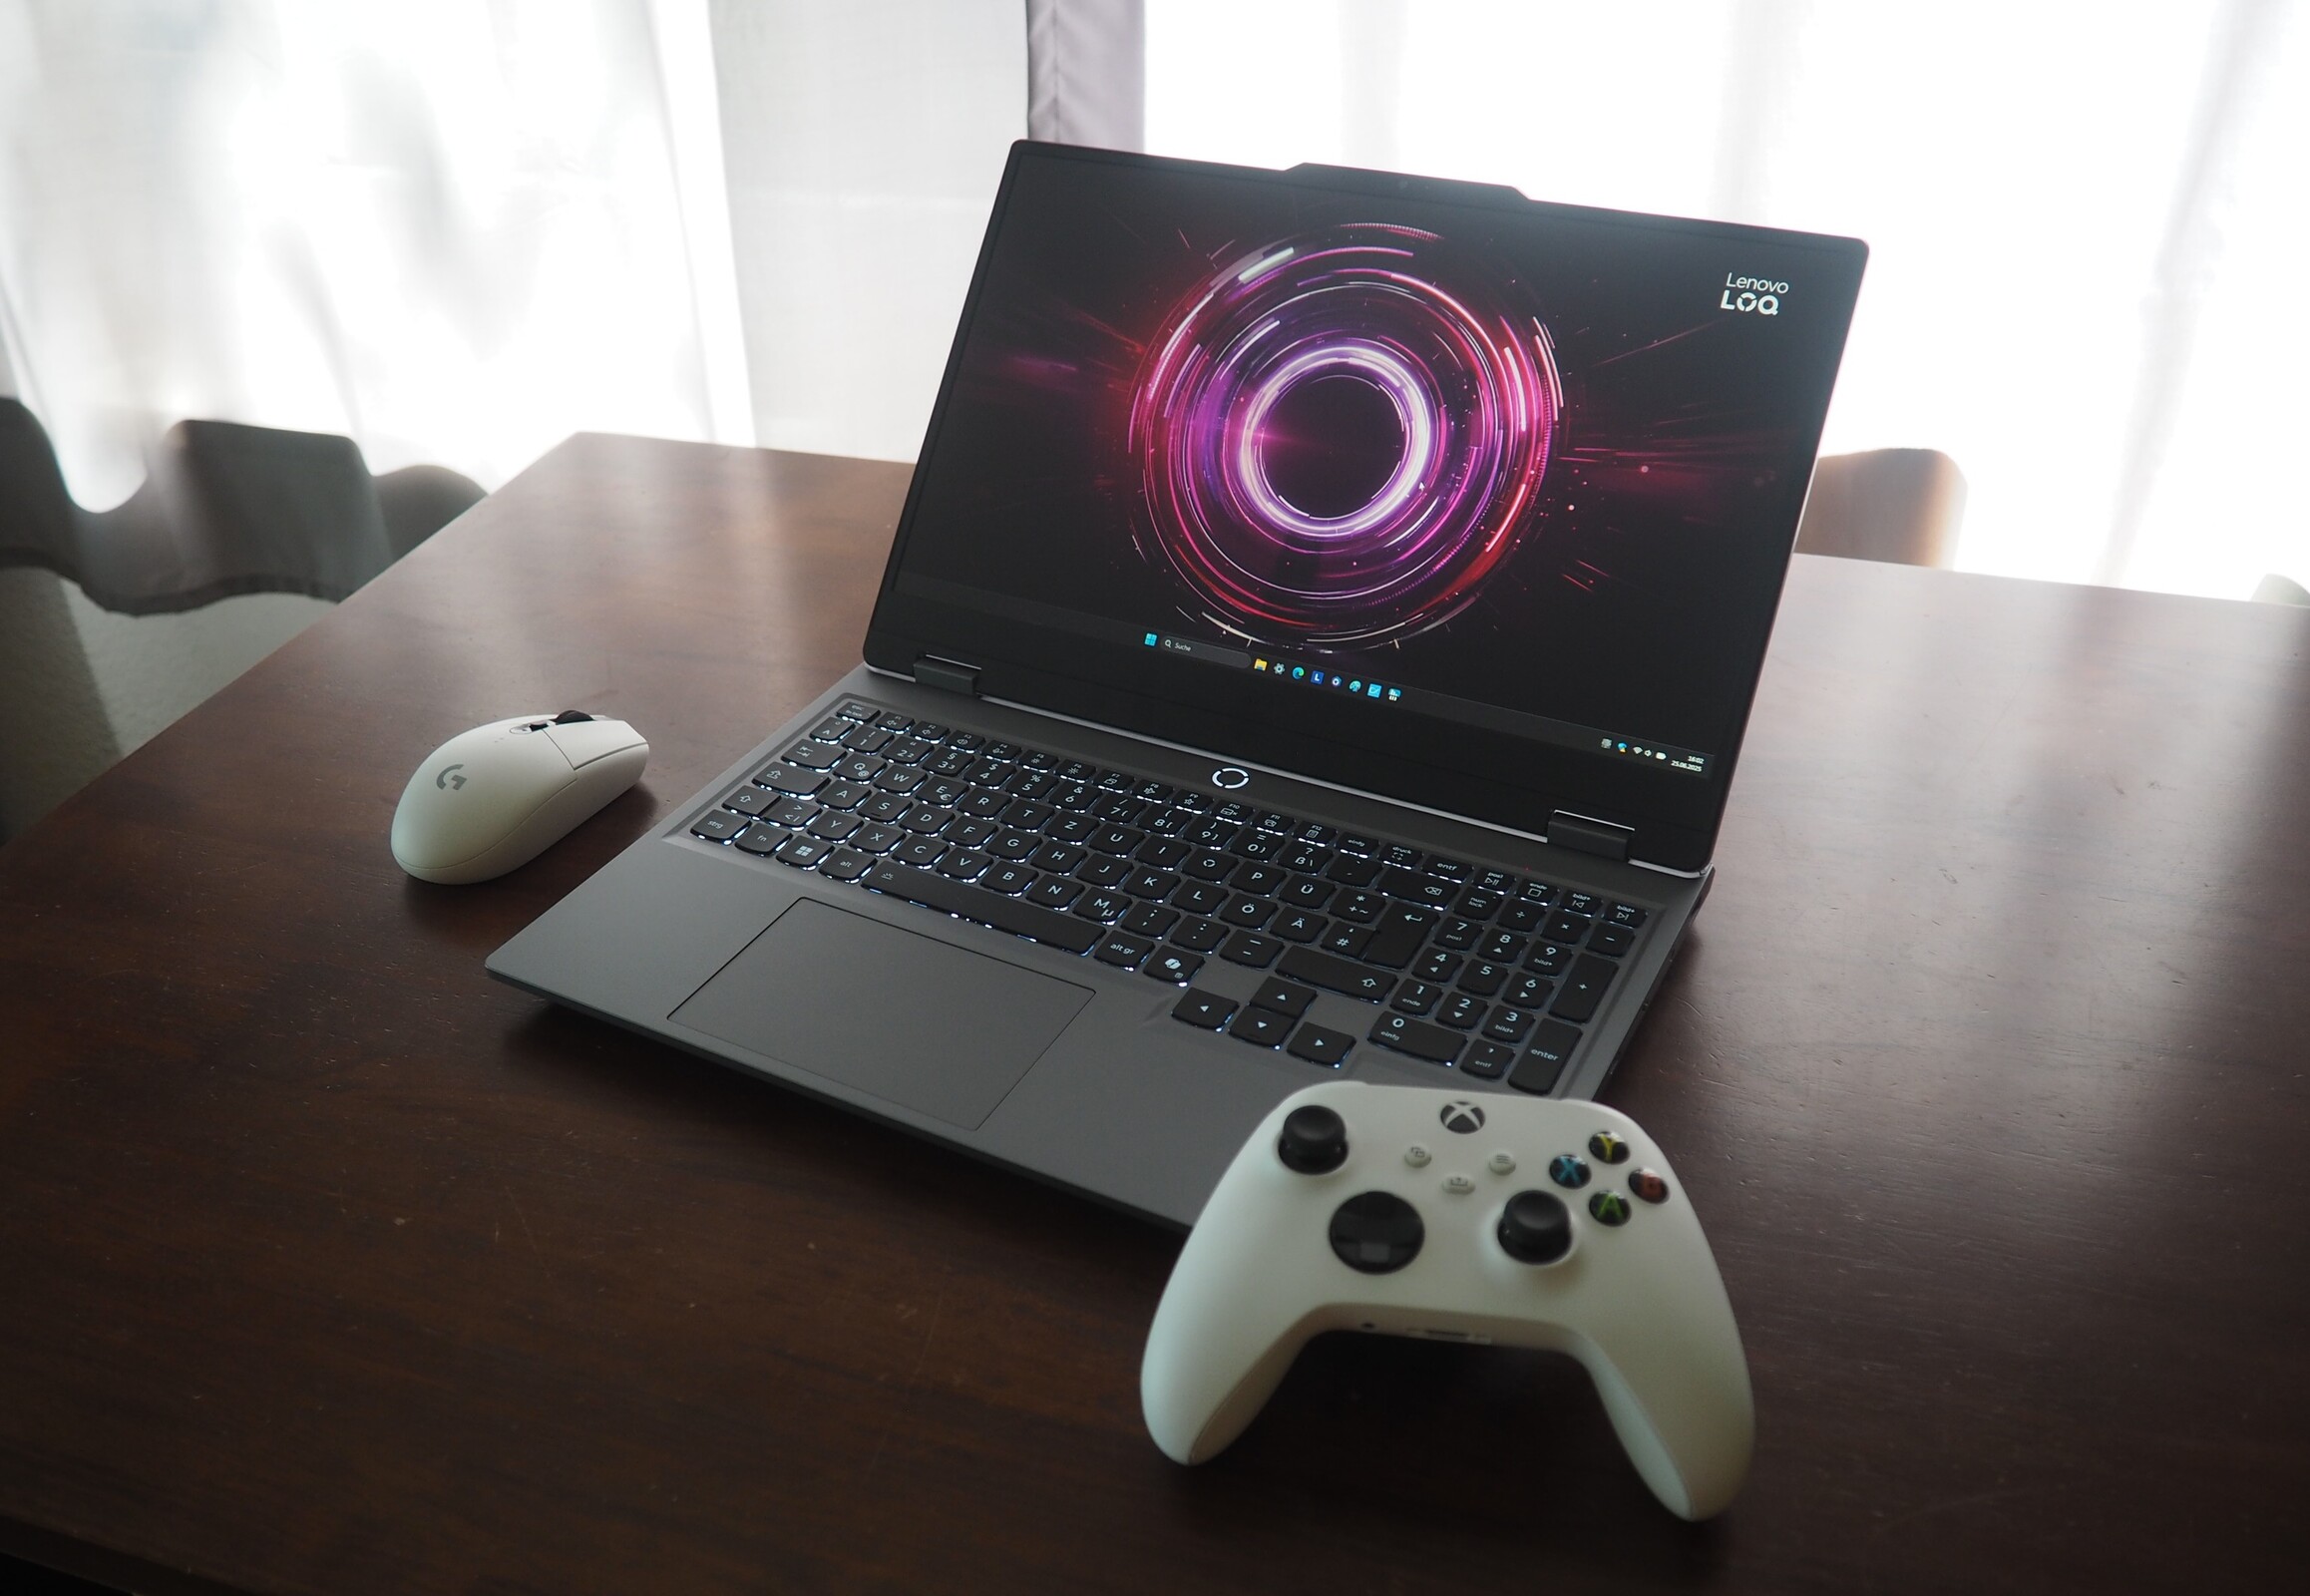
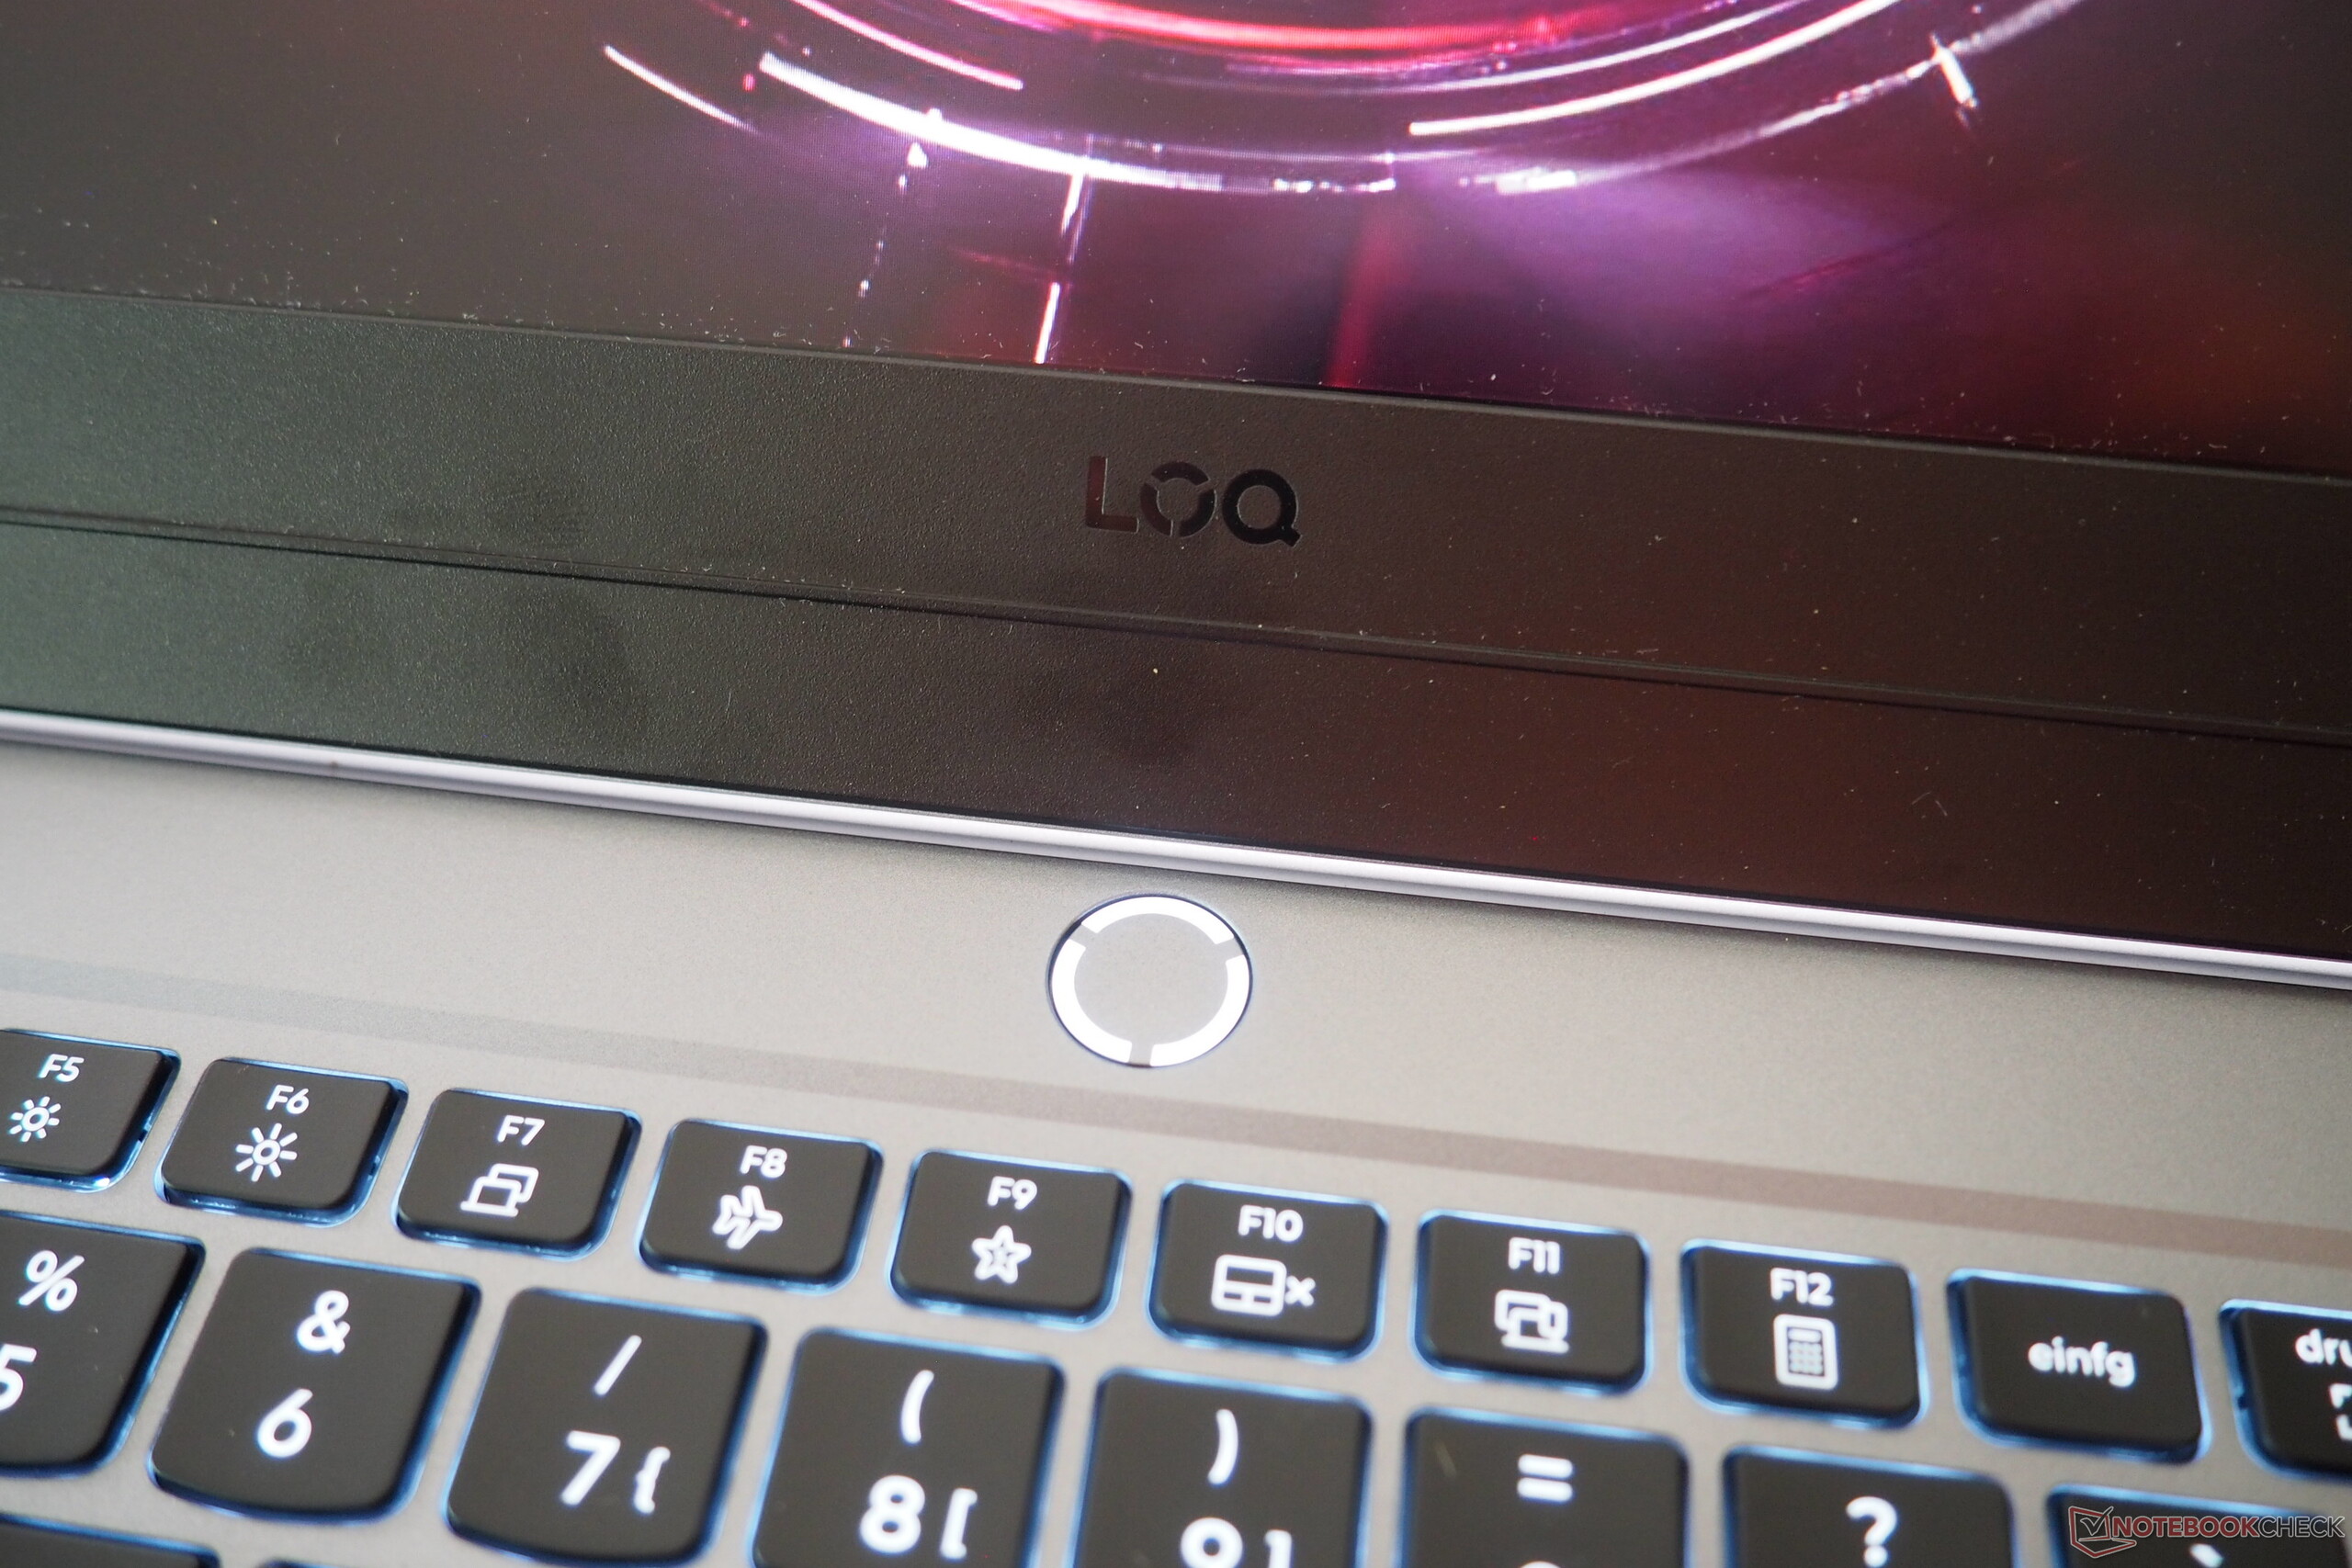
这款笔记本电脑的外壳似乎与其前代产品一致 前代几乎是 1:1。在外观上,联想完全采用了塑料材质,这并没有让人感觉到该设备有多高的品质。不过,它的稳定性和制造质量还是比较不错的。此外,其灰色表面不像黑色笔记本那样容易留下指纹印。其宽敞的打开角度也是一大亮点:该设备的屏幕可以打开 180°。在设计方面,制造商将俏皮与不张扬很好地结合在了一起。

在尺寸和重量方面,LOQ 15 也毫不逊色。它的重量为 2.4 千克,比 Aero X16 和Legion 5(约 2 千克)重,但比 Katana 17(2.7 千克)轻。
连接性
端口
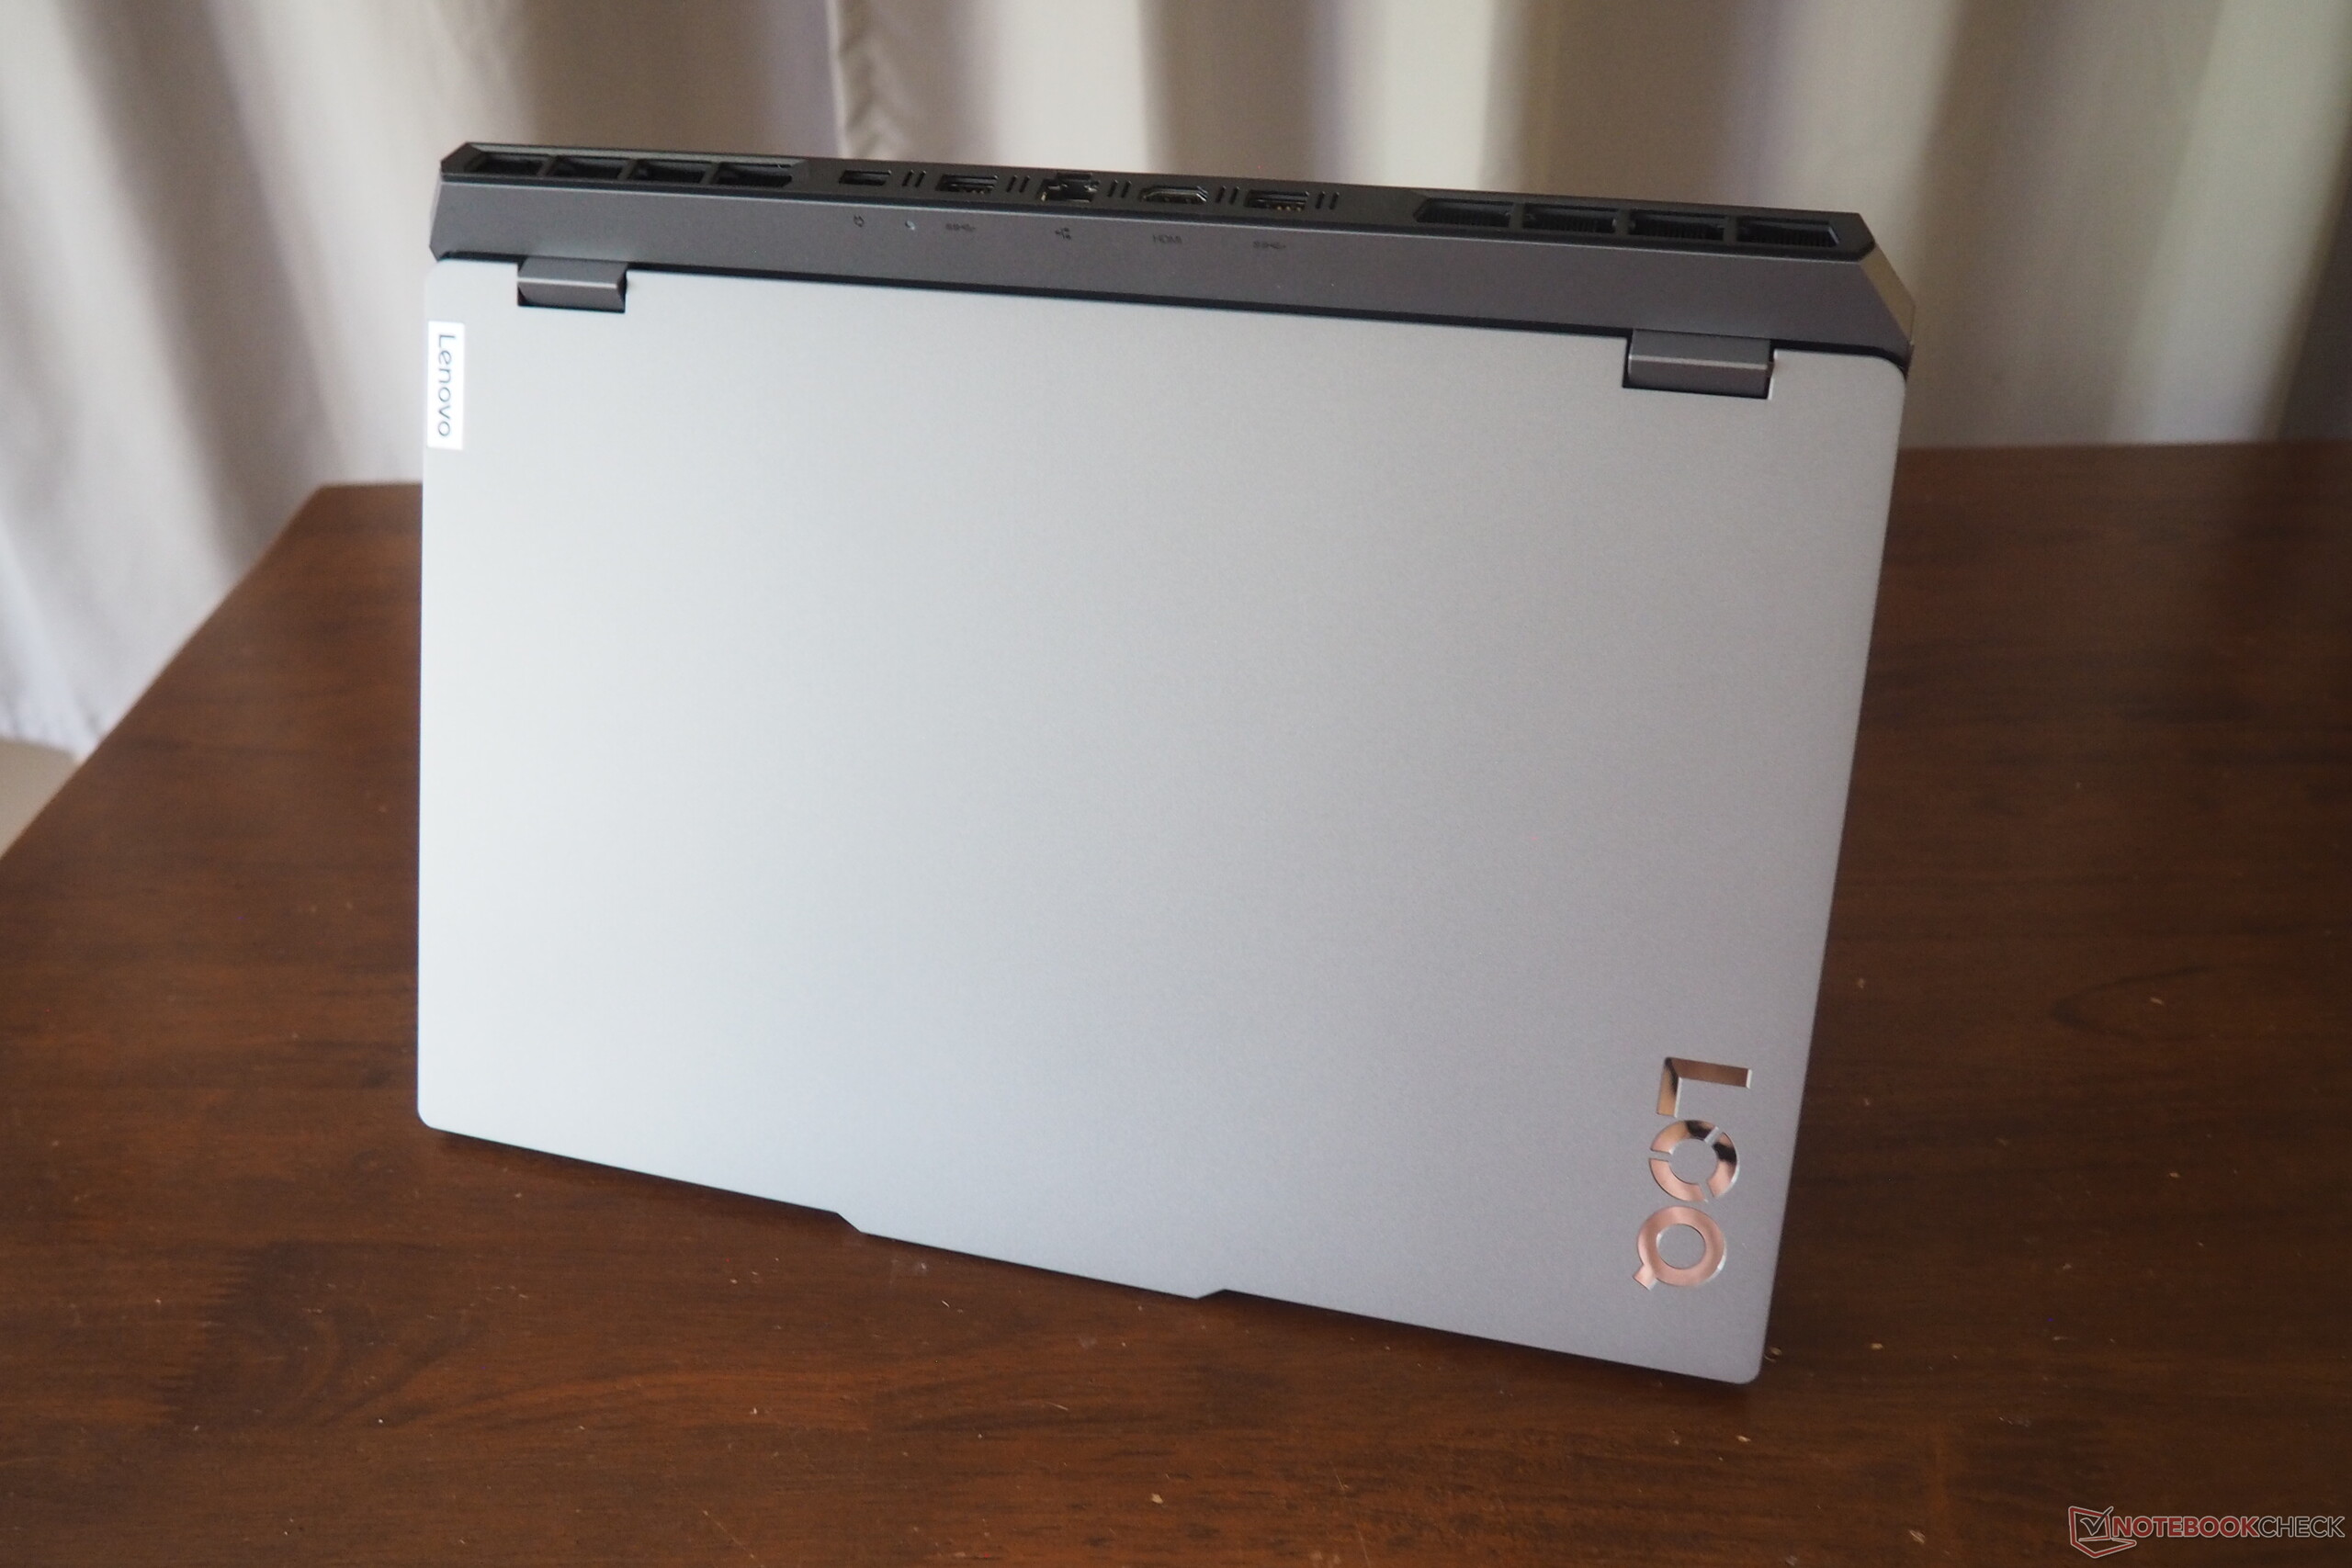
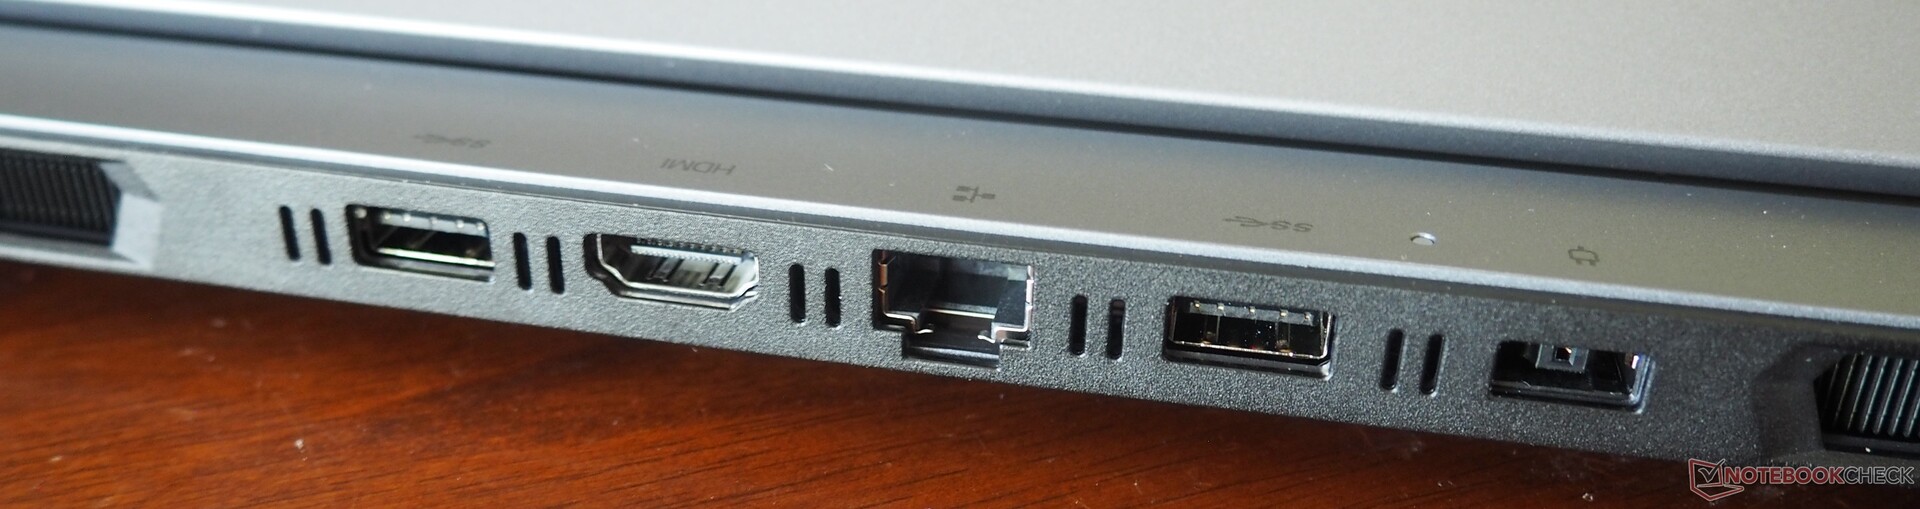
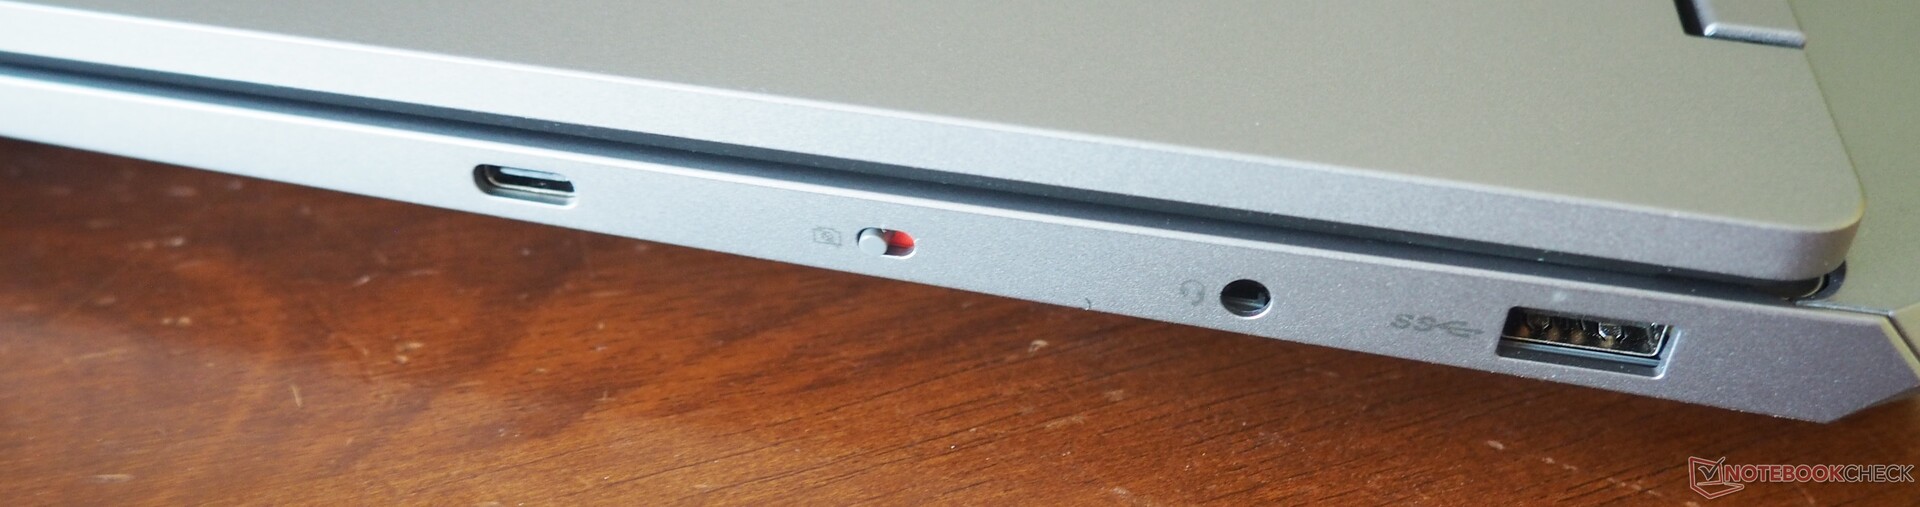
遗憾的是,联想并没有改善笔记本电脑端口的分布。在我们看来,这与制造商只安装一个 USB-C 端口(不支持 Thunderbolt)的决定一样糟糕。至少还有 3 个 USB-A 端口。图像输出可通过 HDMI 或 DisplayPort(通过 USB-C)实现。此外,还有一个音频插孔和一个千兆以太网端口。联想没有配备读卡器。
交流
无线通信通过 Realtek 的 Wi-Fi 6 模块(RTL8852)进行,遗憾的是,在我们的 WLAN 测试中,该模块的速度一般,与前代机型类似。
网络摄像头
据联想称,其网络摄像头的分辨率为 500 万像素,图像清晰度高于平均水平。不过,其色彩准确度仅为平均水平。网络摄像头的电子快门位于设备的右侧,非常方便。


配件
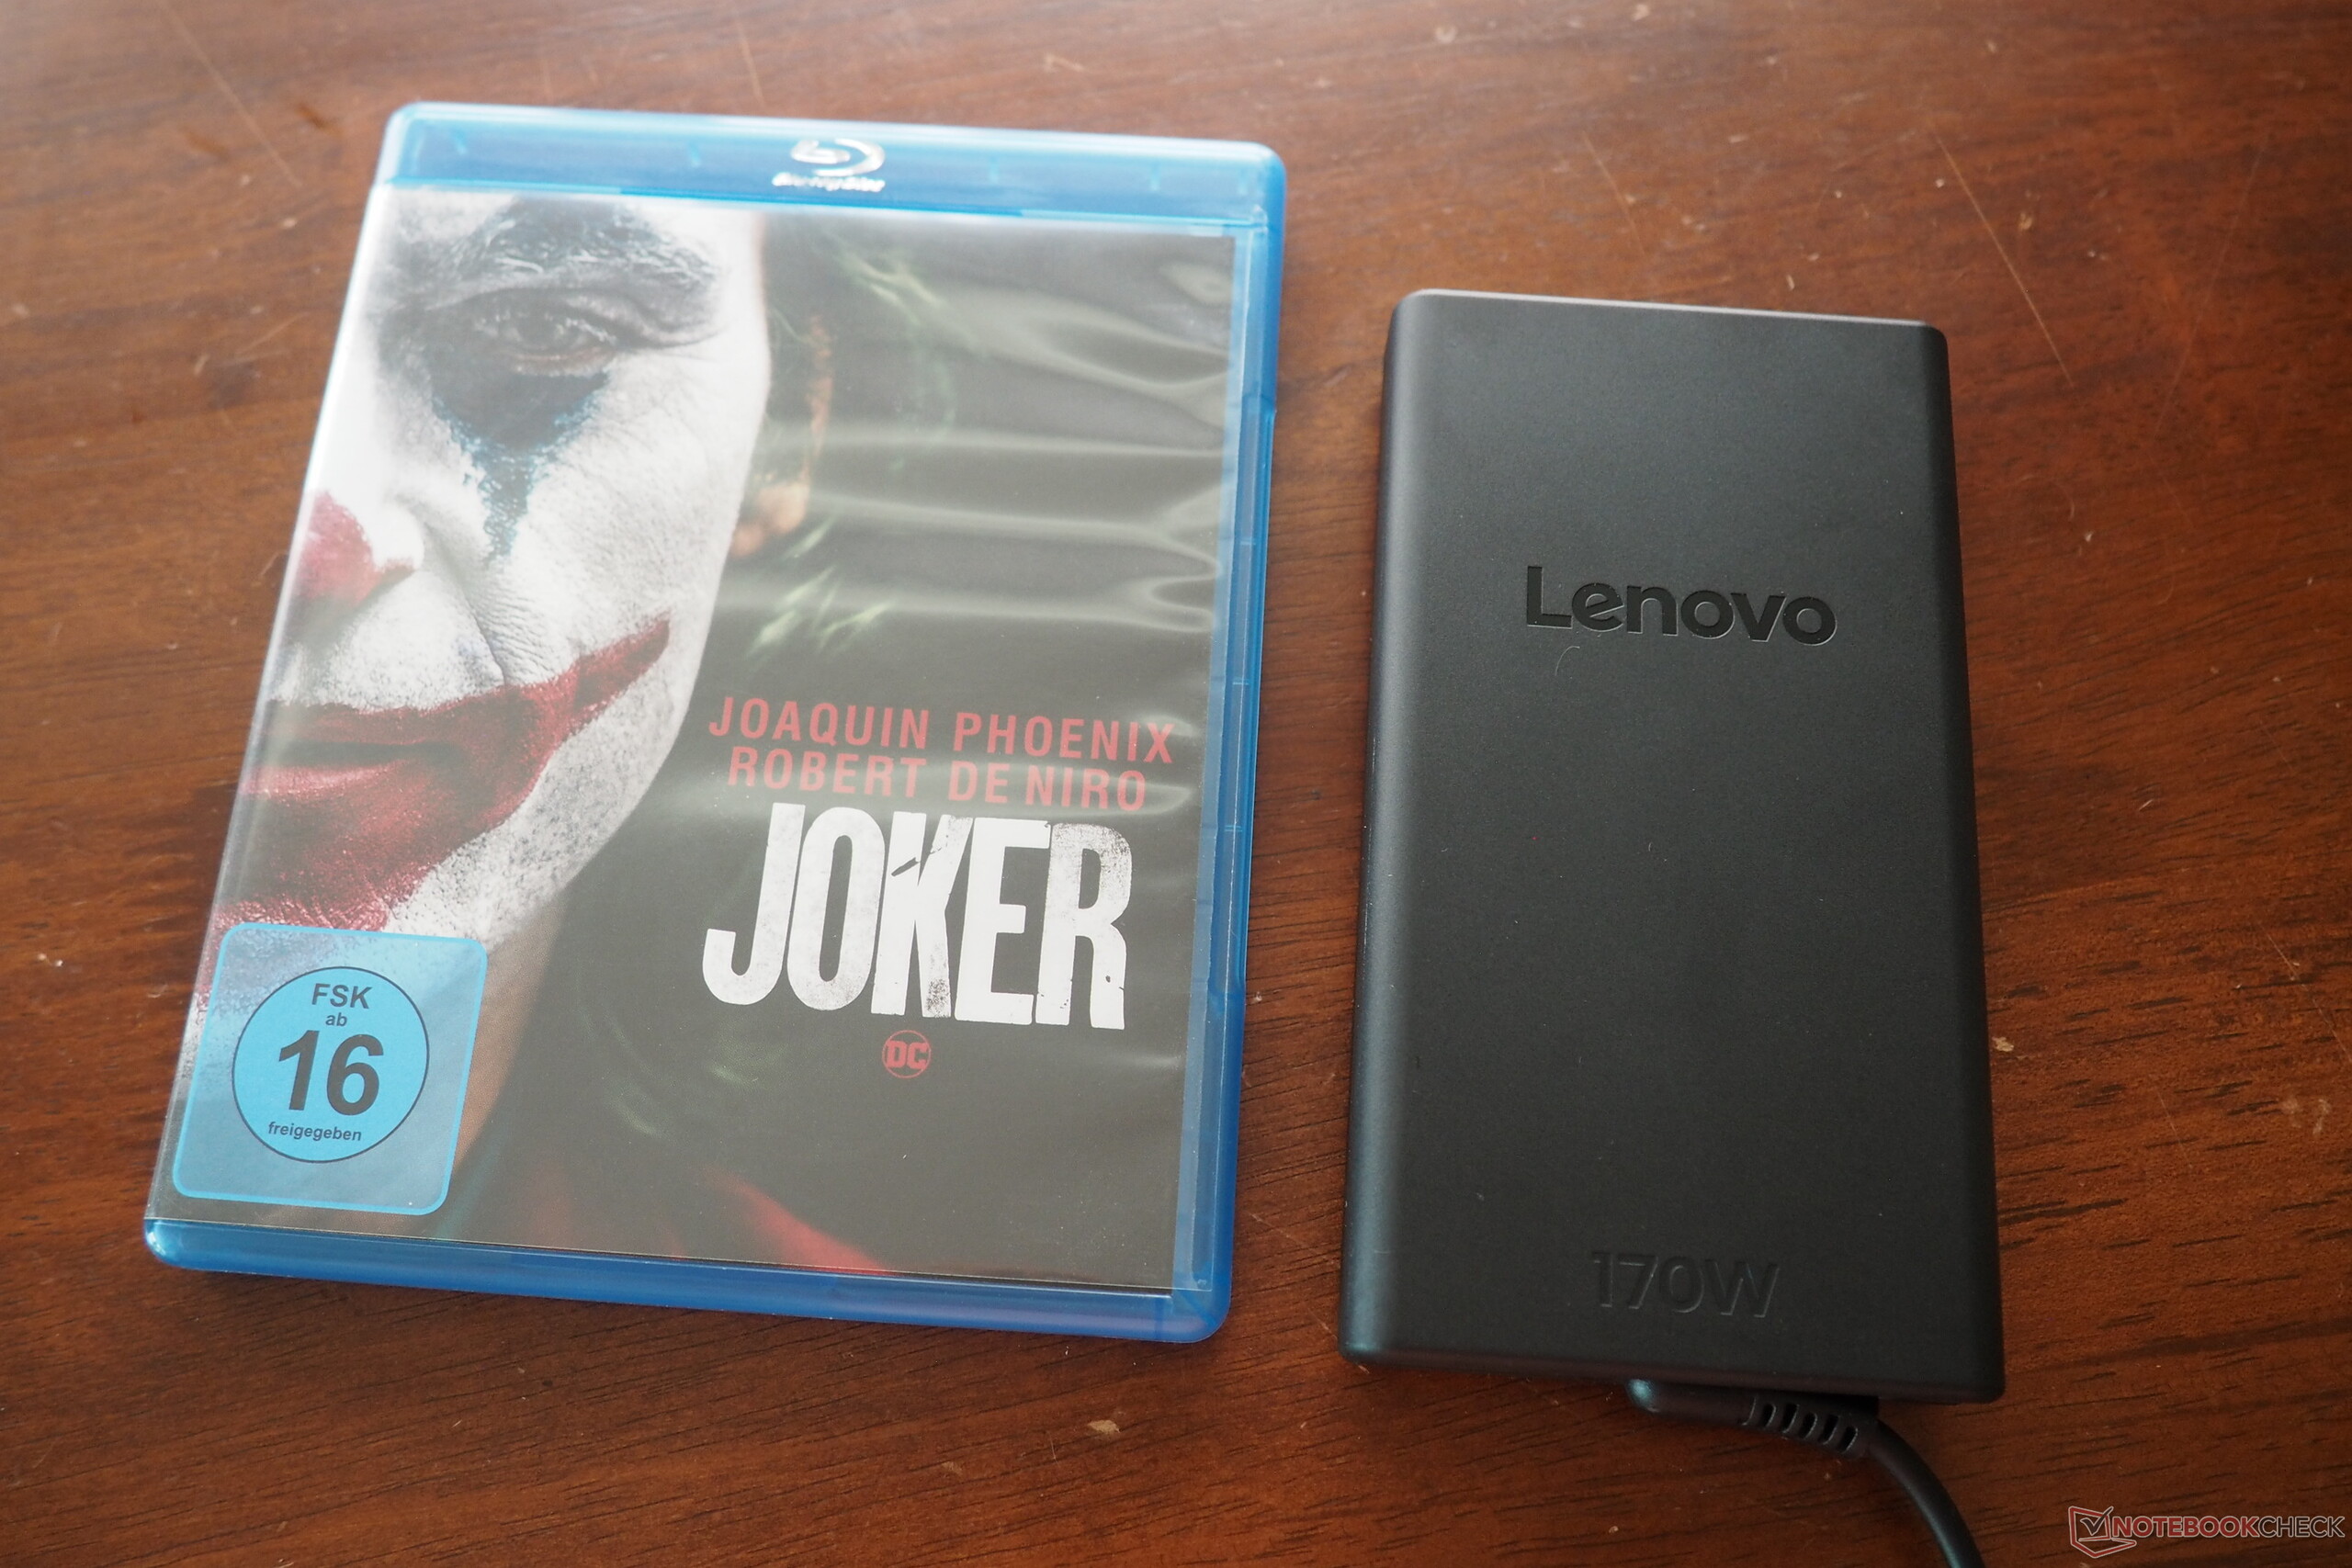
笔记本电脑附带几本信息手册和一个相当小巧的 170 瓦电源装置,连电源线在内重量不到 600 克。
维护
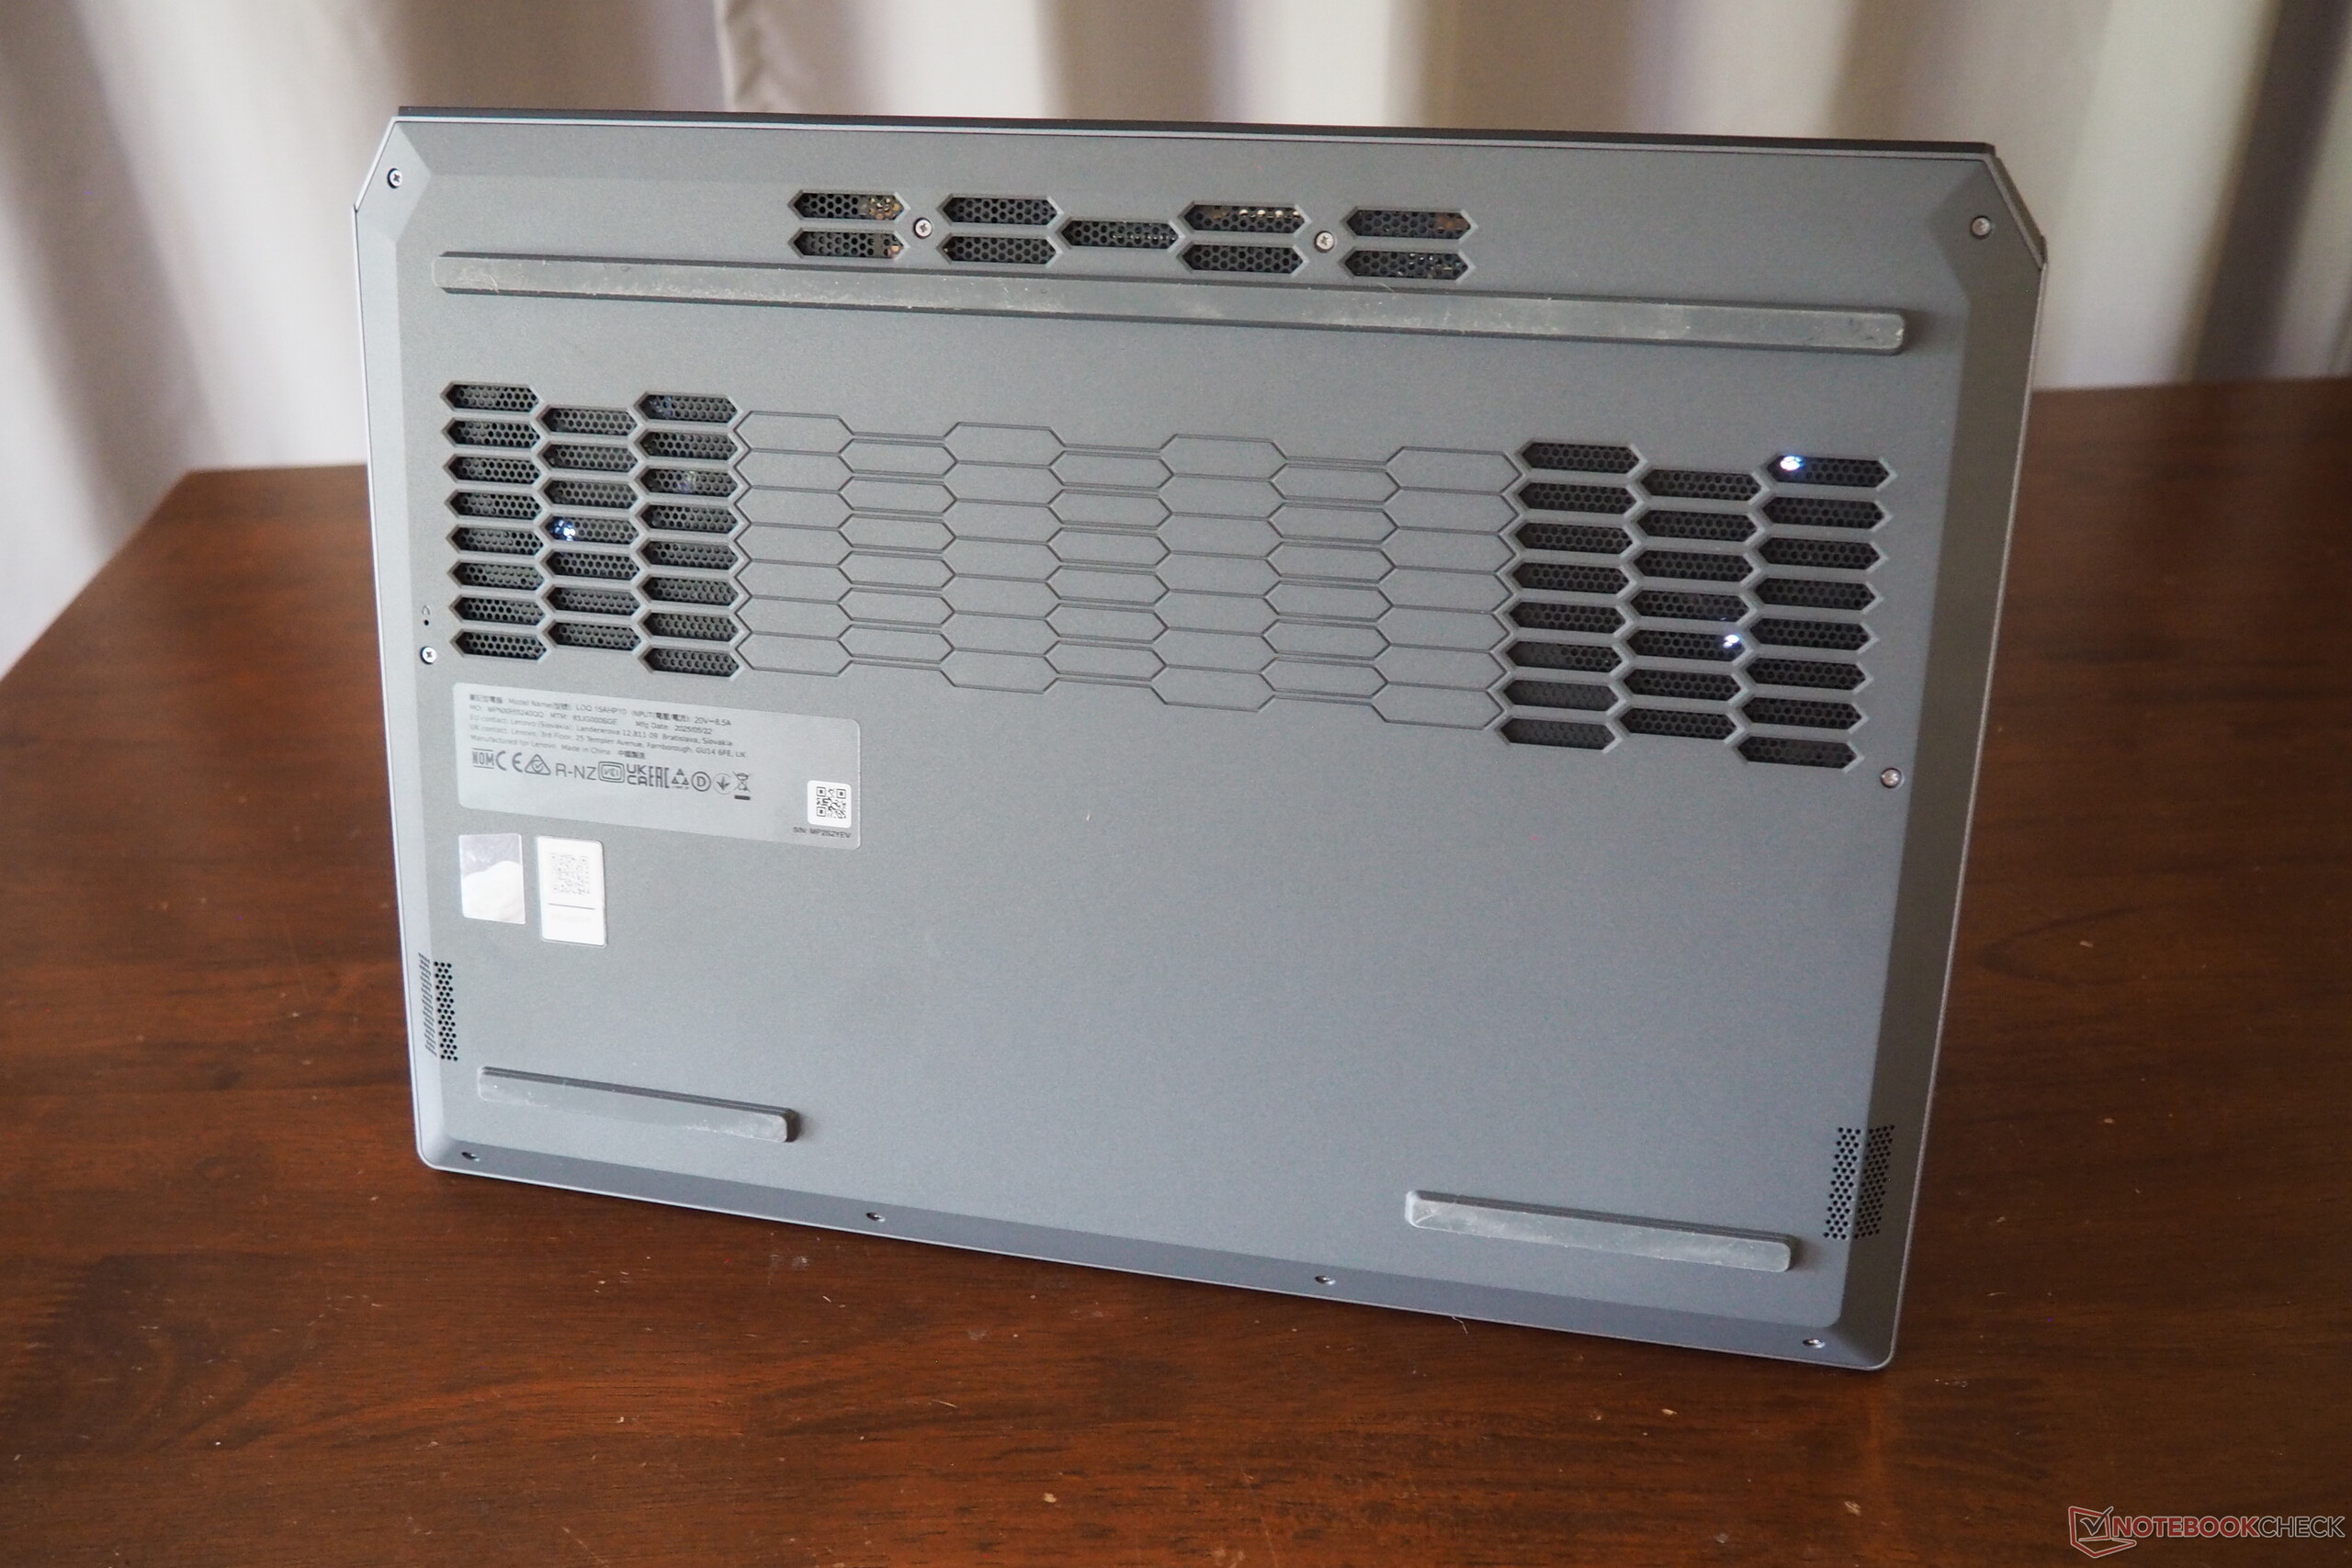
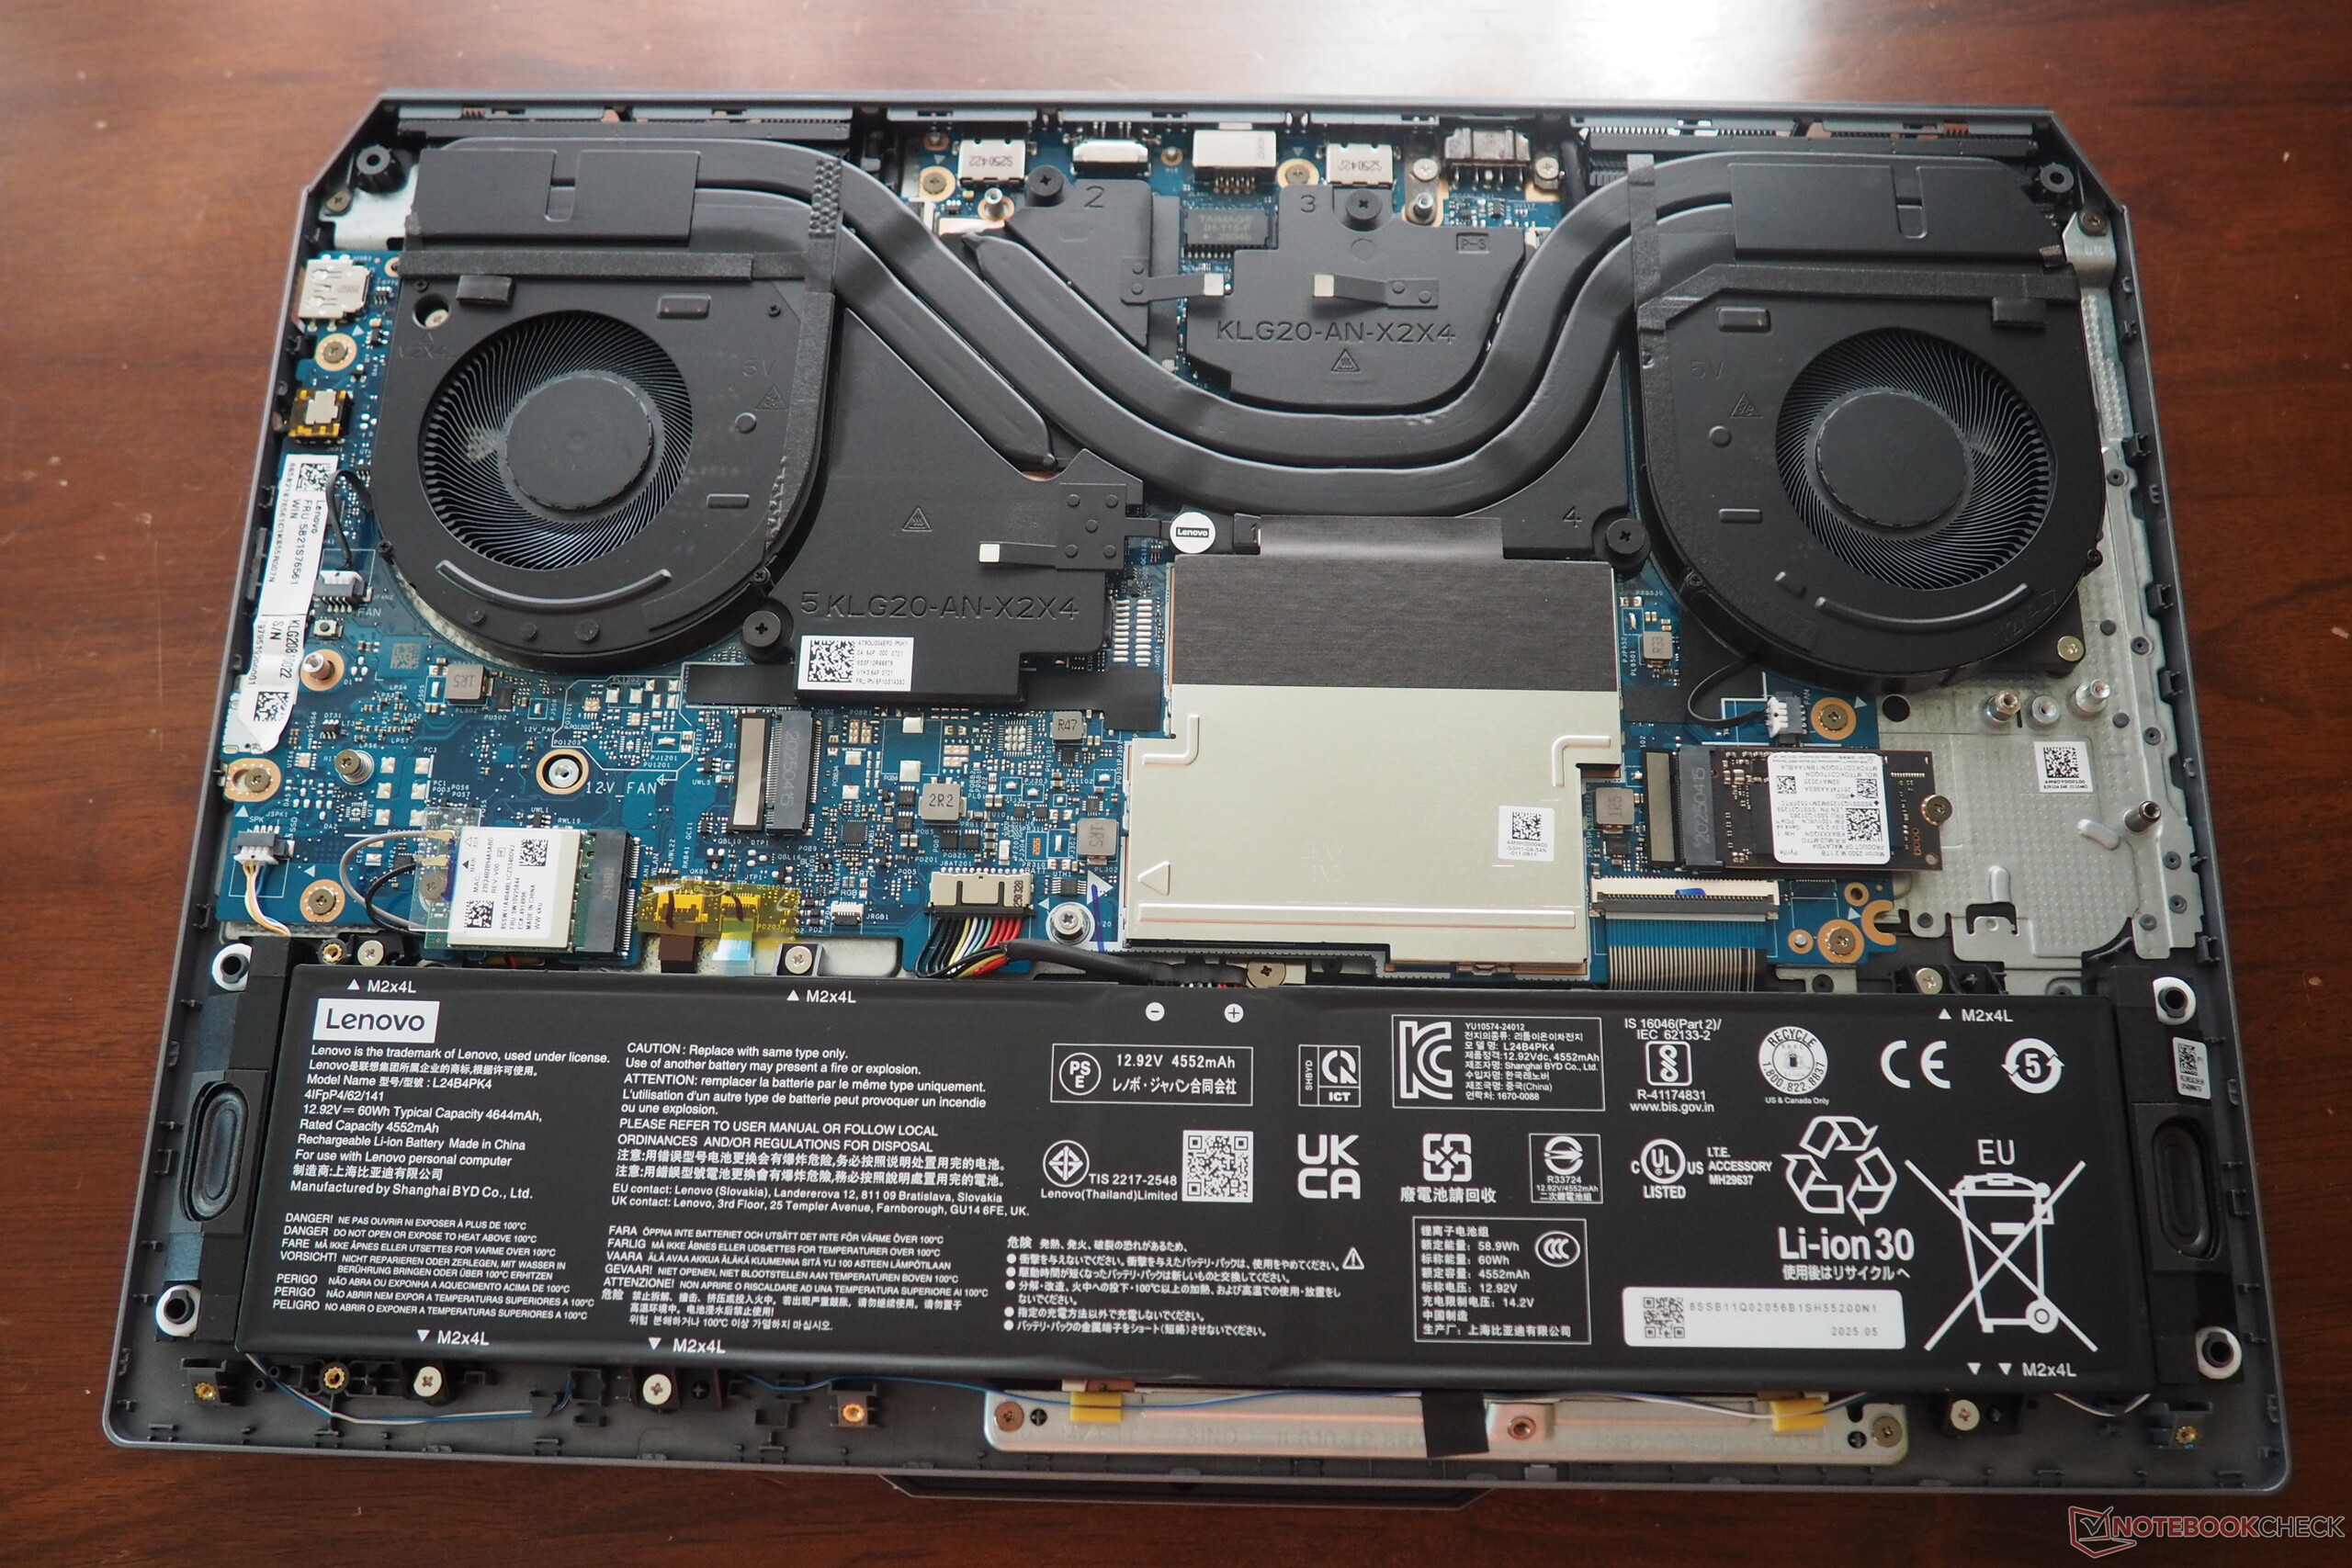
对于游戏笔记本电脑来说,它的维护选项非常典型。卸下 10 颗十字螺丝后,底板就可以从固定装置中撬出,露出设备的内部结构(见照片)。两个 M.2 插槽(最高 2280 型)裸露在外,而两个 SO-DIMM 组则被散热片覆盖,拆卸非常容易。电池、冷却系统和无线模块也都可以拆卸。

可持续性
在可持续发展方面,联想可以做得更好,因为该设备的包装中使用了大量塑料。
保修
在美国,笔记本电脑享有 12 个月的标准保修服务。
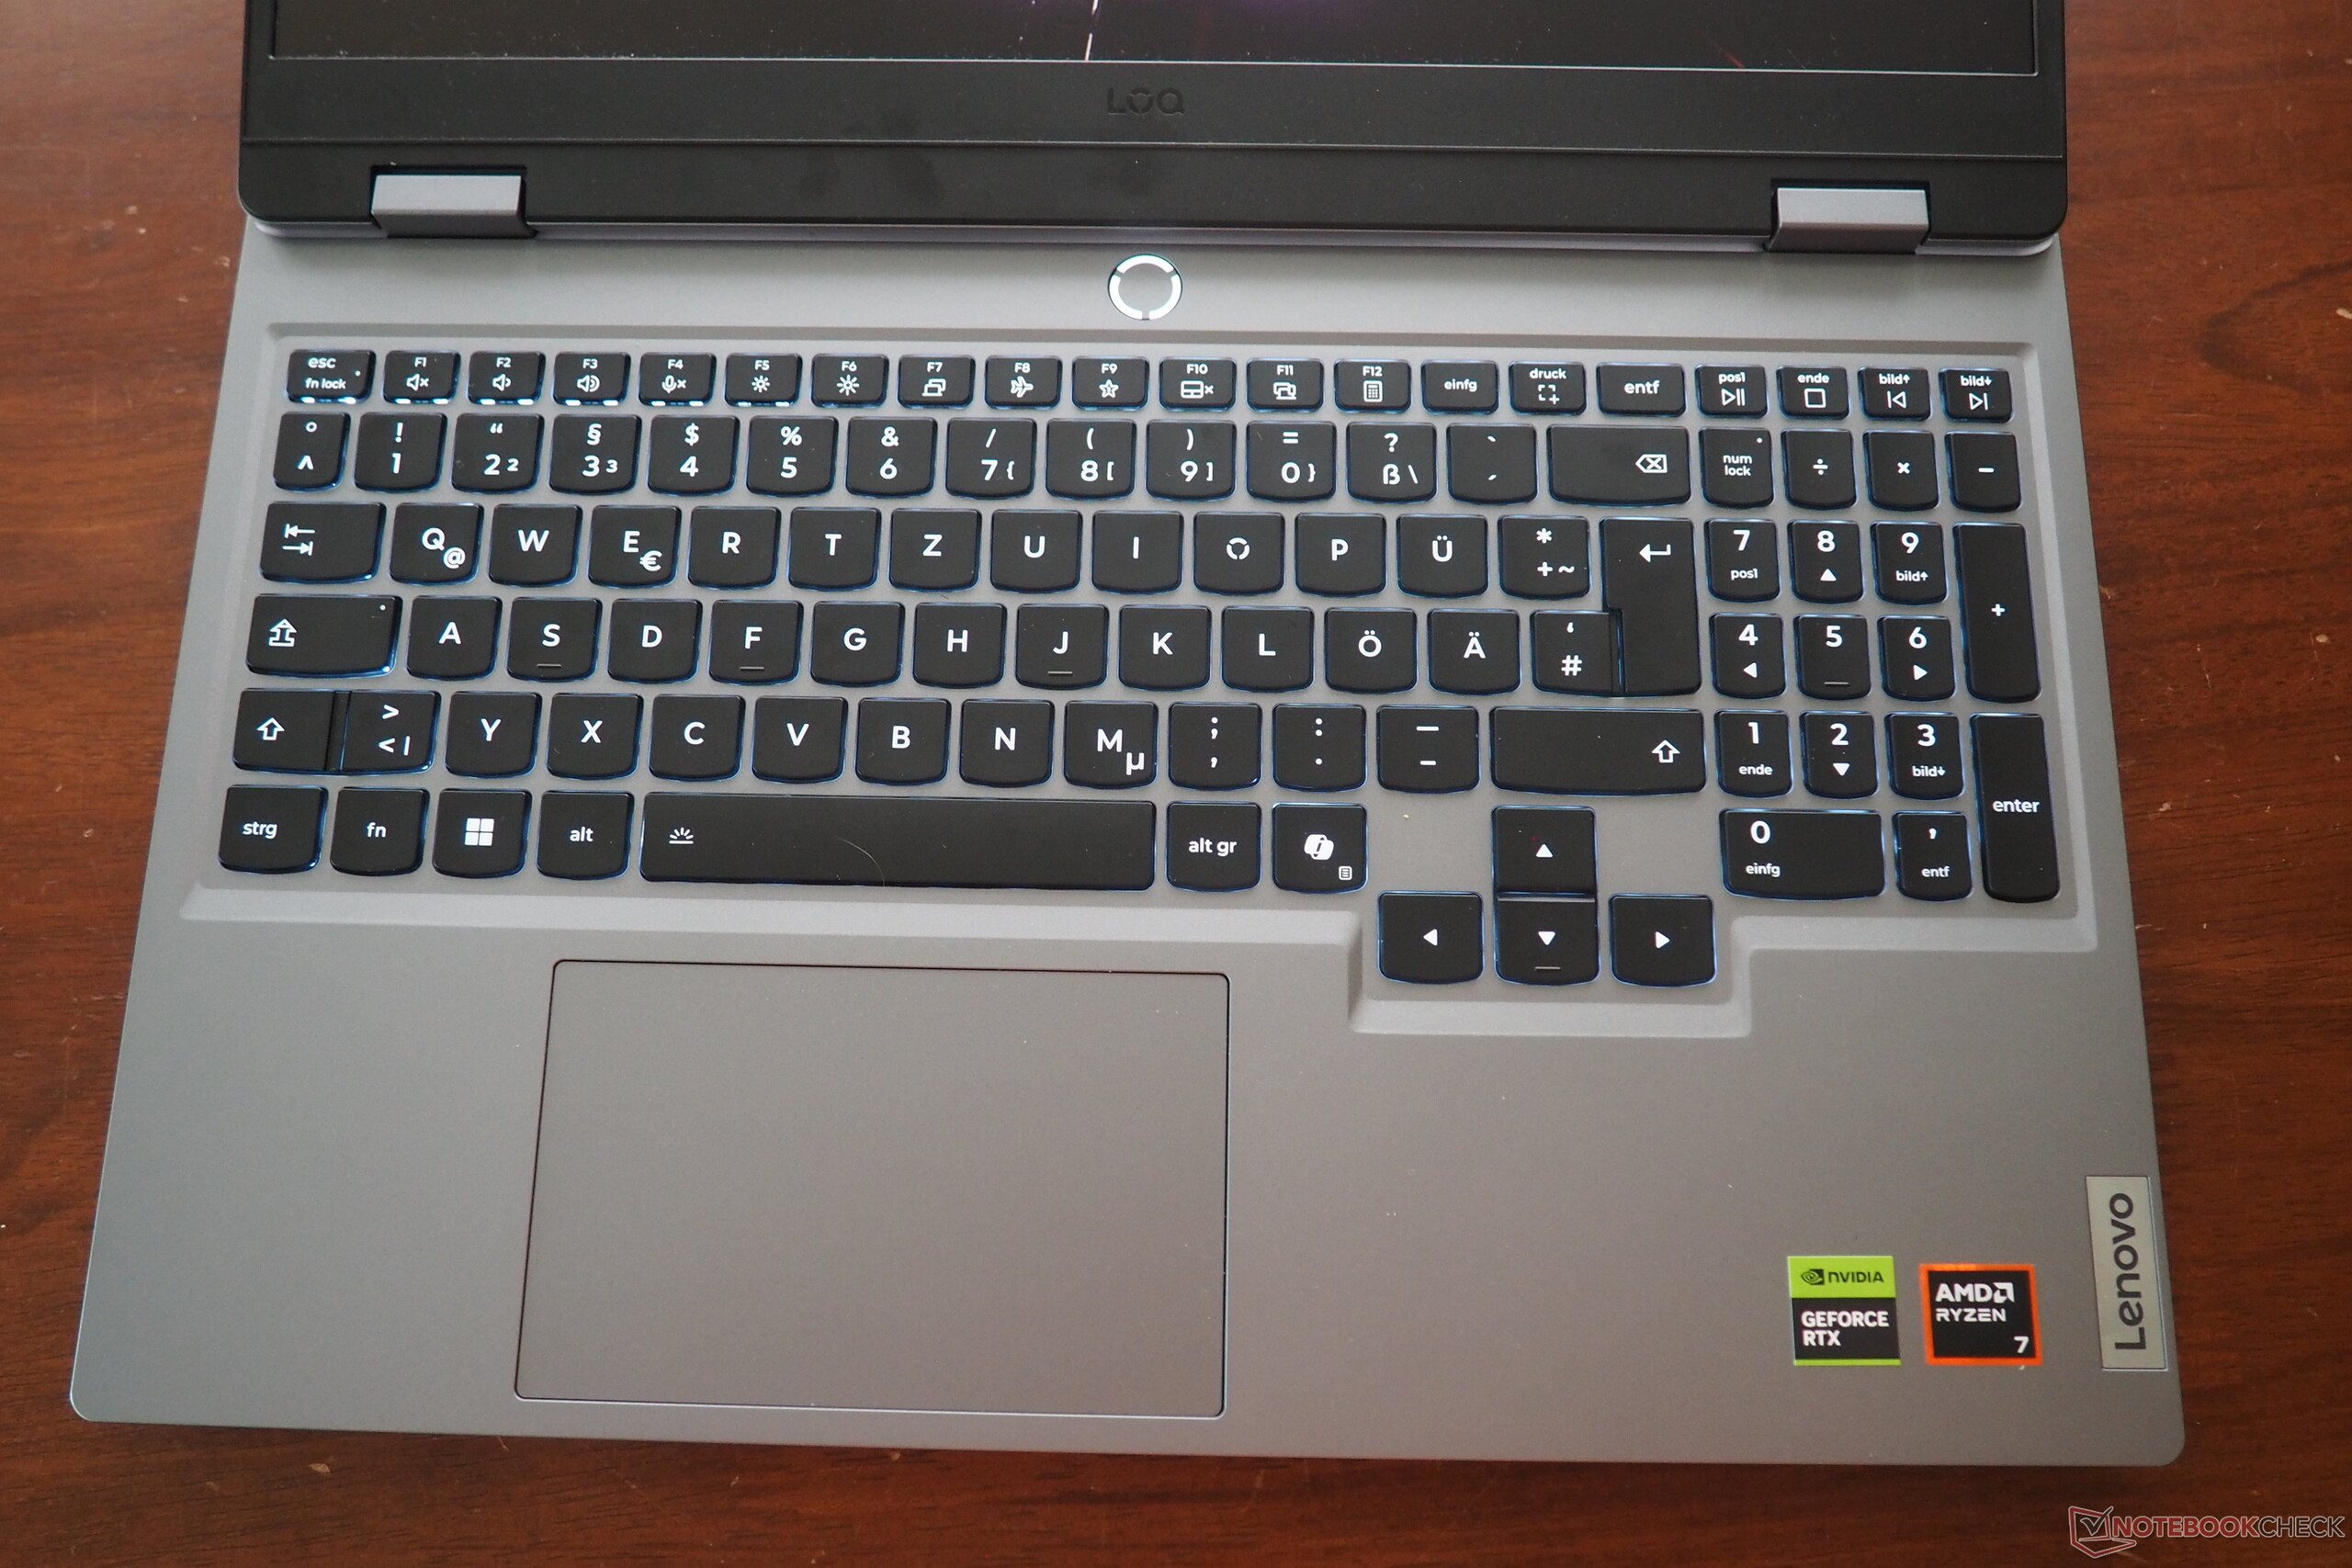
输入设备
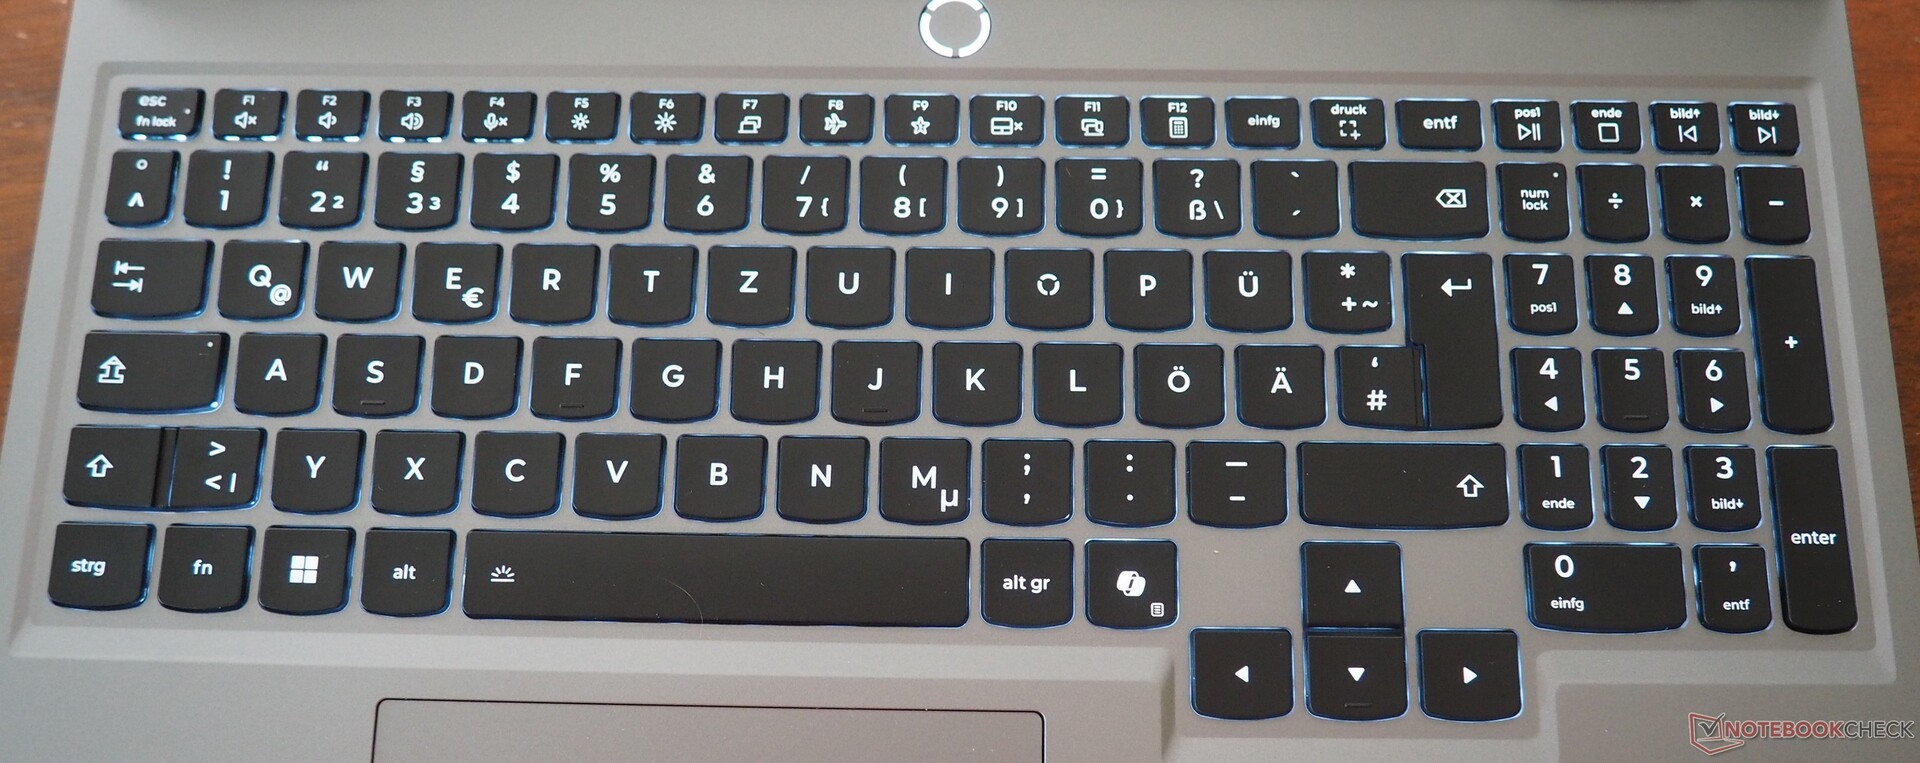
键盘
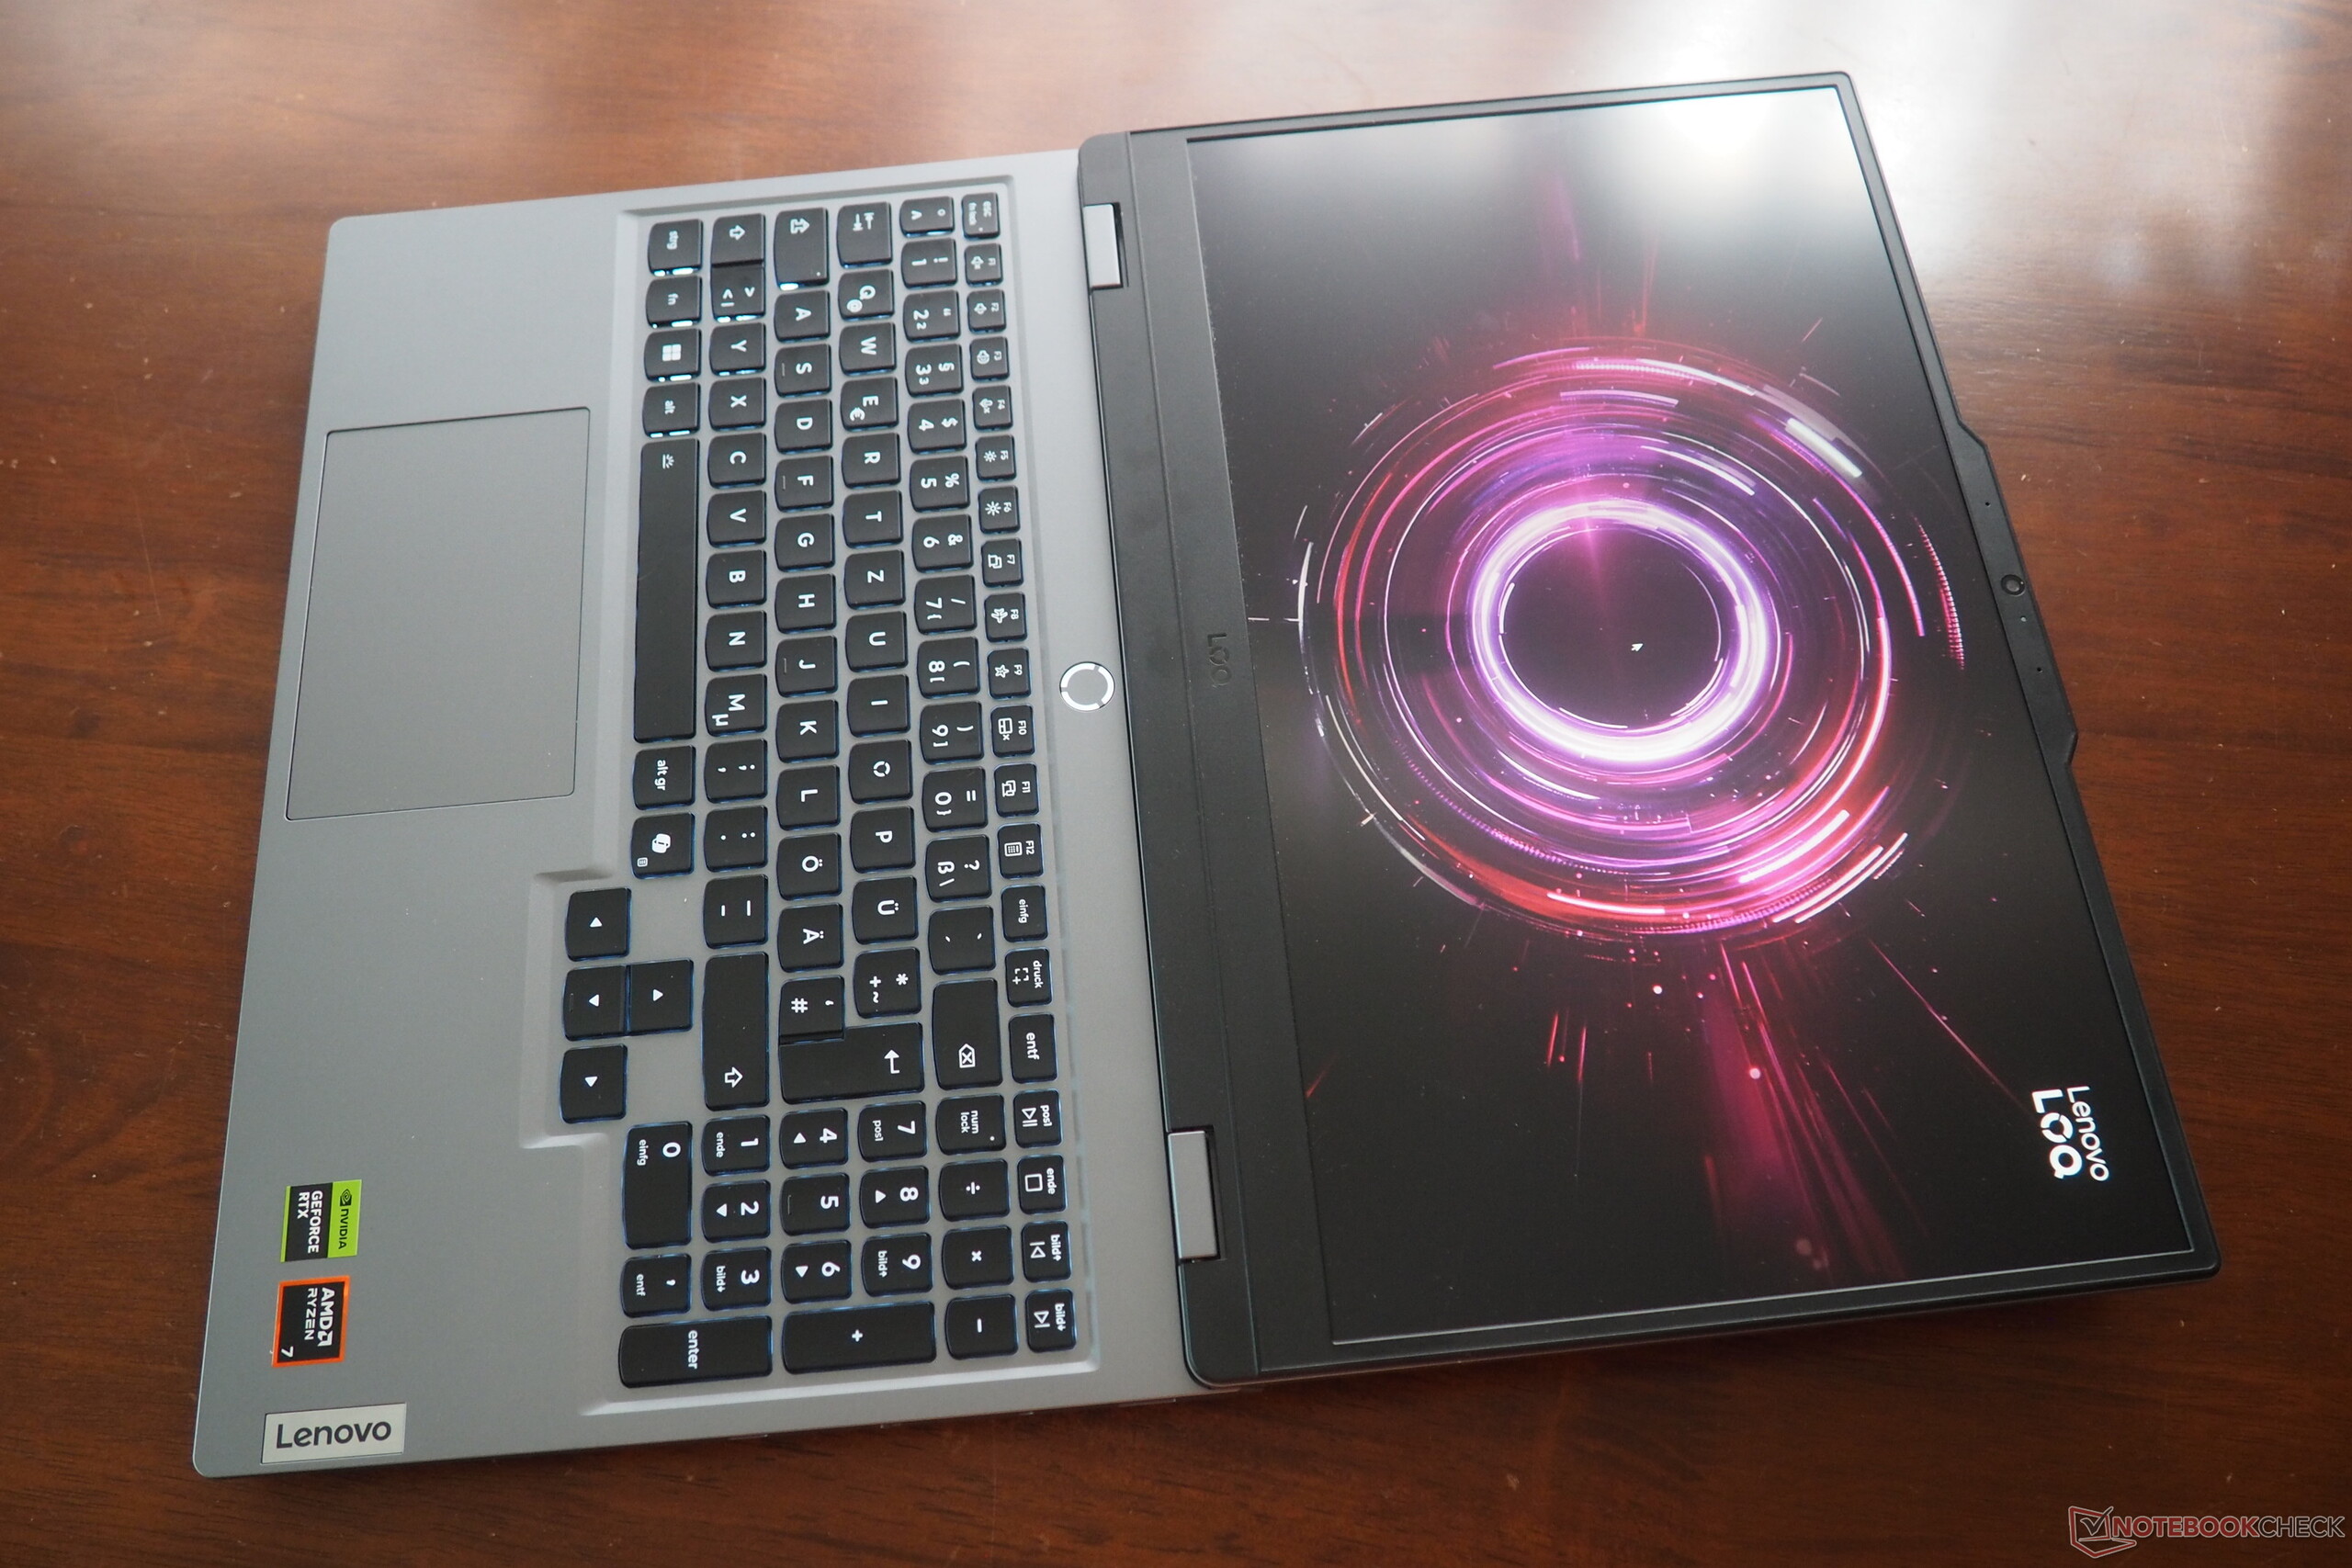
该设备的键盘应能满足大多数买家的需求。与几乎所有 Rubberdome 机型一样,键盘的打字手感仍有改进的余地,但至少达到了游戏笔记本电脑的标准。我们尤其喜欢它宽大的方向键。而数字键盘则由于空间不足而不得不使用较窄的按键。联想选择了白色多级可调背光。我们认为制造商选择的布局是成功的。
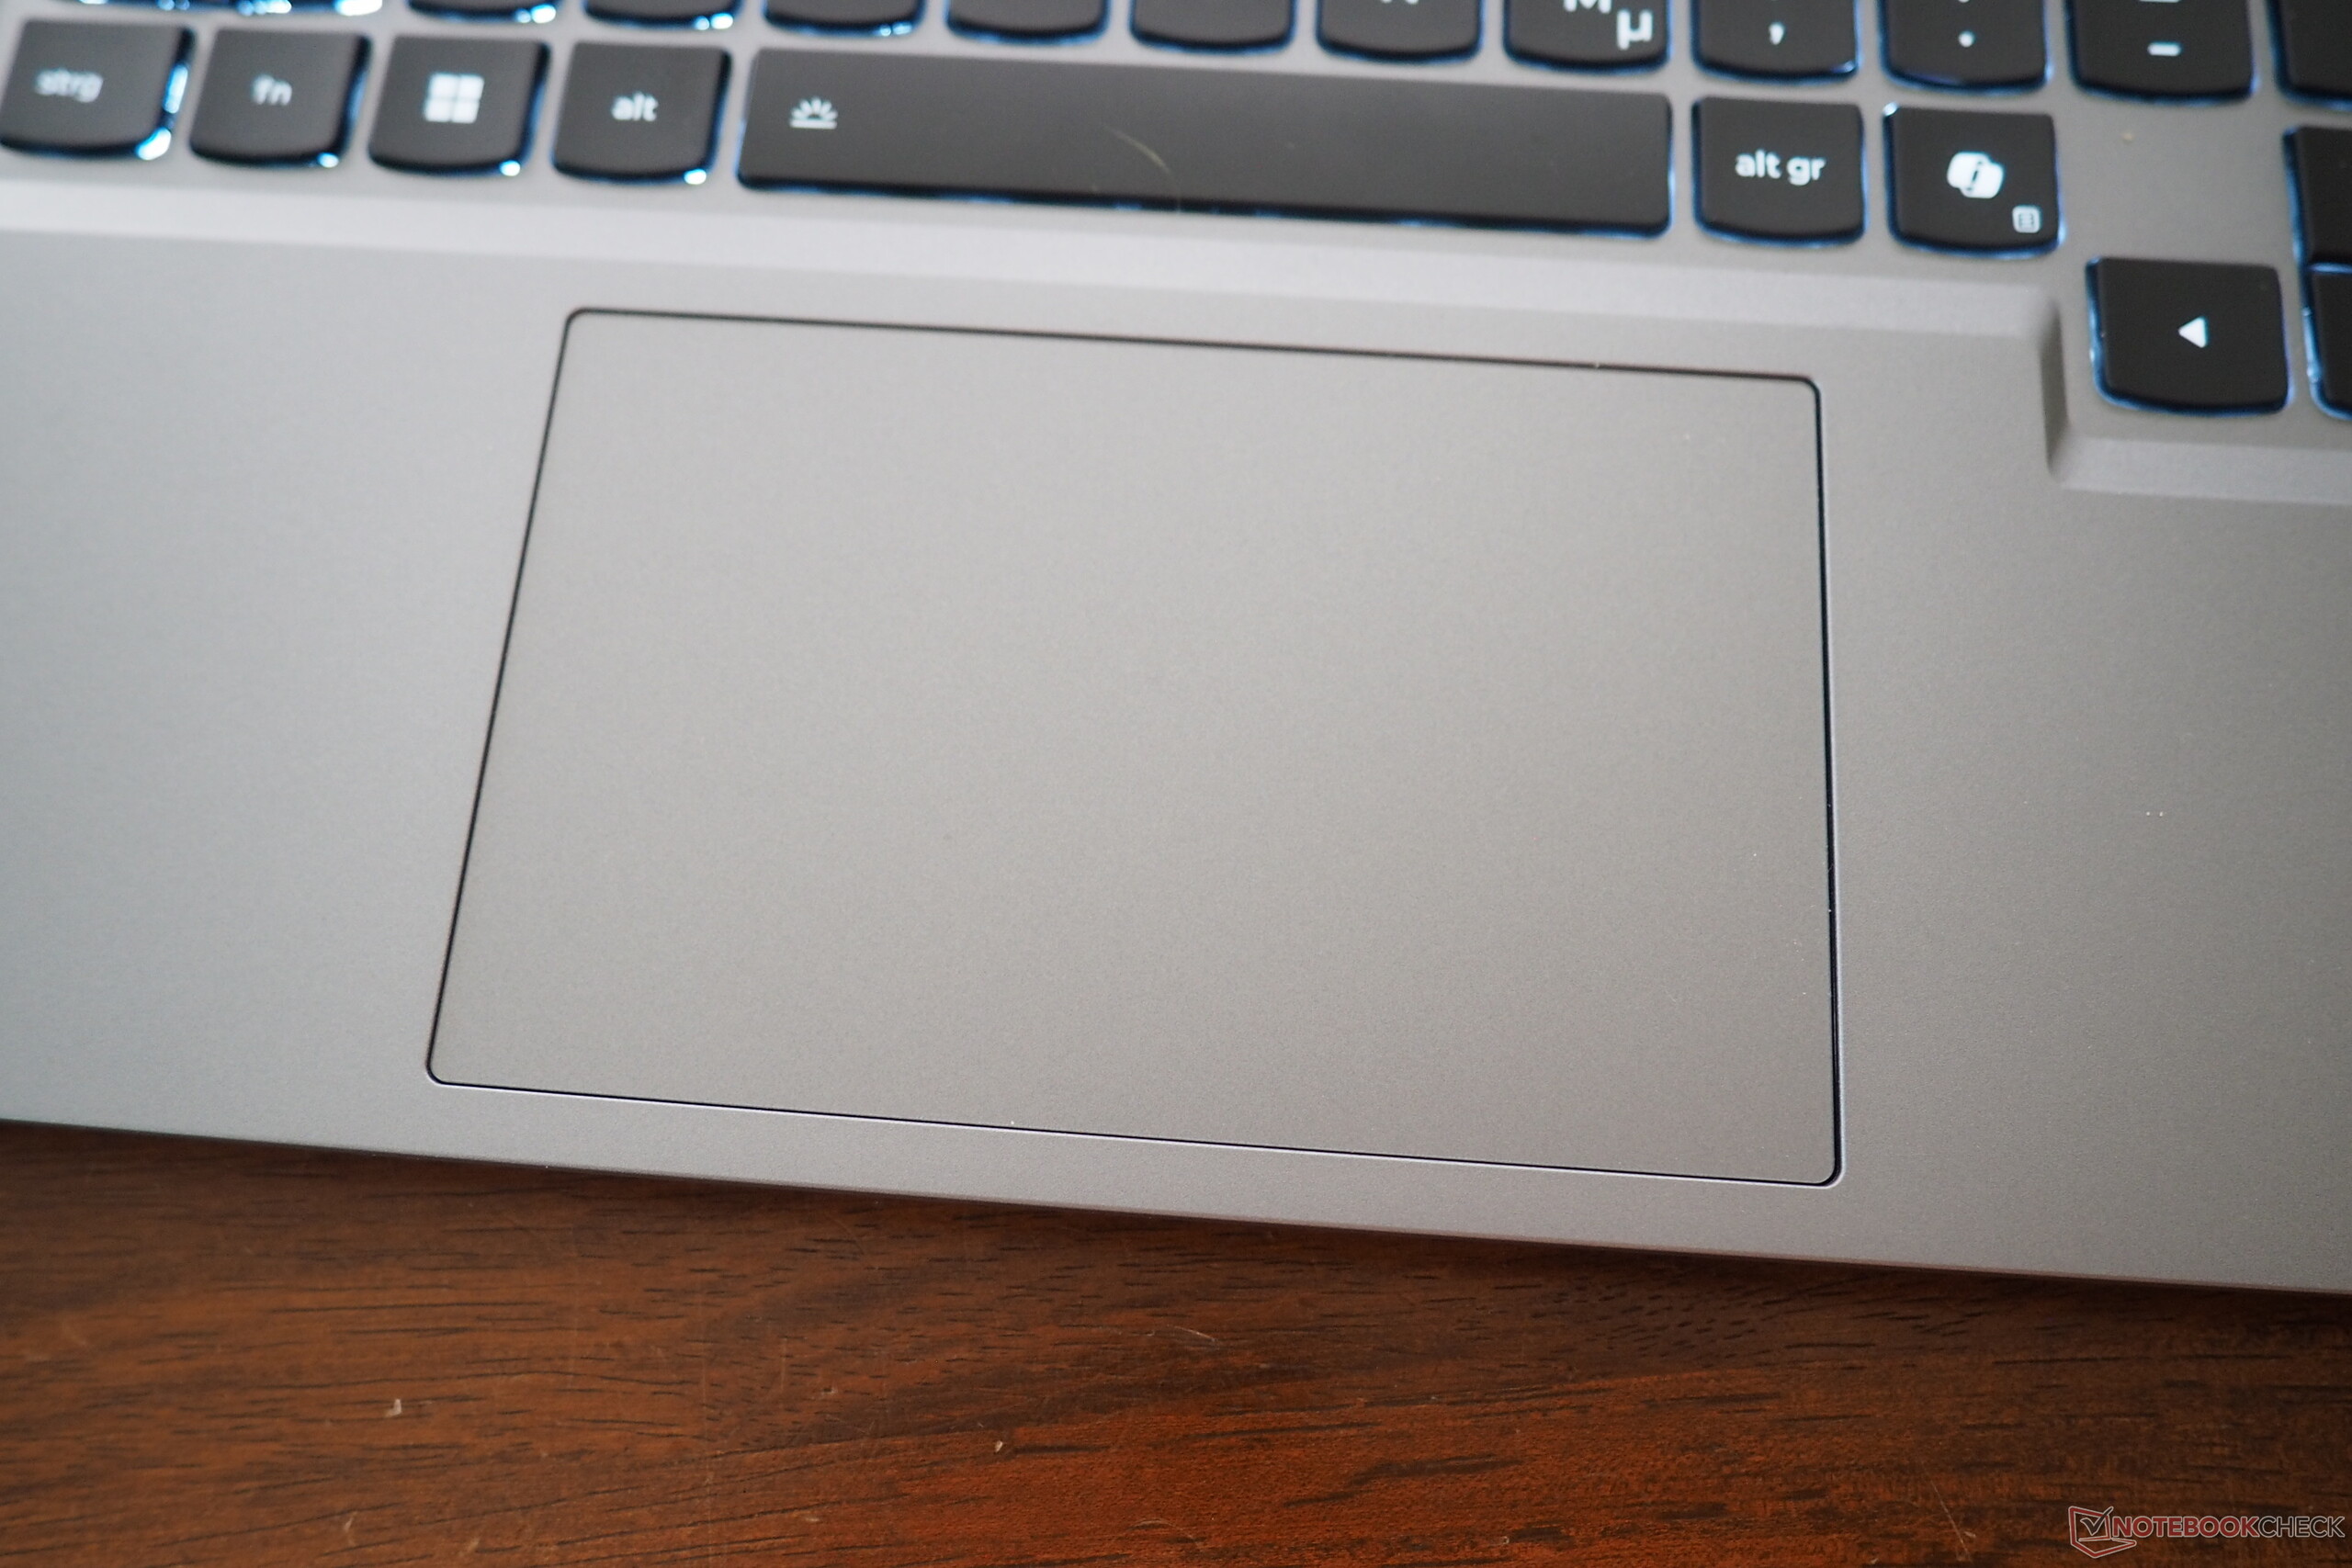
触摸板
鼠标替换件的位置相当靠左,尺寸为 12 x 7.5 厘米,手感相当流畅和精确。当然,它还支持多点触控手势。联想可以对其稳定性和点击行为进行一些改进。按压底部边缘的点击区域听起来相当不稳定,因此让人感觉该设备有点廉价。
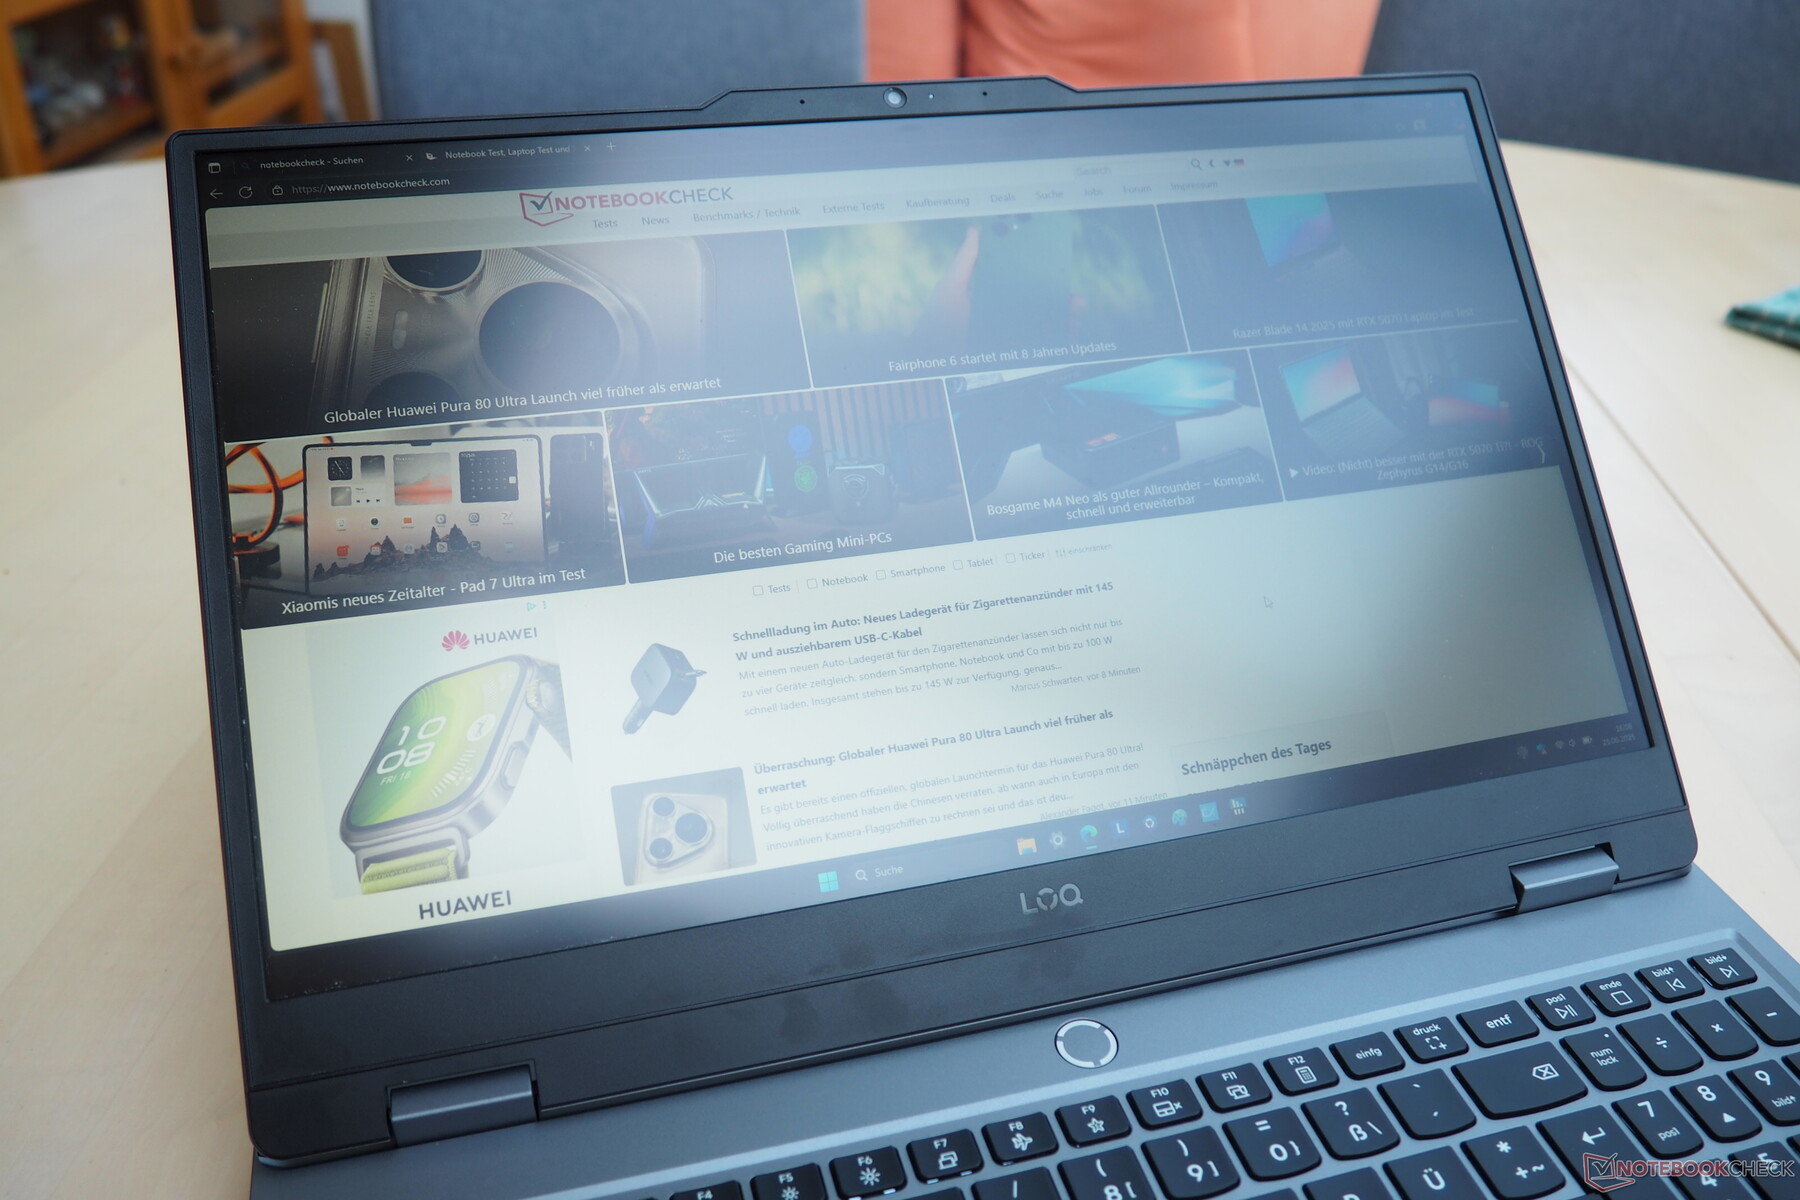
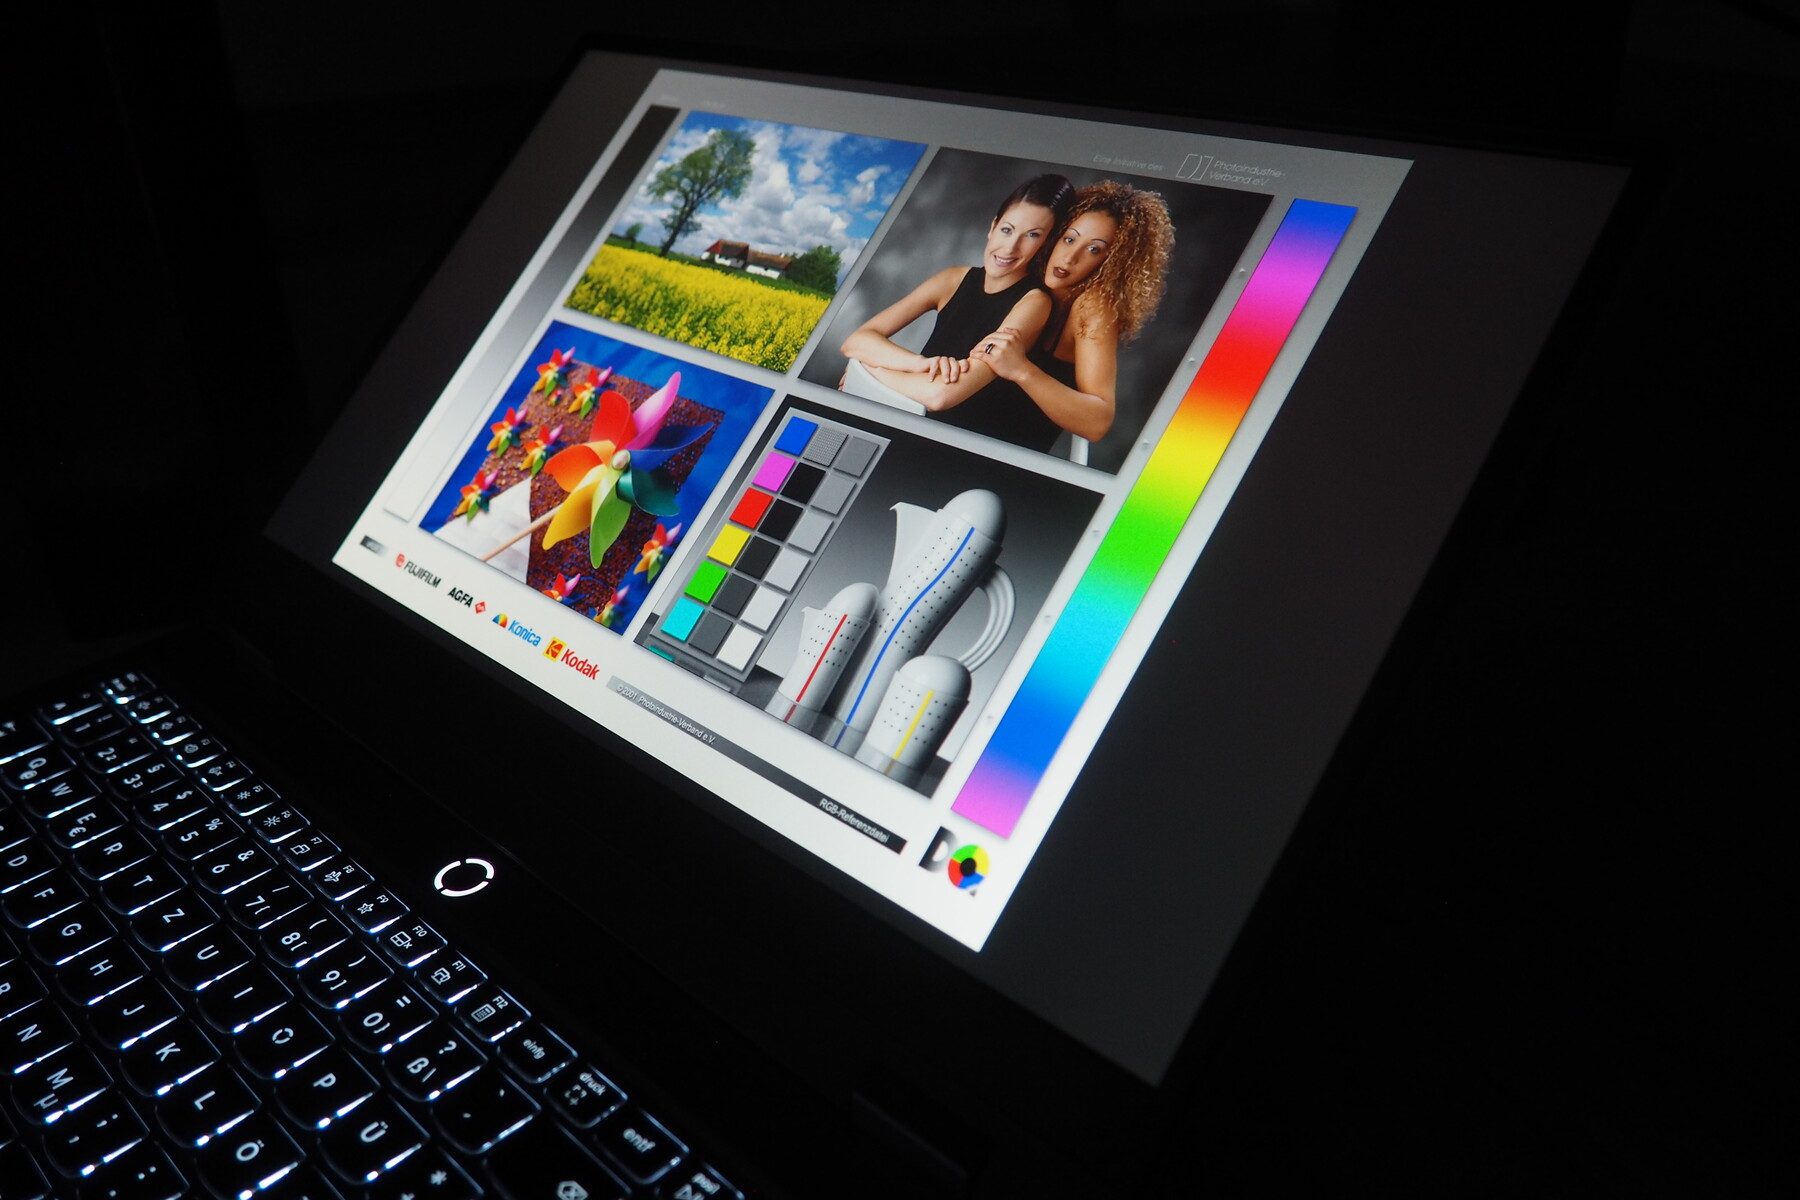
显示屏
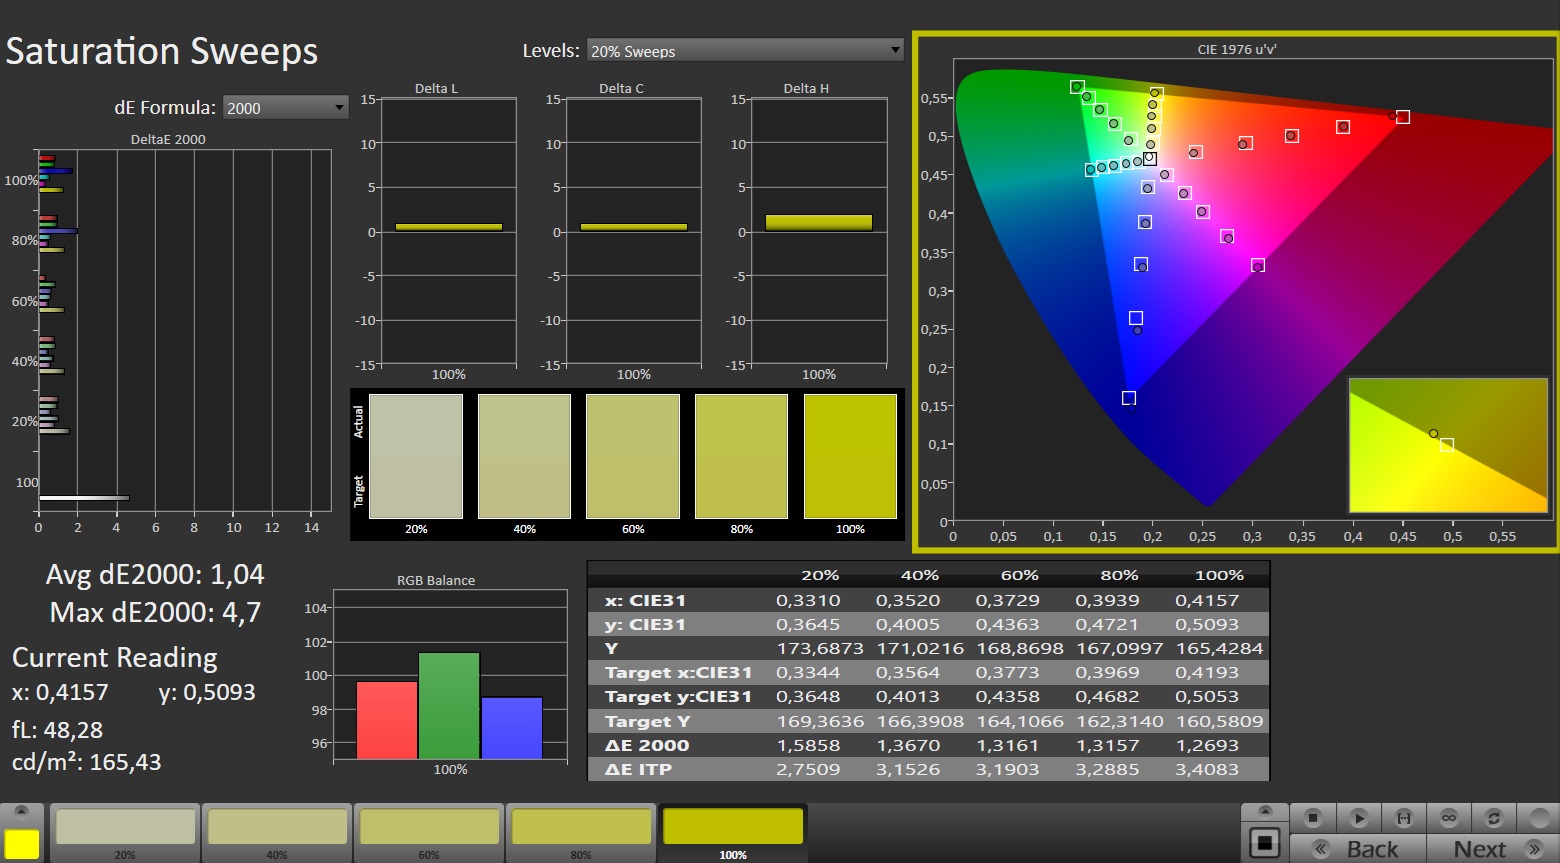
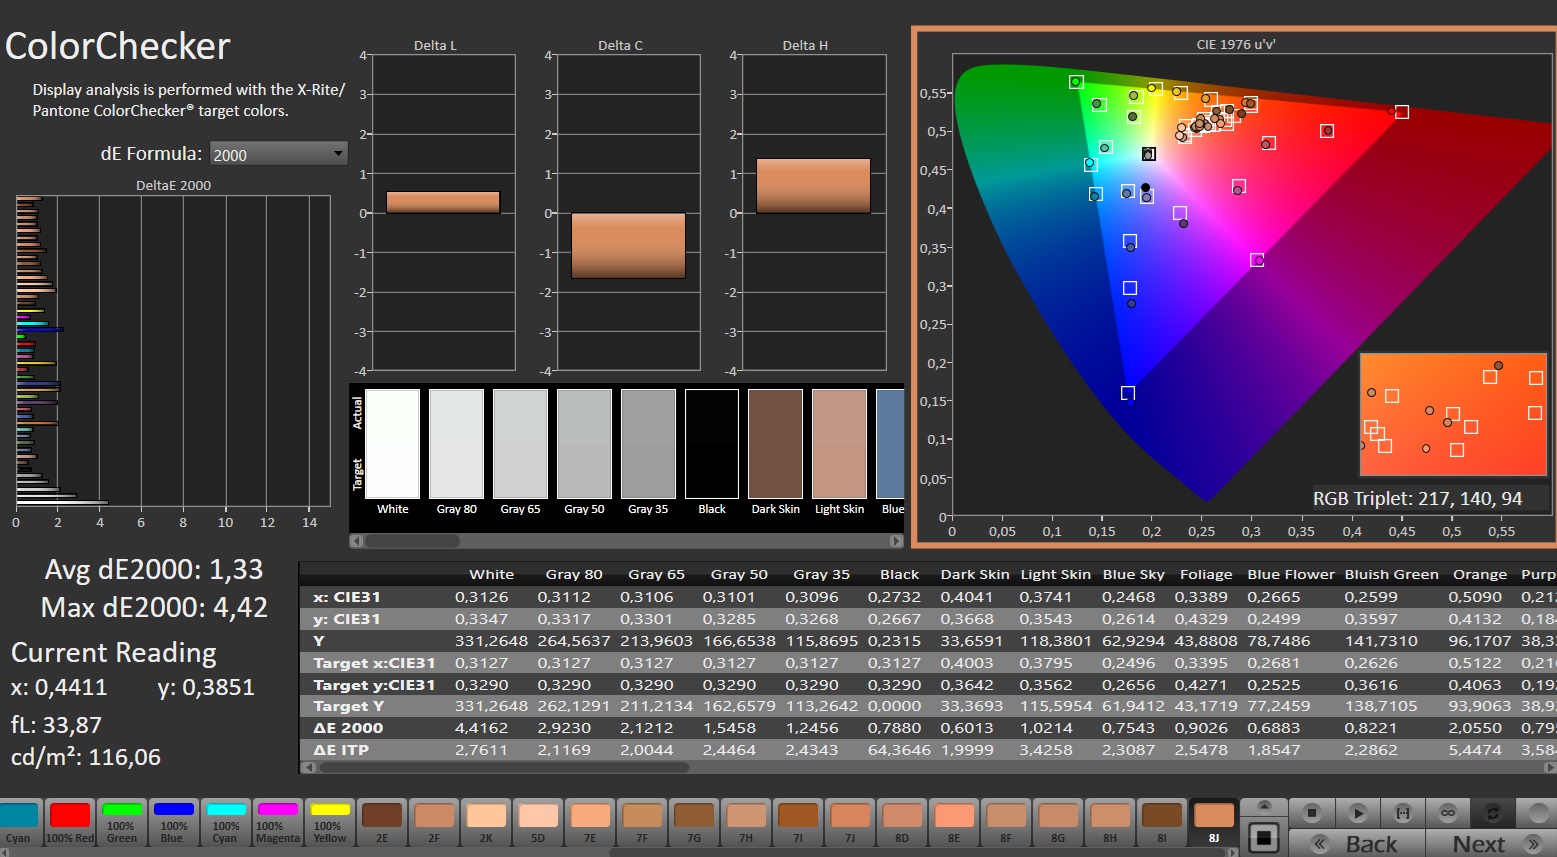
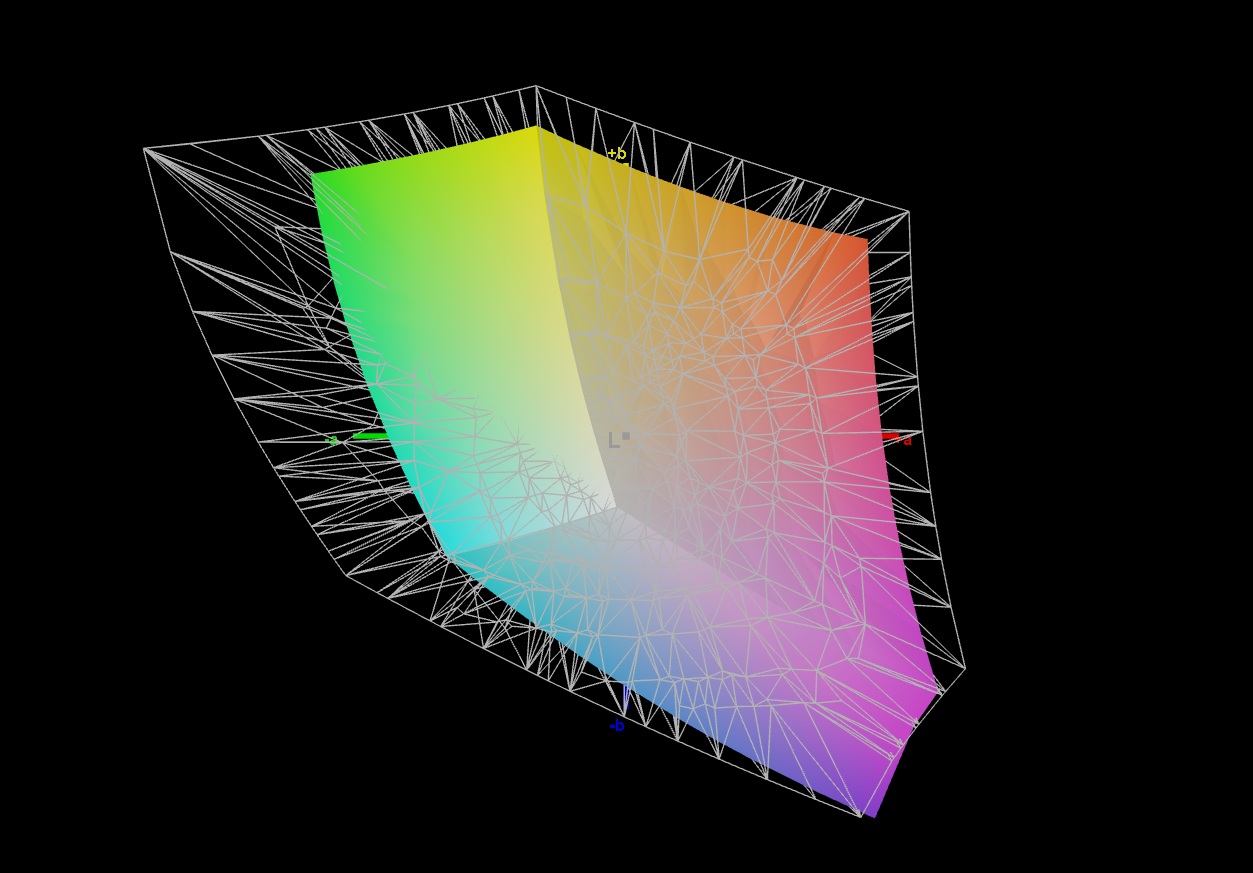
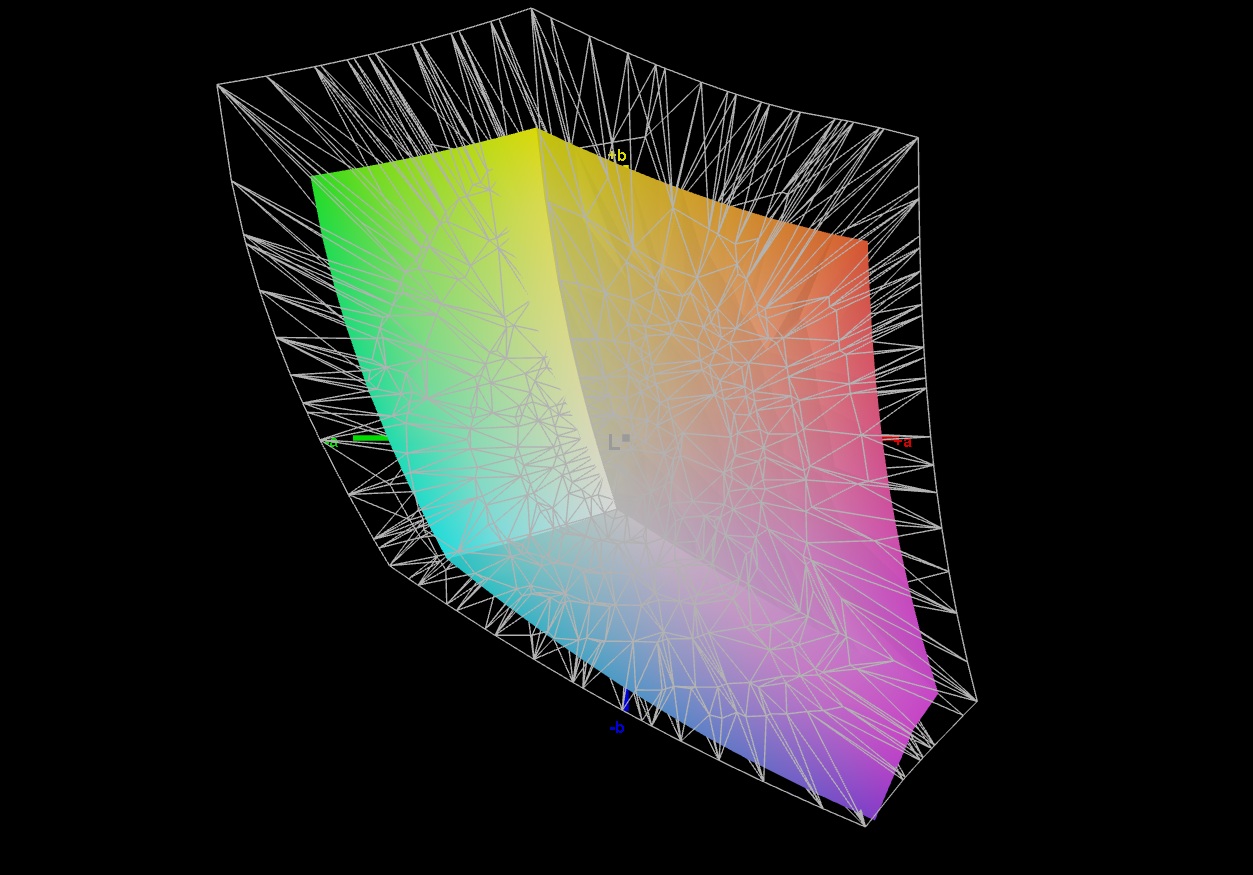
事实证明,这款笔记本电脑的显示屏几乎在所有方面都不尽如人意,即既不差也不特别好。首先是亮度,测试期间平均亮度为 300 cd/m²。因此,室外使用几乎是不可能的,但对于大多数室内区域来说,这个数值已经足够了。
| |||||||||||||||||||||||||
Brightness Distribution: 89 %
Center on Battery: 318 cd/m²
Contrast: 1590:1 (Black: 0.2 cd/m²)
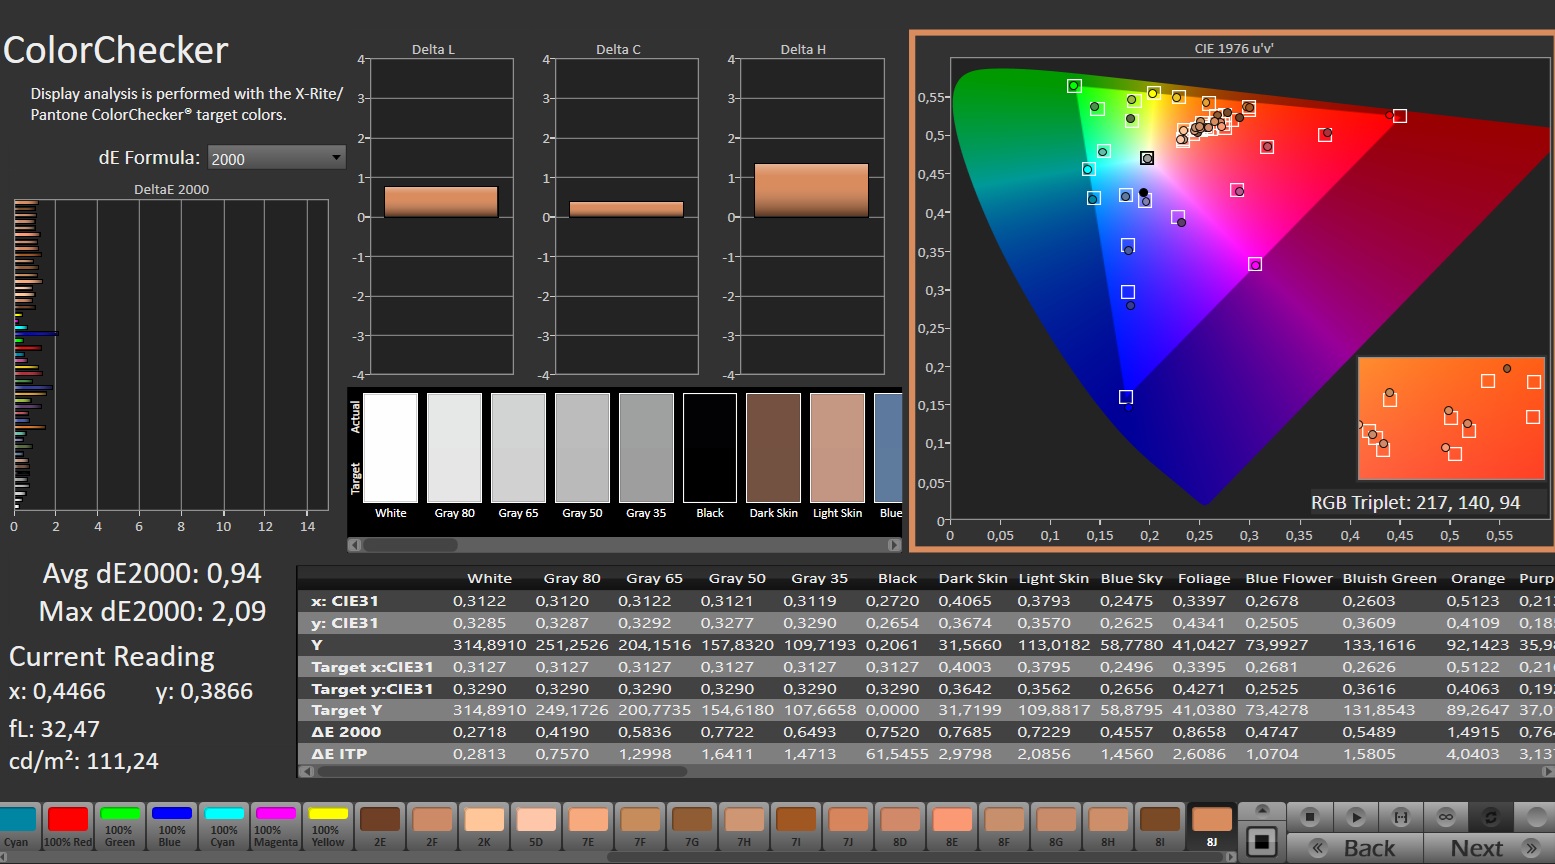
ΔE ColorChecker Calman: 1.33 | ∀{0.5-29.43 Ø4.72}
calibrated: 0.94
ΔE Greyscale Calman: 1.9 | ∀{0.09-98 Ø4.97}
69.1% AdobeRGB 1998 (Argyll 3D)
99.2% sRGB (Argyll 3D)
67.3% Display P3 (Argyll 3D)
Gamma: 2.187
CCT: 6678 K
| Lenovo LOQ 15AHP10 CSOT MNF601BA1-4, IPS, 1920x1080, 15.6", 144 Hz | Lenovo LOQ 15IRX9 BOE NJ NE156FHM-NX9, IPS, 1920x1080, 15.6", 144 Hz | Lenovo Legion 5 15AHP G10 LEN151WQXGA, OLED, 2560x1600, 15.1", 165 Hz | Gigabyte Aero X16 1WH MNG007DA5-1, IPS, 2560x1600, 16", 165 Hz | MSI Katana 17 HX B14WGK CSOT MNH301CA3-1, IPS, 2560x1440, 17.3", 240 Hz | |
|---|---|---|---|---|---|
| Display | 5% | 30% | 1% | 25% | |
| Display P3 Coverage (%) | 67.3 | 73.7 10% | 99.9 48% | 68.7 2% | 97.3 45% |
| sRGB Coverage (%) | 99.2 | 99.1 0% | 100 1% | 96.1 -3% | 99.6 0% |
| AdobeRGB 1998 Coverage (%) | 69.1 | 72.6 5% | 98.3 42% | 71.2 3% | 89 29% |
| Response Times | -16% | 99% | 70% | 71% | |
| Response Time Grey 50% / Grey 80% * (ms) | 33.9 ? | 42.2 ? -24% | 0.42 ? 99% | 12 ? 65% | 5.2 ? 85% |
| Response Time Black / White * (ms) | 21.2 ? | 22.6 ? -7% | 0.4 ? 98% | 5.6 ? 74% | 9.2 ? 57% |
| PWM Frequency (Hz) | 1152 ? | ||||
| PWM Amplitude * (%) | 11 | ||||
| Screen | -20% | 42% | -2% | -13% | |
| Brightness middle (cd/m²) | 318 | 306 -4% | 492 55% | 395 24% | 296 -7% |
| Brightness (cd/m²) | 300 | 287 -4% | 495 65% | 398 33% | 272 -9% |
| Brightness Distribution (%) | 89 | 88 -1% | 92 3% | 97 9% | 87 -2% |
| Black Level * (cd/m²) | 0.2 | 0.21 -5% | 0.32 -60% | 0.27 -35% | |
| Contrast (:1) | 1590 | 1457 -8% | 1234 -22% | 1096 -31% | |
| Colorchecker dE 2000 * | 1.33 | 2.25 -69% | 0.9 32% | 1.3 2% | 1.35 -2% |
| Colorchecker dE 2000 max. * | 4.42 | 4.84 -10% | 1.8 59% | 2.8 37% | 4.76 -8% |
| Colorchecker dE 2000 calibrated * | 0.94 | 1.45 -54% | 1.4 -49% | 0.78 17% | |
| Greyscale dE 2000 * | 1.9 | 2.4 -26% | 1.2 37% | 1.8 5% | 2.7 -42% |
| Gamma | 2.187 101% | 2.259 97% | 2.16 102% | 2.2 100% | 2.201 100% |
| CCT | 6678 97% | 6790 96% | 6291 103% | 6842 95% | 6770 96% |
| Total Average (Program / Settings) | -10% /
-14% | 57% /
49% | 23% /
9% | 28% /
7% |
* ... smaller is better
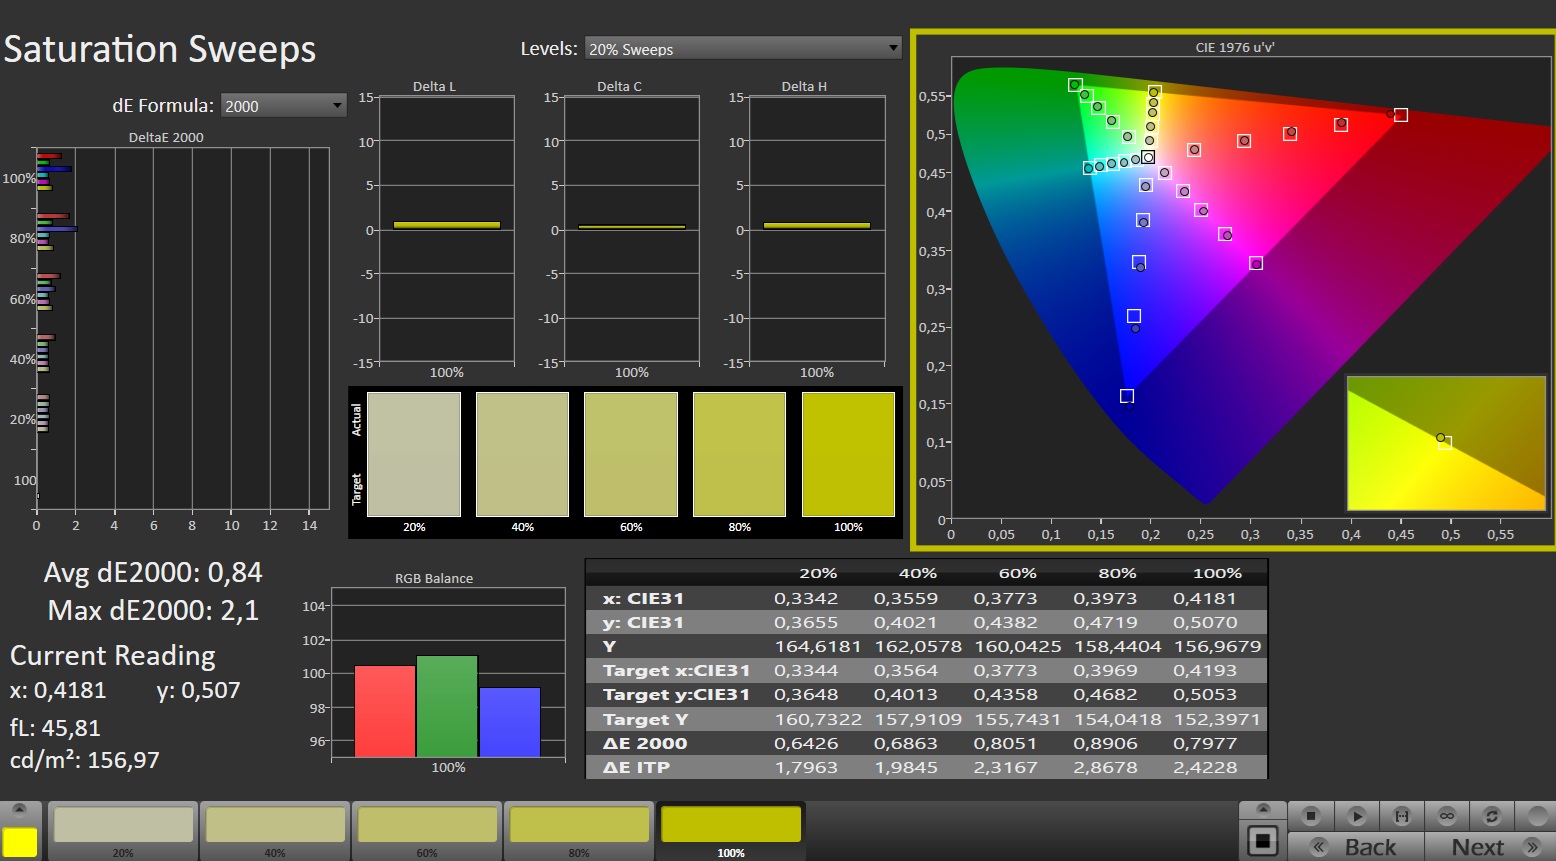
由于其黑色值较低,仅为 0.2 cd/m²,因此对比度约为 1,600:1。它的色彩空间覆盖率也是可以接受的,因为它的 sRGB 覆盖率接近 100%,尽管它没有完全覆盖 AdobeRGB 和 DCI-P3。
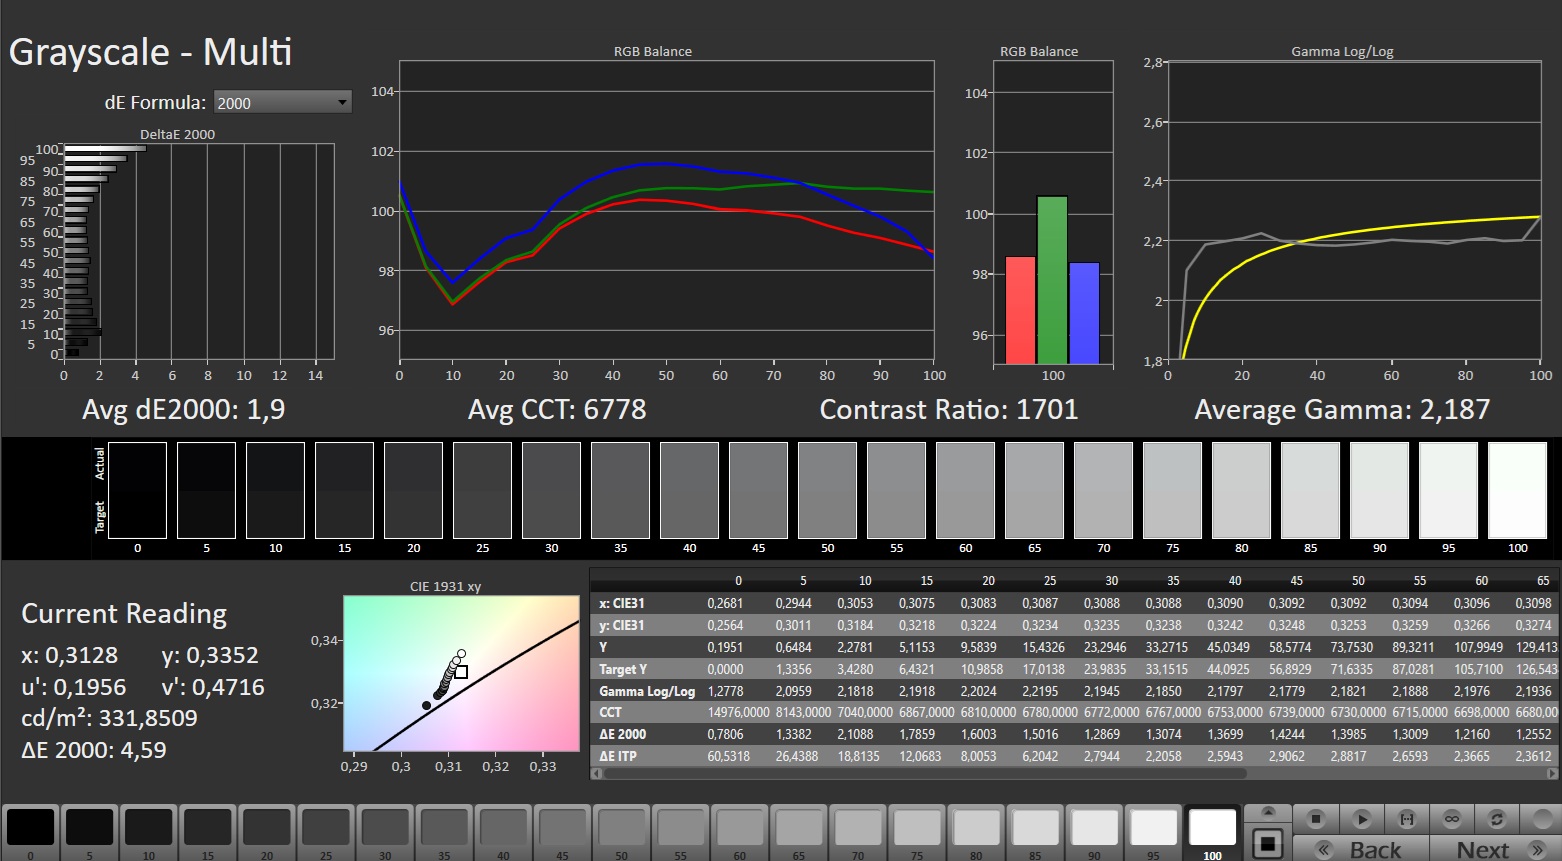
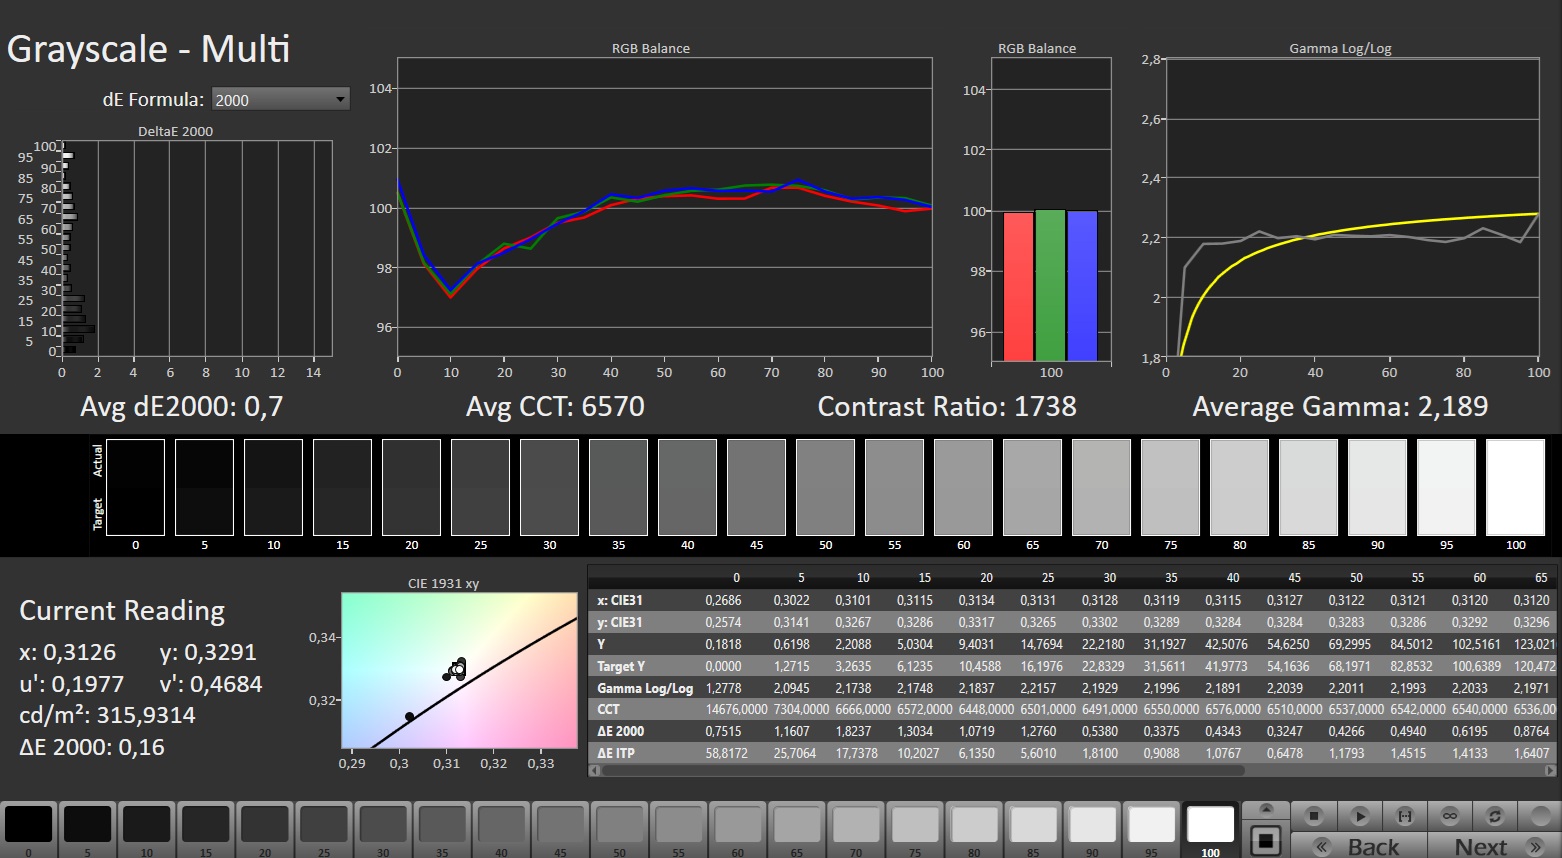
144 Hz 面板即使在交付状态下也能呈现令人印象深刻的色彩保真度,值得尊敬。
15 英寸屏幕在响应时间方面表现较差。在这方面,众多竞争对手的面板都遥遥领先(见表)。同时,它的可视角度符合通常的 IPS 标准。
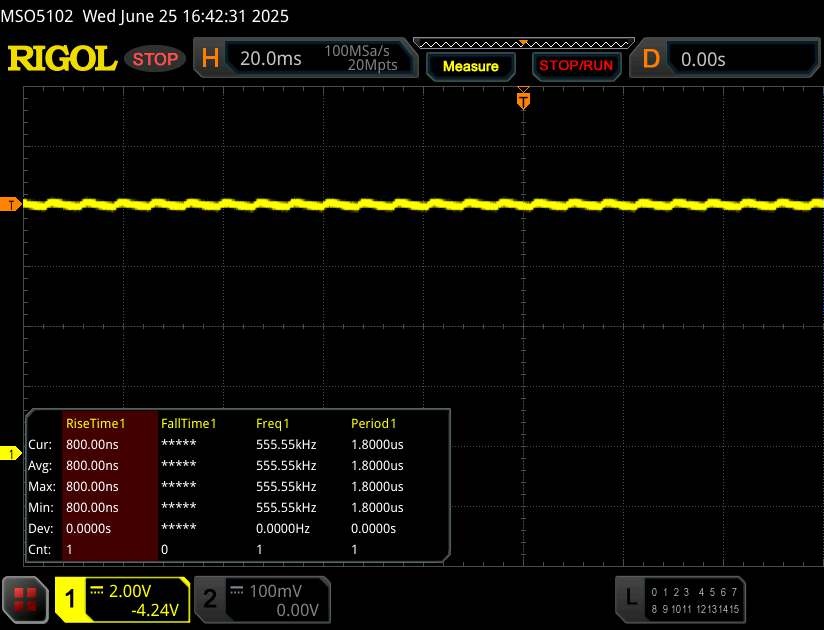
Display Response Times
| ↔ Response Time Black to White | ||
|---|---|---|
| 21.2 ms ... rise ↗ and fall ↘ combined | ↗ 10.2 ms rise | 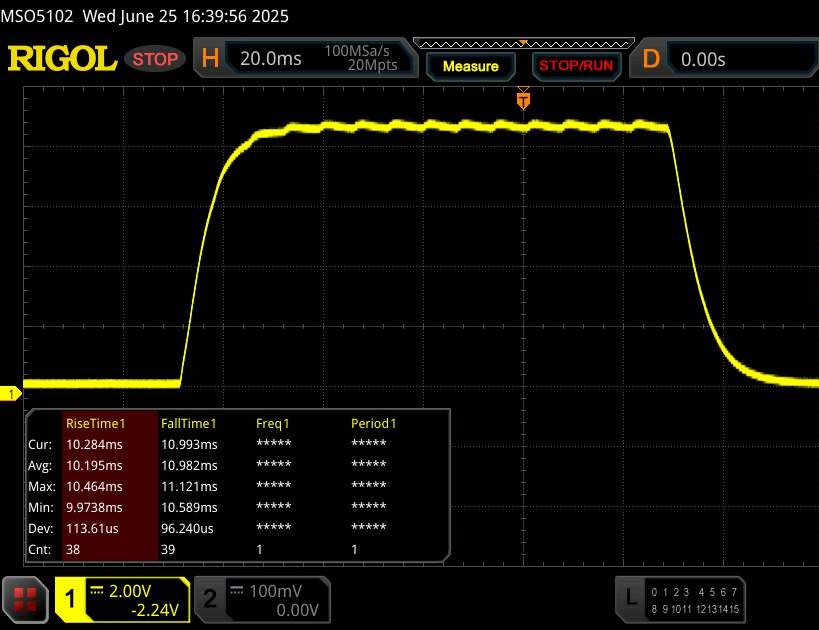 |
| ↘ 11 ms fall | ||
| The screen shows good response rates in our tests, but may be too slow for competitive gamers. In comparison, all tested devices range from 0.1 (minimum) to 240 (maximum) ms. » 47 % of all devices are better. This means that the measured response time is similar to the average of all tested devices (19.8 ms). | ||
| ↔ Response Time 50% Grey to 80% Grey | ||
| 33.9 ms ... rise ↗ and fall ↘ combined | ↗ 15.5 ms rise | 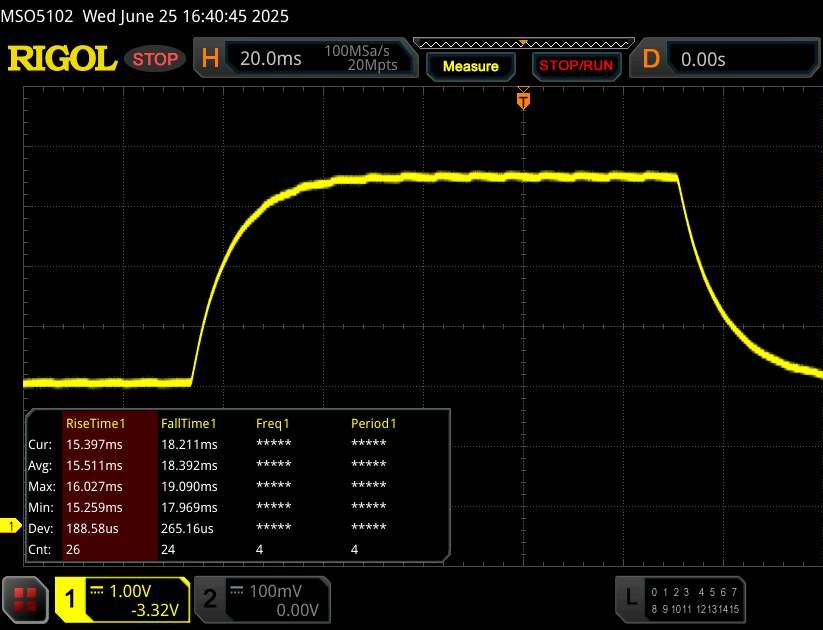 |
| ↘ 18.4 ms fall | ||
| The screen shows slow response rates in our tests and will be unsatisfactory for gamers. In comparison, all tested devices range from 0.165 (minimum) to 636 (maximum) ms. » 47 % of all devices are better. This means that the measured response time is similar to the average of all tested devices (31 ms). | ||
Screen Flickering / PWM (Pulse-Width Modulation)
| Screen flickering / PWM not detected |  | ||
In comparison: 52 % of all tested devices do not use PWM to dim the display. If PWM was detected, an average of 7778 (minimum: 5 - maximum: 343500) Hz was measured. | |||
性能
正如开头提到的,联想 LOQ 15 属于中端机型,无论其 CPU 是 AMD 还是英特尔。目前,16 GB 内存对于游戏来说应该还是足够的(不过出于性能考虑,我们建议采用双通道配置)。1 TB 的存储空间也是如此,除非你需要或想存储私人电影收藏之类的东西。
测试条件
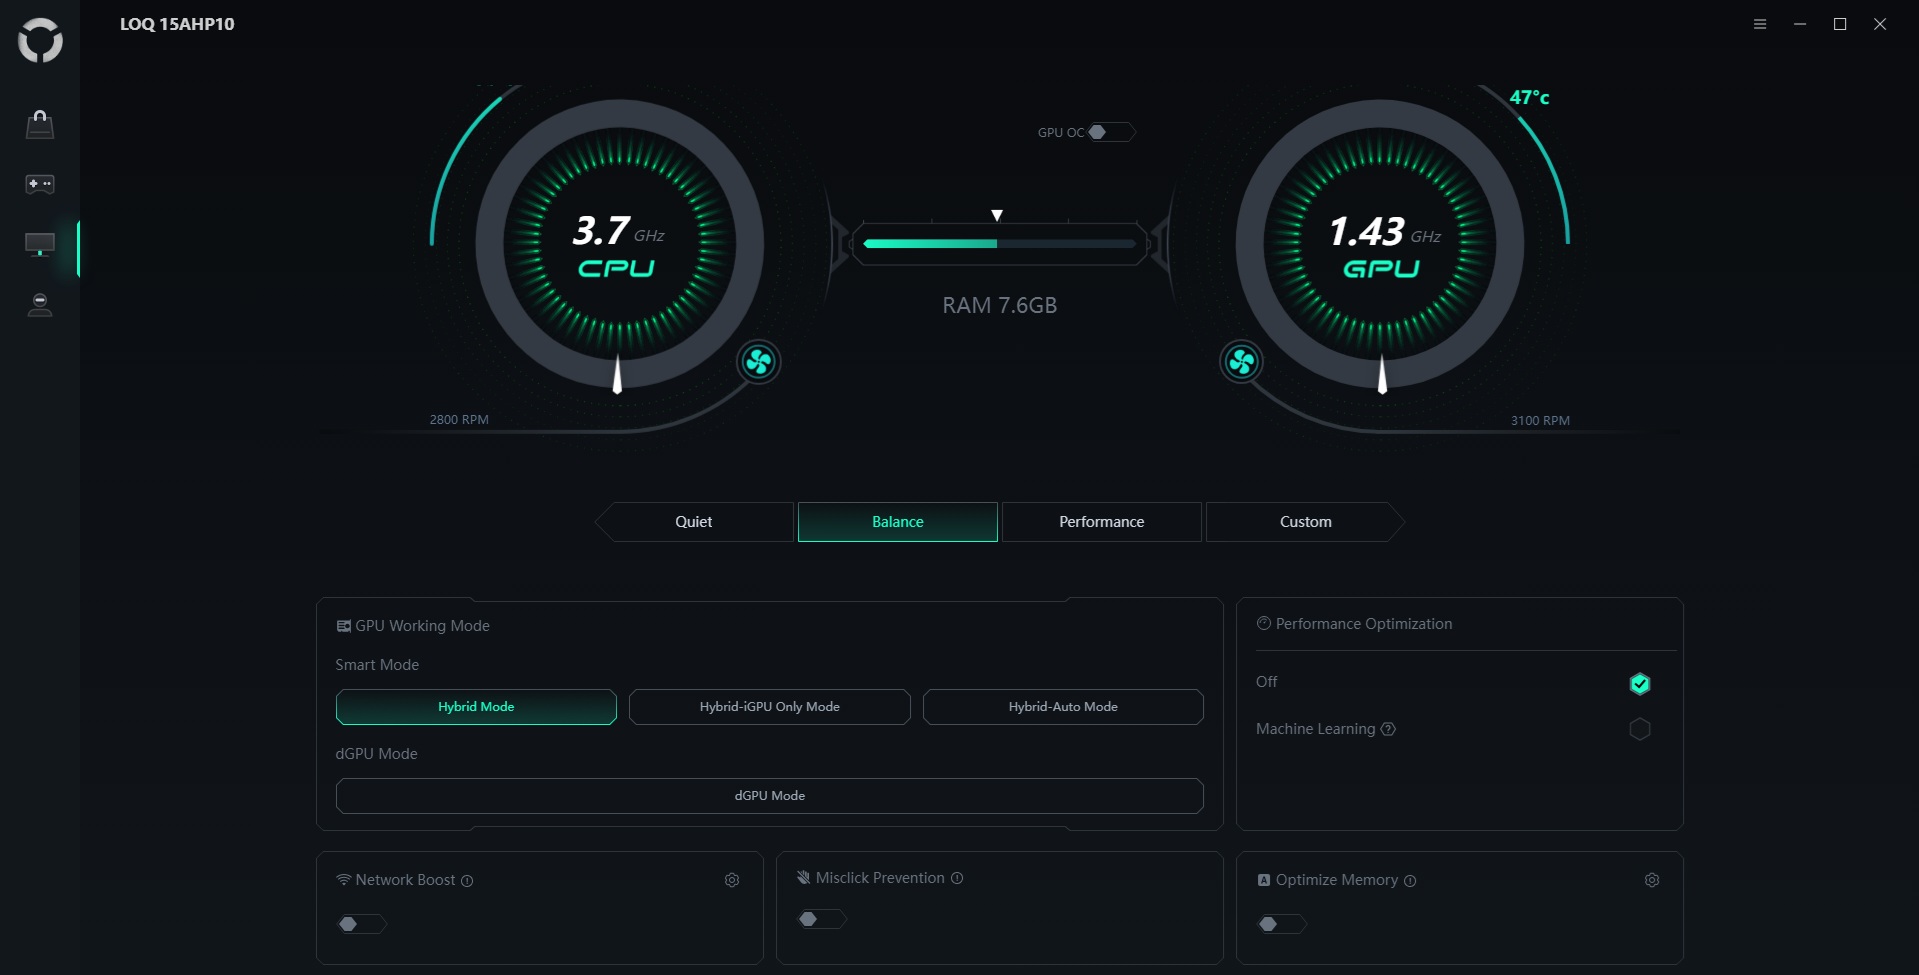
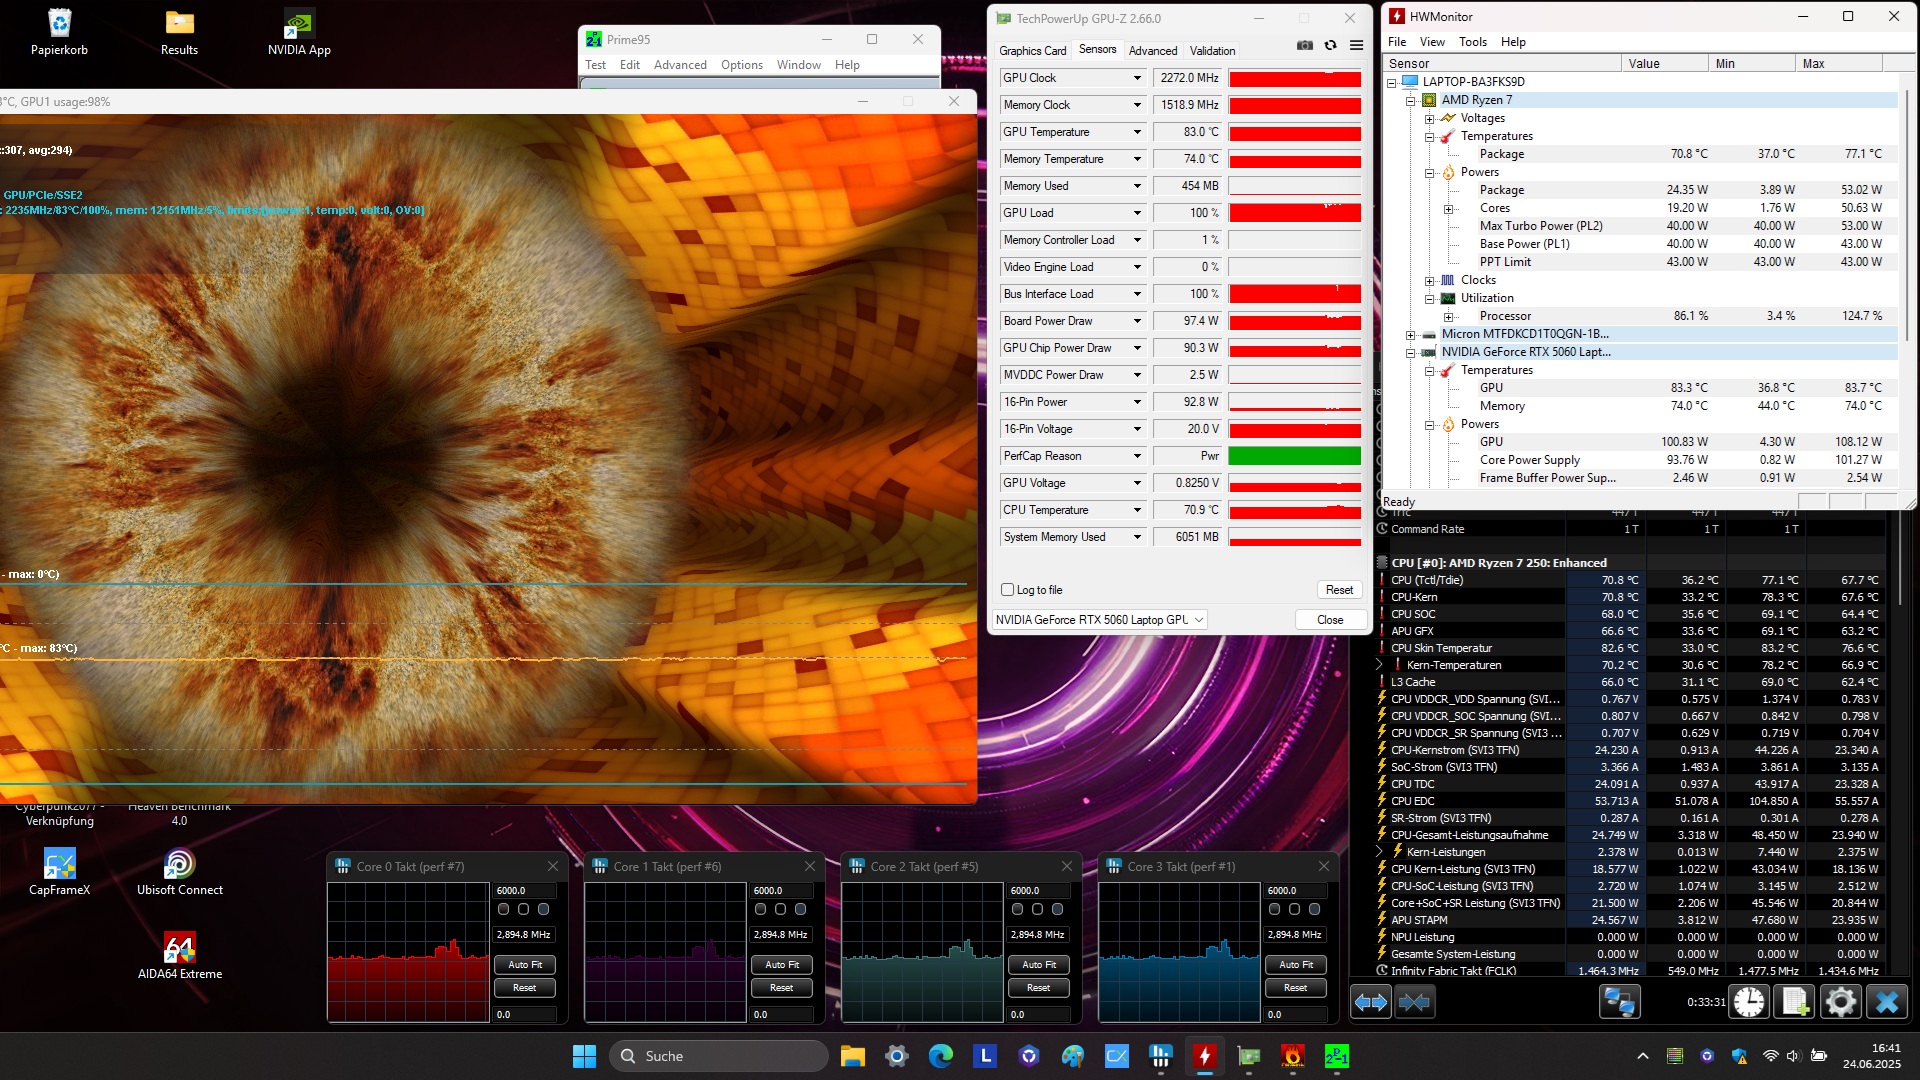
预装的Legion 软件在 "设备管理 "菜单中提供了大量有关 GPU 模式(混合、仅 iGPU、仅 dGPU)和一般系统模式的设置选项,下表显示了这些模式的不同之处。非常漂亮根据配置文件的不同,电源按钮的边框颜色也不同(蓝色 =安静,白色 =平衡,红色 =性能)。除电池测试外,我们在性能模式下进行了所有测量,该模式的 FPS 明显高于平衡模式,当然,这是以噪音为代价的。图形切换在每种情况下都处于激活状态。
| 模式 | 安静 | 平衡 | 性能 |
| 赛博朋克 2077 噪音 | 38 dB(A) | 45 dB(A) | 51 dB(A) |
| 赛博朋克 2077》性能(FHD/超高清) | 65.2fps | 74.6fps | 88.6fps |
| Cinebench R15 Multi 分数 | 2020 分 | 2379 分 | 2520 分 |
| CPU PL1 | 25 瓦 | 40 瓦 | 43 瓦 |
| CPU PL2 | 25 瓦 | 50 瓦 | 53 瓦 |
处理器
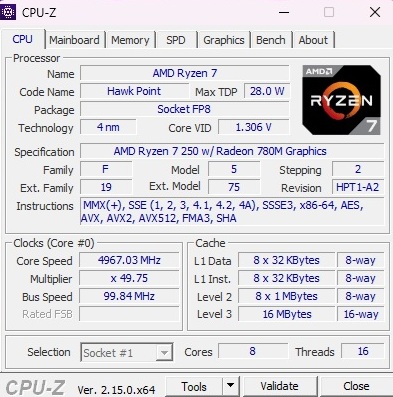
到目前为止,我们还没有测试过 Ryzen 7 250是基于 Zen 4 架构的鹰点一代八核型号。该芯片可通过 SMT 并行处理多达 16 个线程。更多规格请参见我们的 CPU 页面.在我们的基准测试过程中,R7 250 的性能表现尚可。其性能相对介于 酷睿 i5-13450HX和 酷睿 i7-14650HX.性能 Ryzen 7 260和 Ryzen AI 7 350总共只快了不到 10%。太棒了:在 Cinebench 循环过程中,它的性能保持稳定,因此没有下降。
Cinebench R15 Multi continuous test
| CPU Performance rating - Percent | |
| Average of class Gaming | |
| Lenovo Legion 5 15AHP G10 | |
| Gigabyte Aero X16 1WH | |
| MSI Katana 17 HX B14WGK | |
| Lenovo LOQ 15AHP10 | |
| Lenovo LOQ 15IRX9 | |
| Average AMD Ryzen 7 250 | |
* ... smaller is better
AIDA64: FP32 Ray-Trace | FPU Julia | CPU SHA3 | CPU Queen | FPU SinJulia | FPU Mandel | CPU AES | CPU ZLib | FP64 Ray-Trace | CPU PhotoWorxx
| Performance rating | |
| Average of class Gaming | |
| Lenovo Legion 5 15AHP G10 | |
| Gigabyte Aero X16 1WH | |
| Lenovo LOQ 15AHP10 | |
| Average AMD Ryzen 7 250 | |
| Lenovo LOQ 15IRX9 | |
| MSI Katana 17 HX B14WGK | |
| AIDA64 / FP32 Ray-Trace | |
| Average of class Gaming (10227 - 85542, n=109, last 2 years) | |
| Lenovo Legion 5 15AHP G10 | |
| Gigabyte Aero X16 1WH | |
| Lenovo LOQ 15AHP10 | |
| Average AMD Ryzen 7 250 (19614 - 24783, n=5) | |
| Lenovo LOQ 15IRX9 | |
| MSI Katana 17 HX B14WGK | |
| AIDA64 / FPU Julia | |
| Average of class Gaming (51376 - 238426, n=109, last 2 years) | |
| Lenovo Legion 5 15AHP G10 | |
| Gigabyte Aero X16 1WH | |
| Lenovo LOQ 15AHP10 | |
| Average AMD Ryzen 7 250 (79019 - 98709, n=5) | |
| Lenovo LOQ 15IRX9 | |
| MSI Katana 17 HX B14WGK | |
| AIDA64 / CPU SHA3 | |
| Average of class Gaming (2180 - 9817, n=109, last 2 years) | |
| Lenovo Legion 5 15AHP G10 | |
| Lenovo LOQ 15AHP10 | |
| Gigabyte Aero X16 1WH | |
| Average AMD Ryzen 7 250 (3817 - 4563, n=5) | |
| Lenovo LOQ 15IRX9 | |
| MSI Katana 17 HX B14WGK | |
| AIDA64 / CPU Queen | |
| Lenovo Legion 5 15AHP G10 | |
| Average of class Gaming (49785 - 173351, n=98, last 2 years) | |
| Lenovo LOQ 15AHP10 | |
| Average AMD Ryzen 7 250 (97511 - 114915, n=4) | |
| MSI Katana 17 HX B14WGK | |
| Lenovo LOQ 15IRX9 | |
| Gigabyte Aero X16 1WH | |
| AIDA64 / FPU SinJulia | |
| Lenovo Legion 5 15AHP G10 | |
| Lenovo LOQ 15AHP10 | |
| Average of class Gaming (4424 - 33636, n=109, last 2 years) | |
| Average AMD Ryzen 7 250 (12847 - 14798, n=5) | |
| Gigabyte Aero X16 1WH | |
| Lenovo LOQ 15IRX9 | |
| MSI Katana 17 HX B14WGK | |
| AIDA64 / FPU Mandel | |
| Average of class Gaming (25115 - 128721, n=109, last 2 years) | |
| Lenovo Legion 5 15AHP G10 | |
| Gigabyte Aero X16 1WH | |
| Lenovo LOQ 15AHP10 | |
| Average AMD Ryzen 7 250 (42572 - 53836, n=5) | |
| Lenovo LOQ 15IRX9 | |
| MSI Katana 17 HX B14WGK | |
| AIDA64 / CPU AES | |
| Average of class Gaming (39258 - 247074, n=109, last 2 years) | |
| Gigabyte Aero X16 1WH | |
| Average AMD Ryzen 7 250 (68090 - 85430, n=5) | |
| Lenovo LOQ 15IRX9 | |
| Lenovo Legion 5 15AHP G10 | |
| Lenovo LOQ 15AHP10 | |
| MSI Katana 17 HX B14WGK | |
| AIDA64 / CPU ZLib | |
| Average of class Gaming (574 - 2531, n=109, last 2 years) | |
| Gigabyte Aero X16 1WH | |
| Lenovo Legion 5 15AHP G10 | |
| Lenovo LOQ 15AHP10 | |
| Lenovo LOQ 15IRX9 | |
| Average AMD Ryzen 7 250 (850 - 1074, n=5) | |
| MSI Katana 17 HX B14WGK | |
| AIDA64 / FP64 Ray-Trace | |
| Average of class Gaming (5509 - 45446, n=109, last 2 years) | |
| Lenovo Legion 5 15AHP G10 | |
| Gigabyte Aero X16 1WH | |
| Lenovo LOQ 15AHP10 | |
| Average AMD Ryzen 7 250 (10504 - 13039, n=5) | |
| Lenovo LOQ 15IRX9 | |
| MSI Katana 17 HX B14WGK | |
| AIDA64 / CPU PhotoWorxx | |
| Gigabyte Aero X16 1WH | |
| Average of class Gaming (12271 - 89891, n=109, last 2 years) | |
| Lenovo Legion 5 15AHP G10 | |
| Lenovo LOQ 15IRX9 | |
| MSI Katana 17 HX B14WGK | |
| Average AMD Ryzen 7 250 (22645 - 40403, n=5) | |
| Lenovo LOQ 15AHP10 | |
系统性能
此外,其系统性能也符合预期,至少没有任何意外,LOQ 15 的性能与其前身非常相似。
PCMark 10: Score | Essentials | Productivity | Digital Content Creation
CrossMark: Overall | Productivity | Creativity | Responsiveness
WebXPRT 3: Overall
WebXPRT 4: Overall
Mozilla Kraken 1.1: Total
| Performance rating | |
| Average of class Gaming | |
| Lenovo Legion 5 15AHP G10 | |
| Gigabyte Aero X16 1WH | |
| MSI Katana 17 HX B14WGK | |
| Average AMD Ryzen 7 250, NVIDIA GeForce RTX 5060 Laptop | |
| Lenovo LOQ 15IRX9 | |
| Lenovo LOQ 15AHP10 -2! | |
| PCMark 10 / Score | |
| Average of class Gaming (5828 - 11574, n=96, last 2 years) | |
| Lenovo Legion 5 15AHP G10 | |
| Gigabyte Aero X16 1WH | |
| Average AMD Ryzen 7 250, NVIDIA GeForce RTX 5060 Laptop (7304 - 8136, n=2) | |
| Lenovo LOQ 15AHP10 | |
| Lenovo LOQ 15IRX9 | |
| MSI Katana 17 HX B14WGK | |
| PCMark 10 / Essentials | |
| Lenovo Legion 5 15AHP G10 | |
| Average of class Gaming (8810 - 12600, n=100, last 2 years) | |
| Gigabyte Aero X16 1WH | |
| Lenovo LOQ 15AHP10 | |
| MSI Katana 17 HX B14WGK | |
| Average AMD Ryzen 7 250, NVIDIA GeForce RTX 5060 Laptop (9343 - 10292, n=2) | |
| Lenovo LOQ 15IRX9 | |
| PCMark 10 / Productivity | |
| Average AMD Ryzen 7 250, NVIDIA GeForce RTX 5060 Laptop (9226 - 14114, n=2) | |
| Average of class Gaming (6845 - 21327, n=98, last 2 years) | |
| Gigabyte Aero X16 1WH | |
| Lenovo Legion 5 15AHP G10 | |
| Lenovo LOQ 15AHP10 | |
| Lenovo LOQ 15IRX9 | |
| MSI Katana 17 HX B14WGK | |
| PCMark 10 / Digital Content Creation | |
| Average of class Gaming (7602 - 19657, n=98, last 2 years) | |
| Lenovo Legion 5 15AHP G10 | |
| Gigabyte Aero X16 1WH | |
| MSI Katana 17 HX B14WGK | |
| Lenovo LOQ 15AHP10 | |
| Average AMD Ryzen 7 250, NVIDIA GeForce RTX 5060 Laptop (11083 - 11137, n=2) | |
| Lenovo LOQ 15IRX9 | |
| CrossMark / Overall | |
| Average of class Gaming (1366 - 2409, n=97, last 2 years) | |
| MSI Katana 17 HX B14WGK | |
| Lenovo LOQ 15IRX9 | |
| Lenovo Legion 5 15AHP G10 | |
| Gigabyte Aero X16 1WH | |
| Lenovo LOQ 15AHP10 | |
| Average AMD Ryzen 7 250, NVIDIA GeForce RTX 5060 Laptop (n=1) | |
| CrossMark / Productivity | |
| MSI Katana 17 HX B14WGK | |
| Average of class Gaming (1386 - 2254, n=97, last 2 years) | |
| Lenovo LOQ 15AHP10 | |
| Average AMD Ryzen 7 250, NVIDIA GeForce RTX 5060 Laptop (n=1) | |
| Lenovo LOQ 15IRX9 | |
| Lenovo Legion 5 15AHP G10 | |
| Gigabyte Aero X16 1WH | |
| CrossMark / Creativity | |
| Average of class Gaming (1343 - 2729, n=97, last 2 years) | |
| MSI Katana 17 HX B14WGK | |
| Gigabyte Aero X16 1WH | |
| Lenovo Legion 5 15AHP G10 | |
| Lenovo LOQ 15IRX9 | |
| Lenovo LOQ 15AHP10 | |
| Average AMD Ryzen 7 250, NVIDIA GeForce RTX 5060 Laptop (n=1) | |
| CrossMark / Responsiveness | |
| MSI Katana 17 HX B14WGK | |
| Lenovo LOQ 15IRX9 | |
| Average of class Gaming (1226 - 2334, n=97, last 2 years) | |
| Lenovo LOQ 15AHP10 | |
| Average AMD Ryzen 7 250, NVIDIA GeForce RTX 5060 Laptop (n=1) | |
| Lenovo Legion 5 15AHP G10 | |
| Gigabyte Aero X16 1WH | |
| WebXPRT 3 / Overall | |
| Gigabyte Aero X16 1WH | |
| Average of class Gaming (242 - 532, n=101, last 2 years) | |
| Lenovo Legion 5 15AHP G10 | |
| MSI Katana 17 HX B14WGK | |
| Average AMD Ryzen 7 250, NVIDIA GeForce RTX 5060 Laptop (n=1) | |
| Lenovo LOQ 15IRX9 | |
| WebXPRT 4 / Overall | |
| Average of class Gaming (176.4 - 354, n=101, last 2 years) | |
| Gigabyte Aero X16 1WH | |
| MSI Katana 17 HX B14WGK | |
| Lenovo Legion 5 15AHP G10 | |
| Lenovo LOQ 15IRX9 | |
| Average AMD Ryzen 7 250, NVIDIA GeForce RTX 5060 Laptop (n=1) | |
| Mozilla Kraken 1.1 / Total | |
| Lenovo LOQ 15IRX9 | |
| Average AMD Ryzen 7 250, NVIDIA GeForce RTX 5060 Laptop (534 - 551, n=2) | |
| Lenovo LOQ 15AHP10 | |
| Lenovo Legion 5 15AHP G10 | |
| MSI Katana 17 HX B14WGK | |
| Average of class Gaming (391 - 590, n=106, last 2 years) | |
| Gigabyte Aero X16 1WH | |
* ... smaller is better
| PCMark 10 Score | 7304 points | |
Help | ||
| AIDA64 / Memory Copy | |
| Gigabyte Aero X16 1WH | |
| Average of class Gaming (21750 - 129946, n=109, last 2 years) | |
| Lenovo Legion 5 15AHP G10 | |
| MSI Katana 17 HX B14WGK | |
| Lenovo LOQ 15IRX9 | |
| Average AMD Ryzen 7 250 (35172 - 68811, n=5) | |
| Lenovo LOQ 15AHP10 | |
| AIDA64 / Memory Read | |
| Average of class Gaming (22956 - 118858, n=109, last 2 years) | |
| MSI Katana 17 HX B14WGK | |
| Lenovo LOQ 15IRX9 | |
| Gigabyte Aero X16 1WH | |
| Lenovo Legion 5 15AHP G10 | |
| Average AMD Ryzen 7 250 (29534 - 60683, n=5) | |
| Lenovo LOQ 15AHP10 | |
| AIDA64 / Memory Write | |
| Lenovo Legion 5 15AHP G10 | |
| Gigabyte Aero X16 1WH | |
| Average of class Gaming (22297 - 135096, n=109, last 2 years) | |
| Lenovo LOQ 15IRX9 | |
| MSI Katana 17 HX B14WGK | |
| Average AMD Ryzen 7 250 (40057 - 86628, n=5) | |
| Lenovo LOQ 15AHP10 | |
| AIDA64 / Memory Latency | |
| Average of class Gaming (75.3 - 259, n=109, last 2 years) | |
| Lenovo LOQ 15AHP10 | |
| Average AMD Ryzen 7 250 (94.1 - 103, n=5) | |
| Gigabyte Aero X16 1WH | |
| MSI Katana 17 HX B14WGK | |
| Lenovo LOQ 15IRX9 | |
| Lenovo Legion 5 15AHP G10 | |
* ... smaller is better
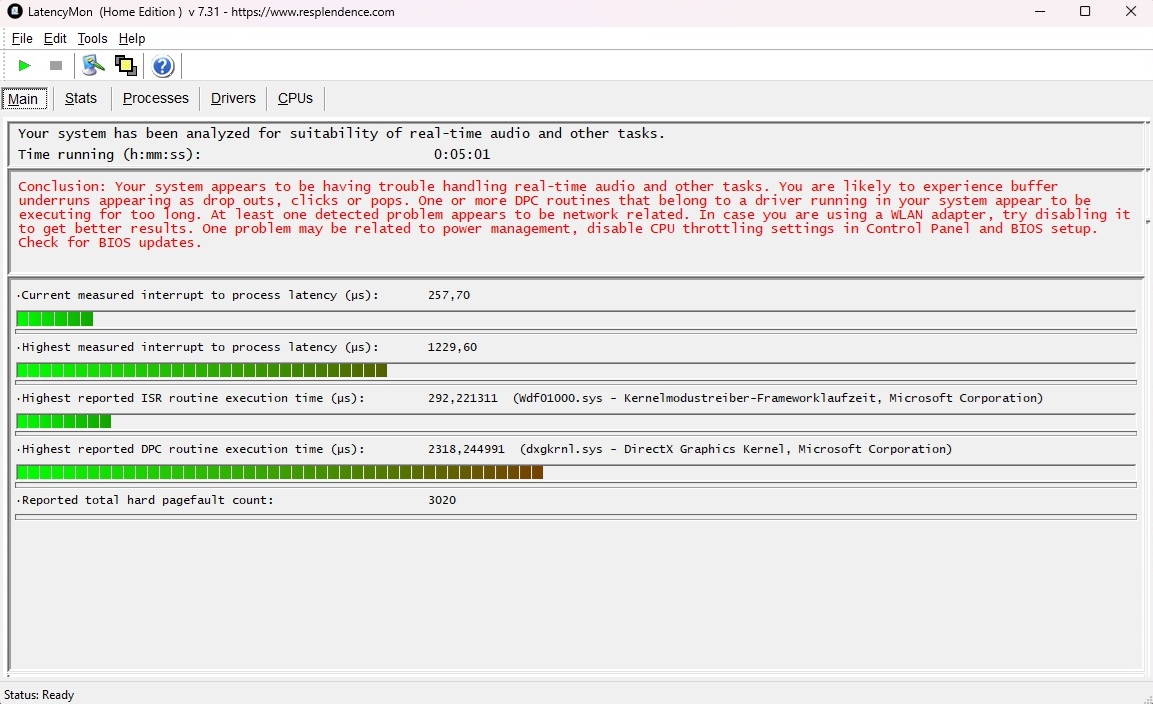
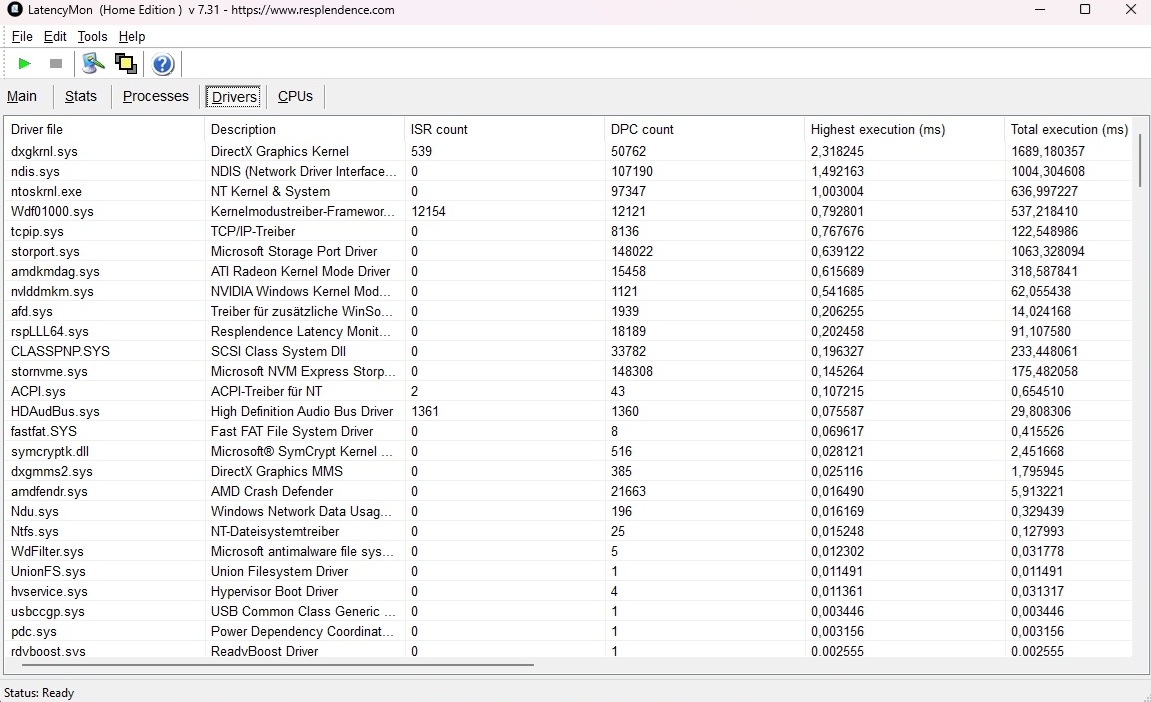
DPC 延迟
虽然它的延迟时间是测试领域最低的,但 LatencyMon 工具揭示了音频和视频实时处理方面可能存在的一些限制或问题。
| DPC Latencies / LatencyMon - interrupt to process latency (max), Web, Youtube, Prime95 | |
| MSI Katana 17 HX B14WGK | |
| Lenovo Legion 5 15AHP G10 | |
| Gigabyte Aero X16 1WH | |
| Lenovo LOQ 15IRX9 | |
| Lenovo LOQ 15AHP10 | |
* ... smaller is better
存储设备
乍一看,安装的美光 1 TB 硬盘(型号 2500)表现令人信服。从顺序上看,它与 Katana 17 和Legion 5 都是速度最快的对比设备之一。不过,正如我们的 DiskSpd 循环所显示的,它的速度随着时间的推移波动很大,就像它的前代产品一样。另一方面,用户可以使用第二个 M.2 插槽进行升级,这一点非常好。

| Drive Performance rating - Percent | |
| Lenovo Legion 5 15AHP G10 | |
| MSI Katana 17 HX B14WGK | |
| Lenovo LOQ 15AHP10 | |
| Gigabyte Aero X16 1WH | |
| Average of class Gaming | |
| Average Micron 2500 1TB MTFDKBA1T0QGN | |
| Lenovo LOQ 15IRX9 | |
* ... smaller is better
Reading continuous performance: DiskSpd Read Loop, Queue Depth 8
图形处理器性能
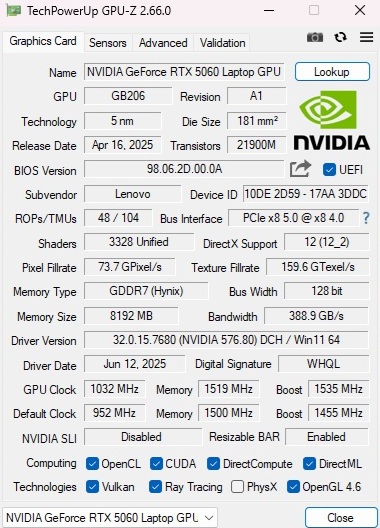
移动 GeForce RTX 5060是 Nvidia 当前 Blackwell 系列中价格相对较低的型号。与移动 RTX 5070相比,它只包含 3328 个着色器单元,而不是 4608 个,但也可以依靠通过 128 位连接的 8 GB GDDR7 内存。联想使用了 115 瓦的最大指定 TGP(包括 Dynamic Boost)。根据合成基准测试,尽管着色器数量较少,但 RTX 5060 与 RTX 5070 大致相当。它的性能超过了 RTX 4060在我们的测试中,它的整体性能比旧版 LOQ 15 的 RTX 4060 高出约 23%。更多基准测试和信息,请访问我们的 GPU 页面.
| 3DMark 06 Standard Score | 54494 points | |
| 3DMark Vantage P Result | 81794 points | |
| 3DMark 11 Performance | 31563 points | |
| 3DMark Ice Storm Standard Score | 177944 points | |
| 3DMark Cloud Gate Standard Score | 53299 points | |
| 3DMark Fire Strike Score | 27579 points | |
| 3DMark Time Spy Score | 11594 points | |
Help | ||
* ... smaller is better
游戏性能
在游戏测试中,RTX 5070 的全高清性能也大致相当。根据我们的性能评级,相应的笔记本电脑仅略胜一筹,而旧版 RTX 4060--令人失望的是 RTX 5060--仅领先约 10%(尽管这在一定程度上可能与 CPU 和内存配置有关)。
在 QHD 游戏中,差距如期拉大,不过应该说,RTX 5060(至少在最高设置和不升频的情况下)在这种情况下往往不再能突破 40fps 大关,所以你必须依靠使用 DLSS 或(多)帧生成。尤其是 VRAM 较高的游戏,如 夺宝奇兵等 VRAM 较高的游戏表明,8GB 内存已接近极限,尤其是在未来,可能会经常出现问题。因此,热衷于游戏的玩家应该选择至少 12GB 或 16GB 的 GPU,尽管购买者需要为此支付高昂的费用。
| Cyberpunk 2077 - 1920x1080 Ultra Preset (FSR off) | |
| Average of class Gaming (17.7 - 169.9, n=120, last 2 years) | |
| MSI Katana 17 HX B14WGK | |
| Lenovo Legion 5 15AHP G10 | |
| Gigabyte Aero X16 1WH | |
| Lenovo LOQ 15AHP10 | |
| Average NVIDIA GeForce RTX 5060 Laptop (68.1 - 94.9, n=19) | |
| Lenovo LOQ 15IRX9 | |
| Baldur's Gate 3 - 1920x1080 Ultra Preset AA:T | |
| Average of class Gaming (59.4 - 246, n=107, last 2 years) | |
| Lenovo Legion 5 15AHP G10 | |
| Gigabyte Aero X16 1WH | |
| Average NVIDIA GeForce RTX 5060 Laptop (78.1 - 117.8, n=18) | |
| MSI Katana 17 HX B14WGK | |
| Lenovo LOQ 15AHP10 | |
| Final Fantasy XV Benchmark - 1920x1080 High Quality | |
| Average of class Gaming (41 - 215, n=102, last 2 years) | |
| Lenovo Legion 5 15AHP G10 | |
| Gigabyte Aero X16 1WH | |
| Average NVIDIA GeForce RTX 5060 Laptop (107 - 133.6, n=13) | |
| Lenovo LOQ 15AHP10 | |
| Lenovo LOQ 15IRX9 | |
| Strange Brigade - 1920x1080 ultra AA:ultra AF:16 | |
| Average of class Gaming (76.3 - 456, n=92, last 2 years) | |
| Lenovo Legion 5 15AHP G10 | |
| Gigabyte Aero X16 1WH | |
| Lenovo LOQ 15AHP10 | |
| Average NVIDIA GeForce RTX 5060 Laptop (191.1 - 240, n=12) | |
| Lenovo LOQ 15IRX9 | |
| Stalker 2 | |
| 2560x1440 Epic Preset | |
| Average of class Gaming (29 - 110.7, n=13, last 2 years) | |
| MSI Katana 17 HX B14WGK | |
| Average NVIDIA GeForce RTX 5060 Laptop (31.8 - 32.4, n=2) | |
| Lenovo LOQ 15AHP10 | |
| 2560x1440 Epic Preset + Quality DLSS + FG | |
| Average of class Gaming (58.3 - 134.6, n=12, last 2 years) | |
| MSI Katana 17 HX B14WGK | |
| Average NVIDIA GeForce RTX 5060 Laptop (62.8 - 70.1, n=2) | |
| Lenovo LOQ 15AHP10 | |
| Doom: The Dark Ages | |
| 2560x1440 Ultra Nightmare AA:T | |
| Average of class Gaming (30.4 - 92.2, n=19, last 2 years) | |
| MSI Katana 17 HX B14WGK | |
| Lenovo LOQ 15AHP10 | |
| Average NVIDIA GeForce RTX 5060 Laptop (30.4 - 38.2, n=3) | |
| 2560x1440 Ultra Nightmare - DLSS Quality | |
| Average of class Gaming (48 - 107.3, n=18, last 2 years) | |
| MSI Katana 17 HX B14WGK | |
| Lenovo LOQ 15AHP10 | |
| Average NVIDIA GeForce RTX 5060 Laptop (48 - 55.1, n=3) | |
| Assassin's Creed Shadows | |
| 2560x1440 Ultra High | |
| Average of class Gaming (22 - 64, n=48, last 2 years) | |
| Gigabyte Aero X16 1WH | |
| Average NVIDIA GeForce RTX 5060 Laptop (25 - 34, n=6) | |
| Lenovo Legion 5 15AHP G10 | |
| Lenovo LOQ 15AHP10 | |
| 2560x1440 Ultra High + DLSS Quality | |
| Average of class Gaming (24 - 117, n=31, last 2 years) | |
| Gigabyte Aero X16 1WH | |
| Lenovo LOQ 15AHP10 | |
| Average NVIDIA GeForce RTX 5060 Laptop (24 - 41, n=3) | |
| Kingdom Come Deliverance 2 | |
| 2560x1440 Ultra Preset | |
| Average of class Gaming (36.8 - 97.2, n=13, last 2 years) | |
| Lenovo LOQ 15AHP10 | |
| MSI Katana 17 HX B14WGK | |
| Average NVIDIA GeForce RTX 5060 Laptop (43.6 - 45.6, n=2) | |
| 2560x1440 Ultra Preset + Quality DLSS | |
| Average of class Gaming (50.3 - 115.5, n=13, last 2 years) | |
| MSI Katana 17 HX B14WGK | |
| Lenovo LOQ 15AHP10 | |
| Average NVIDIA GeForce RTX 5060 Laptop (57.4 - 57.6, n=2) | |
| Indiana Jones and the Great Circle | |
| 2560x1440 Very Ultra Preset | |
| Average of class Gaming (4.2 - 121.9, n=33, last 2 years) | |
| MSI Katana 17 HX B14WGK | |
| Lenovo LOQ 15AHP10 | |
| Average NVIDIA GeForce RTX 5060 Laptop (4.2 - 10.1, n=3) | |
| 2560x1440 Very Ultra Preset - DLSS Quality | |
| Average of class Gaming (76.2 - 141.4, n=16, last 2 years) | |
| Lenovo LOQ 15AHP10 | |
| F1 25 | |
| 2560x1440 Ultra Max Preset AA:T AF:16x | |
| Average of class Gaming (5 - 37.5, n=24, last 2 years) | |
| Lenovo LOQ 15AHP10 | |
| Average NVIDIA GeForce RTX 5060 Laptop (9.33 - 13, n=5) | |
| Lenovo Legion 5 15AHP G10 | |
| 2560x1440 Ultra Max Preset + DLSS Quality AA:DLSS AF:16x | |
| Average of class Gaming (9 - 67.5, n=22, last 2 years) | |
| Average NVIDIA GeForce RTX 5060 Laptop (18.3 - 26.5, n=5) | |
| Lenovo LOQ 15AHP10 | |
| Lenovo Legion 5 15AHP G10 | |
在使用 赛博朋克 2077.在整个测试过程中,我们注意到帧速率相当稳定。
Cyberpunk 2077 ultra FPS diagram
| low | med. | high | ultra | QHD DLSS | QHD | |
|---|---|---|---|---|---|---|
| GTA V (2015) | 171.7 | 160.3 | 108.7 | 100.9 | ||
| Dota 2 Reborn (2015) | 142.6 | 129.3 | 125.7 | 121.5 | ||
| Final Fantasy XV Benchmark (2018) | 153.9 | 118.1 | 87 | |||
| X-Plane 11.11 (2018) | 99.8 | 87 | 72.1 | |||
| Strange Brigade (2018) | 286 | 248 | 223 | 157.8 | ||
| Baldur's Gate 3 (2023) | 124.3 | 105.7 | 101 | 105.9 | 71.8 | |
| Cyberpunk 2077 (2023) | 112 | 95.6 | 88.6 | 71.7 | 55.4 | |
| Horizon Forbidden West (2024) | 93.8 | 58.8 | 52.9 | 59.9 | 48.1 | |
| Ghost of Tsushima (2024) | 78.7 | 73.1 | 59 | 60.2 | 46.3 | |
| Senua's Saga Hellblade 2 (2024) | 55.8 | 40.8 | 44 | 29 | ||
| F1 24 (2024) | 219 | 195 | 71 | 65 | 39 | |
| Star Wars Outlaws (2024) | 46.5 | 43.6 | 38.1 | 38.6 | 27.6 | |
| Space Marine 2 (2024) | 66 | 65.7 | 65.2 | 62.8 | 55.6 | |
| Until Dawn (2024) | 83.8 | 65.9 | 49.3 | 46.4 | 35.2 | |
| Stalker 2 (2024) | 54.3 | 48.5 | 42 | 62.8 | 31.8 | |
| Indiana Jones and the Great Circle (2024) | 68.1 | 15.6 | 0 () | 9.43 | ||
| Kingdom Come Deliverance 2 (2025) | 102.8 | 85.9 | 61.1 | 57.6 | 45.6 | |
| Civilization 7 (2025) | 163.1 | 148.6 | 96 | |||
| Assassin's Creed Shadows (2025) | 56 | 46 | 33 | 33 | 25 | |
| The Elder Scrolls IV Oblivion Remastered (2025) | 66.9 | 48.2 | 26.5 | 25.3 | 12.7 | |
| Doom: The Dark Ages (2025) | 63.2 | 57.8 | 57.3 | 55.1 | 35 | |
| F1 25 (2025) | 152 | 146 | 24 | 21 | 13 |
排放量
噪音排放
LOQ 15 的问题之一是性能模式下的风扇控制不佳(平衡模式下几乎不存在以下问题)。即使在笔记本无事可做的情况下,它的两个机箱风扇也能咆哮到 43 到 48 dB(A)--一些竞争对手只有在(满载)的情况下才能达到这个水平。联想肯定要在这方面下点功夫(也许目前这 "只是 "一个 bug)。在 3D 模式(赛博朋克 2077和压力测试)下,我们的测量设备测得的噪音为 51 至 53 dB(A),略高于竞争对手。
Noise level
| Idle |
| 43 / 45 / 48 dB(A) |
| Load |
| 53 / 53 dB(A) |
 | ||
30 dB silent 40 dB(A) audible 50 dB(A) loud |
||
min: | ||
| Lenovo LOQ 15AHP10 R7 250, GeForce RTX 5060 Laptop | Lenovo LOQ 15IRX9 i5-13450HX, GeForce RTX 4060 Laptop GPU | Lenovo Legion 5 15AHP G10 R7 260, GeForce RTX 5060 Laptop | Gigabyte Aero X16 1WH Ryzen AI 7 350, GeForce RTX 5070 Laptop | MSI Katana 17 HX B14WGK i7-14650HX, GeForce RTX 5070 Laptop | |
|---|---|---|---|---|---|
| Noise | 16% | 24% | 27% | 10% | |
| off / environment * (dB) | 25 | 25 -0% | 25.5 -2% | 23.9 4% | 25 -0% |
| Idle Minimum * (dB) | 43 | 26 40% | 25.5 41% | 23.9 44% | 31 28% |
| Idle Average * (dB) | 45 | 34 24% | 25.5 43% | 23.9 47% | 32 29% |
| Idle Maximum * (dB) | 48 | 36 25% | 26.9 44% | 23.9 50% | 34 29% |
| Load Average * (dB) | 53 | 48 9% | 34.6 35% | 33.2 37% | 50 6% |
| Cyberpunk 2077 ultra * (dB) | 51 | 48 6% | 50.1 2% | 50.2 2% | 58 -14% |
| Load Maximum * (dB) | 53 | 50 6% | 50.1 5% | 50.2 5% | 59 -11% |
* ... smaller is better
温度
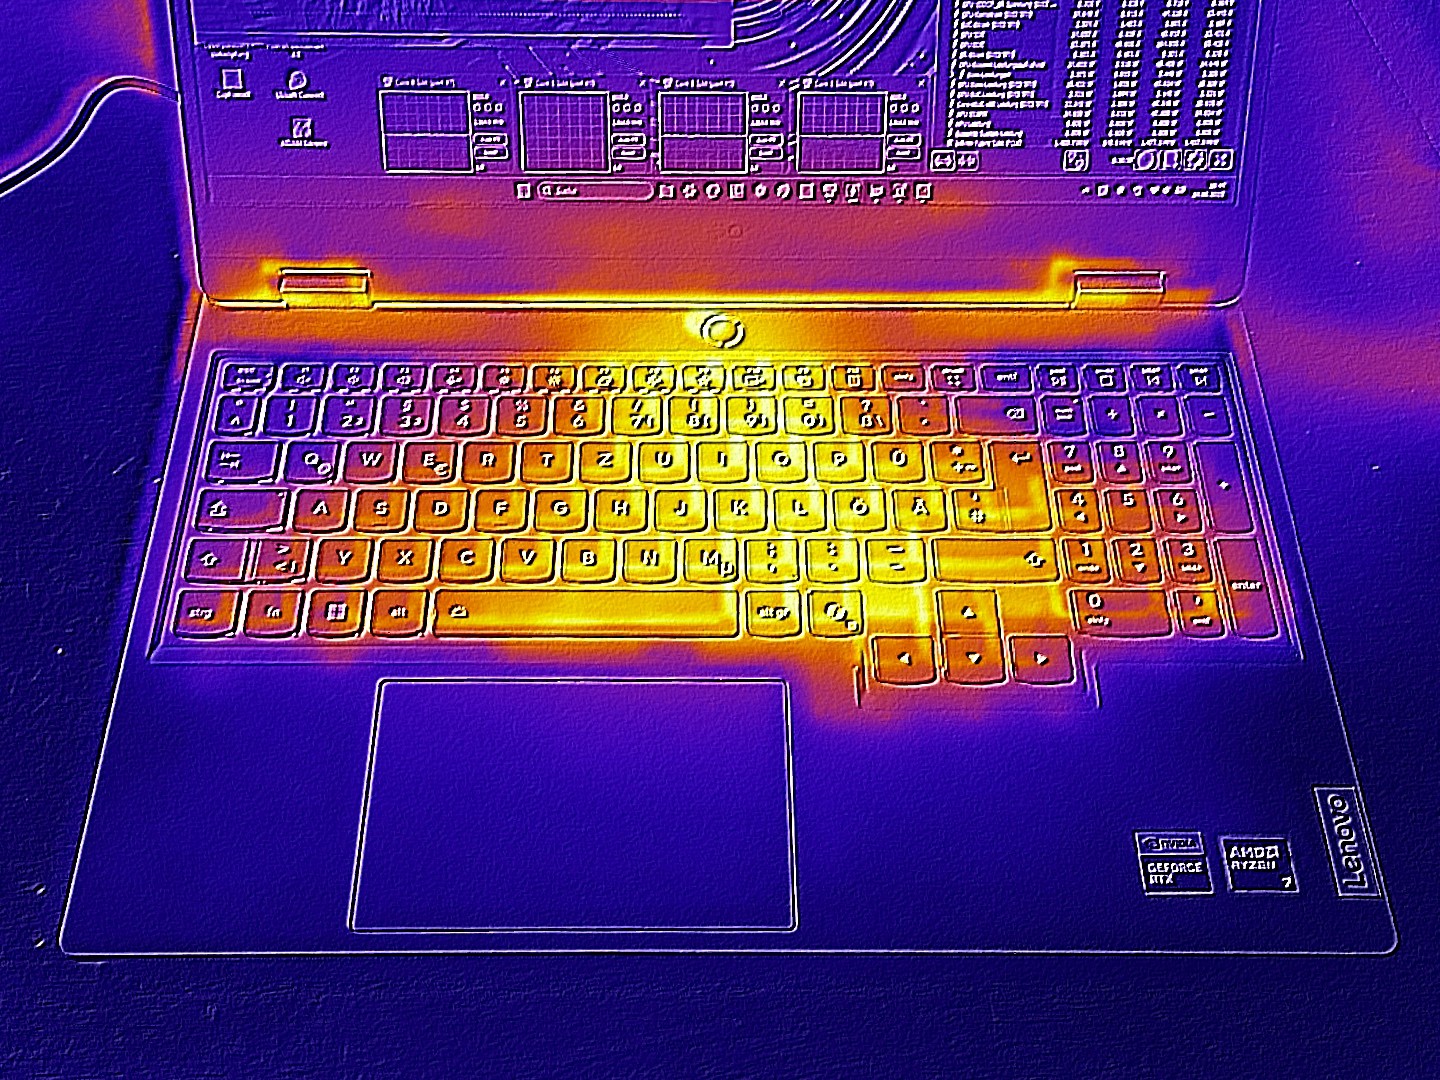
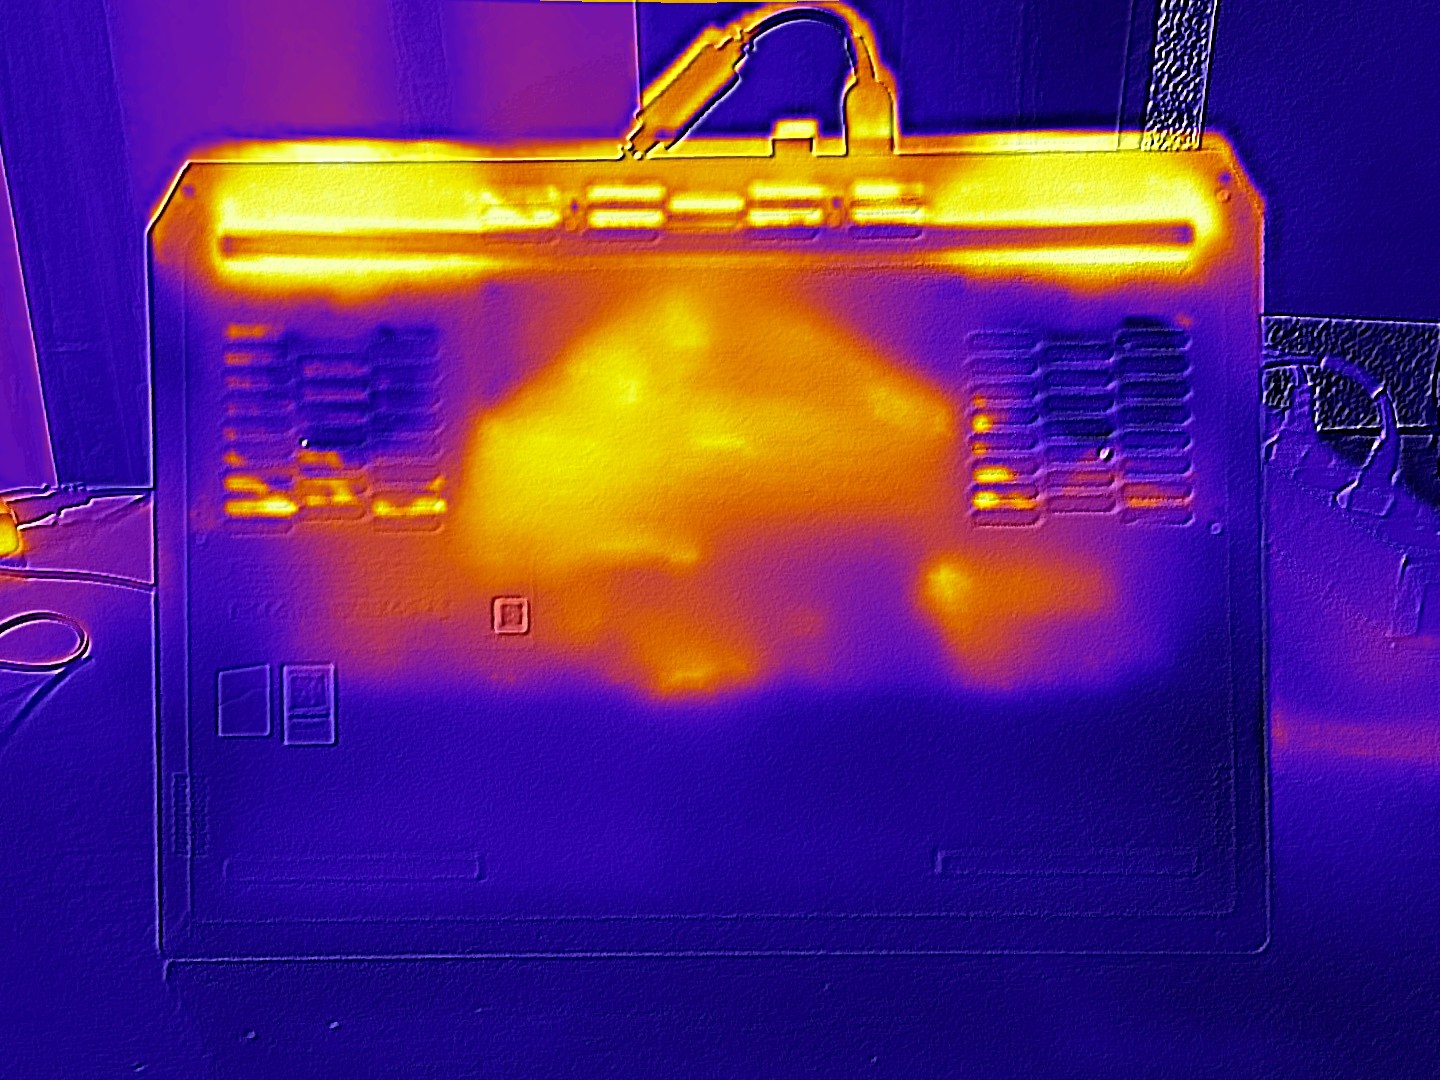
设备外壳底部的发热量最大。我们在其外壳上测得的最高温度为 58 °C,这与长时间游戏的结果相吻合。虽然顶部的温度一般不高,测试期间最高温度为 49 °C,但我们希望看到一个更凉爽的掌托。空闲时,其机箱温度稳定在 30 °C以下,温度适中。
(-) The maximum temperature on the upper side is 49 °C / 120 F, compared to the average of 40.4 °C / 105 F, ranging from 21.2 to 68.8 °C for the class Gaming.
(-) The bottom heats up to a maximum of 58 °C / 136 F, compared to the average of 43.2 °C / 110 F
(+) In idle usage, the average temperature for the upper side is 29.8 °C / 86 F, compared to the device average of 33.9 °C / 93 F.
(-) 3: The average temperature for the upper side is 44.6 °C / 112 F, compared to the average of 33.9 °C / 93 F for the class Gaming.
(-) The palmrests and touchpad can get very hot to the touch with a maximum of 43 °C / 109.4 F.
(-) The average temperature of the palmrest area of similar devices was 28.8 °C / 83.8 F (-14.2 °C / -25.6 F).
| Lenovo LOQ 15AHP10 R7 250, GeForce RTX 5060 Laptop | Lenovo LOQ 15IRX9 i5-13450HX, GeForce RTX 4060 Laptop GPU | Lenovo Legion 5 15AHP G10 R7 260, GeForce RTX 5060 Laptop | Gigabyte Aero X16 1WH Ryzen AI 7 350, GeForce RTX 5070 Laptop | MSI Katana 17 HX B14WGK i7-14650HX, GeForce RTX 5070 Laptop | |
|---|---|---|---|---|---|
| Heat | -5% | 9% | 11% | -4% | |
| Maximum Upper Side * (°C) | 49 | 47 4% | 42.2 14% | 43.3 12% | 52 -6% |
| Maximum Bottom * (°C) | 58 | 58 -0% | 51.7 11% | 50.3 13% | 56 3% |
| Idle Upper Side * (°C) | 32 | 32 -0% | 28.5 11% | 27 16% | 33 -3% |
| Idle Bottom * (°C) | 29 | 36 -24% | 29.2 -1% | 28.3 2% | 32 -10% |
* ... smaller is better
压力测试
在使用 Furmark 和 Prime95 工具进行的压力测试中,笔记本电脑 GPU 的发热温度(83 °C)高于 CPU(71 °C),这很不寻常。在运行《赛博朋克 2077》时,两个组件的温度都在 80 °C左右。
发言人
该设备的音质与前代产品相似,也很一般。与许多笔记本电脑一样,它的低音尤其可以更有力。
Lenovo LOQ 15AHP10 audio analysis
(±) | speaker loudness is average but good (81 dB)
Bass 100 - 315 Hz
(-) | nearly no bass - on average 17.7% lower than median
(±) | linearity of bass is average (9.4% delta to prev. frequency)
Mids 400 - 2000 Hz
(+) | balanced mids - only 2.6% away from median
(+) | mids are linear (4.2% delta to prev. frequency)
Highs 2 - 16 kHz
(±) | higher highs - on average 5.9% higher than median
(±) | linearity of highs is average (8.7% delta to prev. frequency)
Overall 100 - 16.000 Hz
(±) | linearity of overall sound is average (15.6% difference to median)
Compared to same class
» 36% of all tested devices in this class were better, 6% similar, 58% worse
» The best had a delta of 6%, average was 18%, worst was 132%
Compared to all devices tested
» 23% of all tested devices were better, 5% similar, 72% worse
» The best had a delta of 4%, average was 24%, worst was 134%
Lenovo LOQ 15IRX9 audio analysis
(±) | speaker loudness is average but good (81 dB)
Bass 100 - 315 Hz
(±) | reduced bass - on average 14.6% lower than median
(±) | linearity of bass is average (9.6% delta to prev. frequency)
Mids 400 - 2000 Hz
(+) | balanced mids - only 2.1% away from median
(+) | mids are linear (3.6% delta to prev. frequency)
Highs 2 - 16 kHz
(±) | higher highs - on average 5.9% higher than median
(±) | linearity of highs is average (8.2% delta to prev. frequency)
Overall 100 - 16.000 Hz
(+) | overall sound is linear (14.7% difference to median)
Compared to same class
» 28% of all tested devices in this class were better, 7% similar, 64% worse
» The best had a delta of 6%, average was 18%, worst was 132%
Compared to all devices tested
» 19% of all tested devices were better, 4% similar, 77% worse
» The best had a delta of 4%, average was 24%, worst was 134%
能源管理
耗电量
与竞争对手的设备相比,LOQ 15 的闲置功耗相当高,平均为 21 瓦,而竞争对手的功耗仅在 11 至 18 瓦之间。在负载情况下,我们测得的功耗在 71 瓦到 172 瓦之间,因此其电源似乎仍然足够大。
| Off / Standby | |
| Idle | |
| Load |
|
Key:
min: | |
| Lenovo LOQ 15AHP10 R7 250, GeForce RTX 5060 Laptop | Lenovo LOQ 15IRX9 i5-13450HX, GeForce RTX 4060 Laptop GPU | Lenovo Legion 5 15AHP G10 R7 260, GeForce RTX 5060 Laptop | Gigabyte Aero X16 1WH Ryzen AI 7 350, GeForce RTX 5070 Laptop | MSI Katana 17 HX B14WGK i7-14650HX, GeForce RTX 5070 Laptop | Average of class Gaming | |
|---|---|---|---|---|---|---|
| Power Consumption | -2% | 16% | 27% | -15% | -13% | |
| Idle Minimum * (Watt) | 20 | 13 35% | 6.9 65% | 5.8 71% | 9.7 51% | 13.1 ? 34% |
| Idle Average * (Watt) | 20.7 | 18 13% | 10.7 48% | 10.9 47% | 15 28% | 18.7 ? 10% |
| Idle Maximum * (Watt) | 22.7 | 24 -6% | 11.3 50% | 11.2 51% | 23.7 -4% | 24.4 ? -7% |
| Load Average * (Watt) | 71 | 85 -20% | 69.7 2% | 91.3 -29% | 126 -77% | 108.1 ? -52% |
| Cyberpunk 2077 ultra external monitor * (Watt) | 151.1 | 150.9 -0% | 165 -9% | 117.9 22% | 202 -34% | |
| Cyberpunk 2077 ultra * (Watt) | 153.1 | 155.7 -2% | 162.6 -6% | 123.8 19% | 205 -34% | |
| Load Maximum * (Watt) | 172 | 232 -35% | 233.6 -36% | 155.3 10% | 227 -32% | 254 ? -48% |
* ... smaller is better
Power consumption Cyberpunk / stress test
Power consumption with external monitor
运行时间
60 Wh 电池的续航时间并不是 LOQ 15 的优势之一。在我们的 WLAN 测试中,亮度降低到 150 cd/m²,这款 15 英寸设备的续航时间仅为 4.5 小时。而竞争对手在这种情况下至少能使用 5 个小时,这部分归功于他们拥有更大的电池(75 至 80 瓦时)。
| Lenovo LOQ 15AHP10 R7 250, GeForce RTX 5060 Laptop, 60 Wh | Lenovo LOQ 15IRX9 i5-13450HX, GeForce RTX 4060 Laptop GPU, 60 Wh | Lenovo Legion 5 15AHP G10 R7 260, GeForce RTX 5060 Laptop, 80 Wh | Gigabyte Aero X16 1WH Ryzen AI 7 350, GeForce RTX 5070 Laptop, 76 Wh | MSI Katana 17 HX B14WGK i7-14650HX, GeForce RTX 5070 Laptop, 75 Wh | Average of class Gaming | |
|---|---|---|---|---|---|---|
| Battery runtime | 18% | 54% | 91% | 13% | 32% | |
| Reader / Idle (h) | 6.9 | 8.71 ? 26% | ||||
| WiFi v1.3 (h) | 4.5 | 5.3 18% | 9.7 116% | 8.6 91% | 5.1 13% | 7.04 ? 56% |
| Load (h) | 1.3 | 1.2 -8% | 1.47 ? 13% | |||
| H.264 (h) | 11.5 | 8.26 ? | ||||
| Cyberpunk 2077 ultra 150cd (h) | 0.9 |
Notebookcheck 总评分
就价格而言,联想 LOQ 15AHP10 是一款令人兴奋的 15 英寸游戏机,但它在某些系统模式下的风扇控制可以做得更好。
Lenovo LOQ 15AHP10
- 06/30/2025 v8
Florian Glaser
 Total Sustainability Score:
 可能的替代品比较
Transparency
The selection of devices to be reviewed is made by our editorial team. The test sample was provided to the author as a loan by the manufacturer or retailer for the purpose of this review. The lender had no influence on this review, nor did the manufacturer receive a copy of this review before publication. There was no obligation to publish this review. As an independent media company, Notebookcheck is not subjected to the authority of manufacturers, retailers or publishers.
This is how Notebookcheck is testing
Every year, Notebookcheck independently reviews hundreds of laptops and smartphones using standardized procedures to ensure that all results are comparable. We have continuously developed our test methods for around 20 years and set industry standards in the process. In our test labs, high-quality measuring equipment is utilized by experienced technicians and editors. These tests involve a multi-stage validation process. Our complex rating system is based on hundreds of well-founded measurements and benchmarks, which maintains objectivity. Further information on our test methods can be found here.

