判决
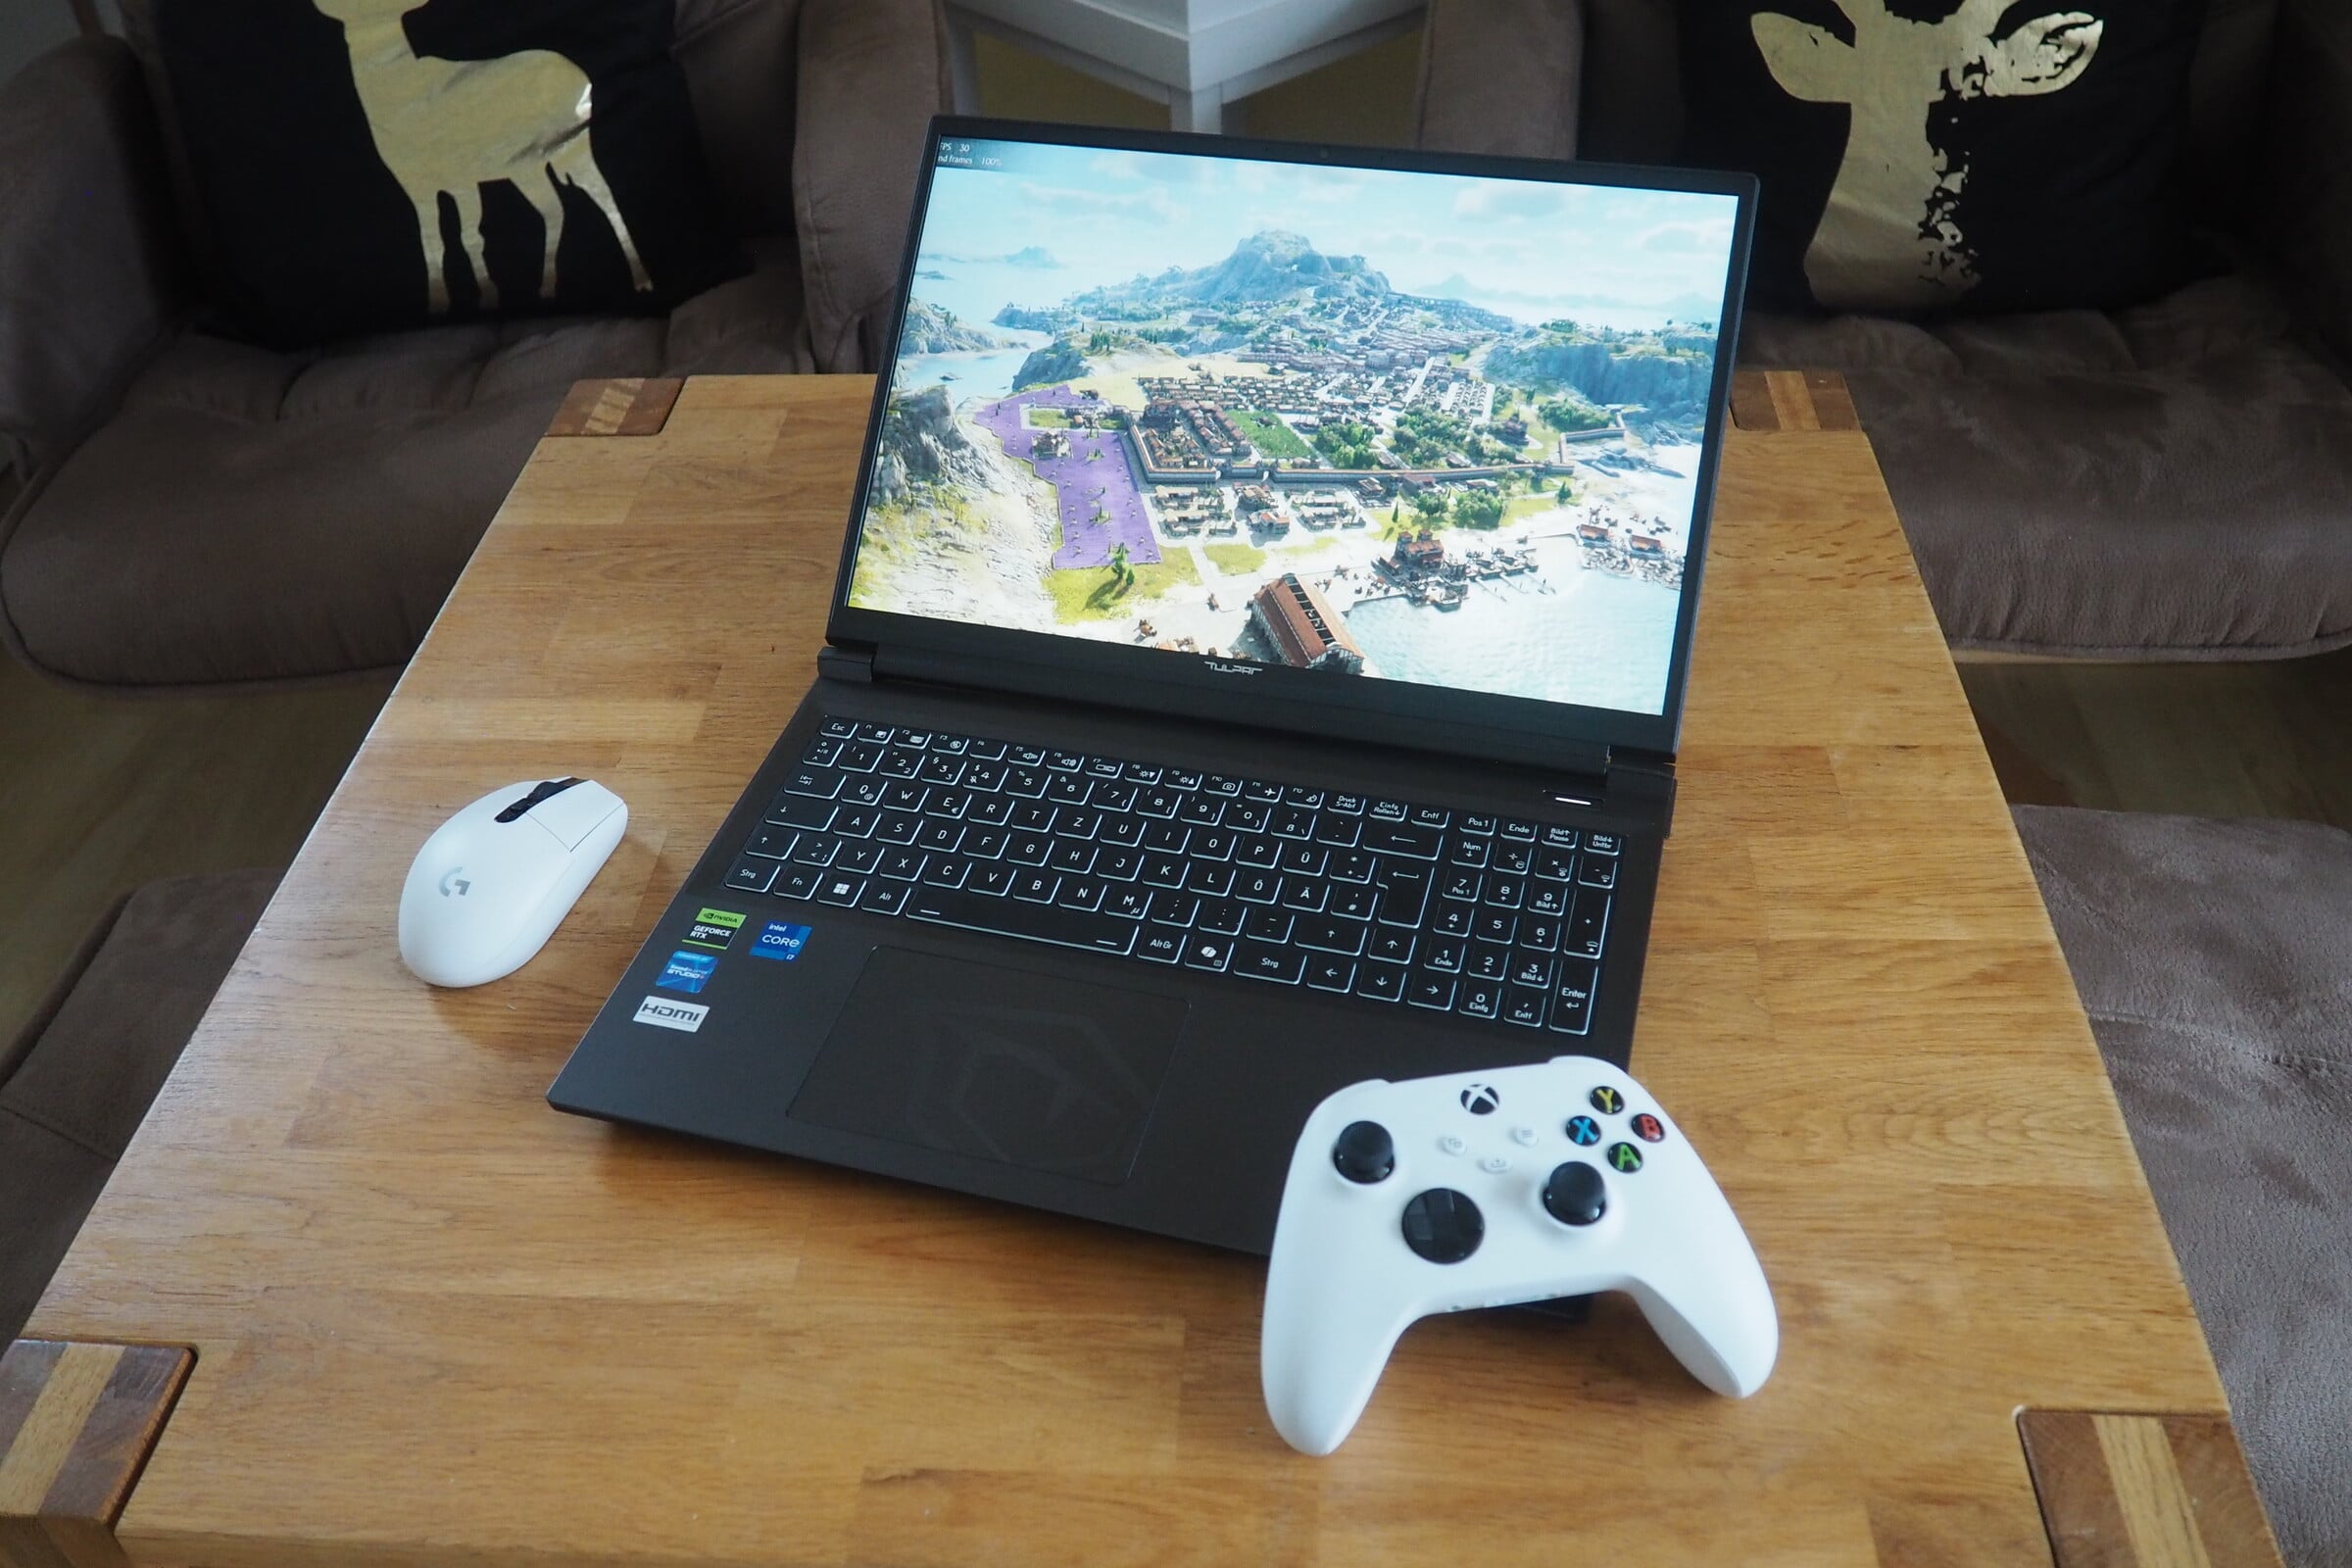
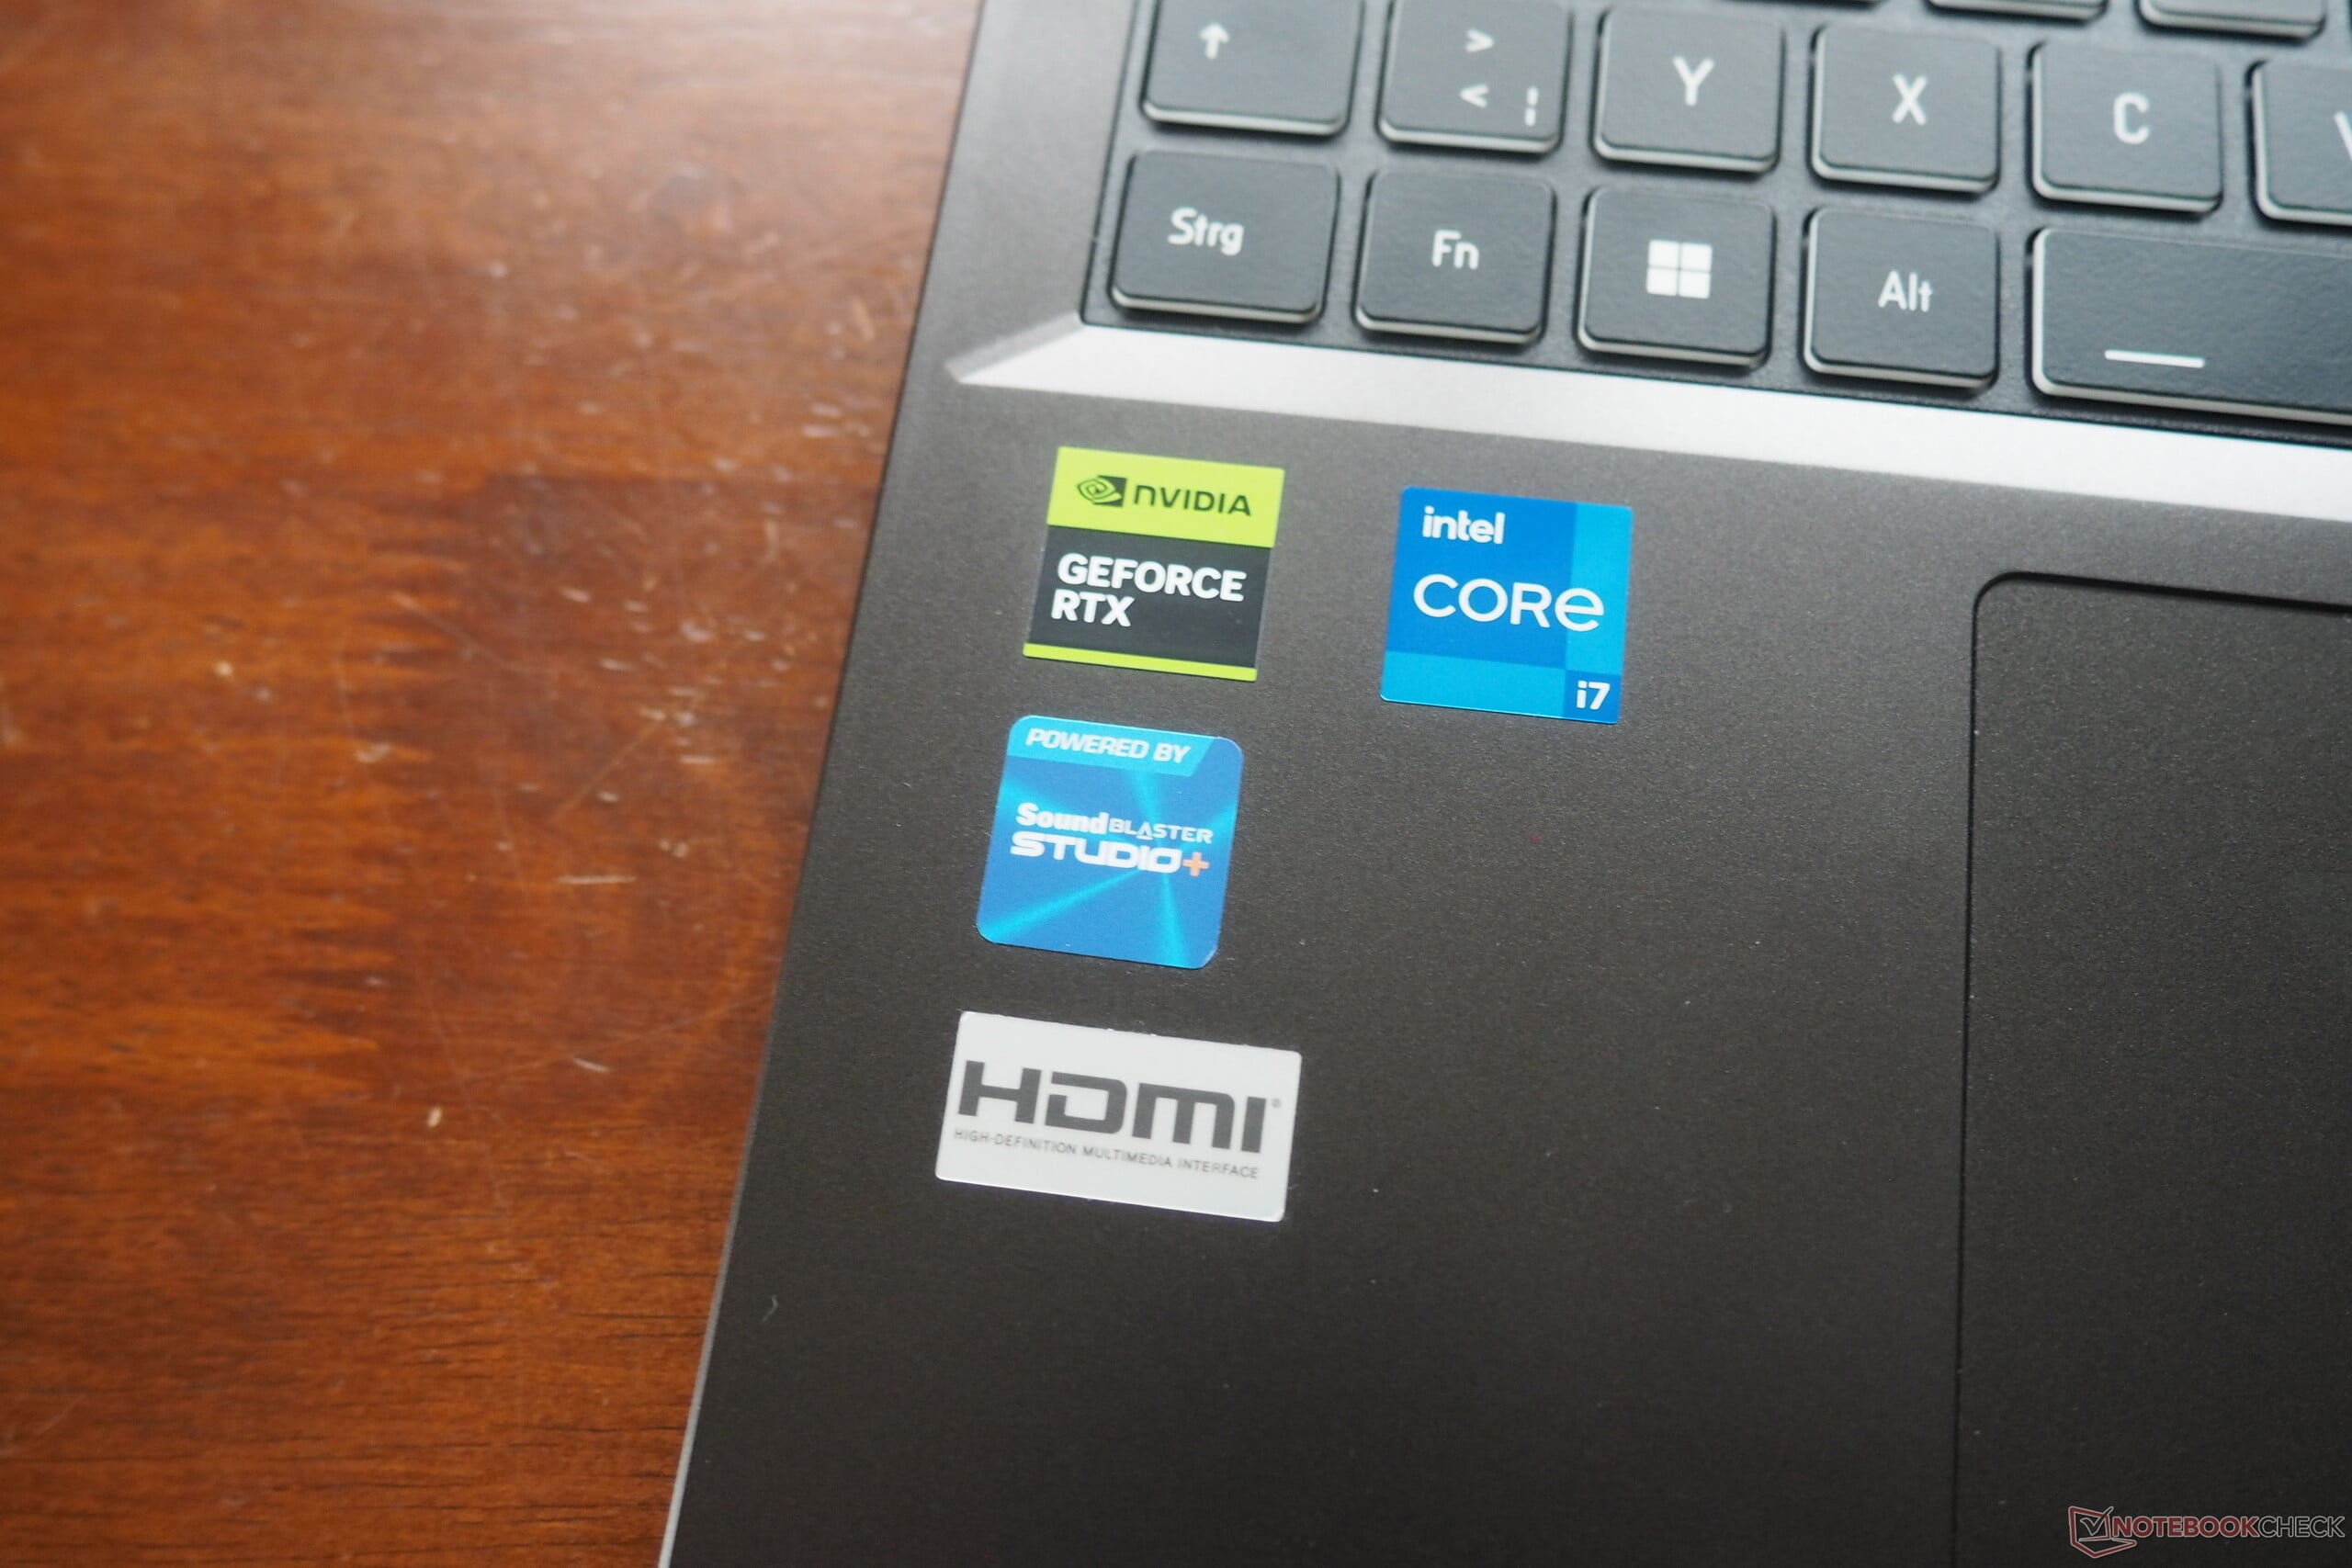
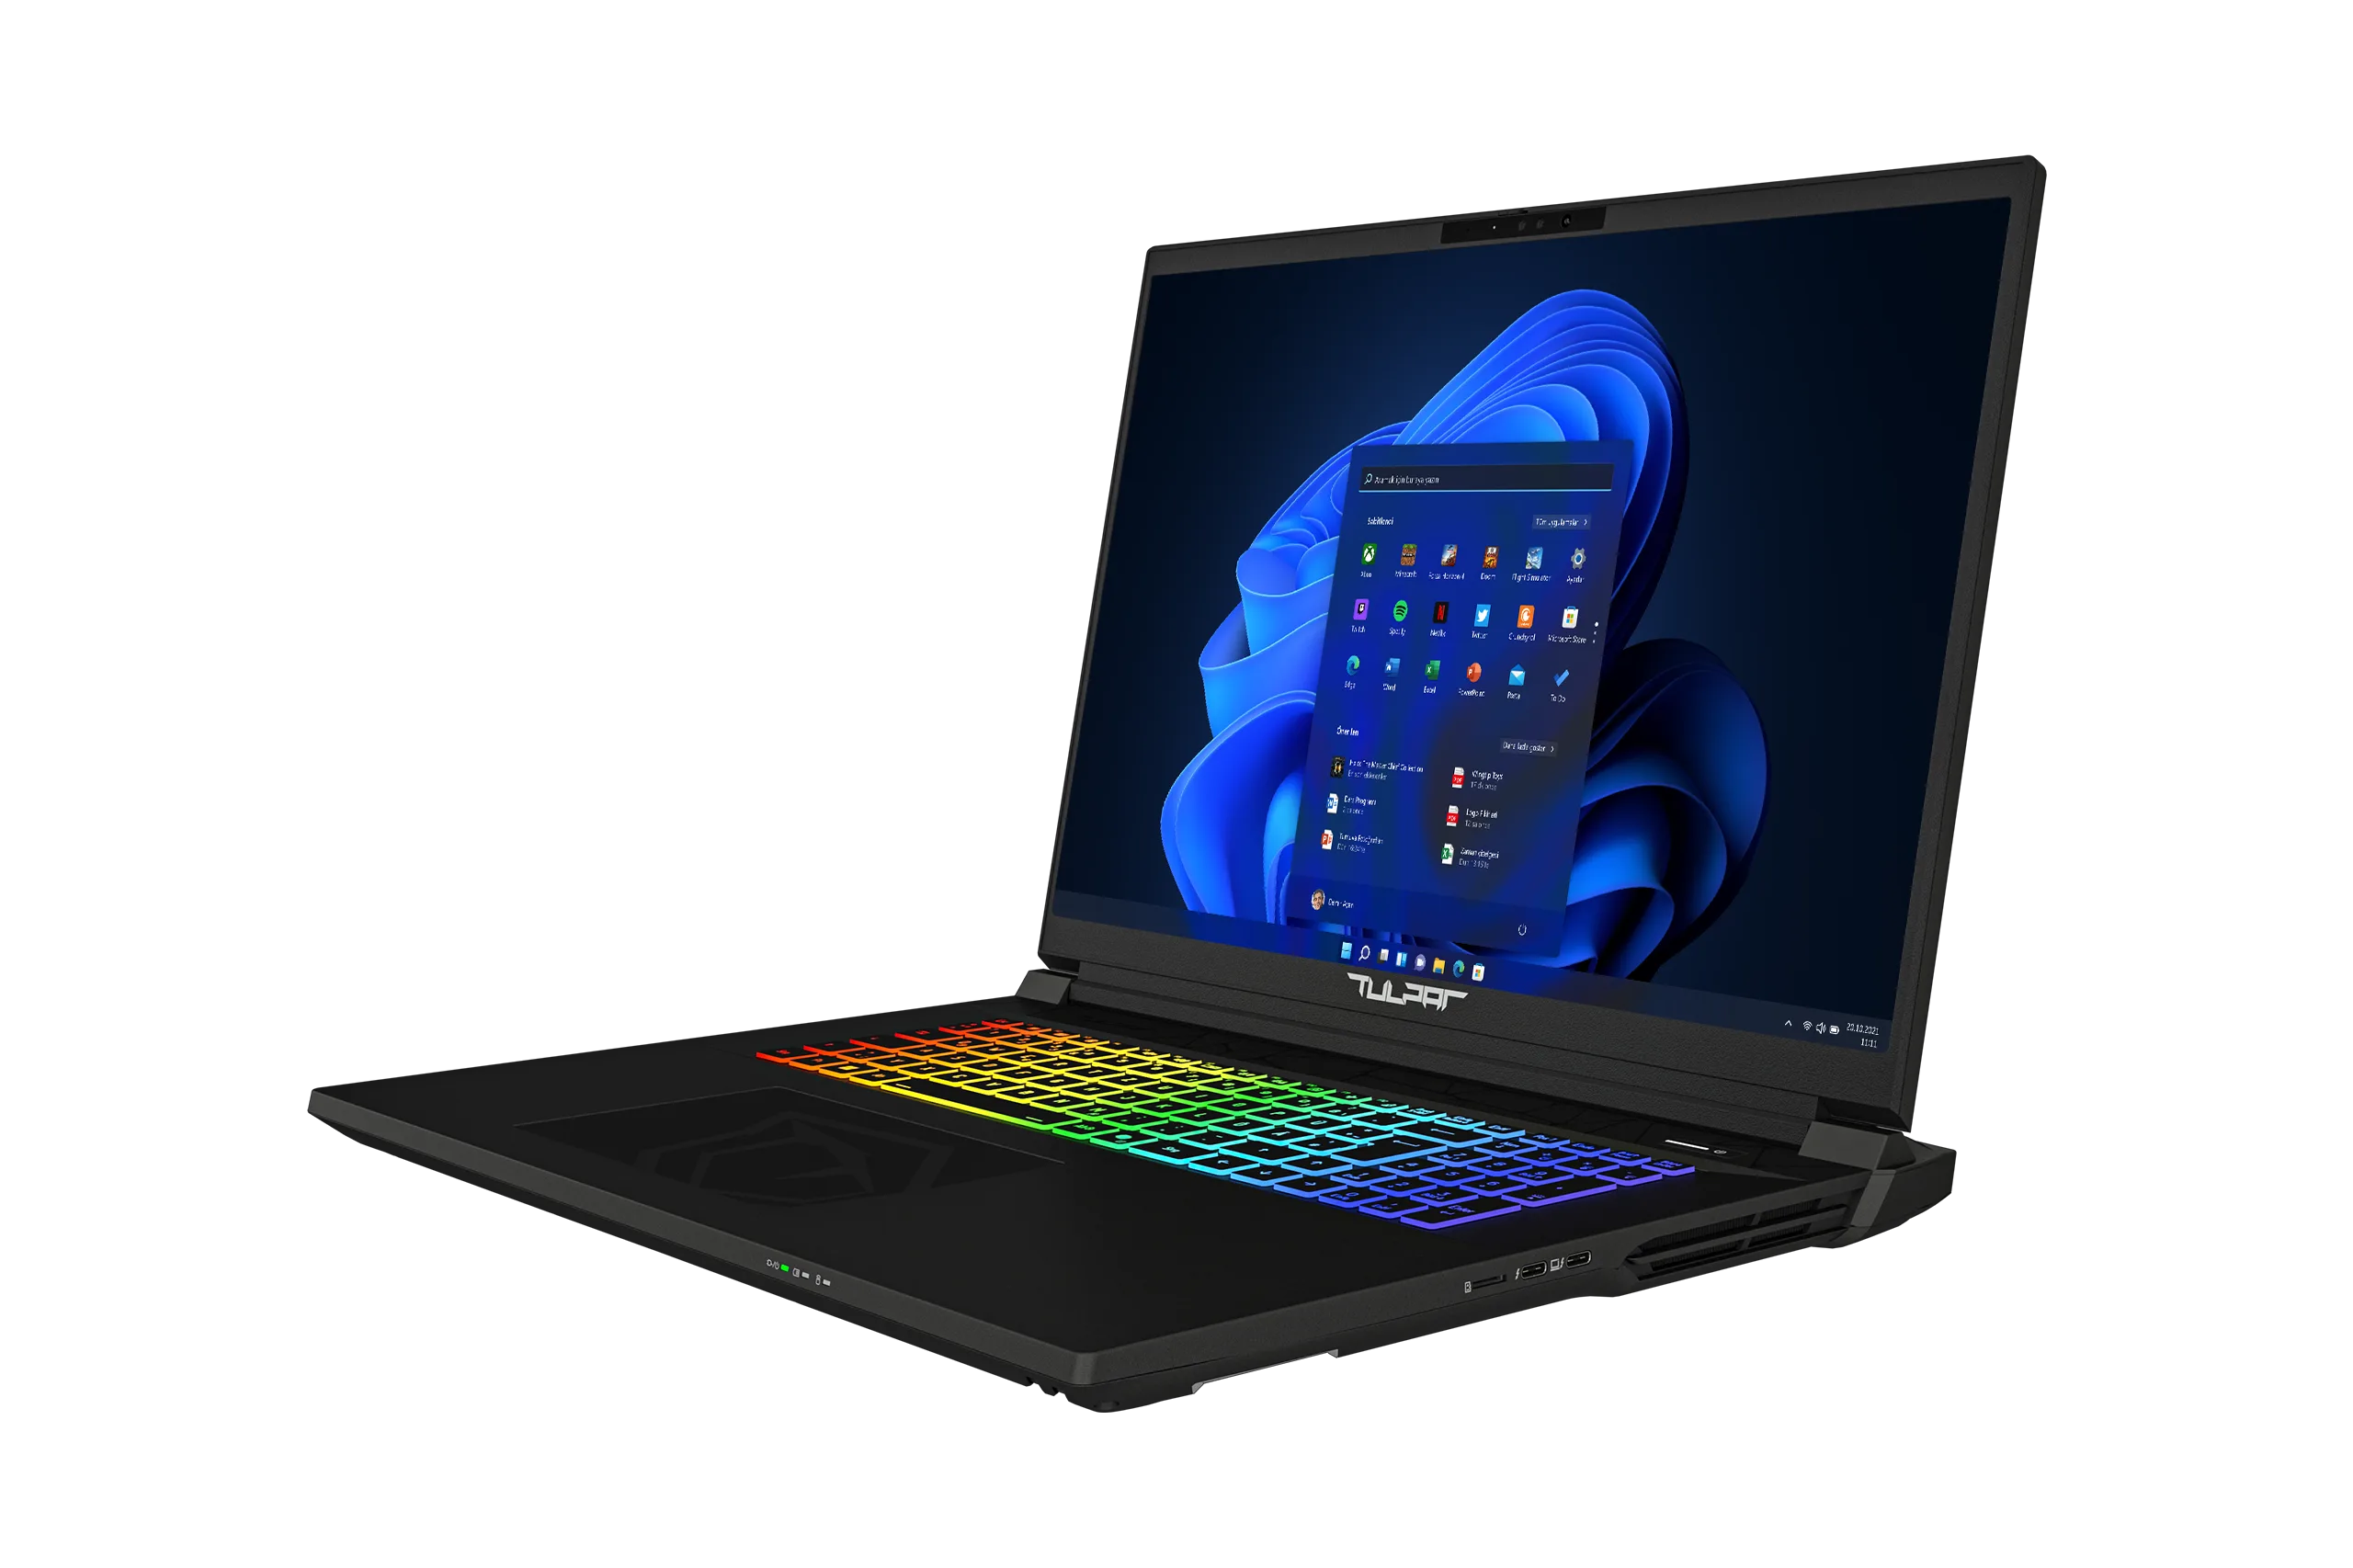
如果你正在寻找一款 1000 欧元左右的游戏笔记本电脑,那么 Tulpar Notebook 的 T6 V3.5 可能会很适合你。这款 16 英寸机型配备了GeForce RTX 5060,提供了坚实的中端 GPU,并搭配了快速的酷睿 i7-14700HX(但在持续负载下性能会有所下降)。我们的测试机还包括 32 GB DDR5 内存(2×16 GB)和 1 TB NVMe SSD。
在外壳方面,买家可以期待标准的外观。机身完全由塑料制成,设计相当低调。在连接性方面也有改进的余地(没有读卡器,没有 USB4)。显示屏符合该价位段的预期。基于 165 Hz IPS 的面板(1,920 × 1,200 像素)提供了可用的亮度和相当好的色彩空间覆盖率,这不是所有竞争对手都能做到的(稍后再谈)。尽管风扇控制可以做得更好,但包括温度和噪音在内的排放水平与其他游戏笔记本电脑基本一致。
总体而言,Tulpar T6 V3.5 与更知名的品牌相比仍具有竞争力,值得考虑。
Pros
Cons
价格和供应情况
Tulpar T6 V3.5 目前在制造商网站上的起价约为 1,160 欧元(约合 1,345 美元)。
译者注:Monster 的笔记本电脑尚未在北美正式发售。
Tulpar T6 V3.5 的竞争对手包括 Acer Nitro V 16 AI以及 Alienware 16 Aurora和 惠普 Omen 16它们的价格也都比较合理。价格稍高的 技嘉游戏 A16配备了 RTX 5070 和当前的 RTX 5060 参考型号,以及 联想Legion 5也出现在我们的对比表中。
规格
案例
塑料外壳的稳定性相当不错,大部分地方都做了整洁的处理。铰链在大多数情况下工作起来并不显眼,尽管最大打开角度约为 135°,但并不是特别宽松。只要关闭键盘背光,深灰色的表面会给笔记本电脑带来相当低调的外观。
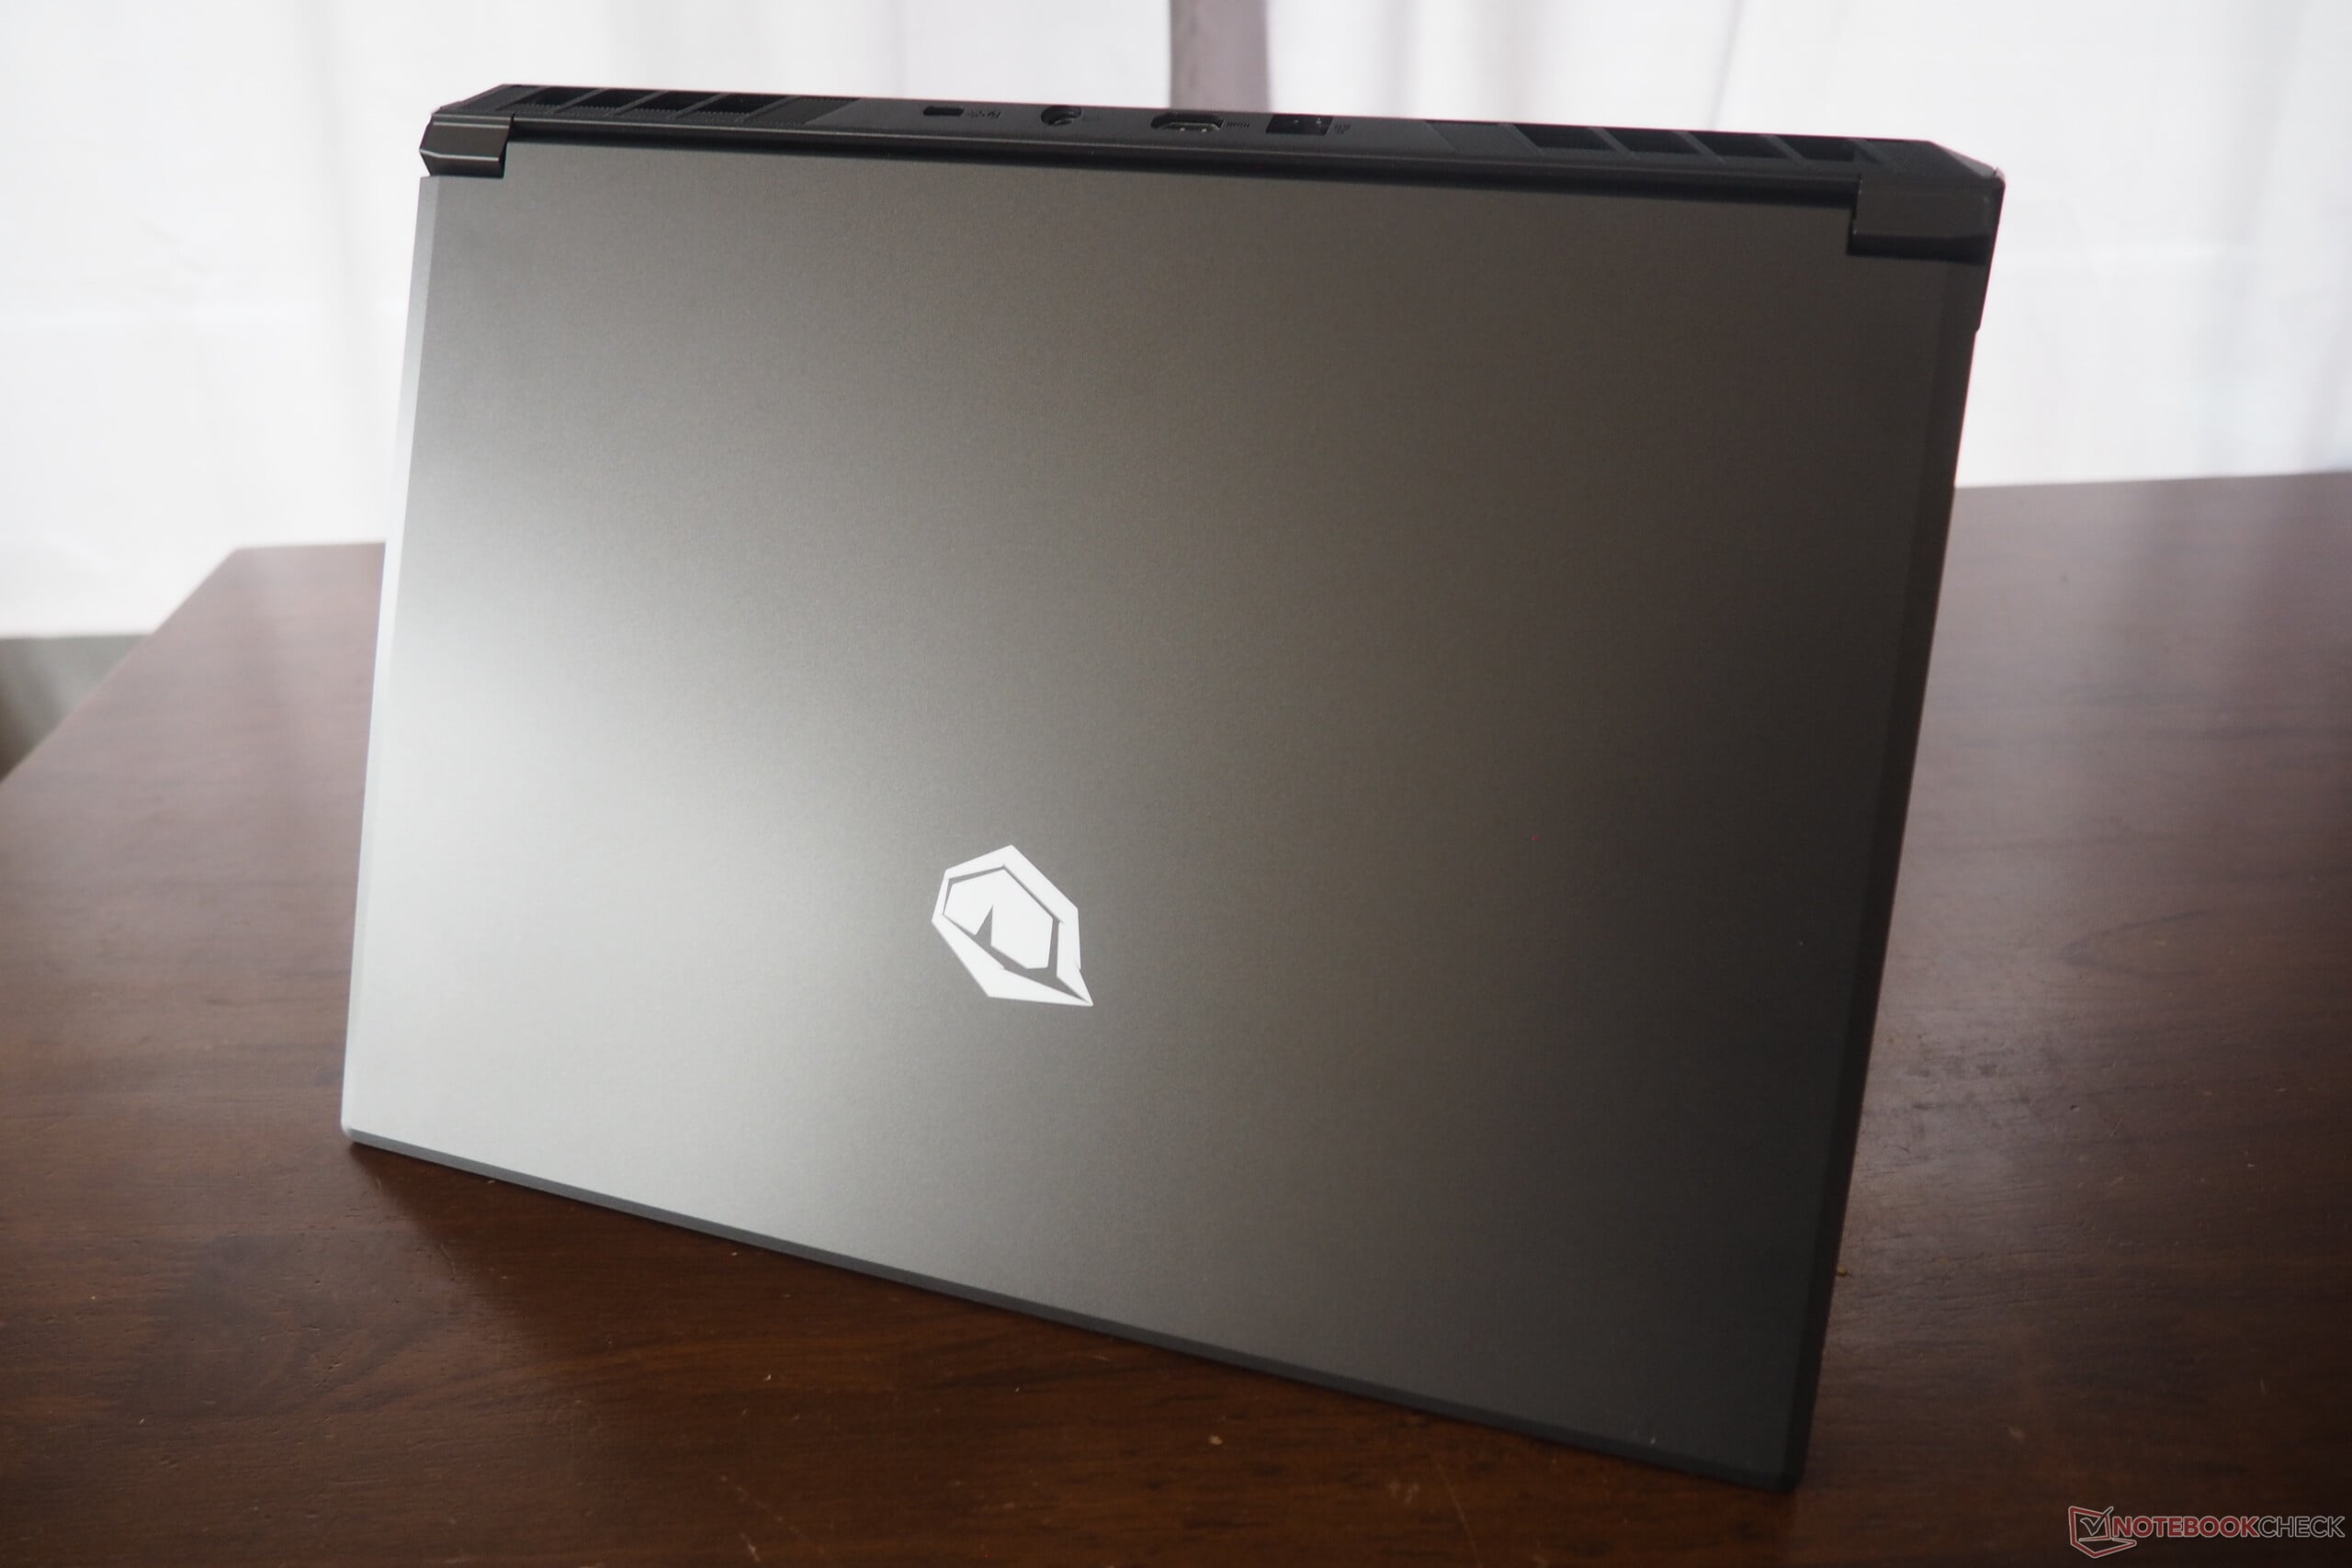
除了更轻的Legion 5 外,T6 V3.5 的重量为 2.4 千克,与其他 16 英寸竞争产品持平,后者的重量在 2.3 至 2.6 千克之间。2.5 厘米的厚度也是该级别产品的典型水平。
设备
连接
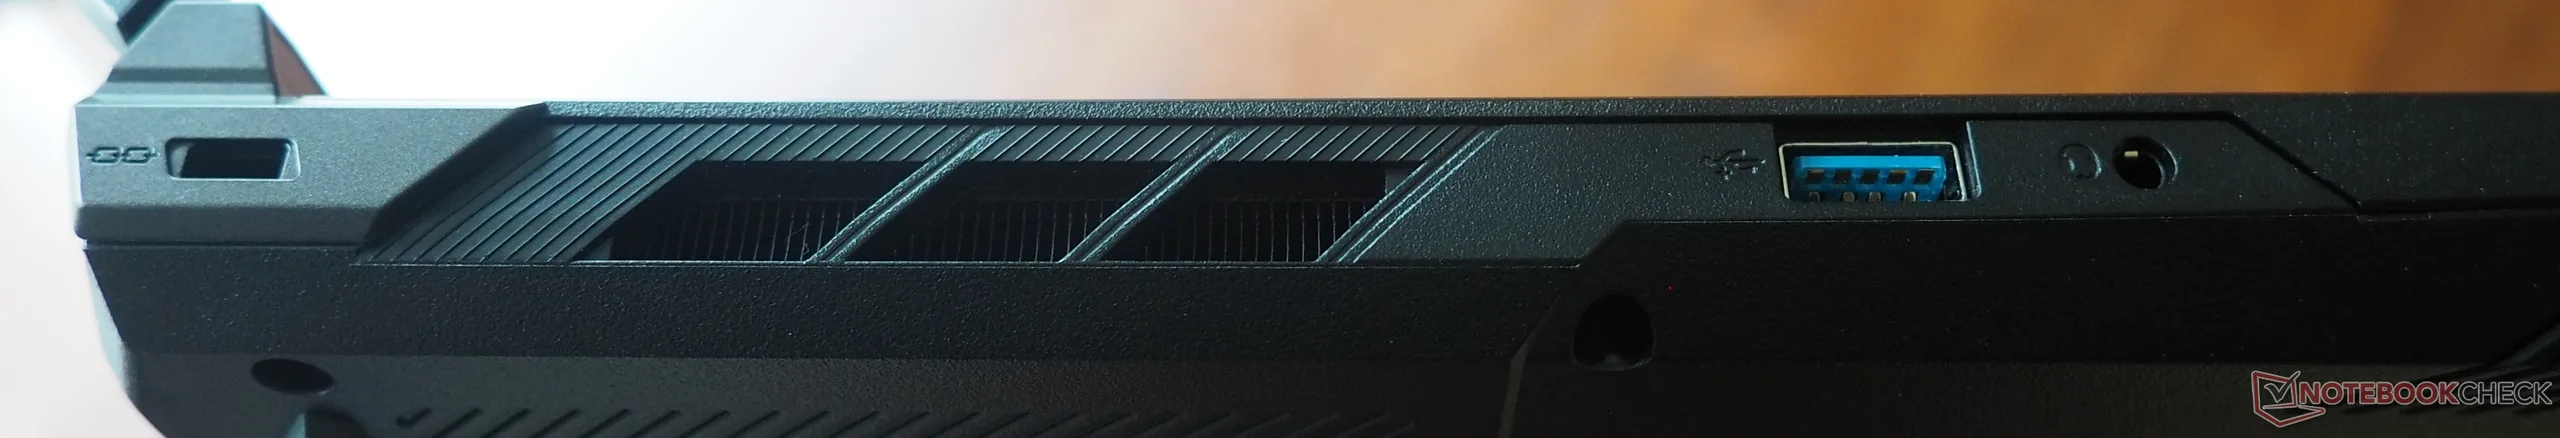
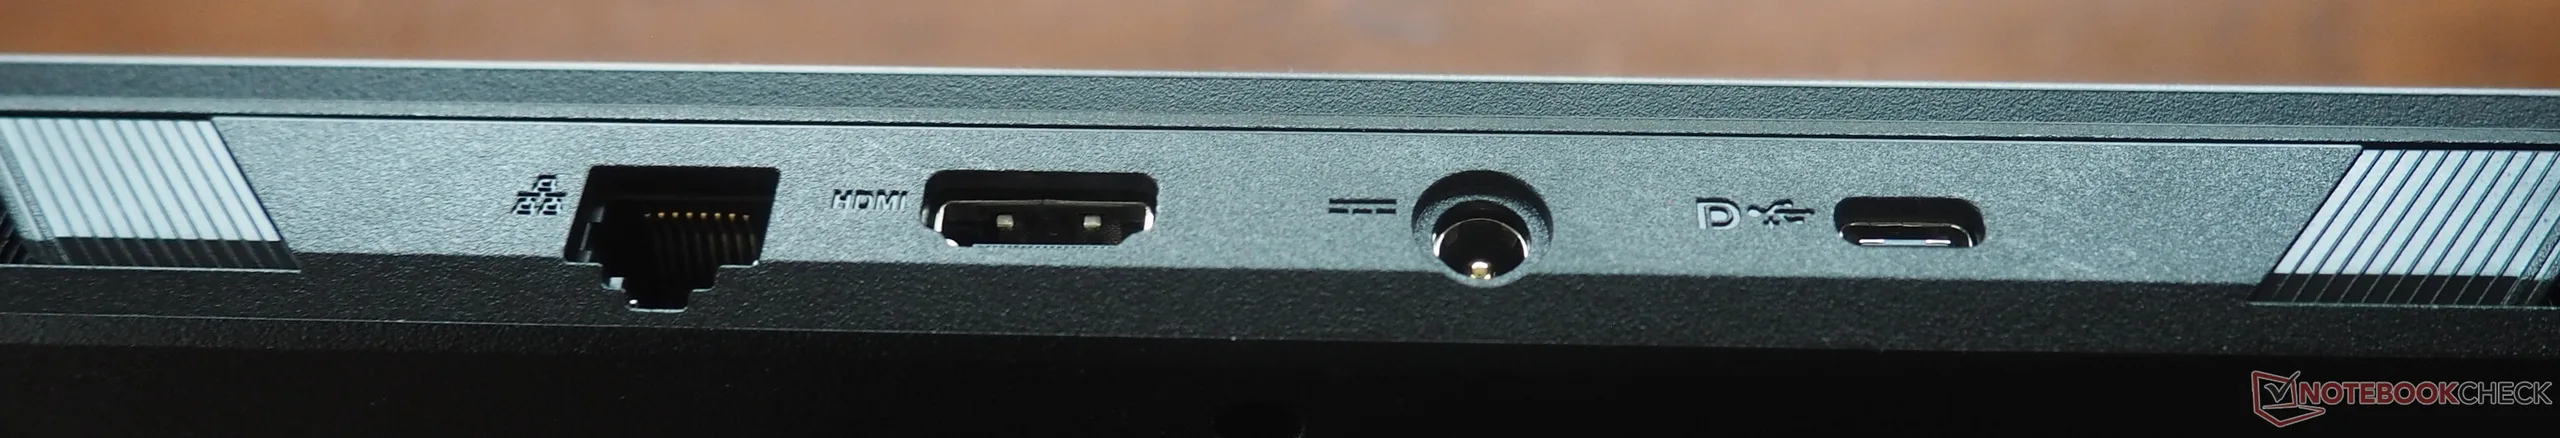
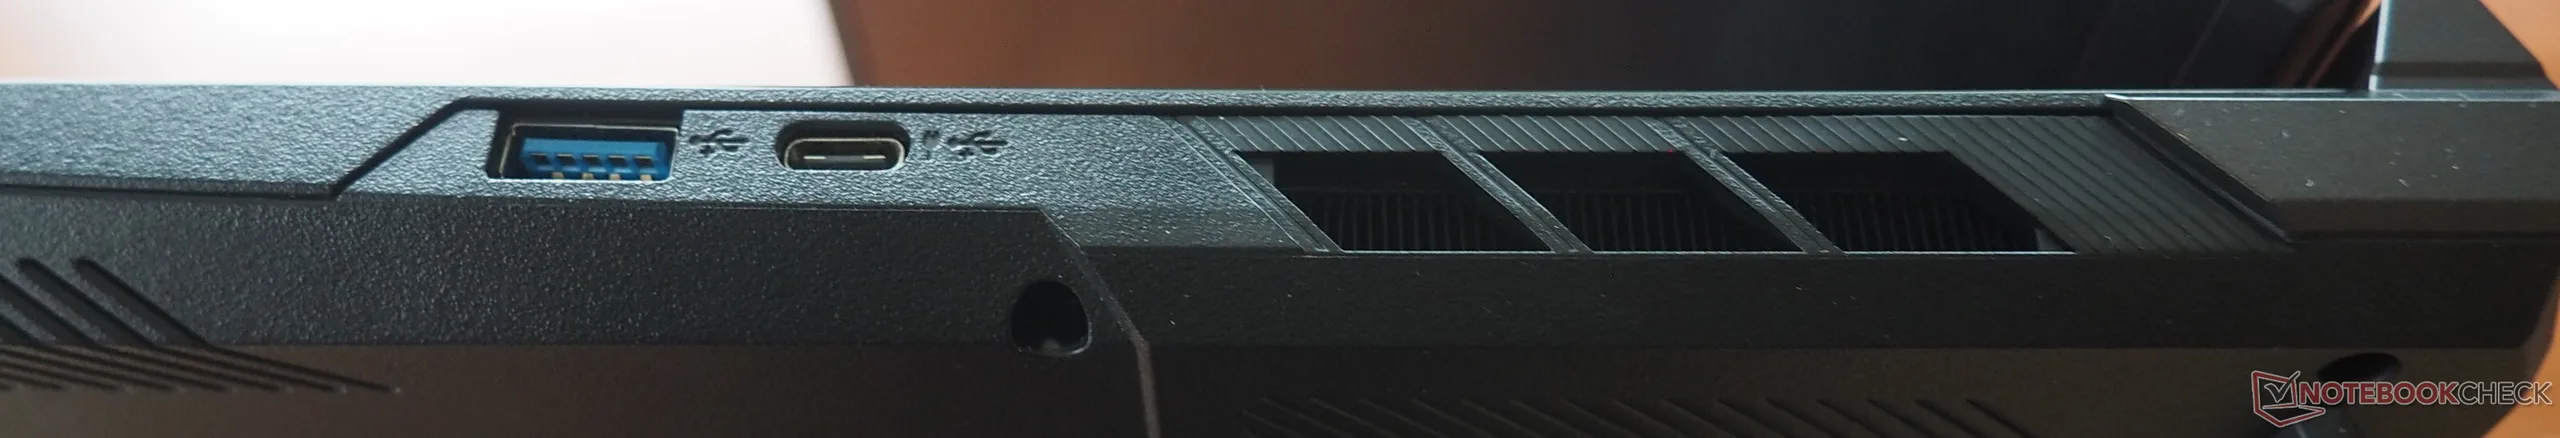
端口几乎遍布机箱的每一侧。虽然没有 USB 4 或 Thunderbolt,但系统仍提供四个 USB 端口(两个 Type-A 和两个 Type-C)。外接显示器可通过 HDMI 接口连接。此外,还包括一个千兆 LAN 端口、一个耳机插孔和一个 Kensington 锁插槽。
交流
内置无线模块是速度更快的选择。英特尔的 Wi-Fi 6E AX211 在发射和接收测试中均表现出色。
网络摄像头
网络摄像头的图像质量则不尽如人意,与许多笔记本电脑一样,它的分辨率可以更高一些。


配件
该笔记本还附带了一些信息手册、一块清洁布和一个中等大小的 230 瓦电源装置。
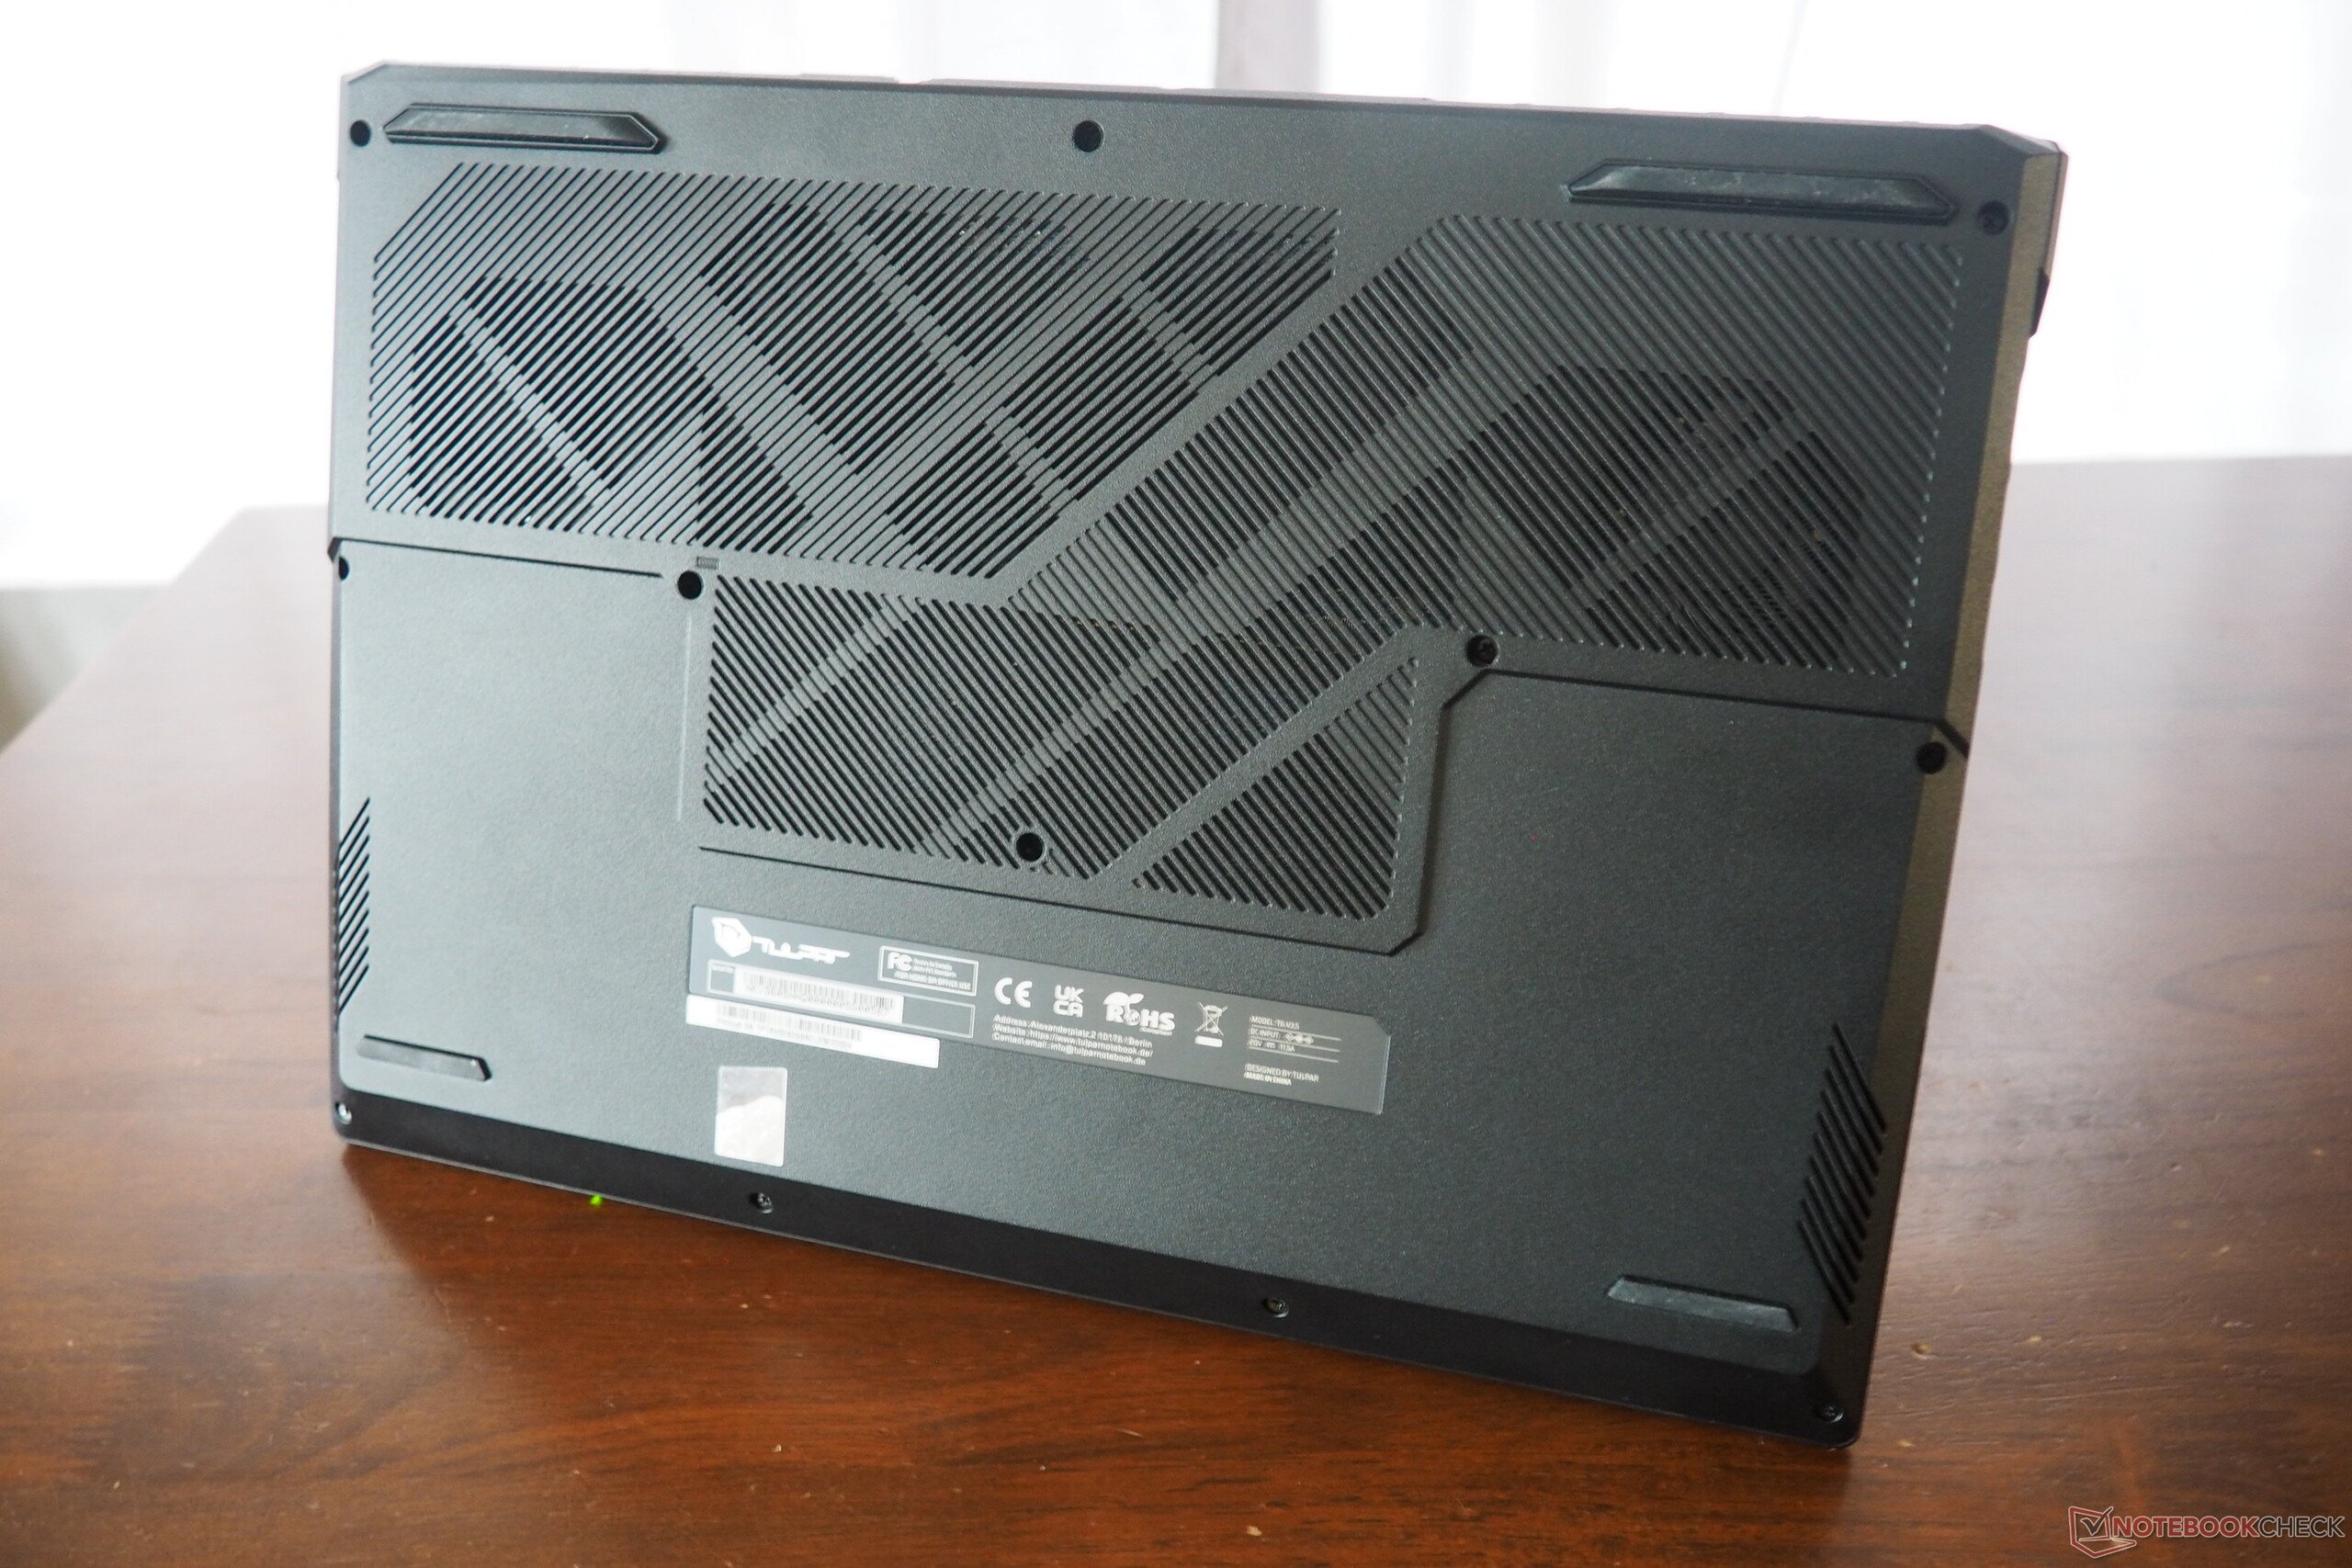
维护
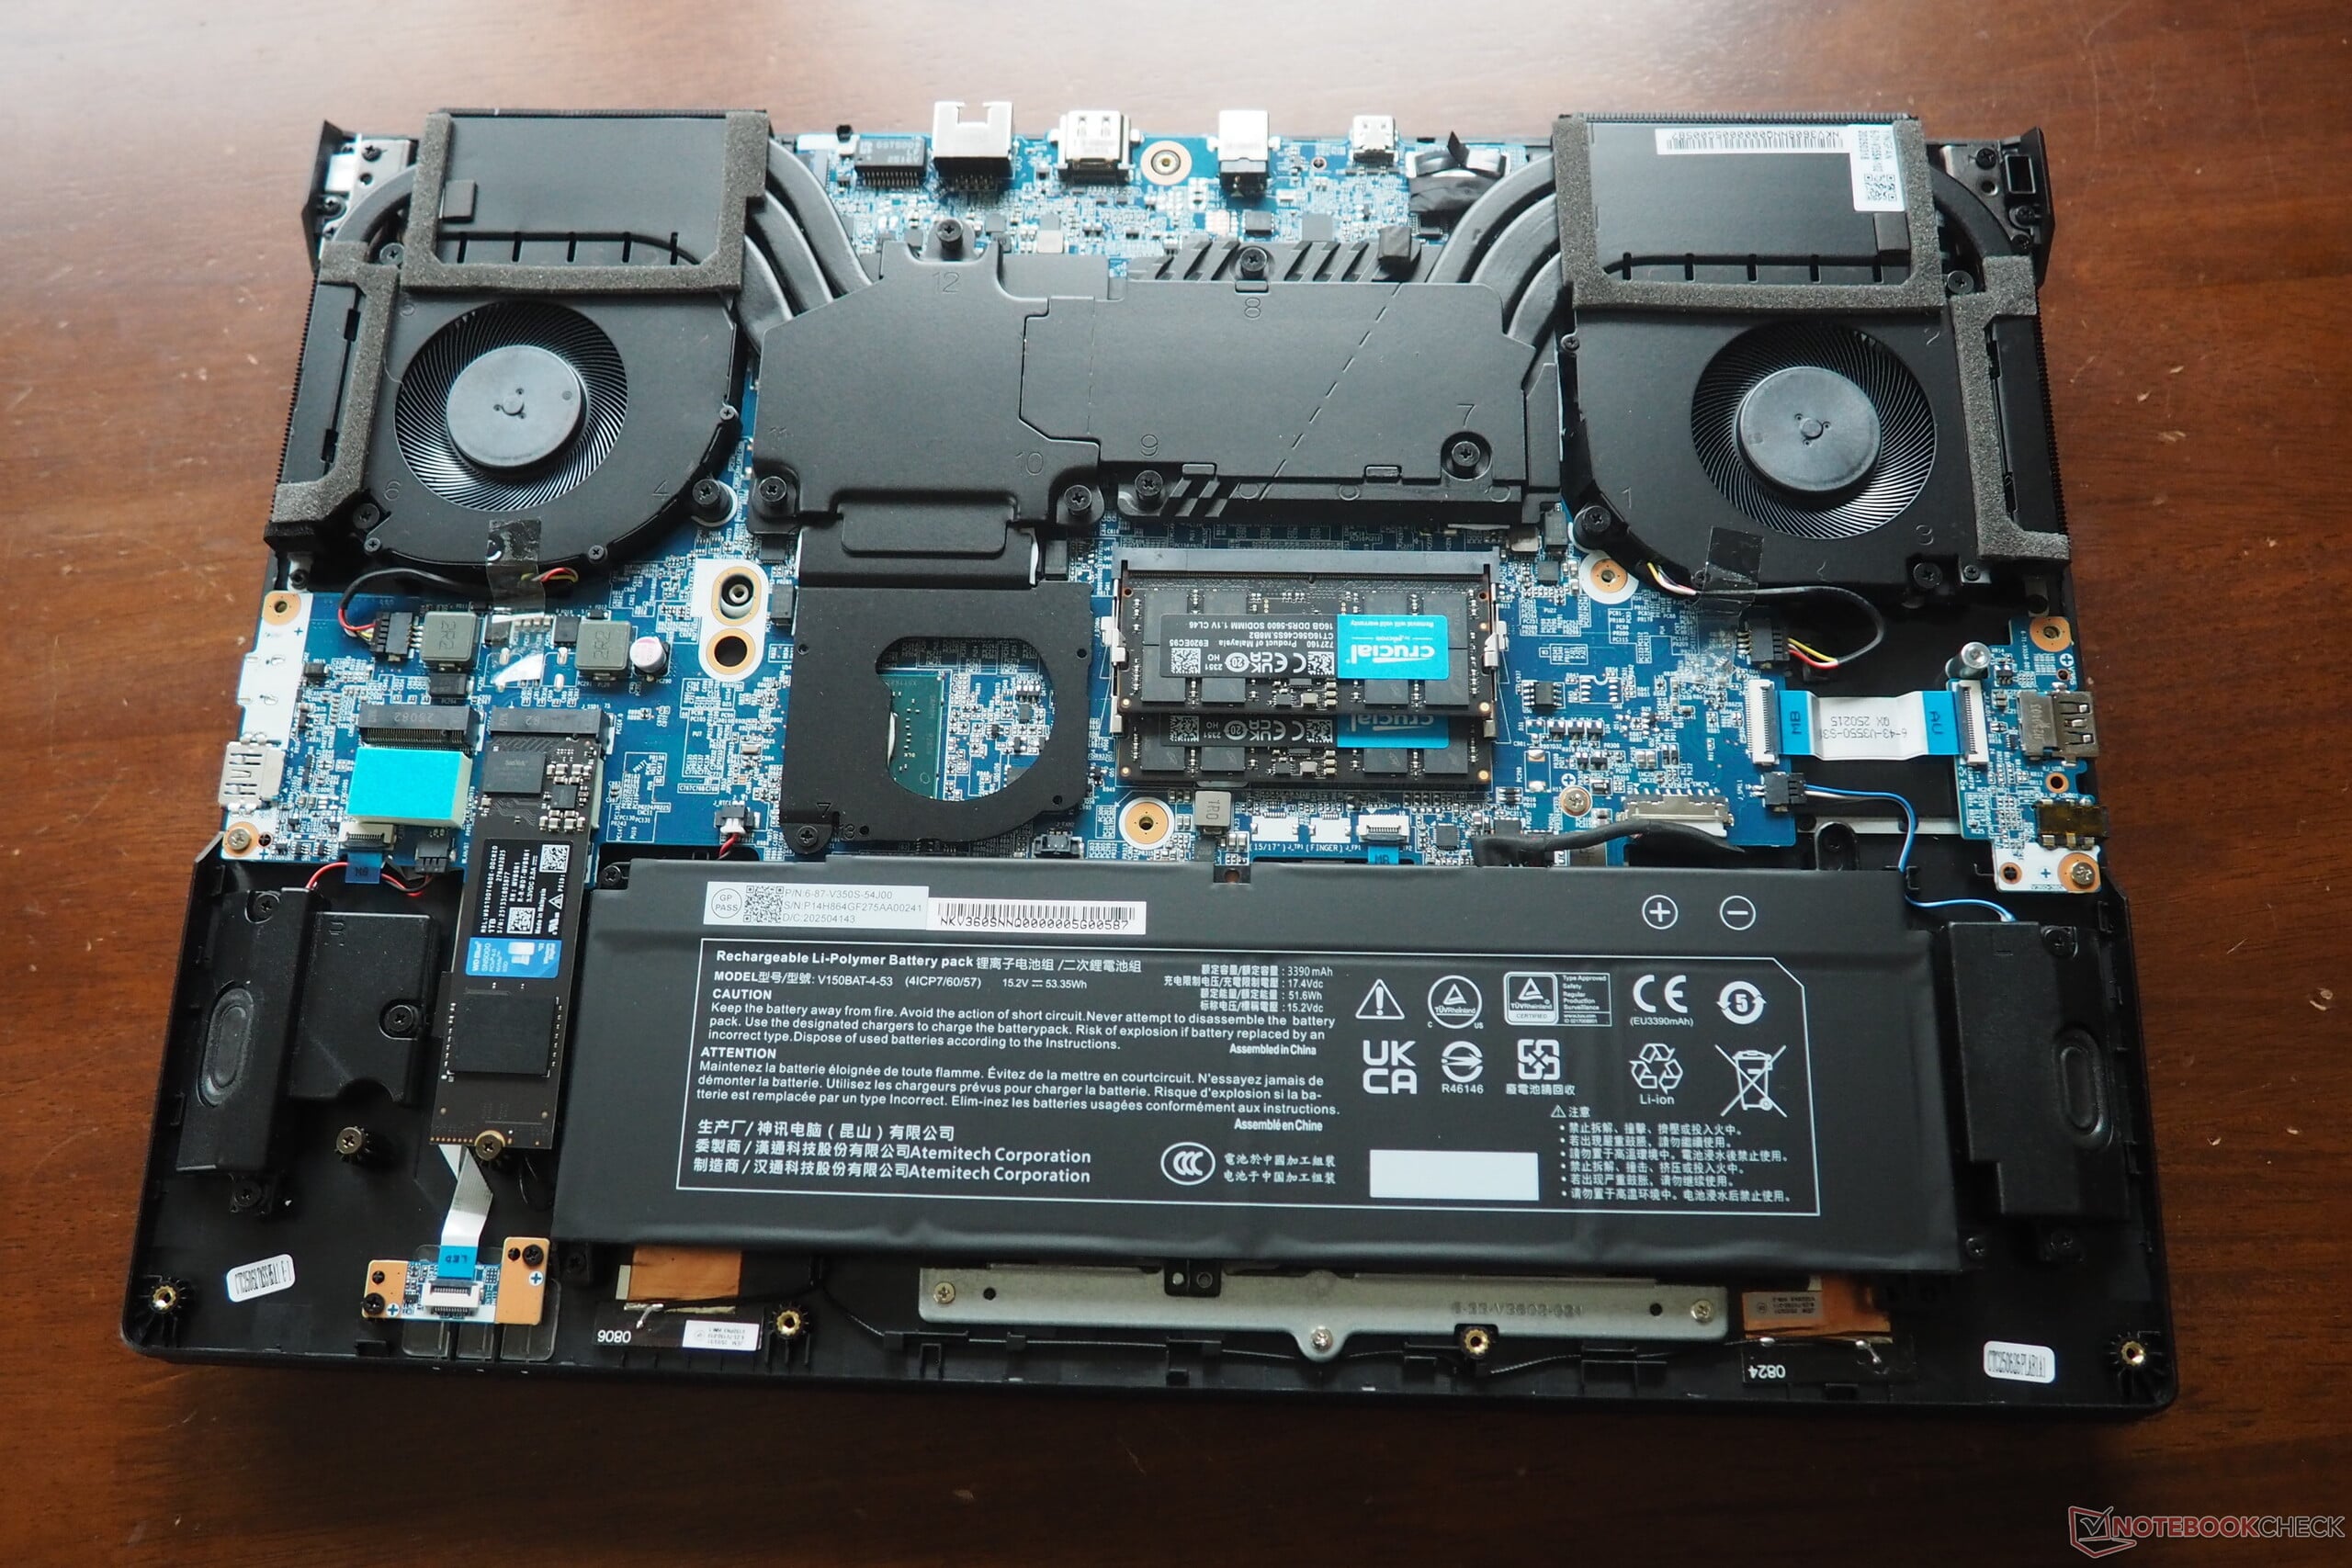
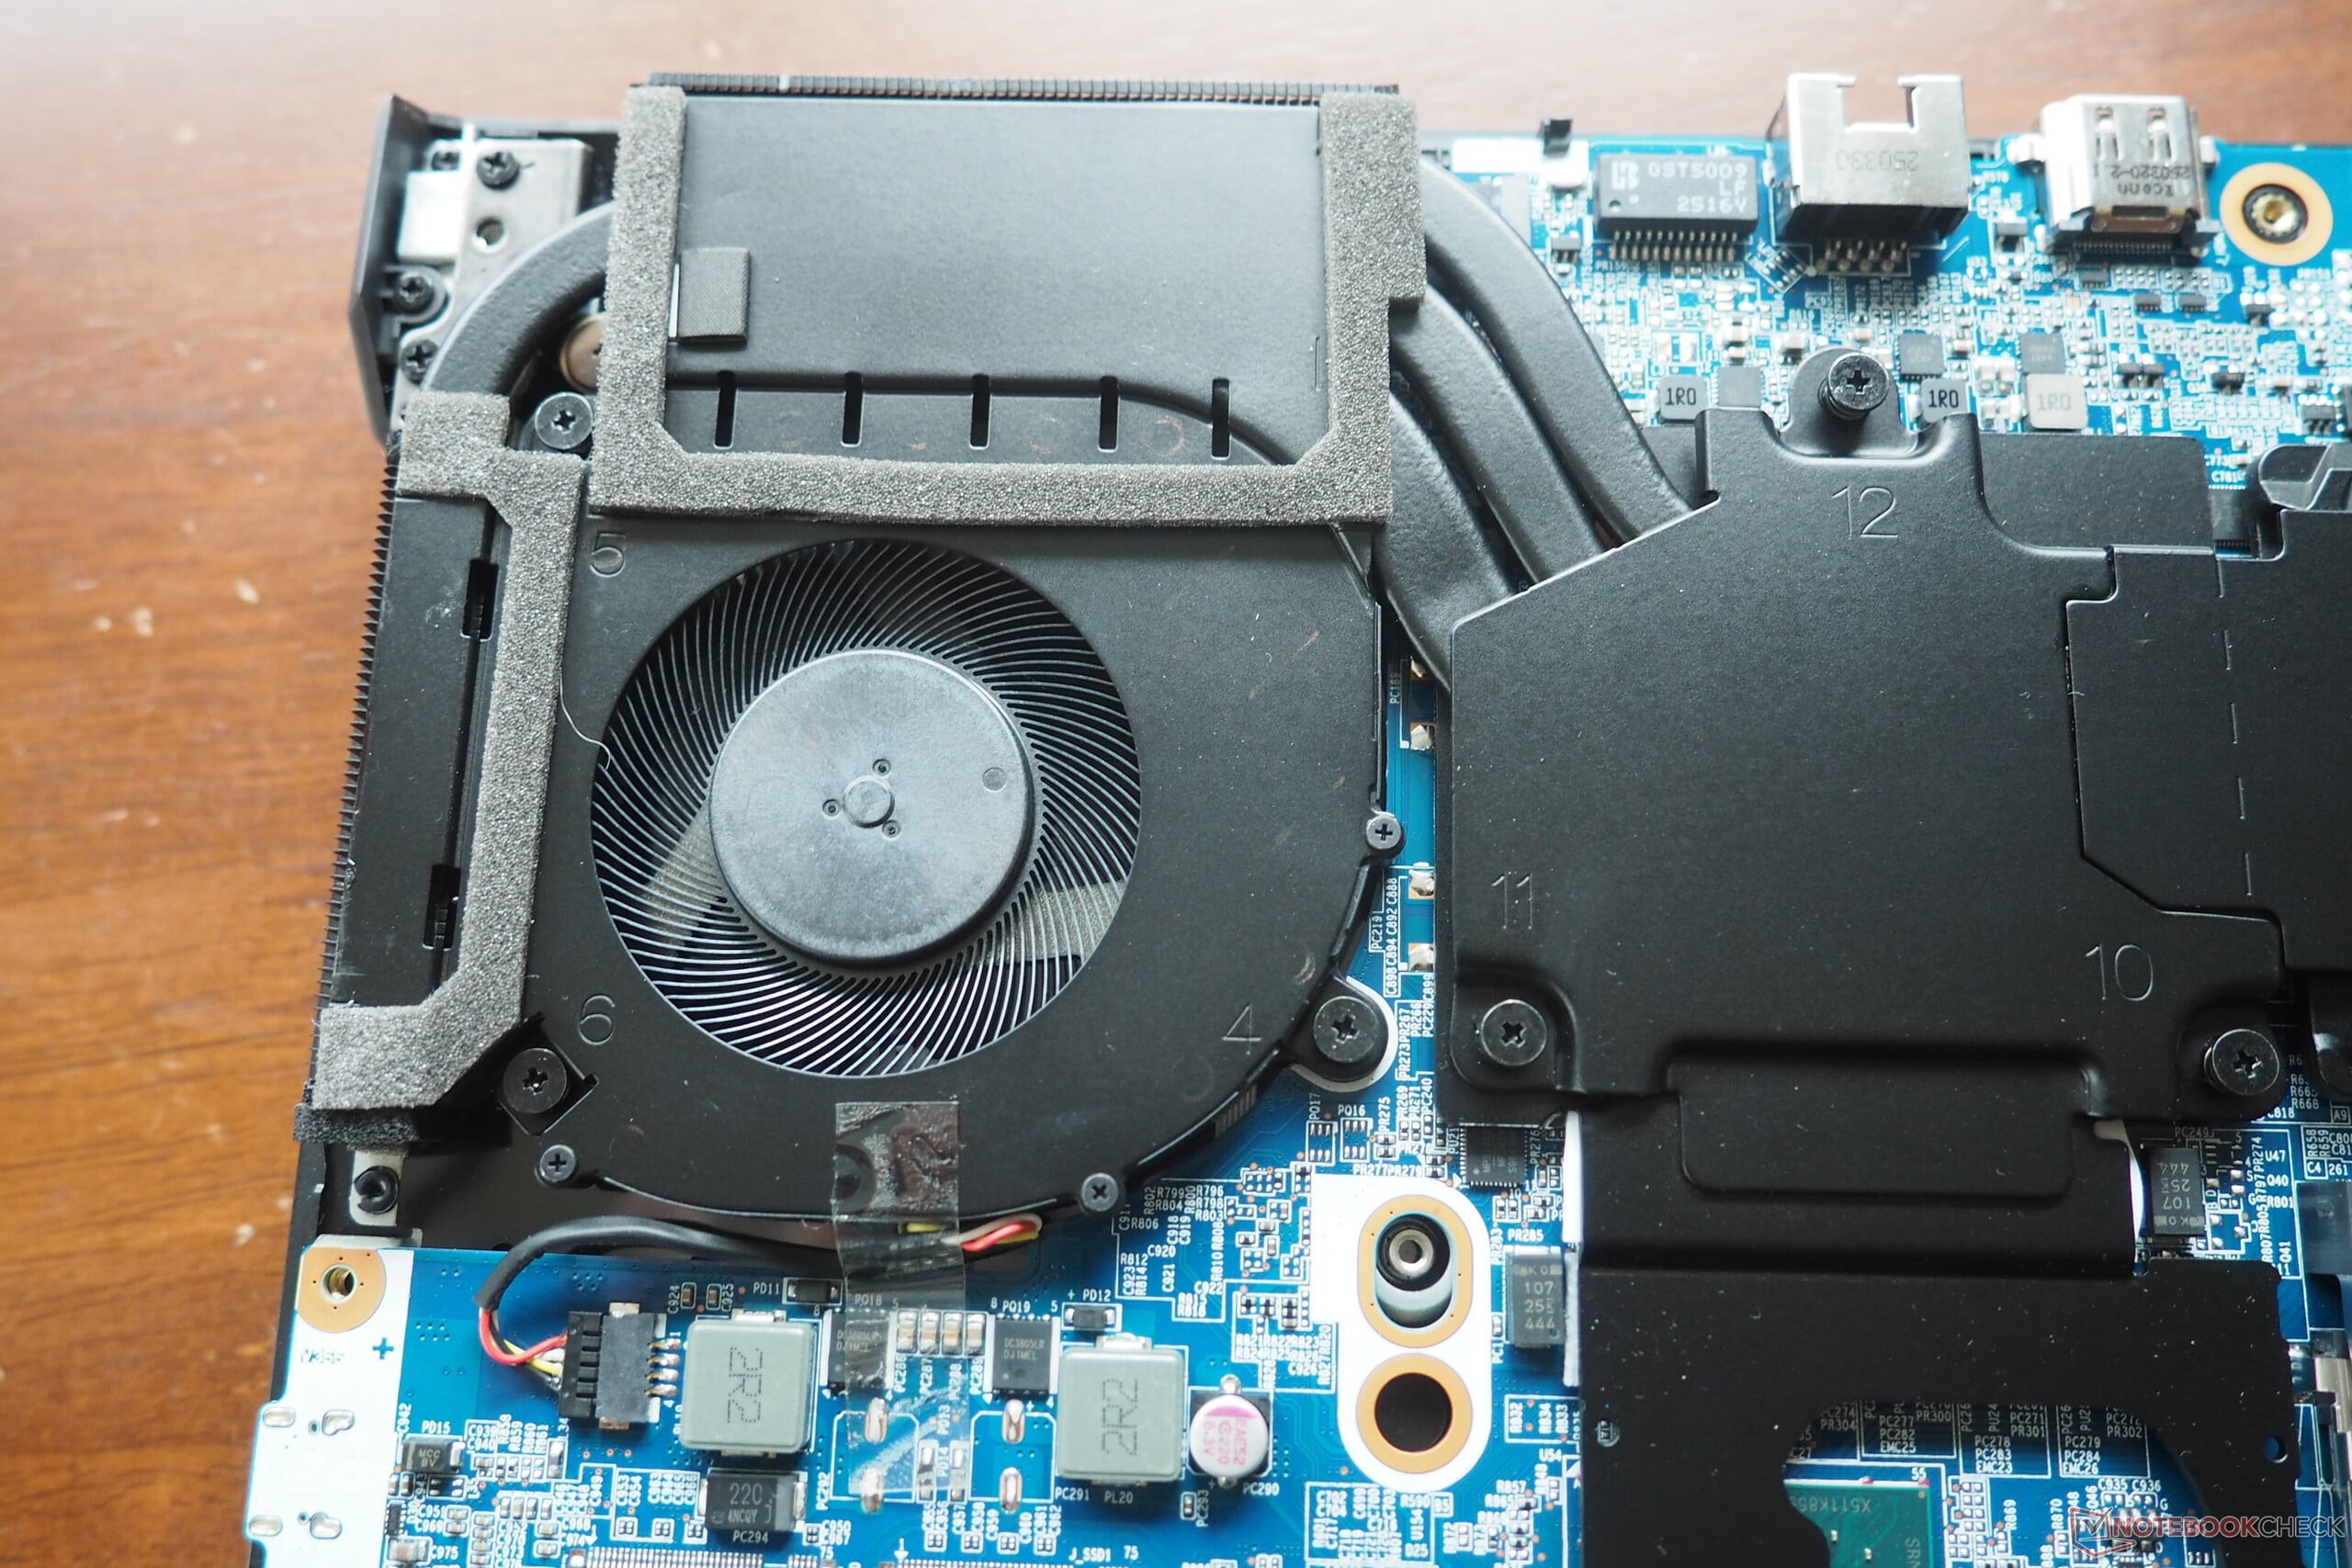
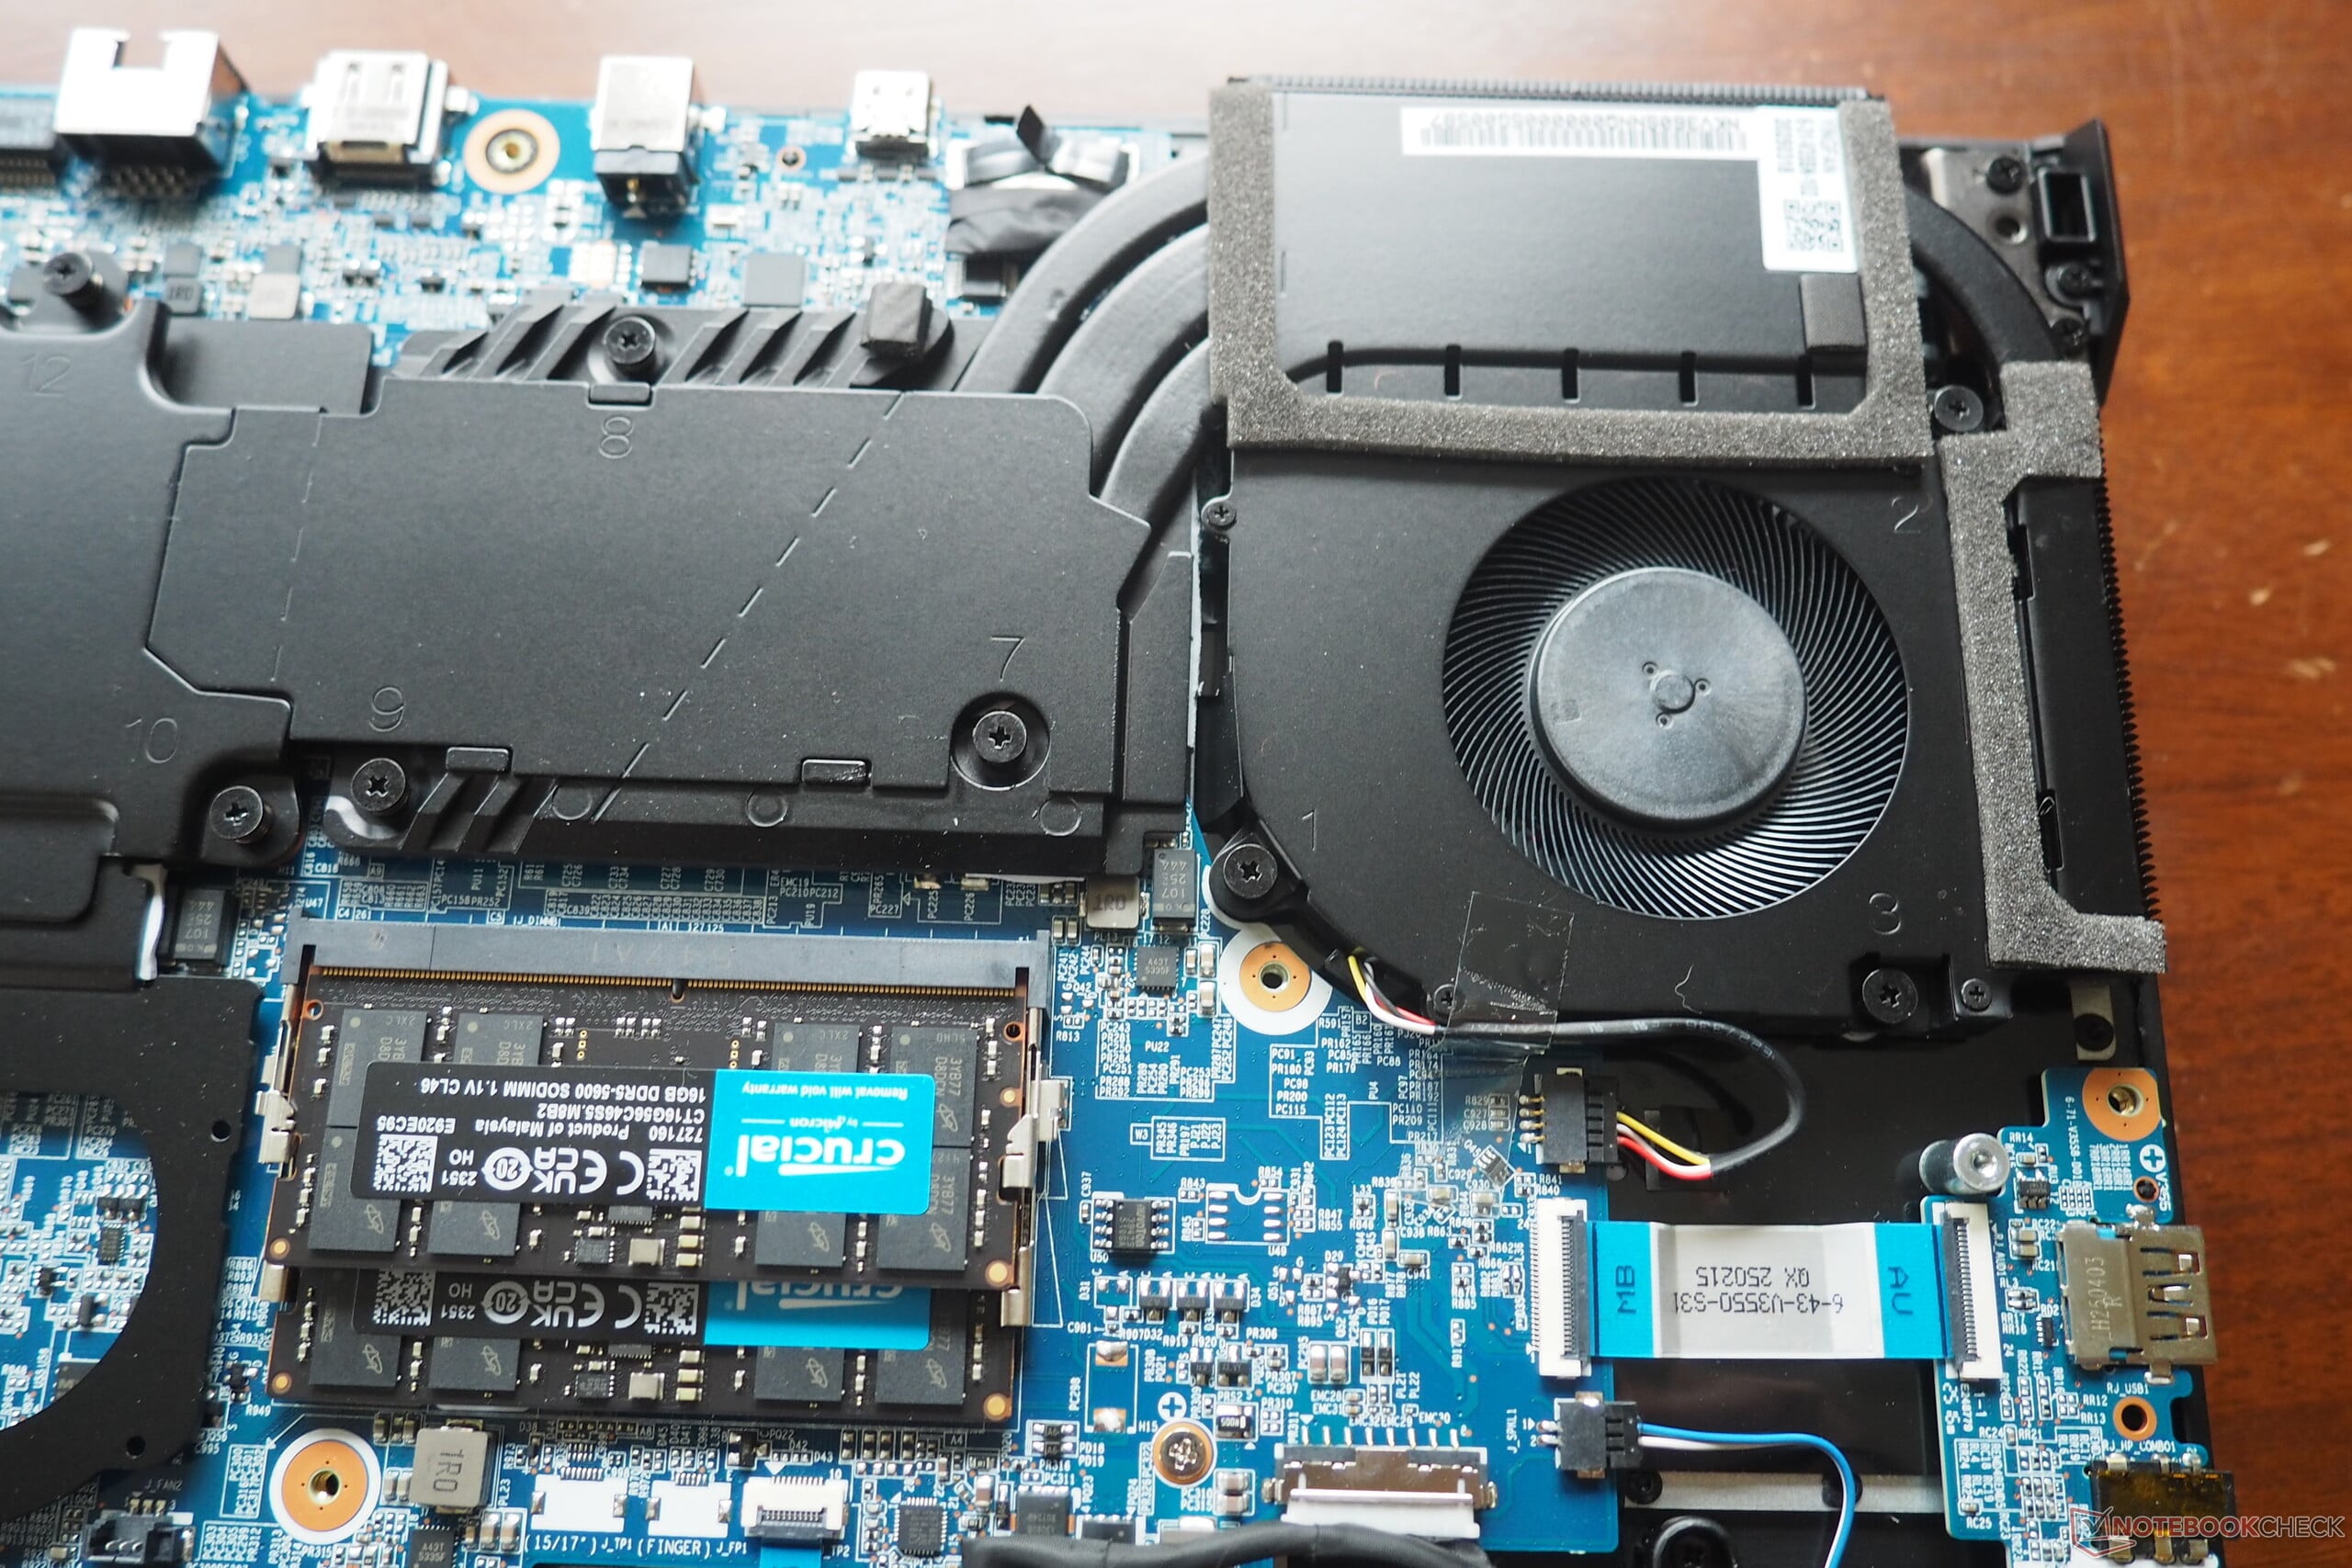
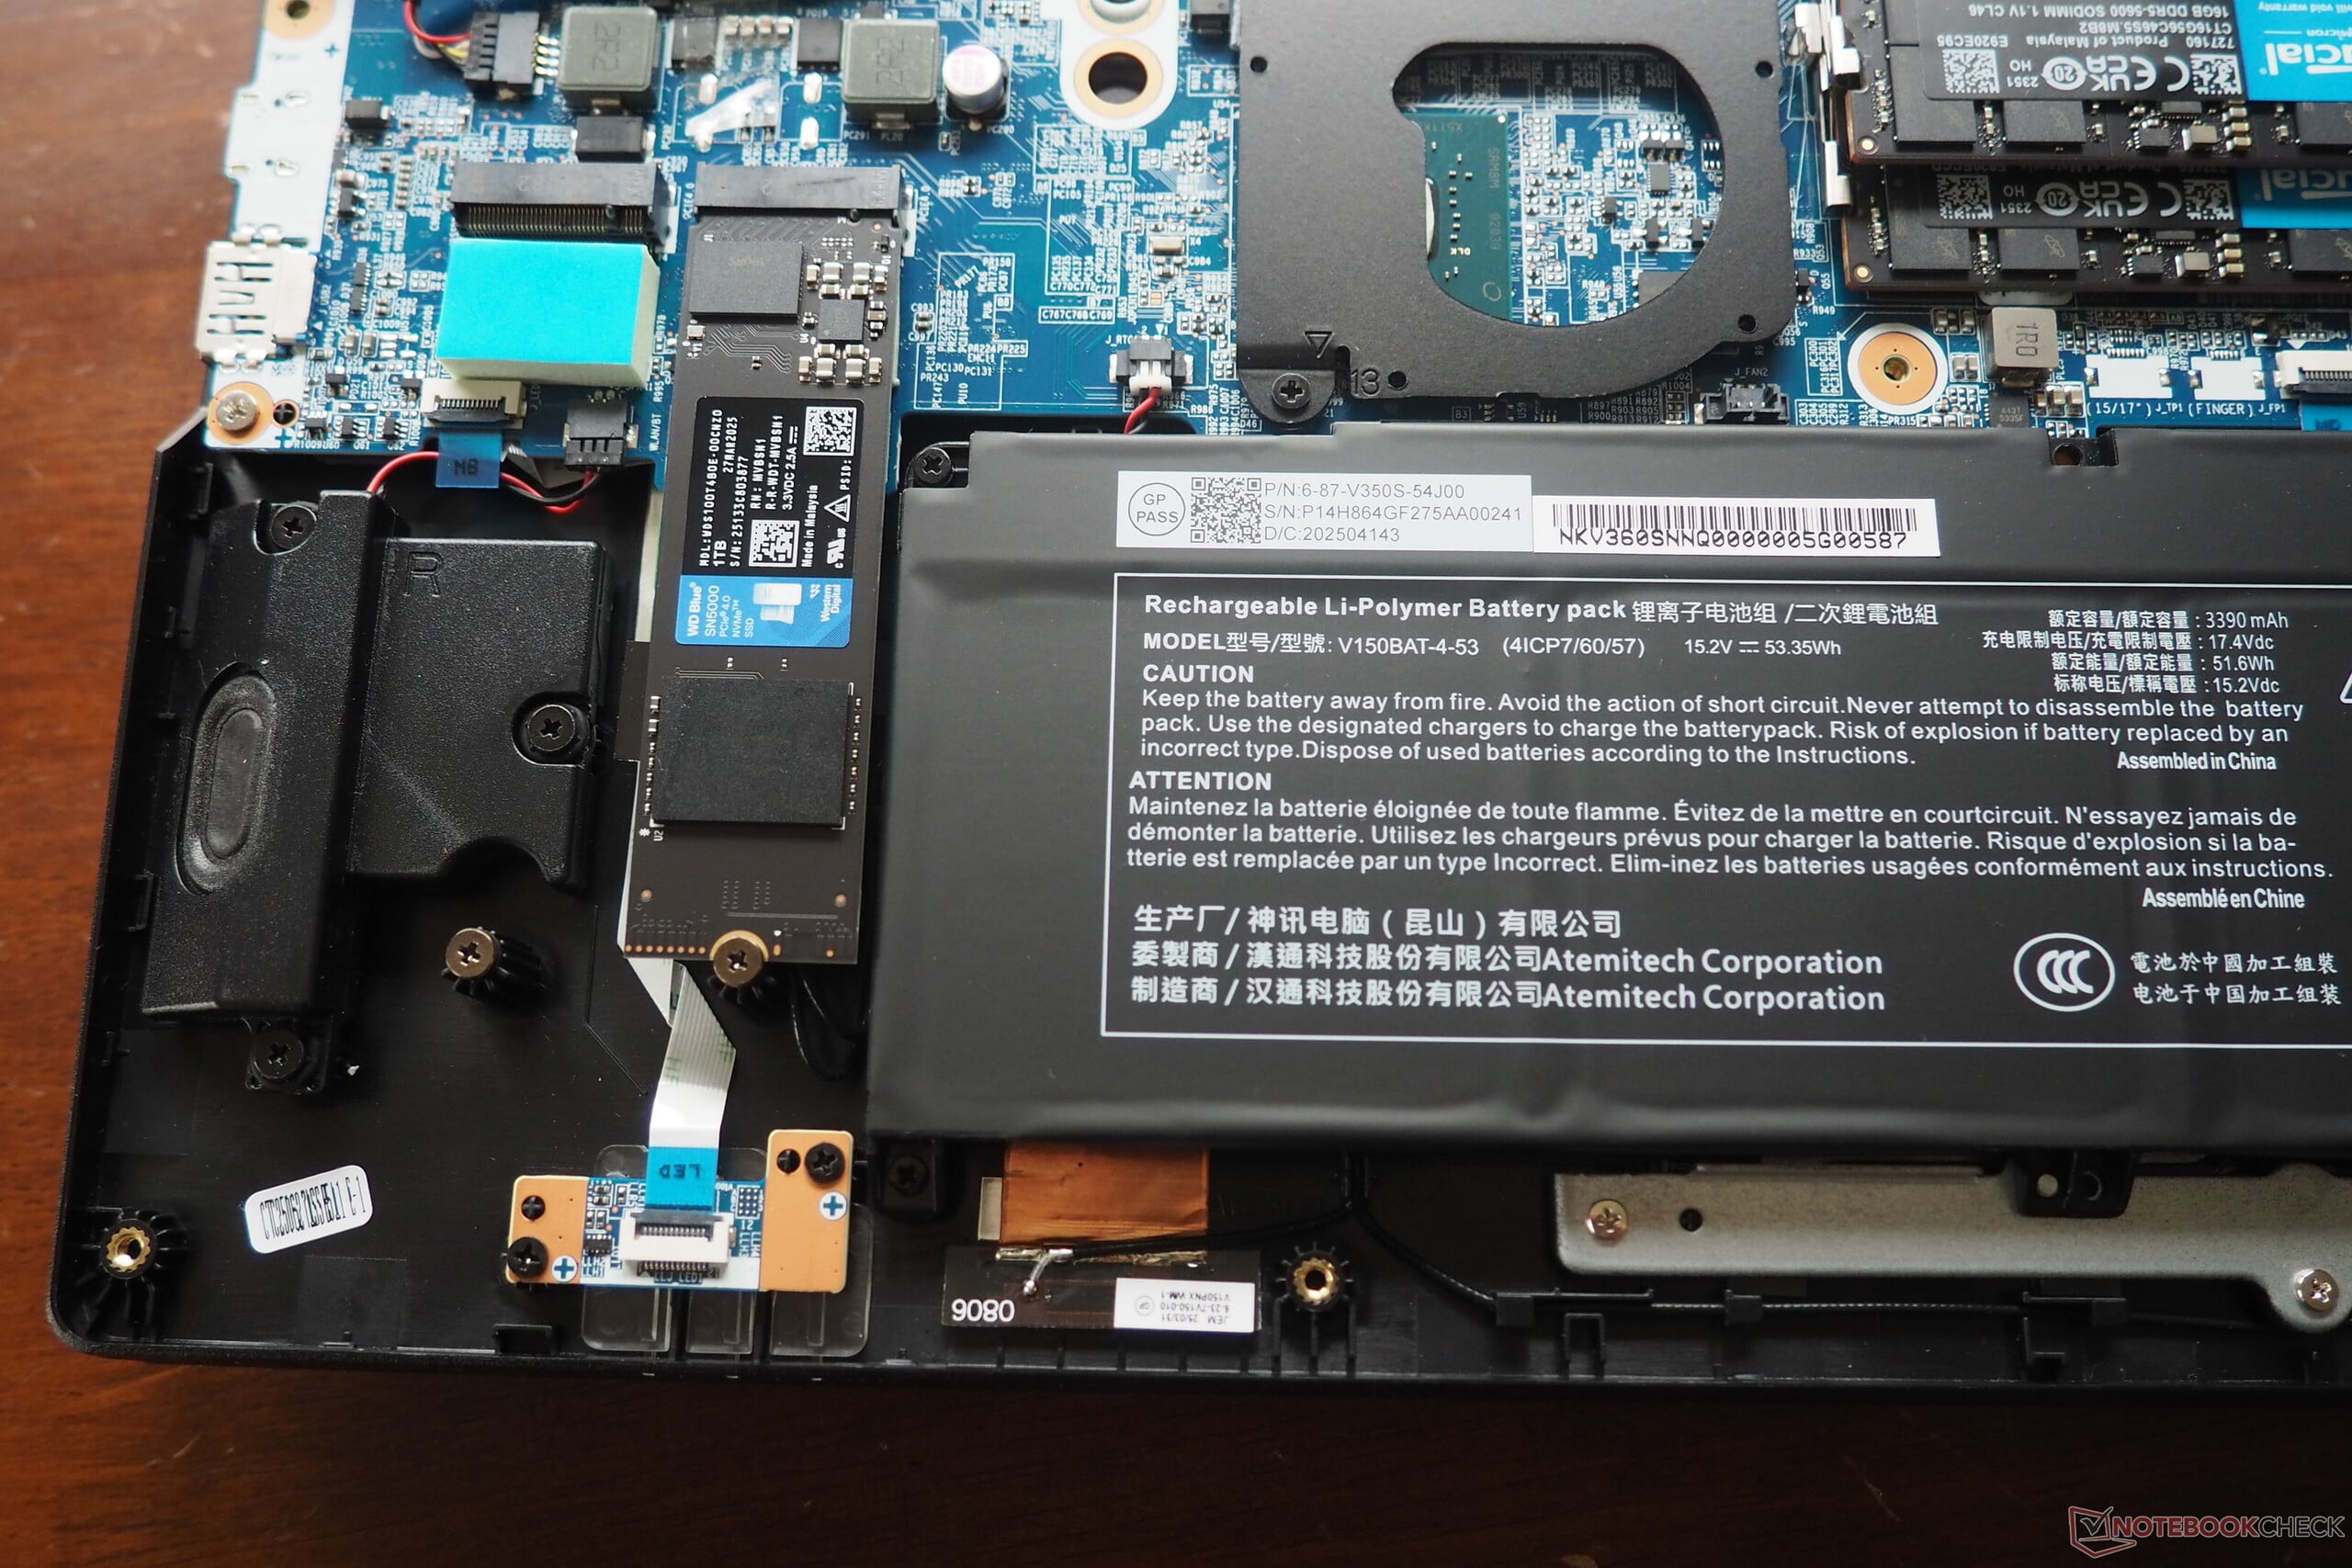
在撬开底盖之前,总共需要卸下 12 颗十字螺丝。在机盖下,你会发现一个带有两个风扇的冷却系统,以及两个内存插槽和两个固态硬盘插槽。电池也可以从这里取出。
可持续性
遗憾的是,包装使用了大量塑料。
保证
Tulpar Notebook 为该设备提供 24 个月的保修服务,并宣传 "终身免费维修服务"。前段时间,我们在柏林拜访了这家制造商,相关文章详细介绍了这项维修服务。
Tulpar S8 V1.1 18 英寸游戏笔记本电脑:纯粹动力带来极致游戏体验
Tulpar S8 V1.1是一款高端游戏笔记本电脑,性能卓越,功能丰富,配备 18 英寸超大显示屏。NVIDIAGeForce RTX 5080 和英特尔酷睿 Ultra 9 275HX 的组合为游戏和苛刻的工作负载提供了最大的动力。强大的冷却系统可确保性能持续稳定,不打折扣。
Tulpar S8 V1.1 的一个突出特点是其专为游戏玩家设计的 IPS LED 面板。2560×1600 分辨率、240 Hz 刷新率,18 英寸超大屏幕可提供生动、超流畅的游戏体验。该显示器还支持 NVIDIA G-SYNC,100% 覆盖 DCI-P3 色彩空间,非常适合创意专业人士使用。
Tulpar S8 V1.1 像台式电脑一样配备齐全,支持高达 192 GB 的 DDR5-4400 内存,并提供四个 M.2 SSD 插槽,消除了对内存或存储限制的担忧。该笔记本电脑还包括双 RJ45 端口、HDMI 2.1 和两个 Thunderbolt 5(DisplayPort 2.1)端口。强大的五扬声器音响系统为您带来更优质的体验。
Tulpar S8 V1.1 可在Tulpar 网上商店进行完全定制,以满足您的确切要求。
输入设备
键盘
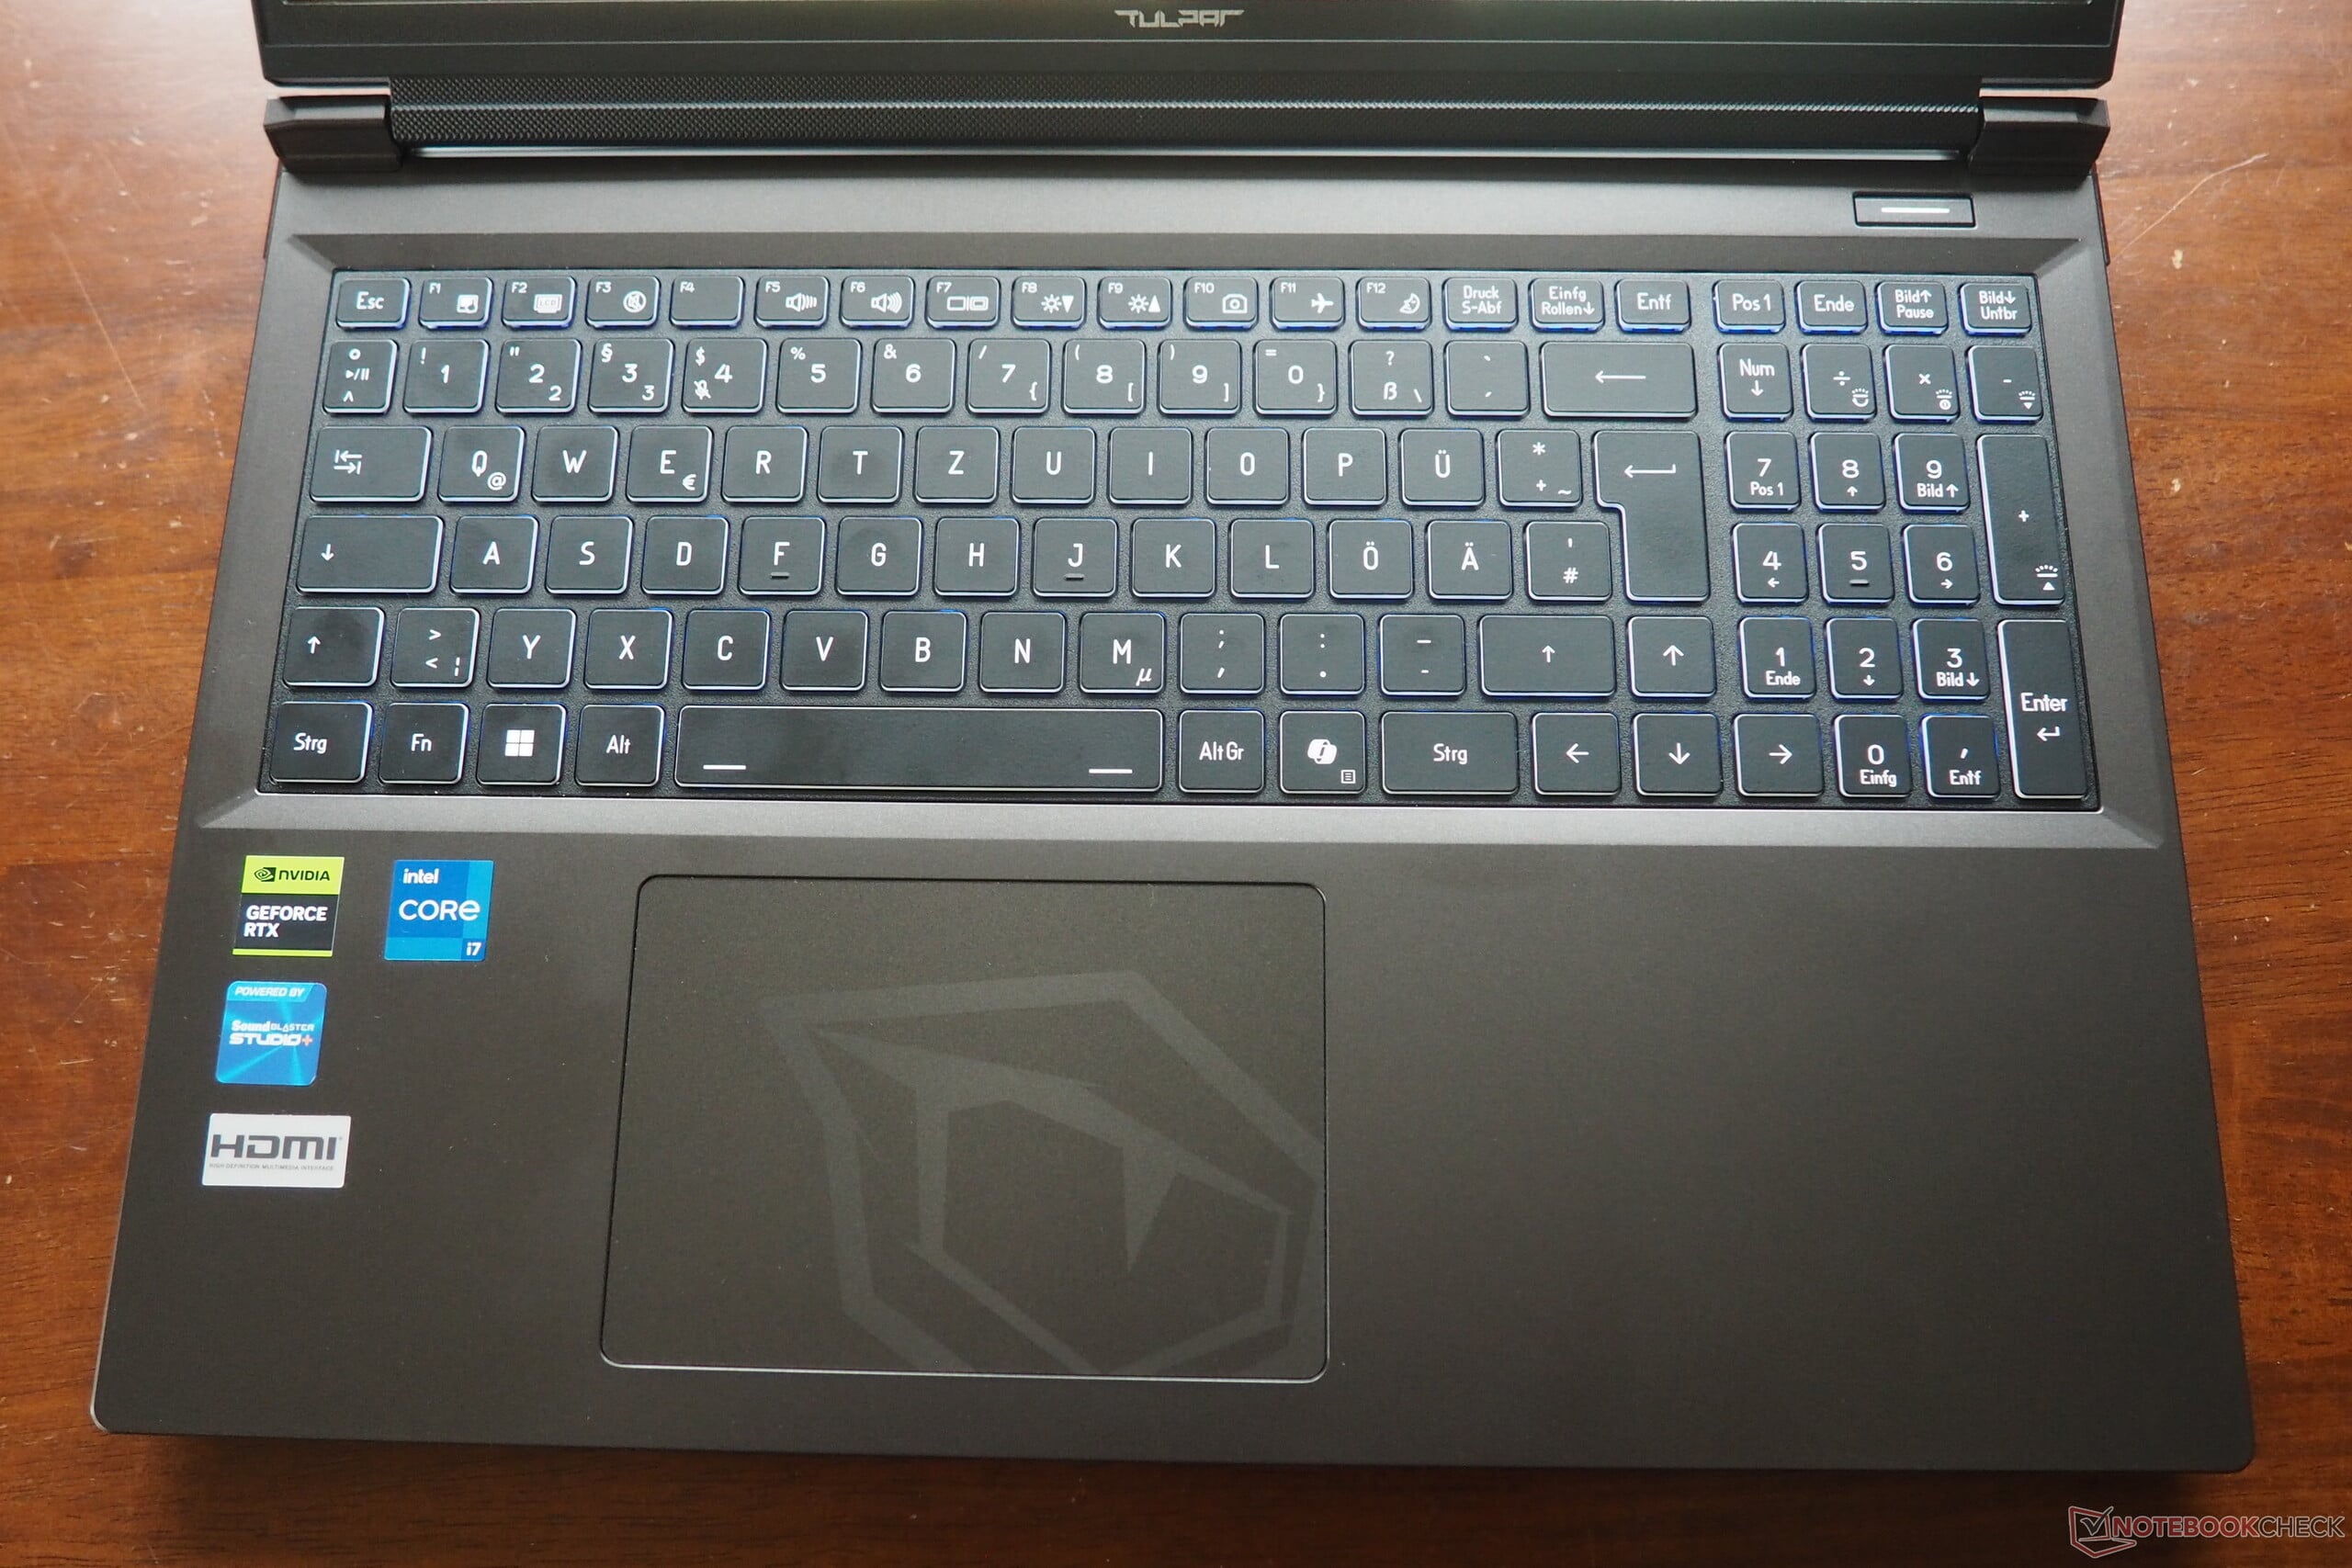
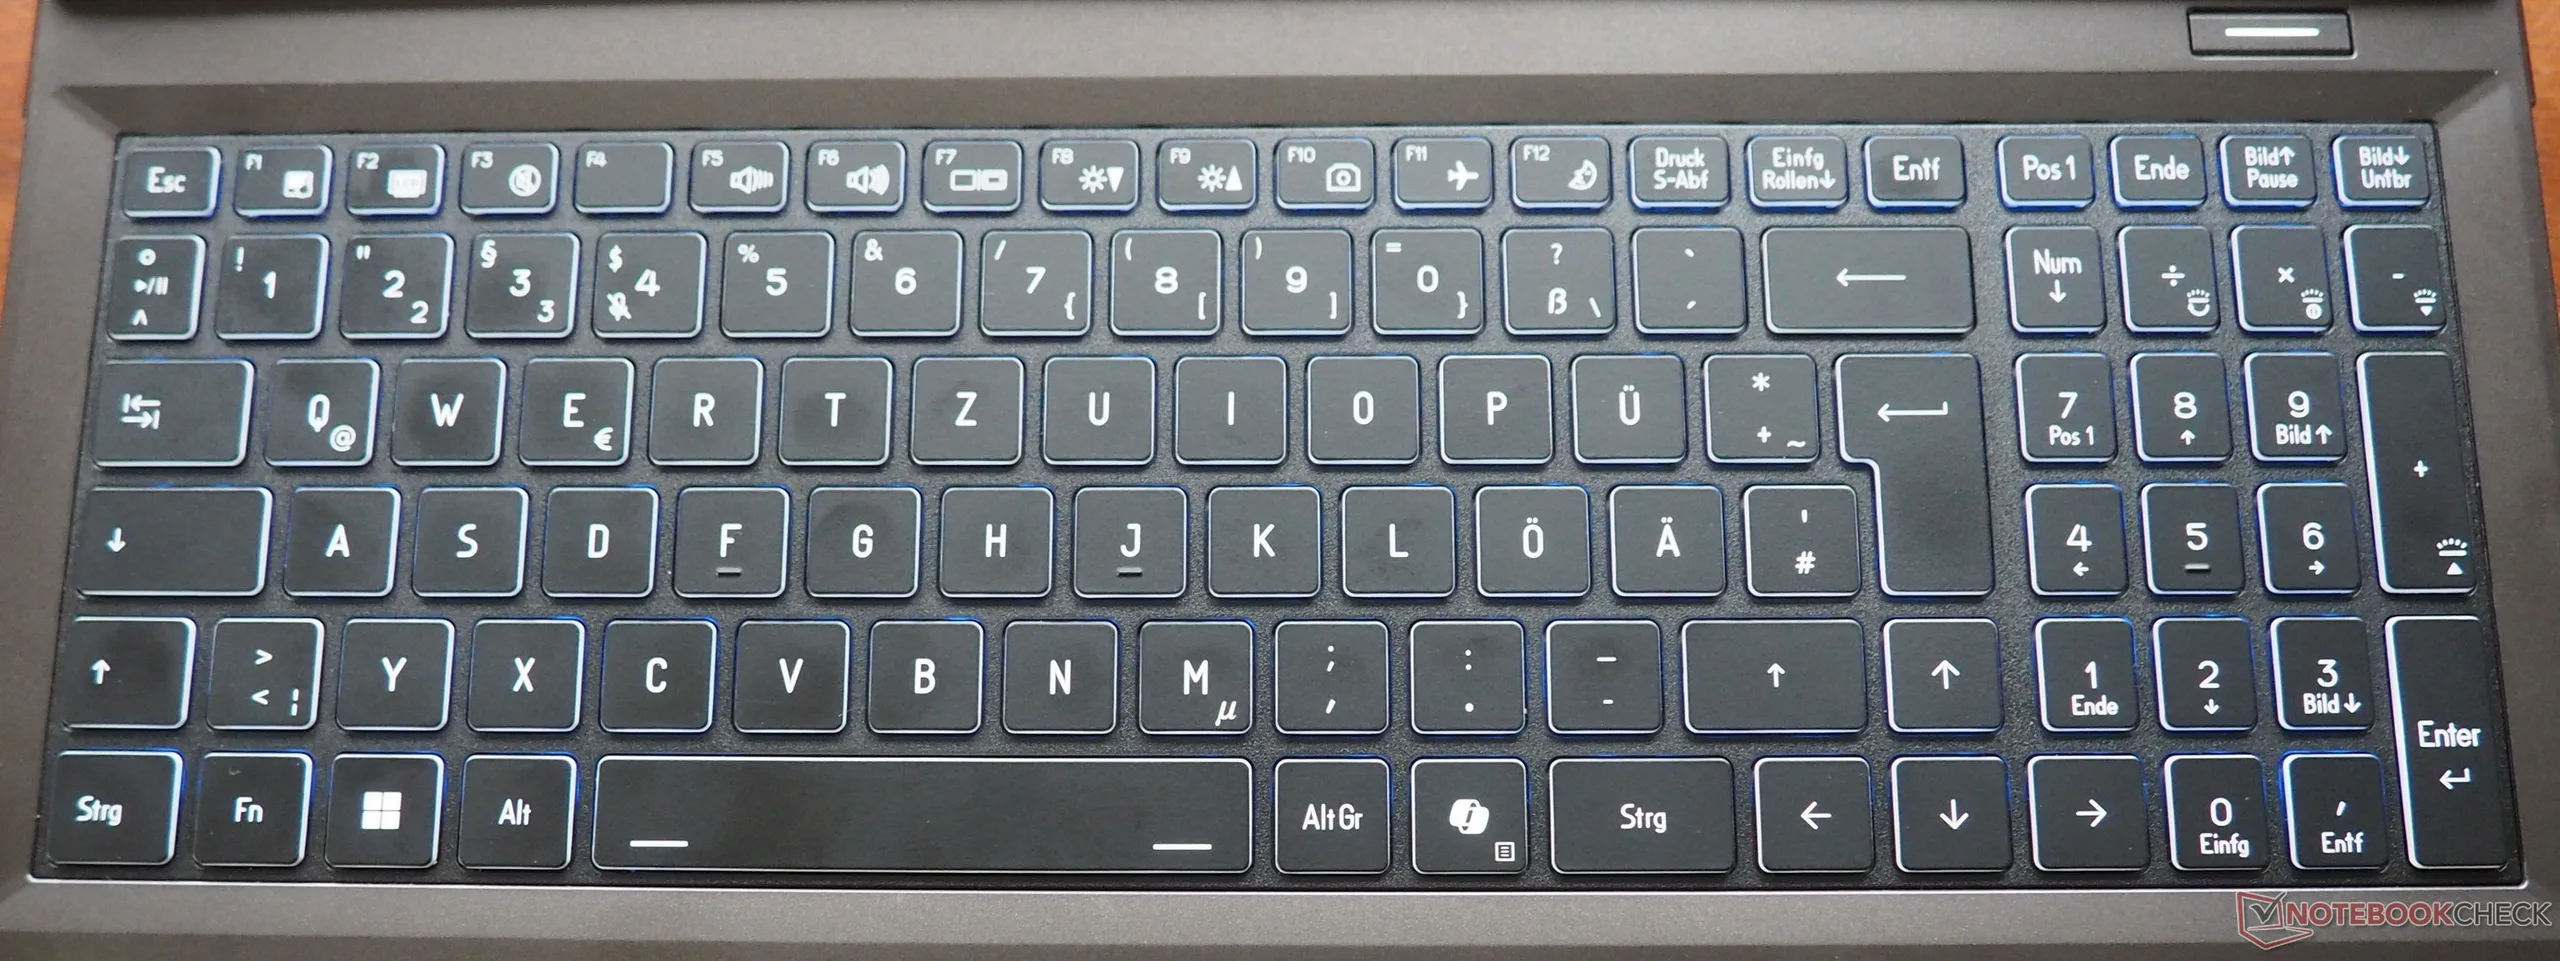
无论好坏,键盘在大多数方面并不突出。不过,键盘布局是一个亮点,因为它紧贴标准布局,方向键大小适中。打字手感尚可,但背光即使在最高设置下也可以更亮一些。
触摸板
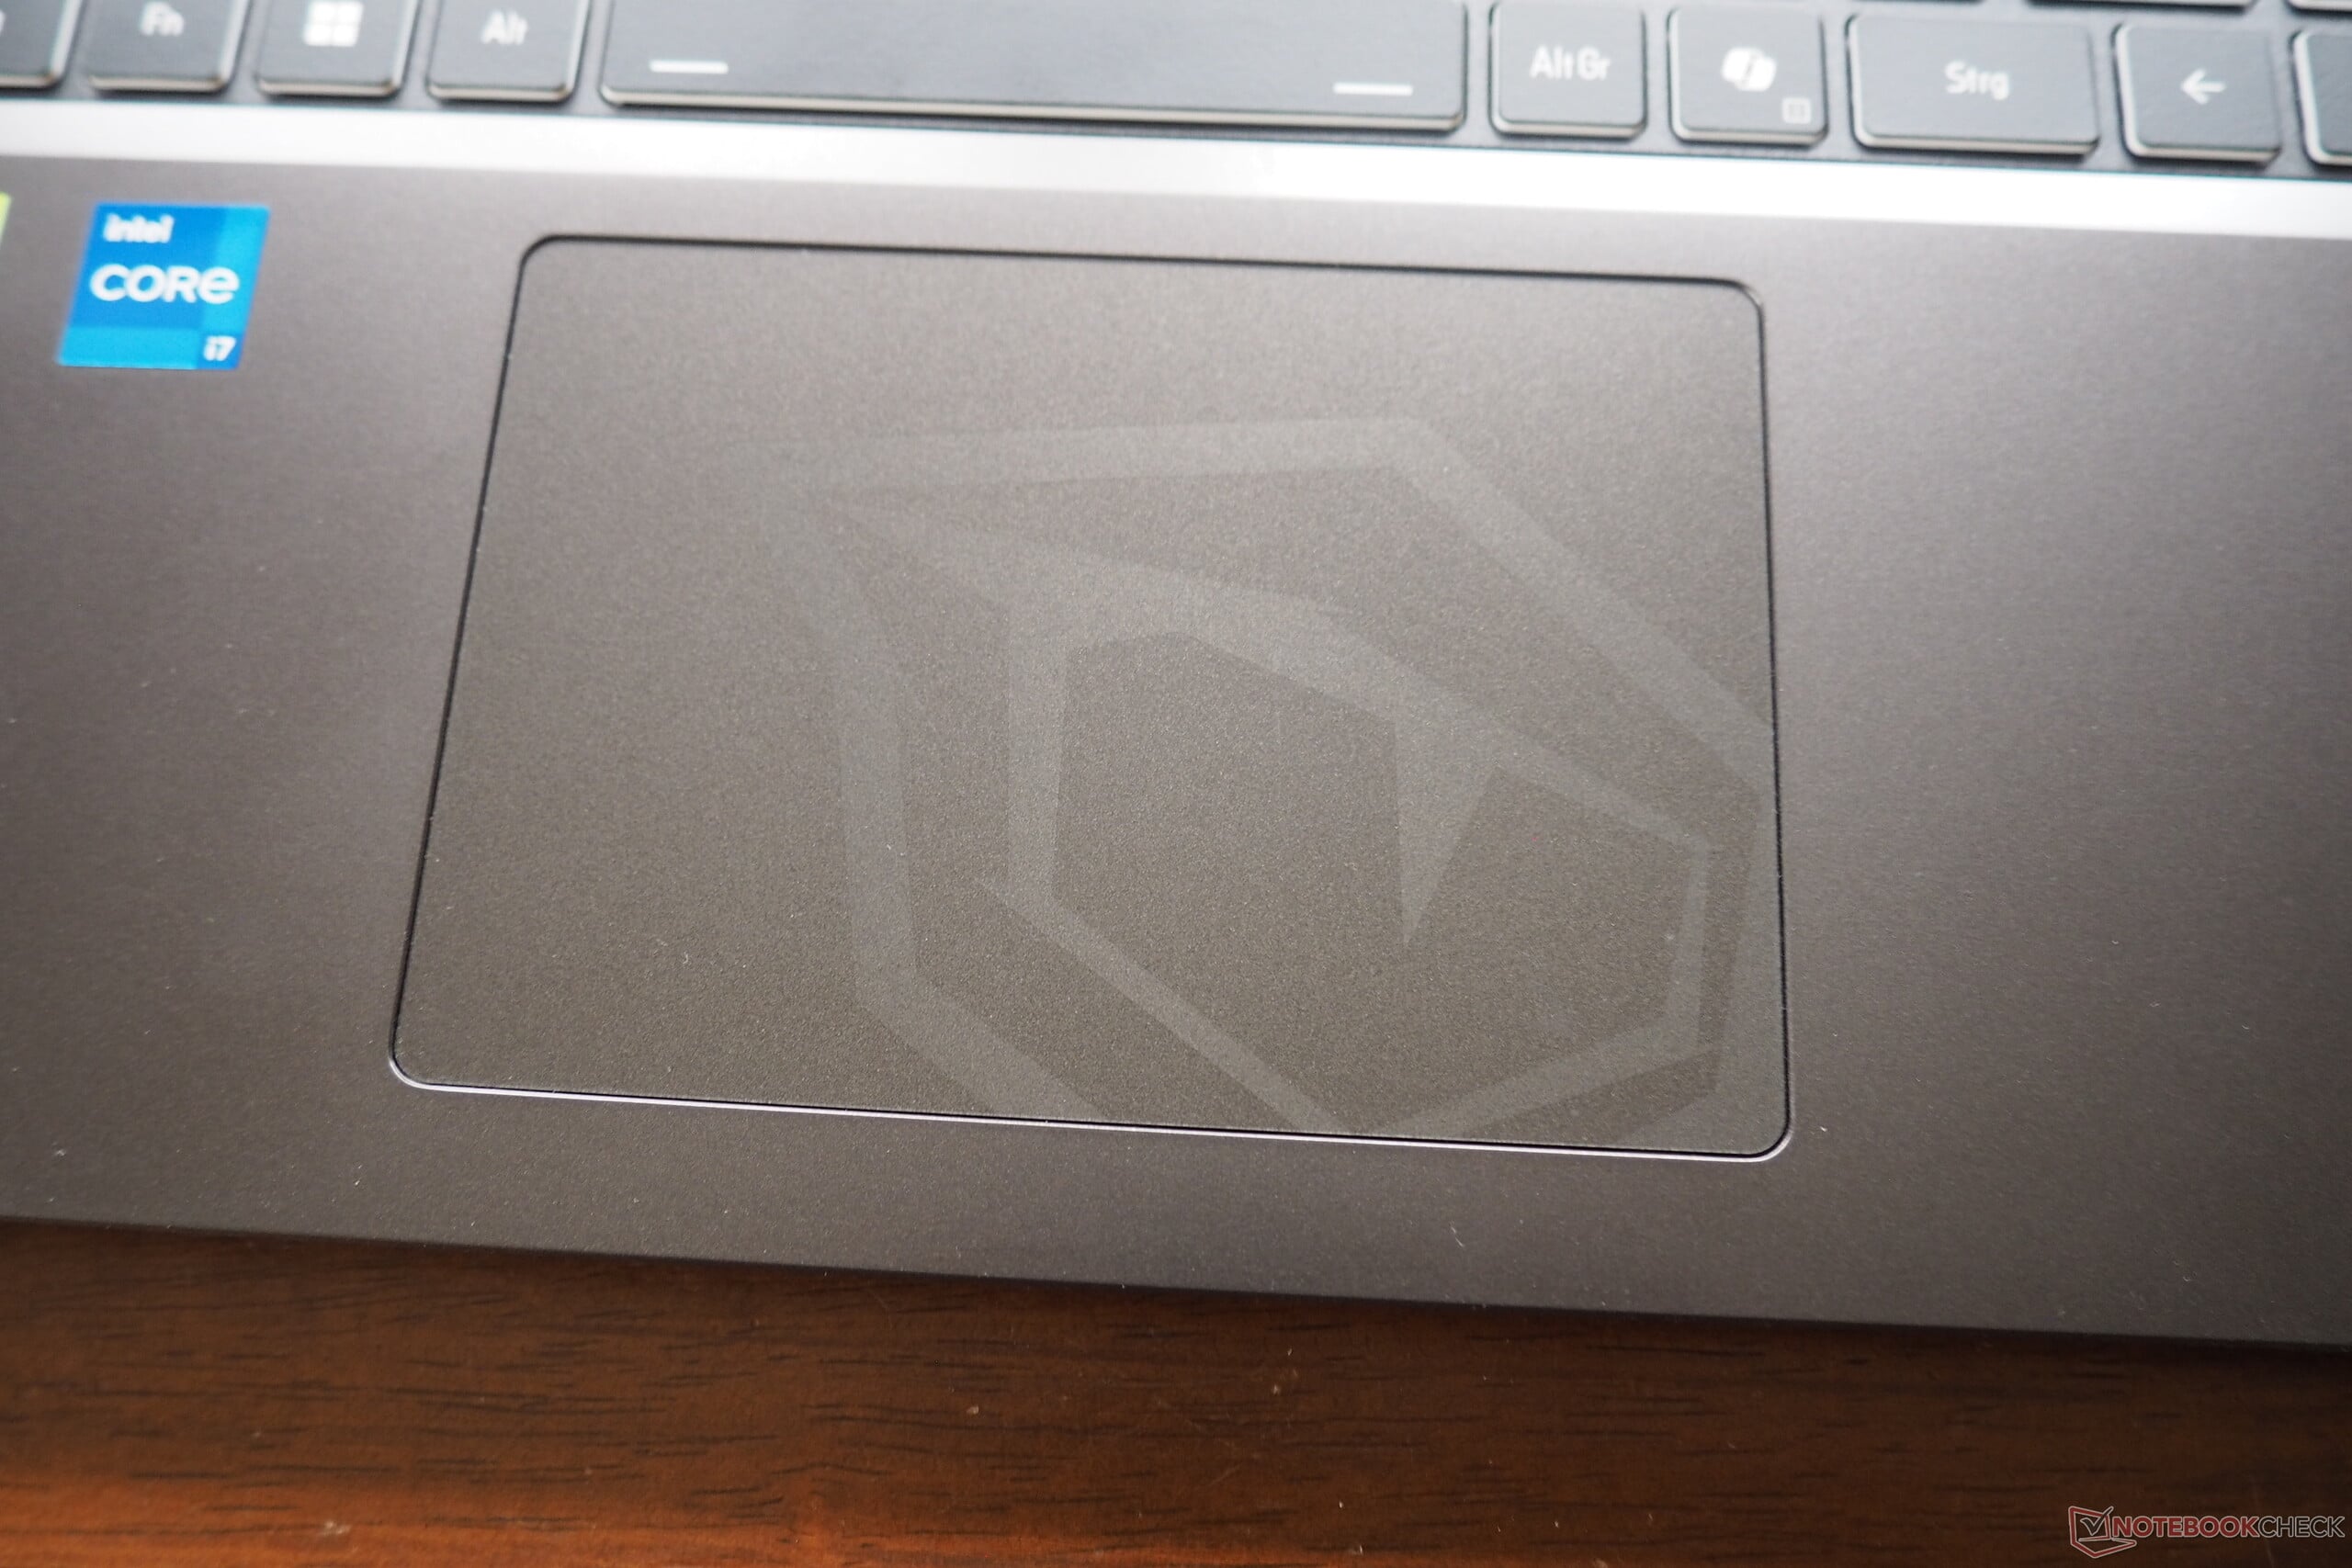
触摸板仍有改进的余地,因为手势识别并不总是很可靠。尽管如此,它仍能提供稳定的精度和流畅的滑动。对于一款 16 英寸的笔记本电脑来说,大约 12.1 x 8.3 厘米的表面积绰绰有余。与其他几款竞争对手的产品一样,点击机构的声音有点嘎吱嘎吱的。
显示屏
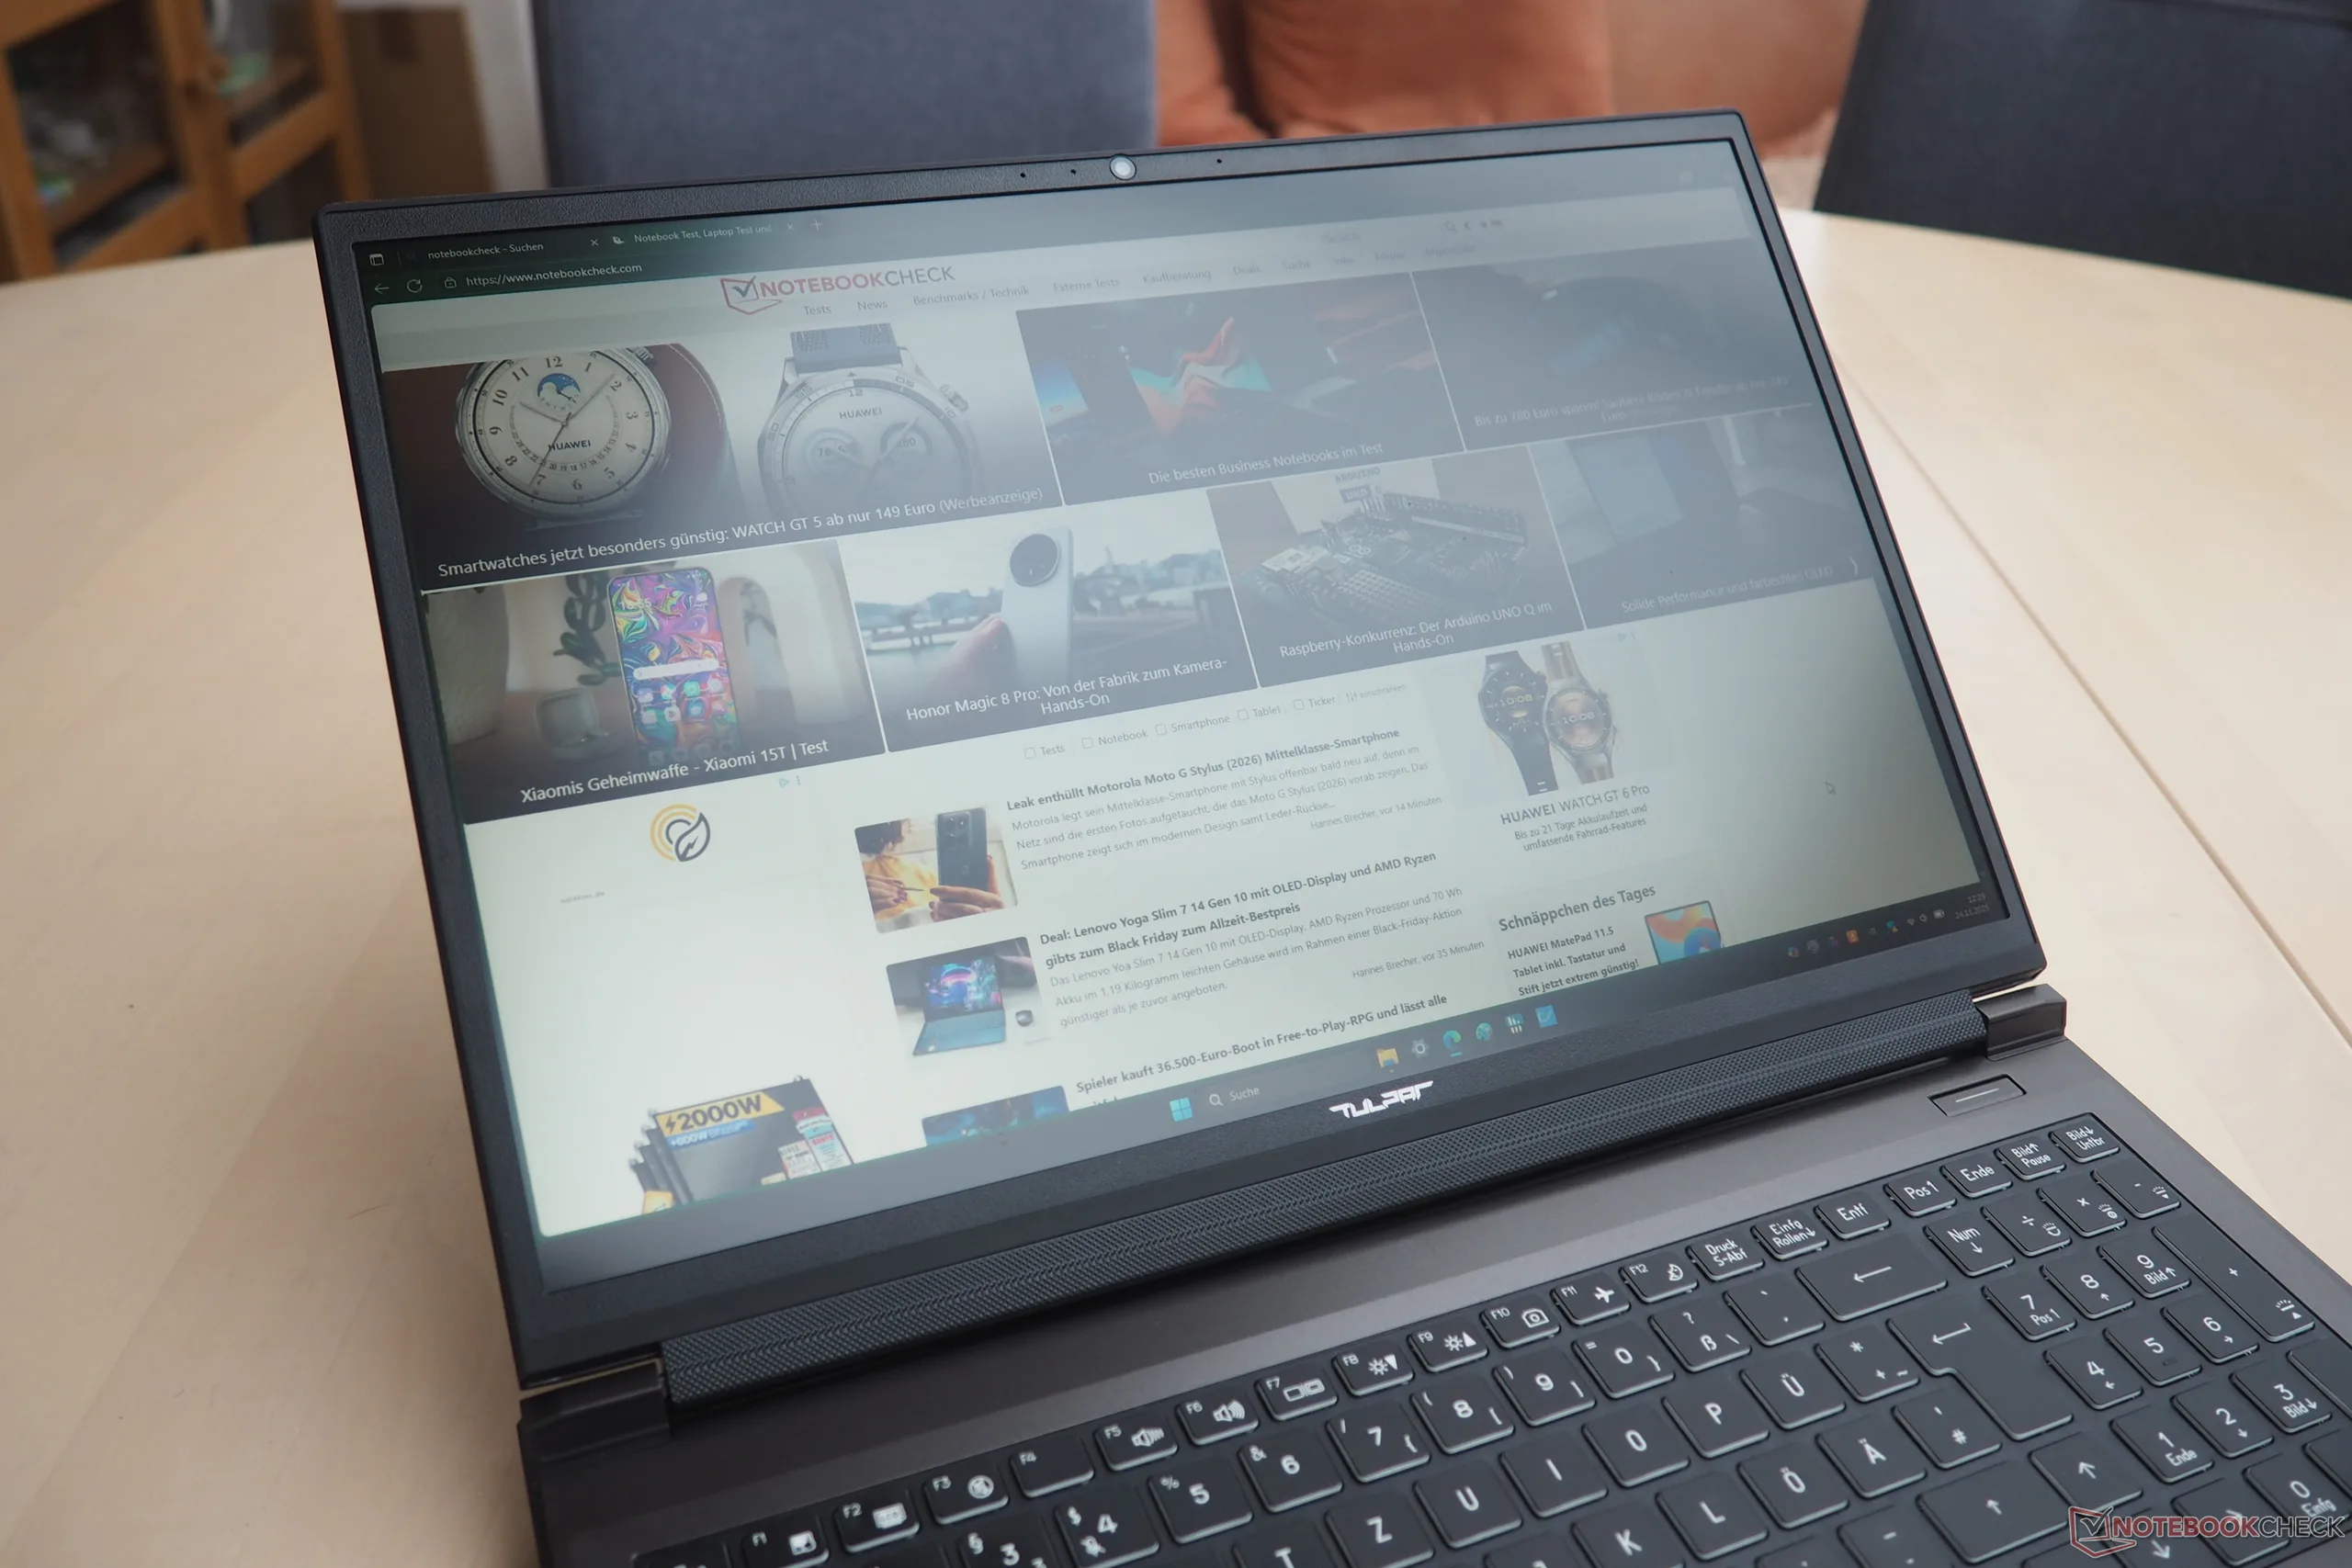
T6 V3.5 采用 165 Hz 雾面面板。它的平均亮度为 403 cd/m²,对于 IPS 显示屏来说是相当不错的,只要阳光不是太强烈或直接照射到屏幕上,笔记本电脑在光线较强的环境中也能正常使用。
| |||||||||||||||||||||||||
Brightness Distribution: 79 %
Center on Battery: 456 cd/m²
Contrast: 1169:1 (Black: 0.39 cd/m²)
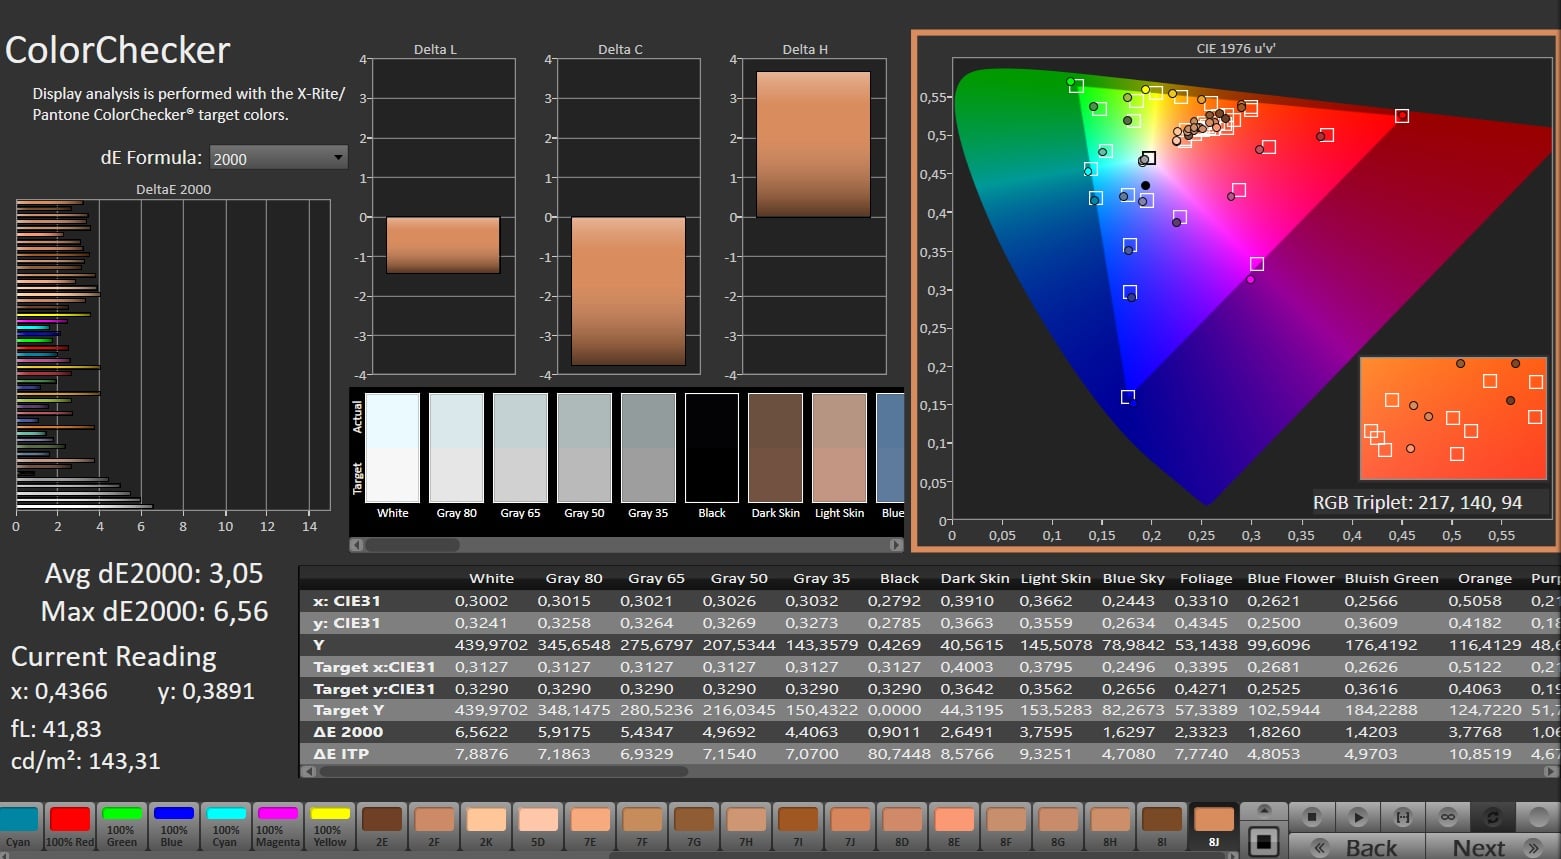
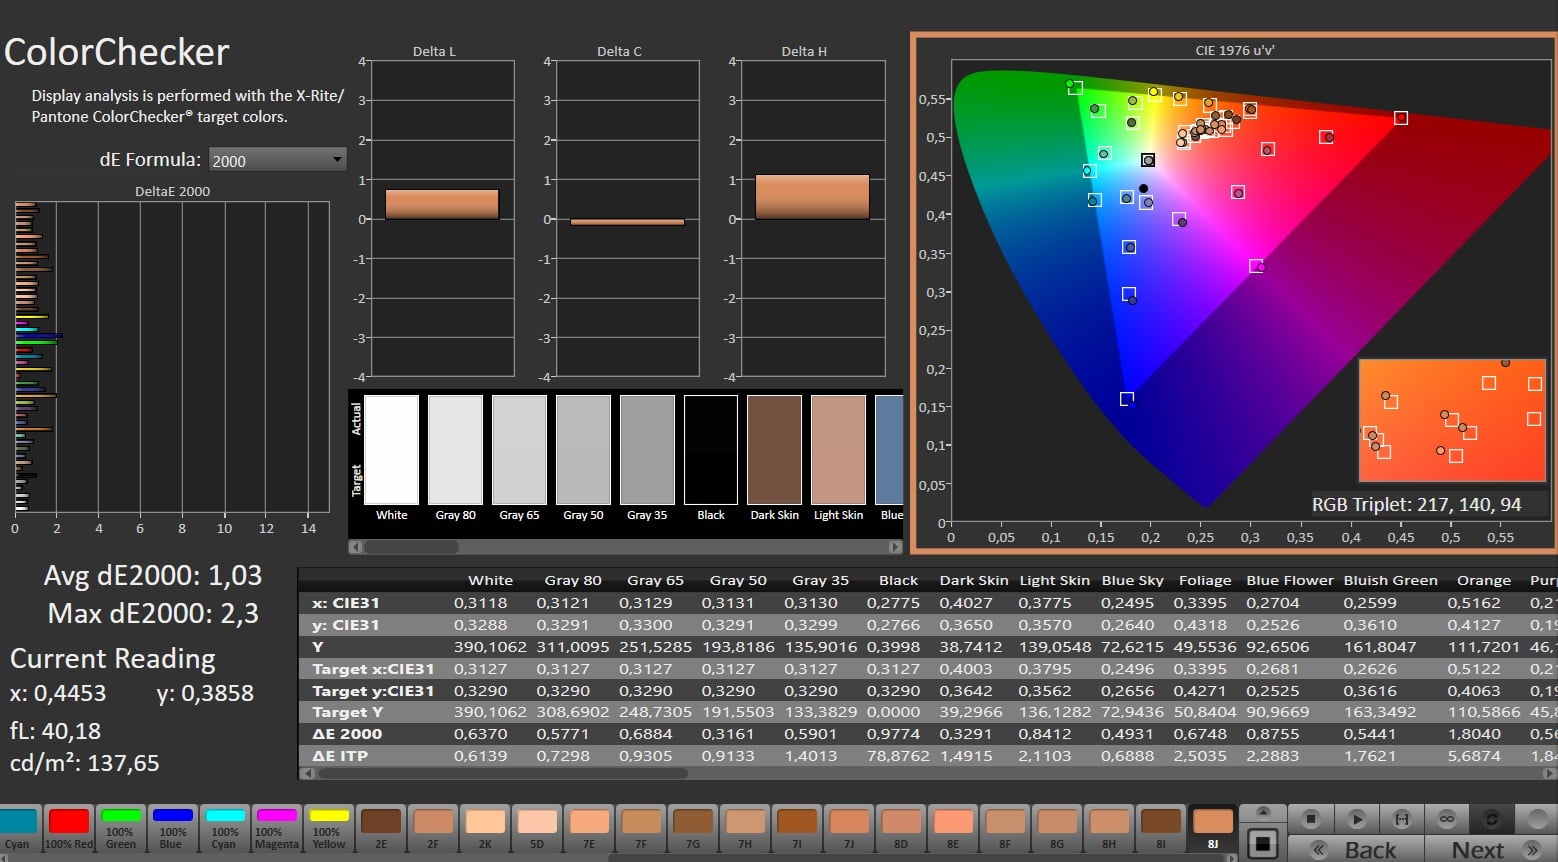
ΔE ColorChecker Calman: 3.05 | ∀{0.5-29.43 Ø4.72}
calibrated: 1.03
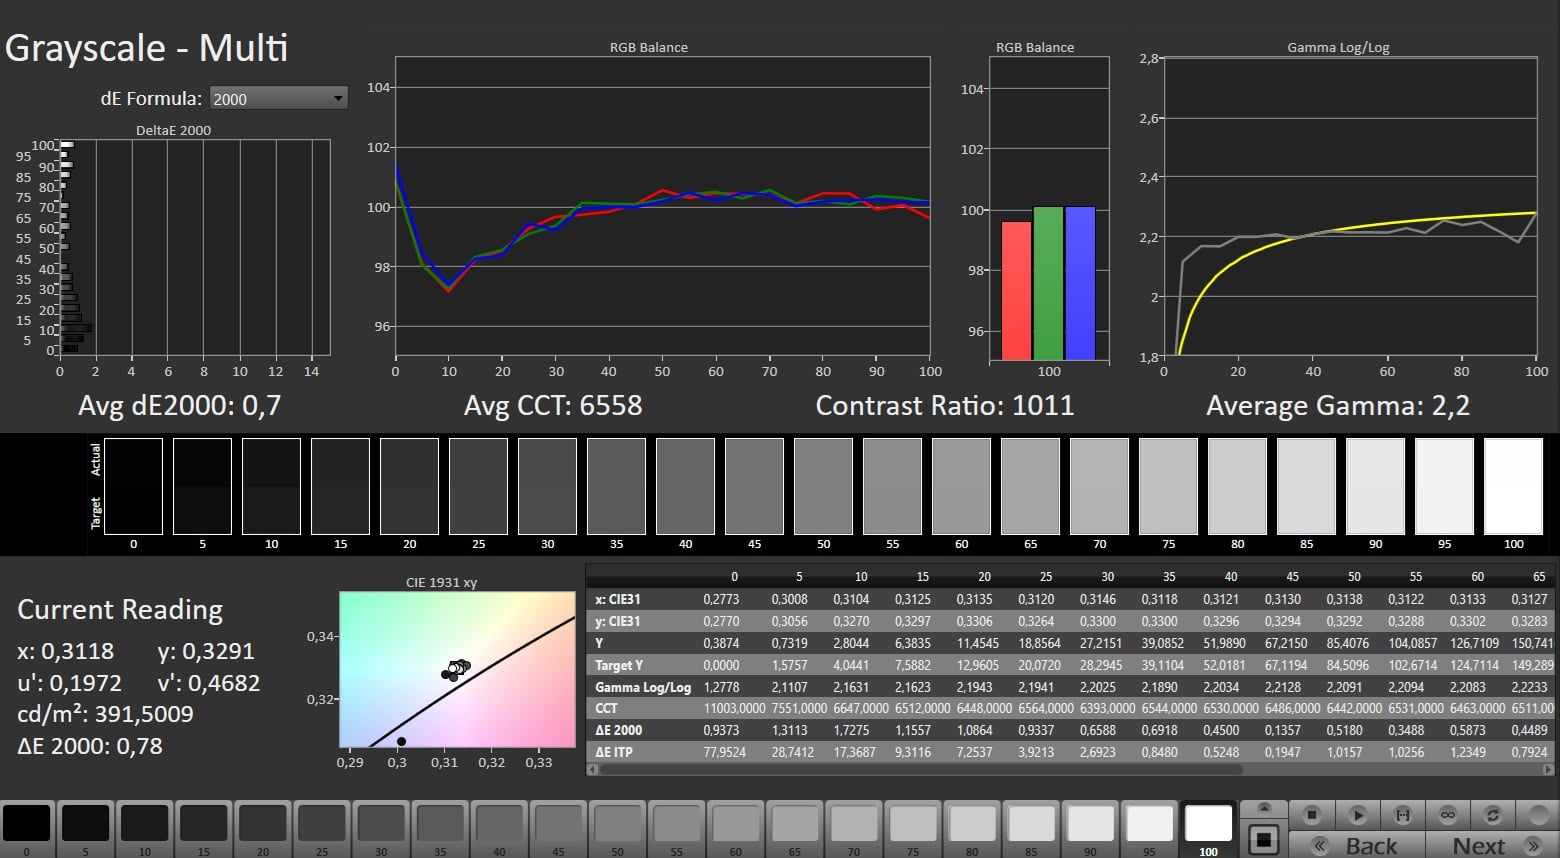
ΔE Greyscale Calman: 3.9 | ∀{0.09-98 Ø4.97}
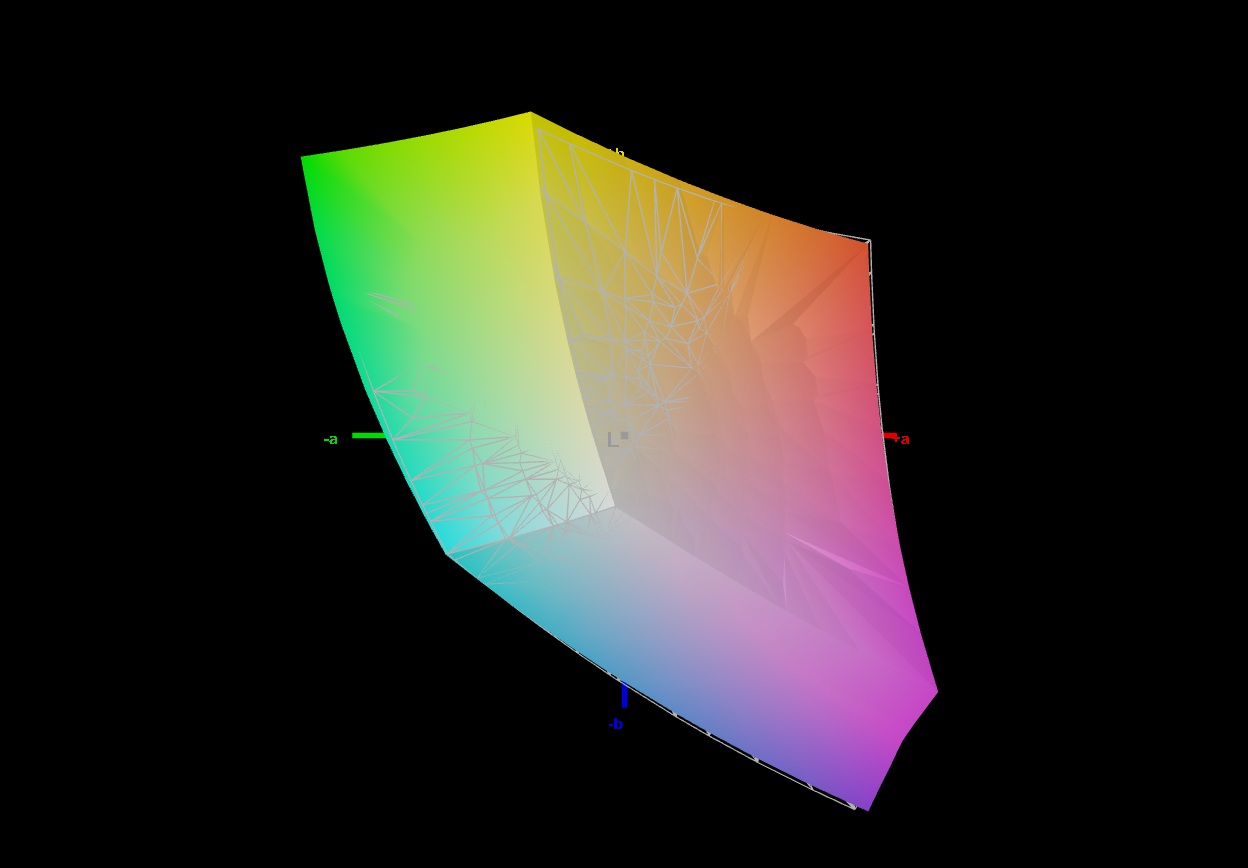
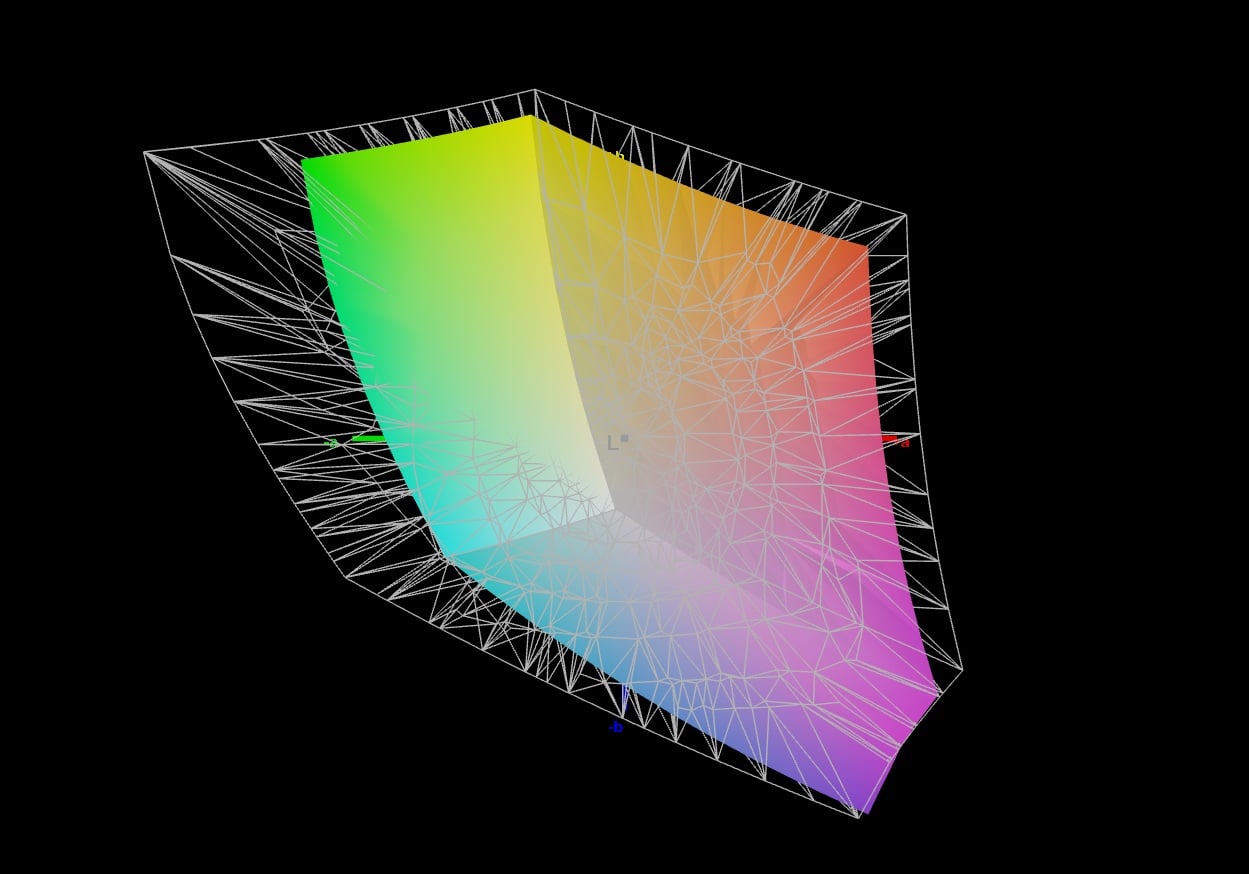
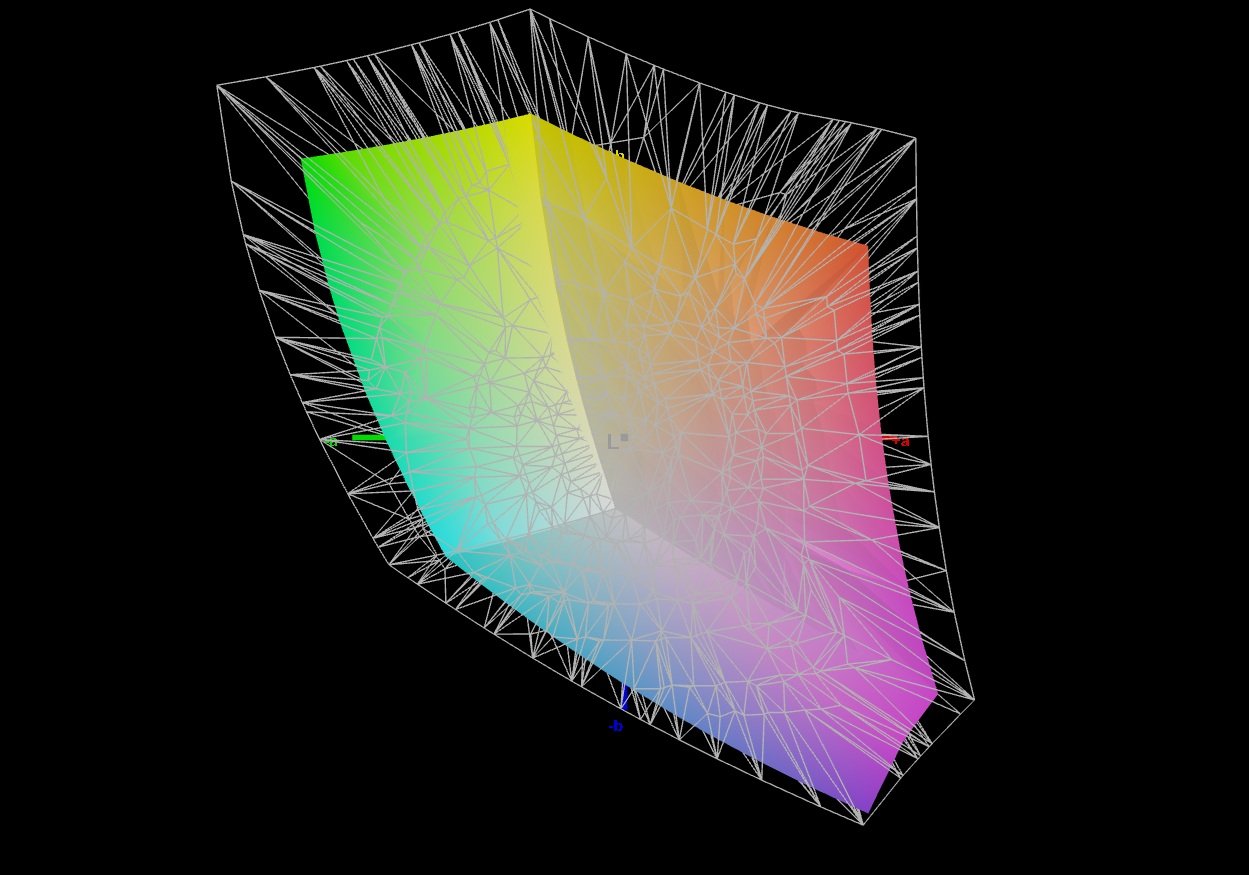
70.6% AdobeRGB 1998 (Argyll 3D)
98.7% sRGB (Argyll 3D)
68.6% Display P3 (Argyll 3D)
Gamma: 2.279
CCT: 7198 K
| Tulpar T6 V3.5 B160UANAC.J (AUO33B7), IPS, 1920x1200, 16", 165 Hz | Acer Nitro V 16 AI ANV16-42-R860 B160UAN08.3 (AUO2CB8), IPS, 1920x1200, 16", 180 Hz | Alienware 16 Aurora BOE NE16N41, IPS, 2560x1600, 16", 120 Hz | HP Omen 16-ap0091ng AUODBB2, IPS, 1920x1200, 16", 144 Hz | Lenovo Legion 5 15AHP G10 LEN151WQXGA, OLED, 2560x1600, 15.1", 165 Hz | Gigabyte Gaming A16 GA6H NE160QDM-NYJ (BOE0C80), IPS, 2560x1600, 16", 165 Hz | |
|---|---|---|---|---|---|---|
| Display | -42% | 2% | -43% | 29% | 1% | |
| Display P3 Coverage (%) | 68.6 | 39.2 -43% | 70.8 3% | 40 -42% | 99.9 46% | 69.4 1% |
| sRGB Coverage (%) | 98.7 | 58.2 -41% | 99.9 1% | 58.1 -41% | 100 1% | 99.5 1% |
| AdobeRGB 1998 Coverage (%) | 70.6 | 40.5 -43% | 72.1 2% | 38.7 -45% | 98.3 39% | 71.6 1% |
| Response Times | 8% | -281% | -132% | 96% | -1% | |
| Response Time Grey 50% / Grey 80% * (ms) | 12.4 ? | 11.6 ? 6% | 49.5 ? -299% | 27.6 ? -123% | 0.42 ? 97% | 14.3 ? -15% |
| Response Time Black / White * (ms) | 8.1 ? | 7.4 ? 9% | 29.3 ? -262% | 19.4 ? -140% | 0.4 ? 95% | 7 ? 14% |
| PWM Frequency (Hz) | 1152 ? | |||||
| PWM Amplitude * (%) | 11 | |||||
| Screen | -70% | 4% | -53% | 43% | -16% | |
| Brightness middle (cd/m²) | 456 | 384 -16% | 345.3 -24% | 328 -28% | 492 8% | 432 -5% |
| Brightness (cd/m²) | 403 | 372 -8% | 324 -20% | 313 -22% | 495 23% | 425 5% |
| Brightness Distribution (%) | 79 | 92 16% | 88 11% | 91 15% | 92 16% | 91 15% |
| Black Level * (cd/m²) | 0.39 | 0.36 8% | 0.23 41% | 0.26 33% | 0.37 5% | |
| Contrast (:1) | 1169 | 1067 -9% | 1501 28% | 1262 8% | 1168 0% | |
| Colorchecker dE 2000 * | 3.05 | 5.82 -91% | 3.22 -6% | 4.73 -55% | 0.9 70% | 4.76 -56% |
| Colorchecker dE 2000 max. * | 6.56 | 20.34 -210% | 5.68 13% | 17.47 -166% | 1.8 73% | 8.59 -31% |
| Colorchecker dE 2000 calibrated * | 1.03 | 3.95 -283% | 0.93 10% | 4.22 -310% | 1.18 -15% | |
| Greyscale dE 2000 * | 3.9 | 5.4 -38% | 4.5 -15% | 2.05 47% | 1.2 69% | 6.2 -59% |
| Gamma | 2.279 97% | 2.174 101% | 2.1 105% | 2.63 84% | 2.16 102% | 2.079 106% |
| CCT | 7198 90% | 6067 107% | 7041 92% | 6718 97% | 6291 103% | 6690 97% |
| Total Average (Program / Settings) | -35% /
-53% | -92% /
-37% | -76% /
-62% | 56% /
49% | -5% /
-10% |
* ... smaller is better
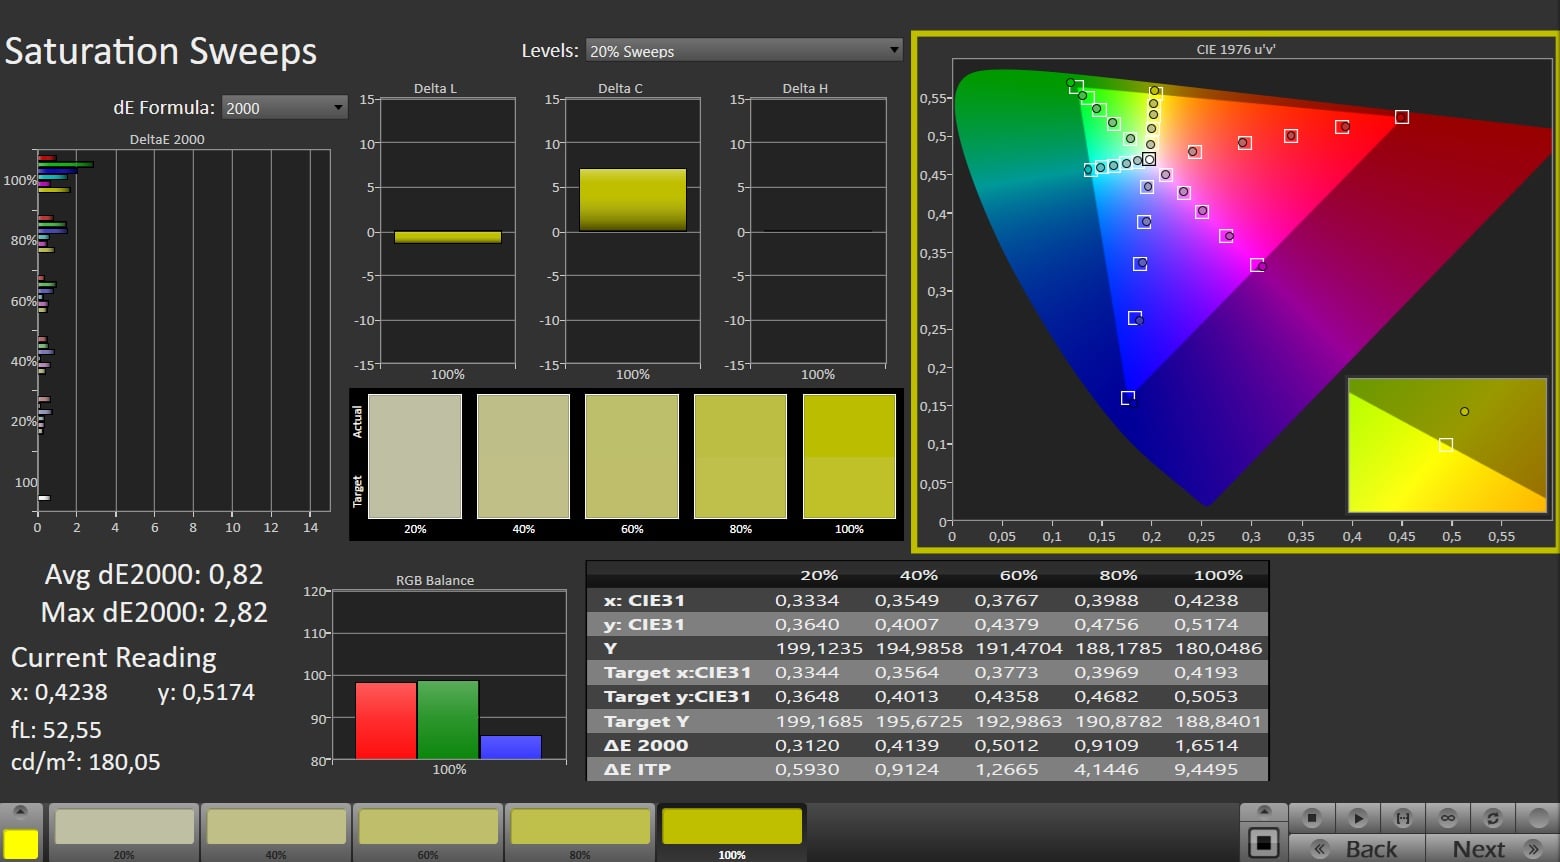
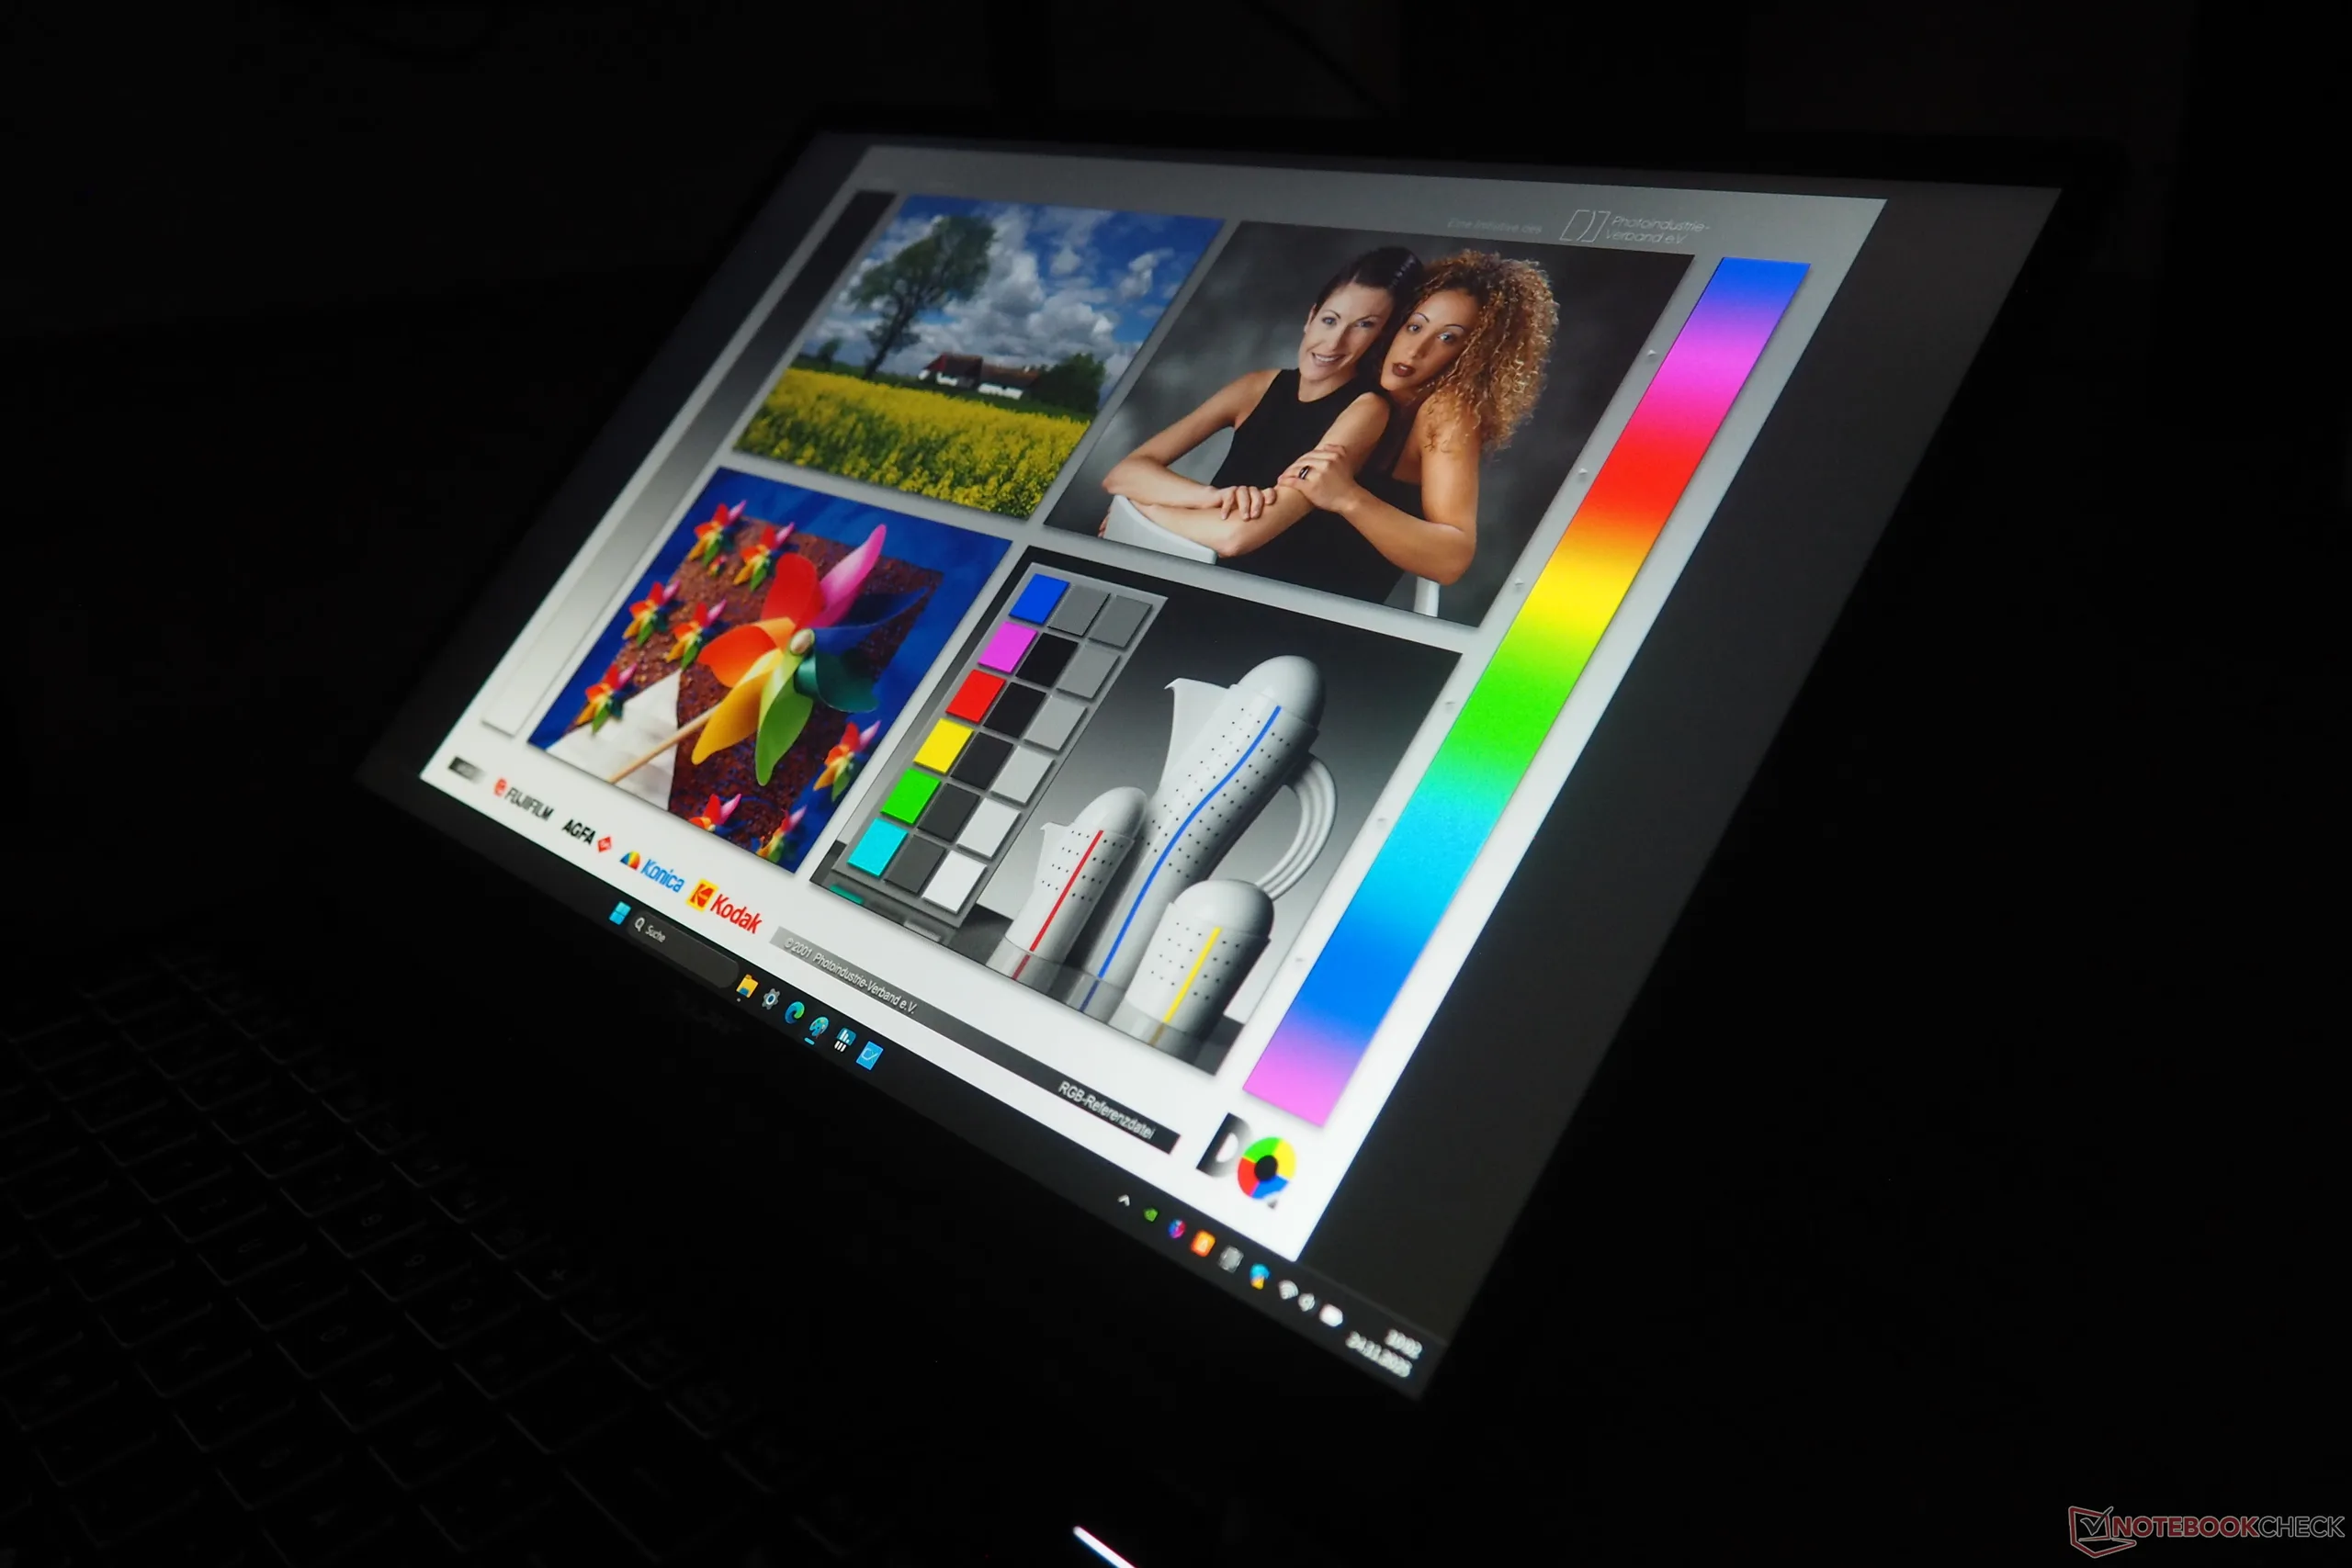
虽然 16 英寸显示屏没有达到 AdobeRGB 和 DCI-P3 的覆盖范围,但它几乎完全覆盖了 sRGB 空间,这对大多数游戏玩家来说是最重要的。开箱后,会有明显的蓝色色调,但校准后很容易解决。
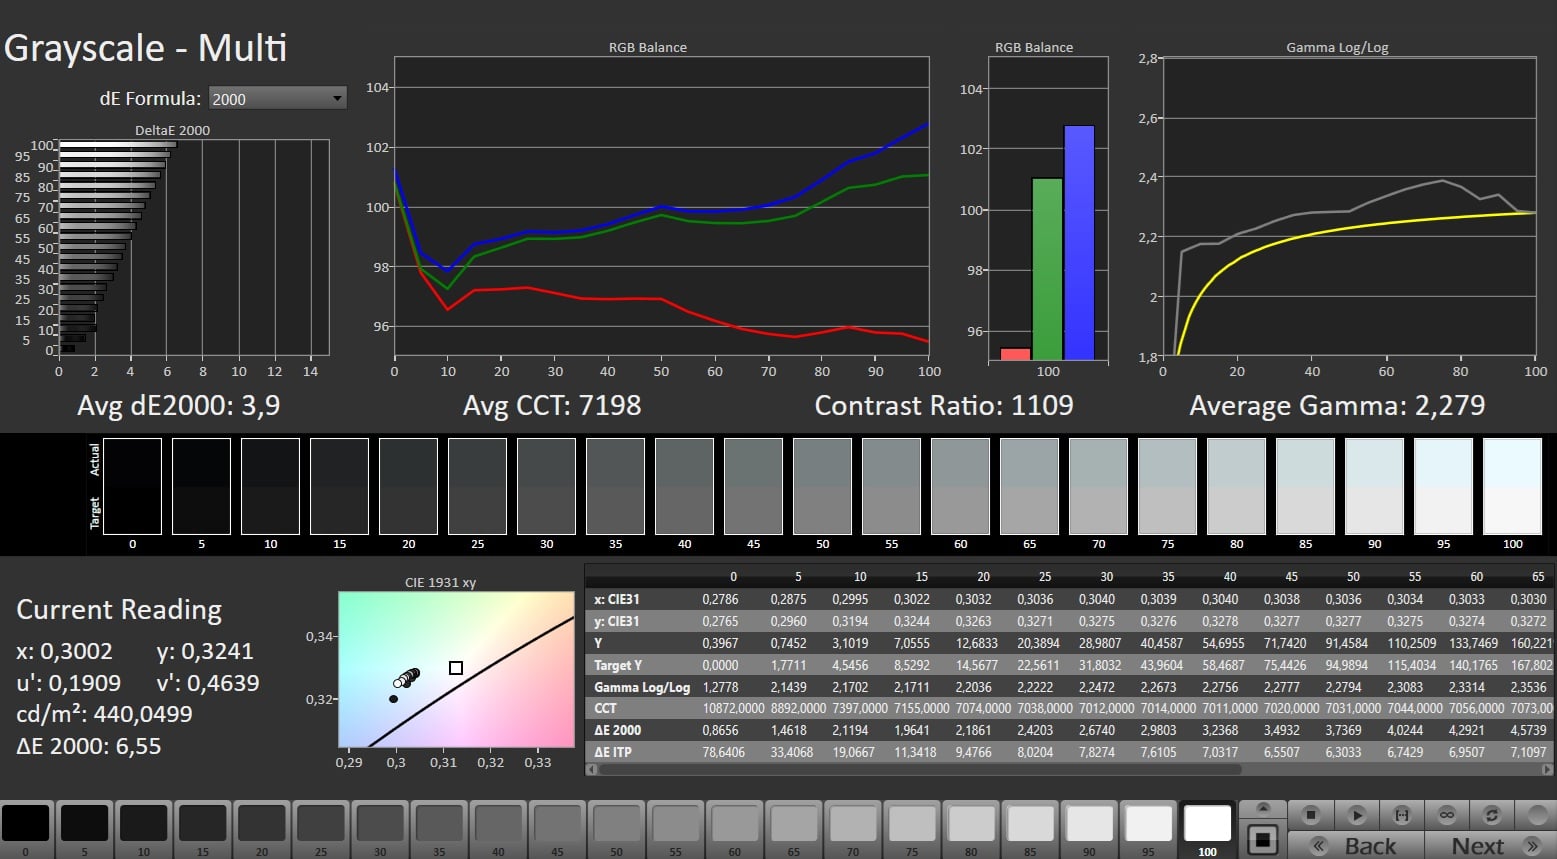
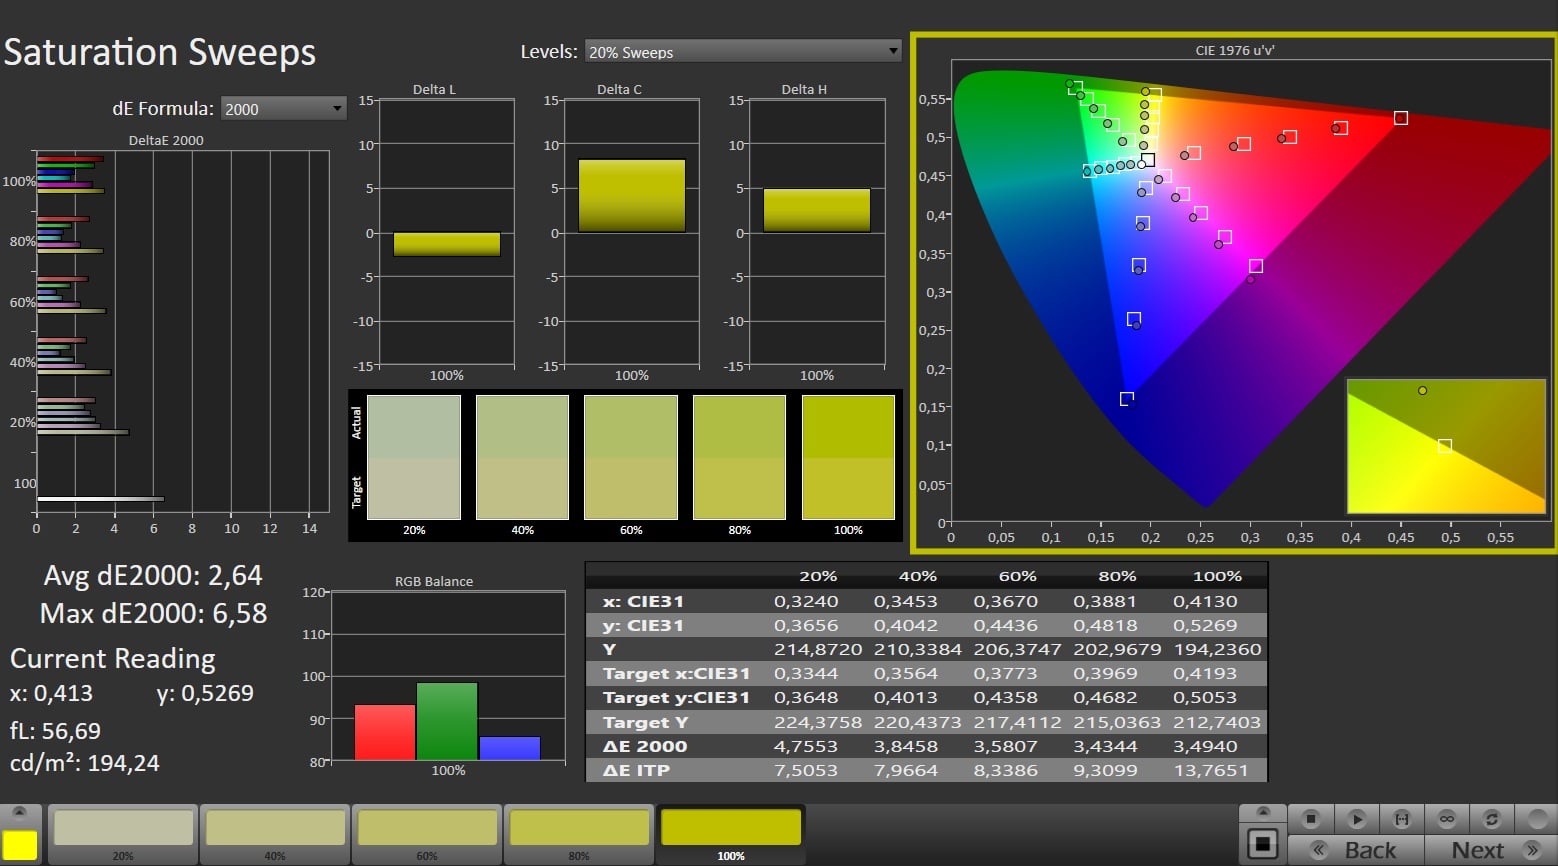
黑阶为 0.39 cd/m²,可以做得更好,但对比度仍超过 1,000:1,这在同级产品中很典型。
与同类机型相比,其响应时间也很短。不过,我们的测试机出现了明显的屏幕出血现象,主要集中在侧面和角落。
Display Response Times
| ↔ Response Time Black to White | ||
|---|---|---|
| 8.1 ms ... rise ↗ and fall ↘ combined | ↗ 4.7 ms rise | 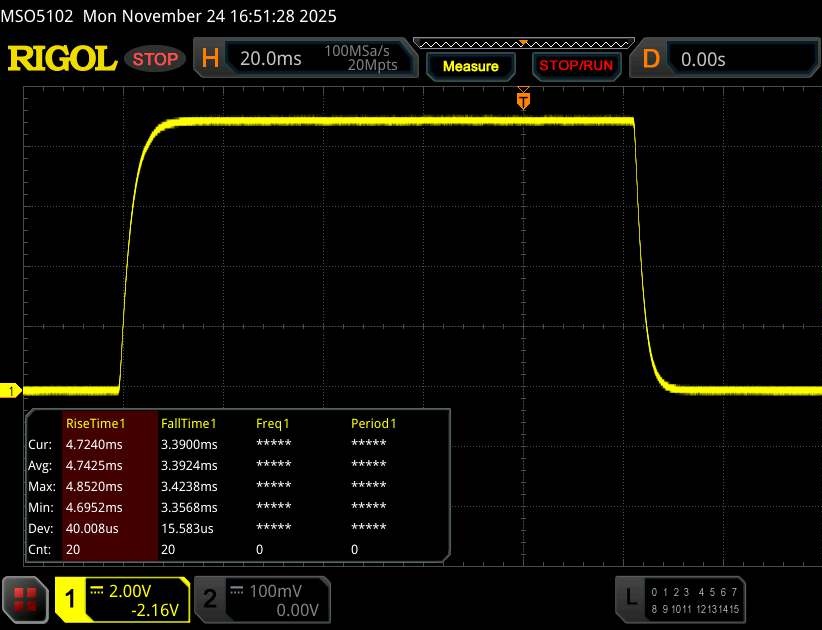 |
| ↘ 3.4 ms fall | ||
| The screen shows fast response rates in our tests and should be suited for gaming. In comparison, all tested devices range from 0.1 (minimum) to 240 (maximum) ms. » 23 % of all devices are better. This means that the measured response time is better than the average of all tested devices (19.8 ms). | ||
| ↔ Response Time 50% Grey to 80% Grey | ||
| 12.4 ms ... rise ↗ and fall ↘ combined | ↗ 6.2 ms rise | 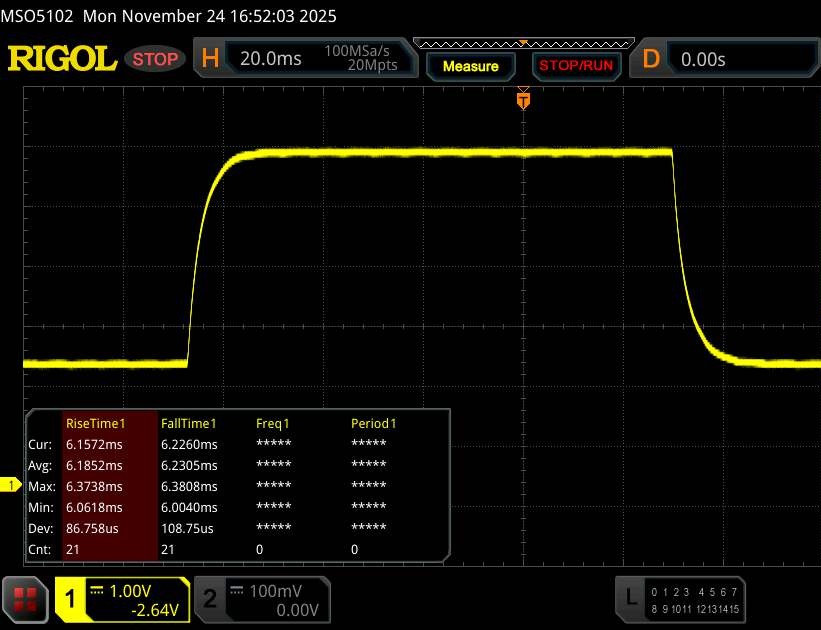 |
| ↘ 6.2 ms fall | ||
| The screen shows good response rates in our tests, but may be too slow for competitive gamers. In comparison, all tested devices range from 0.165 (minimum) to 636 (maximum) ms. » 26 % of all devices are better. This means that the measured response time is better than the average of all tested devices (31 ms). | ||
Screen Flickering / PWM (Pulse-Width Modulation)
| Screen flickering / PWM not detected |  | ||
In comparison: 52 % of all tested devices do not use PWM to dim the display. If PWM was detected, an average of 7763 (minimum: 5 - maximum: 343500) Hz was measured. | |||
性能
Tulpar T6 V3.5 是一款中端系统,几乎可以胜任任何任务。除了操作系统、内存容量和 M.2 存储配置外,制造商的网站没有提供其他定制选项。
测试条件
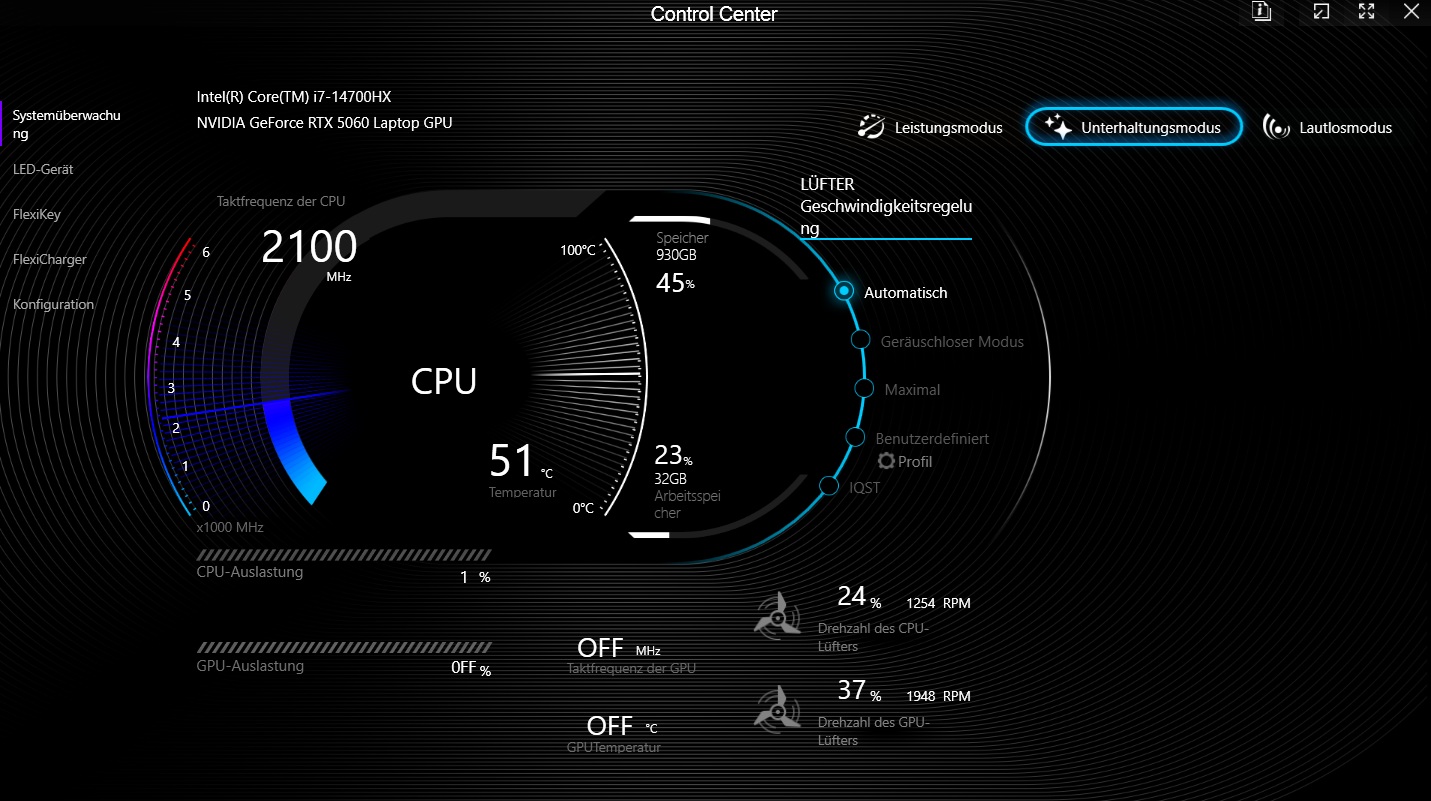
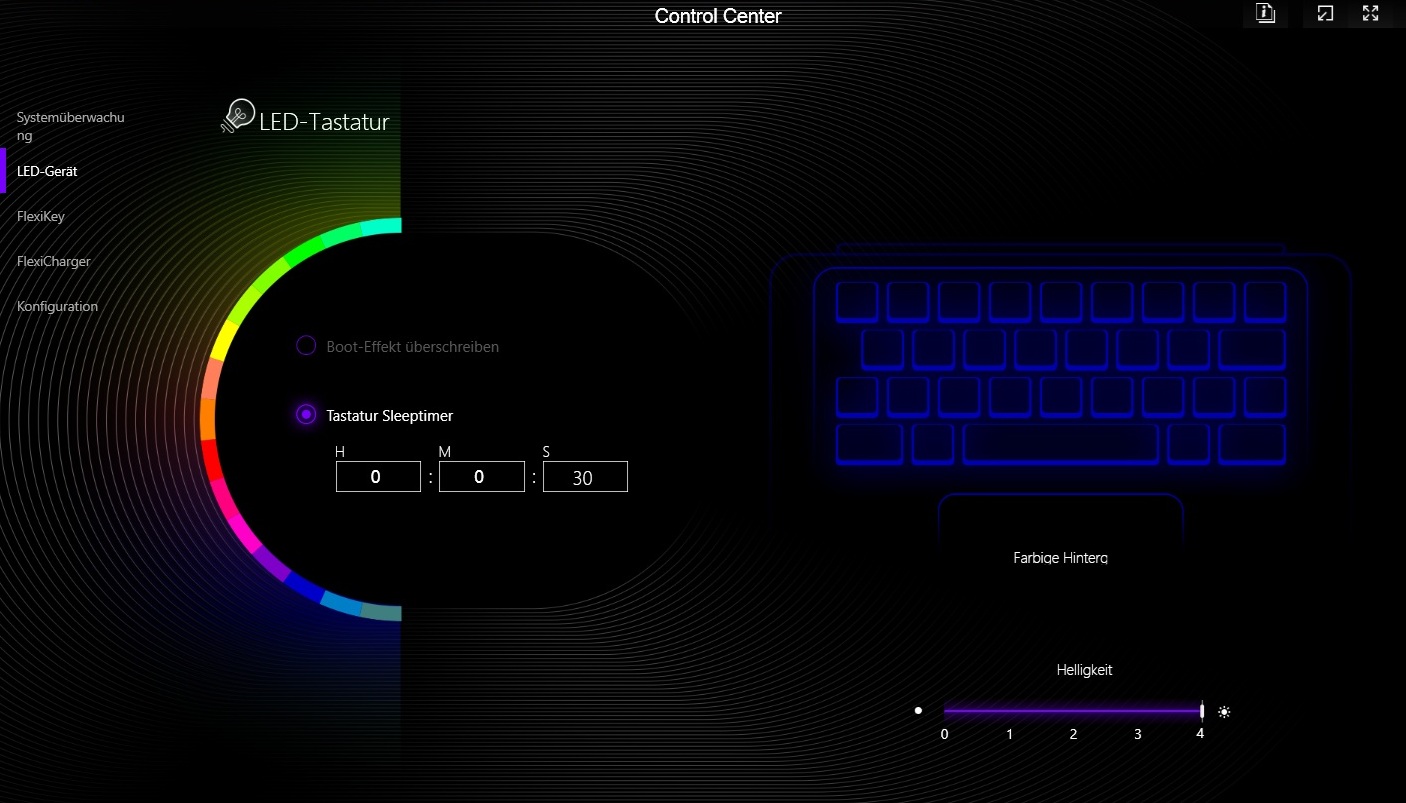
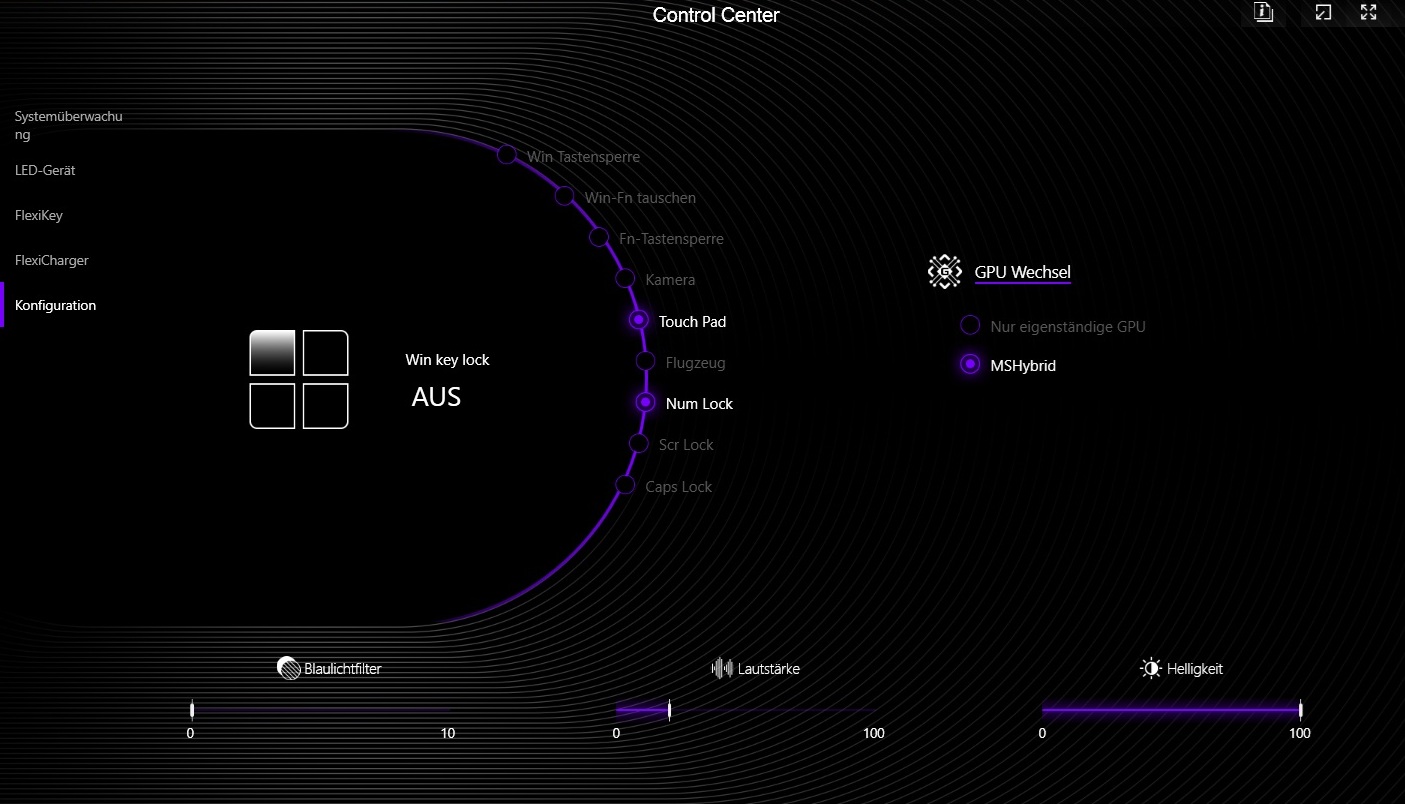
预装的控制中心提供三种运行模式。在我们的测试中,性能模式并没有显著提高 CPU 或 GPU 的输出,但却增加了噪音,因此我们的所有基准测试都在娱乐模式下进行。
| 模式 | 静音 | 娱乐 | 性能 |
| 赛博朋克 2077》噪音 | 34 dB(A) | 52 dB(A) | 56 dB(A) |
| 赛博朋克 2077》帧速率(FHD/超高清) | 62.4 fps | 81.8 fps | 82.3 fps |
| CPU PL1 | 28 W | 46 W | 55 W |
| CPU PL2 | 30 W | 115 W | 155 W |
| Cinebench R15 多重得分 | 1441 分 | 3743 分 | 3794 分 |
处理器
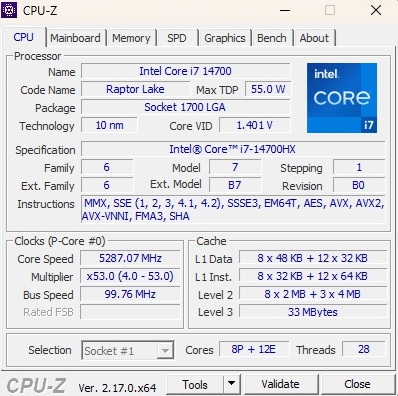
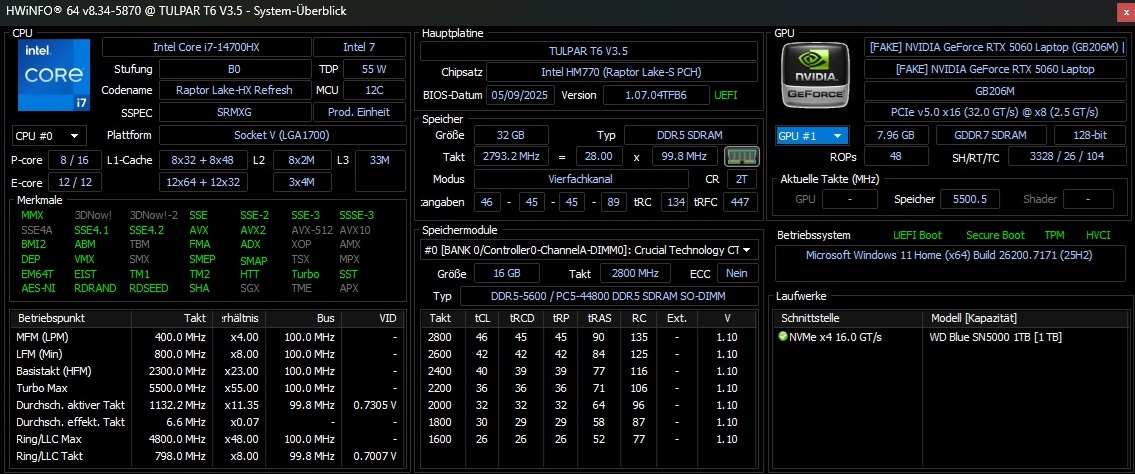
酷睿 i7-14700HX 酷睿 i7-14700HX是一款快速处理器,来自我们现在熟悉的 Raptor Lake 处理器(10 纳米)。它提供八个带超线程功能的性能内核和十二个不带超线程功能的效率内核,总共可提供多达 28 个并行线程。在我们的基准测试中,T6 V3.5 的性能略低于该 CPU 的平均水平。更令人担忧的是,在 Cinebench 循环中,仅运行几次后性能就急剧下降。这并不能很好地反映系统的电源管理或散热性能,而且即使在性能模式下,这个问题依然存在。
Cinebench R15 多耐久性测试
* ... smaller is better
AIDA64: FP32 Ray-Trace | FPU Julia | CPU SHA3 | CPU Queen | FPU SinJulia | FPU Mandel | CPU AES | CPU ZLib | FP64 Ray-Trace | CPU PhotoWorxx
| Performance rating | |
| HP Omen 16-ap0091ng | |
| Average of class Gaming | |
| Lenovo Legion 5 15AHP G10 | |
| Average Intel Core i7-14700HX | |
| Acer Nitro V 16 AI ANV16-42-R860 | |
| Tulpar T6 V3.5 | |
| Alienware 16 Aurora | |
| Gigabyte Gaming A16 GA6H | |
| AIDA64 / FP32 Ray-Trace | |
| HP Omen 16-ap0091ng | |
| Average of class Gaming (10227 - 85542, n=107, last 2 years) | |
| Lenovo Legion 5 15AHP G10 | |
| Acer Nitro V 16 AI ANV16-42-R860 | |
| Average Intel Core i7-14700HX (14147 - 23676, n=9) | |
| Alienware 16 Aurora | |
| Tulpar T6 V3.5 | |
| Gigabyte Gaming A16 GA6H | |
| AIDA64 / FPU Julia | |
| HP Omen 16-ap0091ng | |
| Average of class Gaming (51376 - 238426, n=107, last 2 years) | |
| Lenovo Legion 5 15AHP G10 | |
| Average Intel Core i7-14700HX (71875 - 116556, n=9) | |
| Acer Nitro V 16 AI ANV16-42-R860 | |
| Alienware 16 Aurora | |
| Tulpar T6 V3.5 | |
| Gigabyte Gaming A16 GA6H | |
| AIDA64 / CPU SHA3 | |
| HP Omen 16-ap0091ng | |
| Average of class Gaming (2180 - 9817, n=107, last 2 years) | |
| Lenovo Legion 5 15AHP G10 | |
| Average Intel Core i7-14700HX (3388 - 5567, n=9) | |
| Acer Nitro V 16 AI ANV16-42-R860 | |
| Tulpar T6 V3.5 | |
| Alienware 16 Aurora | |
| Gigabyte Gaming A16 GA6H | |
| AIDA64 / CPU Queen | |
| HP Omen 16-ap0091ng | |
| Average Intel Core i7-14700HX (129134 - 152200, n=9) | |
| Tulpar T6 V3.5 | |
| Lenovo Legion 5 15AHP G10 | |
| Average of class Gaming (49785 - 173351, n=94, last 2 years) | |
| Acer Nitro V 16 AI ANV16-42-R860 | |
| Alienware 16 Aurora | |
| Gigabyte Gaming A16 GA6H | |
| AIDA64 / FPU SinJulia | |
| HP Omen 16-ap0091ng | |
| Lenovo Legion 5 15AHP G10 | |
| Average of class Gaming (4424 - 33636, n=107, last 2 years) | |
| Average Intel Core i7-14700HX (10266 - 14434, n=9) | |
| Acer Nitro V 16 AI ANV16-42-R860 | |
| Tulpar T6 V3.5 | |
| Alienware 16 Aurora | |
| Gigabyte Gaming A16 GA6H | |
| AIDA64 / FPU Mandel | |
| HP Omen 16-ap0091ng | |
| Average of class Gaming (25115 - 128721, n=107, last 2 years) | |
| Lenovo Legion 5 15AHP G10 | |
| Average Intel Core i7-14700HX (35155 - 58380, n=9) | |
| Acer Nitro V 16 AI ANV16-42-R860 | |
| Alienware 16 Aurora | |
| Tulpar T6 V3.5 | |
| Gigabyte Gaming A16 GA6H | |
| AIDA64 / CPU AES | |
| HP Omen 16-ap0091ng | |
| Average of class Gaming (39258 - 247074, n=107, last 2 years) | |
| Average Intel Core i7-14700HX (68616 - 113157, n=9) | |
| Tulpar T6 V3.5 | |
| Lenovo Legion 5 15AHP G10 | |
| Acer Nitro V 16 AI ANV16-42-R860 | |
| Alienware 16 Aurora | |
| Gigabyte Gaming A16 GA6H | |
| AIDA64 / CPU ZLib | |
| HP Omen 16-ap0091ng | |
| Average of class Gaming (574 - 2531, n=107, last 2 years) | |
| Average Intel Core i7-14700HX (1003 - 1682, n=9) | |
| Lenovo Legion 5 15AHP G10 | |
| Tulpar T6 V3.5 | |
| Alienware 16 Aurora | |
| Acer Nitro V 16 AI ANV16-42-R860 | |
| Gigabyte Gaming A16 GA6H | |
| AIDA64 / FP64 Ray-Trace | |
| HP Omen 16-ap0091ng | |
| Average of class Gaming (5509 - 45446, n=107, last 2 years) | |
| Lenovo Legion 5 15AHP G10 | |
| Acer Nitro V 16 AI ANV16-42-R860 | |
| Average Intel Core i7-14700HX (7585 - 12928, n=9) | |
| Alienware 16 Aurora | |
| Tulpar T6 V3.5 | |
| Gigabyte Gaming A16 GA6H | |
| AIDA64 / CPU PhotoWorxx | |
| Tulpar T6 V3.5 | |
| Average of class Gaming (12271 - 89891, n=107, last 2 years) | |
| Average Intel Core i7-14700HX (24276 - 49671, n=9) | |
| Lenovo Legion 5 15AHP G10 | |
| Alienware 16 Aurora | |
| Acer Nitro V 16 AI ANV16-42-R860 | |
| Gigabyte Gaming A16 GA6H | |
| HP Omen 16-ap0091ng | |
系统性能
相比之下,系统性能并不突出。除了相对较慢的固态硬盘(我们很快就会提到)外,没有什么特别值得注意的地方。
PCMark 10: Score | Essentials | Productivity | Digital Content Creation
CrossMark: Overall | Productivity | Creativity | Responsiveness
WebXPRT 3: Overall
WebXPRT 4: Overall
Mozilla Kraken 1.1: Total
| Performance rating | |
| Average of class Gaming | |
| HP Omen 16-ap0091ng | |
| Lenovo Legion 5 15AHP G10 | |
| Alienware 16 Aurora -4! | |
| Tulpar T6 V3.5 | |
| Average Intel Core i7-14700HX, NVIDIA GeForce RTX 5060 Laptop | |
| Gigabyte Gaming A16 GA6H | |
| Acer Nitro V 16 AI ANV16-42-R860 | |
| PCMark 10 / Score | |
| Average of class Gaming (5828 - 11574, n=95, last 2 years) | |
| Lenovo Legion 5 15AHP G10 | |
| HP Omen 16-ap0091ng | |
| Tulpar T6 V3.5 | |
| Average Intel Core i7-14700HX, NVIDIA GeForce RTX 5060 Laptop (n=1) | |
| Acer Nitro V 16 AI ANV16-42-R860 | |
| Gigabyte Gaming A16 GA6H | |
| PCMark 10 / Essentials | |
| Lenovo Legion 5 15AHP G10 | |
| HP Omen 16-ap0091ng | |
| Average of class Gaming (8810 - 12600, n=99, last 2 years) | |
| Tulpar T6 V3.5 | |
| Average Intel Core i7-14700HX, NVIDIA GeForce RTX 5060 Laptop (n=1) | |
| Gigabyte Gaming A16 GA6H | |
| Acer Nitro V 16 AI ANV16-42-R860 | |
| PCMark 10 / Productivity | |
| Average of class Gaming (6845 - 21327, n=97, last 2 years) | |
| Lenovo Legion 5 15AHP G10 | |
| HP Omen 16-ap0091ng | |
| Acer Nitro V 16 AI ANV16-42-R860 | |
| Tulpar T6 V3.5 | |
| Average Intel Core i7-14700HX, NVIDIA GeForce RTX 5060 Laptop (n=1) | |
| Gigabyte Gaming A16 GA6H | |
| PCMark 10 / Digital Content Creation | |
| Average of class Gaming (7602 - 19657, n=97, last 2 years) | |
| Lenovo Legion 5 15AHP G10 | |
| HP Omen 16-ap0091ng | |
| Tulpar T6 V3.5 | |
| Average Intel Core i7-14700HX, NVIDIA GeForce RTX 5060 Laptop (n=1) | |
| Gigabyte Gaming A16 GA6H | |
| Acer Nitro V 16 AI ANV16-42-R860 | |
| CrossMark / Overall | |
| Alienware 16 Aurora | |
| Average of class Gaming (1366 - 2409, n=96, last 2 years) | |
| HP Omen 16-ap0091ng | |
| Tulpar T6 V3.5 | |
| Average Intel Core i7-14700HX, NVIDIA GeForce RTX 5060 Laptop (n=1) | |
| Gigabyte Gaming A16 GA6H | |
| Lenovo Legion 5 15AHP G10 | |
| Acer Nitro V 16 AI ANV16-42-R860 | |
| CrossMark / Productivity | |
| Alienware 16 Aurora | |
| Average of class Gaming (1386 - 2254, n=96, last 2 years) | |
| HP Omen 16-ap0091ng | |
| Gigabyte Gaming A16 GA6H | |
| Lenovo Legion 5 15AHP G10 | |
| Tulpar T6 V3.5 | |
| Average Intel Core i7-14700HX, NVIDIA GeForce RTX 5060 Laptop (n=1) | |
| Acer Nitro V 16 AI ANV16-42-R860 | |
| CrossMark / Creativity | |
| Tulpar T6 V3.5 | |
| Average Intel Core i7-14700HX, NVIDIA GeForce RTX 5060 Laptop (n=1) | |
| Average of class Gaming (1343 - 2729, n=96, last 2 years) | |
| Alienware 16 Aurora | |
| HP Omen 16-ap0091ng | |
| Lenovo Legion 5 15AHP G10 | |
| Gigabyte Gaming A16 GA6H | |
| Acer Nitro V 16 AI ANV16-42-R860 | |
| CrossMark / Responsiveness | |
| Alienware 16 Aurora | |
| Gigabyte Gaming A16 GA6H | |
| Average of class Gaming (1226 - 2334, n=96, last 2 years) | |
| Lenovo Legion 5 15AHP G10 | |
| HP Omen 16-ap0091ng | |
| Acer Nitro V 16 AI ANV16-42-R860 | |
| Tulpar T6 V3.5 | |
| Average Intel Core i7-14700HX, NVIDIA GeForce RTX 5060 Laptop (n=1) | |
| WebXPRT 3 / Overall | |
| HP Omen 16-ap0091ng | |
| Average of class Gaming (220 - 532, n=100, last 2 years) | |
| Lenovo Legion 5 15AHP G10 | |
| Tulpar T6 V3.5 | |
| Average Intel Core i7-14700HX, NVIDIA GeForce RTX 5060 Laptop (n=1) | |
| Alienware 16 Aurora | |
| Acer Nitro V 16 AI ANV16-42-R860 | |
| Gigabyte Gaming A16 GA6H | |
| WebXPRT 4 / Overall | |
| Tulpar T6 V3.5 | |
| Average Intel Core i7-14700HX, NVIDIA GeForce RTX 5060 Laptop (n=1) | |
| Average of class Gaming (165 - 354, n=101, last 2 years) | |
| Lenovo Legion 5 15AHP G10 | |
| Alienware 16 Aurora | |
| Gigabyte Gaming A16 GA6H | |
| HP Omen 16-ap0091ng | |
| Acer Nitro V 16 AI ANV16-42-R860 | |
| Mozilla Kraken 1.1 / Total | |
| Acer Nitro V 16 AI ANV16-42-R860 | |
| Alienware 16 Aurora | |
| Gigabyte Gaming A16 GA6H | |
| HP Omen 16-ap0091ng | |
| Lenovo Legion 5 15AHP G10 | |
| Tulpar T6 V3.5 | |
| Average Intel Core i7-14700HX, NVIDIA GeForce RTX 5060 Laptop (n=1) | |
| Average of class Gaming (391 - 590, n=104, last 2 years) | |
* ... smaller is better
| PCMark 10 Score | 7269 points | |
Help | ||
| AIDA64 / Memory Copy | |
| Tulpar T6 V3.5 | |
| Average of class Gaming (21750 - 129946, n=107, last 2 years) | |
| Lenovo Legion 5 15AHP G10 | |
| Average Intel Core i7-14700HX (41617 - 78742, n=9) | |
| Alienware 16 Aurora | |
| Acer Nitro V 16 AI ANV16-42-R860 | |
| Gigabyte Gaming A16 GA6H | |
| HP Omen 16-ap0091ng | |
| AIDA64 / Memory Read | |
| Tulpar T6 V3.5 | |
| Average Intel Core i7-14700HX (46627 - 86175, n=9) | |
| Average of class Gaming (22956 - 118858, n=107, last 2 years) | |
| Alienware 16 Aurora | |
| Acer Nitro V 16 AI ANV16-42-R860 | |
| Lenovo Legion 5 15AHP G10 | |
| HP Omen 16-ap0091ng | |
| Gigabyte Gaming A16 GA6H | |
| AIDA64 / Memory Write | |
| Lenovo Legion 5 15AHP G10 | |
| Acer Nitro V 16 AI ANV16-42-R860 | |
| Tulpar T6 V3.5 | |
| Average of class Gaming (22297 - 135096, n=107, last 2 years) | |
| Average Intel Core i7-14700HX (39155 - 76976, n=9) | |
| Alienware 16 Aurora | |
| HP Omen 16-ap0091ng | |
| Gigabyte Gaming A16 GA6H | |
| AIDA64 / Memory Latency | |
| Average of class Gaming (75.3 - 259, n=107, last 2 years) | |
| Alienware 16 Aurora | |
| Gigabyte Gaming A16 GA6H | |
| Acer Nitro V 16 AI ANV16-42-R860 | |
| Lenovo Legion 5 15AHP G10 | |
| Average Intel Core i7-14700HX (82.7 - 96.4, n=9) | |
| Tulpar T6 V3.5 | |
| HP Omen 16-ap0091ng | |
* ... smaller is better
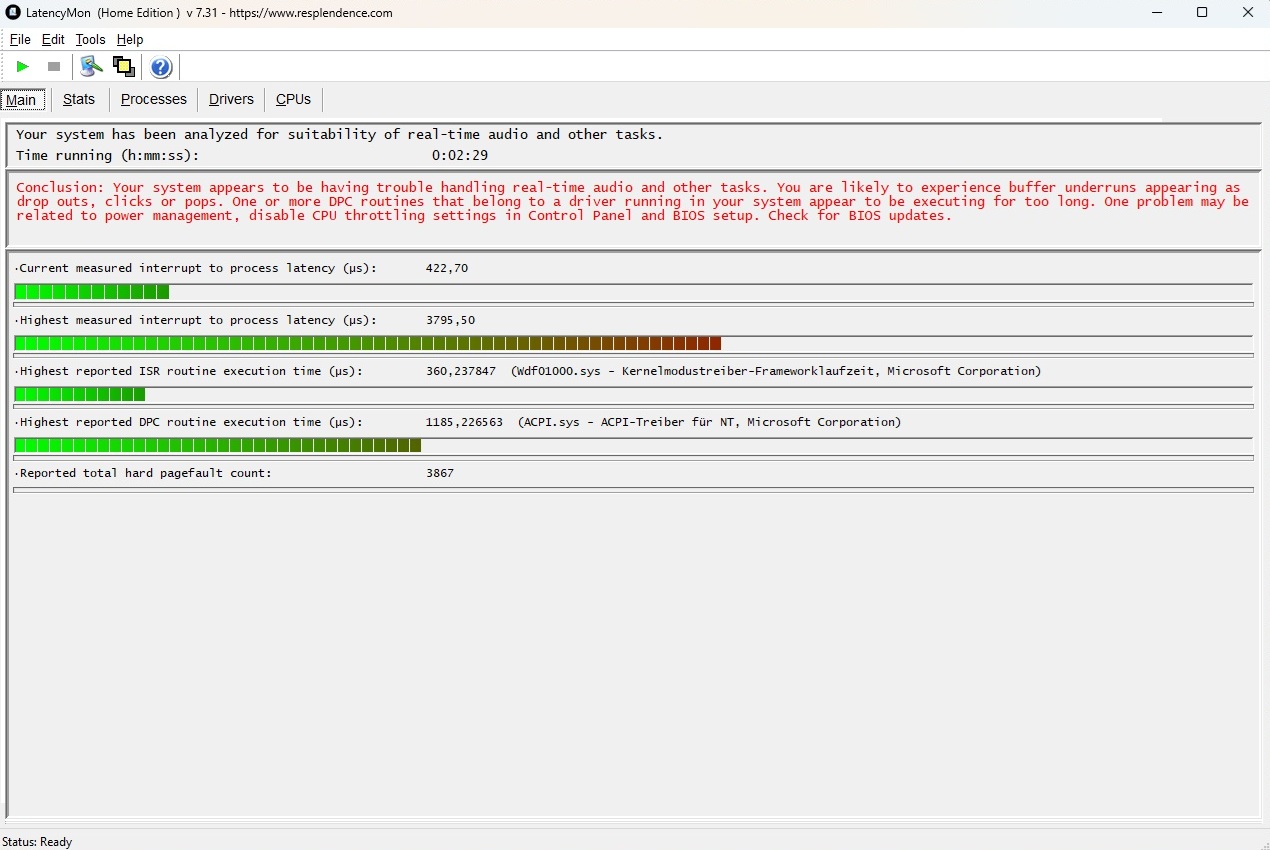
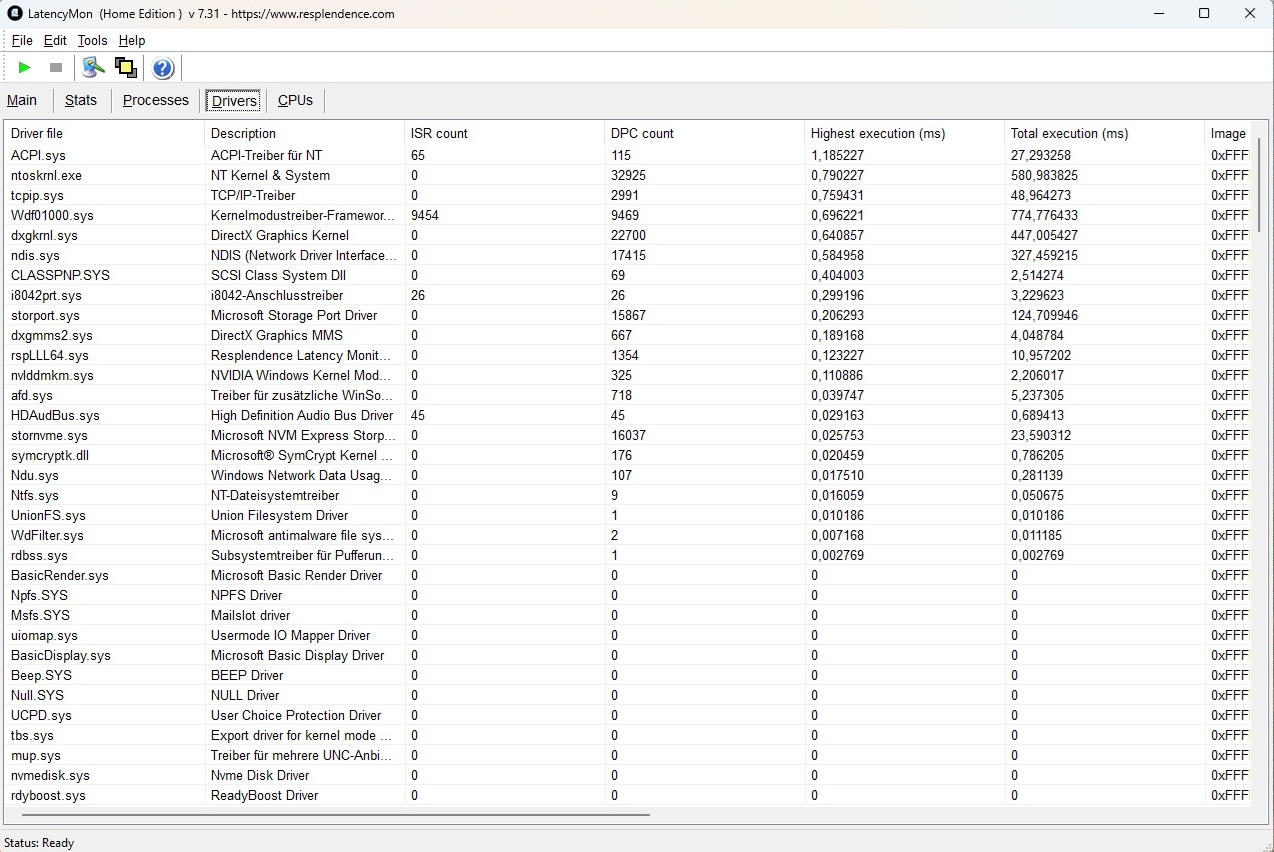
DPC 延迟
延迟结果可能会更好,但与技嘉和宏碁的同类机型处于同一范围。
| DPC Latencies / LatencyMon - interrupt to process latency (max), Web, Youtube, Prime95 | |
| Gigabyte Gaming A16 GA6H | |
| Acer Nitro V 16 AI ANV16-42-R860 | |
| Tulpar T6 V3.5 | |
| Lenovo Legion 5 15AHP G10 | |
| HP Omen 16-ap0091ng | |
* ... smaller is better
存储设备
与 CPU 不同的是,存储系统能长期保持其全部性能,而所有竞争对手都做不到这一点。即便如此,内置的 1 TB Western Digital 硬盘在固态硬盘基准测试中仍处于较低水平,写入速度尤其弱。

* ... smaller is better
连续读取性能DiskSpd 读取循环,队列深度 8
图形处理器性能
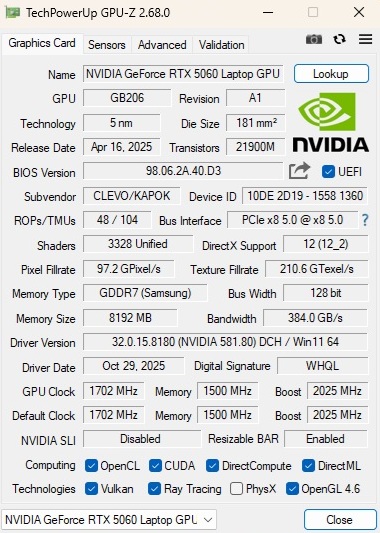
显卡也未能充分发挥其潜力。虽然 GeForce RTX 5060的额定 TGP 为 115 瓦(包括 15 瓦的动态提升),但实际性能略低于 RTX 5060 的平均水平,与 Alienware 16 Aurora 大致相当。
| 3DMark 11 Performance | 31398 points | |
| 3DMark Cloud Gate Standard Score | 47731 points | |
| 3DMark Fire Strike Score | 26286 points | |
| 3DMark Time Spy Score | 11164 points | |
Help | ||
* ... smaller is better
游戏性能
| low | med. | high | ultra | |
|---|---|---|---|---|
| GTA V (2015) | 178.9 | 176.1 | 123.8 | |
| Dota 2 Reborn (2015) | 168.2 | 163.6 | 150.6 | |
| Final Fantasy XV Benchmark (2018) | 143.7 | 110 | ||
| X-Plane 11.11 (2018) | 118.3 | 102.8 | ||
| Strange Brigade (2018) | 288 | 227 | 195 | |
| Baldur's Gate 3 (2023) | 95 | 93 | 90 | |
| Cyberpunk 2077 (2023) | 107.4 | 93.2 | 81.8 | |
| Borderlands 4 (2025) | 40.3 | 31.6 | 16.3 | |
| The Outer Worlds 2 (2025) | 82.1 | 65 | 35.7 | |
| ARC Raiders (2025) | 118.4 | 93.5 | 59.8 | |
| Anno 117: Pax Romana (2025) | 73.8 | 55.4 | 28.4 | |
| Call of Duty Black Ops 7 (2025) | 130 | 95 | 32 |
| The Outer Worlds 2 | |
| 1920x1080 High Preset AA:T | |
| Average of class Gaming (51.1 - 94.5, n=11, last 2 years) | |
| Average NVIDIA GeForce RTX 5060 Laptop (58.3 - 72.7, n=4) | |
| Tulpar T6 V3.5 | |
| Acer Nitro V 16 AI ANV16-42-R860 | |
| 1920x1080 Very High Preset AA:T | |
| Average of class Gaming (26.4 - 58.4, n=11, last 2 years) | |
| Average NVIDIA GeForce RTX 5060 Laptop (31.1 - 40.9, n=4) | |
| Tulpar T6 V3.5 | |
| Acer Nitro V 16 AI ANV16-42-R860 | |
| Borderlands 4 | |
| 1920x1080 High Preset AA:FX | |
| Average of class Gaming (28.7 - 76.6, n=13, last 2 years) | |
| Average NVIDIA GeForce RTX 5060 Laptop (28.7 - 39.3, n=4) | |
| Tulpar T6 V3.5 | |
| Acer Nitro V 16 AI ANV16-42-R860 | |
| 1920x1080 Badass Preset AA:FX | |
| Average of class Gaming (16 - 54, n=13, last 2 years) | |
| Average NVIDIA GeForce RTX 5060 Laptop (16.3 - 24.8, n=4) | |
| Acer Nitro V 16 AI ANV16-42-R860 | |
| Tulpar T6 V3.5 | |
| Call of Duty Black Ops 7 | |
| 1920x1080 Ultra Preset | |
| Average of class Gaming (70 - 157, n=11, last 2 years) | |
| Average NVIDIA GeForce RTX 5060 Laptop (95 - 103, n=4) | |
| Tulpar T6 V3.5 | |
| 1920x1080 Extreme Preset + Raytracing | |
| Average of class Gaming (24 - 60, n=11, last 2 years) | |
| Average NVIDIA GeForce RTX 5060 Laptop (32 - 38, n=4) | |
| Tulpar T6 V3.5 | |
| ARC Raiders | |
| 1920x1080 High Preset AA:TSR | |
| Average of class Gaming (64.5 - 144.4, n=11, last 2 years) | |
| Tulpar T6 V3.5 | |
| Average NVIDIA GeForce RTX 5060 Laptop (79.9 - 104.9, n=4) | |
| 1920x1080 Epic Preset + Epic Raytracing AA:TSR | |
| Average of class Gaming (43.5 - 98.6, n=11, last 2 years) | |
| Average NVIDIA GeForce RTX 5060 Laptop (55 - 70.2, n=4) | |
| Tulpar T6 V3.5 | |
在 30 分钟的《赛博朋克 2077》压力测试中,帧速率基本保持稳定。
赛博朋克 2077》超 FPS 图表
排放量
系统噪音
风扇控制需要改进。即使系统处于闲置状态,风扇偶尔也会急速运转,这可能会令人恼火。在负载情况下,16 英寸笔记本电脑会发出明显的噪音,噪音值高达 52 至 53 dB(A),因此耳机是明智的选择。
Noise level
| Idle |
| 26 / 29 / 31 dB(A) |
| Load |
| 52 / 53 dB(A) |
 | ||
30 dB silent 40 dB(A) audible 50 dB(A) loud |
||
min: | ||
| Tulpar T6 V3.5 i7-14700HX, GeForce RTX 5060 Laptop | Acer Nitro V 16 AI ANV16-42-R860 R5 240, GeForce RTX 5050 Laptop | Alienware 16 Aurora Core 7 240H, GeForce RTX 5060 Laptop | HP Omen 16-ap0091ng R9 8940HX, GeForce RTX 5060 Laptop | Lenovo Legion 5 15AHP G10 R7 260, GeForce RTX 5060 Laptop | Gigabyte Gaming A16 GA6H i7-13620H, GeForce RTX 5070 Laptop | |
|---|---|---|---|---|---|---|
| Noise | 4% | 7% | 8% | 9% | 2% | |
| off / environment * (dB) | 24 | 25 -4% | 22.9 5% | 23 4% | 25.5 -6% | 24 -0% |
| Idle Minimum * (dB) | 26 | 25 4% | 24 8% | 23 12% | 25.5 2% | 25 4% |
| Idle Average * (dB) | 29 | 30 -3% | 25.6 12% | 23 21% | 25.5 12% | 26 10% |
| Idle Maximum * (dB) | 31 | 33 -6% | 25.6 17% | 27.64 11% | 26.9 13% | 27 13% |
| Load Average * (dB) | 52 | 38 27% | 46.8 10% | 49.5 5% | 34.6 33% | 54 -4% |
| Cyberpunk 2077 ultra * (dB) | 52 | 49 6% | 49.9 4% | 49.5 5% | 50.1 4% | 54 -4% |
| Load Maximum * (dB) | 53 | 50 6% | 55.6 -5% | 52.73 1% | 50.1 5% | 55 -4% |
* ... smaller is better
温度
在 3D 工作负载下,表面温度保持在合理水平,顶部最高温度可达 40 °C。不过,底部温度最高可达 47 °C。空闲时,机箱温度控制在 24 至 35 °C。
(±) The maximum temperature on the upper side is 40 °C / 104 F, compared to the average of 40.4 °C / 105 F, ranging from 21.2 to 68.8 °C for the class Gaming.
(-) The bottom heats up to a maximum of 47 °C / 117 F, compared to the average of 43.2 °C / 110 F
(+) In idle usage, the average temperature for the upper side is 27.4 °C / 81 F, compared to the device average of 33.9 °C / 93 F.
(±) 3: The average temperature for the upper side is 34.8 °C / 95 F, compared to the average of 33.9 °C / 93 F for the class Gaming.
(+) The palmrests and touchpad are cooler than skin temperature with a maximum of 27 °C / 80.6 F and are therefore cool to the touch.
(±) The average temperature of the palmrest area of similar devices was 28.8 °C / 83.8 F (+1.8 °C / 3.2 F).
| Tulpar T6 V3.5 i7-14700HX, GeForce RTX 5060 Laptop | Acer Nitro V 16 AI ANV16-42-R860 R5 240, GeForce RTX 5050 Laptop | Alienware 16 Aurora Core 7 240H, GeForce RTX 5060 Laptop | HP Omen 16-ap0091ng R9 8940HX, GeForce RTX 5060 Laptop | Lenovo Legion 5 15AHP G10 R7 260, GeForce RTX 5060 Laptop | Gigabyte Gaming A16 GA6H i7-13620H, GeForce RTX 5070 Laptop | |
|---|---|---|---|---|---|---|
| Heat | -10% | 10% | 2% | -11% | ||
| Maximum Upper Side * (°C) | 40 | 45 -13% | 36 10% | 42.2 -6% | 50 -25% | |
| Maximum Bottom * (°C) | 47 | 59 -26% | 37 21% | 51.7 -10% | 49 -4% | |
| Idle Upper Side * (°C) | 30 | 29 3% | 30 -0% | 28.5 5% | 35 -17% | |
| Idle Bottom * (°C) | 35 | 36 -3% | 32 9% | 29.2 17% | 34 3% |
* ... smaller is better
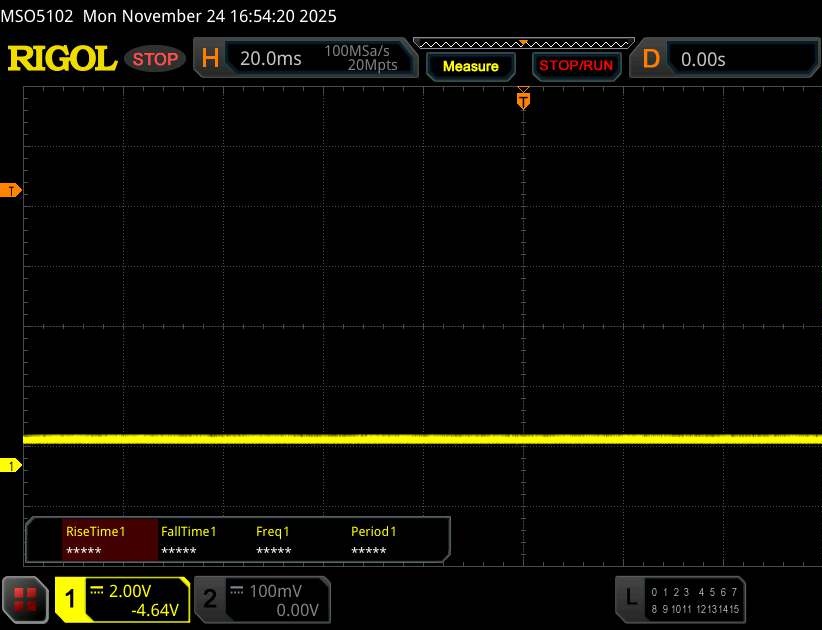
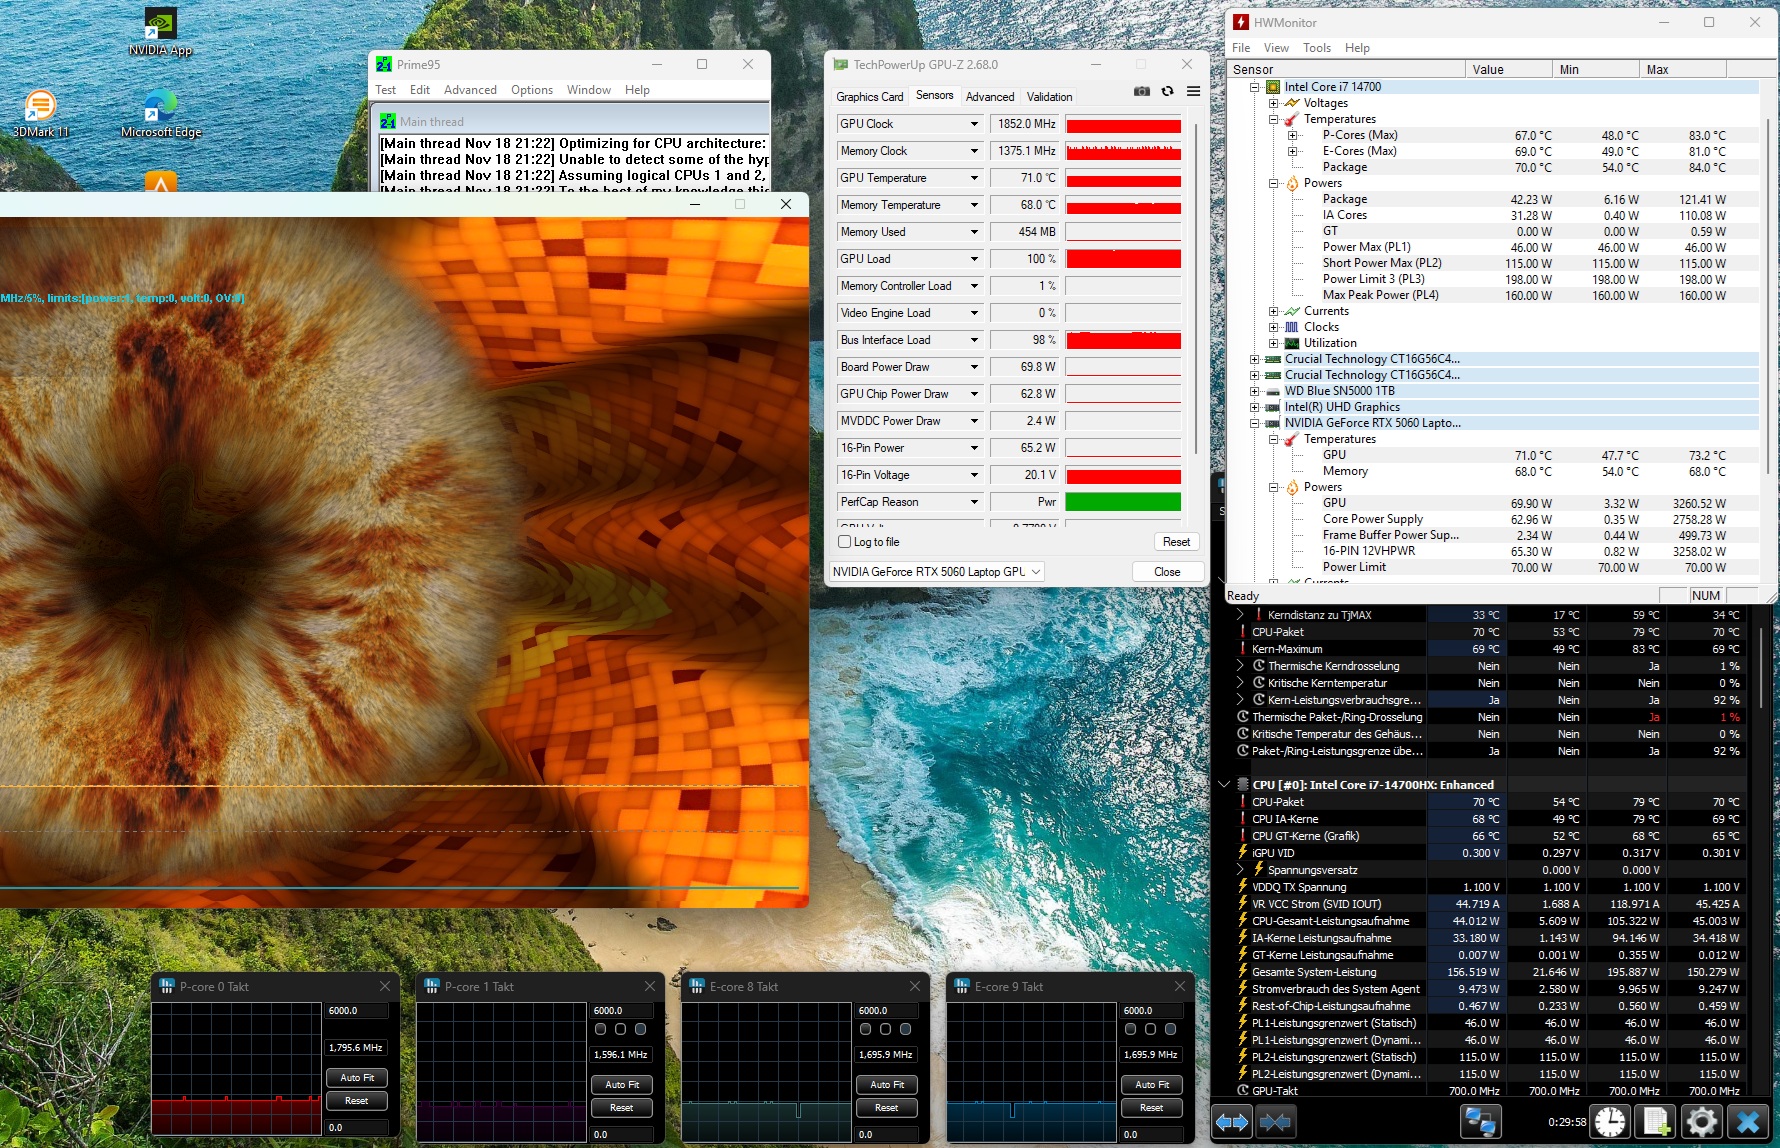
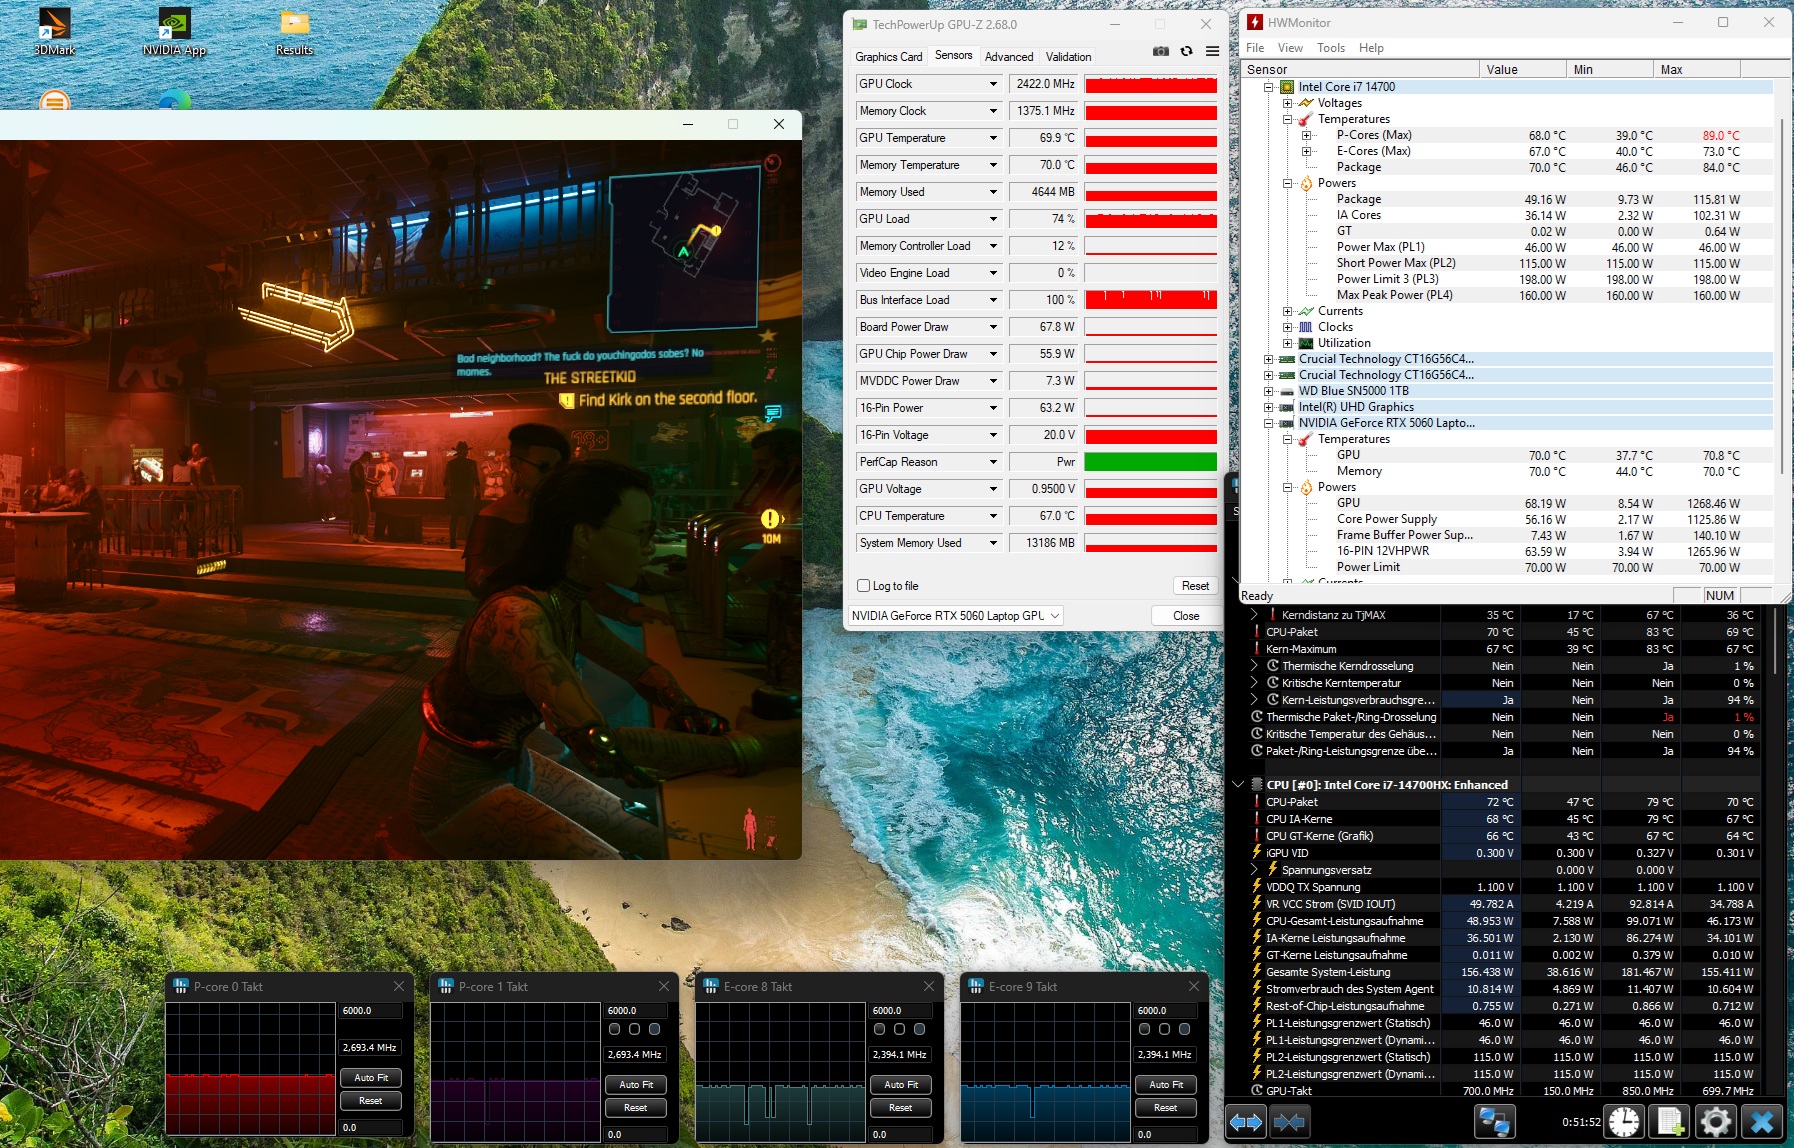
压力测试
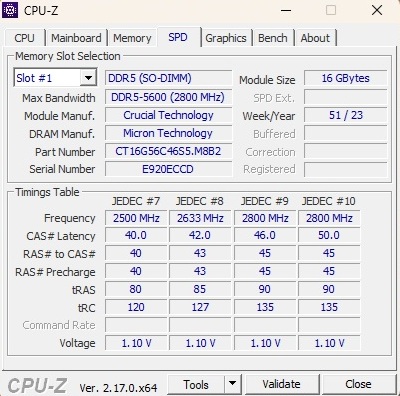
节流型酷睿 i7-14700HX 完成 Furmark 和 Prime95 综合压力测试时的温度约为 70 °C,完全无害。GeForce RTX 5060 也在大约 70 °C时趋于平稳。
.jpg)
.jpg)
.jpg)
.jpg)
#0 could not convert image to webp (convert_image_webp function, file: /Notebooks/Tulpar/T6_V3.5/temp_tulpar-(1).jpg, status:2), tried cmd /usr/local/bin/magick /var/www/notebookcheck/fileadmin/Notebooks/Tulpar/T6_V3.5/temp_tulpar-(1).jpg -resize 227x -quality 82 -auto-orient /var/www/notebookcheck/fileadmin/_processed_/webp/Notebooks/Tulpar/T6_V3.5/temp_tulpar-(1)-q82-w227-h.webp && chmod 644 /var/www/notebookcheck/fileadmin/_processed_/webp/Notebooks/Tulpar/T6_V3.5/temp_tulpar-(1)-q82-w227-h.webp +0.001s ... 0.006s
#1 cant get getimagesize for webp image. +0s ... 0.006s
#2 could not convert image to webp (convert_image_webp function, file: /Notebooks/Tulpar/T6_V3.5/temp_tulpar-(1).jpg, status:2), tried cmd /usr/local/bin/magick /var/www/notebookcheck/fileadmin/Notebooks/Tulpar/T6_V3.5/temp_tulpar-(1).jpg -resize 454x -quality 82 -auto-orient /var/www/notebookcheck/fileadmin/_processed_/webp/Notebooks/Tulpar/T6_V3.5/temp_tulpar-(1)-q82-w454-h.webp && chmod 644 /var/www/notebookcheck/fileadmin/_processed_/webp/Notebooks/Tulpar/T6_V3.5/temp_tulpar-(1)-q82-w454-h.webp +0.001s ... 0.007s
#3 cant get getimagesize for webp image. +0s ... 0.007s
#4 could not convert image to webp (convert_image_webp function, file: /Notebooks/Tulpar/T6_V3.5/temp_tulpar-(2).jpg, status:2), tried cmd /usr/local/bin/magick /var/www/notebookcheck/fileadmin/Notebooks/Tulpar/T6_V3.5/temp_tulpar-(2).jpg -resize 227x -quality 82 -auto-orient /var/www/notebookcheck/fileadmin/_processed_/webp/Notebooks/Tulpar/T6_V3.5/temp_tulpar-(2)-q82-w227-h.webp && chmod 644 /var/www/notebookcheck/fileadmin/_processed_/webp/Notebooks/Tulpar/T6_V3.5/temp_tulpar-(2)-q82-w227-h.webp +0.001s ... 0.01s
#5 cant get getimagesize for webp image. +0s ... 0.01s
#6 could not convert image to webp (convert_image_webp function, file: /Notebooks/Tulpar/T6_V3.5/temp_tulpar-(2).jpg, status:2), tried cmd /usr/local/bin/magick /var/www/notebookcheck/fileadmin/Notebooks/Tulpar/T6_V3.5/temp_tulpar-(2).jpg -resize 454x -quality 82 -auto-orient /var/www/notebookcheck/fileadmin/_processed_/webp/Notebooks/Tulpar/T6_V3.5/temp_tulpar-(2)-q82-w454-h.webp && chmod 644 /var/www/notebookcheck/fileadmin/_processed_/webp/Notebooks/Tulpar/T6_V3.5/temp_tulpar-(2)-q82-w454-h.webp +0.001s ... 0.011s
#7 cant get getimagesize for webp image. +0s ... 0.011s
#8 could not convert image to webp (convert_image_webp function, file: /Notebooks/Tulpar/T6_V3.5/temp_tulpar-(3).jpg, status:2), tried cmd /usr/local/bin/magick /var/www/notebookcheck/fileadmin/Notebooks/Tulpar/T6_V3.5/temp_tulpar-(3).jpg -resize 226x -quality 82 -auto-orient /var/www/notebookcheck/fileadmin/_processed_/webp/Notebooks/Tulpar/T6_V3.5/temp_tulpar-(3)-q82-w226-h.webp && chmod 644 /var/www/notebookcheck/fileadmin/_processed_/webp/Notebooks/Tulpar/T6_V3.5/temp_tulpar-(3)-q82-w226-h.webp +0.001s ... 0.016s
#9 cant get getimagesize for webp image. +0s ... 0.016s
#10 could not convert image to webp (convert_image_webp function, file: /Notebooks/Tulpar/T6_V3.5/temp_tulpar-(3).jpg, status:2), tried cmd /usr/local/bin/magick /var/www/notebookcheck/fileadmin/Notebooks/Tulpar/T6_V3.5/temp_tulpar-(3).jpg -resize 452x -quality 82 -auto-orient /var/www/notebookcheck/fileadmin/_processed_/webp/Notebooks/Tulpar/T6_V3.5/temp_tulpar-(3)-q82-w452-h.webp && chmod 644 /var/www/notebookcheck/fileadmin/_processed_/webp/Notebooks/Tulpar/T6_V3.5/temp_tulpar-(3)-q82-w452-h.webp +0.001s ... 0.017s
#11 cant get getimagesize for webp image. +0s ... 0.017s
#12 could not convert image to webp (convert_image_webp function, file: /Notebooks/Tulpar/T6_V3.5/temp_tulpar-(4).jpg, status:2), tried cmd /usr/local/bin/magick /var/www/notebookcheck/fileadmin/Notebooks/Tulpar/T6_V3.5/temp_tulpar-(4).jpg -resize 226x -quality 82 -auto-orient /var/www/notebookcheck/fileadmin/_processed_/webp/Notebooks/Tulpar/T6_V3.5/temp_tulpar-(4)-q82-w226-h.webp && chmod 644 /var/www/notebookcheck/fileadmin/_processed_/webp/Notebooks/Tulpar/T6_V3.5/temp_tulpar-(4)-q82-w226-h.webp +0.001s ... 0.02s
#13 cant get getimagesize for webp image. +0s ... 0.02s
#14 could not convert image to webp (convert_image_webp function, file: /Notebooks/Tulpar/T6_V3.5/temp_tulpar-(4).jpg, status:2), tried cmd /usr/local/bin/magick /var/www/notebookcheck/fileadmin/Notebooks/Tulpar/T6_V3.5/temp_tulpar-(4).jpg -resize 452x -quality 82 -auto-orient /var/www/notebookcheck/fileadmin/_processed_/webp/Notebooks/Tulpar/T6_V3.5/temp_tulpar-(4)-q82-w452-h.webp && chmod 644 /var/www/notebookcheck/fileadmin/_processed_/webp/Notebooks/Tulpar/T6_V3.5/temp_tulpar-(4)-q82-w452-h.webp +0.001s ... 0.021s
#15 cant get getimagesize for webp image. +0s ... 0.021s
发言人
由于内置 2.0 扬声器的音质有限,尤其是低音部分,因此建议长期使用外置音频系统。
Tulpar T6 V3.5 audio analysis
(+) | speakers can play relatively loud (82 dB)
Bass 100 - 315 Hz
(-) | nearly no bass - on average 22.4% lower than median
(±) | linearity of bass is average (14.4% delta to prev. frequency)
Mids 400 - 2000 Hz
(±) | higher mids - on average 10.7% higher than median
(+) | mids are linear (6.6% delta to prev. frequency)
Highs 2 - 16 kHz
(+) | balanced highs - only 3.5% away from median
(±) | linearity of highs is average (7.4% delta to prev. frequency)
Overall 100 - 16.000 Hz
(±) | linearity of overall sound is average (24% difference to median)
Compared to same class
» 86% of all tested devices in this class were better, 4% similar, 9% worse
» The best had a delta of 6%, average was 18%, worst was 132%
Compared to all devices tested
» 72% of all tested devices were better, 6% similar, 22% worse
» The best had a delta of 4%, average was 24%, worst was 134%
HP Omen 16-ap0091ng audio analysis
(±) | speaker loudness is average but good (79.91 dB)
Bass 100 - 315 Hz
(-) | nearly no bass - on average 18% lower than median
(±) | linearity of bass is average (11.1% delta to prev. frequency)
Mids 400 - 2000 Hz
(±) | higher mids - on average 6.9% higher than median
(±) | linearity of mids is average (7.5% delta to prev. frequency)
Highs 2 - 16 kHz
(+) | balanced highs - only 2.1% away from median
(±) | linearity of highs is average (7.5% delta to prev. frequency)
Overall 100 - 16.000 Hz
(±) | linearity of overall sound is average (17.8% difference to median)
Compared to same class
» 53% of all tested devices in this class were better, 10% similar, 37% worse
» The best had a delta of 6%, average was 18%, worst was 132%
Compared to all devices tested
» 36% of all tested devices were better, 8% similar, 56% worse
» The best had a delta of 4%, average was 24%, worst was 134%
能源管理
耗电量
虽然 T6 V3.5 的能效比某些同类机型要高一些,但总体功耗还算合理。它的 230 瓦电源适配器很少接近极限。
| Off / Standby | |
| Idle | |
| Load |
|
Key:
min: | |
| Tulpar T6 V3.5 i7-14700HX, GeForce RTX 5060 Laptop | Acer Nitro V 16 AI ANV16-42-R860 R5 240, GeForce RTX 5050 Laptop | Alienware 16 Aurora Core 7 240H, GeForce RTX 5060 Laptop | HP Omen 16-ap0091ng R9 8940HX, GeForce RTX 5060 Laptop | Lenovo Legion 5 15AHP G10 R7 260, GeForce RTX 5060 Laptop | Gigabyte Gaming A16 GA6H i7-13620H, GeForce RTX 5070 Laptop | Average of class Gaming | |
|---|---|---|---|---|---|---|---|
| Power Consumption | 38% | 17% | 1% | 15% | 10% | -26% | |
| Idle Minimum * (Watt) | 6.7 | 4.2 37% | 4.4 34% | 7.8 -16% | 6.9 -3% | 9 -34% | 13 ? -94% |
| Idle Average * (Watt) | 13.7 | 6.8 50% | 18 -31% | 8.8 36% | 10.7 22% | 11 20% | 18.7 ? -36% |
| Idle Maximum * (Watt) | 21.8 | 9.8 55% | 18.2 17% | 21.5 1% | 11.3 48% | 23 -6% | 24.3 ? -11% |
| Load Average * (Watt) | 127 | 62 51% | 87.1 31% | 119 6% | 69.7 45% | 91 28% | 108.2 ? 15% |
| Cyberpunk 2077 ultra external monitor * (Watt) | 151.9 | 129.6 15% | 120.6 21% | 164.5 -8% | 165 -9% | 130 14% | |
| Cyberpunk 2077 ultra * (Watt) | 156.7 | 130.3 17% | 123 22% | 192 -23% | 162.6 -4% | 132.5 15% | |
| Load Maximum * (Watt) | 242 | 135 44% | 183 24% | 208 14% | 233.6 3% | 155 36% | 254 ? -5% |
* ... smaller is better
能耗 赛博朋克/压力测试
带外部监控器的能耗
电池寿命
在我们的 Wi-Fi 测试中,显示屏亮度设置为 150 cd/m²,53 Wh 的电池仅持续了不到 4.5 小时,成绩一般。相比之下,竞争对手的电池容量在 70 到 96 Wh 之间,续航时间从 5 小时(HP Omen 16)到 11 小时(Acer Nitro V 16 AI)不等。
| Tulpar T6 V3.5 i7-14700HX, GeForce RTX 5060 Laptop, 53.35 Wh | Acer Nitro V 16 AI ANV16-42-R860 R5 240, GeForce RTX 5050 Laptop, 76 Wh | Alienware 16 Aurora Core 7 240H, GeForce RTX 5060 Laptop, 96 Wh | HP Omen 16-ap0091ng R9 8940HX, GeForce RTX 5060 Laptop, 70 Wh | Lenovo Legion 5 15AHP G10 R7 260, GeForce RTX 5060 Laptop, 80 Wh | Gigabyte Gaming A16 GA6H i7-13620H, GeForce RTX 5070 Laptop, 76 Wh | Average of class Gaming | |
|---|---|---|---|---|---|---|---|
| Battery runtime | 155% | 70% | 14% | 120% | 75% | 59% | |
| WiFi v1.3 (h) | 4.4 | 11.2 155% | 7.5 70% | 5 14% | 9.7 120% | 7.7 75% | 7 ? 59% |
| H.264 (h) | 5.1 | 11.5 | 8.9 ? | ||||
| Load (h) | 1.3 | 1.2 | 1.51 ? | ||||
| Cyberpunk 2077 ultra 150cd (h) | 0.9 |
Notebookcheck 总体评分
总的来说,Tulpar T6 V3.5 是一款性能稳定的游戏笔记本电脑,配备 RTX 5060,性价比均衡。
Tulpar T6 V3.5
- 11/25/2025 v8
Florian Glaser
 Total Sustainability Score:
 可比较的替代品
Image | Model / Review | Price | Weight | Height | Display |
|---|---|---|---|---|---|
1. 77.8%  | Tulpar T6 V3.5 Intel Core i7-14700HX ⎘ NVIDIA GeForce RTX 5060 Laptop ⎘ 32 GB Memory, 1000 GB SSD | Amazon: List Price: 1160 EUR | 2.4 kg | 25 mm | 16.00" 1920x1200 142 PPI IPS |
2. 77.5% 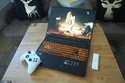 | Acer Nitro V 16 AI ANV16-42-R860 AMD Ryzen 5 240 ⎘ NVIDIA GeForce RTX 5050 Laptop ⎘ 16 GB Memory, 1024 GB SSD | Amazon: 1. $949.99 acer Nitro V 16" WUXGA IPS G... 2. $16.99 180W/135W AC Adapter Compati... 3. $989.00 Acer Nitro V 16 AI Gaming La... List Price: 1100 EUR | 2.4 kg | 24.5 mm | 16.00" 1920x1200 142 PPI IPS |
3. 76.2%  | Alienware 16 Aurora Intel Core 7 240H ⎘ NVIDIA GeForce RTX 5060 Laptop ⎘ 32 GB Memory | Amazon: List Price: 1100 USD | 2.6 kg | 15.2 mm | 16.00" 2560x1600 189 PPI IPS |
4. 82.5%  | HP Omen 16-ap0091ng AMD Ryzen 9 8940HX ⎘ NVIDIA GeForce RTX 5060 Laptop ⎘ 16 GB Memory, 1000 GB SSD | Amazon: List Price: 1500 Euro | 2.4 kg | 23.7 mm | 16.00" 1920x1200 162 PPI IPS |
5. 87.2%  | Lenovo Legion 5 15AHP G10 AMD Ryzen 7 260 ⎘ NVIDIA GeForce RTX 5060 Laptop ⎘ 32 GB Memory, 1024 GB SSD | Amazon: List Price: 1449€ | 1.9 kg | 21.5 mm | 15.10" 2560x1600 200 PPI OLED |
6. 80.1%  | Gigabyte Gaming A16 GA6H Intel Core i7-13620H ⎘ NVIDIA GeForce RTX 5070 Laptop ⎘ 16 GB Memory, 1024 GB SSD | Amazon: 1. $1,598.77 GIGABYTE - Gaming A16 Gaming... 2. $1,085.33 GIGABYTE - Gaming A16 Gaming... 3. $1,224.02 GIGABYTE - Gaming A16 Gaming... List Price: 1700 EUR | 2.3 kg | 23 mm | 16.00" 2560x1600 189 PPI IPS |
Transparency
The selection of devices to be reviewed is made by our editorial team. The test sample was provided to the author as a loan by the manufacturer or retailer for the purpose of this review. The lender had no influence on this review, nor did the manufacturer receive a copy of this review before publication. There was no obligation to publish this review. As an independent media company, Notebookcheck is not subjected to the authority of manufacturers, retailers or publishers.
This is how Notebookcheck is testing
Every year, Notebookcheck independently reviews hundreds of laptops and smartphones using standardized procedures to ensure that all results are comparable. We have continuously developed our test methods for around 20 years and set industry standards in the process. In our test labs, high-quality measuring equipment is utilized by experienced technicians and editors. These tests involve a multi-stage validation process. Our complex rating system is based on hundreds of well-founded measurements and benchmarks, which maintains objectivity. Further information on our test methods can be found here.
