NVIDIA GeForce GTX 1650 Mobile
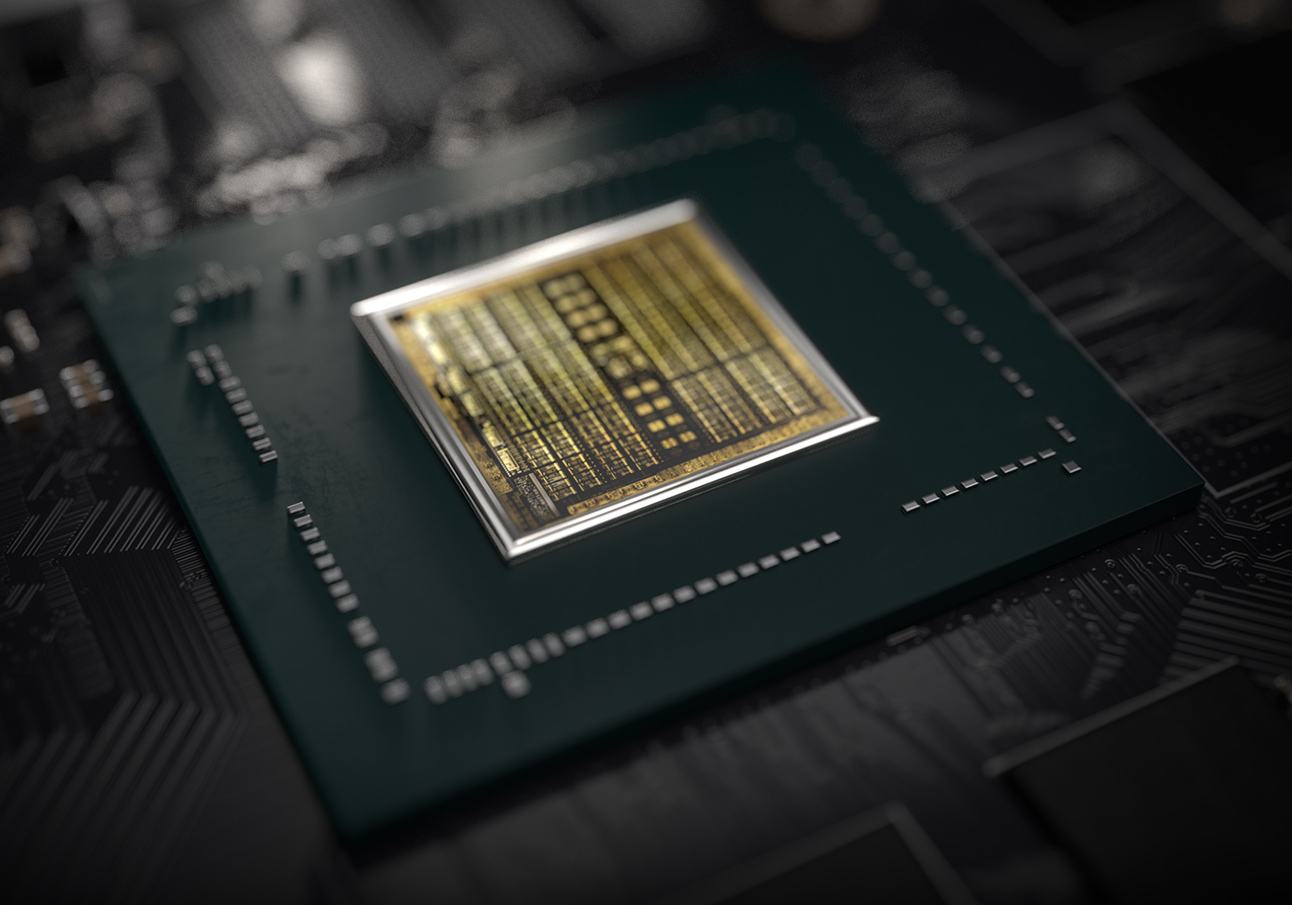
用于笔记本电脑的Nvidia GeForce GTX 1650是基于Turing架构(TU117芯片)的移动图形卡。与更快的RTX 2000 GPU(例如RTX 2060)相比,1650没有集成Raytracing或Tensor内核。性能应该比旧的GeForce GTX 1050 Ti强一点。与台式机版本相比,笔记本版GTX1650的TU117芯片有1024个着色器。
Turing一代不仅为RTX卡引入了光追,而且还优化了内核和缓存的体系结构。根据Nvidia的说法,CUDA内核现在可以同时执行浮点和整数运算,以提高现代游戏中计算繁重的工作负载的性能。此外,对缓存进行了重新设计(新的统一内存体系结构的缓存是Pascal的两倍)。与Pascal相比,这使得每个时钟指令增加50%,能耗提高40%。
与较大的Turing芯片(例如GTX 1660 Ti的TU116和RTX系列)相比,TU117不包括新的NVENC编码器,而是较旧的类似于Pascal和Volta中使用的编码器。
Nvidia将笔记本电脑1650的功耗定为50瓦TGP(总图形功率),比1650的Max-Q版本高15瓦。TU117芯片采用12nm FFN台积电工艺。
GeForce GTX 1600 Series Codename N18P-G0, N18P-G61 Architecture Turing Pipelines 1024 - unified TMUs 56 ROPs 32 Core Speed 1380 - 1560 (Boost) MHz Memory Speed 12000 effective = 1500 MHz Memory Bus Width 128 Bit Memory Type GDDR5, GDDR6 Max. Amount of Memory 4 GB Shared Memory no Memory Bandwidth 192 GB/s API DirectX 12_1, OpenGL 4.6 Power Consumption 50 Watt technology 12 nm PCIe 4.0 Notebook Size medium sized Date of Announcement 23.04.2019 Link to Manufacturer Page www.nvidia.com
Benchmarks Performance Rating - 3DMark 11 + Fire Strike + Time Spy
4.2 pt (13%)
...
NVIDIA Quadro M5000M
NVIDIA GeForce GTX 1650 Mobile
NVIDIA GeForce GTX 780M SLI
AMD Radeon RX Vega M GH
AMD Radeon HD 8970M Crossfire
AMD Radeon RX 580 (Laptop)
...
max:
3DMark - 3DMark Time Spy Score
min: 3080 avg: 3562 median: 3595.5 (10%) max: 3978 Points
GPU TDP ? TDP 30 W TDP 35 W TDP 40 W 100% 94% 87% 94%
...
NVIDIA Quadro T2000 Max-Q
NVIDIA GeForce GTX 1650 Mobile
AMD Radeon RX 580 (Laptop)
NVIDIA Quadro P4000
AMD Radeon RX 5300M
...
max:
3DMark - 3DMark Time Spy Graphics
min: 2900 avg: 3430 median: 3488 (9%) max: 3700 Points
GPU TDP ? TDP 30 W TDP 35 W TDP 40 W 100% 87% 83% 90%
...
NVIDIA Quadro T2000 Max-Q
NVIDIA GeForce GTX 1650 Mobile
AMD Radeon RX 580 (Laptop)
AMD Radeon RX 5300M
NVIDIA Quadro P4000
...
max:
3DMark - 3DMark Ice Storm Unlimited Graphics
min: 200727 avg: 325249 median: 364872 (41%) max: 392682 Points
GPU TDP ? TDP 40 W 81% 100%
...
NVIDIA Quadro P4000 Max-Q
NVIDIA GeForce GTX 1050 Ti Mobile
NVIDIA Quadro P620
NVIDIA GeForce GTX 1050 Max-Q
NVIDIA Quadro M5000M
NVIDIA GeForce GTX 1050 Ti Max-Q
NVIDIA GeForce GTX 1650 Mobile
NVIDIA Quadro P2000 Max-Q
AMD Radeon 680M
NVIDIA Quadro P2000
...
max:
NVIDIA GeForce RTX 3070 Ti
3DMark - 3DMark Ice Storm Extreme Graphics
min: 57517 avg: 91494 median: 82623.5 (11%) max: 141041 Points
Intel HD Graphics (Bay Trail)
...
NVIDIA GeForce GTX 950M
NVIDIA Quadro P2000
NVIDIA GeForce GTX 960M
NVIDIA GeForce GTX 1650 Mobile
AMD Radeon RX Vega 6 (Ryzen 4000/5000)
NVIDIA GeForce GTX 765M
NVIDIA GeForce 945M
AMD Radeon R9 M370X
AMD Radeon RX Vega 7
Intel Iris Pro Graphics 580
Intel Iris Pro Graphics 6200
...
max:
3DMark - 3DMark Cloud Gate Score
min: 16079 avg: 24781 median: 25707 (27%) max: 30573 Points
GPU TDP ? TDP 40 W 83% 100%
Intel Graphics Media Accelerator (GMA) 4500MHD
...
NVIDIA Quadro P620
NVIDIA Quadro RTX 4000 Max-Q
NVIDIA Quadro M5000M
NVIDIA GeForce GTX 1050 Ti Max-Q
NVIDIA Quadro P2000
NVIDIA GeForce GTX 1650 Mobile
AMD Radeon RX Vega M GH
NVIDIA Quadro T2000 Max-Q
NVIDIA Quadro P4000 Max-Q
NVIDIA GeForce GTX 980 (Laptop)
...
max:
3DMark - 3DMark Cloud Gate Graphics
min: 38016 avg: 55346 median: 57365 (15%) max: 66073 Points
GPU TDP ? TDP 40 W 97% 100%
Intel Graphics Media Accelerator (GMA) 4500MHD
...
NVIDIA GeForce GTX 1050 Ti Mobile
NVIDIA Quadro P4000
NVIDIA GeForce GTX 1650 Mobile
AMD Radeon RX 5300M
AMD Radeon Pro Vega 16
AMD Radeon RX Vega M GH
...
max:
3DMark - 3DMark Fire Strike Standard Score
min: 6909 avg: 8152 median: 8081 (14%) max: 9201 Points
GPU TDP ? TDP 30 W TDP 35 W TDP 40 W 100% 95% 91% 96%
...
NVIDIA GeForce GTX 780M SLI
NVIDIA Quadro M5000M
NVIDIA GeForce GTX 1650 Mobile
AMD Radeon HD 8970M Crossfire
AMD Radeon RX Vega M GH
AMD Radeon RX 470 (Laptop)
...
max:
3DMark - 3DMark Fire Strike Standard Graphics
min: 7741 avg: 9195 median: 9313 (11%) max: 9810 Points
GPU TDP ? TDP 30 W TDP 35 W TDP 40 W 100% 89% 86% 92%
...
NVIDIA Quadro T2000 Max-Q
NVIDIA GeForce GTX 1650 Mobile
NVIDIA Quadro M5000M
NVIDIA GeForce GTX 780M SLI
AMD Radeon RX Vega M GH
AMD Radeon RX 5300M
...
max:
3DMark - 3DMark Ice Storm Graphics
min: 60813 avg: 106107 median: 85847 (10%) max: 161091 Points
Intel Graphics Media Accelerator (GMA) 4500MHD
...
Intel Iris Pro Graphics 5200
NVIDIA GeForce GTX 960M
Intel HD Graphics 630
NVIDIA GeForce GTX 760M
NVIDIA GeForce GTX 1650 Mobile
AMD Radeon HD 8970M
NVIDIA GeForce GTX 765M
...
max:
3DMark - 3DMark Wild Life Unlimited
20519 Points (10%)
...
AMD Radeon RX 560X (Laptop)
Intel Iris Xe MAX Graphics
AMD Radeon 680M
Apple M1 7-Core GPU
Apple M1 8-Core GPU
NVIDIA GeForce GTX 1650 Mobile
Apple M2 8-Core GPU
Apple M2 10-Core GPU
...
Apple M1 Max 32-Core GPU
max:
3DMark - 3DMark Night Raid
27315 Points (26%)
...
Intel Iris Xe MAX Graphics
NVIDIA GeForce GTX 1650 Mobile
...
max:
3DMark - 3DMark Night Raid Graphics Score
38744 Points (15%)
...
Intel Iris Xe MAX Graphics
NVIDIA GeForce GTX 1650 Mobile
...
max:
3DMark 11 - 3DM11 Performance Score
min: 9774 avg: 11678 median: 11788 (16%) max: 13143 Points
GPU TDP ? TDP 30 W TDP 35 W TDP 40 W 99% 100% 90% 99%
...
AMD Radeon HD 8970M Crossfire
NVIDIA GeForce GTX 1650 Mobile
NVIDIA Quadro T2000 Max-Q
NVIDIA Quadro P4000
NVIDIA GeForce GTX 780M SLI
...
max:
3DMark 11 - 3DM11 Performance GPU
min: 10885 avg: 12797 median: 13131.5 (11%) max: 13575 Points
GPU TDP ? TDP 30 W TDP 35 W TDP 40 W 100% 88% 84% 88%
...
NVIDIA Quadro M5000M
NVIDIA GeForce GTX 1650 Mobile
AMD Radeon HD 8970M Crossfire
NVIDIA GeForce GTX 780M SLI
AMD Radeon RX Vega M GH
AMD Radeon RX 5300M
...
max:
3DMark Vantage + 3DMark Vantage - 3DM Vant. Perf. total
min: 27719 avg: 31311 median: 31310.5 (9%) max: 34902 Points
...
NVIDIA Quadro M3000M
NVIDIA GeForce GTX 1050 Ti Max-Q
AMD Radeon R9 M295X
NVIDIA GeForce GTX 1050 Ti Mobile
NVIDIA GeForce GTX 1650 Mobile
AMD Radeon 680M
NVIDIA Quadro P2000 Max-Q
NVIDIA Quadro P2000
...
max:
NVIDIA T600
3DM Vant. Perf. GPU no PhysX + 3DMark Vantage - 3DM Vant. Perf. GPU no PhysX
min: 28940 avg: 33810 median: 33809.5 (19%) max: 38679 Points
...
NVIDIA Quadro P2000 Max-Q
NVIDIA Quadro P2000
NVIDIA GeForce GTX 1050 Ti Mobile
NVIDIA GeForce GTX 1650 Mobile
AMD Radeon RX 5300M
...
max:
3DMark 05 - 3DMark 05 - Standard
24001 Points (26%)
Intel Graphics Media Accelerator (GMA) 500
...
NVIDIA GeForce GTX 950M
NVIDIA GeForce GTX 760M
AMD Radeon HD 8790M
NVIDIA GeForce GTX 1650 Mobile
NVIDIA GeForce GTX 765M
NVIDIA GeForce GTX 770M
...
max:
3DMark 06 3DMark 06 - Standard 1280x1024 +
min: 23061 avg: 33654 median: 34484.5 (45%) max: 40902 Points
...
NVIDIA GeForce GTX 980 (Laptop)
NVIDIA Quadro P1000
AMD Radeon RX Vega M GH
NVIDIA GeForce GTX 1650 Mobile
NVIDIA Quadro P2000
NVIDIA GeForce GTX 1080 Mobile
NVIDIA Quadro P620
AMD Radeon R9 M295X
...
max:
3DMark 06 - Standard 1024x768 +
42416 Points (55%)
Model CPU GPU RAM Value 3DMark 06 - Standard 1024x768 Acer Nitro 5 AN517-41-R3FK R7 5800H GeForce GTX 1650 Mobile 1380 / 1500 MHz 4 GB 16 GB 42416
Intel Graphics Media Accelerator (GMA) 500
...
Intel UHD Graphics G1 (Ice Lake 32 EU)
AMD Radeon RX Vega 8 (Ryzen 2000/3000)
AMD Radeon RX Vega 6 (Ryzen 4000/5000)
NVIDIA GeForce GTX 770M
AMD Radeon Pro 560
NVIDIA GeForce GTX 1050 Ti Max-Q
NVIDIA GeForce GTX 1650 Mobile
Unigine Valley 1.0 - Unigine Valley 1.0 DX
40.4 fps (13%)
...
NVIDIA GeForce GTX 1050 Max-Q
NVIDIA Quadro P2000
NVIDIA Quadro P520
NVIDIA Quadro M3000M
NVIDIA GeForce GTX 1050 Ti Max-Q
NVIDIA GeForce GTX 1650 Mobile
NVIDIA Quadro M5000M
NVIDIA Quadro P3200
NVIDIA Quadro RTX 3000 Max-Q
...
max:
Unigine Heaven 3.0 - Unigine Heaven 3.0 DX 11
100.6 fps (33%)
Intel HD Graphics (Bay Trail)
...
NVIDIA GeForce GTX 765M SLI
NVIDIA GeForce GTX 1050 Max-Q
NVIDIA GeForce GTX 780M
AMD FirePro W7170M
NVIDIA Quadro M3000M
NVIDIA GeForce GTX 1650 Mobile
NVIDIA Quadro M5000M
AMD Radeon HD 8970M Crossfire
NVIDIA GeForce GTX 780M SLI
...
Unigine Heaven 3.0 - Unigine Heaven 3.0 OpenGL
97.6 fps (43%)
...
AMD FirePro M6100
AMD FirePro W7170M
NVIDIA Quadro M3000M
NVIDIA GeForce GTX 1050 Max-Q
NVIDIA GeForce GTX 1650 Mobile
NVIDIA Quadro M5000M
NVIDIA GeForce GTX 1080 Mobile
NVIDIA Quadro RTX 5000 Max-Q
Unigine Heaven 2.1 - Heaven 2.1 high
120 fps (23%)
...
AMD Radeon R9 M290X
NVIDIA GeForce GTX 765M SLI
NVIDIA GeForce GTX 780M
NVIDIA GeForce GTX 1050 Max-Q
AMD FirePro W7170M
NVIDIA Quadro M3000M
NVIDIA GeForce GTX 1650 Mobile
AMD Radeon R9 M295X
AMD Radeon HD 8970M Crossfire
NVIDIA Quadro M5000M
NVIDIA GeForce GTX 780M SLI
...
SPECviewperf 13 specvp13 sw-04 + SPECviewperf 13 - specvp13 sw-04
54.5 fps (15%)
Intel Iris Plus Graphics G7 (Ice Lake 64 EU)
...
AMD Radeon Pro WX 3200
Intel UHD Graphics Xe 32EUs (Tiger Lake-H)
NVIDIA GeForce GTX 1650 Mobile
NVIDIA Quadro P520
AMD Radeon RX Vega 7
...
max:
specvp13 snx-03 + SPECviewperf 13 - specvp13 snx-03
11.8 fps (1%)
Intel Iris Xe MAX Graphics
...
Intel UHD Graphics Xe 16EUs (Tiger Lake-H)
NVIDIA GeForce GTX 1650 Mobile
AMD Radeon RX Vega 10
...
max:
specvp13 showcase-02 + SPECviewperf 13 - specvp13 showcase-02
41.2 fps (9%)
Intel UHD Graphics 24EUs (Alder Lake-N)
...
AMD Radeon 680M
NVIDIA Quadro P2000 Max-Q
NVIDIA Quadro P2000
NVIDIA Quadro T2000 Max-Q
NVIDIA GeForce GTX 1650 Mobile
AMD Radeon Pro Vega 16
AMD Radeon RX 5300M
NVIDIA Quadro P3200
...
max:
specvp13 medical-02 + SPECviewperf 13 - specvp13 medical-02
28.1 fps (6%)
...
NVIDIA Quadro P2000
NVIDIA Quadro P620
AMD Radeon 660M
NVIDIA GeForce GTX 1650 Mobile
NVIDIA T500 Laptop GPU
NVIDIA Quadro P3200
AMD Radeon RX 5300M
...
max:
specvp13 maya-05 + SPECviewperf 13 - specvp13 maya-05
120.4 fps (14%)
Intel UHD Graphics 24EUs (Alder Lake-N)
...
NVIDIA Quadro P2000
AMD Radeon 680M
AMD Radeon RX 5300M
AMD Radeon Pro Vega 16
NVIDIA Quadro T2000 Max-Q
NVIDIA GeForce GTX 1650 Mobile
NVIDIA Quadro P3200
...
max:
specvp13 creo-02 + SPECviewperf 13 - specvp13 creo-02
85.6 fps (13%)
Intel Iris Plus Graphics G7 (Ice Lake 64 EU)
...
AMD Radeon 680M
AMD Radeon Pro Vega 16
NVIDIA Quadro P2000 Max-Q
NVIDIA Quadro P2000
NVIDIA GeForce GTX 1650 Mobile
NVIDIA Quadro T2000 Max-Q
...
max:
specvp13 catia-05 + SPECviewperf 13 - specvp13 catia-05
61.2 fps (7%)
Intel UHD Graphics 24EUs (Alder Lake-N)
...
NVIDIA Quadro P520
AMD Radeon RX Vega 7
NVIDIA Quadro P600
AMD Radeon 660M
NVIDIA GeForce GTX 1650 Mobile
Intel Iris Xe MAX Graphics
NVIDIA Quadro P620
NVIDIA Quadro P1000
...
max:
specvp13 3dsmax-06 + SPECviewperf 13 - specvp13 3dsmax-06
103 fps (18%)
Intel UHD Graphics 24EUs (Alder Lake-N)
...
NVIDIA Quadro T2000 Max-Q
NVIDIA GeForce GTX 1650 Mobile
NVIDIA Quadro P3200
NVIDIA Quadro RTX 3000 Max-Q
...
max:
Cinebench R10 Cinebench R10 Shading (32bit) + Cinebench R10 - Cinebench R10 Shading (32bit)
min: 6572 avg: 8609 median: 6821 (5%) max: 14363 points
Intel Graphics Media Accelerator (GMA) 500
...
AMD Radeon Pro WX 3100
AMD Radeon R5 M335
NVIDIA GeForce GTX 1650 Mobile
Intel HD Graphics 530
Intel Iris Plus Graphics 650
NVIDIA GeForce GTX 980 (Laptop)
...
Cinebench R11.5 Cinebench R11.5 OpenGL 64 Bit + Cinebench R11.5 - Cinebench R11.5 OpenGL 64 Bit
min: 69.6 avg: 84.9 median: 88 (30%) max: 94 fps
Intel Graphics Media Accelerator (GMA) 4500MHD
...
NVIDIA Quadro K3100M
NVIDIA Quadro M1000M
NVIDIA GeForce GTX 1650 Mobile
AMD Radeon R9 M290X
AMD FirePro W7170M
AMD Radeon RX 580 (Laptop)
NVIDIA GeForce RTX 2070 Super Max-Q
NVIDIA Quadro M4000M
...
max:
Cinebench R15 + Cinebench R15 - Cinebench R15 OpenGL 64 Bit
min: 73.3 avg: 108.6 median: 103.6 (6%) max: 160 fps
GPU TDP ? TDP 30 W TDP 35 W TDP 40 W 66% 100% 50% 91%
Intel Graphics Media Accelerator (GMA) 4500MHD
...
NVIDIA GeForce GTX 1050 Ti Max-Q
NVIDIA Quadro P4000
AMD Radeon RX 580 (Laptop)
NVIDIA GeForce GTX 1650 Mobile
AMD Radeon R9 M295X
AMD Radeon RX 5300M
AMD FirePro M6100
NVIDIA Quadro M5000M
AMD Radeon Pro 460
...
Cinebench R15 OpenGL Ref. Match 64 Bit + Cinebench R15 - Cinebench R15 OpenGL Ref. Match 64 Bit
min: 99.6 avg: 99.6 median: 99.6 (100%) max: 100 %
GPU TDP ? TDP 30 W TDP 35 W TDP 40 W 100% 100% 100% 100%
...
NVIDIA Quadro P2000 Max-Q
NVIDIA Quadro M4000M
NVIDIA T500 Laptop GPU
NVIDIA GeForce GTX 1050 Ti Max-Q
NVIDIA Quadro M3000M
NVIDIA GeForce GTX 1650 Mobile
NVIDIA Quadro P3200
NVIDIA Quadro RTX 4000 (Laptop)
...
NVIDIA GeForce GTX 780M
GFXBench - GFXBench 5.0 Aztec Ruins High Tier Offscreen
87.1 fps (16%)
...
NVIDIA Quadro T2000 Max-Q
Apple M1 7-Core GPU
Apple M1 8-Core GPU
NVIDIA GeForce GTX 1650 Mobile
Apple M2 8-Core GPU
Apple M2 10-Core GPU
NVIDIA Quadro RTX 3000 Max-Q
...
GFXBench - GFXBench 5.0 Aztec Ruins Normal Tier Offscreen
225.5 fps (17%)
...
Apple M1 7-Core GPU
Apple M1 8-Core GPU
NVIDIA GeForce GTX 1650 Mobile
NVIDIA Quadro RTX 3000 Max-Q
Apple M2 8-Core GPU
Apple M2 10-Core GPU
...
GFXBench - GFXBench Car Chase Offscreen
min: 170.1 avg: 177.1 median: 177.1 (20%) max: 184.1 fps
...
Apple M1 7-Core GPU
AMD Radeon RX 5300M
Apple M1 8-Core GPU
NVIDIA GeForce GTX 1650 Mobile
Apple M2 8-Core GPU
Apple M2 10-Core GPU
NVIDIA Quadro P4000
NVIDIA Quadro P3200
NVIDIA Quadro RTX 3000 Max-Q
...
GFXBench 3.1 - GFXBench Manhattan ES 3.1 Offscreen
272.9 fps (6%)
Intel HD Graphics (Bay Trail)
...
NVIDIA Quadro T2000 Max-Q
Apple M1 7-Core GPU
Apple M1 8-Core GPU
NVIDIA GeForce GTX 1650 Mobile
Apple M2 8-Core GPU
NVIDIA Quadro P4000
Apple M2 10-Core GPU
...
GFXBench 3.0 - GFXBench 3.0 Manhattan Offscreen
331 fps (19%)
...
NVIDIA Quadro T2000 Max-Q
NVIDIA GeForce GTX 1050 Ti Mobile
NVIDIA GeForce GTX 1650 Mobile
Apple M1 8-Core GPU
Apple M1 7-Core GPU
NVIDIA GeForce GTX 980 (Laptop)
NVIDIA Quadro P4000
...
GFXBench (DX / GLBenchmark) 2.7 + GFXBench (DX / GLBenchmark) 2.7 - GFXBench T-Rex HD Offscreen C24Z16
775 fps (6%)
Intel HD Graphics (Bay Trail)
...
Apple M1 8-Core GPU
Apple M1 7-Core GPU
NVIDIA Quadro T2000 Max-Q
NVIDIA GeForce GTX 1650 Mobile
Apple M2 8-Core GPU
Apple M2 10-Core GPU
...
LuxMark v2.0 64Bit - LuxMark v2.0 Room GPU
min: 1294 avg: 1479 median: 1478.5 (7%) max: 1663 Samples/s
...
NVIDIA Quadro P2000 Max-Q
NVIDIA Quadro M5000M
NVIDIA GeForce GTX 1050 Ti Mobile
AMD Radeon RX 580 (Laptop)
NVIDIA GeForce GTX 1650 Mobile
AMD Radeon RX Vega M GH
AMD Radeon RX 5300M
NVIDIA Quadro P520
AMD Radeon HD 8650G + HD 8670M Dual Graphics
NVIDIA Quadro T2000 Max-Q
...
max:
4x NVIDIA RTX A6000
LuxMark v2.0 64Bit - LuxMark v2.0 Sala GPU
min: 2474 avg: 2873 median: 2872.5 (5%) max: 3271 Samples/s
...
NVIDIA Quadro P2000 Max-Q
NVIDIA GeForce GTX 1050 Ti Mobile
NVIDIA Quadro P2000
AMD Radeon RX Vega M GH
NVIDIA GeForce GTX 1650 Mobile
NVIDIA Quadro T2000 Max-Q
Intel Iris Xe MAX Graphics
NVIDIA GeForce GTX 980 (Laptop)
AMD Radeon RX 5300M
...
max:
4x NVIDIA RTX A6000
ComputeMark v2.1 - ComputeMark v2.1 Result
min: 6891 avg: 6931 median: 6931 (7%) max: 6971 points
...
NVIDIA Quadro T2000 Max-Q
AMD Radeon RX Vega M GH
NVIDIA GeForce GTX 1650 Mobile
AMD Radeon RX 5300M
NVIDIA Quadro P4000 Max-Q
NVIDIA Quadro P4000
...
max:
Power Consumption - Furmark Stress Test Power Consumption - external Monitor *
min: 52.5 avg: 79.8 median: 91 (13%) max: 100 Watt
GPU TDP ? TDP 30 W TDP 35 W TDP 40 W 100% 106% 106% 100%
...
NVIDIA Quadro P2000 Max-Q
NVIDIA GeForce GTX 1050 Ti Max-Q
NVIDIA GeForce GTX 950M
NVIDIA GeForce GTX 1650 Mobile
NVIDIA Quadro P4000
...
max:
4x NVIDIA RTX A6000
0 10 20 30 40 50 60 70 80 90 100 110 120 130 Tooltip Acer Swift X SFX14-41G-R7F3: Ø52.5 (49.1-60.9)
Lenovo IdeaPad 5 Pro 16ACH: Ø56.8 (54.2-67.2)
Acer Aspire 7 A715-42G-R0XB: Ø69.5 (65.9-80)
Lenovo Yoga Creator 7 15IMH05 82DS000VGE: Ø91 (86.3-130)
Acer Nitro 5 AN515-45-R05E: Ø94.1 (90.1-102)
Acer Nitro 5 AN517-41-R3FK: Ø100.4 (97.9-112)
Power Consumption - The Witcher 3 Power Consumption - external Monitor *
min: 55.9 avg: 81 median: 85.8 (12%) max: 94.3 Watt
GPU TDP ? TDP 30 W TDP 40 W 100% 105% 100%
...
NVIDIA GeForce GTX 1050 Ti Max-Q
NVIDIA GeForce GTX 1650 Mobile
AMD Radeon RX 560X (Laptop)
Intel UHD Graphics Xe 750 32EUs (Rocket Lake)
NVIDIA GeForce GTX 1050 Ti Mobile
...
max:
4x NVIDIA RTX A6000
0 10 20 30 40 50 60 70 80 90 100 110 120 Tooltip Lenovo IdeaPad 5 Pro 16ACH: Ø55.9 (53.5-60.9)
Acer Aspire 7 A715-42G-R0XB: Ø70.7 (63-74.7)
Lenovo Yoga Creator 7 15IMH05 82DS000VGE: Ø84.1 (79.1-95.1)
Acer Nitro 5 AN515-45-R05E: Ø87.4 (84.2-120)
Acer Nitro 5 AN517-41-R3FK: Ø94.3 (91-103)
Power Consumption - Witcher 3 Power Consumption *
min: 57.3 avg: 88.8 median: 90.9 (20%) max: 109 Watt
GPU TDP ? TDP 30 W TDP 35 W TDP 40 W 101% 100% 110% 105%
...
NVIDIA Quadro P2000 Max-Q
AMD Radeon Pro WX Vega M GL
NVIDIA Quadro T2000 Max-Q
AMD Radeon RX 560 (Laptop)
NVIDIA GeForce GTX 1650 Mobile
NVIDIA GeForce GTX 1050 Ti Max-Q
...
0 10 20 30 40 50 60 70 80 90 100 110 120 130 140 Tooltip Acer Swift X SFX14-41G-R7F3: Ø57.3 (55.2-65.4)
Acer Aspire 7 A715-42G-R0XB: Ø72.7 (70.5-93.3)
Acer Nitro 5 AN515-45-R05E: Ø91.9 (88.6-112)
Lenovo IdeaPad 5 Pro 16ACH: Ø94.4 (91.8-97.7)
Acer Nitro 5 AN517-41-R3FK: Ø107.8 (91.7-140)
Power Consumption - Witcher 3 ultra Power Efficiency
min: 0.3111 avg: 0.4 median: 0.4 (39%) max: 0.534 fps per Watt
GPU TDP ? TDP 30 W TDP 35 W TDP 40 W 77% 66% 100% 90%
...
NVIDIA Quadro T2000 Max-Q
AMD Radeon 660M
NVIDIA Quadro P4000 Max-Q
NVIDIA T500 Laptop GPU
NVIDIA GeForce GTX 1650 Mobile
AMD Radeon 680M
...
Apple M2 10-Core GPU
0 5 10 15 20 25 30 35 40 45 50 55 60 65 Tooltip Acer Swift X SFX14-41G-R7F3: Ø54.8 (53.3-68.1)
Acer Swift X SFX14-41G-R7F3: Ø57.3 (55.2-65.4)
Power Consumption - Witcher 3 ultra Power Efficiency - external Monitor
min: 0.3991 avg: 0.5 median: 0.4 (35%) max: 0.585 fps per Watt
GPU TDP ? TDP 30 W TDP 40 W 77% 100% 72%
...
AMD Radeon 680M
NVIDIA Quadro P4000 Max-Q
NVIDIA T500 Laptop GPU
NVIDIA GeForce GTX 1650 Mobile
NVIDIA Quadro RTX 3000 Max-Q
...
Emissions Witcher 3 Fan Noise + Emissions - Witcher 3 Fan Noise
min: 35.2 avg: 44.2 median: 45.7 (73%) max: 52 dB(A)
GPU TDP ? TDP 30 W TDP 40 W 89% 100% 85%
...
NVIDIA Quadro RTX 3000 Max-Q
AMD Radeon RX 460 (Laptop)
NVIDIA GeForce GTX 1050 Ti Mobile
NVIDIA GeForce GTX 1650 Mobile
Intel Iris Xe MAX Graphics
...
Clock Speed - GPU Clock Witcher 3 ultra
min: 1570 avg: 1685 median: 1680 (66%) max: 1770 MHz
...
NVIDIA GeForce GTX 1050 Ti Mobile
NVIDIA GeForce GTX 1650 Mobile
AMD Radeon 680M
NVIDIA GeForce RTX 2080 Super Mobile
NVIDIA GeForce GTX 1080 Mobile
...
Clock Speed - GPU Clock Speed Furmark
min: 713 avg: 1225 median: 1273 (50%) max: 1689 MHz
...
NVIDIA GeForce RTX 2070 Super Mobile
AMD Radeon RX 560X (Laptop)
AMD Radeon RX Vega M GH
Intel Iris Xe MAX Graphics
NVIDIA GeForce GTX 1650 Mobile
NVIDIA Quadro P500
...
max:
AMD Radeon RX 6700 XT
- Range of benchmark values for this graphics card
- Average benchmark values for this graphics card
* Smaller numbers mean a higher performance
Game Benchmarks The following benchmarks stem from our benchmarks of review laptops. The performance depends on the used graphics memory, clock rate, processor, system settings, drivers, and operating systems. So the results don't have to be representative for all laptops with this GPU. For detailed information on the benchmark results, click on the fps number.
0 100 200 300 400 500 600 700 Tooltip ThinkBook 15p G2 ITH 21B1000WGE: Ø60.2 (19.217-745)
NVIDIA GeForce GTX 1650 Mobile
...
max:
0 Tooltip ThinkBook 15p G2 ITH 21B1000WGE: Ø27.2 (17.155-45.2)
NVIDIA GeForce GTX 1650 Mobile
...
max:
0 100 200 Tooltip ThinkBook 15p G2 ITH 21B1000WGE: Ø29.8 (10.05-260)
NVIDIA GeForce GTX 1650 Mobile
...
max:
0 Tooltip ThinkBook 15p G2 ITH 21B1000WGE: Ø15.2 (7.466-28)
NVIDIA GeForce GTX 1650 Mobile
...
max:
» The benchmarks indicate that the game is not playable in the tested settings.
Additional Benchmarks
Max. Performance 1280x720
44.2 [X] Lenovo ThinkBook 15p G2 ITH 21B1000WGE Intel Core i5-11400H 2.7GHz
GeForce GTX 1650 Mobile
min:
24.8 fps, P0.1:
24.9 fps, P1:
26.5 fps, max:
116 fps
0 Tooltip ThinkBook 15p G2 ITH 21B1000WGE: Ø51.6 (42.04-62.33)
Intel UHD Graphics Xe 32EUs (Tiger Lake-H)
NVIDIA GeForce GTX 1650 Mobile
max:
0 Tooltip ThinkBook 15p G2 ITH 21B1000WGE: Ø47.5 (38.303-77.2)
NVIDIA GeForce GTX 1650 Mobile
...
max:
0 100 200 300 Tooltip ThinkBook 15p G2 ITH 21B1000WGE: Ø50.2 (29.025-336)
NVIDIA GeForce GTX 1650 Mobile
...
max:
0 Tooltip ThinkBook 15p G2 ITH 21B1000WGE: Ø34.1 (27.186-60)
NVIDIA GeForce GTX 1650 Mobile
...
max:
» With all tested laptops playable in detail settings med..
Additional Benchmarks
Very Low Preset 1280x720
107.6 [X] Lenovo ThinkBook 15p G2 ITH 21B1000WGE Intel Core i5-11400H 2.7GHz
GeForce GTX 1650 Mobile
min:
20.9 fps, P0.1:
45.6 fps, P1:
75.7 fps, max:
194.9 fps
0 100 200 300 Tooltip ThinkBook 15p G2 ITH 21B1000WGE: Ø298 (203.216-390.8)
Intel UHD Graphics Xe 16EUs (Tiger Lake-H)
...
AMD Radeon 680M
NVIDIA GeForce GTX 1650 Mobile
...
max:
0 100 200 Tooltip ThinkBook 15p G2 ITH 21B1000WGE: Ø218 (189.49-298.8)
...
Intel UHD Graphics Xe 32EUs (Tiger Lake-H)
AMD Radeon 680M
NVIDIA GeForce GTX 1650 Mobile
...
max:
0 100 200 Tooltip ThinkBook 15p G2 ITH 21B1000WGE: Ø200 (174.097-238)
...
Intel UHD Graphics Xe 32EUs (Tiger Lake-H)
AMD Radeon 680M
NVIDIA GeForce GTX 1650 Mobile
...
max:
» With all tested laptops playable in detail settings ultra.
0 100 200 Tooltip ThinkBook 15p G2 ITH 21B1000WGE: Ø90 (56.302-200.3)
...
Intel Iris Plus Graphics G7 (Ice Lake 64 EU)
AMD Radeon RX Vega 6 (Ryzen 4000/5000)
Intel UHD Graphics Xe 32EUs (Tiger Lake-H)
NVIDIA GeForce GTX 1650 Mobile
...
max:
0 100 Tooltip ThinkBook 15p G2 ITH 21B1000WGE: Ø75.4 (49.59-133.6)
Intel Iris Plus Graphics G7 (Ice Lake 64 EU)
...
AMD Radeon RX Vega 6 (Ryzen 4000/5000)
Intel UHD Graphics Xe 32EUs (Tiger Lake-H)
NVIDIA GeForce GTX 1650 Mobile
...
max:
0 100 Tooltip ThinkBook 15p G2 ITH 21B1000WGE: Ø68.5 (42.48-117.2)
AMD Radeon RX Vega 6 (Ryzen 4000/5000)
Intel UHD Graphics Xe 32EUs (Tiger Lake-H)
NVIDIA GeForce GTX 1650 Mobile
...
max:
0 Tooltip ThinkBook 15p G2 ITH 21B1000WGE: Ø43.7 (32.158-58.9)
AMD Radeon RX Vega 6 (Ryzen 4000/5000)
Intel UHD Graphics Xe 32EUs (Tiger Lake-H)
NVIDIA GeForce GTX 1650 Mobile
...
max:
» With all tested laptops playable in detail settings ultra.
0 100 Tooltip ThinkBook 15p G2 ITH 21B1000WGE: Ø108 (84.416-153.9)
Intel UHD Graphics Xe 16EUs (Tiger Lake-H)
...
Intel UHD Graphics Xe 32EUs (Tiger Lake-H)
NVIDIA GeForce GTX 1650 Mobile
...
max:
0 100 Tooltip ThinkBook 15p G2 ITH 21B1000WGE: Ø77.1 (54.669-199.3)
AMD Radeon RX Vega 6 (Ryzen 4000/5000)
Intel UHD Graphics Xe 32EUs (Tiger Lake-H)
NVIDIA GeForce GTX 1650 Mobile
...
max:
0 100 200 300 400 500 600 700 800 Tooltip ThinkBook 15p G2 ITH 21B1000WGE: Ø89.5 (49.498-831)
Intel UHD Graphics Xe 32EUs (Tiger Lake-H)
AMD Radeon RX Vega 6 (Ryzen 4000/5000)
NVIDIA GeForce GTX 1650 Mobile
...
max:
0 100 Tooltip ThinkBook 15p G2 ITH 21B1000WGE: Ø50.1 (35.614-125.3)
AMD Radeon RX Vega 6 (Ryzen 4000/5000)
NVIDIA GeForce GTX 1650 Mobile
...
max:
» With all tested laptops playable in detail settings ultra.
Additional Benchmarks
Low Preset 1280x720
136.4 [X] Lenovo ThinkBook 15p G2 ITH 21B1000WGE Intel Core i5-11400H 2.7GHz
GeForce GTX 1650 Mobile
min:
38.5 fps, P0.1:
83.9 fps, P1:
97.3 fps, max:
221 fps
AMD Radeon RX Vega 6 (Ryzen 4000/5000)
NVIDIA GeForce GTX 1650 Mobile
...
max:
NVIDIA GeForce GTX 1650 Mobile
...
max:
NVIDIA GeForce GTX 1650 Mobile
...
max:
» The benchmarks indicate that the game is not playable in the tested settings.
Additional Benchmarks
Low Preset TAA 1280x720
35 [X] Lenovo ThinkBook 15p G2 ITH 21B1000WGE Intel Core i5-11400H 2.7GHz
GeForce GTX 1650 Mobile
min:
12 fps, max:
48 fps
Intel UHD Graphics Xe 16EUs (Tiger Lake-H)
AMD Radeon RX Vega 6 (Ryzen 4000/5000)
NVIDIA GeForce GTX 1650 Mobile
...
max:
AMD Radeon RX Vega 6 (Ryzen 4000/5000)
NVIDIA GeForce GTX 1650 Mobile
...
max:
NVIDIA GeForce GTX 1650 Mobile
...
max:
NVIDIA GeForce GTX 1650 Mobile
...
max:
» With all tested laptops playable in detail settings high.
Additional Benchmarks
Minimum Preset 1280x720
97 [X] Lenovo ThinkBook 15p G2 ITH 21B1000WGE Intel Core i5-11400H 2.7GHz
GeForce GTX 1650 Mobile
min:
71 fps
0 Tooltip ThinkBook 15p G2 ITH 21B1000WGE: Ø55.9 (35.32-95.5)
...
Intel UHD Graphics Xe 32EUs (Tiger Lake-H)
Intel Iris Plus Graphics G7 (Ice Lake 64 EU)
NVIDIA GeForce GTX 1650 Mobile
max:
0 100 Tooltip ThinkBook 15p G2 ITH 21B1000WGE: Ø44 (35.474-126.8)
NVIDIA GeForce GTX 1650 Mobile
...
max:
0 100 200 Tooltip ThinkBook 15p G2 ITH 21B1000WGE: Ø33.2 (22.222-209.3)
NVIDIA GeForce GTX 1650 Mobile
...
max:
0 Tooltip ThinkBook 15p G2 ITH 21B1000WGE: Ø20.7 (16.05-49.2)
NVIDIA GeForce GTX 1650 Mobile
...
max:
» With all tested laptops playable in detail settings med..
Additional Benchmarks
Ultra Low Preset LowAA 1280x720
110 [X] Lenovo ThinkBook 15p G2 ITH 21B1000WGE Intel Core i5-11400H 2.7GHz
GeForce GTX 1650 Mobile
min:
34.9 fps, P0.1:
62.9 fps, P1:
78.6 fps, max:
155.9 fps
0 Tooltip ThinkBook 15p G2 ITH 21B1000WGE: Ø26.9 (22.248-51.7)
AMD Radeon 680M
NVIDIA GeForce GTX 1650 Mobile
...
max:
0 Tooltip ThinkBook 15p G2 ITH 21B1000WGE: Ø23.2 (20.122-37.6)
AMD Radeon 680M
NVIDIA GeForce GTX 1650 Mobile
...
max:
0 100 Tooltip ThinkBook 15p G2 ITH 21B1000WGE: Ø27 (18.01-127.9)
AMD Radeon 680M
NVIDIA GeForce GTX 1650 Mobile
...
max:
» The benchmarks indicate that the game is not playable in the tested settings.
Additional Benchmarks
Low Preset 1280x720
40 [X] Lenovo ThinkBook 15p G2 ITH 21B1000WGE Intel Core i5-11400H 2.7GHz
GeForce GTX 1650 Mobile
min:
23.6 fps, P0.1:
24.6 fps, P1:
29.9 fps, max:
64 fps
0 Tooltip ThinkBook 15p G2 ITH 21B1000WGE: Ø33.8 (27.847-67.1)
AMD Radeon RX Vega 6 (Ryzen 4000/5000)
AMD Radeon 680M
NVIDIA GeForce GTX 1650 Mobile
...
max:
0 Tooltip ThinkBook 15p G2 ITH 21B1000WGE: Ø28.5 (22.033-52.9)
AMD Radeon 680M
NVIDIA GeForce GTX 1650 Mobile
...
max:
0 Tooltip ThinkBook 15p G2 ITH 21B1000WGE: Ø22.8 (16.802-54.7)
AMD Radeon 680M
NVIDIA GeForce GTX 1650 Mobile
...
max:
0 Tooltip ThinkBook 15p G2 ITH 21B1000WGE: Ø19 (11.081-81.3)
NVIDIA GeForce GTX 1650 Mobile
...
max:
» The benchmarks indicate that the game is not playable in the tested settings.
Additional Benchmarks
Low Preset 1280x720
53.2 [X] Lenovo ThinkBook 15p G2 ITH 21B1000WGE Intel Core i5-11400H 2.7GHz
GeForce GTX 1650 Mobile
min:
12.9 fps, P0.1:
17.6 fps, P1:
37.2 fps, max:
102.9 fps
...
NVIDIA GeForce GTX 1650 Mobile
...
max:
...
AMD Radeon 680M
NVIDIA GeForce GTX 1650 Mobile
...
max:
Intel UHD Graphics G1 (Ice Lake 32 EU)
...
AMD Radeon 680M
NVIDIA GeForce GTX 1650 Mobile
...
max:
...
AMD Radeon 680M
NVIDIA GeForce GTX 1650 Mobile
...
max:
» With all tested laptops playable in detail settings ultra.
Additional Benchmarks
Low Preset 1280x720
219.6 [X] Lenovo ThinkBook 15p G2 ITH 21B1000WGE Intel Core i5-11400H 2.7GHz
GeForce GTX 1650 Mobile
Intel UHD Graphics Xe 16EUs (Tiger Lake-H)
...
AMD Radeon RX Vega 6 (Ryzen 4000/5000)
AMD Radeon 680M
NVIDIA GeForce GTX 1650 Mobile
...
max:
AMD Radeon RX Vega 6 (Ryzen 4000/5000)
...
AMD Radeon RX Vega 10
AMD Radeon 680M
NVIDIA GeForce GTX 1650 Mobile
...
max:
AMD Radeon RX Vega 6 (Ryzen 4000/5000)
NVIDIA GeForce GTX 1650 Mobile
AMD Radeon 680M
...
max:
NVIDIA GeForce GTX 1650 Mobile
AMD Radeon 680M
...
max:
» With all tested laptops playable in detail settings med..
Additional Benchmarks
Low Preset (Adaptive Quality Off) 1280x720
73 [X] Lenovo ThinkBook 15p G2 ITH 21B1000WGE Intel Core i5-11400H 2.7GHz
GeForce GTX 1650 Mobile
min:
42 fps, max:
106 fps
0 100 200 Tooltip ThinkBook 15p G2 ITH 21B1000WGE: Ø64.6 (40.502-258.5)
NVIDIA GeForce GTX 1650 Mobile
...
max:
» With all tested laptops playable in detail settings ultra.
0 100 Tooltip ThinkBook 15p G2 ITH 21B1000WGE: Ø129.3 (72.18-166.01)
...
NVIDIA GeForce GTX 1650 Mobile
max:
0 100 Tooltip ThinkBook 15p G2 ITH 21B1000WGE: Ø116.8 (79.484-170.1)
...
NVIDIA GeForce GTX 1650 Mobile
...
max:
0 100 Tooltip ThinkBook 15p G2 ITH 21B1000WGE: Ø84.3 (56.875-108.33)
...
NVIDIA GeForce GTX 1650 Mobile
...
max:
0 Tooltip ThinkBook 15p G2 ITH 21B1000WGE: Ø54.9 (32.091-75.119)
...
NVIDIA GeForce GTX 1650 Mobile
...
max:
» With all tested laptops playable in detail settings ultra.
Additional Benchmarks
Low Preset 1280x720
151.8 [X] Lenovo ThinkBook 15p G2 ITH 21B1000WGE Intel Core i5-11400H 2.7GHz
GeForce GTX 1650 Mobile
min:
43 fps, P0.1:
65 fps, P1:
72.7 fps, max:
362 fps
41 [X] Lenovo ThinkBook 15p G2 ITH 21B1000WGE 2.02
Intel Core i5-11400H 2.7GHz
GeForce GTX 1650 Mobile
min:
15.4 fps, max:
66.1 fps
fps
+ Compare
- Hide Comparison
Intel UHD Graphics Xe 16EUs (Tiger Lake-H)
...
AMD Radeon 680M
NVIDIA GeForce GTX 1650 Mobile
...
max:
...
AMD Radeon 680M
NVIDIA GeForce GTX 1650 Mobile
...
max:
27 [X] Lenovo ThinkBook 15p G2 ITH 21B1000WGE 2.02
Intel Core i5-11400H 2.7GHz
GeForce GTX 1650 Mobile
min:
10.7 fps, max:
80.9 fps
fps
+ Compare
- Hide Comparison
...
AMD Radeon 680M
NVIDIA GeForce GTX 1650 Mobile
...
max:
...
AMD Radeon 680M
NVIDIA GeForce GTX 1650 Mobile
...
max:
» With all tested laptops playable in detail settings low.
Additional Benchmarks
Low Preset (FSR off) 1280x720
63 [X] Lenovo ThinkBook 15p G2 ITH 21B1000WGE Intel Core i5-11400H 2.7GHz
GeForce GTX 1650 Mobile
min:
9.15 fps, max:
103.2 fps
Steam Deck 1280x720
63.4 [X] Lenovo ThinkBook 15p G2 ITH 21B1000WGE Intel Core i5-11400H 2.7GHz
GeForce GTX 1650 Mobile
min:
37.8 fps, max:
111.1 fps
0 Tooltip ThinkBook 15p G2 ITH 21B1000WGE: Ø64 (57.124-80.06)
Intel UHD Graphics Xe 16EUs (Tiger Lake-H)
...
AMD Radeon 680M
NVIDIA GeForce GTX 1650 Mobile
...
max:
0 Tooltip ThinkBook 15p G2 ITH 21B1000WGE: Ø58.4 (50.388-78.5)
...
AMD Radeon 680M
NVIDIA GeForce GTX 1650 Mobile
...
max:
0 Tooltip ThinkBook 15p G2 ITH 21B1000WGE: Ø47.8 (41.045-61.2)
AMD Radeon RX Vega 6 (Ryzen 4000/5000)
...
AMD Radeon 680M
NVIDIA GeForce GTX 1650 Mobile
...
max:
0 Tooltip ThinkBook 15p G2 ITH 21B1000WGE: Ø44.5 (38.072-79)
...
AMD Radeon 680M
NVIDIA GeForce GTX 1650 Mobile
...
max:
» With all tested laptops playable in detail settings ultra.
Additional Benchmarks
Low Preset 1280x720
108 [X] Lenovo ThinkBook 15p G2 ITH 21B1000WGE Intel Core i5-11400H 2.7GHz
GeForce GTX 1650 Mobile
min:
21 fps, P0.1:
34.9 fps, P1:
68.4 fps, max:
214 fps
...
AMD Radeon RX Vega 10
AMD Radeon 680M
NVIDIA GeForce GTX 1650 Mobile
...
AMD Radeon RX Vega 6 (Ryzen 4000/5000)
...
AMD Radeon RX Vega 10
AMD Radeon 680M
NVIDIA GeForce GTX 1650 Mobile
...
max:
AMD Radeon RX Vega 6 (Ryzen 4000/5000)
AMD Radeon 680M
NVIDIA GeForce GTX 1650 Mobile
...
max:
AMD Radeon 680M
NVIDIA GeForce GTX 1650 Mobile
max:
» With all tested laptops playable in detail settings med..
Additional Benchmarks
Low Preset 1280x720
59 [X] Lenovo ThinkBook 15p G2 ITH 21B1000WGE Intel Core i5-11400H 2.7GHz
GeForce GTX 1650 Mobile
min:
55 fps, max:
60 fps
0 100 200 Tooltip ThinkBook 15p G2 ITH 21B1000WGE: Ø48.2 (27.047-277)
...
AMD Radeon 680M
NVIDIA GeForce GTX 1650 Mobile
...
max:
0 Tooltip ThinkBook 15p G2 ITH 21B1000WGE: Ø24.4 (21.016-31.38)
AMD Radeon 680M
NVIDIA GeForce GTX 1650 Mobile
...
max:
0 Tooltip ThinkBook 15p G2 ITH 21B1000WGE: Ø20.2 (17.13-32.66)
AMD Radeon 680M
NVIDIA GeForce GTX 1650 Mobile
...
max:
0 100 Tooltip ThinkBook 15p G2 ITH 21B1000WGE: Ø33.1 (14.024-148.3)
AMD Radeon 680M
NVIDIA GeForce GTX 1650 Mobile
...
max:
» The benchmarks indicate that the game is not playable in the tested settings.
Additional Benchmarks
Low Preset 1280x720
39.9 [X] Lenovo ThinkBook 15p G2 ITH 21B1000WGE Intel Core i5-11400H 2.7GHz
GeForce GTX 1650 Mobile
min:
29 fps, P0.1:
29.8 fps, P1:
31.7 fps, max:
70.6 fps
0 Tooltip ThinkBook 15p G2 ITH 21B1000WGE: Ø67.1 (52.127-86.535)
...
AMD Radeon 680M
NVIDIA GeForce GTX 1650 Mobile
...
max:
0 100 Tooltip ThinkBook 15p G2 ITH 21B1000WGE: Ø59.5 (49.124-124.6)
...
Intel UHD Graphics Xe 32EUs (Tiger Lake-H)
AMD Radeon 680M
NVIDIA GeForce GTX 1650 Mobile
...
max:
0 100 Tooltip ThinkBook 15p G2 ITH 21B1000WGE: Ø52 (7.26-180)
...
Intel UHD Graphics Xe 32EUs (Tiger Lake-H)
AMD Radeon 680M
NVIDIA GeForce GTX 1650 Mobile
...
max:
0 Tooltip ThinkBook 15p G2 ITH 21B1000WGE: Ø23 (16.24-48.2)
AMD Radeon RX Vega 6 (Ryzen 4000/5000)
AMD Radeon RX Vega 10
NVIDIA GeForce GTX 1650 Mobile
AMD Radeon 680M
...
max:
» With all tested laptops playable in detail settings high.
Additional Benchmarks
Low Preset 1280x720
76.2 [X] Lenovo ThinkBook 15p G2 ITH 21B1000WGE Intel Core i5-11400H 2.7GHz
GeForce GTX 1650 Mobile
min:
36.4 fps, P0.1:
41 fps, P1:
49.9 fps, max:
129.3 fps
0 100 Tooltip ThinkBook 15p G2 ITH 21B1000WGE: Ø32.3 (16.02-106)
...
AMD Radeon RX Vega 6 (Ryzen 4000/5000)
AMD Radeon RX Vega 10
AMD Radeon 680M
NVIDIA GeForce GTX 1650 Mobile
...
max:
0 Tooltip ThinkBook 15p G2 ITH 21B1000WGE: Ø28.3 (16.755-45.1)
AMD Radeon 680M
NVIDIA GeForce GTX 1650 Mobile
...
max:
0 Tooltip ThinkBook 15p G2 ITH 21B1000WGE: Ø25.8 (13.797-81.4)
NVIDIA GeForce GTX 1650 Mobile
...
max:
» The benchmarks indicate that the game is not playable in the tested settings.
Additional Benchmarks
Low 1280x720
48.3 [X] Lenovo ThinkBook 15p G2 ITH 21B1000WGE Intel Core i5-11400H 2.7GHz
GeForce GTX 1650 Mobile
min:
2.6 fps, P0.1:
6.11 fps, P1:
19.3 fps, max:
96.6 fps
0 Tooltip ThinkBook 15p G2 ITH 21B1000WGE: Ø57.4 (49.558-94.6)
...
AMD Radeon 680M
NVIDIA GeForce GTX 1650 Mobile
...
max:
0 Tooltip ThinkBook 15p G2 ITH 21B1000WGE: Ø51.9 (44.447-58.15)
...
AMD Radeon 680M
NVIDIA GeForce GTX 1650 Mobile
...
max:
0 100 200 300 400 500 600 Tooltip ThinkBook 15p G2 ITH 21B1000WGE: Ø95.9 (44.663-684)
AMD Radeon RX Vega 6 (Ryzen 4000/5000)
...
AMD Radeon 680M
NVIDIA GeForce GTX 1650 Mobile
...
max:
0 Tooltip ThinkBook 15p G2 ITH 21B1000WGE: Ø30.5 (22.67-39.1)
AMD Radeon RX Vega 10
AMD Radeon 680M
NVIDIA GeForce GTX 1650 Mobile
...
max:
» With all tested laptops playable in detail settings high.
Additional Benchmarks
Low Preset 1280x720
90.2 [X] Lenovo ThinkBook 15p G2 ITH 21B1000WGE Intel Core i5-11400H 2.7GHz
GeForce GTX 1650 Mobile
min:
40.7 fps, P0.1:
62.5 fps, P1:
73.7 fps, max:
145.3 fps
0 Tooltip ThinkBook 15p G2 ITH 21B1000WGE: Ø51.5 (43.17-61.1)
...
AMD Radeon RX 560X (Laptop)
AMD Radeon 680M
NVIDIA GeForce GTX 1650 Mobile
...
max:
0 Tooltip ThinkBook 15p G2 ITH 21B1000WGE: Ø39.9 (33.102-59.4)
...
AMD Radeon 680M
NVIDIA GeForce GTX 1650 Mobile
...
max:
0 100 200 300 400 500 600 700 800 900 1000 1100 1200 1300 1400 1500 1600 1700 1800 1900 2000 2100 2200 2300 2400 2500 2600 2700 2800 2900 3000 3100 3200 3300 3400 3500 3600 3700 3800 3900 4000 4100 4200 4300 4400 4500 4600 4700 4800 4900 5000 5100 5200 5300 5400 5500 5600 5700 5800 5900 6000 6100 6200 6300 6400 6500 6600 6700 6800 6900 7000 7100 7200 7300 7400 7500 7600 7700 7800 7900 8000 8100 8200 8300 8400 8500 Tooltip ThinkBook 15p G2 ITH 21B1000WGE: Ø313 (30.066-8575)
...
AMD Radeon 680M
NVIDIA GeForce GTX 1650 Mobile
...
max:
0 Tooltip ThinkBook 15p G2 ITH 21B1000WGE: Ø36.8 (29.687-79.9)
...
AMD Radeon 680M
NVIDIA GeForce GTX 1650 Mobile
...
max:
» With all tested laptops playable in detail settings med..
0 100 200 Tooltip ThinkBook 15p G2 ITH 21B1000WGE: Ø35.8 (24.127-223.3)
...
Intel UHD Graphics Xe 32EUs (Tiger Lake-H)
AMD Radeon RX Vega 6 (Ryzen 4000/5000)
AMD Radeon RX Vega 10
AMD Radeon RX 560X (Laptop)
NVIDIA GeForce GTX 1650 Mobile
AMD Radeon 680M
...
max:
0 Tooltip ThinkBook 15p G2 ITH 21B1000WGE: Ø22.3 (18.268-33.8)
AMD Radeon RX 560X (Laptop)
NVIDIA GeForce GTX 1650 Mobile
AMD Radeon 680M
...
max:
0 Tooltip ThinkBook 15p G2 ITH 21B1000WGE: Ø19.8 (13.054-59.9)
AMD Radeon RX 560X (Laptop)
NVIDIA GeForce GTX 1650 Mobile
AMD Radeon 680M
...
max:
0 100 200 300 400 500 600 700 800 900 1000 1100 1200 1300 1400 1500 1600 Tooltip ThinkBook 15p G2 ITH 21B1000WGE: Ø71.6 (10.414-1621)
NVIDIA GeForce GTX 1650 Mobile
AMD Radeon 680M
...
max:
» The benchmarks indicate that the game is not playable in the tested settings.
Additional Benchmarks
Very Low Preset 1280x720
38 [X] Lenovo ThinkBook 15p G2 ITH 21B1000WGE Intel Core i5-11400H 2.7GHz
GeForce GTX 1650 Mobile
min:
22.2 fps, P0.1:
23.5 fps, P1:
27.8 fps, max:
63.1 fps
109.8 [X] Lenovo ThinkBook 15p G2 ITH 21B1000WGE 1070925
Intel Core i5-11400H 2.7GHz
GeForce GTX 1650 Mobile
min:
93 fps, P1:
89 fps, max:
128 fps
fps
+ Compare
- Hide Comparison
Intel UHD Graphics Xe 16EUs (Tiger Lake-H)
...
AMD Radeon 680M
NVIDIA GeForce GTX 1650 Mobile
...
max:
98.4 [X] Lenovo ThinkBook 15p G2 ITH 21B1000WGE 1070925
Intel Core i5-11400H 2.7GHz
GeForce GTX 1650 Mobile
min:
86 fps, P1:
82 fps, max:
114 fps
fps
+ Compare
- Hide Comparison
...
AMD Radeon 680M
NVIDIA GeForce GTX 1650 Mobile
...
max:
65.7 [X] Lenovo ThinkBook 15p G2 ITH 21B1000WGE 1070925
Intel Core i5-11400H 2.7GHz
GeForce GTX 1650 Mobile
min:
44 fps, P1:
55 fps, max:
74 fps
fps
+ Compare
- Hide Comparison
Intel UHD Graphics Xe 16EUs (Tiger Lake-H)
...
AMD Radeon 680M
NVIDIA GeForce GTX 1650 Mobile
...
max:
38.4 [X] Lenovo ThinkBook 15p G2 ITH 21B1000WGE 1070925
Intel Core i5-11400H 2.7GHz
GeForce GTX 1650 Mobile
min:
22 fps, P1:
30 fps, max:
49 fps
fps
+ Compare
- Hide Comparison
...
NVIDIA GeForce GTX 1650 Mobile
...
max:
» With all tested laptops playable in detail settings ultra.
Additional Benchmarks
Ultra Low Preset TAA 1280x720
153.5 [X] Lenovo ThinkBook 15p G2 ITH 21B1000WGE Intel Core i5-11400H 2.7GHz
GeForce GTX 1650 Mobile
min:
126 fps, P1:
112 fps, max:
169 fps
0 100 Tooltip ThinkBook 15p G2 ITH 21B1000WGE: Ø94.5 (79.079-116.5)
...
AMD Radeon 680M
AMD Radeon RX 560X (Laptop)
NVIDIA GeForce GTX 1650 Mobile
...
max:
0 100 200 Tooltip ThinkBook 15p G2 ITH 21B1000WGE: Ø92.3 (67.57-232)
...
AMD Radeon RX 560X (Laptop)
AMD Radeon 680M
NVIDIA GeForce GTX 1650 Mobile
...
max:
0 Tooltip ThinkBook 15p G2 ITH 21B1000WGE: Ø74 (60.663-86.297)
...
AMD Radeon RX 560X (Laptop)
AMD Radeon 680M
NVIDIA GeForce GTX 1650 Mobile
...
max:
0 100 Tooltip ThinkBook 15p G2 ITH 21B1000WGE: Ø65.7 (50.02-147.3)
...
AMD Radeon 660M
AMD Radeon RX 560X (Laptop)
AMD Radeon 680M
NVIDIA GeForce GTX 1650 Mobile
...
max:
» With all tested laptops playable in detail settings ultra.
Additional Benchmarks
Low Preset 1280x720
161.6 [X] Lenovo ThinkBook 15p G2 ITH 21B1000WGE Intel Core i5-11400H 2.7GHz
GeForce GTX 1650 Mobile
min:
70.5 fps, P0.1:
83.4 fps, P1:
108.7 fps, max:
252 fps
0 100 Tooltip ThinkBook 15p G2 ITH 21B1000WGE: Ø32.6 (21.136-105.5)
...
AMD Radeon 660M
AMD Radeon RX 560X (Laptop)
NVIDIA GeForce GTX 1650 Mobile
AMD Radeon 680M
...
max:
0 Tooltip ThinkBook 15p G2 ITH 21B1000WGE: Ø25.6 (16.131-35.9)
AMD Radeon RX 560X (Laptop)
NVIDIA GeForce GTX 1650 Mobile
AMD Radeon 680M
...
max:
0 Tooltip ThinkBook 15p G2 ITH 21B1000WGE: Ø26.7 (14.63-47.6)
AMD Radeon RX 560X (Laptop)
AMD Radeon 680M
NVIDIA GeForce GTX 1650 Mobile
...
max:
0 100 Tooltip ThinkBook 15p G2 ITH 21B1000WGE: Ø26.7 (19.005-148.7)
AMD Radeon 680M
NVIDIA GeForce GTX 1650 Mobile
...
max:
» The benchmarks indicate that the game is not playable in the tested settings.
Additional Benchmarks
Low Preset 1280x720
52.5 [X] Lenovo ThinkBook 15p G2 ITH 21B1000WGE Intel Core i5-11400H 2.7GHz
GeForce GTX 1650 Mobile
min:
9.07 fps, P0.1:
17.2 fps, P1:
35.8 fps, max:
121.4 fps
0 100 200 Tooltip ThinkBook 15p G2 ITH 21B1000WGE: Ø111.7 (79.625-292.7)
...
AMD Radeon 660M
AMD Radeon RX 560X (Laptop)
AMD Radeon 680M
NVIDIA GeForce GTX 1650 Mobile
...
max:
0 100 Tooltip ThinkBook 15p G2 ITH 21B1000WGE: Ø77.8 (62.69-101.2)
AMD Radeon RX Vega 8 (Ryzen 2000/3000)
...
AMD Radeon 660M
AMD Radeon RX 560X (Laptop)
AMD Radeon 680M
NVIDIA GeForce GTX 1650 Mobile
...
max:
0 Tooltip ThinkBook 15p G2 ITH 21B1000WGE: Ø55.7 (45.29-80.7)
...
AMD Radeon 660M
AMD Radeon RX 560X (Laptop)
AMD Radeon 680M
NVIDIA GeForce GTX 1650 Mobile
...
max:
0 Tooltip ThinkBook 15p G2 ITH 21B1000WGE: Ø45.3 (33.89-73.9)
...
AMD Radeon 660M
AMD Radeon RX 560X (Laptop)
AMD Radeon 680M
NVIDIA GeForce GTX 1650 Mobile
...
max:
» With all tested laptops playable in detail settings ultra.
Additional Benchmarks
Low Preset Low TAA 1280x720
130 [X] Lenovo ThinkBook 15p G2 ITH 21B1000WGE Intel Core i5-11400H 2.7GHz
GeForce GTX 1650 Mobile
min:
21.3 fps, P0.1:
62.8 fps, P1:
78.8 fps, max:
180.8 fps
0 100 200 300 400 500 600 700 800 900 Tooltip ThinkBook 15p G2 ITH 21B1000WGE: Ø55.5 (28.029-949)
...
AMD Radeon 660M
AMD Radeon RX 560X (Laptop)
AMD Radeon 680M
NVIDIA GeForce GTX 1650 Mobile
...
max:
0 100 Tooltip ThinkBook 15p G2 ITH 21B1000WGE: Ø30.4 (23.026-137.2)
AMD Radeon 660M
AMD Radeon RX 560X (Laptop)
AMD Radeon 680M
NVIDIA GeForce GTX 1650 Mobile
...
max:
0 100 200 300 400 500 600 700 800 900 1000 1100 1200 1300 Tooltip ThinkBook 15p G2 ITH 21B1000WGE: Ø47.3 (13.141-1315)
AMD Radeon RX 560X (Laptop)
AMD Radeon 680M
NVIDIA GeForce GTX 1650 Mobile
...
max:
» The benchmarks indicate that the game is not playable in the tested settings.
Additional Benchmarks
Low Preset 1280x720
50.4 [X] Lenovo ThinkBook 15p G2 ITH 21B1000WGE Intel Core i5-11400H 2.7GHz
GeForce GTX 1650 Mobile
min:
22.8 fps, P0.1:
34.3 fps, P1:
38.4 fps, max:
109.9 fps
0 Tooltip ThinkBook 15p G2 ITH 21B1000WGE: Ø47.7 (38.167-66.83)
...
AMD Radeon RX 560X (Laptop)
AMD Radeon 680M
NVIDIA GeForce GTX 1650 Mobile
...
max:
0 Tooltip ThinkBook 15p G2 ITH 21B1000WGE: Ø34 (29.345-44.8)
...
AMD Radeon RX 560X (Laptop)
AMD Radeon 680M
NVIDIA GeForce GTX 1650 Mobile
...
max:
0 100 Tooltip ThinkBook 15p G2 ITH 21B1000WGE: Ø40 (26.705-148.9)
...
AMD Radeon RX 560X (Laptop)
AMD Radeon 680M
NVIDIA GeForce GTX 1650 Mobile
...
max:
0 Tooltip ThinkBook 15p G2 ITH 21B1000WGE: Ø17.2 (11.036-42.8)
AMD Radeon RX 560X (Laptop)
AMD Radeon 680M
NVIDIA GeForce GTX 1650 Mobile
...
max:
» With all tested laptops playable in detail settings low.
Additional Benchmarks
Prioritize Performance Preset 1280x720
67.2 [X] Lenovo ThinkBook 15p G2 ITH 21B1000WGE Intel Core i5-11400H 2.7GHz
GeForce GTX 1650 Mobile
min:
2.94 fps, P0.1:
7.32 fps, P1:
51.6 fps, max:
99.6 fps
...
AMD Radeon 680M
NVIDIA GeForce GTX 1650 Mobile
...
max:
AMD Radeon RX Vega 8 (Ryzen 2000/3000)
...
AMD Radeon 680M
NVIDIA GeForce GTX 1650 Mobile
...
max:
AMD Radeon RX Vega 6 (Ryzen 4000/5000)
...
NVIDIA GeForce GTX 1650 Mobile
...
max:
AMD Radeon RX Vega 6 (Ryzen 4000/5000)
...
AMD Radeon RX 560X (Laptop)
NVIDIA GeForce GTX 1650 Mobile
...
max:
» With all tested laptops playable in detail settings ultra.
Additional Benchmarks
Minimum Settings 1280x720
115.6 [X] Lenovo ThinkBook 15p G2 ITH 21B1000WGE Intel Core i5-11400H 2.7GHz
GeForce GTX 1650 Mobile
P0.1:
38.3 fpsP1:
60.3 fps
0 Tooltip ThinkBook 15p G2 ITH 21B1000WGE: Ø55.1 (39.295-81.3)
...
AMD Radeon 680M
AMD Radeon RX 560X (Laptop)
NVIDIA GeForce GTX 1650 Mobile
...
max:
0 100 200 300 Tooltip ThinkBook 15p G2 ITH 21B1000WGE: Ø44.5 (24.776-377)
...
AMD Radeon RX 560X (Laptop)
AMD Radeon 680M
NVIDIA GeForce GTX 1650 Mobile
...
max:
0 Tooltip ThinkBook 15p G2 ITH 21B1000WGE: Ø35.6 (22.035-69.6)
...
AMD Radeon RX 560X (Laptop)
AMD Radeon 680M
NVIDIA GeForce GTX 1650 Mobile
...
max:
0 Tooltip ThinkBook 15p G2 ITH 21B1000WGE: Ø32.4 (24.23-45.31)
...
AMD Radeon 660M
AMD Radeon RX 560X (Laptop)
AMD Radeon 680M
NVIDIA GeForce GTX 1650 Mobile
...
max:
» With all tested laptops playable in detail settings low.
Additional Benchmarks
Ultra Low Preset 1280x720
77.5 [X] Lenovo ThinkBook 15p G2 ITH 21B1000WGE Intel Core i5-11400H 2.7GHz
GeForce GTX 1650 Mobile
min:
37.4 fps, P0.1:
44.9 fps, P1:
57 fps, max:
110.5 fps
0 100 200 Tooltip ThinkBook 15p G2 ITH 21B1000WGE: Ø76.2 (62.783-206.1)
Intel UHD Graphics Xe 16EUs (Tiger Lake-H)
...
AMD Radeon RX 560X (Laptop)
AMD Radeon 680M
NVIDIA GeForce GTX 1650 Mobile
...
max:
0 Tooltip ThinkBook 15p G2 ITH 21B1000WGE: Ø52.4 (45.133-68.4)
...
AMD Radeon RX 560X (Laptop)
AMD Radeon 680M
NVIDIA GeForce GTX 1650 Mobile
...
max:
0 Tooltip ThinkBook 15p G2 ITH 21B1000WGE: Ø31.9 (27.085-41)
...
AMD Radeon RX 560X (Laptop)
AMD Radeon 680M
NVIDIA GeForce GTX 1650 Mobile
...
max:
0 100 Tooltip ThinkBook 15p G2 ITH 21B1000WGE: Ø28.6 (21.009-195.5)
...
AMD Radeon 660M
AMD Radeon RX 560X (Laptop)
AMD Radeon 680M
NVIDIA GeForce GTX 1650 Mobile
...
max:
» With all tested laptops playable in detail settings med..
Additional Benchmarks
Low Preset 1280x720
111.7 [X] Lenovo ThinkBook 15p G2 ITH 21B1000WGE Intel Core i5-11400H 2.7GHz
GeForce GTX 1650 Mobile
min:
36.1 fps, P0.1:
78 fps, P1:
90.3 fps, max:
166.8 fps
...
AMD Radeon RX 560X (Laptop)
NVIDIA GeForce GTX 1650 Mobile
...
max:
...
AMD Radeon RX 560X (Laptop)
NVIDIA GeForce GTX 1650 Mobile
...
max:
...
AMD Radeon 680M
AMD Radeon RX 560X (Laptop)
NVIDIA GeForce GTX 1650 Mobile
...
max:
AMD Radeon 680M
AMD Radeon RX 560X (Laptop)
NVIDIA GeForce GTX 1650 Mobile
...
max:
» With all tested laptops playable in detail settings med..
Additional Benchmarks
Low Preset 1280x720
51 [X] Lenovo ThinkBook 15p G2 ITH 21B1000WGE Intel Core i5-11400H 2.7GHz
GeForce GTX 1650 Mobile
min:
28 fps, max:
87 fps
0 100 200 300 400 500 600 700 800 900 1000 1100 1200 1300 1400 1500 1600 1700 1800 Tooltip ThinkBook 15p G2 ITH 21B1000WGE: Ø128.8 (47.189-1880)
Intel UHD Graphics G1 (Ice Lake 32 EU)
...
AMD Radeon RX 560X (Laptop)
AMD Radeon 680M
NVIDIA GeForce GTX 1650 Mobile
...
max:
0 Tooltip ThinkBook 15p G2 ITH 21B1000WGE: Ø40.2 (34.133-68)
...
AMD Radeon RX 560X (Laptop)
NVIDIA GeForce GTX 1650 Mobile
...
max:
0 Tooltip ThinkBook 15p G2 ITH 21B1000WGE: Ø31.2 (25.982-42.8)
...
AMD Radeon RX 560X (Laptop)
AMD Radeon 680M
NVIDIA GeForce GTX 1650 Mobile
...
max:
0 Tooltip ThinkBook 15p G2 ITH 21B1000WGE: Ø21 (14.095-33.4)
...
AMD Radeon RX 560X (Laptop)
AMD Radeon 680M
NVIDIA GeForce GTX 1650 Mobile
...
max:
» With all tested laptops playable in detail settings med..
Additional Benchmarks
Low Preset Low TAA 1280x720
79.9 [X] Lenovo ThinkBook 15p G2 ITH 21B1000WGE Intel Core i5-11400H 2.7GHz
GeForce GTX 1650 Mobile
min:
15.4 fps, P0.1:
34.2 fps, P1:
50.3 fps, max:
103.3 fps
0 Tooltip ThinkBook 15p G2 ITH 21B1000WGE: Ø32.3 (26.046-39.306)
Intel UHD Graphics Xe 16EUs (Tiger Lake-H)
...
AMD Radeon RX 560X (Laptop)
NVIDIA GeForce GTX 1650 Mobile
...
max:
0 Tooltip ThinkBook 15p G2 ITH 21B1000WGE: Ø28.8 (22.469-42.6)
...
AMD Radeon RX 560X (Laptop)
NVIDIA GeForce GTX 1650 Mobile
...
max:
0 Tooltip ThinkBook 15p G2 ITH 21B1000WGE: Ø26 (20.094-58.2)
AMD Radeon RX 560X (Laptop)
NVIDIA GeForce GTX 1650 Mobile
...
max:
0 Tooltip ThinkBook 15p G2 ITH 21B1000WGE: Ø17.4 (14.016-30.2)
NVIDIA GeForce GTX 1650 Mobile
...
max:
» The benchmarks indicate that the game is not playable in the tested settings.
Additional Benchmarks
Low Preset TAA 1280x720
51.7 [X] Lenovo ThinkBook 15p G2 ITH 21B1000WGE Intel Core i5-11400H 2.7GHz
GeForce GTX 1650 Mobile
min:
17.3 fps, P0.1:
31.8 fps, P1:
34.9 fps, max:
145.7 fps
0 100 Tooltip ThinkBook 15p G2 ITH 21B1000WGE: Ø85.4 (72.524-193.6)
...
AMD Radeon 660M
AMD Radeon 680M
AMD Radeon RX 560X (Laptop)
NVIDIA GeForce GTX 1650 Mobile
...
max:
0 100 200 300 400 500 600 700 800 900 1000 Tooltip ThinkBook 15p G2 ITH 21B1000WGE: Ø84.8 (53.125-1041)
...
AMD Radeon 660M
AMD Radeon RX 560X (Laptop)
AMD Radeon 680M
NVIDIA GeForce GTX 1650 Mobile
...
max:
19.6 [X] Lenovo ThinkBook 15p G2 ITH 21B1000WGE Intel Core i5-11400H 2.7GHz
GeForce GTX 1650 Mobile
min:
12.5 fps, P0.1:
15.7 fps, P1:
16.8 fps, max:
54.3 fps
22.9 [X] Lenovo ThinkBook 15p G2 ITH 21B1000WGE Intel Core i5-11400H 2.7GHz
GeForce GTX 1650 Mobile
min:
10.9 fps, P0.1:
17.8 fps, P1:
20 fps, max:
81.8 fps
~ 21 fps
+ Compare
- Hide Comparison
+ 📈 Graph
- 📈 Hide Graph
0 100 Tooltip ThinkBook 15p G2 ITH 21B1000WGE: Ø22.2 (17.346-50.1)
ThinkBook 15p G2 ITH 21B1000WGE: Ø29.7 (20.096-167)
AMD Radeon RX Vega 6 (Ryzen 4000/5000)
...
AMD Radeon 660M
AMD Radeon RX Vega 7
NVIDIA GeForce GTX 1650 Mobile
AMD Radeon RX 560X (Laptop)
AMD Radeon 680M
...
max:
» With all tested laptops playable in detail settings med..
Additional Benchmarks
Low Preset / Off 1280x720
124.4 [X] Lenovo ThinkBook 15p G2 ITH 21B1000WGE Intel Core i5-11400H 2.7GHz
GeForce GTX 1650 Mobile
min:
9.3 fps, P0.1:
46.8 fps, P1:
82.6 fps, max:
206 fps
0 100 Tooltip ThinkBook 15p G2 ITH 21B1000WGE: Ø116.5 (75.153-176.8)
Intel UHD Graphics Xe 16EUs (Tiger Lake-H)
...
NVIDIA GeForce GTX 1650 Mobile
...
max:
0 Tooltip ThinkBook 15p G2 ITH 21B1000WGE: Ø62 (43.426-76.38)
...
AMD Radeon RX 560X (Laptop)
AMD Radeon 680M
NVIDIA GeForce GTX 1650 Mobile
...
max:
0 100 Tooltip ThinkBook 15p G2 ITH 21B1000WGE: Ø55.9 (34.02-138.7)
...
AMD Radeon RX 560X (Laptop)
AMD Radeon 680M
NVIDIA GeForce GTX 1650 Mobile
...
max:
0 Tooltip ThinkBook 15p G2 ITH 21B1000WGE: Ø43.2 (32.22-78.5)
...
AMD Radeon RX 560X (Laptop)
AMD Radeon 680M
NVIDIA GeForce GTX 1650 Mobile
...
max:
» With all tested laptops playable in detail settings ultra.
Additional Benchmarks
Low Preset 1280x720
156.3 [X] Lenovo ThinkBook 15p G2 ITH 21B1000WGE Intel Core i5-11400H 2.7GHz
GeForce GTX 1650 Mobile
min:
11.1 fps, P0.1:
54.3 fps, P1:
95.1 fps, max:
247 fps
...
AMD Radeon 660M
AMD Radeon 680M
AMD Radeon RX 560X (Laptop)
NVIDIA GeForce GTX 1650 Mobile
...
max:
...
AMD Radeon 660M
AMD Radeon 680M
AMD Radeon RX 560X (Laptop)
NVIDIA GeForce GTX 1650 Mobile
...
max:
...
AMD Radeon RX 560X (Laptop)
NVIDIA GeForce GTX 1650 Mobile
...
max:
...
AMD Radeon 680M
AMD Radeon RX 560X (Laptop)
NVIDIA GeForce GTX 1650 Mobile
...
max:
» With all tested laptops playable in detail settings ultra.
Additional Benchmarks
Low Preset (without FSR Upscaling) 1280x720
74.8 [X] Lenovo ThinkBook 15p G2 ITH 21B1000WGE Intel Core i5-11400H 2.7GHz
GeForce GTX 1650 Mobile
0 Tooltip ThinkBook 15p G2 ITH 21B1000WGE: Ø63.2 (52.381-81.6)
...
AMD Radeon 660M
AMD Radeon RX 560X (Laptop)
AMD Radeon 680M
NVIDIA GeForce GTX 1650 Mobile
...
max:
0 100 200 Tooltip ThinkBook 15p G2 ITH 21B1000WGE: Ø64.7 (46.741-280)
...
AMD Radeon 660M
AMD Radeon RX 560X (Laptop)
AMD Radeon 680M
NVIDIA GeForce GTX 1650 Mobile
...
max:
0 Tooltip ThinkBook 15p G2 ITH 21B1000WGE: Ø35.9 (25.218-54.3)
...
AMD Radeon 660M
AMD Radeon RX 560X (Laptop)
AMD Radeon 680M
NVIDIA GeForce GTX 1650 Mobile
...
max:
0 Tooltip ThinkBook 15p G2 ITH 21B1000WGE: Ø24.5 (11.864-44.7)
...
AMD Radeon RX Vega 7
AMD Radeon RX 560X (Laptop)
AMD Radeon 660M
NVIDIA GeForce GTX 1650 Mobile
AMD Radeon 680M
...
max:
» With all tested laptops playable in detail settings med..
Additional Benchmarks
Low Preset 1280x720
94.1 [X] Lenovo ThinkBook 15p G2 ITH 21B1000WGE Intel Core i5-11400H 2.7GHz
GeForce GTX 1650 Mobile
min:
37 fps, P0.1:
53.5 fps, P1:
65.2 fps, max:
235 fps
0 100 200 Tooltip ThinkBook 15p G2 ITH 21B1000WGE: Ø67.6 (53.281-213.8)
Intel UHD Graphics Xe 16EUs (Tiger Lake-H)
...
AMD Radeon RX 560X (Laptop)
AMD Radeon 680M
NVIDIA GeForce GTX 1650 Mobile
...
max:
0 Tooltip ThinkBook 15p G2 ITH 21B1000WGE: Ø43.5 (34.788-66.8)
...
AMD Radeon 660M
AMD Radeon RX 560X (Laptop)
AMD Radeon 680M
NVIDIA GeForce GTX 1650 Mobile
...
max:
0 Tooltip ThinkBook 15p G2 ITH 21B1000WGE: Ø36.5 (30.055-53.6)
...
AMD Radeon 660M
AMD Radeon RX 560X (Laptop)
AMD Radeon 680M
NVIDIA GeForce GTX 1650 Mobile
...
max:
0 100 Tooltip ThinkBook 15p G2 ITH 21B1000WGE: Ø36.2 (26.023-117.3)
...
AMD Radeon RX Vega 7
AMD Radeon RX 560X (Laptop)
AMD Radeon 680M
NVIDIA GeForce GTX 1650 Mobile
...
max:
» With all tested laptops playable in detail settings med..
Additional Benchmarks
Very Low Preset 1280x720
88.2 [X] Lenovo ThinkBook 15p G2 ITH 21B1000WGE Intel Core i5-11400H 2.7GHz
GeForce GTX 1650 Mobile
min:
39.8 fps, P0.1:
49.9 fps, P1:
65.8 fps, max:
133.2 fps
0 100 Tooltip ThinkBook 15p G2 ITH 21B1000WGE: Ø45.4 (37.094-101.5)
...
AMD Radeon 660M
AMD Radeon RX 560X (Laptop)
AMD Radeon 680M
NVIDIA GeForce GTX 1650 Mobile
...
max:
0 100 200 300 400 500 600 700 800 900 1000 1100 1200 1300 1400 Tooltip ThinkBook 15p G2 ITH 21B1000WGE: Ø124.7 (28.011-1471)
AMD Radeon RX Vega 8 (Ryzen 2000/3000)
...
AMD Radeon RX Vega 7
AMD Radeon 660M
AMD Radeon RX 560X (Laptop)
AMD Radeon 680M
NVIDIA GeForce GTX 1650 Mobile
...
max:
0 Tooltip ThinkBook 15p G2 ITH 21B1000WGE: Ø18.9 (16.223-23.74)
AMD Radeon 660M
AMD Radeon RX Vega 7
AMD Radeon RX 560X (Laptop)
NVIDIA GeForce GTX 1650 Mobile
AMD Radeon 680M
...
max:
0 Tooltip ThinkBook 15p G2 ITH 21B1000WGE: Ø18.7 (15.033-31.7)
AMD Radeon RX Vega 7
AMD Radeon RX 560X (Laptop)
NVIDIA GeForce GTX 1650 Mobile
AMD Radeon 680M
...
max:
» With all tested laptops playable in detail settings low.
Additional Benchmarks
Low Preset 1280x720
55.5 [X] Lenovo ThinkBook 15p G2 ITH 21B1000WGE Intel Core i5-11400H 2.7GHz
GeForce GTX 1650 Mobile
min:
47.8 fps, P0.1:
48.1 fps, P1:
49.2 fps, max:
64.4 fps
0 Tooltip ThinkBook 15p G2 ITH 21B1000WGE: Ø42.7 (33.301-80.9)
Intel UHD Graphics Xe 16EUs (Tiger Lake-H)
...
AMD Radeon 680M
AMD Radeon RX 560X (Laptop)
NVIDIA GeForce GTX 1650 Mobile
...
max:
0 Tooltip ThinkBook 15p G2 ITH 21B1000WGE: Ø34 (27.031-79.6)
...
AMD Radeon 680M
AMD Radeon RX 560X (Laptop)
NVIDIA GeForce GTX 1650 Mobile
...
max:
0 Tooltip ThinkBook 15p G2 ITH 21B1000WGE: Ø28.6 (23.041-58)
...
AMD Radeon 680M
AMD Radeon RX 560X (Laptop)
NVIDIA GeForce GTX 1650 Mobile
...
max:
0 Tooltip ThinkBook 15p G2 ITH 21B1000WGE: Ø25.6 (19.018-69.6)
AMD Radeon RX 560X (Laptop)
AMD Radeon 680M
NVIDIA GeForce GTX 1650 Mobile
...
max:
» With all tested laptops playable in detail settings low.
Additional Benchmarks
Low Preset 1280x720
54.4 [X] Lenovo ThinkBook 15p G2 ITH 21B1000WGE Intel Core i5-11400H 2.7GHz
GeForce GTX 1650 Mobile
min:
20.8 fps, P0.1:
31.3 fps, P1:
43.4 fps, max:
94.1 fps
0 Tooltip ThinkBook 15p G2 ITH 21B1000WGE: Ø60.6 (51.239-88.1)
Intel UHD Graphics Xe 16EUs (Tiger Lake-H)
...
AMD Radeon 660M
AMD Radeon RX 560X (Laptop)
AMD Radeon 680M
NVIDIA GeForce GTX 1050 Ti Mobile
NVIDIA GeForce GTX 1650 Mobile
...
max:
0 100 Tooltip ThinkBook 15p G2 ITH 21B1000WGE: Ø47.2 (34.045-152.9)
Intel UHD Graphics Xe G4 48EUs
...
AMD Radeon 660M
AMD Radeon RX 560X (Laptop)
AMD Radeon 680M
NVIDIA GeForce GTX 1050 Ti Mobile
NVIDIA GeForce GTX 1650 Mobile
...
max:
0 Tooltip ThinkBook 15p G2 ITH 21B1000WGE: Ø37.1 (28.023-67.9)
...
AMD Radeon 660M
AMD Radeon RX 560X (Laptop)
AMD Radeon 680M
NVIDIA GeForce GTX 1050 Ti Mobile
NVIDIA GeForce GTX 1650 Mobile
...
max:
0 100 200 300 400 500 600 700 Tooltip ThinkBook 15p G2 ITH 21B1000WGE: Ø46.3 (21.194-799)
...
AMD Radeon 680M
AMD Radeon RX 560X (Laptop)
NVIDIA GeForce GTX 1050 Ti Mobile
NVIDIA GeForce GTX 1650 Mobile
...
max:
» With all tested laptops playable in detail settings med..
Additional Benchmarks
Low Preset 1280x720
83.5 [X] Lenovo ThinkBook 15p G2 ITH 21B1000WGE Intel Core i5-11400H 2.7GHz
GeForce GTX 1650 Mobile
min:
12.5 fps, P0.1:
33.6 fps, P1:
66.9 fps, max:
149 fps
116 [X] Lenovo ThinkBook 15p G2 ITH 21B1000WGE 959964
Intel Core i5-11400H 2.7GHz
GeForce GTX 1650 Mobile
min:
94 fps, P1:
84 fps, max:
134 fps
fps
+ Compare
- Hide Comparison
Intel UHD Graphics Xe 16EUs (Tiger Lake-H)
...
AMD Radeon 680M
NVIDIA GeForce GTX 1050 Ti Mobile
NVIDIA GeForce GTX 1650 Mobile
...
max:
105.2 [X] Lenovo ThinkBook 15p G2 ITH 21B1000WGE 959964
Intel Core i5-11400H 2.7GHz
GeForce GTX 1650 Mobile
min:
88 fps, P1:
78 fps, max:
124 fps
fps
+ Compare
- Hide Comparison
Intel UHD Graphics Xe 16EUs (Tiger Lake-H)
...
AMD Radeon 680M
NVIDIA GeForce GTX 1050 Ti Mobile
NVIDIA GeForce GTX 1650 Mobile
...
max:
74.2 [X] Lenovo ThinkBook 15p G2 ITH 21B1000WGE 959964
Intel Core i5-11400H 2.7GHz
GeForce GTX 1650 Mobile
min:
63 fps, P1:
61 fps, max:
85 fps
fps
+ Compare
- Hide Comparison
Intel UHD Graphics Xe 16EUs (Tiger Lake-H)
...
AMD Radeon 680M
NVIDIA GeForce GTX 1050 Ti Mobile
NVIDIA GeForce GTX 1650 Mobile
...
max:
53.2 [X] Lenovo ThinkBook 15p G2 ITH 21B1000WGE 959964
Intel Core i5-11400H 2.7GHz
GeForce GTX 1650 Mobile
min:
44 fps, P1:
43 fps, max:
63 fps
fps
+ Compare
- Hide Comparison
...
NVIDIA GeForce GTX 1650 Mobile
...
max:
» With all tested laptops playable in detail settings ultra.
Additional Benchmarks
Ultra Low Preset 16xAF TAA 1280x720
187.8 [X] Lenovo ThinkBook 15p G2 ITH 21B1000WGE Intel Core i5-11400H 2.7GHz
GeForce GTX 1650 Mobile
min:
143 fps, P1:
119 fps, max:
206 fps
0 100 Tooltip ThinkBook 15p G2 ITH 21B1000WGE: Ø126.9 (97.452-166.1)
...
AMD Radeon 680M
NVIDIA GeForce GTX 1050 Ti Mobile
NVIDIA GeForce GTX 1650 Mobile
max:
0 100 Tooltip ThinkBook 15p G2 ITH 21B1000WGE: Ø92.2 (75.33-108.457)
...
AMD Radeon 680M
NVIDIA GeForce GTX 1050 Ti Mobile
NVIDIA GeForce GTX 1650 Mobile
...
max:
0 100 Tooltip ThinkBook 15p G2 ITH 21B1000WGE: Ø79.8 (65.034-108.6)
...
AMD Radeon 680M
NVIDIA GeForce GTX 1050 Ti Mobile
NVIDIA GeForce GTX 1650 Mobile
...
max:
0 100 Tooltip ThinkBook 15p G2 ITH 21B1000WGE: Ø77.4 (60.558-132.4)
Intel UHD Graphics Xe G4 48EUs
...
AMD Radeon RX 560X (Laptop)
NVIDIA GeForce GTX 1050 Ti Mobile
NVIDIA GeForce GTX 1650 Mobile
...
max:
» With all tested laptops playable in detail settings ultra.
Additional Benchmarks
Low Preset 1280x720
128.2 [X] Lenovo ThinkBook 15p G2 ITH 21B1000WGE Intel Core i5-11400H 2.7GHz
GeForce GTX 1650 Mobile
min:
13.4 fps, P0.1:
52.8 fps, P1:
89.9 fps, max:
248 fps
0 100 Tooltip ThinkBook 15p G2 ITH 21B1000WGE: Ø69.3 (56.532-110.5)
...
NVIDIA GeForce GTX 1050 Ti Mobile
AMD Radeon RX 560X (Laptop)
AMD Radeon 680M
NVIDIA GeForce GTX 1650 Mobile
...
max:
0 100 200 Tooltip ThinkBook 15p G2 ITH 21B1000WGE: Ø64.4 (51.019-254.4)
...
AMD Radeon RX 560X (Laptop)
AMD Radeon 680M
NVIDIA GeForce GTX 1050 Ti Mobile
NVIDIA GeForce GTX 1650 Mobile
...
max:
0 100 200 300 400 500 600 700 800 900 1000 1100 1200 1300 1400 1500 1600 1700 1800 1900 2000 2100 2200 2300 2400 2500 2600 2700 2800 2900 3000 3100 3200 3300 3400 3500 3600 3700 3800 3900 4000 4100 4200 4300 4400 4500 4600 4700 4800 4900 5000 5100 5200 5300 5400 5500 5600 5700 5800 5900 6000 6100 6200 6300 6400 6500 6600 6700 6800 6900 7000 7100 7200 7300 7400 7500 7600 7700 7800 7900 8000 8100 8200 8300 8400 8500 8600 8700 8800 8900 9000 9100 9200 9300 9400 9500 9600 9700 9800 9900 Tooltip ThinkBook 15p G2 ITH 21B1000WGE: Ø951 (48.389-36726)
...
AMD Radeon 680M
NVIDIA GeForce GTX 1050 Ti Mobile
NVIDIA GeForce GTX 1650 Mobile
...
max:
0 100 Tooltip ThinkBook 15p G2 ITH 21B1000WGE: Ø54.6 (43.015-104.3)
...
AMD Radeon RX 560X (Laptop)
NVIDIA GeForce GTX 1050 Ti Mobile
NVIDIA GeForce GTX 1650 Mobile
...
max:
» With all tested laptops playable in detail settings ultra.
...
NVIDIA GeForce GTX 1050 Ti Mobile
AMD Radeon 680M
AMD Radeon RX Vega M GH
NVIDIA GeForce GTX 1650 Mobile
...
max:
AMD Radeon RX Vega 8 (Ryzen 2000/3000)
...
NVIDIA GeForce GTX 1050 Ti Mobile
AMD Radeon 680M
AMD Radeon RX Vega M GH
NVIDIA GeForce GTX 1650 Mobile
...
max:
...
NVIDIA GeForce GTX 1050 Ti Mobile
AMD Radeon 680M
AMD Radeon RX Vega M GH
NVIDIA GeForce GTX 1650 Mobile
...
max:
AMD Radeon RX Vega 8 (Ryzen 2000/3000)
...
AMD Radeon RX Vega M GH
NVIDIA GeForce GTX 1650 Mobile
...
max:
AMD Radeon 680M
NVIDIA GeForce GTX 1650 Mobile
...
max:
NVIDIA GeForce GTX 1650 Mobile
...
max:
» With all tested laptops playable in detail settings med..
Additional Benchmarks
Low Preset 1280x720
80.4 [X] MSI GL75 Intel Core i7-10750H 2.6GHz
GeForce GTX 1650 Mobile
min:
25 fps
...
AMD Radeon 660M
NVIDIA GeForce GTX 1050 Ti Mobile
AMD Radeon RX 560X (Laptop)
AMD Radeon 680M
NVIDIA GeForce GTX 1650 Mobile
...
...
AMD Radeon 660M
NVIDIA GeForce GTX 1050 Ti Mobile
AMD Radeon RX 560X (Laptop)
AMD Radeon 680M
NVIDIA GeForce GTX 1650 Mobile
...
...
AMD Radeon 660M
NVIDIA GeForce GTX 1050 Ti Mobile
AMD Radeon RX 560X (Laptop)
AMD Radeon 680M
NVIDIA GeForce GTX 1650 Mobile
...
...
NVIDIA GeForce GTX 1050 Ti Mobile
AMD Radeon 680M
NVIDIA GeForce GTX 1650 Mobile
...
» With all tested laptops playable in detail settings high.
Additional Benchmarks
Low / Off 1280x720
59.9 [X] MSI GL75 Intel Core i7-10750H 2.6GHz
GeForce GTX 1650 Mobile
min:
26.2 fps, P0.1:
26.5 fps, P1:
28.5 fps, max:
109 fps
...
NVIDIA GeForce GTX 1650 Mobile
...
max:
...
NVIDIA GeForce GTX 1650 Mobile
...
max:
Intel UHD Graphics 24EUs (Alder Lake-N)
...
NVIDIA GeForce GTX 1650 Mobile
...
max:
AMD Radeon RX Vega 6 (Ryzen 4000/5000)
...
AMD Radeon 680M
AMD Radeon RX 560X (Laptop)
NVIDIA GeForce GTX 1650 Mobile
...
max:
» With all tested laptops playable in detail settings ultra.
Additional Benchmarks
Low Preset 1280x720
150 [X] MSI GL75 Intel Core i7-10750H 2.6GHz
GeForce GTX 1650 Mobile
min:
117 fps
...
AMD Radeon RX 560X (Laptop)
AMD Radeon 660M
AMD Radeon 680M
NVIDIA GeForce GTX 1650 Mobile
max:
...
NVIDIA GeForce GTX 1050 Ti Mobile
AMD Radeon RX 560X (Laptop)
AMD Radeon 680M
NVIDIA GeForce GTX 1650 Mobile
...
max:
...
AMD Radeon 660M
AMD Radeon RX 560X (Laptop)
AMD Radeon 680M
NVIDIA GeForce GTX 1650 Mobile
...
max:
Intel UHD Graphics Xe G4 48EUs
...
AMD Radeon RX 560X (Laptop)
AMD Radeon 680M
NVIDIA GeForce GTX 1650 Mobile
...
max:
NVIDIA GeForce GTX 1650 Mobile
...
max:
NVIDIA GeForce GTX 1650 Mobile
...
max:
» With all tested laptops playable in detail settings ultra.
...
AMD Radeon RX 560X (Laptop)
NVIDIA GeForce GTX 1050 Ti Mobile
AMD Radeon 680M
NVIDIA GeForce GTX 1650 Mobile
...
max:
...
AMD Radeon RX 560X (Laptop)
NVIDIA GeForce GTX 1050 Ti Mobile
AMD Radeon 680M
NVIDIA GeForce GTX 1650 Mobile
...
max:
...
AMD Radeon RX 560X (Laptop)
NVIDIA GeForce GTX 1050 Ti Mobile
AMD Radeon 680M
NVIDIA GeForce GTX 1650 Mobile
...
max:
» With all tested laptops playable in detail settings low.
Additional Benchmarks
Low Quality 1280x720
58.7 [X] MSI GL75 Intel Core i7-10750H 2.6GHz
GeForce GTX 1650 Mobile
min:
46.3 fps, P0.1:
46.8 fps, P1:
48.4 fps, max:
73.1 fps
...
AMD Radeon 660M
AMD Radeon RX 560X (Laptop)
NVIDIA GeForce GTX 1050 Ti Mobile
NVIDIA GeForce GTX 1650 Mobile
AMD Radeon 680M
...
max:
...
AMD Radeon RX 560X (Laptop)
AMD Radeon 660M
NVIDIA GeForce GTX 1050 Ti Mobile
NVIDIA GeForce GTX 1650 Mobile
...
max:
...
AMD Radeon 660M
NVIDIA GeForce GTX 1050 Ti Mobile
NVIDIA GeForce GTX 1650 Mobile
AMD Radeon 680M
...
max:
...
AMD Radeon RX 560X (Laptop)
NVIDIA GeForce GTX 1050 Ti Mobile
NVIDIA GeForce GTX 1650 Mobile
AMD Radeon 680M
...
max:
» With all tested laptops playable in detail settings ultra.
Additional Benchmarks
Ultra Low Preset (with Fixed Resolution Quality) 1280x720
154 [X] MSI GL75 Intel Core i7-10750H 2.6GHz
GeForce GTX 1650 Mobile
min:
114 fps
Intel UHD Graphics G1 (Ice Lake 32 EU)
...
AMD Radeon RX 560X (Laptop)
AMD Radeon 680M
NVIDIA GeForce GTX 1050 Ti Mobile
NVIDIA GeForce GTX 1650 Mobile
...
max:
...
AMD Radeon 680M
AMD Radeon RX 560X (Laptop)
NVIDIA GeForce GTX 1050 Ti Mobile
NVIDIA GeForce GTX 1650 Mobile
...
max:
...
AMD Radeon 680M
AMD Radeon RX 560X (Laptop)
NVIDIA GeForce GTX 1650 Mobile
...
max:
...
AMD Radeon 660M
AMD Radeon 680M
NVIDIA GeForce GTX 1650 Mobile
...
max:
» With most tested laptops playable in detail settings med..
Additional Benchmarks
Low Preset 1280x720
80.7 [X] MSI GL75 Intel Core i7-10750H 2.6GHz
GeForce GTX 1650 Mobile
min:
53.6 fps, P0.1:
54.1 fps, P1:
68.4 fps, max:
119 fps
AMD Radeon RX Vega 7
AMD Radeon 660M
AMD Radeon 680M
NVIDIA GeForce GTX 1650 Mobile
...
AMD Radeon 660M
AMD Radeon RX 560X (Laptop)
AMD Radeon 680M
NVIDIA GeForce GTX 1650 Mobile
NVIDIA GeForce GTX 1050 Ti Mobile
...
AMD Radeon RX 560X (Laptop)
AMD Radeon 660M
AMD Radeon 680M
NVIDIA GeForce GTX 1650 Mobile
...
AMD Radeon RX 560X (Laptop)
AMD Radeon 680M
NVIDIA GeForce GTX 1650 Mobile
NVIDIA GeForce GTX 1050 Ti Mobile
...
» With all tested laptops playable in detail settings ultra.
Additional Benchmarks
Low Preset 1920x1080
64.5 [X] MSI GL75 Intel Core i7-10750H 2.6GHz
GeForce GTX 1650 Mobile
min:
40.2 fps, P0.1:
41.8 fps, P1:
49.9 fps, max:
134 fps
...
NVIDIA GeForce GTX 1050 Ti Mobile
AMD Radeon 680M
NVIDIA GeForce GTX 1650 Mobile
max:
...
NVIDIA GeForce GTX 1050 Ti Mobile
NVIDIA GeForce GTX 1650 Mobile
...
max:
...
AMD Radeon 680M
NVIDIA GeForce GTX 1650 Mobile
...
max:
AMD Radeon RX Vega 6 (Ryzen 4000/5000)
...
AMD Radeon RX 560X (Laptop)
AMD Radeon 680M
NVIDIA GeForce GTX 1650 Mobile
...
max:
NVIDIA GeForce GTX 1650 Mobile
...
max:
NVIDIA GeForce GTX 1650 Mobile
...
max:
» With all tested laptops playable in detail settings ultra.
...
Intel UHD Graphics Xe 32EUs (Tiger Lake-H)
AMD Radeon RX 560X (Laptop)
NVIDIA GeForce GTX 1050 Ti Mobile
AMD Radeon 680M
NVIDIA GeForce GTX 1650 Mobile
max:
Intel UHD Graphics Xe 32EUs (Tiger Lake-H)
NVIDIA GeForce GTX 1050 Ti Mobile
AMD Radeon RX 560X (Laptop)
AMD Radeon 680M
NVIDIA GeForce GTX 1650 Mobile
...
max:
0 100 200 300 400 500 600 700 800 900 1000 1100 1200 1300 1400 1500 1600 1700 1800 1900 2000 2100 2200 2300 2400 2500 2600 2700 2800 Tooltip
NVIDIA GeForce GTX 1050 Ti Mobile
AMD Radeon RX 560X (Laptop)
AMD Radeon 680M
NVIDIA GeForce GTX 1650 Mobile
...
max:
NVIDIA GeForce GTX 1650 Mobile
AMD Radeon RX 560X (Laptop)
AMD Radeon 680M
...
NVIDIA GeForce GTX 1650 Mobile
» With all tested laptops playable in detail settings high.
Additional Benchmarks
Low Preset 1920x1080
69.8 [X] MSI GL75 Intel Core i7-10750H 2.6GHz
GeForce GTX 1650 Mobile
min:
6.76 fps, P0.1:
10.8 fps, P1:
47.6 fps, max:
133 fps
Intel UHD Graphics Xe 16EUs (Tiger Lake-H)
...
AMD Radeon 660M
NVIDIA GeForce GTX 1050 Ti Mobile
AMD Radeon RX Vega M GH
AMD Radeon 680M
NVIDIA GeForce GTX 1650 Mobile
...
max:
...
AMD Radeon RX 560X (Laptop)
AMD Radeon 660M
AMD Radeon RX Vega M GH
NVIDIA GeForce GTX 1050 Ti Mobile
AMD Radeon 680M
NVIDIA GeForce GTX 1650 Mobile
...
max:
...
AMD Radeon RX Vega M GH
AMD Radeon RX 560X (Laptop)
NVIDIA GeForce GTX 1050 Ti Mobile
NVIDIA GeForce GTX 1650 Mobile
AMD Radeon 680M
...
max:
AMD Radeon RX Vega M GH
NVIDIA GeForce GTX 1650 Mobile
...
max:
NVIDIA GeForce GTX 1650 Mobile
...
max:
» With all tested laptops playable in detail settings high.
Additional Benchmarks
Low Preset 1920x1080
85 [X] MSI GL75 Intel Core i7-10750H 2.6GHz
GeForce GTX 1650 Mobile
NVIDIA GeForce GTX 1050 Ti Mobile
NVIDIA GeForce GTX 1650 Mobile
max:
NVIDIA GeForce GTX 1050 Ti Mobile
NVIDIA GeForce GTX 1650 Mobile
max:
NVIDIA GeForce GTX 1050 Ti Mobile
NVIDIA GeForce GTX 1650 Mobile
max:
0 100 200 300 400 500 600 700 800 900 1000 Tooltip
NVIDIA GeForce GTX 1650 Mobile
max:
NVIDIA GeForce GTX 1650 Mobile
max:
» With all tested laptops playable in detail settings med..
Additional Benchmarks
Low Preset 1920x1080
64.5 [X] MSI GL75 Intel Core i7-10750H 2.6GHz
GeForce GTX 1650 Mobile
min:
40 fps, P0.1:
52 fps, P1:
55.2 fps, max:
146 fps
...
AMD Radeon RX 560X (Laptop)
AMD Radeon 680M
NVIDIA GeForce GTX 1050 Ti Mobile
NVIDIA GeForce GTX 1650 Mobile
...
max:
...
AMD Radeon RX 560X (Laptop)
NVIDIA GeForce GTX 1050 Ti Mobile
AMD Radeon 680M
NVIDIA GeForce GTX 1650 Mobile
...
max:
...
AMD Radeon RX 560X (Laptop)
AMD Radeon 680M
NVIDIA GeForce GTX 1650 Mobile
...
max:
NVIDIA GeForce GTX 1650 Mobile
...
max:
NVIDIA GeForce GTX 1650 Mobile
...
max:
» With all tested laptops playable in detail settings ultra.
Additional Benchmarks
Low Preset 1920x1080
81 [X] MSI GL75 Intel Core i7-10750H 2.6GHz
GeForce GTX 1650 Mobile
min:
58 fps
AMD Radeon RX 560X (Laptop)
NVIDIA GeForce GTX 1650 Mobile
...
max:
AMD Radeon RX 560X (Laptop)
NVIDIA GeForce GTX 1650 Mobile
...
max:
AMD Radeon RX 560X (Laptop)
NVIDIA GeForce GTX 1650 Mobile
...
max:
NVIDIA GeForce GTX 1650 Mobile
...
max:
NVIDIA GeForce GTX 1650 Mobile
...
max:
» With all tested laptops playable in detail settings ultra.
Additional Benchmarks
Low Preset 1920x1080
50 [X] MSI GL75 Intel Core i7-10750H 2.6GHz
GeForce GTX 1650 Mobile
min:
33 fps
...
AMD Radeon 660M
AMD Radeon RX 560X (Laptop)
AMD Radeon 680M
NVIDIA GeForce GTX 1650 Mobile
...
0 100 200 300 400 500 600 700 800 900 1000 1100 1200 1300 Tooltip
...
AMD Radeon 660M
AMD Radeon RX 560X (Laptop)
AMD Radeon 680M
NVIDIA GeForce GTX 1650 Mobile
...
Intel UHD Graphics Xe G4 48EUs
...
AMD Radeon RX 560X (Laptop)
AMD Radeon 680M
NVIDIA GeForce GTX 1650 Mobile
...
NVIDIA GeForce GTX 1650 Mobile
...
NVIDIA GeForce GTX 1650 Mobile
...
max:
» With all tested laptops playable in detail settings ultra.
Additional Benchmarks
Low Preset (DX12) 1920x1080
147 [X] MSI GL75 Intel Core i7-10750H 2.6GHz
GeForce GTX 1650 Mobile
min:
22.1 fps, P0.1:
84.5 fps, P1:
92.3 fps, max:
337 fps
0 Tooltip Aspire 7 A715-42G-R0XB: Ø68.5 (47-87)
...
AMD Radeon 660M
AMD Radeon RX 560X (Laptop)
NVIDIA GeForce GTX 1050 Ti Mobile
AMD Radeon 680M
NVIDIA GeForce GTX 1650 Mobile
...
max:
0 Tooltip Aspire 7 A715-42G-R0XB: Ø53.2 (44-61)
...
AMD Radeon RX 560X (Laptop)
NVIDIA GeForce GTX 1050 Ti Mobile
AMD Radeon 680M
NVIDIA GeForce GTX 1650 Mobile
...
max:
0 Tooltip Aspire 7 A715-42G-R0XB: Ø46.7 (38-54)
Intel UHD Graphics Xe 32EUs (Tiger Lake-H)
...
AMD Radeon RX 560X (Laptop)
NVIDIA GeForce GTX 1050 Ti Mobile
AMD Radeon 680M
NVIDIA GeForce GTX 1650 Mobile
...
max:
0 Tooltip Aspire 7 A715-42G-R0XB: Ø41.1 (19-47)
...
AMD Radeon 660M
NVIDIA GeForce GTX 1050 Ti Mobile
AMD Radeon RX 560X (Laptop)
AMD Radeon 680M
NVIDIA GeForce GTX 1650 Mobile
...
max:
AMD Radeon 680M
NVIDIA GeForce GTX 1650 Mobile
...
max:
» With all tested laptops playable in detail settings ultra.
Additional Benchmarks
Low Graphics Quality 1920x1080
75 [X] MSI GL75 Intel Core i7-10750H 2.6GHz
GeForce GTX 1650 Mobile
min:
48 fps
...
NVIDIA GeForce GTX 1050 Ti Mobile
AMD Radeon 660M
AMD Radeon RX 560X (Laptop)
AMD Radeon 680M
NVIDIA GeForce GTX 1650 Mobile
...
...
Intel Iris Plus Graphics G7 (Ice Lake 64 EU)
AMD Radeon 660M
NVIDIA GeForce GTX 1050 Ti Mobile
AMD Radeon 680M
AMD Radeon RX 560X (Laptop)
NVIDIA GeForce GTX 1650 Mobile
...
max:
NVIDIA GeForce GTX 1650 Mobile
...
max:
» With all tested laptops playable in detail settings high.
Additional Benchmarks
Low Preset 1920x1080
87.3 [X] MSI GL75 Intel Core i7-10750H 2.6GHz
GeForce GTX 1650 Mobile
min:
36 fps, P0.1:
42.4 fps, P1:
69 fps, max:
110 fps
AMD Radeon RX Vega 6 (Ryzen 2000/3000)
AMD Radeon RX Vega 6 (Ryzen 4000/5000)
AMD Radeon RX Vega 7
NVIDIA GeForce GTX 1650 Mobile
AMD Radeon RX Vega 6 (Ryzen 2000/3000)
AMD Radeon RX Vega 6 (Ryzen 4000/5000)
AMD Radeon RX Vega 7
NVIDIA GeForce GTX 1650 Mobile
max:
NVIDIA GeForce RTX 3060
AMD Radeon RX Vega 6 (Ryzen 2000/3000)
AMD Radeon RX Vega 6 (Ryzen 4000/5000)
AMD Radeon RX Vega 8 (Ryzen 2000/3000)
AMD Radeon RX Vega 7
NVIDIA GeForce GTX 1650 Mobile
max:
NVIDIA GeForce RTX 3060
0 100 Tooltip : Ø116.5 (110.337-120.173)
AMD Radeon RX Vega 6 (Ryzen 4000/5000)
AMD Radeon RX Vega 7
NVIDIA GeForce GTX 1650 Mobile
max:
NVIDIA GeForce GTX 1650 Mobile
max:
» With all tested laptops playable in detail settings ultra.
Additional Benchmarks
Low Rendering Quality 1920x1080
167 [X] MSI GL75 Intel Core i7-10750H 2.6GHz
GeForce GTX 1650 Mobile
min:
19.7 fps, P0.1:
102 fps, P1:
111 fps, max:
272 fps
...
AMD Radeon RX Vega 7
AMD Radeon RX 560X (Laptop)
AMD Radeon 680M
NVIDIA GeForce GTX 1650 Mobile
...
max:
AMD Radeon RX Vega 7
AMD Radeon RX 560X (Laptop)
AMD Radeon 680M
NVIDIA GeForce GTX 1650 Mobile
...
max:
...
AMD Radeon RX Vega 7
AMD Radeon RX 560X (Laptop)
AMD Radeon 680M
NVIDIA GeForce GTX 1650 Mobile
...
max:
NVIDIA GeForce GTX 1650 Mobile
...
max:
0 100 200 300 400 500 600 700 800 900 1000 1100 1200 1300 1400 1500 Tooltip
NVIDIA GeForce GTX 1650 Mobile
...
max:
» With all tested laptops playable in detail settings high.
Additional Benchmarks
Low Video Quality 1920x1080
54.3 [X] MSI GL75 Intel Core i7-10750H 2.6GHz
GeForce GTX 1650 Mobile
min:
18.6 fps, P0.1:
23.7 fps, P1:
29.4 fps, max:
105 fps
...
AMD Radeon RX Vega 8 (Ryzen 2000/3000)
AMD Radeon RX Vega 7
AMD Radeon RX 560X (Laptop)
AMD Radeon 660M
NVIDIA GeForce GTX 1050 Ti Mobile
AMD Radeon 680M
NVIDIA GeForce GTX 1650 Mobile
...
...
AMD Radeon RX Vega 7
AMD Radeon 660M
AMD Radeon RX 560X (Laptop)
NVIDIA GeForce GTX 1050 Ti Mobile
AMD Radeon 680M
NVIDIA GeForce GTX 1650 Mobile
...
NVIDIA GeForce GTX 1050 Ti Mobile
AMD Radeon 680M
NVIDIA GeForce GTX 1650 Mobile
...
NVIDIA GeForce GTX 1650 Mobile
...
NVIDIA GeForce GTX 1650 Mobile
...
max:
» With all tested laptops playable in detail settings high.
Additional Benchmarks
Low Preset 1920x1080
59 [X] MSI GL75 Intel Core i7-10750H 2.6GHz
GeForce GTX 1650 Mobile
min:
18.7 fps, P0.1:
36.8 fps, P1:
46.4 fps, max:
103 fps
...
AMD Radeon RX Vega 7
AMD Radeon RX 560X (Laptop)
AMD Radeon 660M
NVIDIA GeForce GTX 1650 Mobile
AMD Radeon 680M
...
max:
...
AMD Radeon 680M
NVIDIA GeForce GTX 1650 Mobile
...
max:
...
AMD Radeon 680M
NVIDIA GeForce GTX 1650 Mobile
...
max:
...
NVIDIA GeForce GTX 1650 Mobile
...
max:
» With all tested laptops playable in detail settings ultra.
Additional Benchmarks
Ultra Low Preset 1920x1080
138 [X] MSI GL75 Intel Core i7-10750H 2.6GHz
GeForce GTX 1650 Mobile
min:
120 fps
...
AMD Radeon RX 560X (Laptop)
NVIDIA GeForce GTX 1650 Mobile
...
max:
...
Intel Iris Xe MAX Graphics
AMD Radeon RX 560X (Laptop)
NVIDIA GeForce GTX 1650 Mobile
max:
Intel UHD Graphics Xe 32EUs (Tiger Lake-H)
NVIDIA GeForce GTX 1650 Mobile
...
max:
Intel UHD Graphics Xe 32EUs (Tiger Lake-H)
NVIDIA GeForce GTX 1650 Mobile
max:
» With all tested laptops playable in detail settings high.
Additional Benchmarks
Low Preset 1920x1080
132 [X] MSI GL75 Intel Core i7-10750H 2.6GHz
GeForce GTX 1650 Mobile
min:
86.3 fps, P0.1:
89.1 fps, P1:
95.2 fps, max:
152 fps
...
AMD Radeon 660M
AMD Radeon RX 560X (Laptop)
AMD Radeon 680M
NVIDIA GeForce GTX 1650 Mobile
...
Intel UHD Graphics Xe 32EUs (Tiger Lake-H)
...
AMD Radeon 660M
AMD Radeon RX 560X (Laptop)
AMD Radeon 680M
NVIDIA GeForce GTX 1650 Mobile
...
AMD Radeon RX 560X (Laptop)
AMD Radeon 680M
NVIDIA GeForce GTX 1650 Mobile
...
max:
NVIDIA GeForce GTX 1650 Mobile
...
max:
NVIDIA GeForce GTX 1650 Mobile
...
max:
AMD Radeon RX Vega 64
» With all tested laptops playable in detail settings ultra.
Additional Benchmarks
Low Preset 1920x1080
77.2 [X] MSI GL75 Intel Core i7-10750H 2.6GHz
GeForce GTX 1650 Mobile
min:
33.8 fps, P0.1:
38.8 fps, P1:
52.1 fps, max:
178 fps
...
AMD Radeon 680M
NVIDIA GeForce GTX 1650 Mobile
...
AMD Radeon 680M
NVIDIA GeForce GTX 1650 Mobile
...
NVIDIA GeForce GTX 1650 Mobile
...
NVIDIA GeForce GTX 1650 Mobile
...
max:
» With all tested laptops playable in detail settings ultra.
Intel UHD Graphics Xe 32EUs (Tiger Lake-H)
...
AMD Radeon 660M
AMD Radeon RX 560X (Laptop)
AMD Radeon 680M
NVIDIA GeForce GTX 1650 Mobile
...
max:
AMD Radeon RX 6700 XT
...
AMD Radeon 660M
AMD Radeon RX 560X (Laptop)
AMD Radeon 680M
NVIDIA GeForce GTX 1650 Mobile
...
max:
AMD Radeon RX 6700 XT
...
AMD Radeon RX 560X (Laptop)
AMD Radeon 680M
NVIDIA GeForce GTX 1650 Mobile
...
NVIDIA GeForce GTX 1650 Mobile
...
max:
NVIDIA GeForce GTX 1650 Mobile
...
max:
» With all tested laptops playable in detail settings ultra.
Additional Benchmarks
Prioritize Performance Preset 1920x1080
88.9 [X] MSI GL75 Intel Core i7-10750H 2.6GHz
GeForce GTX 1650 Mobile
min:
65.8 fps, P0.1:
66.2 fps, P1:
67.6 fps, max:
111 fps
...
AMD Radeon 660M
Intel Iris Xe MAX Graphics
AMD Radeon RX 560X (Laptop)
AMD Radeon 680M
NVIDIA GeForce GTX 1650 Mobile
...
max:
AMD Radeon RX 6700 XT
AMD Radeon RX Vega 6 (Ryzen 2000/3000)
...
AMD Radeon 660M
Intel Iris Xe MAX Graphics
AMD Radeon RX 560X (Laptop)
AMD Radeon 680M
NVIDIA GeForce GTX 1650 Mobile
...
max:
NVIDIA Titan RTX
...
AMD Radeon RX 560X (Laptop)
Intel Iris Xe MAX Graphics
AMD Radeon 680M
NVIDIA GeForce GTX 1650 Mobile
...
max:
NVIDIA Titan RTX
NVIDIA GeForce GTX 1650 Mobile
...
max:
NVIDIA GeForce GTX 1650 Mobile
...
max:
» With all tested laptops playable in detail settings ultra.
Additional Benchmarks
Low Preset 1920x1080
79.8 [X] MSI GL75 Intel Core i7-10750H 2.6GHz
GeForce GTX 1650 Mobile
min:
8.69 fps, P0.1:
11.3 fps, P1:
27 fps, max:
191 fps
...
AMD Radeon 660M
AMD Radeon RX 560X (Laptop)
NVIDIA GeForce GTX 1050 Ti Mobile
AMD Radeon 680M
NVIDIA GeForce GTX 1650 Mobile
NVIDIA Quadro RTX 3000 Max-Q
...
max:
AMD Radeon RX 6700 XT
63.5 [X] Lenovo Yoga Creator 7 15IMH05 82DS000VGE Intel Core i7-10750H 2.6GHz
GeForce GTX 1650 Mobile
75.1 [X] MSI GL75 Intel Core i7-10750H 2.6GHz
GeForce GTX 1650 Mobile
min:
50 fps
~ 69 fps
+ Compare
- Hide Comparison
...
AMD Radeon 660M
AMD Radeon RX 560X (Laptop)
NVIDIA GeForce GTX 1050 Ti Mobile
AMD Radeon 680M
NVIDIA GeForce GTX 1650 Mobile
NVIDIA Quadro RTX 3000 Max-Q
...
max:
55.3 [X] Lenovo Yoga Creator 7 15IMH05 82DS000VGE Intel Core i7-10750H 2.6GHz
GeForce GTX 1650 Mobile
64 [X] MSI GL75 Intel Core i7-10750H 2.6GHz
GeForce GTX 1650 Mobile
min:
16 fps
~ 60 fps
+ Compare
- Hide Comparison
...
AMD Radeon 660M
AMD Radeon RX 560X (Laptop)
NVIDIA GeForce GTX 1050 Ti Mobile
AMD Radeon 680M
NVIDIA GeForce GTX 1650 Mobile
NVIDIA Quadro RTX 3000 Max-Q
...
max:
50.2 [X] Lenovo Yoga Creator 7 15IMH05 82DS000VGE Intel Core i7-10750H 2.6GHz
GeForce GTX 1650 Mobile
58.3 [X] MSI GL75 Intel Core i7-10750H 2.6GHz
GeForce GTX 1650 Mobile
min:
38 fps
~ 54 fps
+ Compare
- Hide Comparison
...
Intel Iris Xe MAX Graphics
AMD Radeon RX 560X (Laptop)
NVIDIA GeForce GTX 1050 Ti Mobile
AMD Radeon 680M
NVIDIA GeForce GTX 1650 Mobile
NVIDIA Quadro RTX 3000 Max-Q
...
max:
AMD Radeon 680M
NVIDIA GeForce GTX 1650 Mobile
...
max:
AMD Radeon 680M
NVIDIA GeForce GTX 1650 Mobile
NVIDIA Quadro RTX 3000 Max-Q
...
max:
» With all tested laptops playable in detail settings ultra.
Additional Benchmarks
Minimum Settings 1920x1080
106 [X] MSI GL75 Intel Core i7-10750H 2.6GHz
GeForce GTX 1650 Mobile
min:
67 fps
92.4 [X] Lenovo Yoga Creator 7 15IMH05 82DS000VGE Intel Core i7-10750H 2.6GHz
GeForce GTX 1650 Mobile
37.8 [X] SCHENKER XMG Core 14 Intel Core i5-1135G7 2.4GHz
GeForce GTX 1650 Mobile
min:
11 fps
54 [X] Lenovo Yoga Creator 7 15IMH05 82DS000VGE Intel Core i7-10750H 2.6GHz
GeForce GTX 1650 Mobile
min:
16.7 fps, P0.1:
35.6 fps, P1:
42.1 fps, max:
101 fps
~ 46 fps
+ Compare
- Hide Comparison
+ 📈 Graph
- 📈 Hide Graph
0 100 Tooltip Yoga Creator 7 15IMH05 82DS000VGE: Ø59.1 (48.137-114.5)
...
Intel Iris Xe MAX Graphics
NVIDIA T500 Laptop GPU
AMD Radeon RX 560X (Laptop)
NVIDIA GeForce GTX 1050 Ti Mobile
NVIDIA GeForce GTX 1650 Mobile
NVIDIA Quadro RTX 3000 Max-Q
...
max:
AMD Radeon RX 6700 XT
24.4 [X] SCHENKER XMG Core 14 Intel Core i5-1135G7 2.4GHz
GeForce GTX 1650 Mobile
min:
11 fps
28.5 [X] Lenovo Yoga Creator 7 15IMH05 82DS000VGE Intel Core i7-10750H 2.6GHz
GeForce GTX 1650 Mobile
min:
12.3 fps, P0.1:
19.2 fps, P1:
24.2 fps, max:
54.4 fps
32.4 [X] MSI GL75 Intel Core i7-10750H 2.6GHz
GeForce GTX 1650 Mobile
min:
18 fps, P0.1:
25.5 fps, P1:
27.3 fps, max:
77.4 fps
~ 28 fps
+ Compare
- Hide Comparison
+ 📈 Graph
- 📈 Hide Graph
0 100 Tooltip Yoga Creator 7 15IMH05 82DS000VGE: Ø33.1 (25.357-100.4)
: Ø39 (28.014-185)
...
Intel Iris Xe MAX Graphics
NVIDIA T500 Laptop GPU
AMD Radeon RX 560X (Laptop)
NVIDIA GeForce GTX 1050 Ti Mobile
NVIDIA GeForce GTX 1650 Mobile
...
max:
20.5 [X] SCHENKER XMG Core 14 Intel Core i5-1135G7 2.4GHz
GeForce GTX 1650 Mobile
min:
10 fps
23.6 [X] Lenovo Yoga Creator 7 15IMH05 82DS000VGE Intel Core i7-10750H 2.6GHz
GeForce GTX 1650 Mobile
min:
15.3 fps, P0.1:
17 fps, P1:
20.3 fps, max:
61.2 fps
26.6 [X] MSI GL75 Intel Core i7-10750H 2.6GHz
GeForce GTX 1650 Mobile
min:
17.7 fps, P0.1:
21.1 fps, P1:
23 fps, max:
57.6 fps
~ 24 fps
+ Compare
- Hide Comparison
+ 📈 Graph
- 📈 Hide Graph
0 100 200 Tooltip Yoga Creator 7 15IMH05 82DS000VGE: Ø27.1 (22.137-69.4)
: Ø34.5 (24.066-243)
...
Intel Iris Xe MAX Graphics
NVIDIA T500 Laptop GPU
AMD Radeon RX 560X (Laptop)
NVIDIA GeForce GTX 1650 Mobile
NVIDIA Quadro RTX 3000 Max-Q
...
max:
17.6 [X] SCHENKER XMG Core 14 Intel Core i5-1135G7 2.4GHz
GeForce GTX 1650 Mobile
min:
7 fps
19 [X] Lenovo Yoga Creator 7 15IMH05 82DS000VGE Intel Core i7-10750H 2.6GHz
GeForce GTX 1650 Mobile
min:
10.4 fps, P0.1:
10.5 fps, P1:
14.7 fps, max:
25.5 fps
22.6 [X] MSI GL75 Intel Core i7-10750H 2.6GHz
GeForce GTX 1650 Mobile
min:
11.1 fps, P0.1:
11.7 fps, P1:
19.2 fps, max:
56.2 fps
~ 20 fps
+ Compare
- Hide Comparison
+ 📈 Graph
- 📈 Hide Graph
0 100 200 300 400 500 600 700 800 Tooltip Yoga Creator 7 15IMH05 82DS000VGE: Ø35.7 (13.41-883)
: Ø25.1 (14.256-60.5)
NVIDIA T500 Laptop GPU
NVIDIA GeForce GTX 1650 Mobile
NVIDIA Quadro RTX 3000 Max-Q
...
max:
NVIDIA GeForce GTX 1650 Mobile
NVIDIA GeForce GTX 1080 Mobile
...
max:
0 100 200 300 400 500 600 700 Tooltip
NVIDIA GeForce GTX 1650 Mobile
NVIDIA Quadro RTX 3000 Max-Q
NVIDIA GeForce GTX 1080 Mobile
...
max:
» With all tested laptops playable in detail settings low.
Additional Benchmarks
Low Preset 1920x1080
38.9 [X] MSI GL75 Intel Core i7-10750H 2.6GHz
GeForce GTX 1650 Mobile
min:
18 fps, P0.1:
30 fps, P1:
33 fps, max:
84.8 fps
35.5 [X] Lenovo Yoga Creator 7 15IMH05 82DS000VGE Intel Core i7-10750H 2.6GHz
GeForce GTX 1650 Mobile
min:
11.6 fps, P0.1:
23.5 fps, P1:
30.6 fps, max:
78.1 fps
60 [X] SCHENKER XMG Core 14 Intel Core i5-1135G7 2.4GHz
GeForce GTX 1650 Mobile
min:
22 fps
85 [X] Lenovo Yoga Creator 7 15IMH05 82DS000VGE Intel Core i7-10750H 2.6GHz
GeForce GTX 1650 Mobile
min:
36 fps, max:
150 fps
~ 73 fps
+ Compare
- Hide Comparison
...
AMD Radeon RX Vega 7
AMD Radeon RX 560X (Laptop)
NVIDIA T500 Laptop GPU
NVIDIA GeForce GTX 1650 Mobile
NVIDIA GeForce GTX 1050 Ti Mobile
...
42 [X] SCHENKER XMG Core 14 Intel Core i5-1135G7 2.4GHz
GeForce GTX 1650 Mobile
min:
10 fps
50 [X] Lenovo Yoga Creator 7 15IMH05 82DS000VGE Intel Core i7-10750H 2.6GHz
GeForce GTX 1650 Mobile
min:
30 fps, max:
109 fps
60 [X] MSI GL75 Intel Core i7-10750H 2.6GHz
GeForce GTX 1650 Mobile
min:
19 fps
~ 51 fps
+ Compare
- Hide Comparison
Intel UHD Graphics G1 (Ice Lake 32 EU)
...
AMD Radeon RX 560X (Laptop)
NVIDIA GeForce GTX 1050 Ti Mobile
NVIDIA T500 Laptop GPU
NVIDIA GeForce GTX 1650 Mobile
NVIDIA Quadro RTX 3000 Max-Q
...
max:
25 [X] SCHENKER XMG Core 14 Intel Core i5-1135G7 2.4GHz
GeForce GTX 1650 Mobile
min:
7 fps
37 [X] MSI GL75 Intel Core i7-10750H 2.6GHz
GeForce GTX 1650 Mobile
min:
17 fps
42 [X] Lenovo Yoga Creator 7 15IMH05 82DS000VGE Intel Core i7-10750H 2.6GHz
GeForce GTX 1650 Mobile
min:
13 fps, max:
80 fps
~ 35 fps
+ Compare
- Hide Comparison
AMD Radeon RX Vega 6 (Ryzen 2000/3000)
...
AMD Radeon RX Vega 10
NVIDIA GeForce GTX 1050 Ti Mobile
AMD Radeon RX 560X (Laptop)
NVIDIA T500 Laptop GPU
NVIDIA GeForce GTX 1650 Mobile
...
max:
16 [X] SCHENKER XMG Core 14 Intel Core i5-1135G7 2.4GHz
GeForce GTX 1650 Mobile
min:
3 fps
36 [X] MSI GL75 Intel Core i7-10750H 2.6GHz
GeForce GTX 1650 Mobile
min:
12 fps
36 [X] Lenovo Yoga Creator 7 15IMH05 82DS000VGE Intel Core i7-10750H 2.6GHz
GeForce GTX 1650 Mobile
min:
20 fps, max:
71 fps
~ 29 fps
+ Compare
- Hide Comparison
...
NVIDIA GeForce GTX 1050 Ti Mobile
AMD Radeon RX 560X (Laptop)
NVIDIA T500 Laptop GPU
NVIDIA GeForce GTX 1650 Mobile
...
max:
NVIDIA GeForce GTX 1650 Mobile
...
max:
NVIDIA GeForce GTX 1650 Mobile
NVIDIA Quadro RTX 3000 Max-Q
NVIDIA GeForce GTX 1080 Mobile
...
max:
» With all tested laptops playable in detail settings med..
...
AMD Radeon RX Vega 7
Intel Iris Xe MAX Graphics
AMD Radeon RX 560X (Laptop)
NVIDIA GeForce GTX 1650 Mobile
AMD Radeon 660M
NVIDIA GeForce GTX 1050 Ti Mobile
AMD Radeon 680M
...
0 100 200 300 400 500 600 700 800 Tooltip
...
AMD Radeon RX 560X (Laptop)
Intel Iris Xe MAX Graphics
AMD Radeon 680M
NVIDIA GeForce GTX 1050 Ti Mobile
NVIDIA GeForce GTX 1650 Mobile
...
Intel UHD Graphics Xe 32EUs (Tiger Lake-H)
...
AMD Radeon 660M
Intel Iris Xe MAX Graphics
AMD Radeon RX 560X (Laptop)
AMD Radeon 680M
NVIDIA GeForce GTX 1050 Ti Mobile
NVIDIA GeForce GTX 1650 Mobile
...
...
Intel Iris Xe MAX Graphics
AMD Radeon RX 560X (Laptop)
AMD Radeon 680M
NVIDIA GeForce GTX 1050 Ti Mobile
NVIDIA GeForce GTX 1650 Mobile
...
NVIDIA GeForce GTX 1650 Mobile
...
NVIDIA GeForce GTX 1650 Mobile
NVIDIA Quadro RTX 3000 Max-Q
...
max:
» With most tested laptops playable in detail settings ultra.
AMD Radeon RX Vega 7
NVIDIA GeForce GTX 1050 Ti Mobile
NVIDIA GeForce GTX 1650 Mobile
NVIDIA GeForce RTX 2070 Super Max-Q
NVIDIA GeForce RTX 2070 Super Mobile
max:
AMD Radeon RX Vega 7
NVIDIA GeForce GTX 1050 Ti Mobile
NVIDIA GeForce GTX 1650 Mobile
NVIDIA GeForce GTX 1080 Mobile
...
max:
AMD Radeon RX Vega 7
NVIDIA GeForce GTX 1050 Ti Mobile
NVIDIA GeForce GTX 1650 Mobile
NVIDIA GeForce GTX 1080 Mobile
...
max:
NVIDIA GeForce GTX 1050 Ti Mobile
NVIDIA GeForce GTX 1650 Mobile
NVIDIA GeForce GTX 1080 Mobile
...
max:
NVIDIA GeForce GTX 1650 Mobile
NVIDIA GeForce GTX 1080 Mobile
...
max:
NVIDIA GeForce GTX 1650 Mobile
NVIDIA GeForce GTX 1080 Mobile
...
max:
» With all tested laptops playable in detail settings med..
64 [X] SCHENKER XMG Core 14 Intel Core i5-1135G7 2.4GHz
GeForce GTX 1650 Mobile
min:
18 fps
68 [X] Lenovo Yoga Creator 7 15IMH05 82DS000VGE Intel Core i7-10750H 2.6GHz
GeForce GTX 1650 Mobile
min:
9 fps, P0.1:
31 fps, P1:
50 fps, max:
134 fps
~ 66 fps
+ Compare
- Hide Comparison
...
AMD Radeon RX Vega 7
AMD Radeon 660M
AMD Radeon RX 560X (Laptop)
NVIDIA GeForce GTX 1650 Mobile
AMD Radeon 680M
NVIDIA Quadro RTX 3000 Max-Q
...
max:
41 [X] Lenovo Yoga Creator 7 15IMH05 82DS000VGE Intel Core i7-10750H 2.6GHz
GeForce GTX 1650 Mobile
min:
27 fps, P0.1:
28 fps, P1:
31 fps, max:
93 fps
42 [X] SCHENKER XMG Core 14 Intel Core i5-1135G7 2.4GHz
GeForce GTX 1650 Mobile
min:
12 fps
~ 42 fps
+ Compare
- Hide Comparison
...
Intel Iris Xe MAX Graphics
AMD Radeon 660M
AMD Radeon RX 560X (Laptop)
AMD Radeon 680M
NVIDIA GeForce GTX 1650 Mobile
NVIDIA Quadro RTX 3000 Max-Q
...
max:
21 [X] SCHENKER XMG Core 14 Intel Core i5-1135G7 2.4GHz
GeForce GTX 1650 Mobile
min:
10 fps
27 [X] Lenovo Yoga Creator 7 15IMH05 82DS000VGE Intel Core i7-10750H 2.6GHz
GeForce GTX 1650 Mobile
min:
18 fps, P0.1:
18 fps, P1:
20 fps, max:
60 fps
~ 24 fps
+ Compare
- Hide Comparison
Intel Iris Xe MAX Graphics
...
AMD Radeon 660M
AMD Radeon RX 560X (Laptop)
NVIDIA GeForce GTX 1650 Mobile
AMD Radeon 680M
...
max:
5 [X] SCHENKER XMG Core 14 Intel Core i5-1135G7 2.4GHz
GeForce GTX 1650 Mobile
min:
3 fps
10 [X] Lenovo Yoga Creator 7 15IMH05 82DS000VGE Intel Core i7-10750H 2.6GHz
GeForce GTX 1650 Mobile
min:
7 fps, P0.1:
7 fps, P1:
8 fps, max:
13 fps
~ 8 fps
+ Compare
- Hide Comparison
NVIDIA GeForce GTX 1650 Mobile
NVIDIA GeForce GTX 1050 Ti Mobile
...
max:
» With all tested laptops playable in detail settings med..
90.7 [X] SCHENKER XMG Core 14 Intel Core i5-1135G7 2.4GHz
GeForce GTX 1650 Mobile
min:
29 fps
92.5 [X] MSI GP75 Leopard 9SC Intel Core i7-9750H 2.6GHz
GeForce GTX 1650 Mobile
min:
59.1 fps, P0.1:
62.4 fps, P1:
75.9 fps, max:
122 fps
95.4 [X] Lenovo Yoga Creator 7 15IMH05 82DS000VGE Intel Core i7-10750H 2.6GHz
GeForce GTX 1650 Mobile
min:
23.3 fps, P0.1:
57.7 fps, P1:
73.6 fps, max:
170.7 fps
~ 93 fps
+ Compare
- Hide Comparison
Intel UHD Graphics Xe 16EUs (Tiger Lake-H)
...
AMD Radeon RX 560X (Laptop)
NVIDIA GeForce GTX 1050 Ti Mobile
AMD Radeon 660M
NVIDIA GeForce GTX 1650 Mobile
AMD Radeon 680M
NVIDIA Quadro RTX 3000 Max-Q
...
max:
44.4 [X] MSI GP75 Leopard 9SC Intel Core i7-9750H 2.6GHz
GeForce GTX 1650 Mobile
min:
24.9 fps, P0.1:
27.6 fps, P1:
36.5 fps, max:
131.4 fps
46.6 [X] Lenovo Yoga Creator 7 15IMH05 82DS000VGE Intel Core i7-10750H 2.6GHz
GeForce GTX 1650 Mobile
min:
31.8 fps, P0.1:
35.1 fps, P1:
37.9 fps, max:
65.9 fps
46.8 [X] SCHENKER XMG Core 14 Intel Core i5-1135G7 2.4GHz
GeForce GTX 1650 Mobile
min:
16 fps
~ 46 fps
+ Compare
- Hide Comparison
...
Intel Iris Xe MAX Graphics
AMD Radeon 660M
NVIDIA GeForce GTX 1050 Ti Mobile
AMD Radeon RX 560X (Laptop)
AMD Radeon 680M
NVIDIA GeForce GTX 1650 Mobile
NVIDIA Quadro RTX 3000 Max-Q
...
max:
35.4 [X] MSI GP75 Leopard 9SC Intel Core i7-9750H 2.6GHz
GeForce GTX 1650 Mobile
min:
25.1 fps, P0.1:
27 fps, P1:
30.2 fps, max:
44 fps
36.3 [X] SCHENKER XMG Core 14 Intel Core i5-1135G7 2.4GHz
GeForce GTX 1650 Mobile
min:
9 fps
36.3 [X] Lenovo Yoga Creator 7 15IMH05 82DS000VGE Intel Core i7-10750H 2.6GHz
GeForce GTX 1650 Mobile
min:
26.8 fps, P0.1:
28.9 fps, P1:
30.7 fps, max:
48.5 fps
~ 36 fps
+ Compare
- Hide Comparison
...
AMD Radeon 660M
NVIDIA GeForce GTX 1050 Ti Mobile
AMD Radeon RX 560X (Laptop)
AMD Radeon 680M
NVIDIA GeForce GTX 1650 Mobile
...
max:
16.6 [X] MSI GP75 Leopard 9SC Intel Core i7-9750H 2.6GHz
GeForce GTX 1650 Mobile
min:
12 fps, P0.1:
12.5 fps, P1:
13.1 fps, max:
21.9 fps
22.2 [X] SCHENKER XMG Core 14 Intel Core i5-1135G7 2.4GHz
GeForce GTX 1650 Mobile
min:
9 fps
29.4 [X] Lenovo Yoga Creator 7 15IMH05 82DS000VGE Intel Core i7-10750H 2.6GHz
GeForce GTX 1650 Mobile
min:
21.8 fps, P0.1:
23 fps, P1:
24.4 fps, max:
40.8 fps
~ 23 fps
+ Compare
- Hide Comparison
...
Intel Iris Xe MAX Graphics
AMD Radeon RX Vega 7
AMD Radeon RX 560X (Laptop)
NVIDIA GeForce GTX 1650 Mobile
AMD Radeon 680M
...
max:
13.8 [X] MSI GP75 Leopard 9SC Intel Core i7-9750H 2.6GHz
GeForce GTX 1650 Mobile
min:
4.6 fps, P0.1:
10.5 fps, P1:
11.3 fps, max:
90.2 fps
fps
+ Compare
- Hide Comparison
NVIDIA GeForce GTX 1650 Mobile
NVIDIA GeForce GTX 1080 Mobile
...
max:
» With all tested laptops playable in detail settings high.
54 [X] SCHENKER XMG Core 14 Intel Core i5-1135G7 2.4GHz
GeForce GTX 1650 Mobile
min:
23 fps
80.4 [X] Lenovo Yoga Creator 7 15IMH05 82DS000VGE Intel Core i7-10750H 2.6GHz
GeForce GTX 1650 Mobile
min:
35.96 fps, P1:
58.9 fps, max:
131.62 fps
91.2 [X] MSI GP75 Leopard 9SC Intel Core i7-9750H 2.6GHz
GeForce GTX 1650 Mobile
min:
36.42 fps, P1:
64.22 fps, max:
140.12 fps
~ 75 fps
+ Compare
- Hide Comparison
+ 📈 Graph
- 📈 Hide Graph
0 100 Tooltip Yoga Creator 7 15IMH05 82DS000VGE: Ø81.1 (35-131)
: Ø92.6 (36-140)
...
AMD Radeon 680M
NVIDIA GeForce GTX 1650 Mobile
NVIDIA Quadro RTX 5000 Max-Q
...
max:
47 [X] SCHENKER XMG Core 14 Intel Core i5-1135G7 2.4GHz
GeForce GTX 1650 Mobile
min:
6 fps
48 [X] Lenovo Yoga Creator 7 15IMH05 82DS000VGE Intel Core i7-10750H 2.6GHz
GeForce GTX 1650 Mobile
min:
22.63 fps, P1:
38.09 fps, max:
60.02 fps
53.8 [X] MSI GP75 Leopard 9SC Intel Core i7-9750H 2.6GHz
GeForce GTX 1650 Mobile
min:
26.13 fps, P1:
39.24 fps, max:
112.04 fps
~ 50 fps
+ Compare
- Hide Comparison
+ 📈 Graph
- 📈 Hide Graph
0 100 Tooltip Yoga Creator 7 15IMH05 82DS000VGE: Ø48 (22-60)
: Ø54 (26-112)
Intel UHD Graphics Xe 16EUs (Tiger Lake-H)
...
AMD Radeon 660M
AMD Radeon RX 560X (Laptop)
NVIDIA GeForce GTX 1050 Ti Mobile
AMD Radeon 680M
NVIDIA GeForce GTX 1650 Mobile
...
max:
39 [X] SCHENKER XMG Core 14 Intel Core i5-1135G7 2.4GHz
GeForce GTX 1650 Mobile
min:
5 fps
41.6 [X] Lenovo Yoga Creator 7 15IMH05 82DS000VGE Intel Core i7-10750H 2.6GHz
GeForce GTX 1650 Mobile
min:
19.49 fps, P1:
32.74 fps, max:
63.32 fps
45.3 [X] MSI GP75 Leopard 9SC Intel Core i7-9750H 2.6GHz
GeForce GTX 1650 Mobile
min:
20.4 fps, P1:
34.72 fps, max:
82.35 fps
~ 42 fps
+ Compare
- Hide Comparison
+ 📈 Graph
- 📈 Hide Graph
0 Tooltip Yoga Creator 7 15IMH05 82DS000VGE: Ø41.4 (19-63)
: Ø45.4 (20-82)
...
AMD Radeon 660M
AMD Radeon RX 560X (Laptop)
NVIDIA GeForce GTX 1050 Ti Mobile
AMD Radeon 680M
NVIDIA GeForce GTX 1650 Mobile
...
max:
14 [X] SCHENKER XMG Core 14 Intel Core i5-1135G7 2.4GHz
GeForce GTX 1650 Mobile
min:
4 fps
17.4 [X] MSI GP75 Leopard 9SC Intel Core i7-9750H 2.6GHz
GeForce GTX 1650 Mobile
min:
2.15 fps, P1:
6.93 fps, max:
86.34 fps
18 [X] Lenovo Yoga Creator 7 15IMH05 82DS000VGE Intel Core i7-10750H 2.6GHz
GeForce GTX 1650 Mobile
min:
9 fps, P1:
12.49 fps, max:
56.99 fps
~ 16 fps
+ Compare
- Hide Comparison
+ 📈 Graph
- 📈 Hide Graph
0 Tooltip : Ø18.2 (2-86)
Yoga Creator 7 15IMH05 82DS000VGE: Ø18 (8-56)
AMD Radeon RX 560X (Laptop)
NVIDIA GeForce GTX 1050 Ti Mobile
NVIDIA GeForce GTX 1650 Mobile
AMD Radeon 680M
...
max:
NVIDIA GeForce GTX 1650 Mobile
...
max:
» With all tested laptops playable in detail settings high.
...
AMD Radeon RX Vega 7
NVIDIA GeForce GTX 1080 Mobile
NVIDIA GeForce GTX 1050 Ti Mobile
NVIDIA GeForce GTX 1650 Mobile
NVIDIA Quadro RTX 5000 Max-Q
max:
...
AMD Radeon RX Vega 8 (Ryzen 2000/3000)
AMD Radeon RX Vega 7
NVIDIA GeForce GTX 1650 Mobile
NVIDIA GeForce GTX 1050 Ti Mobile
NVIDIA GeForce GTX 1080 Mobile
NVIDIA Quadro RTX 5000 Max-Q
...
max:
0 100 Tooltip : Ø162.6 (155.788-171.37)
...
AMD Radeon RX Vega 8 (Ryzen 2000/3000)
AMD Radeon RX Vega 7
NVIDIA GeForce GTX 1650 Mobile
NVIDIA GeForce GTX 1050 Ti Mobile
NVIDIA GeForce GTX 1080 Mobile
NVIDIA Quadro RTX 5000 Max-Q
...
NVIDIA GeForce RTX 2080 Super Mobile
max:
...
AMD Radeon RX Vega 7
NVIDIA GeForce GTX 1050 Ti Mobile
NVIDIA GeForce GTX 1650 Mobile
NVIDIA GeForce GTX 1080 Mobile
NVIDIA Quadro RTX 5000 Max-Q
...
NVIDIA GeForce RTX 2080 Super Mobile
max:
NVIDIA GeForce GTX 1050 Ti Mobile
NVIDIA GeForce GTX 1650 Mobile
NVIDIA Quadro RTX 5000 Max-Q
NVIDIA GeForce GTX 1080 Mobile
...
NVIDIA GeForce RTX 2080 Super Mobile
max:
NVIDIA GeForce GTX 1050 Ti Mobile
NVIDIA GeForce GTX 1650 Mobile
NVIDIA Quadro RTX 5000 Max-Q
...
NVIDIA GeForce RTX 2080 Super Mobile
max:
» With all tested laptops playable in detail settings ultra.
108 [X] SCHENKER XMG Core 14 Intel Core i5-1135G7 2.4GHz
GeForce GTX 1650 Mobile
min:
26 fps
179.1 [X] Lenovo Legion 5 17IMH05 Intel Core i5-10300H 2.5GHz
GeForce GTX 1650 Mobile
~ 144 fps
+ Compare
- Hide Comparison
...
AMD Radeon 540X
AMD Radeon RX Vega 7
NVIDIA GeForce GTX 1650 Mobile
AMD Radeon 660M
AMD Radeon RX 560X (Laptop)
AMD Radeon 680M
NVIDIA GeForce GTX 1050 Ti Mobile
...
max:
93 [X] SCHENKER XMG Core 14 Intel Core i5-1135G7 2.4GHz
GeForce GTX 1650 Mobile
min:
22 fps
122.6 [X] Lenovo Legion 5 17IMH05 Intel Core i5-10300H 2.5GHz
GeForce GTX 1650 Mobile
~ 108 fps
+ Compare
- Hide Comparison
...
NVIDIA T500 Laptop GPU
AMD Radeon 660M
AMD Radeon RX 560X (Laptop)
AMD Radeon 680M
NVIDIA GeForce GTX 1050 Ti Mobile
NVIDIA GeForce GTX 1650 Mobile
...
max:
89 [X] SCHENKER XMG Core 14 Intel Core i5-1135G7 2.4GHz
GeForce GTX 1650 Mobile
min:
18 fps
108.7 [X] Lenovo Legion 5 17IMH05 Intel Core i5-10300H 2.5GHz
GeForce GTX 1650 Mobile
~ 99 fps
+ Compare
- Hide Comparison
AMD Radeon RX Vega 6 (Ryzen 2000/3000)
...
NVIDIA T500 Laptop GPU
AMD Radeon 660M
AMD Radeon RX 560X (Laptop)
AMD Radeon 680M
NVIDIA GeForce GTX 1050 Ti Mobile
NVIDIA GeForce GTX 1650 Mobile
...
max:
80.8 [X] SCHENKER XMG Core 14 Intel Core i5-1135G7 2.4GHz
GeForce GTX 1650 Mobile
min:
18 fps
100 [X] Lenovo Legion 5 17IMH05 Intel Core i5-10300H 2.5GHz
GeForce GTX 1650 Mobile
~ 90 fps
+ Compare
- Hide Comparison
...
NVIDIA T500 Laptop GPU
NVIDIA GeForce GTX 1050 Ti Mobile
AMD Radeon RX 560X (Laptop)
AMD Radeon 680M
NVIDIA GeForce GTX 1650 Mobile
...
max:
» With all tested laptops playable in detail settings ultra.
0 100 Tooltip 1.5.4.5: Ø106.1 (94.05-130.7)
...
AMD Radeon RX 560X (Laptop)
AMD Radeon 680M
NVIDIA GeForce GTX 1050 Ti Mobile
NVIDIA GeForce GTX 1650 Mobile
NVIDIA Quadro RTX 5000 Max-Q
...
max:
0 Tooltip 1.5.4.5: Ø48.5 (38.727-57.5)
Intel UHD Graphics G1 (Ice Lake 32 EU)
...
AMD Radeon RX 560X (Laptop)
AMD Radeon 680M
NVIDIA GeForce GTX 1050 Ti Mobile
NVIDIA GeForce GTX 1650 Mobile
...
max:
0 100 Tooltip 1.5.4.5: Ø54 (41.148-137)
...
AMD Radeon RX 560X (Laptop)
AMD Radeon 680M
NVIDIA GeForce GTX 1050 Ti Mobile
NVIDIA GeForce GTX 1650 Mobile
...
max:
0 Tooltip 1.5.4.5: Ø31.6 (27.529-45.7)
NVIDIA GeForce GTX 1050 Ti Mobile
NVIDIA GeForce GTX 1650 Mobile
...
max:
0 100 Tooltip 1.5.4.5: Ø20.1 (13.02-105.1)
NVIDIA GeForce GTX 1050 Ti Mobile
NVIDIA GeForce GTX 1650 Mobile
...
max:
» With all tested laptops playable in detail settings high.
0 100 200 Tooltip Legion 5 17IMH05: Ø103.6 (68.45-155.21)
: Ø119 (86.739-235)
...
NVIDIA GeForce GTX 1080 Mobile
AMD Radeon 680M
NVIDIA Quadro RTX 5000 Max-Q
NVIDIA GeForce GTX 1650 Mobile
AMD Radeon 660M
NVIDIA GeForce GTX 1050 Ti Mobile
...
max:
0 100 200 300 400 500 600 700 800 900 1000 1100 1200 1300 1400 1500 1600 1700 1800 1900 2000 2100 2200 2300 2400 2500 2600 2700 2800 2900 3000 3100 3200 3300 3400 3500 3600 3700 3800 3900 4000 4100 4200 4300 4400 4500 4600 4700 4800 4900 5000 5100 5200 5300 5400 5500 5600 5700 5800 5900 6000 6100 6200 6300 6400 6500 6600 6700 6800 6900 7000 7100 7200 7300 7400 7500 7600 7700 7800 7900 8000 8100 8200 8300 8400 8500 8600 8700 8800 8900 9000 9100 9200 9300 9400 9500 9600 9700 9800 9900 Tooltip Legion 5 17IMH05: Ø54 (33.12-269)
: Ø779678870172 (44.076-46001053336768)
...
Intel Iris Xe MAX Graphics
AMD Radeon 660M
AMD Radeon RX 560X (Laptop)
NVIDIA GeForce GTX 1050 Ti Mobile
NVIDIA GeForce GTX 1650 Mobile
NVIDIA GeForce GTX 1080 Mobile
...
max:
0 100 Tooltip Legion 5 17IMH05: Ø42.3 (25.64-58.91)
: Ø51.9 (35.908-166)
...
Intel Iris Xe MAX Graphics
NVIDIA GeForce GTX 1050 Ti Mobile
AMD Radeon RX 560X (Laptop)
AMD Radeon 660M
NVIDIA GeForce GTX 1650 Mobile
NVIDIA GeForce GTX 1080 Mobile
...
NVIDIA GeForce RTX 2080 Super Mobile
max:
0 100 Tooltip : Ø27.4 (2.286-69.6)
Legion 5 17IMH05: Ø32 (15.53-117.3)
NVIDIA GeForce GTX 1050 Ti Mobile
AMD Radeon RX Vega 7
Intel Iris Xe MAX Graphics
NVIDIA GeForce GTX 1650 Mobile
...
max:
NVIDIA GeForce GTX 1050 Ti Mobile
NVIDIA GeForce GTX 1650 Mobile
...
max:
» With all tested laptops playable in detail settings high.
...
AMD Radeon RX 560X (Laptop)
Intel Iris Xe MAX Graphics
AMD Radeon 660M
AMD Radeon 680M
NVIDIA GeForce GTX 1650 Mobile
max:
...
Intel Iris Plus Graphics G7 (Ice Lake 64 EU)
Intel Iris Xe MAX Graphics
AMD Radeon 660M
AMD Radeon 680M
NVIDIA GeForce GTX 1650 Mobile
...
max:
...
Intel Iris Xe MAX Graphics
AMD Radeon 660M
AMD Radeon 680M
NVIDIA GeForce GTX 1650 Mobile
...
max:
AMD Radeon 680M
NVIDIA GeForce GTX 1650 Mobile
...
max:
NVIDIA GeForce GTX 1650 Mobile
NVIDIA GeForce GTX 1080 Mobile
...
max:
NVIDIA GeForce GTX 1650 Mobile
NVIDIA GeForce GTX 1080 Mobile
...
max:
» With all tested laptops playable in detail settings med..
Intel UHD Graphics Xe 16EUs (Tiger Lake-H)
...
NVIDIA GeForce GTX 1050 Ti Mobile
AMD Radeon RX 560X (Laptop)
NVIDIA GeForce GTX 1650 Mobile
NVIDIA Quadro RTX 5000 Max-Q
NVIDIA GeForce GTX 1080 Mobile
NVIDIA GeForce RTX 2070 Super Mobile
...
0 Tooltip 1.5.4.5: Ø39.1 (7.48-64.4)
AMD Radeon RX Vega 8 (Ryzen 2000/3000)
...
AMD Radeon 660M
AMD Radeon RX 560X (Laptop)
NVIDIA GeForce GTX 1050 Ti Mobile
NVIDIA GeForce GTX 1650 Mobile
NVIDIA Quadro RTX 5000 Max-Q
...
0 Tooltip 1.5.4.5: Ø27.6 (10.2-50.5)
...
AMD Radeon 660M
AMD Radeon RX 560X (Laptop)
NVIDIA GeForce GTX 1050 Ti Mobile
NVIDIA GeForce GTX 1650 Mobile
...
0 Tooltip 1.5.4.5: Ø17.7 (8.51-39.5)
NVIDIA GeForce GTX 1050 Ti Mobile
NVIDIA GeForce GTX 1650 Mobile
...
0 Tooltip 1.5.4.5: Ø13.2 (2.1-41.2)
NVIDIA GeForce GTX 1050 Ti Mobile
NVIDIA GeForce GTX 1650 Mobile
NVIDIA GeForce GTX 1080 Mobile
...
0 Tooltip 1.5.4.5: Ø5.03 (1.959-22.5)
NVIDIA GeForce GTX 1050 Ti Mobile
NVIDIA GeForce GTX 1650 Mobile
NVIDIA GeForce GTX 1080 Mobile
NVIDIA Quadro RTX 5000 Max-Q
...
» With all tested laptops playable in detail settings med..
Additional Benchmarks
Low-End TAAAA 1920x1080
48 [X] Lenovo Legion 5 17IMH05 Intel Core i5-10300H 2.5GHz
GeForce GTX 1650 Mobile
81 [X] MSI GP75 Leopard 9SC Intel Core i7-9750H 2.6GHz
GeForce GTX 1650 Mobile
84 95 [X] Nexoc GH5 515IG Intel Core i5-10300H 2.5GHz
GeForce GTX 1650 Mobile
~ 87 fps
+ Compare
- Hide Comparison
...
NVIDIA GeForce GTX 1050 Ti Mobile
AMD Radeon 680M
NVIDIA GeForce GTX 1650 Mobile
NVIDIA GeForce GTX 1080 Mobile
NVIDIA Quadro RTX 3000 Max-Q
...
max:
52 52 [X] Acer Nitro 5 AN517-41-R3FK AMD Ryzen 7 5800H 3.2GHz
GeForce GTX 1650 Mobile
54 [X] MSI GP75 Leopard 9SC Intel Core i7-9750H 2.6GHz
GeForce GTX 1650 Mobile
min:
3 fps
54 [X] Nexoc GH5 515IG Intel Core i5-10300H 2.5GHz
GeForce GTX 1650 Mobile
~ 53 fps
+ Compare
- Hide Comparison
Intel UHD Graphics Xe 16EUs (Tiger Lake-H)
...
AMD Radeon 680M
NVIDIA GeForce GTX 1050 Ti Mobile
NVIDIA GeForce GTX 1650 Mobile
...
max:
41 [X] Acer Nitro 5 AN517-41-R3FK AMD Ryzen 7 5800H 3.2GHz
GeForce GTX 1650 Mobile
44 45 [X] Nexoc GH5 515IG Intel Core i5-10300H 2.5GHz
GeForce GTX 1650 Mobile
46 [X] MSI GP75 Leopard 9SC Intel Core i7-9750H 2.6GHz
GeForce GTX 1650 Mobile
min:
18 fps
~ 44 fps
+ Compare
- Hide Comparison
AMD Radeon RX Vega 6 (Ryzen 4000/5000)
...
NVIDIA GeForce GTX 1050 Ti Mobile
AMD Radeon 680M
NVIDIA GeForce GTX 1650 Mobile
...
max:
34 [X] MSI GP75 Leopard 9SC Intel Core i7-9750H 2.6GHz
GeForce GTX 1650 Mobile
34 [X] Nexoc GH5 515IG Intel Core i5-10300H 2.5GHz
GeForce GTX 1650 Mobile
34 39 [X] Acer Nitro 5 AN517-41-R3FK AMD Ryzen 7 5800H 3.2GHz
GeForce GTX 1650 Mobile
~ 35 fps
+ Compare
- Hide Comparison
...
AMD Radeon RX Vega 7
NVIDIA GeForce GTX 1050 Ti Mobile
AMD Radeon 680M
NVIDIA GeForce GTX 1650 Mobile
...
max:
NVIDIA GeForce GTX 1050 Ti Mobile
NVIDIA GeForce GTX 1650 Mobile
NVIDIA Quadro RTX 3000 Max-Q
...
max:
NVIDIA GeForce GTX 1050 Ti Mobile
NVIDIA GeForce GTX 1650 Mobile
NVIDIA Quadro RTX 3000 Max-Q
NVIDIA GeForce GTX 1080 Mobile
...
max:
» With all tested laptops playable in detail settings high.
100.8 [X] Lenovo Legion 5 17IMH05 Intel Core i5-10300H 2.5GHz
GeForce GTX 1650 Mobile
104.9 [X] Nexoc GH5 515IG Intel Core i5-10300H 2.5GHz
GeForce GTX 1650 Mobile
105.6 111 [X] MSI GP75 Leopard 9SC Intel Core i7-9750H 2.6GHz
GeForce GTX 1650 Mobile
min:
84 fps
~ 106 fps
+ Compare
- Hide Comparison
...
AMD Radeon RX 560X (Laptop)
NVIDIA GeForce GTX 1050 Ti Mobile
AMD Radeon 680M
NVIDIA Quadro RTX 3000 Max-Q
NVIDIA GeForce GTX 1650 Mobile
NVIDIA Quadro RTX 5000 Max-Q
NVIDIA GeForce GTX 1080 Mobile
...
max:
AMD Radeon RX 6700 XT
62.8 [X] Nexoc GH5 515IG Intel Core i5-10300H 2.5GHz
GeForce GTX 1650 Mobile
64 [X] Lenovo Legion 5 17IMH05 Intel Core i5-10300H 2.5GHz
GeForce GTX 1650 Mobile
64.2 [X] MSI GP75 Leopard 9SC Intel Core i7-9750H 2.6GHz
GeForce GTX 1650 Mobile
min:
50 fps
64.2 ~ 64 fps
+ Compare
- Hide Comparison
...
AMD Radeon 660M
AMD Radeon RX 560X (Laptop)
NVIDIA GeForce GTX 1050 Ti Mobile
AMD Radeon 680M
NVIDIA GeForce GTX 1650 Mobile
NVIDIA Quadro RTX 3000 Max-Q
...
max:
57.3 [X] Nexoc GH5 515IG Intel Core i5-10300H 2.5GHz
GeForce GTX 1650 Mobile
58.8 [X] MSI GP75 Leopard 9SC Intel Core i7-9750H 2.6GHz
GeForce GTX 1650 Mobile
min:
49 fps
59.5 [X] Lenovo Legion 5 17IMH05 Intel Core i5-10300H 2.5GHz
GeForce GTX 1650 Mobile
60.4 ~ 59 fps
+ Compare
- Hide Comparison
AMD Radeon RX Vega 6 (Ryzen 2000/3000)
...
AMD Radeon 660M
AMD Radeon RX 560X (Laptop)
NVIDIA GeForce GTX 1050 Ti Mobile
AMD Radeon 680M
NVIDIA GeForce GTX 1650 Mobile
NVIDIA Quadro RTX 3000 Max-Q
...
max:
56.5 [X] Nexoc GH5 515IG Intel Core i5-10300H 2.5GHz
GeForce GTX 1650 Mobile
57.3 [X] MSI GP75 Leopard 9SC Intel Core i7-9750H 2.6GHz
GeForce GTX 1650 Mobile
min:
45 fps
57.6 [X] Lenovo Legion 5 17IMH05 Intel Core i5-10300H 2.5GHz
GeForce GTX 1650 Mobile
57.8 ~ 57 fps
+ Compare
- Hide Comparison
AMD Radeon RX Vega 6 (Ryzen 2000/3000)
...
AMD Radeon RX 560X (Laptop)
NVIDIA GeForce GTX 1050 Ti Mobile
AMD Radeon 680M
NVIDIA GeForce GTX 1650 Mobile
NVIDIA Quadro RTX 3000 Max-Q
...
max:
NVIDIA GeForce GTX 1050 Ti Mobile
NVIDIA GeForce GTX 1650 Mobile
NVIDIA Quadro RTX 3000 Max-Q
...
max:
NVIDIA GeForce GTX 1050 Ti Mobile
NVIDIA GeForce GTX 1650 Mobile
NVIDIA Quadro RTX 3000 Max-Q
...
max:
» With all tested laptops playable in detail settings ultra.
156 [X] Lenovo Legion 5 17IMH05 Intel Core i5-10300H 2.5GHz
GeForce GTX 1650 Mobile
min:
117 fps, max:
169 fps
178 182 [X] Nexoc GH5 515IG Intel Core i5-10300H 2.5GHz
GeForce GTX 1650 Mobile
min:
169 fps, max:
197 fps
185 208 [X] MSI GP75 Leopard 9SC Intel Core i7-9750H 2.6GHz
GeForce GTX 1650 Mobile
min:
187 fps
~ 182 fps
+ Compare
- Hide Comparison
...
AMD Radeon 660M
AMD Radeon 680M
NVIDIA GeForce GTX 1050 Ti Mobile
NVIDIA GeForce GTX 1650 Mobile
AMD Radeon RX Vega M GH
NVIDIA Quadro RTX 5000 Max-Q
...
max:
86.5 100 [X] Lenovo Legion 5 17IMH05 Intel Core i5-10300H 2.5GHz
GeForce GTX 1650 Mobile
min:
89 fps, max:
110 fps
104 [X] Nexoc GH5 515IG Intel Core i5-10300H 2.5GHz
GeForce GTX 1650 Mobile
min:
91 fps, max:
115 fps
104 114 [X] MSI GP75 Leopard 9SC Intel Core i7-9750H 2.6GHz
GeForce GTX 1650 Mobile
min:
101 fps
~ 102 fps
+ Compare
- Hide Comparison
...
NVIDIA T500 Laptop GPU
AMD Radeon 680M
NVIDIA GeForce GTX 1050 Ti Mobile
NVIDIA Quadro T2000 Max-Q
NVIDIA GeForce GTX 1650 Mobile
AMD Radeon RX Vega M GH
...
max:
68.7 80 [X] Lenovo Legion 5 17IMH05 Intel Core i5-10300H 2.5GHz
GeForce GTX 1650 Mobile
min:
70 fps, max:
91 fps
81 [X] Nexoc GH5 515IG Intel Core i5-10300H 2.5GHz
GeForce GTX 1650 Mobile
min:
71 fps, max:
93 fps
83 91 [X] MSI GP75 Leopard 9SC Intel Core i7-9750H 2.6GHz
GeForce GTX 1650 Mobile
min:
79 fps
~ 81 fps
+ Compare
- Hide Comparison
...
Intel Iris Xe MAX Graphics
NVIDIA T500 Laptop GPU
AMD Radeon 680M
NVIDIA GeForce GTX 1050 Ti Mobile
NVIDIA Quadro T2000 Max-Q
NVIDIA GeForce GTX 1650 Mobile
AMD Radeon RX Vega M GH
...
max:
48.3 57 [X] Nexoc GH5 515IG Intel Core i5-10300H 2.5GHz
GeForce GTX 1650 Mobile
min:
46 fps, max:
66 fps
57 [X] Lenovo Legion 5 17IMH05 Intel Core i5-10300H 2.5GHz
GeForce GTX 1650 Mobile
min:
47 fps, max:
66 fps
58 63 [X] MSI GP75 Leopard 9SC Intel Core i7-9750H 2.6GHz
GeForce GTX 1650 Mobile
min:
51 fps
~ 57 fps
+ Compare
- Hide Comparison
...
Intel Iris Xe MAX Graphics
NVIDIA T500 Laptop GPU
NVIDIA GeForce GTX 1050 Ti Mobile
AMD Radeon 680M
NVIDIA Quadro T2000 Max-Q
AMD Radeon RX Vega M GH
NVIDIA GeForce GTX 1650 Mobile
...
max:
NVIDIA GeForce GTX 1050 Ti Mobile
AMD Radeon RX Vega M GH
NVIDIA GeForce GTX 1650 Mobile
...
max:
NVIDIA GeForce GTX 1050 Ti Mobile
AMD Radeon RX Vega M GH
NVIDIA GeForce GTX 1650 Mobile
NVIDIA Quadro RTX 5000 Max-Q
...
max:
» With all tested laptops playable in detail settings ultra.
126 [X] SCHENKER XMG Core 14 Intel Core i5-1135G7 2.4GHz
GeForce GTX 1650 Mobile
min:
16 fps
214 [X] MSI GP75 Leopard 9SC Intel Core i7-9750H 2.6GHz
GeForce GTX 1650 Mobile
min:
206 fps
~ 170 fps
+ Compare
- Hide Comparison
...
NVIDIA GeForce GTX 1650 Mobile
NVIDIA GeForce GTX 1050 Ti Mobile
Intel UHD Graphics Xe 750 32EUs (Rocket Lake)
NVIDIA GeForce GTX 1080 Mobile
max:
NVIDIA Titan RTX
125 [X] SCHENKER XMG Core 14 Intel Core i5-1135G7 2.4GHz
GeForce GTX 1650 Mobile
min:
13 fps
202 [X] MSI GP75 Leopard 9SC Intel Core i7-9750H 2.6GHz
GeForce GTX 1650 Mobile
min:
171 fps
~ 164 fps
+ Compare
- Hide Comparison
...
Intel UHD Graphics Xe 750 32EUs (Rocket Lake)
AMD Radeon RX Vega 6 (Ryzen 4000/5000)
NVIDIA GeForce GTX 1650 Mobile
NVIDIA GeForce GTX 1050 Ti Mobile
NVIDIA GeForce GTX 1080 Mobile
max:
NVIDIA Titan RTX
105 [X] SCHENKER XMG Core 14 Intel Core i5-1135G7 2.4GHz
GeForce GTX 1650 Mobile
min:
4 fps
191 [X] MSI GP75 Leopard 9SC Intel Core i7-9750H 2.6GHz
GeForce GTX 1650 Mobile
min:
165 fps
~ 148 fps
+ Compare
- Hide Comparison
...
AMD Radeon RX Vega 6 (Ryzen 4000/5000)
AMD Radeon RX Vega 7
NVIDIA GeForce GTX 1650 Mobile
NVIDIA GeForce GTX 1050 Ti Mobile
NVIDIA GeForce GTX 1080 Mobile
...
max:
NVIDIA Titan RTX
...
Intel UHD Graphics Xe 750 32EUs (Rocket Lake)
AMD Radeon RX Vega 7
AMD Radeon RX Vega 6 (Ryzen 4000/5000)
NVIDIA GeForce GTX 1050 Ti Mobile
NVIDIA GeForce GTX 1650 Mobile
NVIDIA GeForce GTX 1080 Mobile
max:
NVIDIA Titan RTX
AMD Radeon RX Vega 6 (Ryzen 4000/5000)
AMD Radeon RX Vega 7
NVIDIA GeForce GTX 1050 Ti Mobile
NVIDIA GeForce GTX 1650 Mobile
NVIDIA GeForce GTX 1080 Mobile
...
» With all tested laptops playable in detail settings high.
161.6 191.1 [X] Lenovo IdeaPad Gaming 3i 15IMH05 Intel Core i5-10300H 2.5GHz
GeForce GTX 1650 Mobile
230.8 [X] Nexoc GH5 515IG Intel Core i5-10300H 2.5GHz
GeForce GTX 1650 Mobile
260 [X] MSI GP75 Leopard 9SC Intel Core i7-9750H 2.6GHz
GeForce GTX 1650 Mobile
~ 211 fps
+ Compare
- Hide Comparison
...
AMD Radeon 680M
NVIDIA GeForce GTX 1050 Ti Mobile
NVIDIA Quadro RTX 5000 Max-Q
NVIDIA GeForce GTX 1650 Mobile
AMD Radeon RX 5300M
NVIDIA GeForce GTX 1080 Mobile
...
max:
89.7 [X] Nexoc GH5 515IG Intel Core i5-10300H 2.5GHz
GeForce GTX 1650 Mobile
94 [X] Lenovo IdeaPad Gaming 3i 15IMH05 Intel Core i5-10300H 2.5GHz
GeForce GTX 1650 Mobile
98.2 [X] MSI GP75 Leopard 9SC Intel Core i7-9750H 2.6GHz
GeForce GTX 1650 Mobile
100.4 ~ 96 fps
+ Compare
- Hide Comparison
...
NVIDIA GeForce GTX 1050 Ti Mobile
NVIDIA Quadro T2000 Max-Q
AMD Radeon RX Vega M GH
NVIDIA GeForce GTX 1650 Mobile
AMD Radeon RX 5300M
...
max:
61 [X] Nexoc GH5 515IG Intel Core i5-10300H 2.5GHz
GeForce GTX 1650 Mobile
64.7 [X] MSI GP75 Leopard 9SC Intel Core i7-9750H 2.6GHz
GeForce GTX 1650 Mobile
65.2 [X] Lenovo IdeaPad Gaming 3i 15IMH05 Intel Core i5-10300H 2.5GHz
GeForce GTX 1650 Mobile
66.4 66.4 ~ 65 fps
+ Compare
- Hide Comparison
...
NVIDIA Quadro T2000 Max-Q
NVIDIA GeForce GTX 1050 Ti Mobile
AMD Radeon RX Vega M GH
NVIDIA GeForce GTX 1650 Mobile
AMD Radeon RX 5300M
...
max:
41.9 [X] Nexoc GH5 515IG Intel Core i5-10300H 2.5GHz
GeForce GTX 1650 Mobile
43.6 45.4 [X] Nexoc GH5 515IG Leistungsmodus
Intel Core i5-10300H 2.5GHz
GeForce GTX 1650 Mobile
46.9 [X] MSI GP75 Leopard 9SC Intel Core i7-9750H 2.6GHz
GeForce GTX 1650 Mobile
48.3 [X] Lenovo IdeaPad Gaming 3i 15IMH05 Intel Core i5-10300H 2.5GHz
GeForce GTX 1650 Mobile
~ 45 fps
+ Compare
- Hide Comparison
...
NVIDIA Quadro T2000 Max-Q
NVIDIA GeForce GTX 1050 Ti Mobile
AMD Radeon RX Vega M GH
NVIDIA GeForce GTX 1650 Mobile
AMD Radeon RX 5300M
...
max:
...
NVIDIA GeForce GTX 1050 Ti Mobile
AMD Radeon RX Vega M GH
NVIDIA GeForce GTX 1650 Mobile
...
max:
AMD Radeon RX Vega M GH
NVIDIA GeForce GTX 1650 Mobile
NVIDIA Quadro RTX 5000 Max-Q
...
max:
» With all tested laptops playable in detail settings ultra.
118.9 139 [X] Lenovo Legion 5 17IMH05 Intel Core i5-10300H 2.5GHz
GeForce GTX 1650 Mobile
148.6 [X] Nexoc GH5 515IG Intel Core i5-10300H 2.5GHz
GeForce GTX 1650 Mobile
151.5 [X] Lenovo IdeaPad Gaming 3i 15IMH05 Intel Core i5-10300H 2.5GHz
GeForce GTX 1650 Mobile
~ 140 fps
+ Compare
- Hide Comparison
...
NVIDIA GeForce GTX 1050 Ti Mobile
AMD Radeon 660M
AMD Radeon Pro 560X
AMD Radeon RX 560X (Laptop)
NVIDIA GeForce GTX 1650 Mobile
NVIDIA Quadro T2000 Max-Q
...
max:
78.6 81.4 [X] Nexoc GH5 515IG Intel Core i5-10300H 2.5GHz
GeForce GTX 1650 Mobile
84.3 [X] Lenovo Legion 5 17IMH05 Intel Core i5-10300H 2.5GHz
GeForce GTX 1650 Mobile
84.6 [X] Lenovo IdeaPad Gaming 3i 15IMH05 Intel Core i5-10300H 2.5GHz
GeForce GTX 1650 Mobile
~ 82 fps
+ Compare
- Hide Comparison
Intel UHD Graphics Xe 16EUs (Tiger Lake-H)
...
Intel Iris Xe MAX Graphics
AMD Radeon RX Vega 7
AMD Radeon 660M
AMD Radeon Pro 560X
AMD Radeon RX 560X (Laptop)
NVIDIA GeForce GTX 1650 Mobile
NVIDIA Quadro T2000 Max-Q
...
max:
62.6 [X] Nexoc GH5 515IG Intel Core i5-10300H 2.5GHz
GeForce GTX 1650 Mobile
62.9 68.1 [X] Lenovo IdeaPad Gaming 3i 15IMH05 Intel Core i5-10300H 2.5GHz
GeForce GTX 1650 Mobile
69.2 [X] Lenovo Legion 5 17IMH05 Intel Core i5-10300H 2.5GHz
GeForce GTX 1650 Mobile
~ 66 fps
+ Compare
- Hide Comparison
Intel Iris Plus Graphics G7 (Ice Lake 64 EU)
...
AMD Radeon 660M
AMD Radeon RX 560X (Laptop)
NVIDIA Quadro T2000 Max-Q
NVIDIA GeForce GTX 1650 Mobile
NVIDIA Quadro RTX 3000 Max-Q
...
max:
» With all tested laptops playable in detail settings high.
144.4 [X] Lenovo IdeaPad Gaming 3i 15IMH05 Intel Core i5-10300H 2.5GHz
GeForce GTX 1650 Mobile
152 [X] MSI GP75 Leopard 9SC Intel Core i7-9750H 2.6GHz
GeForce GTX 1650 Mobile
min:
141 fps
~ 148 fps
+ Compare
- Hide Comparison
AMD Radeon R4 (Stoney Ridge)
...
AMD Radeon RX Vega M GH
AMD Radeon RX 5300M
NVIDIA Quadro T2000 Max-Q
NVIDIA GeForce GTX 1650 Mobile
NVIDIA Quadro RTX 5000 Max-Q
...
56.8 [X] Lenovo IdeaPad Gaming 3i 15IMH05 Intel Core i5-10300H 2.5GHz
GeForce GTX 1650 Mobile
57.9 [X] MSI GP75 Leopard 9SC Intel Core i7-9750H 2.6GHz
GeForce GTX 1650 Mobile
min:
45 fps
~ 57 fps
+ Compare
- Hide Comparison
...
AMD Radeon 680M
NVIDIA GeForce GTX 1050 Ti Mobile
NVIDIA Quadro T2000 Max-Q
AMD Radeon RX 5300M
AMD Radeon RX Vega M GH
NVIDIA GeForce GTX 1650 Mobile
...
46.4 [X] Lenovo IdeaPad Gaming 3i 15IMH05 Intel Core i5-10300H 2.5GHz
GeForce GTX 1650 Mobile
48.3 [X] MSI GP75 Leopard 9SC Intel Core i7-9750H 2.6GHz
GeForce GTX 1650 Mobile
min:
43 fps
~ 47 fps
+ Compare
- Hide Comparison
...
NVIDIA GeForce GTX 1050 Ti Mobile
AMD Radeon RX Vega M GH
AMD Radeon RX 5300M
NVIDIA Quadro T2000 Max-Q
NVIDIA GeForce GTX 1650 Mobile
...
NVIDIA GeForce GTX 1050 Max-Q
NVIDIA GeForce GTX 1050 Ti Mobile
AMD Radeon RX Vega M GH
NVIDIA GeForce GTX 1650 Mobile
...
max:
NVIDIA GeForce GTX 1050 Max-Q
NVIDIA GeForce GTX 1050 Ti Mobile
AMD Radeon RX Vega M GH
NVIDIA GeForce GTX 1650 Mobile
...
max:
» With all tested laptops playable in detail settings high.
121 [X] MSI GP75 Leopard 9SC Intel Core i7-9750H 2.6GHz
GeForce GTX 1650 Mobile
min:
118 fps
121.2 [X] Lenovo IdeaPad Gaming 3i 15IMH05 Intel Core i5-10300H 2.5GHz
GeForce GTX 1650 Mobile
~ 121 fps
+ Compare
- Hide Comparison
AMD Radeon R4 (Stoney Ridge)
...
AMD Radeon Pro 560X
NVIDIA GeForce GTX 1050 Ti Mobile
NVIDIA GeForce GTX 1650 Mobile
78.6 [X] Lenovo IdeaPad Gaming 3i 15IMH05 Intel Core i5-10300H 2.5GHz
GeForce GTX 1650 Mobile
82 [X] MSI GP75 Leopard 9SC Intel Core i7-9750H 2.6GHz
GeForce GTX 1650 Mobile
min:
70 fps
~ 80 fps
+ Compare
- Hide Comparison
...
AMD Radeon Pro 560X
NVIDIA GeForce GTX 1050 Ti Mobile
NVIDIA GeForce GTX 1650 Mobile
AMD Radeon RX 5300M
...
max:
NVIDIA Titan RTX
58.4 [X] MSI GP75 Leopard 9SC Intel Core i7-9750H 2.6GHz
GeForce GTX 1650 Mobile
min:
46 fps
67.9 [X] Lenovo IdeaPad Gaming 3i 15IMH05 Intel Core i5-10300H 2.5GHz
GeForce GTX 1650 Mobile
~ 63 fps
+ Compare
- Hide Comparison
AMD Radeon RX Vega 6 (Ryzen 2000/3000)
...
AMD Radeon Pro 560X
NVIDIA GeForce GTX 1050 Ti Mobile
NVIDIA GeForce GTX 1650 Mobile
AMD Radeon RX 5300M
...
NVIDIA GeForce RTX 2070 Super Mobile
max:
AMD Radeon RX 5700 (Desktop)
45.8 [X] MSI GP75 Leopard 9SC Intel Core i7-9750H 2.6GHz
GeForce GTX 1650 Mobile
min:
36 fps
62.2 [X] Lenovo IdeaPad Gaming 3i 15IMH05 Intel Core i5-10300H 2.5GHz
GeForce GTX 1650 Mobile
~ 54 fps
+ Compare
- Hide Comparison
...
AMD Radeon Pro 560X
NVIDIA GeForce GTX 1050 Ti Mobile
NVIDIA GeForce GTX 1650 Mobile
AMD Radeon RX 5300M
...
NVIDIA GeForce RTX 2070 Super Mobile
NVIDIA GeForce GTX 1050 Ti Mobile
NVIDIA GeForce GTX 1650 Mobile
NVIDIA GeForce RTX 2070 Super Max-Q
NVIDIA GeForce RTX 2070 Super Mobile
...
max:
NVIDIA GeForce GTX 1050 Ti Mobile
NVIDIA GeForce GTX 1650 Mobile
NVIDIA GeForce RTX 2070 Super Max-Q
...
max:
NVIDIA Titan RTX
» With all tested laptops playable in detail settings ultra.
63.4 [X] MSI GP75 Leopard 9SC Intel Core i7-9750H 2.6GHz
GeForce GTX 1650 Mobile
min:
13 fps
93.6 [X] Lenovo IdeaPad Gaming 3i 15IMH05 Intel Core i5-10300H 2.5GHz
GeForce GTX 1650 Mobile
~ 79 fps
+ Compare
- Hide Comparison
AMD Radeon R4 (Stoney Ridge)
...
NVIDIA GeForce GTX 1050 Ti Mobile
Intel Iris Xe MAX Graphics
AMD Radeon Pro 560X
NVIDIA GeForce GTX 1650 Mobile
AMD Radeon RX 5300M
NVIDIA Quadro RTX 5000 Max-Q
...
max:
45.8 [X] MSI GP75 Leopard 9SC Intel Core i7-9750H 2.6GHz
GeForce GTX 1650 Mobile
min:
23 fps
50.8 [X] Lenovo IdeaPad Gaming 3i 15IMH05 Intel Core i5-10300H 2.5GHz
GeForce GTX 1650 Mobile
~ 48 fps
+ Compare
- Hide Comparison
...
Intel Iris Xe MAX Graphics
AMD Radeon Pro 560X
NVIDIA GeForce GTX 1050 Ti Mobile
AMD Radeon RX 5300M
NVIDIA GeForce GTX 1650 Mobile
...
max:
32.1 [X] MSI GP75 Leopard 9SC Intel Core i7-9750H 2.6GHz
GeForce GTX 1650 Mobile
min:
15 fps
33.1 [X] Lenovo IdeaPad Gaming 3i 15IMH05 Intel Core i5-10300H 2.5GHz
GeForce GTX 1650 Mobile
~ 33 fps
+ Compare
- Hide Comparison
Intel UHD Graphics Xe 32EUs (Tiger Lake-H)
...
NVIDIA GeForce GTX 1050 Max-Q
Intel Iris Xe MAX Graphics
AMD Radeon Pro 560X
AMD Radeon RX 5300M
NVIDIA GeForce GTX 1650 Mobile
...
max:
21.2 [X] MSI GP75 Leopard 9SC Intel Core i7-9750H 2.6GHz
GeForce GTX 1650 Mobile
min:
12 fps
21.2 [X] Lenovo IdeaPad Gaming 3i 15IMH05 Intel Core i5-10300H 2.5GHz
GeForce GTX 1650 Mobile
~ 21 fps
+ Compare
- Hide Comparison
NVIDIA GeForce GTX 1050 Max-Q
NVIDIA GeForce GTX 1650 Mobile
...
max:
» With all tested laptops playable in detail settings med..
69.6 [X] Lenovo IdeaPad Gaming 3i 15IMH05 Intel Core i5-10300H 2.5GHz
GeForce GTX 1650 Mobile
71.2 [X] MSI GP75 Leopard 9SC Intel Core i7-9750H 2.6GHz
GeForce GTX 1650 Mobile
min:
60 fps
78.3 [X] Nexoc GH5 515IG Intel Core i5-10300H 2.5GHz
GeForce GTX 1650 Mobile
~ 73 fps
+ Compare
- Hide Comparison
...
NVIDIA GeForce GTX 950M
NVIDIA GeForce GTX 1050 Ti Mobile
NVIDIA Quadro T2000 Max-Q
AMD Radeon RX 5300M
NVIDIA GeForce GTX 1650 Mobile
NVIDIA Quadro RTX 3000 Max-Q
NVIDIA GeForce GTX 1080 Mobile
...
max:
59.8 [X] Lenovo IdeaPad Gaming 3i 15IMH05 Intel Core i5-10300H 2.5GHz
GeForce GTX 1650 Mobile
61.1 [X] Nexoc GH5 515IG Intel Core i5-10300H 2.5GHz
GeForce GTX 1650 Mobile
64 [X] MSI GP75 Leopard 9SC Intel Core i7-9750H 2.6GHz
GeForce GTX 1650 Mobile
min:
55 fps
~ 62 fps
+ Compare
- Hide Comparison
...
NVIDIA GeForce GTX 1050 Ti Mobile
NVIDIA Quadro T2000 Max-Q
AMD Radeon RX 5300M
NVIDIA GeForce GTX 1650 Mobile
NVIDIA Quadro RTX 3000 Max-Q
...
NVIDIA GeForce RTX 2080 Super Mobile
max:
51.8 [X] Nexoc GH5 515IG Intel Core i5-10300H 2.5GHz
GeForce GTX 1650 Mobile
52.1 [X] Lenovo IdeaPad Gaming 3i 15IMH05 Intel Core i5-10300H 2.5GHz
GeForce GTX 1650 Mobile
54.5 [X] MSI GP75 Leopard 9SC Intel Core i7-9750H 2.6GHz
GeForce GTX 1650 Mobile
min:
47 fps
~ 53 fps
+ Compare
- Hide Comparison
...
NVIDIA GeForce GTX 950M
NVIDIA GeForce GTX 1050 Ti Mobile
NVIDIA Quadro T2000 Max-Q
NVIDIA GeForce GTX 1650 Mobile
AMD Radeon RX 5300M
NVIDIA Quadro RTX 3000 Max-Q
...
max:
AMD Radeon Pro 560X
NVIDIA GeForce GTX 950M
NVIDIA GeForce GTX 1050 Max-Q
NVIDIA GeForce GTX 1050 Ti Mobile
NVIDIA GeForce GTX 1650 Mobile
NVIDIA Quadro RTX 3000 Max-Q
...
max:
NVIDIA GeForce GTX 1050 Max-Q
NVIDIA GeForce GTX 1050 Ti Mobile
NVIDIA GeForce GTX 1650 Mobile
NVIDIA GeForce GTX 950M
NVIDIA Quadro RTX 3000 Max-Q
...
max:
» With all tested laptops playable in detail settings ultra.
75.6 [X] Lenovo IdeaPad Gaming 3i 15IMH05 Intel Core i5-10300H 2.5GHz
GeForce GTX 1650 Mobile
98 [X] MSI GP75 Leopard 9SC Intel Core i7-9750H 2.6GHz
GeForce GTX 1650 Mobile
min:
86 fps
~ 87 fps
+ Compare
- Hide Comparison
AMD Radeon R4 (Stoney Ridge)
...
AMD Radeon RX Vega M GH
AMD Radeon RX 5300M
NVIDIA GeForce GTX 1050 Ti Mobile
NVIDIA Quadro RTX 3000 Max-Q
NVIDIA GeForce GTX 1650 Mobile
NVIDIA Quadro RTX 5000 Max-Q
NVIDIA GeForce GTX 1080 Mobile
...
max:
NVIDIA GeForce RTX 2080 (Desktop)
57.8 [X] Lenovo IdeaPad Gaming 3i 15IMH05 Intel Core i5-10300H 2.5GHz
GeForce GTX 1650 Mobile
66.3 [X] MSI GP75 Leopard 9SC Intel Core i7-9750H 2.6GHz
GeForce GTX 1650 Mobile
min:
54 fps
~ 62 fps
+ Compare
- Hide Comparison
...
NVIDIA GeForce GTX 1050 Ti Mobile
AMD Radeon RX Vega M GH
NVIDIA GeForce GTX 1650 Mobile
AMD Radeon RX 5300M
NVIDIA Quadro RTX 3000 Max-Q
NVIDIA Quadro RTX 5000 Max-Q
...
max:
NVIDIA GeForce RTX 2080 (Desktop)
51 [X] Lenovo IdeaPad Gaming 3i 15IMH05 Intel Core i5-10300H 2.5GHz
GeForce GTX 1650 Mobile
59.9 [X] MSI GP75 Leopard 9SC Intel Core i7-9750H 2.6GHz
GeForce GTX 1650 Mobile
min:
52 fps
~ 55 fps
+ Compare
- Hide Comparison
Intel Iris Plus Graphics G7 (Ice Lake 64 EU)
...
NVIDIA GeForce GTX 1050 Ti Mobile
AMD Radeon RX Vega M GH
NVIDIA GeForce GTX 1650 Mobile
AMD Radeon RX 5300M
NVIDIA Quadro RTX 3000 Max-Q
NVIDIA Quadro RTX 5000 Max-Q
...
max:
NVIDIA GeForce RTX 2080 (Desktop)
46.3 [X] MSI GP75 Leopard 9SC Intel Core i7-9750H 2.6GHz
GeForce GTX 1650 Mobile
min:
40 fps
48.7 [X] Lenovo IdeaPad Gaming 3i 15IMH05 Intel Core i5-10300H 2.5GHz
GeForce GTX 1650 Mobile
~ 48 fps
+ Compare
- Hide Comparison
...
NVIDIA GeForce GTX 1050 Ti Mobile
AMD Radeon RX Vega M GH
NVIDIA GeForce GTX 1650 Mobile
AMD Radeon RX 5300M
NVIDIA Quadro RTX 3000 Max-Q
...
max:
NVIDIA GeForce RTX 2080 (Desktop)
AMD Radeon Pro 560X
NVIDIA GeForce GTX 1050 Max-Q
NVIDIA GeForce GTX 1050 Ti Mobile
AMD Radeon RX Vega M GH
NVIDIA GeForce GTX 1650 Mobile
NVIDIA Quadro RTX 3000 Max-Q
...
max:
NVIDIA Titan RTX
NVIDIA GeForce GTX 1050 Ti Mobile
NVIDIA GeForce GTX 1050 Max-Q
NVIDIA GeForce GTX 1650 Mobile
NVIDIA Quadro RTX 3000 Max-Q
NVIDIA GeForce RTX 2070 Super Max-Q
...
max:
NVIDIA Titan RTX
» With all tested laptops playable in detail settings ultra.
97.5 [X] Nexoc GH5 515IG Intel Core i5-10300H 2.5GHz
GeForce GTX 1650 Mobile
98.3 99.6 [X] Lenovo IdeaPad Gaming 3i 15IMH05 Intel Core i5-10300H 2.5GHz
GeForce GTX 1650 Mobile
121 [X] MSI GP75 Leopard 9SC Intel Core i7-9750H 2.6GHz
GeForce GTX 1650 Mobile
min:
96 fps
~ 104 fps
+ Compare
- Hide Comparison
...
NVIDIA GeForce GTX 1050 Max-Q
AMD Radeon Pro 560X
NVIDIA GeForce GTX 1050 Ti Mobile
NVIDIA GeForce GTX 1650 Mobile
AMD Radeon RX 5300M
NVIDIA Quadro RTX 3000 Max-Q
NVIDIA GeForce RTX 2070 Super Max-Q
...
max:
NVIDIA GeForce RTX 2080 (Desktop)
58.1 61.5 [X] Nexoc GH5 515IG Intel Core i5-10300H 2.5GHz
GeForce GTX 1650 Mobile
64.3 [X] Lenovo IdeaPad Gaming 3i 15IMH05 Intel Core i5-10300H 2.5GHz
GeForce GTX 1650 Mobile
70.1 [X] MSI GP75 Leopard 9SC Intel Core i7-9750H 2.6GHz
GeForce GTX 1650 Mobile
min:
58 fps
~ 64 fps
+ Compare
- Hide Comparison
...
NVIDIA GeForce GTX 1050 Max-Q
AMD Radeon Pro 560X
NVIDIA GeForce GTX 1050 Ti Mobile
NVIDIA GeForce GTX 1650 Mobile
AMD Radeon RX 5300M
NVIDIA Quadro RTX 3000 Max-Q
...
max:
NVIDIA Titan RTX
51.1 [X] Nexoc GH5 515IG Intel Core i5-10300H 2.5GHz
GeForce GTX 1650 Mobile
51.4 53.3 [X] Lenovo IdeaPad Gaming 3i 15IMH05 Intel Core i5-10300H 2.5GHz
GeForce GTX 1650 Mobile
66.5 [X] MSI GP75 Leopard 9SC Intel Core i7-9750H 2.6GHz
GeForce GTX 1650 Mobile
min:
53 fps
~ 56 fps
+ Compare
- Hide Comparison
...
AMD Radeon RX Vega 7
NVIDIA GeForce GTX 1050 Max-Q
AMD Radeon Pro 560X
NVIDIA GeForce GTX 1050 Ti Mobile
NVIDIA GeForce GTX 1650 Mobile
AMD Radeon RX 5300M
NVIDIA Quadro RTX 3000 Max-Q
...
max:
NVIDIA Titan RTX
43.3 [X] Nexoc GH5 515IG Intel Core i5-10300H 2.5GHz
GeForce GTX 1650 Mobile
44.6 45.4 [X] Lenovo IdeaPad Gaming 3i 15IMH05 Intel Core i5-10300H 2.5GHz
GeForce GTX 1650 Mobile
53.5 [X] MSI GP75 Leopard 9SC Intel Core i7-9750H 2.6GHz
GeForce GTX 1650 Mobile
min:
44 fps
~ 47 fps
+ Compare
- Hide Comparison
...
AMD Radeon Pro 560X
NVIDIA GeForce GTX 1050 Max-Q
NVIDIA GeForce GTX 1050 Ti Mobile
NVIDIA GeForce GTX 1650 Mobile
NVIDIA Quadro RTX 3000 Max-Q
NVIDIA Quadro RTX 5000 Max-Q
...
max:
NVIDIA GeForce GTX 1050 Max-Q
NVIDIA GeForce GTX 1050 Ti Mobile
NVIDIA Quadro RTX 3000 Max-Q
NVIDIA GeForce GTX 1650 Mobile
NVIDIA Quadro RTX 5000 Max-Q
NVIDIA GeForce RTX 2070 Super Max-Q
NVIDIA GeForce GTX 1080 Mobile
NVIDIA GeForce RTX 2070 Super Mobile
...
max:
NVIDIA GeForce GTX 1050 Ti Mobile
NVIDIA GeForce GTX 1650 Mobile
NVIDIA GeForce GTX 1050 Max-Q
NVIDIA Quadro RTX 3000 Max-Q
...
max:
» With all tested laptops playable in detail settings ultra.
98.2 123 [X] Dell G5 15 5590-PCNJJ Intel Core i5-9300H 2.4GHz
GeForce GTX 1650 Mobile
166 [X] MSI GP75 Leopard 9SC Intel Core i7-9750H 2.6GHz
GeForce GTX 1650 Mobile
min:
128 fps
~ 129 fps
+ Compare
- Hide Comparison
AMD Radeon R5 (Bristol Ridge)
...
NVIDIA GeForce GTX 1050 Ti Mobile
NVIDIA GeForce GTX 1650 Mobile
NVIDIA GeForce GTX 1080 Mobile
NVIDIA Quadro RTX 5000 Max-Q
AMD Radeon RX 5300M
NVIDIA Quadro T2000 Max-Q
...
...
NVIDIA GeForce GTX 1050 Max-Q
NVIDIA GeForce GTX 1050 Ti Mobile
AMD Radeon Pro 560X
NVIDIA Quadro RTX 3000 Max-Q
NVIDIA GeForce GTX 1650 Mobile
AMD Radeon RX 5300M
NVIDIA Quadro T2000 Max-Q
...
max:
NVIDIA Titan X Pascal
...
NVIDIA GeForce GTX 1050 Max-Q
AMD Radeon Pro 560X
NVIDIA GeForce GTX 1050 Ti Mobile
AMD Radeon RX 5300M
NVIDIA GeForce GTX 1650 Mobile
NVIDIA Quadro RTX 3000 Max-Q
NVIDIA Quadro T2000 Max-Q
...
max:
NVIDIA Titan RTX
...
NVIDIA GeForce GTX 1050 Ti Mobile
AMD Radeon RX 5300M
NVIDIA GeForce GTX 1650 Mobile
NVIDIA Quadro T2000 Max-Q
NVIDIA Quadro RTX 3000 Max-Q
...
max:
NVIDIA Titan RTX
NVIDIA GeForce GTX 1050 Max-Q
NVIDIA GeForce GTX 1050 Ti Mobile
NVIDIA GeForce GTX 1650 Mobile
NVIDIA Quadro RTX 3000 Max-Q
...
max:
NVIDIA Titan RTX
NVIDIA GeForce GTX 1050 Max-Q
NVIDIA GeForce GTX 1050 Ti Mobile
NVIDIA GeForce GTX 1650 Mobile
NVIDIA Quadro RTX 3000 Max-Q
...
max:
» With most tested laptops playable in detail settings ultra.
85 [X] Dell G5 15 5590-PCNJJ Intel Core i5-9300H 2.4GHz
GeForce GTX 1650 Mobile
min:
57 fps
94 [X] MSI GP75 Leopard 9SC Intel Core i7-9750H 2.6GHz
GeForce GTX 1650 Mobile
min:
59 fps
~ 90 fps
+ Compare
- Hide Comparison
...
NVIDIA Quadro RTX 3000 Max-Q
NVIDIA GeForce GTX 1050 Ti Mobile
AMD Radeon RX 5300M
NVIDIA GeForce GTX 1650 Mobile
NVIDIA GeForce GTX 1080 Mobile
NVIDIA Quadro RTX 5000 Max-Q
...
48 [X] Dell G5 15 5590-PCNJJ Intel Core i5-9300H 2.4GHz
GeForce GTX 1650 Mobile
min:
40 fps
54 [X] MSI GP75 Leopard 9SC Intel Core i7-9750H 2.6GHz
GeForce GTX 1650 Mobile
min:
40 fps
~ 51 fps
+ Compare
- Hide Comparison
...
AMD Radeon Pro 560X
NVIDIA GeForce GTX 1050 Max-Q
AMD Radeon RX Vega M GH
NVIDIA GeForce GTX 1050 Ti Mobile
NVIDIA GeForce GTX 1650 Mobile
NVIDIA Quadro RTX 3000 Max-Q
...
max:
NVIDIA Titan RTX
44 [X] Dell G5 15 5590-PCNJJ Intel Core i5-9300H 2.4GHz
GeForce GTX 1650 Mobile
min:
35 fps
49 [X] MSI GP75 Leopard 9SC Intel Core i7-9750H 2.6GHz
GeForce GTX 1650 Mobile
min:
35 fps
~ 47 fps
+ Compare
- Hide Comparison
...
NVIDIA GeForce GTX 1050 Max-Q
AMD Radeon RX Vega M GH
NVIDIA GeForce GTX 1050 Ti Mobile
AMD Radeon RX 5300M
NVIDIA GeForce GTX 1650 Mobile
NVIDIA Quadro RTX 3000 Max-Q
...
max:
NVIDIA Titan RTX
30 [X] Dell G5 15 5590-PCNJJ Intel Core i5-9300H 2.4GHz
GeForce GTX 1650 Mobile
min:
23 fps
37 [X] MSI GP75 Leopard 9SC Intel Core i7-9750H 2.6GHz
GeForce GTX 1650 Mobile
min:
24 fps
~ 34 fps
+ Compare
- Hide Comparison
...
AMD Radeon RX Vega M GH
AMD Radeon RX 5300M
NVIDIA GeForce GTX 1050 Ti Mobile
NVIDIA GeForce GTX 1650 Mobile
NVIDIA Quadro RTX 3000 Max-Q
...
max:
» With all tested laptops playable in detail settings high.
188 [X] Dell G5 15 5590-PCNJJ Intel Core i5-9300H 2.4GHz
GeForce GTX 1650 Mobile
218 [X] MSI GP75 Leopard 9SC Intel Core i7-9750H 2.6GHz
GeForce GTX 1650 Mobile
min:
175 fps
~ 203 fps
+ Compare
- Hide Comparison
...
AMD Radeon RX Vega M GH
NVIDIA Quadro P620
AMD Radeon RX 5300M
NVIDIA GeForce GTX 1050 Ti Mobile
NVIDIA GeForce GTX 1050 Max-Q
NVIDIA GeForce GTX 1650 Mobile
NVIDIA GeForce GTX 1080 Mobile
154 [X] Dell G5 15 5590-PCNJJ Intel Core i5-9300H 2.4GHz
GeForce GTX 1650 Mobile
179 [X] MSI GP75 Leopard 9SC Intel Core i7-9750H 2.6GHz
GeForce GTX 1650 Mobile
min:
130 fps
~ 167 fps
+ Compare
- Hide Comparison
...
NVIDIA Quadro P620
AMD Radeon RX Vega M GH
NVIDIA GeForce GTX 1050 Ti Mobile
NVIDIA GeForce GTX 1650 Mobile
AMD Radeon RX 5300M
NVIDIA GeForce GTX 1080 Mobile
...
max:
148 [X] Dell G5 15 5590-PCNJJ Intel Core i5-9300H 2.4GHz
GeForce GTX 1650 Mobile
174 [X] MSI GP75 Leopard 9SC Intel Core i7-9750H 2.6GHz
GeForce GTX 1650 Mobile
min:
128 fps
~ 161 fps
+ Compare
- Hide Comparison
...
NVIDIA Quadro P620
AMD Radeon RX Vega M GH
NVIDIA GeForce GTX 1050 Ti Mobile
AMD Radeon RX 5300M
NVIDIA GeForce GTX 1650 Mobile
NVIDIA GeForce GTX 1080 Mobile
NVIDIA GeForce RTX 2070 Super Max-Q
...
NVIDIA GeForce RTX 2070 Super Mobile
max:
137 [X] Dell G5 15 5590-PCNJJ Intel Core i5-9300H 2.4GHz
GeForce GTX 1650 Mobile
159 [X] MSI GP75 Leopard 9SC Intel Core i7-9750H 2.6GHz
GeForce GTX 1650 Mobile
min:
112 fps
~ 148 fps
+ Compare
- Hide Comparison
...
AMD Radeon Pro 560X
AMD Radeon RX Vega M GH
NVIDIA GeForce GTX 1050 Ti Mobile
NVIDIA GeForce GTX 1650 Mobile
AMD Radeon RX 5300M
NVIDIA GeForce GTX 1080 Mobile
...
NVIDIA GeForce RTX 2070 Super Mobile
max:
AMD Radeon RX 5700 (Desktop)
...
AMD Radeon Pro 560X
NVIDIA GeForce GTX 1050 Ti Mobile
AMD Radeon RX Vega M GH
NVIDIA GeForce GTX 1650 Mobile
NVIDIA GeForce GTX 1080 Mobile
NVIDIA GeForce RTX 2070 Super Max-Q
...
AMD Radeon Pro 560X
NVIDIA GeForce GTX 1050 Max-Q
NVIDIA GeForce GTX 1050 Ti Mobile
AMD Radeon RX Vega M GH
NVIDIA GeForce GTX 1650 Mobile
NVIDIA GeForce GTX 1080 Mobile
...
max:
» With all tested laptops playable in detail settings ultra.
80.9 [X] SCHENKER XMG Core 14 Intel Core i5-1135G7 2.4GHz
GeForce GTX 1650 Mobile
98.9 [X] Dell G5 15 5590-PCNJJ Intel Core i5-9300H 2.4GHz
GeForce GTX 1650 Mobile
102.8 [X] Acer Aspire 7 A715-74G-50U5 Intel Core i5-9300H 2.4GHz
GeForce GTX 1650 Mobile
115.7 [X] Lenovo IdeaPad Gaming 3i 15IMH05 Intel Core i5-10300H 2.5GHz
GeForce GTX 1650 Mobile
124 [X] MSI GP75 Leopard 9SC Intel Core i7-9750H 2.6GHz
GeForce GTX 1650 Mobile
~ 104 fps
+ Compare
- Hide Comparison
...
AMD Radeon RX 5300M
NVIDIA GeForce GTX 1650 Mobile
NVIDIA GeForce GTX 1080 Mobile
...
max:
50.5 [X] SCHENKER XMG Core 14 Intel Core i5-1135G7 2.4GHz
GeForce GTX 1650 Mobile
58.3 [X] Dell G5 15 5590-PCNJJ Intel Core i5-9300H 2.4GHz
GeForce GTX 1650 Mobile
60.1 [X] Lenovo IdeaPad Gaming 3i 15IMH05 Intel Core i5-10300H 2.5GHz
GeForce GTX 1650 Mobile
63.1 [X] Acer Aspire 7 A715-74G-50U5 Intel Core i5-9300H 2.4GHz
GeForce GTX 1650 Mobile
64.3 [X] MSI GP75 Leopard 9SC Intel Core i7-9750H 2.6GHz
GeForce GTX 1650 Mobile
~ 59 fps
+ Compare
- Hide Comparison
...
Apple M1 Pro 16-Core GPU
AMD Radeon RX Vega M GH
Apple M1 Max 32-Core GPU
NVIDIA Quadro T2000 Max-Q
NVIDIA GeForce GTX 1650 Mobile
AMD Radeon RX 5300M
...
max:
35.7 [X] SCHENKER XMG Core 14 Intel Core i5-1135G7 2.4GHz
GeForce GTX 1650 Mobile
39 [X] Dell G5 15 5590-PCNJJ Intel Core i5-9300H 2.4GHz
GeForce GTX 1650 Mobile
39.2 [X] Lenovo IdeaPad Gaming 3i 15IMH05 Intel Core i5-10300H 2.5GHz
GeForce GTX 1650 Mobile
40.9 [X] Acer Aspire 7 A715-74G-50U5 Intel Core i5-9300H 2.4GHz
GeForce GTX 1650 Mobile
41 [X] MSI GP75 Leopard 9SC Intel Core i7-9750H 2.6GHz
GeForce GTX 1650 Mobile
~ 39 fps
+ Compare
- Hide Comparison
Intel UHD Graphics Xe 16EUs (Tiger Lake-H)
...
AMD Radeon RX Vega M GH
Apple M1 Pro 14-Core GPU
Apple M1 Pro 16-Core GPU
NVIDIA Quadro T2000 Max-Q
NVIDIA GeForce GTX 1650 Mobile
Apple M1 Max 24-Core GPU
AMD Radeon RX 5300M
...
max:
29 [X] SCHENKER XMG Core 14 Intel Core i5-1135G7 2.4GHz
GeForce GTX 1650 Mobile
29.5 [X] Dell G5 15 5590-PCNJJ Intel Core i5-9300H 2.4GHz
GeForce GTX 1650 Mobile
30.7 [X] MSI GP75 Leopard 9SC Intel Core i7-9750H 2.6GHz
GeForce GTX 1650 Mobile
30.8 [X] Acer Aspire 7 A715-74G-50U5 Intel Core i5-9300H 2.4GHz
GeForce GTX 1650 Mobile
34.6 [X] Lenovo IdeaPad Gaming 3i 15IMH05 Intel Core i5-10300H 2.5GHz
GeForce GTX 1650 Mobile
~ 31 fps
+ Compare
- Hide Comparison
Intel Iris Plus Graphics G4 (Ice Lake 48 EU)
...
Apple M1 Pro 16-Core GPU
NVIDIA Quadro T2000 Max-Q
NVIDIA GeForce GTX 1650 Mobile
AMD Radeon RX 5300M
Apple M1 Max 24-Core GPU
...
max:
...
AMD Radeon Pro 560X
NVIDIA GeForce GTX 1050 Max-Q
AMD Radeon 680M
NVIDIA GeForce GTX 1050 Ti Mobile
AMD Radeon RX Vega M GH
NVIDIA GeForce GTX 1650 Mobile
Apple M1 Max 32-Core GPU
...
max:
NVIDIA GeForce GTX 1050 Ti Mobile
AMD Radeon Pro 560X
NVIDIA GeForce GTX 1050 Max-Q
NVIDIA GeForce GTX 1650 Mobile
AMD Radeon RX Vega M GH
AMD Radeon 680M
...
max:
» With all tested laptops playable in detail settings high.
Additional Benchmarks
Very Low Overall Quality (DX11) 1920x1080
87.2 [X] Lenovo IdeaPad Gaming 3i 15IMH05 Intel Core i5-10300H 2.5GHz
GeForce GTX 1650 Mobile
126.7 [X] Lenovo Ideapad L340-17IRH 81LL001YGE Intel Core i5-9300H 2.4GHz
GeForce GTX 1650 Mobile
129 [X] Dell G5 15 5590-PCNJJ Intel Core i5-9300H 2.4GHz
GeForce GTX 1650 Mobile
min:
111 fps
138.5 [X] Lenovo IdeaPad Gaming 3i 15IMH05 Intel Core i5-10300H 2.5GHz
GeForce GTX 1650 Mobile
143 [X] MSI GP75 Leopard 9SC Intel Core i7-9750H 2.6GHz
GeForce GTX 1650 Mobile
min:
127 fps
143.3 [X] Acer Aspire 7 A715-74G-50U5 Intel Core i5-9300H 2.4GHz
GeForce GTX 1650 Mobile
~ 136 fps
+ Compare
- Hide Comparison
...
NVIDIA GeForce GTX 1050 Ti Mobile
AMD Radeon RX Vega M GH
NVIDIA Quadro T2000 Max-Q
AMD Radeon RX 5300M
NVIDIA GeForce GTX 1650 Mobile
...
max:
44.2 [X] Dell G5 15 5590-PCNJJ Intel Core i5-9300H 2.4GHz
GeForce GTX 1650 Mobile
min:
38 fps
45.2 [X] Lenovo Ideapad L340-17IRH 81LL001YGE Intel Core i5-9300H 2.4GHz
GeForce GTX 1650 Mobile
45.5 [X] Acer Aspire 7 A715-74G-50U5 Intel Core i5-9300H 2.4GHz
GeForce GTX 1650 Mobile
45.7 [X] MSI GP75 Leopard 9SC Intel Core i7-9750H 2.6GHz
GeForce GTX 1650 Mobile
min:
39 fps
46 [X] Lenovo IdeaPad Gaming 3i 15IMH05 Intel Core i5-10300H 2.5GHz
GeForce GTX 1650 Mobile
~ 45 fps
+ Compare
- Hide Comparison
...
NVIDIA GeForce GTX 1050 Ti Mobile
AMD Radeon RX Vega M GH
NVIDIA Quadro T2000 Max-Q
AMD Radeon RX 5300M
NVIDIA GeForce GTX 1650 Mobile
...
max:
32.1 [X] Dell G5 15 5590-PCNJJ Intel Core i5-9300H 2.4GHz
GeForce GTX 1650 Mobile
min:
27 fps
33.2 [X] Acer Aspire 7 A715-74G-50U5 Intel Core i5-9300H 2.4GHz
GeForce GTX 1650 Mobile
33.4 [X] MSI GP75 Leopard 9SC Intel Core i7-9750H 2.6GHz
GeForce GTX 1650 Mobile
min:
28 fps
33.4 [X] Lenovo Ideapad L340-17IRH 81LL001YGE Intel Core i5-9300H 2.4GHz
GeForce GTX 1650 Mobile
33.5 [X] Lenovo IdeaPad Gaming 3i 15IMH05 Intel Core i5-10300H 2.5GHz
GeForce GTX 1650 Mobile
~ 33 fps
+ Compare
- Hide Comparison
...
NVIDIA GeForce GTX 1050 Ti Mobile
AMD Radeon RX Vega M GH
NVIDIA Quadro T2000 Max-Q
AMD Radeon RX 5300M
NVIDIA GeForce GTX 1650 Mobile
...
max:
NVIDIA GeForce GTX 1050 Max-Q
NVIDIA GeForce GTX 1050 Ti Mobile
AMD Radeon 680M
AMD Radeon RX Vega M GH
NVIDIA GeForce GTX 1650 Mobile
NVIDIA GeForce GTX 1080 Mobile
...
max:
NVIDIA GeForce GTX 1050 Ti Mobile
NVIDIA GeForce GTX 1050 Max-Q
AMD Radeon 680M
NVIDIA GeForce GTX 1650 Mobile
NVIDIA GeForce GTX 1080 Mobile
...
max:
» With all tested laptops playable in detail settings med..
111 [X] Lenovo Ideapad L340-17IRH 81LL001YGE Intel Core i5-9300H 2.4GHz
GeForce GTX 1650 Mobile
128 [X] HP Omen 15-dc1020ng Intel Core i5-9300H 2.4GHz
GeForce GTX 1650 Mobile
163 [X] HP Omen 15-dc1020ng Dual-Channel-Modus
Intel Core i5-9300H 2.4GHz
GeForce GTX 1650 Mobile
172 [X] Dell G5 15 5590-PCNJJ Intel Core i5-9300H 2.4GHz
GeForce GTX 1650 Mobile
min:
138 fps
194 [X] MSI GP75 Leopard 9SC Intel Core i7-9750H 2.6GHz
GeForce GTX 1650 Mobile
min:
147 fps
~ 154 fps
+ Compare
- Hide Comparison
...
AMD Radeon Pro 560X
AMD Radeon RX Vega M GH
NVIDIA GeForce GTX 1050 Max-Q
NVIDIA Quadro RTX 5000 Max-Q
NVIDIA GeForce GTX 1650 Mobile
NVIDIA GeForce GTX 1050 Ti Mobile
AMD Radeon RX 5300M
...
max:
NVIDIA GeForce GTX 1660 Super (Desktop)
84 [X] Lenovo Ideapad L340-17IRH 81LL001YGE Intel Core i5-9300H 2.4GHz
GeForce GTX 1650 Mobile
97 [X] HP Omen 15-dc1020ng Intel Core i5-9300H 2.4GHz
GeForce GTX 1650 Mobile
102 [X] Dell G5 15 5590-PCNJJ Intel Core i5-9300H 2.4GHz
GeForce GTX 1650 Mobile
min:
93 fps
107 [X] MSI GP75 Leopard 9SC Intel Core i7-9750H 2.6GHz
GeForce GTX 1650 Mobile
min:
86 fps
111 [X] HP Omen 15-dc1020ng Dual-Channel-Modus
Intel Core i5-9300H 2.4GHz
GeForce GTX 1650 Mobile
~ 100 fps
+ Compare
- Hide Comparison
...
NVIDIA GeForce GTX 1050 Ti Mobile
AMD Radeon RX Vega M GH
NVIDIA GeForce GTX 1650 Mobile
AMD Radeon RX 5300M
NVIDIA Quadro RTX 5000 Max-Q
...
70 [X] Lenovo Ideapad L340-17IRH 81LL001YGE Intel Core i5-9300H 2.4GHz
GeForce GTX 1650 Mobile
74 [X] HP Omen 15-dc1020ng Intel Core i5-9300H 2.4GHz
GeForce GTX 1650 Mobile
84 [X] MSI GP75 Leopard 9SC Intel Core i7-9750H 2.6GHz
GeForce GTX 1650 Mobile
min:
74 fps
85 [X] Dell G5 15 5590-PCNJJ Intel Core i5-9300H 2.4GHz
GeForce GTX 1650 Mobile
min:
63 fps
92 [X] HP Omen 15-dc1020ng Dual-Channel-Modus
Intel Core i5-9300H 2.4GHz
GeForce GTX 1650 Mobile
~ 81 fps
+ Compare
- Hide Comparison
...
NVIDIA GeForce GTX 1050 Ti Mobile
AMD Radeon RX Vega M GH
NVIDIA GeForce GTX 1650 Mobile
AMD Radeon RX 5300M
NVIDIA Quadro RTX 5000 Max-Q
...
59 [X] Lenovo Ideapad L340-17IRH 81LL001YGE Intel Core i5-9300H 2.4GHz
GeForce GTX 1650 Mobile
59 [X] Dell G5 15 5590-PCNJJ Intel Core i5-9300H 2.4GHz
GeForce GTX 1650 Mobile
min:
53 fps
60 [X] HP Omen 15-dc1020ng Intel Core i5-9300H 2.4GHz
GeForce GTX 1650 Mobile
63 [X] HP Omen 15-dc1020ng Dual-Channel-Modus
Intel Core i5-9300H 2.4GHz
GeForce GTX 1650 Mobile
65 [X] MSI GP75 Leopard 9SC Intel Core i7-9750H 2.6GHz
GeForce GTX 1650 Mobile
min:
60 fps
~ 61 fps
+ Compare
- Hide Comparison
...
AMD Radeon Pro 560X
NVIDIA GeForce GTX 1050 Ti Mobile
NVIDIA GeForce GTX 1050 Max-Q
AMD Radeon RX Vega M GH
NVIDIA GeForce GTX 1650 Mobile
AMD Radeon RX 5300M
...
NVIDIA GeForce RTX 2070 Super Mobile
AMD Radeon Pro 560X
NVIDIA GeForce GTX 1050 Ti Mobile
NVIDIA GeForce GTX 1050 Max-Q
AMD Radeon RX Vega M GH
NVIDIA GeForce GTX 1650 Mobile
NVIDIA GeForce GTX 1080 Mobile
NVIDIA Quadro RTX 5000 Max-Q
...
NVIDIA GeForce GTX 1050 Ti Mobile
NVIDIA GeForce GTX 1050 Max-Q
AMD Radeon RX Vega M GH
NVIDIA GeForce GTX 1650 Mobile
NVIDIA GeForce GTX 1080 Mobile
NVIDIA Quadro RTX 5000 Max-Q
...
NVIDIA GeForce RTX 2080 Super Mobile
max:
NVIDIA Titan RTX
» With all tested laptops playable in detail settings ultra.
114.8 [X] Lenovo Ideapad L340-17IRH 81LL001YGE Intel Core i5-9300H 2.4GHz
GeForce GTX 1650 Mobile
min:
68 fps, max:
173 fps
162.9 164.5 [X] Acer Aspire 7 A715-74G-50U5 Intel Core i5-9300H 2.4GHz
GeForce GTX 1650 Mobile
min:
105 fps, max:
209 fps
166 [X] Dell G5 15 5590-PCNJJ Intel Core i5-9300H 2.4GHz
GeForce GTX 1650 Mobile
~ 152 fps
+ Compare
- Hide Comparison
...
NVIDIA GeForce GTX 1050 Max-Q
NVIDIA Quadro T2000 Max-Q
AMD Radeon RX Vega M GH
NVIDIA GeForce GTX 1650 Mobile
Apple M1 Pro 14-Core GPU
Apple M1 Max 24-Core GPU
...
max:
57.7 [X] Lenovo Ideapad L340-17IRH 81LL001YGE Intel Core i5-9300H 2.4GHz
GeForce GTX 1650 Mobile
min:
41 fps, max:
73 fps
63.9 [X] Dell G5 15 5590-PCNJJ Intel Core i5-9300H 2.4GHz
GeForce GTX 1650 Mobile
65.5 68 [X] Acer Aspire 7 A715-74G-50U5 Intel Core i5-9300H 2.4GHz
GeForce GTX 1650 Mobile
min:
57 fps, max:
80 fps
~ 64 fps
+ Compare
- Hide Comparison
...
AMD Radeon 680M
Apple M1 Pro 14-Core GPU
NVIDIA Quadro T2000 Max-Q
NVIDIA GeForce GTX 1650 Mobile
Apple M1 Pro 16-Core GPU
...
max:
38.5 [X] Dell G5 15 5590-PCNJJ Intel Core i5-9300H 2.4GHz
GeForce GTX 1650 Mobile
min:
34 fps
38.9 [X] Lenovo Ideapad L340-17IRH 81LL001YGE Intel Core i5-9300H 2.4GHz
GeForce GTX 1650 Mobile
min:
29 fps, max:
48 fps
39.9 40.4 [X] Acer Aspire 7 A715-74G-50U5 Intel Core i5-9300H 2.4GHz
GeForce GTX 1650 Mobile
min:
24 fps, max:
49 fps
~ 39 fps
+ Compare
- Hide Comparison
...
Apple M2 10-Core GPU
AMD Radeon RX Vega M GH
Apple M1 Pro 14-Core GPU
NVIDIA Quadro T2000 Max-Q
NVIDIA GeForce GTX 1650 Mobile
Apple M1 Pro 16-Core GPU
AMD Radeon 680M
...
max:
24.4 [X] Dell G5 15 5590-PCNJJ Intel Core i5-9300H 2.4GHz
GeForce GTX 1650 Mobile
min:
17 fps
26.1 [X] Lenovo Ideapad L340-17IRH 81LL001YGE Intel Core i5-9300H 2.4GHz
GeForce GTX 1650 Mobile
min:
23 fps, max:
32 fps
26.6 26.9 [X] Acer Aspire 7 A715-74G-50U5 Intel Core i5-9300H 2.4GHz
GeForce GTX 1650 Mobile
min:
14 fps, max:
32 fps
~ 26 fps
+ Compare
- Hide Comparison
...
NVIDIA GeForce GTX 1050 Max-Q
Apple M2 10-Core GPU
AMD Radeon RX Vega M GH
NVIDIA Quadro T2000 Max-Q
NVIDIA GeForce GTX 1650 Mobile
Apple M1 Pro 14-Core GPU
Apple M1 Pro 16-Core GPU
...
max:
» With all tested laptops playable in detail settings high.
117 [X] HP Omen 15-dc1020ng Intel Core i5-9300H 2.4GHz
GeForce GTX 1650 Mobile
117 [X] Dell G5 15 5590-PCNJJ Intel Core i5-9300H 2.4GHz
GeForce GTX 1650 Mobile
123.1 [X] HP Omen 15-dc1020ng Dual-Channel-Modus
Intel Core i5-9300H 2.4GHz
GeForce GTX 1650 Mobile
~ 119 fps
+ Compare
- Hide Comparison
...
AMD Radeon Pro 560X
NVIDIA GeForce GTX 1050 Max-Q
NVIDIA GeForce GTX 1050 Ti Mobile
AMD Radeon RX Vega M GH
NVIDIA GeForce GTX 1650 Mobile
AMD Radeon RX 5300M
...
max:
54.5 [X] Dell G5 15 5590-PCNJJ Intel Core i5-9300H 2.4GHz
GeForce GTX 1650 Mobile
55.8 [X] HP Omen 15-dc1020ng Dual-Channel-Modus
Intel Core i5-9300H 2.4GHz
GeForce GTX 1650 Mobile
97 [X] HP Omen 15-dc1020ng Intel Core i5-9300H 2.4GHz
GeForce GTX 1650 Mobile
~ 69 fps
+ Compare
- Hide Comparison
...
AMD Radeon RX Vega M GH
AMD Radeon RX 5300M
NVIDIA GeForce GTX 1650 Mobile
NVIDIA GeForce GTX 1080 Mobile
...
max:
46 [X] Dell G5 15 5590-PCNJJ Intel Core i5-9300H 2.4GHz
GeForce GTX 1650 Mobile
47.2 [X] HP Omen 15-dc1020ng Dual-Channel-Modus
Intel Core i5-9300H 2.4GHz
GeForce GTX 1650 Mobile
74 [X] HP Omen 15-dc1020ng Intel Core i5-9300H 2.4GHz
GeForce GTX 1650 Mobile
~ 56 fps
+ Compare
- Hide Comparison
...
NVIDIA GeForce GTX 1050 Ti Mobile
AMD Radeon RX Vega M GH
NVIDIA GeForce GTX 1650 Mobile
NVIDIA GeForce GTX 1080 Mobile
...
max:
45.1 [X] Dell G5 15 5590-PCNJJ Intel Core i5-9300H 2.4GHz
GeForce GTX 1650 Mobile
46.4 [X] HP Omen 15-dc1020ng Dual-Channel-Modus
Intel Core i5-9300H 2.4GHz
GeForce GTX 1650 Mobile
60 [X] HP Omen 15-dc1020ng Intel Core i5-9300H 2.4GHz
GeForce GTX 1650 Mobile
~ 51 fps
+ Compare
- Hide Comparison
...
NVIDIA GeForce GTX 1050 Max-Q
NVIDIA GeForce GTX 1050 Ti Mobile
AMD Radeon RX 5300M
AMD Radeon RX Vega M GH
NVIDIA GeForce GTX 1650 Mobile
...
max:
» With all tested laptops playable in detail settings ultra.
49.2 [X] Asus TUF FX705DT-AU068T AMD Ryzen 5 3550H 2.1GHz
GeForce GTX 1650 Mobile
53.8 [X] Lenovo IdeaPad L340-15IRH 81LK00BMGE Intel Core i5-9300H 2.4GHz
GeForce GTX 1650 Mobile
63.1 [X] Asus TUF FX705DT-AU068T Dual-Channel
AMD Ryzen 5 3550H 2.1GHz
GeForce GTX 1650 Mobile
74.9 [X] Dell G5 15 5590-PCNJJ Intel Core i5-9300H 2.4GHz
GeForce GTX 1650 Mobile
min:
69 fps
~ 60 fps
+ Compare
- Hide Comparison
...
NVIDIA GeForce GTX 950M
NVIDIA GeForce GTX 960M
AMD Radeon RX Vega 7
NVIDIA GeForce GTX 1650 Mobile
NVIDIA Quadro P520
...
max:
43.3 [X] Lenovo IdeaPad L340-15IRH 81LK00BMGE Intel Core i5-9300H 2.4GHz
GeForce GTX 1650 Mobile
45.2 [X] Asus TUF FX705DT-AU068T AMD Ryzen 5 3550H 2.1GHz
GeForce GTX 1650 Mobile
60.8 [X] Asus TUF FX705DT-AU068T Dual-Channel
AMD Ryzen 5 3550H 2.1GHz
GeForce GTX 1650 Mobile
64.5 [X] Dell G5 15 5590-PCNJJ Intel Core i5-9300H 2.4GHz
GeForce GTX 1650 Mobile
min:
55 fps
69.8 [X] Acer Nitro 5 Intel Core i5-9300H 2.4GHz
GeForce GTX 1650 Mobile
min:
60 fps
~ 57 fps
+ Compare
- Hide Comparison
...
Intel Iris Xe MAX Graphics
AMD Radeon Pro 560X
NVIDIA GeForce GTX 1050 Max-Q
NVIDIA GeForce GTX 1650 Mobile
AMD Radeon RX 5300M
...
max:
34 [X] Lenovo IdeaPad L340-15IRH 81LK00BMGE Intel Core i5-9300H 2.4GHz
GeForce GTX 1650 Mobile
38 [X] Asus TUF FX705DT-AU068T AMD Ryzen 5 3550H 2.1GHz
GeForce GTX 1650 Mobile
40.1 [X] Dell G5 15 5590-PCNJJ Intel Core i5-9300H 2.4GHz
GeForce GTX 1650 Mobile
min:
36 fps
42.4 [X] Asus TUF FX705DT-AU068T Dual-Channel
AMD Ryzen 5 3550H 2.1GHz
GeForce GTX 1650 Mobile
44.7 [X] Acer Nitro 5 Intel Core i5-9300H 2.4GHz
GeForce GTX 1650 Mobile
min:
42 fps
~ 40 fps
+ Compare
- Hide Comparison
...
NVIDIA GeForce GTX 1050 Max-Q
NVIDIA GeForce GTX 1050 Ti Mobile
AMD Radeon RX 5300M
NVIDIA GeForce GTX 1650 Mobile
...
max:
17.4 [X] Lenovo IdeaPad L340-15IRH 81LK00BMGE Intel Core i5-9300H 2.4GHz
GeForce GTX 1650 Mobile
19.2 [X] Acer Nitro 5 Intel Core i5-9300H 2.4GHz
GeForce GTX 1650 Mobile
min:
16 fps
19.4 [X] Dell G5 15 5590-PCNJJ Intel Core i5-9300H 2.4GHz
GeForce GTX 1650 Mobile
min:
16 fps
21.7 [X] Asus TUF FX705DT-AU068T AMD Ryzen 5 3550H 2.1GHz
GeForce GTX 1650 Mobile
22.7 [X] Asus TUF FX705DT-AU068T Dual-Channel
AMD Ryzen 5 3550H 2.1GHz
GeForce GTX 1650 Mobile
~ 20 fps
+ Compare
- Hide Comparison
...
Intel Iris Xe MAX Graphics
NVIDIA GeForce GTX 1050 Max-Q
NVIDIA GeForce GTX 1050 Ti Mobile
NVIDIA GeForce GTX 1650 Mobile
AMD Radeon RX 5300M
...
max:
NVIDIA GeForce GTX 1050 Max-Q
NVIDIA GeForce GTX 1050 Ti Mobile
NVIDIA GeForce GTX 1650 Mobile
NVIDIA Quadro RTX 5000 Max-Q
...
max:
NVIDIA GeForce GTX 1050 Ti Mobile
NVIDIA GeForce GTX 1050 Max-Q
NVIDIA GeForce GTX 1650 Mobile
...
max:
» With most tested laptops playable in detail settings high.
81 [X] Asus TUF FX705DT-AU068T AMD Ryzen 5 3550H 2.1GHz
GeForce GTX 1650 Mobile
114 [X] Dell G5 15 5590-PCNJJ Intel Core i5-9300H 2.4GHz
GeForce GTX 1650 Mobile
~ 98 fps
+ Compare
- Hide Comparison
...
AMD Radeon RX 560X (Laptop)
NVIDIA GeForce GTX 1050 Max-Q
AMD Radeon 680M
NVIDIA GeForce GTX 1650 Mobile
AMD Radeon Pro 560X
NVIDIA GeForce GTX 1050 Ti Mobile
NVIDIA Quadro RTX 3000 Max-Q
AMD Radeon RX 5300M
...
max:
AMD Radeon RX 6700 XT
54 [X] Asus TUF FX705DT-AU068T AMD Ryzen 5 3550H 2.1GHz
GeForce GTX 1650 Mobile
63 [X] Dell G5 15 5590-PCNJJ Intel Core i5-9300H 2.4GHz
GeForce GTX 1650 Mobile
74 [X] Acer Nitro 5 Intel Core i5-9300H 2.4GHz
GeForce GTX 1650 Mobile
~ 64 fps
+ Compare
- Hide Comparison
...
NVIDIA GeForce GTX 1050 Ti Mobile
AMD Radeon RX Vega M GH
NVIDIA GeForce GTX 1650 Mobile
AMD Radeon RX 5300M
NVIDIA Quadro RTX 3000 Max-Q
...
max:
46 [X] Asus TUF FX705DT-AU068T AMD Ryzen 5 3550H 2.1GHz
GeForce GTX 1650 Mobile
50 [X] Dell G5 15 5590-PCNJJ Intel Core i5-9300H 2.4GHz
GeForce GTX 1650 Mobile
57 [X] Acer Nitro 5 Intel Core i5-9300H 2.4GHz
GeForce GTX 1650 Mobile
~ 51 fps
+ Compare
- Hide Comparison
...
AMD Radeon RX Vega M GH
NVIDIA GeForce GTX 1650 Mobile
AMD Radeon RX 5300M
NVIDIA Quadro RTX 3000 Max-Q
...
max:
35 [X] Asus TUF FX705DT-AU068T AMD Ryzen 5 3550H 2.1GHz
GeForce GTX 1650 Mobile
37 [X] Dell G5 15 5590-PCNJJ Intel Core i5-9300H 2.4GHz
GeForce GTX 1650 Mobile
43 [X] Acer Nitro 5 Intel Core i5-9300H 2.4GHz
GeForce GTX 1650 Mobile
~ 38 fps
+ Compare
- Hide Comparison
...
NVIDIA GeForce GTX 1050 Ti Mobile
AMD Radeon RX Vega M GH
NVIDIA GeForce GTX 1650 Mobile
AMD Radeon RX 5300M
NVIDIA Quadro RTX 3000 Max-Q
...
max:
NVIDIA GeForce GTX 1050 Max-Q
NVIDIA GeForce GTX 1050 Ti Mobile
NVIDIA GeForce GTX 1650 Mobile
NVIDIA Quadro RTX 3000 Max-Q
NVIDIA Quadro RTX 4000 (Laptop)
NVIDIA Quadro RTX 5000 Max-Q
...
max:
...
NVIDIA GeForce GTX 1050 Max-Q
NVIDIA GeForce GTX 1050 Ti Mobile
AMD Radeon RX Vega M GH
NVIDIA GeForce GTX 1650 Mobile
NVIDIA Quadro RTX 3000 Max-Q
NVIDIA Quadro RTX 4000 (Laptop)
...
max:
» With most tested laptops playable in detail settings ultra.
145.7 [X] Asus TUF FX705DT-AU068T AMD Ryzen 5 3550H 2.1GHz
GeForce GTX 1650 Mobile
203 [X] Dell G5 15 5590-PCNJJ Intel Core i5-9300H 2.4GHz
GeForce GTX 1650 Mobile
min:
169 fps
~ 174 fps
+ Compare
- Hide Comparison
...
AMD Radeon Pro 560X
NVIDIA GeForce GTX 1050 Max-Q
AMD Radeon RX 560X (Laptop)
AMD Radeon RX Vega M GH
NVIDIA GeForce GTX 1650 Mobile
AMD Radeon RX 5300M
NVIDIA Quadro RTX 3000 Max-Q
NVIDIA GeForce GTX 1080 Mobile
...
max:
NVIDIA GeForce GTX 1660 Super (Desktop)
81.4 [X] Asus TUF FX705DT-AU068T AMD Ryzen 5 3550H 2.1GHz
GeForce GTX 1650 Mobile
89.3 [X] Dell G5 15 5590-PCNJJ Intel Core i5-9300H 2.4GHz
GeForce GTX 1650 Mobile
min:
76 fps
99.8 [X] Acer Nitro 5 Intel Core i5-9300H 2.4GHz
GeForce GTX 1650 Mobile
min:
90 fps
~ 90 fps
+ Compare
- Hide Comparison
...
NVIDIA GeForce GTX 1050 Ti Mobile
AMD Radeon RX 560X (Laptop)
AMD Radeon RX Vega M GH
NVIDIA Quadro T2000 Max-Q
NVIDIA GeForce GTX 1650 Mobile
AMD Radeon RX 5300M
NVIDIA GeForce GTX 1080 Mobile
...
NVIDIA GeForce RTX 2070 Super Mobile
max:
68.9 [X] Asus TUF FX705DT-AU068T AMD Ryzen 5 3550H 2.1GHz
GeForce GTX 1650 Mobile
71 [X] Dell G5 15 5590-PCNJJ Intel Core i5-9300H 2.4GHz
GeForce GTX 1650 Mobile
min:
53 fps
77.1 [X] Acer Nitro 5 Intel Core i5-9300H 2.4GHz
GeForce GTX 1650 Mobile
min:
66 fps
~ 72 fps
+ Compare
- Hide Comparison
...
AMD Radeon RX 560X (Laptop)
AMD Radeon RX Vega M GH
NVIDIA Quadro T2000 Max-Q
NVIDIA GeForce GTX 1650 Mobile
AMD Radeon RX 5300M
NVIDIA GeForce GTX 1080 Mobile
NVIDIA Quadro RTX 3000 Max-Q
...
41.8 [X] Dell G5 15 5590-PCNJJ Intel Core i5-9300H 2.4GHz
GeForce GTX 1650 Mobile
min:
33 fps
42.1 [X] Asus TUF FX705DT-AU068T AMD Ryzen 5 3550H 2.1GHz
GeForce GTX 1650 Mobile
44.1 [X] Acer Nitro 5 Intel Core i5-9300H 2.4GHz
GeForce GTX 1650 Mobile
min:
38 fps
~ 43 fps
+ Compare
- Hide Comparison
Intel Iris Plus Graphics G4 (Ice Lake 48 EU)
...
AMD Radeon RX 560X (Laptop)
AMD Radeon RX Vega M GH
NVIDIA Quadro T2000 Max-Q
NVIDIA GeForce GTX 1650 Mobile
AMD Radeon RX 5300M
...
max:
NVIDIA GeForce GTX 1050 Max-Q
NVIDIA GeForce GTX 1050 Ti Mobile
NVIDIA GeForce GTX 1650 Mobile
NVIDIA Quadro RTX 3000 Max-Q
NVIDIA GeForce GTX 1080 Mobile
...
max:
» With all tested laptops playable in detail settings ultra.
43.9 [X] Lenovo Ideapad L340-17IRH 81LL001YGE Intel Core i5-9300H 2.4GHz
GeForce GTX 1650 Mobile
62.7 [X] Dell G5 15 5590-PCNJJ Intel Core i5-9300H 2.4GHz
GeForce GTX 1650 Mobile
min:
51 fps
~ 53 fps
+ Compare
- Hide Comparison
...
NVIDIA GeForce GTX 960M
AMD Radeon RX 560X (Laptop)
NVIDIA GeForce GTX 1650 Mobile
NVIDIA GeForce GTX 1050 Max-Q
AMD Radeon Pro 560X
NVIDIA GeForce GTX 1050 Ti Max-Q
NVIDIA GeForce GTX 1050 Ti Mobile
...
max:
33.4 [X] Lenovo Ideapad L340-17IRH 81LL001YGE Intel Core i5-9300H 2.4GHz
GeForce GTX 1650 Mobile
56.8 [X] Dell G5 15 5590-PCNJJ Intel Core i5-9300H 2.4GHz
GeForce GTX 1650 Mobile
min:
42 fps
61 [X] Acer Nitro 5 Intel Core i5-9300H 2.4GHz
GeForce GTX 1650 Mobile
min:
51 fps
~ 50 fps
+ Compare
- Hide Comparison
...
AMD Radeon Pro 560X
AMD Radeon RX 560X (Laptop)
NVIDIA GeForce GTX 1050 Ti Mobile
NVIDIA GeForce GTX 1050 Ti Max-Q
NVIDIA GeForce GTX 1650 Mobile
...
34.2 [X] Lenovo Ideapad L340-17IRH 81LL001YGE Intel Core i5-9300H 2.4GHz
GeForce GTX 1650 Mobile
47.3 [X] Dell G5 15 5590-PCNJJ Intel Core i5-9300H 2.4GHz
GeForce GTX 1650 Mobile
min:
40 fps
53.6 [X] Acer Nitro 5 Intel Core i5-9300H 2.4GHz
GeForce GTX 1650 Mobile
min:
43 fps
~ 45 fps
+ Compare
- Hide Comparison
AMD Radeon RX Vega 6 (Ryzen 2000/3000)
...
NVIDIA GeForce GTX 1050 Ti Mobile
AMD Radeon RX 560X (Laptop)
NVIDIA GeForce GTX 1050 Ti Max-Q
NVIDIA GeForce GTX 1650 Mobile
...
max:
29.1 [X] Lenovo Ideapad L340-17IRH 81LL001YGE Intel Core i5-9300H 2.4GHz
GeForce GTX 1650 Mobile
44.9 [X] Dell G5 15 5590-PCNJJ Intel Core i5-9300H 2.4GHz
GeForce GTX 1650 Mobile
min:
36 fps
46.2 [X] Acer Nitro 5 Intel Core i5-9300H 2.4GHz
GeForce GTX 1650 Mobile
min:
39 fps
~ 40 fps
+ Compare
- Hide Comparison
AMD Radeon RX Vega 8 (Ryzen 2000/3000)
...
AMD Radeon Pro 560X
NVIDIA GeForce GTX 1050 Ti Mobile
AMD Radeon RX 560X (Laptop)
NVIDIA GeForce GTX 1050 Ti Max-Q
NVIDIA GeForce GTX 1650 Mobile
...
max:
NVIDIA GeForce GTX 1050 Max-Q
NVIDIA GeForce GTX 1050 Ti Mobile
NVIDIA GeForce GTX 1650 Mobile
NVIDIA GeForce GTX 1080 Mobile
max:
NVIDIA GeForce GTX 1050 Ti Mobile
NVIDIA GeForce GTX 1050 Max-Q
NVIDIA GeForce GTX 1050 Ti Max-Q
NVIDIA GeForce GTX 1650 Mobile
NVIDIA GeForce GTX 1080 Mobile
max:
NVIDIA Titan RTX
» With most tested laptops playable in detail settings ultra.
59 [X] Asus TUF FX705DT-AU068T AMD Ryzen 5 3550H 2.1GHz
GeForce GTX 1650 Mobile
60 [X] HP Omen 15-dc1020ng Intel Core i5-9300H 2.4GHz
GeForce GTX 1650 Mobile
73 [X] Asus TUF FX705DT-AU068T Dual-Channel
AMD Ryzen 5 3550H 2.1GHz
GeForce GTX 1650 Mobile
95 [X] HP Omen 15-dc1020ng Dual-Channel-Modus
Intel Core i5-9300H 2.4GHz
GeForce GTX 1650 Mobile
~ 72 fps
+ Compare
- Hide Comparison
...
NVIDIA GeForce GTX 1050 Max-Q
AMD Radeon Pro 560X
AMD Radeon RX Vega M GH
NVIDIA GeForce GTX 1650 Mobile
NVIDIA GeForce GTX 1050 Ti Mobile
NVIDIA Quadro T2000 Max-Q
NVIDIA GeForce GTX 1050 Ti Max-Q
AMD Radeon RX 5300M
...
max:
47 [X] Asus TUF FX705DT-AU068T AMD Ryzen 5 3550H 2.1GHz
GeForce GTX 1650 Mobile
53 [X] HP Omen 15-dc1020ng Intel Core i5-9300H 2.4GHz
GeForce GTX 1650 Mobile
55 [X] Asus TUF FX705DT-AU068T Dual-Channel
AMD Ryzen 5 3550H 2.1GHz
GeForce GTX 1650 Mobile
63 [X] HP Omen 15-dc1020ng Dual-Channel-Modus
Intel Core i5-9300H 2.4GHz
GeForce GTX 1650 Mobile
64 [X] Acer Nitro 5 Intel Core i5-9300H 2.4GHz
GeForce GTX 1650 Mobile
min:
54 fps
~ 56 fps
+ Compare
- Hide Comparison
...
NVIDIA GeForce GTX 1050 Ti Mobile
NVIDIA GeForce GTX 1050 Ti Max-Q
AMD Radeon RX Vega M GH
NVIDIA GeForce GTX 1650 Mobile
NVIDIA Quadro T2000 Max-Q
AMD Radeon RX 5300M
...
max:
44 [X] Asus TUF FX705DT-AU068T AMD Ryzen 5 3550H 2.1GHz
GeForce GTX 1650 Mobile
52 [X] HP Omen 15-dc1020ng Intel Core i5-9300H 2.4GHz
GeForce GTX 1650 Mobile
53 [X] Asus TUF FX705DT-AU068T Dual-Channel
AMD Ryzen 5 3550H 2.1GHz
GeForce GTX 1650 Mobile
57 60 [X] HP Omen 15-dc1020ng Dual-Channel-Modus
Intel Core i5-9300H 2.4GHz
GeForce GTX 1650 Mobile
61 [X] Acer Nitro 5 Intel Core i5-9300H 2.4GHz
GeForce GTX 1650 Mobile
min:
50 fps
~ 55 fps
+ Compare
- Hide Comparison
...
NVIDIA GeForce GTX 1050 Ti Mobile
NVIDIA GeForce GTX 1050 Ti Max-Q
AMD Radeon RX Vega M GH
NVIDIA GeForce GTX 1650 Mobile
AMD Radeon RX 5300M
...
max:
40 [X] Asus TUF FX705DT-AU068T AMD Ryzen 5 3550H 2.1GHz
GeForce GTX 1650 Mobile
47 [X] HP Omen 15-dc1020ng Intel Core i5-9300H 2.4GHz
GeForce GTX 1650 Mobile
48 [X] Asus TUF FX705DT-AU068T Dual-Channel
AMD Ryzen 5 3550H 2.1GHz
GeForce GTX 1650 Mobile
53 55 [X] HP Omen 15-dc1020ng Dual-Channel-Modus
Intel Core i5-9300H 2.4GHz
GeForce GTX 1650 Mobile
56 [X] Acer Nitro 5 Intel Core i5-9300H 2.4GHz
GeForce GTX 1650 Mobile
min:
44 fps
~ 50 fps
+ Compare
- Hide Comparison
Intel UHD Graphics Xe 16EUs (Tiger Lake-H)
...
NVIDIA GeForce GTX 1050 Ti Mobile
NVIDIA GeForce GTX 1050 Ti Max-Q
AMD Radeon RX Vega M GH
NVIDIA GeForce GTX 1650 Mobile
AMD Radeon RX 5300M
...
max:
...
NVIDIA GeForce GTX 1050 Max-Q
NVIDIA GeForce GTX 1050 Ti Mobile
NVIDIA GeForce GTX 1050 Ti Max-Q
NVIDIA GeForce GTX 1650 Mobile
...
max:
...
AMD Radeon Pro 560X
NVIDIA GeForce GTX 1050 Max-Q
NVIDIA GeForce GTX 1050 Ti Mobile
NVIDIA GeForce GTX 1050 Ti Max-Q
NVIDIA GeForce GTX 1650 Mobile
AMD Radeon RX Vega M GH
...
max:
» With all tested laptops playable in detail settings ultra.
67.7 [X] Asus TUF FX705DT-AU068T AMD Ryzen 5 3550H 2.1GHz
GeForce GTX 1650 Mobile
85.3 [X] Dell G5 15 5590-PCNJJ Intel Core i5-9300H 2.4GHz
GeForce GTX 1650 Mobile
min:
43 fps
98.9 [X] Lenovo IdeaPad Gaming 3i 15IMH05 Intel Core i5-10300H 2.5GHz
GeForce GTX 1650 Mobile
~ 84 fps
+ Compare
- Hide Comparison
...
NVIDIA GeForce GTX 1050 Ti Max-Q
AMD Radeon 680M
NVIDIA GeForce GTX 1650 Mobile
AMD Radeon RX Vega M GH
NVIDIA Quadro T2000 Max-Q
...
max:
40.5 [X] Asus TUF FX705DT-AU068T AMD Ryzen 5 3550H 2.1GHz
GeForce GTX 1650 Mobile
41 [X] Dell G5 15 5590-PCNJJ Intel Core i5-9300H 2.4GHz
GeForce GTX 1650 Mobile
min:
21 fps
42.5 [X] Acer Nitro 5 Intel Core i5-9300H 2.4GHz
GeForce GTX 1650 Mobile
min:
23 fps
46.1 [X] Lenovo IdeaPad Gaming 3i 15IMH05 Intel Core i5-10300H 2.5GHz
GeForce GTX 1650 Mobile
~ 43 fps
+ Compare
- Hide Comparison
...
NVIDIA GeForce GTX 1050 Ti Max-Q
NVIDIA Quadro T2000 Max-Q
NVIDIA GeForce GTX 1650 Mobile
AMD Radeon RX Vega M GH
AMD Radeon RX 5300M
...
max:
30.4 [X] Asus TUF FX705DT-AU068T AMD Ryzen 5 3550H 2.1GHz
GeForce GTX 1650 Mobile
30.8 [X] Dell G5 15 5590-PCNJJ Intel Core i5-9300H 2.4GHz
GeForce GTX 1650 Mobile
min:
17 fps
31.4 [X] Acer Nitro 5 Intel Core i5-9300H 2.4GHz
GeForce GTX 1650 Mobile
min:
18 fps
34.2 [X] Lenovo IdeaPad Gaming 3i 15IMH05 Intel Core i5-10300H 2.5GHz
GeForce GTX 1650 Mobile
~ 32 fps
+ Compare
- Hide Comparison
...
AMD Radeon RX Vega M GH
NVIDIA GeForce GTX 1050 Ti Max-Q
NVIDIA Quadro T2000 Max-Q
NVIDIA GeForce GTX 1650 Mobile
AMD Radeon RX 5300M
...
max:
24.9 [X] Asus TUF FX705DT-AU068T AMD Ryzen 5 3550H 2.1GHz
GeForce GTX 1650 Mobile
25.1 [X] Dell G5 15 5590-PCNJJ Intel Core i5-9300H 2.4GHz
GeForce GTX 1650 Mobile
min:
14 fps
25.9 [X] Acer Nitro 5 Intel Core i5-9300H 2.4GHz
GeForce GTX 1650 Mobile
min:
15 fps
26.6 [X] Lenovo IdeaPad Gaming 3i 15IMH05 Intel Core i5-10300H 2.5GHz
GeForce GTX 1650 Mobile
~ 26 fps
+ Compare
- Hide Comparison
AMD Radeon RX Vega 8 (Ryzen 2000/3000)
...
NVIDIA GeForce GTX 1050 Ti Max-Q
AMD Radeon RX Vega M GH
NVIDIA Quadro T2000 Max-Q
NVIDIA GeForce GTX 1650 Mobile
AMD Radeon RX 5300M
...
max:
...
AMD Radeon Pro 560X
NVIDIA GeForce GTX 1050 Max-Q
NVIDIA GeForce GTX 1050 Ti Mobile
NVIDIA GeForce GTX 1650 Mobile
...
max:
AMD Radeon Pro W6800
NVIDIA GeForce GTX 1050 Ti Max-Q
...
AMD Radeon Pro 560X
NVIDIA GeForce GTX 1050 Max-Q
NVIDIA GeForce GTX 1050 Ti Mobile
AMD Radeon RX Vega M GH
NVIDIA GeForce GTX 1650 Mobile
...
max:
» With all tested laptops playable in detail settings med..
144 [X] Lenovo Ideapad L340-17IRH 81LL001YGE Intel Core i5-9300H 2.4GHz
GeForce GTX 1650 Mobile
144 [X] Dell G5 15 5590-PCNJJ Intel Core i5-9300H 2.4GHz
GeForce GTX 1650 Mobile
min:
141 fps
~ 144 fps
+ Compare
- Hide Comparison
...
AMD Radeon RX 5300M
NVIDIA GeForce GTX 1650 Mobile
80.3 [X] Acer Nitro 5 Intel Core i5-9300H 2.4GHz
GeForce GTX 1650 Mobile
min:
73 fps
81.7 [X] Dell G5 15 5590-PCNJJ Intel Core i5-9300H 2.4GHz
GeForce GTX 1650 Mobile
min:
73 fps
95.1 [X] Lenovo Ideapad L340-17IRH 81LL001YGE Intel Core i5-9300H 2.4GHz
GeForce GTX 1650 Mobile
~ 86 fps
+ Compare
- Hide Comparison
...
NVIDIA GeForce GTX 1050 Ti Mobile
Intel Iris Xe MAX Graphics
NVIDIA GeForce GTX 1650 Mobile
NVIDIA Quadro T2000 Max-Q
AMD Radeon RX 5300M
...
66.5 [X] Dell G5 15 5590-PCNJJ Intel Core i5-9300H 2.4GHz
GeForce GTX 1650 Mobile
min:
60 fps
68.3 [X] Acer Nitro 5 Intel Core i5-9300H 2.4GHz
GeForce GTX 1650 Mobile
min:
62 fps
71.9 [X] Lenovo Ideapad L340-17IRH 81LL001YGE Intel Core i5-9300H 2.4GHz
GeForce GTX 1650 Mobile
~ 69 fps
+ Compare
- Hide Comparison
...
Intel Iris Xe MAX Graphics
NVIDIA GeForce GTX 1050 Ti Mobile
AMD Radeon RX 5300M
NVIDIA GeForce GTX 1650 Mobile
NVIDIA Quadro T2000 Max-Q
...
65.4 [X] Dell G5 15 5590-PCNJJ Intel Core i5-9300H 2.4GHz
GeForce GTX 1650 Mobile
min:
60 fps
67.4 [X] Acer Nitro 5 Intel Core i5-9300H 2.4GHz
GeForce GTX 1650 Mobile
min:
61 fps
71.7 [X] Lenovo Ideapad L340-17IRH 81LL001YGE Intel Core i5-9300H 2.4GHz
GeForce GTX 1650 Mobile
~ 68 fps
+ Compare
- Hide Comparison
...
Intel Iris Xe MAX Graphics
NVIDIA Quadro T2000 Max-Q
AMD Radeon RX 5300M
NVIDIA GeForce GTX 1650 Mobile
...
...
NVIDIA GeForce GTX 1050 Max-Q
NVIDIA GeForce GTX 1050 Ti Mobile
NVIDIA GeForce GTX 1650 Mobile
NVIDIA GeForce GTX 1080 Mobile
...
max:
NVIDIA GeForce GTX 1050 Max-Q
NVIDIA GeForce GTX 1050 Ti Mobile
NVIDIA GeForce GTX 1650 Mobile
NVIDIA GeForce GTX 1080 Mobile
...
max:
» With all tested laptops playable in detail settings ultra.
...
AMD Radeon RX 560X (Laptop)
NVIDIA GeForce GTX 1050 Ti Max-Q
NVIDIA GeForce GTX 1050 Ti Mobile
AMD Radeon RX Vega M GH
NVIDIA GeForce GTX 1650 Mobile
AMD Radeon RX 5300M
NVIDIA Quadro RTX 4000 (Laptop)
...
NVIDIA GeForce RTX 2070 Super Mobile
max:
NVIDIA Titan RTX
Intel Iris Plus Graphics G7 (Ice Lake 64 EU)
...
NVIDIA GeForce GTX 1050 Ti Max-Q
NVIDIA GeForce GTX 1050 Ti Mobile
AMD Radeon RX Vega M GH
NVIDIA GeForce GTX 1650 Mobile
AMD Radeon RX 5300M
...
NVIDIA GeForce RTX 2080 Super Mobile
max:
NVIDIA Titan RTX
...
NVIDIA GeForce GTX 1050 Ti Max-Q
NVIDIA GeForce GTX 1050 Ti Mobile
AMD Radeon RX Vega M GH
NVIDIA GeForce GTX 1650 Mobile
AMD Radeon RX 5300M
NVIDIA Quadro RTX 4000 (Laptop)
...
NVIDIA GeForce RTX 2080 Super Mobile
max:
NVIDIA Titan RTX
NVIDIA GeForce GTX 1050 Ti Mobile
NVIDIA GeForce GTX 1650 Mobile
NVIDIA Quadro RTX 4000 (Laptop)
NVIDIA GeForce RTX 2070 Super Max-Q
...
NVIDIA GeForce RTX 2080 Super Mobile
max:
NVIDIA GeForce GTX 1050 Ti Mobile
NVIDIA GeForce GTX 1050 Ti Max-Q
AMD Radeon RX Vega M GH
NVIDIA GeForce GTX 1650 Mobile
NVIDIA Quadro RTX 4000 (Laptop)
NVIDIA GeForce RTX 2070 Super Max-Q
...
max:
» With all tested laptops playable in detail settings ultra.
...
NVIDIA Quadro P520
NVIDIA GeForce 940M
AMD Radeon RX Vega 10
AMD Radeon RX Vega 8 (Ryzen 2000/3000)
AMD Radeon 540X
NVIDIA GeForce GTX 1650 Mobile
AMD Radeon RX 560X (Laptop)
NVIDIA GeForce GTX 960M
NVIDIA GeForce GTX 950M
...
max:
NVIDIA GeForce GTX 1080 (Desktop)
64.8 [X] Asus TUF FX705DT-AU068T AMD Ryzen 5 3550H 2.1GHz
GeForce GTX 1650 Mobile
82.3 [X] Acer Nitro 5 Intel Core i5-9300H 2.4GHz
GeForce GTX 1650 Mobile
min:
71 fps
~ 74 fps
+ Compare
- Hide Comparison
...
AMD Radeon RX 560X (Laptop)
NVIDIA GeForce GTX 950M
AMD Radeon RX Vega M GH
NVIDIA GeForce GTX 1050 Ti Mobile
NVIDIA GeForce GTX 1650 Mobile
AMD Radeon RX 5300M
NVIDIA GeForce GTX 1050 Ti Max-Q
...
NVIDIA GeForce RTX 2080 Super Mobile
57.4 [X] Asus TUF FX705DT-AU068T AMD Ryzen 5 3550H 2.1GHz
GeForce GTX 1650 Mobile
64.6 [X] Acer Nitro 5 Intel Core i5-9300H 2.4GHz
GeForce GTX 1650 Mobile
min:
57 fps
~ 61 fps
+ Compare
- Hide Comparison
AMD Radeon RX Vega 6 (Ryzen 2000/3000)
...
NVIDIA GeForce GTX 1050 Max-Q
NVIDIA GeForce GTX 950M
AMD Radeon RX Vega M GH
NVIDIA GeForce GTX 1050 Ti Mobile
NVIDIA GeForce GTX 1650 Mobile
AMD Radeon RX 5300M
NVIDIA GeForce GTX 1050 Ti Max-Q
...
NVIDIA GeForce RTX 2080 Super Mobile
52.3 [X] Asus TUF FX705DT-AU068T AMD Ryzen 5 3550H 2.1GHz
GeForce GTX 1650 Mobile
56.7 [X] Acer Nitro 5 Intel Core i5-9300H 2.4GHz
GeForce GTX 1650 Mobile
min:
47 fps
~ 55 fps
+ Compare
- Hide Comparison
...
AMD Radeon RX Vega M GH
NVIDIA GeForce GTX 1050 Ti Mobile
AMD Radeon RX 5300M
NVIDIA GeForce GTX 1650 Mobile
NVIDIA GeForce GTX 1050 Ti Max-Q
NVIDIA GeForce GTX 1080 Mobile
...
NVIDIA GeForce RTX 2080 Super Mobile
max:
NVIDIA GeForce GTX 1050 Ti Mobile
NVIDIA GeForce GTX 1650 Mobile
NVIDIA Quadro RTX 4000 (Laptop)
...
max:
NVIDIA GeForce RTX 2080 (Desktop)
AMD Radeon Pro 560X
NVIDIA GeForce GTX 1650 Mobile
NVIDIA GeForce GTX 1050 Ti Max-Q
AMD Radeon RX Vega M GH
NVIDIA GeForce GTX 1050 Ti Mobile
...
max:
NVIDIA Titan RTX
» With all tested laptops playable in detail settings ultra.
75.3 [X] SCHENKER XMG Core 14 Intel Core i5-1135G7 2.4GHz
GeForce GTX 1650 Mobile
min:
9 fps
83.7 [X] Lenovo Ideapad L340-17IRH 81LL001YGE Intel Core i5-9300H 2.4GHz
GeForce GTX 1650 Mobile
~ 80 fps
+ Compare
- Hide Comparison
...
NVIDIA GeForce GTX 950M
NVIDIA GeForce GTX 960M
NVIDIA GeForce GTX 1650 Mobile
AMD Radeon RX 560X (Laptop)
NVIDIA GeForce GTX 1050 Ti Mobile
AMD Radeon Pro 560X
NVIDIA GeForce GTX 1050 Ti Max-Q
...
max:
54.2 [X] SCHENKER XMG Core 14 Intel Core i5-1135G7 2.4GHz
GeForce GTX 1650 Mobile
min:
9 fps
60.4 [X] Lenovo Ideapad L340-17IRH 81LL001YGE Intel Core i5-9300H 2.4GHz
GeForce GTX 1650 Mobile
84.4 [X] Acer Nitro 5 Intel Core i5-9300H 2.4GHz
GeForce GTX 1650 Mobile
min:
64 fps
~ 66 fps
+ Compare
- Hide Comparison
...
AMD Radeon RX 560X (Laptop)
NVIDIA GeForce GTX 1050 Ti Max-Q
NVIDIA GeForce GTX 1050 Ti Mobile
NVIDIA GeForce GTX 1650 Mobile
AMD Radeon RX Vega M GH
AMD Radeon RX 5300M
...
NVIDIA GeForce RTX 2080 Super Mobile
max:
51.3 [X] SCHENKER XMG Core 14 Intel Core i5-1135G7 2.4GHz
GeForce GTX 1650 Mobile
min:
7 fps
57.7 [X] Lenovo Ideapad L340-17IRH 81LL001YGE Intel Core i5-9300H 2.4GHz
GeForce GTX 1650 Mobile
59.6 [X] Acer Nitro 5 AN515-45-R05E AMD Ryzen 5 5600H 3.3GHz
GeForce GTX 1650 Mobile
59.7 [X] Acer Nitro 5 AN515-45-R05E AMD Ryzen 5 5600H 3.3GHz
GeForce GTX 1650 Mobile
min:
55 fps, max:
61 fps
71.5 [X] Acer Nitro 5 Intel Core i5-9300H 2.4GHz
GeForce GTX 1650 Mobile
min:
56 fps
~ 60 fps
+ Compare
- Hide Comparison
...
AMD Radeon RX 560X (Laptop)
NVIDIA GeForce GTX 1050 Ti Max-Q
NVIDIA GeForce GTX 1050 Ti Mobile
NVIDIA GeForce GTX 1650 Mobile
AMD Radeon RX Vega M GH
AMD Radeon RX 5300M
...
max:
44.3 [X] SCHENKER XMG Core 14 Intel Core i5-1135G7 2.4GHz
GeForce GTX 1650 Mobile
min:
7 fps
54.3 [X] Lenovo Ideapad L340-17IRH 81LL001YGE Intel Core i5-9300H 2.4GHz
GeForce GTX 1650 Mobile
58.5 [X] Acer Nitro 5 AN515-45-R05E AMD Ryzen 5 5600H 3.3GHz
GeForce GTX 1650 Mobile
58.5 [X] Acer Nitro 5 AN515-45-R05E AMD Ryzen 5 5600H 3.3GHz
GeForce GTX 1650 Mobile
min:
44 fps, max:
62 fps
64.8 [X] Acer Nitro 5 Intel Core i5-9300H 2.4GHz
GeForce GTX 1650 Mobile
min:
51 fps
~ 56 fps
+ Compare
- Hide Comparison
...
NVIDIA GeForce GTX 1050 Max-Q
AMD Radeon RX 560X (Laptop)
NVIDIA GeForce GTX 1050 Ti Mobile
NVIDIA GeForce GTX 1050 Ti Max-Q
NVIDIA GeForce GTX 1650 Mobile
AMD Radeon RX Vega M GH
AMD Radeon RX 5300M
...
max:
...
NVIDIA GeForce GTX 1050 Ti Mobile
AMD Radeon RX Vega M GH
NVIDIA GeForce GTX 1650 Mobile
NVIDIA Quadro RTX 4000 (Laptop)
...
max:
...
NVIDIA GeForce GTX 1050 Ti Max-Q
AMD Radeon RX Vega M GH
NVIDIA GeForce GTX 1650 Mobile
...
max:
» With all tested laptops playable in detail settings ultra.
...
NVIDIA GeForce GTX 1050 Ti Mobile
NVIDIA GeForce GTX 1050 Ti Max-Q
NVIDIA GeForce GTX 1080 Mobile
NVIDIA GeForce GTX 1650 Mobile
max:
NVIDIA GeForce GTX 1080 (Desktop)
...
NVIDIA GeForce GTX 1050 Ti Mobile
NVIDIA GeForce GTX 1050 Ti Max-Q
AMD Radeon RX Vega M GH
NVIDIA GeForce GTX 1650 Mobile
NVIDIA GeForce GTX 1080 Mobile
...
max:
NVIDIA GeForce GTX 1080 (Desktop)
...
AMD Radeon RX Vega M GH
NVIDIA GeForce GTX 1050 Ti Mobile
NVIDIA GeForce GTX 1050 Ti Max-Q
NVIDIA GeForce GTX 1650 Mobile
NVIDIA GeForce GTX 1080 Mobile
...
max:
NVIDIA GeForce GTX 1080 (Desktop)
NVIDIA GeForce GTX 1050 Max-Q
NVIDIA GeForce GTX 1050 Ti Mobile
NVIDIA GeForce GTX 1650 Mobile
...
max:
» With all tested laptops playable in detail settings ultra.
...
AMD Radeon RX Vega M GH
NVIDIA GeForce GTX 1080 Mobile
NVIDIA Quadro RTX 3000 Max-Q
AMD Radeon RX 5300M
NVIDIA GeForce GTX 1650 Mobile
NVIDIA Quadro RTX 5000 Max-Q
NVIDIA GeForce RTX 2070 Super Max-Q
...
NVIDIA GeForce RTX 2080 Super Mobile
AMD Radeon RX Vega 8 (Ryzen 2000/3000)
...
AMD Radeon RX Vega M GH
NVIDIA GeForce GTX 1080 Mobile
AMD Radeon RX 5300M
NVIDIA Quadro RTX 3000 Max-Q
NVIDIA GeForce GTX 1650 Mobile
NVIDIA Quadro RTX 5000 Max-Q
...
NVIDIA GeForce RTX 2070 Super Mobile
max:
AMD Radeon RX Vega 8 (Ryzen 2000/3000)
...
NVIDIA GeForce GTX 1050 Ti Max-Q
AMD Radeon RX Vega M GH
AMD Radeon RX 5300M
NVIDIA GeForce GTX 1080 Mobile
NVIDIA GeForce GTX 1650 Mobile
NVIDIA Quadro RTX 3000 Max-Q
NVIDIA Quadro RTX 5000 Max-Q
...
max:
NVIDIA GeForce GTX 1650 Mobile
NVIDIA Quadro RTX 3000 Max-Q
NVIDIA GeForce GTX 1080 Mobile
...
max:
AMD Radeon Pro 560X
NVIDIA GeForce GTX 1050 Ti Max-Q
AMD Radeon RX Vega M GH
NVIDIA GeForce GTX 1650 Mobile
NVIDIA Quadro RTX 3000 Max-Q
...
max:
» With all tested laptops playable in detail settings ultra.
...
NVIDIA GeForce GTX 960M
AMD Radeon Pro 555
AMD Radeon RX 560X (Laptop)
NVIDIA GeForce GTX 1050 Ti Mobile
NVIDIA GeForce GTX 1050 Ti Max-Q
NVIDIA GeForce GTX 1650 Mobile
NVIDIA GeForce GTX 1080 Mobile
max:
78.4 [X] Acer Aspire 7 A715-74G-50U5 Intel Core i5-9300H 2.4GHz
GeForce GTX 1650 Mobile
83.2 [X] Acer Nitro 5 Intel Core i5-9300H 2.4GHz
GeForce GTX 1650 Mobile
min:
62 fps
~ 81 fps
+ Compare
- Hide Comparison
...
NVIDIA GeForce GTX 1050 Ti Max-Q
NVIDIA GeForce GTX 1050 Ti Mobile
AMD Radeon Pro 560X
AMD Radeon RX 560X (Laptop)
NVIDIA GeForce GTX 1650 Mobile
NVIDIA GeForce GTX 1080 Mobile
max:
71.6 [X] Acer Nitro 5 Intel Core i5-9300H 2.4GHz
GeForce GTX 1650 Mobile
min:
53 fps
72.6 [X] Acer Aspire 7 A715-74G-50U5 Intel Core i5-9300H 2.4GHz
GeForce GTX 1650 Mobile
~ 72 fps
+ Compare
- Hide Comparison
...
AMD Radeon Pro 560X
AMD Radeon RX 560X (Laptop)
NVIDIA GeForce GTX 1050 Ti Max-Q
NVIDIA GeForce GTX 1050 Ti Mobile
NVIDIA GeForce GTX 1650 Mobile
NVIDIA GeForce GTX 1080 Mobile
...
max:
67.8 [X] Acer Nitro 5 Intel Core i5-9300H 2.4GHz
GeForce GTX 1650 Mobile
min:
50 fps
68.8 [X] Acer Aspire 7 A715-74G-50U5 Intel Core i5-9300H 2.4GHz
GeForce GTX 1650 Mobile
~ 68 fps
+ Compare
- Hide Comparison
...
NVIDIA GeForce GTX 1050 Ti Max-Q
AMD Radeon Pro 560X
NVIDIA GeForce GTX 1050 Ti Mobile
AMD Radeon RX Vega M GH
NVIDIA GeForce GTX 1650 Mobile
NVIDIA GeForce GTX 1080 Mobile
...
max:
AMD Radeon RX Vega M GH
NVIDIA GeForce GTX 1650 Mobile
NVIDIA GeForce GTX 1080 Mobile
...
max:
NVIDIA GeForce GTX 1050 Ti Max-Q
NVIDIA GeForce GTX 1050 Ti Mobile
AMD Radeon RX Vega M GH
NVIDIA GeForce GTX 1650 Mobile
NVIDIA GeForce GTX 1080 Mobile
...
max:
NVIDIA Titan RTX
» With all tested laptops playable in detail settings ultra.
45 [X] Asus TUF FX705DT-AU068T AMD Ryzen 5 3550H 2.1GHz
GeForce GTX 1650 Mobile
61 [X] Asus TUF FX705DT-AU068T Dual-Channel
AMD Ryzen 5 3550H 2.1GHz
GeForce GTX 1650 Mobile
71 [X] Dell G5 15 5590-PCNJJ Intel Core i5-9300H 2.4GHz
GeForce GTX 1650 Mobile
min:
37 fps
~ 59 fps
+ Compare
- Hide Comparison
...
NVIDIA GeForce GTX 950M
AMD Radeon Pro WX Vega M GL
NVIDIA GeForce GTX 960M
AMD Radeon Pro 560X
NVIDIA GeForce GTX 1050 Max-Q
NVIDIA GeForce GTX 1650 Mobile
NVIDIA GeForce GTX 1080 Mobile
NVIDIA GeForce GTX 1050 Ti Max-Q
...
max:
38 [X] Asus TUF FX705DT-AU068T AMD Ryzen 5 3550H 2.1GHz
GeForce GTX 1650 Mobile
54 [X] Asus TUF FX705DT-AU068T Dual-Channel
AMD Ryzen 5 3550H 2.1GHz
GeForce GTX 1650 Mobile
56 [X] Dell G5 15 5590-PCNJJ Intel Core i5-9300H 2.4GHz
GeForce GTX 1650 Mobile
min:
28 fps
66 [X] Acer Nitro 5 Intel Core i5-9300H 2.4GHz
GeForce GTX 1650 Mobile
min:
35 fps
~ 54 fps
+ Compare
- Hide Comparison
...
NVIDIA GeForce GTX 1050 Ti Max-Q
NVIDIA GeForce GTX 1050 Ti Mobile
AMD Radeon RX Vega M GH
NVIDIA Quadro T2000 Max-Q
NVIDIA GeForce GTX 1650 Mobile
NVIDIA GeForce GTX 1080 Mobile
AMD Radeon RX 5300M
NVIDIA Quadro P3200
...
max:
35 [X] Asus TUF FX705DT-AU068T AMD Ryzen 5 3550H 2.1GHz
GeForce GTX 1650 Mobile
47 [X] Asus TUF FX705DT-AU068T Dual-Channel
AMD Ryzen 5 3550H 2.1GHz
GeForce GTX 1650 Mobile
48 [X] Dell G5 15 5590-PCNJJ Intel Core i5-9300H 2.4GHz
GeForce GTX 1650 Mobile
min:
5 fps
53 [X] Acer Nitro 5 Intel Core i5-9300H 2.4GHz
GeForce GTX 1650 Mobile
min:
28 fps
~ 46 fps
+ Compare
- Hide Comparison
...
AMD Radeon RX 5300M
NVIDIA Quadro T2000 Max-Q
NVIDIA GeForce GTX 1650 Mobile
NVIDIA GeForce GTX 1080 Mobile
NVIDIA Quadro P3200
...
max:
22 [X] Asus TUF FX705DT-AU068T AMD Ryzen 5 3550H 2.1GHz
GeForce GTX 1650 Mobile
28 [X] Asus TUF FX705DT-AU068T Dual-Channel
AMD Ryzen 5 3550H 2.1GHz
GeForce GTX 1650 Mobile
30 [X] Dell G5 15 5590-PCNJJ Intel Core i5-9300H 2.4GHz
GeForce GTX 1650 Mobile
min:
1 fps
34 [X] Acer Nitro 5 Intel Core i5-9300H 2.4GHz
GeForce GTX 1650 Mobile
min:
21 fps
43 [X] presample NVIDIA GeForce GTX 1650 (Laptop) GeForce GTX 1650 Mobile
~ 31 fps
+ Compare
- Hide Comparison
...
AMD Radeon RX Vega M GH
NVIDIA GeForce GTX 1050 Ti Mobile
NVIDIA Quadro T2000 Max-Q
AMD Radeon RX 5300M
NVIDIA GeForce GTX 1650 Mobile
NVIDIA Quadro P3200
...
max:
NVIDIA GeForce GTX 1050 Max-Q
NVIDIA GeForce GTX 1650 Mobile
NVIDIA Quadro RTX 4000 (Laptop)
NVIDIA GeForce GTX 1080 Mobile
...
max:
AMD Radeon RX Vega 8 (Ryzen 2000/3000)
NVIDIA GeForce GTX 1050 Max-Q
NVIDIA GeForce GTX 1050 Ti Max-Q
AMD Radeon Pro WX Vega M GL
NVIDIA GeForce GTX 1650 Mobile
NVIDIA Quadro RTX 4000 (Laptop)
...
max:
» With most tested laptops playable in detail settings high.
84 [X] Asus TUF FX705DT-AU068T AMD Ryzen 5 3550H 2.1GHz
GeForce GTX 1650 Mobile
110 [X] Acer Aspire 7 A715-74G-50U5 Intel Core i5-9300H 2.4GHz
GeForce GTX 1650 Mobile
~ 97 fps
+ Compare
- Hide Comparison
...
NVIDIA GeForce GTX 960M
AMD Radeon RX Vega 7
AMD Radeon RX 560X (Laptop)
NVIDIA GeForce GTX 1650 Mobile
AMD Radeon Pro 560X
NVIDIA GeForce GTX 1080 Mobile
NVIDIA GeForce GTX 1050 Ti Mobile
NVIDIA GeForce GTX 1050 Ti Max-Q
...
max:
64 [X] Asus TUF FX705DT-AU068T AMD Ryzen 5 3550H 2.1GHz
GeForce GTX 1650 Mobile
100 [X] Acer Aspire 7 A715-74G-50U5 Intel Core i5-9300H 2.4GHz
GeForce GTX 1650 Mobile
~ 82 fps
+ Compare
- Hide Comparison
...
AMD Radeon RX 560X (Laptop)
AMD Radeon Pro 560X
NVIDIA GeForce GTX 1050 Ti Mobile
NVIDIA GeForce GTX 1050 Ti Max-Q
NVIDIA GeForce GTX 1650 Mobile
NVIDIA Quadro P3200
NVIDIA GeForce GTX 1080 Mobile
...
max:
65 [X] Asus TUF FX705DT-AU068T AMD Ryzen 5 3550H 2.1GHz
GeForce GTX 1650 Mobile
95 [X] Acer Aspire 7 A715-74G-50U5 Intel Core i5-9300H 2.4GHz
GeForce GTX 1650 Mobile
~ 80 fps
+ Compare
- Hide Comparison
AMD Radeon RX Vega 6 (Ryzen 2000/3000)
...
AMD Radeon RX 560X (Laptop)
AMD Radeon Pro 560X
NVIDIA GeForce GTX 1050 Ti Mobile
NVIDIA GeForce GTX 1050 Ti Max-Q
NVIDIA GeForce GTX 1650 Mobile
NVIDIA Quadro P3200
NVIDIA GeForce GTX 1080 Mobile
...
max:
48 [X] Asus TUF FX705DT-AU068T AMD Ryzen 5 3550H 2.1GHz
GeForce GTX 1650 Mobile
75 [X] Acer Aspire 7 A715-74G-50U5 Intel Core i5-9300H 2.4GHz
GeForce GTX 1650 Mobile
~ 62 fps
+ Compare
- Hide Comparison
...
AMD Radeon Pro 560X
AMD Radeon RX 560X (Laptop)
NVIDIA GeForce GTX 1050 Ti Mobile
NVIDIA GeForce GTX 1050 Ti Max-Q
NVIDIA GeForce GTX 1650 Mobile
NVIDIA Quadro P3200
NVIDIA GeForce GTX 1080 Mobile
...
max:
» With all tested laptops playable in detail settings ultra.
0 100 Tooltip TUF FX505DT: Ø103.9 (46-126)
...
AMD Radeon RX Vega 10
NVIDIA GeForce 940M
AMD Radeon RX Vega 8 (Ryzen 2000/3000)
NVIDIA GeForce GTX 1650 Mobile
AMD Radeon RX 560X (Laptop)
NVIDIA GeForce GTX 960M
NVIDIA GeForce GTX 1050 Ti Mobile
NVIDIA Quadro P1000
...
max:
0 100 Tooltip TUF FX505DT: Ø96.9 (47-109)
AMD Radeon RX Vega 6 (Ryzen 2000/3000)
...
NVIDIA GeForce GTX 960M
NVIDIA Quadro P1000
AMD Radeon RX 560X (Laptop)
NVIDIA GeForce GTX 1050 Ti Mobile
NVIDIA GeForce GTX 1650 Mobile
NVIDIA GeForce GTX 1080 Mobile
...
0 100 Tooltip TUF FX505DT: Ø93.9 (88-102)
...
NVIDIA GeForce GTX 1050 Max-Q
NVIDIA Quadro P1000
AMD Radeon RX 560X (Laptop)
NVIDIA GeForce GTX 1050 Ti Mobile
NVIDIA GeForce GTX 1650 Mobile
NVIDIA GeForce GTX 1080 Mobile
...
max:
0 100 Tooltip TUF FX505DT: Ø89.3 (47-101)
...
NVIDIA Quadro P1000
AMD Radeon RX 560X (Laptop)
NVIDIA GeForce GTX 1050 Max-Q
AMD Radeon Pro 560X
NVIDIA GeForce GTX 1050 Ti Mobile
NVIDIA GeForce GTX 1650 Mobile
NVIDIA GeForce GTX 1080 Mobile
...
max:
0 Tooltip TUF FX505DT: Ø71.3 (44-83)
NVIDIA GeForce GTX 960M
NVIDIA GeForce GTX 1650 Mobile
NVIDIA GeForce GTX 1080 Mobile
...
max:
AMD Radeon RX Vega 8 (Ryzen 2000/3000)
NVIDIA GeForce GTX 960M
AMD Radeon Pro 560X
NVIDIA GeForce GTX 1050 Ti Mobile
NVIDIA GeForce GTX 1650 Mobile
NVIDIA GeForce GTX 1080 Mobile
...
max:
» With all tested laptops playable in detail settings ultra.
57 [X] Asus TUF FX505DT AMD Ryzen 7 3750H 2.3GHz
GeForce GTX 1650 Mobile
62 [X] Asus TUF FX505DT-EB73 AMD Ryzen 7 3750H 2.3GHz
GeForce GTX 1650 Mobile
63 [X] SCHENKER XMG Core 14 Intel Core i5-1135G7 2.4GHz
GeForce GTX 1650 Mobile
min:
38 fps
83 [X] Lenovo Legion 5 17IMH05 Intel Core i5-10300H 2.5GHz
GeForce GTX 1650 Mobile
88 [X] MSI GF75 Thin 10SCXR Intel Core i5-10300H 2.5GHz
GeForce GTX 1650 Mobile
min:
57 fps, max:
142 fps
95 98 [X] Dell G5 15 5590-PCNJJ Intel Core i5-9300H 2.4GHz
GeForce GTX 1650 Mobile
min:
50 fps
101 [X] Lenovo IdeaPad Gaming 3i 15IMH05 Intel Core i5-10300H 2.5GHz
GeForce GTX 1650 Mobile
102 111 115 [X] Nexoc GH5 515IG Intel Core i5-10300H 2.5GHz
GeForce GTX 1650 Mobile
122 [X] Lenovo Yoga Creator 7 15IMH05 82DS000VGE Intel Core i7-10750H 2.6GHz
GeForce GTX 1650 Mobile
128 [X] MSI GF75 Thin 9SC Intel Core i7-9750H 2.6GHz
GeForce GTX 1650 Mobile
~ 94 fps
+ Compare
- Hide Comparison
...
NVIDIA Quadro P2000 Max-Q
Apple M2 10-Core GPU
AMD Radeon Pro 560X
AMD Radeon Pro WX Vega M GL
NVIDIA GeForce GTX 1050 Ti Mobile
NVIDIA Quadro RTX 3000 Max-Q
NVIDIA GeForce GTX 1650 Mobile
NVIDIA GeForce GTX 1080 Mobile
NVIDIA GeForce GTX 1050 Ti Max-Q
...
max:
42 48 [X] Asus TUF FX505DT AMD Ryzen 7 3750H 2.3GHz
GeForce GTX 1650 Mobile
52 [X] Asus TUF FX505DT-EB73 AMD Ryzen 7 3750H 2.3GHz
GeForce GTX 1650 Mobile
54 [X] SCHENKER XMG Core 14 Intel Core i5-1135G7 2.4GHz
GeForce GTX 1650 Mobile
min:
37 fps
57 [X] Acer Nitro 5 Intel Core i5-9300H 2.4GHz
GeForce GTX 1650 Mobile
min:
35 fps
57 [X] Dell G5 15 5590-PCNJJ Intel Core i5-9300H 2.4GHz
GeForce GTX 1650 Mobile
min:
46 fps
57 [X] Lenovo Yoga Creator 7 15IMH05 82DS000VGE Intel Core i7-10750H 2.6GHz
GeForce GTX 1650 Mobile
59 [X] MSI GF75 Thin 9SC Intel Core i7-9750H 2.6GHz
GeForce GTX 1650 Mobile
60 [X] MSI GF75 Thin 10SCXR Intel Core i5-10300H 2.5GHz
GeForce GTX 1650 Mobile
min:
50 fps, max:
125 fps
61 61 [X] Nexoc GH5 515IG Intel Core i5-10300H 2.5GHz
GeForce GTX 1650 Mobile
62 62 [X] Lenovo Legion 5 17IMH05 Intel Core i5-10300H 2.5GHz
GeForce GTX 1650 Mobile
63 [X] Lenovo IdeaPad Gaming 3i 15IMH05 Intel Core i5-10300H 2.5GHz
GeForce GTX 1650 Mobile
~ 57 fps
+ Compare
- Hide Comparison
...
AMD Radeon RX Vega M GH
NVIDIA Quadro T2000 Max-Q
NVIDIA GeForce GTX 1650 Mobile
Apple M1 Pro 14-Core GPU
AMD Radeon RX 5300M
NVIDIA Quadro P3200
Apple M1 Pro 16-Core GPU
...
max:
38 44 [X] Asus TUF FX505DT AMD Ryzen 7 3750H 2.3GHz
GeForce GTX 1650 Mobile
45 [X] Asus TUF FX505DT-EB73 AMD Ryzen 7 3750H 2.3GHz
GeForce GTX 1650 Mobile
46 [X] SCHENKER XMG Core 14 Intel Core i5-1135G7 2.4GHz
GeForce GTX 1650 Mobile
min:
36 fps
48 48 [X] Dell G5 15 5590-PCNJJ Intel Core i5-9300H 2.4GHz
GeForce GTX 1650 Mobile
min:
40 fps
49 [X] Lenovo Yoga Creator 7 15IMH05 82DS000VGE Intel Core i7-10750H 2.6GHz
GeForce GTX 1650 Mobile
51 [X] MSI GF75 Thin 9SC Intel Core i7-9750H 2.6GHz
GeForce GTX 1650 Mobile
51 51 [X] MSI GF75 Thin 10SCXR Intel Core i5-10300H 2.5GHz
GeForce GTX 1650 Mobile
min:
40 fps, max:
82 fps
51 [X] Nexoc GH5 515IG Intel Core i5-10300H 2.5GHz
GeForce GTX 1650 Mobile
52 [X] Acer Nitro 5 Intel Core i5-9300H 2.4GHz
GeForce GTX 1650 Mobile
min:
31 fps
52 52 [X] Lenovo Legion 5 17IMH05 Intel Core i5-10300H 2.5GHz
GeForce GTX 1650 Mobile
53 [X] Lenovo IdeaPad Gaming 3i 15IMH05 Intel Core i5-10300H 2.5GHz
GeForce GTX 1650 Mobile
~ 49 fps
+ Compare
- Hide Comparison
AMD Radeon RX Vega 6 (Ryzen 2000/3000)
...
AMD Radeon RX Vega M GH
NVIDIA Quadro T2000 Max-Q
AMD Radeon RX 5300M
NVIDIA GeForce GTX 1650 Mobile
Apple M1 Pro 14-Core GPU
NVIDIA Quadro P3200
Apple M1 Pro 16-Core GPU
...
max:
34 39 [X] SCHENKER XMG Core 14 Intel Core i5-1135G7 2.4GHz
GeForce GTX 1650 Mobile
min:
32 fps
41 [X] Asus TUF FX505DT-EB73 AMD Ryzen 7 3750H 2.3GHz
GeForce GTX 1650 Mobile
42 [X] Lenovo Yoga Creator 7 15IMH05 82DS000VGE Hoechstleistung
Intel Core i7-10750H 2.6GHz
GeForce GTX 1650 Mobile
43 [X] Dell G5 15 5590-PCNJJ Intel Core i5-9300H 2.4GHz
GeForce GTX 1650 Mobile
min:
35 fps
43 [X] Lenovo Yoga Creator 7 15IMH05 82DS000VGE Intel Core i7-10750H 2.6GHz
GeForce GTX 1650 Mobile
44 44 [X] MSI GF75 Thin 10SCXR Intel Core i5-10300H 2.5GHz
GeForce GTX 1650 Mobile
min:
35 fps, max:
73 fps
44 [X] Nexoc GH5 515IG Intel Core i5-10300H 2.5GHz
GeForce GTX 1650 Mobile
45 [X] MSI GF75 Thin 9SC Intel Core i7-9750H 2.6GHz
GeForce GTX 1650 Mobile
45 45 [X] Lenovo Legion 5 17IMH05 Intel Core i5-10300H 2.5GHz
GeForce GTX 1650 Mobile
46 [X] Acer Nitro 5 Intel Core i5-9300H 2.4GHz
GeForce GTX 1650 Mobile
min:
18 fps
46 [X] Nexoc GH5 515IG Leistungsmodus
Intel Core i5-10300H 2.5GHz
GeForce GTX 1650 Mobile
47 [X] Lenovo IdeaPad Gaming 3i 15IMH05 Intel Core i5-10300H 2.5GHz
GeForce GTX 1650 Mobile
~ 43 fps
+ Compare
- Hide Comparison
...
Apple M1 8-Core GPU
NVIDIA Quadro T2000 Max-Q
NVIDIA GeForce GTX 1650 Mobile
Apple M1 Pro 14-Core GPU
NVIDIA Quadro P3200
Apple M1 Pro 16-Core GPU
...
max:
...
NVIDIA GeForce GTX 1050 Ti Mobile
Apple M2 10-Core GPU
NVIDIA GeForce GTX 1650 Mobile
...
max:
AMD Radeon RX Vega 8 (Ryzen 2000/3000)
...
AMD Radeon Pro WX Vega M GL
NVIDIA GeForce GTX 1050 Ti Mobile
NVIDIA GeForce GTX 1050 Ti Max-Q
NVIDIA GeForce GTX 1650 Mobile
NVIDIA Quadro RTX 3000 Max-Q
...
max:
» With most tested laptops playable in detail settings ultra.
Additional Benchmarks
Lowest Preset 1920x1080
91 [X] Lenovo Yoga Creator 7 15IMH05 82DS000VGE Intel Core i7-10750H 2.6GHz
GeForce GTX 1650 Mobile
98 [X] Lenovo IdeaPad Gaming 3i 15IMH05 Intel Core i5-10300H 2.5GHz
GeForce GTX 1650 Mobile
79 [X] MSI GF75 Thin 10SCXR Intel Core i5-10300H 2.5GHz
GeForce GTX 1650 Mobile
min:
59 fps, max:
130 fps
101 [X] Nexoc GH5 515IG Intel Core i5-10300H 2.5GHz
GeForce GTX 1650 Mobile
...
AMD Radeon 680M
NVIDIA GeForce GTX 1650 Mobile
AMD Radeon RX Vega M GH
...
NVIDIA GeForce RTX 2080 Super Mobile
max:
...
NVIDIA GeForce GTX 1650 Mobile
AMD Radeon RX Vega M GH
...
max:
...
NVIDIA GeForce GTX 1650 Mobile
AMD Radeon RX Vega M GH
...
max:
...
NVIDIA GeForce GTX 1650 Mobile
AMD Radeon RX Vega M GH
...
max:
» With all tested laptops playable in detail settings ultra.
AMD Radeon RX Vega 6 (Ryzen 2000/3000)
...
NVIDIA Quadro P2000 Max-Q
NVIDIA Quadro P2000
NVIDIA GeForce GTX 1050 Ti Mobile
NVIDIA GeForce GTX 1050 Ti Max-Q
AMD Radeon RX Vega M GH
NVIDIA GeForce GTX 1650 Mobile
NVIDIA Quadro P3200
NVIDIA GeForce GTX 1080 Mobile
NVIDIA Quadro P5200
...
max:
AMD Radeon RX Vega 6 (Ryzen 2000/3000)
...
NVIDIA GeForce GTX 1050 Ti Mobile
NVIDIA Quadro P2000
NVIDIA GeForce GTX 1050 Ti Max-Q
AMD Radeon RX Vega M GH
NVIDIA Quadro P2000 Max-Q
NVIDIA GeForce GTX 1650 Mobile
NVIDIA GeForce GTX 1080 Mobile
NVIDIA Quadro P3200
NVIDIA Quadro P5200
...
max:
...
NVIDIA Quadro P2000
AMD Radeon Pro WX Vega M GL
NVIDIA GeForce GTX 1050 Ti Mobile
NVIDIA GeForce GTX 1050 Ti Max-Q
NVIDIA Quadro P2000 Max-Q
AMD Radeon RX Vega M GH
NVIDIA GeForce GTX 1650 Mobile
NVIDIA Quadro P3200
NVIDIA Quadro P5200
NVIDIA Quadro RTX 4000 (Laptop)
...
max:
NVIDIA Titan RTX
NVIDIA GeForce GTX 950M
NVIDIA GeForce GTX 960M
NVIDIA Quadro P2000
NVIDIA GeForce GTX 1050 Ti Mobile
NVIDIA GeForce GTX 1650 Mobile
NVIDIA Quadro RTX 4000 (Laptop)
NVIDIA GeForce GTX 1080 Mobile
...
max:
AMD Radeon RX Vega 8 (Ryzen 2000/3000)
...
AMD Radeon Pro 555
AMD Radeon Pro 560X
NVIDIA Quadro P2000
NVIDIA GeForce GTX 1050 Max-Q
AMD Radeon Pro WX Vega M GL
NVIDIA GeForce GTX 1050 Ti Mobile
NVIDIA GeForce GTX 1050 Ti Max-Q
NVIDIA Quadro P2000 Max-Q
NVIDIA GeForce GTX 1650 Mobile
NVIDIA Quadro P5200
NVIDIA Quadro RTX 4000 (Laptop)
NVIDIA GeForce GTX 1080 Mobile
...
max:
NVIDIA Titan RTX
» With all tested laptops playable in detail settings ultra.
...
NVIDIA GeForce GTX 1050 Max-Q
AMD Radeon RX 560X (Laptop)
NVIDIA GeForce GTX 1050 Ti Max-Q
NVIDIA GeForce GTX 1050 Ti Mobile
NVIDIA GeForce GTX 1650 Mobile
AMD Radeon RX 5300M
NVIDIA GeForce GTX 1080 Mobile
...
max:
...
NVIDIA GeForce GTX 1050 Max-Q
AMD Radeon Pro 560X
AMD Radeon RX 560X (Laptop)
NVIDIA GeForce GTX 1050 Ti Mobile
NVIDIA GeForce GTX 1050 Ti Max-Q
NVIDIA GeForce GTX 1650 Mobile
AMD Radeon RX 5300M
NVIDIA GeForce GTX 1080 Mobile
...
max:
...
AMD Radeon Pro 560X
NVIDIA GeForce GTX 1050 Max-Q
AMD Radeon RX 560X (Laptop)
NVIDIA GeForce GTX 1050 Ti Mobile
NVIDIA GeForce GTX 1050 Ti Max-Q
NVIDIA GeForce GTX 1650 Mobile
AMD Radeon RX 5300M
...
max:
NVIDIA GeForce GTX 1650 Mobile
NVIDIA GeForce RTX 2070 Super Max-Q
...
max:
NVIDIA GeForce GTX 1050 Max-Q
NVIDIA GeForce GTX 1050 Ti Max-Q
NVIDIA GeForce GTX 1650 Mobile
NVIDIA Quadro P5200
NVIDIA GeForce GTX 1080 Mobile
...
NVIDIA GeForce RTX 2080 Super Mobile
max:
NVIDIA Titan RTX
» With all tested laptops playable in detail settings ultra.
...
NVIDIA GeForce GTX 960M
AMD Radeon Pro 560X
NVIDIA GeForce GTX 1050 Max-Q
AMD Radeon RX 560X (Laptop)
NVIDIA GeForce GTX 1050 Ti Max-Q
NVIDIA GeForce GTX 1050 Ti Mobile
NVIDIA GeForce GTX 1650 Mobile
...
...
AMD Radeon Pro 560X
AMD Radeon RX 560X (Laptop)
NVIDIA GeForce GTX 1050 Ti Max-Q
NVIDIA GeForce GTX 1050 Ti Mobile
NVIDIA GeForce GTX 1650 Mobile
...
max:
...
NVIDIA GeForce GTX 1050 Max-Q
AMD Radeon Pro 560X
AMD Radeon RX 560X (Laptop)
NVIDIA GeForce GTX 1050 Ti Max-Q
NVIDIA GeForce GTX 1050 Ti Mobile
AMD Radeon RX Vega M GH
NVIDIA GeForce GTX 1650 Mobile
NVIDIA GeForce GTX 1080 Mobile
...
max:
AMD Radeon RX 480 (Desktop)
NVIDIA GeForce GTX 950M
NVIDIA GeForce GTX 960M
NVIDIA GeForce GTX 1050 Ti Mobile
NVIDIA GeForce GTX 1650 Mobile
NVIDIA GeForce GTX 1080 Mobile
...
max:
...
AMD Radeon Pro 555
NVIDIA GeForce GTX 960M
AMD Radeon Pro 560X
NVIDIA GeForce GTX 1050 Max-Q
NVIDIA GeForce GTX 1050 Ti Max-Q
NVIDIA GeForce GTX 1050 Ti Mobile
NVIDIA GeForce GTX 1650 Mobile
...
max:
NVIDIA Titan RTX
» With all tested laptops playable in detail settings ultra.
54 [X] Asus TUF FX505DT AMD Ryzen 7 3750H 2.3GHz
GeForce GTX 1650 Mobile
min:
33 fps, max:
67 fps
64 [X] Asus TUF FX705DT-AU068T AMD Ryzen 5 3550H 2.1GHz
GeForce GTX 1650 Mobile
74 83 [X] Asus TUF FX705DT-AU068T Dual-Channel
AMD Ryzen 5 3550H 2.1GHz
GeForce GTX 1650 Mobile
97 [X] Lenovo IdeaPad Gaming 3i 15IMH05 Intel Core i5-10300H 2.5GHz
GeForce GTX 1650 Mobile
115 [X] Lenovo Yoga Creator 7 15IMH05 82DS000VGE Intel Core i7-10750H 2.6GHz
GeForce GTX 1650 Mobile
min:
92 fps, max:
131 fps
~ 81 fps
+ Compare
- Hide Comparison
+ 📈 Graph
- 📈 Hide Graph
0 100 Tooltip TUF FX505DT: Ø53.6 (33-67)
Aspire 7 A715-42G-R0XB: Ø74.5 (8-102)
Yoga Creator 7 15IMH05 82DS000VGE: Ø114.9 (92-131)
...
AMD Radeon Pro 560X
NVIDIA GeForce GTX 1650 Mobile
NVIDIA GeForce GTX 1050 Ti Mobile
NVIDIA GeForce GTX 1050 Ti Max-Q
NVIDIA Quadro P2000
...
max:
48 [X] Asus TUF FX705DT-AU068T AMD Ryzen 5 3550H 2.1GHz
GeForce GTX 1650 Mobile
51 [X] Asus TUF FX505DT AMD Ryzen 7 3750H 2.3GHz
GeForce GTX 1650 Mobile
min:
36 fps, max:
63 fps
59 [X] Lenovo Yoga Creator 7 15IMH05 82DS000VGE Intel Core i7-10750H 2.6GHz
GeForce GTX 1650 Mobile
min:
52 fps, max:
70 fps
60 [X] Asus TUF FX705DT-AU068T Dual-Channel
AMD Ryzen 5 3550H 2.1GHz
GeForce GTX 1650 Mobile
60 66 [X] Lenovo IdeaPad Gaming 3i 15IMH05 Intel Core i5-10300H 2.5GHz
GeForce GTX 1650 Mobile
~ 57 fps
+ Compare
- Hide Comparison
+ 📈 Graph
- 📈 Hide Graph
0 Tooltip TUF FX505DT: Ø50.6 (36-63)
Yoga Creator 7 15IMH05 82DS000VGE: Ø59.4 (52-70)
Aspire 7 A715-42G-R0XB: Ø59.6 (47-70)
...
NVIDIA GeForce GTX 1050 Ti Mobile
NVIDIA Quadro P2000
NVIDIA GeForce GTX 1050 Ti Max-Q
NVIDIA GeForce GTX 1650 Mobile
...
max:
48 [X] Asus TUF FX505DT AMD Ryzen 7 3750H 2.3GHz
GeForce GTX 1650 Mobile
min:
37 fps, max:
60 fps
49 [X] Asus TUF FX705DT-AU068T AMD Ryzen 5 3550H 2.1GHz
GeForce GTX 1650 Mobile
49 54 [X] Lenovo Yoga Creator 7 15IMH05 82DS000VGE Intel Core i7-10750H 2.6GHz
GeForce GTX 1650 Mobile
min:
48 fps, max:
65 fps
56 [X] Asus TUF FX705DT-AU068T Dual-Channel
AMD Ryzen 5 3550H 2.1GHz
GeForce GTX 1650 Mobile
57 61 [X] Lenovo IdeaPad Gaming 3i 15IMH05 Intel Core i5-10300H 2.5GHz
GeForce GTX 1650 Mobile
~ 53 fps
+ Compare
- Hide Comparison
+ 📈 Graph
- 📈 Hide Graph
0 Tooltip TUF FX505DT: Ø48.3 (37-60)
Yoga Creator 7 15IMH05 82DS000VGE: Ø54.4 (48-65)
Aspire 7 A715-42G-R0XB: Ø57.2 (48-66)
...
NVIDIA GeForce GTX 1050 Ti Max-Q
NVIDIA GeForce GTX 1050 Ti Mobile
AMD Radeon RX Vega M GH
NVIDIA GeForce GTX 1650 Mobile
...
max:
44 [X] Asus TUF FX705DT-AU068T AMD Ryzen 5 3550H 2.1GHz
GeForce GTX 1650 Mobile
45 [X] Asus TUF FX505DT AMD Ryzen 7 3750H 2.3GHz
GeForce GTX 1650 Mobile
min:
35 fps, max:
57 fps
46 50 [X] Lenovo Yoga Creator 7 15IMH05 82DS000VGE Intel Core i7-10750H 2.6GHz
GeForce GTX 1650 Mobile
min:
45 fps, max:
58 fps
53 [X] Asus TUF FX705DT-AU068T Dual-Channel
AMD Ryzen 5 3550H 2.1GHz
GeForce GTX 1650 Mobile
54 57 [X] Lenovo IdeaPad Gaming 3i 15IMH05 Intel Core i5-10300H 2.5GHz
GeForce GTX 1650 Mobile
57 [X] Acer Nitro 5 AN515-45-R05E AMD Ryzen 5 5600H 3.3GHz
GeForce GTX 1650 Mobile
57 [X] Acer Nitro 5 AN517-41-R3FK AMD Ryzen 7 5800H 3.2GHz
GeForce GTX 1650 Mobile
~ 51 fps
+ Compare
- Hide Comparison
+ 📈 Graph
- 📈 Hide Graph
0 Tooltip TUF FX505DT: Ø45.3 (35-57)
Yoga Creator 7 15IMH05 82DS000VGE: Ø50.3 (45-58)
Aspire 7 A715-42G-R0XB: Ø54.4 (46-63)
...
NVIDIA GeForce GTX 1050 Ti Mobile
AMD Radeon RX Vega M GH
NVIDIA GeForce GTX 1650 Mobile
...
max:
0 Tooltip TUF FX505DT: Ø34.5 (29-42)
...
NVIDIA GeForce GTX 1050 Ti Mobile
NVIDIA GeForce GTX 1650 Mobile
...
max:
0 Tooltip TUF FX505DT: Ø17.6 (8-22)
...
NVIDIA GeForce GTX 1050 Max-Q
NVIDIA GeForce GTX 1050 Ti Mobile
NVIDIA GeForce GTX 1050 Ti Max-Q
NVIDIA GeForce GTX 1650 Mobile
NVIDIA Quadro RTX 3000 Max-Q
...
max:
» With all tested laptops playable in detail settings ultra.
Additional Benchmarks
Low Preset TAA 1920x1080
68 [X] Lenovo Yoga Creator 7 15IMH05 82DS000VGE Intel Core i7-10750H 2.6GHz
GeForce GTX 1650 Mobile
min:
58 fps, max:
79 fps
74 [X] Lenovo IdeaPad Gaming 3i 15IMH05 Intel Core i5-10300H 2.5GHz
GeForce GTX 1650 Mobile
...
NVIDIA GeForce GTX 950M
NVIDIA GeForce 940M
NVIDIA GeForce GTX 1650 Mobile
Intel Iris Xe MAX Graphics
AMD Radeon RX Vega M GH
NVIDIA GeForce GTX 1050 Max-Q
...
NVIDIA Quadro RTX 5000 Max-Q
...
NVIDIA GeForce GTX 950M
Intel Iris Xe MAX Graphics
AMD Radeon Pro 560X
NVIDIA GeForce GTX 1050 Max-Q
NVIDIA GeForce GTX 1650 Mobile
AMD Radeon RX Vega M GH
NVIDIA Quadro RTX 5000 Max-Q
69.5 [X] Asus TUF FX705DT-AU068T AMD Ryzen 5 3550H 2.1GHz
GeForce GTX 1650 Mobile
77 [X] Acer Aspire 7 A715-74G-50U5 Intel Core i5-9300H 2.4GHz
GeForce GTX 1650 Mobile
~ 73 fps
+ Compare
- Hide Comparison
...
AMD Radeon Pro 560X
Intel Iris Xe MAX Graphics
NVIDIA GeForce GTX 1050 Max-Q
AMD Radeon RX Vega M GH
NVIDIA GeForce GTX 1650 Mobile
NVIDIA Quadro RTX 5000 Max-Q
max:
» With all tested laptops playable in detail settings ultra.
56.9 [X] Asus TUF FX705DT-AU068T AMD Ryzen 5 3550H 2.1GHz
GeForce GTX 1650 Mobile
59.3 [X] LG Ultra 17U70N Intel Core i5-10210U 1.6GHz
GeForce GTX 1650 Mobile
61.1 [X] SCHENKER XMG Core 14 Intel Core i5-1135G7 2.4GHz
GeForce GTX 1650 Mobile
72 73 [X] Lenovo IdeaPad L340-15IRH 81LK00BMGE Intel Core i5-9300H 2.4GHz
GeForce GTX 1650 Mobile
75.6 [X] Lenovo Yoga Creator 7 15IMH05 82DS000VGE Akkusparmodus
Intel Core i7-10750H 2.6GHz
GeForce GTX 1650 Mobile
75.7 [X] MSI GF75 Thin 10SCXR Intel Core i5-10300H 2.5GHz
GeForce GTX 1650 Mobile
78 [X] HP Omen 15-dc1020ng Intel Core i5-9300H 2.4GHz
GeForce GTX 1650 Mobile
82.8 [X] Lenovo IdeaPad Gaming 3i 15IMH05 Intel Core i5-10300H 2.5GHz
GeForce GTX 1650 Mobile
84.8 [X] HP Omen 15-dc1020ng Dual-Channel-Modus
Intel Core i5-9300H 2.4GHz
GeForce GTX 1650 Mobile
90 93.7 [X] Acer Nitro 5 AN515-45-R05E AMD Ryzen 5 5600H 3.3GHz
GeForce GTX 1650 Mobile
95.1 [X] Acer Nitro 5 AN517-41-R3FK AMD Ryzen 7 5800H 3.2GHz
GeForce GTX 1650 Mobile
95.2 [X] Lenovo Yoga Creator 7 15IMH05 82DS000VGE Intel Core i7-10750H 2.6GHz
GeForce GTX 1650 Mobile
97 100 [X] Lenovo Yoga Creator 7 15IMH05 82DS000VGE Hoechstleistung
Intel Core i7-10750H 2.6GHz
GeForce GTX 1650 Mobile
107 [X] MSI GP75 Leopard 9SC Intel Core i7-9750H 2.6GHz
GeForce GTX 1650 Mobile
107 [X] Acer Nitro 5 AN517-41-R3FK AMD Ryzen 7 5800H 3.2GHz
GeForce GTX 1650 Mobile
~ 84 fps
+ Compare
- Hide Comparison
...
NVIDIA GeForce GTX 1050 Ti Mobile
NVIDIA GeForce GTX 1080 Mobile
NVIDIA GeForce GTX 1650 Mobile
NVIDIA GeForce GTX 1050 Max-Q
NVIDIA GeForce GTX 1050 Ti Max-Q
NVIDIA Quadro P2000
...
max:
50.5 [X] Asus TUF FX705DT-AU068T AMD Ryzen 5 3550H 2.1GHz
GeForce GTX 1650 Mobile
54.4 [X] LG Ultra 17U70N Intel Core i5-10210U 1.6GHz
GeForce GTX 1650 Mobile
54.8 [X] SCHENKER XMG Core 14 Intel Core i5-1135G7 2.4GHz
GeForce GTX 1650 Mobile
61 [X] Lenovo IdeaPad L340-15IRH 81LK00BMGE Intel Core i5-9300H 2.4GHz
GeForce GTX 1650 Mobile
61.8 62 [X] HP Omen 15-dc1020ng Intel Core i5-9300H 2.4GHz
GeForce GTX 1650 Mobile
65.1 [X] MSI GF75 Thin 10SCXR Intel Core i5-10300H 2.5GHz
GeForce GTX 1650 Mobile
66.7 [X] Lenovo Yoga Creator 7 15IMH05 82DS000VGE Akkusparmodus
Intel Core i7-10750H 2.6GHz
GeForce GTX 1650 Mobile
68 73.2 [X] HP Omen 15-dc1020ng Dual-Channel-Modus
Intel Core i5-9300H 2.4GHz
GeForce GTX 1650 Mobile
74.1 [X] Lenovo IdeaPad Gaming 3i 15IMH05 Intel Core i5-10300H 2.5GHz
GeForce GTX 1650 Mobile
79.6 [X] Acer Nitro 5 AN515-45-R05E AMD Ryzen 5 5600H 3.3GHz
GeForce GTX 1650 Mobile
80.4 [X] Acer Nitro 5 AN517-41-R3FK AMD Ryzen 7 5800H 3.2GHz
GeForce GTX 1650 Mobile
83.3 [X] Lenovo Yoga Creator 7 15IMH05 82DS000VGE Intel Core i7-10750H 2.6GHz
GeForce GTX 1650 Mobile
84.6 85.4 [X] Lenovo Yoga Creator 7 15IMH05 82DS000VGE Hoechstleistung
Intel Core i7-10750H 2.6GHz
GeForce GTX 1650 Mobile
92.8 [X] MSI GP75 Leopard 9SC Intel Core i7-9750H 2.6GHz
GeForce GTX 1650 Mobile
93.6 [X] Acer Nitro 5 AN517-41-R3FK AMD Ryzen 7 5800H 3.2GHz
GeForce GTX 1650 Mobile
~ 72 fps
+ Compare
- Hide Comparison
...
NVIDIA T500 Laptop GPU
NVIDIA GeForce GTX 1050 Ti Mobile
NVIDIA Quadro P620
NVIDIA GeForce GTX 1650 Mobile
NVIDIA GeForce GTX 1080 Mobile
NVIDIA Quadro RTX 4000 Max-Q
...
max:
44.5 [X] Asus TUF FX705DT-AU068T AMD Ryzen 5 3550H 2.1GHz
GeForce GTX 1650 Mobile
49.3 [X] LG Ultra 17U70N Intel Core i5-10210U 1.6GHz
GeForce GTX 1650 Mobile
49.4 [X] SCHENKER XMG Core 14 Intel Core i5-1135G7 2.4GHz
GeForce GTX 1650 Mobile
52.9 54.1 [X] Lenovo IdeaPad L340-15IRH 81LK00BMGE Intel Core i5-9300H 2.4GHz
GeForce GTX 1650 Mobile
55 [X] HP Omen 15-dc1020ng Intel Core i5-9300H 2.4GHz
GeForce GTX 1650 Mobile
57.4 [X] MSI GF75 Thin 10SCXR Intel Core i5-10300H 2.5GHz
GeForce GTX 1650 Mobile
58 [X] Lenovo Yoga Creator 7 15IMH05 82DS000VGE Akkusparmodus
Intel Core i7-10750H 2.6GHz
GeForce GTX 1650 Mobile
59.2 64.7 [X] HP Omen 15-dc1020ng Dual-Channel-Modus
Intel Core i5-9300H 2.4GHz
GeForce GTX 1650 Mobile
64.8 [X] Lenovo IdeaPad Gaming 3i 15IMH05 Intel Core i5-10300H 2.5GHz
GeForce GTX 1650 Mobile
67.1 [X] Lenovo Yoga Creator 7 15IMH05 82DS000VGE Intel Core i7-10750H 2.6GHz
GeForce GTX 1650 Mobile
67.8 [X] Acer Nitro 5 AN515-45-R05E AMD Ryzen 5 5600H 3.3GHz
GeForce GTX 1650 Mobile
68.6 [X] Acer Nitro 5 AN517-41-R3FK AMD Ryzen 7 5800H 3.2GHz
GeForce GTX 1650 Mobile
70 71.6 [X] Lenovo Yoga Creator 7 15IMH05 82DS000VGE Hoechstleistung
Intel Core i7-10750H 2.6GHz
GeForce GTX 1650 Mobile
75.5 [X] Acer Nitro 5 AN517-41-R3FK AMD Ryzen 7 5800H 3.2GHz
GeForce GTX 1650 Mobile
77.3 [X] MSI GP75 Leopard 9SC Intel Core i7-9750H 2.6GHz
GeForce GTX 1650 Mobile
~ 62 fps
+ Compare
- Hide Comparison
...
NVIDIA T500 Laptop GPU
NVIDIA GeForce GTX 1050 Ti Mobile
NVIDIA GeForce GTX 1650 Mobile
NVIDIA Quadro P620
NVIDIA GeForce GTX 1050 Max-Q
NVIDIA Quadro RTX 4000 Max-Q
NVIDIA GeForce GTX 1080 Mobile
...
max:
...
NVIDIA Quadro RTX 3000 Max-Q
NVIDIA GeForce RTX 2070 Super Max-Q
NVIDIA GeForce GTX 1650 Mobile
NVIDIA Quadro RTX 4000 (Laptop)
NVIDIA GeForce RTX 2080 Super Mobile
...
max:
» With all tested laptops playable in detail settings high.
...
NVIDIA GeForce GTX 1050 Max-Q
NVIDIA Quadro P2000
NVIDIA GeForce GTX 1050 Ti Mobile
NVIDIA GeForce GTX 1650 Mobile
AMD Radeon RX 5300M
NVIDIA GeForce GTX 1080 Mobile
...
NVIDIA GeForce RTX 2070 Super Mobile
max:
...
AMD Radeon RX 560X (Laptop)
NVIDIA GeForce GTX 1050 Max-Q
NVIDIA Quadro P2000
NVIDIA GeForce GTX 1050 Ti Mobile
NVIDIA GeForce GTX 1650 Mobile
AMD Radeon RX 5300M
...
NVIDIA GeForce RTX 2070 Super Mobile
max:
...
NVIDIA Quadro P2000
NVIDIA GeForce GTX 1050 Ti Mobile
AMD Radeon RX 5300M
NVIDIA GeForce GTX 1650 Mobile
...
NVIDIA GeForce RTX 2070 Super Mobile
max:
NVIDIA Quadro P2000
NVIDIA GeForce GTX 1050 Ti Mobile
NVIDIA GeForce GTX 1650 Mobile
NVIDIA GeForce GTX 1080 Mobile
...
max:
NVIDIA GeForce GTX 1050 Max-Q
NVIDIA GeForce GTX 1050 Ti Mobile
NVIDIA Quadro P2000
NVIDIA GeForce GTX 1650 Mobile
...
max:
» With all tested laptops playable in detail settings ultra.
54.8 [X] Lenovo Ideapad L340-17IRH 81LL001YGE Intel Core i5-9300H 2.4GHz
GeForce GTX 1650 Mobile
67 [X] Asus TUF FX705DT-AU068T AMD Ryzen 5 3550H 2.1GHz
GeForce GTX 1650 Mobile
82.3 [X] LG Ultra 17U70N 1.3
Intel Core i5-10210U 1.6GHz
GeForce GTX 1650 Mobile
87.4 ~ 73 fps
+ Compare
- Hide Comparison
Intel UHD Graphics (Elkhart Lake 16 EU)
...
AMD Radeon Pro WX Vega M GL
NVIDIA GeForce GTX 1050 Ti Mobile
NVIDIA GeForce GTX 1050 Ti Max-Q
NVIDIA GeForce GTX 1650 Mobile
AMD Radeon RX Vega M GH
NVIDIA Quadro T2000 Max-Q
...
max:
47.7 [X] Asus TUF FX705DT-AU068T AMD Ryzen 5 3550H 2.1GHz
GeForce GTX 1650 Mobile
49.1 [X] Lenovo Ideapad L340-17IRH 81LL001YGE Intel Core i5-9300H 2.4GHz
GeForce GTX 1650 Mobile
50.2 [X] LG Ultra 17U70N 1.3
Intel Core i5-10210U 1.6GHz
GeForce GTX 1650 Mobile
51.2 [X] Acer Nitro 5 Intel Core i5-9300H 2.4GHz
GeForce GTX 1650 Mobile
min:
12 fps
52.4 ~ 50 fps
+ Compare
- Hide Comparison
Intel UHD Graphics (Elkhart Lake 16 EU)
...
NVIDIA Quadro T2000 Max-Q
NVIDIA GeForce GTX 1650 Mobile
AMD Radeon RX 5300M
...
max:
31.8 33.6 [X] Asus TUF FX705DT-AU068T AMD Ryzen 5 3550H 2.1GHz
GeForce GTX 1650 Mobile
35.4 [X] Lenovo Ideapad L340-17IRH 81LL001YGE Intel Core i5-9300H 2.4GHz
GeForce GTX 1650 Mobile
35.9 [X] LG Ultra 17U70N 1.3
Intel Core i5-10210U 1.6GHz
GeForce GTX 1650 Mobile
37.2 [X] Acer Nitro 5 Intel Core i5-9300H 2.4GHz
GeForce GTX 1650 Mobile
min:
10 fps
37.6 ~ 35 fps
+ Compare
- Hide Comparison
...
AMD Radeon RX 5300M
NVIDIA Quadro T2000 Max-Q
NVIDIA GeForce GTX 1650 Mobile
...
max:
...
AMD Radeon 680M
NVIDIA GeForce GTX 1650 Mobile
NVIDIA Quadro T2000 Max-Q
...
max:
AMD Radeon RX Vega 6 (Ryzen 4000/5000)
...
NVIDIA GeForce GTX 1050 Ti Max-Q
NVIDIA Quadro P2000
NVIDIA Quadro T2000 Max-Q
NVIDIA GeForce GTX 1650 Mobile
...
max:
» With all tested laptops playable in detail settings med..
Intel Iris Plus Graphics G4 (Ice Lake 48 EU)
...
AMD Radeon RX 560 (Laptop)
NVIDIA GeForce GTX 1050 Ti Mobile
AMD Radeon RX 5300M
AMD Radeon RX 580 (Laptop)
NVIDIA GeForce GTX 1650 Mobile
NVIDIA GeForce RTX 2070 Super Max-Q
...
NVIDIA GeForce RTX 2080 Super Mobile
max:
...
NVIDIA Quadro P2000
NVIDIA GeForce GTX 1050 Ti Mobile
NVIDIA GeForce GTX 1650 Mobile
NVIDIA GeForce RTX 2070 Super Max-Q
NVIDIA GeForce GTX 1080 Mobile
...
max:
» With all tested laptops playable in detail settings ultra.
...
NVIDIA Quadro P1000
AMD Radeon RX 560 (Laptop)
AMD Radeon RX 580 (Laptop)
NVIDIA GeForce GTX 1050 Max-Q
NVIDIA GeForce GTX 1050 Ti Mobile
NVIDIA GeForce GTX 1650 Mobile
NVIDIA GeForce GTX 1080 Mobile
...
max:
...
NVIDIA Quadro P1000
AMD Radeon RX 560 (Laptop)
AMD Radeon RX 580 (Laptop)
NVIDIA GeForce GTX 1050 Max-Q
NVIDIA GeForce GTX 1050 Ti Mobile
NVIDIA GeForce GTX 1650 Mobile
...
max:
...
NVIDIA GeForce GTX 1050 Ti Max-Q
NVIDIA GeForce GTX 1050 Max-Q
NVIDIA GeForce GTX 1050 Ti Mobile
AMD Radeon RX 580 (Laptop)
NVIDIA GeForce GTX 1650 Mobile
...
max:
NVIDIA GeForce GTX 1050 Ti Mobile
NVIDIA GeForce GTX 1650 Mobile
NVIDIA GeForce GTX 1080 Mobile
...
max:
NVIDIA GeForce GTX 950M
NVIDIA GeForce GTX 1050 Ti Mobile
NVIDIA GeForce GTX 1050 Max-Q
NVIDIA GeForce GTX 1650 Mobile
NVIDIA GeForce GTX 1080 Mobile
...
max:
» With all tested laptops playable in detail settings ultra.
...
AMD Radeon RX 560X (Laptop)
NVIDIA GeForce GTX 1050 Ti Mobile
AMD Radeon RX 580 (Laptop)
NVIDIA GeForce GTX 1650 Mobile
NVIDIA GeForce GTX 1080 Mobile
...
...
AMD Radeon Pro 560X
AMD Radeon RX 560 (Laptop)
AMD Radeon RX 560X (Laptop)
NVIDIA GeForce GTX 1050 Ti Mobile
NVIDIA GeForce GTX 1650 Mobile
AMD Radeon RX 580 (Laptop)
...
AMD Radeon RX Vega 8 (Ryzen 2000/3000)
...
AMD Radeon RX 560 (Laptop)
AMD Radeon RX 560X (Laptop)
NVIDIA GeForce GTX 1050 Ti Mobile
NVIDIA GeForce GTX 1650 Mobile
AMD Radeon RX 580 (Laptop)
...
NVIDIA GeForce GTX 1050 Ti Mobile
NVIDIA GeForce GTX 1650 Mobile
NVIDIA GeForce GTX 1080 Mobile
max:
NVIDIA GeForce GTX 1050 Ti Mobile
NVIDIA GeForce GTX 1650 Mobile
NVIDIA GeForce GTX 1080 Mobile
...
max:
» With all tested laptops playable in detail settings ultra.
...
NVIDIA GeForce GTX 950M
NVIDIA GeForce GTX 960M
AMD Radeon RX 560X (Laptop)
NVIDIA GeForce GTX 1050 Max-Q
NVIDIA GeForce GTX 1650 Mobile
AMD Radeon RX 580 (Laptop)
NVIDIA Quadro P620
AMD Radeon RX Vega M GH
AMD Radeon RX 560 (Laptop)
...
...
AMD Radeon RX 560 (Laptop)
NVIDIA Quadro P620
AMD Radeon RX 560X (Laptop)
NVIDIA GeForce GTX 1050 Max-Q
NVIDIA GeForce GTX 1050 Ti Mobile
NVIDIA GeForce GTX 1050 Ti Max-Q
NVIDIA GeForce GTX 1650 Mobile
AMD Radeon RX Vega M GH
AMD Radeon RX 580 (Laptop)
...
...
NVIDIA Quadro P620
AMD Radeon RX 560 (Laptop)
AMD Radeon RX 560X (Laptop)
NVIDIA GeForce GTX 1050 Max-Q
NVIDIA GeForce GTX 1050 Ti Mobile
NVIDIA GeForce GTX 1050 Ti Max-Q
NVIDIA GeForce GTX 1650 Mobile
AMD Radeon RX Vega M GH
AMD Radeon RX 580 (Laptop)
...
max:
...
NVIDIA Quadro P620
AMD Radeon RX 560 (Laptop)
AMD Radeon RX 560X (Laptop)
NVIDIA GeForce GTX 1050 Max-Q
NVIDIA GeForce GTX 1050 Ti Mobile
NVIDIA GeForce GTX 1050 Ti Max-Q
NVIDIA GeForce GTX 1650 Mobile
AMD Radeon RX Vega M GH
AMD Radeon RX 580 (Laptop)
...
max:
» With all tested laptops playable in detail settings ultra.
...
NVIDIA GeForce GTX 950M
NVIDIA GeForce GTX 960M
AMD Radeon RX 560X (Laptop)
NVIDIA GeForce GTX 1050 Ti Mobile
NVIDIA GeForce GTX 1650 Mobile
AMD Radeon RX 580 (Laptop)
...
max:
NVIDIA GeForce GTX 1080 (Desktop)
...
NVIDIA GeForce GTX 950M
NVIDIA GeForce GTX 960M
AMD Radeon RX 560X (Laptop)
NVIDIA GeForce GTX 1050 Ti Mobile
NVIDIA GeForce GTX 1650 Mobile
AMD Radeon RX 580 (Laptop)
...
max:
NVIDIA GeForce GTX 1080 (Desktop)
...
NVIDIA GeForce GTX 960M
AMD Radeon RX 560X (Laptop)
NVIDIA GeForce GTX 1050 Ti Mobile
NVIDIA GeForce GTX 1650 Mobile
AMD Radeon RX 580 (Laptop)
...
max:
NVIDIA GeForce GTX 1050 Ti Mobile
NVIDIA GeForce GTX 1650 Mobile
NVIDIA GeForce GTX 1080 Mobile
...
max:
NVIDIA GeForce GTX 1050 Ti Mobile
NVIDIA GeForce GTX 1650 Mobile
NVIDIA GeForce GTX 1080 Mobile
...
max:
» With all tested laptops playable in detail settings ultra.
...
NVIDIA GeForce GTX 1050 Max-Q
NVIDIA Quadro P2000 Max-Q
NVIDIA GeForce GTX 1050 Ti Max-Q
NVIDIA GeForce GTX 1050 Ti Mobile
NVIDIA Quadro P2000
AMD Radeon RX Vega M GH
NVIDIA GeForce GTX 1650 Mobile
AMD Radeon RX 580 (Laptop)
NVIDIA Quadro RTX 5000 Max-Q
NVIDIA GeForce GTX 1080 Mobile
...
max:
...
NVIDIA Quadro P2000 Max-Q
NVIDIA GeForce GTX 1050 Ti Max-Q
NVIDIA Quadro P2000
NVIDIA GeForce GTX 1050 Ti Mobile
AMD Radeon RX Vega M GH
NVIDIA GeForce GTX 1650 Mobile
AMD Radeon RX 580 (Laptop)
NVIDIA Quadro RTX 5000 Max-Q
...
max:
...
NVIDIA Quadro P2000
NVIDIA Quadro P2000 Max-Q
NVIDIA GeForce GTX 1050 Ti Max-Q
NVIDIA GeForce GTX 1050 Ti Mobile
AMD Radeon RX Vega M GH
NVIDIA GeForce GTX 1650 Mobile
AMD Radeon RX 580 (Laptop)
...
max:
...
NVIDIA Quadro P2000
NVIDIA GeForce GTX 1050 Max-Q
NVIDIA GeForce GTX 1050 Ti Mobile
NVIDIA Quadro P2000 Max-Q
NVIDIA GeForce GTX 1050 Ti Max-Q
NVIDIA GeForce GTX 1650 Mobile
NVIDIA Quadro P5200
...
max:
» With all tested laptops playable in detail settings ultra.
...
NVIDIA GeForce GTX 1050 Max-Q
NVIDIA GeForce GTX 1050 Ti Mobile
AMD Radeon RX 580 (Laptop)
NVIDIA GeForce GTX 1650 Mobile
NVIDIA GeForce GTX 1080 Mobile
...
max:
» With all tested laptops playable in detail settings ultra.
...
NVIDIA GeForce GT 720M
Intel HD Graphics 530
NVIDIA GeForce GTX 1650 Mobile
Intel Iris Plus Graphics G4 (Ice Lake 48 EU)
AMD Radeon RX 560X (Laptop)
Intel Iris Plus Graphics G7 (Ice Lake 64 EU)
Intel HD Graphics 5600
...
AMD Radeon Pro 560X
...
NVIDIA GeForce GT 720M
Intel HD Graphics 530
Intel Iris Plus Graphics G4 (Ice Lake 48 EU)
NVIDIA GeForce GTX 1650 Mobile
Intel Iris Plus Graphics G7 (Ice Lake 64 EU)
AMD Radeon RX 560X (Laptop)
Intel HD Graphics 5600
...
AMD Radeon Pro 560X
...
Intel Iris Plus Graphics G4 (Ice Lake 48 EU)
Intel Iris Plus Graphics G7 (Ice Lake 64 EU)
NVIDIA GeForce GTX 1650 Mobile
AMD Radeon RX 560X (Laptop)
Intel HD Graphics 630
AMD Radeon RX 580 (Laptop)
NVIDIA GeForce GTX 1050 Ti Max-Q
...
AMD Radeon Pro 560X
...
AMD Radeon R9 M280X
AMD Radeon RX Vega 7
NVIDIA GeForce GTX 1650 Mobile
AMD Radeon RX 560X (Laptop)
NVIDIA GeForce GTX 950M
AMD Radeon Pro 555
AMD Radeon RX 580 (Laptop)
NVIDIA GeForce GTX 1080 Mobile
NVIDIA GeForce GTX 1050 Ti Mobile
...
AMD Radeon Pro 560X
max:
AMD Radeon R7 370
» With all tested laptops playable in detail settings ultra.
213.9 [X] Asus TUF FX505DT-EB73 AMD Ryzen 7 3750H 2.3GHz
GeForce GTX 1650 Mobile
247 248 248.4 [X] MSI GF75 Thin 10SCXR Intel Core i5-10300H 2.5GHz
GeForce GTX 1650 Mobile
249 [X] Dell G5 15 5590-PCNJJ Intel Core i5-9300H 2.4GHz
GeForce GTX 1650 Mobile
min:
202 fps
~ 241 fps
+ Compare
- Hide Comparison
Intel HD Graphics (Bay Trail)
...
AMD Radeon RX 560 (Laptop)
NVIDIA Quadro P600
NVIDIA Quadro P1000
AMD Radeon RX 580 (Laptop)
NVIDIA GeForce GTX 1050 Max-Q
NVIDIA GeForce GTX 1650 Mobile
NVIDIA Quadro P4000 Max-Q
NVIDIA GeForce GTX 1050 Ti Mobile
NVIDIA GeForce GTX 960M
NVIDIA Quadro P5200
...
152.5 162.5 [X] Asus TUF FX505DT-EB73 AMD Ryzen 7 3750H 2.3GHz
GeForce GTX 1650 Mobile
188.7 198.5 [X] MSI GF75 Thin 10SCXR Intel Core i5-10300H 2.5GHz
GeForce GTX 1650 Mobile
204 [X] Dell G5 15 5590-PCNJJ Intel Core i5-9300H 2.4GHz
GeForce GTX 1650 Mobile
min:
166 fps
229 [X] Acer Nitro 5 Intel Core i5-9300H 2.4GHz
GeForce GTX 1650 Mobile
min:
185 fps
~ 189 fps
+ Compare
- Hide Comparison
...
NVIDIA Quadro P620
NVIDIA GeForce GTX 1050 Max-Q
NVIDIA Quadro P2000
NVIDIA GeForce GTX 1050 Ti Max-Q
NVIDIA GeForce GTX 1050 Ti Mobile
NVIDIA GeForce GTX 1650 Mobile
NVIDIA Quadro P4000 Max-Q
AMD Radeon RX 580 (Laptop)
NVIDIA Quadro P5200
...
max:
96.4 127.5 [X] Asus TUF FX505DT-EB73 AMD Ryzen 7 3750H 2.3GHz
GeForce GTX 1650 Mobile
136 [X] Dell G5 15 5590-PCNJJ Intel Core i5-9300H 2.4GHz
GeForce GTX 1650 Mobile
min:
112 fps
137.2 150 [X] Acer Nitro 5 Intel Core i5-9300H 2.4GHz
GeForce GTX 1650 Mobile
min:
124 fps
162.2 [X] MSI GF75 Thin 10SCXR Intel Core i5-10300H 2.5GHz
GeForce GTX 1650 Mobile
~ 135 fps
+ Compare
- Hide Comparison
...
AMD Radeon Pro WX Vega M GL
NVIDIA Quadro P2000
NVIDIA GeForce GTX 1050 Ti Max-Q
NVIDIA GeForce GTX 1050 Ti Mobile
NVIDIA GeForce GTX 1650 Mobile
AMD Radeon RX Vega M GH
NVIDIA Quadro P4000 Max-Q
AMD Radeon RX 580 (Laptop)
...
max:
NVIDIA Titan X Pascal
...
AMD Radeon Pro 560X
AMD Radeon Pro WX Vega M GL
NVIDIA GeForce GTX 1050 Max-Q
NVIDIA Quadro P2000
NVIDIA GeForce GTX 1050 Ti Max-Q
NVIDIA GeForce GTX 1650 Mobile
AMD Radeon RX Vega M GH
NVIDIA GeForce GTX 1050 Ti Mobile
...
max:
» With all tested laptops playable in detail settings high.
Additional Benchmarks
Performance 1920x1080
189.8 [X] Asus TUF FX505DT-EB73 AMD Ryzen 7 3750H 2.3GHz
GeForce GTX 1650 Mobile
228.2 [X] MSI GF75 Thin 10SCXR Intel Core i5-10300H 2.5GHz
GeForce GTX 1650 Mobile
...
NVIDIA Quadro P2000
AMD Radeon Pro WX Vega M GL
NVIDIA GeForce GTX 1050 Ti Mobile
NVIDIA Quadro P2000 Max-Q
AMD Radeon RX Vega M GH
NVIDIA GeForce GTX 1650 Mobile
NVIDIA Quadro P4000 Max-Q
...
NVIDIA Quadro P5200
...
AMD Radeon Pro WX Vega M GL
NVIDIA Quadro P2000
NVIDIA GeForce GTX 1050 Ti Mobile
AMD Radeon RX Vega M GH
AMD Radeon RX 580 (Laptop)
NVIDIA GeForce GTX 1650 Mobile
NVIDIA Quadro P2000 Max-Q
NVIDIA Quadro P4000 Max-Q
...
NVIDIA Quadro P5200
AMD Radeon R5 (Bristol Ridge)
...
NVIDIA GeForce GTX 1050 Ti Max-Q
NVIDIA Quadro P2000
AMD Radeon Pro WX Vega M GL
NVIDIA GeForce GTX 1050 Ti Mobile
AMD Radeon RX Vega M GH
NVIDIA GeForce GTX 1650 Mobile
AMD Radeon RX 580 (Laptop)
NVIDIA Quadro P2000 Max-Q
NVIDIA Quadro P4000 Max-Q
...
NVIDIA Quadro P5200
AMD Radeon Pro WX Vega M GL
NVIDIA Quadro P2000
NVIDIA GeForce GTX 1050 Ti Max-Q
AMD Radeon RX 580 (Laptop)
NVIDIA GeForce GTX 1650 Mobile
NVIDIA Quadro P2000 Max-Q
NVIDIA Quadro P4000 Max-Q
...
max:
» With all tested laptops playable in detail settings ultra.
...
NVIDIA GeForce GTX 1050 Ti Max-Q
NVIDIA GeForce GTX 1050 Ti Mobile
AMD Radeon RX 580 (Laptop)
NVIDIA GeForce GTX 1650 Mobile
NVIDIA Quadro P3200
NVIDIA Quadro RTX 5000 Max-Q
...
max:
...
NVIDIA GeForce GTX 1050 Ti Max-Q
NVIDIA GeForce GTX 1050 Ti Mobile
AMD Radeon RX 580 (Laptop)
NVIDIA GeForce GTX 1650 Mobile
NVIDIA Quadro P3200
NVIDIA Quadro RTX 5000 Max-Q
...
max:
...
NVIDIA GeForce GTX 1050 Ti Mobile
NVIDIA GeForce GTX 1050 Ti Max-Q
AMD Radeon RX 580 (Laptop)
NVIDIA GeForce GTX 1650 Mobile
NVIDIA Quadro P3200
...
max:
NVIDIA Titan RTX
NVIDIA GeForce GTX 1050 Max-Q
NVIDIA GeForce GTX 1050 Ti Max-Q
NVIDIA GeForce GTX 1650 Mobile
AMD Radeon RX 580 (Laptop)
...
max:
NVIDIA Titan RTX
» With all tested laptops playable in detail settings high.
...
NVIDIA GeForce GTX 1050 Ti Mobile
NVIDIA GeForce GTX 1050 Ti Max-Q
AMD Radeon Pro 560X
NVIDIA GeForce GTX 1650 Mobile
AMD Radeon RX 580 (Laptop)
NVIDIA Quadro P3200
...
max:
...
NVIDIA GeForce GTX 1050 Ti Mobile
NVIDIA GeForce GTX 1050 Ti Max-Q
NVIDIA GeForce GTX 1650 Mobile
AMD Radeon RX 580 (Laptop)
NVIDIA Quadro P3200
...
max:
...
NVIDIA GeForce GTX 1050 Ti Mobile
NVIDIA GeForce GTX 1050 Ti Max-Q
NVIDIA GeForce GTX 1650 Mobile
AMD Radeon RX 580 (Laptop)
NVIDIA Quadro P3200
...
max:
NVIDIA Titan RTX
NVIDIA GeForce GTX 1050 Max-Q
NVIDIA GeForce GTX 1050 Ti Max-Q
NVIDIA GeForce GTX 1650 Mobile
AMD Radeon RX 580 (Laptop)
...
» With all tested laptops playable in detail settings ultra.
...
NVIDIA Quadro P2000
NVIDIA GeForce GTX 1050 Ti Mobile
AMD Radeon Pro 555
NVIDIA GeForce GTX 1650 Mobile
AMD Radeon RX 580 (Laptop)
NVIDIA Quadro P4000 Max-Q
NVIDIA GeForce GTX 1080 Mobile
...
max:
...
AMD Radeon RX 560X (Laptop)
NVIDIA Quadro P2000
NVIDIA GeForce GTX 1050 Ti Mobile
NVIDIA GeForce GTX 1650 Mobile
AMD Radeon RX 580 (Laptop)
NVIDIA Quadro P4000 Max-Q
...
max:
...
NVIDIA Quadro P2000
NVIDIA GeForce GTX 1050 Ti Mobile
AMD Radeon RX 560X (Laptop)
AMD Radeon Pro 555
NVIDIA GeForce GTX 1650 Mobile
AMD Radeon RX 580 (Laptop)
NVIDIA Quadro P4000 Max-Q
...
max:
NVIDIA Quadro P2000
NVIDIA GeForce GTX 1650 Mobile
AMD Radeon RX 580 (Laptop)
...
max:
» With all tested laptops playable in detail settings ultra.
...
NVIDIA GeForce GTX 1050 Ti Mobile
AMD Radeon RX 580 (Laptop)
NVIDIA GeForce GTX 1650 Mobile
NVIDIA GeForce GTX 1080 Mobile
...
max:
NVIDIA Titan RTX
AMD Radeon RX Vega 8 (Ryzen 2000/3000)
...
NVIDIA GeForce GTX 960M
AMD Radeon RX 560X (Laptop)
NVIDIA GeForce GTX 1050 Ti Mobile
NVIDIA GeForce GTX 1650 Mobile
AMD Radeon RX 580 (Laptop)
...
NVIDIA GeForce GTX 1050 Ti Mobile
AMD Radeon RX 580 (Laptop)
NVIDIA GeForce GTX 1650 Mobile
NVIDIA GeForce GTX 1080 Mobile
...
max:
NVIDIA Titan RTX
» With all tested laptops playable in detail settings ultra.
...
AMD Radeon HD 8970M
NVIDIA GeForce GTX 1050 Ti Max-Q
NVIDIA GeForce GTX 1050 Ti Mobile
NVIDIA GeForce GTX 1650 Mobile
AMD Radeon HD 8970M Crossfire
AMD Radeon RX 580 (Laptop)
NVIDIA Quadro P3200
...
max:
...
AMD Radeon HD 8970M
NVIDIA GeForce GTX 1050 Ti Max-Q
NVIDIA GeForce GTX 1050 Ti Mobile
AMD Radeon HD 8970M Crossfire
NVIDIA GeForce GTX 1650 Mobile
AMD Radeon RX 580 (Laptop)
NVIDIA Quadro P3200
...
max:
» With all tested laptops playable in detail settings ultra.
...
Apple M1 7-Core GPU
NVIDIA GeForce GTX 960M
NVIDIA GeForce GTX 1050 Ti Mobile
AMD Radeon RX 580 (Laptop)
AMD Radeon RX 560X (Laptop)
NVIDIA GeForce GTX 1650 Mobile
NVIDIA GeForce GTX 1050 Ti Max-Q
NVIDIA Quadro P1000
NVIDIA Quadro P2000
Apple M1 Pro 14-Core GPU
NVIDIA GeForce GTX 1050 Max-Q
...
NVIDIA Quadro P1000
Apple M1 Pro 14-Core GPU
NVIDIA Quadro P4000 Max-Q
NVIDIA GeForce GTX 1050 Ti Mobile
AMD Radeon RX 560X (Laptop)
NVIDIA GeForce GTX 1050 Max-Q
NVIDIA GeForce GTX 1650 Mobile
AMD Radeon RX 580 (Laptop)
NVIDIA GeForce GTX 1050 Ti Max-Q
NVIDIA Quadro P2000
...
NVIDIA Quadro P4000
Apple M1 Pro 16-Core GPU
NVIDIA GeForce GTX 1050 Ti Mobile
NVIDIA Quadro P2000
NVIDIA GeForce GTX 1050 Ti Max-Q
NVIDIA GeForce GTX 1650 Mobile
NVIDIA Quadro P4000 Max-Q
AMD Radeon RX 580 (Laptop)
...
AMD Radeon RX 560X (Laptop)
NVIDIA GeForce GTX 1050 Ti Max-Q
NVIDIA Quadro P4000
NVIDIA GeForce GTX 1050 Ti Mobile
Apple M1 Pro 16-Core GPU
NVIDIA Quadro P2000
NVIDIA GeForce GTX 1650 Mobile
NVIDIA Quadro P4000 Max-Q
AMD Radeon RX 580 (Laptop)
NVIDIA GeForce GTX 1080 Mobile
» With all tested laptops playable in detail settings ultra.
...
NVIDIA Quadro P2000
NVIDIA GeForce GTX 1050 Ti Mobile
AMD Radeon RX Vega M GH
NVIDIA GeForce GTX 1650 Mobile
Apple M1 Pro 16-Core GPU
AMD Radeon RX 580 (Laptop)
NVIDIA Quadro P4000 Max-Q
...
max:
...
AMD Radeon HD 8970M Crossfire
NVIDIA GeForce GTX 1050 Ti Mobile
NVIDIA GeForce GTX 1050 Max-Q
AMD Radeon RX Vega M GH
NVIDIA GeForce GTX 1650 Mobile
AMD Radeon RX 580 (Laptop)
NVIDIA Quadro P4000 Max-Q
Apple M1 Pro 16-Core GPU
...
NVIDIA GeForce GTX 1050 Max-Q
...
NVIDIA Quadro P2000 Max-Q
NVIDIA Quadro P2000
NVIDIA GeForce GTX 1050 Ti Mobile
NVIDIA GeForce GTX 1650 Mobile
AMD Radeon RX 580 (Laptop)
NVIDIA Quadro P4000 Max-Q
...
max:
NVIDIA Titan RTX
» With all tested laptops playable in detail settings high.
...
NVIDIA GeForce GTX 1050 Ti Mobile
NVIDIA GeForce GTX 1650 Mobile
AMD Radeon RX 580 (Laptop)
NVIDIA GeForce GTX 980 (Laptop)
...
...
AMD Radeon RX 560X (Laptop)
NVIDIA GeForce GTX 1050 Ti Mobile
NVIDIA GeForce GTX 1650 Mobile
AMD Radeon RX 580 (Laptop)
NVIDIA GeForce GTX 980 (Laptop)
...
...
NVIDIA GeForce GTX 1050 Ti Mobile
NVIDIA GeForce GTX 1650 Mobile
AMD Radeon RX 580 (Laptop)
NVIDIA GeForce GTX 980 (Laptop)
...
» With all tested laptops playable in detail settings ultra.
...
AMD Radeon RX Vega 7
AMD Radeon 540X
NVIDIA GeForce GTX 950M
AMD Radeon Pro 450
AMD Radeon HD 8970M Crossfire
NVIDIA GeForce GTX 1650 Mobile
AMD Radeon HD 8970M
NVIDIA GeForce GTX 860M
AMD Radeon Pro 455
NVIDIA GeForce GTX 960M
AMD Radeon Pro WX Vega M GL
AMD Radeon Pro 460
...
133.2 [X] Asus TUF FX505DT-EB73 AMD Ryzen 7 3750H 2.3GHz
GeForce GTX 1650 Mobile
147 [X] Acer Nitro 5 Intel Core i5-9300H 2.4GHz
GeForce GTX 1650 Mobile
min:
121 fps
~ 140 fps
+ Compare
- Hide Comparison
...
AMD Radeon Pro WX Vega M GL
AMD Radeon HD 8970M Crossfire
NVIDIA GeForce GTX 1050 Ti Mobile
AMD Radeon HD 8970M
NVIDIA GeForce GTX 1050 Ti Max-Q
NVIDIA GeForce GTX 1650 Mobile
AMD Radeon RX Vega M GH
AMD Radeon RX 580 (Laptop)
NVIDIA GeForce GTX 980 (Laptop)
...
AMD Radeon R5 (Bristol Ridge)
...
NVIDIA GeForce GTX 1050 Ti Mobile
AMD Radeon HD 8970M Crossfire
NVIDIA GeForce GTX 1050 Ti Max-Q
AMD Radeon RX Vega M GH
NVIDIA GeForce GTX 1650 Mobile
AMD Radeon RX 580 (Laptop)
NVIDIA GeForce GTX 980 (Laptop)
...
max:
NVIDIA Titan RTX
...
NVIDIA GeForce GTX 1050 Max-Q
AMD Radeon Pro WX Vega M GL
NVIDIA GeForce GTX 1050 Ti Mobile
NVIDIA GeForce GTX 1050 Ti Max-Q
NVIDIA GeForce GTX 1650 Mobile
NVIDIA GeForce GTX 980 (Laptop)
...
max:
NVIDIA Titan RTX
» With all tested laptops playable in detail settings ultra.
Additional Benchmarks
Epic (Render Scale 100 %) 16xAF SMAA 2560x1440
57.9 [X] MSI GP75 Leopard 9SC Intel Core i7-9750H 2.6GHz
GeForce GTX 1650 Mobile
min:
49 fps
...
NVIDIA Quadro P2000
NVIDIA Quadro P2000 Max-Q
AMD Radeon RX 580 (Laptop)
NVIDIA GeForce GTX 1050 Ti Mobile
NVIDIA Quadro P4000
NVIDIA Quadro P4000 Max-Q
NVIDIA GeForce GTX 1650 Mobile
NVIDIA GeForce GTX 980 (Laptop)
...
...
AMD Radeon RX 580 (Laptop)
NVIDIA Quadro P4000
NVIDIA Quadro P4000 Max-Q
NVIDIA GeForce GTX 980 (Laptop)
NVIDIA GeForce GTX 1650 Mobile
...
max:
...
NVIDIA Quadro P2000
NVIDIA Quadro P2000 Max-Q
NVIDIA GeForce GTX 1050 Ti Mobile
AMD Radeon RX 580 (Laptop)
NVIDIA GeForce GTX 1650 Mobile
NVIDIA Quadro P4000 Max-Q
NVIDIA GeForce GTX 980 (Laptop)
NVIDIA GeForce GTX 1080 Mobile
...
max:
NVIDIA Titan RTX
» With all tested laptops playable in detail settings ultra.
...
NVIDIA GeForce GTX 950M
AMD Radeon Pro 455
AMD Radeon RX 580 (Laptop)
AMD Radeon Pro 555
AMD Radeon RX 560X (Laptop)
NVIDIA GeForce GTX 1650 Mobile
AMD Radeon Pro WX Vega M GL
NVIDIA Quadro P620
NVIDIA GeForce GTX 1050 Max-Q
NVIDIA Quadro P2000 Max-Q
NVIDIA GeForce GTX 1050 Ti Mobile
...
NVIDIA Quadro P5200
40 [X] Asus TUF FX505DT-EB73 AMD Ryzen 7 3750H 2.3GHz
GeForce GTX 1650 Mobile
40.6 [X] Asus TUF FX705DT-AU068T AMD Ryzen 5 3550H 2.1GHz
GeForce GTX 1650 Mobile
~ 40 fps
+ Compare
- Hide Comparison
AMD Radeon R5 (Bristol Ridge)
...
NVIDIA Quadro P620
AMD Radeon RX 580 (Laptop)
AMD Radeon RX 560X (Laptop)
NVIDIA GeForce GTX 1050 Max-Q
AMD Radeon Pro WX Vega M GL
NVIDIA Quadro P2000 Max-Q
NVIDIA GeForce GTX 1650 Mobile
NVIDIA Quadro P2000
NVIDIA GeForce GTX 1050 Ti Mobile
NVIDIA GeForce GTX 1050 Ti Max-Q
AMD Radeon RX Vega M GH
NVIDIA GeForce GTX 1080 Mobile
...
36 [X] Asus TUF FX505DT-EB73 AMD Ryzen 7 3750H 2.3GHz
GeForce GTX 1650 Mobile
36.5 [X] Asus TUF FX705DT-AU068T AMD Ryzen 5 3550H 2.1GHz
GeForce GTX 1650 Mobile
~ 36 fps
+ Compare
- Hide Comparison
AMD Radeon RX Vega 6 (Ryzen 2000/3000)
...
NVIDIA Quadro P620
NVIDIA GeForce GTX 1050 Max-Q
AMD Radeon RX 580 (Laptop)
NVIDIA Quadro P2000 Max-Q
NVIDIA GeForce GTX 1050 Ti Mobile
NVIDIA GeForce GTX 1050 Ti Max-Q
NVIDIA GeForce GTX 1650 Mobile
AMD Radeon RX Vega M GH
NVIDIA GeForce GTX 1080 Mobile
NVIDIA Quadro P4000 Max-Q
...
» With all tested laptops playable in detail settings high.
...
NVIDIA Quadro M3000M
NVIDIA Quadro P4000
NVIDIA GeForce GTX 1050 Ti Max-Q
NVIDIA GeForce GTX 1650 Mobile
AMD Radeon HD 8970M Crossfire
AMD Radeon RX Vega M GH
NVIDIA Quadro P3200
...
NVIDIA Quadro P5200
max:
...
AMD Radeon Pro WX Vega M GL
NVIDIA Quadro M4000M
AMD Radeon RX Vega M GH
NVIDIA GeForce GTX 1650 Mobile
NVIDIA Quadro P4000
AMD Radeon HD 8970M Crossfire
AMD Radeon RX 580 (Laptop)
NVIDIA Quadro RTX 3000 Max-Q
...
NVIDIA Quadro P5200
max:
Intel HD Graphics (Haswell)
...
NVIDIA GeForce GTX 1050 Ti Max-Q
AMD Radeon RX Vega M GH
NVIDIA Quadro M4000M
AMD Radeon HD 8970M Crossfire
NVIDIA GeForce GTX 1650 Mobile
AMD Radeon RX 580 (Laptop)
NVIDIA Quadro P4000
NVIDIA Quadro P4000 Max-Q
...
max:
Intel HD Graphics (Haswell)
...
Apple M1 8-Core GPU
AMD Radeon RX Vega M GH
AMD Radeon HD 8970M Crossfire
NVIDIA Quadro M4000M
NVIDIA GeForce GTX 1650 Mobile
AMD Radeon RX 580 (Laptop)
NVIDIA Quadro P4000 Max-Q
NVIDIA Quadro P4000
...
max:
...
NVIDIA Quadro P2000 Max-Q
NVIDIA Quadro P2000
NVIDIA GeForce GTX 1050 Ti Mobile
NVIDIA GeForce GTX 1050 Ti Max-Q
NVIDIA Quadro M4000M
NVIDIA GeForce GTX 1650 Mobile
AMD Radeon RX 580 (Laptop)
NVIDIA Quadro P3200
NVIDIA Quadro P4000 Max-Q
...
max:
» With all tested laptops playable in detail settings ultra.
...
NVIDIA Quadro P3200
AMD Radeon RX 580 (Laptop)
NVIDIA GeForce GTX 980 (Laptop)
NVIDIA GeForce GTX 1650 Mobile
NVIDIA Quadro RTX 5000 Max-Q
...
max:
...
NVIDIA Quadro P3200
NVIDIA GeForce GTX 980 (Laptop)
AMD Radeon RX 580 (Laptop)
NVIDIA GeForce GTX 1650 Mobile
...
max:
...
AMD Radeon RX 580 (Laptop)
NVIDIA GeForce GTX 1650 Mobile
NVIDIA GeForce GTX 980 (Laptop)
...
max:
NVIDIA Titan RTX
» With all tested laptops playable in detail settings ultra.
Intel HD Graphics (Bay Trail)
...
AMD Radeon RX Vega 7
Intel Iris Pro Graphics 5200
NVIDIA GeForce 940M
Intel Iris Graphics 550
NVIDIA GeForce GTX 1650 Mobile
AMD Radeon RX 560X (Laptop)
NVIDIA GeForce 945M
AMD Radeon RX 580 (Laptop)
NVIDIA GeForce GTX 960M
...
max:
NVIDIA GeForce GTX 1080 (Desktop)
...
AMD Radeon 540X
AMD Radeon RX Vega 7
NVIDIA GeForce 940M
NVIDIA GeForce GTX 950M
NVIDIA GeForce GTX 1650 Mobile
AMD Radeon RX 560X (Laptop)
NVIDIA GeForce 945M
AMD Radeon RX 580 (Laptop)
...
max:
NVIDIA GeForce GTX 1080 (Desktop)
...
NVIDIA GeForce 945M
NVIDIA GeForce GTX 950M
AMD Radeon Pro 455
AMD Radeon RX 560X (Laptop)
NVIDIA GeForce GTX 1650 Mobile
NVIDIA GeForce GTX 960M
AMD Radeon RX 580 (Laptop)
AMD Radeon HD 8970M
NVIDIA GeForce GTX 1050 Max-Q
NVIDIA GeForce GTX 1050 Ti Max-Q
NVIDIA GeForce GTX 1050 Ti Mobile
...
max:
NVIDIA GeForce GTX 1080 (Desktop)
...
AMD Radeon Pro 455
AMD Radeon Pro 560X
NVIDIA GeForce GTX 960M
AMD Radeon RX 560X (Laptop)
AMD Radeon R9 M390
AMD Radeon HD 8970M
NVIDIA GeForce GTX 1050 Max-Q
NVIDIA GeForce GTX 1650 Mobile
NVIDIA GeForce GTX 780M
AMD Radeon RX 580 (Laptop)
NVIDIA GeForce GTX 1050 Ti Max-Q
NVIDIA GeForce GTX 1050 Ti Mobile
...
max:
» With all tested laptops playable in detail settings ultra.
75.8 [X] Asus TUF FX705DT-AU068T AMD Ryzen 5 3550H 2.1GHz
GeForce GTX 1650 Mobile
84.1 [X] Asus TUF FX705DT-AU068T Dual-Channel
AMD Ryzen 5 3550H 2.1GHz
GeForce GTX 1650 Mobile
94.2 99.4 111 [X] SCHENKER XMG Core 14 Intel Core i5-1135G7 2.4GHz
GeForce GTX 1650 Mobile
min:
95 fps, max:
-1 fps
112 [X] LG Ultra 17U70N Intel Core i5-10210U 1.6GHz
GeForce GTX 1650 Mobile
min:
95.3 fps, max:
-1 fps
114 [X] HP Omen 15-dc1020ng Intel Core i5-9300H 2.4GHz
GeForce GTX 1650 Mobile
min:
101.9 fps
114 [X] Lenovo IdeaPad L340-15IRH 81LK00BMGE Intel Core i5-9300H 2.4GHz
GeForce GTX 1650 Mobile
min:
103 fps
117 [X] MSI GF75 Thin 10SCXR Intel Core i5-10300H 2.5GHz
GeForce GTX 1650 Mobile
min:
105.1 fps
121 122.2 [X] HP Omen 15-dc1020ng Dual-Channel-Modus
Intel Core i5-9300H 2.4GHz
GeForce GTX 1650 Mobile
128 132 [X] Acer Nitro 5 AN515-45-R05E AMD Ryzen 5 5600H 3.3GHz
GeForce GTX 1650 Mobile
min:
117.2 fps, max:
-1 fps
133.9 [X] Lenovo IdeaPad Gaming 3i 15IMH05 Intel Core i5-10300H 2.5GHz
GeForce GTX 1650 Mobile
min:
116.9 fps, max:
-1 fps
134 [X] Lenovo Yoga Creator 7 15IMH05 82DS000VGE Akkusparmodus
Intel Core i7-10750H 2.6GHz
GeForce GTX 1650 Mobile
min:
116.5 fps, max:
-1 fps
138 [X] Acer Nitro 5 AN517-41-R3FK AMD Ryzen 7 5800H 3.2GHz
GeForce GTX 1650 Mobile
min:
110.9 fps, max:
-1 fps
144 [X] Acer Nitro 5 AN517-41-R3FK AMD Ryzen 7 5800H 3.2GHz
GeForce GTX 1650 Mobile
min:
127.8 fps, max:
-1 fps
145 [X] MSI GP75 Leopard 9SC Intel Core i7-9750H 2.6GHz
GeForce GTX 1650 Mobile
min:
127.9 fps
146 [X] Lenovo Yoga Creator 7 15IMH05 82DS000VGE Intel Core i7-10750H 2.6GHz
GeForce GTX 1650 Mobile
min:
126.2 fps, max:
-1 fps
148 [X] Lenovo Yoga Creator 7 15IMH05 82DS000VGE Hoechstleistung
Intel Core i7-10750H 2.6GHz
GeForce GTX 1650 Mobile
min:
128.3 fps, max:
-1 fps
~ 121 fps
+ Compare
- Hide Comparison
...
AMD Radeon 680M
Intel UHD Graphics Xe 32EUs (Tiger Lake-H)
NVIDIA Quadro P600
Intel HD Graphics 630
NVIDIA GeForce GTX 1650 Mobile
NVIDIA GeForce GTX 1050 Ti Mobile
NVIDIA Quadro P520
...
max:
69.1 [X] Asus TUF FX705DT-AU068T AMD Ryzen 5 3550H 2.1GHz
GeForce GTX 1650 Mobile
78.2 [X] Asus TUF FX705DT-AU068T Dual-Channel
AMD Ryzen 5 3550H 2.1GHz
GeForce GTX 1650 Mobile
90.6 90.8 [X] SCHENKER XMG Core 14 Intel Core i5-1135G7 2.4GHz
GeForce GTX 1650 Mobile
min:
77.2 fps, max:
-1 fps
96.9 97 [X] Lenovo IdeaPad L340-15IRH 81LK00BMGE Intel Core i5-9300H 2.4GHz
GeForce GTX 1650 Mobile
min:
78.9 fps
97.6 [X] LG Ultra 17U70N Intel Core i5-10210U 1.6GHz
GeForce GTX 1650 Mobile
min:
84.9 fps, max:
-1 fps
103 [X] HP Omen 15-dc1020ng Intel Core i5-9300H 2.4GHz
GeForce GTX 1650 Mobile
min:
90.5 fps
104 [X] MSI GF75 Thin 10SCXR Intel Core i5-10300H 2.5GHz
GeForce GTX 1650 Mobile
min:
91.5 fps
104.1 [X] HP Omen 15-dc1020ng Dual-Channel-Modus
Intel Core i5-9300H 2.4GHz
GeForce GTX 1650 Mobile
109 112 [X] Lenovo Yoga Creator 7 15IMH05 82DS000VGE Akkusparmodus
Intel Core i7-10750H 2.6GHz
GeForce GTX 1650 Mobile
min:
95.9 fps, max:
-1 fps
121.5 [X] Lenovo IdeaPad Gaming 3i 15IMH05 Intel Core i5-10300H 2.5GHz
GeForce GTX 1650 Mobile
min:
106.3 fps, max:
-1 fps
122 127 [X] Acer Nitro 5 AN517-41-R3FK AMD Ryzen 7 5800H 3.2GHz
GeForce GTX 1650 Mobile
min:
112.5 fps, max:
-1 fps
128 [X] Acer Nitro 5 AN515-45-R05E AMD Ryzen 5 5600H 3.3GHz
GeForce GTX 1650 Mobile
min:
112.6 fps, max:
-1 fps
131 [X] Acer Nitro 5 AN517-41-R3FK AMD Ryzen 7 5800H 3.2GHz
GeForce GTX 1650 Mobile
min:
115 fps, max:
-1 fps
132 [X] MSI GP75 Leopard 9SC Intel Core i7-9750H 2.6GHz
GeForce GTX 1650 Mobile
min:
115.9 fps
132 [X] Lenovo Yoga Creator 7 15IMH05 82DS000VGE Hoechstleistung
Intel Core i7-10750H 2.6GHz
GeForce GTX 1650 Mobile
min:
115.3 fps, max:
-1 fps
136 [X] Lenovo Yoga Creator 7 15IMH05 82DS000VGE Intel Core i7-10750H 2.6GHz
GeForce GTX 1650 Mobile
min:
115.8 fps, max:
-1 fps
~ 109 fps
+ Compare
- Hide Comparison
...
NVIDIA Quadro P600
AMD Radeon RX 5300M
NVIDIA GeForce GTX 1050 Ti Mobile
NVIDIA GeForce GTX 1650 Mobile
NVIDIA Quadro P2000
NVIDIA Quadro RTX 4000 Max-Q
NVIDIA T500 Laptop GPU
...
max:
NVIDIA GeForce RTX 3070 Ti
63.3 [X] Asus TUF FX705DT-AU068T AMD Ryzen 5 3550H 2.1GHz
GeForce GTX 1650 Mobile
73.9 [X] Asus TUF FX705DT-AU068T Dual-Channel
AMD Ryzen 5 3550H 2.1GHz
GeForce GTX 1650 Mobile
79 [X] Lenovo IdeaPad L340-15IRH 81LK00BMGE Intel Core i5-9300H 2.4GHz
GeForce GTX 1650 Mobile
min:
70.3 fps
82.2 84.9 87.5 [X] SCHENKER XMG Core 14 Intel Core i5-1135G7 2.4GHz
GeForce GTX 1650 Mobile
min:
75.9 fps, max:
-1 fps
89 [X] HP Omen 15-dc1020ng Intel Core i5-9300H 2.4GHz
GeForce GTX 1650 Mobile
min:
73.8 fps
92.9 [X] LG Ultra 17U70N Intel Core i5-10210U 1.6GHz
GeForce GTX 1650 Mobile
min:
79.9 fps, max:
-1 fps
93.7 [X] MSI GF75 Thin 10SCXR Intel Core i5-10300H 2.5GHz
GeForce GTX 1650 Mobile
min:
83.5 fps
94 98.5 [X] HP Omen 15-dc1020ng Dual-Channel-Modus
Intel Core i5-9300H 2.4GHz
GeForce GTX 1650 Mobile
103 [X] Lenovo Yoga Creator 7 15IMH05 82DS000VGE Akkusparmodus
Intel Core i7-10750H 2.6GHz
GeForce GTX 1650 Mobile
min:
89.6 fps, max:
-1 fps
112 [X] Acer Nitro 5 AN515-45-R05E AMD Ryzen 5 5600H 3.3GHz
GeForce GTX 1650 Mobile
min:
98.8 fps, max:
-1 fps
112 113 [X] Acer Nitro 5 AN517-41-R3FK AMD Ryzen 7 5800H 3.2GHz
GeForce GTX 1650 Mobile
min:
99.4 fps, max:
-1 fps
113.2 [X] Lenovo IdeaPad Gaming 3i 15IMH05 Intel Core i5-10300H 2.5GHz
GeForce GTX 1650 Mobile
min:
98.3 fps, max:
-1 fps
121 [X] Lenovo Yoga Creator 7 15IMH05 82DS000VGE Intel Core i7-10750H 2.6GHz
GeForce GTX 1650 Mobile
min:
104.1 fps, max:
-1 fps
121 [X] Lenovo Yoga Creator 7 15IMH05 82DS000VGE Hoechstleistung
Intel Core i7-10750H 2.6GHz
GeForce GTX 1650 Mobile
min:
105 fps, max:
-1 fps
123 [X] Acer Nitro 5 AN517-41-R3FK AMD Ryzen 7 5800H 3.2GHz
GeForce GTX 1650 Mobile
min:
108.6 fps, max:
-1 fps
127 [X] MSI GP75 Leopard 9SC Intel Core i7-9750H 2.6GHz
GeForce GTX 1650 Mobile
min:
113.1 fps
~ 99 fps
+ Compare
- Hide Comparison
...
NVIDIA T500 Laptop GPU
NVIDIA GeForce GTX 1050 Ti Mobile
AMD Radeon RX 5300M
NVIDIA GeForce GTX 1050 Ti Max-Q
NVIDIA GeForce GTX 1650 Mobile
NVIDIA Quadro P2000
NVIDIA Quadro RTX 4000 Max-Q
AMD Radeon RX Vega M GH
...
max:
58.5 [X] Asus TUF FX705DT-AU068T AMD Ryzen 5 3550H 2.1GHz
GeForce GTX 1650 Mobile
68.9 [X] Asus TUF FX705DT-AU068T Dual-Channel
AMD Ryzen 5 3550H 2.1GHz
GeForce GTX 1650 Mobile
73 [X] Lenovo IdeaPad L340-15IRH 81LK00BMGE Intel Core i5-9300H 2.4GHz
GeForce GTX 1650 Mobile
min:
65.1 fps
78.4 80.8 82 [X] HP Omen 15-dc1020ng Intel Core i5-9300H 2.4GHz
GeForce GTX 1650 Mobile
min:
70.2 fps
85.9 [X] SCHENKER XMG Core 14 Intel Core i5-1135G7 2.4GHz
GeForce GTX 1650 Mobile
min:
75 fps, max:
-1 fps
87.5 [X] MSI GF75 Thin 10SCXR Intel Core i5-10300H 2.5GHz
GeForce GTX 1650 Mobile
min:
76.4 fps
88.2 [X] LG Ultra 17U70N Intel Core i5-10210U 1.6GHz
GeForce GTX 1650 Mobile
min:
75.4 fps, max:
-1 fps
89 89.9 [X] HP Omen 15-dc1020ng Dual-Channel-Modus
Intel Core i5-9300H 2.4GHz
GeForce GTX 1650 Mobile
95.7 [X] Lenovo Yoga Creator 7 15IMH05 82DS000VGE Akkusparmodus
Intel Core i7-10750H 2.6GHz
GeForce GTX 1650 Mobile
min:
83.1 fps, max:
-1 fps
106 [X] Acer Nitro 5 AN515-45-R05E AMD Ryzen 5 5600H 3.3GHz
GeForce GTX 1650 Mobile
min:
93.4 fps, max:
-1 fps
107.5 [X] Lenovo IdeaPad Gaming 3i 15IMH05 Intel Core i5-10300H 2.5GHz
GeForce GTX 1650 Mobile
min:
90.7 fps, max:
-1 fps
108 [X] Acer Nitro 5 AN517-41-R3FK AMD Ryzen 7 5800H 3.2GHz
GeForce GTX 1650 Mobile
min:
95.1 fps, max:
-1 fps
108 110 [X] Lenovo Yoga Creator 7 15IMH05 82DS000VGE Intel Core i7-10750H 2.6GHz
GeForce GTX 1650 Mobile
min:
93.3 fps, max:
-1 fps
111 [X] Lenovo Yoga Creator 7 15IMH05 82DS000VGE Hoechstleistung
Intel Core i7-10750H 2.6GHz
GeForce GTX 1650 Mobile
min:
92.9 fps, max:
-1 fps
117 [X] Acer Nitro 5 AN517-41-R3FK AMD Ryzen 7 5800H 3.2GHz
GeForce GTX 1650 Mobile
min:
102.4 fps, max:
-1 fps
119 [X] MSI GP75 Leopard 9SC Intel Core i7-9750H 2.6GHz
GeForce GTX 1650 Mobile
min:
104.5 fps
~ 93 fps
+ Compare
- Hide Comparison
...
NVIDIA Quadro P620
NVIDIA GeForce GTX 1050 Ti Mobile
NVIDIA GeForce GTX 1650 Mobile
NVIDIA GeForce GTX 1050 Ti Max-Q
AMD Radeon RX Vega M GH
AMD Radeon RX 5300M
NVIDIA Quadro P2000
...
max:
NVIDIA GeForce RTX 3070 Ti
...
NVIDIA GeForce GTX 1050 Max-Q
AMD Radeon Pro Vega 16
NVIDIA Quadro T2000 Max-Q
NVIDIA GeForce GTX 1050 Ti Max-Q
NVIDIA GeForce GTX 1650 Mobile
NVIDIA Quadro RTX 4000 Max-Q
...
NVIDIA GeForce RTX 2080 Super Mobile
max:
» With all tested laptops playable in detail settings ultra.
88 [X] Asus TUF FX505DT-EB73 AMD Ryzen 7 3750H 2.3GHz
GeForce GTX 1650 Mobile
90 [X] Asus TUF FX705DT-AU068T AMD Ryzen 5 3550H 2.1GHz
GeForce GTX 1650 Mobile
131 [X] Acer Aspire 7 A715-74G-50U5 Intel Core i5-9300H 2.4GHz
GeForce GTX 1650 Mobile
~ 103 fps
+ Compare
- Hide Comparison
...
AMD Radeon RX 560X (Laptop)
NVIDIA Quadro P2000 Max-Q
NVIDIA GeForce GTX 1650 Mobile
NVIDIA GeForce GTX 1050 Ti Mobile
NVIDIA Quadro P2000
AMD Radeon RX 580 (Laptop)
NVIDIA GeForce GTX 1080 Mobile
NVIDIA Quadro P3200
...
86 [X] Asus TUF FX705DT-AU068T AMD Ryzen 5 3550H 2.1GHz
GeForce GTX 1650 Mobile
91 [X] Acer Aspire 7 A715-74G-50U5 Intel Core i5-9300H 2.4GHz
GeForce GTX 1650 Mobile
~ 89 fps
+ Compare
- Hide Comparison
...
AMD Radeon Pro WX Vega M GL
AMD Radeon RX 560X (Laptop)
NVIDIA GeForce GTX 1650 Mobile
NVIDIA GeForce GTX 1050 Ti Mobile
NVIDIA Quadro P2000 Max-Q
NVIDIA Quadro P2000
AMD Radeon RX 580 (Laptop)
NVIDIA GeForce GTX 1080 Mobile
...
67 [X] Asus TUF FX505DT-EB73 AMD Ryzen 7 3750H 2.3GHz
GeForce GTX 1650 Mobile
68 [X] Asus TUF FX705DT-AU068T AMD Ryzen 5 3550H 2.1GHz
GeForce GTX 1650 Mobile
81 [X] Acer Aspire 7 A715-74G-50U5 Intel Core i5-9300H 2.4GHz
GeForce GTX 1650 Mobile
~ 72 fps
+ Compare
- Hide Comparison
...
AMD Radeon Pro WX Vega M GL
NVIDIA Quadro P2000
NVIDIA GeForce GTX 1050 Ti Mobile
NVIDIA Quadro P2000 Max-Q
NVIDIA GeForce GTX 1650 Mobile
AMD Radeon RX Vega M GH
AMD Radeon RX 580 (Laptop)
NVIDIA Quadro P3200
NVIDIA Quadro P4000 Max-Q
...
44 [X] Asus TUF FX505DT-EB73 AMD Ryzen 7 3750H 2.3GHz
GeForce GTX 1650 Mobile
45 [X] Asus TUF FX705DT-AU068T AMD Ryzen 5 3550H 2.1GHz
GeForce GTX 1650 Mobile
51 [X] Acer Aspire 7 A715-74G-50U5 Intel Core i5-9300H 2.4GHz
GeForce GTX 1650 Mobile
~ 47 fps
+ Compare
- Hide Comparison
...
NVIDIA GeForce GTX 1050 Ti Mobile
NVIDIA Quadro P2000
NVIDIA GeForce GTX 1650 Mobile
NVIDIA Quadro P2000 Max-Q
NVIDIA Quadro P3200
NVIDIA GeForce GTX 980 (Laptop)
...
» With all tested laptops playable in detail settings ultra.
127 [X] Asus TUF FX505DT AMD Ryzen 7 3750H 2.3GHz
GeForce GTX 1650 Mobile
min:
65 fps, P1:
84 fps, max:
154 fps
134.9 [X] Asus TUF FX705DT-AU068T AMD Ryzen 5 3550H 2.1GHz
GeForce GTX 1650 Mobile
135.8 [X] Lenovo Ideapad L340-17IRH 81LL001YGE Intel Core i5-9300H 2.4GHz
GeForce GTX 1650 Mobile
139 [X] SCHENKER XMG Core 14 Intel Core i5-1135G7 2.4GHz
GeForce GTX 1650 Mobile
min:
82 fps
146.4 [X] Asus TUF FX505DT-EB73 AMD Ryzen 7 3750H 2.3GHz
GeForce GTX 1650 Mobile
156.7 [X] Asus TUF FX705DT-AU068T Dual-Channel
AMD Ryzen 5 3550H 2.1GHz
GeForce GTX 1650 Mobile
157.1 [X] HP Omen 15-dc1020ng Intel Core i5-9300H 2.4GHz
GeForce GTX 1650 Mobile
158.5 160.2 163 [X] LG Ultra 17U70N Intel Core i5-10210U 1.6GHz
GeForce GTX 1650 Mobile
min:
142 fps, max:
174 fps
169.4 [X] MSI GF75 Thin 10SCXR Intel Core i5-10300H 2.5GHz
GeForce GTX 1650 Mobile
172.7 [X] Lenovo Legion 5 17IMH05 Intel Core i5-10300H 2.5GHz
GeForce GTX 1650 Mobile
175 175.1 176 [X] Dell G5 15 5590-PCNJJ Intel Core i5-9300H 2.4GHz
GeForce GTX 1650 Mobile
min:
138 fps
183.5 184.5 [X] Lenovo IdeaPad Gaming 3i 15IMH05 Intel Core i5-10300H 2.5GHz
GeForce GTX 1650 Mobile
185 [X] Lenovo Yoga Creator 7 15IMH05 82DS000VGE Intel Core i7-10750H 2.6GHz
GeForce GTX 1650 Mobile
min:
13 fps, P0.1:
50.5 fps, P1:
118 fps, max:
399 fps
187.9 [X] Nexoc GH5 515IG Intel Core i5-10300H 2.5GHz
GeForce GTX 1650 Mobile
188.1 [X] Acer Aspire 7 A715-74G-50U5 Intel Core i5-9300H 2.4GHz
GeForce GTX 1650 Mobile
189.4 209.1 [X] MSI GF75 Thin 9SC Intel Core i7-9750H 2.6GHz
GeForce GTX 1650 Mobile
~ 167 fps
+ Compare
- Hide Comparison
+ 📈 Graph
- 📈 Hide Graph
0 100 200 Tooltip TUF FX505DT: Ø127 (65-154)
Yoga Creator 7 15IMH05 82DS000VGE: Ø188.2 (167.69-217.4)
...
NVIDIA Quadro M5000M
NVIDIA Quadro P4000
NVIDIA Quadro P4000 Max-Q
AMD Radeon RX Vega M GH
NVIDIA GeForce GTX 1650 Mobile
AMD Radeon RX 580 (Laptop)
AMD Radeon RX 5300M
...
max:
89.7 [X] SCHENKER XMG Core 14 Intel Core i5-1135G7 2.4GHz
GeForce GTX 1650 Mobile
min:
64 fps
92 [X] Asus TUF FX505DT AMD Ryzen 7 3750H 2.3GHz
GeForce GTX 1650 Mobile
min:
61 fps, P1:
69.16 fps, max:
102 fps
95.4 [X] LG Ultra 17U70N Intel Core i5-10210U 1.6GHz
GeForce GTX 1650 Mobile
min:
88 fps, max:
103 fps
97.9 [X] Asus TUF FX705DT-AU068T AMD Ryzen 5 3550H 2.1GHz
GeForce GTX 1650 Mobile
100.1 [X] Lenovo Ideapad L340-17IRH 81LL001YGE Intel Core i5-9300H 2.4GHz
GeForce GTX 1650 Mobile
102.6 106.4 [X] Asus TUF FX705DT-AU068T Dual-Channel
AMD Ryzen 5 3550H 2.1GHz
GeForce GTX 1650 Mobile
107 [X] Lenovo Yoga Creator 7 15IMH05 82DS000VGE Intel Core i7-10750H 2.6GHz
GeForce GTX 1650 Mobile
min:
2.15 fps, P0.1:
48.7 fps, P1:
77.9 fps, max:
248 fps
109.6 [X] HP Omen 15-dc1020ng Intel Core i5-9300H 2.4GHz
GeForce GTX 1650 Mobile
110 [X] Dell G5 15 5590-PCNJJ Intel Core i5-9300H 2.4GHz
GeForce GTX 1650 Mobile
min:
89 fps
110 111.5 115.8 116.6 [X] MSI GF75 Thin 10SCXR Intel Core i5-10300H 2.5GHz
GeForce GTX 1650 Mobile
117.3 [X] Lenovo Legion 5 17IMH05 Intel Core i5-10300H 2.5GHz
GeForce GTX 1650 Mobile
118.4 [X] Nexoc GH5 515IG Intel Core i5-10300H 2.5GHz
GeForce GTX 1650 Mobile
118.5 119.2 [X] Lenovo IdeaPad Gaming 3i 15IMH05 Intel Core i5-10300H 2.5GHz
GeForce GTX 1650 Mobile
123.3 [X] Acer Aspire 7 A715-74G-50U5 Intel Core i5-9300H 2.4GHz
GeForce GTX 1650 Mobile
126 [X] MSI GF75 Thin 9SC Intel Core i7-9750H 2.6GHz
GeForce GTX 1650 Mobile
~ 109 fps
+ Compare
- Hide Comparison
+ 📈 Graph
- 📈 Hide Graph
0 100 Tooltip TUF FX505DT: Ø91.9 (61-102)
Yoga Creator 7 15IMH05 82DS000VGE: Ø109.8 (65.264-129.8)
...
AMD Radeon RX Vega M GH
NVIDIA Quadro T2000 Max-Q
NVIDIA GeForce GTX 1650 Mobile
NVIDIA Quadro P4000
NVIDIA Quadro P4000 Max-Q
AMD Radeon RX 5300M
NVIDIA Quadro M5000M
AMD Radeon RX 580 (Laptop)
...
max:
45 53.6 [X] SCHENKER XMG Core 14 Intel Core i5-1135G7 2.4GHz
GeForce GTX 1650 Mobile
min:
31 fps
54.3 55.4 57 [X] LG Ultra 17U70N Intel Core i5-10210U 1.6GHz
GeForce GTX 1650 Mobile
min:
54 fps, max:
61 fps
57.3 [X] Asus TUF FX505DT AMD Ryzen 7 3750H 2.3GHz
GeForce GTX 1650 Mobile
min:
47 fps, P1:
47.78 fps, max:
63 fps
57.5 [X] Lenovo Ideapad L340-17IRH 81LL001YGE Intel Core i5-9300H 2.4GHz
GeForce GTX 1650 Mobile
58 59.1 [X] Asus TUF FX705DT-AU068T AMD Ryzen 5 3550H 2.1GHz
GeForce GTX 1650 Mobile
59.8 [X] Dell G5 15 5590-PCNJJ Intel Core i5-9300H 2.4GHz
GeForce GTX 1650 Mobile
min:
50 fps
60.3 [X] Asus TUF FX705DT-AU068T Dual-Channel
AMD Ryzen 5 3550H 2.1GHz
GeForce GTX 1650 Mobile
61.1 61.4 [X] Acer Nitro 5 AN515-54-78TL Intel Core i7-9750H 2.6GHz
GeForce GTX 1650 Mobile
61.8 [X] Lenovo Yoga Creator 7 15IMH05 82DS000VGE Intel Core i7-10750H 2.6GHz
GeForce GTX 1650 Mobile
min:
24.4 fps, P0.1:
28.3 fps, P1:
44.3 fps, max:
231 fps
62.2 [X] HP Omen 15-dc1020ng Intel Core i5-9300H 2.4GHz
GeForce GTX 1650 Mobile
62.5 [X] Acer Nitro 5 Intel Core i5-9300H 2.4GHz
GeForce GTX 1650 Mobile
min:
53 fps
62.5 [X] Acer Nitro 5 AN515-45-R05E AMD Ryzen 5 5600H 3.3GHz
GeForce GTX 1650 Mobile
62.5 [X] Acer Nitro 5 AN515-45-R05E AMD Ryzen 5 5600H 3.3GHz
GeForce GTX 1650 Mobile
min:
52 fps, max:
69 fps
62.7 [X] Asus TUF FX505DT-EB73 AMD Ryzen 7 3750H 2.3GHz
GeForce GTX 1650 Mobile
64.8 65.3 [X] Acer Aspire 7 A715-74G-50U5 Intel Core i5-9300H 2.4GHz
GeForce GTX 1650 Mobile
65.9 66 [X] Lenovo IdeaPad Gaming 3i 15IMH05 Intel Core i5-10300H 2.5GHz
GeForce GTX 1650 Mobile
67.2 [X] Nexoc GH5 515IG Intel Core i5-10300H 2.5GHz
GeForce GTX 1650 Mobile
67.6 [X] MSI GF75 Thin 9SC Intel Core i7-9750H 2.6GHz
GeForce GTX 1650 Mobile
68.5 [X] Acer Nitro 5 AN517-41-R3FK AMD Ryzen 7 5800H 3.2GHz
GeForce GTX 1650 Mobile
min:
60 fps, max:
77 fps
68.9 69.5 [X] Lenovo Legion 5 17IMH05 Intel Core i5-10300H 2.5GHz
GeForce GTX 1650 Mobile
70.4 [X] MSI GF75 Thin 10SCXR Intel Core i5-10300H 2.5GHz
GeForce GTX 1650 Mobile
~ 62 fps
+ Compare
- Hide Comparison
+ 📈 Graph
- 📈 Hide Graph
0 Tooltip Ultra 17U70N: Ø59 (55-63)
TUF FX505DT: Ø57.3 (47-63)
Yoga Creator 7 15IMH05 82DS000VGE: Ø64.6 (57.24-82.6)
TUF FX505DT-EB73: Ø62.9 (55-68)
XPS 15 7590 9980HK GTX 1650: Ø61.9 (53-69)
G3 3590: Ø62.9 (59-68)
Intel HD Graphics (Haswell)
...
AMD Radeon RX Vega M GH
AMD Radeon RX 5300M
NVIDIA GeForce GTX 1650 Mobile
NVIDIA Quadro T2000 Max-Q
NVIDIA Quadro M5000M
AMD Radeon RX 580 (Laptop)
...
max:
29.9 30 32.1 [X] SCHENKER XMG Core 14 Intel Core i5-1135G7 2.4GHz
GeForce GTX 1650 Mobile
min:
27 fps
32.7 33.1 [X] Asus TUF FX505DT AMD Ryzen 7 3750H 2.3GHz
GeForce GTX 1650 Mobile
min:
26 fps, P1:
26.4 fps, max:
38 fps
33.1 [X] LG Ultra 17U70N Intel Core i5-10210U 1.6GHz
GeForce GTX 1650 Mobile
min:
30 fps, max:
37 fps
33.3 [X] Asus TUF FX705DT-AU068T AMD Ryzen 5 3550H 2.1GHz
GeForce GTX 1650 Mobile
34 [X] presample NVIDIA GeForce GTX 1650 (Laptop) GeForce GTX 1650 Mobile
34.2 [X] Asus TUF FX705DT-AU068T Dual-Channel
AMD Ryzen 5 3550H 2.1GHz
GeForce GTX 1650 Mobile
34.2 [X] Lenovo Ideapad L340-17IRH 81LL001YGE Intel Core i5-9300H 2.4GHz
GeForce GTX 1650 Mobile
34.4 [X] Dell G5 15 5590-PCNJJ Intel Core i5-9300H 2.4GHz
GeForce GTX 1650 Mobile
min:
26 fps
34.5 [X] Lenovo IdeaPad L340-15IRH 81LK00BMGE Intel Core i5-9300H 2.4GHz
GeForce GTX 1650 Mobile
min:
32 fps, P1:
32 fps, max:
37 fps
35.3 [X] Lenovo Yoga Creator 7 15IMH05 82DS000VGE Intel Core i7-10750H 2.6GHz
GeForce GTX 1650 Mobile
min:
15.4 fps, P0.1:
15.7 fps, P1:
16.3 fps, max:
147 fps
35.4 35.5 [X] Acer Nitro 5 Intel Core i5-9300H 2.4GHz
GeForce GTX 1650 Mobile
min:
28 fps
35.6 [X] Acer Nitro 5 AN515-54-78TL Intel Core i7-9750H 2.6GHz
GeForce GTX 1650 Mobile
36 36.2 [X] Asus TUF FX505DT-EB73 AMD Ryzen 7 3750H 2.3GHz
GeForce GTX 1650 Mobile
36.2 36.3 [X] Nexoc GH5 515IG Leistungsmodus
Intel Core i5-10300H 2.5GHz
GeForce GTX 1650 Mobile
37 [X] HP Omen 15-dc1020ng Intel Core i5-9300H 2.4GHz
GeForce GTX 1650 Mobile
37.4 [X] Lenovo IdeaPad Gaming 3i 15IMH05 Intel Core i5-10300H 2.5GHz
GeForce GTX 1650 Mobile
37.6 [X] Acer Nitro 5 AN515-45-R05E AMD Ryzen 5 5600H 3.3GHz
GeForce GTX 1650 Mobile
37.7 [X] MSI GF75 Thin 9SC Intel Core i7-9750H 2.6GHz
GeForce GTX 1650 Mobile
37.7 [X] MSI GF75 Thin 10SCXR Intel Core i5-10300H 2.5GHz
GeForce GTX 1650 Mobile
38.1 [X] Acer Aspire 7 A715-74G-50U5 Intel Core i5-9300H 2.4GHz
GeForce GTX 1650 Mobile
38.5 [X] Nexoc GH5 515IG Intel Core i5-10300H 2.5GHz
GeForce GTX 1650 Mobile
38.8 39 [X] Acer Nitro 5 AN517-41-R3FK AMD Ryzen 7 5800H 3.2GHz
GeForce GTX 1650 Mobile
min:
33 fps, max:
44 fps
39.8 40.3 [X] Lenovo Legion 5 17IMH05 Intel Core i5-10300H 2.5GHz
GeForce GTX 1650 Mobile
min:
26 fps
~ 36 fps
+ Compare
- Hide Comparison
+ 📈 Graph
- 📈 Hide Graph
0 Tooltip ThinkPad X1 Extreme 2019 20QV000WGE: Ø29.9 (27-32)
Swift X SFX14-41G-R7F3: Ø28.9 (27-31)
XMG Core 14: Ø31.4 (30-33)
IdeaPad 5 Pro 16ACH: Ø30.6 (28-33)
TUF FX505DT: Ø33.1 (26-38)
TUF FX705DT-AU068T: Ø35 (31-39)
Ideapad L340-17IRH 81LL001YGE: Ø36 (33-39)
G5 15 5590-PCNJJ: Ø35.8 (32-38)
IdeaPad L340-15IRH 81LK00BMGE: Ø34.5 (32-37)
Yoga Creator 7 15IMH05 82DS000VGE: Ø36 (31-39)
Aspire Nitro 5 AN515-54-53Z2: Ø36.9 (34-39)
Nitro 5 AN515-54-78TL: Ø34.9 (31-39)
GH5 515IG Leistungsmodus: Ø38.6 (35-41)
Omen 15-dc1020ng: Ø37.2 (33-41)
IdeaPad Gaming 3i 15IMH05: Ø35.1 (30-38)
Nitro 5 AN515-45-R05E: Ø31.2 (28-33)
GF75 Thin 9SC: Ø34.4 (32-37)
GF75 Thin 10SCXR: Ø33.8 (31-37)
Aspire 7 A715-74G-50U5: Ø37.6 (34-41)
GH5 515IG: Ø34.1 (31-36)
Nitro 5 AN517-41-R3FK: Ø35.8 (33-40)
Pavilion Gaming 15-ec1206ng: Ø37 (34-40)
Legion 5 17IMH05: Ø40.1 (0-43)
...
NVIDIA Quadro T2000 Max-Q
AMD Radeon RX Vega M GH
NVIDIA GeForce GTX 1650 Mobile
AMD Radeon RX 580 (Laptop)
NVIDIA Quadro M5000M
AMD Radeon RX 5300M
...
max:
...
NVIDIA Quadro M3000M
AMD Radeon Pro WX Vega M GL
NVIDIA GeForce GTX 1050 Ti Max-Q
NVIDIA GeForce GTX 1050 Ti Mobile
NVIDIA GeForce GTX 1650 Mobile
AMD Radeon RX 580 (Laptop)
NVIDIA Quadro P3200
...
max:
» With most tested laptops playable in detail settings ultra.
Additional Benchmarks
Ultra Graphics & Postprocessing (HBAO+) 3840x2160
99.1 [X] Asus TUF FX705DT-AU068T AMD Ryzen 5 3550H 2.1GHz
GeForce GTX 1650 Mobile
101.6 [X] Asus TUF FX505DT AMD Ryzen 7 3750H 2.3GHz
GeForce GTX 1650 Mobile
108 [X] SCHENKER XMG Core 14 Intel Core i5-1135G7 2.4GHz
GeForce GTX 1650 Mobile
min:
40.5 fps, P1:
66.7 fps, max:
177 fps
123 171 178 [X] MSI GP75 Leopard 9SC Intel Core i7-9750H 2.6GHz
GeForce GTX 1650 Mobile
min:
4.08 fps, P1:
143 fps, max:
271 fps
~ 130 fps
+ Compare
- Hide Comparison
...
NVIDIA GeForce GTX 860M
AMD Radeon RX 580 (Laptop)
NVIDIA GeForce GTX 960M
NVIDIA Quadro M2000M
AMD Radeon 660M
NVIDIA GeForce GTX 1650 Mobile
AMD Radeon 680M
NVIDIA GeForce GTX 1050 Max-Q
AMD Radeon HD 8970M
...
max:
91.6 [X] Asus TUF FX505DT AMD Ryzen 7 3750H 2.3GHz
GeForce GTX 1650 Mobile
93.6 [X] Asus TUF FX705DT-AU068T AMD Ryzen 5 3550H 2.1GHz
GeForce GTX 1650 Mobile
95.1 [X] SCHENKER XMG Core 14 Intel Core i5-1135G7 2.4GHz
GeForce GTX 1650 Mobile
min:
31.9 fps, P1:
43.5 fps, max:
163 fps
162 170 [X] MSI GP75 Leopard 9SC Intel Core i7-9750H 2.6GHz
GeForce GTX 1650 Mobile
min:
5.25 fps, P1:
125 fps, max:
295 fps
~ 122 fps
+ Compare
- Hide Comparison
...
AMD Radeon 660M
NVIDIA GeForce GTX 960M
NVIDIA Quadro M2000M
AMD Radeon RX 580 (Laptop)
AMD Radeon 680M
NVIDIA GeForce GTX 1650 Mobile
NVIDIA GeForce GTX 860M
NVIDIA GeForce GTX 1050 Max-Q
AMD Radeon HD 8970M
NVIDIA GeForce GTX 1050 Ti Mobile
...
max:
67.7 [X] Asus TUF FX705DT-AU068T AMD Ryzen 5 3550H 2.1GHz
GeForce GTX 1650 Mobile
68 [X] Asus TUF FX505DT AMD Ryzen 7 3750H 2.3GHz
GeForce GTX 1650 Mobile
68 [X] SCHENKER XMG Core 14 Intel Core i5-1135G7 2.4GHz
GeForce GTX 1650 Mobile
min:
20.3 fps, P1:
40 fps, max:
118 fps
83.7 91.7 102 [X] MSI GP75 Leopard 9SC Intel Core i7-9750H 2.6GHz
GeForce GTX 1650 Mobile
min:
32.7 fps, P1:
71.4 fps, max:
264 fps
~ 80 fps
+ Compare
- Hide Comparison
...
NVIDIA Quadro M3000M
NVIDIA GeForce GTX 1050 Ti Mobile
NVIDIA GeForce GTX 1050 Ti Max-Q
NVIDIA GeForce GTX 1650 Mobile
AMD Radeon RX Vega M GH
AMD Radeon RX 580 (Laptop)
AMD Radeon RX 5300M
...
max:
38.1 [X] SCHENKER XMG Core 14 Intel Core i5-1135G7 2.4GHz
GeForce GTX 1650 Mobile
min:
3.65 fps, P1:
24.4 fps, max:
70.2 fps
38.2 [X] Asus TUF FX705DT-AU068T AMD Ryzen 5 3550H 2.1GHz
GeForce GTX 1650 Mobile
40.7 [X] Asus TUF FX505DT AMD Ryzen 7 3750H 2.3GHz
GeForce GTX 1650 Mobile
44.9 45.9 51.1 [X] MSI GP75 Leopard 9SC Intel Core i7-9750H 2.6GHz
GeForce GTX 1650 Mobile
min:
7.76 fps, P1:
34.5 fps, max:
90.3 fps
~ 43 fps
+ Compare
- Hide Comparison
...
NVIDIA GeForce GTX 1050 Ti Mobile
AMD Radeon RX Vega M GH
AMD Radeon RX 580 (Laptop)
AMD Radeon RX 5300M
NVIDIA GeForce GTX 1650 Mobile
NVIDIA GeForce GTX 980 (Laptop)
...
max:
» With all tested laptops playable in detail settings ultra.
Additional Benchmarks
Normal/Off 4xAF 1920x1080
167 [X] MSI GP75 Leopard 9SC Intel Core i7-9750H 2.6GHz
GeForce GTX 1650 Mobile
min:
4.85 fps, P1:
111 fps, max:
335 fps
87.8 [X] SCHENKER XMG Core 14 Intel Core i5-1135G7 2.4GHz
GeForce GTX 1650 Mobile
min:
30.7 fps, P1:
45.5 fps, max:
145 fps
Lowest Settings possible 1920x1080
175 [X] MSI GP75 Leopard 9SC Intel Core i7-9750H 2.6GHz
GeForce GTX 1650 Mobile
min:
5.67 fps, P1:
125 fps, max:
319 fps
95.3 [X] SCHENKER XMG Core 14 Intel Core i5-1135G7 2.4GHz
GeForce GTX 1650 Mobile
min:
35.5 fps, P1:
50 fps, max:
152 fps
Intel HD Graphics (Bay Trail)
...
NVIDIA GeForce GTX 860M
NVIDIA GeForce GTX 770M
NVIDIA Quadro P4000 Max-Q
NVIDIA GeForce GTX 960M
NVIDIA Quadro K5100M
NVIDIA GeForce GTX 1050 Ti Mobile
AMD Radeon R9 M295X
NVIDIA GeForce GTX 1650 Mobile
AMD Radeon R9 M290X
AMD Radeon R9 M390
NVIDIA GeForce GTX 780M
NVIDIA GeForce GTX 1080 Mobile
NVIDIA Quadro M1000M
...
Intel HD Graphics (Bay Trail)
...
AMD Radeon R9 M390
AMD Radeon R9 M295X
NVIDIA GeForce GTX 780M
AMD Radeon R9 M290X
NVIDIA Quadro P4000 Max-Q
NVIDIA GeForce GTX 1050 Ti Mobile
NVIDIA GeForce GTX 1650 Mobile
NVIDIA Quadro M3000M
AMD FirePro W7170M
NVIDIA Quadro M1000M
NVIDIA Quadro M5000M
NVIDIA GeForce GTX 1080 Mobile
...
...
AMD Radeon R9 M290X
AMD Radeon R9 M390
NVIDIA GeForce GTX 780M
AMD Radeon R9 M295X
NVIDIA Quadro M3000M
AMD FirePro W7170M
NVIDIA GeForce GTX 1650 Mobile
NVIDIA Quadro M5000M
NVIDIA GeForce GTX 1050 Ti Mobile
NVIDIA Quadro P4000 Max-Q
NVIDIA GeForce GTX 980 (Laptop)
...
...
AMD Radeon R9 M295X
AMD FirePro W7170M
NVIDIA Quadro M3000M
NVIDIA Quadro M5000M
NVIDIA GeForce GTX 1650 Mobile
NVIDIA GeForce GTX 1050 Ti Mobile
NVIDIA Quadro P4000 Max-Q
NVIDIA GeForce GTX 980 (Laptop)
NVIDIA GeForce GTX 1080 Mobile
...
» With all tested laptops playable in detail settings ultra.
183.9 [X] Asus TUF FX505DT-EB73 AMD Ryzen 7 3750H 2.3GHz
GeForce GTX 1650 Mobile
184.2 [X] Asus TUF FX705DT-AU068T AMD Ryzen 5 3550H 2.1GHz
GeForce GTX 1650 Mobile
191 [X] Lenovo IdeaPad L340-15IRH 81LK00BMGE Intel Core i5-9300H 2.4GHz
GeForce GTX 1650 Mobile
195.6 [X] Lenovo Ideapad L340-17IRH 81LL001YGE Intel Core i5-9300H 2.4GHz
GeForce GTX 1650 Mobile
213.6 [X] HP Omen 15-dc1020ng Intel Core i5-9300H 2.4GHz
GeForce GTX 1650 Mobile
214.2 [X] Asus TUF FX705DT-AU068T Dual-Channel
AMD Ryzen 5 3550H 2.1GHz
GeForce GTX 1650 Mobile
241.5 [X] MSI GF75 Thin 10SCXR Intel Core i5-10300H 2.5GHz
GeForce GTX 1650 Mobile
250.1 [X] Lenovo Legion 5 17IMH05 Intel Core i5-10300H 2.5GHz
GeForce GTX 1650 Mobile
251.9 259.9 261.4 [X] Acer Aspire 7 A715-74G-50U5 Intel Core i5-9300H 2.4GHz
GeForce GTX 1650 Mobile
266 [X] Dell G5 15 5590-PCNJJ Intel Core i5-9300H 2.4GHz
GeForce GTX 1650 Mobile
min:
35 fps
288.3 [X] HP Omen 15-dc1020ng Dual-Channel-Modus
Intel Core i5-9300H 2.4GHz
GeForce GTX 1650 Mobile
288.3 [X] Lenovo IdeaPad Gaming 3i 15IMH05 Intel Core i5-10300H 2.5GHz
GeForce GTX 1650 Mobile
319.5 [X] MSI GF75 Thin 9SC Intel Core i7-9750H 2.6GHz
GeForce GTX 1650 Mobile
332.4 [X] Nexoc GH5 515IG Intel Core i5-10300H 2.5GHz
GeForce GTX 1650 Mobile
342.5 ~ 252 fps
+ Compare
- Hide Comparison
...
NVIDIA Quadro M3000M
AMD Radeon Pro 455
AMD FirePro M6100
NVIDIA GeForce GTX 1050 Ti Mobile
NVIDIA GeForce GTX 1650 Mobile
NVIDIA Quadro P1000
NVIDIA Quadro P4000 Max-Q
NVIDIA Quadro P2000 Max-Q
NVIDIA GeForce GTX 980 (Laptop)
NVIDIA GeForce GTX 1050 Max-Q
...
159.4 [X] Lenovo Ideapad L340-17IRH 81LL001YGE Intel Core i5-9300H 2.4GHz
GeForce GTX 1650 Mobile
160 [X] Asus TUF FX705DT-AU068T AMD Ryzen 5 3550H 2.1GHz
GeForce GTX 1650 Mobile
160.8 [X] Lenovo IdeaPad L340-15IRH 81LK00BMGE Intel Core i5-9300H 2.4GHz
GeForce GTX 1650 Mobile
178.9 [X] Asus TUF FX705DT-AU068T Dual-Channel
AMD Ryzen 5 3550H 2.1GHz
GeForce GTX 1650 Mobile
200.3 [X] HP Omen 15-dc1020ng Intel Core i5-9300H 2.4GHz
GeForce GTX 1650 Mobile
212.7 [X] MSI GF75 Thin 10SCXR Intel Core i5-10300H 2.5GHz
GeForce GTX 1650 Mobile
213.5 217.9 [X] Lenovo Legion 5 17IMH05 Intel Core i5-10300H 2.5GHz
GeForce GTX 1650 Mobile
221.8 223.4 224.2 [X] Acer Aspire 7 A715-74G-50U5 Intel Core i5-9300H 2.4GHz
GeForce GTX 1650 Mobile
230 [X] Dell G5 15 5590-PCNJJ Intel Core i5-9300H 2.4GHz
GeForce GTX 1650 Mobile
min:
28 fps
237.8 [X] HP Omen 15-dc1020ng Dual-Channel-Modus
Intel Core i5-9300H 2.4GHz
GeForce GTX 1650 Mobile
242.3 [X] Lenovo IdeaPad Gaming 3i 15IMH05 Intel Core i5-10300H 2.5GHz
GeForce GTX 1650 Mobile
250.2 [X] Nexoc GH5 515IG Intel Core i5-10300H 2.5GHz
GeForce GTX 1650 Mobile
251 [X] MSI GF75 Thin 9SC Intel Core i7-9750H 2.6GHz
GeForce GTX 1650 Mobile
~ 212 fps
+ Compare
- Hide Comparison
Intel HD Graphics (Bay Trail)
...
NVIDIA GeForce GTX 1050 Ti Mobile
NVIDIA Quadro P2000 Max-Q
NVIDIA Quadro M4000M
NVIDIA GeForce GTX 1050 Max-Q
NVIDIA GeForce GTX 1050 Ti Max-Q
NVIDIA GeForce GTX 1650 Mobile
NVIDIA Quadro P2000
NVIDIA Quadro P4000 Max-Q
NVIDIA Quadro M5000M
...
148.6 [X] Lenovo IdeaPad L340-15IRH 81LK00BMGE Intel Core i5-9300H 2.4GHz
GeForce GTX 1650 Mobile
149 [X] Asus TUF FX705DT-AU068T AMD Ryzen 5 3550H 2.1GHz
GeForce GTX 1650 Mobile
152.2 [X] Lenovo Ideapad L340-17IRH 81LL001YGE Intel Core i5-9300H 2.4GHz
GeForce GTX 1650 Mobile
160 [X] Asus TUF FX705DT-AU068T Dual-Channel
AMD Ryzen 5 3550H 2.1GHz
GeForce GTX 1650 Mobile
171.8 190.4 [X] HP Omen 15-dc1020ng Intel Core i5-9300H 2.4GHz
GeForce GTX 1650 Mobile
193.6 195.4 200.1 [X] MSI GF75 Thin 10SCXR Intel Core i5-10300H 2.5GHz
GeForce GTX 1650 Mobile
203.4 [X] Acer Aspire 7 A715-74G-50U5 Intel Core i5-9300H 2.4GHz
GeForce GTX 1650 Mobile
205.7 [X] Lenovo Legion 5 17IMH05 Intel Core i5-10300H 2.5GHz
GeForce GTX 1650 Mobile
209 [X] Dell G5 15 5590-PCNJJ Intel Core i5-9300H 2.4GHz
GeForce GTX 1650 Mobile
min:
10 fps
215 [X] HP Omen 15-dc1020ng Dual-Channel-Modus
Intel Core i5-9300H 2.4GHz
GeForce GTX 1650 Mobile
221.6 [X] MSI GF75 Thin 9SC Intel Core i7-9750H 2.6GHz
GeForce GTX 1650 Mobile
224.2 [X] Lenovo IdeaPad Gaming 3i 15IMH05 Intel Core i5-10300H 2.5GHz
GeForce GTX 1650 Mobile
226.1 [X] Nexoc GH5 515IG Intel Core i5-10300H 2.5GHz
GeForce GTX 1650 Mobile
~ 192 fps
+ Compare
- Hide Comparison
Intel HD Graphics (Bay Trail)
...
NVIDIA Quadro P2000 Max-Q
NVIDIA GeForce GTX 1050 Ti Mobile
NVIDIA Quadro M4000M
NVIDIA GeForce GTX 1050 Ti Max-Q
NVIDIA Quadro P2000
NVIDIA GeForce GTX 1650 Mobile
NVIDIA Quadro P4000 Max-Q
NVIDIA GeForce GTX 780M SLI
AMD Radeon RX Vega M GH
...
68.5 73.9 [X] Asus TUF FX505DT-EB73 AMD Ryzen 7 3750H 2.3GHz
GeForce GTX 1650 Mobile
77 [X] Asus TUF FX705DT-AU068T AMD Ryzen 5 3550H 2.1GHz
GeForce GTX 1650 Mobile
77.8 [X] Asus TUF FX705DT-AU068T Dual-Channel
AMD Ryzen 5 3550H 2.1GHz
GeForce GTX 1650 Mobile
78.7 [X] Lenovo IdeaPad L340-15IRH 81LK00BMGE Intel Core i5-9300H 2.4GHz
GeForce GTX 1650 Mobile
80.5 [X] Lenovo Ideapad L340-17IRH 81LL001YGE Intel Core i5-9300H 2.4GHz
GeForce GTX 1650 Mobile
85.6 86.1 [X] Dell G5 15 5590-PCNJJ Intel Core i5-9300H 2.4GHz
GeForce GTX 1650 Mobile
min:
3 fps
87.7 [X] HP Omen 15-dc1020ng Intel Core i5-9300H 2.4GHz
GeForce GTX 1650 Mobile
88.1 [X] Acer Aspire 7 A715-74G-50U5 Intel Core i5-9300H 2.4GHz
GeForce GTX 1650 Mobile
90.4 [X] MSI GF75 Thin 9SC Intel Core i7-9750H 2.6GHz
GeForce GTX 1650 Mobile
90.8 [X] HP Omen 15-dc1020ng Dual-Channel-Modus
Intel Core i5-9300H 2.4GHz
GeForce GTX 1650 Mobile
92.6 93.2 [X] Lenovo Legion 5 17IMH05 Intel Core i5-10300H 2.5GHz
GeForce GTX 1650 Mobile
93.6 [X] MSI GF75 Thin 10SCXR Intel Core i5-10300H 2.5GHz
GeForce GTX 1650 Mobile
95.2 [X] Nexoc GH5 515IG Intel Core i5-10300H 2.5GHz
GeForce GTX 1650 Mobile
96.5 [X] Lenovo IdeaPad Gaming 3i 15IMH05 Intel Core i5-10300H 2.5GHz
GeForce GTX 1650 Mobile
99.4 [X] Nexoc GH5 515IG Leistungsmodus
Intel Core i5-10300H 2.5GHz
GeForce GTX 1650 Mobile
~ 86 fps
+ Compare
- Hide Comparison
+ 📈 Graph
- 📈 Hide Graph
0 Tooltip XPS 15 7590 9980HK GTX 1650: Ø61.9 (53-69)
Intel HD Graphics (Bay Trail)
...
NVIDIA GeForce GTX 1050 Ti Max-Q
NVIDIA GeForce GTX 1050 Ti Mobile
NVIDIA Quadro T2000 Max-Q
AMD Radeon RX Vega M GH
NVIDIA Quadro M4000M
NVIDIA GeForce GTX 1650 Mobile
AMD Radeon HD 8970M Crossfire
NVIDIA Quadro M5000M
NVIDIA GeForce GTX 780M SLI
NVIDIA Quadro P4000
...
max:
» With all tested laptops playable in detail settings ultra.
...
AMD Radeon RX Vega 7
NVIDIA GeForce 940M
AMD Radeon RX Vega 6 (Ryzen 4000/5000)
NVIDIA GeForce GTX 1650 Mobile
Intel Iris Graphics 550
AMD Radeon RX 560X (Laptop)
...
NVIDIA GeForce GTX 1050 Max-Q
Intel Graphics Media Accelerator (GMA) 4500MHD
...
Intel Iris Graphics 550
NVIDIA GeForce GT 745M
Intel Iris Pro Graphics 5200
NVIDIA GeForce GTX 1650 Mobile
AMD Radeon HD 8970M Crossfire
AMD Radeon RX 560X (Laptop)
NVIDIA GeForce GT 750M SLI
AMD Radeon R9 M370X
...
NVIDIA GeForce GTX 1050 Max-Q
Intel Graphics Media Accelerator (GMA) 4500MHD
...
NVIDIA GeForce GT 745M
AMD Radeon R9 M370X
AMD Radeon HD 8970M Crossfire
AMD Radeon RX 560X (Laptop)
NVIDIA GeForce GTX 1650 Mobile
NVIDIA GeForce GTX 760M
NVIDIA GeForce GT 750M SLI
NVIDIA GeForce GTX 765M
...
NVIDIA GeForce GTX 780M SLI
...
AMD Radeon R9 M370X
NVIDIA GeForce GTX 765M
AMD Radeon RX 560X (Laptop)
NVIDIA GeForce GTX 1050 Ti Mobile
AMD Radeon HD 8970M Crossfire
NVIDIA GeForce GTX 1650 Mobile
NVIDIA GeForce GTX 1050 Max-Q
AMD Radeon Pro 455
AMD Radeon HD 8970M
NVIDIA GeForce GTX 770M
NVIDIA GeForce GT 750M SLI
...
NVIDIA GeForce GTX 780M SLI
max:
AMD Radeon RX 480 (Desktop)
» With all tested laptops playable in detail settings ultra.
...
Intel Iris Plus Graphics G7 (Ice Lake 64 EU)
Intel Iris Graphics 550
Intel Iris Pro Graphics 5200
NVIDIA GeForce GTX 1650 Mobile
NVIDIA GeForce GT 750M
AMD FirePro W4170M
AMD Radeon RX 560X (Laptop)
NVIDIA GeForce 940M
...
...
AMD Radeon 540X
AMD Radeon RX Vega 7
NVIDIA GeForce GT 745M
NVIDIA GeForce GT 750M
NVIDIA GeForce GTX 1650 Mobile
NVIDIA Quadro K2100M
AMD Radeon RX 560X (Laptop)
AMD FirePro M5100
...
Intel HD Graphics (Bay Trail)
...
NVIDIA Quadro K2100M
AMD Radeon RX Vega 7
NVIDIA GeForce GT 750M
AMD FirePro M5100
NVIDIA GeForce GTX 1650 Mobile
AMD Radeon RX 560X (Laptop)
NVIDIA GeForce GTX 760M
NVIDIA GeForce GTX 950M
AMD FirePro M6100
...
Intel HD Graphics (Bay Trail)
...
NVIDIA GeForce GTX 760M
NVIDIA Quadro K3100M
NVIDIA GeForce GTX 950M
NVIDIA GeForce GTX 1650 Mobile
NVIDIA GeForce GTX 860M
AMD Radeon RX 560X (Laptop)
NVIDIA GeForce GTX 765M
AMD Radeon HD 8970M
NVIDIA GeForce GTX 960M
AMD FirePro M6100
...
NVIDIA GeForce GTX 1080 Mobile
max:
» With all tested laptops playable in detail settings ultra.
...
ATI Mobility Radeon HD 4850
AMD Radeon RX 560X (Laptop)
NVIDIA GeForce GTX 1650 Mobile
AMD FirePro W4170M
AMD Radeon RX Vega 7
AMD Radeon RX Vega 6 (Ryzen 4000/5000)
...
Intel Graphics Media Accelerator (GMA) 4500MHD
...
AMD Radeon RX 560X (Laptop)
NVIDIA GeForce GTX 1650 Mobile
NVIDIA GeForce GTX 760M
NVIDIA GeForce GTX 1050 Ti Mobile
NVIDIA GeForce GTX 1050 Ti Max-Q
Intel HD Graphics (Bay Trail)
...
NVIDIA GeForce GTX 760M
AMD Radeon RX 560X (Laptop)
NVIDIA GeForce GTX 1650 Mobile
NVIDIA GeForce GTX 1050 Ti Mobile
NVIDIA GeForce GTX 1050 Ti Max-Q
...
AMD Radeon RX 560X (Laptop)
NVIDIA GeForce GTX 1650 Mobile
NVIDIA GeForce GTX 1050 Ti Mobile
NVIDIA GeForce GTX 1050 Ti Max-Q
NVIDIA GeForce GTX 1080 Mobile
» With all tested laptops playable in detail settings ultra.
For more games that might be playable and a list of all games and graphics cards visit our Gaming List
v1.26
log 26. 06:11:27
#0 no ids found in url (should be separated by "_") +0s ... 0s
#1 not redirecting to Ajax server +0s ... 0s
#2 did not recreate cache, as it is less than 5 days old! Created at Sat, 25 May 2024 05:40:03 +0200 +0.001s ... 0.001s
#3 no comparison url found in template nbc.compare_page_1 needed +0.042s ... 0.044s
#4 no comparison url found in template nbc.compare_page_1 needed +0s ... 0.044s
#5 no comparison url found in template nbc.compare_page_1 needed +0s ... 0.044s
#6 no comparison url found in template nbc.compare_page_1 needed +0s ... 0.044s
#7 no comparison url found in template nbc.compare_page_1 needed +0s ... 0.044s
#8 no comparison url found in template nbc.compare_page_1 needed +0s ... 0.044s
#9 no comparison url found in template nbc.compare_page_1 needed +0s ... 0.045s
#10 no comparison url found in template nbc.compare_page_1 needed +0s ... 0.045s
#11 no comparison url found in template nbc.compare_page_1 needed +0s ... 0.045s
#12 no comparison url found in template nbc.compare_page_1 needed +0s ... 0.046s
#13 composed specs +0s ... 0.046s
#14 did output specs +0s ... 0.046s
#15 start showIntegratedCPUs +0s ... 0.046s
#16 getting avg benchmarks for device 9828 +0.031s ... 0.077s
#17 got single benchmarks 9828 +0.227s ... 0.304s
#18 got avg benchmarks for devices +0s ... 0.304s
#19 min, max, avg, median took s +1.106s ... 1.41s
#20 before gaming benchmark output +0s ... 1.41s
#21 Got 1555 rows for game benchmarks. +0.193s ... 1.603s
#22 composed SQL query for gamebenchmarks +0s ... 1.603s
#23 got data and put it in $dataArray +0.123s ... 1.727s
#24 benchmarks composed for output. +8.574s ... 10.301s
#25 no comparison url found in template nbc.compare_page_1 needed +0.014s ... 10.315s
#26 return log +0s ... 10.315s
Notebook reviews with NVIDIA GeForce GTX 1650 Mobile graphics card
配备GTX1650的宏碁Swift X SFX14回顾: 斯威夫特Ryzen笔记本电脑 宏碁的14英寸笔记本具备了移动游戏超极本的条件。虽然2020年的图灵图形不是最新和最伟大的,但它在19毫米厚的外壳中与Ryzen 5000搭配,提供了适度的游戏能力。构建质量很扎实,显示效果也出奇的好。...
AMD Ryzen 5 5500U | NVIDIA GeForce GTX 1650 Mobile | 14.00" | 1.4 kg
宏碁Aspire 7 A715-42G多媒体笔记本电脑评论。伪装成全能选手的游戏潜力 15.6英寸的显示屏不仅为办公和互联网提供了足够的动力,而且还力求达到清晰的帧率。这款多媒体笔记本电脑可以将许多现代游戏流畅地传输到屏幕上。...
AMD Ryzen 5 5500U | NVIDIA GeForce GTX 1650 Mobile | 15.60" | 2.2 kg
联想IdeaPad 5 Pro 16ACH回顾。带有120赫兹大屏幕的Ryzen 5000笔记本电脑 联想IdeaPad 5 Pro 16ACH可能是16:10显示屏和AMD处理器的趋势相结合的结果。这款多媒体笔记本电脑以其不太宽的大尺寸、高分辨率120赫兹液晶显示器和快速的Ryzen 5000H CPU脱颖而出。...
AMD Ryzen 7 5800H | NVIDIA GeForce GTX 1650 Mobile | 16.00" | 2 kg
惠普Pavilion 15游戏笔记本电脑评测:拥有长续航的廉价游戏本 Pavilion Gaming 15的硬件可以流畅地在15.6英寸屏幕上运行所有现代游戏。 NVMe SSD,8 GB RAM(双通道模式)和非常长的续航时间为该产品提供了更多。...
AMD Ryzen 5 4600H | NVIDIA GeForce GTX 1650 Mobile | 15.60" | 2.1 kg
联想ThinkPad X1 Extreme 2019笔记本电脑评测:联想的二代全能本变差了? 新的CPU,更快的GPU和更多的显示选择,这就是ThinkPad X1 Extreme Gen 2的一切。 联想仅对第二代机型进行了少许改动,而今年的模具则保持不变。 我们一直在努力研究该设备,特别是带有4K雾面面板的设备,这对续航时间产生了巨大影响。...
Intel Core i7-9750H | NVIDIA GeForce GTX 1650 Mobile | 15.60" | 1.7 kg
Dell G3 3590 : Intel Core i5-9300H, 15.60", 2.5 kgReview » 戴尔Dell G3 15 3590笔记本电脑评测:廉价且易升级
Dell XPS 15 7590 9980HK GTX 1650 : Intel Core i9-9980HK, 15.60", 2 kgReview » 势不可挡:Dell XPS 15 7590酷睿i9,GTX1650笔记本电脑评测
Acer Aspire Nitro 5 AN515-54-53Z2 : Intel Core i5-9300H, 15.60", 2.2 kgReview » 宏碁Nitro 5 (Core i5-9300H, GeForce GTX 1650) 笔记本电脑评测
Acer Nitro 5 AN515-57, GTX 1650 : Intel Core i5-11400H, 15.60", 2.3 kgExternal Review » Acer Nitro 5 AN515-57, GTX 1650
Lenovo IdeaPad 5 Pro 16ACH6-82L500VKMH : AMD Ryzen 7 5800H, 16.00", 1.9 kgExternal Review » Lenovo IdeaPad 5 Pro 16ACH6-82L500VKMH
Acer Aspire 7 A715-76G : Intel Core i5-12450H, 15.60", 2.1 kgExternal Review » Acer Aspire 7 A715-76G
HP Victus 15-fa0031dx : Intel Core i5-12450H, 15.60", 2.3 kgExternal Review » HP Victus 15-fa0031dx
Asus TUF Gaming F15 FX506LHB-HN324 : Intel Core i5-10300H, 15.60", 2.3 kgExternal Review » Asus TUF Gaming F15 FX506LHB-HN324
HP Victus 16-d0019ns : Intel Core i5-11400H, 16.10", 2.5 kgExternal Review » HP Victus 16-d0019ns
HP Victus 16-e0085ns : AMD Ryzen 5 5600H, 16.10", 2.5 kgExternal Review » HP Victus 16-e0085ns
HP Victus 15-fb0152ng : AMD Ryzen 5 5600H, 16.00", 2.3 kgExternal Review » HP Victus 15-fb0152ng
MSI GF63 Thin 11SC : Intel Core i5-11400H, 15.60", 1.9 kgExternal Review » MSI GF63 Thin 11SC
Lenovo IdeaPad Gaming 3 15IHU6-82K1019DSP : Intel Core i5-11320H, 15.60", 2.3 kgExternal Review » Lenovo IdeaPad Gaming 3 15IHU6-82K1019DSP
HP Victus 15-fa0038nf : Intel Core i5-12450H, 15.60", 2.3 kgExternal Review » HP Victus 15-fa0038nf
Lenovo IdeaPad Gaming 3 15ACH6-82K201SRSP : AMD Ryzen 5 5600H, 15.60", 2.3 kgExternal Review » Lenovo IdeaPad Gaming 3 15ACH6-82K201SRSP
MSI Prestige 14 A12SC-086CA : Intel Core i7-1280P, 14.00", 1.6 kgExternal Review » MSI Prestige 14 A12SC-086CA
HP Victus 15t-fa000 : Intel Core i5-12450H, 15.60", 2.3 kgExternal Review » HP Victus 15t-fa000
Lenovo IdeaPad Gaming 3 15ACH6-82K201HEMH : AMD Ryzen 5 5600H, 15.60", 2.3 kgExternal Review » Lenovo IdeaPad Gaming 3 15ACH6-82K201HEMH
Asus TUF Gaming F15 FX506LH-AS51 : Intel Core i5-10300H, 15.60", 2.3 kgExternal Review » Asus TUF Gaming F15 FX506LH-AS51
Acer Nitro 5 AN515-55-72P7 : Intel Core i7-10750H, 15.60", 2.5 kgExternal Review » Acer Nitro 5 AN515-55-72P7
Lenovo IdeaPad 5 Pro 16ACH : AMD Ryzen 7 5800H, 16.00", 2 kgExternal Review » Lenovo IdeaPad 5 Pro 16ACH
Acer Nitro 5 AN515-56-54DF : Intel Core i5-11300H, 15.60", 2.3 kgExternal Review » Acer Nitro 5 AN515-56-54DF
Acer Nitro 5 AN515-56-51V8 : Intel Core i5-11300H, 15.60", 2.3 kgExternal Review » Acer Nitro 5 AN515-56-51V8
HP Victus 16-e0040ns : AMD Ryzen 5 5600H, 16.10", 2.5 kgExternal Review » HP Victus 16-e0040ns
Lenovo IdeaPad Gaming 3 15ACH6-82K201DHMH : AMD Ryzen 5 5600H, 15.60", 2.3 kgExternal Review » Lenovo IdeaPad Gaming 3 15ACH6-82K201DHMH
Lenovo ThinkBook 15p G2 ITH-21B1001LUS : Intel Core i7-11800H, 15.60", 1.9 kgExternal Review » Lenovo ThinkBook 15p G2 ITH-21B1001LUS
HP Victus 16-e0010ns : AMD Ryzen 5 5600H, 16.10", 2.5 kgExternal Review » HP Victus 16-e0010ns
Lenovo IdeaPad Gaming 3 15ACH6-82K200UTUS : AMD Ryzen 5 5600H, 15.60", 2.3 kgExternal Review » Lenovo IdeaPad Gaming 3 15ACH6-82K200UTUS
Dell G15 5510-8R03T : Intel Core i5-10200H, 15.60", 2.7 kgExternal Review » Dell G15 5510-8R03T
Asus Vivobook Pro 14 K3400, i5-11300H GTX 1650 : Intel Core i5-11300H, 14.00", 1.4 kgExternal Review » Asus Vivobook Pro 14 K3400, i5-11300H GTX 1650
HP Pavilion Gaming 15-ec2004ns : AMD Ryzen 7 5800H, 15.60", 2 kgExternal Review » HP Pavilion Gaming 15-ec2004ns
HP Pavilion Gaming 15-ec2047AX : AMD Ryzen 5 5600H, 15.60", 2 kgExternal Review » HP Pavilion Gaming 15-ec2047AX
HP Pavilion Gaming 15-ec2005ns : AMD Ryzen 5 5600H, 15.60", 2 kgExternal Review » HP Pavilion Gaming 15-ec2005ns
Asus ROG Strix G513IC-HN004 : AMD Ryzen 7 4800H, 15.60", 2.3 kgExternal Review » Asus ROG Strix G513IC-HN004
MSI GF75 Thin 10SCXR : Intel Core i5-10300H, 17.30", 2.2 kgExternal Review » MSI GF75 Thin 10SCXR
HP Pavilion Gaming 15-ec2002ns : AMD Ryzen 5 5600H, 15.60", 2 kgExternal Review » HP Pavilion Gaming 15-ec2002ns
Acer Aspire 7 A715-42G-R1DD : AMD Ryzen 5 5500U, 15.60", 2.2 kgExternal Review » Acer Aspire 7 A715-42G-R1DD
Lenovo IdeaPad Gaming 3 15ACH6-82K20015US : AMD Ryzen 5 5600H, 15.60", 2.3 kgExternal Review » Lenovo IdeaPad Gaming 3 15ACH6-82K20015US
HP Pavilion Gaming 15-ec2009ns : AMD Ryzen 5 5600H, 15.60", 2 kgExternal Review » HP Pavilion Gaming 15-ec2009ns
Acer Swift X SFX14-41G-R9KC : AMD Ryzen 5 5500U, 14.00", 1.5 kgExternal Review » Acer Swift X SFX14-41G-R9KC
Lenovo IdeaPad Gaming 3 15IMH05-81Y400YFSP : Intel Core i7-10750H, 15.60", 2.2 kgExternal Review » Lenovo IdeaPad Gaming 3 15IMH05-81Y400YFSP
HP Victus 16-e0004ns : AMD Ryzen 5 5600H, 16.10", 2.5 kgExternal Review » HP Victus 16-e0004ns
HP Pavilion Gaming 15-ec2007ns : AMD Ryzen 5 5600H, 15.60", 2 kgExternal Review » HP Pavilion Gaming 15-ec2007ns
Acer Nitro 5 AN515-55-56F5 : Intel Core i5-10300H, 15.60", 2.3 kgExternal Review » Acer Nitro 5 AN515-55-56F5
Acer Nitro 5 AN515-55-72GW : Intel Core i7-10750H, 15.60", 2.3 kgExternal Review » Acer Nitro 5 AN515-55-72GW
HP Pavilion Gaming 15-ec2008ns : AMD Ryzen 5 5600H, 15.60", 2 kgExternal Review » HP Pavilion Gaming 15-ec2008ns
Lenovo IdeaPad Gaming 3 15ARH05-82EY00RDSP : AMD Ryzen 5 4600H, 15.60", 2.2 kgExternal Review » Lenovo IdeaPad Gaming 3 15ARH05-82EY00RDSP
Asus TUF Gaming F15 FX506LH-HN129 : Intel Core i7-10875H, 15.60", 2.3 kgExternal Review » Asus TUF Gaming F15 FX506LH-HN129
HP Pavilion Gaming 15z-ec200 : AMD Ryzen 5 5600H, 15.60", 2.3 kgExternal Review » HP Pavilion Gaming 15z-ec200
HP Pavilion Gaming 15-ec2025ns : AMD Ryzen 7 5800H, 15.60", 2.3 kgExternal Review » HP Pavilion Gaming 15-ec2025ns
Asus ROG Strix G15 G513IH-HN008 : AMD Ryzen 7 4800H, 15.60", 2.1 kgExternal Review » Asus ROG Strix G15 G513IH-HN008
Lenovo Legion 5 17ACH6-82K0000RMH : AMD Ryzen 5 5600H, 17.30", 3 kgExternal Review » Lenovo Legion 5 17ACH6-82K0000RMH
Lenovo IdeaPad Gaming 3 15ARH05-82EY00RESP : AMD Ryzen 7 4800H, 15.60", 2.2 kgExternal Review » Lenovo IdeaPad Gaming 3 15ARH05-82EY00RESP
Asus TUF Gaming F15 FX506LH-HN042T : Intel Core i5-10300H, 15.60", 2.3 kgExternal Review » Asus TUF Gaming F15 FX506LH-HN042T
Acer Swift X SFX14-41G-R2DS : AMD Ryzen 7 5700U, 14.00", 1.5 kgExternal Review » Acer Swift X SFX14-41G-R2DS
Lenovo Ideapad L340-17IRH 81LL001YGE : Intel Core i5-9300H, 17.30", 2.5 kgExternal Review » Lenovo Ideapad L340-17IRH 81LL001YGE
Lenovo Ideapad L340 17IRH-81LL003BMH : Intel Core i7-9750H, 17.30", 2.8 kgExternal Review » Lenovo Ideapad L340 17IRH-81LL003BMH
HP Pavilion Gaming 15-ec2253ng : AMD Ryzen 5 5600H, 15.60", 2.3 kgExternal Review » HP Pavilion Gaming 15-ec2253ng
Acer Aspire 7 A715-42G-R9LH : AMD Ryzen 7 5700U, 15.60", 2.2 kgExternal Review » Acer Aspire 7 A715-42G-R9LH
HP Pavilion Gaming 15-ec1073dx : AMD Ryzen 5 4600H, 15.60", 2 kgExternal Review » HP Pavilion Gaming 15-ec1073dx
Dell Vostro 15 7500-0323 : Intel Core i7-10750H, 15.60", 1.9 kgExternal Review » Dell Vostro 15 7500-0323
Medion Erazer Crawler E10 : Intel Core i5-10300H, 15.60", 2.2 kgExternal Review » Medion Erazer Crawler E10
Acer Nitro 5 AN515-56-75HR : Intel Core i7-11370H, 15.60", 2.3 kgExternal Review » Acer Nitro 5 AN515-56-75HR
Asus ROG Flow X13 GV301QH-K5228T : AMD Ryzen 9 5980HS, 13.40", 1.3 kgExternal Review » Asus ROG Flow X13 GV301QH-K5228T
Acer Nitro 5 AN515-56-58CQ : Intel Core i5-11300H, 15.60", 2.3 kgExternal Review » Acer Nitro 5 AN515-56-58CQ
Asus TUF FX505DT-HN540 : AMD Ryzen 7 3750H, 15.60", 2.2 kgExternal Review » Asus TUF FX505DT-HN540
Asus ROG Flow X13 GV301QH-K5232T : AMD Ryzen 9 5980HS, 13.40", 1.3 kgExternal Review » Asus ROG Flow X13 GV301QH-K5232T
Lenovo IdeaPad Gaming 3 15ARH05-82EY00CQSP : AMD Ryzen 7 4800H, 15.60", 2.2 kgExternal Review » Lenovo IdeaPad Gaming 3 15ARH05-82EY00CQSP
Acer Nitro 5 AN515-43-R6BW : AMD Ryzen 5 3550H, 15.60", 2.3 kgExternal Review » Acer Nitro 5 AN515-43-R6BW
Acer Aspire 7 A715-42G-R0XB : AMD Ryzen 5 5500U, 15.60", 2.2 kgExternal Review » Acer Aspire 7 A715-42G-R0XB
Lenovo IdeaPad 3 15IMH05-81Y400DWMH : Intel Core i5-10300H, 15.60", 2.2 kgExternal Review » Lenovo IdeaPad 3 15IMH05-81Y400DWMH
Acer Aspire Nitro 5 AN517-53-51FQ : Intel Core i5-11300H, 17.30", 2.7 kgExternal Review » Acer Aspire Nitro 5 AN517-53-51FQ
LG Ultra 17U70N-J.AA78B : Intel Core i7-10510U, 17.30"External Review » LG Ultra 17U70N-J.AA78B
Lenovo IdeaPad 3 15ARH05-82EY00CNSP : AMD Ryzen 7 4800H, 15.60", 2.2 kgExternal Review » Lenovo IdeaPad 3 15ARH05-82EY00CNSP
HP Pavilion 15-ec1155nd : AMD Ryzen 5 4600H, 15.60", 2 kgExternal Review » HP Pavilion 15-ec1155nd
Acer Nitro 5 AN515-44-R8QT : AMD Ryzen 5 4600H, 15.60", 2.4 kgExternal Review » Acer Nitro 5 AN515-44-R8QT
Asus TUF Gaming F15 FX506LH-BQ116 : Intel Core i7-10870H, 15.60", 2.3 kgExternal Review » Asus TUF Gaming F15 FX506LH-BQ116
HP Gaming Pavilion 15-ec1005ns : AMD Ryzen 5 4600H, 15.60", 2 kgExternal Review » HP Gaming Pavilion 15-ec1005ns
Lenovo IdeaPad 3 15ARH05-82EY00BSMH : AMD Ryzen 7 4800H, 15.60", 2.2 kgExternal Review » Lenovo IdeaPad 3 15ARH05-82EY00BSMH
Lenovo Yoga Creator 7 15IMH05 82DS000VGE : Intel Core i7-10750H, 15.60", 1.8 kgExternal Review » Lenovo Yoga Creator 7 15IMH05-82DS000VGE
Asus TUF Gaming A15 FA506IH-AS53 : AMD Ryzen 5 4600H, 15.60", 2.3 kgExternal Review » Asus TUF Gaming A15 FA506IH-AS53
Acer ConceptD 3 CN314-72G-744X : Intel Core i7-10750H, 14.00", 1.5 kgExternal Review » Acer ConceptD 3 CN314-72G-744X
Lenovo Ideapad Creator 5 15IMH05-82D4003UCK : Intel Core i5-10300H, 15.60", 2.2 kgExternal Review » Lenovo Ideapad Creator 5 15IMH05-82D4003UCK
HP Pavilion Gaming 16-a0031ns : Intel Core i5-10300H, 16.10", 2.4 kgExternal Review » HP Pavilion Gaming 16-a0031ns
Acer Aspire Nitro 5 AN515-44-R329 : AMD Ryzen 5 4600H, 15.60", 2.4 kgExternal Review » Acer Aspire Nitro 5 AN515-44-R329
Acer Aspire 7 A715-75G-59MG : Intel Core i5-10300H, 15.60", 2.2 kgExternal Review » Acer Aspire 7 A715-75G-59MG
Lenovo Legion 5 17IMH05 : Intel Core i5-10300H, 17.30", 2.9 kgExternal Review » Lenovo Legion 5 17IMH05
Asus TUF Gaming A15 FA506IH-BQ027T : AMD Ryzen 7 4800H, 15.60", 2.3 kgExternal Review » Asus TUF Gaming A15 FA506IH-BQ027T
Acer Nitro 5 AN515-44-R99Q : AMD Ryzen 5 4600H, 15.60", 2.4 kgExternal Review » Acer Nitro 5 AN515-44-R99Q
Lenovo Yoga Slim 7 15IMH05-82AB003CUK : Intel Core i7-10750H, 15.60", 1.8 kgExternal Review » Lenovo Yoga Slim 7 15IMH05-82AB003CUK
LG Ultra 17U70N-R.AAS8U1 : Intel Core i7-10510U, 17.00", 2 kgExternal Review » LG Ultra 17U70N-R.AAS8U1
HP Pavilion Gaming 15-dk1041tx : Intel Core i7-10750H, 15.60", 2.3 kgExternal Review » HP Pavilion Gaming 15-dk1041tx
HP Pavilion Gaming 16-a0006ns : Intel Core i5-10300H, 15.60", 2.4 kgExternal Review » HP Pavilion Gaming 16-a0006ns
Lenovo Legion 5 15IMH05-82AU00B1SP : Intel Core i7-10750H, 15.60", 2.3 kgExternal Review » Lenovo Legion 5 15IMH05-82AU00B1SP
Asus TUF Gaming F15 FX506LH-BQ030 : Intel Core i7-10750H, 15.60", 2.3 kgExternal Review » Asus TUF FX506LH-BQ030
Asus TUF Gaming F15 FX506LH-BQ034 : Intel Core i5-10300H, 15.60", 2.3 kgExternal Review » Asus TUF FX506LH-BQ034
Lenovo Legion Y7000SE : Intel Core i5-9300HF, 15.60"External Review » Lenovo Legion Y7000SE
HP Pavilion Gaming 16-a0022ns : Intel Core i5-10300H, 16.10", 2.4 kgExternal Review » HP Pavilion Gaming 16-a0022ns
Asus TUF FX505DT-BQ613T : AMD Ryzen 7 3750H, 15.60", 2.2 kgExternal Review » Asus TUF FX505DT-BQ613T
Lenovo Yoga Slim 7 15IMH05-82AB002WMH : Intel Core i5-10300H, 15.60", 1.8 kgExternal Review » Lenovo Yoga Slim 7 15IMH05-82AB002WMH
Acer Nitro 5 AN515-44-R4P7 : AMD Ryzen 7 4800H, 15.60", 2.4 kgExternal Review » Acer Nitro 5 AN515-44-R4P7
MSI GF63 Thin 10SCXR-042XES : Intel Core i7-10750H, 15.60", 1.9 kgExternal Review » MSI GF63 Thin 10SCXR-042XES
Lenovo Legion 5 15ARH05-82B500D3SP : AMD Ryzen 7 4800H, 15.60", 2.3 kgExternal Review » Lenovo Legion 5 15ARH05-82B500D3SP
Asus TUF FX505GT-BQ108 : Intel Core i5-9300H, 15.60", 2.2 kgExternal Review » Asus TUF FX505GT-BQ108
HP Pavilion Gaming 16-a0000ns : Intel Core i5-10300H, 16.10", 2.4 kgExternal Review » HP Pavilion Gaming 16-a0000ns
HP Pavilion Gaming 15-ec1009ns : AMD Ryzen 5 4600H, 15.60", 2 kgExternal Review » HP Pavilion Gaming 15-ec1009ns
Asus F571GT-AL311T : Intel Core i7-9750H, 15.60", 1.8 kgExternal Review » Asus F571GT-AL311T
Acer Nitro 5 AN515-44-R55M : AMD Ryzen 5 4600H, 15.60", 2.4 kgExternal Review » Acer Nitro 5 AN515-44-R55M
Lenovo IdeaPad S540-15IWL-81SW002AGE : Intel Core i7-8565U, 15.60", 1.8 kgExternal Review » Lenovo IdeaPad S540-15IWL-81SW002AGE
HP Gaming Pavilion 15-dk0025ns : Intel Core i5-9300H, 15.60", 2.2 kgExternal Review » HP Gaming Pavilion 15-dk0025ns
Acer Nitro 5 AN515-55-598S : Intel Core i5-10300H, 15.60", 2.3 kgExternal Review » Acer Nitro 5 AN515-55-598S
MSI GF63 Thin 10SCXR-405XES : Intel Core i7-10750H, 15.60", 1.9 kgExternal Review » MSI GF63 Thin 10SCXR-405XES
Dell G3 15 3500-3KJ99 : Intel Core i5-10300H, 15.60", 2.6 kgExternal Review » Dell G3 15 3500-3KJ99
Lenovo IdeaPad Gaming 3i 15IMH05 : Intel Core i5-10300H, 15.60", 2.2 kgExternal Review » Lenovo IdeaPad Gaming 3i 15IMH05
Acer Nitro 5 AN515-55-7075 : Intel Core i7-10750H, 15.60", 2.3 kgExternal Review » Acer Nitro 5 AN515-55-7075
Acer Aspire 7 A715-41G-R8MJ : AMD Ryzen 5 3550H, 15.60", 2.2 kgExternal Review » Acer Aspire 7 A715-41G-R8MJ
HP Omen 15-dc1049ns : Intel Core i5-9300H, 15.60", 2.3 kgExternal Review » HP Omen 15-dc1049ns
Lenovo Legion Y540-15IRH-PG0 : Intel Core i7-9750H, 15.60", 1.3 kgExternal Review » Lenovo Legion Y540-15IRH-PG0
Lenovo Legion 5 15IMH05-82AU004YVN : Intel Core i7-10750H, 15.60", 2.4 kgExternal Review » Lenovo Legion 5 15IMH05-82AU004YVN
Acer Nitro 5 AN517-52-7995 : Intel Core i7-10750H, 17.30", 2.2 kgExternal Review » Acer Nitro 5 AN517-52-7995
Lenovo IdeaPad Gaming 3i 15-81Y400NESB : Intel Core i7-10750H, 15.60", 2.2 kgExternal Review » Lenovo IdeaPad Gaming 3i 15-81Y400NESB
Acer Aspire 7 A715-41G-R5LR : AMD Ryzen 5 3550H, 15.60", 2.4 kgExternal Review » Acer Aspire 7 A715-41G-R5LR
HP Pavilion Gaming 15-ec1011ns : AMD Ryzen 5 4600H, 15.60", 2 kgExternal Review » HP Pavilion Gaming 15-ec1011ns
Asus TUF FX505DT-BQ600 : AMD Ryzen 7 3750H, 15.60", 2.2 kgExternal Review » Asus TUF FX505DT-BQ600
HP Gaming Pavilion 15-dk0031ns : Intel Core i7-9750H, 15.60", 2.3 kgExternal Review » HP Gaming Pavilion 15-dk0031ns
Asus X571GT-BQ597 : Intel Core i5-8300H, 15.60", 2 kgExternal Review » Asus X571GT-BQ597
Lenovo Legion 5 15ARH05-82B500CFGE : AMD Ryzen 7 4800H, 15.60", 2.3 kgExternal Review » Lenovo Legion 5 15ARH05-82B500CFGE
Asus TUF FX505DT-BQ208 : AMD Ryzen 7 3750H, 15.60", 2.2 kgExternal Review » Asus TUF FX505DT-BQ208
Acer Nitro 5 AN515-55-53YW : Intel Core i5-10300H, 15.60", 2.3 kgExternal Review » Acer Nitro 5 AN515-55-53YW
Acer Aspire 7 A715-41G-R3J5 : AMD Ryzen 7 3750H, 15.60", 2.4 kgExternal Review » Acer Aspire 7 A715-41G-R3J5
Acer Aspire 7 A715-74G-77AW : Intel Core i7-9750H, 15.60", 2.4 kgExternal Review » Acer Aspire 7 A715-74G-77AW
Asus ROG Strix G531GT-BQ165 : Intel Core i7-9750H, 15.60", 2.4 kgExternal Review » Asus ROG Strix G531GT-BQ165
MSI Prestige 14 A10SC-067XES : Intel Core i7-10710U, 14.00", 1.3 kgExternal Review » MSI Prestige 14 A10SC-067XES
Acer ConceptD 3 CN315-71-76MR : Intel Core i7-9750H, 15.60", 2.4 kgExternal Review » Acer ConceptD 3 CN315-71-76MR
Asus TUF FX505DT-BQ051 : AMD Ryzen 5 3550H, 15.60", 2.2 kgExternal Review » Asus TUF FX505DT-BQ051
HP Gaming Pavilion 15-dk0026ns : Intel Core i7-9750H, 15.60", 2.2 kgExternal Review » HP Gaming Pavilion 15-dk0026ns
Acer Nitro 5 AN515-43-R84P : AMD Ryzen 5 3550H, 15.60"External Review » Acer Nitro 5 AN515-43-R84P
HP Pavilion Gaming 15-ec0014nl : AMD Ryzen 7 3750H, 15.60", 2.3 kgExternal Review » HP Pavilion Gaming 15-ec0014nl
Asus TUF FX505GT-BQ025 : Intel Core i5-9300H, 15.60", 2.2 kgExternal Review » Asus TUF FX505GT-BQ025
MSI Prestige 14 A10SC-096NE : Intel Core i7-10710U, 14.00", 1.3 kgExternal Review » MSI Prestige 14 A10SC-096NE
Acer Nitro 5 AN517-51-55ML : Intel Core i5-9300H, 17.30", 2.7 kgExternal Review » Acer Nitro 5 AN517-51-55ML
Lenovo Ideapad L340-15IRH-81LK00CDSP : Intel Core i7-9750H, 15.60", 2.2 kgExternal Review » Lenovo Ideapad L340-15IRH-81LK00CDSP
Acer Aspire Nitro 5 AN515-54-7793 : Intel Core i7-9750H, 15.60", 2.5 kgExternal Review » Acer Aspire Nitro 5 AN515-54-7793
HP Pavilion Gaming 15-dk0002ns : Intel Core i5-9300H, 15.60", 2.3 kgExternal Review » HP Pavilion Gaming 15-dk0002ns
Asus TUF FX505GT-BQ028 : Intel Core i7-9750H, 15.60", 2.2 kgExternal Review » Asus TUF FX505GT-BQ028
MSI Prestige 15 A10SC-007ES : Intel Core i7-10710U, 15.60", 1.7 kgExternal Review » MSI Prestige 15 A10SC-007ES
Asus TUF FX505DT-BQ121 : AMD Ryzen 7 3750H, 15.60", 2.2 kgExternal Review » Asus TUF FX505DT-BQ121
MSI GF75 Thin 9SC-277XES : Intel Core i7-9750H, 17.30", 2.2 kgExternal Review » MSI GF75 Thin 9SC-277XES
HP Pavilion Gaming 15-ec0003ns : AMD Ryzen 7 3750H, 15.60", 2.3 kgExternal Review » HP Pavilion Gaming 15-ec0003ns
MSI Prestige 14 A10SC-012ES : Intel Core i7-10710U, 14.00", 1.3 kgExternal Review » MSI Prestige 14 A10SC-012ES
HP Omen 15-dc1010nr : Intel Core i7-9750H, 15.60", 2.6 kgExternal Review » HP Omen 15-dc1010nr
Acer Aspire Nitro 5 AN517-51-76MG : Intel Core i7-9750H, 15.60", 2.5 kgExternal Review » Acer Aspire Nitro 5 AN517-51-76MG
Samsung Odyssey 2 NP850XBD-XG1BR : Intel Core i5-9300H, 15.60", 2.4 kgExternal Review » Samsung Odyssey 2 NP850XBD-XG1BR
HP Pavilion 15-BC520NS : Intel Core i7-9750H, 15.60", 2.2 kgExternal Review » HP Pavilion 15-BC520NS
Acer Aspire Nitro 7 AN715-51-76XG : Intel Core i7-8750H, 15.60", 2.5 kgExternal Review » Acer Aspire Nitro 7 AN715-51-76XG
Acer Predator Triton 300 PT315-51-58BG : Intel Core i5-9300H, 15.60", 2.5 kgExternal Review » Acer Predator Triton 300 PT315-51-58BG
Lenovo Legion Y540-15IRH-81SY00A2SP : Intel Core i5-9300H, 15.60", 2.3 kgExternal Review » Lenovo Legion Y540-15IRH-81SY00A2SP
Asus TUF FX505GT-BQ024 : Intel Core i7-9750H, 15.60", 2.2 kgExternal Review » Asus TUF FX505GT-BQ024
HP Pavilion 15-bc521ns : Intel Core i5-9300H, 15.60", 2.1 kgExternal Review » HP Pavilion 15-bc521ns
Dell G3 15 3590-GN3R591AU : Intel Core i7-9750H, 15.60", 2.7 kgExternal Review » Dell G3 15 3590-GN3R591AU
Acer Nitro 5 AN515-54-749V : Intel Core i7-9750H, 15.60", 2.5 kgExternal Review » Acer Nitro 5 AN515-54-749V
Dell G3 3590 : Intel Core i5-9300H, 15.60", 2.5 kgExternal Review » Dell G3 3590
Acer Predator Triton 300 PT315-51-7815 : Intel Core i7-9750H, 15.60", 2.3 kgExternal Review » Acer Predator Triton 300 PT315-51-7815
HP Gaming Pavilion 15-dk0046nr : Intel Core i7-9750H, 15.60", 2.3 kgExternal Review » HP Gaming Pavilion 15-dk0046nr
MSI GL65 9SC-004 : Intel Core i5-9300H, 15.60", 2.3 kgExternal Review » MSI GL65 9SC-004
MSI GF63 9SC-621 : Intel Core i5-9300H, 15.60", 1.9 kgExternal Review » MSI GF63 9SC-621
Lenovo IdeaPad L340-15IRH 81LK00BMGE : Intel Core i5-9300H, 15.60", 2.1 kgExternal Review » Lenovo IdeaPad L340-15IRH 81LK00BMGE
Acer Aspire 7 A715-74G-743J : Intel Core i7-9750H, 15.60", 2.4 kgExternal Review » Acer Aspire 7 A715-74G-743J
MSI GF75 Thin 9SC-061XES : Intel Core i7-9750H, 17.30", 2.2 kgExternal Review » MSI GF75 Thin 9SC-061XES
Acer Nitro 5 AN517-51-77B8 : Intel Core i7-9750H, 17.30", 2.7 kgExternal Review » Acer Nitro 5 AN517-51-77B8
HP Gaming Pavilion 17-cd0222ng : Intel Core i5-9300H, 17.30", 2.8 kgExternal Review » HP Gaming Pavilion 17-cd0222ng
Asus ROG Strix G531GT-BQ012 : Intel Core i7-9750H, 15.60", 2.4 kgExternal Review » Asus ROG Strix G531GT-BQ012
Acer Aspire 7 A715-74G-53YM : Intel Core i5-9300H, 15.60", 2.4 kgExternal Review » Acer Aspire 7 A715-74G-53YM
Asus Strix G G531GT-BI7N6 : Intel Core i7-9750H, 15.60", 2.4 kgExternal Review » Asus Strix G G531GT-BI7N6
Acer Nitro 5 AN517-51-56YW : Intel Core i5-9300H, 17.30", 2.7 kgExternal Review » Acer Nitro 5 AN517-51-56YW
Acer Predator Triton 300-15 : Intel Core i7-9750H, 15.60", 2.3 kgExternal Review » Acer Predator Triton 300-15
Lenovo Legion Y540-15IRH-81SY00A6SP : Intel Core i7-9750H, 15.60", 2.3 kgExternal Review » Lenovo Legion Y540-15IRH-81SY00A6SP
Dell XPS 15 7590-K6XWV : Intel Core i7-9750H, 15.60", 2 kgExternal Review » Dell XPS 15 7590-K6XWV
Acer Nitro 5 AN517-51-70U7 : Intel Core i7-9750H, 17.30", 2.7 kgExternal Review » Acer Nitro 5 AN517-51-70U7
Lenovo Ideapad L340-15IRH-81LK0093MB : Intel Core i7-9750H, 15.60", 2.2 kgExternal Review » Lenovo Ideapad L340-15IRH-81LK0093MB
Dell G3 15 3590-cn35917 : Intel Core i5-9300H, 15.60", 2.4 kgExternal Review » Dell G3 15 3590-cn35917
HP Pavilion 15-dk0042tx : Intel Core i7-9750H, 15.60", 2.3 kgExternal Review » HP Pavilion 15-dk0042tx
Lenovo Legion Y545-15-81T20005US : Intel Core i7-9750H, 15.60", 2.3 kgExternal Review » Lenovo Legion Y545-15-81T20005US
Asus ROG Strix G531GT-BQ020 : Intel Core i7-9750H, 15.60", 2.4 kgExternal Review » Asus ROG Strix G531GT-BQ020
Acer Nitro 7 AN715-51-752B : Intel Core i7-9750H, 15.60", 2.7 kgExternal Review » Acer Nitro 7 AN715-51-752B
Lenovo Legion Y540 15-IRH-81SY001KSB : Intel Core i7-9750H, 15.60", 2.3 kgExternal Review » Lenovo Legion Y540 15-IRH-81SY001KSB
Acer Nitro 5 AN515-54-73KT : Intel Core i7-9750H, 15.60", 2.7 kgExternal Review » Acer Nitro 5 AN515-54-73KT
Asus ROG Strix G531GT-BQ005 : Intel Core i5-9300H, 15.60", 2.4 kgExternal Review » Asus ROG Strix G531GT-BQ005
MSI PS63 Modern 8SC-054ES : Intel Core i7-8565U, 15.60", 1.6 kgExternal Review » MSI PS63 Modern 8SC-054ES
Asus Strix G531GT-BI7N6 : Intel Core i7-9750H, 15.60", 2.4 kgExternal Review » Asus Strix G531GT-BI7N6
Asus TUF FX705DT-AU028T : AMD Ryzen 7 3750H, 17.30", 2.6 kgExternal Review » Asus TUF FX705DT-AU028T
Dell G5 15 5590-PCNJJ : Intel Core i5-9300H, 15.60", 2.7 kgExternal Review » Dell G5 15 5590-PCNJJ
Dell XPS 15 7590 9980HK GTX 1650 : Intel Core i9-9980HK, 15.60", 2 kgExternal Review » Dell XPS 15 7590 9980HK GTX 1650
Asus TUF FX505DT-EB73 : AMD Ryzen 7 3750H, 15.60", 2.2 kgExternal Review » Asus TUF FX505DT-EB73
Dell XPS 15 7590 : Intel Core i9-9980HK, 15.60", 2 kgExternal Review » Dell XPS 15 7590
Acer Aspire Nitro 5 AN515-54-72J1 : Intel Core i7-9750H, 15.60", 2.3 kgExternal Review » Acer Aspire Nitro 5 AN515-54-72J1
MSI GF63 Thin 9SC-047XES : Intel Core i7-9750H, 15.60", 1.9 kgExternal Review » MSI GF63 Thin 9SC-047XES
Lenovo Ideapad L340-17IRH-81LL001YGE : Intel Core i5-9300H, 17.30", 2.5 kgExternal Review » Lenovo Ideapad L340-17IRH-81LL001YGE
Lenovo Ideapad L340-15IRH-81LK0001UK : Intel Core i5-9300H, 15.60", 2.2 kgExternal Review » Lenovo Ideapad L340-15IRH-81LK0001UK
Acer Aspire Nitro 5 AN515-54-53Z2 : Intel Core i5-9300H, 15.60", 2.2 kgExternal Review » Acer Aspire Nitro 5 AN515-54-53Z2
Acer Aspire Nitro 7 AN715-51 : Intel Core i7-8750H, 15.60", 2.2 kgExternal Review » Acer Aspire Nitro 7 AN715-51
Please share our article, every link counts!
» Comparison of GPUs
» Benchmark List
» Notebook Gaming List
Class 1 GeForce RTX 2080 Super Mobile
Class 2 M1 Max 32-Core GPU *
GeForce RTX 2070 Super Mobile
M1 Max 24-Core GPU *
Quadro RTX 5000 Max-Q
Radeon RX 5700M *
GeForce GTX 1080 Mobile
Quadro RTX 4000 (Laptop)
M1 Pro 16-Core GPU *
Radeon PRO W6600M *
GeForce RTX 2070 Super Max-Q
Quadro RTX 4000 Max-Q *
M1 Pro 14-Core GPU *
Quadro P5200
Quadro RTX 3000 Max-Q *
Quadro P4200
Quadro P5000 Max-Q *
GeForce GTX 980 (Laptop)
Quadro P4000
Quadro P4000 Max-Q
Quadro P3200
Radeon RX 580X (Laptop) *
Radeon RX 580 (Laptop)
Radeon Pro 5300M
Radeon RX 5300M
Quadro P3000 Max-Q *
Quadro T2000 Max-Q *
Radeon Pro WX 7100 *
Radeon RX 570X (Laptop) *
Radeon RX 570 (Laptop) *
Radeon RX 470 (Laptop) *
Quadro T1000 Max-Q *
Class 3 Vega M GH
Quadro M5000M
GeForce GTX 1050 Ti Mobile
Radeon 680M
Quadro P2000
Quadro P2000 Max-Q
Quadro M4000M
T500 Laptop GPU *
Radeon R9 M395X
GeForce GTX 1050 Ti Max-Q *
Radeon Pro Vega 16
WX Vega M GL
Radeon R9 M485X
Quadro M3000M
FirePro W7170M
Radeon R9 M395
GeForce GTX 1050 Max-Q *
Radeon 660M
Radeon Pro WX 4150 *
Radeon RX 560X (Laptop)
Radeon RX 560 (Laptop)
Radeon RX 460 (Laptop)
Quadro P1000
Radeon R9 M390
Xe MAX
Radeon Pro 560X
Radeon Pro 560
Radeon Pro 460
Radeon Pro WX 4130 *
GeForce GTX 960M
Quadro P620 *
Radeon RX 550X (Laptop)
Radeon Pro WX 3200 *
Radeon Pro 555X
Radeon Pro 555
Radeon Pro 455
Quadro P600
Quadro M2000M
Radeon RX 540X *
Radeon Pro WX 2100 *
Radeon Pro WX 3100 *
GeForce GTX 950M
Radeon Pro 450
Radeon 630
Radeon 540X *
Radeon R9 M385X
Quadro P520
Quadro M1000M
GeForce 945M
Quadro P500 *
Iris Plus Graphics G7 (Ice Lake 64 EU) *
Vega 10 *
Iris Pro Graphics 580
FirePro W5170M *
Radeon R9 M370X
Vega 9
FirePro W5130M
UHD Graphics Xe G4 48EUs *
UHD Graphics 32EUs
UHD Graphics Xe 32EUs (Tiger Lake-H) *
UHD Graphics 750
Vega 7
Radeon R7 M465
Iris Pro Graphics 6200
Vega 8
GeForce 940M
Iris Plus Graphics G4 (Ice Lake 48 EU)
Quadro M600M
FirePro W4190M
Radeon R9 M375
Radeon R7 M445
Iris Plus Graphics 650
Iris Graphics 550
Radeon 625
Vega 6 *
Iris Plus Graphics 640
Iris Graphics 540
UHD Graphics 24EUs (Alder Lake-N) *
Radeon R7 M360
GeForce 920M
Radeon 620
Radeon R7 M340
Radeon 610
Radeon 610M *
Vega 6 *
UHD Graphics G1 (Ice Lake 32 EU)
UHD Graphics Xe 16EUs (Tiger Lake-H) *
HD Graphics 530
Radeon R5 (Bristol Ridge)
Adreno 690 *
Adreno 685 *
Adreno 680 *
Radeon R5 M330
GeForce 910M
HD Graphics 520
Class 4 UHD Graphics 730
Radeon R5 M320 *
Radeon R5 M315 *
Radeon R5 M420 *
Vega 2 *
UHD Graphics 617
UHD Graphics 615
HD Graphics 515
UHD Graphics 610
HD Graphics 510
UHD Graphics 605
Radeon R4 (Stoney Ridge)
Radeon R2 (Stoney Ridge)
HD Graphics (Broadwell)
UHD Graphics 600
HD Graphics (Braswell)
Class 5 * Approximate position of the graphics adapter
Klaus Hinum (Update: 2020-01-22)
 Deutsch
 English
 Español
 Français
 Italiano
 Nederlands
 Polski
 Português
 Русский
 Türkçe
 Svenska
 Chinese
 Magyar