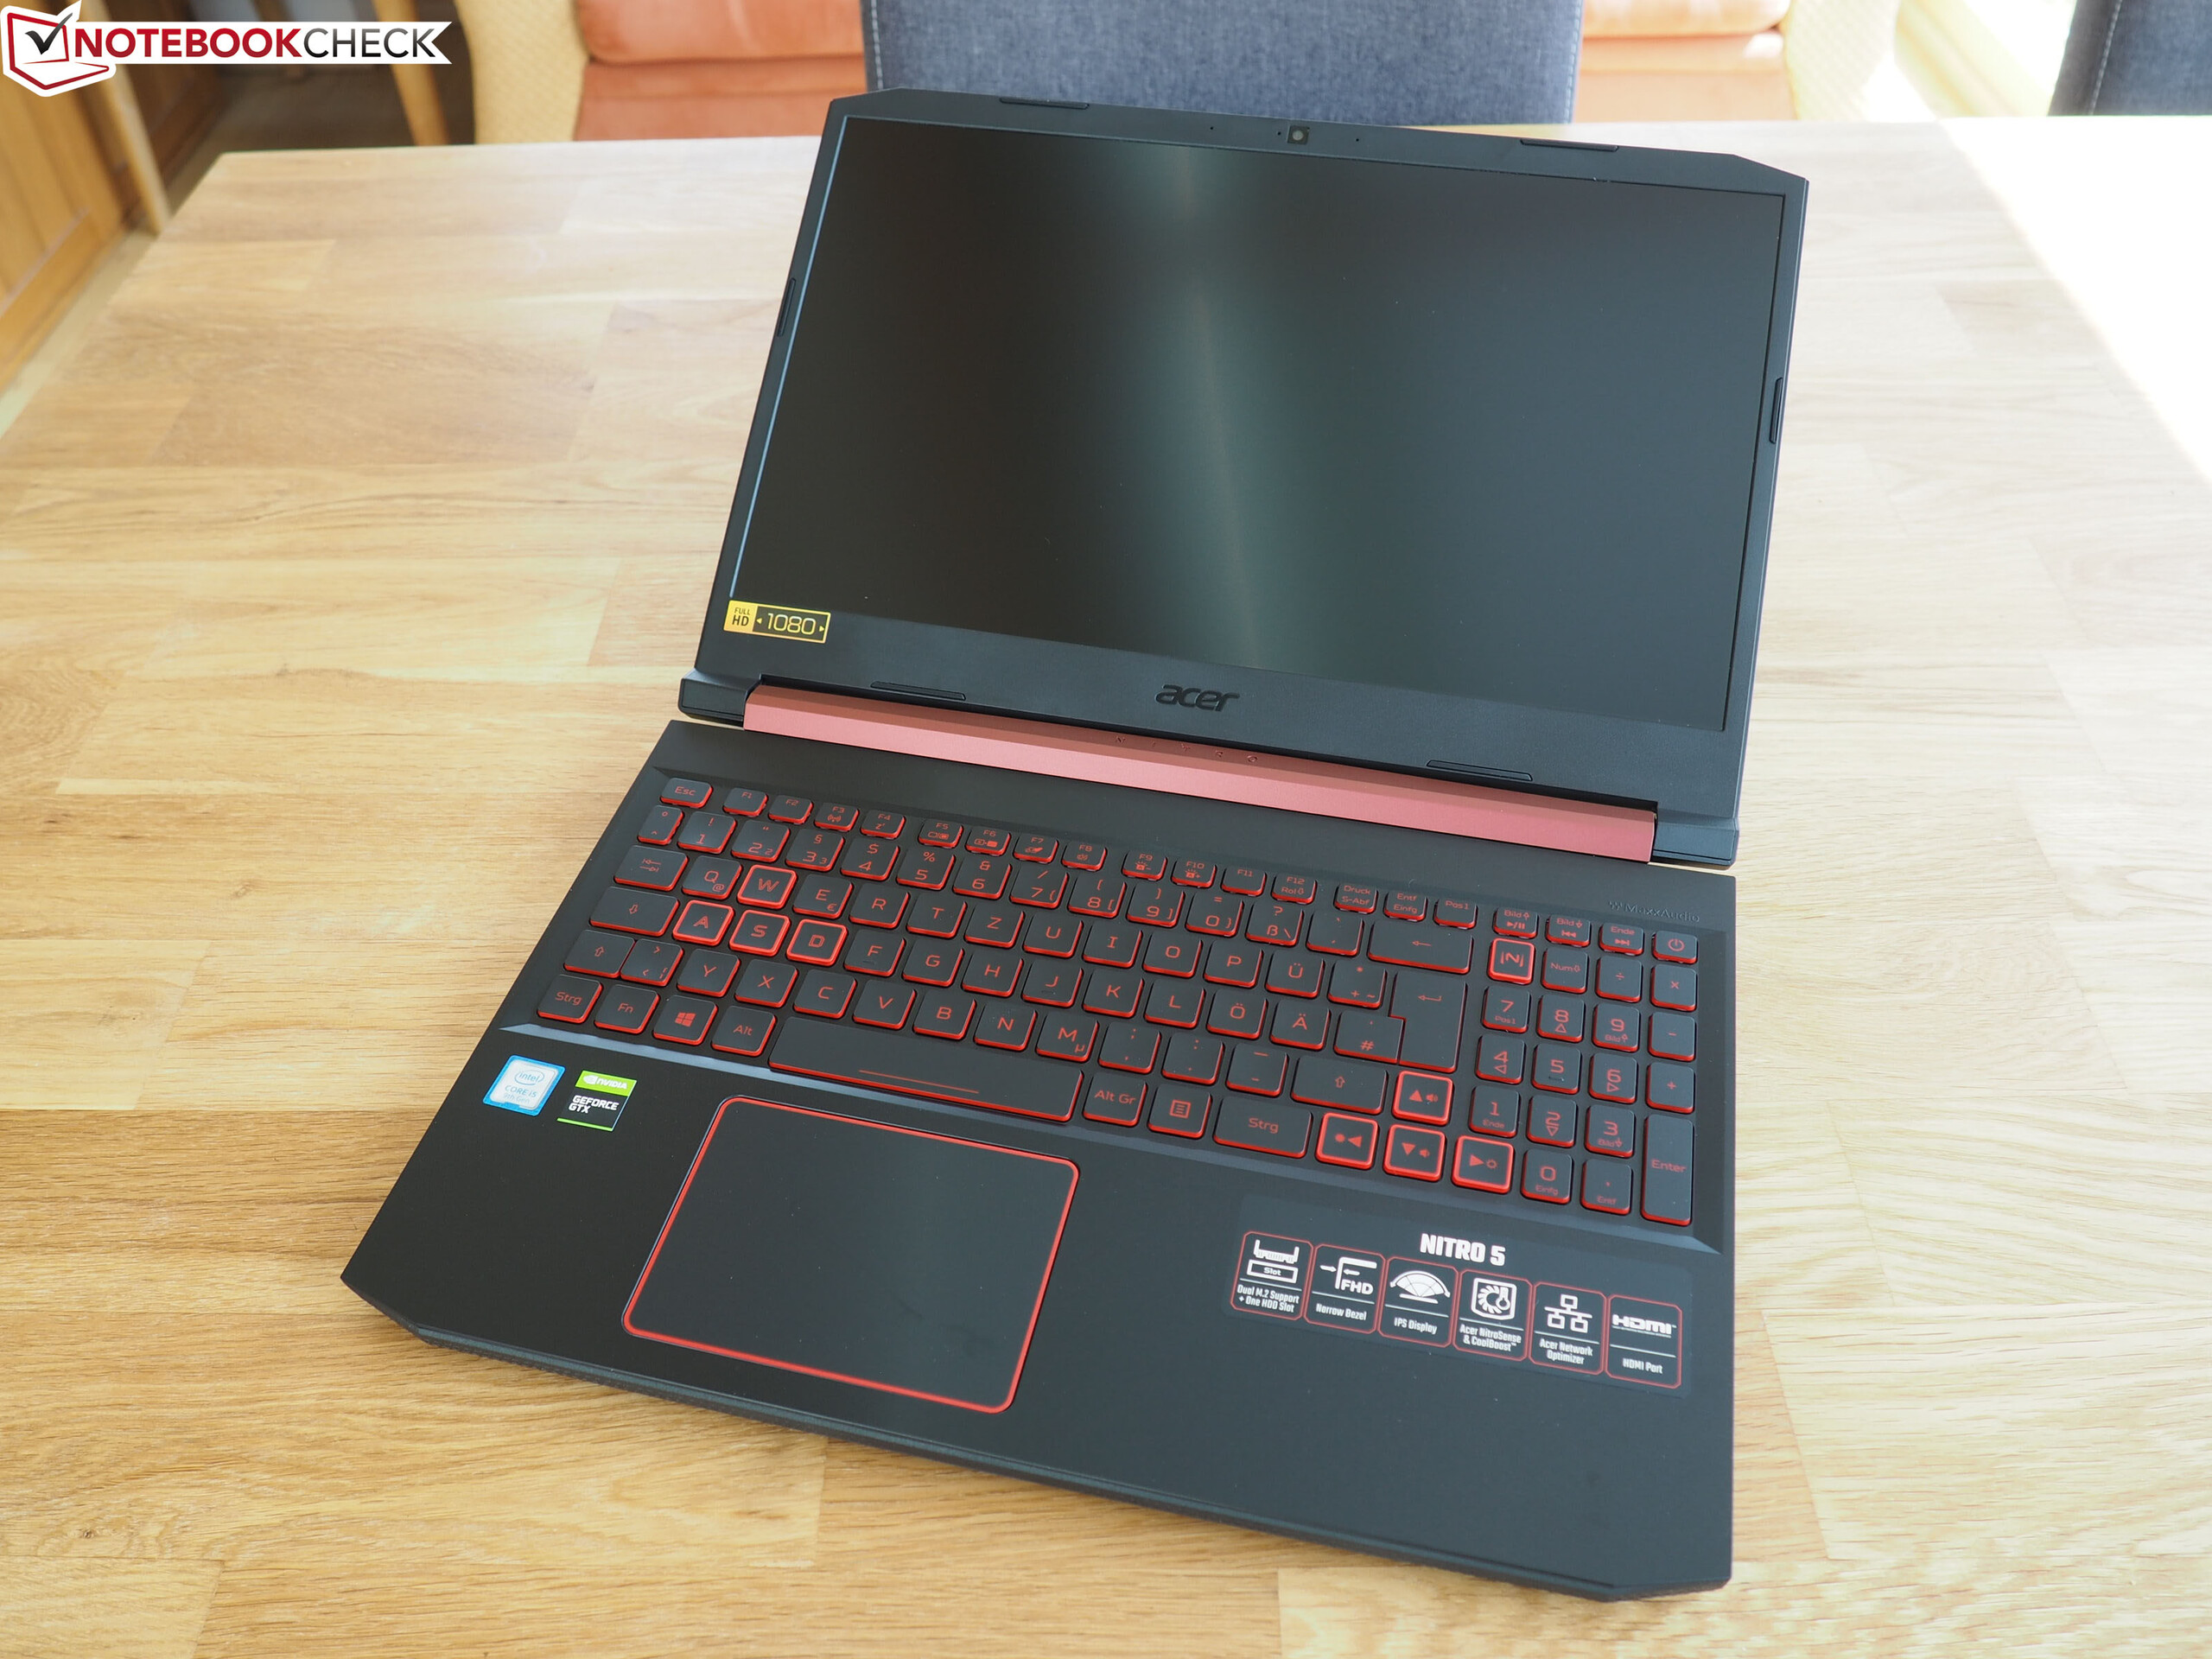
宏碁Nitro 5 (Core i5-9300H, GeForce GTX 1650) 笔记本电脑评测
| Networking | |
| iperf3 transmit AX12 | |
| Lenovo Legion Y730-15ICH i5-8300H | |
| Acer Aspire Nitro 5 AN515-54-53Z2 | |
| Medion Erazer X6805-MD61085 | |
| Dell G5 15 5587 | |
| Acer Nitro 5 AN515-42-R6V0 | |
| iperf3 receive AX12 | |
| Acer Nitro 5 AN515-42-R6V0 | |
| Medion Erazer X6805-MD61085 | |
| Acer Aspire Nitro 5 AN515-54-53Z2 | |
| Lenovo Legion Y730-15ICH i5-8300H | |
| Dell G5 15 5587 | |
| |||||||||||||||||||||||||
Brightness Distribution: 83 %
Center on Battery: 238 cd/m²
Contrast: 881:1 (Black: 0.27 cd/m²)
ΔE ColorChecker Calman: 4.11 | ∀{0.5-29.43 Ø4.73}
calibrated: 3.76
ΔE Greyscale Calman: 1.78 | ∀{0.09-98 Ø4.97}
57% sRGB (Argyll 1.6.3 3D)
36% AdobeRGB 1998 (Argyll 1.6.3 3D)
39.23% AdobeRGB 1998 (Argyll 3D)
57% sRGB (Argyll 3D)
37.97% Display P3 (Argyll 3D)
Gamma: 2.41
CCT: 6311 K
| Acer Aspire Nitro 5 AN515-54-53Z2 LG LP156WFC-SPD1 (LGD0563), IPS, 1920x1080 | Medion Erazer X6805-MD61085 LG Philips LP156WF6 (LGD046F), IPS, 1920x1080 | Dell G5 15 5587 LGD053F, 156WF6, IPS, 1920x1080 | Lenovo Legion Y730-15ICH i5-8300H BOE NV156FHM-N61, IPS, 1920x1080 | Acer Nitro 5 AN515-42-R6V0 AU Optronics B156HAN06.0 (AUO60ED), IPS, 1920x1080 | |
|---|---|---|---|---|---|
| Display | 56% | 0% | 61% | 61% | |
| Display P3 Coverage (%) | 37.97 | 63.8 68% | 38.13 0% | 65.9 74% | 63.4 67% |
| sRGB Coverage (%) | 57 | 82.4 45% | 56.8 0% | 85.5 50% | 87.4 53% |
| AdobeRGB 1998 Coverage (%) | 39.23 | 60.3 54% | 39.47 1% | 62.5 59% | 64 63% |
| Response Times | 0% | 16% | -26% | -19% | |
| Response Time Grey 50% / Grey 80% * (ms) | 42 ? | 38.4 ? 9% | 33 ? 21% | 43.2 ? -3% | 48.4 ? -15% |
| Response Time Black / White * (ms) | 26.8 ? | 29.2 ? -9% | 24 ? 10% | 40 ? -49% | 32.8 ? -22% |
| PWM Frequency (Hz) | 20490 ? | 21740 ? | |||
| Screen | -6% | -38% | -18% | 3% | |
| Brightness middle (cd/m²) | 238 | 270 13% | 229 -4% | 286.5 20% | 299 26% |
| Brightness (cd/m²) | 226 | 269 19% | 224 -1% | 269 19% | 284 26% |
| Brightness Distribution (%) | 83 | 86 4% | 87 5% | 84 1% | 88 6% |
| Black Level * (cd/m²) | 0.27 | 0.32 -19% | 0.28 -4% | 0.33 -22% | 0.24 11% |
| Contrast (:1) | 881 | 844 -4% | 818 -7% | 868 -1% | 1246 41% |
| Colorchecker dE 2000 * | 4.11 | 5.1 -24% | 6.1 -48% | 6.3 -53% | 4.98 -21% |
| Colorchecker dE 2000 max. * | 6.89 | 9.25 -34% | 12.2 -77% | 10.01 -45% | 7.67 -11% |
| Colorchecker dE 2000 calibrated * | 3.76 | 3.25 14% | 6.12 -63% | 4.17 -11% | 3.7 2% |
| Greyscale dE 2000 * | 1.78 | 4.16 -134% | 5.68 -219% | 5.6 -215% | 4.58 -157% |
| Gamma | 2.41 91% | 2.53 87% | 2.4 92% | 2.23 99% | 2.55 86% |
| CCT | 6311 103% | 6860 95% | 6989 93% | 6822 95% | 6397 102% |
| Color Space (Percent of AdobeRGB 1998) (%) | 36 | 54 50% | 36 0% | 55.7 55% | 57 58% |
| Color Space (Percent of sRGB) (%) | 57 | 82 44% | 57 0% | 85.1 49% | 87 53% |
| Total Average (Program / Settings) | 17% /
6% | -7% /
-24% | 6% /
-5% | 15% /
11% |
* ... smaller is better
Display Response Times
| ↔ Response Time Black to White | ||
|---|---|---|
| 26.8 ms ... rise ↗ and fall ↘ combined | ↗ 16 ms rise | 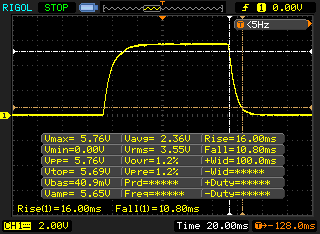 |
| ↘ 10.8 ms fall | ||
| The screen shows relatively slow response rates in our tests and may be too slow for gamers. In comparison, all tested devices range from 0.1 (minimum) to 240 (maximum) ms. » 67 % of all devices are better. This means that the measured response time is worse than the average of all tested devices (19.9 ms). | ||
| ↔ Response Time 50% Grey to 80% Grey | ||
| 42 ms ... rise ↗ and fall ↘ combined | ↗ 20.8 ms rise | 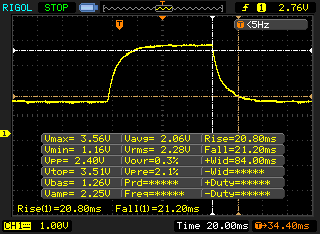 |
| ↘ 21.2 ms fall | ||
| The screen shows slow response rates in our tests and will be unsatisfactory for gamers. In comparison, all tested devices range from 0.165 (minimum) to 636 (maximum) ms. » 67 % of all devices are better. This means that the measured response time is worse than the average of all tested devices (31.1 ms). | ||
Screen Flickering / PWM (Pulse-Width Modulation)
| Screen flickering / PWM not detected |  | ||
In comparison: 52 % of all tested devices do not use PWM to dim the display. If PWM was detected, an average of 7791 (minimum: 5 - maximum: 343500) Hz was measured. | |||
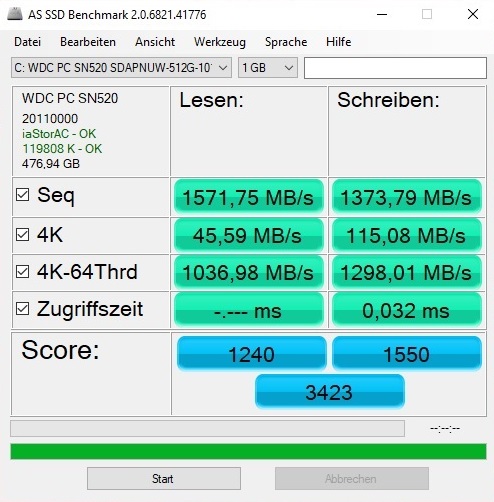
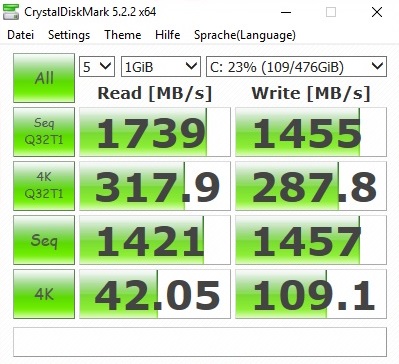
| Acer Aspire Nitro 5 AN515-54-53Z2 WDC PC SN520 SDAPNUW-512G | Medion Erazer X6805-MD61085 Samsung PM961 MZVLW256HEHP | Dell G5 15 5587 SK hynix SC311 M.2 | Lenovo Legion Y730-15ICH i5-8300H Intel Optane 16 GB MEMPEK1J016GAL + HGST ST1000LM049 1 TB HDD | Acer Nitro 5 AN515-42-R6V0 SK Hynix HFS128G39TND | |
|---|---|---|---|---|---|
| AS SSD | -7% | -70% | -48% | -73% | |
| Seq Read (MB/s) | 1572 | 1653 5% | 511 -67% | 736 -53% | 470.8 -70% |
| Seq Write (MB/s) | 1374 | 1262 -8% | 243.7 -82% | 156.1 -89% | 126.8 -91% |
| 4K Read (MB/s) | 45.59 | 44.29 -3% | 24.44 -46% | 94.2 107% | 23.64 -48% |
| 4K Write (MB/s) | 115.1 | 100.9 -12% | 62.2 -46% | 45.63 -60% | 54.5 -53% |
| Score Read (Points) | 1240 | 1565 26% | 240 -81% | 290 -77% | 274 -78% |
| Score Write (Points) | 1550 | 762 -51% | 199 -87% | 239 -85% | 194 -87% |
| Score Total (Points) | 3423 | 3113 -9% | 557 -84% | 692 -80% | 600 -82% |

| 3DMark 11 Performance | 11828 points | |
| 3DMark Fire Strike Score | 8073 points | |
Help | ||
| 3DMark - 1920x1080 Fire Strike Graphics | |
| Average of class Gaming (12242 - 62849, n=118, last 2 years) | |
| Medion Erazer X6805-MD61085 | |
| Dell G5 15 5587 | |
| Acer Aspire Nitro 5 AN515-54-53Z2 | |
| Lenovo Legion Y730-15ICH i5-8300H | |
| Acer Nitro 5 AN515-42-R6V0 | |
| 3DMark 11 - 1280x720 Performance GPU | |
| Average of class Gaming (21841 - 80022, n=106, last 2 years) | |
| Medion Erazer X6805-MD61085 | |
| Dell G5 15 5587 | |
| Acer Aspire Nitro 5 AN515-54-53Z2 | |
| Lenovo Legion Y730-15ICH i5-8300H | |
| Acer Nitro 5 AN515-42-R6V0 | |
| The Witcher 3 | |
| 1920x1080 High Graphics & Postprocessing (Nvidia HairWorks Off) | |
| Average of class Gaming (181 - 341, n=3, last 2 years) | |
| Medion Erazer X6805-MD61085 | |
| Acer Aspire Nitro 5 AN515-54-53Z2 | |
| Dell G5 15 5587 | |
| Lenovo Legion Y730-15ICH i5-8300H | |
| Acer Nitro 5 AN515-42-R6V0 | |
| 1920x1080 Ultra Graphics & Postprocessing (HBAO+) | |
| Average of class Gaming (95 - 240, n=8, last 2 years) | |
| Medion Erazer X6805-MD61085 | |
| Acer Aspire Nitro 5 AN515-54-53Z2 | |
| Dell G5 15 5587 | |
| Lenovo Legion Y730-15ICH i5-8300H | |
| Acer Nitro 5 AN515-42-R6V0 | |
| low | med. | high | ultra | |
|---|---|---|---|---|
| The Witcher 3 (2015) | 61.1 | 35.4 | ||
| Shadow of the Tomb Raider (2018) | 48 | 44 | ||
| Far Cry New Dawn (2019) | 57 | 53 |
Noise level
| Idle |
| 30 / 31 / 33 dB(A) |
| Load |
| 46 / 49 dB(A) |
 | ||
30 dB silent 40 dB(A) audible 50 dB(A) loud |
||
min: | ||
| Acer Aspire Nitro 5 AN515-54-53Z2 GeForce GTX 1650 Mobile, i5-9300H | Medion Erazer X6805-MD61085 GeForce GTX 1060 Mobile, i7-8750H | Dell G5 15 5587 GeForce GTX 1060 Max-Q, i5-8300H | Lenovo Legion Y730-15ICH i5-8300H GeForce GTX 1050 Ti Mobile, i5-8300H | Acer Nitro 5 AN515-42-R6V0 Radeon RX 560X (Laptop), R7 2700U | Average of class Gaming | |
|---|---|---|---|---|---|---|
| Noise | -2% | 5% | 5% | 6% | 9% | |
| off / environment * (dB) | 30 | 29 3% | 30.3 -1% | 28.9 4% | 29 3% | 24.1 ? 20% |
| Idle Minimum * (dB) | 30 | 29 3% | 31.1 -4% | 32.2 -7% | 29 3% | 25.8 ? 14% |
| Idle Average * (dB) | 31 | 32 -3% | 31.1 -0% | 32.5 -5% | 31 -0% | 27.4 ? 12% |
| Idle Maximum * (dB) | 33 | 35 -6% | 34.2 -4% | 32.7 1% | 32 3% | 29.9 ? 9% |
| Load Average * (dB) | 46 | 45 2% | 34.9 24% | 33.2 28% | 36 22% | 43 ? 7% |
| Witcher 3 ultra * (dB) | 46 | 47 -2% | 42.7 7% | 43.1 6% | 44 4% | |
| Load Maximum * (dB) | 49 | 56 -14% | 44 10% | 45 8% | 46 6% | 54 ? -10% |
* ... smaller is better
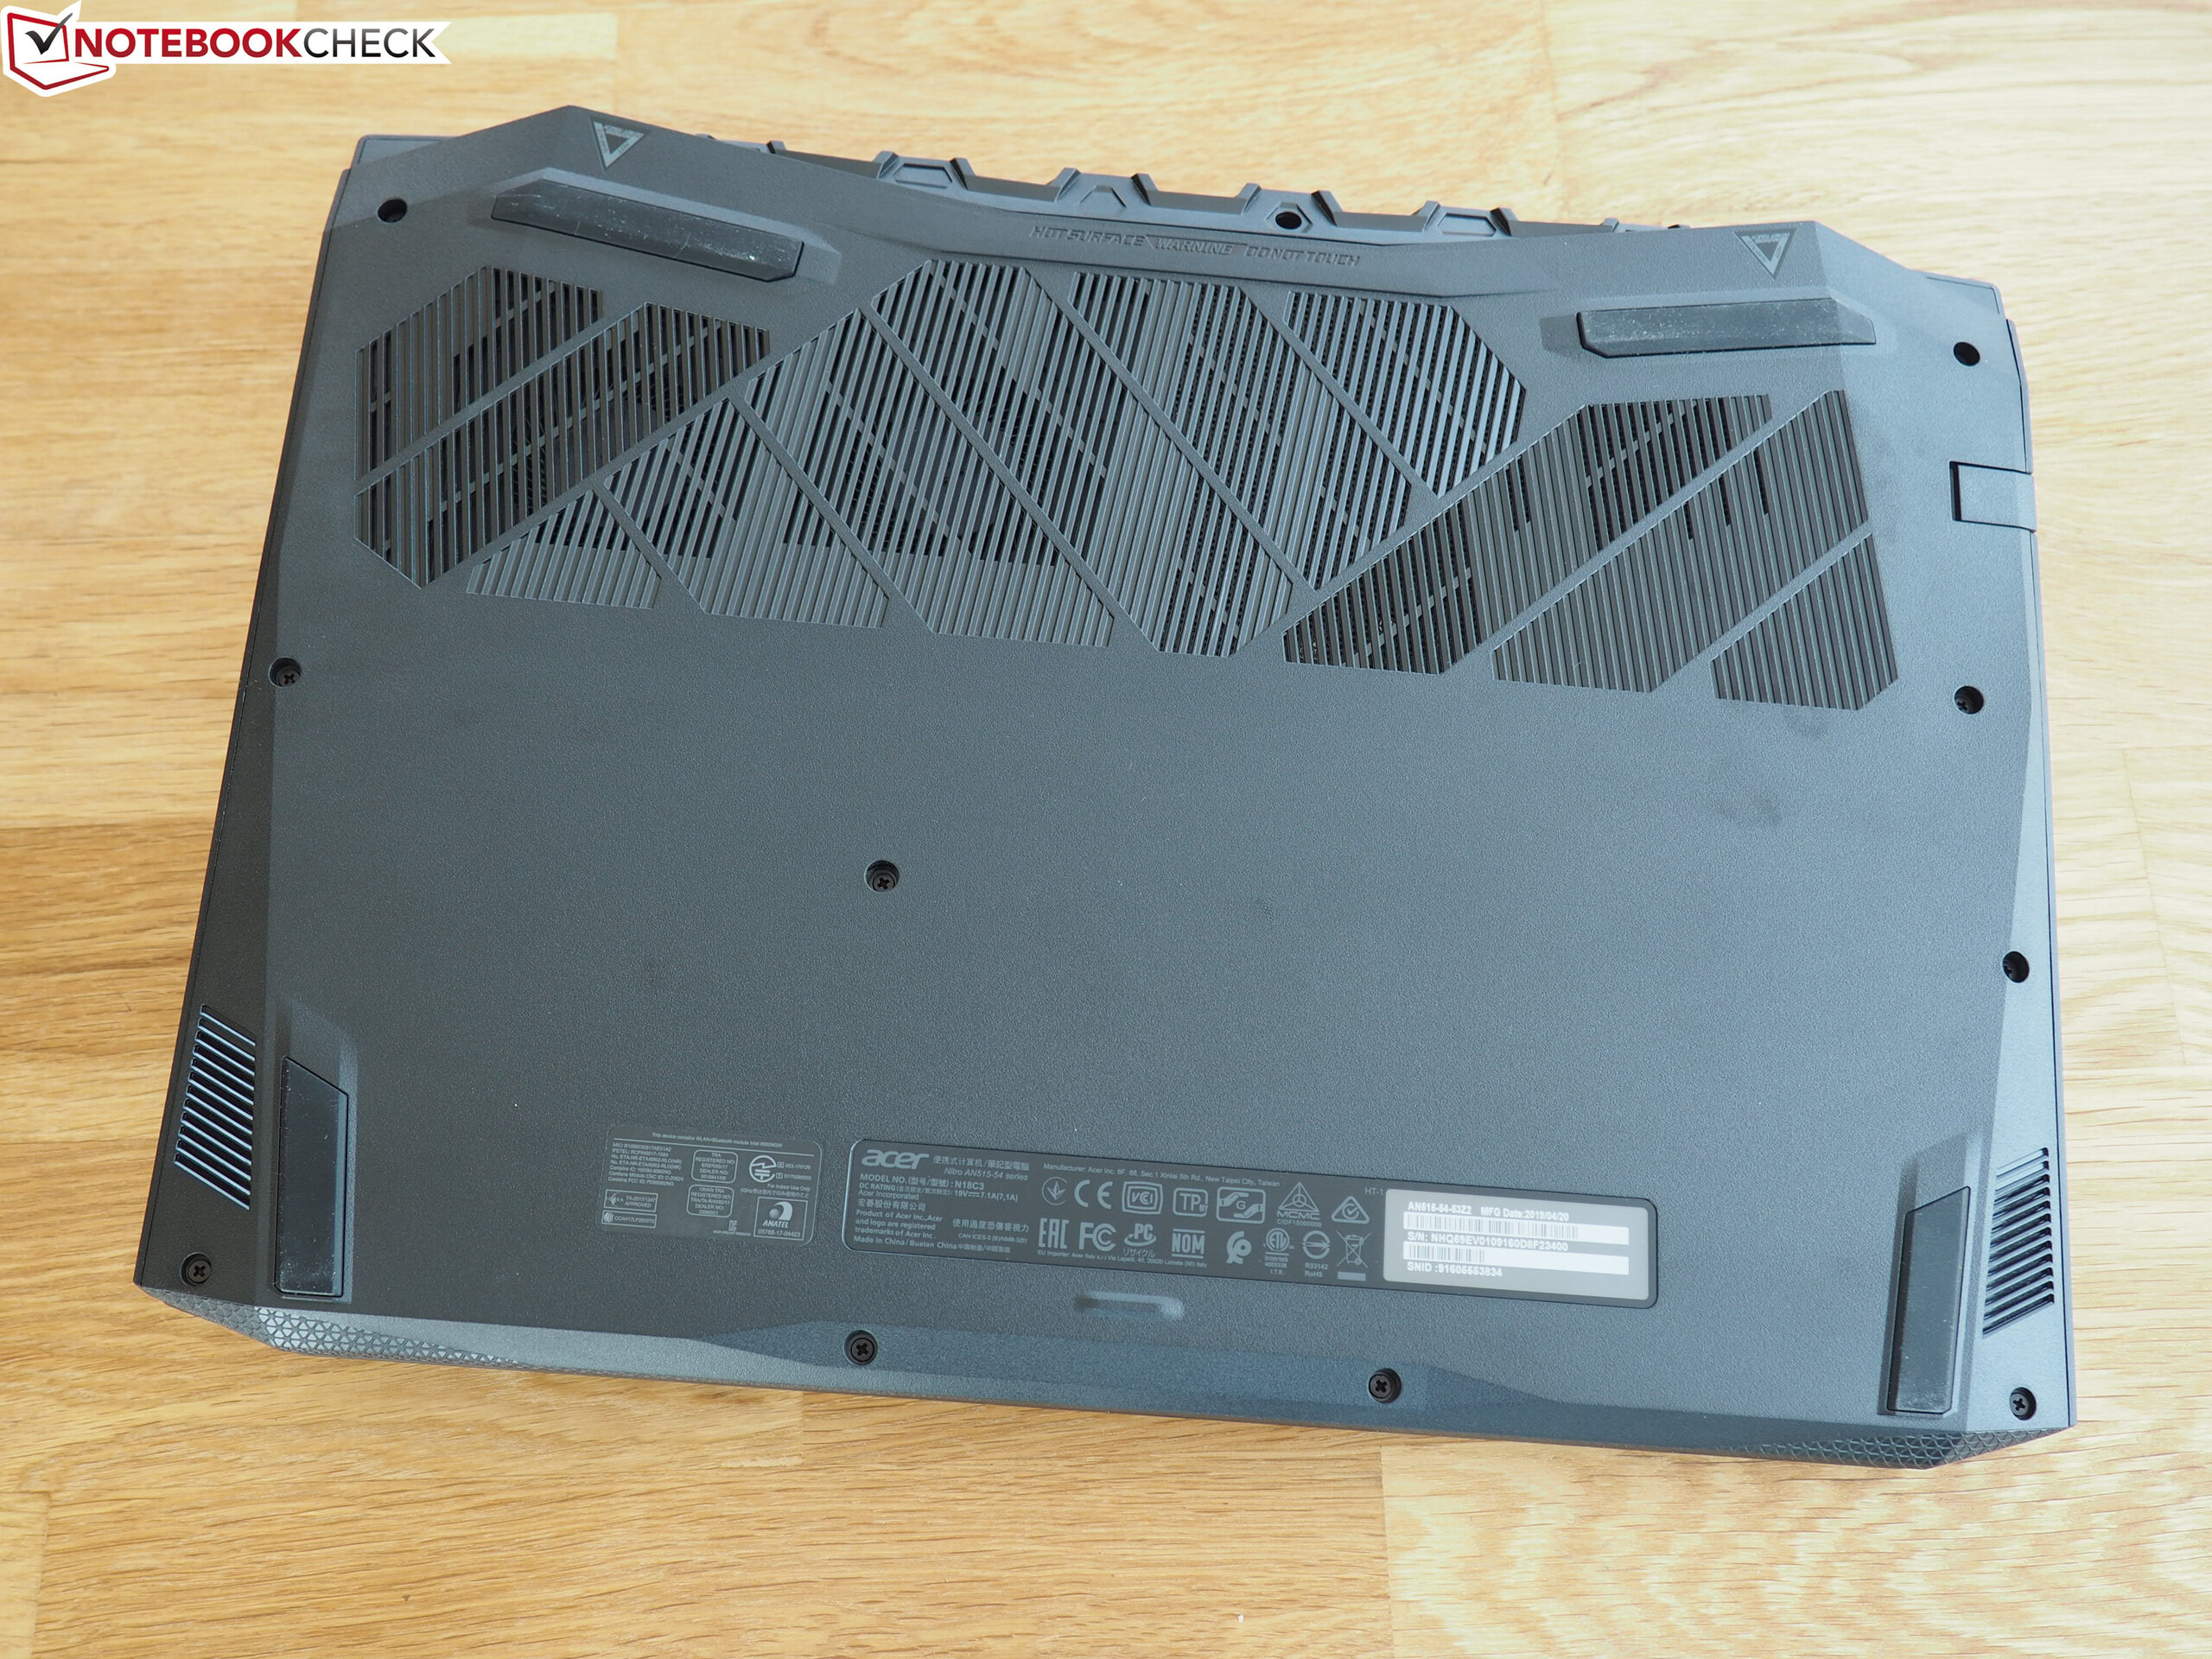
(-) The maximum temperature on the upper side is 47 °C / 117 F, compared to the average of 40.4 °C / 105 F, ranging from 21.2 to 68.8 °C for the class Gaming.
(-) The bottom heats up to a maximum of 50 °C / 122 F, compared to the average of 43.2 °C / 110 F
(+) In idle usage, the average temperature for the upper side is 22.9 °C / 73 F, compared to the device average of 33.9 °C / 93 F.
(±) Playing The Witcher 3, the average temperature for the upper side is 36 °C / 97 F, compared to the device average of 33.9 °C / 93 F.
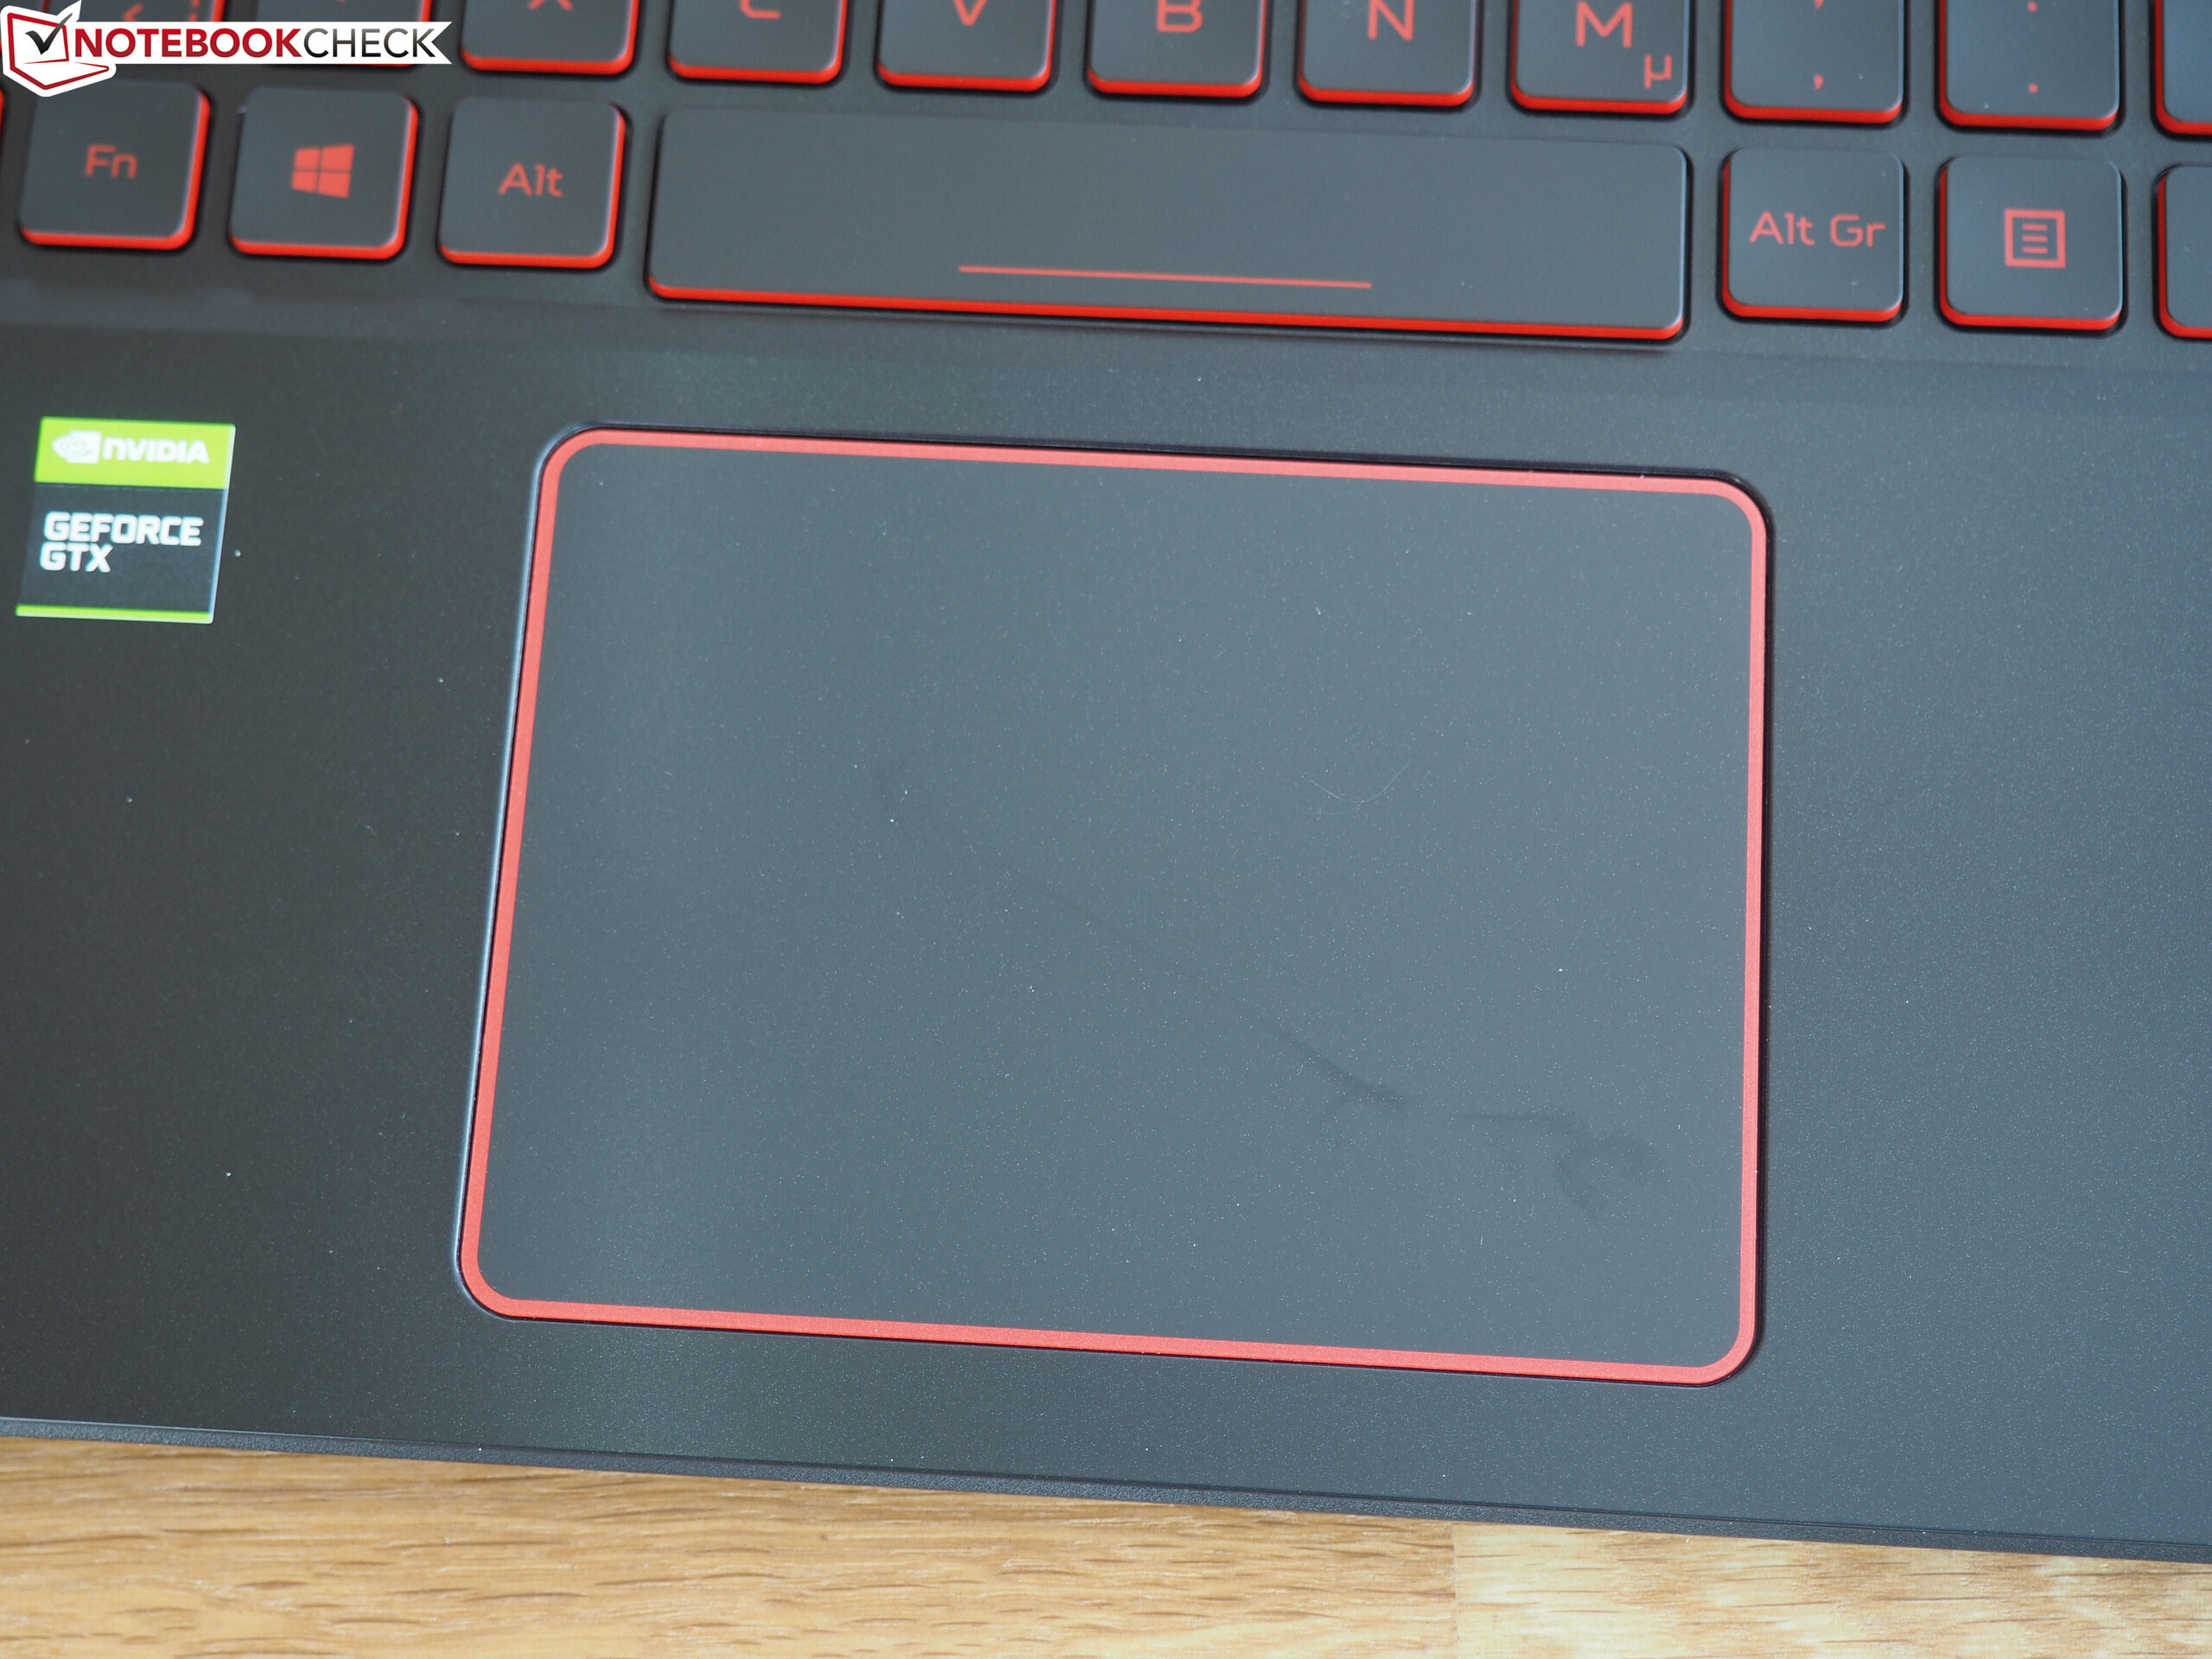
(+) The palmrests and touchpad are cooler than skin temperature with a maximum of 27 °C / 80.6 F and are therefore cool to the touch.
(±) The average temperature of the palmrest area of similar devices was 28.8 °C / 83.8 F (+1.8 °C / 3.2 F).
| Acer Aspire Nitro 5 AN515-54-53Z2 GeForce GTX 1650 Mobile, i5-9300H | Medion Erazer X6805-MD61085 GeForce GTX 1060 Mobile, i7-8750H | Dell G5 15 5587 GeForce GTX 1060 Max-Q, i5-8300H | Lenovo Legion Y730-15ICH i5-8300H GeForce GTX 1050 Ti Mobile, i5-8300H | Acer Nitro 5 AN515-42-R6V0 Radeon RX 560X (Laptop), R7 2700U | Average of class Gaming | |
|---|---|---|---|---|---|---|
| Heat | -10% | -14% | 11% | -6% | -15% | |
| Maximum Upper Side * (°C) | 47 | 43 9% | 50.2 -7% | 30 36% | 47 -0% | 45.2 ? 4% |
| Maximum Bottom * (°C) | 50 | 55 -10% | 57 -14% | 40.8 18% | 44 12% | 47.9 ? 4% |
| Idle Upper Side * (°C) | 24 | 28 -17% | 28.6 -19% | 23.4 2% | 30 -25% | 31.1 ? -30% |
| Idle Bottom * (°C) | 25 | 30 -20% | 28.9 -16% | 27.8 -11% | 28 -12% | 34.2 ? -37% |
* ... smaller is better
Acer Aspire Nitro 5 AN515-54-53Z2 audio analysis
(±) | speaker loudness is average but good (79 dB)
Bass 100 - 315 Hz
(±) | reduced bass - on average 14.5% lower than median
(±) | linearity of bass is average (11.9% delta to prev. frequency)
Mids 400 - 2000 Hz
(±) | higher mids - on average 8.5% higher than median
(±) | linearity of mids is average (7.2% delta to prev. frequency)
Highs 2 - 16 kHz
(+) | balanced highs - only 3.4% away from median
(+) | highs are linear (6.7% delta to prev. frequency)
Overall 100 - 16.000 Hz
(±) | linearity of overall sound is average (20.7% difference to median)
Compared to same class
» 74% of all tested devices in this class were better, 4% similar, 21% worse
» The best had a delta of 6%, average was 18%, worst was 132%
Compared to all devices tested
» 56% of all tested devices were better, 8% similar, 37% worse
» The best had a delta of 4%, average was 24%, worst was 134%
Acer Nitro 5 AN515-42-R6V0 audio analysis
(±) | speaker loudness is average but good (79 dB)
Bass 100 - 315 Hz
(±) | reduced bass - on average 10.3% lower than median
(±) | linearity of bass is average (12.1% delta to prev. frequency)
Mids 400 - 2000 Hz
(±) | higher mids - on average 5.5% higher than median
(+) | mids are linear (3.3% delta to prev. frequency)
Highs 2 - 16 kHz
(+) | balanced highs - only 1.6% away from median
(+) | highs are linear (5.8% delta to prev. frequency)
Overall 100 - 16.000 Hz
(±) | linearity of overall sound is average (15% difference to median)
Compared to same class
» 32% of all tested devices in this class were better, 6% similar, 62% worse
» The best had a delta of 6%, average was 18%, worst was 132%
Compared to all devices tested
» 20% of all tested devices were better, 4% similar, 75% worse
» The best had a delta of 4%, average was 24%, worst was 134%
| Off / Standby | |
| Idle | |
| Load |
|
Key:
min: | |
| Acer Aspire Nitro 5 AN515-54-53Z2 GeForce GTX 1650 Mobile, i5-9300H | Medion Erazer X6805-MD61085 GeForce GTX 1060 Mobile, i7-8750H | Dell G5 15 5587 GeForce GTX 1060 Max-Q, i5-8300H | Lenovo Legion Y730-15ICH i5-8300H GeForce GTX 1050 Ti Mobile, i5-8300H | Acer Nitro 5 AN515-42-R6V0 Radeon RX 560X (Laptop), R7 2700U | Average of class Gaming | |
|---|---|---|---|---|---|---|
| Power Consumption | -61% | -6% | -29% | -24% | -114% | |
| Idle Minimum * (Watt) | 5 | 10 -100% | 4.9 2% | 8 -60% | 7 -40% | 13.2 ? -164% |
| Idle Average * (Watt) | 7 | 13 -86% | 8.5 -21% | 11.8 -69% | 10 -43% | 18.9 ? -170% |
| Idle Maximum * (Watt) | 11 | 21 -91% | 9.1 17% | 13.1 -19% | 18 -64% | 24.3 ? -121% |
| Load Average * (Watt) | 89 | 101 -13% | 90.7 -2% | 90.2 -1% | 79 11% | 108.3 ? -22% |
| Witcher 3 ultra * (Watt) | 90 | 126 -40% | 110 -22% | 107.8 -20% | 98 -9% | |
| Load Maximum * (Watt) | 132 | 176 -33% | 144 -9% | 136.2 -3% | 128 3% | 254 ? -92% |
* ... smaller is better
| Acer Aspire Nitro 5 AN515-54-53Z2 GeForce GTX 1650 Mobile, i5-9300H, 57 Wh | Medion Erazer X6805-MD61085 GeForce GTX 1060 Mobile, i7-8750H, 46.7 Wh | Dell G5 15 5587 GeForce GTX 1060 Max-Q, i5-8300H, 56 Wh | Lenovo Legion Y730-15ICH i5-8300H GeForce GTX 1050 Ti Mobile, i5-8300H, 57 Wh | Acer Nitro 5 AN515-42-R6V0 Radeon RX 560X (Laptop), R7 2700U, 48 Wh | Average of class Gaming | |
|---|---|---|---|---|---|---|
| Battery runtime | -30% | -2% | -38% | -30% | -22% | |
| Reader / Idle (h) | 17.4 | 8.4 -52% | 11.8 -32% | 9.6 -45% | 8.71 ? -50% | |
| WiFi v1.3 (h) | 8.1 | 4.5 -44% | 6.5 -20% | 5.3 -35% | 5.7 -30% | 7.04 ? -13% |
| Load (h) | 1.5 | 1.6 7% | 2.2 47% | 1 -33% | 1.47 ? -2% | |
| H.264 (h) | 5.4 | 8.26 ? |
Pros
Cons
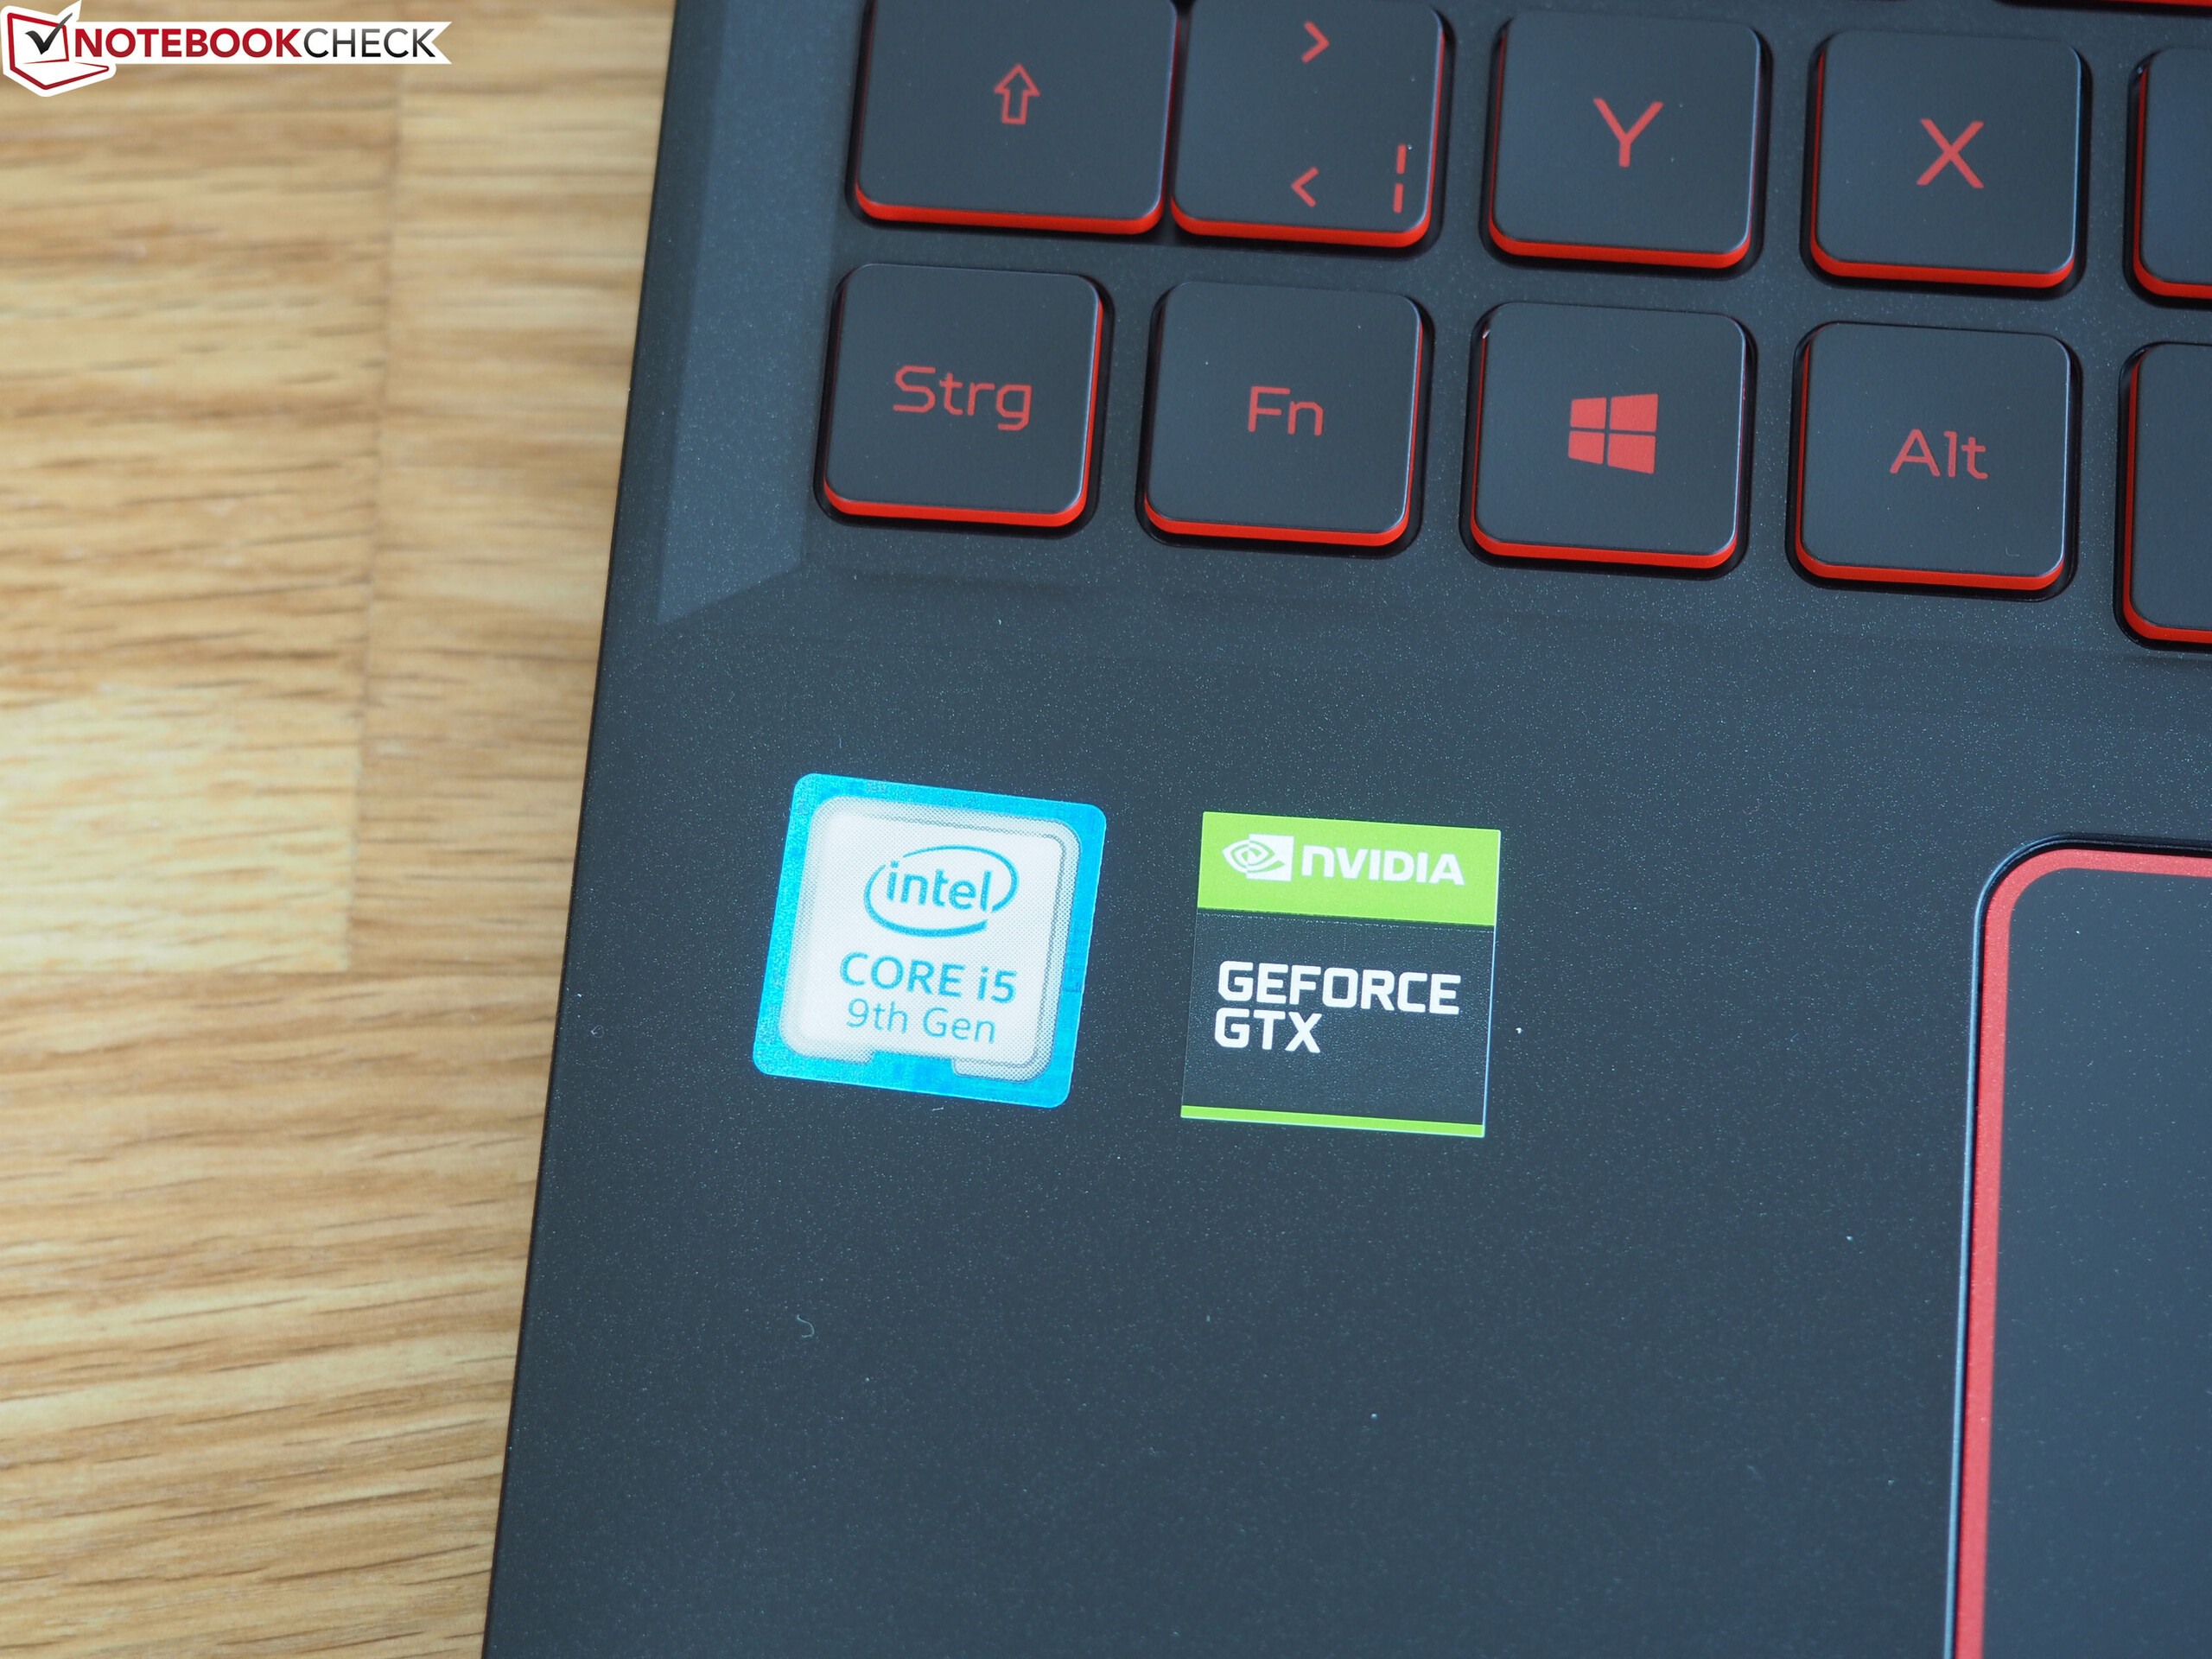
Acer Aspire Nitro 5是一款价格合理,性能平衡的机子。Coffee Lake CPU和图灵GPU的组合几乎可以流畅运行所有应用程序,除非您使用QHD或UHD分辨率以及极高的图形设置。我们也喜欢高速的PCIe SSD。
到目前为止,Nitro 5的最大亮点是其续航时间。该设备非常适合那些想要在移动中玩游戏的人。同样,对于那些想要做更多一般性任务的人来说也很优秀,比如回复电子邮件和浏览网页而不被束缚到电源插座。
宏碁Aspire Nitro 5虽然受到一些妥协和弱点的影响,但仍然物超所值。
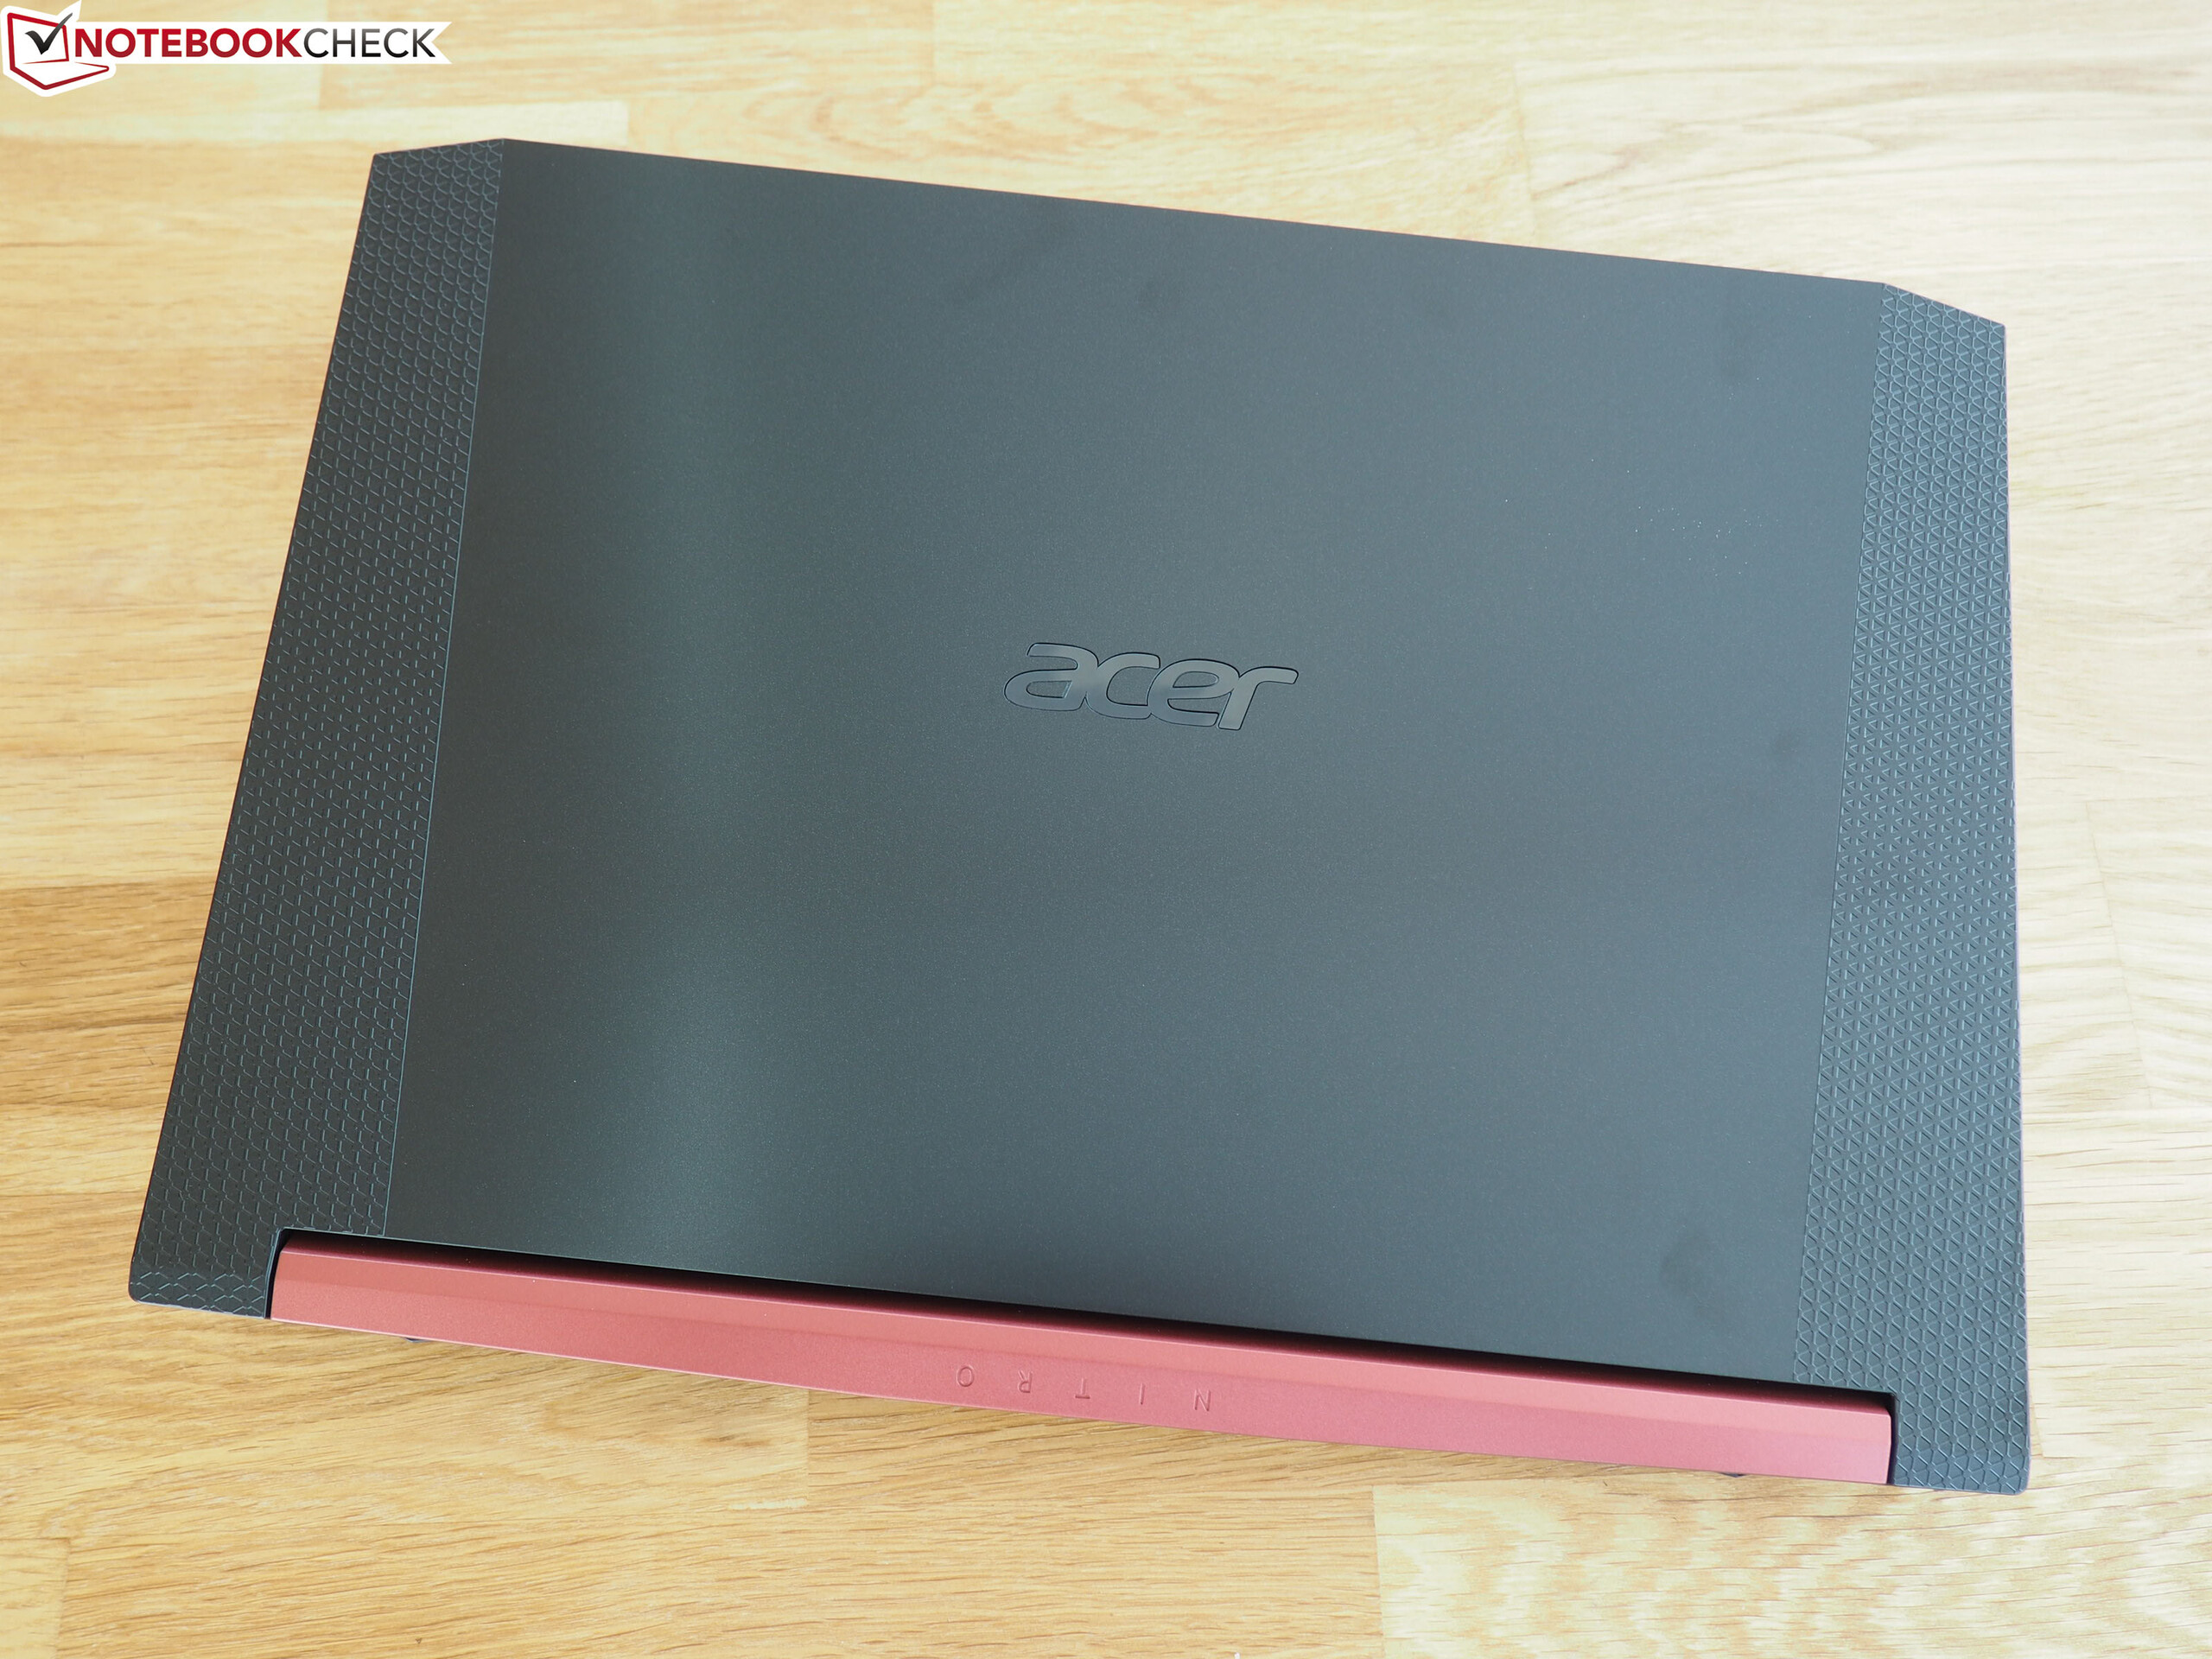
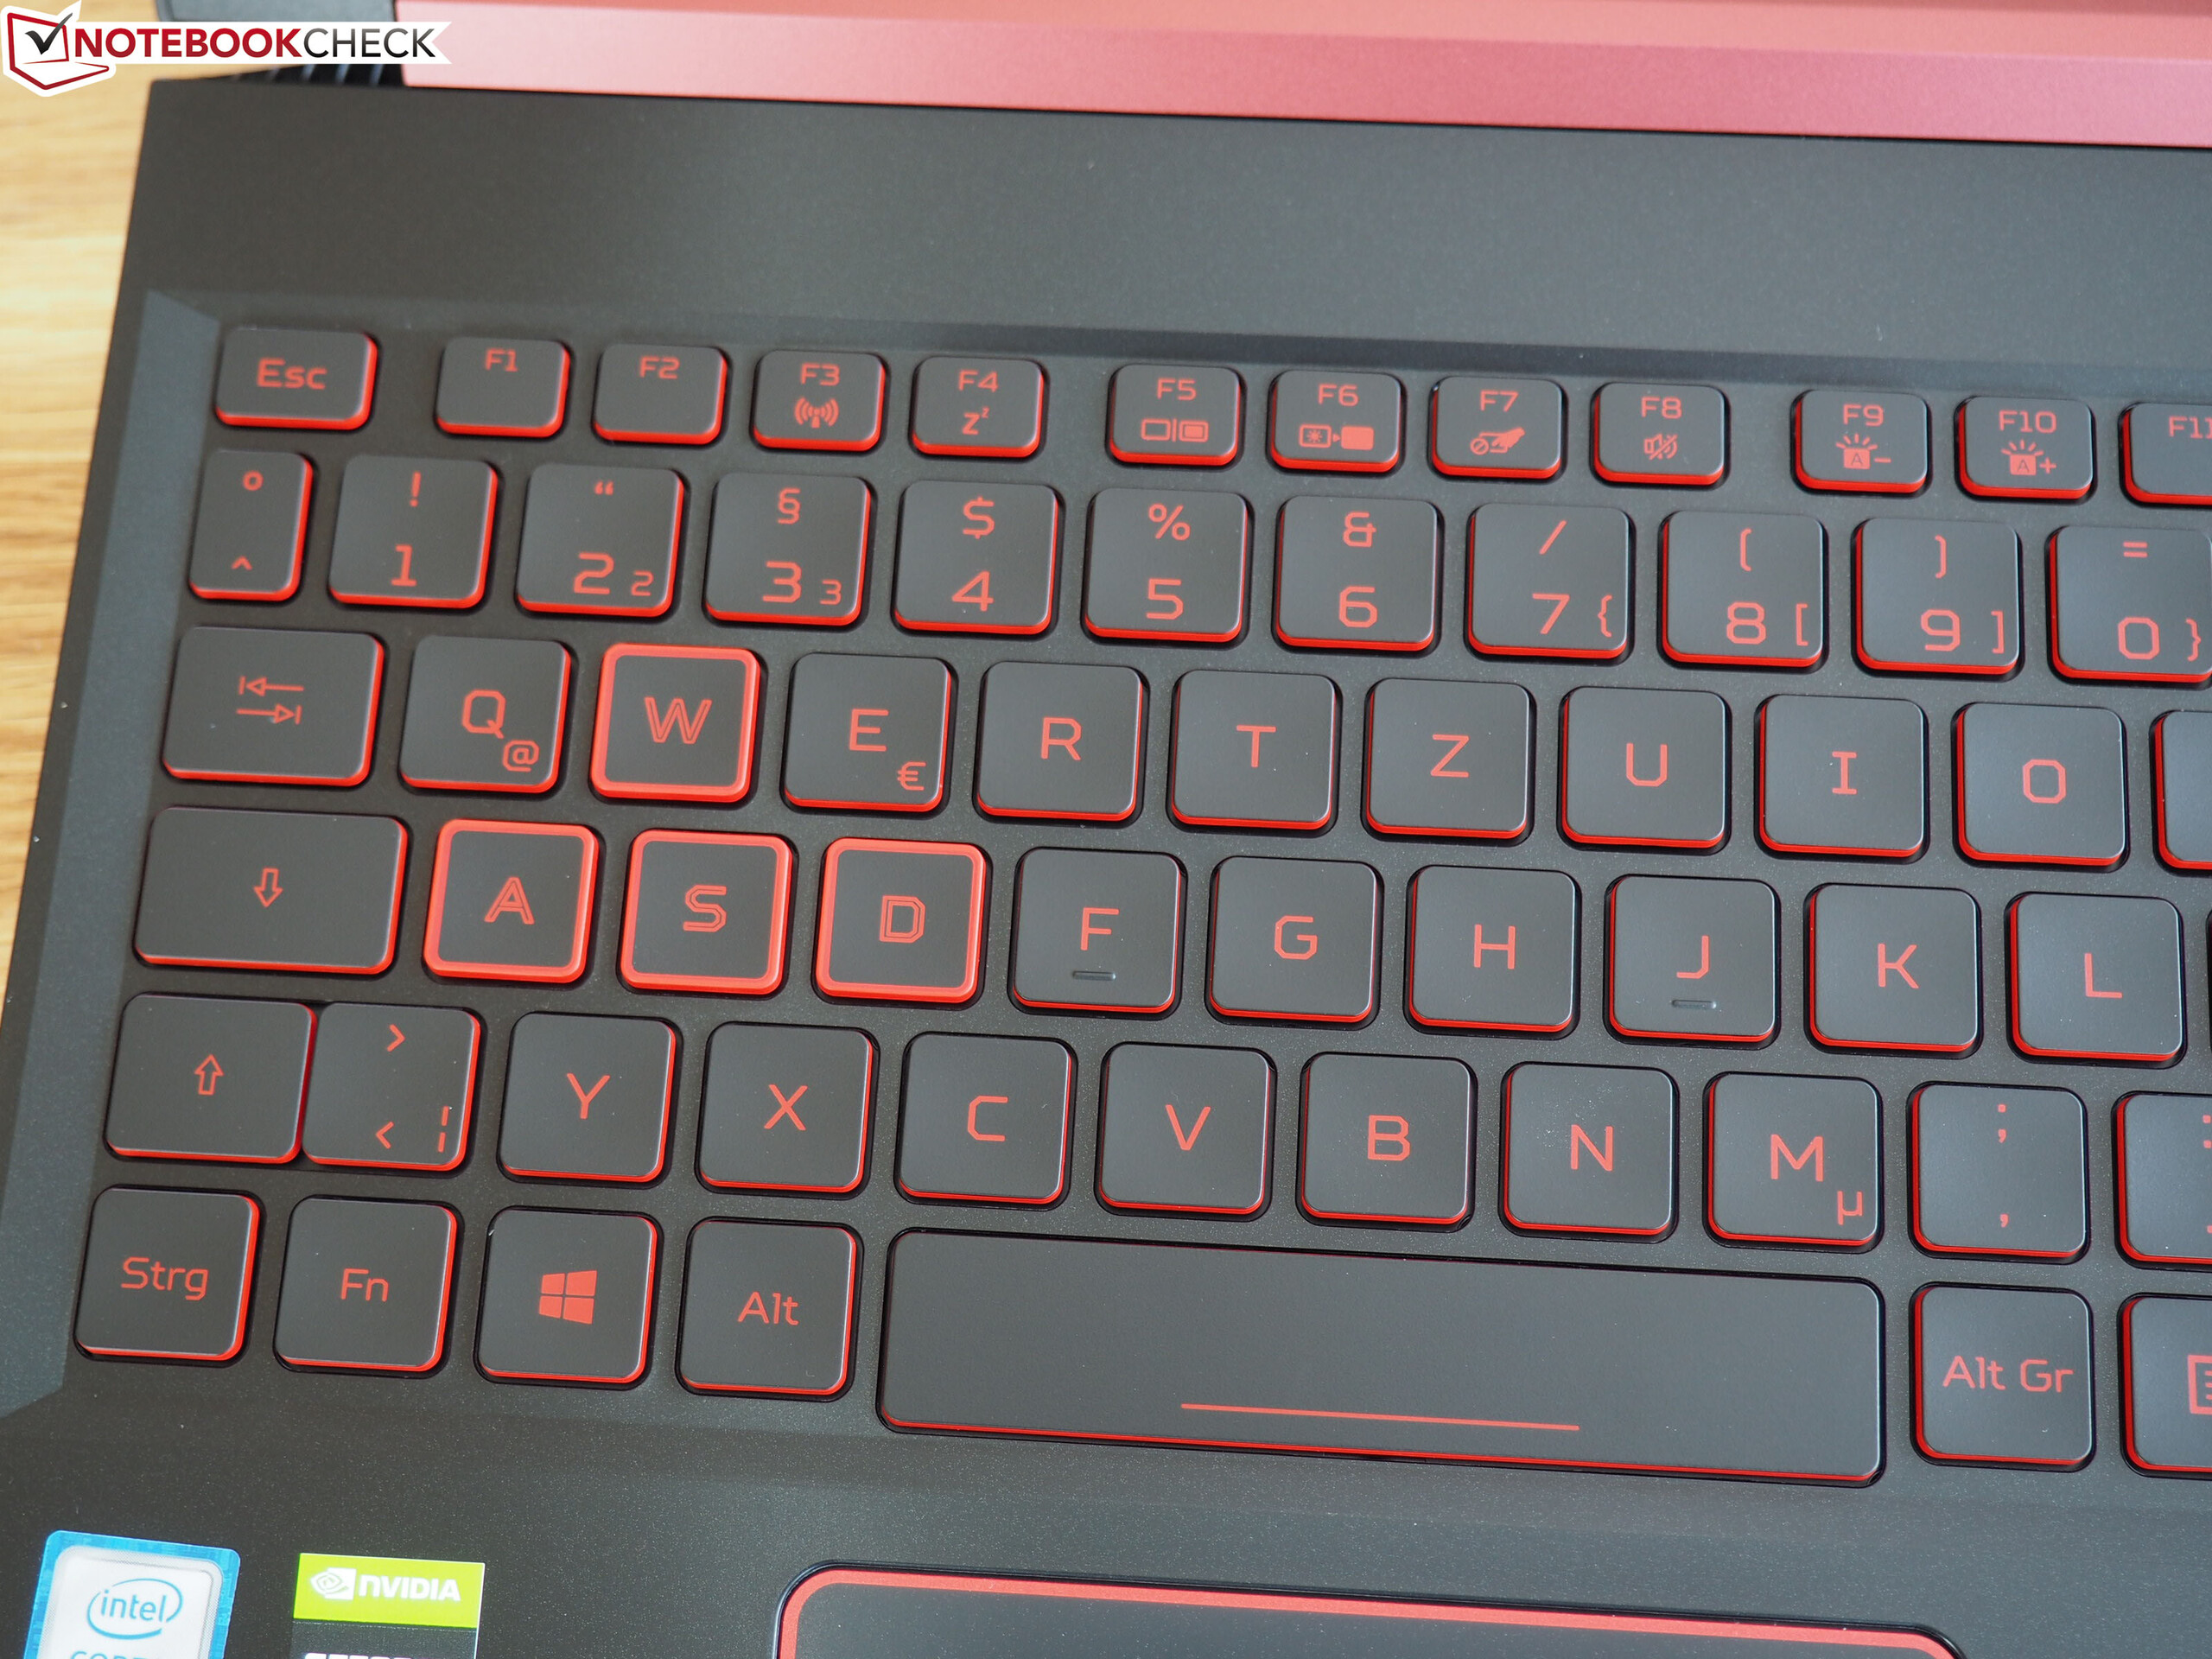
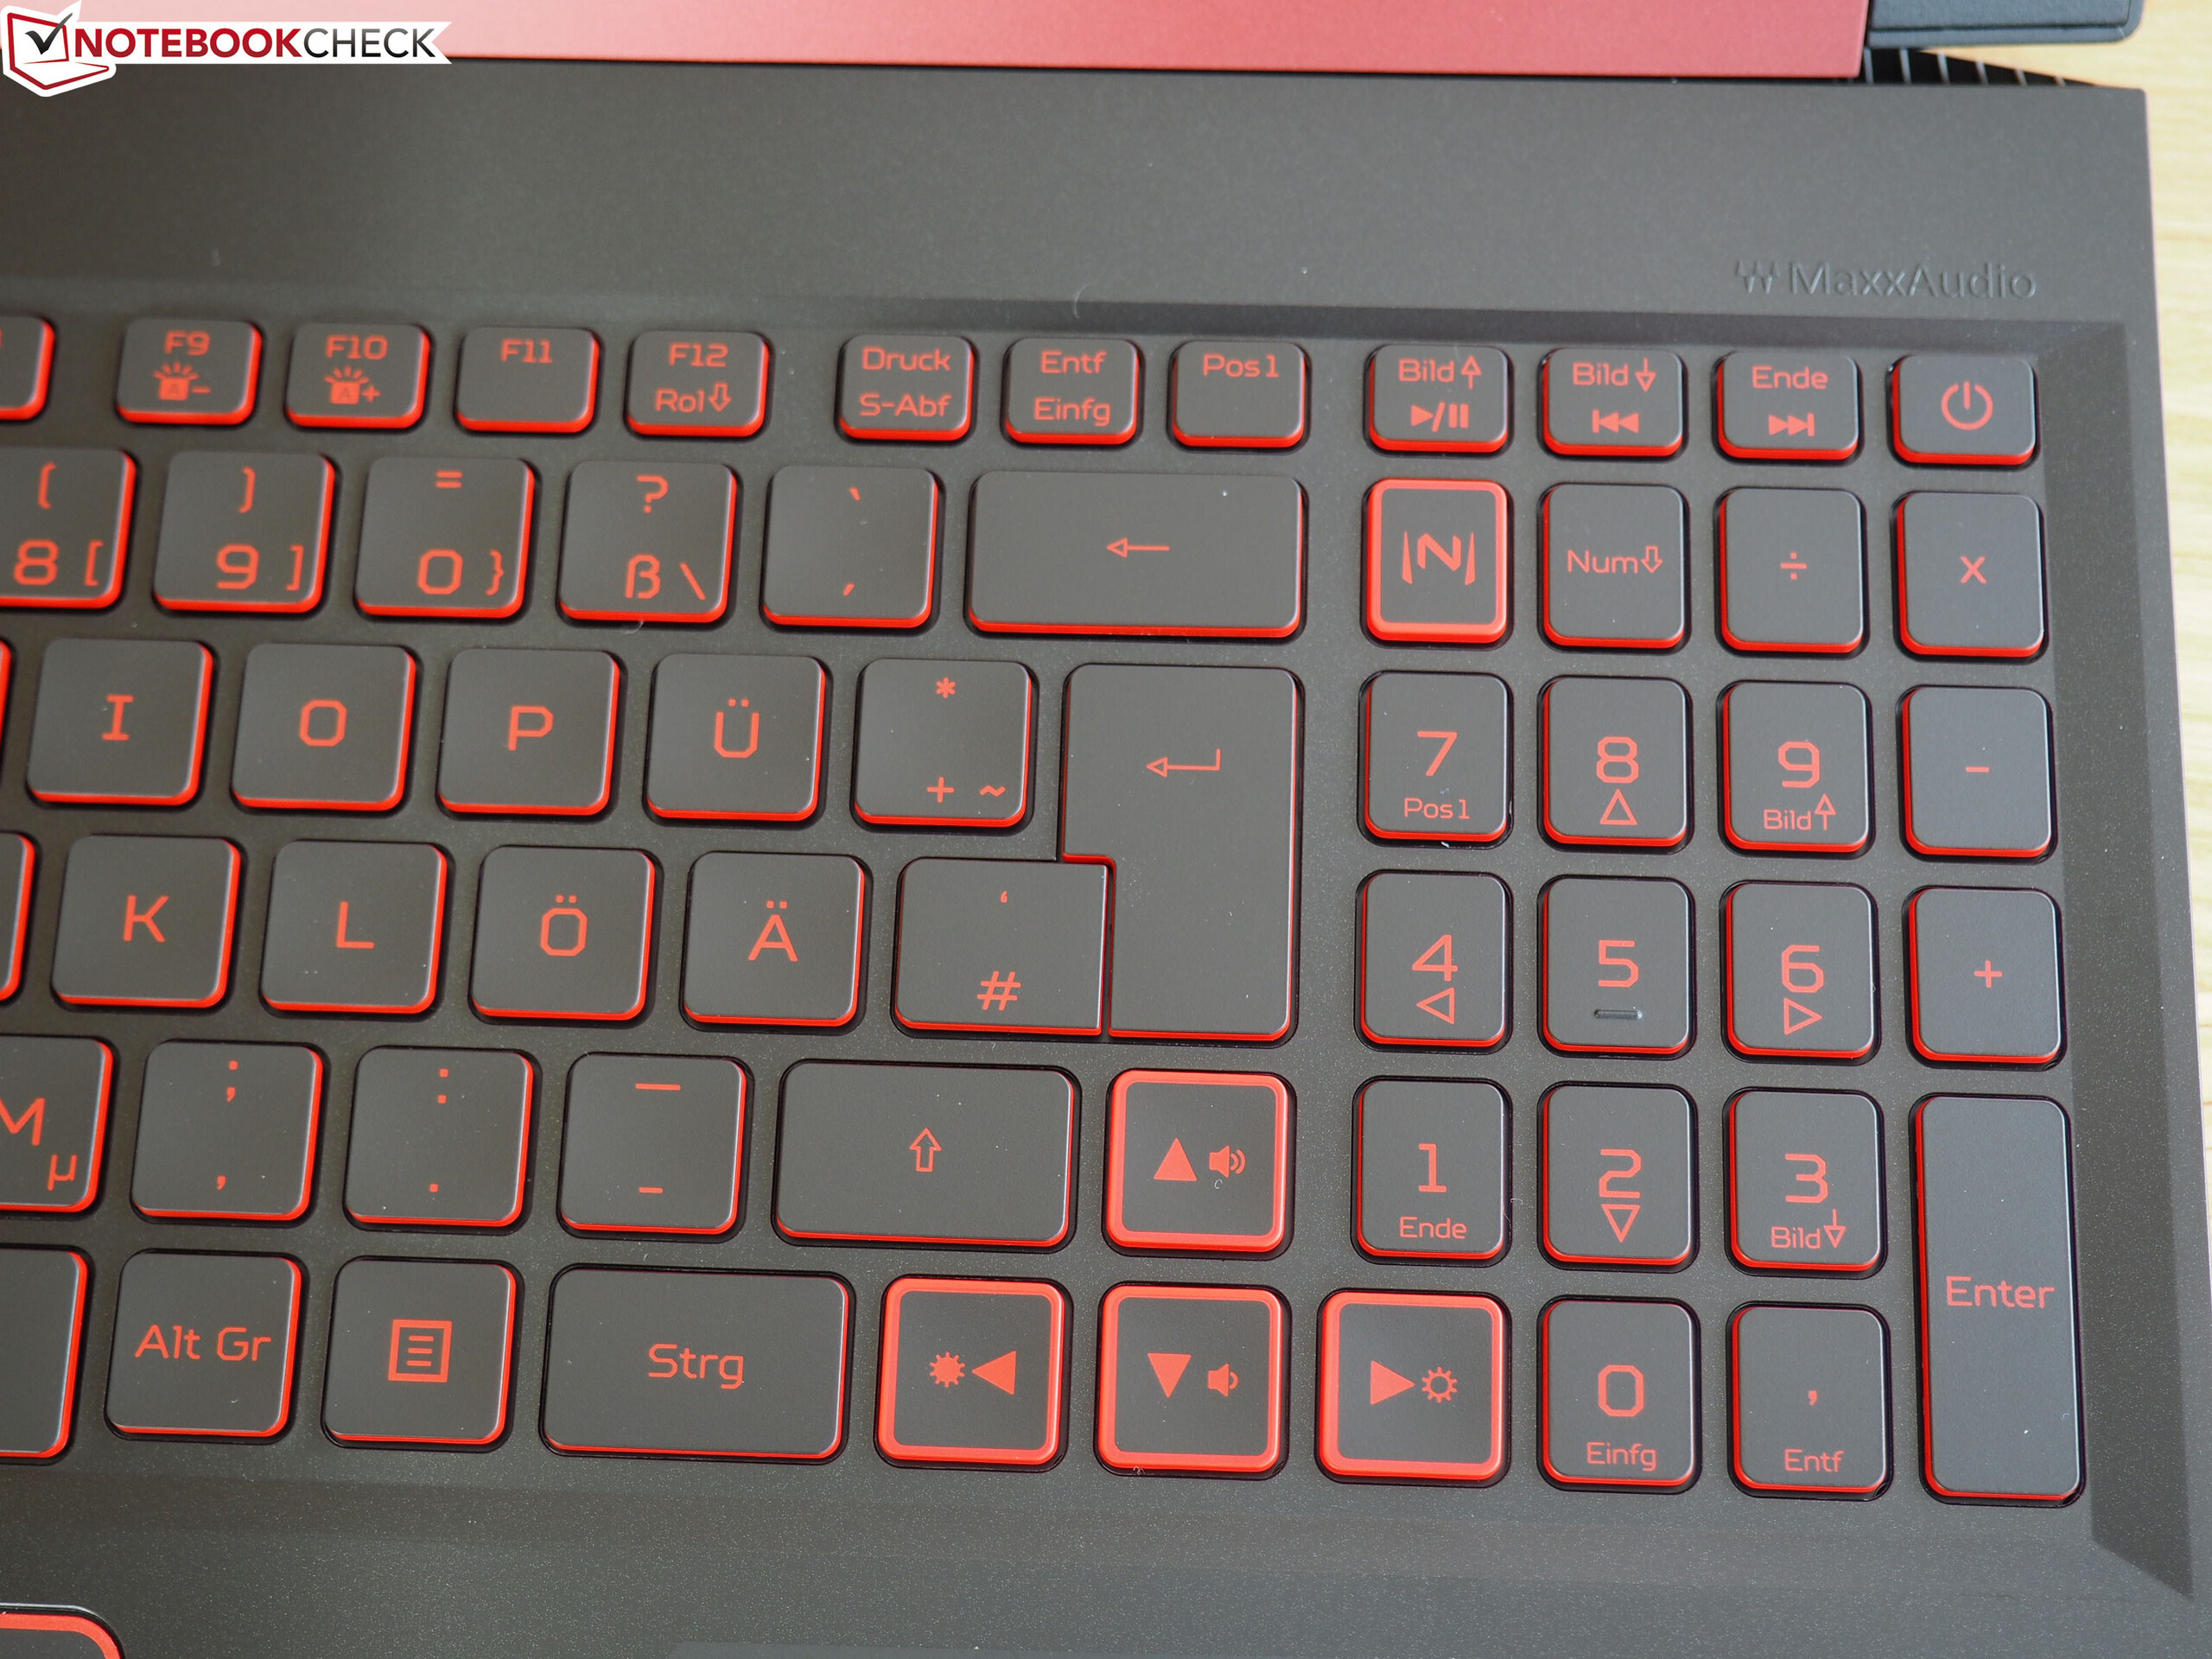
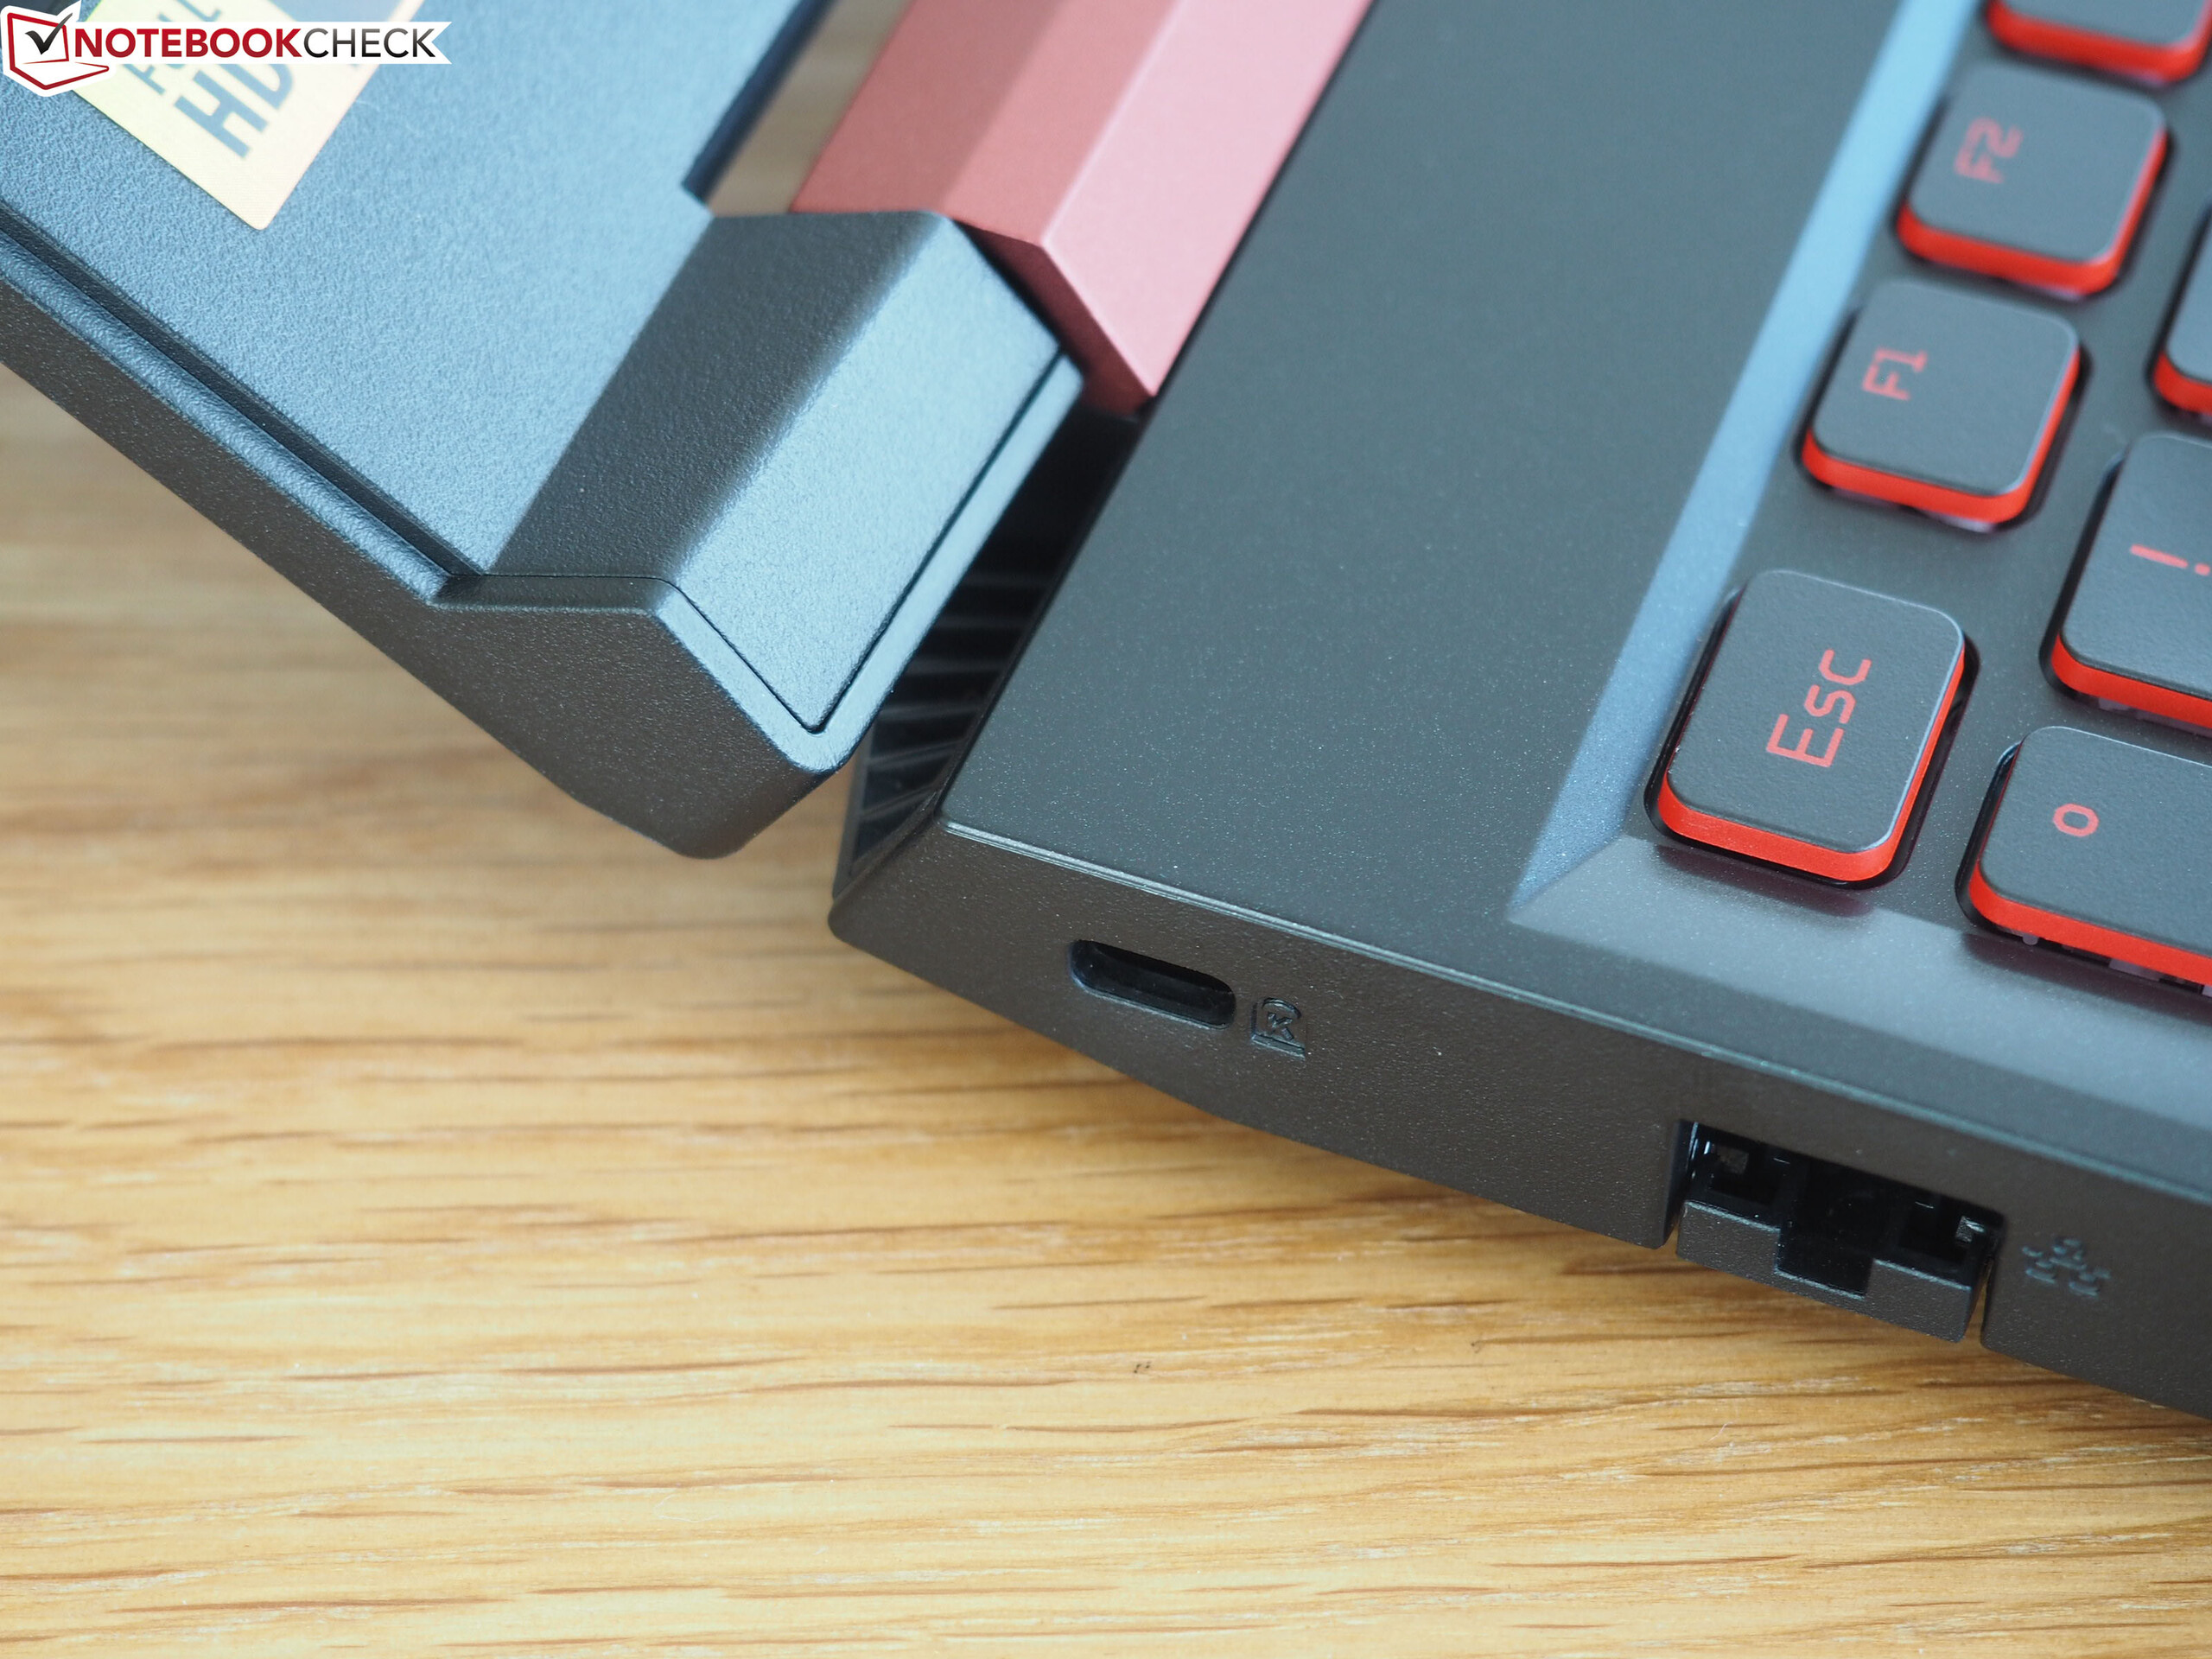
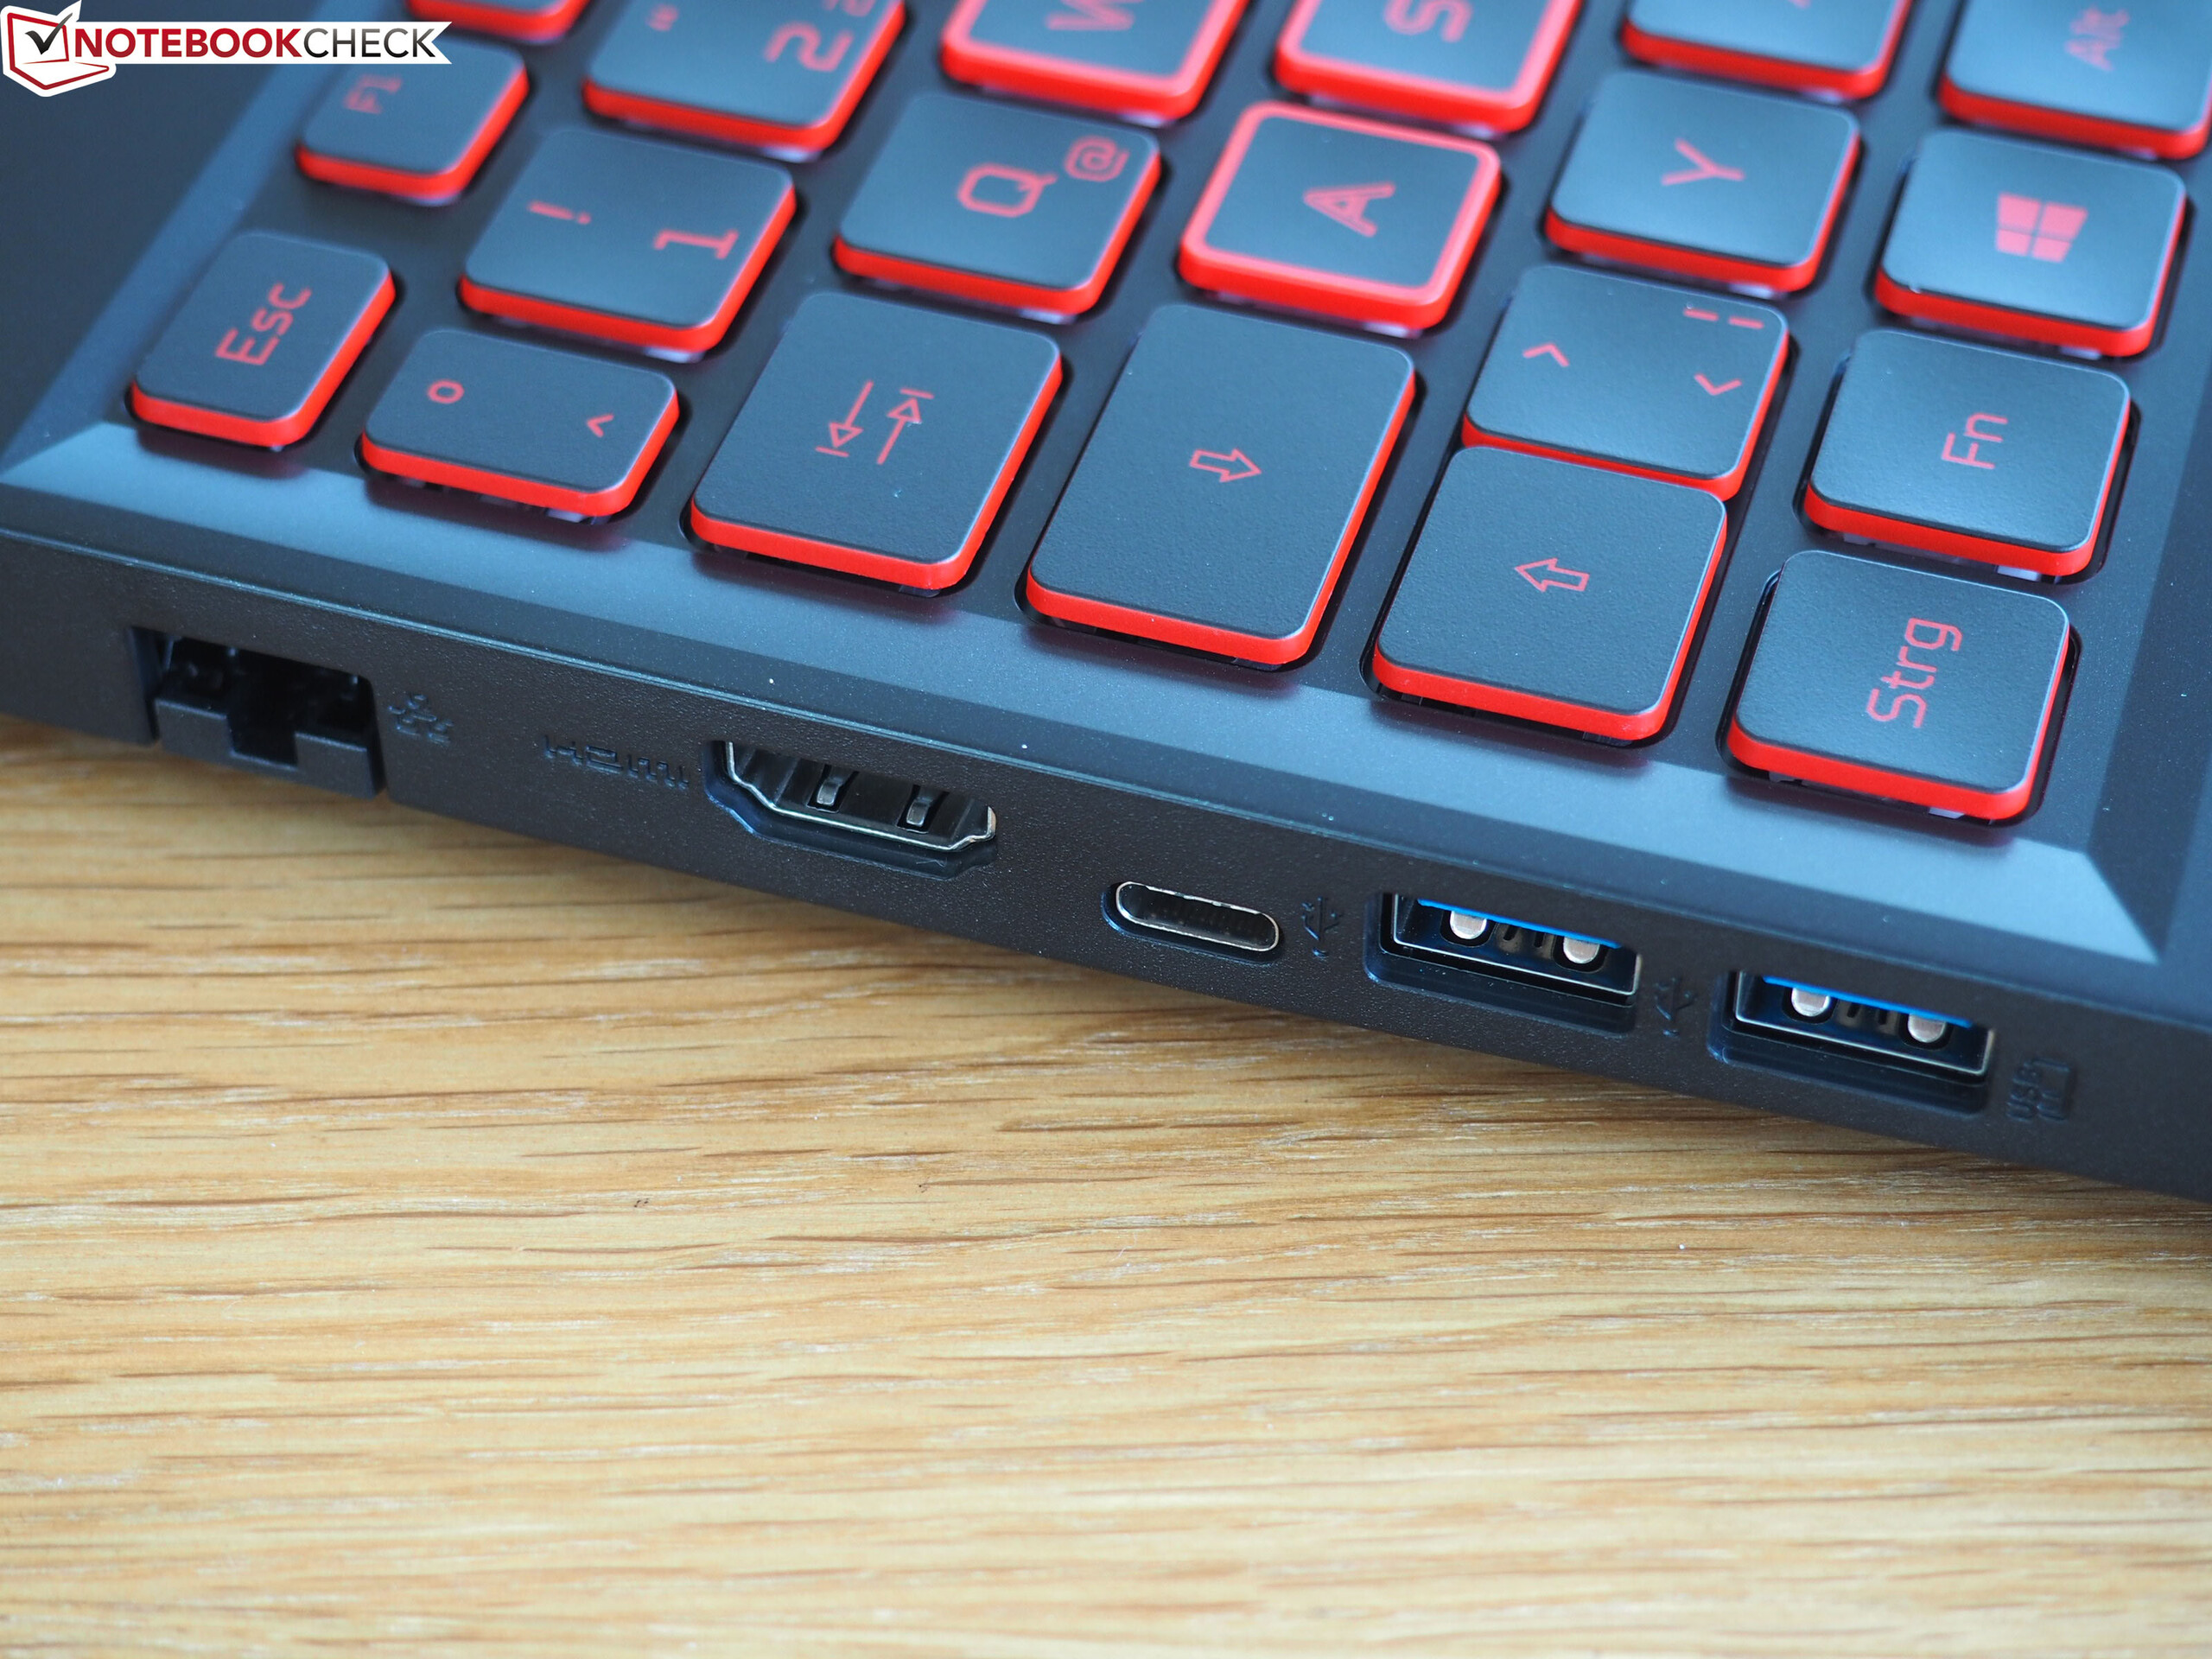
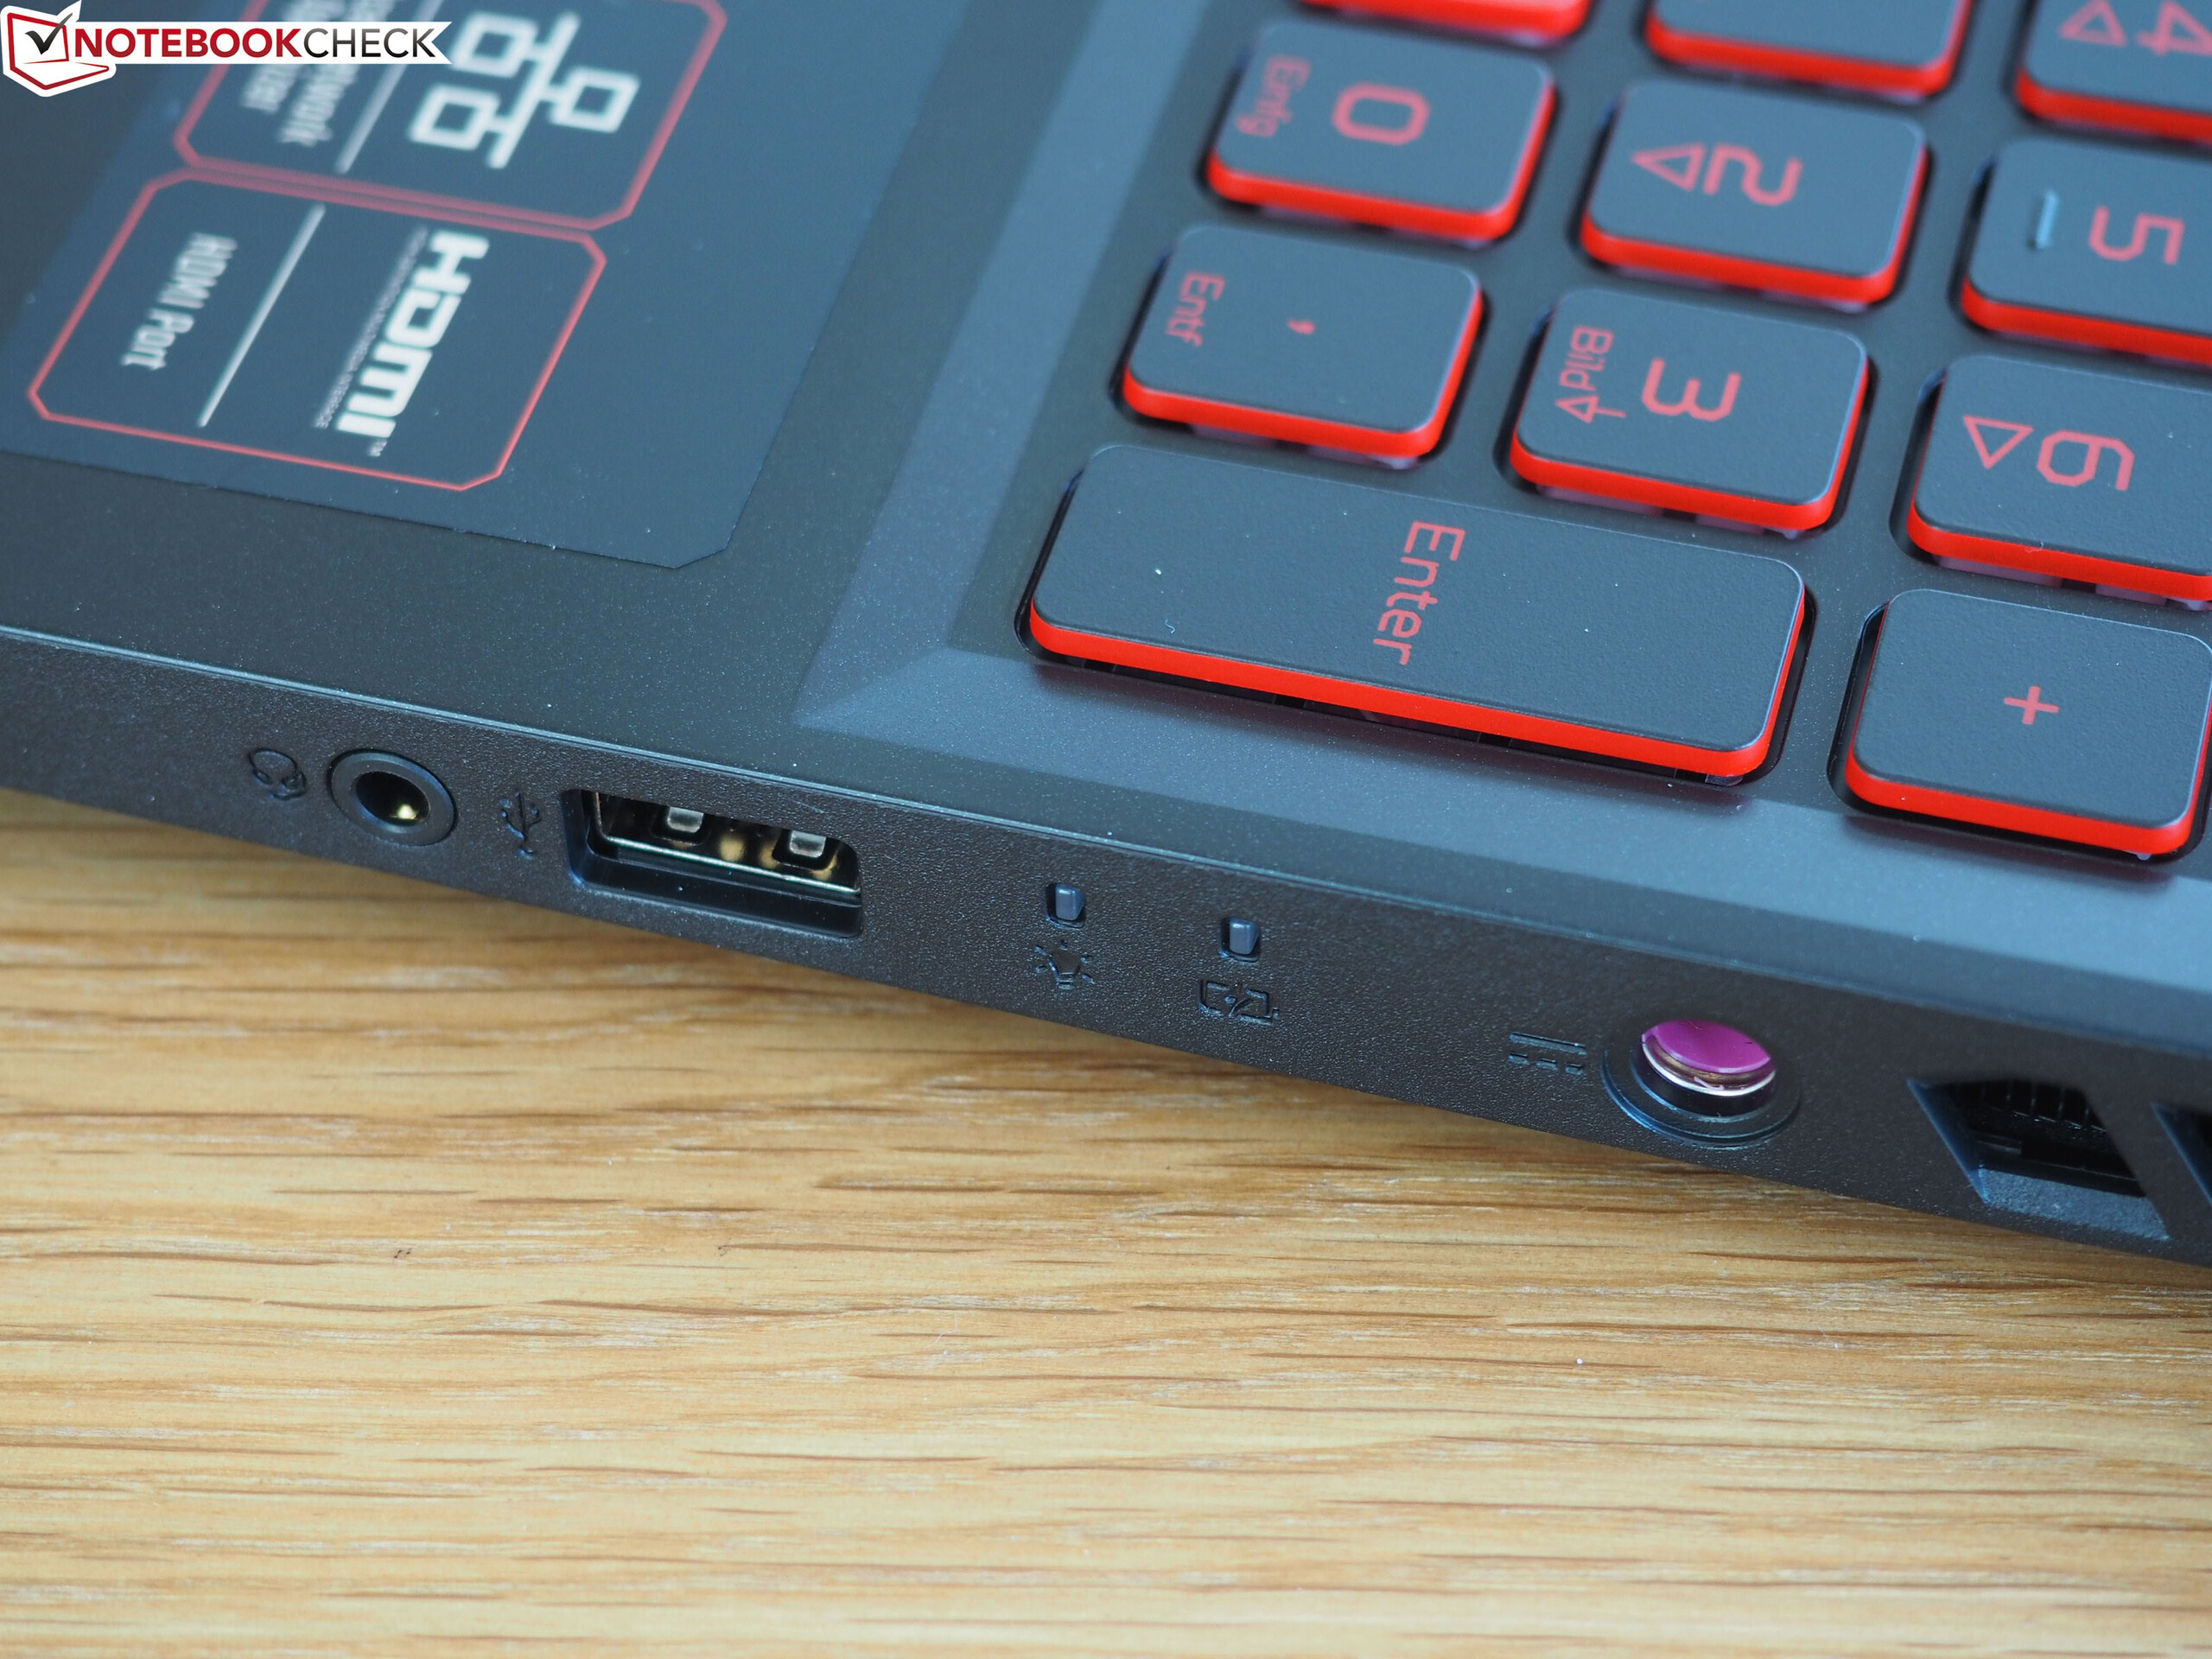
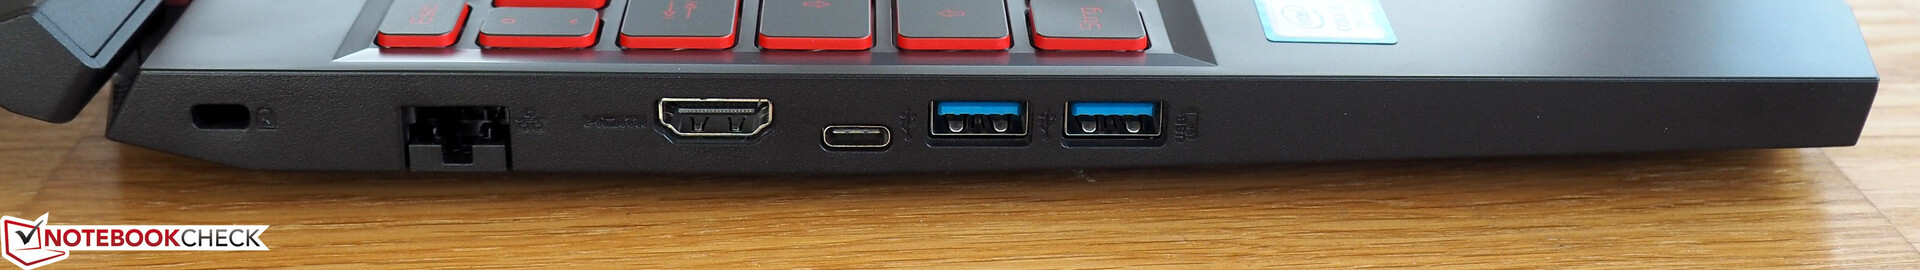
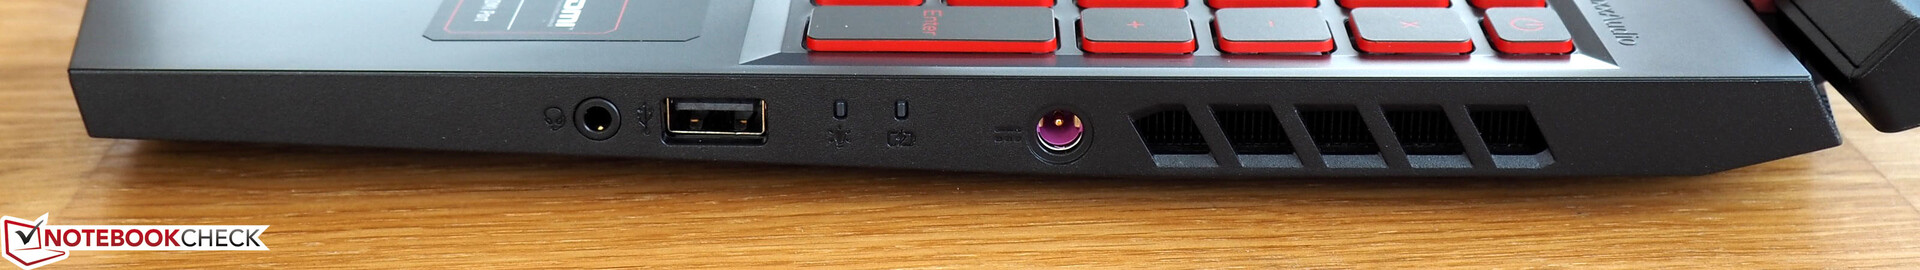
更紧凑的设计和输入设备的质量也是不错的。然而,宏碁需要为Nitro 5改进大量的东西才能获得更高的整体评价。首先,扬声器比较一般,屏幕也算不上出色。而且,接口的选择相当少且过时; 我们原本预计2019年款至少会看到一个Thunderbolt 3端口和一个读卡器。
但是,不要让这些弱点让你失望。 宏碁Nitro 5 AN515-54-53Z2是一款出色的游戏笔记本电脑。同价位您将很难找到更强大,更平衡的笔记本。
Acer Aspire Nitro 5 AN515-54-53Z2
- 05/11/2019 v6 (old)
Florian Glaser
Price comparison