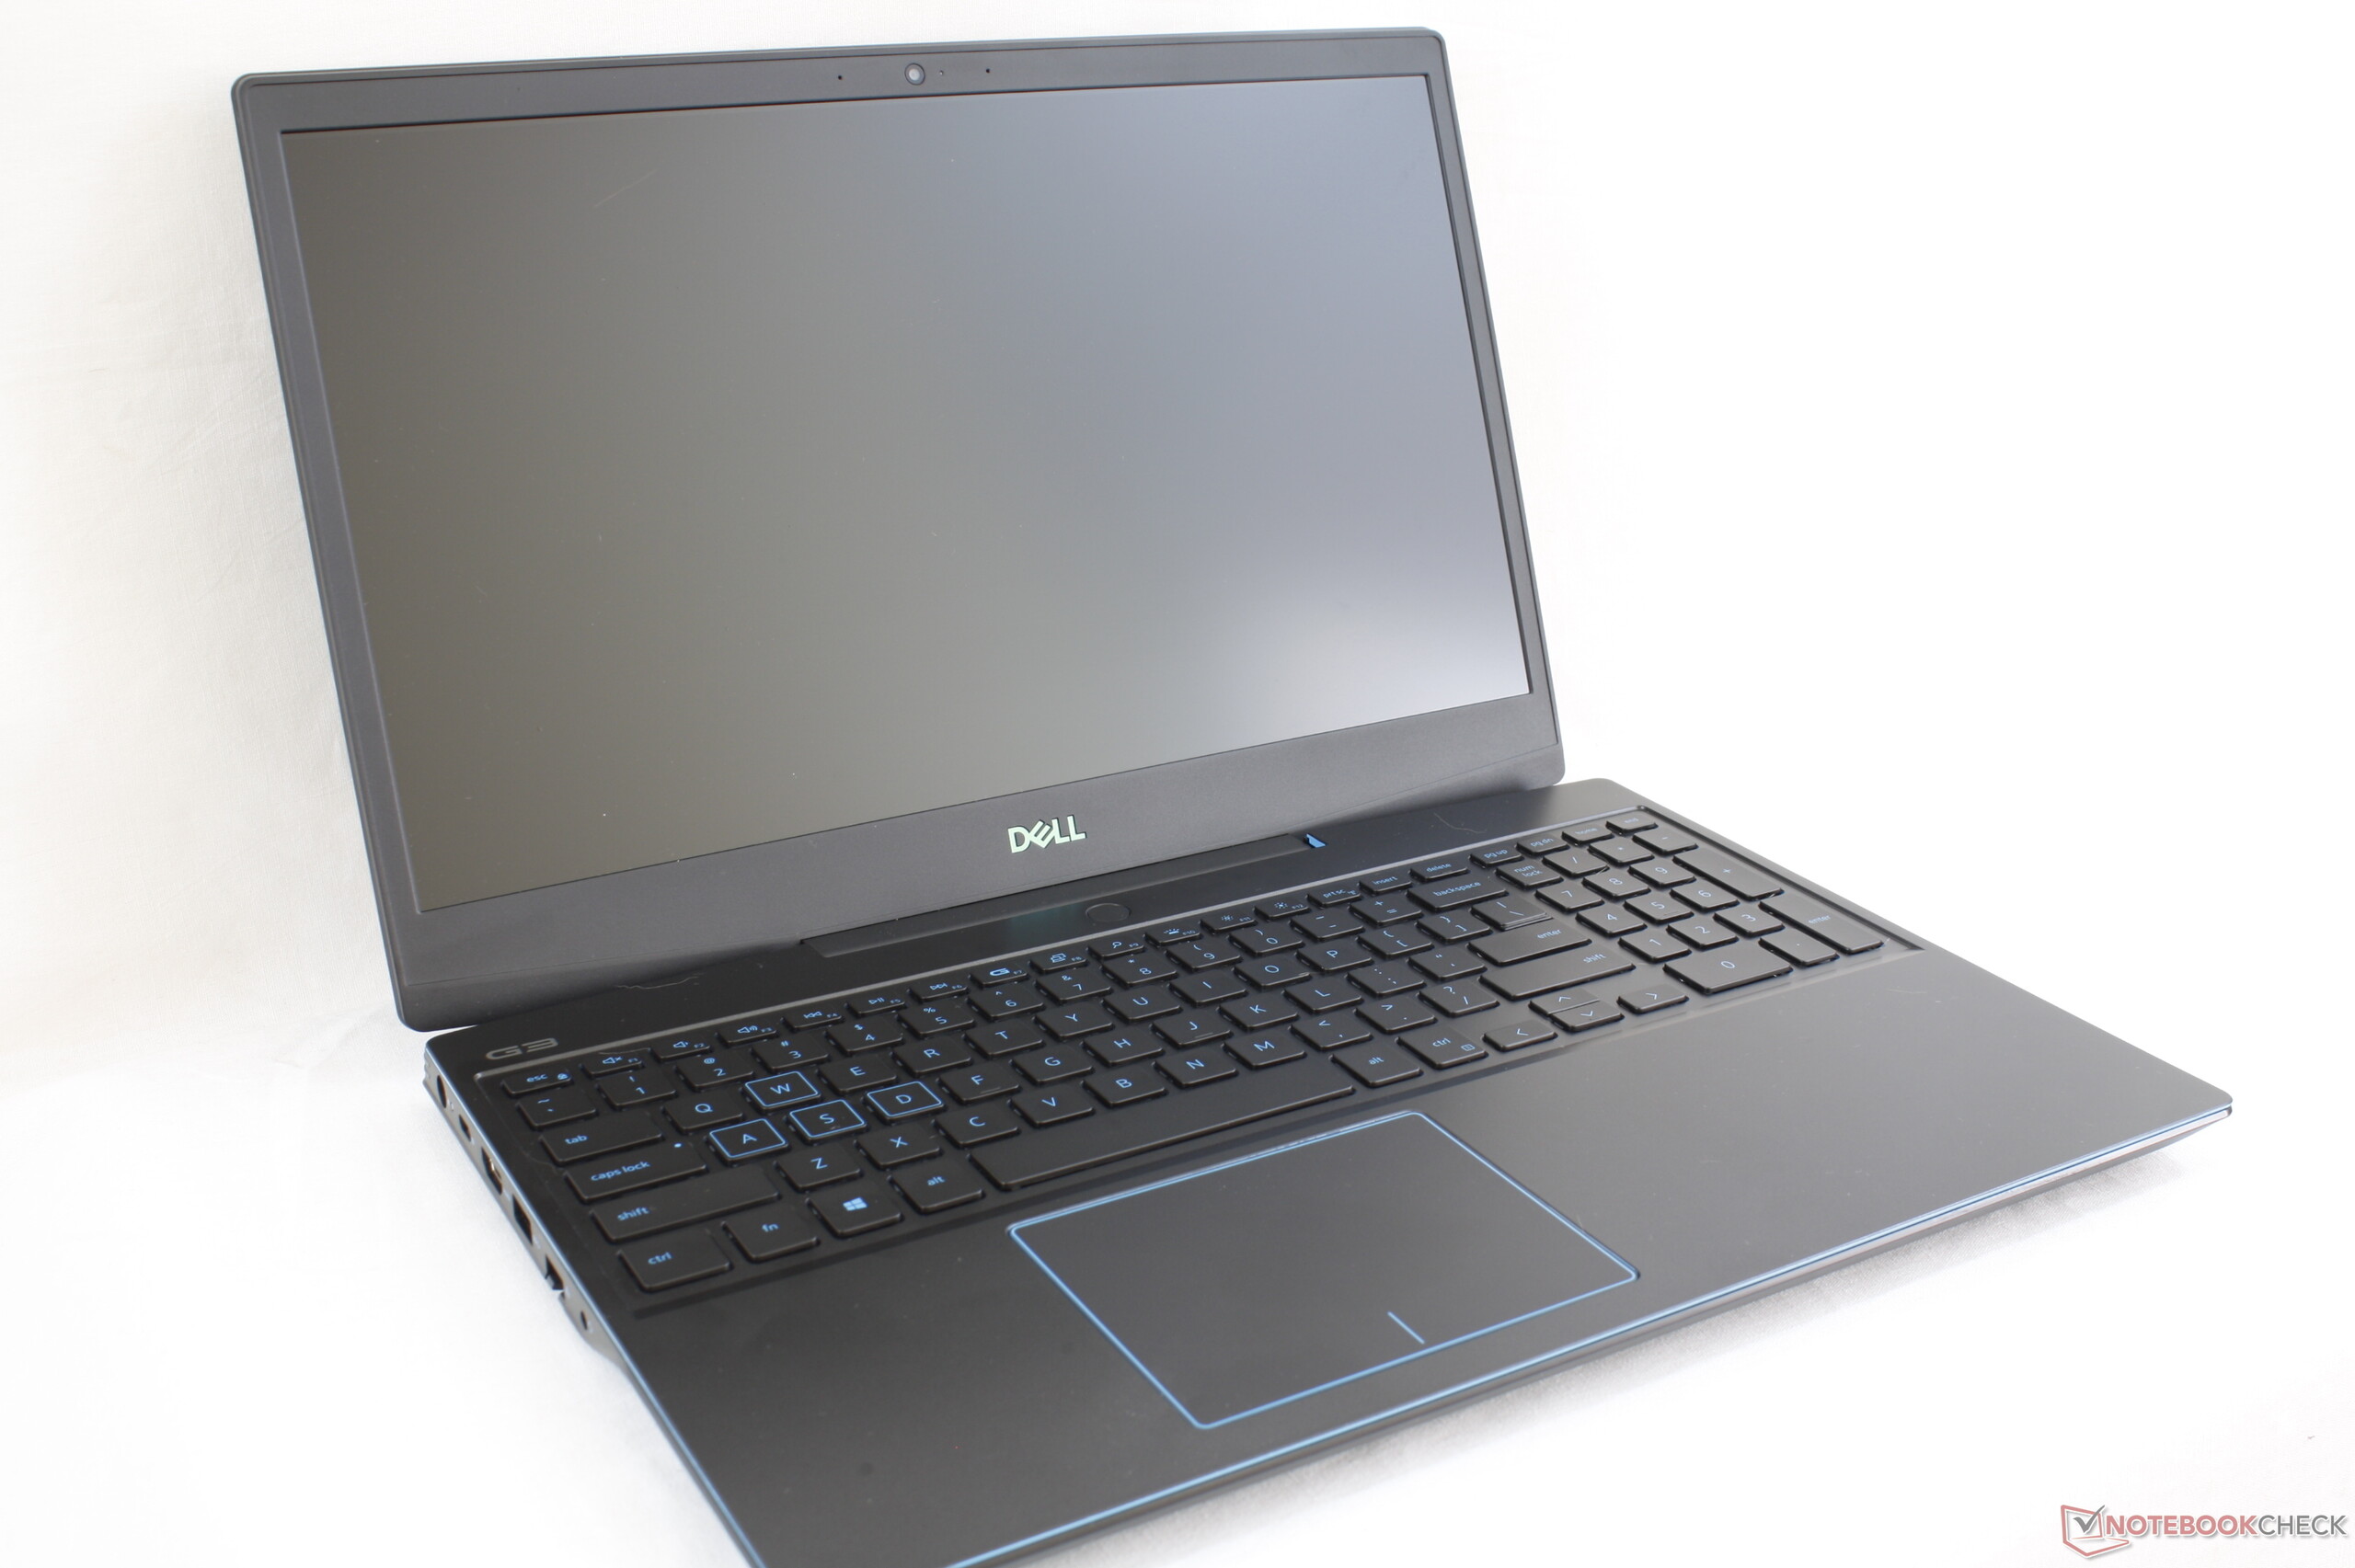
戴尔Dell G3 15 3590笔记本电脑评测:廉价且易升级
Rating | Date | Model | Weight | Height | Size | Resolution | Price |
|---|---|---|---|---|---|---|---|
| 79.3 % v7 (old) | 12 / 2019 | Dell G3 3590 i5-9300H, GeForce GTX 1650 Mobile | 2.5 kg | 21.6 mm | 15.60" | 1920x1080 | |
| 85.5 % v6 (old) | 08 / 2019 | Aorus 15-SA i7-9750H, GeForce GTX 1660 Ti Mobile | 2.1 kg | 24.4 mm | 15.60" | 1920x1080 | |
| 83.9 % v7 (old) | 10 / 2019 | HP Gaming Pavilion 15-dk0009ng i7-9750H, GeForce GTX 1660 Ti Max-Q | 2.4 kg | 23.4 mm | 15.60" | 1920x1080 | |
| 83.3 % v6 (old) | 07 / 2019 | Asus ROG Zephyrus G15 GA502DU R7 3750H, GeForce GTX 1660 Ti Max-Q | 2.1 kg | 20.4 mm | 15.60" | 1920x1080 |
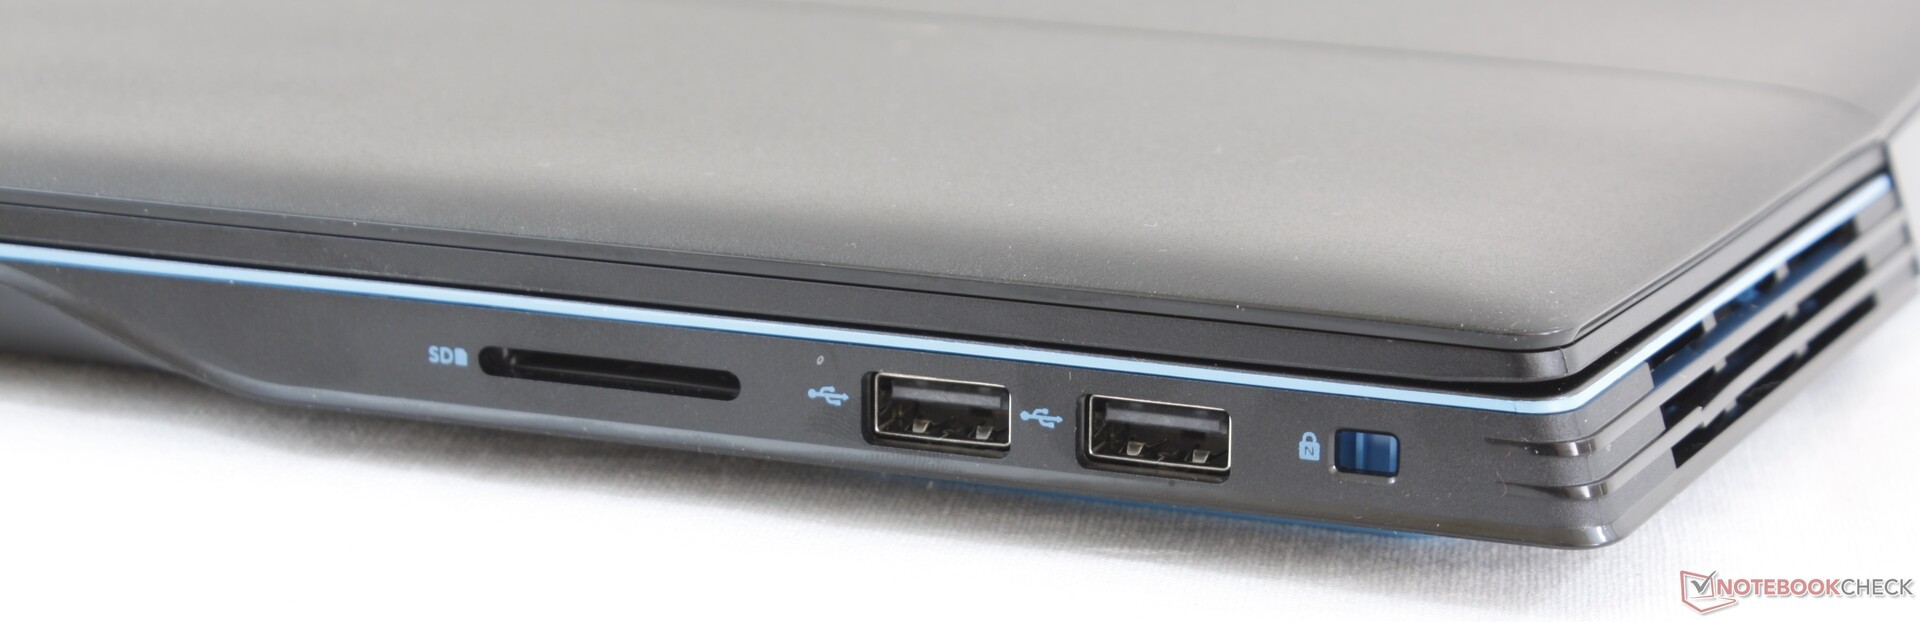
| SD Card Reader | |
| average JPG Copy Test (av. of 3 runs) | |
| HP Gaming Pavilion 15-dk0009ng (Toshiba Exceria Pro SDXC 64 GB UHS-II) | |
| Dell G3 15 3579 (Toshiba Exceria Pro SDXC 64 GB UHS-II) | |
| Dell G3 3590 (Toshiba Exceria Pro SDXC 64 GB UHS-II) | |
| maximum AS SSD Seq Read Test (1GB) | |
| HP Gaming Pavilion 15-dk0009ng (Toshiba Exceria Pro SDXC 64 GB UHS-II) | |
| Dell G3 3590 (Toshiba Exceria Pro SDXC 64 GB UHS-II) | |
| Dell G3 15 3579 (Toshiba Exceria Pro SDXC 64 GB UHS-II) | |
| Networking | |
| iperf3 transmit AX12 | |
| Aorus 15-SA | |
| Lenovo Legion Y540-15IRH-81SX00B2GE | |
| Alienware m15 R2 P87F | |
| Dell G3 15 3579 | |
| Dell G3 3590 | |
| iperf3 receive AX12 | |
| Aorus 15-SA | |
| Alienware m15 R2 P87F | |
| Lenovo Legion Y540-15IRH-81SX00B2GE | |
| Dell G3 3590 | |
| Dell G3 15 3579 | |
| |||||||||||||||||||||||||
Brightness Distribution: 86 %
Center on Battery: 172 cd/m²
Contrast: 1151:1 (Black: 0.24 cd/m²)
ΔE ColorChecker Calman: 5.56 | ∀{0.5-29.43 Ø4.73}
calibrated: 5.23
ΔE Greyscale Calman: 2.8 | ∀{0.09-98 Ø4.97}
59% sRGB (Argyll 1.6.3 3D)
37.8% AdobeRGB 1998 (Argyll 1.6.3 3D)
41.47% AdobeRGB 1998 (Argyll 3D)
59.8% sRGB (Argyll 3D)
40.13% Display P3 (Argyll 3D)
Gamma: 2.37
CCT: 6710 K
| Dell G3 3590 BOE NV15N3D, IPS, 15.6", 1920x1080 | Dell G3 15 3579 LG Philips LP156WF6, IPS, 15.6", 1920x1080 | Lenovo Legion Y540-15IRH-81SX00B2GE BOE 084D, IPS, 15.6", 1920x1080 | Aorus 15-SA LG Philips LP156WFG-SPB2 (LGD05E8), IPS, 15.6", 1920x1080 | Alienware m15 R2 P87F Sharp LQ156M1, IPS, 15.6", 1920x1080 | HP Gaming Pavilion 15-dk0009ng LG Philips LGD05FE, IPS, 15.6", 1920x1080 | |
|---|---|---|---|---|---|---|
| Display | -4% | 56% | 58% | 60% | 59% | |
| Display P3 Coverage (%) | 40.13 | 38.48 -4% | 63.6 58% | 64.3 60% | 65.3 63% | 64.2 60% |
| sRGB Coverage (%) | 59.8 | 57.9 -3% | 91.7 53% | 93.6 57% | 95.1 59% | 95.1 59% |
| AdobeRGB 1998 Coverage (%) | 41.47 | 39.75 -4% | 65.2 57% | 65.6 58% | 65.9 59% | 65.8 59% |
| Response Times | 29% | 72% | 63% | 69% | 66% | |
| Response Time Grey 50% / Grey 80% * (ms) | 46 ? | 32.4 ? 30% | 8.8 ? 81% | 15.6 ? 66% | 16.4 ? 64% | 16.4 ? 64% |
| Response Time Black / White * (ms) | 32.4 ? | 23.2 ? 28% | 12 ? 63% | 12.8 ? 60% | 8.8 ? 73% | 10.4 ? 68% |
| PWM Frequency (Hz) | 200 ? | 23810 ? | ||||
| Screen | -11% | 20% | 21% | 2% | 33% | |
| Brightness middle (cd/m²) | 276.2 | 208.2 -25% | 299 8% | 266 -4% | 324.2 17% | 345 25% |
| Brightness (cd/m²) | 261 | 203 -22% | 290 11% | 254 -3% | 304 16% | 324 24% |
| Brightness Distribution (%) | 86 | 81 -6% | 89 3% | 90 5% | 90 5% | 86 0% |
| Black Level * (cd/m²) | 0.24 | 0.34 -42% | 0.29 -21% | 0.28 -17% | 0.38 -58% | 0.42 -75% |
| Contrast (:1) | 1151 | 612 -47% | 1031 -10% | 950 -17% | 853 -26% | 821 -29% |
| Colorchecker dE 2000 * | 5.56 | 4.65 16% | 3.7 33% | 3.11 44% | 5.01 10% | 1.3 77% |
| Colorchecker dE 2000 max. * | 23.45 | 15.99 32% | 7 70% | 5.84 75% | 12.7 46% | 2.8 88% |
| Colorchecker dE 2000 calibrated * | 5.23 | 3.84 27% | 2 62% | 1.37 74% | 1.64 69% | 1.1 79% |
| Greyscale dE 2000 * | 2.8 | 4.1 -46% | 4.1 -46% | 3.94 -41% | 7.9 -182% | 1.2 57% |
| Gamma | 2.37 93% | 2.3 96% | 2.19 100% | 2.53 87% | 2.35 94% | 2.31 95% |
| CCT | 6710 97% | 7352 88% | 7166 91% | 6210 105% | 8455 77% | 6476 100% |
| Color Space (Percent of AdobeRGB 1998) (%) | 37.8 | 36.7 -3% | 59.3 57% | 60 59% | 60.8 61% | 60.5 60% |
| Color Space (Percent of sRGB) (%) | 59 | 57.9 -2% | 91.5 55% | 93 58% | 95.5 62% | 94.9 61% |
| Total Average (Program / Settings) | 5% /
-4% | 49% /
33% | 47% /
33% | 44% /
21% | 53% /
42% |
* ... smaller is better
Display Response Times
| ↔ Response Time Black to White | ||
|---|---|---|
| 32.4 ms ... rise ↗ and fall ↘ combined | ↗ 18.4 ms rise | 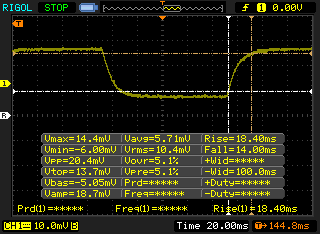 |
| ↘ 14 ms fall | ||
| The screen shows slow response rates in our tests and will be unsatisfactory for gamers. In comparison, all tested devices range from 0.1 (minimum) to 240 (maximum) ms. » 88 % of all devices are better. This means that the measured response time is worse than the average of all tested devices (19.9 ms). | ||
| ↔ Response Time 50% Grey to 80% Grey | ||
| 46 ms ... rise ↗ and fall ↘ combined | ↗ 22 ms rise | 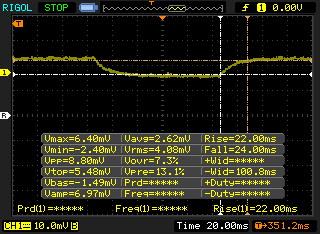 |
| ↘ 24 ms fall | ||
| The screen shows slow response rates in our tests and will be unsatisfactory for gamers. In comparison, all tested devices range from 0.165 (minimum) to 636 (maximum) ms. » 79 % of all devices are better. This means that the measured response time is worse than the average of all tested devices (31.1 ms). | ||
Screen Flickering / PWM (Pulse-Width Modulation)
| Screen flickering / PWM detected | 200 Hz | ≤ 98 % brightness setting | 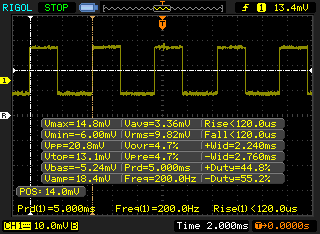 |
The display backlight flickers at 200 Hz (worst case, e.g., utilizing PWM) Flickering detected at a brightness setting of 98 % and below. There should be no flickering or PWM above this brightness setting. The frequency of 200 Hz is relatively low, so sensitive users will likely notice flickering and experience eyestrain at the stated brightness setting and below. In comparison: 52 % of all tested devices do not use PWM to dim the display. If PWM was detected, an average of 7791 (minimum: 5 - maximum: 343500) Hz was measured. | |||
| Cinebench R15 | |
| CPU Single 64Bit | |
| Alienware Area-51m i9-9900K RTX 2080 | |
| Alienware m17 P37E | |
| Alienware m15 R2 P87F | |
| Average Intel Core i5-9300H (169 - 176, n=11) | |
| Dell G3 3590 | |
| Dell G3 15 3579 | |
| Dell G7 17 7790 | |
| Dell Inspiron 15 7000 7577 4K | |
| Asus ROG Zephyrus G15 GA502DU | |
| Alienware 13 R3 (i5-7300HQ, GTX 1050 Ti) | |
| CPU Multi 64Bit | |
| Alienware Area-51m i9-9900K RTX 2080 | |
| Alienware m17 P37E | |
| Dell G7 17 7790 | |
| Alienware m15 R2 P87F | |
| Dell G3 15 3579 | |
| Asus ROG Zephyrus G15 GA502DU | |
| Dell G3 3590 | |
| Average Intel Core i5-9300H (717 - 850, n=11) | |
| Dell Inspiron 15 7000 7577 4K | |
| Alienware 13 R3 (i5-7300HQ, GTX 1050 Ti) | |
| Cinebench R11.5 | |
| CPU Single 64Bit | |
| Dell Inspiron 15 7000 7577 4K | |
| Asus ROG Zephyrus G15 GA502DU | |
| CPU Multi 64Bit | |
| Asus ROG Zephyrus G15 GA502DU | |
| Dell Inspiron 15 7000 7577 4K | |
| Cinebench R10 | |
| Rendering Multiple CPUs 32Bit | |
| Average Intel Core i5-9300H (21798 - 25656, n=5) | |
| Dell Inspiron 15 7000 7577 4K | |
| Asus ROG Zephyrus G15 GA502DU | |
| Rendering Single 32Bit | |
| Average Intel Core i5-9300H (6421 - 6677, n=5) | |
| Dell Inspiron 15 7000 7577 4K | |
| Asus ROG Zephyrus G15 GA502DU | |
| wPrime 2.10 - 1024m | |
| Dell Inspiron 15 7000 7577 4K | |
| Asus ROG Zephyrus G15 GA502DU | |
* ... smaller is better
| PCMark 8 Home Score Accelerated v2 | 3792 points | |
| PCMark 8 Work Score Accelerated v2 | 5088 points | |
| PCMark 10 Score | 4798 points | |
Help | ||
| Dell G3 3590 Toshiba BG4 KBG40ZNS128G | Dell G7 17 7790 Toshiba BG3 KBG30ZMS256G | Aorus 15-SA Intel SSD 760p SSDPEKKW512G8 | Razer Blade 15 GTX 1660 Ti Samsung SSD PM981 MZVLB256HAHQ | Dell XPS 15 7590 i5 iGPU FHD Toshiba XG6 KXG60ZNV512G | Asus ROG Zephyrus G15 GA502DU Intel SSD 660p SSDPEKNW512G8 | |
|---|---|---|---|---|---|---|
| AS SSD | 26% | 361% | 387% | 466% | 226% | |
| Seq Read (MB/s) | 1174 | 1033 -12% | 2601 122% | 1829 56% | 2357 101% | 907 -23% |
| Seq Write (MB/s) | 186 | 218.3 17% | 1507 710% | 1315 607% | 1235 564% | 926 398% |
| 4K Read (MB/s) | 34.01 | 24.12 -29% | 56.3 66% | 51.3 51% | 43.29 27% | 47.26 39% |
| 4K Write (MB/s) | 69.4 | 55 -21% | 110.3 59% | 106 53% | 99.7 44% | 98.7 42% |
| 4K-64 Read (MB/s) | 424 | 330.3 -22% | 877 107% | 917 116% | 1020 141% | 321.5 -24% |
| 4K-64 Write (MB/s) | 68.8 | 155.8 126% | 914 1228% | 1212 1662% | 1502 2083% | 736 970% |
| Access Time Read * (ms) | 0.168 | 0.18 -7% | 0.05 70% | 0.063 62% | 0.07 58% | 0.064 62% |
| Access Time Write * (ms) | 0.94 | 0.314 67% | 0.034 96% | 0.104 89% | 0.039 96% | 0.045 95% |
| Score Read (Points) | 575 | 458 -20% | 1193 107% | 1152 100% | 1299 126% | 459 -20% |
| Score Write (Points) | 157 | 233 48% | 1175 648% | 1450 824% | 1726 999% | 927 490% |
| Score Total (Points) | 987 | 891 -10% | 2938 198% | 3177 222% | 3640 269% | 1641 66% |
| Copy ISO MB/s (MB/s) | 215.7 | 382.9 78% | 2104 875% | 1539 613% | 2145 894% | 905 320% |
| Copy Program MB/s (MB/s) | 108.2 | 234.9 117% | 387.7 258% | 513 374% | 565 422% | 496.9 359% |
| Copy Game MB/s (MB/s) | 165.9 | 218.7 32% | 1021 515% | 1150 593% | 1320 696% | 819 394% |
* ... smaller is better

| 3DMark 11 | |
| 1280x720 Performance GPU | |
| Alienware Area-51m i9-9900K RTX 2080 | |
| Alienware m15 P79F | |
| Alienware 17 R5 | |
| Dell G5 15 5590 | |
| Razer Blade 15 GTX 1660 Ti | |
| HP Gaming Pavilion 15-dk0009ng | |
| Alienware 13 R3 | |
| Gainward GeForce GTX 1650 4 GB | |
| Dell G3 3590 | |
| Average NVIDIA GeForce GTX 1650 Mobile (10885 - 13575, n=30) | |
| MSI GT72S-6QEG16SR421BW | |
| Asus TUF FX705GE-EW096T | |
| Dell Inspiron 15 7000 7577 | |
| 1280x720 Performance Combined | |
| Alienware Area-51m i9-9900K RTX 2080 | |
| HP Gaming Pavilion 15-dk0009ng | |
| Gainward GeForce GTX 1650 4 GB | |
| Alienware m15 P79F | |
| Razer Blade 15 GTX 1660 Ti | |
| Alienware 17 R5 | |
| Dell G5 15 5590 | |
| MSI GT72S-6QEG16SR421BW | |
| Average NVIDIA GeForce GTX 1650 Mobile (5870 - 12662, n=28) | |
| Dell G3 3590 | |
| Alienware 13 R3 | |
| Asus TUF FX705GE-EW096T | |
| Dell Inspiron 15 7000 7577 | |
| 3DMark 11 Performance | 11845 points | |
| 3DMark Cloud Gate Standard Score | 24291 points | |
| 3DMark Fire Strike Score | 8081 points | |
| 3DMark Time Spy Score | 3608 points | |
Help | ||
| Shadow of the Tomb Raider - 1920x1080 High Preset AA:SM | |
| Alienware Area-51m i9-9900K RTX 2080 | |
| Alienware m15 R2 P87F | |
| Alienware m15 P79F | |
| Razer Blade 15 GTX 1660 Ti | |
| HP Pavilion Gaming 17-cd0085cl | |
| Asus TUF FX705GM | |
| Asus ROG Zephyrus G15 GA502DU | |
| MSI GF75 Thin 9SC | |
| Dell G3 3590 | |
| Gainward GeForce GTX 1650 4 GB | |
| Average NVIDIA GeForce GTX 1650 Mobile (38 - 53, n=15) | |
| Asus TUF FX705GE-EW096T | |
| Asus GL753VD | |
| low | med. | high | ultra | |
|---|---|---|---|---|
| BioShock Infinite (2013) | 259.9 | 221.8 | 193.6 | 85.6 |
| The Witcher 3 (2015) | 175.1 | 115.8 | 65.9 | 36.2 |
| Rocket League (2017) | 247 | 188.7 | 137.2 | |
| Shadow of the Tomb Raider (2018) | 102 | 61 | 51 |
| Dell G3 3590 GeForce GTX 1650 Mobile, i5-9300H, Toshiba BG4 KBG40ZNS128G | Dell G3 15 3579 GeForce GTX 1050 Mobile, i5-8300H, Seagate Mobile HDD 1TB ST1000LX015-1U7172 | Lenovo Legion Y540-15IRH-81SX00B2GE GeForce GTX 1660 Ti Mobile, i7-9750H, WDC PC SN720 SDAPNTW-512G | Aorus 15-SA GeForce GTX 1660 Ti Mobile, i7-9750H, Intel SSD 760p SSDPEKKW512G8 | Alienware m15 R2 P87F GeForce RTX 2080 Max-Q, i7-9750H, 2x Toshiba XG6 KXG60ZNV512G (RAID 0) | HP Gaming Pavilion 15-dk0009ng GeForce GTX 1660 Ti Max-Q, i7-9750H, Samsung SSD PM981 MZVLB256HAHQ | |
|---|---|---|---|---|---|---|
| Noise | 0% | 3% | -18% | -14% | 9% | |
| off / environment * (dB) | 28.4 | 28 1% | 29.3 -3% | 29 -2% | 28.3 -0% | 28.2 1% |
| Idle Minimum * (dB) | 29.2 | 29.8 -2% | 29.3 -0% | 32 -10% | 28.5 2% | 29.3 -0% |
| Idle Average * (dB) | 29.4 | 29.8 -1% | 29.3 -0% | 35 -19% | 28.5 3% | 29.3 -0% |
| Idle Maximum * (dB) | 29.4 | 30 -2% | 29.3 -0% | 41 -39% | 49 -67% | 29.3 -0% |
| Load Average * (dB) | 39 | 38.6 1% | 35.7 8% | 54 -38% | 49 -26% | 32.3 17% |
| Witcher 3 ultra * (dB) | 49.5 | 46.9 5% | 44.2 11% | 52 -5% | 49 1% | 34 31% |
| Load Maximum * (dB) | 49.7 | 49.4 1% | 45.6 8% | 56 -13% | 55 -11% | 41.2 17% |
* ... smaller is better
Noise level
| Idle |
| 29.2 / 29.4 / 29.4 dB(A) |
| Load |
| 39 / 49.7 dB(A) |
 | ||
30 dB silent 40 dB(A) audible 50 dB(A) loud |
||
min: | ||
(-) The maximum temperature on the upper side is 49 °C / 120 F, compared to the average of 40.4 °C / 105 F, ranging from 21.2 to 68.8 °C for the class Gaming.
(-) The bottom heats up to a maximum of 49.8 °C / 122 F, compared to the average of 43.2 °C / 110 F
(+) In idle usage, the average temperature for the upper side is 28.8 °C / 84 F, compared to the device average of 33.9 °C / 93 F.
(±) Playing The Witcher 3, the average temperature for the upper side is 37.3 °C / 99 F, compared to the device average of 33.9 °C / 93 F.
(+) The palmrests and touchpad are cooler than skin temperature with a maximum of 31.2 °C / 88.2 F and are therefore cool to the touch.
(-) The average temperature of the palmrest area of similar devices was 28.8 °C / 83.8 F (-2.4 °C / -4.4 F).
Dell G3 3590 audio analysis
(+) | speakers can play relatively loud (84.1 dB)
Bass 100 - 315 Hz
(-) | nearly no bass - on average 16.9% lower than median
(±) | linearity of bass is average (10.9% delta to prev. frequency)
Mids 400 - 2000 Hz
(±) | higher mids - on average 6.5% higher than median
(+) | mids are linear (5.9% delta to prev. frequency)
Highs 2 - 16 kHz
(+) | balanced highs - only 3.5% away from median
(±) | linearity of highs is average (9.4% delta to prev. frequency)
Overall 100 - 16.000 Hz
(±) | linearity of overall sound is average (22.8% difference to median)
Compared to same class
» 82% of all tested devices in this class were better, 5% similar, 13% worse
» The best had a delta of 6%, average was 18%, worst was 132%
Compared to all devices tested
» 67% of all tested devices were better, 6% similar, 27% worse
» The best had a delta of 4%, average was 24%, worst was 134%
Apple MacBook 12 (Early 2016) 1.1 GHz audio analysis
(+) | speakers can play relatively loud (83.6 dB)
Bass 100 - 315 Hz
(±) | reduced bass - on average 11.3% lower than median
(±) | linearity of bass is average (14.2% delta to prev. frequency)
Mids 400 - 2000 Hz
(+) | balanced mids - only 2.4% away from median
(+) | mids are linear (5.5% delta to prev. frequency)
Highs 2 - 16 kHz
(+) | balanced highs - only 2% away from median
(+) | highs are linear (4.5% delta to prev. frequency)
Overall 100 - 16.000 Hz
(+) | overall sound is linear (10.2% difference to median)
Compared to same class
» 7% of all tested devices in this class were better, 2% similar, 91% worse
» The best had a delta of 5%, average was 18%, worst was 53%
Compared to all devices tested
» 5% of all tested devices were better, 1% similar, 94% worse
» The best had a delta of 4%, average was 24%, worst was 134%
| Off / Standby | |
| Idle | |
| Load |
|
Key:
min: | |
| Dell G3 3590 i5-9300H, GeForce GTX 1650 Mobile, Toshiba BG4 KBG40ZNS128G, IPS, 1920x1080, 15.6" | Dell G3 15 3579 i5-8300H, GeForce GTX 1050 Mobile, Seagate Mobile HDD 1TB ST1000LX015-1U7172, IPS, 1920x1080, 15.6" | Aorus 15-SA i7-9750H, GeForce GTX 1660 Ti Mobile, Intel SSD 760p SSDPEKKW512G8, IPS, 1920x1080, 15.6" | Alienware m15 R2 P87F i7-9750H, GeForce RTX 2080 Max-Q, 2x Toshiba XG6 KXG60ZNV512G (RAID 0), IPS, 1920x1080, 15.6" | HP Gaming Pavilion 15-dk0009ng i7-9750H, GeForce GTX 1660 Ti Max-Q, Samsung SSD PM981 MZVLB256HAHQ, IPS, 1920x1080, 15.6" | MSI GS65 Stealth Thin 8RE-051US i7-8750H, GeForce GTX 1060 Mobile, Samsung SSD PM981 MZVLB256HAHQ, IPS, 1920x1080, 15.6" | |
|---|---|---|---|---|---|---|
| Power Consumption | 0% | -79% | -147% | -9% | -20% | |
| Idle Minimum * (Watt) | 6.2 | 7.9 -27% | 20 -223% | 19 -206% | 6.8 -10% | 8.7 -40% |
| Idle Average * (Watt) | 8.4 | 9.6 -14% | 23 -174% | 40.5 -382% | 10.7 -27% | 13 -55% |
| Idle Maximum * (Watt) | 27.7 | 13 53% | 29 -5% | 52 -88% | 12.5 55% | 14.3 48% |
| Load Average * (Watt) | 91 | 93 -2% | 87 4% | 132.3 -45% | 87.2 4% | 107.4 -18% |
| Witcher 3 ultra * (Watt) | 94.4 | 100.6 -7% | 136 -44% | 183.3 -94% | 121 -28% | 129 -37% |
| Load Maximum * (Watt) | 131.5 | 132.7 -1% | 173 -32% | 217.2 -65% | 191.4 -46% | 151.5 -15% |
* ... smaller is better
| Dell G3 3590 i5-9300H, GeForce GTX 1650 Mobile, 51 Wh | Dell G3 15 3579 i5-8300H, GeForce GTX 1050 Mobile, 56 Wh | Lenovo Legion Y540-15IRH-81SX00B2GE i7-9750H, GeForce GTX 1660 Ti Mobile, 57 Wh | Aorus 15-SA i7-9750H, GeForce GTX 1660 Ti Mobile, 62 Wh | Alienware m15 R2 P87F i7-9750H, GeForce RTX 2080 Max-Q, 76 Wh | HP Gaming Pavilion 15-dk0009ng i7-9750H, GeForce GTX 1660 Ti Max-Q, 52.5 Wh | |
|---|---|---|---|---|---|---|
| Battery runtime | 27% | -47% | -30% | -33% | -24% | |
| Reader / Idle (h) | 13.5 | 4 -70% | 3.5 -74% | 9.2 -32% | 8.7 -36% | |
| WiFi v1.3 (h) | 6.7 | 6.5 -3% | 2.4 -64% | 2.8 -58% | 5.5 -18% | 4.8 -28% |
| Load (h) | 1.4 | 2.2 57% | 1.3 -7% | 2 43% | 0.7 -50% | 1.3 -7% |
| Witcher 3 ultra (h) | 1 |
Pros
Cons

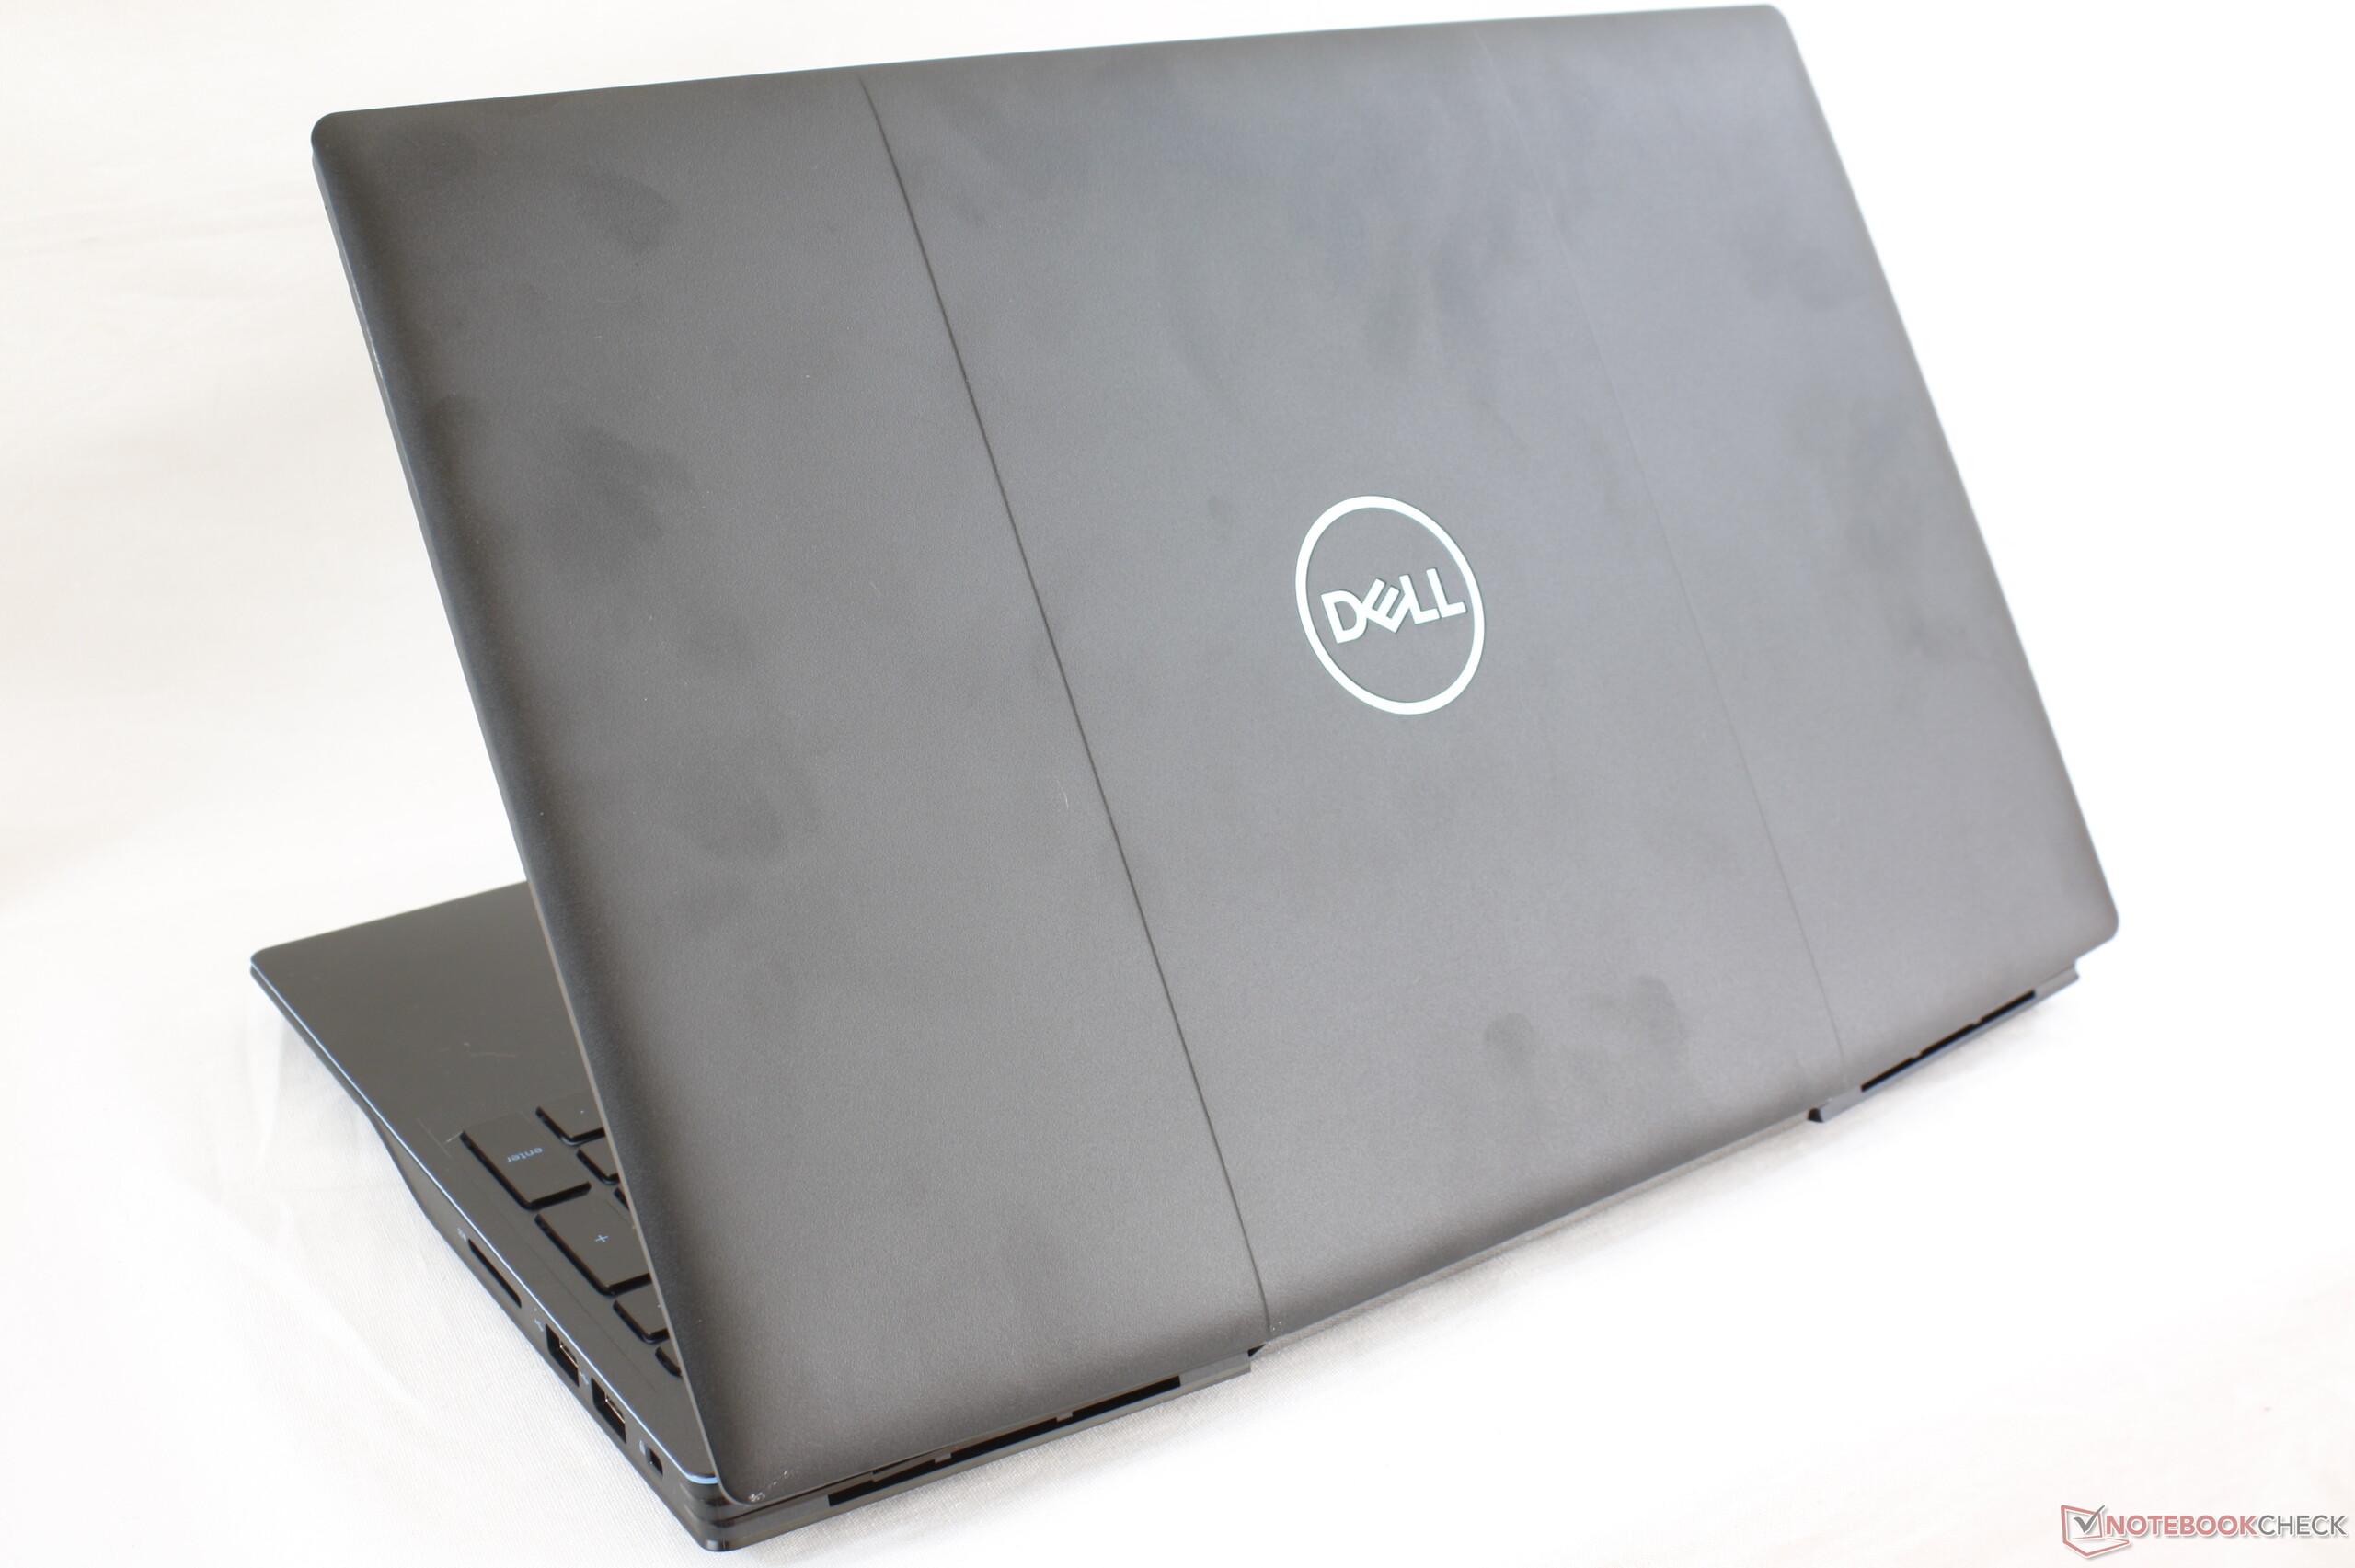
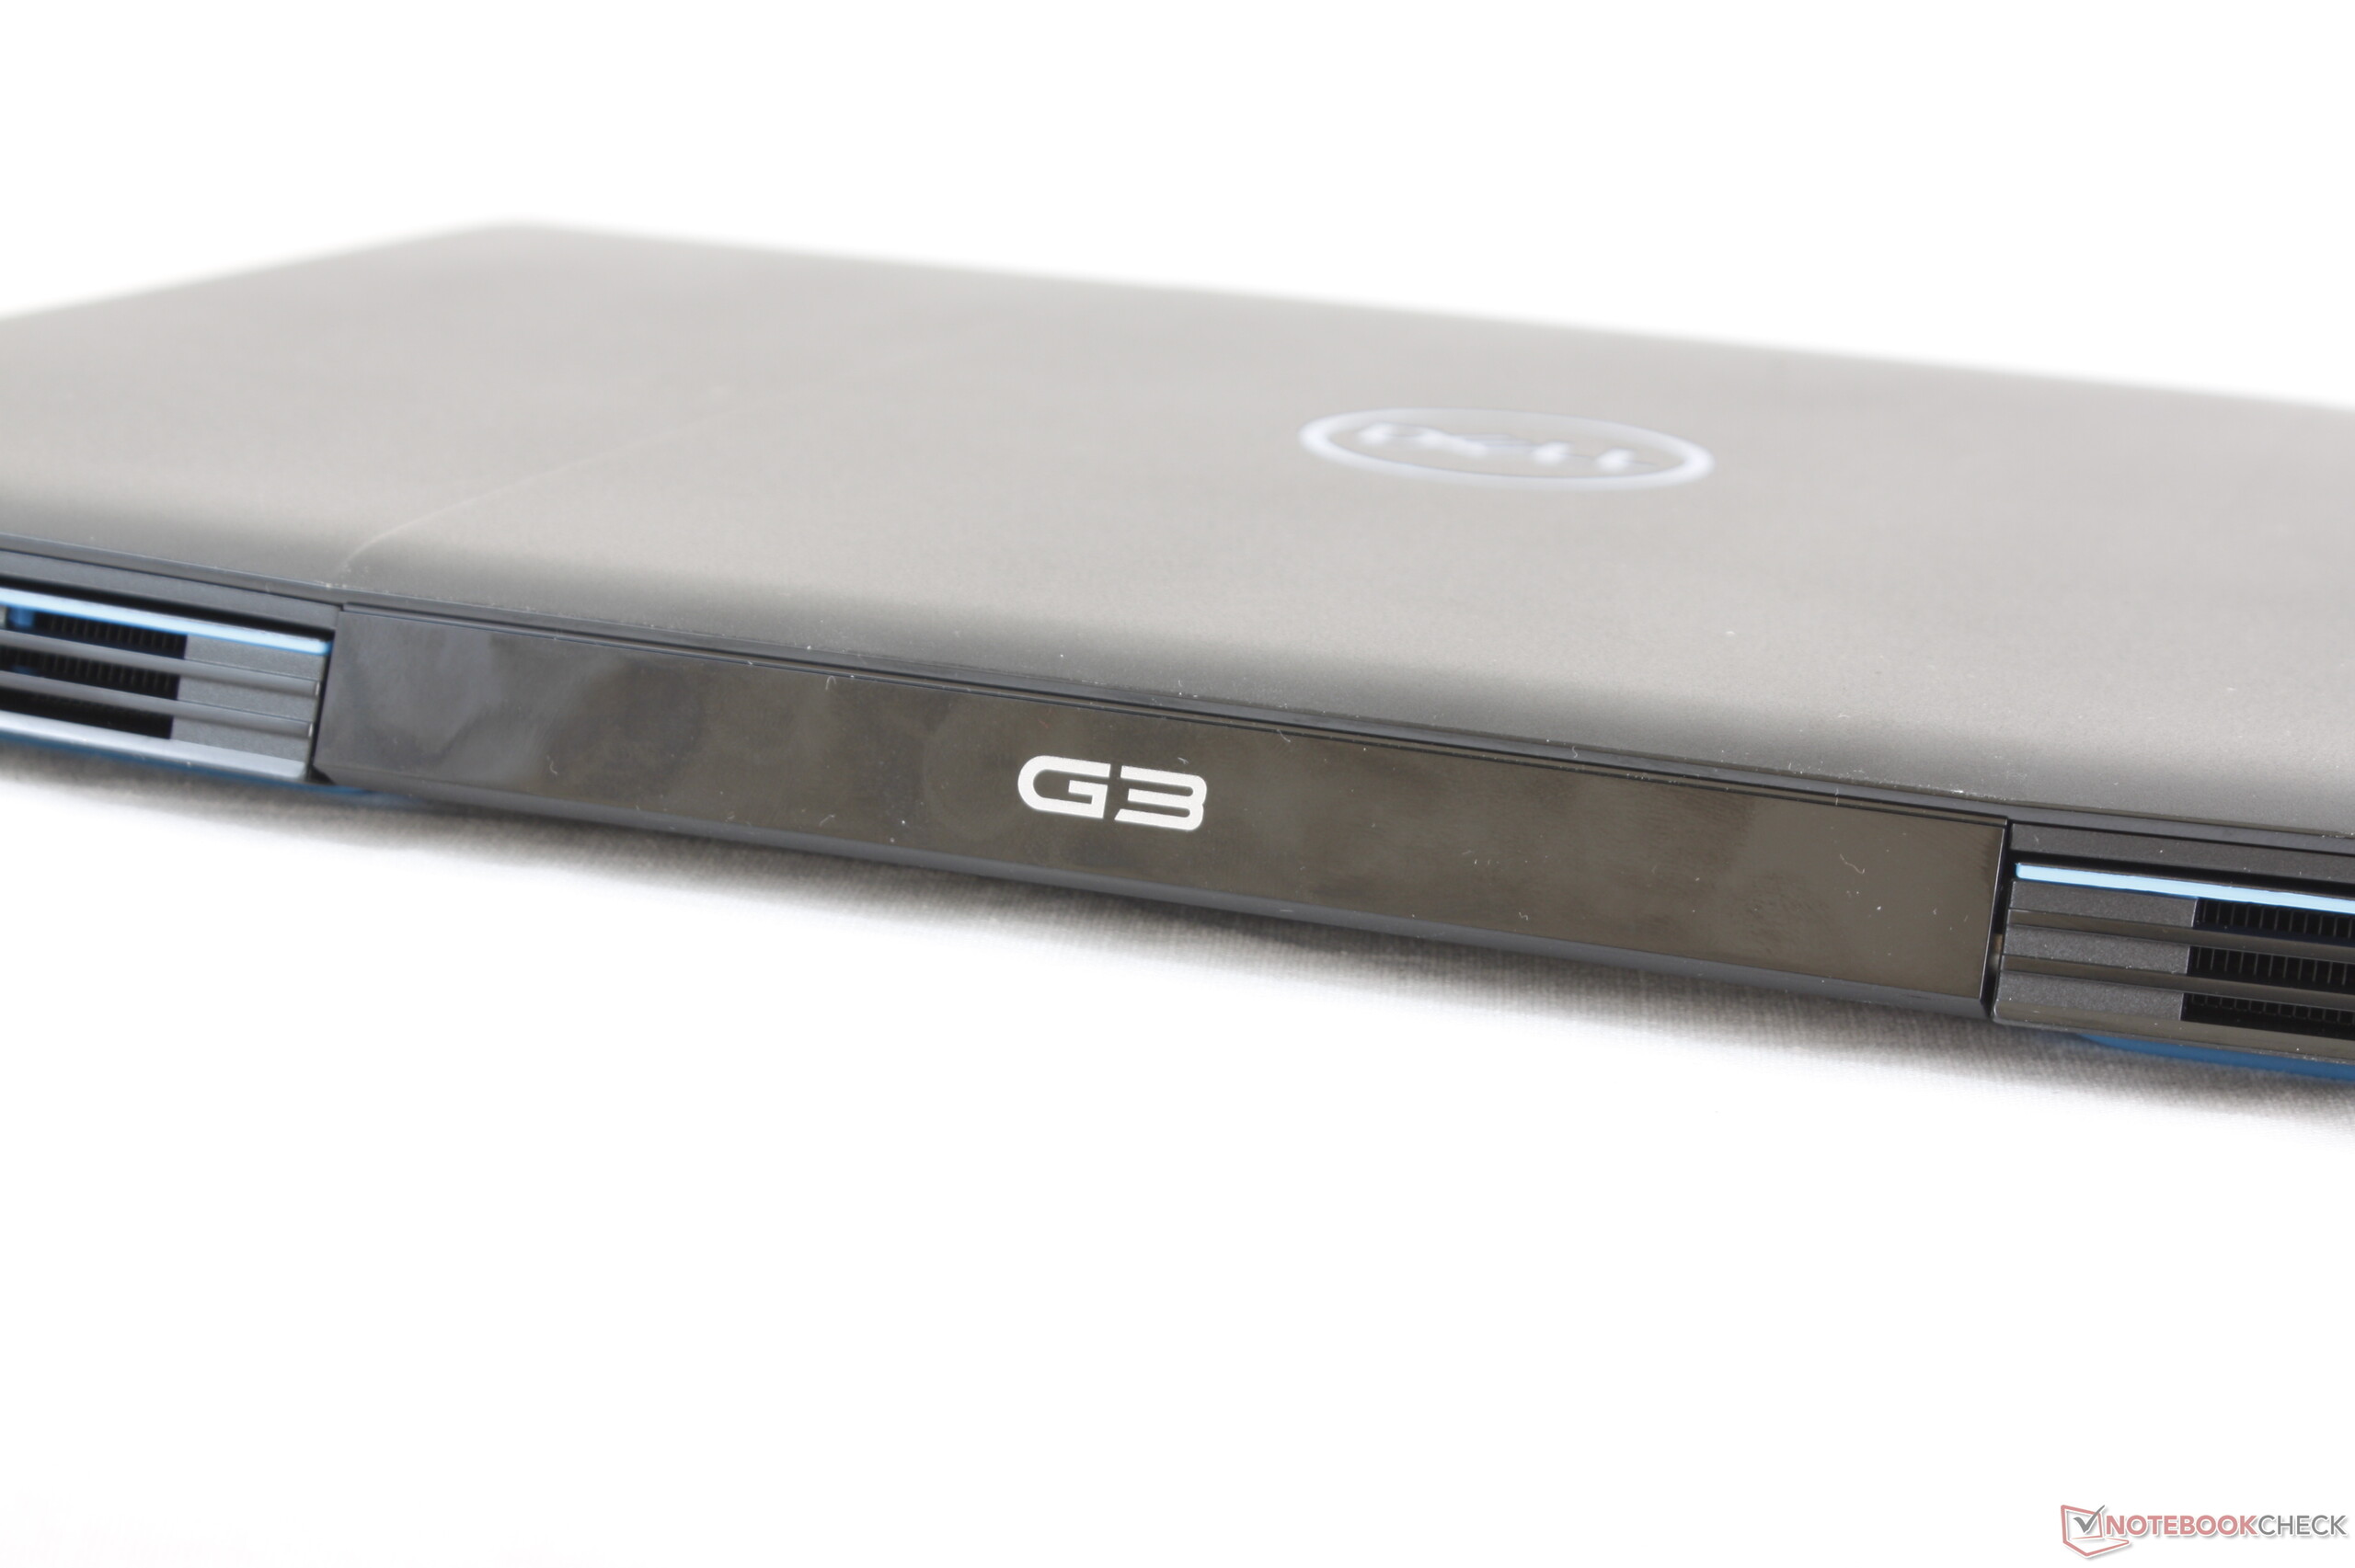
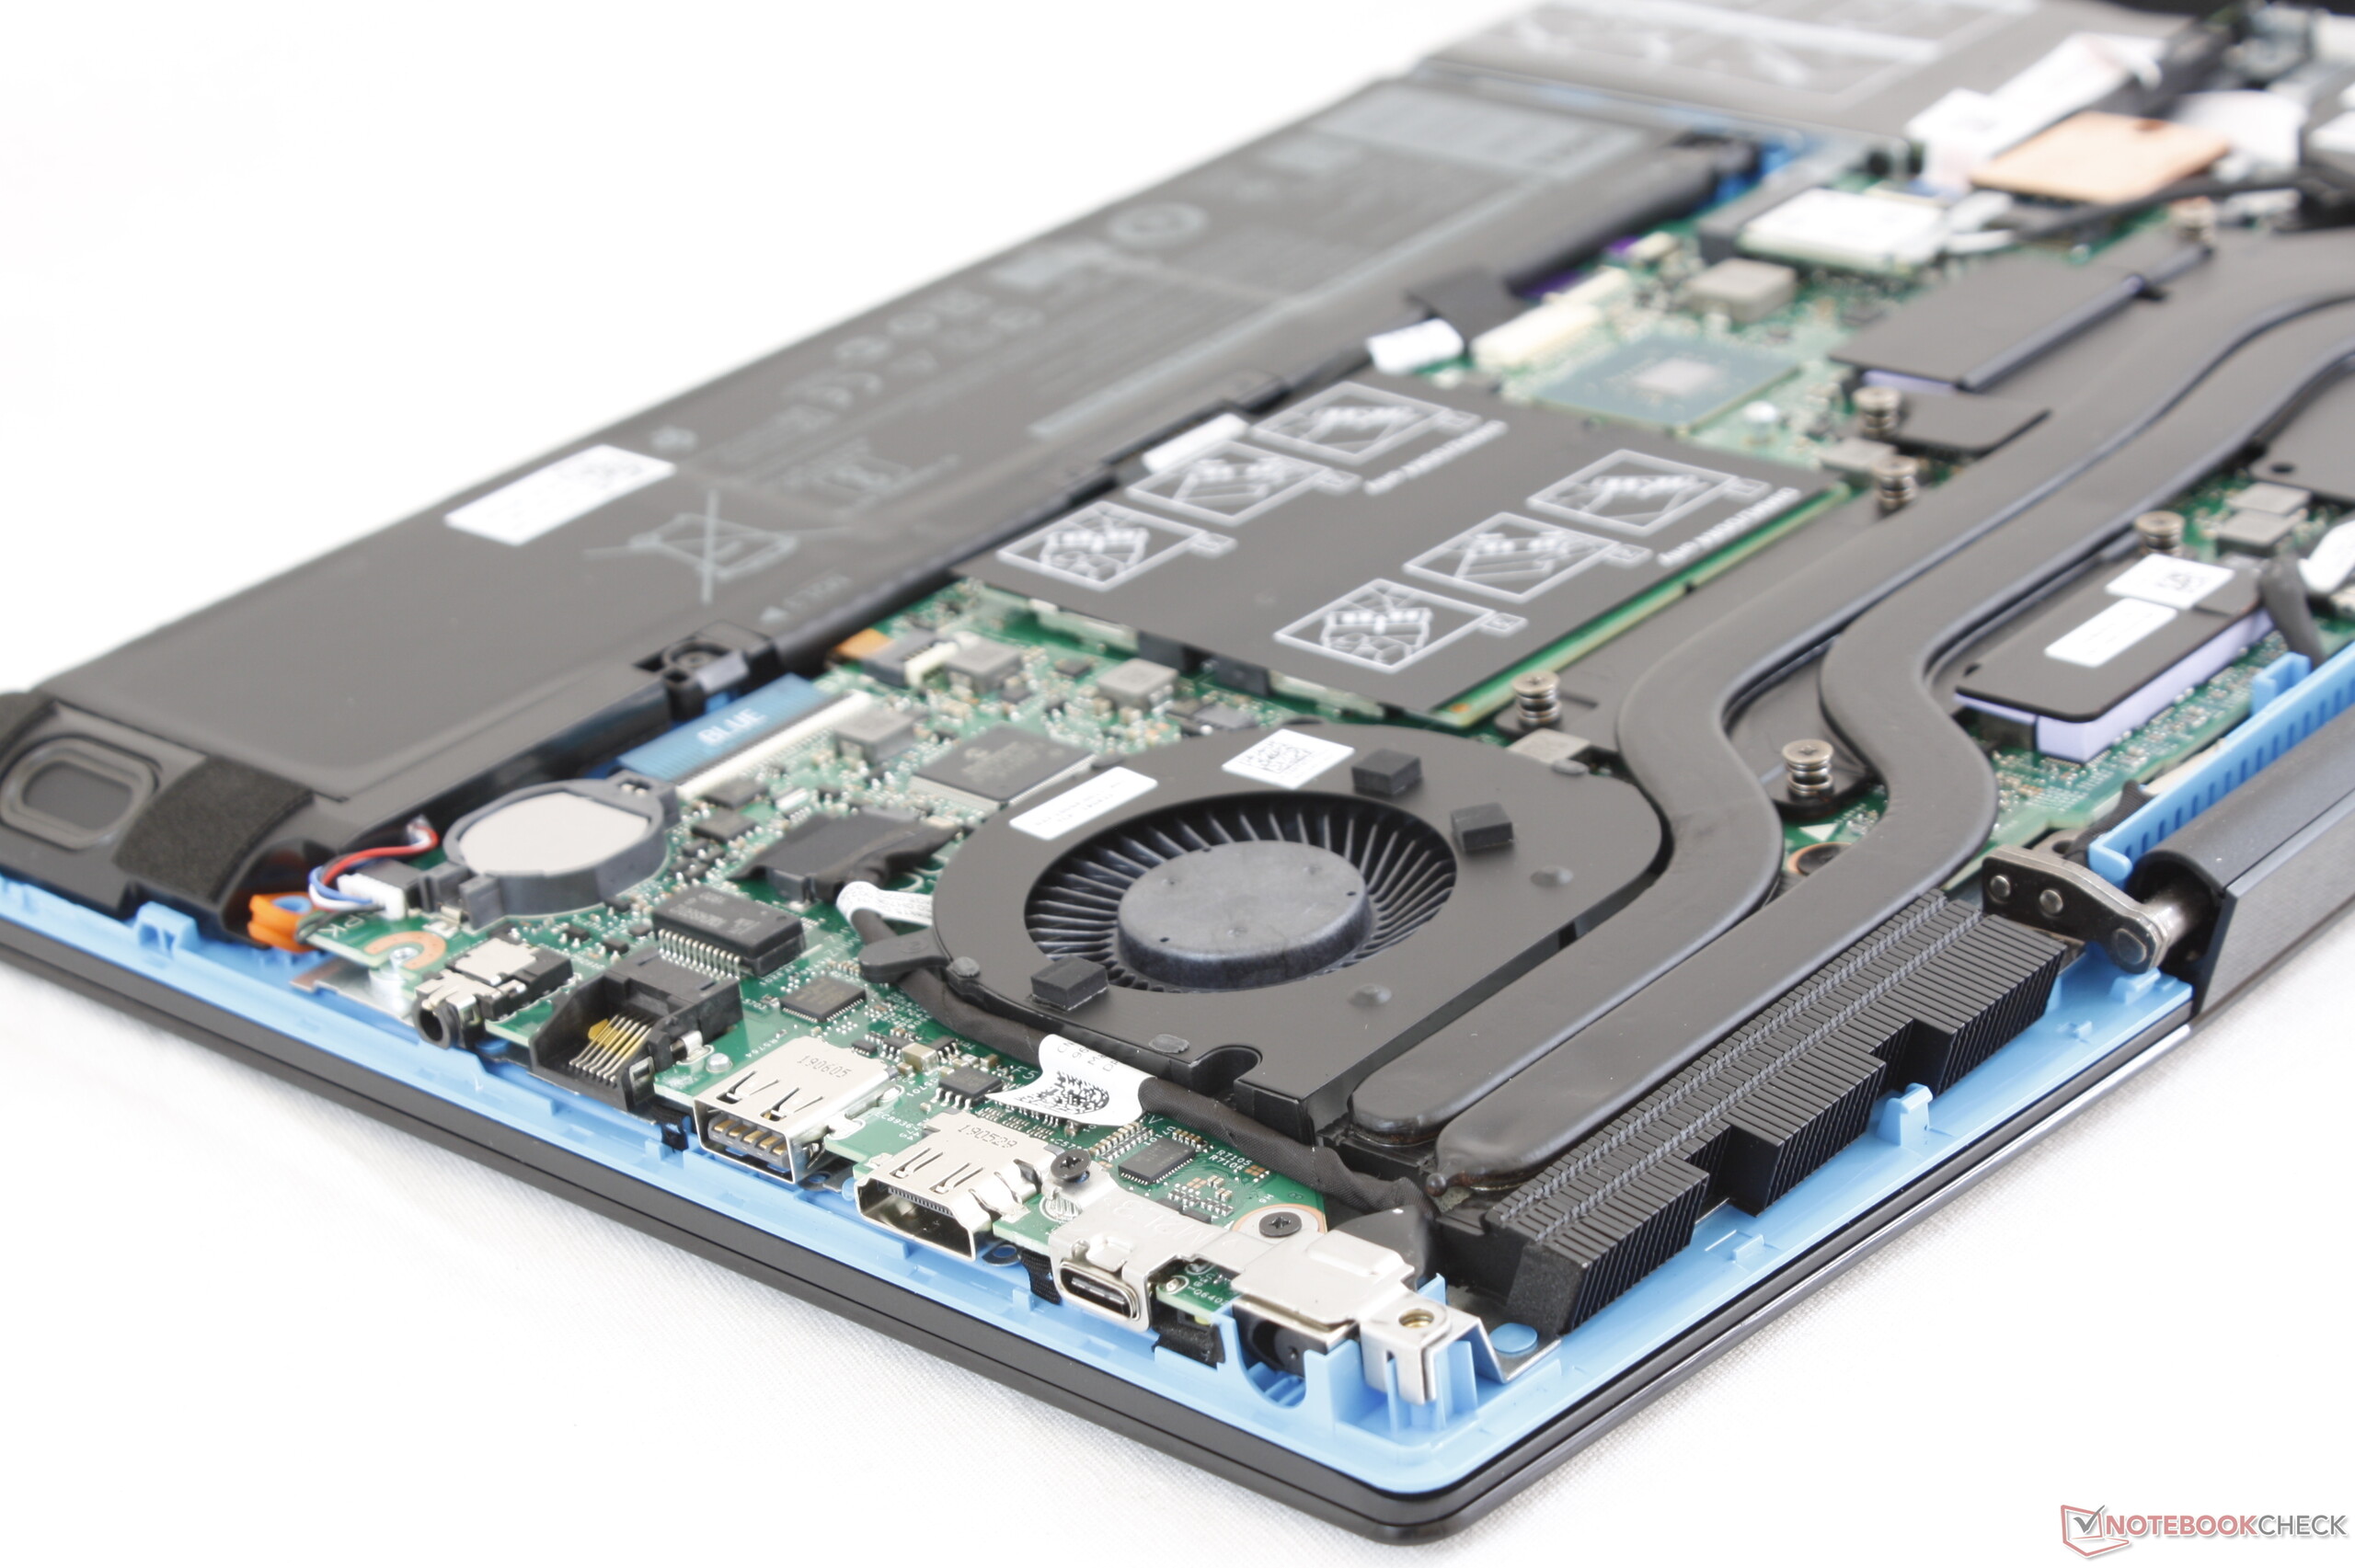
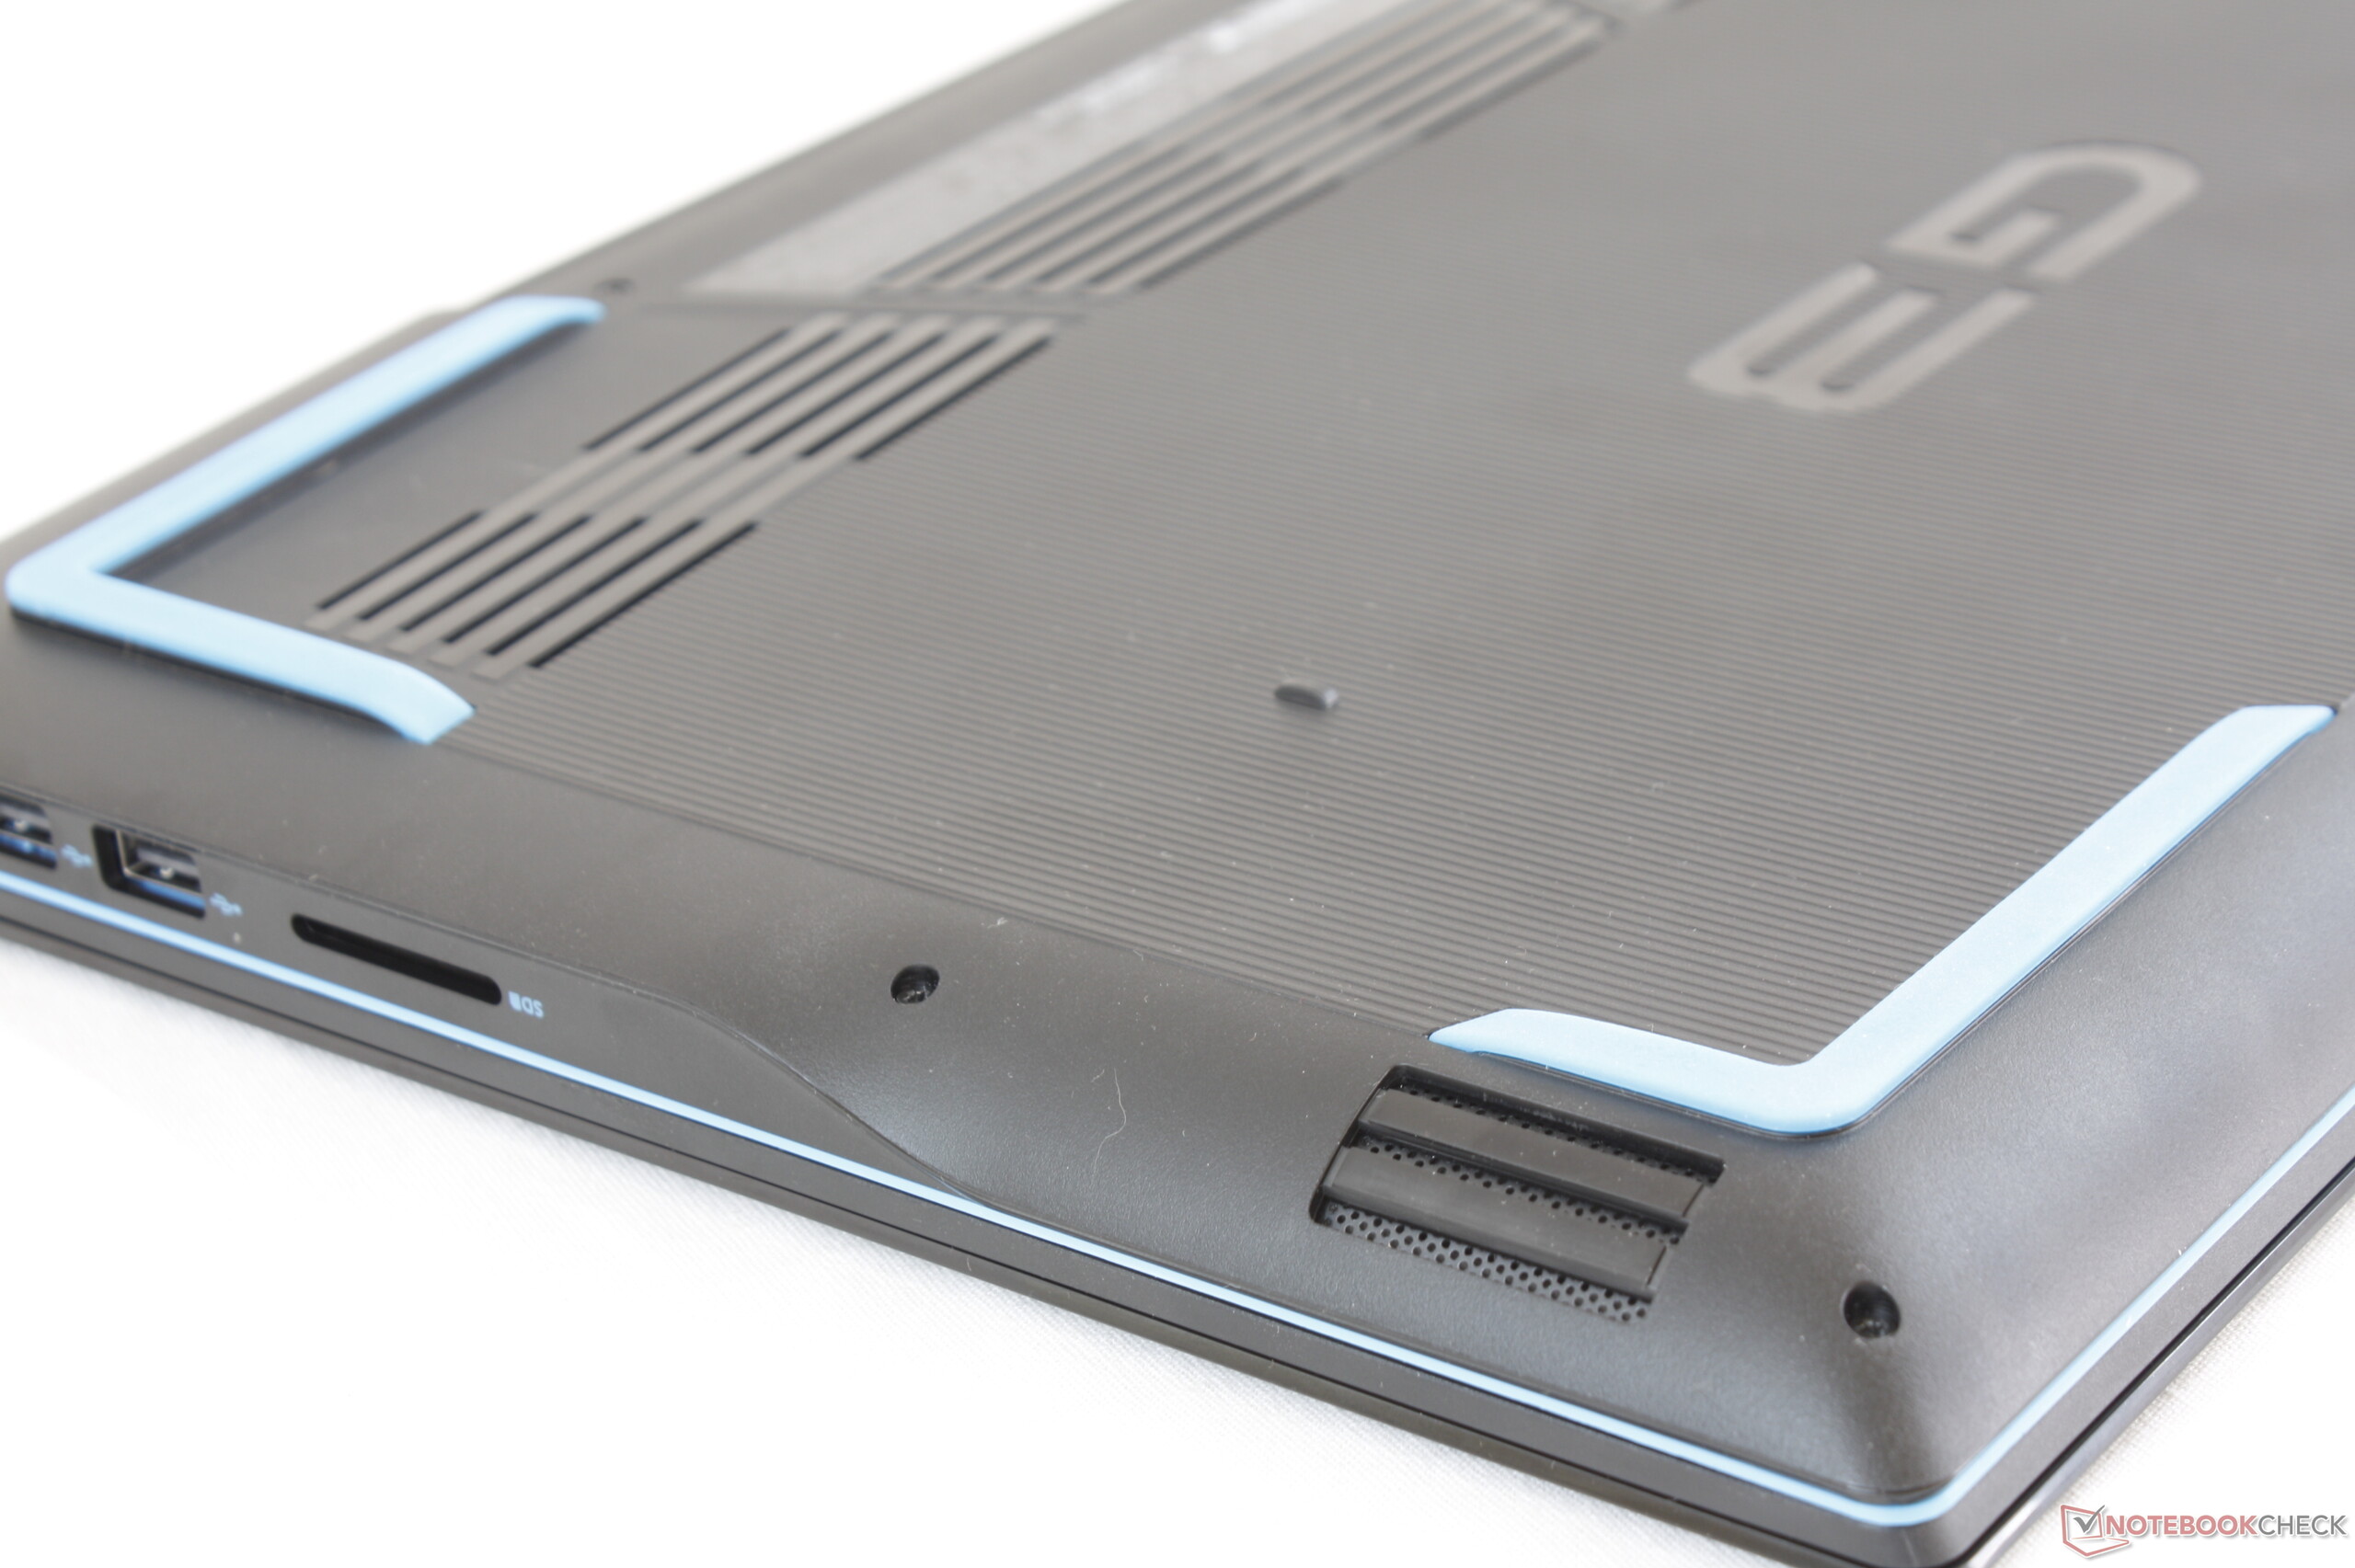
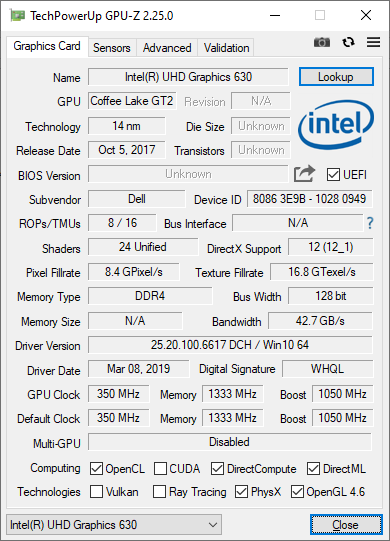
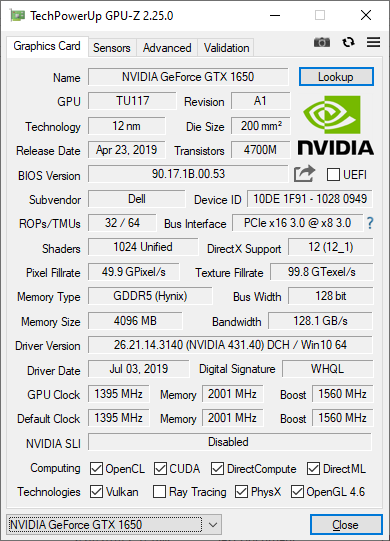
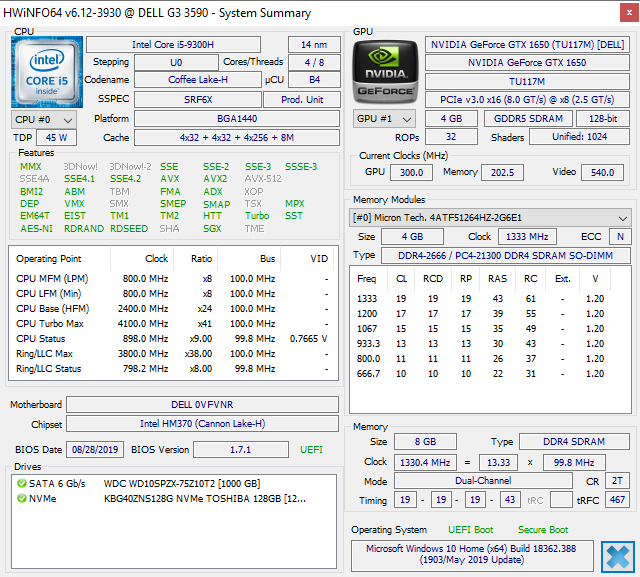
戴尔G3 3590的最强方面是可维护性。与HP Pavilion Gaming 15或MSI GP65不同,戴尔G3更易于升级,并且不需要撕开任何保修封条。我们希望性能是本机的重点,而低廉的入门价格使该系统对于希望拥有功能强大,外观简洁的游戏本的用户具有吸引力。
缺点列表比我们想要的要长。特别是显示器的偷工减料过多,包括较差的色彩,中等程度的不均匀漏光,响应时间较慢,粗糙的磨砂覆盖层和昏暗的背光。尽管大多数可以接受,但竞品 HP Gaming Pavilion 15 和 Lenovo Legion Y540都提供了更好的屏幕面板,更适合竞技游戏。如果您想要更好的视觉体验,则必须升级到Dell G7系列或更高版本,因为G3 3590没有其他面板选项。
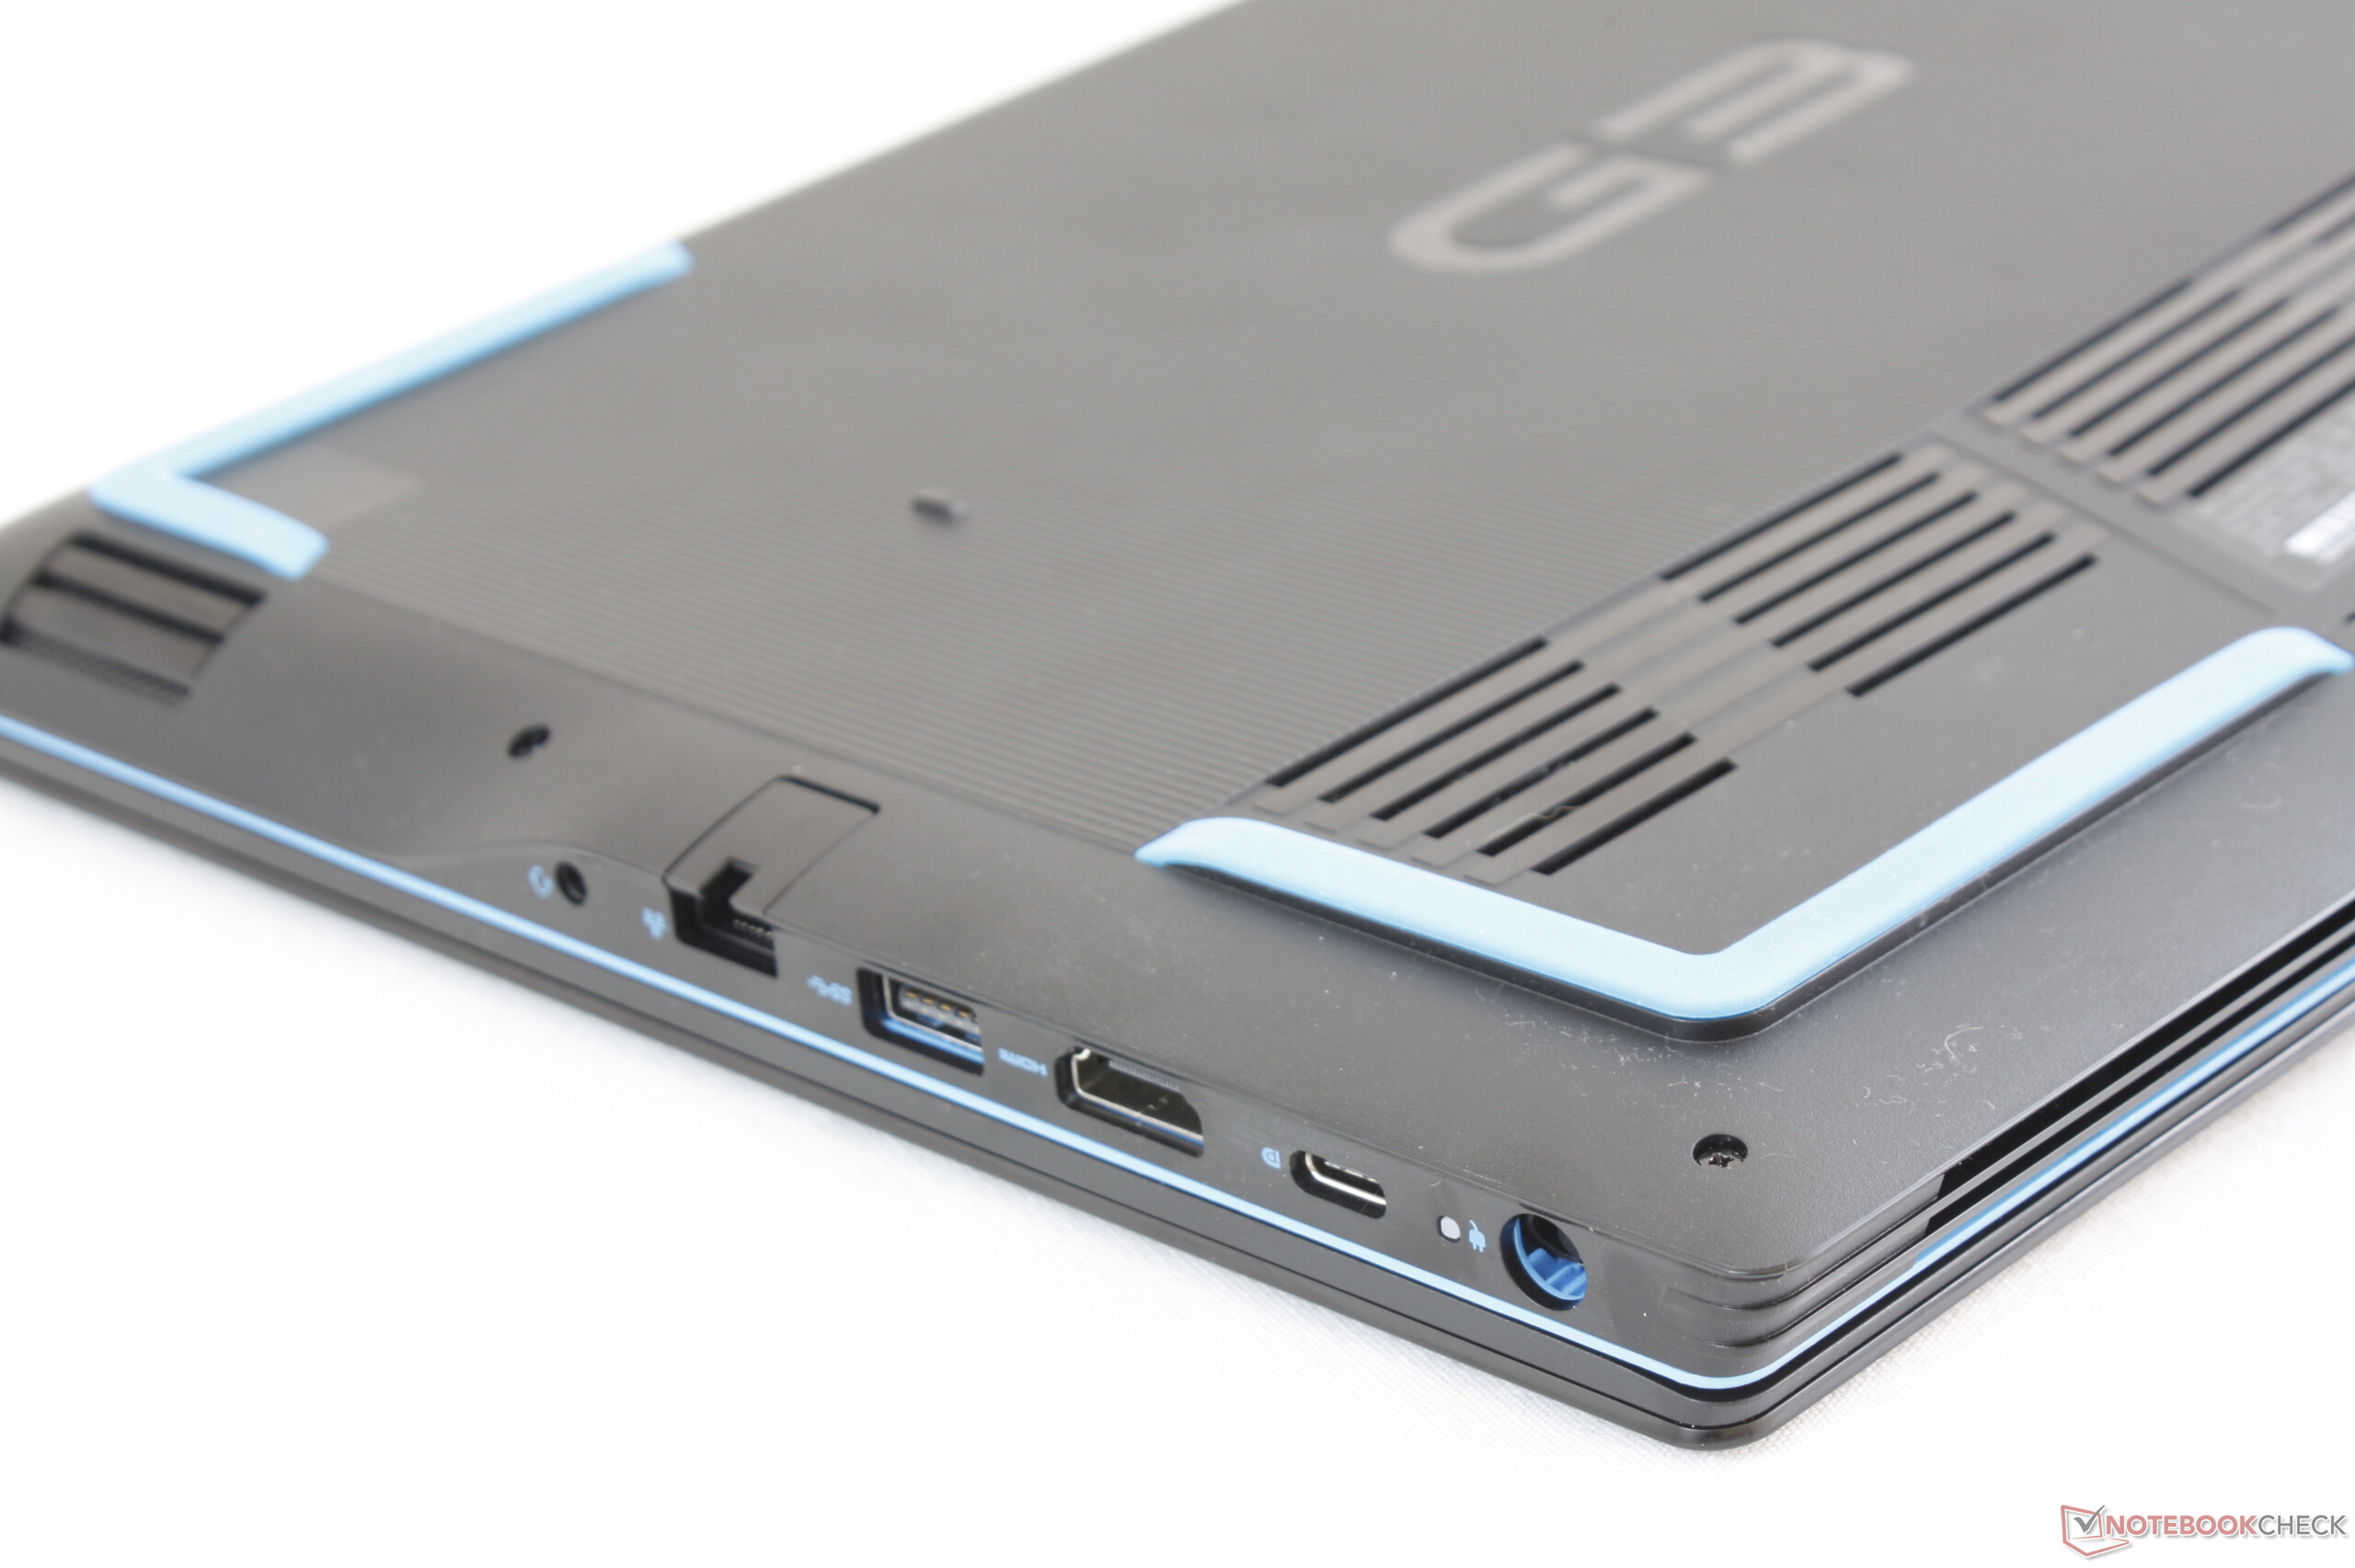
该系统的其余部分是其价格范围的平均水平。塑料机身,一般般的扬声器,低速SD读取器,1x1 WLAN和廉价NVMe SSD在低端游戏笔记本电脑上很常见。
如果您有7000元用于购买游戏笔记本电脑,也可以需要考虑更安静的HP Pavilion Gaming 15或更时尚的AMD版华硕Zephyrus G GA502系列。戴尔G3 3590可能会稍微便宜一些,但其更大声的风扇和较差的显示屏值得三思。
Dell G3 3590
- 10/11/2019 v7 (old)
Allen Ngo
Price comparison

