惠普Pavilion 15游戏笔记本电脑评测:拥有长续航的廉价游戏本
Rating | Date | Model | Weight | Height | Size | Resolution | Price |
|---|---|---|---|---|---|---|---|
| 81.2 % v7 (old) | 11 / 2020 | HP Pavilion Gaming 15-ec1206ng R5 4600H, GeForce GTX 1650 Mobile | 2.1 kg | 23.5 mm | 15.60" | 1920x1080 | |
| 81.2 % v7 (old) | Nexoc GH5 515IG i5-10300H, GeForce GTX 1650 Mobile | 2.1 kg | 24.9 mm | 15.60" | 1920x1080 | ||
| 78.4 % v7 (old) | 08 / 2020 | Lenovo IdeaPad Gaming 3i 15IMH05 i5-10300H, GeForce GTX 1650 Mobile | 2.2 kg | 24.9 mm | 15.60" | 1920x1080 | |
| 80.4 % v6 (old) | 08 / 2019 | Asus TUF FX505DT-EB73 R7 3750H, GeForce GTX 1650 Mobile | 2.2 kg | 26.8 mm | 15.60" | 1920x1080 | |
| 79.6 % v7 (old) | 08 / 2019 | Dell G5 15 5590-PCNJJ i5-9300H, GeForce GTX 1650 Mobile | 2.7 kg | 23.7 mm | 15.60" | 1920x1080 | |
| 79.8 % v7 (old) | 12 / 2020 | Acer Nitro 5 AN515-44-R5FT R5 4600H, GeForce GTX 1650 Ti Mobile | 2.2 kg | 24 mm | 15.60" | 1920x1080 | |
| 79.5 % v7 (old) | MSI Bravo 15 A4DCR R7 4800H, Radeon RX 5300M | 2 kg | 22 mm | 15.60" | 1920x1080 |
| SD Card Reader | |
| average JPG Copy Test (av. of 3 runs) | |
| Average of class Gaming (20.9 - 210, n=54, last 2 years) | |
| Nexoc GH5 515IG (Toshiba Exceria Pro SDXC 64 GB UHS-II) | |
| HP Pavilion Gaming 15-ec1206ng (Toshiba Exceria Pro SDXC 64 GB UHS-II) | |
| HP Pavilion Gaming 15-ec0002ng (Toshiba Exceria Pro SDXC 64 GB UHS-II) | |
| Dell G5 15 5590-PCNJJ (Toshiba Exceria Pro SDXC 64 GB UHS-II) | |
| maximum AS SSD Seq Read Test (1GB) | |
| Average of class Gaming (25.5 - 261, n=51, last 2 years) | |
| Nexoc GH5 515IG (Toshiba Exceria Pro SDXC 64 GB UHS-II) | |
| HP Pavilion Gaming 15-ec0002ng (Toshiba Exceria Pro SDXC 64 GB UHS-II) | |
| HP Pavilion Gaming 15-ec1206ng (Toshiba Exceria Pro SDXC 64 GB UHS-II) | |
| Dell G5 15 5590-PCNJJ (Toshiba Exceria Pro SDXC 64 GB UHS-II) | |
| Networking | |
| iperf3 transmit AX12 | |
| Nexoc GH5 515IG | |
| Acer Nitro 5 AN515-44-R5FT | |
| MSI Bravo 15 A4DCR | |
| Dell G5 15 5590-PCNJJ | |
| HP Pavilion Gaming 15-ec0002ng | |
| HP Pavilion Gaming 15-ec1206ng | |
| Lenovo IdeaPad Gaming 3i 15IMH05 | |
| Asus TUF FX505DT-EB73 | |
| iperf3 receive AX12 | |
| Nexoc GH5 515IG | |
| Acer Nitro 5 AN515-44-R5FT | |
| MSI Bravo 15 A4DCR | |
| Dell G5 15 5590-PCNJJ | |
| HP Pavilion Gaming 15-ec1206ng | |
| Lenovo IdeaPad Gaming 3i 15IMH05 | |
| HP Pavilion Gaming 15-ec0002ng | |
| Asus TUF FX505DT-EB73 | |


| |||||||||||||||||||||||||
Brightness Distribution: 83 %
Center on Battery: 277 cd/m²
Contrast: 1731:1 (Black: 0.16 cd/m²)
ΔE ColorChecker Calman: 3.6 | ∀{0.5-29.43 Ø4.71}
calibrated: 2.88
ΔE Greyscale Calman: 1.75 | ∀{0.09-98 Ø4.96}
62% sRGB (Argyll 1.6.3 3D)
39% AdobeRGB 1998 (Argyll 1.6.3 3D)
42.76% AdobeRGB 1998 (Argyll 3D)
62% sRGB (Argyll 3D)
41.36% Display P3 (Argyll 3D)
Gamma: 2.23
CCT: 6695 K
| HP Pavilion Gaming 15-ec1206ng Chi Mei CMN150D, IPS, 1920x1080, 15.6" | HP Pavilion Gaming 15-ec0002ng Chi Mei N156HGA-EA3, TN LED, 1920x1080, 15.6" | Nexoc GH5 515IG LG Philips LP156WFC-SPD1, IPS, 1920x1080, 15.6" | Lenovo IdeaPad Gaming 3i 15IMH05 BOE CQ NV156FHM-NX1, IPS, 1920x1080, 15.6" | Asus TUF FX505DT-EB73 Panda LM156LF-GL, IPS, 1920x1080, 15.6" | Dell G5 15 5590-PCNJJ AU Optronics B156HAN (AUO23ED), IPS, 1920x1080, 15.6" | Acer Nitro 5 AN515-44-R5FT Panda LM156LF-2F01 (NCP004D), IPS, 1920x1080, 15.6" | MSI Bravo 15 A4DCR AU Optronics B156HAN08.0 (AUO80ED), IPS-Level, 1920x1080, 15.6" | |
|---|---|---|---|---|---|---|---|---|
| Display | 0% | -8% | -8% | -4% | 96% | 0% | 46% | |
| Display P3 Coverage (%) | 41.36 | 41.22 0% | 37.91 -8% | 38.04 -8% | 39.56 -4% | 83.1 101% | 41.16 0% | 62 50% |
| sRGB Coverage (%) | 62 | 61.8 0% | 57 -8% | 56.6 -9% | 59.5 -4% | 99.9 61% | 61.8 0% | 86.8 40% |
| AdobeRGB 1998 Coverage (%) | 42.76 | 42.62 0% | 39.19 -8% | 39.3 -8% | 40.91 -4% | 96.8 126% | 42.56 0% | 62.7 47% |
| Response Times | 1% | -9% | 25% | -7% | -39% | -28% | 53% | |
| Response Time Grey 50% / Grey 80% * (ms) | 33.6 ? | 44 ? -31% | 34.8 ? -4% | 25 ? 26% | 30.4 ? 10% | 48 ? -43% | 40.8 ? -21% | 16 ? 52% |
| Response Time Black / White * (ms) | 22.4 ? | 15 ? 33% | 25.2 ? -13% | 17 ? 24% | 27.6 ? -23% | 30 ? -34% | 30 ? -34% | 10.4 ? 54% |
| PWM Frequency (Hz) | 24750 ? | 250 ? | ||||||
| Screen | -98% | -18% | -55% | -52% | -41% | -26% | -16% | |
| Brightness middle (cd/m²) | 277 | 233 -16% | 261 -6% | 305 10% | 286.2 3% | 234 -16% | 287 4% | 311 12% |
| Brightness (cd/m²) | 248 | 211 -15% | 254 2% | 294 19% | 267 8% | 216 -13% | 271 9% | 313 26% |
| Brightness Distribution (%) | 83 | 82 -1% | 93 12% | 70 -16% | 84 1% | 87 5% | 88 6% | 88 6% |
| Black Level * (cd/m²) | 0.16 | 0.405 -153% | 0.23 -44% | 0.405 -153% | 0.33 -106% | 0.22 -38% | 0.25 -56% | 0.43 -169% |
| Contrast (:1) | 1731 | 575 -67% | 1135 -34% | 753 -56% | 867 -50% | 1064 -39% | 1148 -34% | 723 -58% |
| Colorchecker dE 2000 * | 3.6 | 8.22 -128% | 4.71 -31% | 6.01 -67% | 5.45 -51% | 6.52 -81% | 4.77 -33% | 4.5 -25% |
| Colorchecker dE 2000 max. * | 8.53 | 18.6 -118% | 7.6 11% | 21.9 -157% | 18.08 -112% | 10.58 -24% | 17.15 -101% | 7.97 7% |
| Colorchecker dE 2000 calibrated * | 2.88 | 3.67 -27% | 5.12 -78% | 4.47 -55% | 3.56 -24% | 3.73 -30% | 2.65 8% | |
| Greyscale dE 2000 * | 1.75 | 10.13 -479% | 2.76 -58% | 3.23 -85% | 5.3 -203% | 5.33 -205% | 2.7 -54% | 3.3 -89% |
| Gamma | 2.23 99% | 2.27 97% | 2.42 91% | 2.43 91% | 2.1 105% | 2.86 77% | 2.115 104% | 2.129 103% |
| CCT | 6695 97% | 11323 57% | 7090 92% | 6818 95% | 7679 85% | 5983 109% | 7187 90% | 7227 90% |
| Color Space (Percent of AdobeRGB 1998) (%) | 39 | 39 0% | 36 -8% | 36 -8% | 37.6 -4% | 36 -8% | 43 10% | 63 62% |
| Color Space (Percent of sRGB) (%) | 62 | 62 0% | 56 -10% | 56 -10% | 59.1 -5% | 57 -8% | 61 -2% | 86 39% |
| Total Average (Program / Settings) | -32% /
-65% | -12% /
-15% | -13% /
-36% | -21% /
-37% | 5% /
-15% | -18% /
-21% | 28% /
4% |
* ... smaller is better
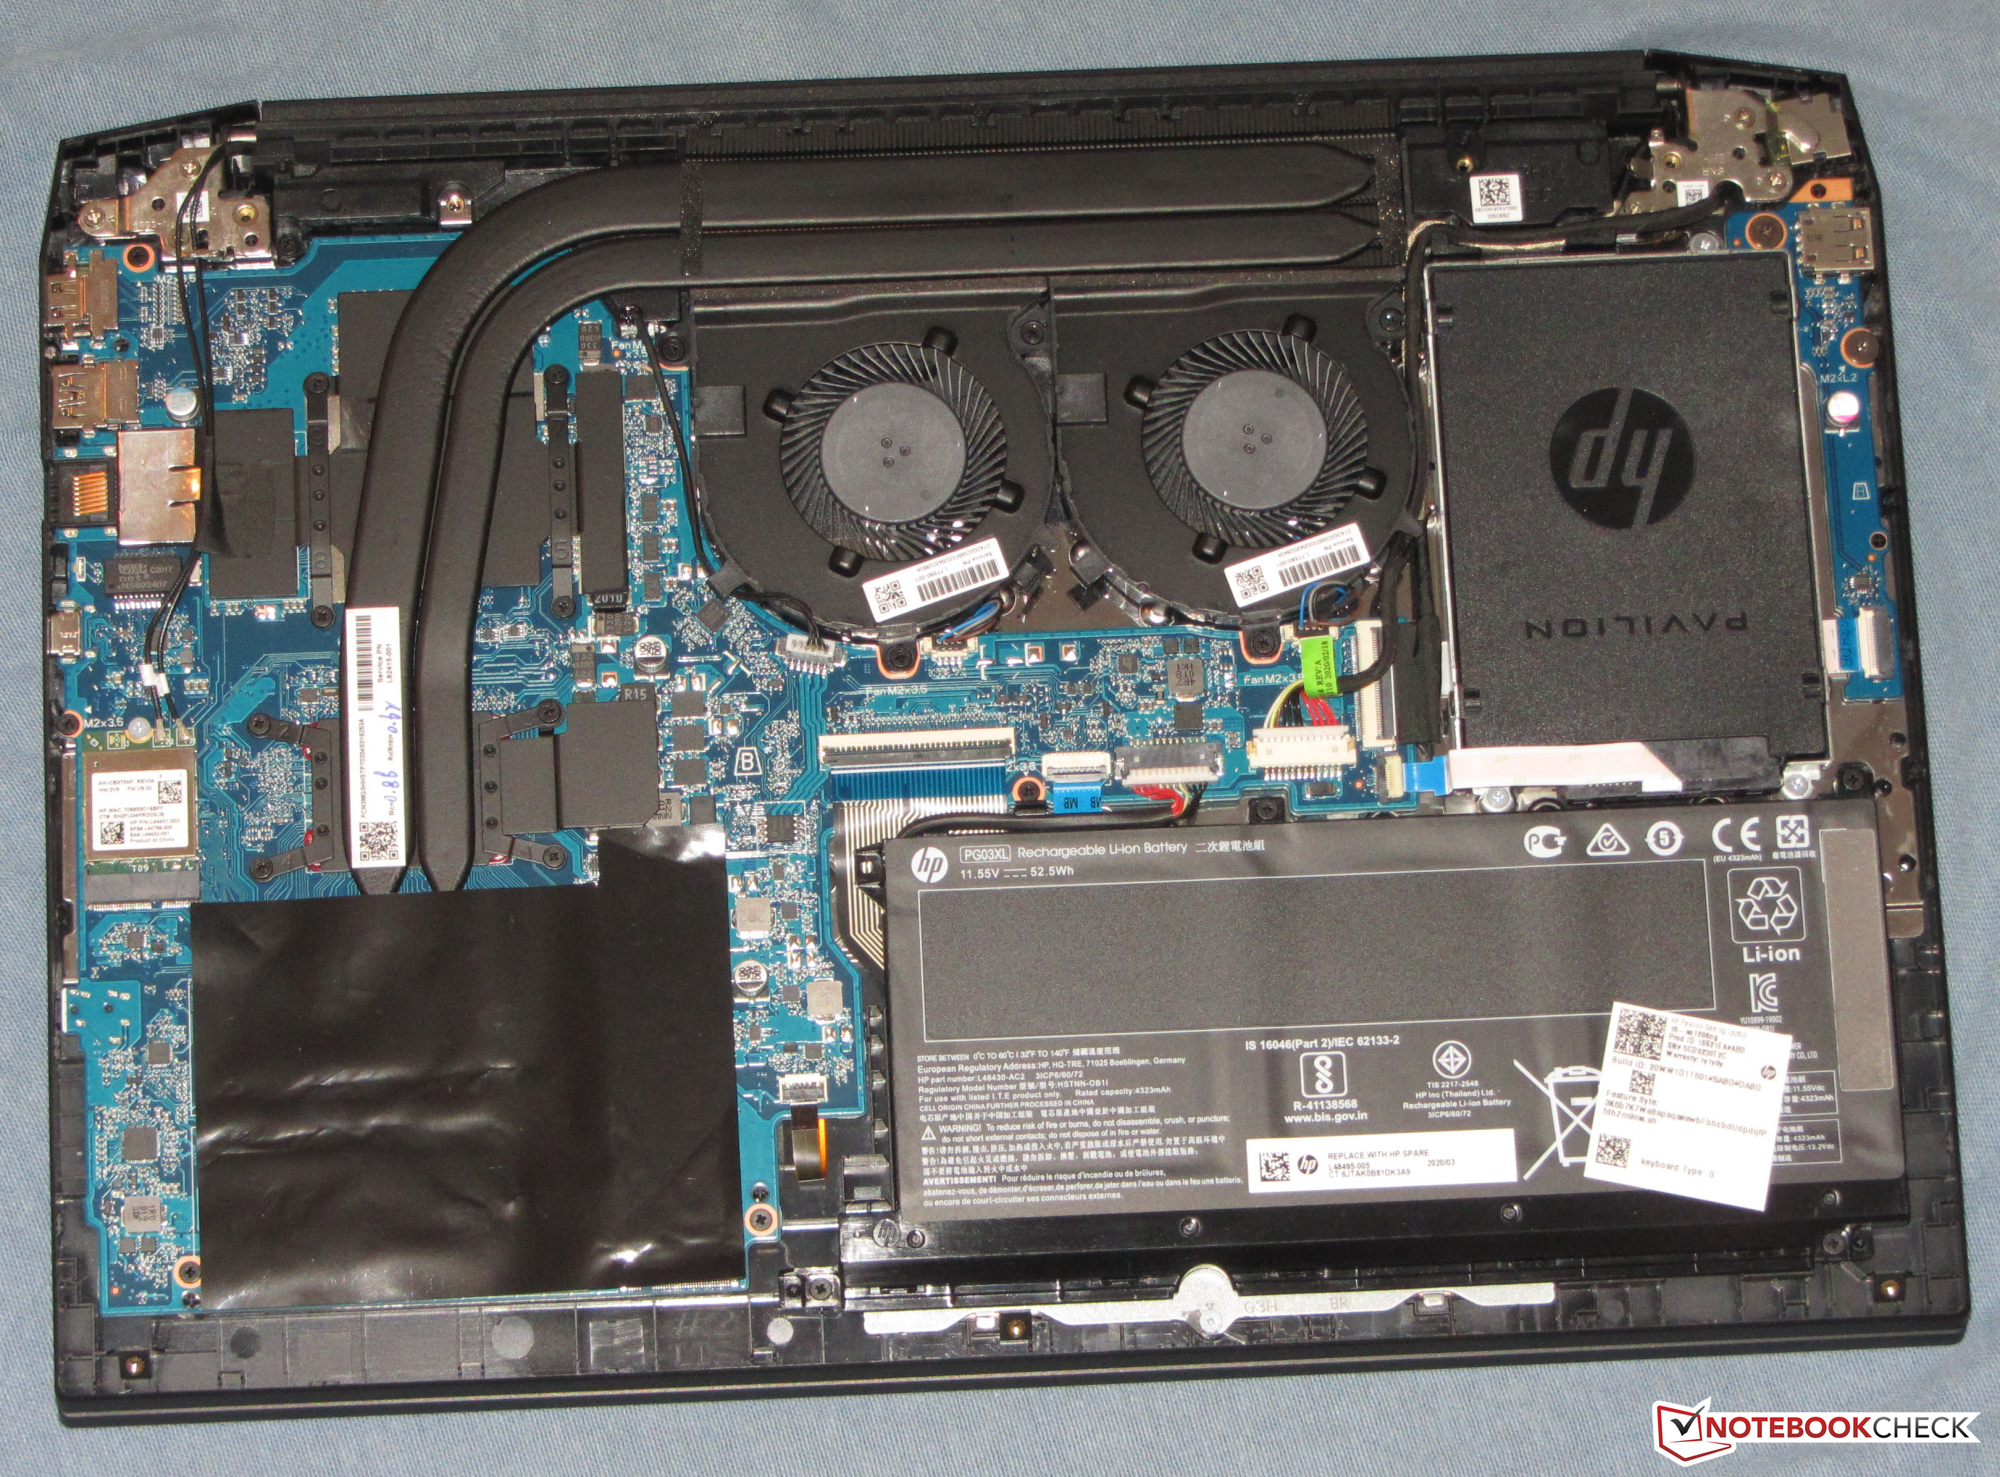
Display Response Times
| ↔ Response Time Black to White | ||
|---|---|---|
| 22.4 ms ... rise ↗ and fall ↘ combined | ↗ 12.8 ms rise | 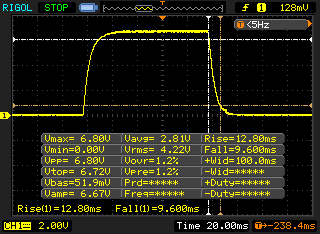 |
| ↘ 9.6 ms fall | ||
| The screen shows good response rates in our tests, but may be too slow for competitive gamers. In comparison, all tested devices range from 0.1 (minimum) to 240 (maximum) ms. » 51 % of all devices are better. This means that the measured response time is worse than the average of all tested devices (19.8 ms). | ||
| ↔ Response Time 50% Grey to 80% Grey | ||
| 33.6 ms ... rise ↗ and fall ↘ combined | ↗ 17.2 ms rise | 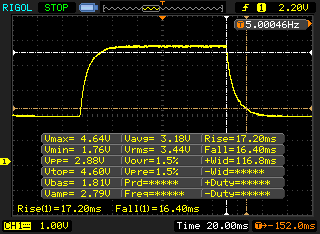 |
| ↘ 16.4 ms fall | ||
| The screen shows slow response rates in our tests and will be unsatisfactory for gamers. In comparison, all tested devices range from 0.165 (minimum) to 636 (maximum) ms. » 46 % of all devices are better. This means that the measured response time is similar to the average of all tested devices (30.9 ms). | ||
Screen Flickering / PWM (Pulse-Width Modulation)
| Screen flickering / PWM detected | 24750 Hz | ≤ 42 % brightness setting |  |
The display backlight flickers at 24750 Hz (worst case, e.g., utilizing PWM) Flickering detected at a brightness setting of 42 % and below. There should be no flickering or PWM above this brightness setting. The frequency of 24750 Hz is quite high, so most users sensitive to PWM should not notice any flickering. In comparison: 52 % of all tested devices do not use PWM to dim the display. If PWM was detected, an average of 7741 (minimum: 5 - maximum: 343500) Hz was measured. | |||
| Cinebench R15 | |
| CPU Single 64Bit | |
| Lenovo IdeaPad Gaming 3i 15IMH05 | |
| MSI Bravo 15 A4DCR | |
| Nexoc GH5 515IG | |
| Acer Nitro 5 AN515-44-R5FT | |
| HP Pavilion Gaming 15-ec1206ng | |
| Dell G5 15 5590-PCNJJ | |
| Asus TUF FX505DT-EB73 | |
| HP Pavilion Gaming 15-ec0002ng | |
| CPU Multi 64Bit | |
| MSI Bravo 15 A4DCR | |
| HP Pavilion Gaming 15-ec1206ng | |
| Acer Nitro 5 AN515-44-R5FT | |
| Lenovo IdeaPad Gaming 3i 15IMH05 | |
| Nexoc GH5 515IG | |
| Dell G5 15 5590-PCNJJ | |
| Asus TUF FX505DT-EB73 | |
| HP Pavilion Gaming 15-ec0002ng | |
| Blender - v2.79 BMW27 CPU | |
| Nexoc GH5 515IG | |
| Lenovo IdeaPad Gaming 3i 15IMH05 | |
| Acer Nitro 5 AN515-44-R5FT | |
| HP Pavilion Gaming 15-ec1206ng | |
| MSI Bravo 15 A4DCR | |
| 7-Zip 18.03 | |
| 7z b 4 -mmt1 | |
| Nexoc GH5 515IG | |
| Lenovo IdeaPad Gaming 3i 15IMH05 | |
| MSI Bravo 15 A4DCR | |
| Acer Nitro 5 AN515-44-R5FT | |
| HP Pavilion Gaming 15-ec1206ng | |
| 7z b 4 | |
| MSI Bravo 15 A4DCR | |
| HP Pavilion Gaming 15-ec1206ng | |
| Acer Nitro 5 AN515-44-R5FT | |
| Lenovo IdeaPad Gaming 3i 15IMH05 | |
| Nexoc GH5 515IG | |
| Cinebench R20 | |
| CPU (Single Core) | |
| MSI Bravo 15 A4DCR | |
| Nexoc GH5 515IG | |
| Lenovo IdeaPad Gaming 3i 15IMH05 | |
| HP Pavilion Gaming 15-ec1206ng | |
| Acer Nitro 5 AN515-44-R5FT | |
| Dell G5 15 5590-PCNJJ | |
| Asus TUF FX505DT-EB73 | |
| HP Pavilion Gaming 15-ec0002ng | |
| CPU (Multi Core) | |
| MSI Bravo 15 A4DCR | |
| HP Pavilion Gaming 15-ec1206ng | |
| Acer Nitro 5 AN515-44-R5FT | |
| Lenovo IdeaPad Gaming 3i 15IMH05 | |
| Nexoc GH5 515IG | |
| Dell G5 15 5590-PCNJJ | |
| Asus TUF FX505DT-EB73 | |
| HP Pavilion Gaming 15-ec0002ng | |
| Geekbench 5.5 | |
| Single-Core | |
| Nexoc GH5 515IG | |
| Lenovo IdeaPad Gaming 3i 15IMH05 | |
| MSI Bravo 15 A4DCR | |
| HP Pavilion Gaming 15-ec1206ng | |
| Acer Nitro 5 AN515-44-R5FT | |
| HP Pavilion Gaming 15-ec0002ng | |
| Multi-Core | |
| MSI Bravo 15 A4DCR | |
| HP Pavilion Gaming 15-ec1206ng | |
| Acer Nitro 5 AN515-44-R5FT | |
| Nexoc GH5 515IG | |
| Lenovo IdeaPad Gaming 3i 15IMH05 | |
| HP Pavilion Gaming 15-ec0002ng | |
| HWBOT x265 Benchmark v2.2 - 4k Preset | |
| MSI Bravo 15 A4DCR | |
| HP Pavilion Gaming 15-ec1206ng | |
| Acer Nitro 5 AN515-44-R5FT | |
| Lenovo IdeaPad Gaming 3i 15IMH05 | |
| Nexoc GH5 515IG | |
| LibreOffice - 20 Documents To PDF | |
| MSI Bravo 15 A4DCR | |
| HP Pavilion Gaming 15-ec1206ng | |
| Acer Nitro 5 AN515-44-R5FT | |
| Nexoc GH5 515IG | |
| Lenovo IdeaPad Gaming 3i 15IMH05 | |
| R Benchmark 2.5 - Overall mean | |
| Lenovo IdeaPad Gaming 3i 15IMH05 | |
| Acer Nitro 5 AN515-44-R5FT | |
| Nexoc GH5 515IG | |
| HP Pavilion Gaming 15-ec1206ng | |
| MSI Bravo 15 A4DCR | |
* ... smaller is better
| PCMark 8 Home Score Accelerated v2 | 4332 points | |
| PCMark 8 Creative Score Accelerated v2 | 5215 points | |
| PCMark 8 Work Score Accelerated v2 | 5164 points | |
| PCMark 10 Score | 5221 points | |
Help | ||
| PCMark 10 - Score | |
| MSI Bravo 15 A4DCR | |
| HP Pavilion Gaming 15-ec1206ng | |
| Nexoc GH5 515IG | |
| Acer Nitro 5 AN515-44-R5FT | |
| Asus TUF FX505DT-EB73 | |
| Dell G5 15 5590-PCNJJ | |
| Lenovo IdeaPad Gaming 3i 15IMH05 | |
| HP Pavilion Gaming 15-ec0002ng | |
| PCMark 8 | |
| Home Score Accelerated v2 | |
| HP Pavilion Gaming 15-ec1206ng | |
| Nexoc GH5 515IG | |
| Asus TUF FX505DT-EB73 | |
| Lenovo IdeaPad Gaming 3i 15IMH05 | |
| HP Pavilion Gaming 15-ec0002ng | |
| Work Score Accelerated v2 | |
| Lenovo IdeaPad Gaming 3i 15IMH05 | |
| Nexoc GH5 515IG | |
| HP Pavilion Gaming 15-ec1206ng | |
| HP Pavilion Gaming 15-ec0002ng | |
| Asus TUF FX505DT-EB73 | |
| DPC Latencies / LatencyMon - interrupt to process latency (max), Web, Youtube, Prime95 | |
| MSI Bravo 15 A4DCR | |
| Acer Nitro 5 AN515-44-R5FT | |
| Lenovo IdeaPad Gaming 3i 15IMH05 | |
| HP Pavilion Gaming 15-ec1206ng | |
| Nexoc GH5 515IG | |
* ... smaller is better

| HP Pavilion Gaming 15-ec1206ng Toshiba KBG40ZNV512G | Nexoc GH5 515IG Samsung SSD 860 Evo 512GB | Lenovo IdeaPad Gaming 3i 15IMH05 SK hynix BC511 HFM512GDHTNI-87A0B | Asus TUF FX505DT-EB73 Intel SSD 660p SSDPEKNW512G8 | Dell G5 15 5590-PCNJJ KBG30ZMS128G | Acer Nitro 5 AN515-44-R5FT SK Hynix BC511 HFM512GDJTNI | MSI Bravo 15 A4DCR Samsung PM981a MZVLB1T0HBLR | HP Pavilion Gaming 15-ec0002ng Intel SSD 660p SSDPEKNW512G8 | |
|---|---|---|---|---|---|---|---|---|
| CrystalDiskMark 5.2 / 6 | -42% | -8% | -12% | -59% | -11% | 41% | -11% | |
| Write 4K (MB/s) | 111.5 | 89.6 -20% | 130 17% | 137.5 23% | 65.3 -41% | 94.7 -15% | 118.3 6% | 136.9 23% |
| Read 4K (MB/s) | 38.17 | 40.88 7% | 44.44 16% | 57 49% | 29.71 -22% | 38.91 2% | 43.73 15% | 57 49% |
| Write Seq (MB/s) | 1515 | 518 -66% | 1059 -30% | 984 -35% | 128.8 -91% | 1056 -30% | 2854 88% | 968 -36% |
| Read Seq (MB/s) | 1576 | 539 -66% | 1105 -30% | 1564 -1% | 859 -45% | 1183 -25% | 2302 46% | 1631 3% |
| Write 4K Q32T1 (MB/s) | 365.4 | 304 -17% | 490.3 34% | 237.4 -35% | 95.8 -74% | 445.3 22% | 418.5 15% | 237 -35% |
| Read 4K Q32T1 (MB/s) | 504 | 329 -35% | 309.2 -39% | 340.7 -32% | 197.6 -61% | 477.7 -5% | 517 3% | 337.1 -33% |
| Write Seq Q32T1 (MB/s) | 1493 | 529 -65% | 1053 -29% | 959 -36% | 132.5 -91% | 1063 -29% | 3008 101% | 963 -35% |
| Read Seq Q32T1 (MB/s) | 2340 | 561 -76% | 2261 -3% | 1732 -26% | 1208 -48% | 2154 -8% | 3568 52% | 1863 -20% |
| AS SSD | -32% | -2% | -1% | -62% | -2% | 70% | -36% | |
| Seq Read (MB/s) | 2048 | 524 -74% | 1348 -34% | 1019 -50% | 1022 -50% | 1504 -27% | 2730 33% | 1623 -21% |
| Seq Write (MB/s) | 1039 | 495 -52% | 1000 -4% | 889 -14% | 117 -89% | 1064 2% | 2513 142% | 891 -14% |
| 4K Read (MB/s) | 52.8 | 38.93 -26% | 48.04 -9% | 48.22 -9% | 30.03 -43% | 51.5 -2% | 61.4 16% | 48.06 -9% |
| 4K Write (MB/s) | 146 | 87.3 -40% | 103.3 -29% | 115.5 -21% | 65.1 -55% | 123.2 -16% | 156.1 7% | 102.1 -30% |
| 4K-64 Read (MB/s) | 1285 | 380 -70% | 755 -41% | 321.5 -75% | 181.4 -86% | 703 -45% | 1780 39% | 325.6 -75% |
| 4K-64 Write (MB/s) | 758 | 335.7 -56% | 749 -1% | 787 4% | 87.1 -89% | 730 -4% | 1920 153% | 94.1 -88% |
| Access Time Read * (ms) | 0.155 | 0.073 53% | 0.061 61% | 0.065 58% | 0.152 2% | 0.064 59% | 0.063 59% | 0.171 -10% |
| Access Time Write * (ms) | 0.202 | 0.039 81% | 0.036 82% | 0.047 77% | 0.25 -24% | 0.031 85% | 0.025 88% | 0.048 76% |
| Score Read (Points) | 1543 | 471 -69% | 938 -39% | 472 -69% | 314 -80% | 905 -41% | 2114 37% | 536 -65% |
| Score Write (Points) | 1008 | 472 -53% | 952 -6% | 992 -2% | 164 -84% | 960 -5% | 2327 131% | 285 -72% |
| Score Total (Points) | 3298 | 1198 -64% | 2365 -28% | 1717 -48% | 604 -82% | 2321 -30% | 5518 67% | 1077 -67% |
| Copy ISO MB/s (MB/s) | 691 | 500 -28% | 749 8% | 942 36% | 566 -18% | |||
| Copy Program MB/s (MB/s) | 345.8 | 283.8 -18% | 342.5 -1% | 444.5 29% | 223.8 -35% | |||
| Copy Game MB/s (MB/s) | 517 | 319.6 -38% | 571 10% | 867 68% | 104.3 -80% | |||
| Total Average (Program / Settings) | -37% /
-36% | -5% /
-4% | -7% /
-5% | -61% /
-61% | -7% /
-6% | 56% /
58% | -24% /
-27% |
* ... smaller is better
Continuous load read: DiskSpd Read Loop, Queue Depth 8
| 3DMark 11 Performance | 12463 points | |
| 3DMark Cloud Gate Standard Score | 30251 points | |
| 3DMark Fire Strike Score | 8985 points | |
| 3DMark Time Spy Score | 3765 points | |
Help | ||
| 3DMark 11 - 1280x720 Performance GPU | |
| MSI Bravo 15 A4DCR | |
| Acer Nitro 5 AN515-44-R5FT | |
| Asus TUF FX505DT-EB73 | |
| Dell G5 15 5590-PCNJJ | |
| HP Pavilion Gaming 15-ec1206ng | |
| Lenovo IdeaPad Gaming 3i 15IMH05 | |
| Nexoc GH5 515IG | |
| HP Pavilion Gaming 15-ec0002ng | |
| 3DMark | |
| 1280x720 Cloud Gate Standard Graphics | |
| Lenovo IdeaPad Gaming 3i 15IMH05 | |
| Nexoc GH5 515IG | |
| Dell G5 15 5590-PCNJJ | |
| MSI Bravo 15 A4DCR | |
| HP Pavilion Gaming 15-ec1206ng | |
| Acer Nitro 5 AN515-44-R5FT | |
| Asus TUF FX505DT-EB73 | |
| HP Pavilion Gaming 15-ec0002ng | |
| 1920x1080 Fire Strike Graphics | |
| MSI Bravo 15 A4DCR | |
| Acer Nitro 5 AN515-44-R5FT | |
| HP Pavilion Gaming 15-ec1206ng | |
| Lenovo IdeaPad Gaming 3i 15IMH05 | |
| Asus TUF FX505DT-EB73 | |
| Nexoc GH5 515IG | |
| Dell G5 15 5590-PCNJJ | |
| HP Pavilion Gaming 15-ec0002ng | |
| 2560x1440 Time Spy Graphics | |
| Acer Nitro 5 AN515-44-R5FT | |
| Asus TUF FX505DT-EB73 | |
| MSI Bravo 15 A4DCR | |
| HP Pavilion Gaming 15-ec1206ng | |
| Dell G5 15 5590-PCNJJ | |
| Lenovo IdeaPad Gaming 3i 15IMH05 | |
| Nexoc GH5 515IG | |
| HP Pavilion Gaming 15-ec0002ng | |
| The Witcher 3 - 1920x1080 High Graphics & Postprocessing (Nvidia HairWorks Off) | |
| HP Pavilion Gaming 15-ec1206ng | |
| Acer Nitro 5 AN515-44-R5FT | |
| Nexoc GH5 515IG | |
| Lenovo IdeaPad Gaming 3i 15IMH05 | |
| Asus TUF FX505DT-EB73 | |
| MSI Bravo 15 A4DCR | |
| Dell G5 15 5590-PCNJJ | |
| HP Pavilion Gaming 15-ec0002ng | |
| BioShock Infinite - 1920x1080 Ultra Preset, DX11 (DDOF) | |
| Lenovo IdeaPad Gaming 3i 15IMH05 | |
| Nexoc GH5 515IG | |
| HP Pavilion Gaming 15-ec1206ng | |
| Dell G5 15 5590-PCNJJ | |
| Asus TUF FX505DT-EB73 | |
| HP Pavilion Gaming 15-ec0002ng | |
| Shadow of the Tomb Raider - 1920x1080 Highest Preset AA:T | |
| Acer Nitro 5 AN515-44-R5FT | |
| Lenovo IdeaPad Gaming 3i 15IMH05 | |
| HP Pavilion Gaming 15-ec1206ng | |
| Nexoc GH5 515IG | |
| Dell G5 15 5590-PCNJJ | |
| Asus TUF FX505DT-EB73 | |
| MSI Bravo 15 A4DCR | |
| HP Pavilion Gaming 15-ec0002ng | |
| Call of Duty Modern Warfare 2019 - 1920x1080 Maximum Settings AA:T2X Filmic SM | |
| Acer Nitro 5 AN515-44-R5FT | |
| MSI Bravo 15 A4DCR | |
| Lenovo IdeaPad Gaming 3i 15IMH05 | |
| HP Pavilion Gaming 15-ec1206ng | |
| Nexoc GH5 515IG | |
| HP Pavilion Gaming 15-ec0002ng | |
| Doom Eternal - 1920x1080 High Preset | |
| Lenovo IdeaPad Gaming 3i 15IMH05 | |
| HP Pavilion Gaming 15-ec1206ng | |
| Nexoc GH5 515IG | |
| MSI Bravo 15 A4DCR | |
| F1 2020 - 1920x1080 Ultra High Preset AA:T AF:16x | |
| HP Pavilion Gaming 15-ec1206ng | |
| Nexoc GH5 515IG | |
| Death Stranding - 1920x1080 Very High Preset | |
| HP Pavilion Gaming 15-ec1206ng | |
| Nexoc GH5 515IG | |
| Horizon Zero Dawn - 1920x1080 Favor Quality | |
| Nexoc GH5 515IG | |
| HP Pavilion Gaming 15-ec1206ng | |
| low | med. | high | ultra | |
|---|---|---|---|---|
| BioShock Infinite (2013) | 251.9 | 213.5 | 195.4 | 92.6 |
| The Witcher 3 (2015) | 189.4 | 118.5 | 68.9 | 39.8 |
| Shadow of the Tomb Raider (2018) | 95 | 62 | 52 | 45 |
| Total War: Three Kingdoms (2019) | 162.9 | 65.5 | 39.9 | 26.6 |
| Call of Duty Modern Warfare 2019 (2019) | 98.3 | 58.1 | 51.4 | 44.6 |
| Doom Eternal (2020) | 118.9 | 78.6 | 62.9 | |
| Gears Tactics (2020) | 161.6 | 100.4 | 66.4 | 43.6 |
| F1 2020 (2020) | 185 | 104 | 83 | 58 |
| Death Stranding (2020) | 105.6 | 64.2 | 60.4 | 57.8 |
| Horizon Zero Dawn (2020) | 84 | 52 | 44 | 34 |
Noise level
| Idle |
| 25 / 26 / 33 dB(A) |
| Load |
| 41 / 47 dB(A) |
 | ||
30 dB silent 40 dB(A) audible 50 dB(A) loud |
||
min: | ||
| HP Pavilion Gaming 15-ec1206ng R5 4600H, GeForce GTX 1650 Mobile | Nexoc GH5 515IG i5-10300H, GeForce GTX 1650 Mobile | Lenovo IdeaPad Gaming 3i 15IMH05 i5-10300H, GeForce GTX 1650 Mobile | Asus TUF FX505DT-EB73 R7 3750H, GeForce GTX 1650 Mobile | Dell G5 15 5590-PCNJJ i5-9300H, GeForce GTX 1650 Mobile | Acer Nitro 5 AN515-44-R5FT R5 4600H, GeForce GTX 1650 Ti Mobile | MSI Bravo 15 A4DCR R7 4800H, Radeon RX 5300M | HP Pavilion Gaming 15-ec0002ng R5 3550H, GeForce GTX 1050 Mobile | |
|---|---|---|---|---|---|---|---|---|
| Noise | -12% | -15% | -8% | -18% | -15% | -20% | -7% | |
| off / environment * (dB) | 25 | 25 -0% | 30.7 -23% | 28.2 -13% | 30 -20% | 30 -20% | 30 -20% | 30.3 -21% |
| Idle Minimum * (dB) | 25 | 25 -0% | 30.7 -23% | 28.2 -13% | 31 -24% | 30 -20% | 31 -24% | 30.3 -21% |
| Idle Average * (dB) | 26 | 31 -19% | 30.7 -18% | 28.2 -8% | 32 -23% | 32 -23% | 32 -23% | 30.3 -17% |
| Idle Maximum * (dB) | 33 | 33 -0% | 30.7 7% | 31.4 5% | 35 -6% | 34 -3% | 40 -21% | 31 6% |
| Load Average * (dB) | 41 | 53 -29% | 49.7 -21% | 39.8 3% | 49 -20% | 46 -12% | 48 -17% | 39.3 4% |
| Witcher 3 ultra * (dB) | 39 | 48 -23% | 47 -21% | 47 -21% | 47 -21% | 47 -21% | 48 -23% | 42.9 -10% |
| Load Maximum * (dB) | 47 | 53 -13% | 50.3 -7% | 50.2 -7% | 53 -13% | 49 -4% | 54 -15% | 43.3 8% |
* ... smaller is better
(-) The maximum temperature on the upper side is 49 °C / 120 F, compared to the average of 40.4 °C / 105 F, ranging from 21.2 to 68.8 °C for the class Gaming.
(-) The bottom heats up to a maximum of 49 °C / 120 F, compared to the average of 43.2 °C / 110 F
(+) In idle usage, the average temperature for the upper side is 27.7 °C / 82 F, compared to the device average of 33.9 °C / 93 F.
(-) Playing The Witcher 3, the average temperature for the upper side is 40.7 °C / 105 F, compared to the device average of 33.9 °C / 93 F.
(-) The palmrests and touchpad can get very hot to the touch with a maximum of 40 °C / 104 F.
(-) The average temperature of the palmrest area of similar devices was 28.8 °C / 83.8 F (-11.2 °C / -20.2 F).
| HP Pavilion Gaming 15-ec1206ng R5 4600H, GeForce GTX 1650 Mobile | Nexoc GH5 515IG i5-10300H, GeForce GTX 1650 Mobile | Lenovo IdeaPad Gaming 3i 15IMH05 i5-10300H, GeForce GTX 1650 Mobile | Asus TUF FX505DT-EB73 R7 3750H, GeForce GTX 1650 Mobile | Dell G5 15 5590-PCNJJ i5-9300H, GeForce GTX 1650 Mobile | Acer Nitro 5 AN515-44-R5FT R5 4600H, GeForce GTX 1650 Ti Mobile | MSI Bravo 15 A4DCR R7 4800H, Radeon RX 5300M | HP Pavilion Gaming 15-ec0002ng R5 3550H, GeForce GTX 1050 Mobile | |
|---|---|---|---|---|---|---|---|---|
| Heat | 2% | 4% | -2% | 2% | 0% | -5% | 13% | |
| Maximum Upper Side * (°C) | 49 | 48 2% | 43 12% | 41.2 16% | 49 -0% | 49 -0% | 51 -4% | 41 16% |
| Maximum Bottom * (°C) | 49 | 47 4% | 50.6 -3% | 40 18% | 55 -12% | 50 -2% | 50 -2% | 39.1 20% |
| Idle Upper Side * (°C) | 29 | 28 3% | 27.2 6% | 34.6 -19% | 25 14% | 28 3% | 30 -3% | 26 10% |
| Idle Bottom * (°C) | 28 | 28 -0% | 27.5 2% | 34.4 -23% | 26 7% | 28 -0% | 31 -11% | 26.5 5% |
* ... smaller is better
HP Pavilion Gaming 15-ec1206ng audio analysis
(±) | speaker loudness is average but good (79 dB)
Bass 100 - 315 Hz
(-) | nearly no bass - on average 17.3% lower than median
(±) | linearity of bass is average (12.1% delta to prev. frequency)
Mids 400 - 2000 Hz
(+) | balanced mids - only 4.1% away from median
(+) | mids are linear (4% delta to prev. frequency)
Highs 2 - 16 kHz
(+) | balanced highs - only 3.9% away from median
(+) | highs are linear (5.7% delta to prev. frequency)
Overall 100 - 16.000 Hz
(±) | linearity of overall sound is average (17.9% difference to median)
Compared to same class
» 55% of all tested devices in this class were better, 9% similar, 36% worse
» The best had a delta of 6%, average was 18%, worst was 132%
Compared to all devices tested
» 37% of all tested devices were better, 8% similar, 55% worse
» The best had a delta of 4%, average was 23%, worst was 134%
| Off / Standby | |
| Idle | |
| Load |
|
Key:
min: | |
| HP Pavilion Gaming 15-ec1206ng R5 4600H, GeForce GTX 1650 Mobile | Nexoc GH5 515IG i5-10300H, GeForce GTX 1650 Mobile | Lenovo IdeaPad Gaming 3i 15IMH05 i5-10300H, GeForce GTX 1650 Mobile | Asus TUF FX505DT-EB73 R7 3750H, GeForce GTX 1650 Mobile | Dell G5 15 5590-PCNJJ i5-9300H, GeForce GTX 1650 Mobile | Acer Nitro 5 AN515-44-R5FT R5 4600H, GeForce GTX 1650 Ti Mobile | MSI Bravo 15 A4DCR R7 4800H, Radeon RX 5300M | HP Pavilion Gaming 15-ec0002ng R5 3550H, GeForce GTX 1050 Mobile | |
|---|---|---|---|---|---|---|---|---|
| Power Consumption | -22% | -51% | -55% | -26% | -30% | -125% | 3% | |
| Idle Minimum * (Watt) | 2 | 3 -50% | 5.1 -155% | 7 -250% | 4 -100% | 5 -150% | 11 -450% | 1.9 5% |
| Idle Average * (Watt) | 6 | 7 -17% | 8.2 -37% | 9.9 -65% | 7 -17% | 8 -33% | 14 -133% | 7.2 -20% |
| Idle Maximum * (Watt) | 11 | 16 -45% | 10.6 4% | 12 -9% | 12 -9% | 13 -18% | 25 -127% | 9.6 13% |
| Load Average * (Watt) | 77 | 85 -10% | 128 -66% | 68.4 11% | 95 -23% | 69 10% | 72 6% | 74 4% |
| Witcher 3 ultra * (Watt) | 76 | 86 -13% | 109 -43% | 94.9 -25% | 86 -13% | 78 -3% | 100 -32% | 75 1% |
| Load Maximum * (Watt) | 142 | 134 6% | 150 -6% | 130.9 8% | 135 5% | 124 13% | 163 -15% | 124 13% |
* ... smaller is better
| HP Pavilion Gaming 15-ec1206ng R5 4600H, GeForce GTX 1650 Mobile, 52.5 Wh | Nexoc GH5 515IG i5-10300H, GeForce GTX 1650 Mobile, 48.96 Wh | Lenovo IdeaPad Gaming 3i 15IMH05 i5-10300H, GeForce GTX 1650 Mobile, 45 Wh | Asus TUF FX505DT-EB73 R7 3750H, GeForce GTX 1650 Mobile, 48 Wh | Dell G5 15 5590-PCNJJ i5-9300H, GeForce GTX 1650 Mobile, 60 Wh | Acer Nitro 5 AN515-44-R5FT R5 4600H, GeForce GTX 1650 Ti Mobile, 57.48 Wh | MSI Bravo 15 A4DCR R7 4800H, Radeon RX 5300M, 51 Wh | HP Pavilion Gaming 15-ec0002ng R5 3550H, GeForce GTX 1050 Mobile, 52.5 Wh | |
|---|---|---|---|---|---|---|---|---|
| Battery runtime | -18% | -5% | -19% | 28% | 2% | -42% | -8% | |
| Reader / Idle (h) | 19.4 | 14.9 -23% | 12.4 -36% | 7.8 -60% | 14.5 -25% | 13.8 -29% | 7 -64% | |
| H.264 (h) | 10.9 | 6.5 -40% | 7.3 -33% | |||||
| WiFi v1.3 (h) | 9.1 | 6.4 -30% | 6.3 -31% | 4.8 -47% | 8 -12% | 8.7 -4% | 4.5 -51% | 8.4 -8% |
| Load (h) | 1 | 1.2 20% | 1.8 80% | 1.5 50% | 2.2 120% | 1.4 40% | 0.9 -10% |
Pros
Cons
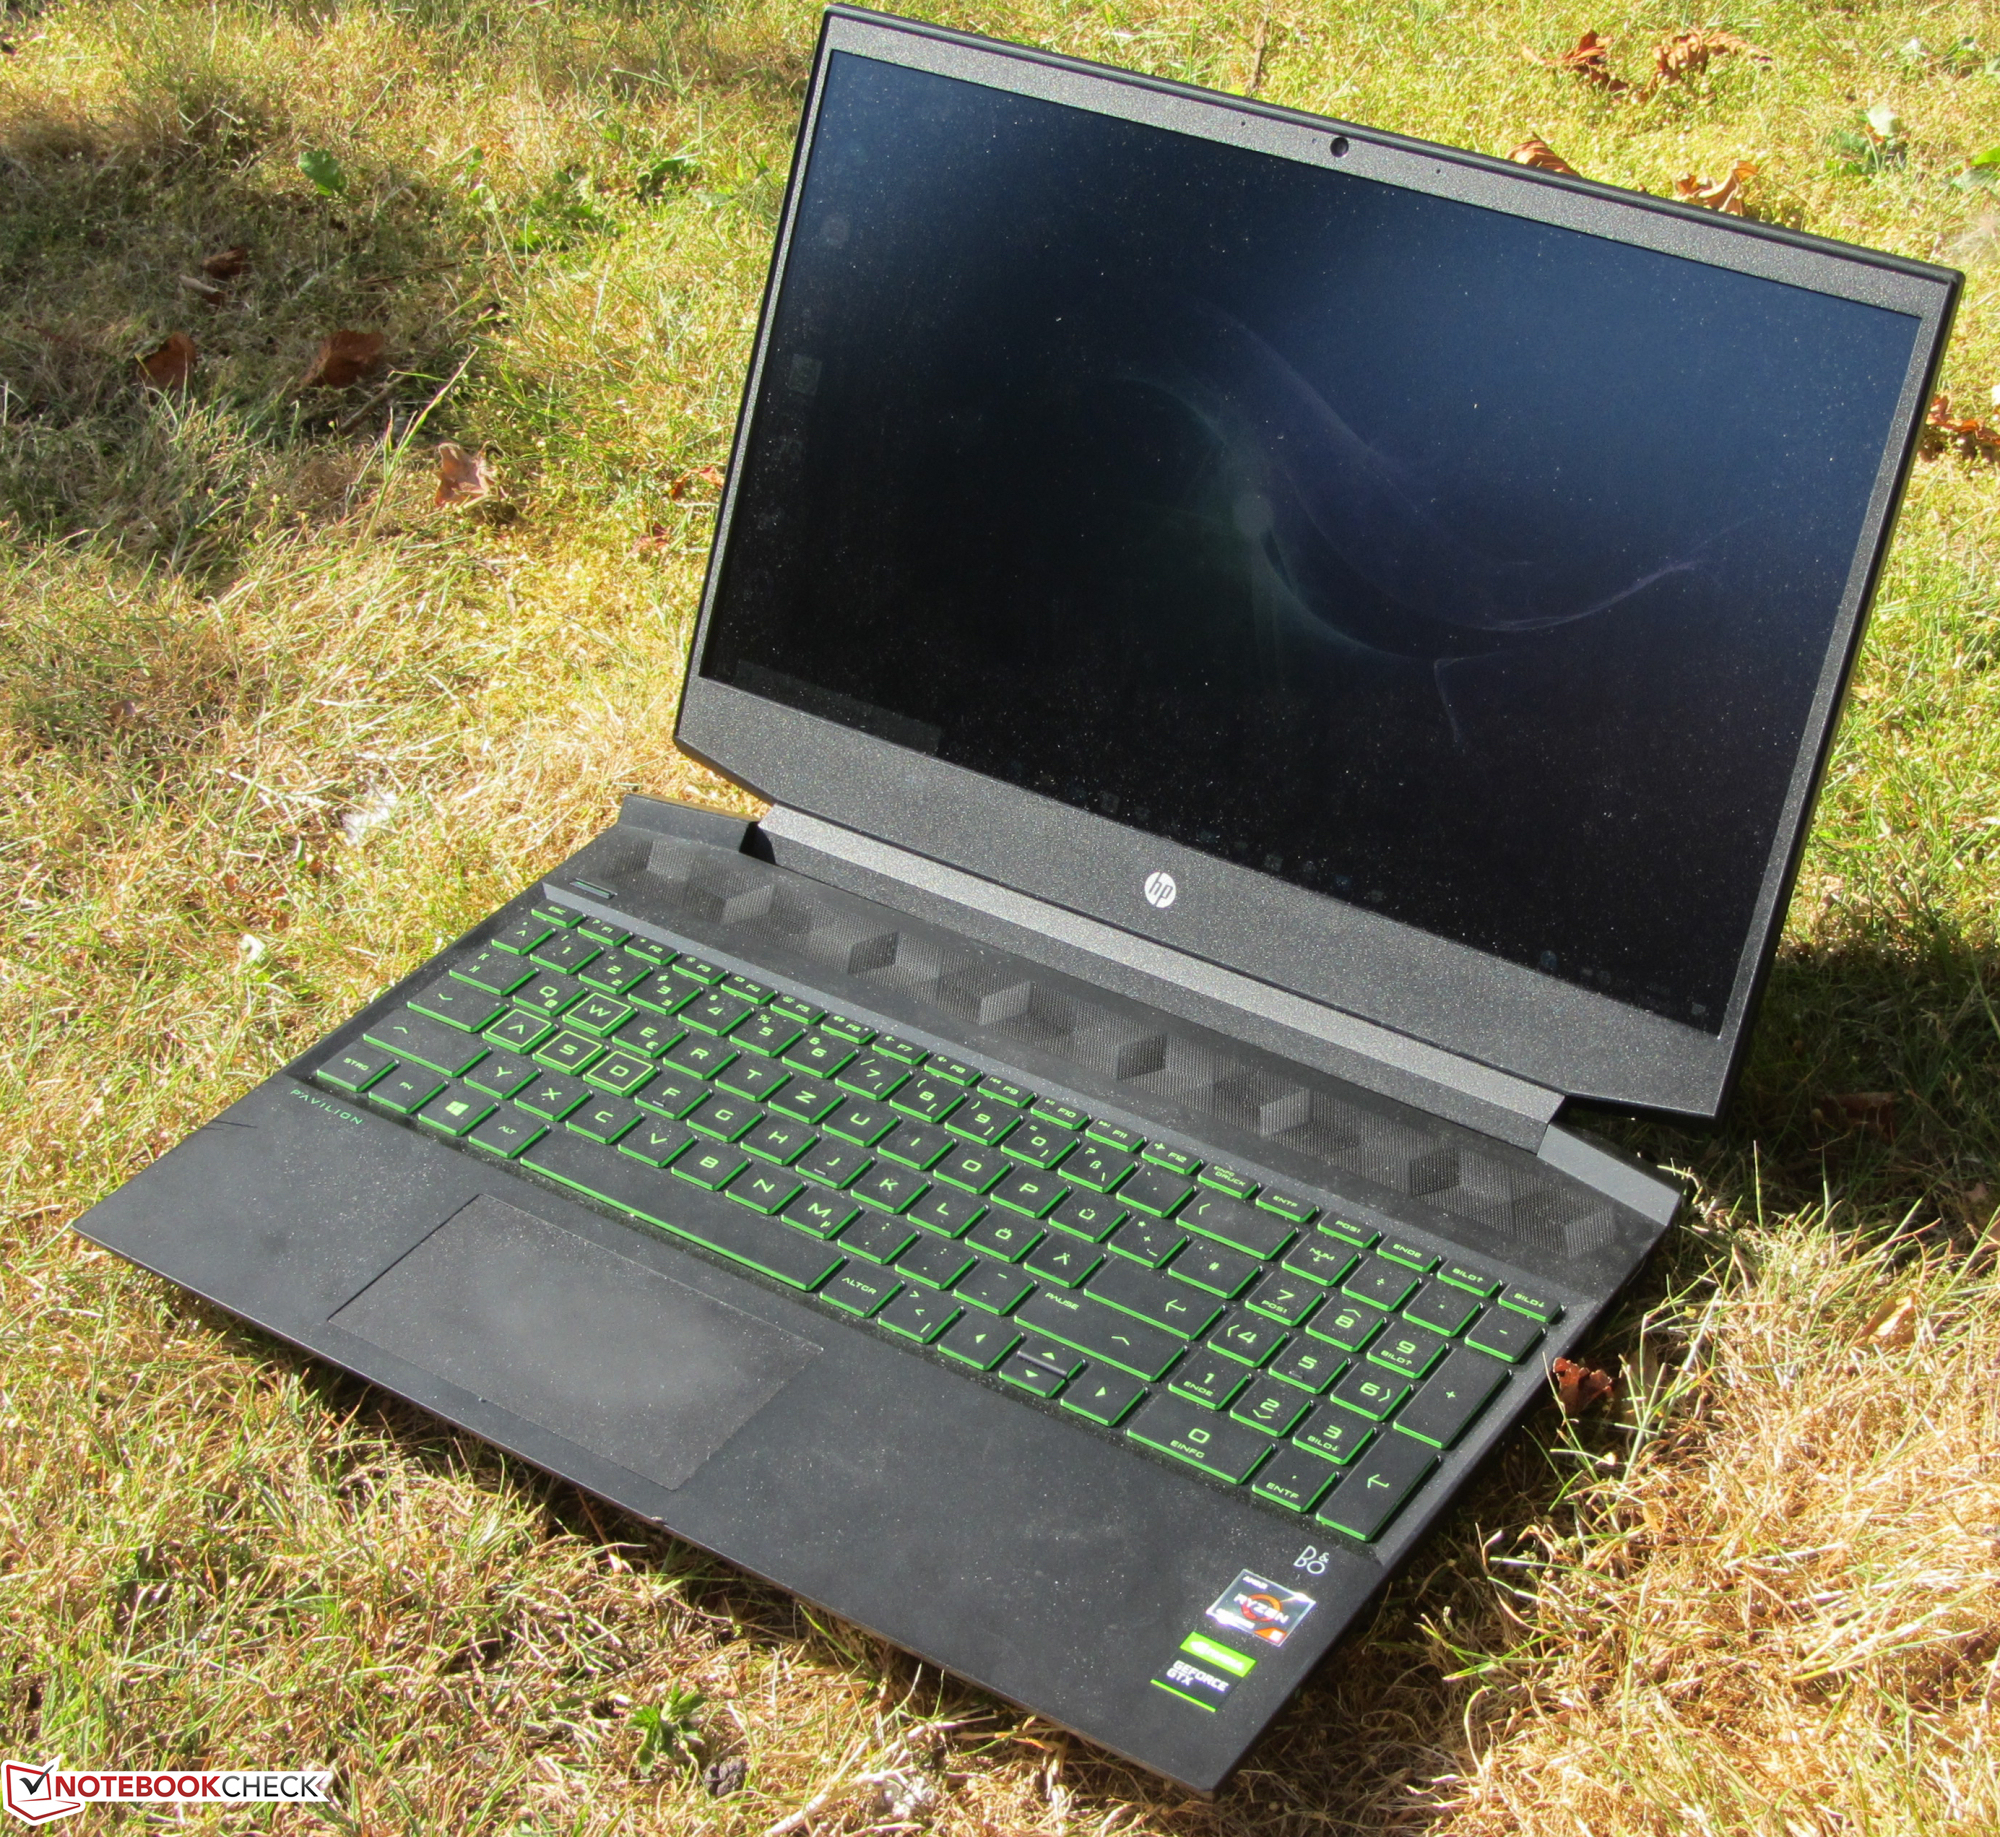
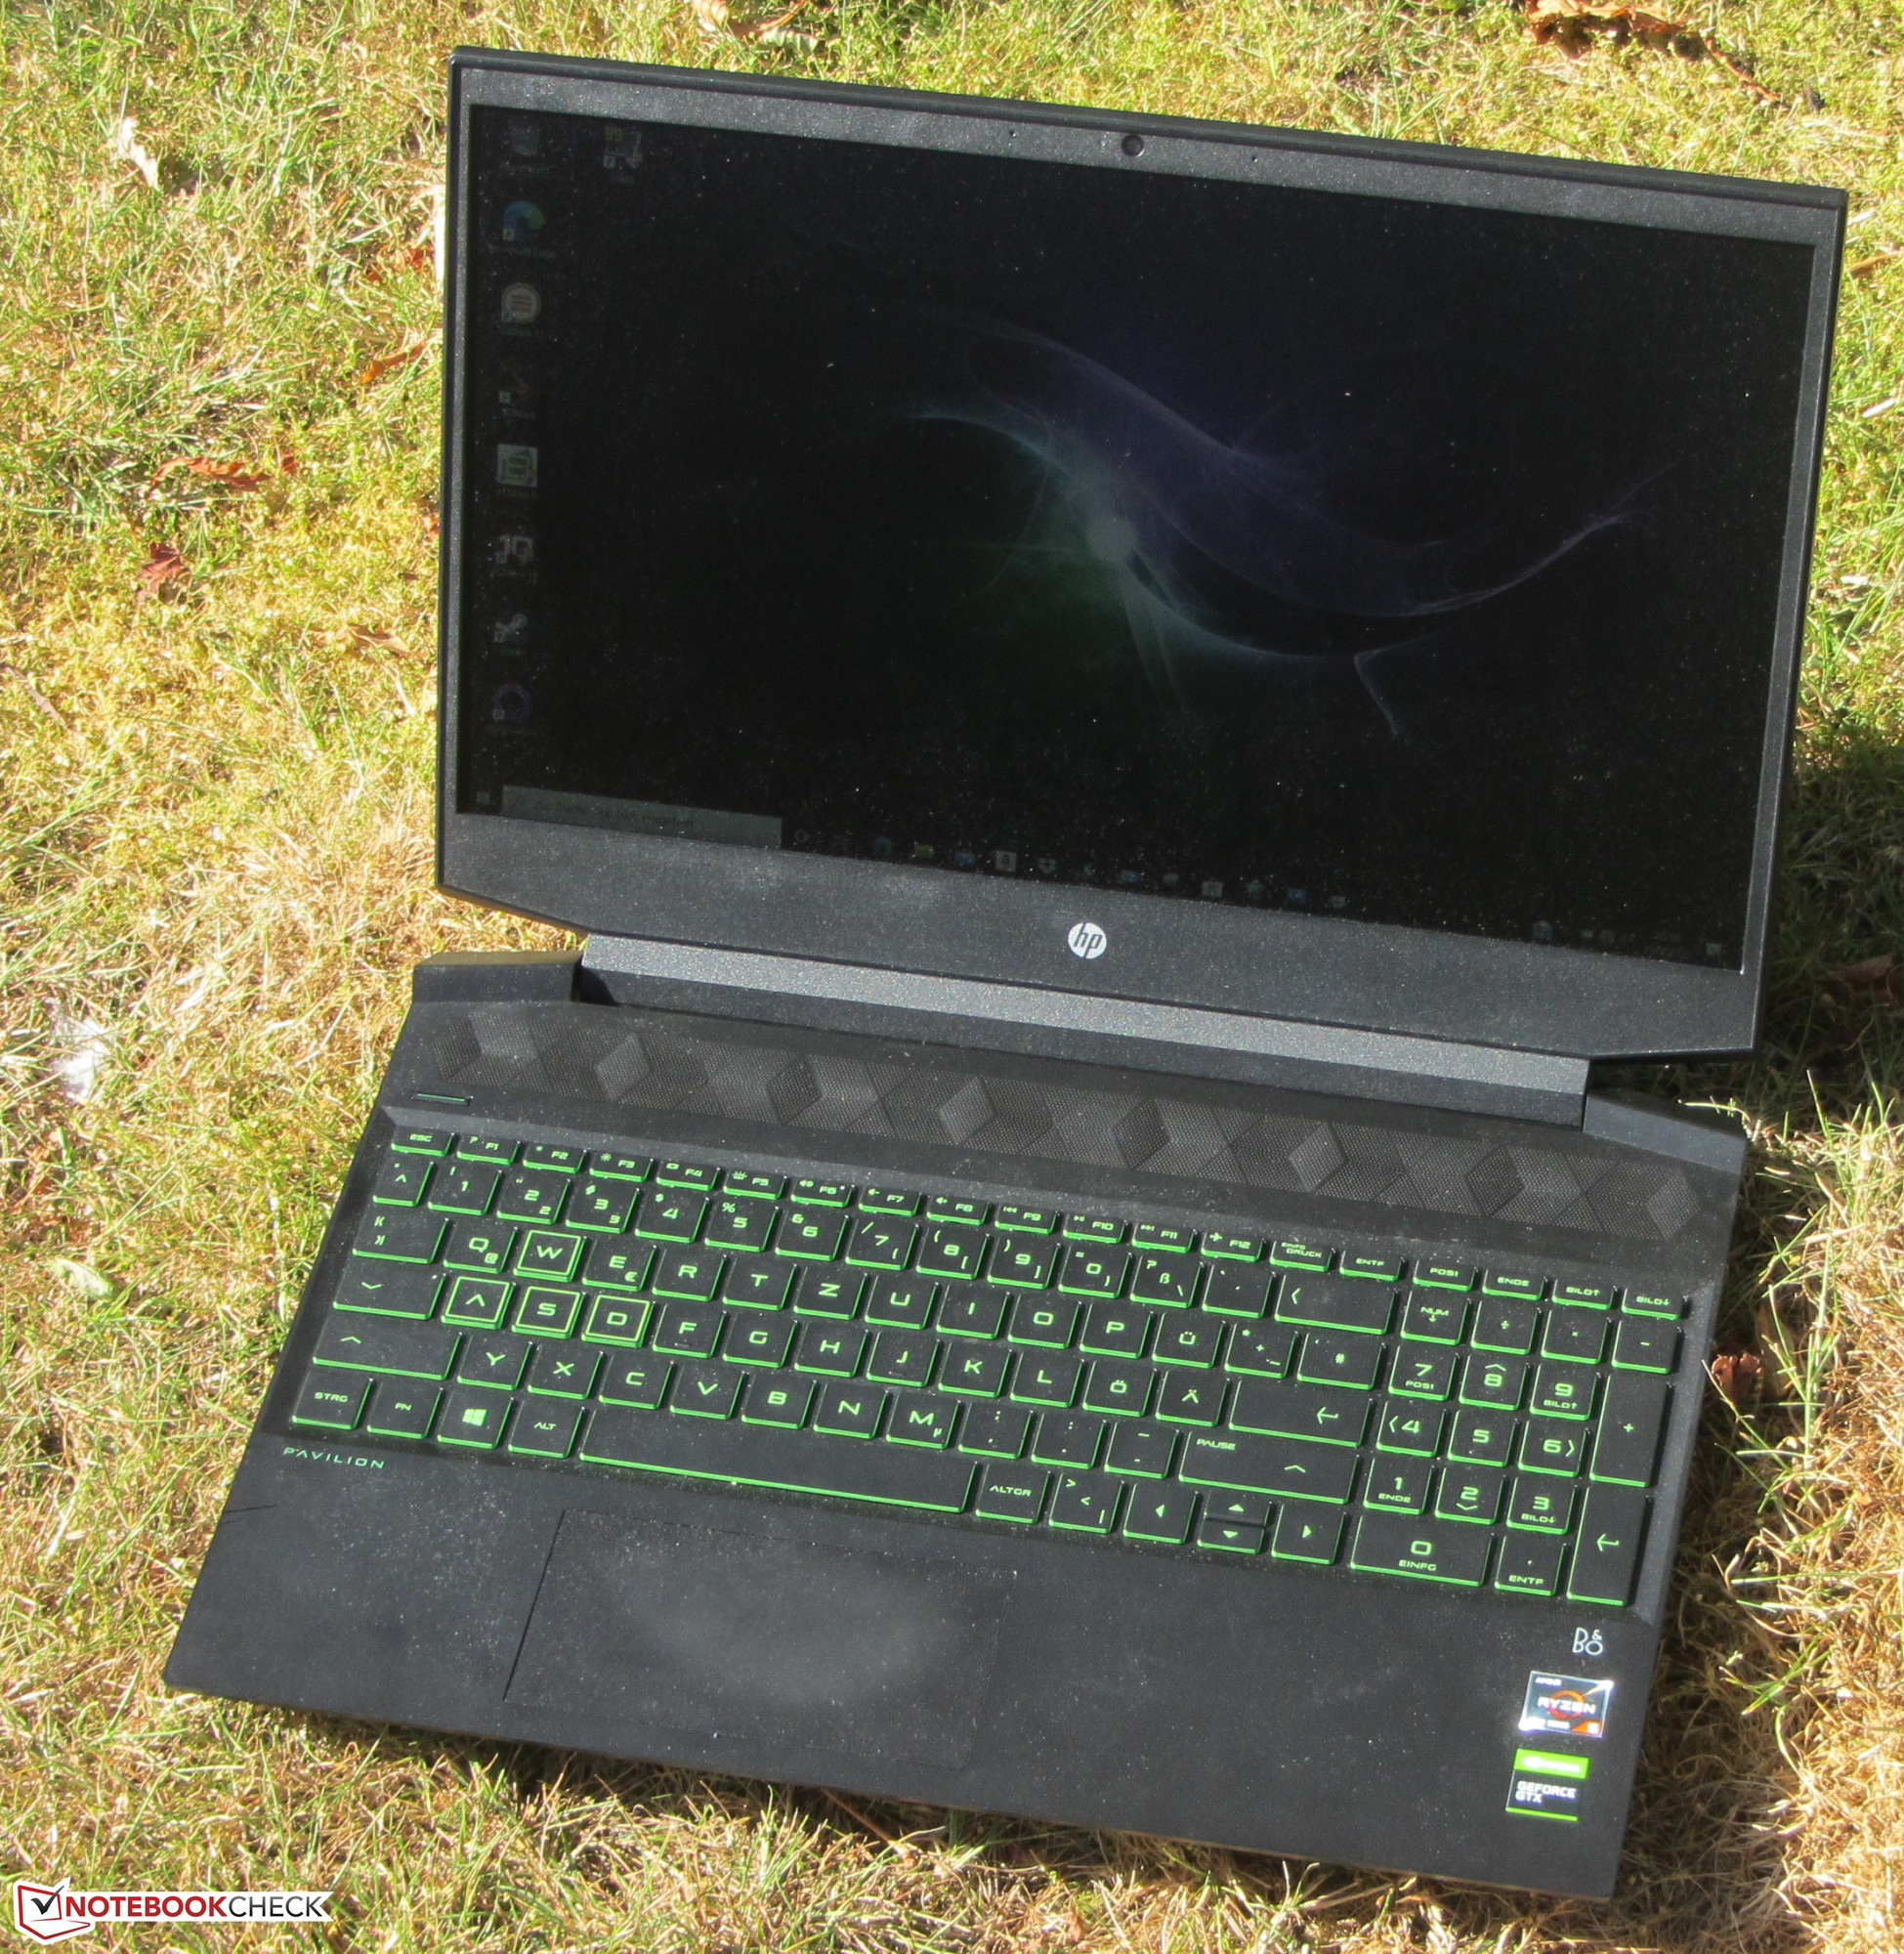
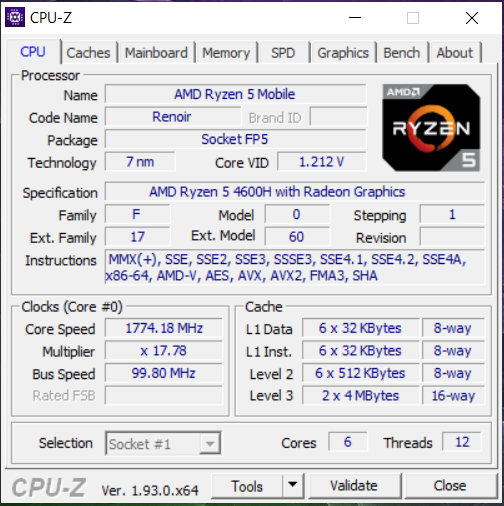
价格略低于800欧元(约合947美元),Pavilion 15-ec1206ng属于廉价游戏笔记本电脑类别。该设备完成了应做的事情:它可以流畅运行现代游戏。但是,不应期望由Ryzen 5 4600H和GeForce GTX 1650组成的内置硬件组合提供最高的分辨率和画质。
通过Pavilion Gaming 15-ec1206ng,惠普以诱人的价格提供了一款功能全面的游戏笔记本电脑。
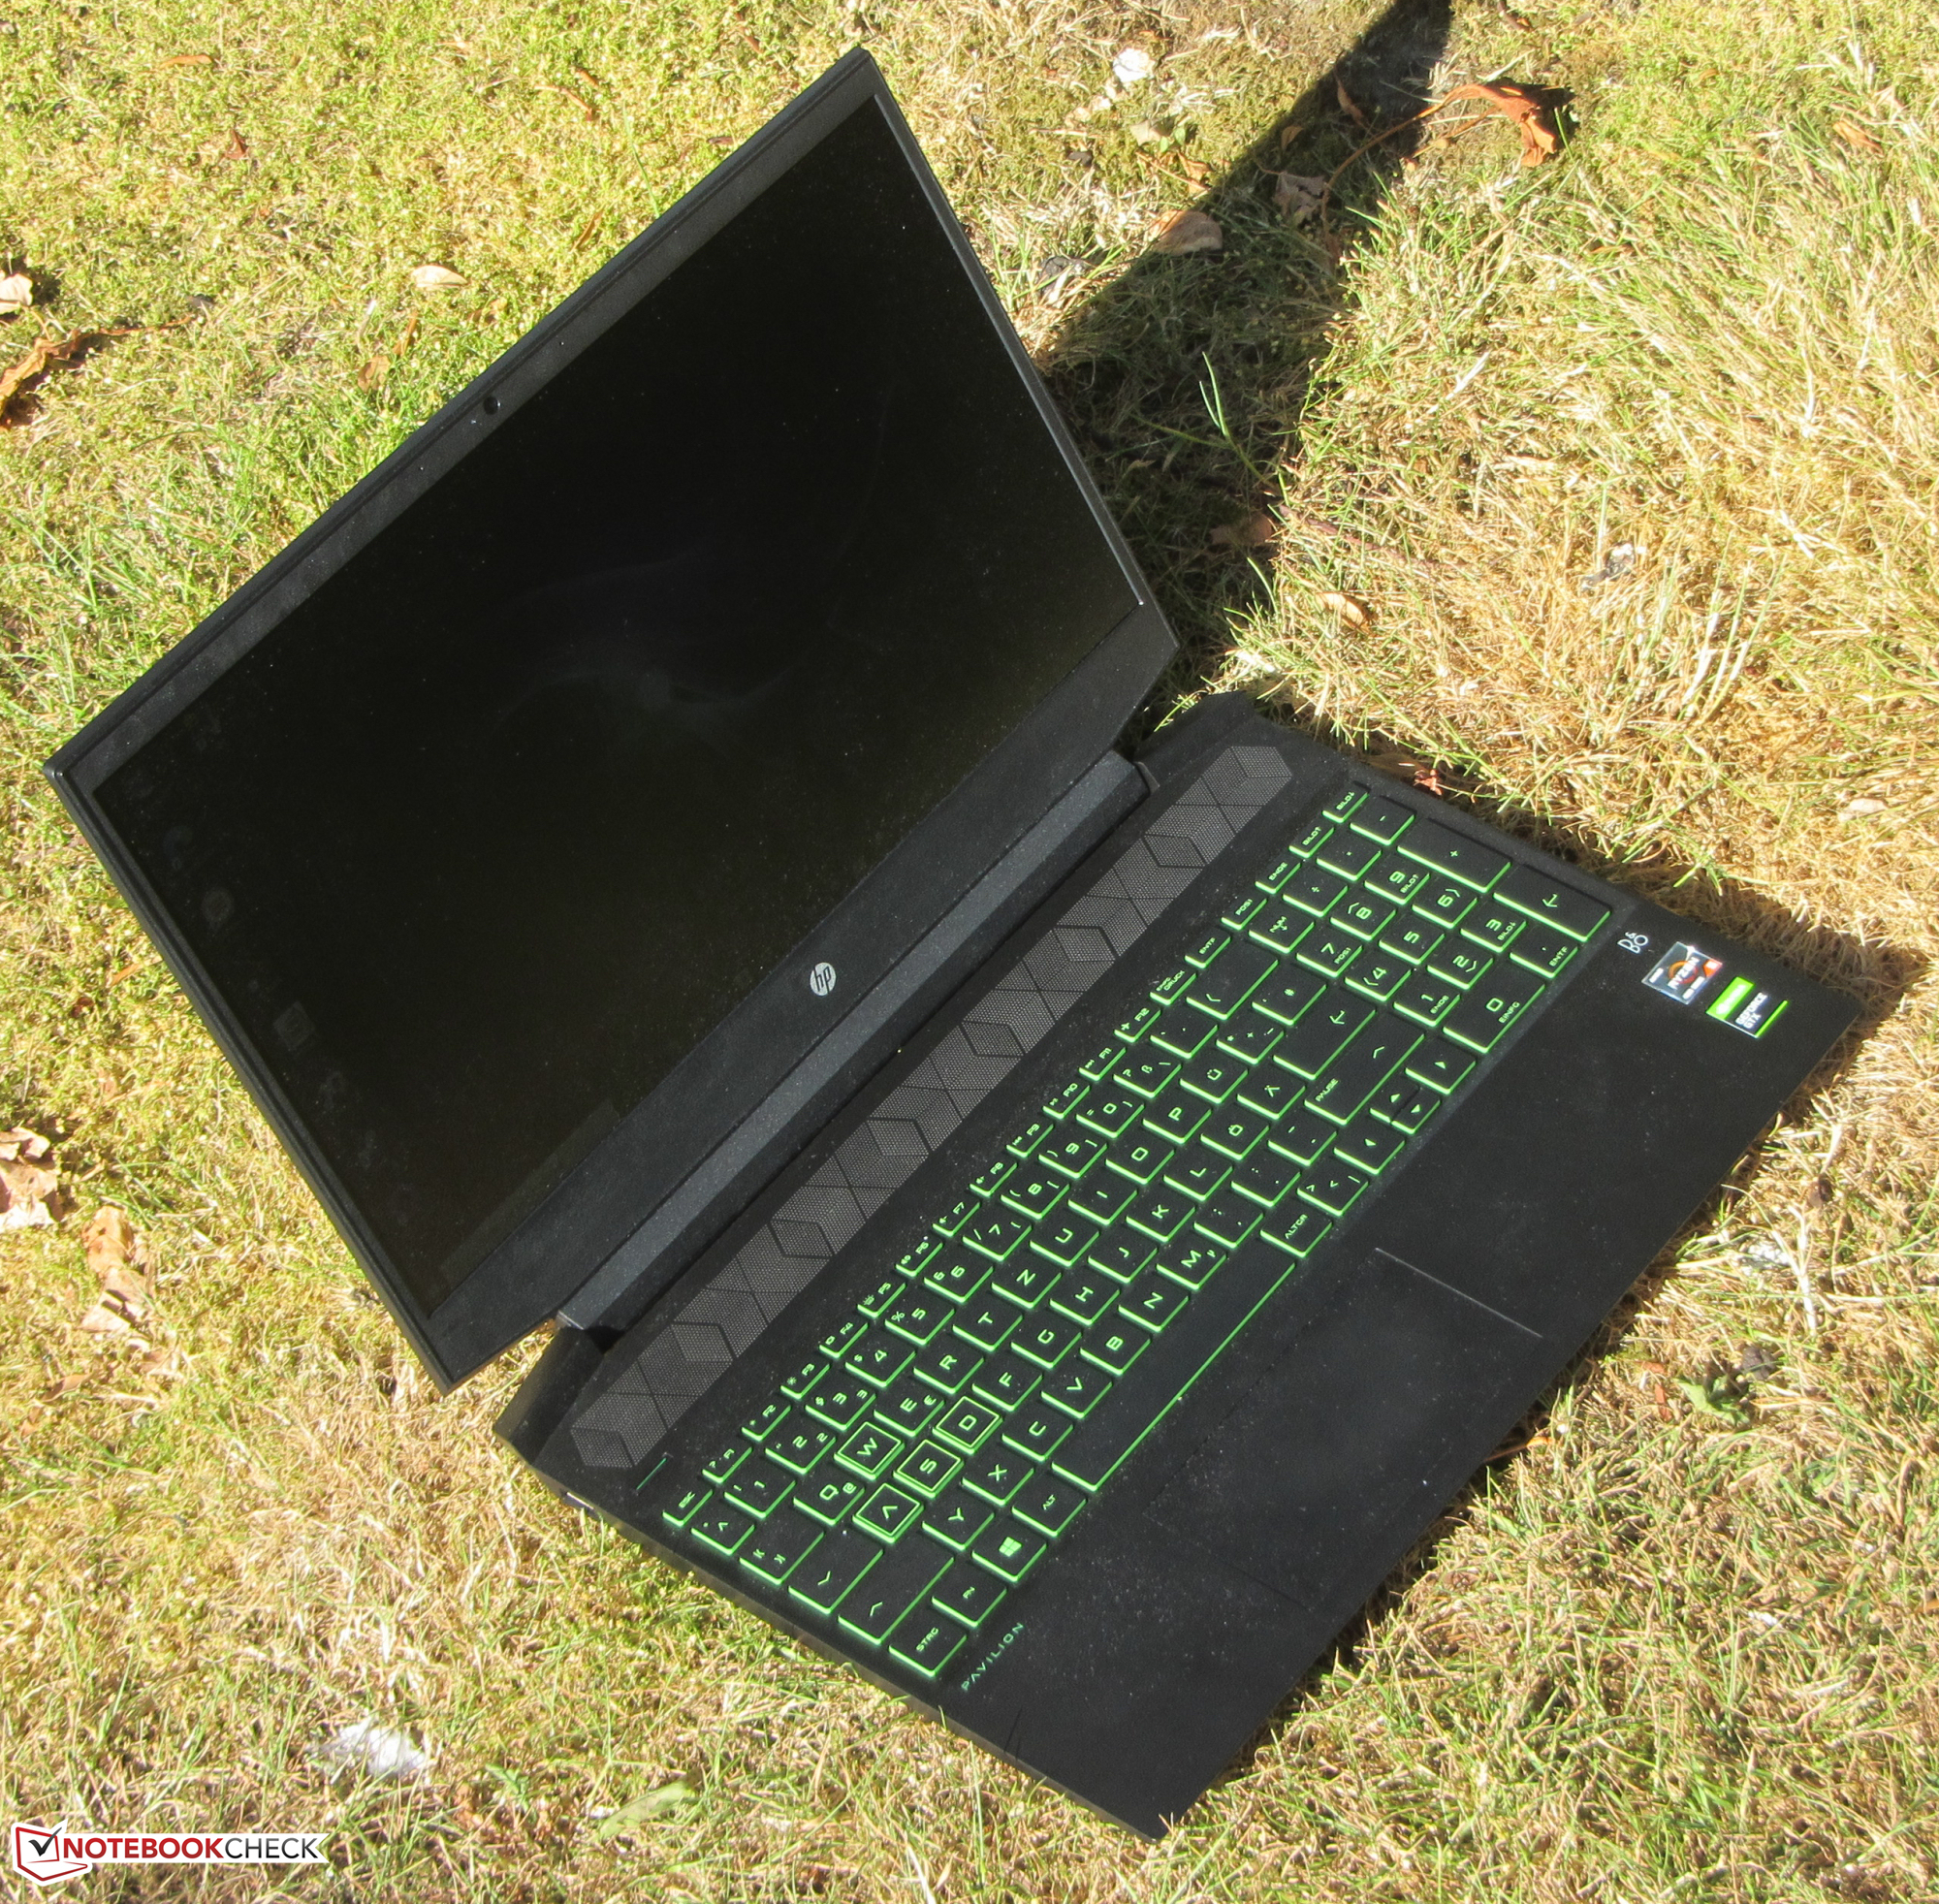
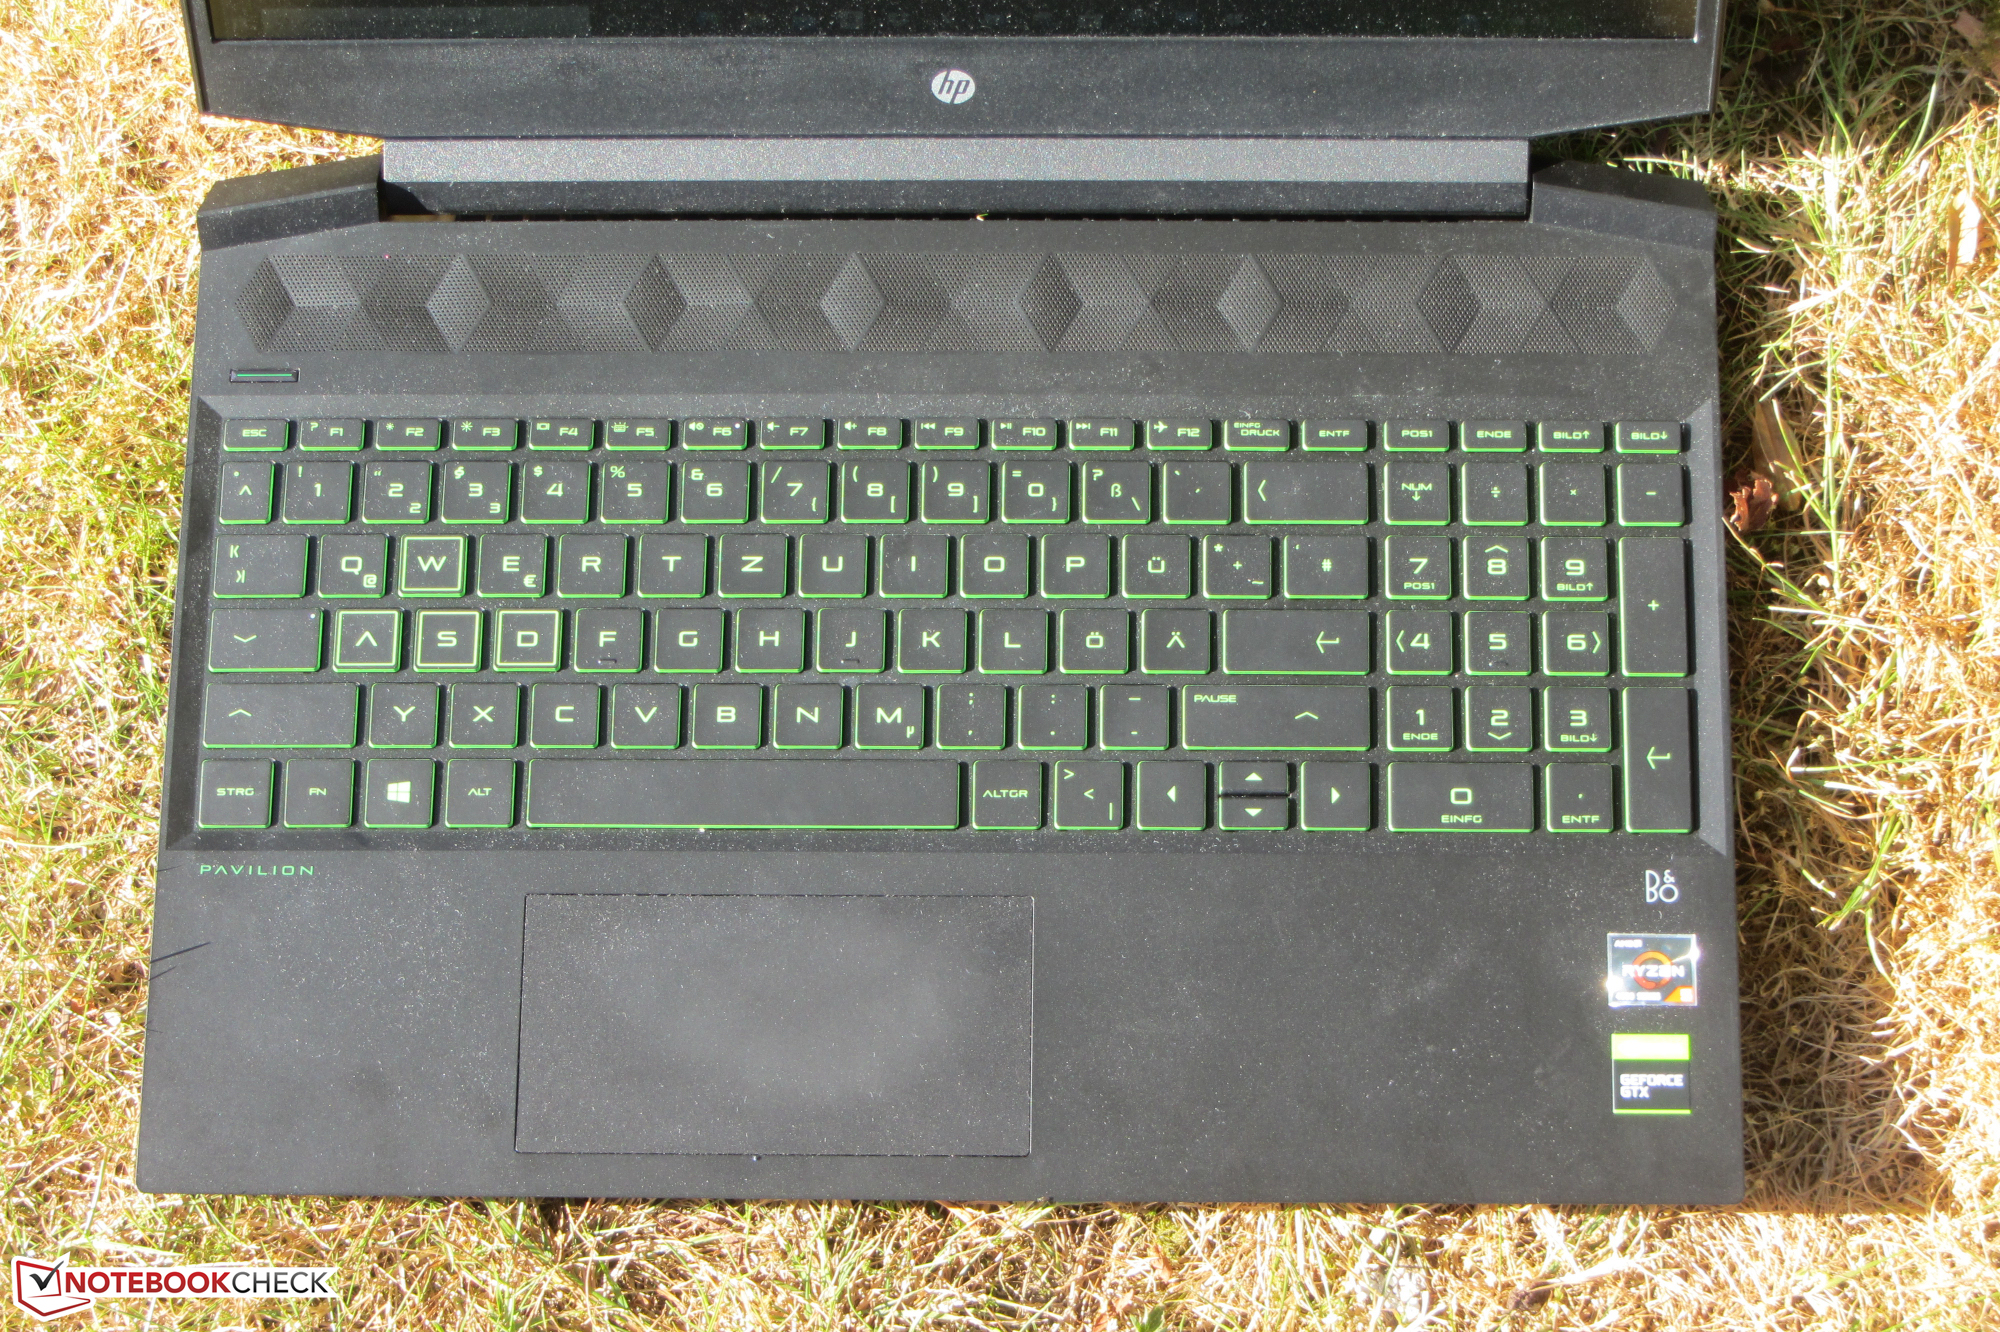
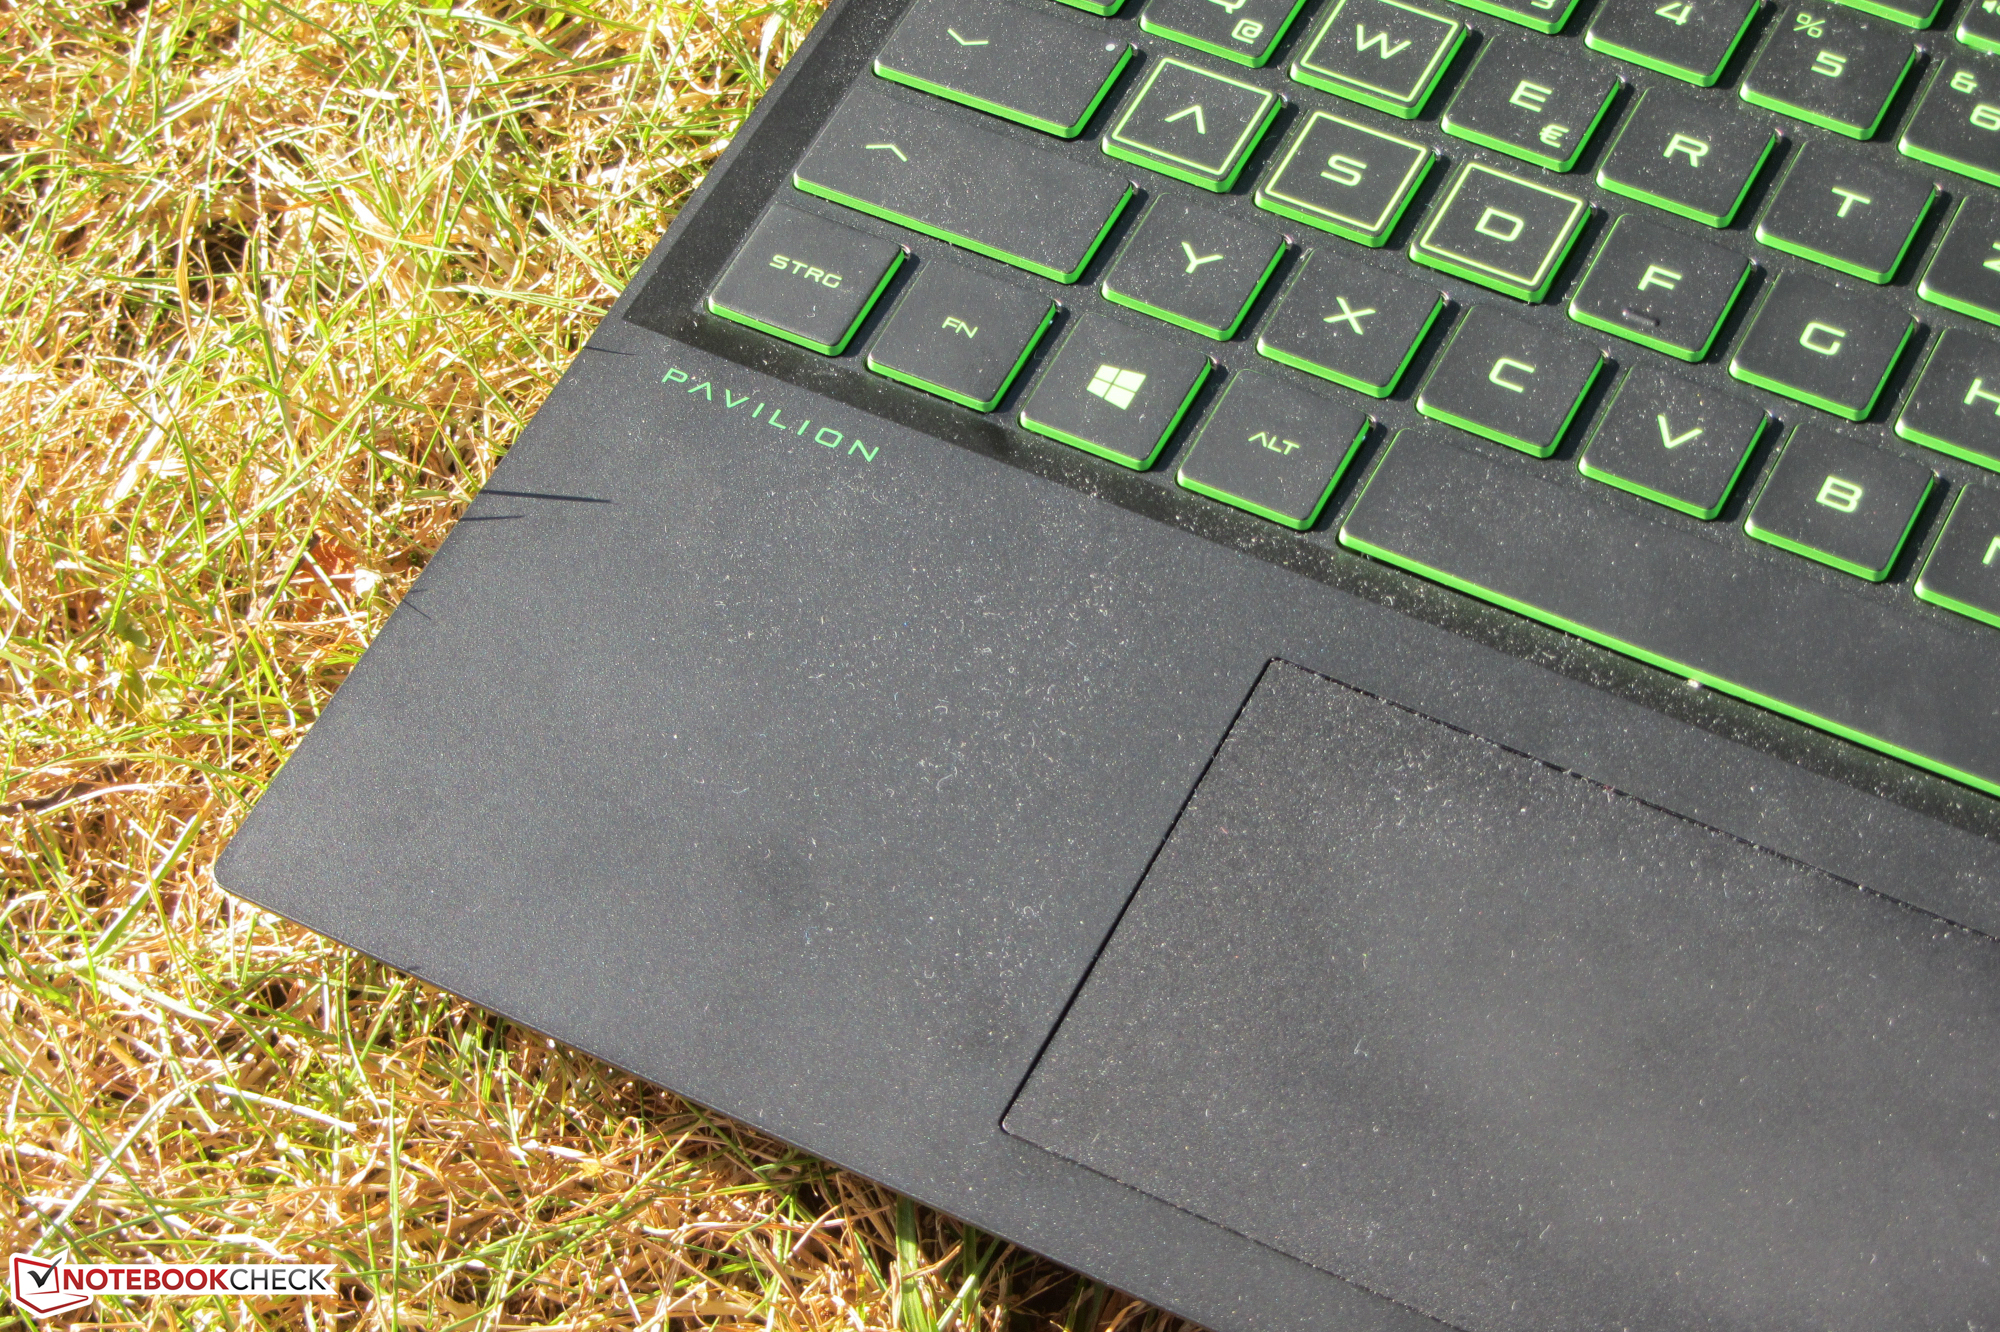
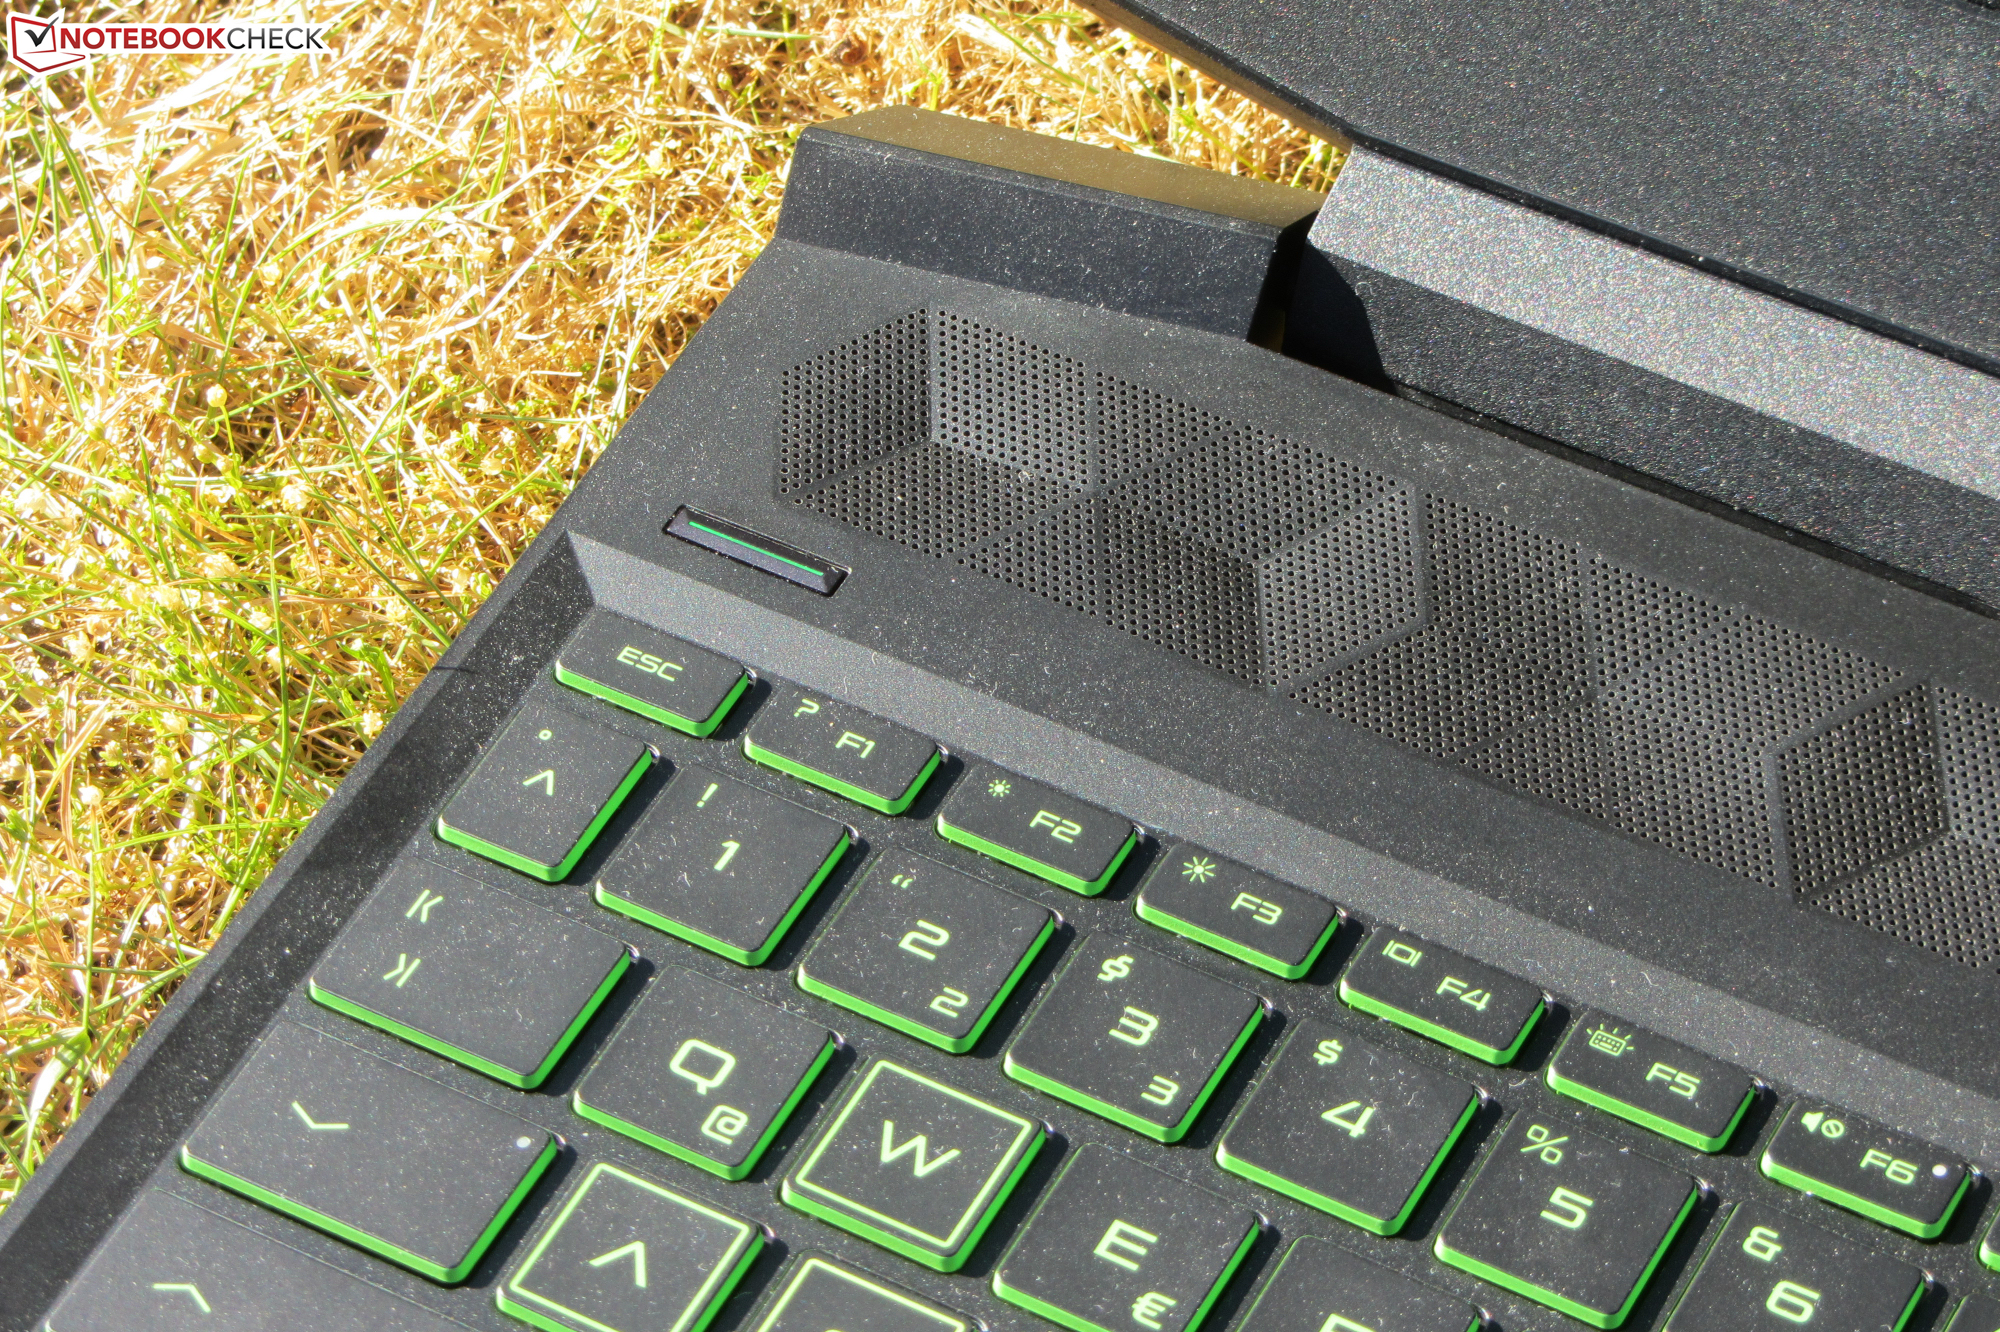
尽管计算能力很高,但您不必放弃很长的续航。只需一次充电,HP笔记本电脑即可达到9到11个小时的实际运行时间-许多办公笔记本电脑都无法实现这一目标。结合不错的键盘(背光),笔记本电脑还可以作为移动出行时的打字和网页浏览设备。
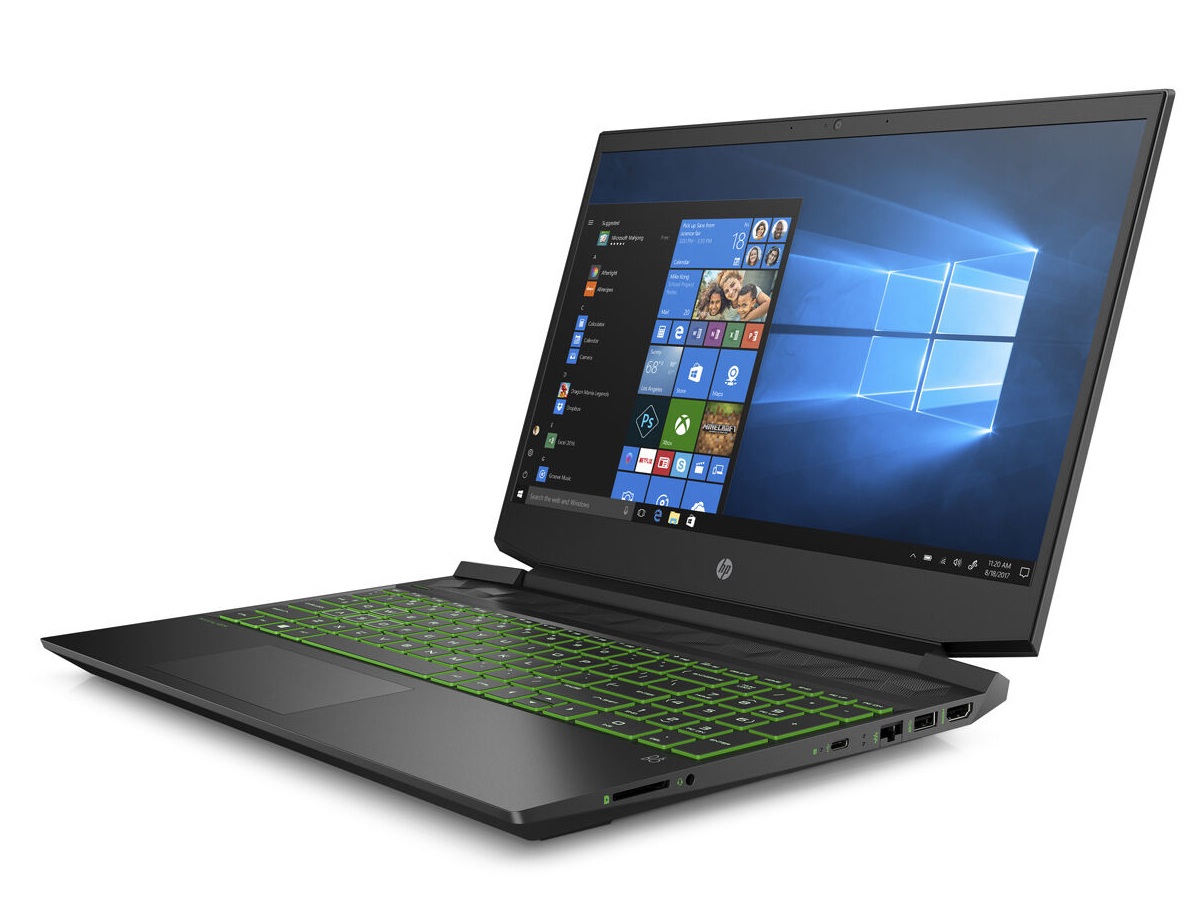
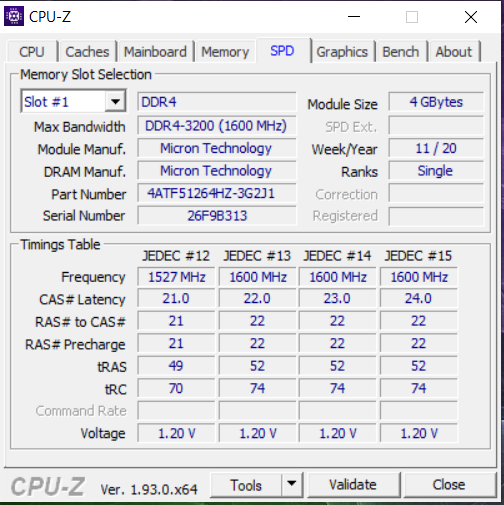
512 GB NVMe SSD(M.2 2280)确保系统快速运行。如果存储空间用完,则可以更换SSD,和/或可以在笔记本电脑中安装2.5英寸存储驱动器。可以使用SATA插槽和安装框架。由于设备没有维护舱口,因此必须打开外壳进行安装。
全高清IPS显示屏可提供稳定的视角,磨砂表面,良好的对比度和非常不错的色彩再现。但是,最大亮度太低。在色彩空间覆盖率方面,还有改进的余地。
HP Pavilion Gaming 15-ec1206ng
- 08/25/2020 v7 (old)
Sascha Mölck
Price comparison

