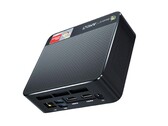
AMD Ryzen 7 3750H

AMD Ryzen 7 3750H是一款移动SoC,于2019年1月发布。它将四个主频为2.3-4 GHz的Zen +内核(8个线程)与一个Radeon RX Vega 10图形卡(10 CU)(640个着色器)结合在一起,显卡频率为1400 MHz。与同类的Ryzen 7 3700U相比,3750H的TDP高20瓦,因此在长期负载下性能更好。集成的双通道内存控制器最多支持DDR4-2400内存。由于Picasso APU的性能与Raven Ridge的前代产品相同,因此,我们推荐您阅读Raven Ridge相关文章。
Picasso SoC使用Zen +微体系结构并进行了一些细微的改进,从而可以将IPS(每频率性能)提高3%。此外,12nm工艺允许以相似的功耗获得更高的频率。
AMD指出,毕加索APU比以前的产品快8%。包括35瓦TDP在内,3750H应该是一款功能强大的中高端处理器,适用于笔记本电脑(包括游戏笔记本电脑)。
Series | AMD Picasso (Ryzen 3000 APU) |
Codename | Zen+ |
Series: Picasso (Ryzen 3000 APU) Zen+ | |
Clock Rate | 2300 - 4000 MHz |
Level 1 Cache | 384 KB |
Level 2 Cache | 2 MB |
Level 3 Cache | 4 MB |
Number of Cores / Threads | 4 / 8 |
Power Consumption (TDP = Thermal Design Power) | 35 Watt |
Transistor Count | 4500 Million |
Manufacturing Technology | 12 nm |
Socket | AM4 |
Features | XFR, FMA3, SSE 4.2, AVX2, SMT |
GPU | AMD Radeon RX Vega 10 ( - 1400 MHz) |
64 Bit | 64 Bit support |
Architecture | x86 |
Announcement Date | 01/06/2019 |
| |
Benchmarks
Performance Rating - CB R15 + R20 + 7-Zip + X265 + Blender + 3DM11 CPU
39 pt (39%)
...
AMD Ryzen 7 2700U -5%
AMD Ryzen 5 1400 -5%
AMD Ryzen 3 1300X -5%
AMD Ryzen 5 3580U -4%
AMD Ryzen 3 2200G -3%
Intel Core i5-1035G4 3%
Intel Core i5-1035G1 3%
Intel Core i5-8365U 4%
Intel Core i3-1115G4 4%
AMD Ryzen 5 1500X 5%
Intel Core i5-1035G7 5%
...
Cinebench R20 - Cinebench R20 CPU (Single Core)
min: 340 avg: 359 median: 352 (55%) max: 386 Points
...
Intel Core i3-8130U -3%
AMD Ryzen 5 1600 -3%
AMD Ryzen 5 3580U -2%
Intel Core i5-6287U -1%
AMD Ryzen 7 2700U 1%
AMD Ryzen 3 2200G 1%
Intel Core i7-6567U 2%
Intel Core i7-7700HQ 3%
AMD Ryzen 5 2600 6%
AMD Ryzen 5 2400G 7%
...
AMD Ryzen 9 5900X 78%
Cinebench R20 - Cinebench R20 CPU (Multi Core)
min: 1633 avg: 1750 median: 1793 (17%) max: 1825 Points
...
Intel Core i7-1065G7 -13%
AMD Ryzen 5 1400 -12%
AMD Ryzen 5 3580U -11%
AMD Ryzen 7 3780U -10%
Intel Core i7-8559U -3%
Intel Core i5-8279U -2%
Intel Core i7-7700HQ 1%
AMD Ryzen 5 1500X 2%
Intel Core i7-10810U 6%
Intel Core i7-8705G 8%
AMD Ryzen 5 2400G 8%
Intel Core i5-10400H 10%
Apple M1 13%
Intel Core i5-1038NG7 14%
...
AMD Ryzen Threadripper 2970WX 471%
Cinebench R15 - Cinebench R15 CPU Multi 64 Bit
min: 672 avg: 753 median: 757 (17%) max: 805 Points
...
Intel Xeon E3-1505M v6 -3%
Intel Xeon E3-1230 v3 -3%
Intel Xeon E3-1231 v3 -3%
Intel Xeon E3-1535M v5 -1%
Intel Core i5-8279U 0%
Intel Core i7-8705G 1%
Intel Core i7-4790 2%
Intel Core i5-1038NG7 2%
Intel Core i7-5775C 2%
Intel Core i5-8400H 2%
Intel Core i7-8706G 4%
Intel Xeon E3-1535M v6 4%
...
AMD Ryzen Threadripper 2970WX 481%
MSI Alpha 15 A3DDK-034 ; Silent: Ø668 (653.77-672.38)
MSI Alpha 15 A3DDK-034 : Ø707 (701.57-734.14)
Cinebench R15 - Cinebench R15 CPU Single 64 Bit
min: 135 avg: 144 median: 143.5 (53%) max: 157 Points
...
AMD Ryzen 7 2700U -1%
Intel Core i5-7260U -1%
Intel Core i7-4870HQ -1%
Intel Core i5-6287U -1%
Intel Core i5-7360U -1%
Intel Core i5-6440HQ -1%
Intel Core i7-4900MQ 1%
Intel Xeon E3-1226 v3 1%
Intel Core i5-8500T 1%
Intel Xeon E3-1230 v3 1%
AMD Ryzen 5 1600 1%
AMD Ryzen 3 2200G 1%
AMD Ryzen 7 1700 1%
Intel Core i5-4590 1%
Intel Core i5-8350U 2%
...
AMD Ryzen 9 5900X 88%
Cinebench R11.5 - Cinebench R11.5 CPU Multi 64 Bit
9.2 Points (19%)
...
Intel Core i5-8500T -7%
Intel Core i7-980X EE -4%
Intel Xeon E3-1280 v5 -3%
Intel Core i7-990X EE -3%
AMD Ryzen 5 1500X -3%
Intel Core i7-4790K 0%
Intel Core i7-8809G 2%
Intel Core i5-9400H 2%
AMD Ryzen 5 2400G 3%
Intel Core i7-7700 3%
Intel Core i7-6700K 4%
Intel Core i5-10400H 4%
Intel Core i7-1160G7 5%
Intel Core i3-10100 8%
...
Cinebench R11.5 - Cinebench R11.5 CPU Single 64 Bit
1.6 Points (52%)
...
Intel Core i7-5557U -1%
Intel Core i7-3940XM -1%
Intel Core i7-4800MQ -1%
Intel Core i3-8130U -1%
Intel Core i5-4590 -1%
AMD Ryzen 5 1600 0%
AMD Ryzen 7 2700U 0%
Intel Core i5-8500T 1%
AMD Ryzen 5 3580U 1%
Intel Core i7-3770K 1%
AMD Ryzen 7 1700 1%
Intel Xeon E3-1230 v3 1%
Intel Core i7-6770HQ 1%
...
AMD Ryzen 9 5900X 91%
Cinebench R10 - Cinebench R10 Rend. Single (32bit)
min: 4527 avg: 4732 median: 4770 (43%) max: 4898 points
...
AMD Ryzen 7 1700X -1%
Intel Core i5-4310M -1%
AMD Ryzen 3 1300X -1%
Intel Core i5-4300M -1%
Intel Core i7-4650U -1%
Intel Core i7-4750HQ 0%
AMD Ryzen 5 2600 0%
AMD Ryzen Threadripper 1950X 0%
Intel Core i5-2500K 1%
Intel Core i7-4712MQ 1%
Intel Core i7-4558U 1%
Intel Core i5-5257U 1%
AMD Ryzen 5 2400G 2%
Intel Core i7-2600K 2%
Intel Core i7-3520M 2%
Intel Core i5-4460 2%
...
Cinebench R10 - Cinebench R10 Rend. Multi (32bit)
min: 19290 avg: 20242 median: 20687 (35%) max: 20750 points
...
Intel Core i7-2700K -3%
Intel Core i7-4790T -2%
Intel Core i7-3740QM -2%
Intel Xeon X5670 -1%
Intel Core i7-4900MQ -1%
Intel Core i7-3840QM -1%
AMD Ryzen 5 1500X 0%
Intel Core i7-6700T 0%
Intel Core i7-3940XM 2%
Intel Xeon E3-1535M v6 2%
AMD Ryzen 5 2400G 4%
Intel Core i7-4790S 4%
...
wPrime 2.10 - wPrime 2.0 1024m *
197 s (2%)
AMD Ryzen Threadripper 2970WX -80%
...
Intel Core i7-7700K -12%
Intel Core i5-9600K -11%
AMD Ryzen 3 3100 -10%
Intel Core i7-4790K -6%
Intel Core i5-8600K -4%
Intel Core i7-8809G -3%
Intel Core i5-8400 -3%
Intel Core i3-10100 -2%
AMD Ryzen 5 2400G 1%
Intel Core i7-8705G 1%
Intel Core i7-8700 1%
Intel Core i7-4790 1%
Intel Core i7-3770K 1%
Intel Core i5-9400F 1%
Intel Core i7-8706G 2%
Intel Core i7-10810U 4%
...
VIA C3-M C3-M-1200 4194%
wPrime 2.10 - wPrime 2.0 32m *
7.4 s (1%)
Intel Core i9-9980XE -63%
...
AMD Ryzen 5 3580U -4%
Intel Core i7-6700K -3%
Intel Core i7-6770HQ -1%
Intel Core i7-975 -1%
Intel Core i7-4790T -1%
Intel Core i7-3840QM -1%
Intel Core i5-1035G4 -1%
Intel Core i7-3820QM 0%
Intel Core i7-3920XM 1%
Intel Core i7-4900MQ 2%
Intel Core i7-3740QM 2%
Intel Core i5-8365U 4%
Intel Core i5-1035G7 4%
...
Transmeta Crusoe TM-5800 6580%
2866 points (18%)
AMD Athlon Neo MV-40 -88%
...
AMD Ryzen 5 PRO 2500U -6%
Intel Core i3-7100H -5%
Intel Core i5-3337U -4%
AMD Ryzen 5 1400 -4%
Intel Core i5-6400T -3%
Intel Xeon E3-1226 v3 -1%
Intel Core i5-2450M -1%
Intel Core i7-5557U 0%
Intel Core i7-3520M 0%
Intel Core i5-3339Y 1%
Intel Core i5-3320M 2%
AMD Ryzen 5 3580U 2%
Intel Core i5-6500T 2%
Intel Core i7-3540M 3%
Intel Core i5-8350U 3%
Intel Core i5-7500 4%
...
AMD Ryzen 7 5800X 444%
7-Zip 18.03 - 7-Zip 18.03 Multli Thread 4 runs
min: 18689 avg: 18938 median: 18938 (15%) max: 19187 MIPS
...
Intel Core i7-1065G7 -9%
Intel Core i5-8365U -9%
AMD Ryzen 7 2700U -9%
Intel Core i5-10310U -6%
AMD Ryzen 5 1400 1%
Intel Core i7-8809G 2%
Intel Core i5-1038NG7 3%
AMD Ryzen 5 2400G 6%
Intel Core i7-10810U 7%
Intel Core i7-7700HQ 10%
Intel Core i5-8259U 11%
...
7-Zip 18.03 - 7-Zip 18.03 Single Thread 4 runs
min: 3511 avg: 3585 median: 3585 (24%) max: 3659 MIPS
...
Intel Core i7-6560U -5%
Intel Core i5-8210Y -5%
AMD Ryzen 5 3580U 0%
AMD Ryzen 7 2700U 0%
AMD FX-8350 1%
Intel Core i5-1035G4 2%
Intel Core i7-6567U 4%
Intel Core i5-6287U 4%
AMD Ryzen 7 1700X 4%
AMD Ryzen 3 1300X 5%
...
AMD Ryzen 7 5800X 94%
X264 HD Benchmark 4.0 - x264 Pass 2
48.6 fps (22%)
Intel Pentium 4 2.4 GHz -96%
...
Intel Core i7-4770K -6%
Intel Core i5-8305G -6%
Intel Core i7-4790 -5%
Intel Core i7-5775C -5%
Intel Core i5-7600K -5%
Intel Xeon E3-1535M v5 -5%
AMD Ryzen 5 2400G -1%
Intel Xeon E3-1505M v6 0%
Intel Core i7-7700 1%
Intel Core i5-10400H 1%
AMD Ryzen 5 1500X 2%
Intel Core i7-8706G 3%
Intel Core i7-8705G 3%
Intel Xeon E3-1280 v5 4%
...
X264 HD Benchmark 4.0 - x264 Pass 1
139 fps (41%)
...
AMD Ryzen 5 3580U -3%
Intel Core i7-4700HQ -2%
Intel Core i7-7660U -1%
Intel Xeon E5-2680 v4 -1%
Intel Core i5-2400 -1%
Intel Core i7-3630QM -1%
Intel Core i7-3635QM -1%
Intel Core i7-3615QM -1%
Intel Core i7-4750HQ -1%
Intel Core i3-1115G4 2%
Intel Core i7-3720QM 4%
Intel Core i7-2600K 4%
Intel Core i7-4700MQ 4%
Intel Core i7-2700K 6%
AMD Ryzen 5 1400 6%
...
AMD Ryzen 7 5800X 144%
HWBOT x265 Benchmark v2.2 - HWBOT x265 4k Preset
min: 4.352 avg: 4.4 median: 4.4 (14%) max: 4.4 fps
...
Intel Core i5-8265U -4%
Intel Core i5-1035G1 -3%
Intel Core i5-1035G4 -3%
AMD Ryzen 3 2200G -2%
Intel Core i5-10310U -1%
AMD Ryzen 5 1400 1%
Intel Core i5-8365U 3%
Intel Core i7-1065G7 4%
Intel Core i5-1035G7 7%
Intel Core i5-8259U 8%
...
TrueCrypt - TrueCrypt Serpent
0.5 GB/s (19%)
...
Intel Xeon E3-1505M v6 -3%
Intel Core i7-1065G7 -3%
Intel Xeon E3-1280 v5 -3%
Intel Core i5-8365U -1%
AMD Ryzen 5 1500X -1%
Intel Xeon E3-1535M v6 0%
Intel Core i7-8559U 1%
Intel Core i7-8809G 3%
Intel Core i7-3960X 4%
Intel Core i5-8400 7%
Intel Core i3-10100 7%
...
TrueCrypt - TrueCrypt Twofish
0.7 GB/s (19%)
...
Intel Core i7-6770HQ -2%
Intel Core i7-7700HQ -2%
Intel Core i7-3770K -1%
Intel Core i7-6700T 0%
Intel Core i7-4770K 0%
Intel Core i5-8350U 0%
Intel Core i7-4980HQ 0%
Intel Core i7-8706G 2%
Intel Core i7-5775C 2%
Intel Xeon E3-1505M v5 3%
Intel Core i5-8305G 3%
Intel Core i7-8650U 3%
...
AMD Ryzen 9 3950X 423%
TrueCrypt - TrueCrypt AES
5 GB/s (19%)
...
Intel Xeon E3-1535M v6 -6%
Intel Core i5-1035G7 -6%
Intel Core i5-1035G4 -6%
Intel Core i7-8809G -4%
Intel Core i7-1160G7 -2%
AMD Ryzen 5 1500X -2%
Intel Core i7-1065G7 -1%
Intel Core i5-9400F 4%
AMD Ryzen 5 2400G 4%
Intel Core i7-3960X 4%
AMD Ryzen 5 5600H 6%
Intel Core i5-10400H 6%
AMD Ryzen 3 3100 8%
Intel Core i5-8600K 8%
...
Blender 2.79 - Blender 2.79 BMW27 CPU *
min: 584.19 avg: 609 median: 608.6 (4%) max: 633 Seconds
Intel Core i5-1038NG7 -99%
...
Intel Core i7-8809G -12%
AMD Ryzen 5 2400G -10%
Intel Core i5-8500T -8%
Intel Core i5-10400H -7%
AMD Ryzen 5 1500X -4%
Intel Core i7-8706G 2%
Intel Core i7-1160G7 3%
Intel Core i7-7700T 3%
Intel Core i5-8279U 3%
Intel Core i7-7700HQ 4%
Intel Core i7-8559U 9%
...
AMD E1-2100 2211%
R Benchmark 2.5 - R Benchmark 2.5 *
0.7 sec (15%)
...
AMD Ryzen 5 2400G -4%
Intel Core i5-9400F -3%
AMD Ryzen 7 1800X -2%
AMD Ryzen 3 2200G -2%
Intel Core i7-10810U -1%
Intel Core i7-8850H 0%
AMD Ryzen 5 1600 1%
Intel Core i5-1038NG7 2%
Intel Core i7-1065G7 2%
AMD Ryzen 3 1300X 2%
AMD Ryzen 5 1500X 5%
Intel Core i5-8265U 6%
Intel Core i5-10310U 6%
...
AMD E1-2100 565%
3DMark 06 - CPU - 3DMark 06 - CPU
min: 7187 avg: 7715 median: 7431 (41%) max: 8812 Points
...
Intel Core i5-6600K -4%
Intel Core i5-1035G4 -4%
Intel Core i7-7820HQ -3%
Intel Core i7-7700HQ -2%
Intel Core i7-4980HQ -1%
Intel Xeon E3-1505M v6 0%
Intel Core i5-8305G 1%
Intel Core i5-1038NG7 2%
Intel Xeon E5-2680 3%
Intel Core i7-5775C 3%
Intel Xeon E3-1230 v3 4%
Intel Core i7-4770K 4%
Intel Core i5-8500T 4%
...
Super Pi mod 1.5 XS 1M - Super Pi mod 1.5 XS 1M *
11 s (2%)
...
Intel Core i5-2500K -2%
AMD Ryzen 7 1700X -2%
Intel Core i5-8305G -2%
Qualcomm Snapdragon 8cx -1%
Intel Core i5-8350U -1%
Intel Core i7-3630QM -1%
Intel Core i7-6600U 1%
Intel Core i5-6440HQ 1%
Intel Core i7-3615QM 1%
Intel Core i5-2400 1%
Intel Core i3-8130U 1%
Intel Core i7-4700MQ 1%
Intel Core i7-4712MQ 1%
AMD Ryzen 7 2700 1%
...
VIA C3-M C3-M-1200 4109%
Super Pi mod 1.5 XS 2M - Super Pi mod 1.5 XS 2M *
25.7 s (1%)
...
AMD Ryzen 5 2400G -2%
Intel Core i5-6440HQ -2%
Intel Core i7-6600U -2%
Intel Core i7-4712MQ -2%
Intel Core i5-8350U -2%
Intel Core i7-2760QM -2%
Intel Core i7-3615QM -1%
Intel Core i5-7440HQ 0%
Intel Core i7-4700MQ 0%
AMD Ryzen 7 1700 0%
Intel Core i7-4558U 0%
Intel Core i5-2400 0%
Intel Core i7-4750HQ 1%
Intel Core i5-4310M 1%
Intel Core i7-2640M 1%
Intel Core i5-4210H 2%
...
Intel Celeron Dual-Core T1400 9005%
Super Pi Mod 1.5 XS 32M - Super Pi mod 1.5 XS 32M *
650 s (3%)
...
AMD Ryzen 5 1500X -2%
Intel Core i5-6360U -1%
Intel Core i5-4210M -1%
Intel Core i5-7200U -1%
AMD Ryzen 5 1600 0%
Intel Core i7-3667U 0%
Intel Core i5-6267U 0%
AMD Ryzen 3 2200G 0%
Intel Core i7-4500U 1%
Intel Core i7-8500Y 1%
Intel Core i5-6400 2%
Intel Core i5-6260U 2%
Intel Core i7-7700T 2%
Intel Core i3-8130U 2%
...
VIA C3-M C3-M-1200 3364%
3DMark Vantage - 3DM Vant. Perf. CPU no Physx
25143 Points (29%)
...
Intel Core i5-1035G7 -3%
Intel Core i7-2700K -3%
Intel Core i7-8559U -2%
Intel Core i7-3840QM -2%
Intel Core i7-4900MQ -1%
Intel Core i7-3920XM -1%
Intel Core i5-8500T 1%
Intel Core i7-7700HQ 1%
Intel Core i5-1035G4 2%
Intel Core i7-3940XM 3%
Intel Core i7-1065G7 4%
...
AMD Ryzen 7 5800X 242%
3DMark 11 - 3DM11 Performance Physics
min: 6606 avg: 7734 median: 7941 (29%) max: 8648 Points
...
Intel Core i7-3615QM -6%
Intel Core i7-3610QM -6%
Intel Core i5-1035G4 -5%
AMD Ryzen 5 1400 -5%
Intel Core i7-4712MQ -5%
Intel Core i7-2860QM -2%
Intel Core i5-6600K 0%
Intel Core i7-3740QM 1%
Intel Core i7-3840QM 1%
Intel Core i7-4800MQ 1%
Intel Core i7-2920XM 2%
Intel Core i5-8500 3%
Intel Core i5-10400H 4%
...
3DMark - 3DMark Ice Storm Physics
min: 39182 avg: 48304 median: 48251 (31%) max: 57479 Points
Samsung Hummingbird S5PC110 / Exynos 3110 -99%
...
AMD Ryzen 9 5980HS -1%
Intel Core i5-4430 -1%
Intel Core i7-6700T -1%
Intel Core i5-8305G 0%
Intel Core i5-6400 0%
Intel Core i5-1035G1 0%
Intel Core i5-2400 0%
Intel Core i5-3570K 0%
Intel Core i7-3940XM 0%
Intel Core i7-3770K 1%
Intel Core i7-4790T 1%
Intel Core i5-8365U 2%
Intel Core i7-4790S 2%
Intel Core i7-1065G7 2%
...
Intel Core i5-4300Y 222%
3DMark - 3DMark Ice Storm Extreme Physics
min: 44524 avg: 50874 median: 51438 (55%) max: 56661 Points
...
Intel Core i5-6440HQ -3%
Intel Core i7-8705G -3%
Intel Xeon E3-1230 v3 -2%
Intel Core i5-8365U -1%
Intel Core i5-7500T -1%
Intel Core i5-1035G4 -1%
Intel Core i5-6400 0%
Intel Core i5-1035G1 1%
Intel Core i5-7440HQ 2%
Intel Core i7-7700 6%
Intel Core i7-8850H 6%
...
AMD Ryzen 7 5800X 85%
3DMark - 3DMark Ice Storm Unlimited Physics
min: 55479 avg: 58242 median: 55515 (57%) max: 63731 Points
Qualcomm Snapdragon S4 Play MSM8625Q -95%
...
Intel Core i5-8365U -3%
AMD Ryzen Threadripper 1950X -3%
Intel Core i7-1065G7 -1%
Intel Core i7-7660U -1%
Intel Core i7-8809G 0%
Intel Core i7-5775C 0%
Intel Xeon E3-1535M v6 1%
Intel Core i7-9750H 1%
HiSilicon Kirin 9000 2%
Intel Xeon E-2176M 2%
Intel Core i5-7500 3%
...
AMD Ryzen 7 5800X 66%
3DMark - 3DMark Cloud Gate Physics
min: 5698 avg: 7502 median: 7786.5 (20%) max: 8117 Points
...
AMD Ryzen 5 2400G -2%
Intel Core i7-7700HQ -2%
Intel Core i7-8559U -2%
Intel Core i7-7820HQ -1%
Intel Xeon E3-1505M v5 0%
Intel Core i5-8305G 0%
Intel Core i5-10310U 1%
Intel Core i7-4790 1%
AMD Ryzen 5 1500X 3%
Intel Xeon E3-1535M v5 4%
...
AMD Ryzen 7 5800X 206%
3DMark - 3DMark Fire Strike Standard Physics
min: 10737 avg: 11312 median: 11370.5 (29%) max: 11900 Points
...
AMD Ryzen 5 1400 -6%
Intel Core i7-10810U -5%
Intel Xeon E3-1535M v5 -5%
Intel Core i7-4790 -5%
AMD Ryzen 5 2400G -5%
Intel Core i7-8706G -4%
Intel Xeon E3-1535M v6 2%
Intel Core i5-8500 3%
Intel Xeon E3-1280 v5 4%
Intel Core i5-8400 4%
...
3DMark - 3DMark Time Spy CPU
min: 3276 avg: 3409 median: 3373 (23%) max: 3574 Points
...
Intel Core i5-1035G4 -12%
Intel Core i7-8650U -12%
Intel Core i5-1035G1 -5%
Intel Core i7-10810U -4%
Intel Core i7-4800MQ -4%
Intel Core i7-1065G7 -1%
AMD Ryzen 5 2400G 0%
Intel Core i5-8279U 1%
Intel Core i7-8705G 1%
AMD Ryzen 5 1400 2%
Intel Core i5-1038NG7 5%
Intel Core i5-1035G7 6%
Intel Core i7-8559U 6%
...
Intel Core i9-10900K 295%
Geekbench 3 - Geekbench 3 32 Bit Multi-Core
min: 14478 avg: 14749 median: 14748.5 (26%) max: 15019 points
Samsung Hummingbird S5PC110 / Exynos 3110 -98%
...
Intel Core i5-8265U -7%
Intel Core i7-7700HQ -7%
Intel Xeon E3-1535M v5 -6%
Intel Core i7-1065G7 -2%
Intel Core i7-3720QM -2%
Intel Xeon E3-1505M v6 0%
Intel Core i7-4790K 5%
Intel Core i7-6700K 11%
Intel Core i7-7740X 24%
...
Geekbench 3 - Geekbench 3 32 Bit Single-Core
min: 3717 avg: 3768 median: 3768 (77%) max: 3819 points
Samsung Hummingbird S5PC110 / Exynos 3110 -94%
...
Intel Core i7-6700T -3%
Intel Core i5-8265U -3%
Intel Xeon E3-1535M v6 -2%
Intel Xeon E3-1505M v5 -1%
Intel Core i7-1065G7 3%
Intel Core i7-3720QM 3%
Intel Xeon E3-1535M v5 4%
...
Intel Core i9-9980HK 29%
Geekbench 4.1 - 4.4 - Geekbench 4.1 - 4.4 64 Bit Single-Core
min: 3898 avg: 4104 median: 4166 (57%) max: 4186 points
Qualcomm Snapdragon 212 APQ8009 -90%
...
Apple A10X Fusion -4%
AMD Ryzen 3 1200 -4%
AMD Ryzen 5 1600 -3%
Intel Core i7-5557U -3%
Intel Core i3-8130U -3%
Intel Core i7-6567U -1%
Intel Core i5-7Y57 -1%
Intel Core i5-6287U 0%
Intel Core i5-7260U 1%
Intel Core i5-8210Y 1%
Intel Core i5-7267U 2%
Intel Core i5-8350U 2%
Intel Core i3-8121U 2%
Intel Core i3-8145U 3%
...
AMD Ryzen 7 5800X 79%
Geekbench 4.1 - 4.4 - Geekbench 4.1 - 4.4 64 Bit Multi-Core
min: 11396 avg: 12985 median: 13403.5 (21%) max: 13738 points
...
AMD Ryzen 3 1300X -6%
Intel Core i5-10310U -3%
Intel Core i5-6350HQ -2%
AMD Ryzen 5 1400 -1%
Intel Core i5-8350U 3%
Intel Core i5-8265U 4%
AMD Ryzen 5 2400G 7%
Intel Core i7-7700T 8%
...
Geekbench 5.0 - Geekbench 5.0 64 Bit Single-Core
min: 853 avg: 895 median: 884 (53%) max: 959 points
...
Samsung Exynos 9820 -7%
AMD Ryzen 3 3300U -6%
Intel Core i7-8500Y -4%
AMD Ryzen 7 3780U -1%
AMD Ryzen 5 1500X 2%
AMD Ryzen 5 1600 2%
Apple A11 Bionic 4%
AMD Ryzen 3 2200G 7%
Intel Core i3-8145U 11%
...
AMD Ryzen 7 5800X 87%
Geekbench 5.0 - Geekbench 5.0 64 Bit Multi-Core
min: 3007 avg: 3467 median: 3571.5 (22%) max: 3718 points
...
Intel Core i5-1035G1 -7%
Intel Core i5-8265U -4%
AMD Ryzen 7 3780U -3%
AMD Ryzen 5 1400 -2%
Apple A13 Bionic -1%
AMD Ryzen 3 2200G -1%
Intel Core i5-1035G7 1%
AMD Ryzen 5 2400G 6%
Intel Core i7-7700HQ 13%
Intel Core i7-8705G 16%
AMD Ryzen 5 1500X 16%
Intel Core i3-9100F 17%
...
Intel Core i9-9980XE 371%
Geekbench 5.3 - Geekbench 5.1 - 5.3 64 Bit Single-Core
874 points (48%)
...
AMD Ryzen 5 2600H -7%
AMD Ryzen 7 2700U -7%
Samsung Exynos 9820 -6%
AMD Ryzen 5 1400 -5%
AMD Ryzen 3 1200 -5%
Samsung Exynos 9825 -5%
AMD Ryzen 7 PRO 2700U 1%
Intel Core i5-6287U 1%
Intel Core i5-7287U 3%
AMD Ryzen 5 3580U 3%
Intel Core i5-8200Y 3%
AMD Ryzen 5 1500X 5%
...
Intel Core i7-11700K 107%
Geekbench 5.3 - Geekbench 5.1 - 5.3 64 Bit Multi-Core
3537 points (21%)
...
AMD Ryzen 7 PRO 2700U -10%
AMD Ryzen 5 2600H -9%
Samsung Exynos 2100 5G -4%
Apple A13 Bionic -3%
Intel Core i5-10310U -2%
Intel Core i5-8265U 1%
AMD Ryzen 3 PRO 4450U 3%
Intel Core i7-8559U 3%
Intel Core i7-7700HQ 6%
Qualcomm Snapdragon 888 5G 7%
Intel Core i5-1035G4 8%
Intel Core i5-1035G1 8%
...
Mozilla Kraken 1.1 - Kraken 1.1 Total Score *
min: 1157.6 avg: 1182 median: 1161.5 (2%) max: 1227.7 ms
...
Intel Core i7-5557U -3%
Intel Core i5-6287U -2%
AMD Ryzen 3 1200 -1%
Intel Core i5-7Y57 -1%
Apple A10 Fusion 0%
Intel Core i5-8305G 0%
Intel Core i5-6260U 0%
Intel Core i7-6950X 0%
Intel Core i5-8350U 1%
Intel Core i5-7200U 2%
Intel Core i5-7Y54 4%
AMD Ryzen 3 3300U 5%
Intel Core i7-3720QM 5%
...
Qualcomm Snapdragon S1 MSM7227A 4931%
Octane V2 - Octane V2 Total Score
min: 29949 avg: 30479 median: 30626 (46%) max: 30714 Points
...
Intel Core i3-8145U -5%
Qualcomm Snapdragon 8cx -4%
Intel Core i5-7200U -2%
Intel Core i5-8305G -1%
Intel Core i5-6260U 0%
AMD Ryzen 5 1600 1%
Apple A10X Fusion 1%
Intel Core i5-7Y57 1%
Intel Core i5-6360U 1%
Intel Core i5-8265U 3%
AMD Ryzen 7 1800X 3%
Intel Core i7-8650U 3%
Intel Core i7-5557U 3%
...
AMD Ryzen 9 5980HS 119%
Power Consumption - Prime95 Power Consumption - external Monitor *
min: 95 avg: 139 median: 138.5 (37%) max: 182 Watt
...
Intel Core i7-8700 -19%
Intel Core i5-8400 -17%
Intel Core i3-10100 -17%
AMD Ryzen 9 5900HX -16%
Intel Core i5-7600K -11%
Intel Core i5-9400F -5%
Intel Core i5-8500T -4%
Intel Core i5-10400F -2%
AMD Ryzen 3 3100 -1%
AMD Ryzen 7 2700 1%
AMD Ryzen 7 1700 1%
Intel Core i7-9700 4%
AMD Ryzen 3 3300X 4%
Intel Core i7-7700K 4%
AMD Ryzen 5 1500X 5%
Intel Core i5-9600K 5%
Intel Core i7-8700K 7%
Intel Xeon W-10885M 8%
...
AMD Ryzen Threadripper 2970WX 168%
Power Consumption - Cinebench R15 Multi Power Consumption - external Monitor *
min: 66.4 avg: 81.8 median: 81.8 (22%) max: 97.1 Watt
...
Intel Core i7-7820HQ -17%
AMD Ryzen 3 2200G -16%
Intel Xeon E3-1535M v6 -14%
AMD Ryzen 5 5600H -12%
Intel Core i7-8559U -9%
Intel Core i7-10810U -8%
Intel Core i5-10400H -7%
Intel Core i7-9750H -4%
Intel Xeon E3-1505M v6 -4%
AMD Ryzen 7 5800H 6%
Intel Xeon E-2176M 9%
AMD A10-7850K 14%
Intel Core i5-8400 19%
Intel Core i5-7600K 20%
AMD Ryzen 5 2400G 22%
Intel Core i3-10100 25%
...
AMD Ryzen Threadripper 2970WX 362%
- Range of benchmark values for this graphics card

- Average benchmark values for this graphics card
* Smaller numbers mean a higher performance
v1.16
log 01. 21:22:40
#0 no ids found in url (should be separated by "_") +0s ... 0s
#1 not redirecting to Ajax server +0s ... 0s
#2 did not recreate cache, as it is less than 5 days old! Created at Fri, 26 Feb 2021 08:40:59 +0100 +0.001s ... 0.001s
#3 no comparison url found in template nbc.compare_page_2 needed +0.028s ... 0.029s
#4 no comparison url found in template nbc.compare_page_2 needed +0s ... 0.029s
#5 no comparison url found in template nbc.compare_page_2 needed +0s ... 0.029s
#6 no comparison url found in template nbc.compare_page_2 needed +0s ... 0.029s
#7 no comparison url found in template nbc.compare_page_2 needed +0s ... 0.029s
#8 no comparison url found in template nbc.compare_page_2 needed +0s ... 0.029s
#9 no comparison url found in template nbc.compare_page_2 needed +0s ... 0.029s
#10 no comparison url found in template nbc.compare_page_2 needed +0s ... 0.029s
#11 no comparison url found in template nbc.compare_page_2 needed +0s ... 0.029s
#12 no comparison url found in template nbc.compare_page_2 needed +0s ... 0.029s
#13 no comparison url found in template nbc.compare_page_2 needed +0s ... 0.03s
#14 no comparison url found in template nbc.compare_page_2 needed +0s ... 0.03s
#15 composed specs +0s ... 0.03s
#16 did output specs +0s ... 0.03s
#17 getting avg benchmarks for device 11131 +0.015s ... 0.044s
#18 got single benchmarks 11131 +0.064s ... 0.109s
#19 got avg benchmarks for devices +0s ... 0.109s
#20 min, max, avg, median took s +1.526s ... 1.635s
#21 no comparison url found in template nbc.compare_page_2 needed +0s ... 1.635s
#22 return log +0s ... 1.635s
Reviews for the AMD Picasso (Ryzen 3000 APU) R7 3750H processor
Acer Aspire 7 A715-41G-R3J5 (NVIDIA GeForce GTX 1650 Mobile, 15.60")
» Acer Aspire 7 A715-41G-R3J5 - External Review
Asus ROG GA502DU (NVIDIA GeForce GTX 1660 Ti Max-Q, 15.60")
» 华硕ROG Zephyrus G GA502DU (Ryzen 7 3750H, GTX 1660 Ti Max-Q) 笔记本电脑评测 - Review
Asus ROG Zephyrus G GA502DU-BQ015 (NVIDIA GeForce GTX 1660 Ti Mobile, 15.60")
» Asus ROG Zephyrus G GA502DU-BQ015 - External Review
Asus TUF FX505DD (NVIDIA GeForce RTX 2060 Mobile, 15.60")
» Asus TUF FX505DD - External Review
Asus TUF FX505DD-BQ067 (NVIDIA GeForce GTX 1050 Mobile, 15.60")
» Asus TUF FX505DD-BQ067 - External Review
Asus TUF FX505DT-BQ121 (NVIDIA GeForce GTX 1650 Mobile, 15.60")
» Asus TUF FX505DT-BQ121 - External Review
Asus TUF FX505DT-BQ208 (NVIDIA GeForce GTX 1650 Mobile, 15.60")
» Asus TUF FX505DT-BQ208 - External Review
Asus TUF FX505DT-BQ600 (NVIDIA GeForce GTX 1650 Mobile, 15.60")
» Asus TUF FX505DT-BQ600 - External Review
Asus TUF FX505DT-BQ613T (NVIDIA GeForce GTX 1650 Mobile, 15.60")
» Asus TUF FX505DT-BQ613T - External Review
Asus TUF FX505DT-EB73 (NVIDIA GeForce GTX 1650 Mobile, 15.60")
» Asus TUF FX505DT-EB73 - External Review
Asus TUF FX505DU-BQ045 (NVIDIA GeForce GTX 1660 Ti Mobile, 15.60")
» Asus TUF FX505DU-BQ045 - External Review
Asus TUF FX505DU-MB74 (NVIDIA GeForce GTX 1660 Ti Mobile, 15.60")
» Asus TUF FX505DU-MB74 - External Review
Asus TUF FX505DV-AL019 (NVIDIA GeForce RTX 2060 Mobile, 15.60")
» Asus TUF FX505DV-AL019 - External Review
Asus TUF FX505DV-AL116 (NVIDIA GeForce RTX 2060 Mobile, 15.60")
» Asus TUF FX505DV-AL116 - External Review
Asus TUF FX505DV-BQ099T (NVIDIA GeForce RTX 2060 Mobile, 15.60")
» Asus TUF FX505DV-BQ099T - External Review
Asus TUF FX705DT-AU028T (NVIDIA GeForce GTX 1650 Mobile, 17.30")
» Asus TUF FX705DT-AU028T - External Review
Asus TUF FX705DU-AU019T (NVIDIA GeForce GTX 1660 Ti Mobile, 17.30")
» Asus TUF FX705DU-AU019T - External Review
Asus TUF FX705DU-AU029T (NVIDIA GeForce GTX 1660 Ti Mobile, 17.30")
» Asus TUF FX705DU-AU029T - External Review
Asus TUF FX705DU-AU053T (NVIDIA GeForce GTX 1660 Ti Mobile, 17.30")
» Asus TUF FX705DU-AU053T - External Review
Asus TUF Gaming FX505DU-AL085T (NVIDIA GeForce GTX 1660 Ti Mobile, 15.60")
» Asus TUF Gaming FX505DU-AL085T - External Review
Asus TUF Gaming FX505DV-AL014 (NVIDIA GeForce RTX 2060 Mobile, 15.60")
» Asus TUF Gaming FX505DV-AL014 - External Review
Asus Zephyrus G GA502DU-AL025T (NVIDIA GeForce GTX 1660 Ti Mobile, 15.60")
» Asus Zephyrus G GA502DU-AL025T - External Review
Asus Zephyrus G15 GA502DU-BQ015T (NVIDIA GeForce GTX 1660 Ti Max-Q, 15.60")
» Asus Zephyrus G15 GA502DU-BQ015T - External Review
HP Gaming Pavilion 15-ec0001ns (AMD Vega 10, 15.60")
» HP Gaming Pavilion 15-ec0001ns - External Review
HP Pavilion Gaming 15-ec0003ns (NVIDIA GeForce GTX 1650 Mobile, 15.60")
» HP Pavilion Gaming 15-ec0003ns - External Review
HP Pavilion Gaming 15-ec0012ng (NVIDIA GeForce GTX 1660 Ti Mobile, 15.60")
» HP Pavilion Gaming 15-ec0012ng - External Review
HP Pavilion Gaming 15-ec0014nl (NVIDIA GeForce GTX 1650 Mobile, 15.60")
» HP Pavilion Gaming 15-ec0014nl - External Review
HP Pavilion Gaming 15-ec0017ng (NVIDIA GeForce GTX 1660 Ti Max-Q, 15.60")
» HP Pavilion Gaming 15-ec0017ng - External Review
HP Pavilion Gaming 15-ec0022ax (NVIDIA GeForce GTX 1660 Ti Mobile, 15.60")
» HP Pavilion Gaming 15-ec0022ax - External Review
MSI Alpha 15 A3DDK (AMD Radeon RX 5500M, 15.60")
» MSI Alpha 15 A3DDK - External Review
MSI Alpha 15 A3DDK-001XES (AMD Radeon RX 5500M, 15.60")
» MSI Alpha 15 A3DDK-001XES - External Review
MSI Alpha 15 A3DDK-007NL (AMD Radeon RX 5500M, 15.60")
» MSI Alpha 15 A3DDK-007NL - External Review
Other CPUs of the series Picasso (Ryzen 3000 APU)
» AMD Ryzen 7 3780U
4x 2.3 GHz - 4 GHz
» AMD Ryzen 5 3580U
4x 2.1 GHz - 3.7 GHz
» AMD Ryzen 3 3300U
4x 2.1 GHz - 3.5 GHz
» AMD Ryzen 3 PRO 3300U
4x 2.1 GHz - 3.5 GHz
Surrounding CPUs
+ Intel Core i7-4870HQ
4x 2.5 GHz - 3.7 GHz
+ Intel Core i5-1035G7
4x 1.2 GHz - 3.7 GHz
+ Intel Core i5-1035G4
4x 1.1 GHz - 3.7 GHz
- Intel Core i5-10310U
4x 1.7 GHz - 4.4 GHz
- Intel Core i5-1035G1
4x 1 GHz - 3.6 GHz
Please share our article, every link counts!
Klaus Hinum (Update: 2020-01-30)