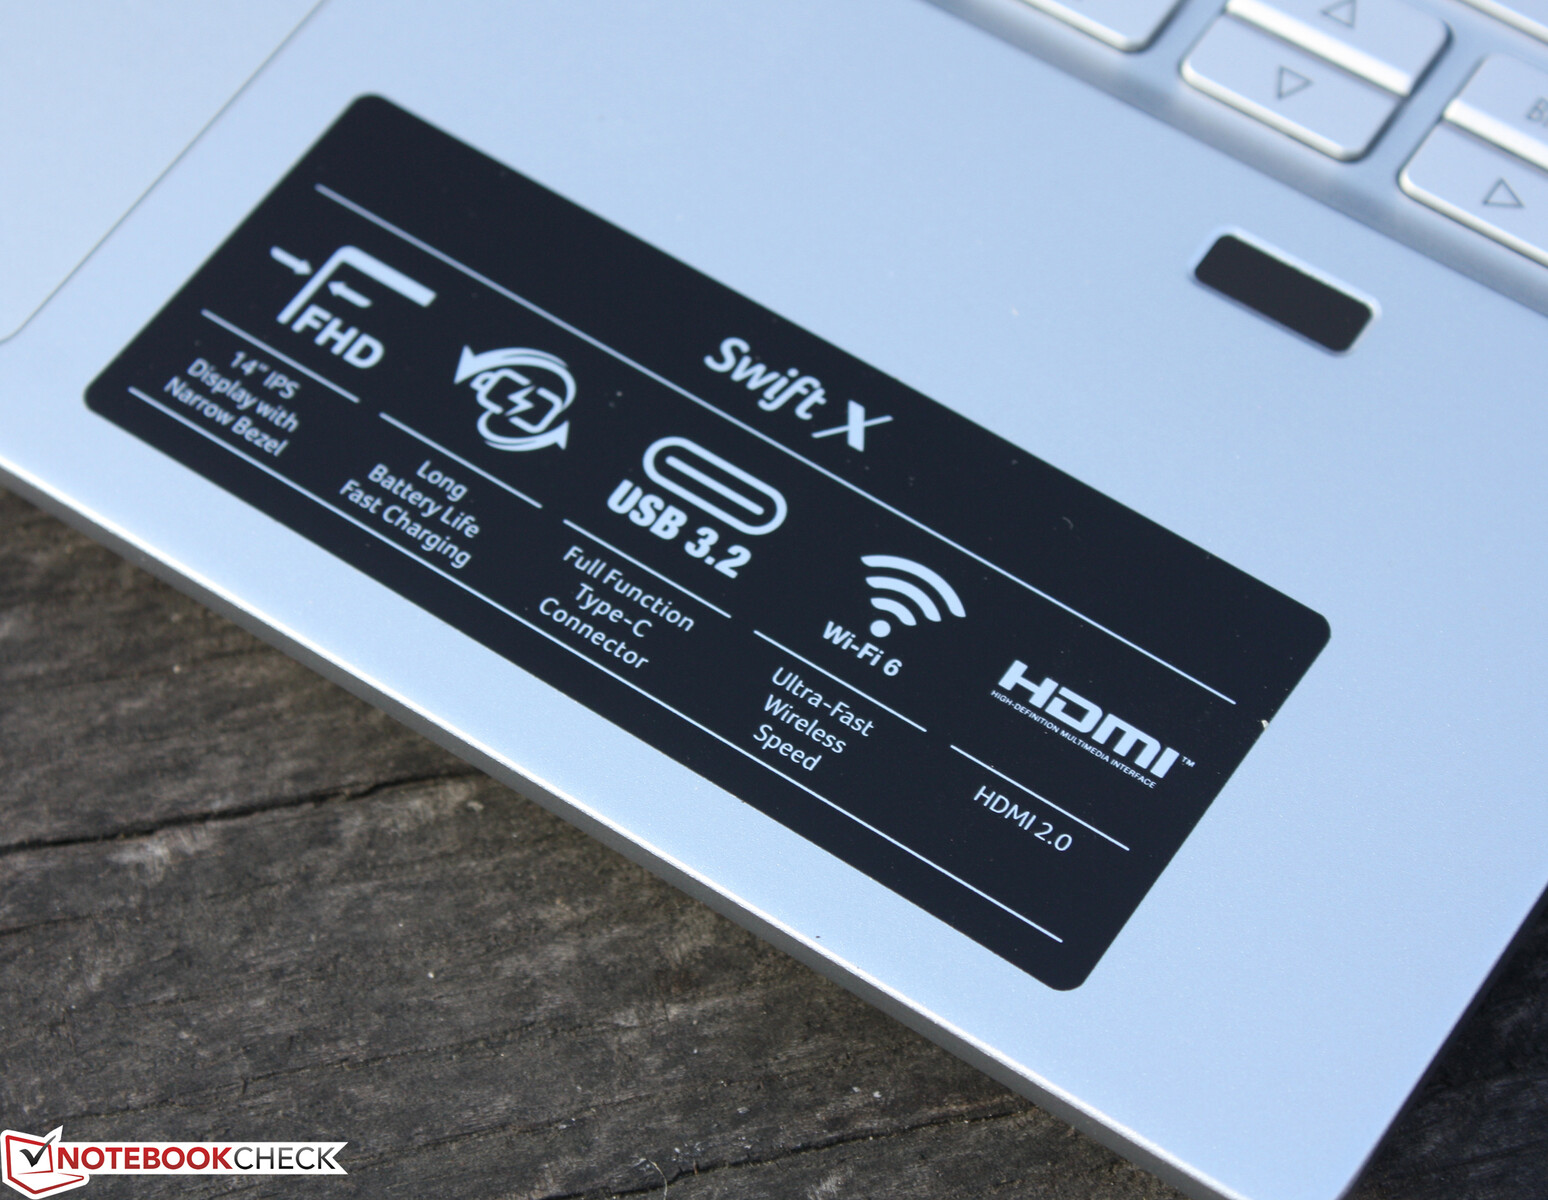
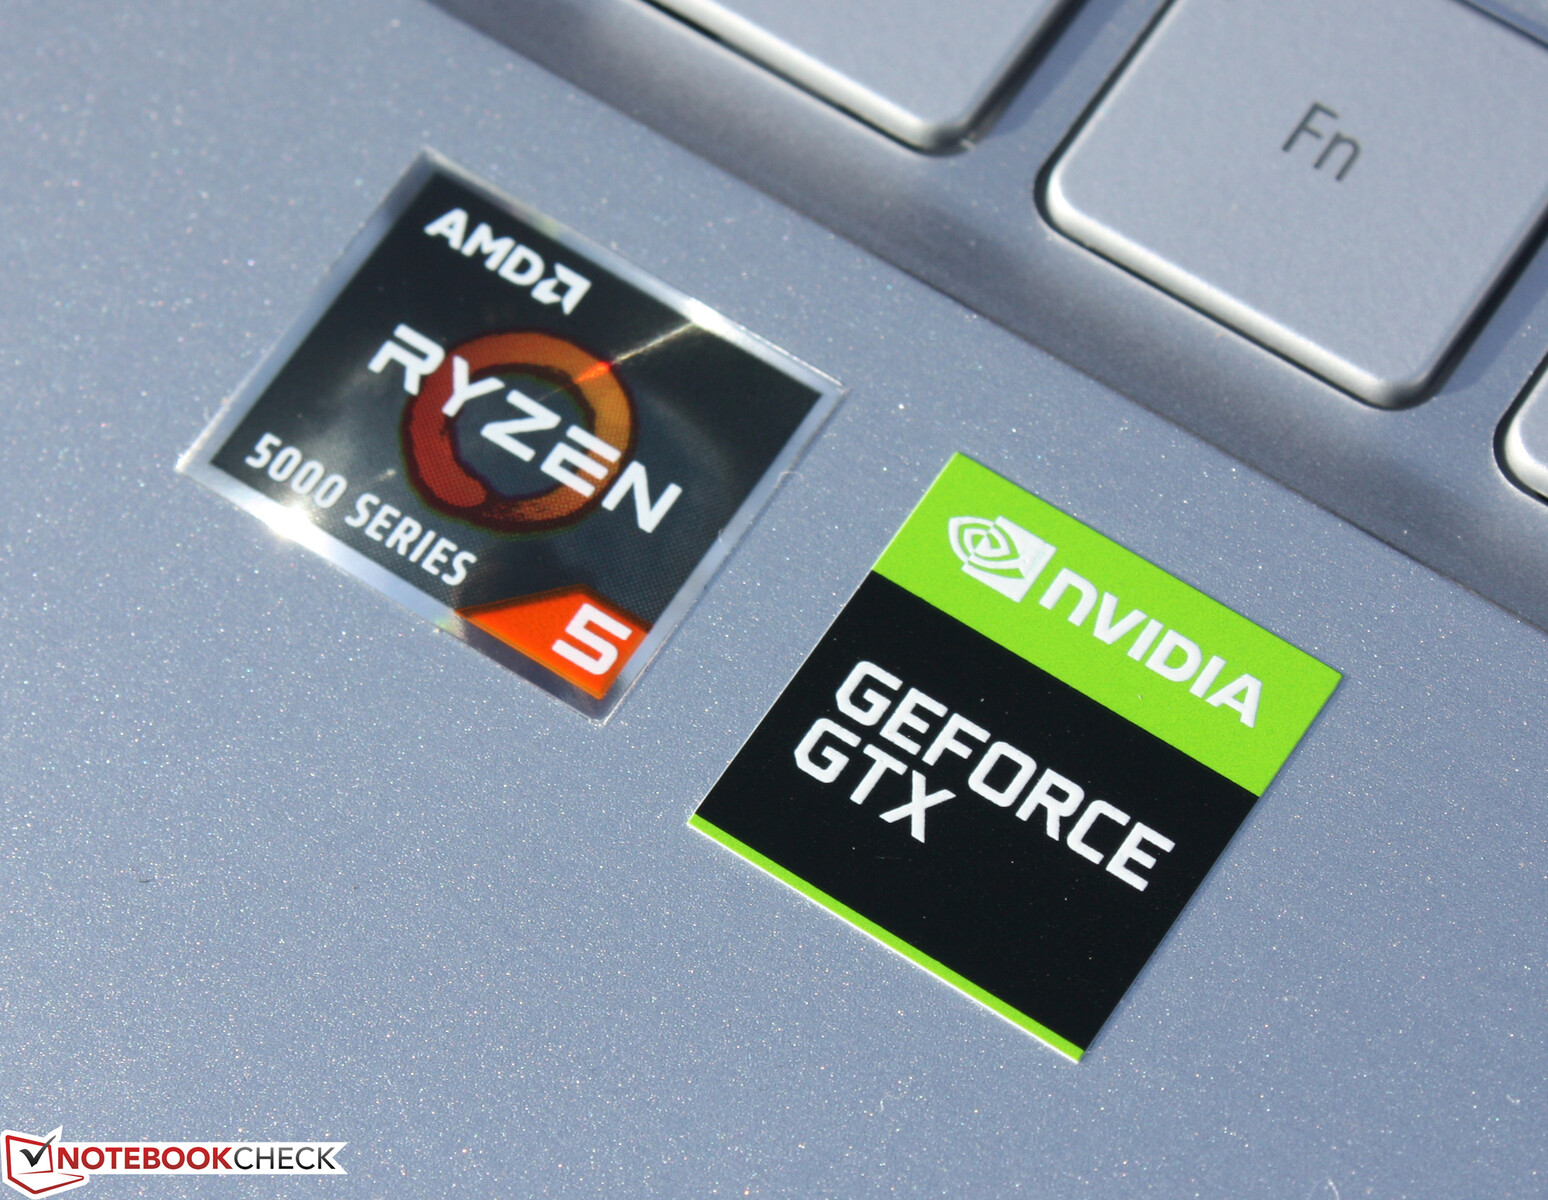
配备GTX1650的宏碁Swift X SFX14回顾: 斯威夫特Ryzen笔记本电脑

通过Swift X SFX14-41G,宏碁解决了那些正在寻找具有体面的游戏性能的轻型办公设备的潜在买家。这些用户会避开一个 Swift 3 SF314-511,这是14英寸笔记本电脑的大部分类似的英特尔版本。有了Iris Xe图形,后者就显得太温顺了。尽管制造商已经提高了对Swift 3X SF314-510的要求。 Swift 3X SF314-510G的整体性能,但其专用的 Iris Xe MAX图形的整体性能对游戏玩家来说是令人失望的,在大多数情况下不足以在高设置下进行全高清游戏。
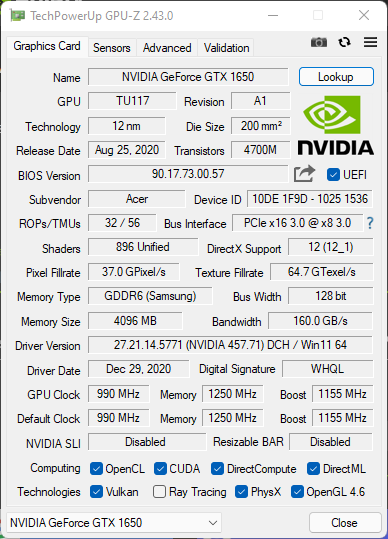
相反,宏碁试图用GTX 1650来打动其目标受众。 GTX 1650尽管2020年3月的dGPU已经不是全新的了,但它仍然接近我们第二性能层(共4层,1=最佳)的底部,与旧的 GeForce GTX 1060 Max-Q.正如本评论所显示的,它也将AMD和英特尔的iGPU甩在了后面。
其他相同的变体Swift X SFX14-41G-R1S3配备了一个 GeForce RTX 3050 Ti显示,我们还没有达到极限。我们还没有机会审查这个特定的单位,尽管我们目前正在试图得到一个样品。
还有更多有游戏愿望的轻薄笔记本电脑,宏碁宣布了其 Swift X14将于2022年1月发布。除了第12代英特尔处理器(桤木湖),X14还配备了 RTX 3050 Ti.14英寸IPS面板将被升级为支持2240 x 1400像素的分辨率。
更多宏碁Swift 14英寸笔记本电脑的评论。
- Acer Swift 3 SF314-511(i5-1135G7, Iris Xe Graphics G7 80EUs)
- Acer Swift 3X SF314-510G(i7-1165G7, Intel Iris Xe MAX)
- Acer Swift 3 SF314-43 (Ryzen 5 5500U, Radeon RX) - 审查中
- Acer Swift 3 SF314-42(Ryzen 7 4700U, Radeon RX) - 6/2020
潜在的竞争对手比较
Rating | Date | Model | Weight | Height | Size | Resolution | Price |
|---|---|---|---|---|---|---|---|
| 85.6 % v7 (old) | 03 / 2022 | Acer Swift X SFX14-41G-R7F3 R5 5500U, GeForce GTX 1650 Mobile | 1.4 kg | 18.89 mm | 14.00" | 1920x1080 | |
| 88.2 % v7 (old) | 02 / 2022 | Acer Swift 3 SF314-511-54ZK i5-1135G7, Iris Xe G7 80EUs | 1.2 kg | 16.55 mm | 14.00" | 1920x1080 | |
| 86.5 % v7 (old) | 02 / 2021 | HP Envy 14-eb0010nr i5-1135G7, GeForce GTX 1650 Ti Max-Q | 1.6 kg | 17.9 mm | 14.00" | 1920x1200 | |
| 86.1 % v7 (old) | 12 / 2021 | Acer Swift 3X SF314-510G-70DW i7-1165G7, Xe MAX | 1.4 kg | 17.9 mm | 14.00" | 1920x1080 | |
| 86.3 % v7 (old) | Lenovo IdeaPad 5 14ALC05 82LM005YGE R5 5500U, Vega 7 | 1.4 kg | 19.1 mm | 14.00" | 1920x1080 | ||
| 82.5 % v7 (old) | 01 / 2021 | MSI Prestige 14 Evo A11M-005 i7-1185G7, Iris Xe G7 96EUs | 1.2 kg | 16 mm | 14.00" | 1920x1080 |
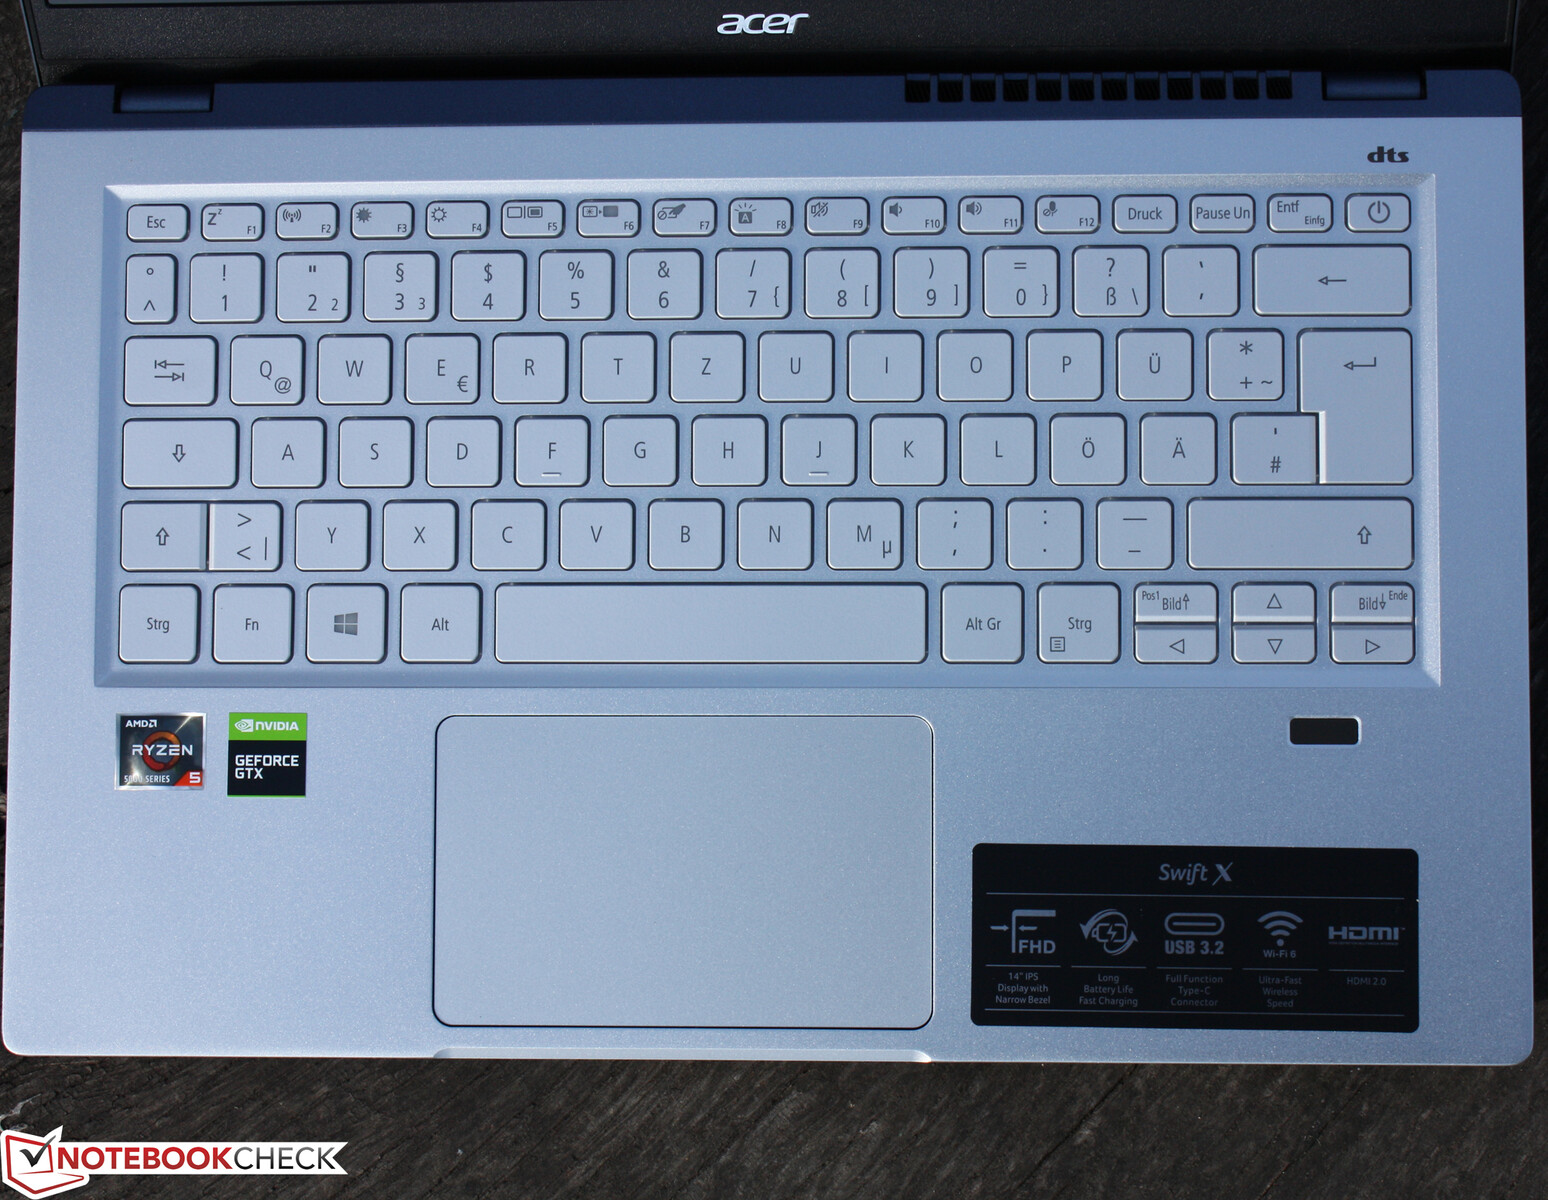
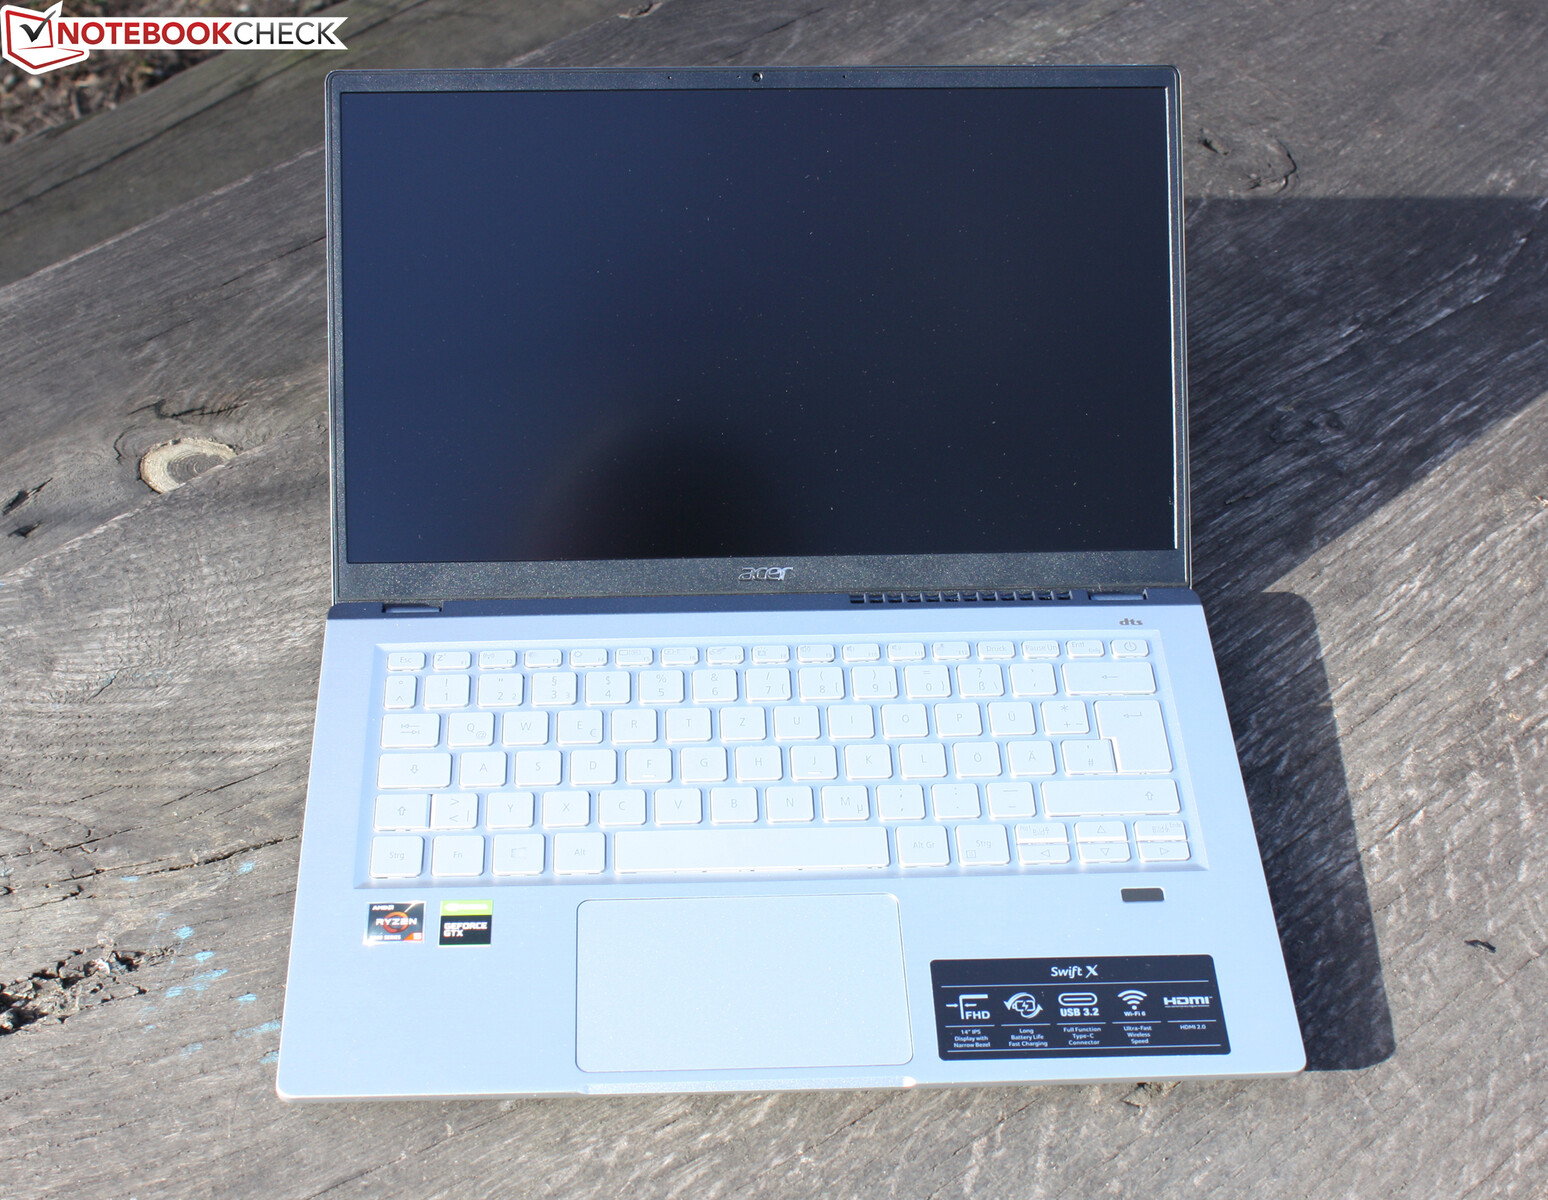
箱子 - 具有坚实工艺的Swift X
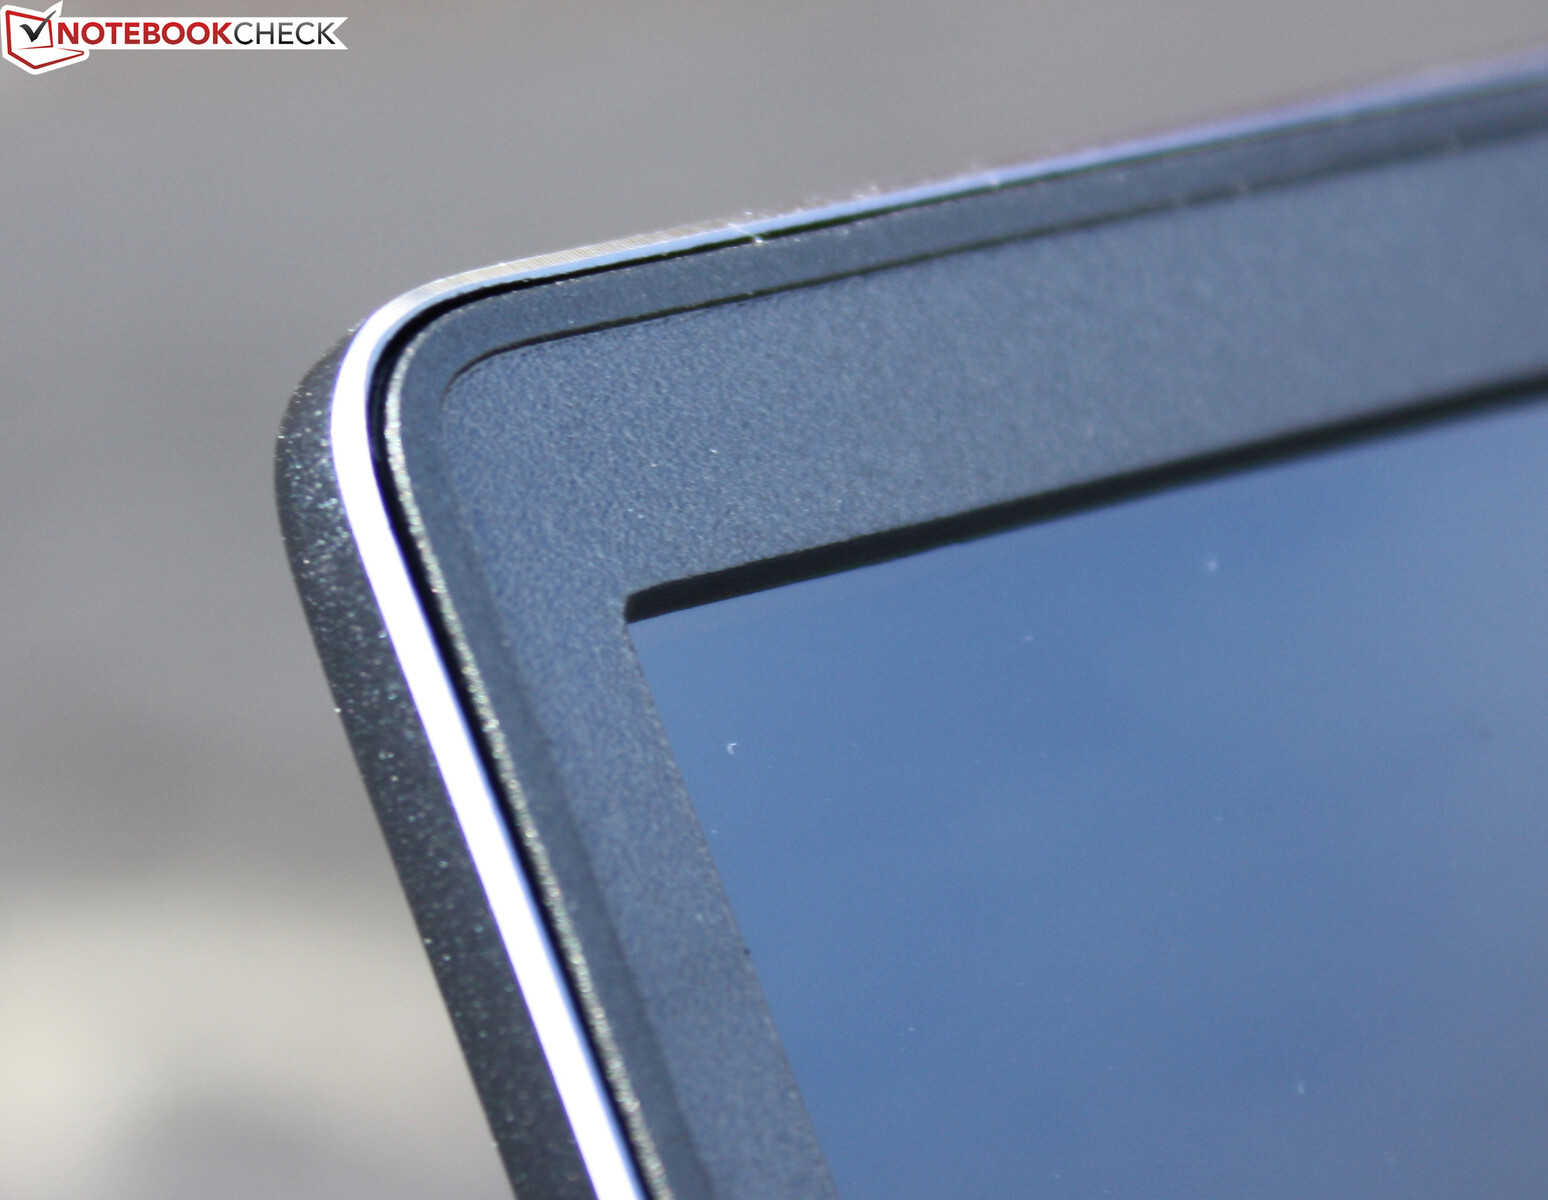
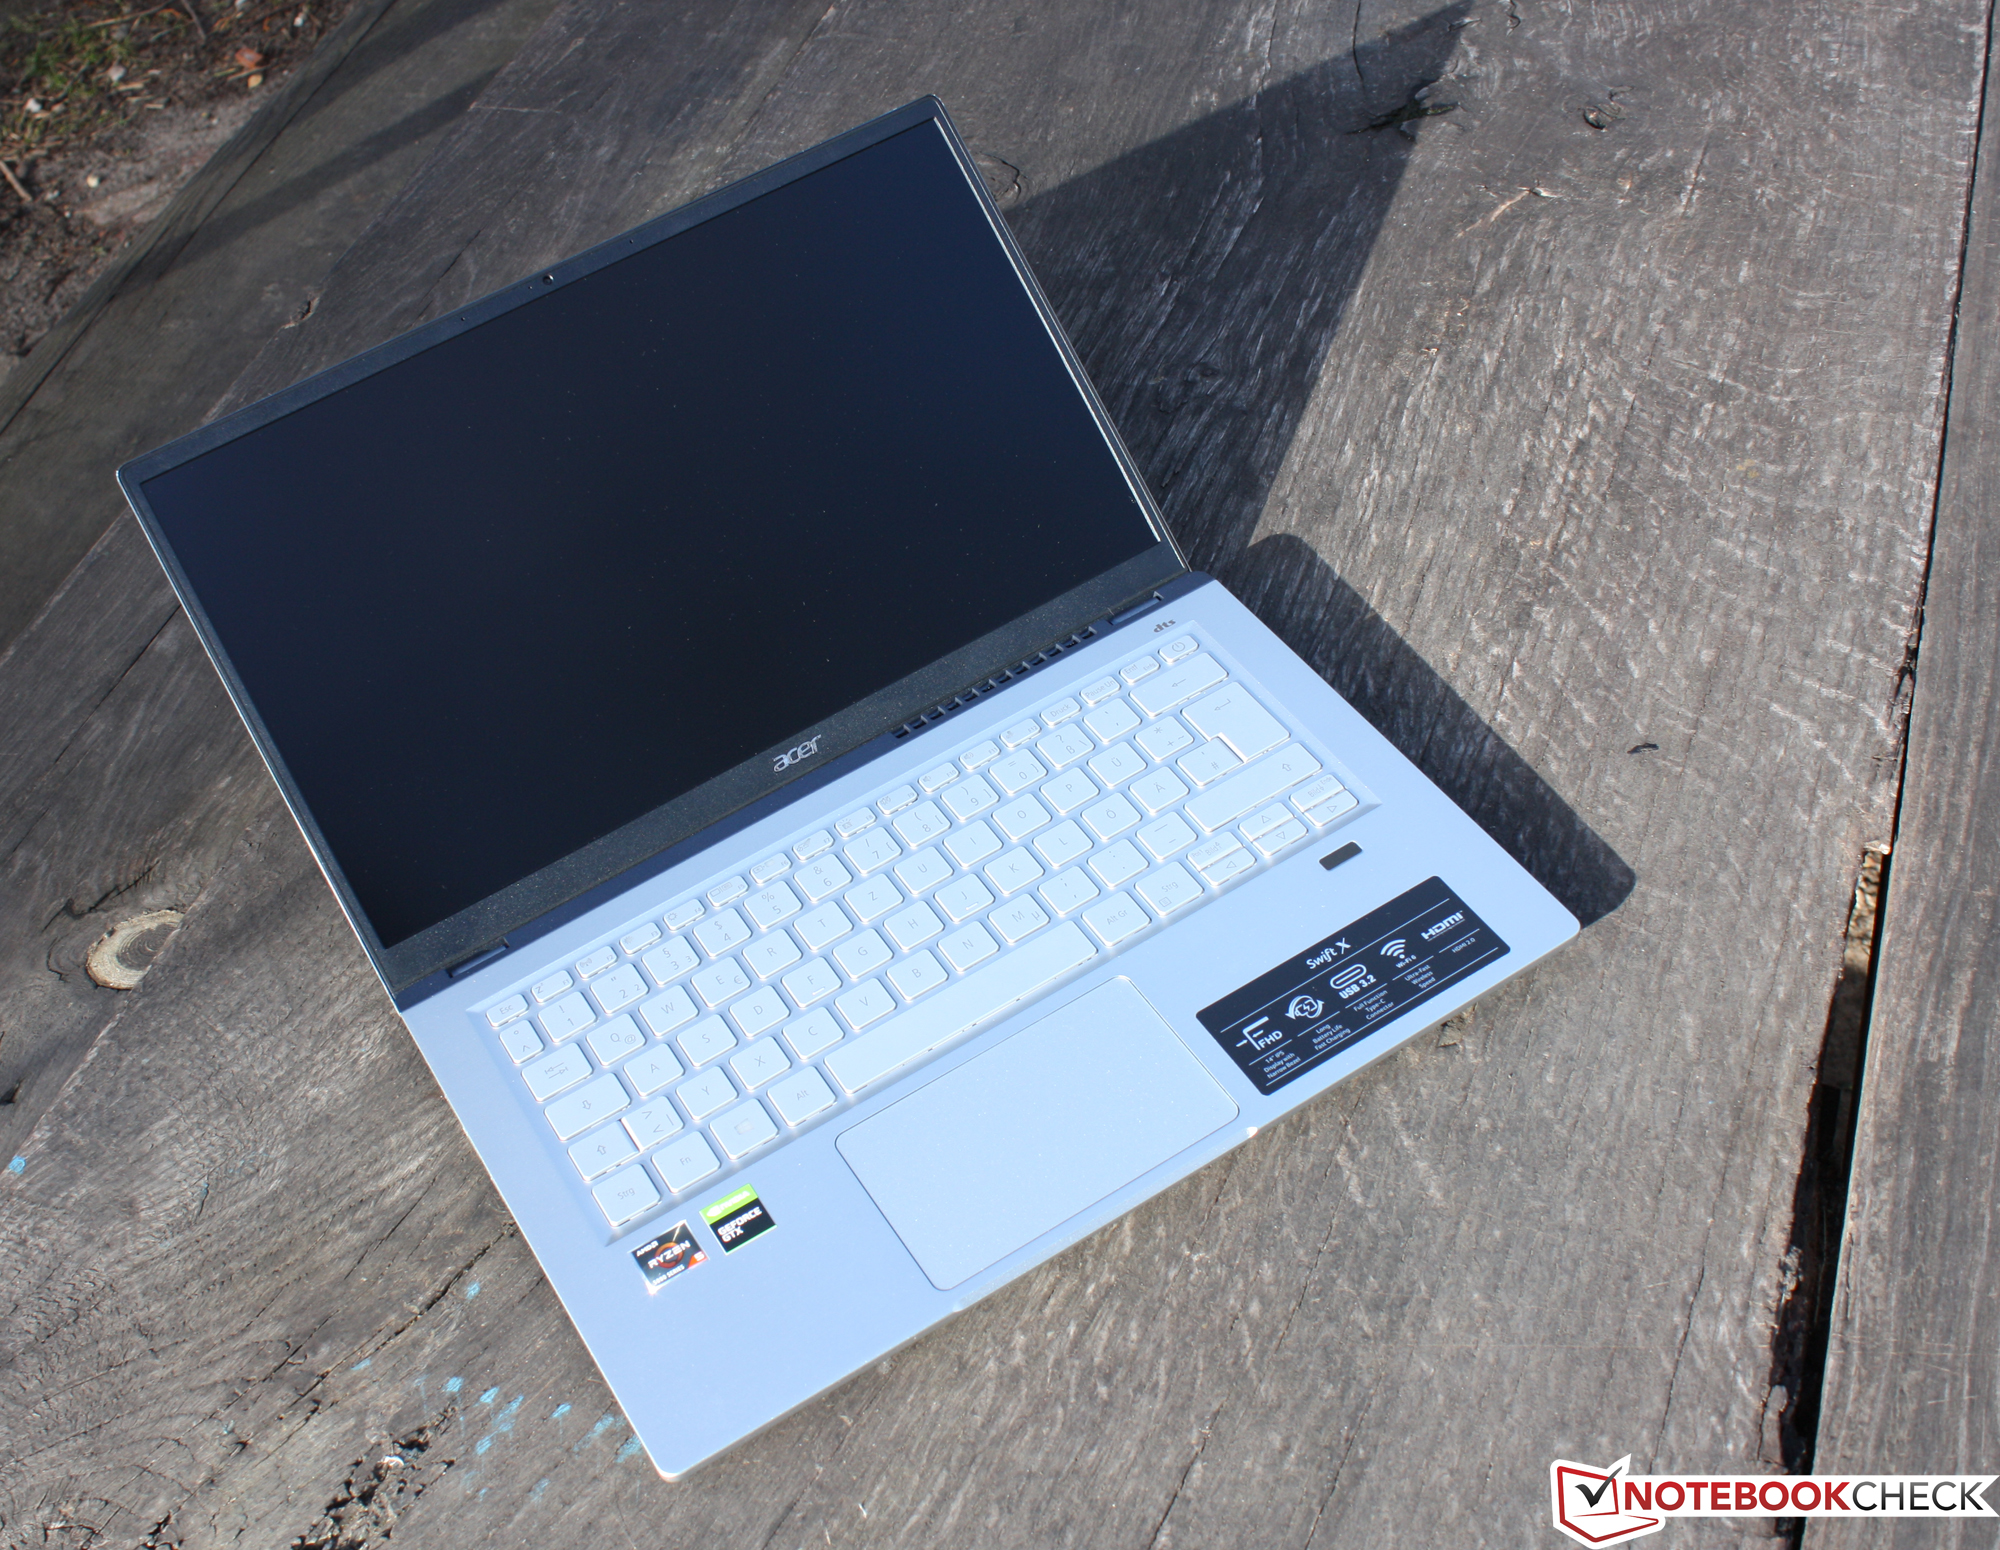
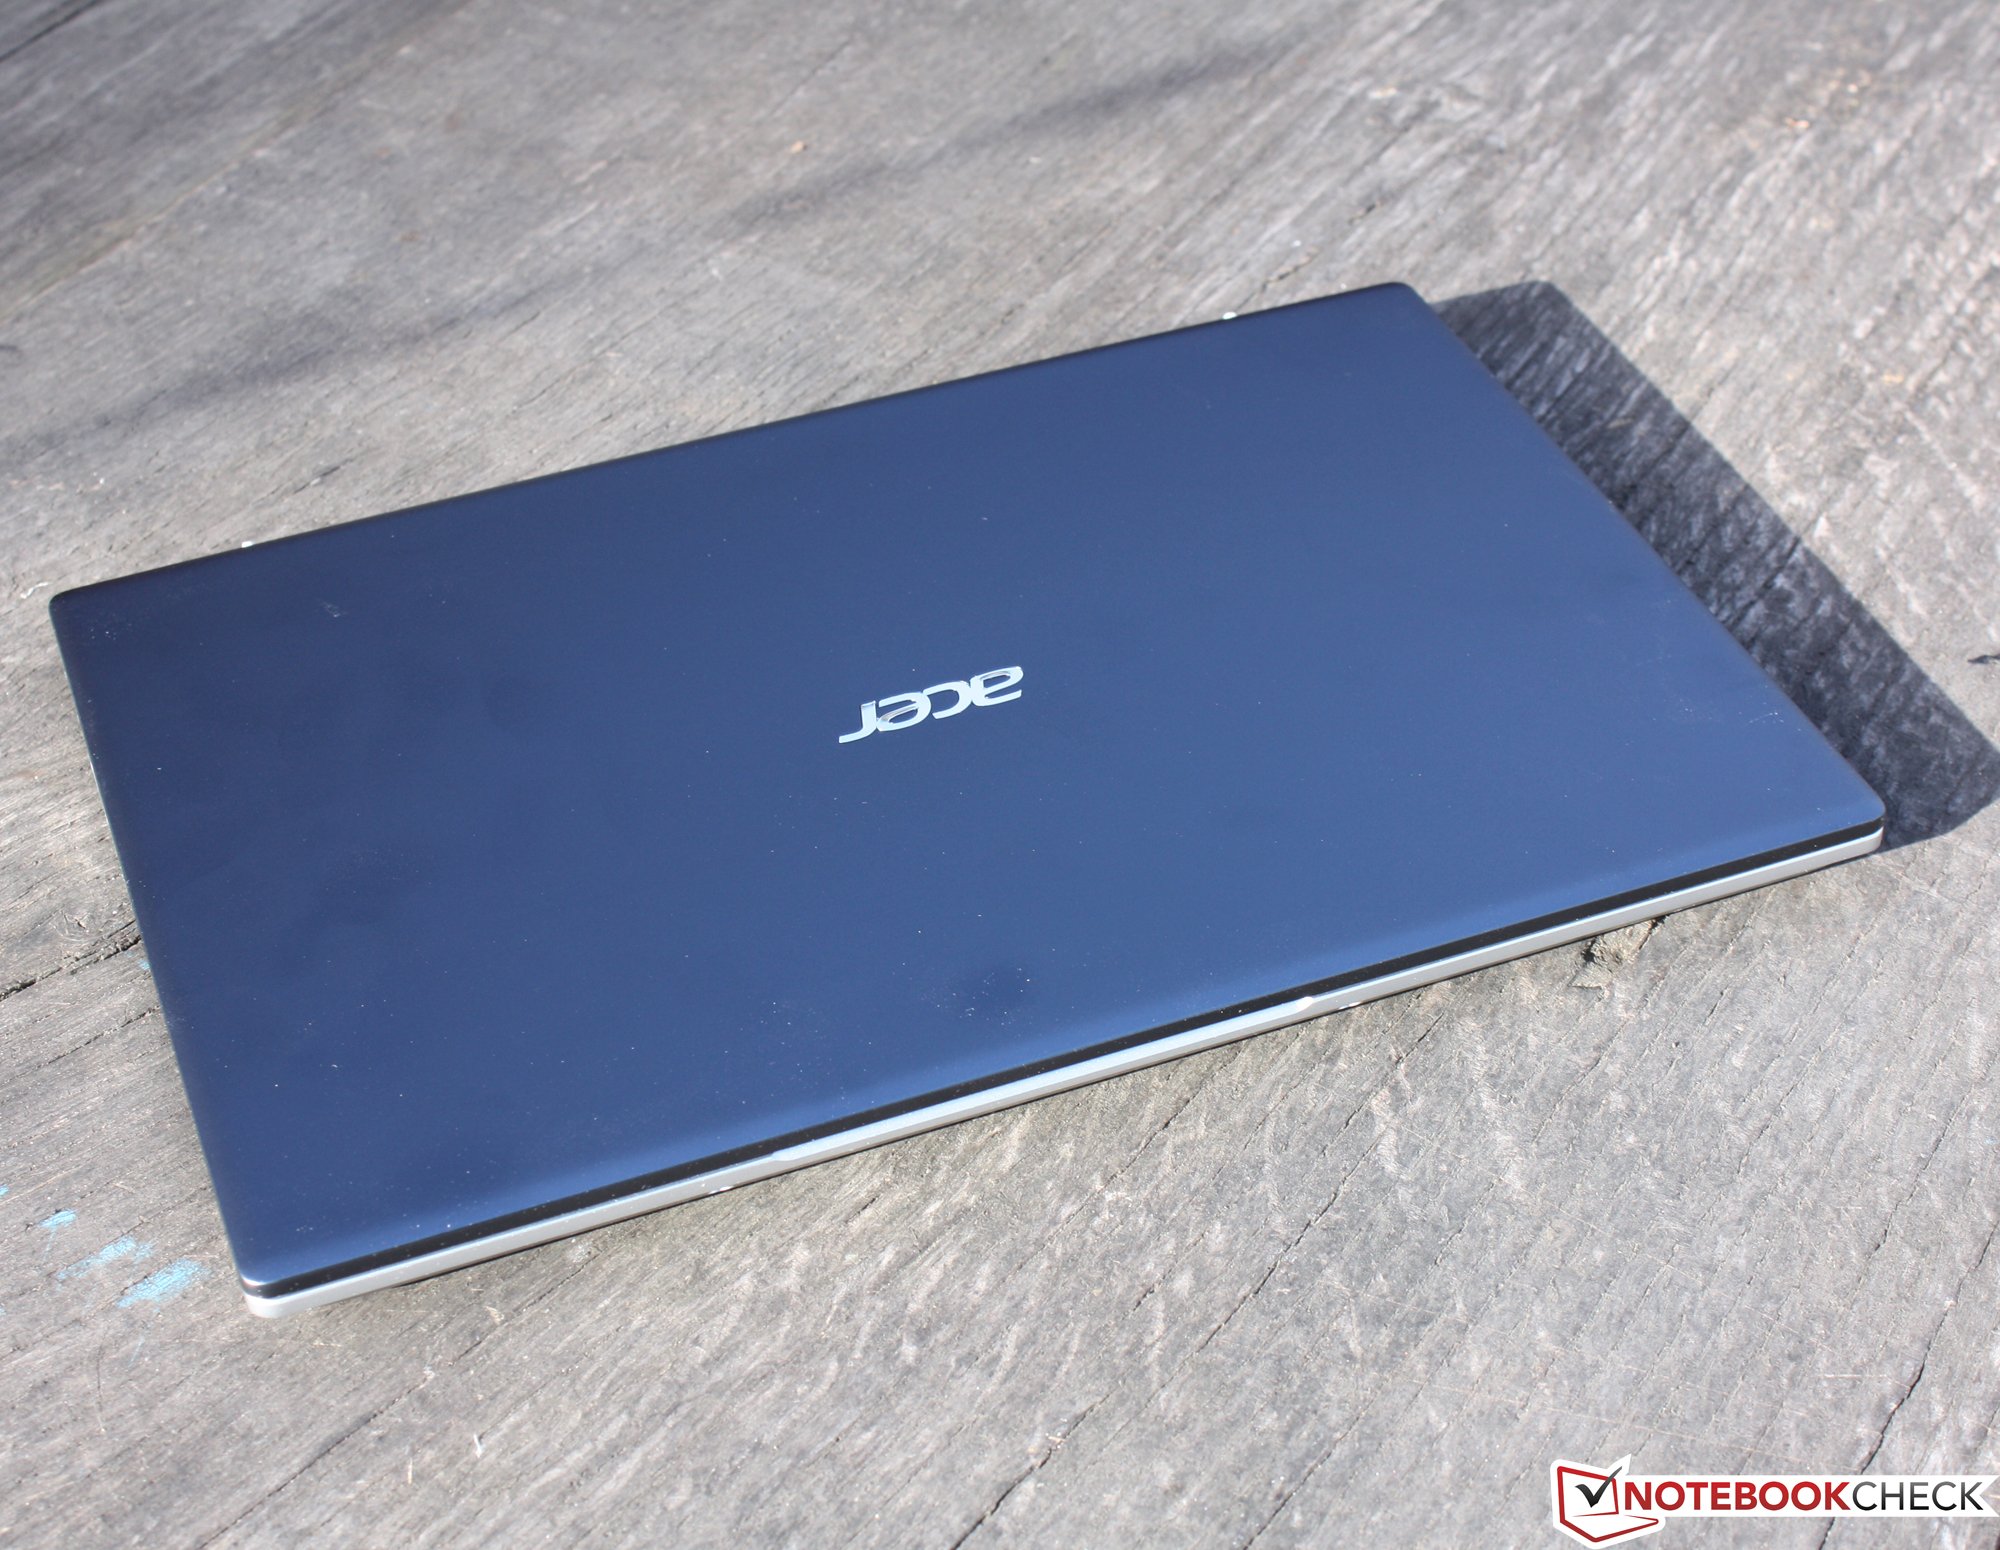
宏碁选择在顶部和底部的外壳以及盖子上都使用金属。虽然光滑、纤细的铝制外壳并不特别华丽,但有一些高级的亮点,特别是当同时考虑到边缘和角落的坚实触觉。
机箱采用哑光银色表面,与黑色塑料边框形成对比,周围是抛光的框架。盖子和靠近铰链的后部区域为深蓝色。
间隙均匀,没有材料突起。宏碁没有显示出任何刚性问题,而且基本单元可以抵御来自角落的扭曲。在同样的情况下,盖子略微倾斜,尽管这并不扭曲显示器上的图像。
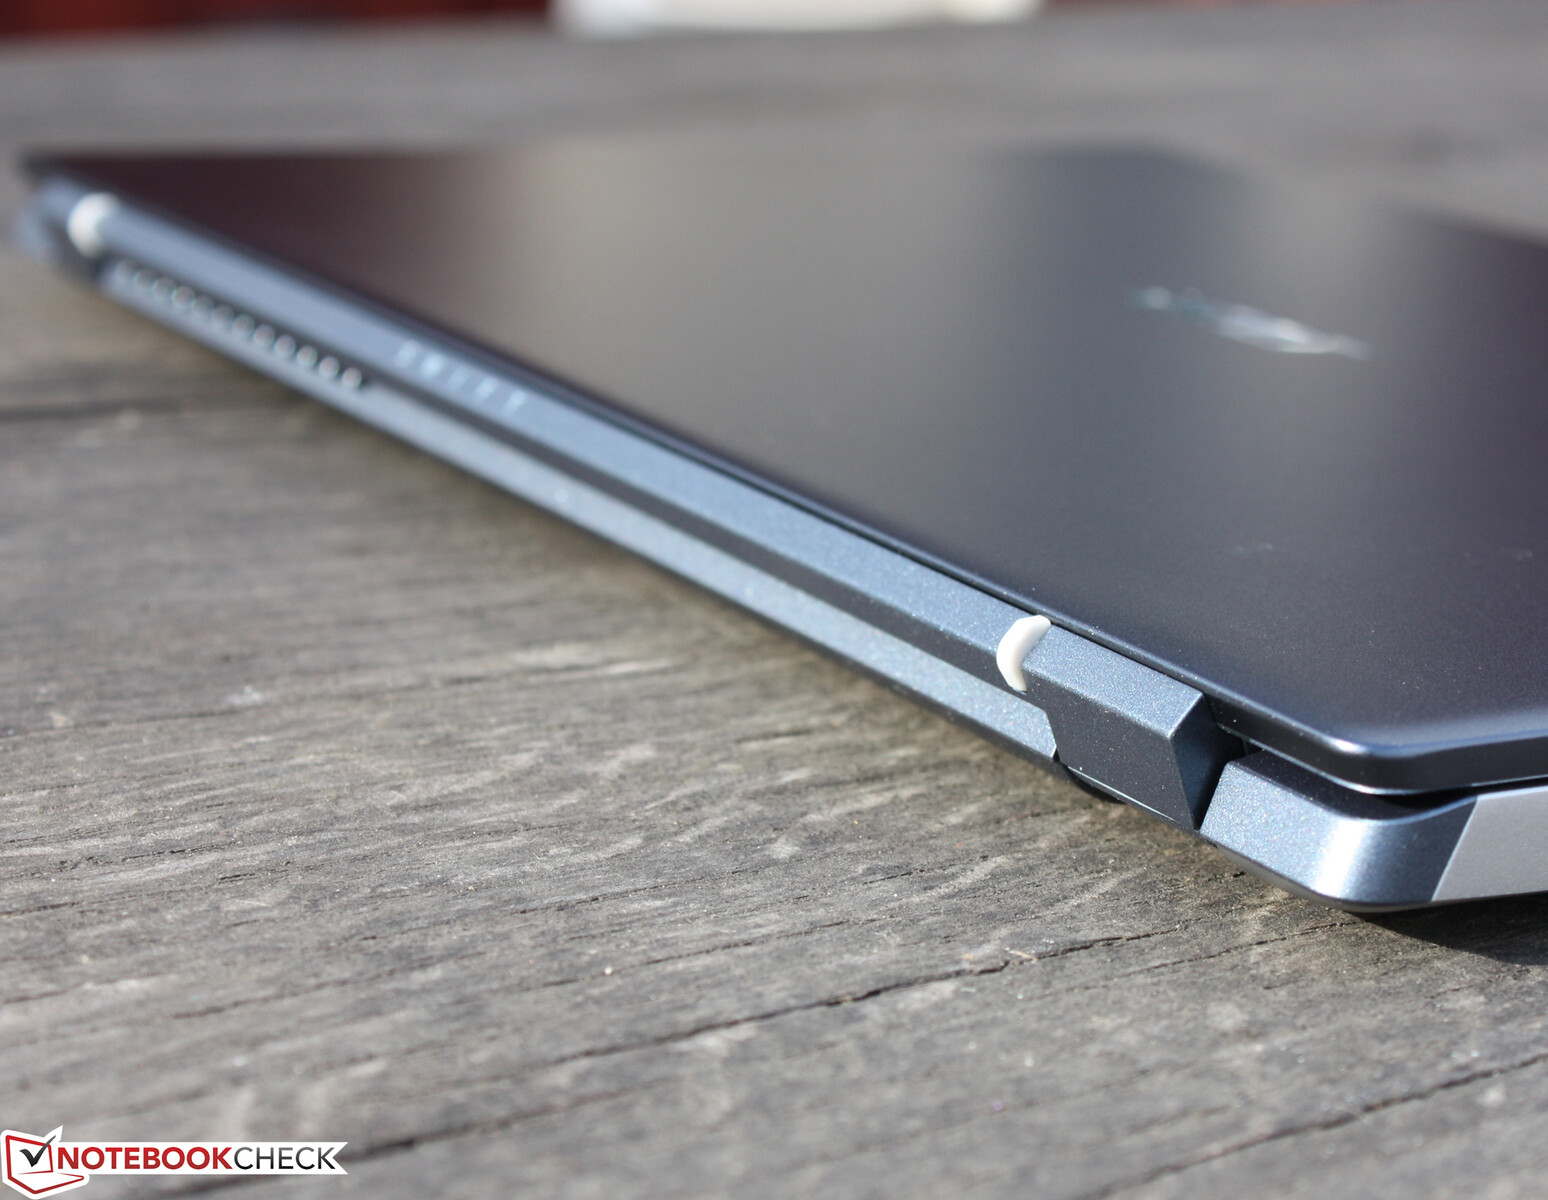
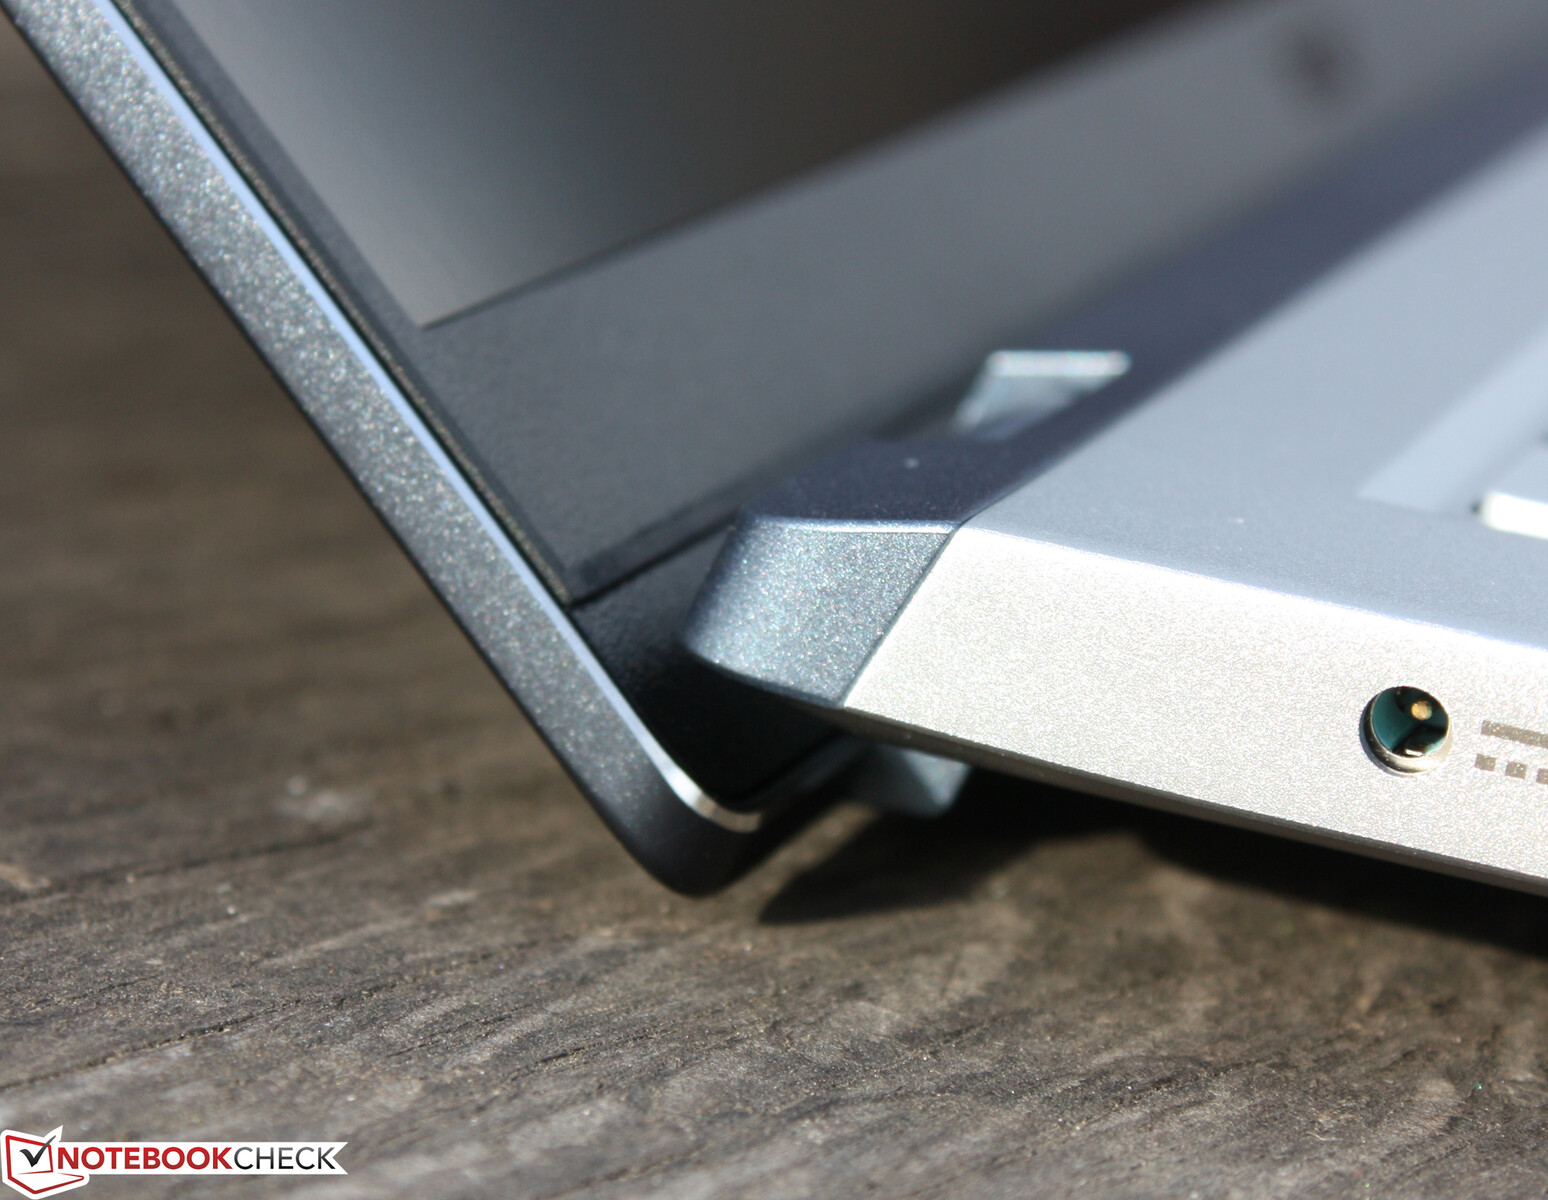
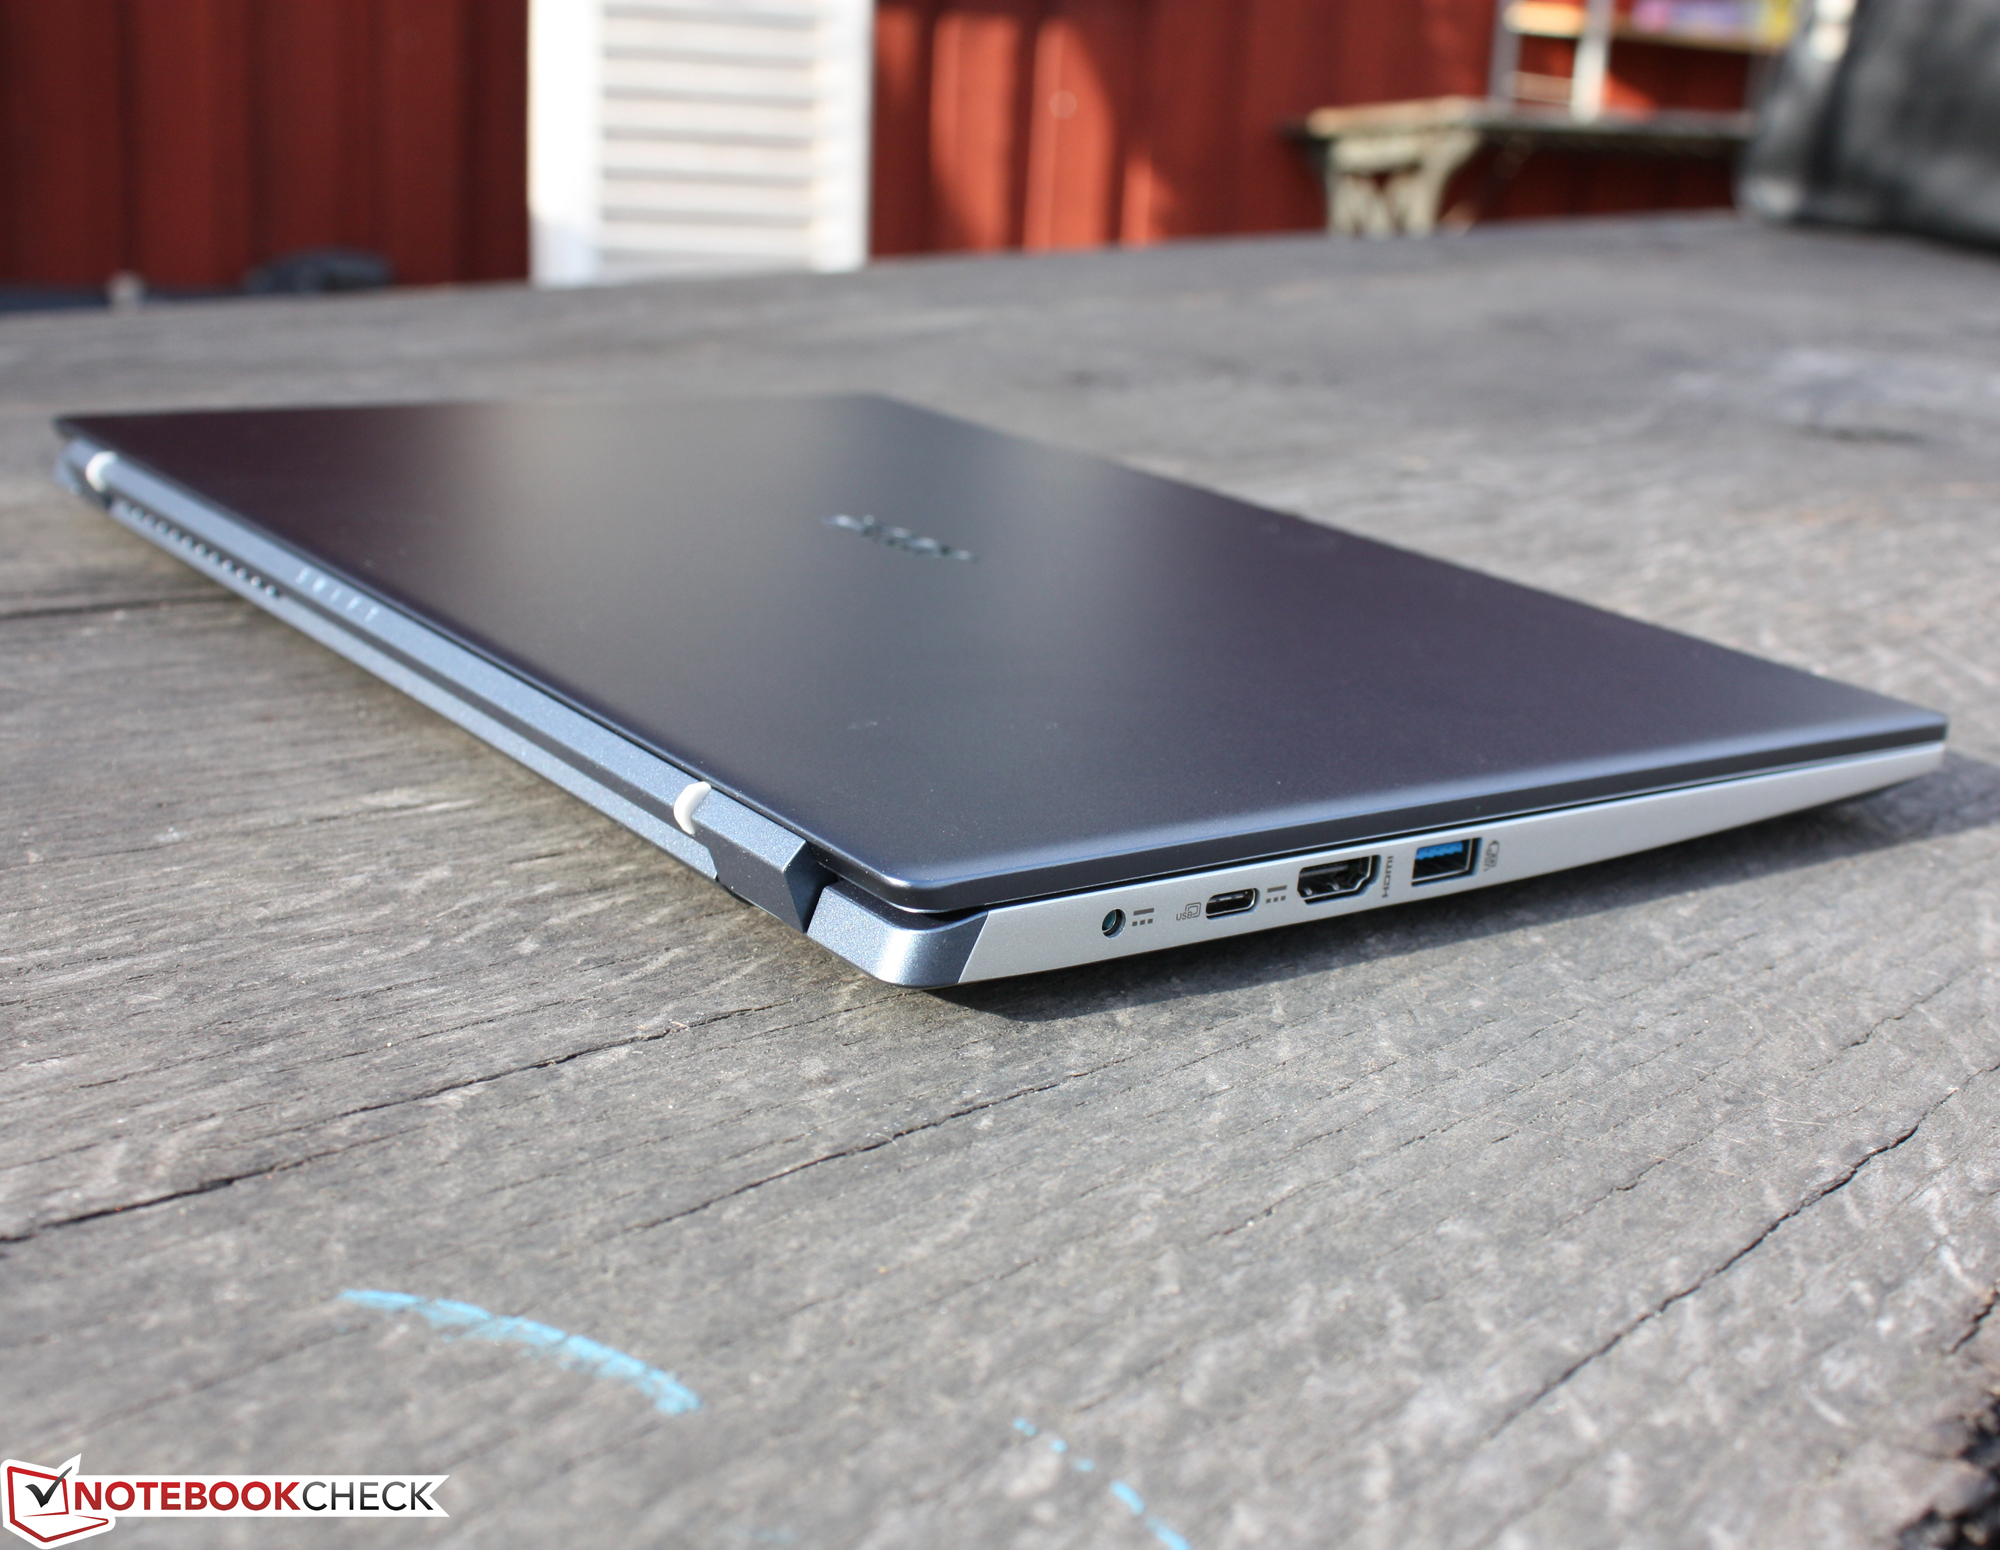
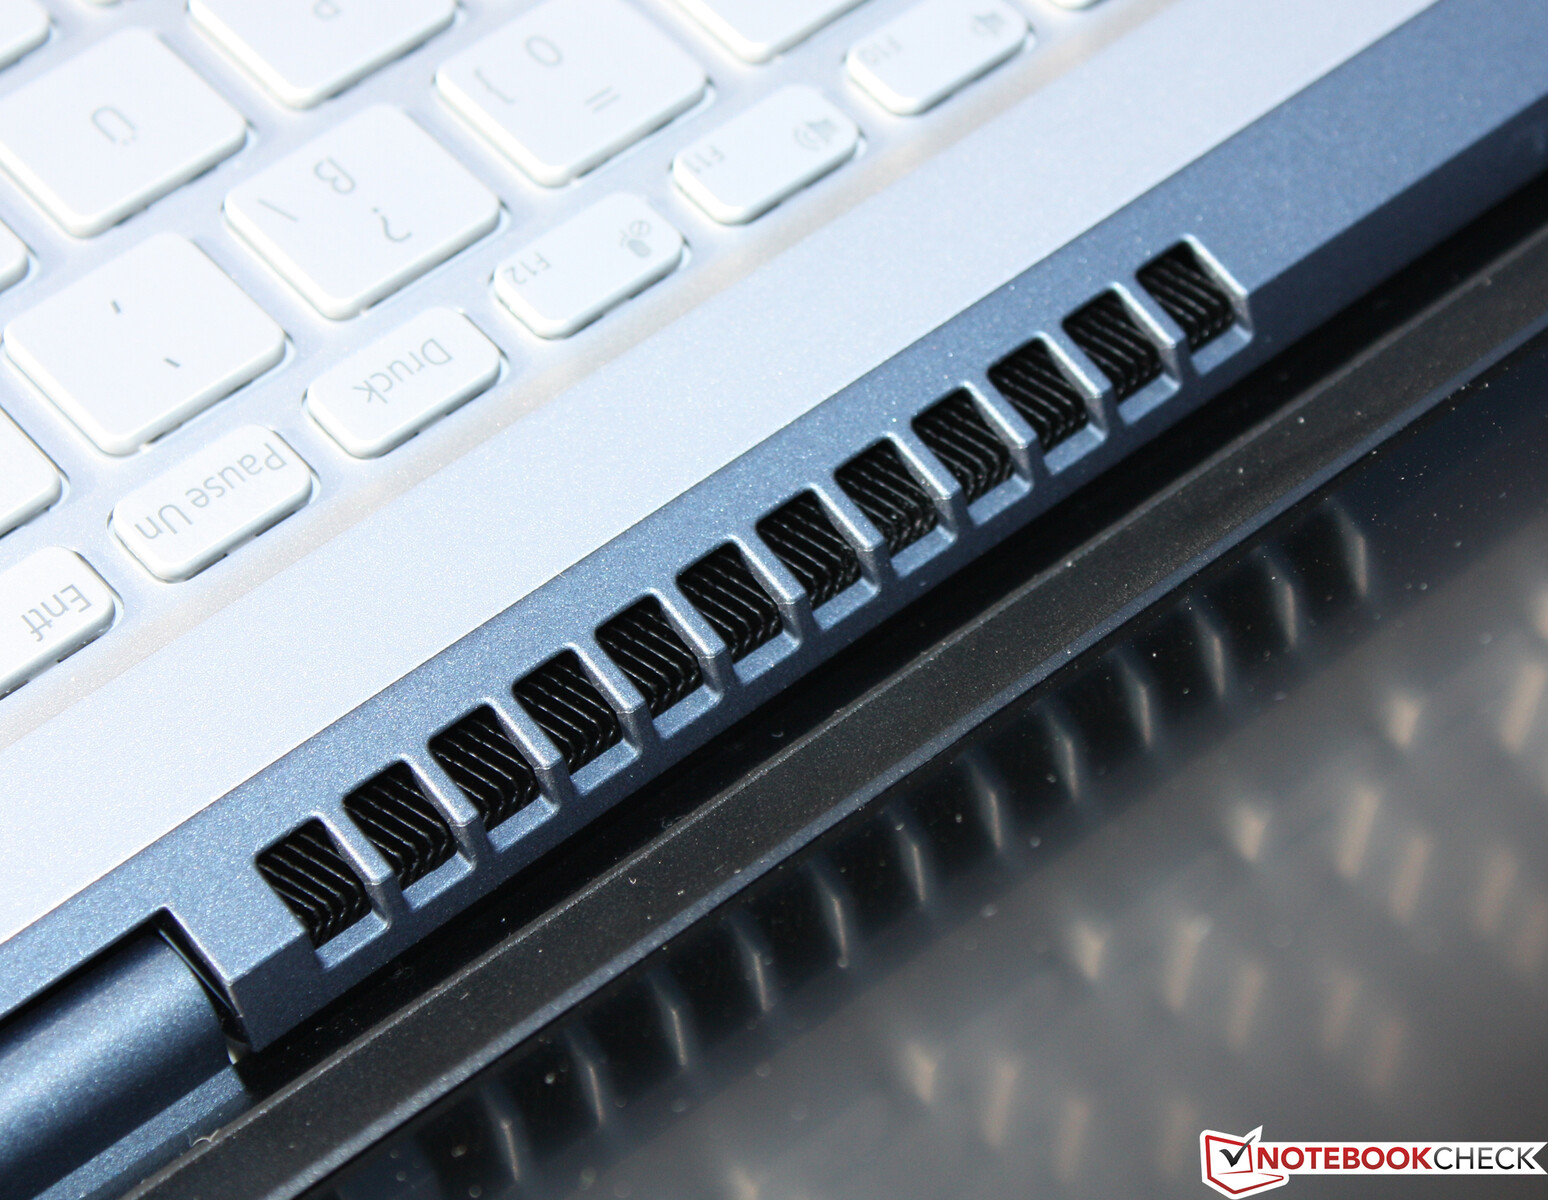
双铰链和显示屏,在打开时滑落到机箱下面,是一个重要的细节。这将基础单元抬起来,以改善底部平坦的进气口所带来的空气流通。
我们对坚固的铰链感到满意,它能可靠地防止运输设备时的摇晃。显示屏可以打开到130度的最大角度。盖子可以单手打开,而不需要把底座固定在原处。
在我们的尺寸比较中,Envy 14是最大的候选者,虽然它不比我们的Swift X厚,但它明显更深。这台 Swift 3 SF314-511甚至比我们的测试设备更薄,为16.5毫米对19毫米(0.65对0.75英寸)。此外,它拥有令人难以置信的低重量,只有1.2公斤对1.4公斤(2.65磅对3.09磅)。dGPU和相关的热管铜似乎也是一个因素。
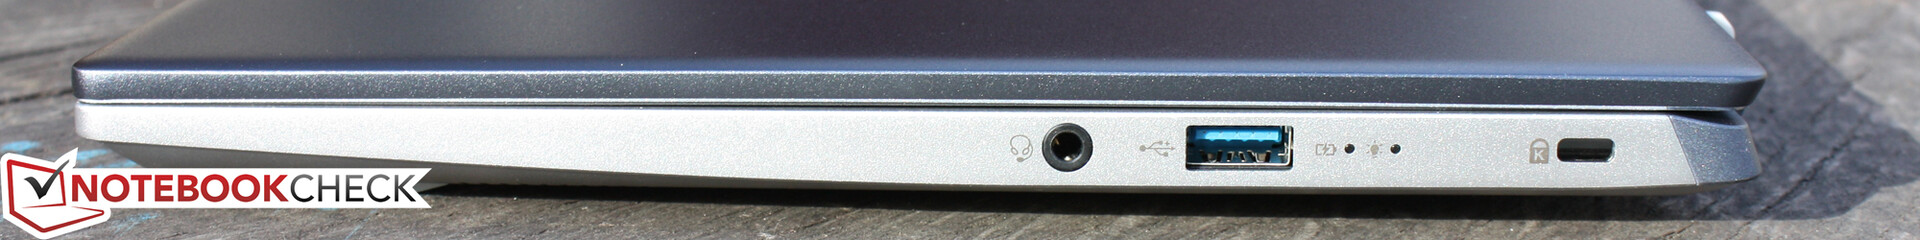
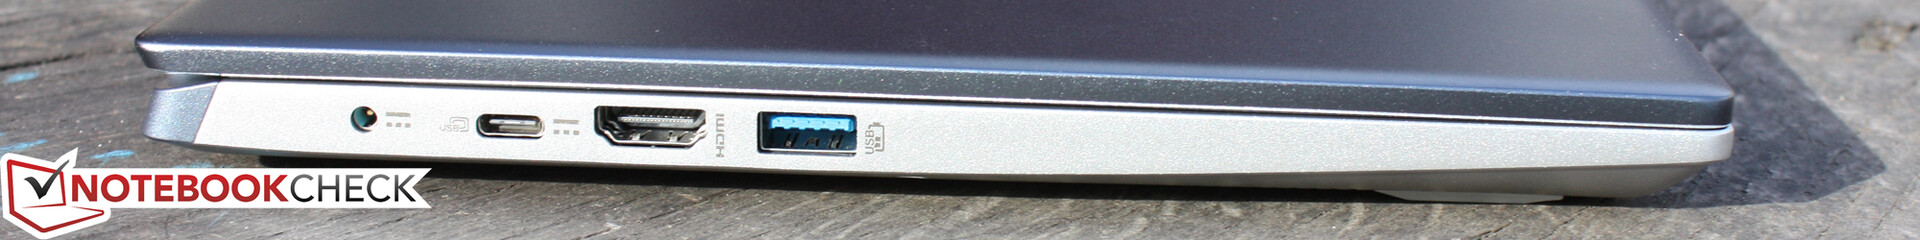
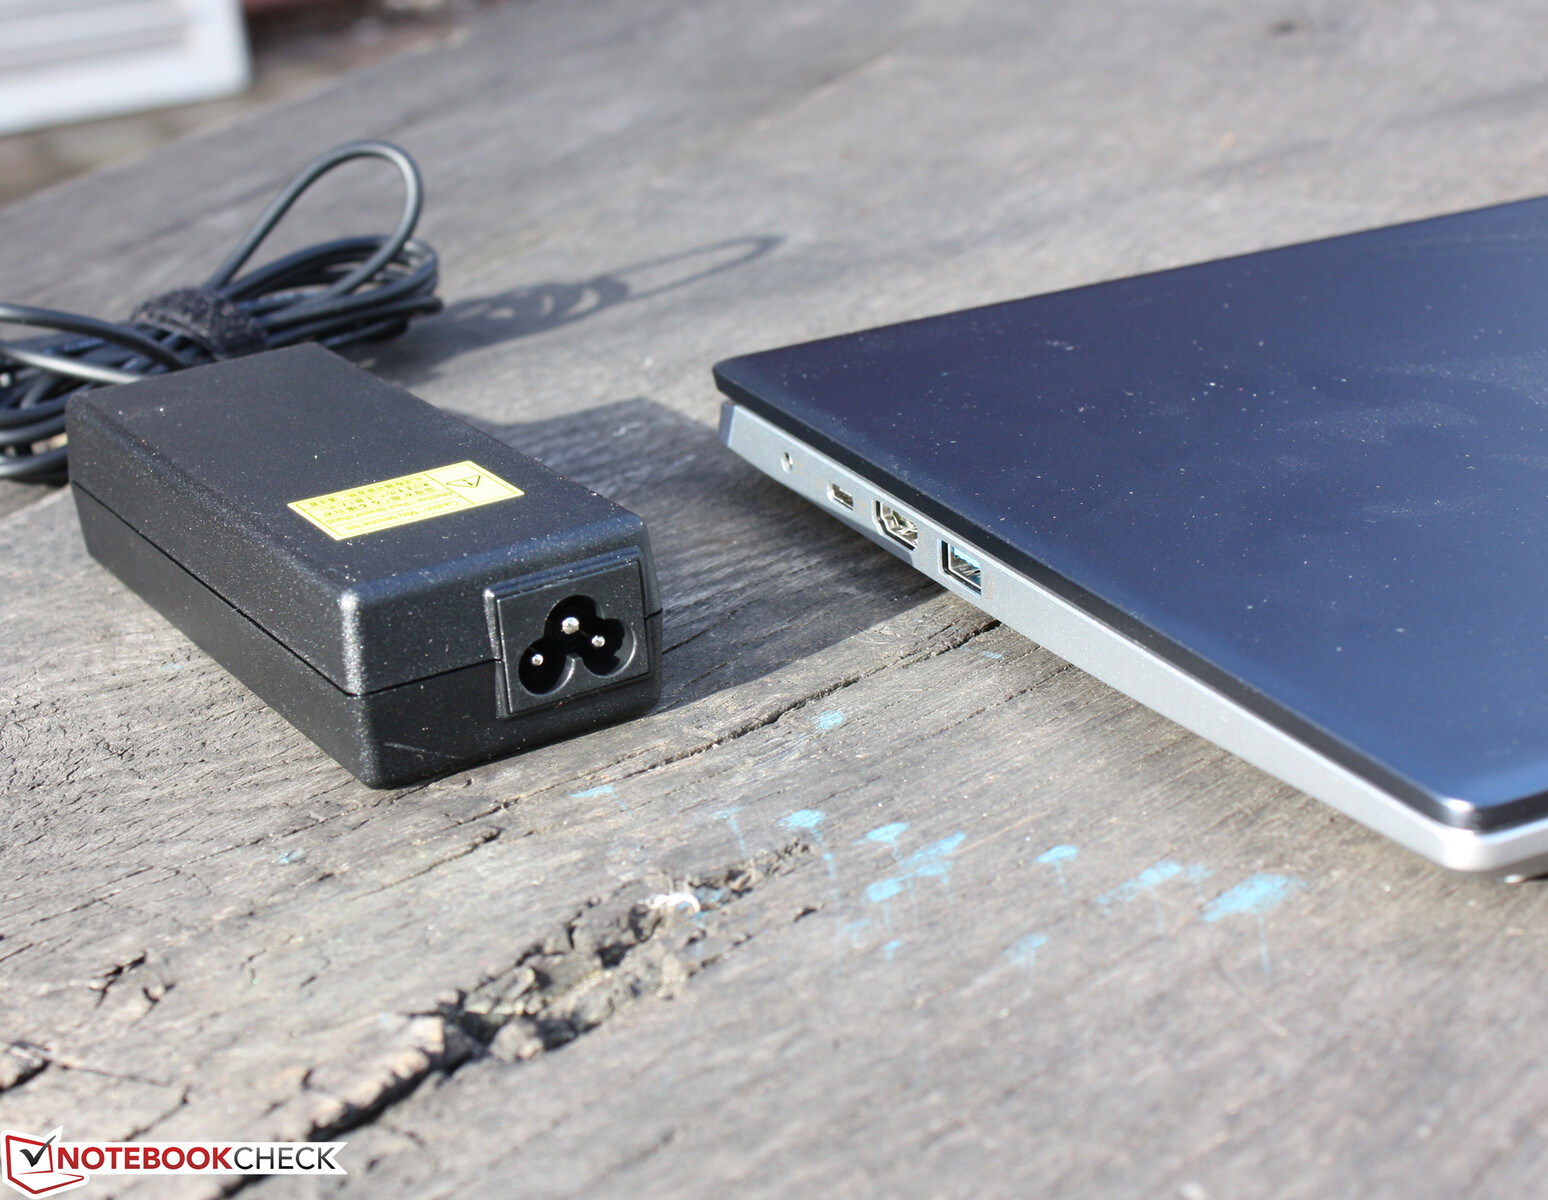
连接性 - 用于Nvidia图形的90瓦PSU
笔记本电脑配备了两个USB Type-A端口。此外,还有一个USB Type-C端口,通过USB-C和Power Delivery(支持通过该端口为笔记本充电)提供DisplayPort。与HDMI端口相结合,Swift总共提供了两个视频输出。没有集成读卡器。
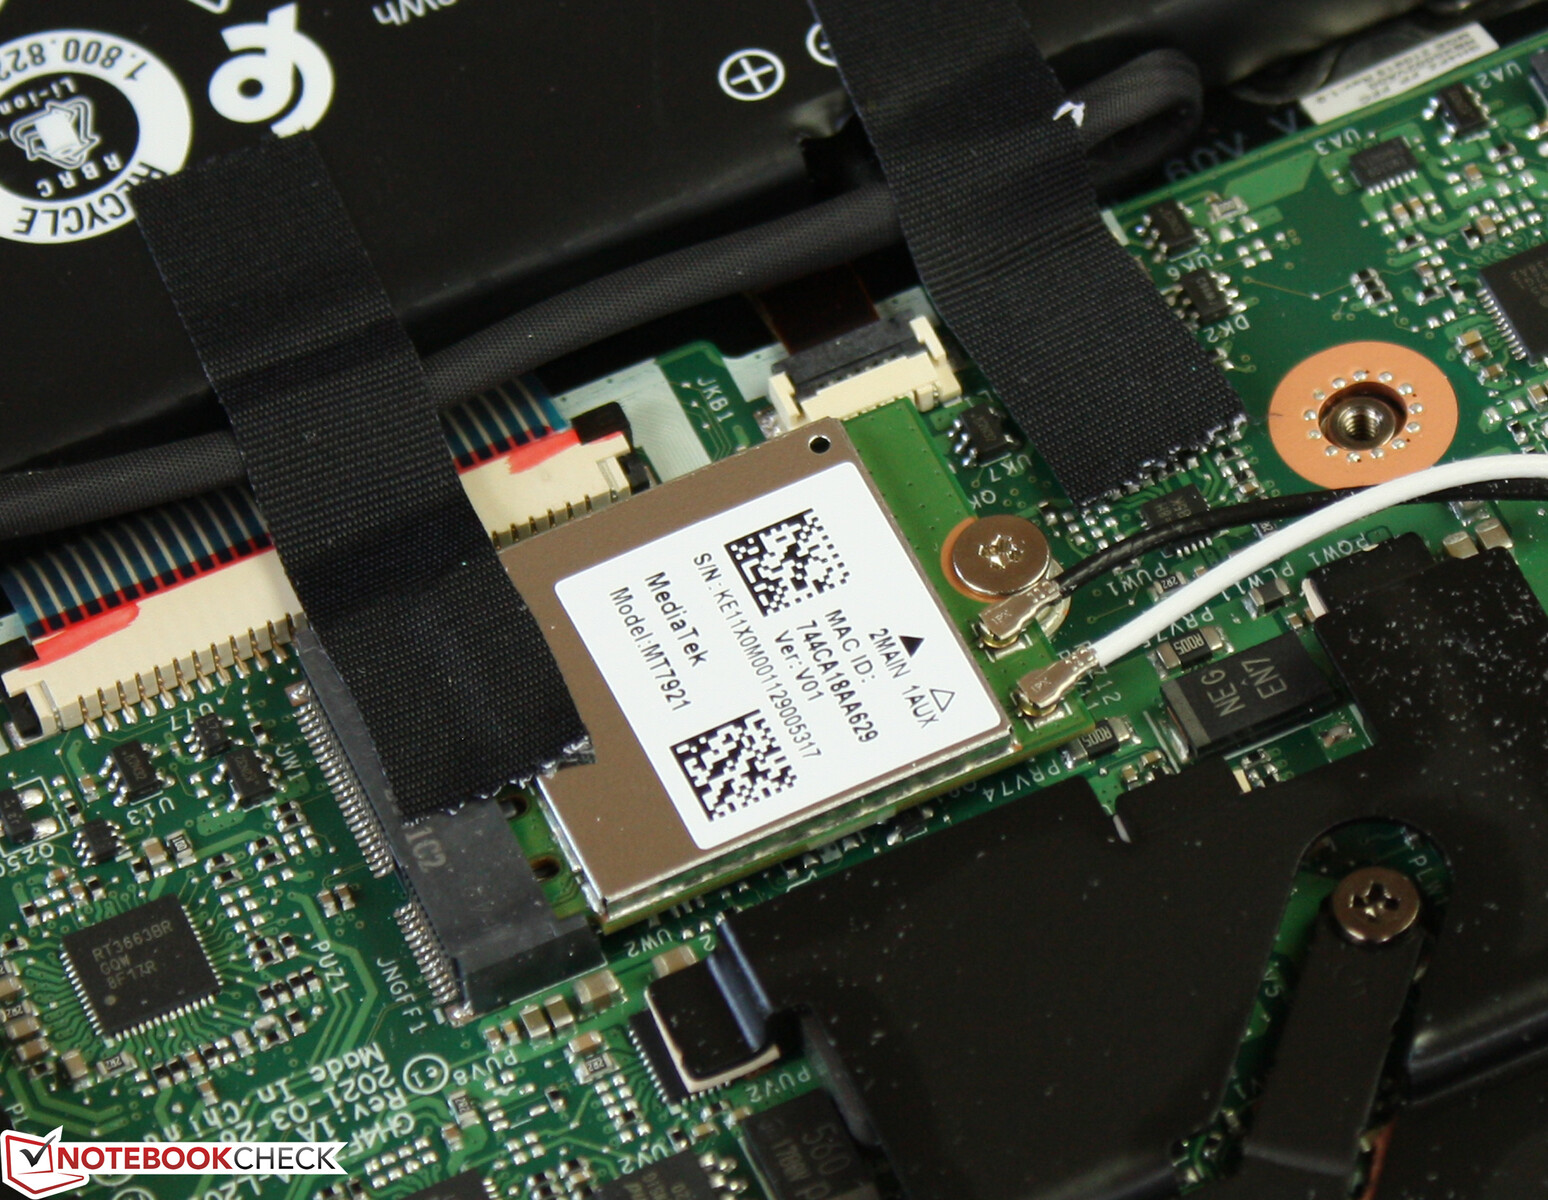
沟通
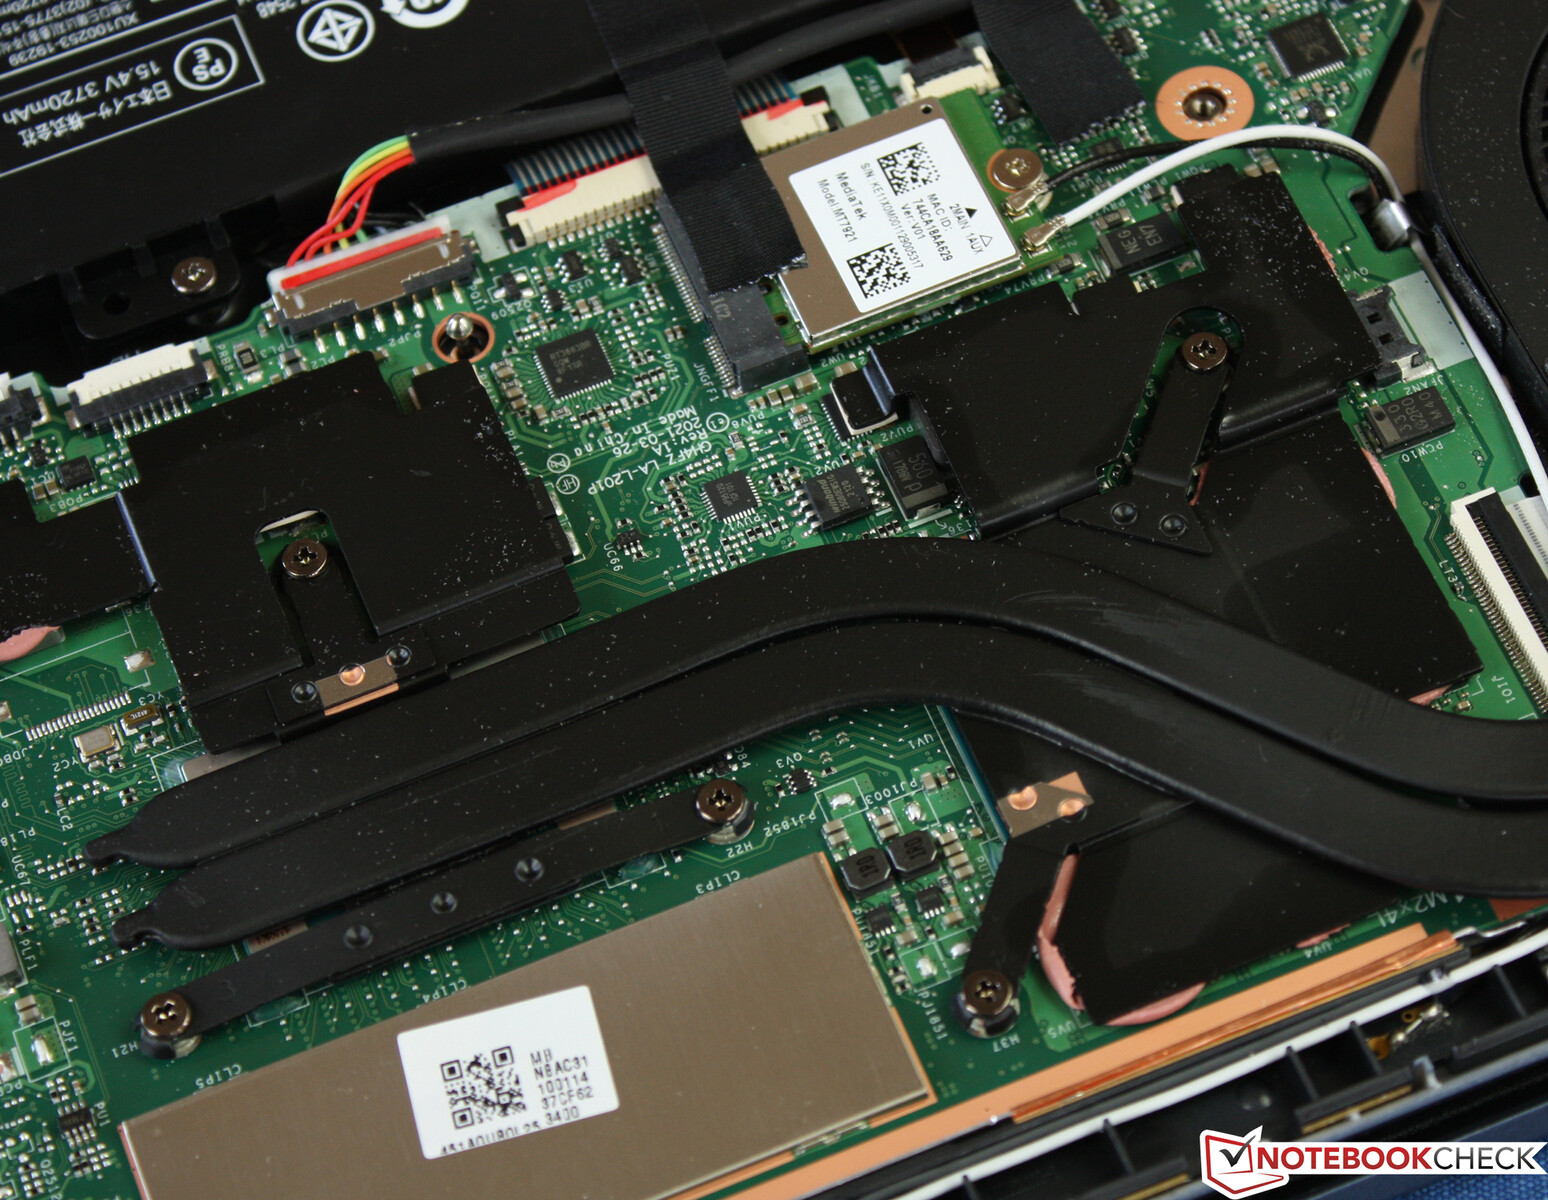
联发科MT7921 Wi-Fi和蓝牙模块是一个罕见的现象,尽管它是AMD和联发科为Ryzen处理器设计的。凭借Wi-Fi 6 2x2和蓝牙5.2,它应该能够与英特尔的AX200相媲美。然而,正如我们的评论所显示的,情况并非如此,下载速度是一个小灾难。
在理想条件下(附近没有其他Wi-Fi设备,笔记本电脑和服务器之间的距离为一米),即使在一天中的不同时间重复测量,下载速度也很差,只有183Mbps。相比之下,该芯片在传输数据时速度快得多,最高可达约950 Mbps。虽然这也不完全是一个记录,但至少是一个坚实的基础。由于下载和上传速度之间的差异,我们怀疑是驱动程序的问题,可能在未来会被修复。在我们的测试中,我们发现自己想知道在封闭的铝制盖子里,天线藏在哪里。请注意,这不可能是低分的原因,因为否则上传速度也会同样低。
| Networking | |
| iperf3 transmit AX12 | |
| Lenovo IdeaPad 5 14ALC05 82LM005YGE | |
| Acer Swift 3 SF314-511-54ZK | |
| Acer Swift 3X SF314-510G-70DW | |
| HP Envy 14-eb0010nr | |
| MSI Prestige 14 Evo A11M-005 | |
| Acer Swift X SFX14-41G-R7F3 | |
| Average MediaTek MT7921 (548 - 985, n=16) | |
| iperf3 receive AX12 | |
| Acer Swift 3X SF314-510G-70DW | |
| Lenovo IdeaPad 5 14ALC05 82LM005YGE | |
| HP Envy 14-eb0010nr | |
| MSI Prestige 14 Evo A11M-005 | |
| Acer Swift 3 SF314-511-54ZK | |
| Average MediaTek MT7921 (90 - 972, n=16) | |
| Acer Swift X SFX14-41G-R7F3 | |
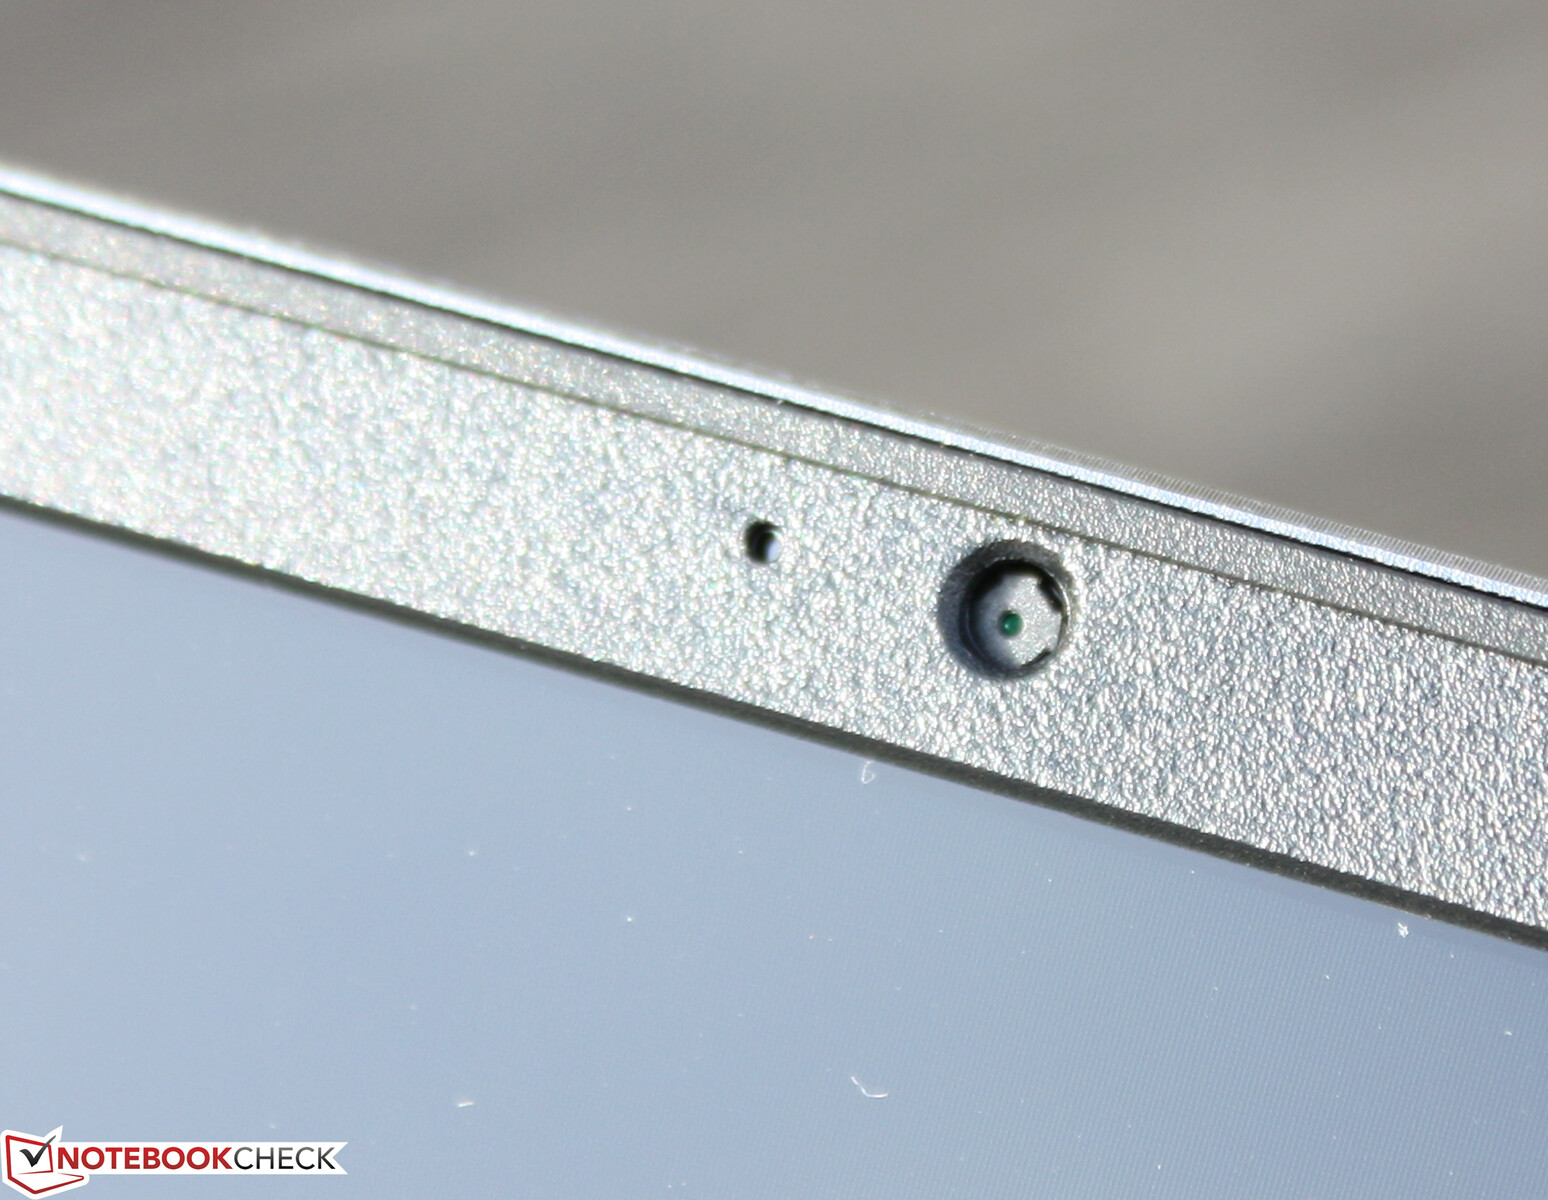
网络摄像头
720p的摄像头做了最基本的工作。色彩冲淡,锐度差,deltaE色彩偏差大。然而,竞争对手在这一类别中的表现并不出色,所有型号都存在严重的图像噪音。


安全问题
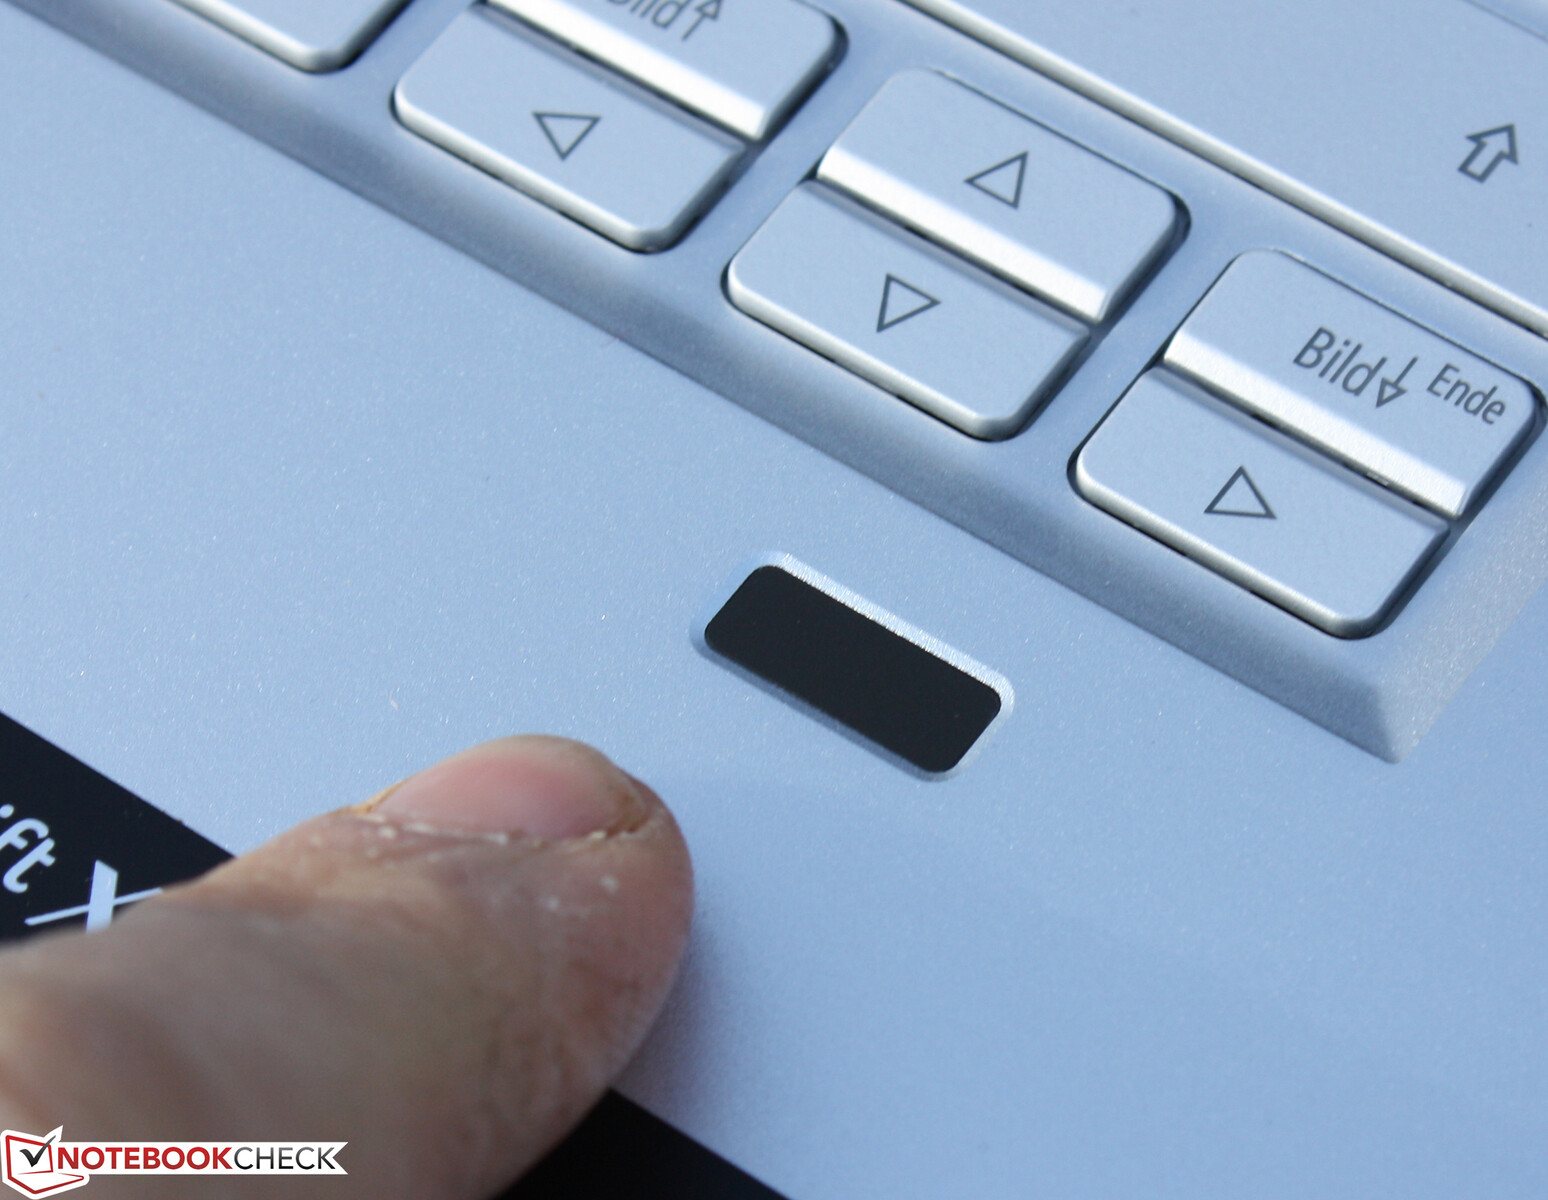
迅雷游戏机具有指纹传感器和Kensington锁。网络摄像头没有配备红外摄像头。因此,通过面部识别登录是不可能的。我们更喜欢指纹识别器集成在方向键下面,而不是集成在触摸板上。在这里,把手指放在上面就足够了。
辅料
除了通常的保修信息和快速启动指南外,该笔记本电脑只包括90瓦的电源。
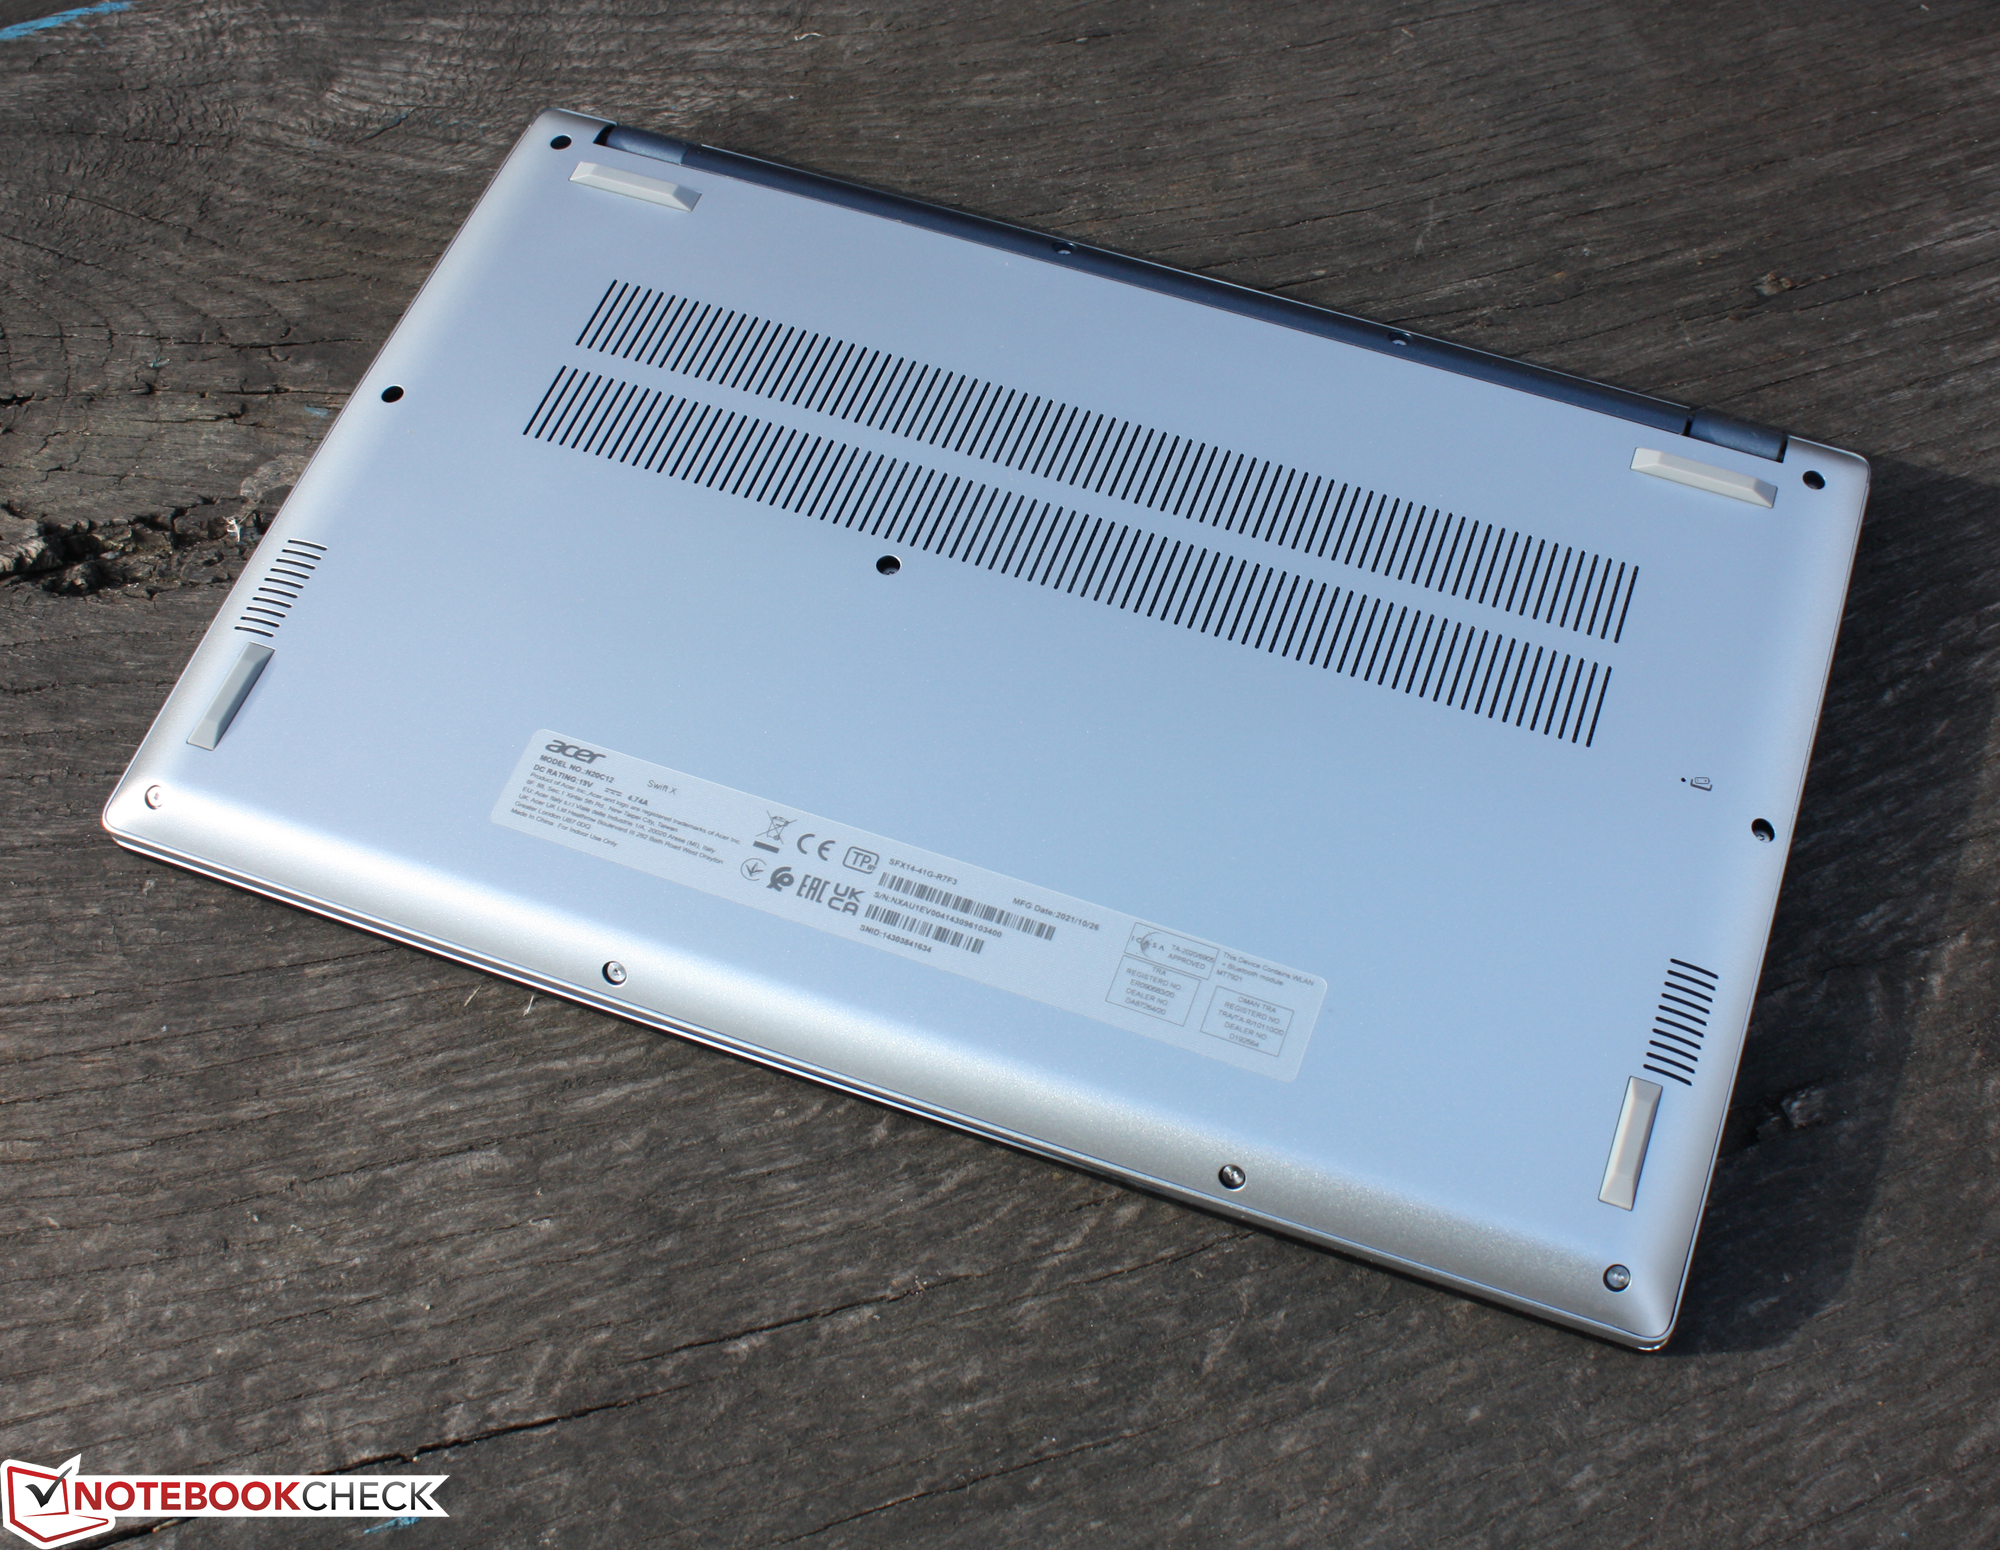
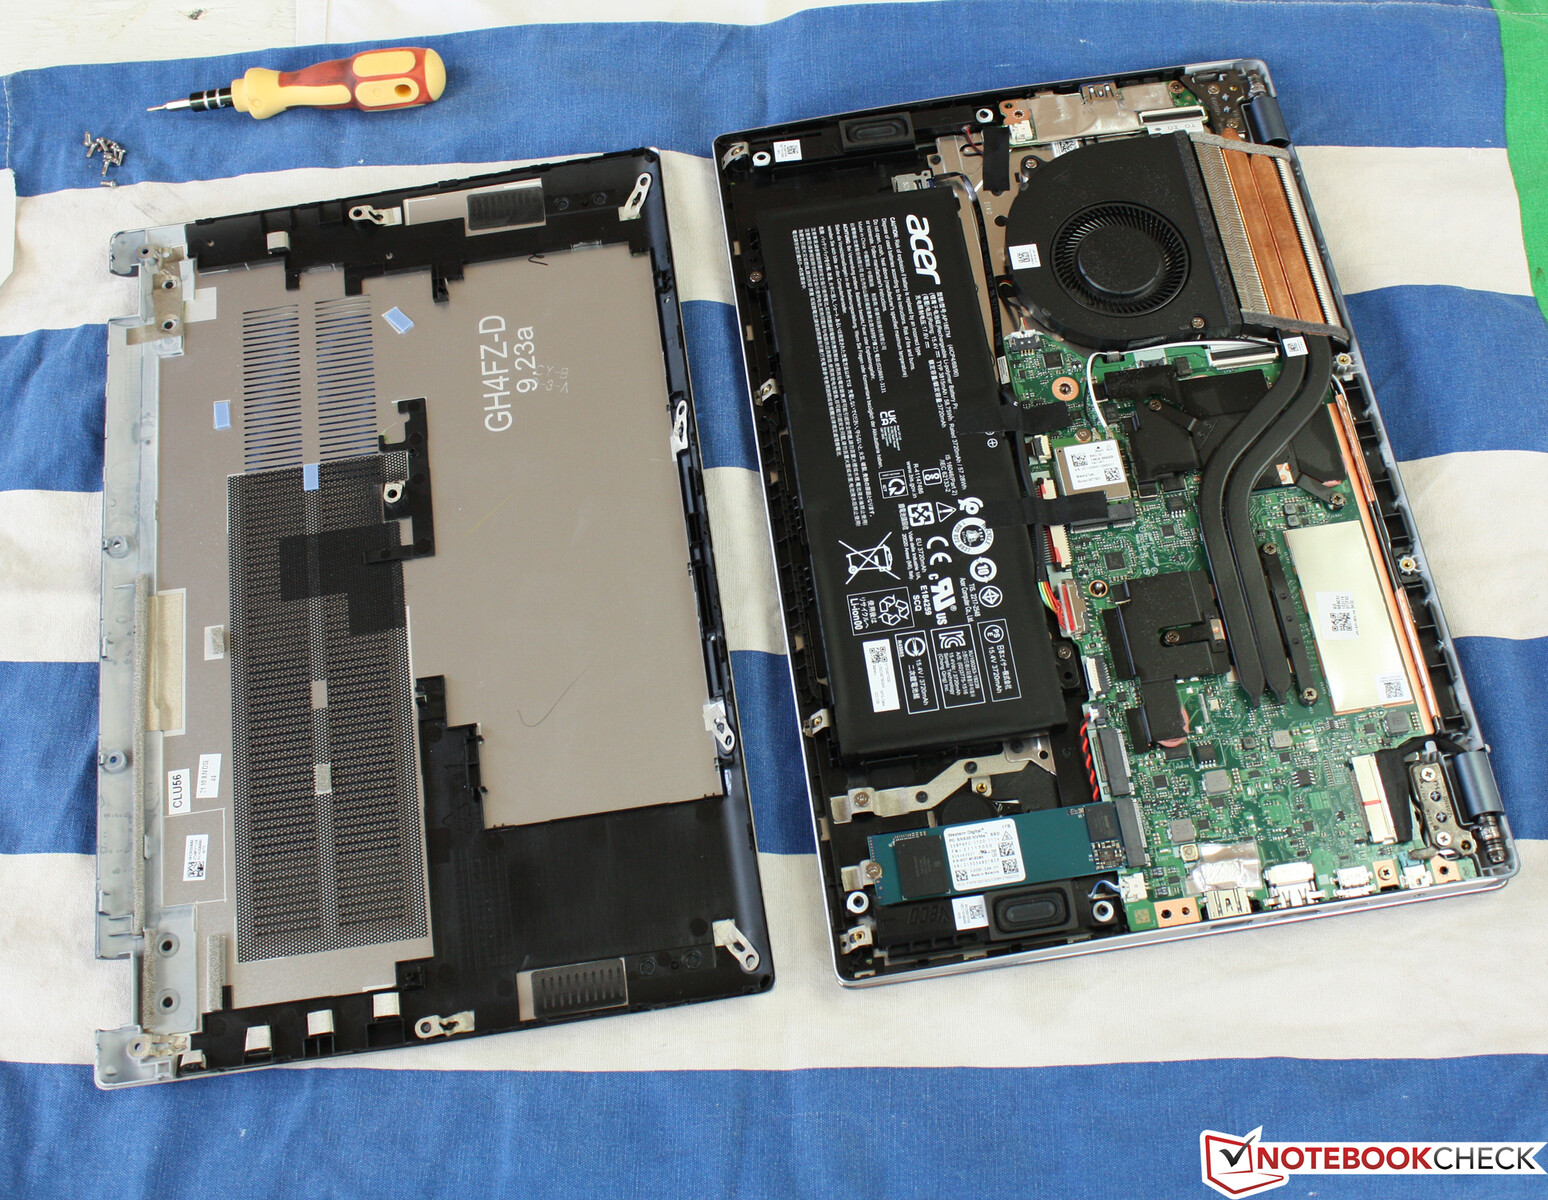
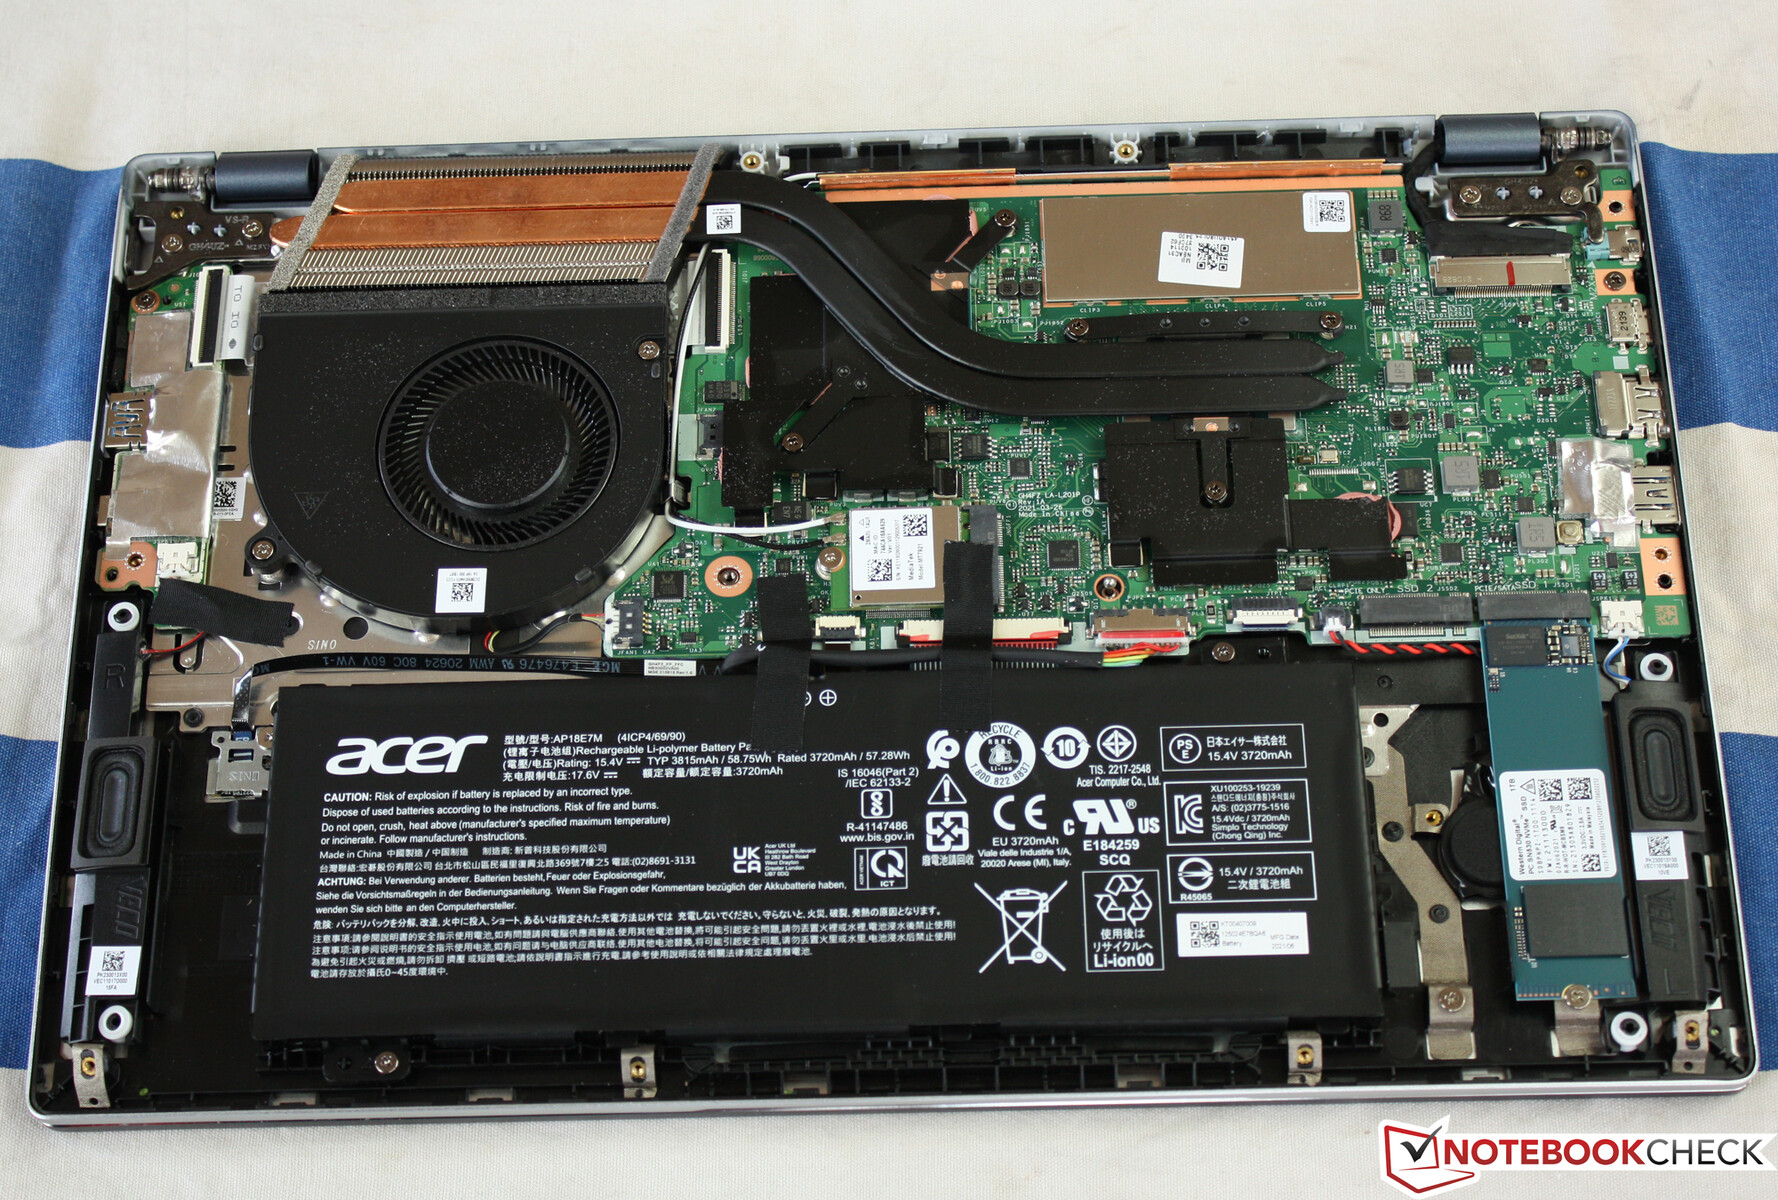
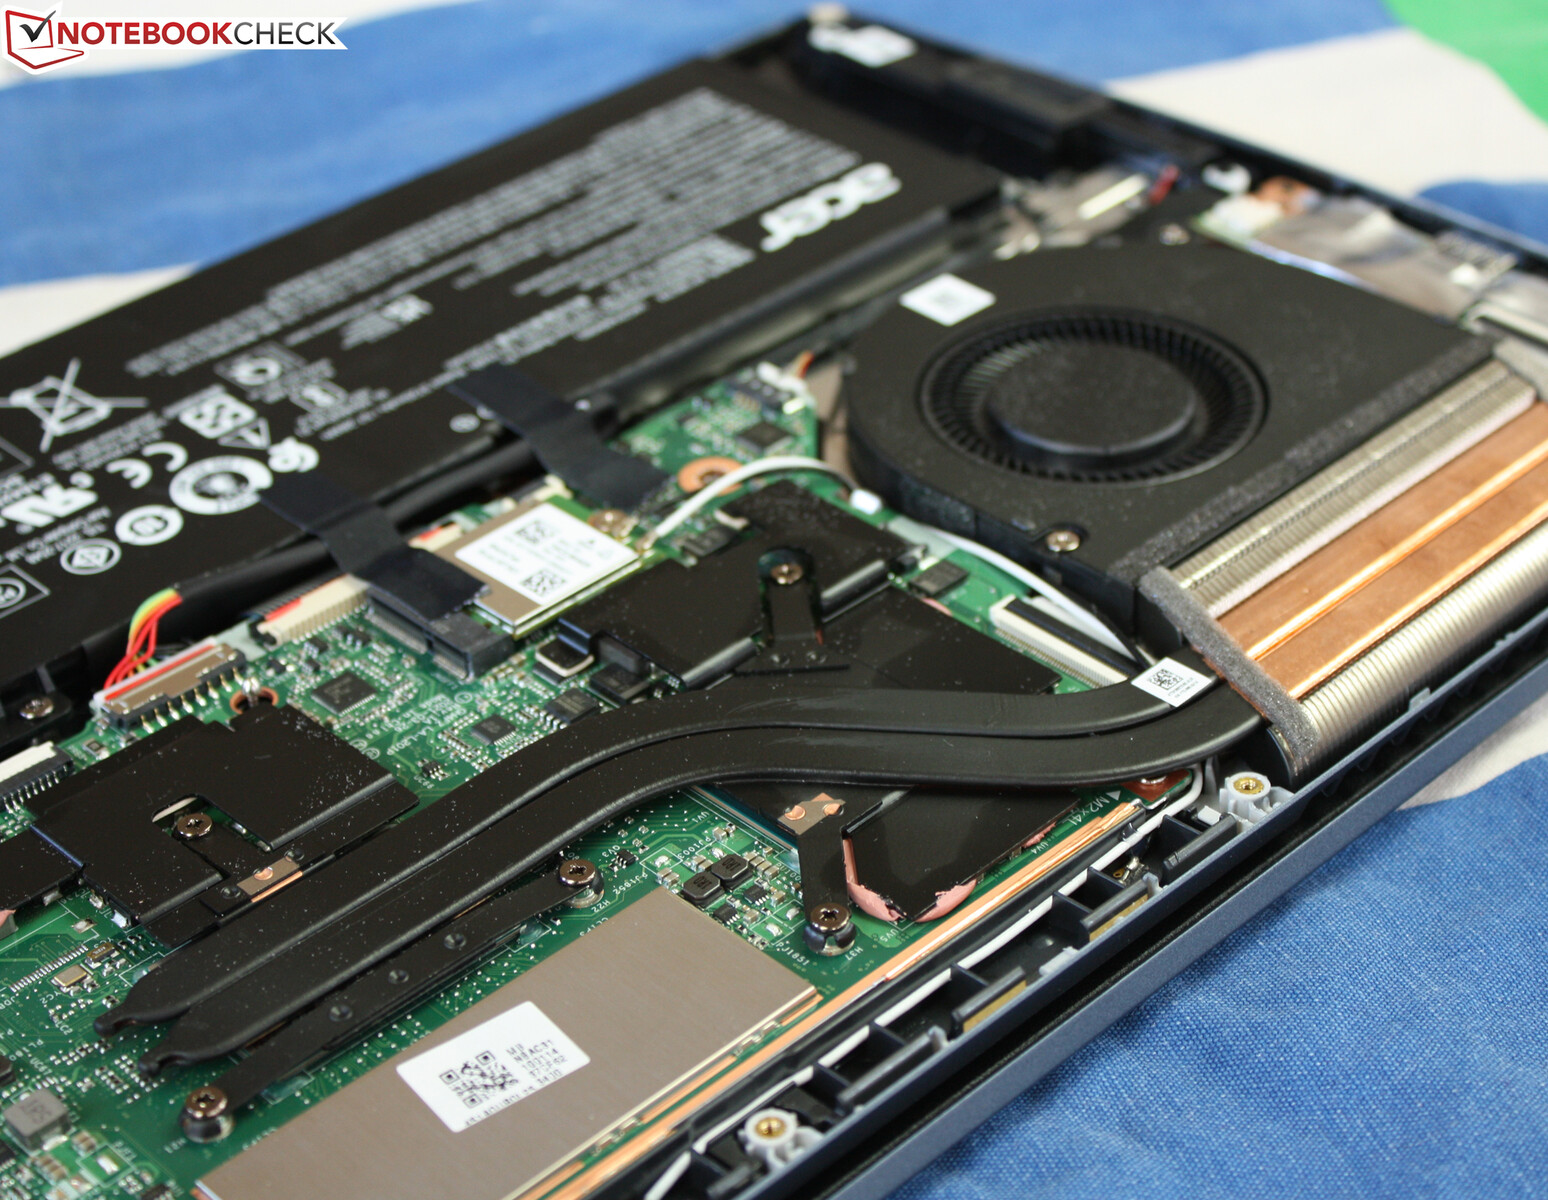
维护
Swift X没有配备维护舱口。不管怎么说,接触组件是很简单的。松开底部的所有螺丝后,可以用平头铲子或其他有锋利边缘的物体将底板卸下。所有的内存都是固定的,没有用于扩展的插槽。
担保
根据不同的地区,宏碁提供一年或两年的有限保修,包括提货服务。延长保修期至三年的费用为50欧元(约55美元)。
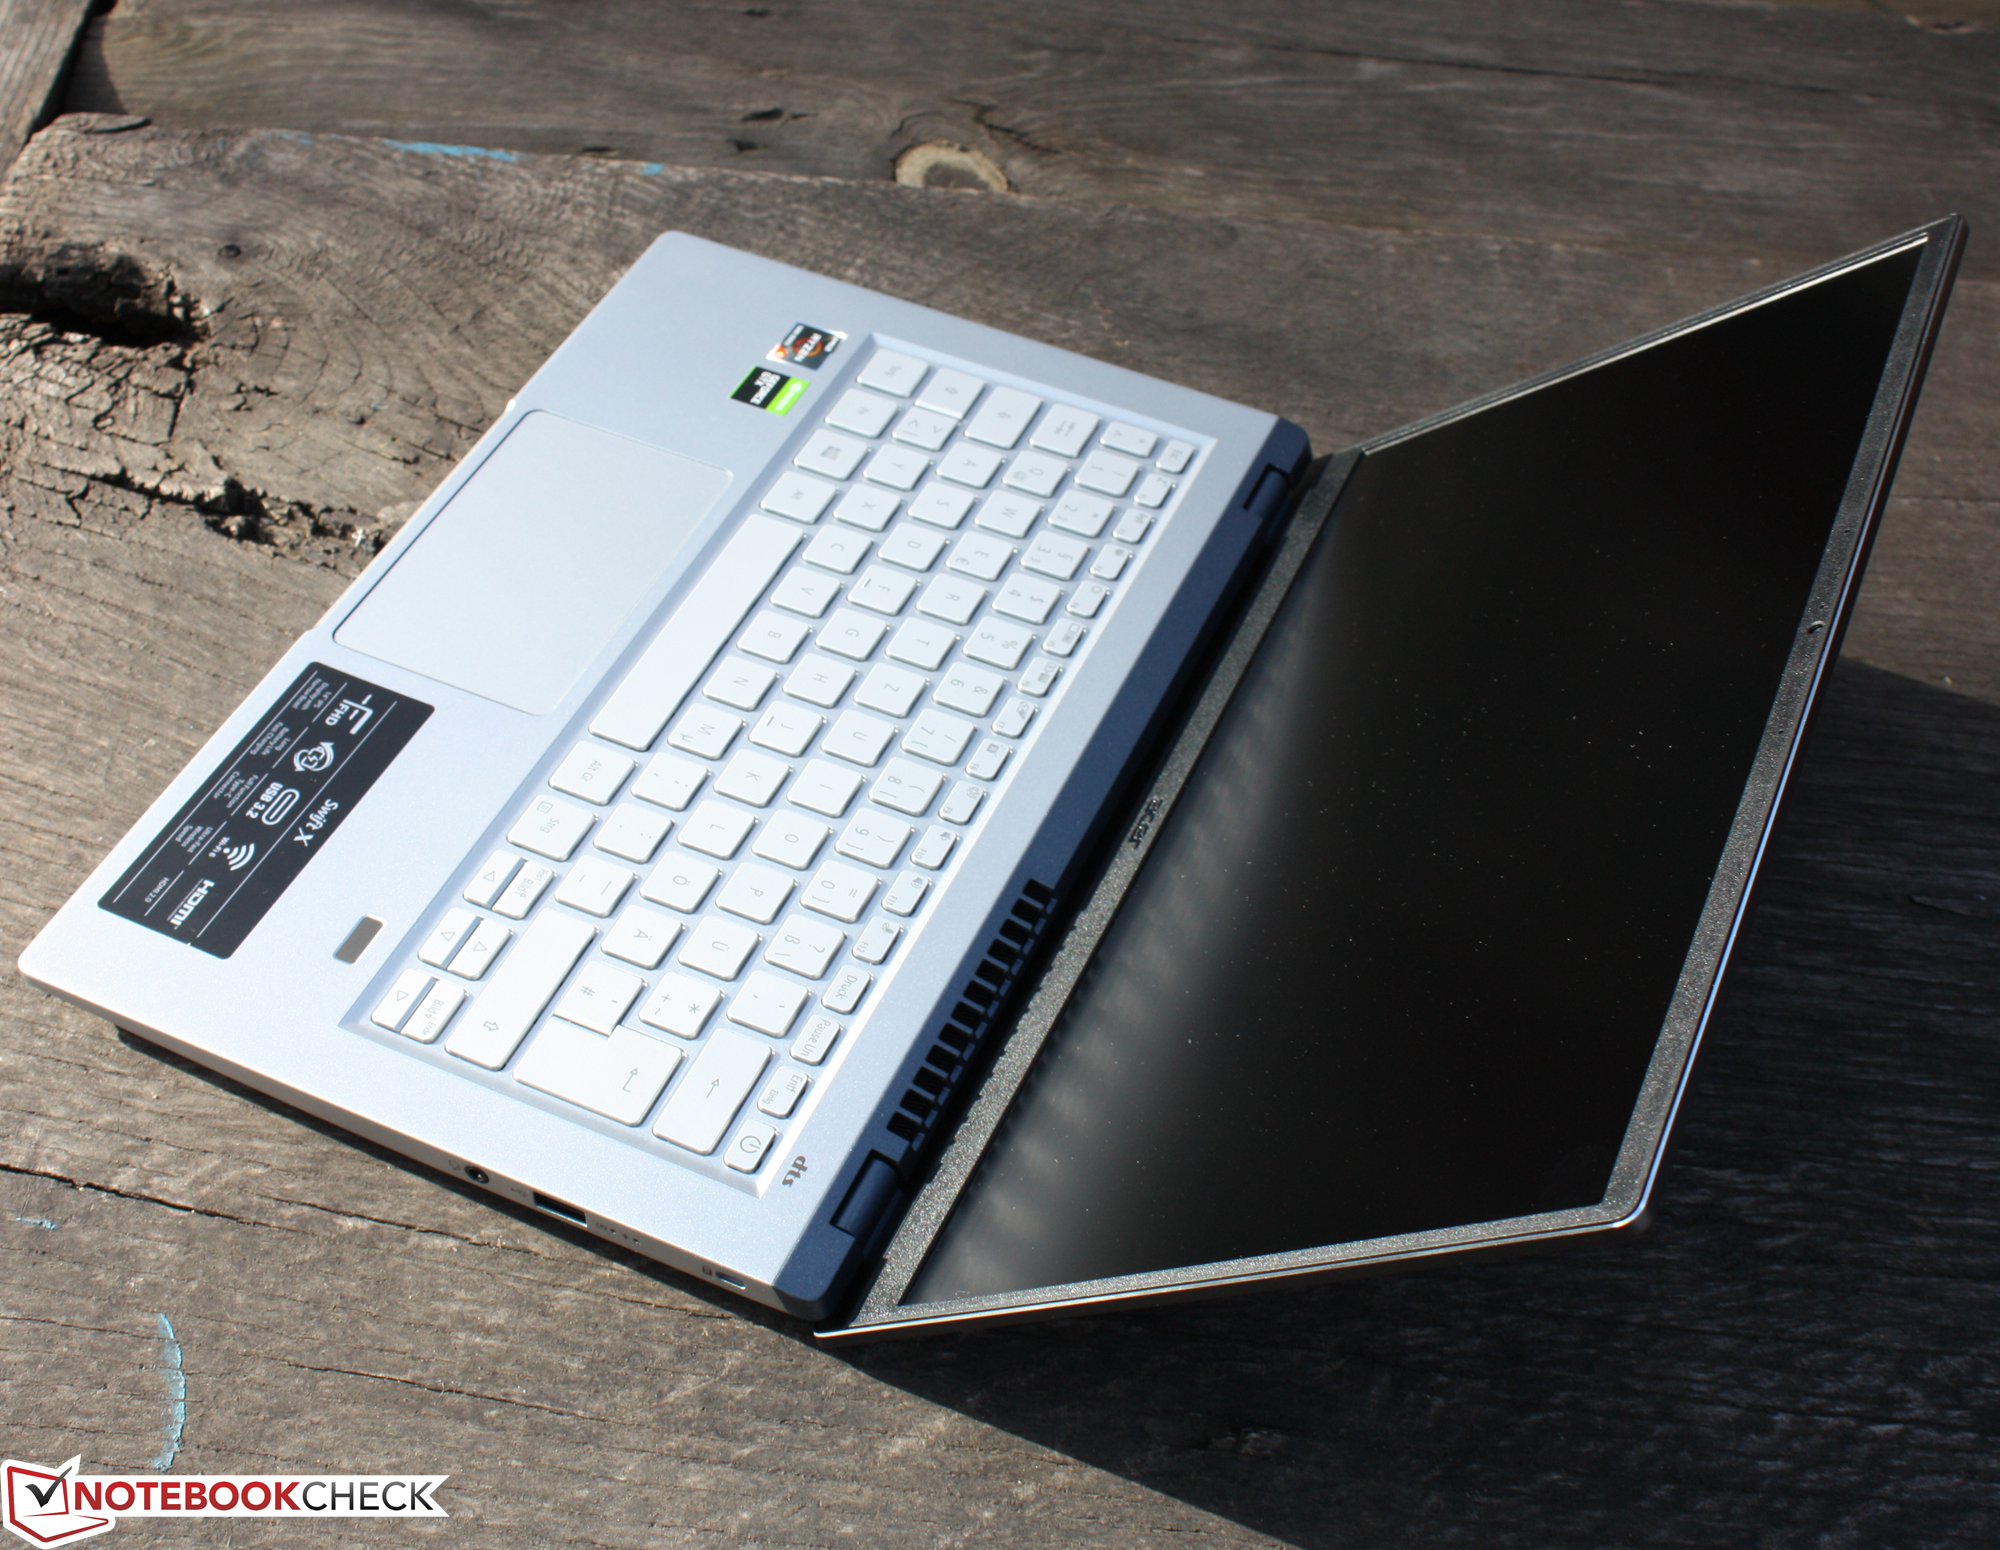
输入设备 - 适合日常使用
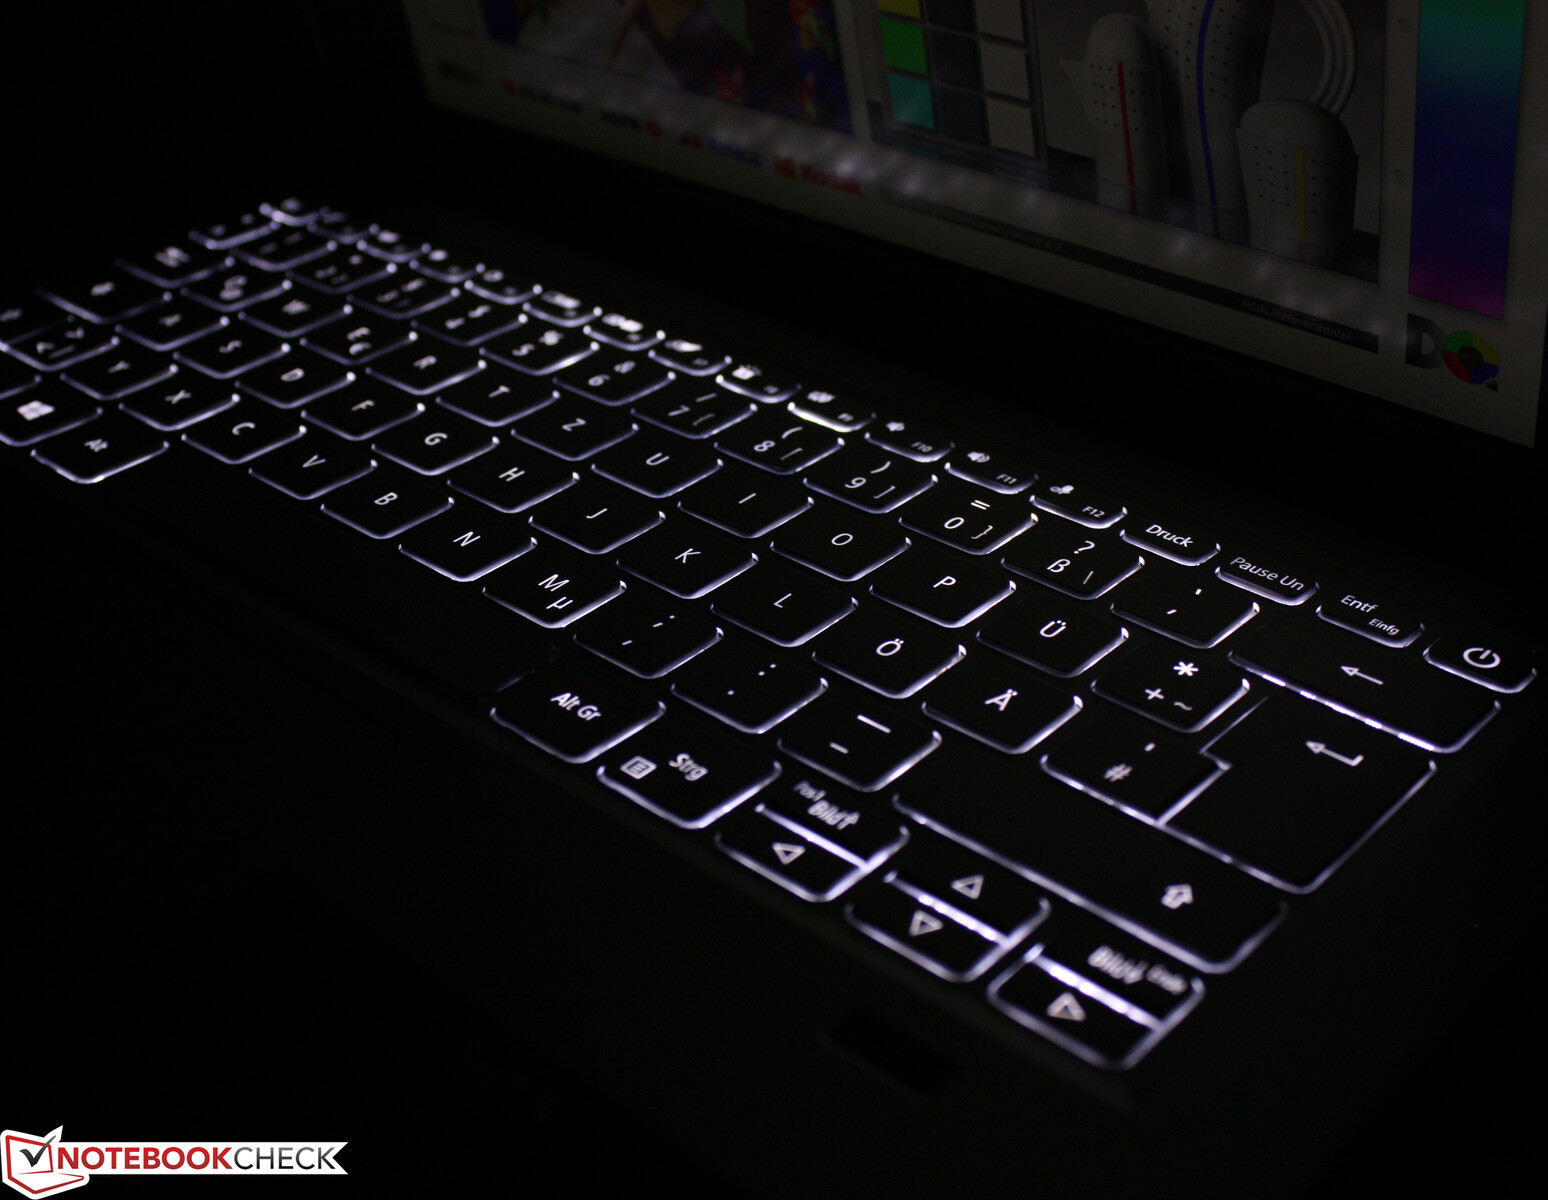
键盘
宏碁为其Swift X配备了一个有亮度设置的背光Chiclet键盘。扁平、光滑的按键提供了较浅的行程和一个有点模糊的启动点。反馈很好,键盘区域在打字时不会出现任何问题。总的来说,宏碁创造了一个键盘,可以在日常使用中快速打字。然而,它仍然不大感觉是一个高级型号。为了获得更好的反馈,行程和启动点必须更加明显。
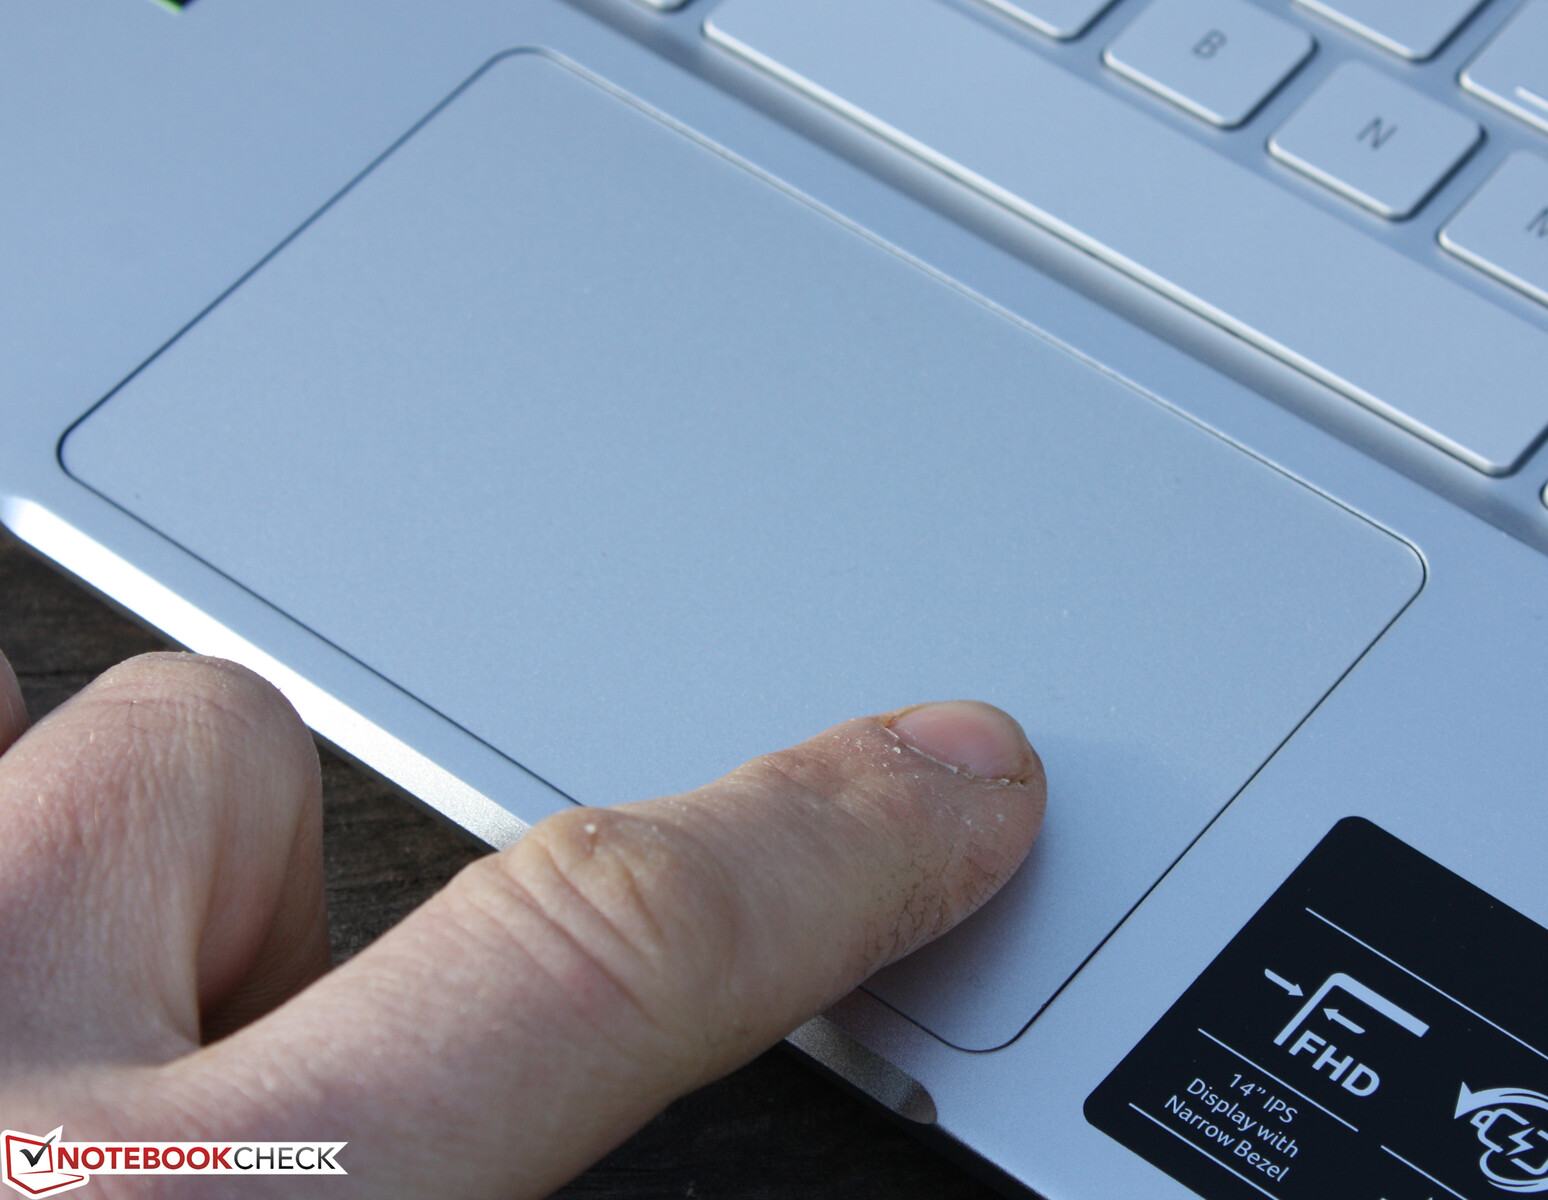
触摸板
点击板支持多点触摸,并在10.5 x 6.5厘米(4.13 x 2.56英寸)的范围内延伸。因此,用户有很大的空间来做手势。光滑的表面具有良好的滑行性能,几乎没有任何摩擦。垫子在所有的角落里都有反应。此外,它的行程较浅,有一个明显的启动点,有声音,但只是适度的咔哒声。
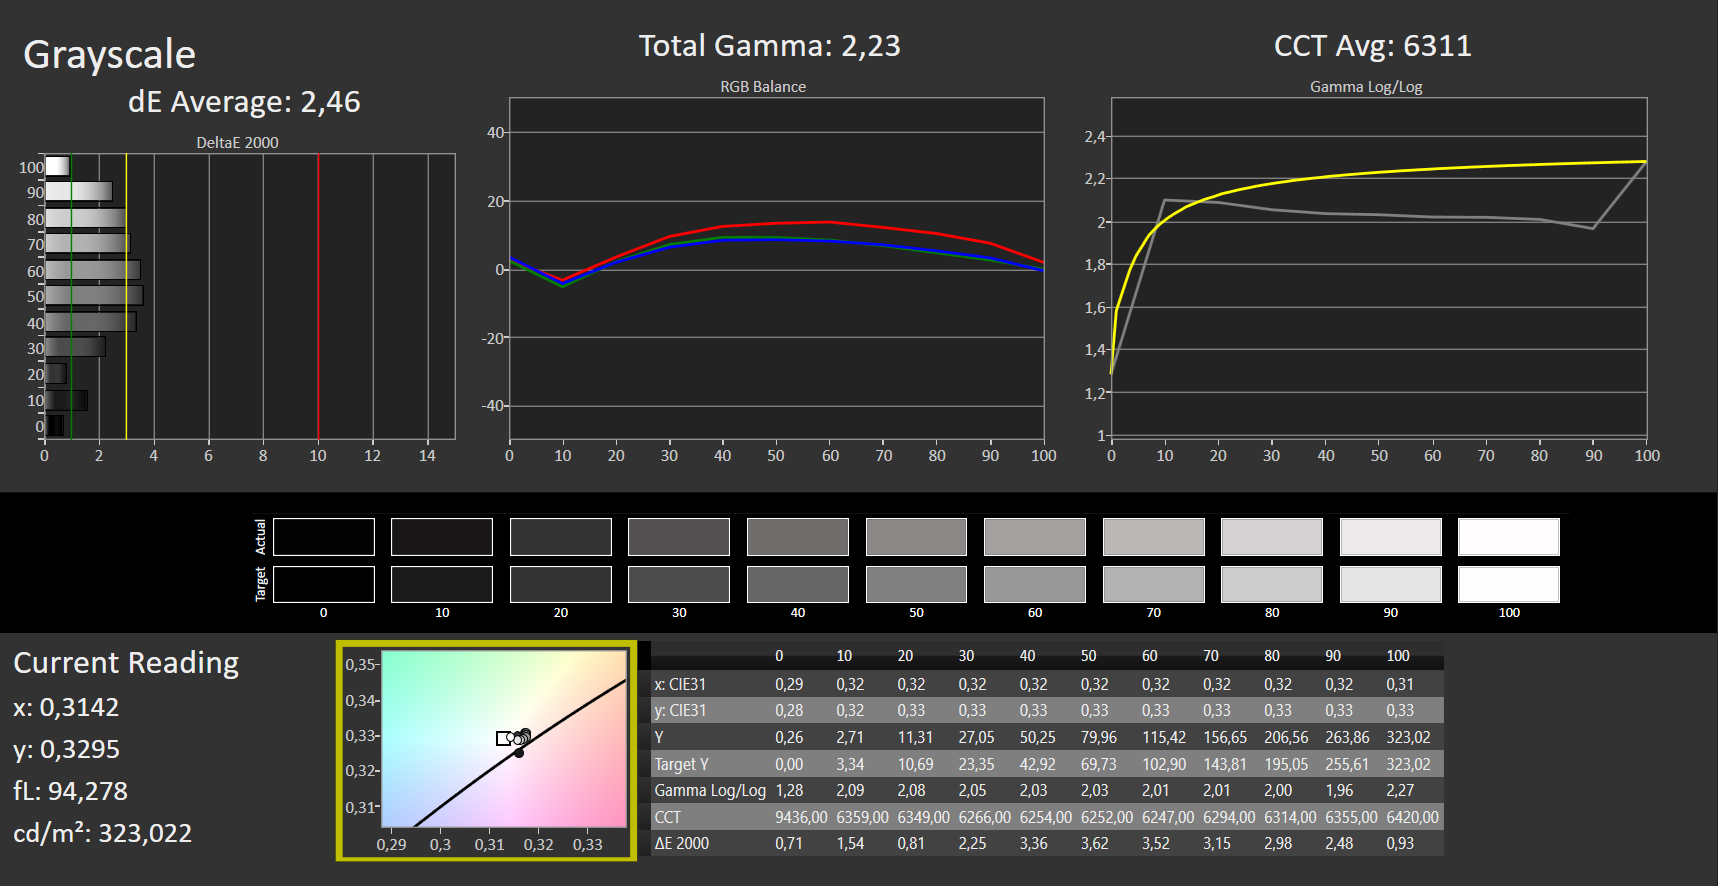
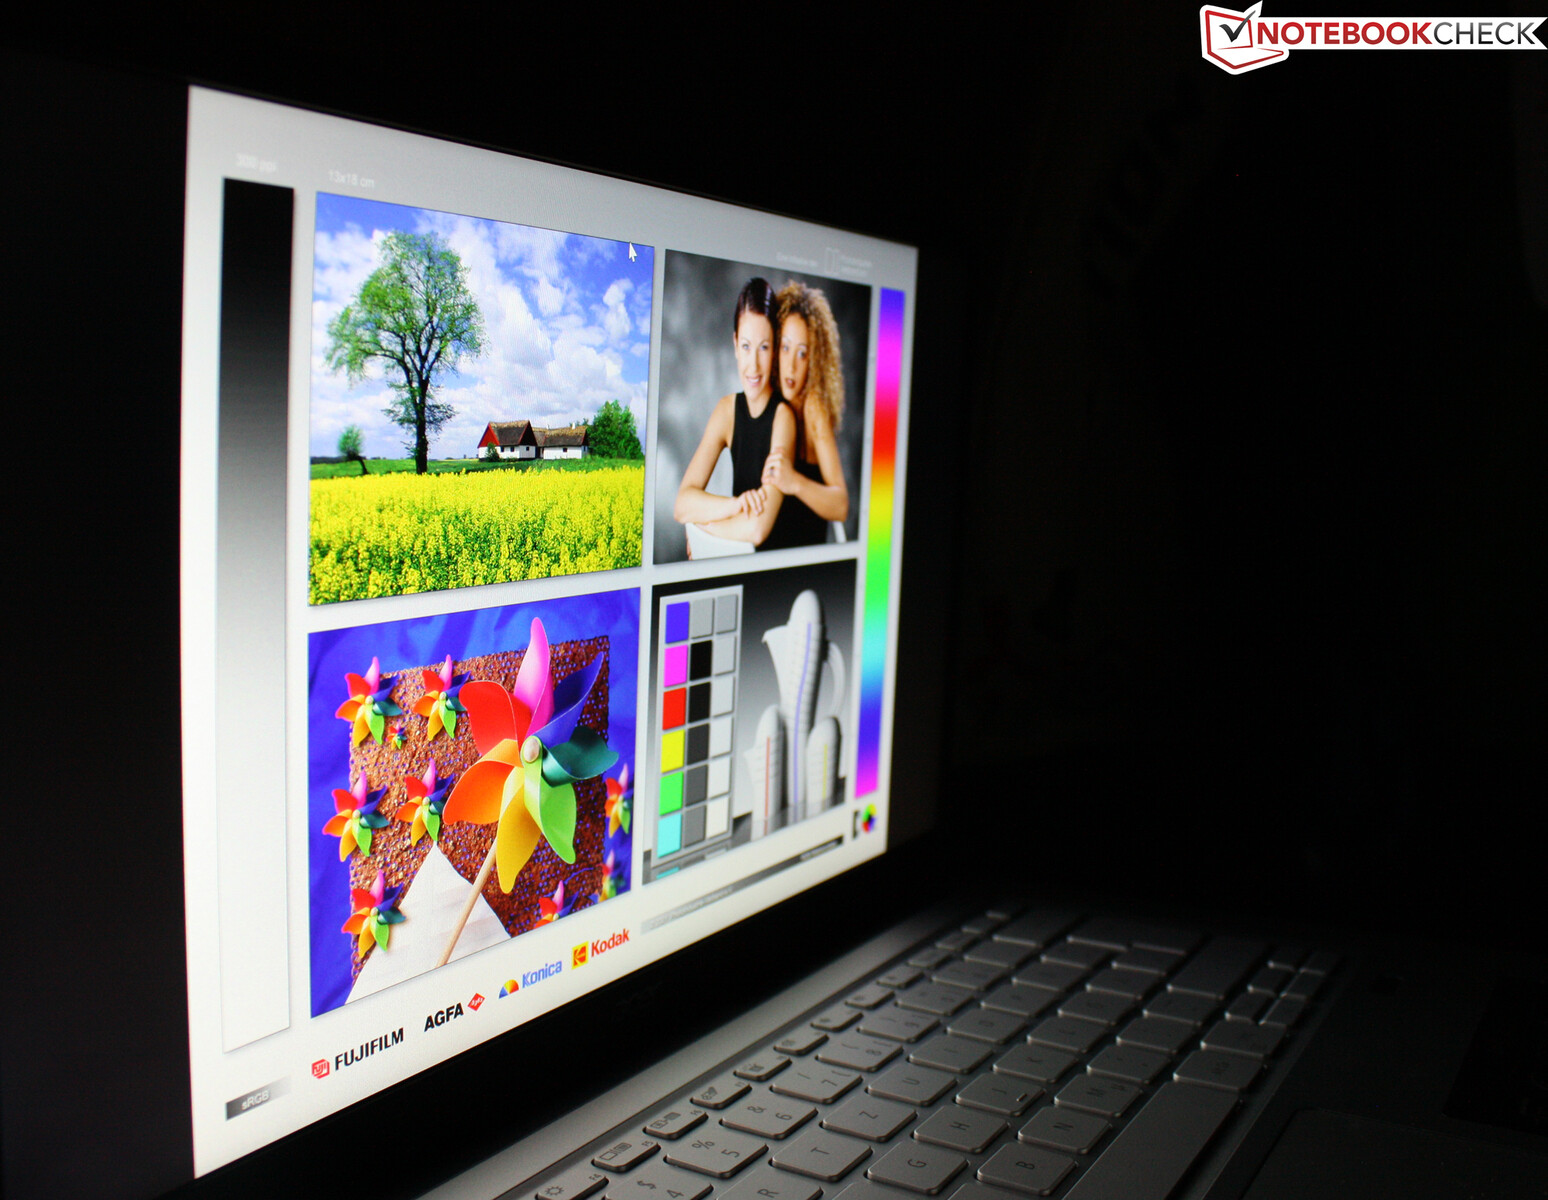
显示屏 - 具有高对比度的全高清笔记本电脑
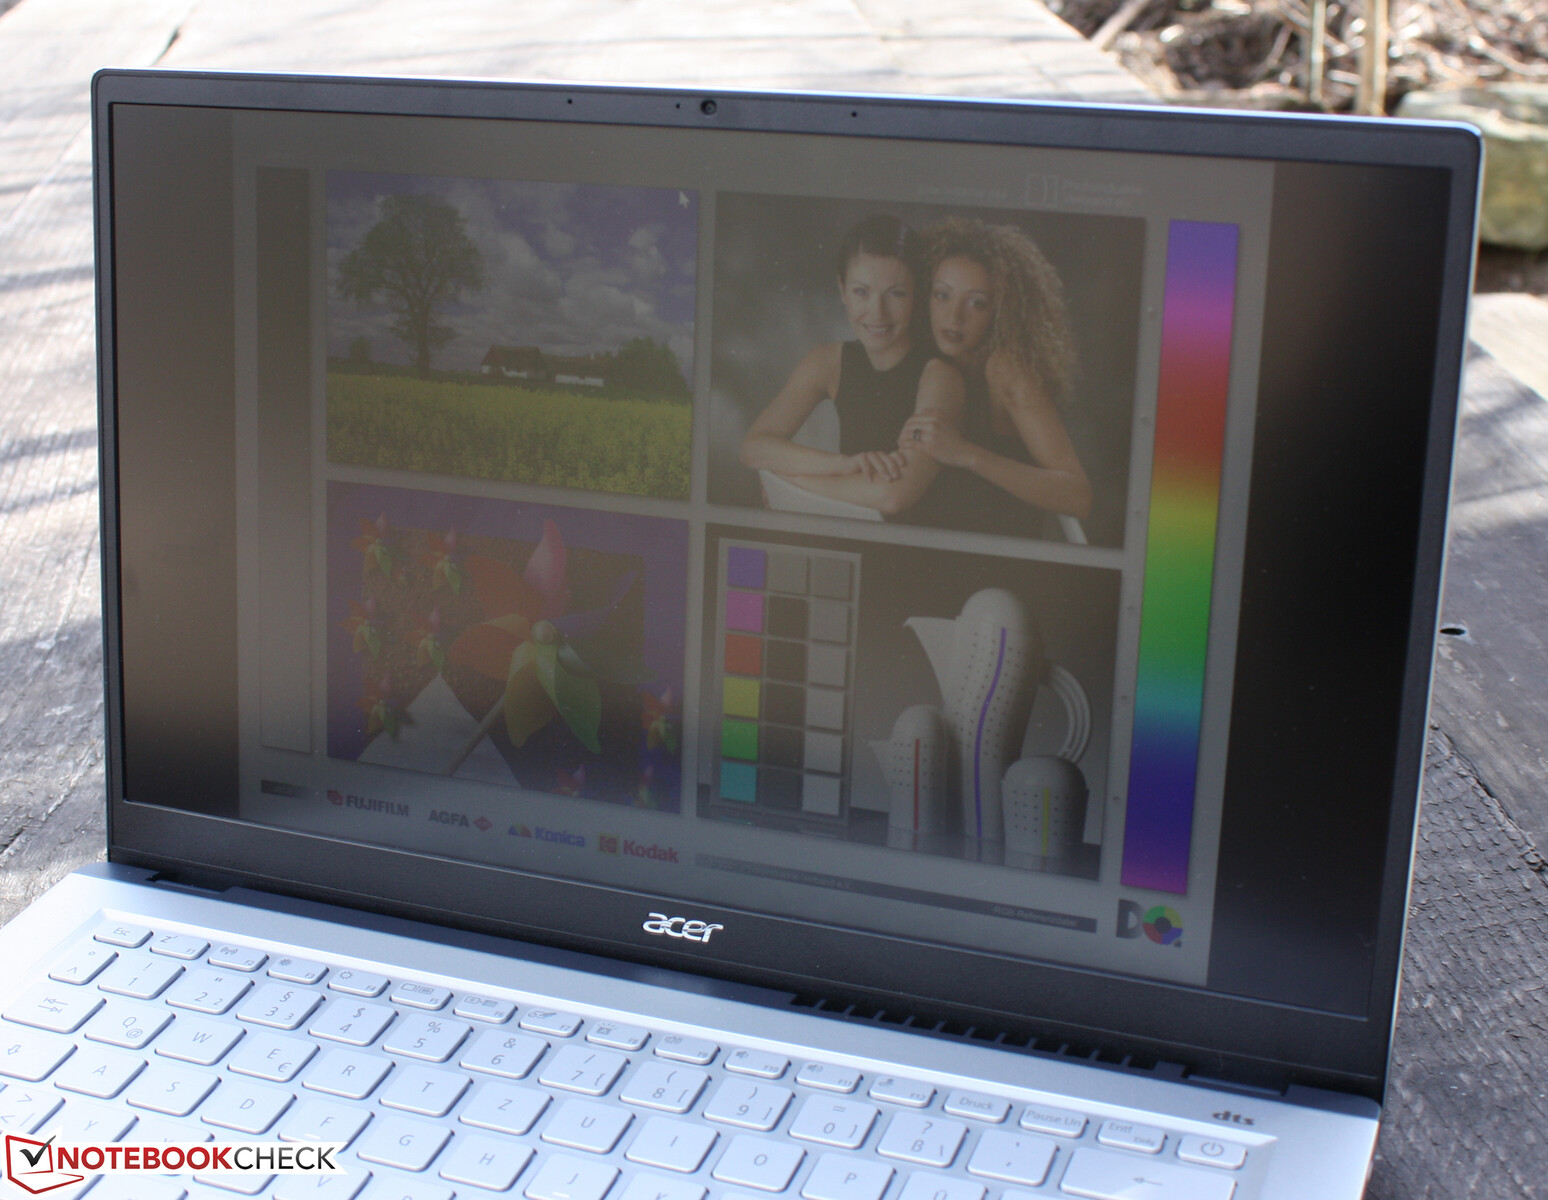
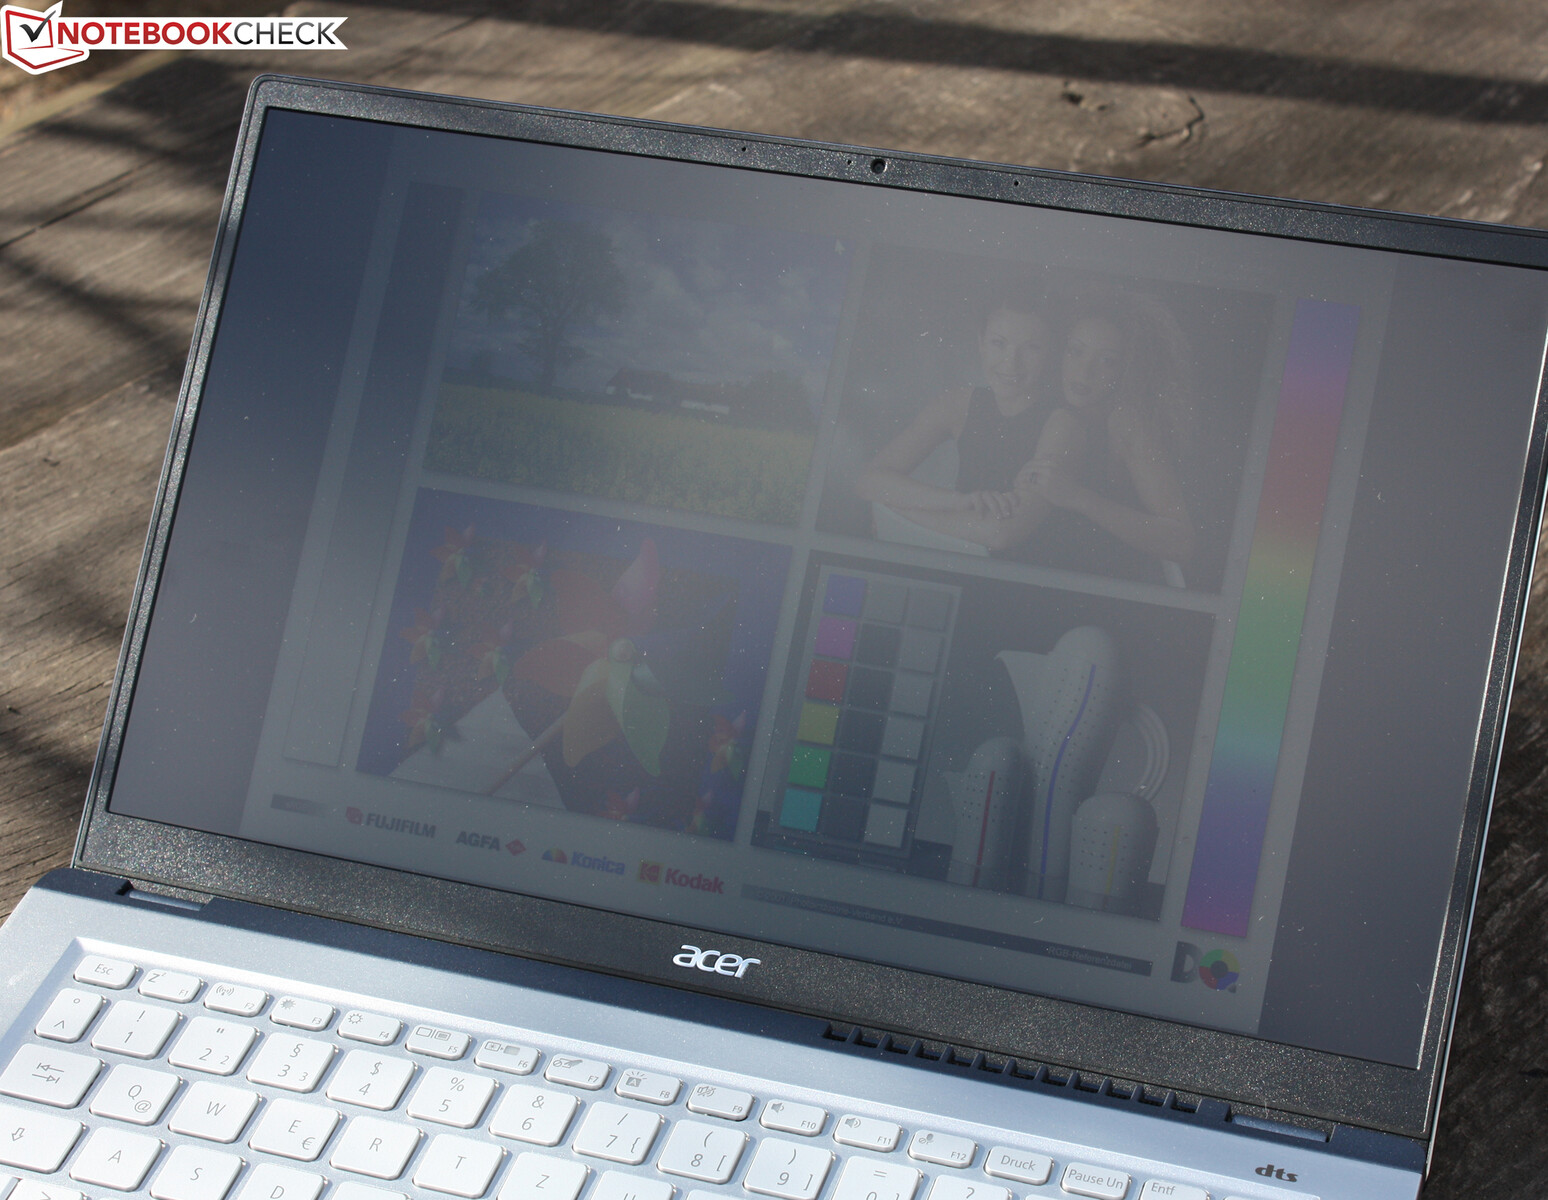
宏碁Swift X的非光面14英寸屏幕的分辨率为1920 x 1080像素。它具有出色的对比度(2194:1),将自己与竞争对手远远区分开来。
最大亮度(412尼特)非常好,高于所有的竞争对手--除此之外还有 HP Envy 14.电池模式下的亮度保持不变,前提是在Radeon设置中禁用AMD Vari Bright。积极的一面。该显示器在任何情况下都不会出现PWM闪烁。
| |||||||||||||||||||||||||
Brightness Distribution: 89 %
Center on Battery: 397 cd/m²
Contrast: 2194:1 (Black: 0.18 cd/m²)
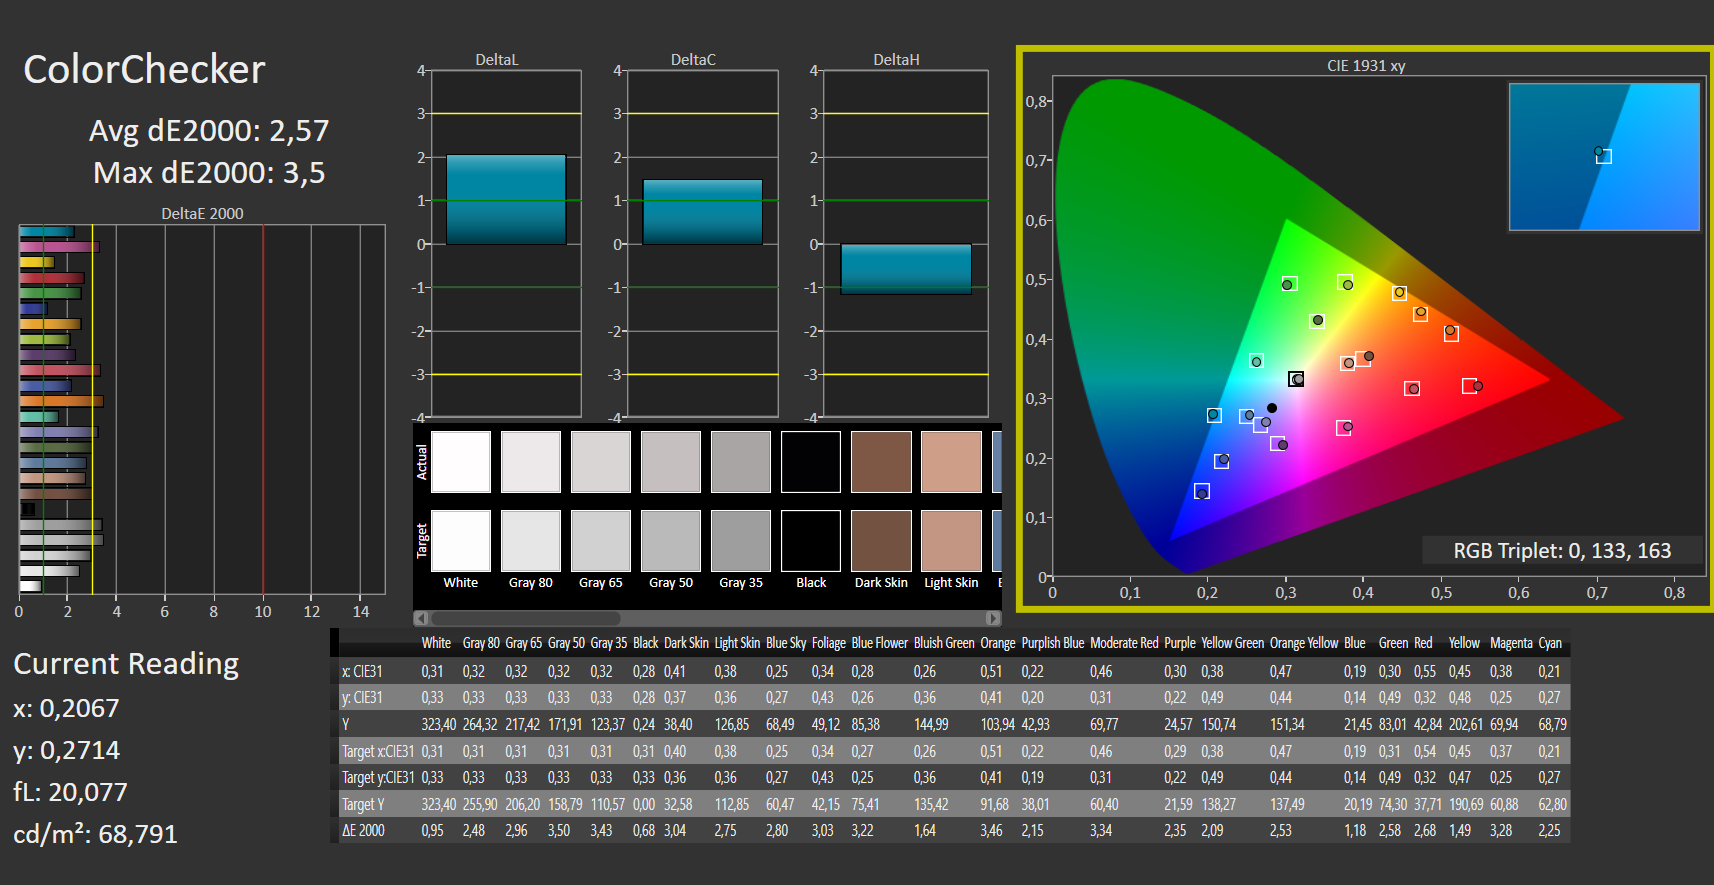
ΔE ColorChecker Calman: 9.73 | ∀{0.5-29.43 Ø4.71}
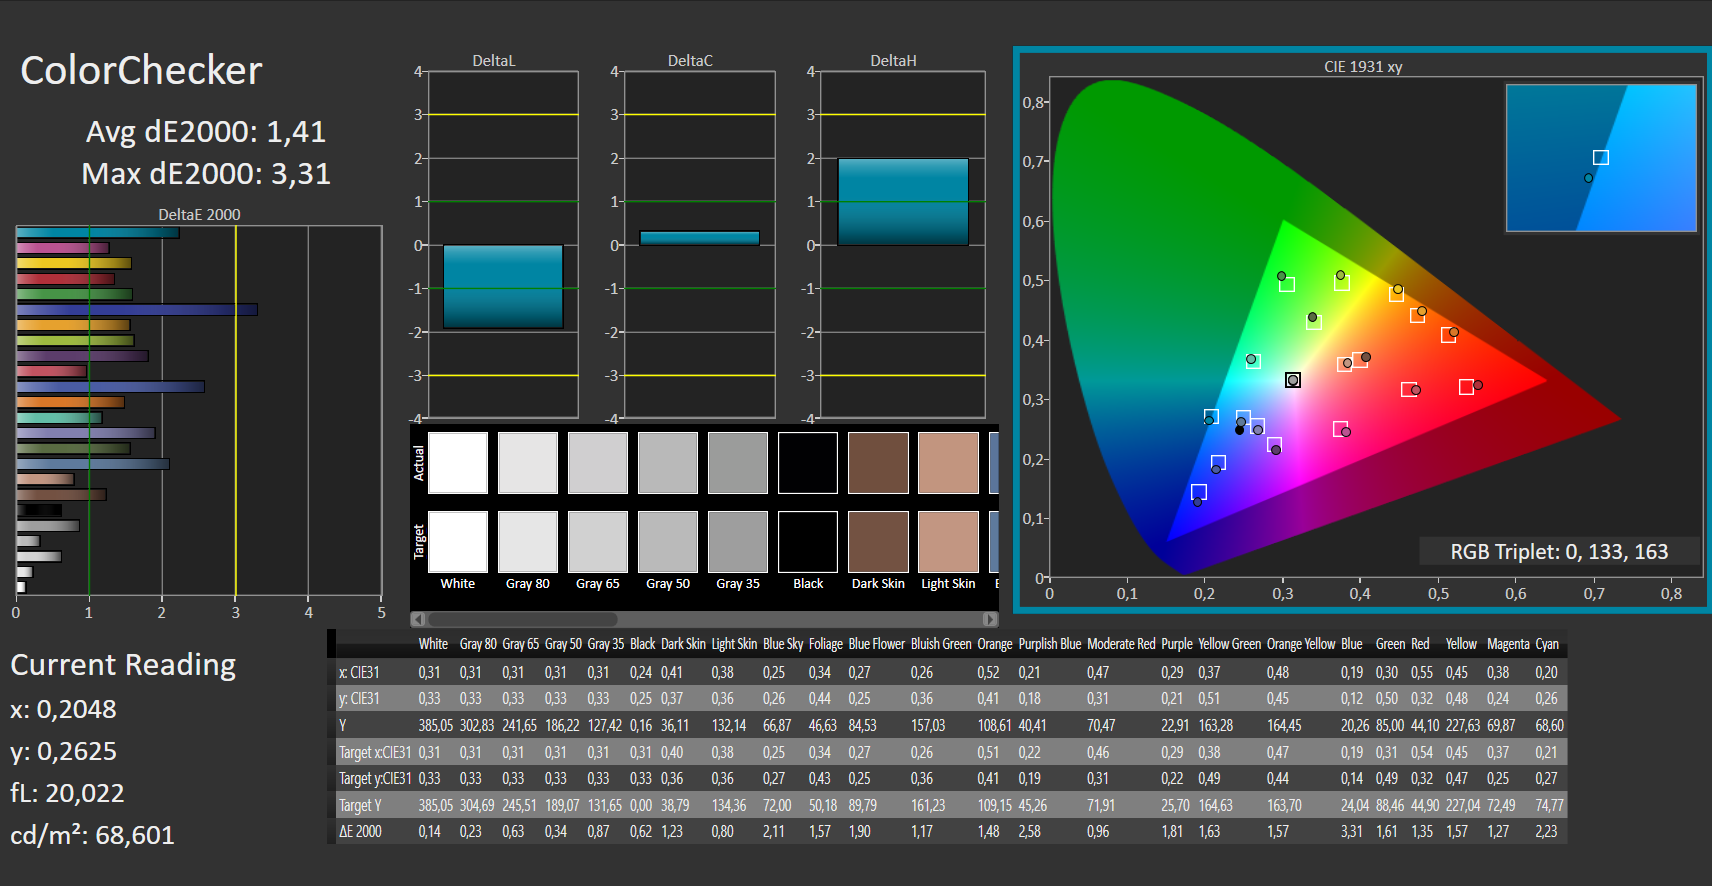
calibrated: 1.41
ΔE Greyscale Calman: 7.5 | ∀{0.09-98 Ø4.96}
73% AdobeRGB 1998 (Argyll 3D)
99% sRGB (Argyll 3D)
72% Display P3 (Argyll 3D)
Gamma: 1.5
CCT: 6678 K
| Acer Swift X SFX14-41G-R7F3 AUO B140HAN06, IPS, 1920x1080, 14" | Acer Swift 3X SF314-510G-70DW AU Optronics AUO683D, IPS, 1920x1080, 14" | Acer Swift 3 SF314-511-54ZK AUO B140HAN06, IPS, 1920x1080, 14" | HP Envy 14-eb0010nr AU Optronics AUOF392, IPS, 1920x1200, 14" | Lenovo IdeaPad 5 14ALC05 82LM005YGE AU Optronics B140HAN04.E, IPS, 1920x1080, 14" | MSI Prestige 14 Evo A11M-005 AUO B140HAN06.2 (AUO623D), IPS-Level, 1920x1080, 14" | |
|---|---|---|---|---|---|---|
| Display | -1% | -4% | 4% | -46% | -2% | |
| Display P3 Coverage (%) | 72 | 71.5 -1% | 67 -7% | 77.1 7% | 37.47 -48% | 68.8 -4% |
| sRGB Coverage (%) | 99 | 99 0% | 98 -1% | 99.8 1% | 56 -43% | 99.4 0% |
| AdobeRGB 1998 Coverage (%) | 73 | 72.5 -1% | 69 -5% | 76.7 5% | 38.71 -47% | 70.9 -3% |
| Response Times | 7% | 2% | -35% | 14% | -12% | |
| Response Time Grey 50% / Grey 80% * (ms) | 49 ? | 48 ? 2% | 52 ? -6% | 61.2 ? -25% | 41 ? 16% | 59.6 ? -22% |
| Response Time Black / White * (ms) | 32 ? | 28 ? 12% | 29 ? 9% | 46 ? -44% | 28 ? 12% | 32.8 ? -2% |
| PWM Frequency (Hz) | 29800 | |||||
| Screen | 24% | 15% | 8% | -10% | 15% | |
| Brightness middle (cd/m²) | 395 | 364 -8% | 320 -19% | 412 4% | 357 -10% | 293 -26% |
| Brightness (cd/m²) | 391 | 372 -5% | 309 -21% | 392 0% | 315 -19% | 277 -29% |
| Brightness Distribution (%) | 89 | 89 0% | 84 -6% | 81 -9% | 82 -8% | 89 0% |
| Black Level * (cd/m²) | 0.18 | 0.19 -6% | 0.25 -39% | 0.32 -78% | 0.455 -153% | 0.18 -0% |
| Contrast (:1) | 2194 | 1916 -13% | 1280 -42% | 1288 -41% | 785 -64% | 1628 -26% |
| Colorchecker dE 2000 * | 9.73 | 2.18 78% | 2.57 74% | 1.88 81% | 3.98 59% | 2.95 70% |
| Colorchecker dE 2000 max. * | 16.33 | 4.01 75% | 3.5 79% | 3.06 81% | 6.92 58% | 6.03 63% |
| Colorchecker dE 2000 calibrated * | 1.41 | 0.76 46% | 1.96 -39% | 0.9 36% | ||
| Greyscale dE 2000 * | 7.5 | 2.34 69% | 2.46 67% | 2.2 71% | 3.33 56% | 4.2 44% |
| Gamma | 1.5 147% | 2.37 93% | 2.23 99% | 2.1 105% | 2.47 89% | 2.099 105% |
| CCT | 6678 97% | 6533 99% | 6311 103% | 6650 98% | 6138 106% | 6622 98% |
| Color Space (Percent of AdobeRGB 1998) (%) | 68.7 | 36 | 71 | |||
| Color Space (Percent of sRGB) (%) | 99.8 | 56 | 93 | |||
| Total Average (Program / Settings) | 10% /
16% | 4% /
9% | -8% /
1% | -14% /
-15% | 0% /
7% |
* ... smaller is better
出厂后,屏幕的色彩还原和准确性都很好。deltaE-2000色彩偏差为2.46,属于理想范围(deltaE小于3)。显示屏没有受到蓝色色调的影响。恰恰相反。99%的sRGB都被覆盖。在这方面,IPS竞争对手的表现并不差,除了 联想IdeaPad 5 14ALC05.
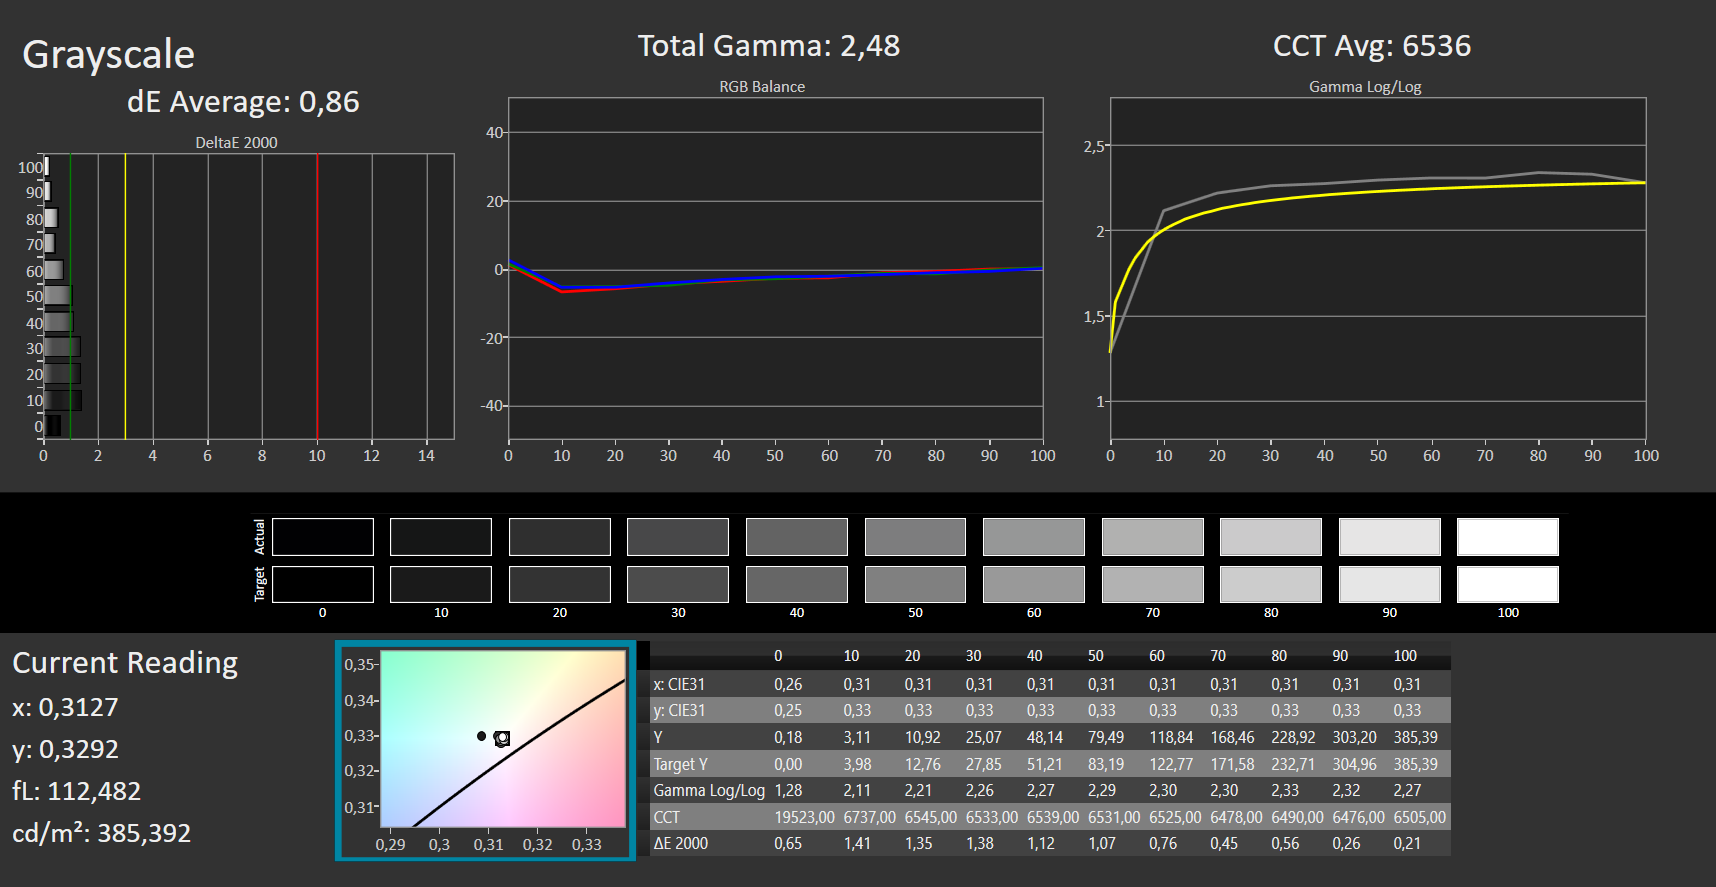
经过我们的校准尝试,Swift甚至更好,灰度和色彩deltaE分别达到了0.86和1.41。这些数值表明,一个优秀的IPS面板从校准中受益。
Display Response Times
| ↔ Response Time Black to White | ||
|---|---|---|
| 32 ms ... rise ↗ and fall ↘ combined | ↗ 16 ms rise |  |
| ↘ 16 ms fall | ||
| The screen shows slow response rates in our tests and will be unsatisfactory for gamers. In comparison, all tested devices range from 0.1 (minimum) to 240 (maximum) ms. » 86 % of all devices are better. This means that the measured response time is worse than the average of all tested devices (19.8 ms). | ||
| ↔ Response Time 50% Grey to 80% Grey | ||
| 49 ms ... rise ↗ and fall ↘ combined | ↗ 28 ms rise |  |
| ↘ 21 ms fall | ||
| The screen shows slow response rates in our tests and will be unsatisfactory for gamers. In comparison, all tested devices range from 0.165 (minimum) to 636 (maximum) ms. » 85 % of all devices are better. This means that the measured response time is worse than the average of all tested devices (31 ms). | ||
Screen Flickering / PWM (Pulse-Width Modulation)
| Screen flickering / PWM not detected |  | ||
In comparison: 52 % of all tested devices do not use PWM to dim the display. If PWM was detected, an average of 7754 (minimum: 5 - maximum: 343500) Hz was measured. | |||
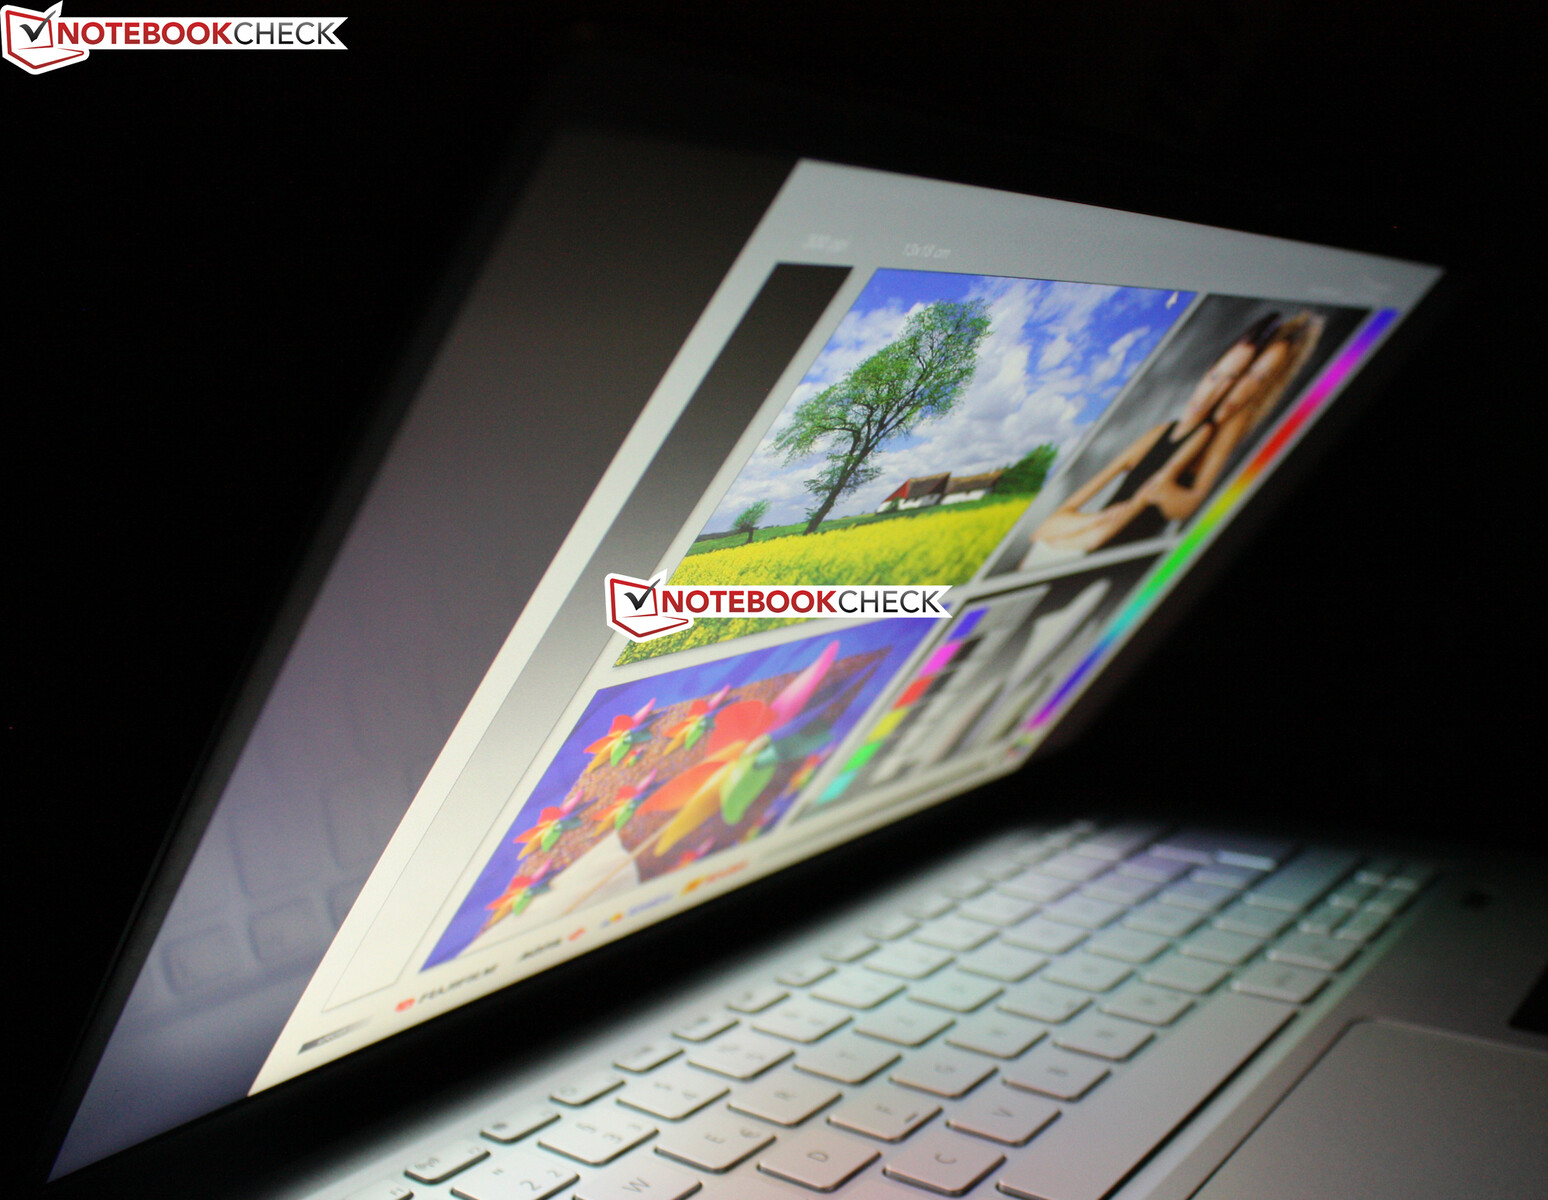
在户外,阳光下的可读性得益于无眩光涂层和400尼特的亮度。在电池模式下,当Radeon工具中的VariBright被禁用时,亮度不会降低。VariBright会根据周围的照明条件降低亮度。由于以下两张图片启用了VariBright,所以屏幕显得很暗。
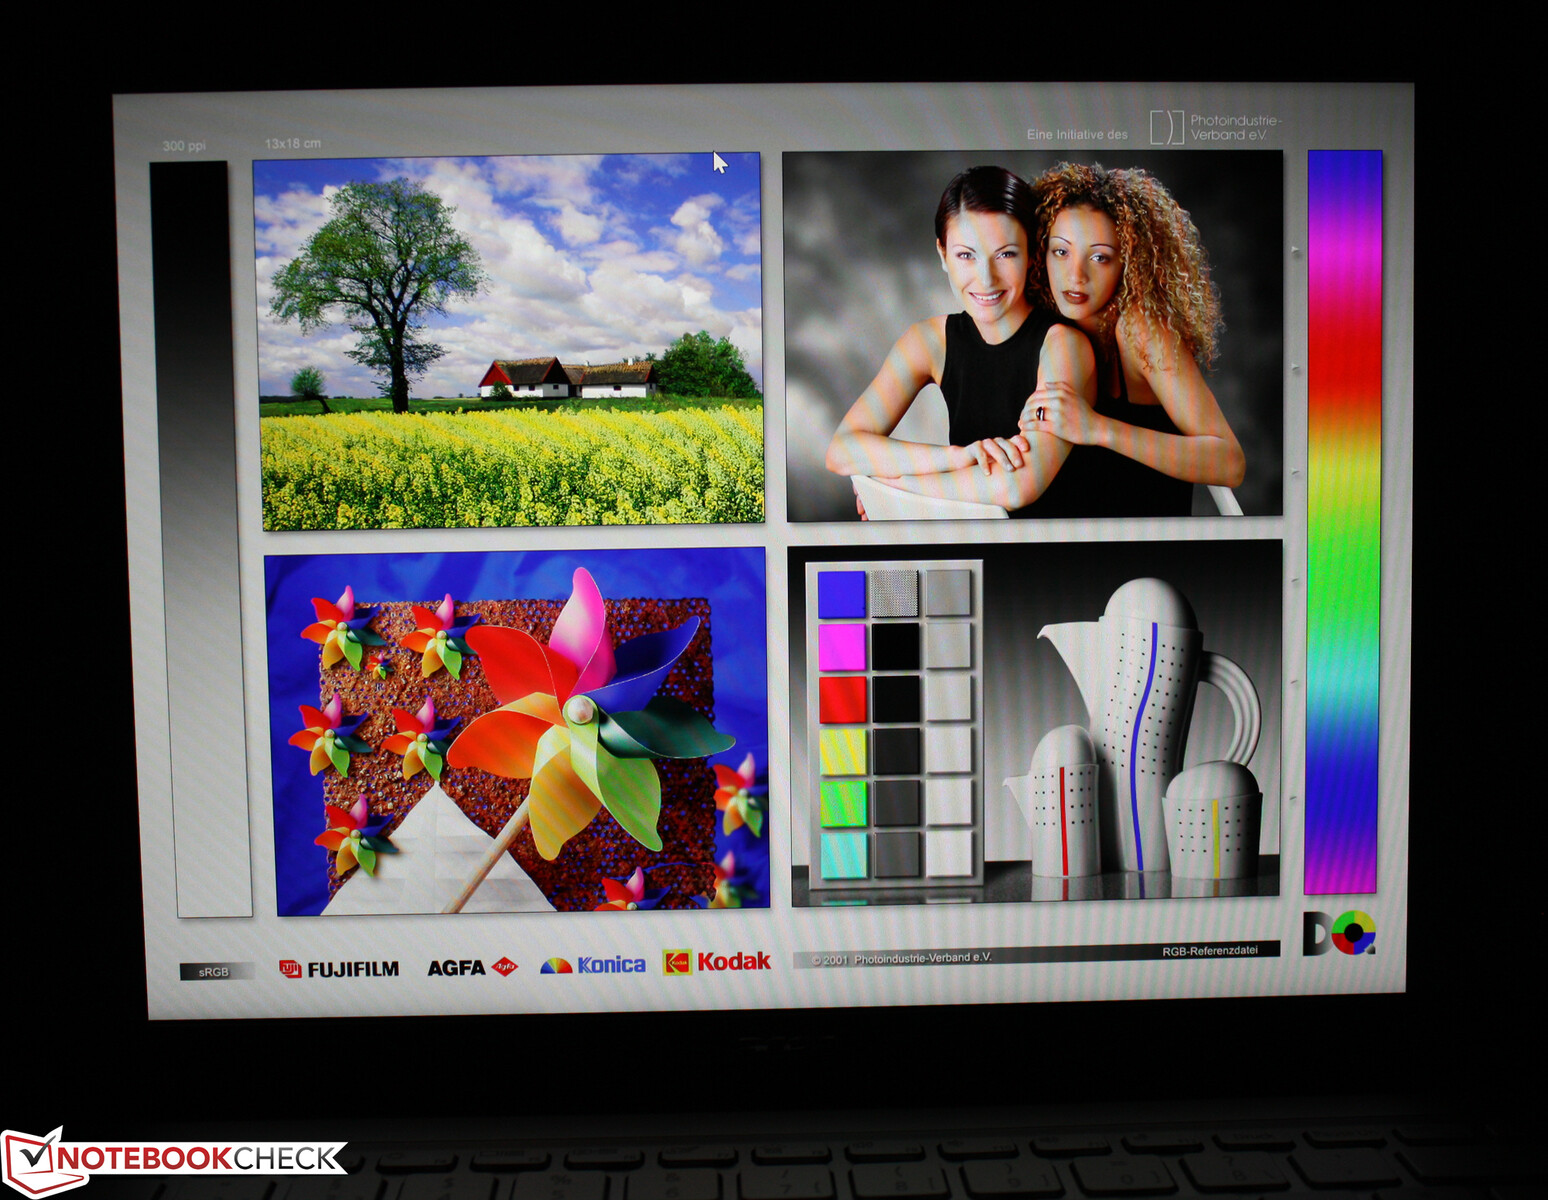
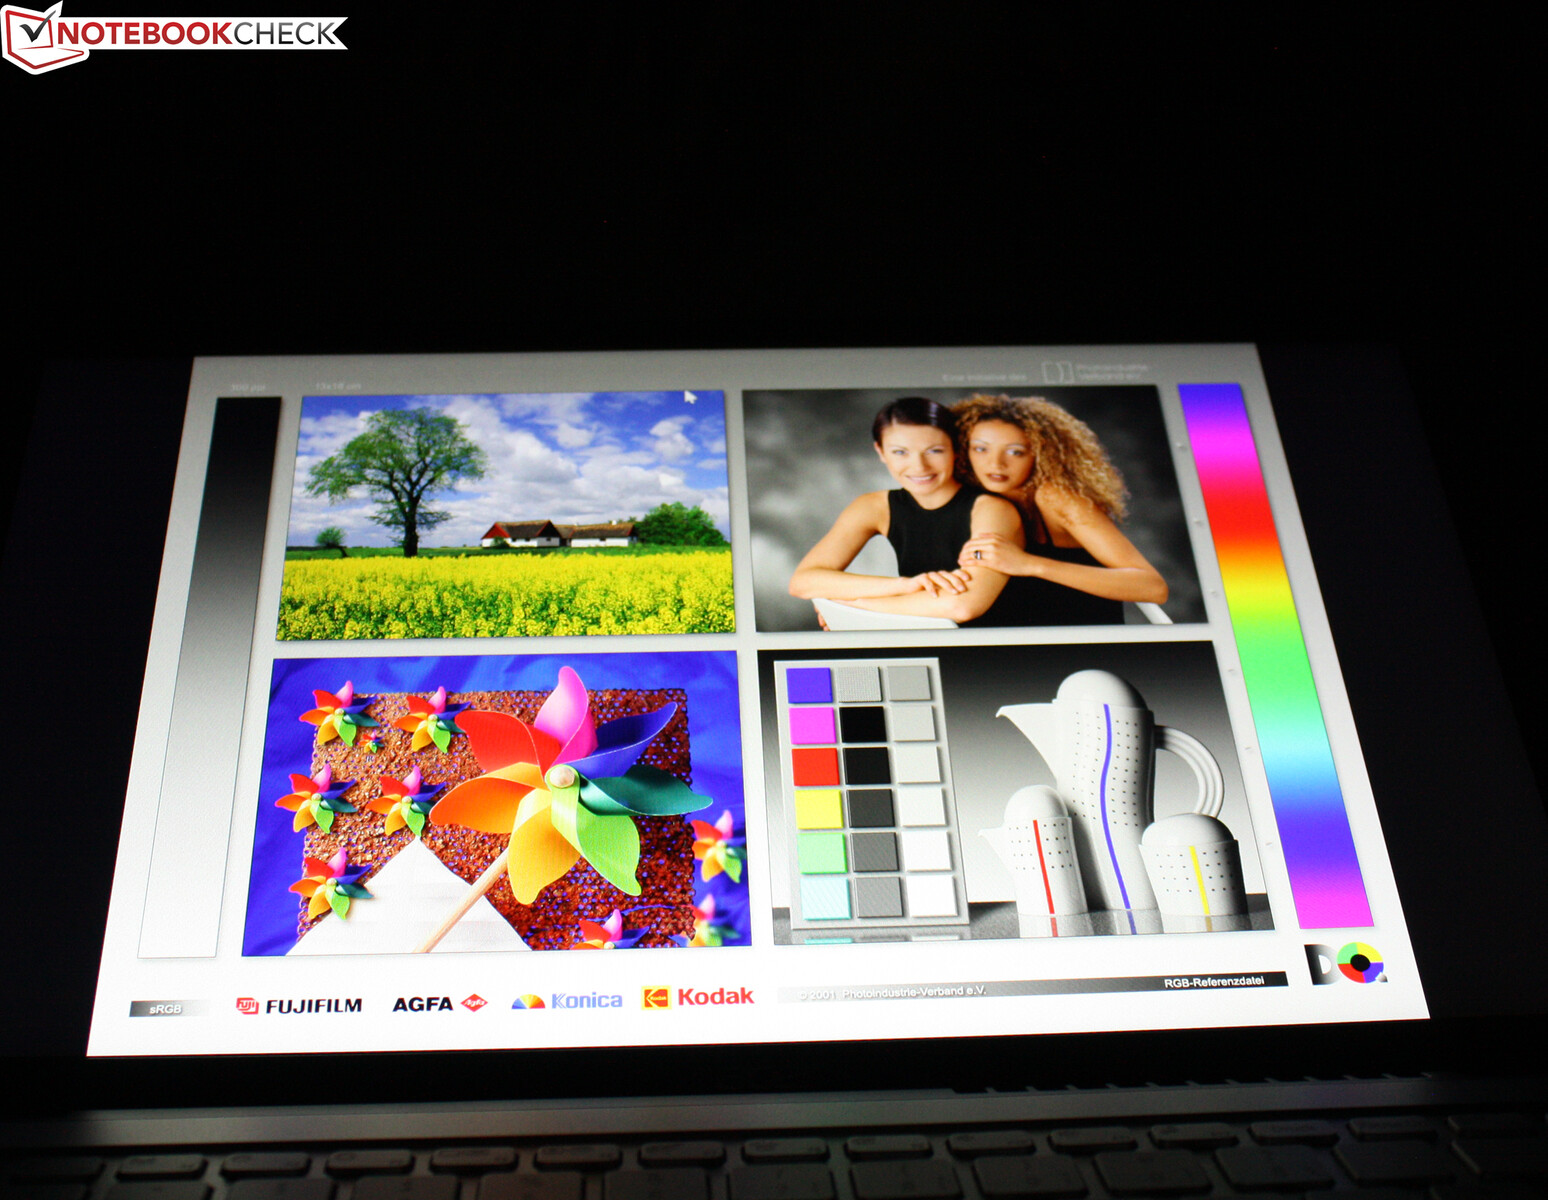
Swift X采用IPS面板,具有很好的可视角度。因此,该屏幕在任何位置都可以阅读。
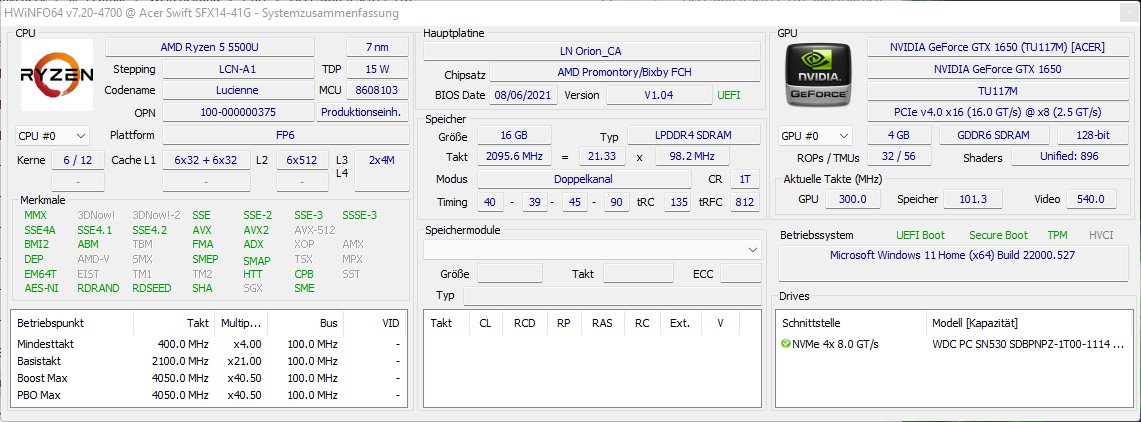
性能--AMD的Ryzen进入快车道
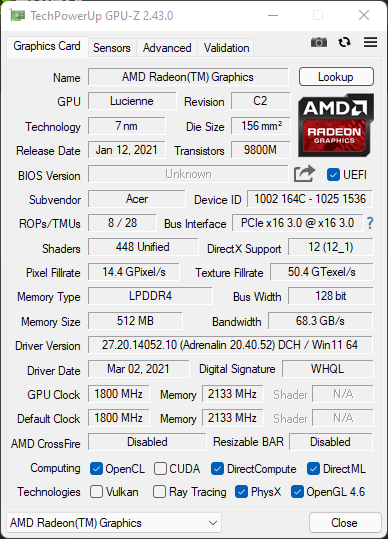
多媒体笔记本电脑Swift X SFX14-41G适用于各种工作负荷。除了日常的网络浏览之外,它也相当适合游戏,这要归功于它的 GeForce GTX 1650.除了我们的配置外,其中包括一个 AMD Ryzen 5 5500U、16GB内存和1TB NVMe SSD,还有其他配置,例如包括一个 GeForce RTX 3050 Ti或 RTX 3050 - 不含Ti。所有Swift X SFX14-41G都有一个板载的dGPU,可以禁用,以依靠Radeon RX GPU代替。带有8GB内存(焊接,不可升级)和512GB M.2固态硬盘的基本配置目前仅售800欧元(约880美元),这是一个引人注目的报价。
测试条件
宏碁公司没有提供性能控制工具。因此,只有windows电源配置文件可供定制。我们在性能基准测试中使用 "最佳性能",在电池测试中使用 "节能"。
处理器
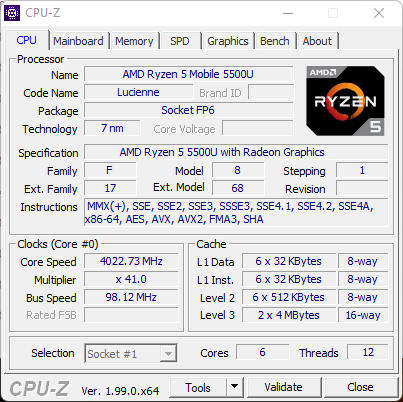
该 Ryzen 5 5500U在Swift X内的时钟速率高达4GHz。2021年初的六核CPU并非基于AMD最新的Zen-3架构。尽管其L3缓存较小,但该处理器取得了坚实的性能,尽管它在单线程性能方面落后于11代英特尔处理器。当涉及到多线程性能时,Ryzen芯片超过了i5和i7的分数。除此之外, Ryzen 5 5500U在我们的测试设备中比自己的平均分高出14%。简而言之:AMD APU在宏碁系统中的表现异常出色。
性能主要取决于TDP设置和冷却方案。在我们的Cinebench测试中,我们记录到最大的CPU封装功率为45瓦,这可能代表了PL2/短时爆发。这个水平只能维持几秒钟,之后下降到37瓦。再经过四次循环后,时钟速度下降,最终的封装功率为27瓦特。这个水平可以无限期地保持,甚至在电池模式下也是如此。
在第一个循环中得到1329分,在第六个循环中得到1182分,性能下降很低(10 %)。联想的 联想IdeaPad 5 14ALC05使用相同的芯片,性能稍差。笔记本电脑内的Core i7-1165G7 Swift 3X与我们的Swift X相比,速度明显较慢。总体性能评级也高于我们测试设备的平均水平。
Cinebench R15 Multi Loop
Cinebench R23: Multi Core | Single Core
Cinebench R20: CPU (Multi Core) | CPU (Single Core)
Cinebench R15: CPU Multi 64Bit | CPU Single 64Bit
Blender: v2.79 BMW27 CPU
7-Zip 18.03: 7z b 4 | 7z b 4 -mmt1
Geekbench 5.5: Multi-Core | Single-Core
HWBOT x265 Benchmark v2.2: 4k Preset
LibreOffice : 20 Documents To PDF
R Benchmark 2.5: Overall mean
| CPU Performance rating | |
| Average of class Multimedia | |
| Acer Swift 3X SF314-510G-70DW | |
| Acer Swift X SFX14-41G-R7F3 -1! | |
| MSI Prestige 14 Evo A11M-005 -2! | |
| HP Envy 14-eb0010nr | |
| Average AMD Ryzen 5 5500U | |
| Lenovo IdeaPad 5 14ALC05 82LM005YGE | |
| Acer Swift 3 SF314-511-54ZK | |
| Cinebench R23 / Multi Core | |
| Average of class Multimedia (4861 - 33362, n=65, last 2 years) | |
| Acer Swift X SFX14-41G-R7F3 | |
| Average AMD Ryzen 5 5500U (6030 - 8565, n=19) | |
| Lenovo IdeaPad 5 14ALC05 82LM005YGE | |
| HP Envy 14-eb0010nr | |
| Acer Swift 3X SF314-510G-70DW | |
| Acer Swift 3 SF314-511-54ZK | |
| Cinebench R23 / Single Core | |
| Average of class Multimedia (1128 - 2459, n=64, last 2 years) | |
| Acer Swift 3X SF314-510G-70DW | |
| HP Envy 14-eb0010nr | |
| Acer Swift 3 SF314-511-54ZK | |
| Lenovo IdeaPad 5 14ALC05 82LM005YGE | |
| Average AMD Ryzen 5 5500U (1149 - 1183, n=18) | |
| Acer Swift X SFX14-41G-R7F3 | |
| Cinebench R20 / CPU (Multi Core) | |
| Average of class Multimedia (1887 - 12912, n=56, last 2 years) | |
| Acer Swift X SFX14-41G-R7F3 | |
| Average AMD Ryzen 5 5500U (2223 - 3316, n=20) | |
| Lenovo IdeaPad 5 14ALC05 82LM005YGE | |
| HP Envy 14-eb0010nr | |
| MSI Prestige 14 Evo A11M-005 | |
| Acer Swift 3X SF314-510G-70DW | |
| Acer Swift 3 SF314-511-54ZK | |
| Cinebench R20 / CPU (Single Core) | |
| Average of class Multimedia (425 - 853, n=56, last 2 years) | |
| Acer Swift 3X SF314-510G-70DW | |
| MSI Prestige 14 Evo A11M-005 | |
| Acer Swift 3 SF314-511-54ZK | |
| HP Envy 14-eb0010nr | |
| Lenovo IdeaPad 5 14ALC05 82LM005YGE | |
| Average AMD Ryzen 5 5500U (449 - 461, n=19) | |
| Acer Swift X SFX14-41G-R7F3 | |
| Cinebench R15 / CPU Multi 64Bit | |
| Average of class Multimedia (856 - 5224, n=60, last 2 years) | |
| Acer Swift X SFX14-41G-R7F3 | |
| Lenovo IdeaPad 5 14ALC05 82LM005YGE | |
| Average AMD Ryzen 5 5500U (995 - 1412, n=20) | |
| Acer Swift 3X SF314-510G-70DW | |
| MSI Prestige 14 Evo A11M-005 | |
| HP Envy 14-eb0010nr | |
| Acer Swift 3 SF314-511-54ZK | |
| Cinebench R15 / CPU Single 64Bit | |
| Average of class Multimedia (184.8 - 326, n=58, last 2 years) | |
| Acer Swift 3X SF314-510G-70DW | |
| MSI Prestige 14 Evo A11M-005 | |
| HP Envy 14-eb0010nr | |
| Acer Swift 3 SF314-511-54ZK | |
| Average AMD Ryzen 5 5500U (170 - 179, n=18) | |
| Lenovo IdeaPad 5 14ALC05 82LM005YGE | |
| Acer Swift X SFX14-41G-R7F3 | |
| Blender / v2.79 BMW27 CPU | |
| Acer Swift 3 SF314-511-54ZK | |
| MSI Prestige 14 Evo A11M-005 | |
| Acer Swift 3X SF314-510G-70DW | |
| HP Envy 14-eb0010nr | |
| Lenovo IdeaPad 5 14ALC05 82LM005YGE | |
| Average AMD Ryzen 5 5500U (358 - 490, n=18) | |
| Acer Swift X SFX14-41G-R7F3 | |
| Average of class Multimedia (100 - 557, n=57, last 2 years) | |
| 7-Zip 18.03 / 7z b 4 | |
| Average of class Multimedia (26062 - 130368, n=54, last 2 years) | |
| Acer Swift X SFX14-41G-R7F3 | |
| Average AMD Ryzen 5 5500U (29585 - 36896, n=18) | |
| Lenovo IdeaPad 5 14ALC05 82LM005YGE | |
| Acer Swift 3X SF314-510G-70DW | |
| MSI Prestige 14 Evo A11M-005 | |
| HP Envy 14-eb0010nr | |
| Acer Swift 3 SF314-511-54ZK | |
| 7-Zip 18.03 / 7z b 4 -mmt1 | |
| Average of class Multimedia (3666 - 7545, n=55, last 2 years) | |
| Acer Swift 3X SF314-510G-70DW | |
| MSI Prestige 14 Evo A11M-005 | |
| HP Envy 14-eb0010nr | |
| Acer Swift 3 SF314-511-54ZK | |
| Lenovo IdeaPad 5 14ALC05 82LM005YGE | |
| Average AMD Ryzen 5 5500U (4174 - 4378, n=19) | |
| Acer Swift X SFX14-41G-R7F3 | |
| Geekbench 5.5 / Multi-Core | |
| Average of class Multimedia (4652 - 20422, n=55, last 2 years) | |
| Acer Swift X SFX14-41G-R7F3 | |
| Acer Swift 3X SF314-510G-70DW | |
| MSI Prestige 14 Evo A11M-005 | |
| Lenovo IdeaPad 5 14ALC05 82LM005YGE | |
| Average AMD Ryzen 5 5500U (4063 - 5917, n=20) | |
| Acer Swift 3 SF314-511-54ZK | |
| HP Envy 14-eb0010nr | |
| Geekbench 5.5 / Single-Core | |
| Average of class Multimedia (805 - 2974, n=55, last 2 years) | |
| Acer Swift 3X SF314-510G-70DW | |
| HP Envy 14-eb0010nr | |
| MSI Prestige 14 Evo A11M-005 | |
| Acer Swift 3 SF314-511-54ZK | |
| Lenovo IdeaPad 5 14ALC05 82LM005YGE | |
| Average AMD Ryzen 5 5500U (1070 - 1126, n=20) | |
| Acer Swift X SFX14-41G-R7F3 | |
| HWBOT x265 Benchmark v2.2 / 4k Preset | |
| Average of class Multimedia (5.26 - 36.1, n=55, last 2 years) | |
| Acer Swift X SFX14-41G-R7F3 | |
| Average AMD Ryzen 5 5500U (6.7 - 9.74, n=20) | |
| Lenovo IdeaPad 5 14ALC05 82LM005YGE | |
| Acer Swift 3X SF314-510G-70DW | |
| HP Envy 14-eb0010nr | |
| MSI Prestige 14 Evo A11M-005 | |
| Acer Swift 3 SF314-511-54ZK | |
| LibreOffice / 20 Documents To PDF | |
| Average AMD Ryzen 5 5500U (60 - 80.7, n=17) | |
| Lenovo IdeaPad 5 14ALC05 82LM005YGE | |
| MSI Prestige 14 Evo A11M-005 | |
| Acer Swift 3 SF314-511-54ZK | |
| HP Envy 14-eb0010nr | |
| Average of class Multimedia (23.9 - 146.7, n=56, last 2 years) | |
| Acer Swift 3X SF314-510G-70DW | |
| R Benchmark 2.5 / Overall mean | |
| Acer Swift X SFX14-41G-R7F3 | |
| Acer Swift 3 SF314-511-54ZK | |
| HP Envy 14-eb0010nr | |
| Average AMD Ryzen 5 5500U (0.607 - 0.67, n=19) | |
| Lenovo IdeaPad 5 14ALC05 82LM005YGE | |
| MSI Prestige 14 Evo A11M-005 | |
| Acer Swift 3X SF314-510G-70DW | |
| Average of class Multimedia (0.3604 - 0.947, n=55, last 2 years) | |
* ... smaller is better
AIDA64: FP32 Ray-Trace | FPU Julia | CPU SHA3 | CPU Queen | FPU SinJulia | FPU Mandel | CPU AES | CPU ZLib | FP64 Ray-Trace | CPU PhotoWorxx
| Performance rating | |
| Average of class Multimedia | |
| Acer Swift X SFX14-41G-R7F3 | |
| Average AMD Ryzen 5 5500U | |
| Lenovo IdeaPad 5 14ALC05 82LM005YGE | |
| Acer Swift 3X SF314-510G-70DW | |
| MSI Prestige 14 Evo A11M-005 | |
| Acer Swift 3 SF314-511-54ZK | |
| AIDA64 / FP32 Ray-Trace | |
| Average of class Multimedia (2214 - 50388, n=53, last 2 years) | |
| Acer Swift X SFX14-41G-R7F3 | |
| Average AMD Ryzen 5 5500U (7222 - 10680, n=18) | |
| Lenovo IdeaPad 5 14ALC05 82LM005YGE | |
| Acer Swift 3X SF314-510G-70DW | |
| Acer Swift 3 SF314-511-54ZK | |
| MSI Prestige 14 Evo A11M-005 | |
| AIDA64 / FPU Julia | |
| Average of class Multimedia (12867 - 201874, n=53, last 2 years) | |
| Acer Swift X SFX14-41G-R7F3 | |
| Average AMD Ryzen 5 5500U (41815 - 58107, n=18) | |
| Lenovo IdeaPad 5 14ALC05 82LM005YGE | |
| Acer Swift 3X SF314-510G-70DW | |
| MSI Prestige 14 Evo A11M-005 | |
| Acer Swift 3 SF314-511-54ZK | |
| AIDA64 / CPU SHA3 | |
| Average of class Multimedia (626 - 8623, n=53, last 2 years) | |
| Acer Swift 3X SF314-510G-70DW | |
| Acer Swift 3 SF314-511-54ZK | |
| MSI Prestige 14 Evo A11M-005 | |
| Acer Swift X SFX14-41G-R7F3 | |
| Average AMD Ryzen 5 5500U (1354 - 1907, n=18) | |
| Lenovo IdeaPad 5 14ALC05 82LM005YGE | |
| AIDA64 / CPU Queen | |
| Average of class Multimedia (13483 - 181505, n=40, last 2 years) | |
| Acer Swift X SFX14-41G-R7F3 | |
| Average AMD Ryzen 5 5500U (68235 - 74033, n=18) | |
| Lenovo IdeaPad 5 14ALC05 82LM005YGE | |
| Acer Swift 3X SF314-510G-70DW | |
| MSI Prestige 14 Evo A11M-005 | |
| Acer Swift 3 SF314-511-54ZK | |
| AIDA64 / FPU SinJulia | |
| Acer Swift X SFX14-41G-R7F3 | |
| Average AMD Ryzen 5 5500U (9007 - 10446, n=18) | |
| Lenovo IdeaPad 5 14ALC05 82LM005YGE | |
| Average of class Multimedia (886 - 28794, n=53, last 2 years) | |
| Acer Swift 3X SF314-510G-70DW | |
| MSI Prestige 14 Evo A11M-005 | |
| Acer Swift 3 SF314-511-54ZK | |
| AIDA64 / FPU Mandel | |
| Average of class Multimedia (6395 - 105740, n=53, last 2 years) | |
| Acer Swift X SFX14-41G-R7F3 | |
| Average AMD Ryzen 5 5500U (21894 - 30659, n=18) | |
| Lenovo IdeaPad 5 14ALC05 82LM005YGE | |
| Acer Swift 3X SF314-510G-70DW | |
| MSI Prestige 14 Evo A11M-005 | |
| Acer Swift 3 SF314-511-54ZK | |
| AIDA64 / CPU AES | |
| Acer Swift 3X SF314-510G-70DW | |
| Average of class Multimedia (8171 - 126790, n=53, last 2 years) | |
| Average AMD Ryzen 5 5500U (31792 - 54455, n=18) | |
| Lenovo IdeaPad 5 14ALC05 82LM005YGE | |
| MSI Prestige 14 Evo A11M-005 | |
| Acer Swift 3 SF314-511-54ZK | |
| Acer Swift X SFX14-41G-R7F3 | |
| AIDA64 / CPU ZLib | |
| Average of class Multimedia (143.8 - 2022, n=53, last 2 years) | |
| Acer Swift X SFX14-41G-R7F3 | |
| Average AMD Ryzen 5 5500U (234 - 614, n=18) | |
| Lenovo IdeaPad 5 14ALC05 82LM005YGE | |
| Acer Swift 3X SF314-510G-70DW | |
| MSI Prestige 14 Evo A11M-005 | |
| Acer Swift 3 SF314-511-54ZK | |
| AIDA64 / FP64 Ray-Trace | |
| Average of class Multimedia (1014 - 26875, n=53, last 2 years) | |
| Acer Swift X SFX14-41G-R7F3 | |
| Average AMD Ryzen 5 5500U (3943 - 5717, n=18) | |
| Lenovo IdeaPad 5 14ALC05 82LM005YGE | |
| Acer Swift 3X SF314-510G-70DW | |
| MSI Prestige 14 Evo A11M-005 | |
| Acer Swift 3 SF314-511-54ZK | |
| AIDA64 / CPU PhotoWorxx | |
| Average of class Multimedia (8187 - 88154, n=53, last 2 years) | |
| MSI Prestige 14 Evo A11M-005 | |
| Acer Swift 3X SF314-510G-70DW | |
| Acer Swift 3 SF314-511-54ZK | |
| Acer Swift X SFX14-41G-R7F3 | |
| Lenovo IdeaPad 5 14ALC05 82LM005YGE | |
| Average AMD Ryzen 5 5500U (7765 - 22932, n=18) | |
系统性能
我们的测试样本在PCMark中排在最后,但数字内容创作子分数除外,它在那里--可能是由于其 GTX 1650 - 能够与惠普Envy 14-eb0010nr一起获得第一名。 HP Envy 14-eb0010nr.差异在5%到16%之间,差异很小,我们比较的每台设备都是很好的全能办公笔记本电脑。在比较这些型号时,输入设备和显示器方面的更大差异应该是决定性因素。
CrossMark: Overall | Productivity | Creativity | Responsiveness
| PCMark 10 / Score | |
| Average of class Multimedia (4325 - 10386, n=51, last 2 years) | |
| HP Envy 14-eb0010nr | |
| Lenovo IdeaPad 5 14ALC05 82LM005YGE | |
| Acer Swift 3X SF314-510G-70DW | |
| Average AMD Ryzen 5 5500U, NVIDIA GeForce GTX 1650 Mobile (4672 - 5138, n=2) | |
| Acer Swift 3 SF314-511-54ZK | |
| MSI Prestige 14 Evo A11M-005 | |
| Acer Swift X SFX14-41G-R7F3 | |
| PCMark 10 / Essentials | |
| Average of class Multimedia (8025 - 11664, n=50, last 2 years) | |
| Acer Swift 3X SF314-510G-70DW | |
| MSI Prestige 14 Evo A11M-005 | |
| Acer Swift 3 SF314-511-54ZK | |
| Lenovo IdeaPad 5 14ALC05 82LM005YGE | |
| HP Envy 14-eb0010nr | |
| Average AMD Ryzen 5 5500U, NVIDIA GeForce GTX 1650 Mobile (8448 - 8671, n=2) | |
| Acer Swift X SFX14-41G-R7F3 | |
| PCMark 10 / Productivity | |
| Average of class Multimedia (7323 - 18233, n=50, last 2 years) | |
| HP Envy 14-eb0010nr | |
| Lenovo IdeaPad 5 14ALC05 82LM005YGE | |
| MSI Prestige 14 Evo A11M-005 | |
| Average AMD Ryzen 5 5500U, NVIDIA GeForce GTX 1650 Mobile (5704 - 7154, n=2) | |
| Acer Swift 3X SF314-510G-70DW | |
| Acer Swift 3 SF314-511-54ZK | |
| Acer Swift X SFX14-41G-R7F3 | |
| PCMark 10 / Digital Content Creation | |
| Average of class Multimedia (3651 - 16240, n=50, last 2 years) | |
| Average AMD Ryzen 5 5500U, NVIDIA GeForce GTX 1650 Mobile (5744 - 5936, n=2) | |
| Acer Swift X SFX14-41G-R7F3 | |
| HP Envy 14-eb0010nr | |
| Lenovo IdeaPad 5 14ALC05 82LM005YGE | |
| Acer Swift 3 SF314-511-54ZK | |
| MSI Prestige 14 Evo A11M-005 | |
| Acer Swift 3X SF314-510G-70DW | |
| CrossMark / Overall | |
| Average of class Multimedia (866 - 2728, n=59, last 2 years) | |
| Acer Swift 3 SF314-511-54ZK | |
| Acer Swift X SFX14-41G-R7F3 | |
| Average AMD Ryzen 5 5500U, NVIDIA GeForce GTX 1650 Mobile (n=1) | |
| CrossMark / Productivity | |
| Average of class Multimedia (931 - 2489, n=59, last 2 years) | |
| Acer Swift 3 SF314-511-54ZK | |
| Acer Swift X SFX14-41G-R7F3 | |
| Average AMD Ryzen 5 5500U, NVIDIA GeForce GTX 1650 Mobile (n=1) | |
| CrossMark / Creativity | |
| Average of class Multimedia (907 - 3465, n=59, last 2 years) | |
| Acer Swift 3 SF314-511-54ZK | |
| Acer Swift X SFX14-41G-R7F3 | |
| Average AMD Ryzen 5 5500U, NVIDIA GeForce GTX 1650 Mobile (n=1) | |
| CrossMark / Responsiveness | |
| Average of class Multimedia (605 - 2024, n=59, last 2 years) | |
| Acer Swift 3 SF314-511-54ZK | |
| Acer Swift X SFX14-41G-R7F3 | |
| Average AMD Ryzen 5 5500U, NVIDIA GeForce GTX 1650 Mobile (n=1) | |
| PCMark 10 Score | 4672 points | |
Help | ||
| AIDA64 / Memory Copy | |
| Average of class Multimedia (11299 - 132135, n=53, last 2 years) | |
| MSI Prestige 14 Evo A11M-005 | |
| Acer Swift 3X SF314-510G-70DW | |
| Acer Swift 3 SF314-511-54ZK | |
| Acer Swift X SFX14-41G-R7F3 | |
| Lenovo IdeaPad 5 14ALC05 82LM005YGE | |
| Average AMD Ryzen 5 5500U (19083 - 40547, n=18) | |
| AIDA64 / Memory Read | |
| Average of class Multimedia (11624 - 174586, n=53, last 2 years) | |
| Acer Swift 3X SF314-510G-70DW | |
| Acer Swift 3 SF314-511-54ZK | |
| MSI Prestige 14 Evo A11M-005 | |
| Acer Swift X SFX14-41G-R7F3 | |
| Lenovo IdeaPad 5 14ALC05 82LM005YGE | |
| Average AMD Ryzen 5 5500U (23005 - 47024, n=18) | |
| AIDA64 / Memory Write | |
| Average of class Multimedia (11755 - 134998, n=53, last 2 years) | |
| Acer Swift 3X SF314-510G-70DW | |
| MSI Prestige 14 Evo A11M-005 | |
| Acer Swift 3 SF314-511-54ZK | |
| Acer Swift X SFX14-41G-R7F3 | |
| Lenovo IdeaPad 5 14ALC05 82LM005YGE | |
| Average AMD Ryzen 5 5500U (20150 - 42337, n=18) | |
| AIDA64 / Memory Latency | |
| Average of class Multimedia (7 - 535, n=52, last 2 years) | |
| Acer Swift X SFX14-41G-R7F3 | |
| Acer Swift 3 SF314-511-54ZK | |
| MSI Prestige 14 Evo A11M-005 | |
| Average AMD Ryzen 5 5500U (87.3 - 119, n=18) | |
| Lenovo IdeaPad 5 14ALC05 82LM005YGE | |
| Acer Swift 3X SF314-510G-70DW | |
* ... smaller is better
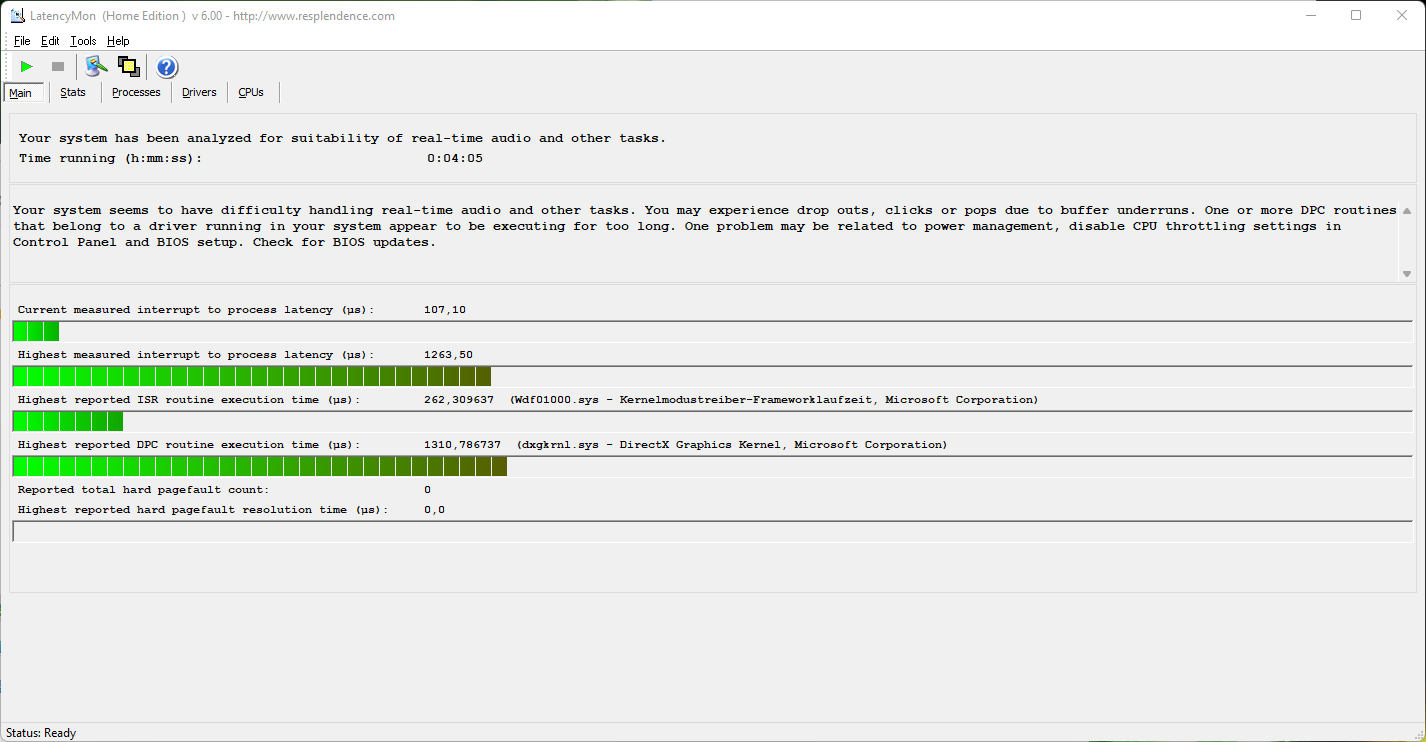
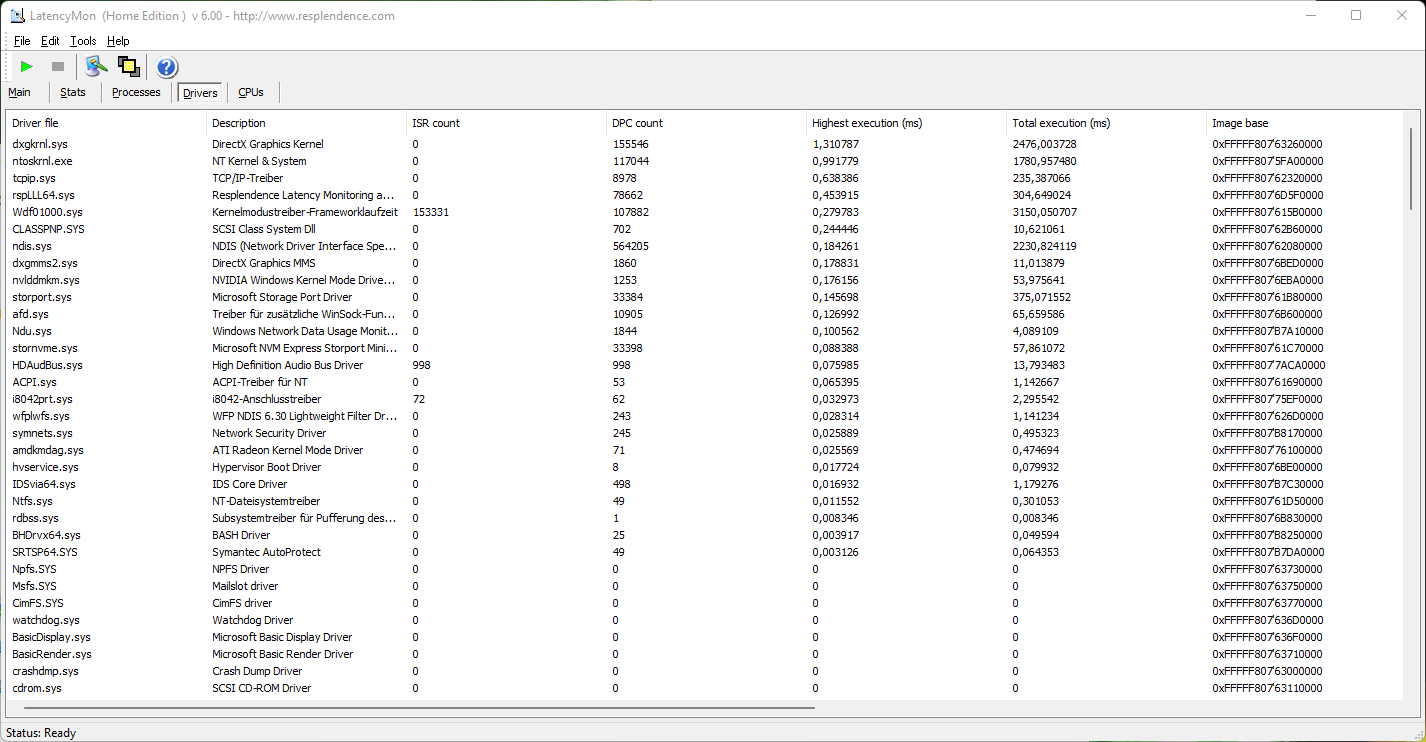
DPC延迟
在我们的LatencyMon测试中,由于DirectX内核驱动的原因,Swift的延迟会增加。因此,14英寸笔记本电脑可能不适合实时应用程序和有类似要求的软件。测量结果是基于测试时可用的驱动配置。
| DPC Latencies / LatencyMon - interrupt to process latency (max), Web, Youtube, Prime95 | |
| HP Envy 14-eb0010nr | |
| Acer Swift 3X SF314-510G-70DW | |
| Acer Swift 3 SF314-511-54ZK | |
| Acer Swift X SFX14-41G-R7F3 | |
| MSI Prestige 14 Evo A11M-005 | |
| Lenovo IdeaPad 5 14ALC05 82LM005YGE | |
* ... smaller is better
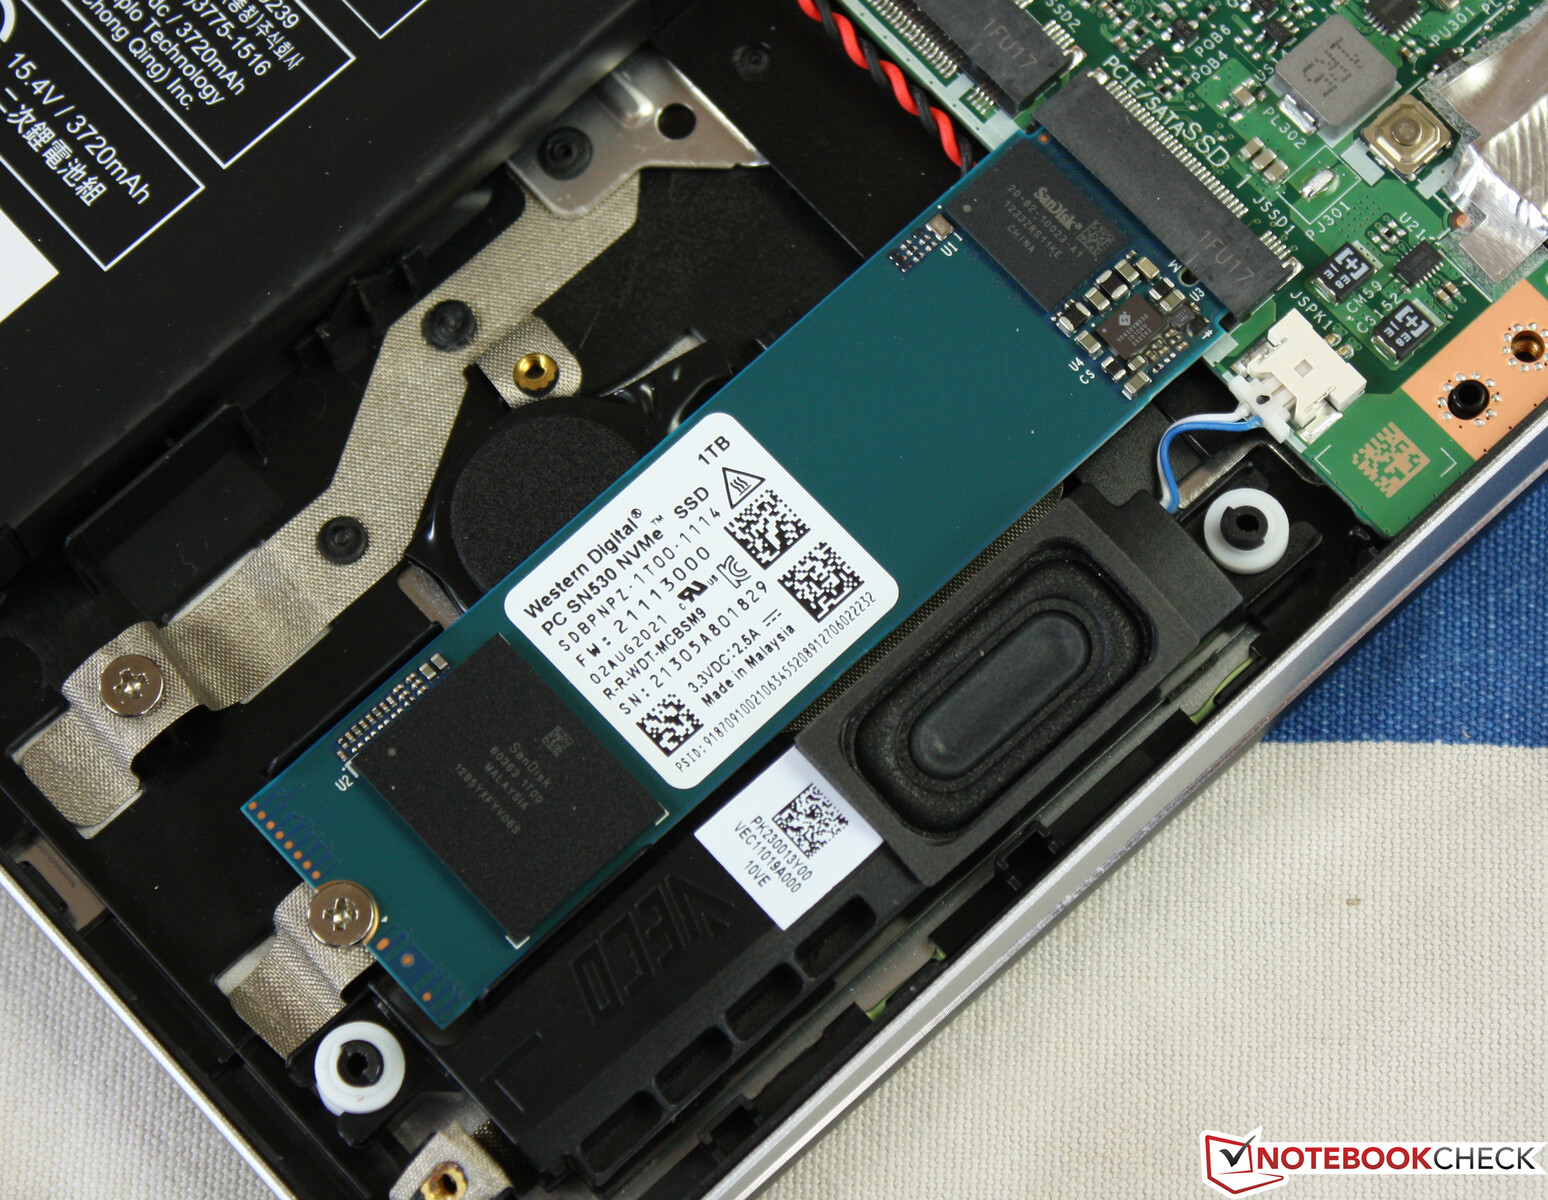
存储解决方案

| Drive Performance rating - Percent | |
| Acer Swift 3 SF314-511-54ZK -1! | |
| Average of class Multimedia | |
| MSI Prestige 14 Evo A11M-005 | |
| Lenovo IdeaPad 5 14ALC05 82LM005YGE | |
| Acer Swift X SFX14-41G-R7F3 | |
| Average WDC PC SN530 SDBPNPZ-1T00 | |
| HP Envy 14-eb0010nr | |
| Acer Swift 3X SF314-510G-70DW | |
* ... smaller is better
Disk Throttling: DiskSpd Read Loop, Queue Depth 8
GPU性能
Nvidia GeForce GTX 1650是一个入门级的GPU,也适用于薄型笔记本电脑。在这种情况下,我们的测试设备配备的是GDDR6变体(N18P-G61,896着色器)。由于仅GPU的耗电量就高达50瓦,宏碁为该机型配备了一个90瓦的电源砖。在3DMark性能评级中,我们的宏碁内部的GTX显卡的表现比其平均水平差15%。在这里, HP Envy 14-eb0010nr更快。
姊妹机型Swift X SFX14-41G-R1S3配备了一个 GeForce RTX 3050 Ti也是可用的,这就引出了一个问题,这两者之间如何比较。由于我们还没有能够测试这个模型,我们使用了戴尔G14 5515作为RTX 3050 Ti系统的替身进行以下比较。假设冷却解决方案与戴尔的一样有效,那么这种升级是值得的。该 RTX 3050 Ti使我们的合成性能得分翻了一番,在游戏中的性能也提高了约100%。
与其他图形单元的更多比较可以在我们的 GPU基准测试列表.
| 3DMark Performance rating - Percent | |
| Average of class Multimedia | |
| Dell G15 5515 | |
| Average NVIDIA GeForce GTX 1650 Mobile | |
| HP Envy 14-eb0010nr | |
| Acer Swift X SFX14-41G-R7F3 | |
| Acer Swift 3X SF314-510G-70DW | |
| MSI Prestige 14 Evo A11M-005 | |
| Acer Swift 3 SF314-511-54ZK | |
| Lenovo IdeaPad 5 14ALC05 82LM005YGE | |
| 3DMark 11 - 1280x720 Performance GPU | |
| Dell G15 5515 | |
| Average of class Multimedia (3749 - 60002, n=54, last 2 years) | |
| Average NVIDIA GeForce GTX 1650 Mobile (10885 - 13575, n=30) | |
| HP Envy 14-eb0010nr | |
| Acer Swift X SFX14-41G-R7F3 | |
| Acer Swift 3X SF314-510G-70DW | |
| MSI Prestige 14 Evo A11M-005 | |
| Acer Swift 3 SF314-511-54ZK | |
| Lenovo IdeaPad 5 14ALC05 82LM005YGE | |
| 3DMark | |
| 1920x1080 Fire Strike Graphics | |
| Average of class Multimedia (2328 - 48907, n=57, last 2 years) | |
| Dell G15 5515 | |
| Average NVIDIA GeForce GTX 1650 Mobile (7741 - 9810, n=32) | |
| HP Envy 14-eb0010nr | |
| Acer Swift X SFX14-41G-R7F3 | |
| Acer Swift 3X SF314-510G-70DW | |
| MSI Prestige 14 Evo A11M-005 | |
| Acer Swift 3 SF314-511-54ZK | |
| Lenovo IdeaPad 5 14ALC05 82LM005YGE | |
| 2560x1440 Time Spy Graphics | |
| Dell G15 5515 | |
| Average of class Multimedia (696 - 19403, n=57, last 2 years) | |
| Average NVIDIA GeForce GTX 1650 Mobile (2900 - 3700, n=31) | |
| HP Envy 14-eb0010nr | |
| Acer Swift X SFX14-41G-R7F3 | |
| Acer Swift 3X SF314-510G-70DW | |
| MSI Prestige 14 Evo A11M-005 | |
| Acer Swift 3 SF314-511-54ZK | |
| Lenovo IdeaPad 5 14ALC05 82LM005YGE | |
| 3DMark 11 Performance | 10672 points | |
| 3DMark Fire Strike Score | 7427 points | |
| 3DMark Time Spy Score | 3142 points | |
Help | ||
游戏性能

与我们数据库中的平均水平相比,宏碁内部的GTX在实际游戏中的表现要差6-15%。这表明,单风扇的冷却解决方案并不像宏碁的双风扇那样有效。 Envy 14-eb0010nr.
正如预期的那样,iGPU在面对GTX时没有机会。然而,即使是专用芯片也遇到了麻烦。宏碁的 Swift 3X SF314-510G配有Iris Xe Max的宏碁Swift 3X SF314-510G在运行《奇异旅团》时只有29 FPS,而GTX则能达到51。AMD的iGPU Vega 7,也可以在我们的测试模型中发挥作用,只达到21 FPS。
我们的GPU游戏列表显示了在其他游戏中可以预期的性能水平。
| The Witcher 3 | |
| 1920x1080 High Graphics & Postprocessing (Nvidia HairWorks Off) | |
| Dell G15 5515 | |
| Average of class Multimedia (22 - 157, n=5, last 2 years) | |
| Average NVIDIA GeForce GTX 1650 Mobile (45 - 70.4, n=29) | |
| HP Envy 14-eb0010nr | |
| Acer Swift X SFX14-41G-R7F3 | |
| Acer Swift 3X SF314-510G-70DW | |
| MSI Prestige 14 Evo A11M-005 | |
| Lenovo IdeaPad 5 14ALC05 82LM005YGE | |
| Acer Swift 3 SF314-511-54ZK | |
| 1920x1080 Ultra Graphics & Postprocessing (HBAO+) | |
| Dell G15 5515 | |
| Average of class Multimedia (11 - 107, n=5, last 2 years) | |
| Average NVIDIA GeForce GTX 1650 Mobile (29.9 - 40.3, n=31) | |
| HP Envy 14-eb0010nr | |
| Acer Swift X SFX14-41G-R7F3 | |
| Acer Swift 3X SF314-510G-70DW | |
| MSI Prestige 14 Evo A11M-005 | |
| Lenovo IdeaPad 5 14ALC05 82LM005YGE | |
| Acer Swift 3 SF314-511-54ZK | |
| Far Cry 5 - 1920x1080 Ultra Preset AA:T | |
| Dell G15 5515 | |
| Average of class Multimedia (17 - 145, n=14, last 2 years) | |
| Average NVIDIA GeForce GTX 1650 Mobile (44 - 57, n=9) | |
| Acer Swift X SFX14-41G-R7F3 | |
| Lenovo IdeaPad 5 14ALC05 82LM005YGE | |
| Strange Brigade - 1920x1080 ultra AA:ultra AF:16 | |
| Dell G15 5515 | |
| Average of class Multimedia (13.3 - 303, n=55, last 2 years) | |
| Average NVIDIA GeForce GTX 1650 Mobile (49.9 - 61.6, n=5) | |
| HP Envy 14-eb0010nr | |
| Acer Swift X SFX14-41G-R7F3 | |
| Acer Swift 3X SF314-510G-70DW | |
| Acer Swift 3 SF314-511-54ZK | |
| Lenovo IdeaPad 5 14ALC05 82LM005YGE | |
| F1 2021 - 1920x1080 Ultra High Preset + Raytracing AA:T AF:16x | |
| Dell G15 5515 | |
| Acer Swift X SFX14-41G-R7F3 | |
| Average NVIDIA GeForce GTX 1650 Mobile (n=1) | |
| MSI Prestige 14 Evo A11M-005 | |
| God of War | |
| 1920x1080 High Preset | |
| Average NVIDIA GeForce GTX 1650 Mobile (29.7 - 33.6, n=2) | |
| Acer Swift X SFX14-41G-R7F3 | |
| 1920x1080 Original Preset | |
| Average NVIDIA GeForce GTX 1650 Mobile (33.9 - 42.8, n=2) | |
| Acer Swift X SFX14-41G-R7F3 | |
| 1920x1080 Low Preset | |
| Average NVIDIA GeForce GTX 1650 Mobile (40.8 - 52.5, n=2) | |
| Acer Swift X SFX14-41G-R7F3 | |
我们的Witcher 3 FPS图表显示了以下方面的比较 GTX 1650和 RTX 3050 Ti - 的差异是巨大的。其他的 GTX 1650型号,联想 IdeaPad 5Pro 16ACH,每秒渲染的帧数略多。在基准测试的过程中,所有设备都出现了小幅下降,因此显然是由游戏而不是硬件节流造成的。正如预期的那样,集成的AMD和英特尔解决方案远远落在后面,甚至专用的Xe Max产生的帧率也低于20。
Witcher 3 FPS Chart
| low | med. | high | ultra | QHD | 4K | |
|---|---|---|---|---|---|---|
| The Witcher 3 (2015) | 45 | 30 | ||||
| Dota 2 Reborn (2015) | 94.2 | 90.6 | 84.9 | 80.8 | 45 | |
| Final Fantasy XV Benchmark (2018) | 31.8 | 22.9 | 12.5 | |||
| Far Cry 5 (2018) | 49 | 46 | ||||
| Strange Brigade (2018) | 161 | 76 | 60.7 | 51.3 | ||
| F1 2021 (2021) | 93 | 77 | 58 | |||
| God of War (2022) | 40.8 | 33.9 | 29.7 | 18.5 |
排放--Ryzen APU的优先次序
系统噪音
在空转时,宏碁Swift X没有发出任何声音。即使风扇处于活动状态,它仍然非常安静。尽管在提高性能参数后,风扇的噪音变得永久性的,但它会逐渐消失在背景噪音中。
当设备受到压力时,风扇产生的噪音水平高达44 dB(A)。其他具有类似硬件规格的笔记本电脑的噪音可能明显更大(HP Envy 14).由于风扇非常单调,Swift X的噪音也从未变得让人分心。
Noise level
| Idle |
| 26 / 27 / 27.4 dB(A) |
| Load |
| 42.2 / 44.3 dB(A) |
 | ||
30 dB silent 40 dB(A) audible 50 dB(A) loud |
||
min: | ||
| Acer Swift X SFX14-41G-R7F3 GeForce GTX 1650 Mobile, R5 5500U, WDC PC SN530 SDBPNPZ-1T00 | Acer Swift 3 SF314-511-54ZK Iris Xe G7 80EUs, i5-1135G7, Samsung PM9A1 MZVL2512HCJQ | HP Envy 14-eb0010nr GeForce GTX 1650 Ti Max-Q, i5-1135G7, Samsung SSD PM981a MZVLB256HBHQ | Acer Swift 3X SF314-510G-70DW Xe MAX, i7-1165G7, Micron 2210 MTFDHBA1T0QFD | Lenovo IdeaPad 5 14ALC05 82LM005YGE Vega 7, R5 5500U, Samsung SSD PM981a MZVLB512HBJQ | MSI Prestige 14 Evo A11M-005 Iris Xe G7 96EUs, i7-1185G7, Phison 512GB SM280512GKBB4S-E162 | |
|---|---|---|---|---|---|---|
| Noise | 7% | 3% | 3% | 5% | -5% | |
| off / environment * (dB) | 26 | 25 4% | 25.9 -0% | 25 4% | 25.5 2% | 24 8% |
| Idle Minimum * (dB) | 26 | 25 4% | 26 -0% | 25 4% | 25.5 2% | 25 4% |
| Idle Average * (dB) | 27 | 25 7% | 26 4% | 25 7% | 25.5 6% | 27 -0% |
| Idle Maximum * (dB) | 27.4 | 27.5 -0% | 26 5% | 25 9% | 25.5 7% | 39 -42% |
| Load Average * (dB) | 42.2 | 32.9 22% | 34.9 17% | 44.2 -5% | 40.6 4% | 43 -2% |
| Load Maximum * (dB) | 44.3 | 42 5% | 48.7 -10% | 44.2 -0% | 40.8 8% | 43 3% |
| Witcher 3 ultra * (dB) | 34.5 | 39 |
* ... smaller is better
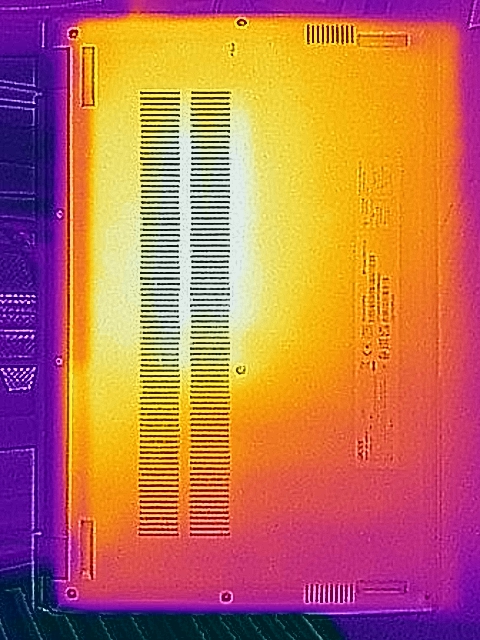
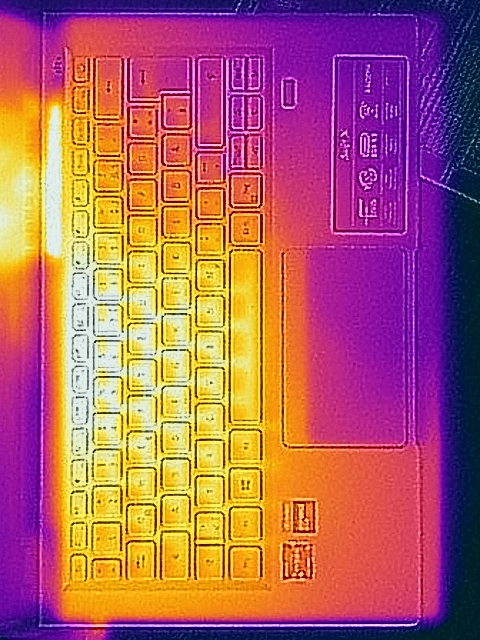
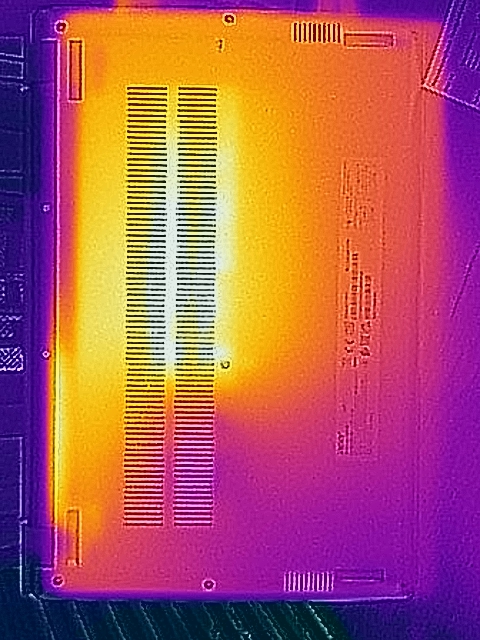
温度
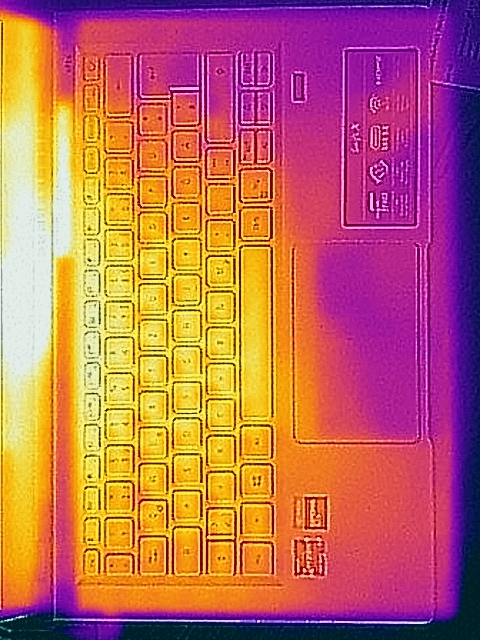
由于CPU和GPU的保守性能特征已经被优化为低温,所以排出的空气在42至45°C(107.6-113°F)时仍然适度温暖。热量特征图显示了我们的压力测试,而在游戏时,机箱仍然较冷。
这时机箱只是变得有些热,对于腿部使用来说,绝不会太热。
然而,在玩游戏时,这台14英寸的笔记本电脑不应该放在毯子或地毯上,因为这将导致底部进气口被堵塞。显示器盖子有意抬高了基本单元,以改善空气流通。
闲置时,平均温度只有23℃(73.4°F),金属机箱感觉温热。
(±) The maximum temperature on the upper side is 42.1 °C / 108 F, compared to the average of 36.8 °C / 98 F, ranging from 21 to 71 °C for the class Multimedia.
(-) The bottom heats up to a maximum of 45.3 °C / 114 F, compared to the average of 39.1 °C / 102 F
(+) In idle usage, the average temperature for the upper side is 23.3 °C / 74 F, compared to the device average of 31.3 °C / 88 F.
(+) The palmrests and touchpad are cooler than skin temperature with a maximum of 31.4 °C / 88.5 F and are therefore cool to the touch.
(-) The average temperature of the palmrest area of similar devices was 28.7 °C / 83.7 F (-2.7 °C / -4.8 F).
| Acer Swift X SFX14-41G-R7F3 AMD Ryzen 5 5500U, NVIDIA GeForce GTX 1650 Mobile | Acer Swift 3 SF314-511-54ZK Intel Core i5-1135G7, Intel Iris Xe Graphics G7 80EUs | HP Envy 14-eb0010nr Intel Core i5-1135G7, NVIDIA GeForce GTX 1650 Ti Max-Q | Acer Swift 3X SF314-510G-70DW Intel Core i7-1165G7, Intel Iris Xe MAX Graphics | Lenovo IdeaPad 5 14ALC05 82LM005YGE AMD Ryzen 5 5500U, AMD Radeon RX Vega 7 | MSI Prestige 14 Evo A11M-005 Intel Core i7-1185G7, Intel Iris Xe Graphics G7 96EUs | |
|---|---|---|---|---|---|---|
| Heat | 2% | -18% | -3% | -6% | -20% | |
| Maximum Upper Side * (°C) | 42.1 | 39.6 6% | 41.2 2% | 40.8 3% | 40.8 3% | 50 -19% |
| Maximum Bottom * (°C) | 45.3 | 43.2 5% | 45.6 -1% | 45.2 -0% | 42.2 7% | 61 -35% |
| Idle Upper Side * (°C) | 25.5 | 25 2% | 31.8 -25% | 29.8 -17% | 29.8 -17% | 28 -10% |
| Idle Bottom * (°C) | 25.3 | 26.2 -4% | 37.8 -49% | 24.7 2% | 29.5 -17% | 29 -15% |
* ... smaller is better
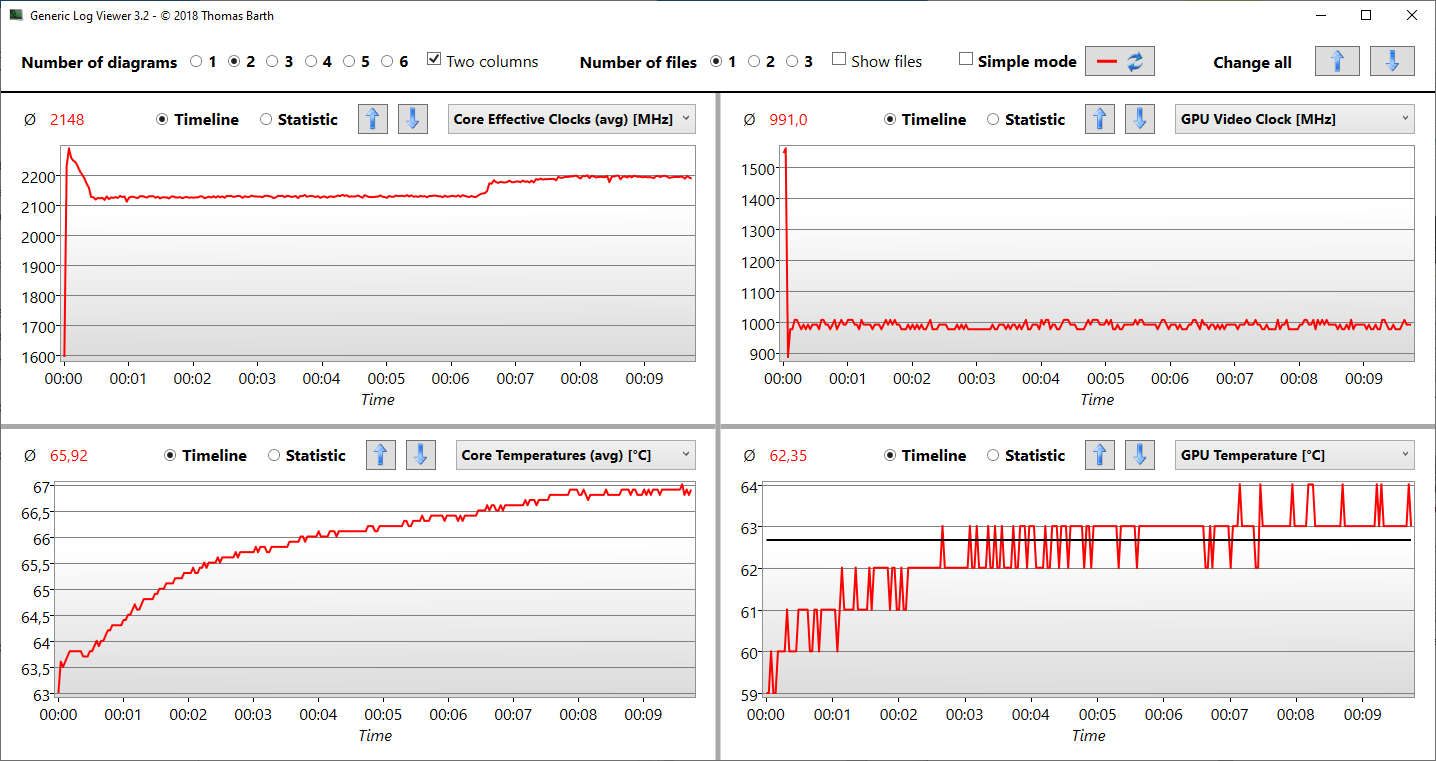
压力测试
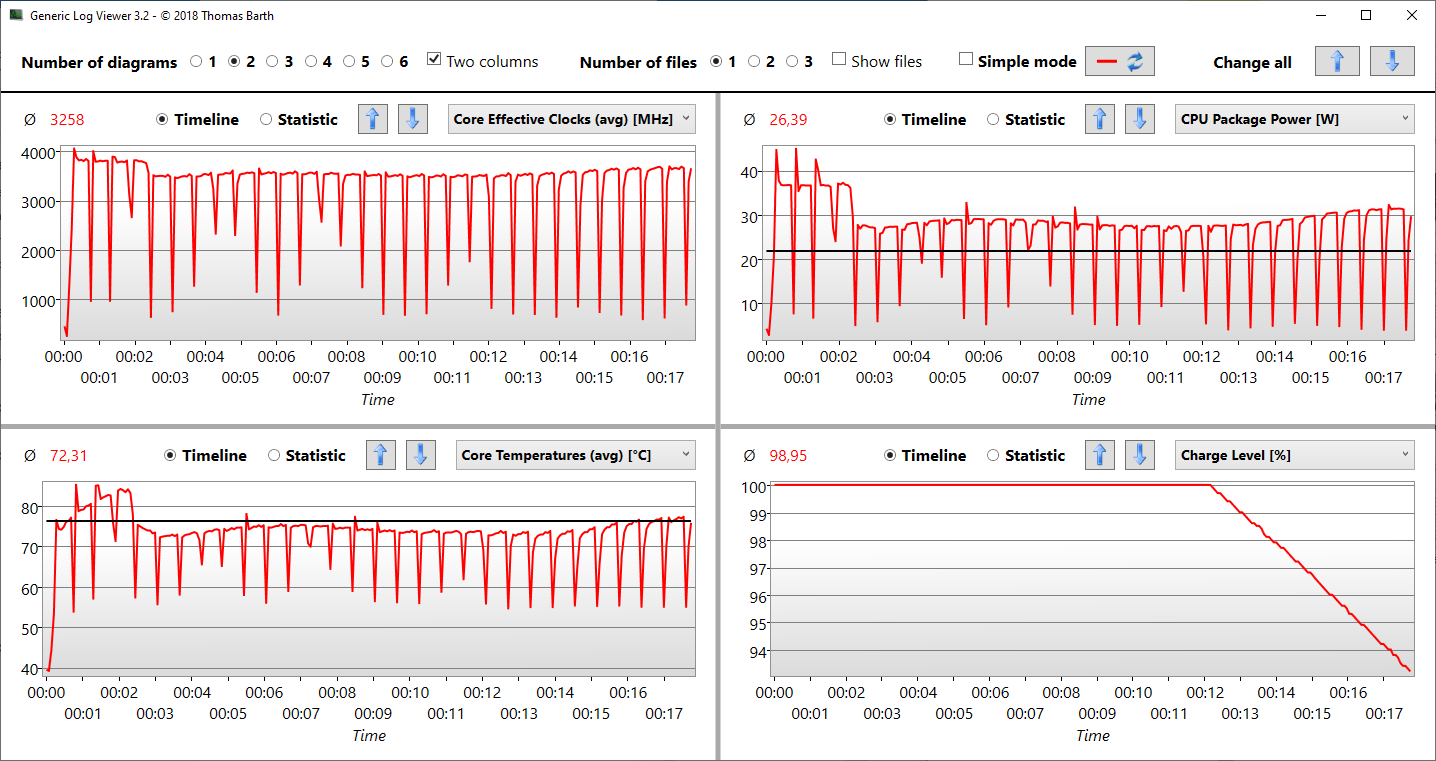
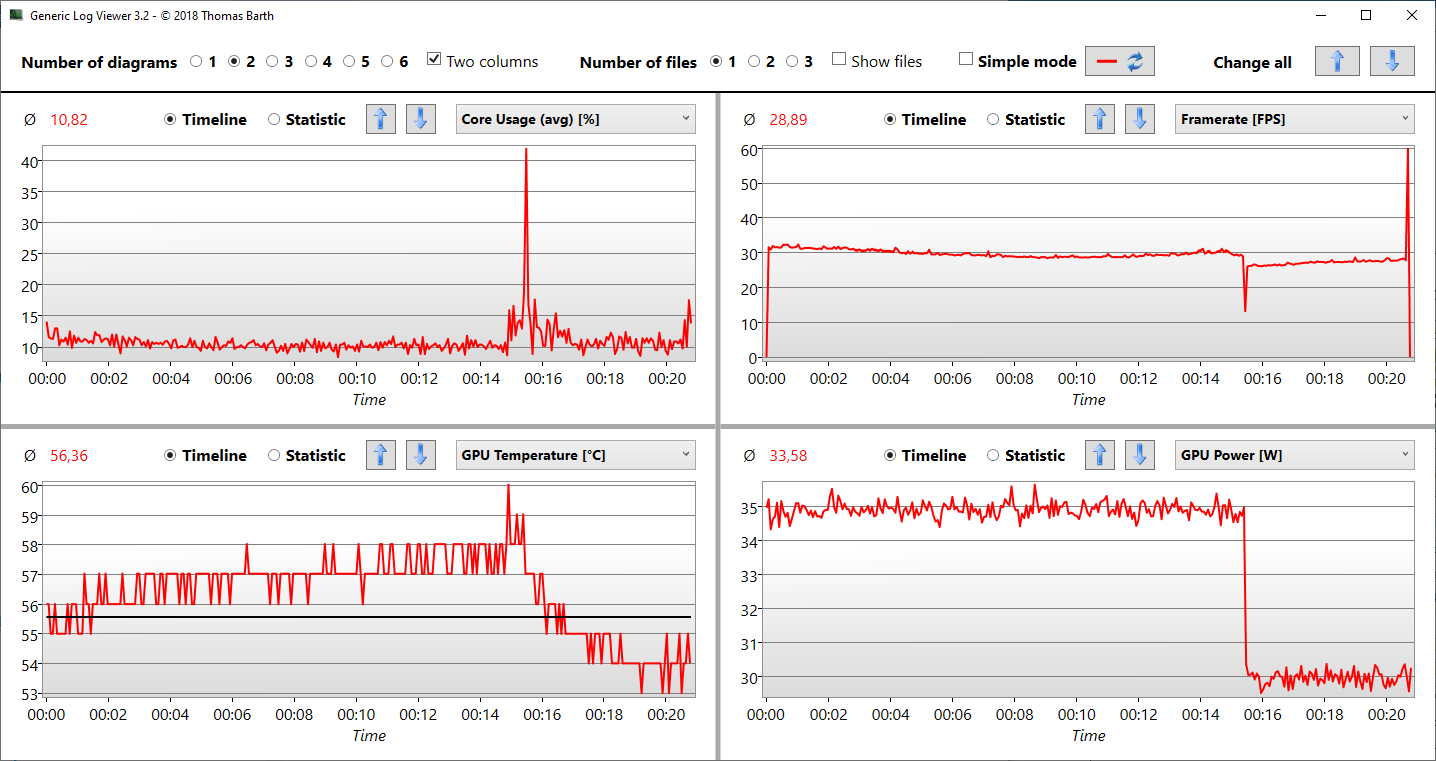
在我们的压力测试中,内部温度上升到67℃(152.6°F)。在我们的测试期间和测试结束时,时钟速度在2.1至2.2 GHz之间,这意味着基本时钟至少得到了维持。同时,GTX在前半分钟提升到1600MHz后,运行速度接近1000MHz。在下面的 Witcher 3能耗图表中,这是由最初的94瓦峰值表示的。
Witcher 3 Ultra主要给GTX显卡带来压力,而Ryzen处理器只处于10%的负载。在这种情况下,dGPU的温度只达到58°C(136.4°F),表明性能调校很保守。宏碁似乎已经优先考虑了表面温度。这似乎并不是一个缺点,因为在超级测试中的FPS一直保持不变。 Witcher 3超级测试中的FPS一直保持不变。
拔掉插头后,游戏性能略有下降,FPS从30下降到27左右,GPU功率从35瓦下降到30瓦。在我们的R15循环和 Witcher 3ultra测试中,我们分别在10分钟和15分钟后断开电源,导致温度、瓦特数和FPS的变化,在下面的图表中可见。
在代表正常多线程工作负载的R15循环测试中,SoC的温度高达85°C(185°F),显示了Ryzen芯片更宽松的热开发限制。在第四个循环后可以观察到轻微的节流,85℃的标志是降低CPU时钟频率的温度阈值。
总之,不存在由于温度过高而导致的问题。dGPU有严格的温度限制,一旦达到温度限制,就会禁用其涡轮增压。同时,处理器被允许达到更高的温度。
发言人
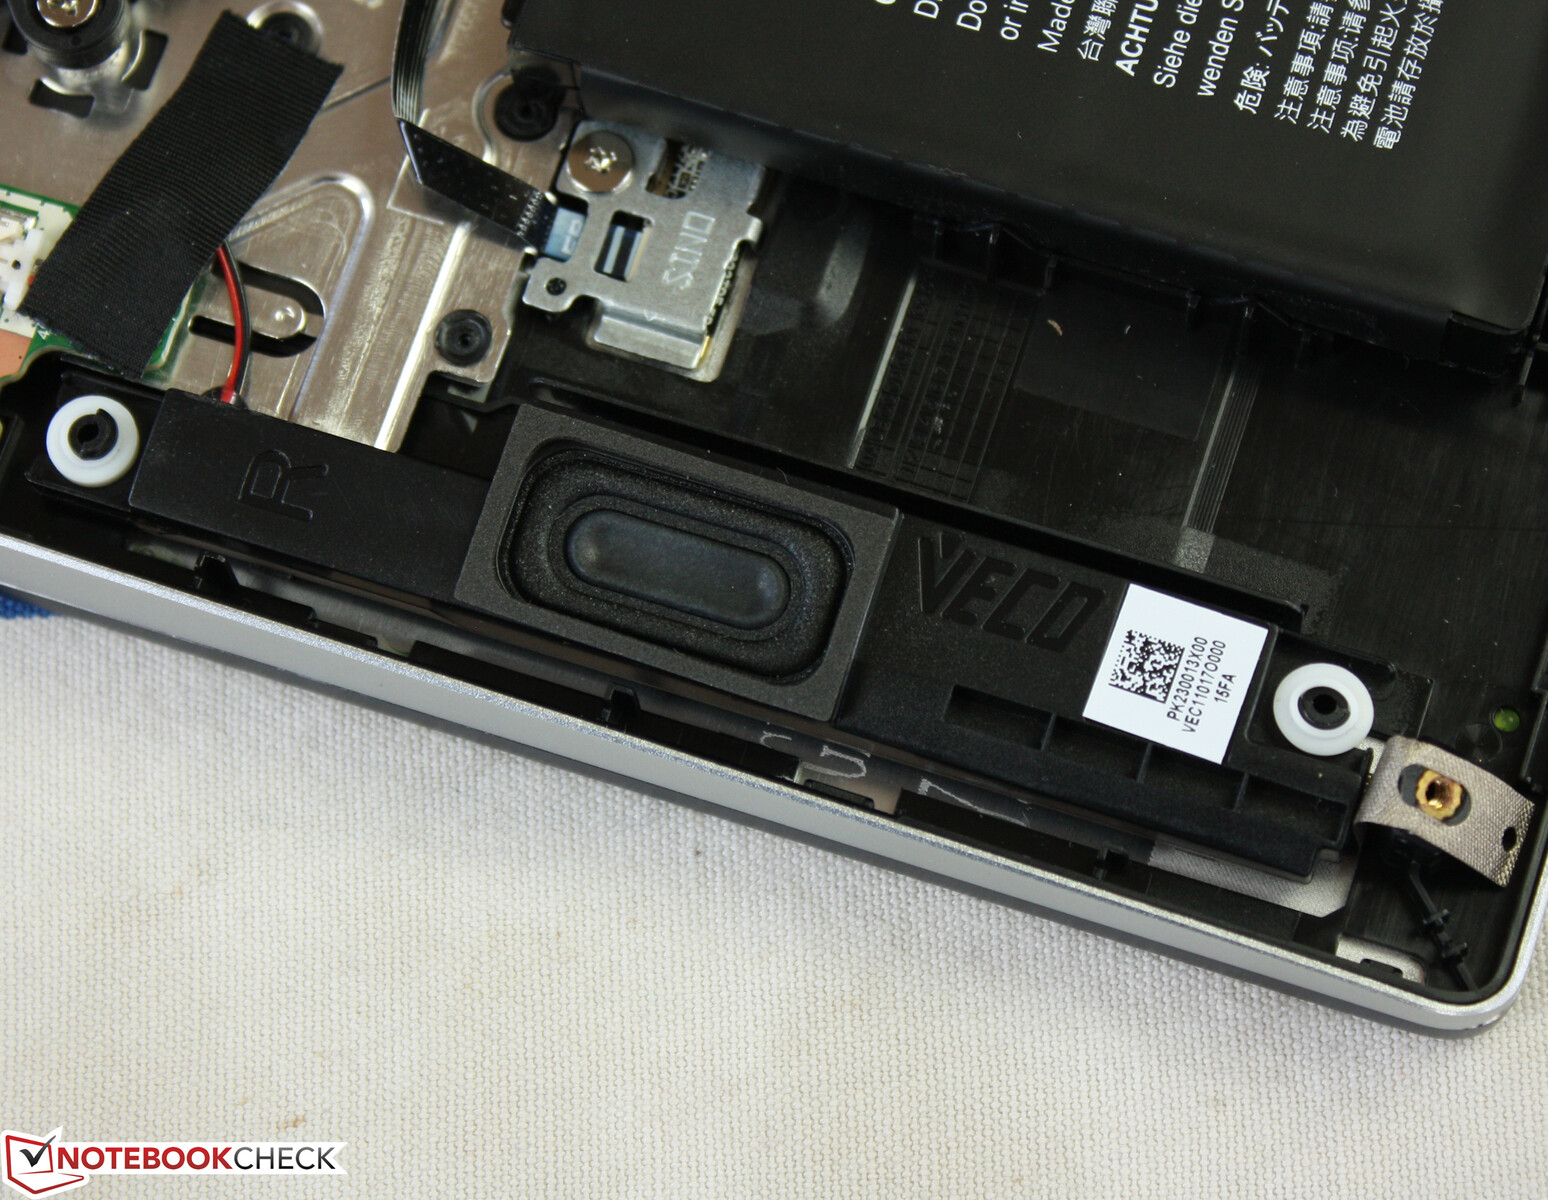
立体声扬声器的中音和高音听起来很扎实。然而,完全缺乏低音,导致整体声音尖锐而单薄。此外,最大音量也相当低。因此,该扬声器适用于视频通话,而不太适合游戏、音乐和类似的多媒体使用情况。我们建议通过3.5毫米音频插孔或蓝牙连接外部扬声器。
宏碁包括DTS软件音频处理器,应该是为了改善音乐、游戏和电影应用中的声音。虽然使用集成扬声器的效果非常明显,但它并不总是能改善体验。
虽然网络摄像头旁边的双阵列麦克风可以捕捉到没有静态噪音的声音,但在1.5米以上的距离说话时,它们的增益似乎很吃力。对于在设备前的电话会议,它们是绰绰有余的。
Acer Swift X SFX14-41G-R7F3 audio analysis
(±) | speaker loudness is average but good (76.3 dB)
Bass 100 - 315 Hz
(-) | nearly no bass - on average 26.1% lower than median
(±) | linearity of bass is average (12.6% delta to prev. frequency)
Mids 400 - 2000 Hz
(+) | balanced mids - only 4.8% away from median
(±) | linearity of mids is average (14.1% delta to prev. frequency)
Highs 2 - 16 kHz
(±) | higher highs - on average 5.7% higher than median
(+) | highs are linear (6.3% delta to prev. frequency)
Overall 100 - 16.000 Hz
(±) | linearity of overall sound is average (22.2% difference to median)
Compared to same class
» 79% of all tested devices in this class were better, 4% similar, 17% worse
» The best had a delta of 5%, average was 17%, worst was 45%
Compared to all devices tested
» 65% of all tested devices were better, 6% similar, 29% worse
» The best had a delta of 4%, average was 23%, worst was 134%
MSI Prestige 14 Evo A11M-005 audio analysis
(±) | speaker loudness is average but good (75 dB)
Bass 100 - 315 Hz
(-) | nearly no bass - on average 24.3% lower than median
(±) | linearity of bass is average (9.8% delta to prev. frequency)
Mids 400 - 2000 Hz
(±) | higher mids - on average 8.5% higher than median
(±) | linearity of mids is average (11% delta to prev. frequency)
Highs 2 - 16 kHz
(+) | balanced highs - only 2.8% away from median
(+) | highs are linear (6.5% delta to prev. frequency)
Overall 100 - 16.000 Hz
(±) | linearity of overall sound is average (27.2% difference to median)
Compared to same class
» 84% of all tested devices in this class were better, 5% similar, 10% worse
» The best had a delta of 7%, average was 21%, worst was 53%
Compared to all devices tested
» 83% of all tested devices were better, 4% similar, 13% worse
» The best had a delta of 4%, average was 23%, worst was 134%
能源管理 - 宏碁的Swift既经济又强大
能源消耗
在能源消耗方面,宏碁Swift X在空闲时是经济的,而在负载时是耗电的。这是可取的,因为正常和重载(压力测试)下的功率分别为57瓦和94瓦,强调了这款14英寸设备对性能的关注。
由于单个风扇无法持续处理94瓦的运行所产生的热量,在压力测试期间,耗电量逐渐下降到60瓦。
在Witcher 3 ultra测试期间,能耗(暂时)从65瓦下降到约60瓦,而游戏中的FPS保持一致,如 Witcher 3FPS图表显示。
正如预期的那样,在这次比较中,采用板载GPU的竞争对手在两种负载情况下的能耗都较低。我们的宏碁所配备的90瓦电源的尺寸是合理的,因为94瓦的峰值只是在极端情况下暂时出现的。
虽然从理论上讲,该笔记本也可以用C型电源供电,但这将阻断唯一的C型USB端口和第二视频输出。我们用一个60瓦的戴尔电源进行了测试。
| Off / Standby | |
| Idle | |
| Load |
|
Key:
min: | |
| Acer Swift X SFX14-41G-R7F3 R5 5500U, GeForce GTX 1650 Mobile, WDC PC SN530 SDBPNPZ-1T00, IPS, 1920x1080, 14" | Acer Swift 3 SF314-511-54ZK i5-1135G7, Iris Xe G7 80EUs, Samsung PM9A1 MZVL2512HCJQ, IPS, 1920x1080, 14" | HP Envy 14-eb0010nr i5-1135G7, GeForce GTX 1650 Ti Max-Q, Samsung SSD PM981a MZVLB256HBHQ, IPS, 1920x1200, 14" | Acer Swift 3X SF314-510G-70DW i7-1165G7, Xe MAX, Micron 2210 MTFDHBA1T0QFD, IPS, 1920x1080, 14" | Lenovo IdeaPad 5 14ALC05 82LM005YGE R5 5500U, Vega 7, Samsung SSD PM981a MZVLB512HBJQ, IPS, 1920x1080, 14" | MSI Prestige 14 Evo A11M-005 i7-1185G7, Iris Xe G7 96EUs, Phison 512GB SM280512GKBB4S-E162, IPS-Level, 1920x1080, 14" | Average NVIDIA GeForce GTX 1650 Mobile | Average of class Multimedia | |
|---|---|---|---|---|---|---|---|---|
| Power Consumption | 13% | -68% | 4% | -8% | -3% | -47% | -41% | |
| Idle Minimum * (Watt) | 3.4 | 4.3 -26% | 4.2 -24% | 3.6 -6% | 5.4 -59% | 5 -47% | 4.96 ? -46% | 5.62 ? -65% |
| Idle Average * (Watt) | 6 | 6.8 -13% | 18.3 -205% | 6.2 -3% | 8.4 -40% | 7 -17% | 8.61 ? -43% | 10.2 ? -70% |
| Idle Maximum * (Watt) | 9.2 | 9 2% | 19.2 -109% | 10.4 -13% | 11.3 -23% | 11 -20% | 14.8 ? -61% | 12.5 ? -36% |
| Load Average * (Watt) | 57 | 33.3 42% | 72.9 -28% | 55.1 3% | 45.3 21% | 54 5% | 81.7 ? -43% | 65 ? -14% |
| Witcher 3 ultra * (Watt) | 57.3 | 33.3 42% | 61.5 -7% | 54.1 6% | 46.6 19% | 39 32% | ||
| Load Maximum * (Watt) | 93.6 | 65 31% | 127.8 -37% | 58 38% | 63 33% | 65 31% | 131.9 ? -41% | 111.9 ? -20% |
* ... smaller is better
Energy Consumption Witcher 3 / Stress Test
Energy Consumption External Monitor
电池寿命
得益于特别低的空闲消耗和59瓦时的大容量电池,在降低亮度和对处理器要求不高的工作负荷(网络浏览)的实际情况下,运行时间可以达到10小时。尽管有相同的电池容量,但英特尔型号在相同的情况下能多持续两个小时。
在负载情况下,运行时间下降到只有74至100分钟,这得益于活跃的GTX图形和随之而来的高能耗(负载情况下平均接近60瓦)。总的来说,对于这个性能类别和Nvidia dGPU来说,十个小时是一个很好的结果。
| Acer Swift X SFX14-41G-R7F3 R5 5500U, GeForce GTX 1650 Mobile, 58.7 Wh | Acer Swift 3 SF314-511-54ZK i5-1135G7, Iris Xe G7 80EUs, 56 Wh | HP Envy 14-eb0010nr i5-1135G7, GeForce GTX 1650 Ti Max-Q, 63.3 Wh | Acer Swift 3X SF314-510G-70DW i7-1165G7, Xe MAX, 58 Wh | Lenovo IdeaPad 5 14ALC05 82LM005YGE R5 5500U, Vega 7, 56.5 Wh | MSI Prestige 14 Evo A11M-005 i7-1185G7, Iris Xe G7 96EUs, 52.4 Wh | Average of class Multimedia | |
|---|---|---|---|---|---|---|---|
| Battery runtime | 125% | 86% | 75% | 49% | 7% | 82% | |
| Reader / Idle (h) | 7.6 | 33.6 342% | 27.7 264% | 19.7 159% | 13.8 82% | 24.9 ? 228% | |
| WiFi v1.3 (h) | 10.1 | 12.1 20% | 10.8 7% | 12.7 26% | 10.8 7% | 7.5 -26% | 12.3 ? 22% |
| Witcher 3 ultra (h) | 1.2 | ||||||
| Load (h) | 1.7 | 1.9 12% | 1.5 -12% | 3.8 124% | 1.4 -18% | 1.1 -35% | 1.645 ? -3% |
| H.264 (h) | 17.8 | 12.7 | 16.8 ? |
Pros
Cons
结论 - 一个适合入门级游戏的宏碁

在快车道上的 GeForce GTX 1650?凭借入门级图形芯片,我们的宏碁不仅击败了目前所有的AMD和英特尔iGPU,而且还击败了英特尔的dGPU Iris Xe Max。然而,尽管是GDDR6版本,GTX并不符合我们数据库中自己的同类产品所设定的期望。这可能是单风扇的结果,它在负载下只产生适度的噪音水平。
尽管如此,这款轻薄的1.4公斤(约3.09磅)14英寸笔记本电脑的性能水平还是令人印象深刻。相对于它的价格类别,游戏和整体性能都很好,而且AMD Ryzen 5500U在CPU性能评级上超过了Core i7-1165G7(Acer Swift 3X).
GTX 1650 的性能略显逊色,而Ryzen 5 5500U 达到最高分。鉴于这台14英寸笔记本电脑的厚度只有19毫米(约0.75英寸),游戏性能总体上相当快。
这款笔记本电脑在其他方面也有很大的优势。由于iGPU的切换,实际运行时间约为10小时,这是现代笔记本电脑的结果。低重量、400尼特的高最大亮度、坚实的底盘和适合日常使用的输入设备使其更加完善。没有Thunderbolt,这反而是英特尔变种的专属。Type-C端口支持Power Delivery和DisplayPort,还有一个用于SSD升级的次级M.2插槽。
最后,联发科Wi-Fi芯片在某种程度上玷污了整体印象,它的下载速度几乎是灾难性的,即使在一天中的不同时间多次重复测试也不会改善。相比之下,虽然上传速度不是很好,但也很不错,这让我们希望有可能出现驱动修复。
注:有一个相同的配置的Acer Aspire 7 A715-42G在15英寸的外形尺寸,配备Ryzen 5500U和一个 GTX 1650(GDDR6)。
价格和可用性
带有AMD Ryzen 7 5800U的模型。 RTX 3050 Ti,16GB内存和512GB固态硬盘,目前在亚马逊上有售。售价约为930美元。
Acer Swift X SFX14-41G-R7F3
- 03/07/2022 v7 (old)
Sebastian Jentsch
Price comparison

