势不可挡:Dell XPS 15 7590酷睿i9,GTX1650笔记本电脑评测
| SD Card Reader | |
| average JPG Copy Test (av. of 3 runs) | |
| Gigabyte Aero 15 OLED XA (Toshiba Exceria Pro SDXC 64 GB UHS-II) | |
| Dell XPS 15 9570 Core i9 UHD (Toshiba Exceria Pro SDXC 64 GB UHS-II) | |
| Dell XPS 15 7590 9980HK GTX 1650 (Toshiba Exceria Pro SDXC 64 GB UHS-II) | |
| HP Spectre x360 15-df0126ng (Toshiba Exceria Pro M501 microSDXC 64GB) | |
| Asus ZenBook 15 UX533FD (Toshiba Exceria Pro SDXC 64 GB UHS-II) | |
| maximum AS SSD Seq Read Test (1GB) | |
| Gigabyte Aero 15 OLED XA (Toshiba Exceria Pro SDXC 64 GB UHS-II) | |
| Dell XPS 15 9570 Core i9 UHD (Toshiba Exceria Pro SDXC 64 GB UHS-II) | |
| HP Spectre x360 15-df0126ng (Toshiba Exceria Pro M501 microSDXC 64GB) | |
| Dell XPS 15 7590 9980HK GTX 1650 (Toshiba Exceria Pro SDXC 64 GB UHS-II) | |
| Asus ZenBook 15 UX533FD (Toshiba Exceria Pro SDXC 64 GB UHS-II) | |
| Networking | |
| iperf3 transmit AX12 | |
| Razer Blade 15 RTX 2080 Max-Q | |
| Gigabyte Aero 15 OLED XA | |
| Dell XPS 15 9570 Core i9 UHD | |
| Asus ZenBook 15 UX533FD | |
| Dell XPS 15 7590 9980HK GTX 1650 | |
| HP Spectre x360 15-df0126ng | |
| iperf3 receive AX12 | |
| Razer Blade 15 RTX 2080 Max-Q | |
| Gigabyte Aero 15 OLED XA | |
| Dell XPS 15 7590 9980HK GTX 1650 | |
| Asus ZenBook 15 UX533FD | |
| Dell XPS 15 9570 Core i9 UHD | |
| HP Spectre x360 15-df0126ng | |
| |||||||||||||||||||||||||
Brightness Distribution: 94 %
Center on Battery: 418.4 cd/m²
Contrast: ∞:1 (Black: 0 cd/m²)
ΔE ColorChecker Calman: 6.06 | ∀{0.5-29.43 Ø4.72}
ΔE Greyscale Calman: 2.8 | ∀{0.09-98 Ø4.97}
99.6% sRGB (Argyll 1.6.3 3D)
81% AdobeRGB 1998 (Argyll 1.6.3 3D)
91.8% AdobeRGB 1998 (Argyll 3D)
99.6% sRGB (Argyll 3D)
88.1% Display P3 (Argyll 3D)
Gamma: 2.15
CCT: 6235 K
| Dell XPS 15 7590 9980HK GTX 1650 Samsung 156WR04, SDCA029, OLED, 15.6", 3840x2160 | Dell XPS 15 9570 Core i9 UHD LQ156D1, IPS, 15.6", 3840x2160 | Asus ZenBook 15 UX533FD BOE07D8, IPS, 15.6", 1920x1080 | HP Spectre x360 15-df0126ng AU Optronics AUO30EB, IPS, 15.6", 3840x2160 | Gigabyte Aero 15 OLED XA Samsung SDCA029, OLED, 15.6", 3840x2160 | Razer Blade 15 RTX 2080 Max-Q Sharp LQ156M1JW03 (SHP14C5), IPS, 15.6", 1920x1080 | |
|---|---|---|---|---|---|---|
| Display | -8% | -22% | -18% | -17% | ||
| Display P3 Coverage (%) | 88.1 | 79.6 -10% | 67.2 -24% | 68.1 -23% | 66.9 -24% | |
| sRGB Coverage (%) | 99.6 | 98.4 -1% | 88.4 -11% | 94.2 -5% | 98.1 -2% | |
| AdobeRGB 1998 Coverage (%) | 91.8 | 79.7 -13% | 64.6 -30% | 68.4 -25% | 68.5 -25% | |
| Response Times | -1698% | -1650% | -1785% | 2% | -395% | |
| Response Time Grey 50% / Grey 80% * (ms) | 2.3 ? | 52.4 ? -2178% | 45 ? -1857% | 57 ? -2378% | 2.4 ? -4% | 12.8 ? -457% |
| Response Time Black / White * (ms) | 2.4 ? | 31.6 ? -1217% | 37 ? -1442% | 31 ? -1192% | 2.2 ? 8% | 10.4 ? -333% |
| PWM Frequency (Hz) | 59.5 ? | 1000 ? | 60 ? | 23810 ? | ||
| Screen | -28% | -18% | -9% | 7% | 8% | |
| Brightness middle (cd/m²) | 421.2 | 451.9 7% | 311 -26% | 330 -22% | 373 -11% | 293 -30% |
| Brightness (cd/m²) | 417 | 414 -1% | 303 -27% | 310 -26% | 375 -10% | 270 -35% |
| Brightness Distribution (%) | 94 | 81 -14% | 81 -14% | 87 -7% | 93 -1% | 87 -7% |
| Black Level * (cd/m²) | 0.36 | 0.24 | 0.37 | 0.29 | ||
| Colorchecker dE 2000 * | 6.06 | 5.62 7% | 5.1 16% | 4.03 33% | 3.98 34% | 1.69 72% |
| Colorchecker dE 2000 max. * | 11.89 | 19.1 -61% | 8.91 25% | 6.74 43% | 6.28 47% | 3.37 72% |
| Greyscale dE 2000 * | 2.8 | 6.9 -146% | 4.93 -76% | 4.49 -60% | 2.81 -0% | 2.3 18% |
| Gamma | 2.15 102% | 2.2 100% | 2.44 90% | 2.57 86% | 2.62 84% | 2.3 96% |
| CCT | 6235 104% | 6254 104% | 7641 85% | 6744 96% | 6434 101% | 6758 96% |
| Color Space (Percent of AdobeRGB 1998) (%) | 81 | 71.8 -11% | 58 -28% | 61 -25% | 78 -4% | 63 -22% |
| Color Space (Percent of sRGB) (%) | 99.6 | 98.5 -1% | 88 -12% | 94 -6% | 97 -3% | 98.5 -1% |
| Contrast (:1) | 1255 | 1296 | 892 | 1010 | ||
| Colorchecker dE 2000 calibrated * | 2.69 | 2.48 | 1.96 | 1.24 | ||
| Total Average (Program / Settings) | -578% /
-280% | -563% /
-270% | -604% /
-284% | 5% /
6% | -135% /
-60% |
* ... smaller is better
Display Response Times
| ↔ Response Time Black to White | ||
|---|---|---|
| 2.4 ms ... rise ↗ and fall ↘ combined | ↗ 1.1 ms rise | 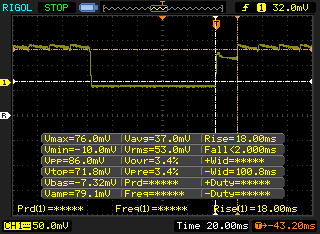 |
| ↘ 1.3 ms fall | ||
| The screen shows very fast response rates in our tests and should be very well suited for fast-paced gaming. In comparison, all tested devices range from 0.1 (minimum) to 240 (maximum) ms. » 13 % of all devices are better. This means that the measured response time is better than the average of all tested devices (19.8 ms). | ||
| ↔ Response Time 50% Grey to 80% Grey | ||
| 2.3 ms ... rise ↗ and fall ↘ combined | ↗ 1.1 ms rise | 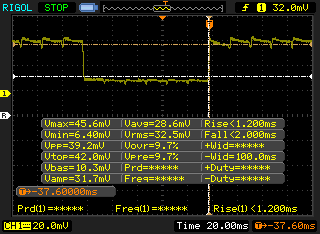 |
| ↘ 1.2 ms fall | ||
| The screen shows very fast response rates in our tests and should be very well suited for fast-paced gaming. In comparison, all tested devices range from 0.165 (minimum) to 636 (maximum) ms. » 11 % of all devices are better. This means that the measured response time is better than the average of all tested devices (31 ms). | ||
Screen Flickering / PWM (Pulse-Width Modulation)
| Screen flickering / PWM detected | 59.5 Hz | ≤ 100 % brightness setting | 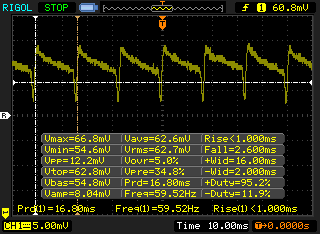 |
The display backlight flickers at 59.5 Hz (worst case, e.g., utilizing PWM) Flickering detected at a brightness setting of 100 % and below. There should be no flickering or PWM above this brightness setting. The frequency of 59.5 Hz is very low, so the flickering may cause eyestrain and headaches after extended use. In comparison: 52 % of all tested devices do not use PWM to dim the display. If PWM was detected, an average of 7763 (minimum: 5 - maximum: 343500) Hz was measured. | |||
| Cinebench R15 | |
| CPU Single 64Bit | |
| Alienware Area-51m i9-9900K RTX 2080 | |
| Schenker XMG Ultra 15 Turing | |
| Dell XPS 15 7590 9980HK GTX 1650 | |
| Average Intel Core i9-9980HK (181 - 215, n=13) | |
| Dell XPS 15 7590 9980HK Undervolt | |
| Eurocom Sky X4C | |
| Asus ZenBook 15 UX533FD | |
| Dell XPS 15 9570 Core i9 UHD | |
| Gigabyte Aero 15 OLED XA | |
| HP Omen 15-dc1020ng | |
| Dell G5 15 5590 | |
| Lenovo Ideapad 720S-15IKB 81AC001AGE | |
| Asus GL702ZC-GC104T | |
| Asus ROG Zephyrus G15 GA502DU | |
| CPU Multi 64Bit | |
| Alienware Area-51m i9-9900K RTX 2080 | |
| Average Intel Core i9-9980HK (1327 - 1930, n=14) | |
| Dell XPS 15 7590 9980HK Undervolt | |
| Dell XPS 15 7590 9980HK GTX 1650 | |
| Schenker XMG Ultra 15 Turing | |
| Asus GL702ZC-GC104T | |
| Eurocom Sky X4C | |
| Gigabyte Aero 15 OLED XA | |
| Dell XPS 15 9570 Core i9 UHD | |
| Dell G5 15 5590 | |
| Asus ZenBook 15 UX533FD | |
| Asus ROG Zephyrus G15 GA502DU | |
| HP Omen 15-dc1020ng | |
| Lenovo Ideapad 720S-15IKB 81AC001AGE | |
| Cinebench R11.5 | |
| CPU Single 64Bit | |
| Average Intel Core i9-9980HK (2.25 - 2.4, n=3) | |
| Dell XPS 15 7590 9980HK GTX 1650 | |
| Eurocom Sky X4C | |
| Asus ROG Zephyrus G15 GA502DU | |
| Asus GL702ZC-GC104T | |
| Asus ZenBook 15 UX533FD | |
| CPU Multi 64Bit | |
| Dell XPS 15 7590 9980HK GTX 1650 | |
| Average Intel Core i9-9980HK (14.8 - 18, n=3) | |
| Asus GL702ZC-GC104T | |
| Eurocom Sky X4C | |
| Asus ROG Zephyrus G15 GA502DU | |
| Asus ZenBook 15 UX533FD | |
| Cinebench R10 | |
| Rendering Multiple CPUs 32Bit | |
| Average Intel Core i9-9980HK (39440 - 50439, n=4) | |
| Schenker XMG Ultra 15 Turing | |
| Eurocom Sky X4C | |
| Dell G5 15 5590 | |
| Asus GL702ZC-GC104T | |
| HP Omen 15-dc1020ng | |
| Asus ZenBook 15 UX533FD | |
| Asus ROG Zephyrus G15 GA502DU | |
| Rendering Single 32Bit | |
| Average Intel Core i9-9980HK (7709 - 9734, n=4) | |
| Schenker XMG Ultra 15 Turing | |
| Eurocom Sky X4C | |
| HP Omen 15-dc1020ng | |
| Dell G5 15 5590 | |
| Asus ROG Zephyrus G15 GA502DU | |
| Asus GL702ZC-GC104T | |
| Asus ZenBook 15 UX533FD | |
| wPrime 2.10 - 1024m | |
| Asus ROG Zephyrus G15 GA502DU | |
| Eurocom Sky X4C | |
| Average Intel Core i9-9980HK (110.4 - 120.2, n=2) | |
* ... smaller is better
| PCMark 10 | |
| Score | |
| Alienware Area-51m i9-9900K RTX 2080 | |
| Dell XPS 15 7590 9980HK GTX 1650 | |
| Gigabyte Aero 15 OLED XA | |
| Dell XPS 15 9570 Core i9 UHD | |
| HP Spectre x360 15-df0126ng | |
| Asus ZenBook 15 UX533FD | |
| Essentials | |
| Alienware Area-51m i9-9900K RTX 2080 | |
| Dell XPS 15 7590 9980HK GTX 1650 | |
| Gigabyte Aero 15 OLED XA | |
| Dell XPS 15 9570 Core i9 UHD | |
| HP Spectre x360 15-df0126ng | |
| Asus ZenBook 15 UX533FD | |
| Productivity | |
| Alienware Area-51m i9-9900K RTX 2080 | |
| Dell XPS 15 7590 9980HK GTX 1650 | |
| Dell XPS 15 9570 Core i9 UHD | |
| Asus ZenBook 15 UX533FD | |
| Gigabyte Aero 15 OLED XA | |
| HP Spectre x360 15-df0126ng | |
| Digital Content Creation | |
| Alienware Area-51m i9-9900K RTX 2080 | |
| Gigabyte Aero 15 OLED XA | |
| Dell XPS 15 7590 9980HK GTX 1650 | |
| Dell XPS 15 9570 Core i9 UHD | |
| HP Spectre x360 15-df0126ng | |
| Asus ZenBook 15 UX533FD | |
| PCMark 8 | |
| Home Score Accelerated v2 | |
| Alienware Area-51m i9-9900K RTX 2080 | |
| Asus ZenBook 15 UX533FD | |
| Dell XPS 15 9570 Core i9 UHD | |
| Dell XPS 15 7590 9980HK GTX 1650 | |
| Gigabyte Aero 15 OLED XA | |
| HP Spectre x360 15-df0126ng | |
| Work Score Accelerated v2 | |
| Alienware Area-51m i9-9900K RTX 2080 | |
| Asus ZenBook 15 UX533FD | |
| Dell XPS 15 7590 9980HK GTX 1650 | |
| Dell XPS 15 9570 Core i9 UHD | |
| Gigabyte Aero 15 OLED XA | |
| HP Spectre x360 15-df0126ng | |
| PCMark 8 Home Score Accelerated v2 | 3799 points | |
| PCMark 8 Work Score Accelerated v2 | 4762 points | |
| PCMark 10 Score | 5469 points | |
Help | ||
| Dell XPS 15 7590 9980HK GTX 1650 Toshiba XG6 KXG60ZNV1T02 | Dell XPS 15 9570 Core i9 UHD Samsung SSD PM981 MZVLB1T0HALR | Asus ZenBook 15 UX533FD WDC PC SN520 SDAPNUW-512G | HP Spectre x360 15-df0126ng Toshiba XG5-P KXG50PNV2T04 | Gigabyte Aero 15 OLED XA Intel SSD 600p SSDPEKKW512G8L | |
|---|---|---|---|---|---|
| AS SSD | -4% | -22% | -45% | -4% | |
| Seq Read (MB/s) | 1723 | 1320 -23% | 579 -66% | 2018 17% | 2095 22% |
| Seq Write (MB/s) | 1386 | 1500 8% | 411.8 -70% | 773 -44% | 1464 6% |
| 4K Read (MB/s) | 43.25 | 30.73 -29% | 41.81 -3% | 24.62 -43% | 56.8 31% |
| 4K Write (MB/s) | 98.3 | 94.4 -4% | 131.6 34% | 92.8 -6% | 109.8 12% |
| 4K-64 Read (MB/s) | 1078 | 1453 35% | 975 -10% | 845 -22% | 871 -19% |
| 4K-64 Write (MB/s) | 1456 | 1815 25% | 1047 -28% | 957 -34% | 773 -47% |
| Access Time Read * (ms) | 0.05 | 0.061 -22% | 0.08 -60% | 0.147 -194% | 0.045 10% |
| Access Time Write * (ms) | 0.039 | 0.044 -13% | 0.027 31% | 0.057 -46% | 0.033 15% |
| Score Read (Points) | 1294 | 1616 25% | 1075 -17% | 1071 -17% | 1137 -12% |
| Score Write (Points) | 1693 | 2059 22% | 1220 -28% | 1127 -33% | 1029 -39% |
| Score Total (Points) | 3638 | 4507 24% | 2845 -22% | 2684 -26% | 2732 -25% |
| Copy ISO MB/s (MB/s) | 3182 | 2577 -19% | 1652 -48% | ||
| Copy Program MB/s (MB/s) | 984 | 515 -48% | 328.5 -67% | ||
| Copy Game MB/s (MB/s) | 1824 | 1120 -39% | 700 -62% |
* ... smaller is better

| 3DMark 11 Performance | 12340 points | |
| 3DMark Cloud Gate Standard Score | 30573 points | |
| 3DMark Fire Strike Score | 7356 points | |
| 3DMark Time Spy Score | 3676 points | |
Help | ||
| Shadow of the Tomb Raider - 1920x1080 Highest Preset AA:T | |
| Alienware Area-51m i9-9900K RTX 2080 | |
| MSI GE75 9SG | |
| Razer Blade Pro 17 RTX 2060 | |
| Gigabyte Aero 15 OLED XA | |
| HP Pavilion Gaming 17-cd0085cl | |
| MSI GF75 Thin 9SC | |
| Average NVIDIA GeForce GTX 1650 Mobile (34 - 47, n=15) | |
| Asus Zephyrus S GX531GM | |
| Asus G752VY | |
| Dell XPS 15 7590 9980HK GTX 1650 | |
| Asus TUF FX705GE-EW096T | |
| BioShock Infinite - 1920x1080 Ultra Preset, DX11 (DDOF) | |
| Alienware Area-51m i9-9900K RTX 2080 | |
| MSI GE75 9SG | |
| Razer Blade 15 RTX 2080 Max-Q | |
| Asus Strix Scar III G531GW | |
| Razer Blade Pro 17 RTX 2060 | |
| Gigabyte Aero 15 OLED XA | |
| Dell G5 15 5590 | |
| HP Pavilion Gaming 17-cd0085cl | |
| Asus Zephyrus S GX531GM | |
| MSI GF75 Thin 9SC | |
| HP Omen 15-dc1020ng | |
| Average NVIDIA GeForce GTX 1650 Mobile (68.5 - 99.4, n=18) | |
| Asus TUF FX705GE-EW096T | |
| HP Spectre x360 15-df0126ng | |
| Dell XPS 15 9570 Core i9 UHD | |
| Dell XPS 15 7590 9980HK GTX 1650 | |
| Asus ZenBook 15 UX533FD | |
| Rocket League - 1920x1080 High Quality AA:High FX | |
| Average NVIDIA GeForce GTX 1650 Mobile (96.4 - 162.2, n=6) | |
| HP Spectre x360 15-df0126ng | |
| Asus GL703GE-ES73 | |
| Dell XPS 15 7590 9980HK GTX 1650 | |
| The Witcher 3 - 1920x1080 Ultra Graphics & Postprocessing (HBAO+) | |
| Alienware Area-51m i9-9900K RTX 2080 | |
| MSI GE75 9SG | |
| Razer Blade 15 RTX 2080 Max-Q | |
| Asus Strix Scar III G531GW | |
| Razer Blade Pro 17 RTX 2060 | |
| Gigabyte Aero 15 OLED XA | |
| Dell G5 15 5590 | |
| HP Pavilion Gaming 17-cd0085cl | |
| Asus Zephyrus S GX531GM | |
| MSI GF75 Thin 9SC | |
| HP Omen 15-dc1020ng | |
| Dell XPS 15 7590 9980HK GTX 1650 | |
| Average NVIDIA GeForce GTX 1650 Mobile (29.9 - 40.3, n=31) | |
| Asus ZenBook 15 UX533FD | |
| Asus GL703GE-ES73 | |
| Asus TUF FX705GE-EW096T | |
| HP Spectre x360 15-df0126ng | |
| Dell XPS 15 9570 Core i9 UHD | |
| Dell XPS 15 9570 Core i9 UHD | |
| low | med. | high | ultra | 4K | |
|---|---|---|---|---|---|
| BioShock Infinite (2013) | 342.5 | 223.4 | 171.8 | 68.5 | |
| The Witcher 3 (2015) | 183.5 | 111.5 | 64.8 | 36 | |
| Rocket League (2017) | 248 | 152.5 | 96.4 | 41.1 | |
| Shadow of the Tomb Raider (2018) | 111 | 42 | 38 | 34 | 14 |
| Dell XPS 15 7590 9980HK GTX 1650 GeForce GTX 1650 Mobile, i9-9980HK, Toshiba XG6 KXG60ZNV1T02 | Dell XPS 15 9570 Core i9 UHD GeForce GTX 1050 Ti Max-Q, i9-8950HK, Samsung SSD PM981 MZVLB1T0HALR | Asus ZenBook 15 UX533FD GeForce GTX 1050 Max-Q, i7-8565U, WDC PC SN520 SDAPNUW-512G | HP Spectre x360 15-df0126ng GeForce GTX 1050 Ti Max-Q, i7-8750H, Toshiba XG5-P KXG50PNV2T04 | Gigabyte Aero 15 OLED XA GeForce RTX 2070 Max-Q, i7-9750H, Intel SSD 600p SSDPEKKW512G8L | Razer Blade 15 RTX 2080 Max-Q GeForce RTX 2080 Max-Q, i7-9750H, Samsung SSD PM981 MZVLB512HAJQ | |
|---|---|---|---|---|---|---|
| Noise | 3% | -1% | -1% | -17% | 5% | |
| off / environment * (dB) | 28.2 | 28.2 -0% | 30.5 -8% | 30.4 -8% | 30 -6% | 28.3 -0% |
| Idle Minimum * (dB) | 28.2 | 28.5 -1% | 30.5 -8% | 30.4 -8% | 34 -21% | 28.8 -2% |
| Idle Average * (dB) | 28.2 | 28.6 -1% | 30.5 -8% | 30.4 -8% | 35 -24% | 28.8 -2% |
| Idle Maximum * (dB) | 30.4 | 28.8 5% | 30.5 -0% | 31.6 -4% | 45 -48% | 29 5% |
| Load Average * (dB) | 43.8 | 36.2 17% | 40.8 7% | 43.2 1% | 43 2% | 33.5 24% |
| Witcher 3 ultra * (dB) | 47.2 | 47.6 -1% | 52 -10% | 45 5% | ||
| Load Maximum * (dB) | 47.2 | 47.6 -1% | 41.8 11% | 38.3 19% | 54 -14% | 45.2 4% |
* ... smaller is better
Noise level
| Idle |
| 28.2 / 28.2 / 30.4 dB(A) |
| Load |
| 43.8 / 47.2 dB(A) |
 | ||
30 dB silent 40 dB(A) audible 50 dB(A) loud |
||
min: | ||
(-) The maximum temperature on the upper side is 50.4 °C / 123 F, compared to the average of 36.8 °C / 98 F, ranging from 21 to 71 °C for the class Multimedia.
(-) The bottom heats up to a maximum of 49.2 °C / 121 F, compared to the average of 39.1 °C / 102 F
(+) In idle usage, the average temperature for the upper side is 30.9 °C / 88 F, compared to the device average of 31.3 °C / 88 F.
(-) Playing The Witcher 3, the average temperature for the upper side is 39.4 °C / 103 F, compared to the device average of 31.3 °C / 88 F.
(+) The palmrests and touchpad are cooler than skin temperature with a maximum of 31.8 °C / 89.2 F and are therefore cool to the touch.
(-) The average temperature of the palmrest area of similar devices was 28.7 °C / 83.7 F (-3.1 °C / -5.5 F).
Dell XPS 15 7590 9980HK GTX 1650 audio analysis
(+) | speakers can play relatively loud (88.4 dB)
Bass 100 - 315 Hz
(-) | nearly no bass - on average 24.9% lower than median
(±) | linearity of bass is average (14.4% delta to prev. frequency)
Mids 400 - 2000 Hz
(+) | balanced mids - only 2.8% away from median
(±) | linearity of mids is average (7.8% delta to prev. frequency)
Highs 2 - 16 kHz
(+) | balanced highs - only 1.9% away from median
(+) | highs are linear (5.3% delta to prev. frequency)
Overall 100 - 16.000 Hz
(±) | linearity of overall sound is average (17.8% difference to median)
Compared to same class
» 52% of all tested devices in this class were better, 7% similar, 41% worse
» The best had a delta of 5%, average was 17%, worst was 45%
Compared to all devices tested
» 36% of all tested devices were better, 8% similar, 56% worse
» The best had a delta of 4%, average was 24%, worst was 134%
Apple MacBook 12 (Early 2016) 1.1 GHz audio analysis
(+) | speakers can play relatively loud (83.6 dB)
Bass 100 - 315 Hz
(±) | reduced bass - on average 11.3% lower than median
(±) | linearity of bass is average (14.2% delta to prev. frequency)
Mids 400 - 2000 Hz
(+) | balanced mids - only 2.4% away from median
(+) | mids are linear (5.5% delta to prev. frequency)
Highs 2 - 16 kHz
(+) | balanced highs - only 2% away from median
(+) | highs are linear (4.5% delta to prev. frequency)
Overall 100 - 16.000 Hz
(+) | overall sound is linear (10.2% difference to median)
Compared to same class
» 7% of all tested devices in this class were better, 2% similar, 91% worse
» The best had a delta of 5%, average was 18%, worst was 53%
Compared to all devices tested
» 5% of all tested devices were better, 1% similar, 94% worse
» The best had a delta of 4%, average was 24%, worst was 134%
| Off / Standby | |
| Idle | |
| Load |
|
Key:
min: | |
| Dell XPS 15 7590 9980HK GTX 1650 i9-9980HK, GeForce GTX 1650 Mobile, Toshiba XG6 KXG60ZNV1T02, OLED, 3840x2160, 15.6" | Dell XPS 15 9570 Core i9 UHD i9-8950HK, GeForce GTX 1050 Ti Max-Q, Samsung SSD PM981 MZVLB1T0HALR, IPS, 3840x2160, 15.6" | Asus ZenBook 15 UX533FD i7-8565U, GeForce GTX 1050 Max-Q, WDC PC SN520 SDAPNUW-512G, IPS, 1920x1080, 15.6" | HP Spectre x360 15-df0126ng i7-8750H, GeForce GTX 1050 Ti Max-Q, Toshiba XG5-P KXG50PNV2T04, IPS, 3840x2160, 15.6" | Gigabyte Aero 15 OLED XA i7-9750H, GeForce RTX 2070 Max-Q, Intel SSD 600p SSDPEKKW512G8L, OLED, 3840x2160, 15.6" | Razer Blade 15 RTX 2080 Max-Q i7-9750H, GeForce RTX 2080 Max-Q, Samsung SSD PM981 MZVLB512HAJQ, IPS, 1920x1080, 15.6" | MSI GF75 Thin 9SC i7-9750H, GeForce GTX 1650 Mobile, Crucial P1 SSD CT1000P1SSD8, IPS, 1920x1080, 17.3" | |
|---|---|---|---|---|---|---|---|
| Power Consumption | -6% | 37% | 34% | -101% | -46% | -13% | |
| Idle Minimum * (Watt) | 6.2 | 7.1 -15% | 2.7 56% | 2.1 66% | 23 -271% | 12.5 -102% | 6.1 2% |
| Idle Average * (Watt) | 9.6 | 13.6 -42% | 8 17% | 6.7 30% | 25 -160% | 15.3 -59% | 11.2 -17% |
| Idle Maximum * (Watt) | 21.2 | 14.1 33% | 10.6 50% | 11.4 46% | 33 -56% | 20.7 2% | 24.5 -16% |
| Load Average * (Watt) | 104.3 | 103.9 -0% | 74 29% | 77.7 26% | 96 8% | 90.2 14% | 94.7 9% |
| Witcher 3 ultra * (Watt) | 91.7 | 103 -12% | 168 -83% | 162 -77% | 105.8 -15% | ||
| Load Maximum * (Watt) | 135.3 | 130.9 3% | 89 34% | 131.5 3% | 197 -46% | 209.3 -55% | 192.2 -42% |
* ... smaller is better
| Dell XPS 15 7590 9980HK GTX 1650 i9-9980HK, GeForce GTX 1650 Mobile, 97 Wh | Dell XPS 15 9570 Core i9 UHD i9-8950HK, GeForce GTX 1050 Ti Max-Q, 97 Wh | Asus ZenBook 15 UX533FD i7-8565U, GeForce GTX 1050 Max-Q, 73 Wh | HP Spectre x360 15-df0126ng i7-8750H, GeForce GTX 1050 Ti Max-Q, 84 Wh | Gigabyte Aero 15 OLED XA i7-9750H, GeForce RTX 2070 Max-Q, 94.24 Wh | Razer Blade 15 RTX 2080 Max-Q i7-9750H, GeForce RTX 2080 Max-Q, 80 Wh | MSI GF75 Thin 9SC i7-9750H, GeForce GTX 1650 Mobile, 51 Wh | |
|---|---|---|---|---|---|---|---|
| Battery runtime | -20% | 25% | 2% | -29% | -19% | -40% | |
| Reader / Idle (h) | 15.2 | 15 -1% | 26.5 74% | 18.8 24% | 9.9 -35% | 15.9 5% | |
| WiFi v1.3 (h) | 7.8 | 8.6 10% | 8.7 12% | 8.8 13% | 5.7 -27% | 6.6 -15% | 4.7 -40% |
| Load (h) | 3.3 | 1 -70% | 2.9 -12% | 2.3 -30% | 2.5 -24% | 1.7 -48% |
Pros
Cons
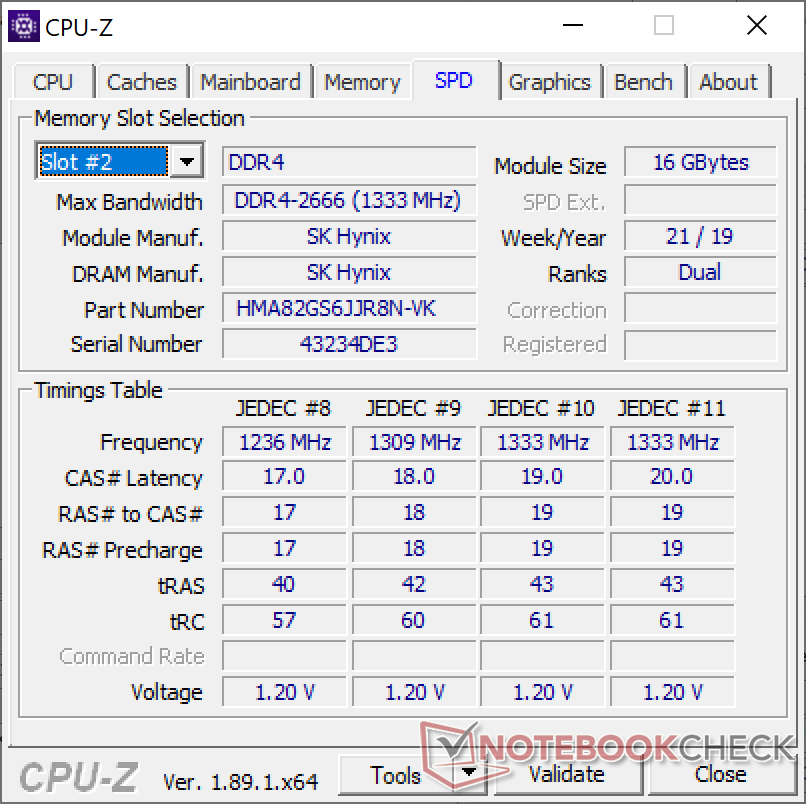
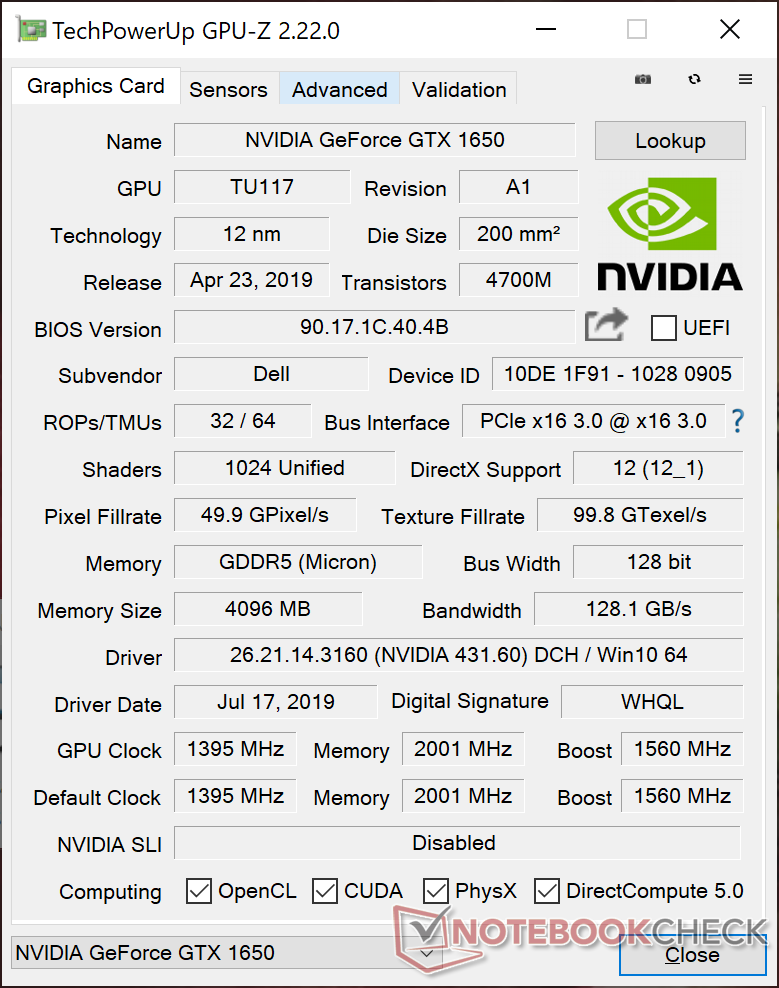
配备Core i9-9980HK和GTX 1650的XPS 15 7590是XPS 15迄今为止最强劲的一代——也应当如此。另一方面,它也是迄今为止我们在笔记本电脑上测试过的i9-9980HK和GTX 1650的最差版本。我们为什么不经常看到配备i9 CPU的超极本是有原因的,更不用说可超频的Core i9 CPU和GeForce GTX GPU。在这种大小的笔记本中塞进如此多的性能将限制处理器的全部潜力,因为它们将受散热设计的限制。基于别的评测我们知道XPS 15中的Core i9和GTX 1650能够在更大的笔记本上发挥更强的性能。
一旦研究XPS 15设计的历史,这些数据就不攻自破了。它的模具是在五年前开发的。酷睿i9 CPU以其极高的Turbo Boost频率而著称,只有通过合适的散热解决方案才能利用。如果您无法维持这些高Turbo Boost频率,那么整体性能将不会比普通Core i7更好。这些新处理器正在挑战陈旧的XPS 15模具的极限。
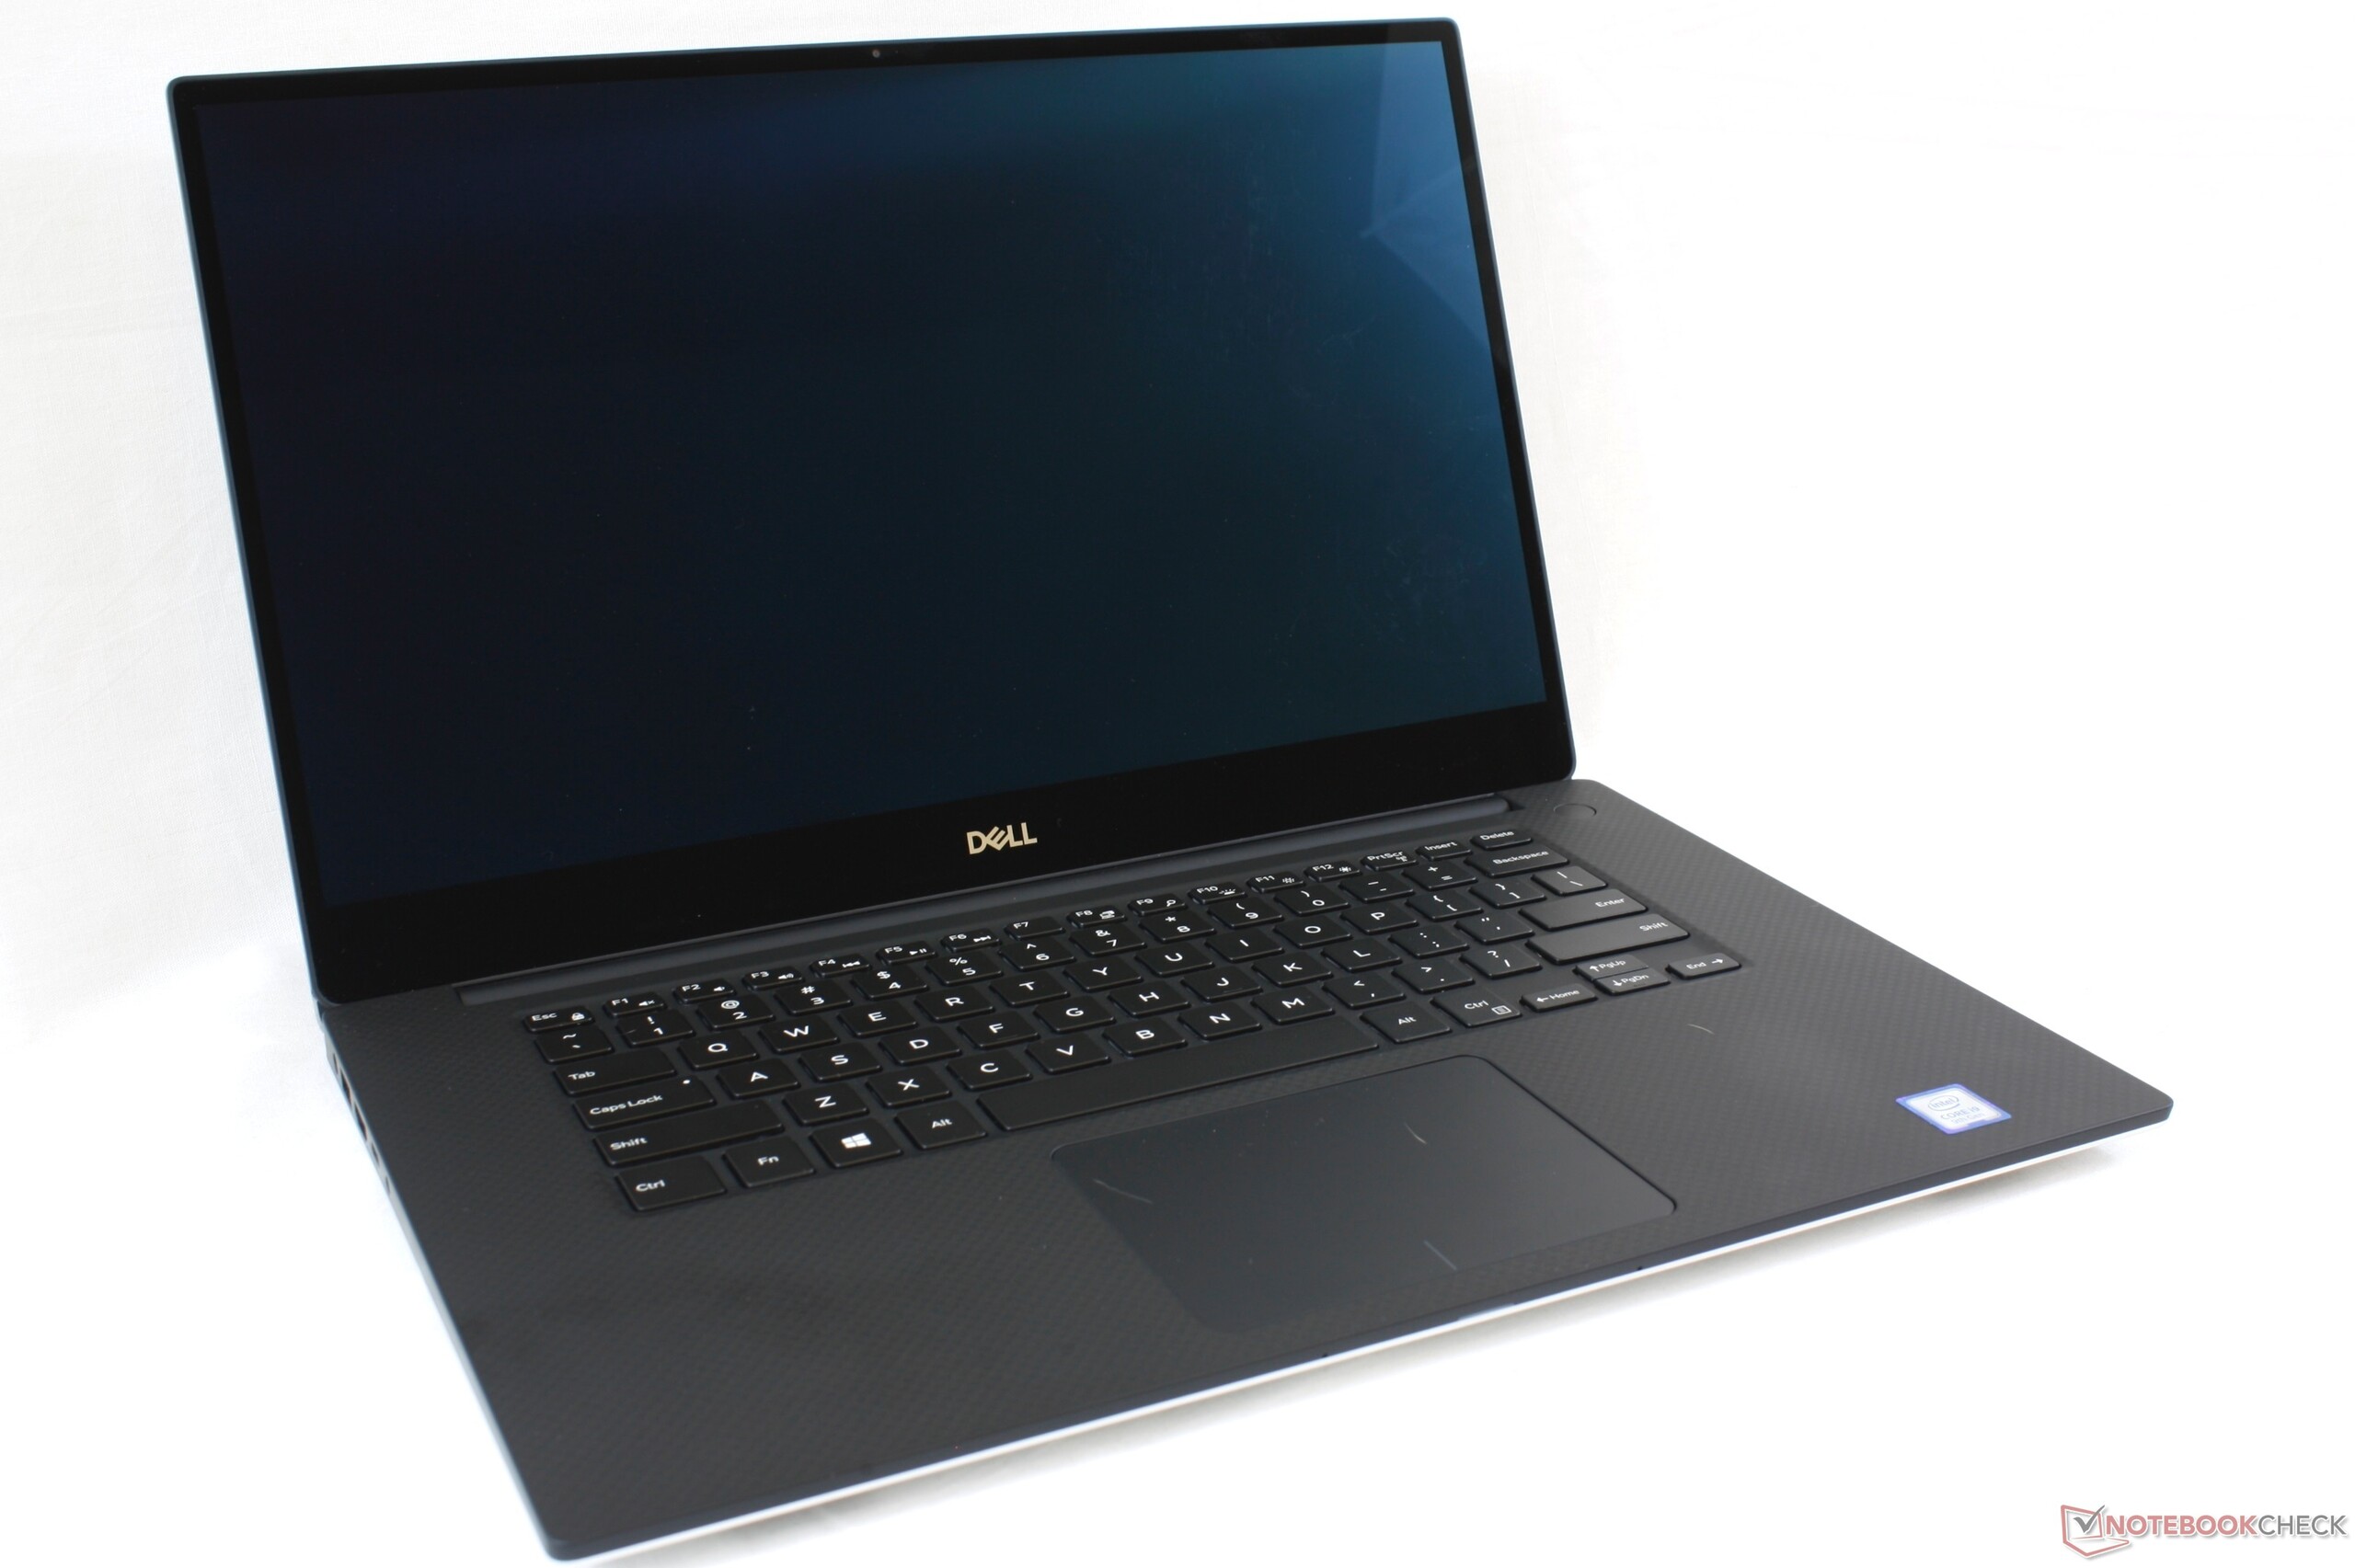
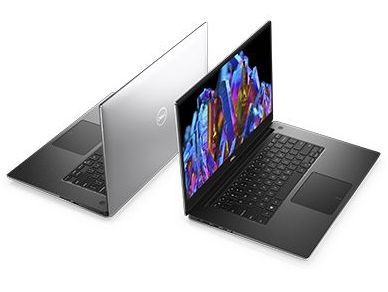
尽管CPU和GeForce GTX的性能不稳定,但XPS 15仍然是市场上最知名的超极本之一。令人惊讶的是,即使面对其他较新的15.6英寸超极本,它的设计在结构质量和美观性方面仍然是如此出色。为了获得更好的性价比和更平衡的机器,我们建议改用XPS 15 7590的i7或i5 SKU。
Core i9-9980HK和GTX 1650配置的性能比去年的Core i9-8950H和GTX 1050 Ti Max-Q配置要强,但提升较小,不如预期。这些可超频的i9选项在XPS 15的当前模具中效果不佳。 7590系列最引人注目的功能不是CPU或GPU更新,而是OLED选项的引入。
Dell XPS 15 7590 9980HK GTX 1650
- 08/31/2022 v7 (old)
Allen Ngo
Price comparison

