结论 - Apex 16 Max 游戏性能全面,几乎没有任何妥协
Apex 16 Max 采用快速组件,完全专注于游戏性能,并能带来令人信服的效果。加上 Mini-LED 面板,HDR 游戏尤其充满乐趣。不过,明亮的显示屏也会消耗大量电能,影响电池寿命。如果您需要更长的续航时间,您应该选择 IPS 面板。
为了保持较低的入门级价格,XMG 确实做出了一些妥协(没有 USB-C 4.0、没有 Wi-Fi 7、没有高级 Optimus 和塑料底座)。不过,老实说,这些在日常游戏中都不是真正的问题,我们很乐意接受这些折衷,以换取配备 12 GB VRAM 的 RTX 5070 Ti。总之,这是一款性价比很高的游戏笔记本电脑。
Pros
Cons
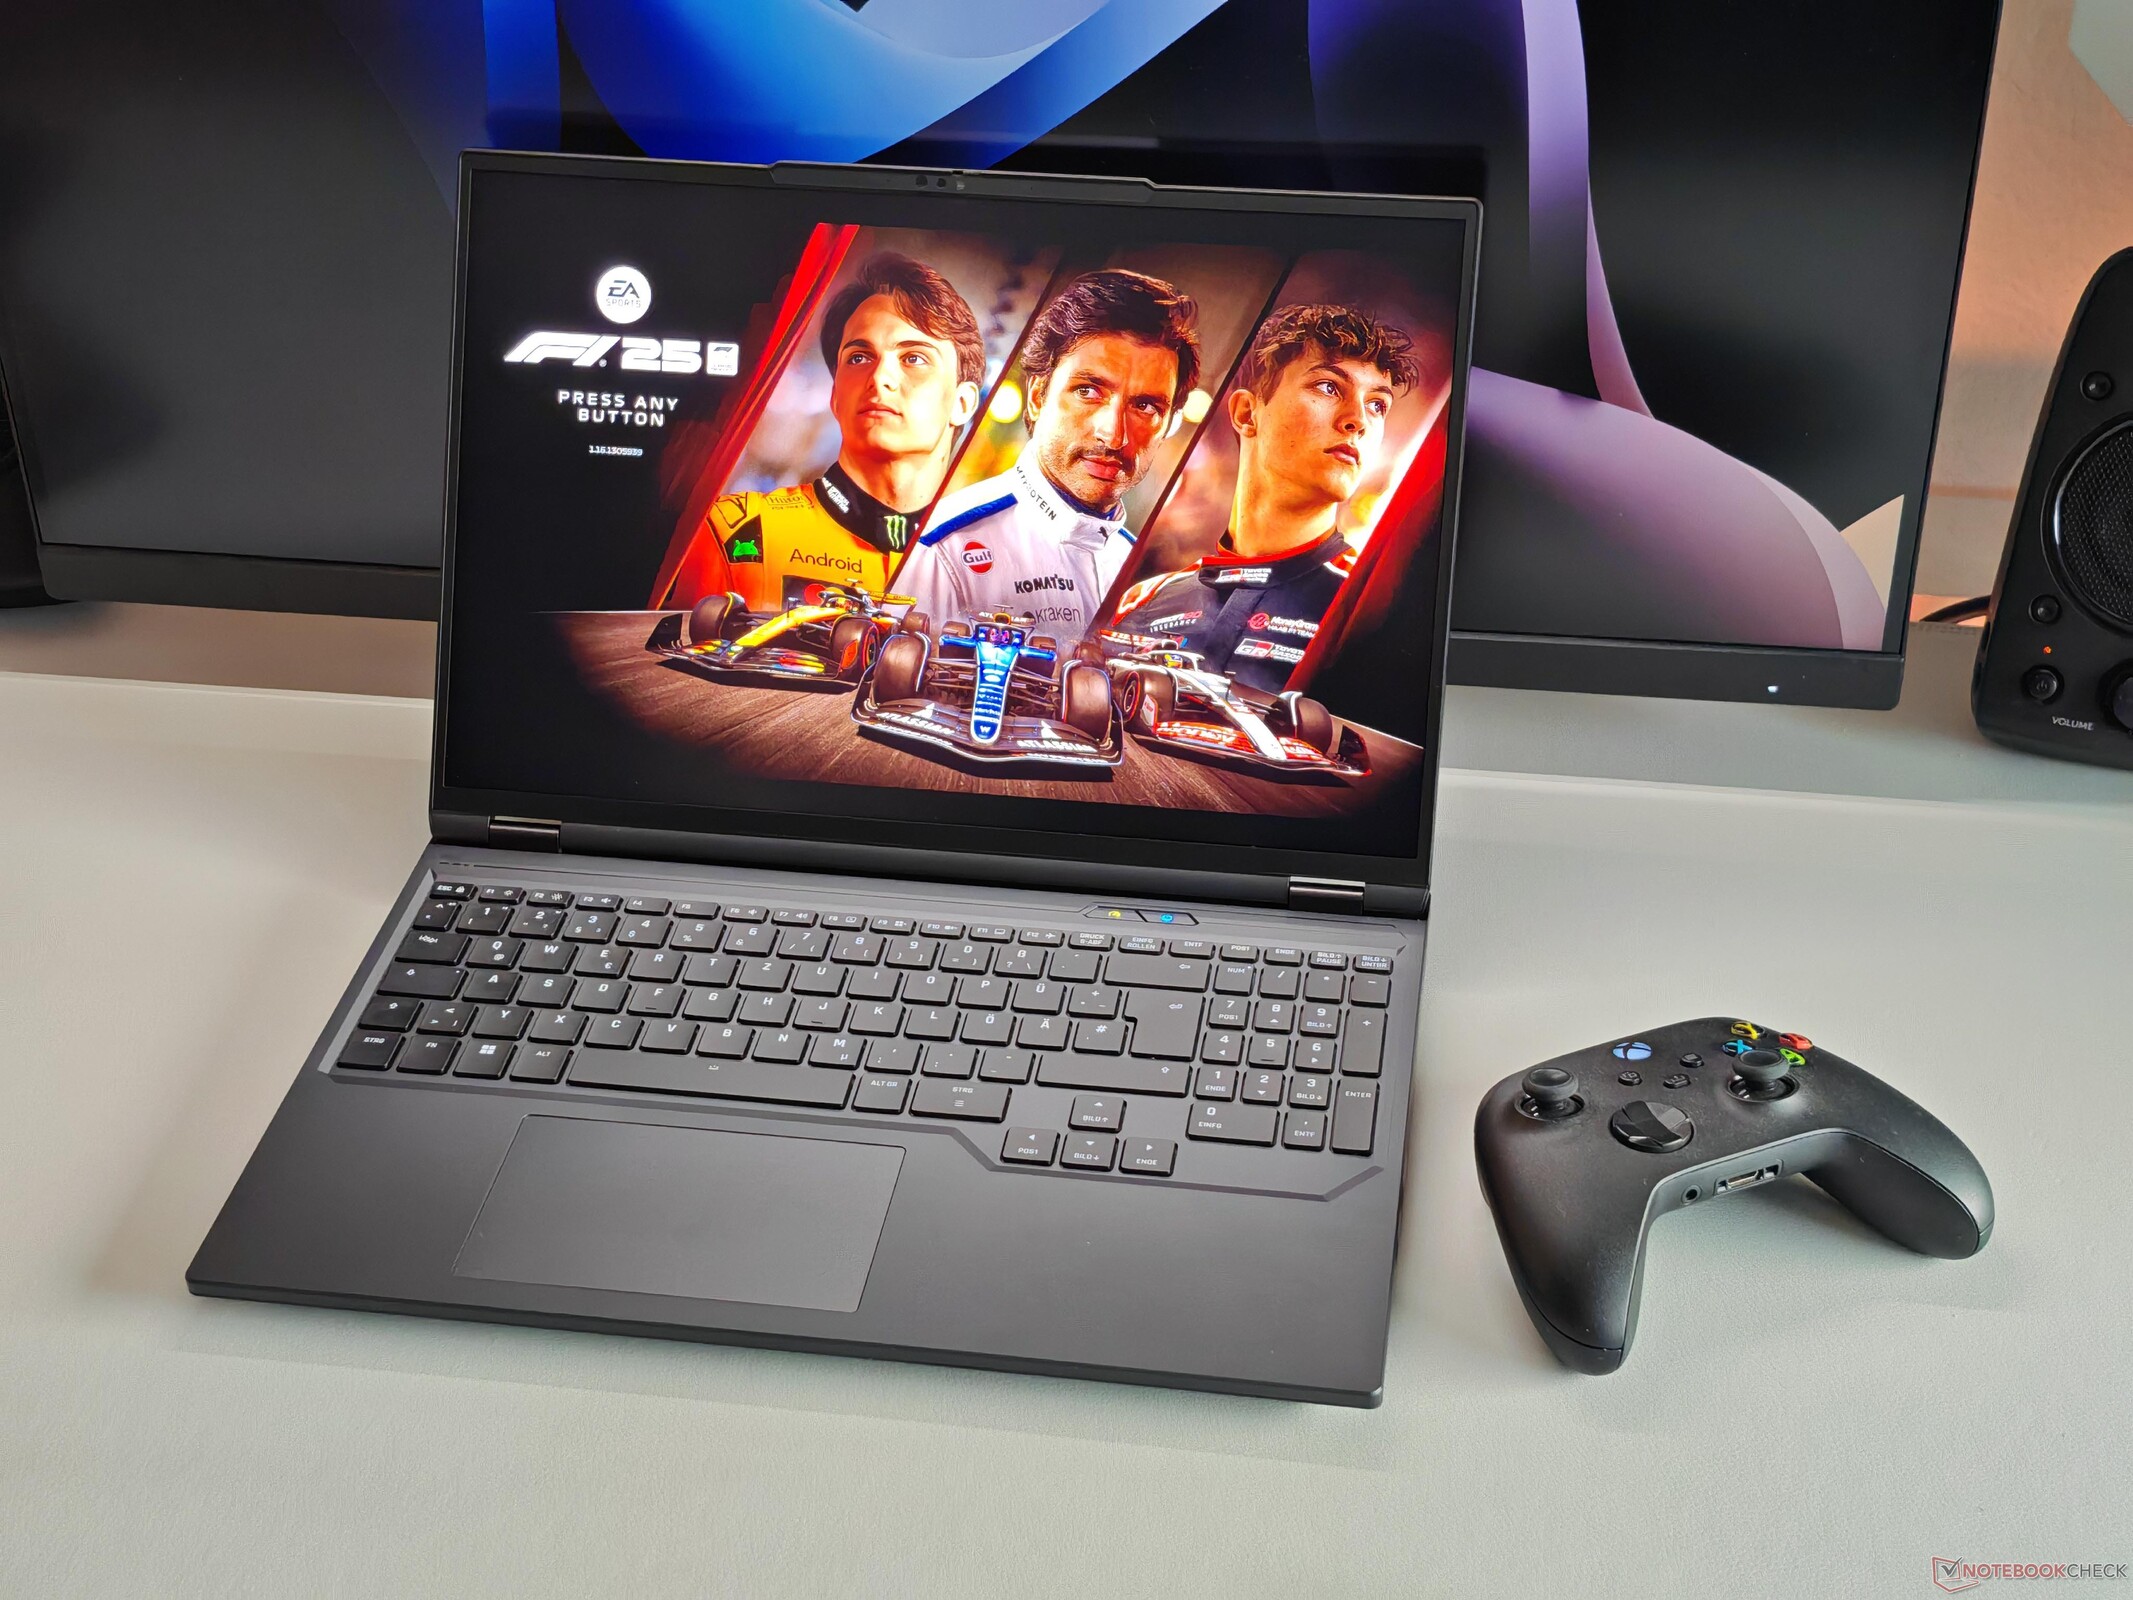
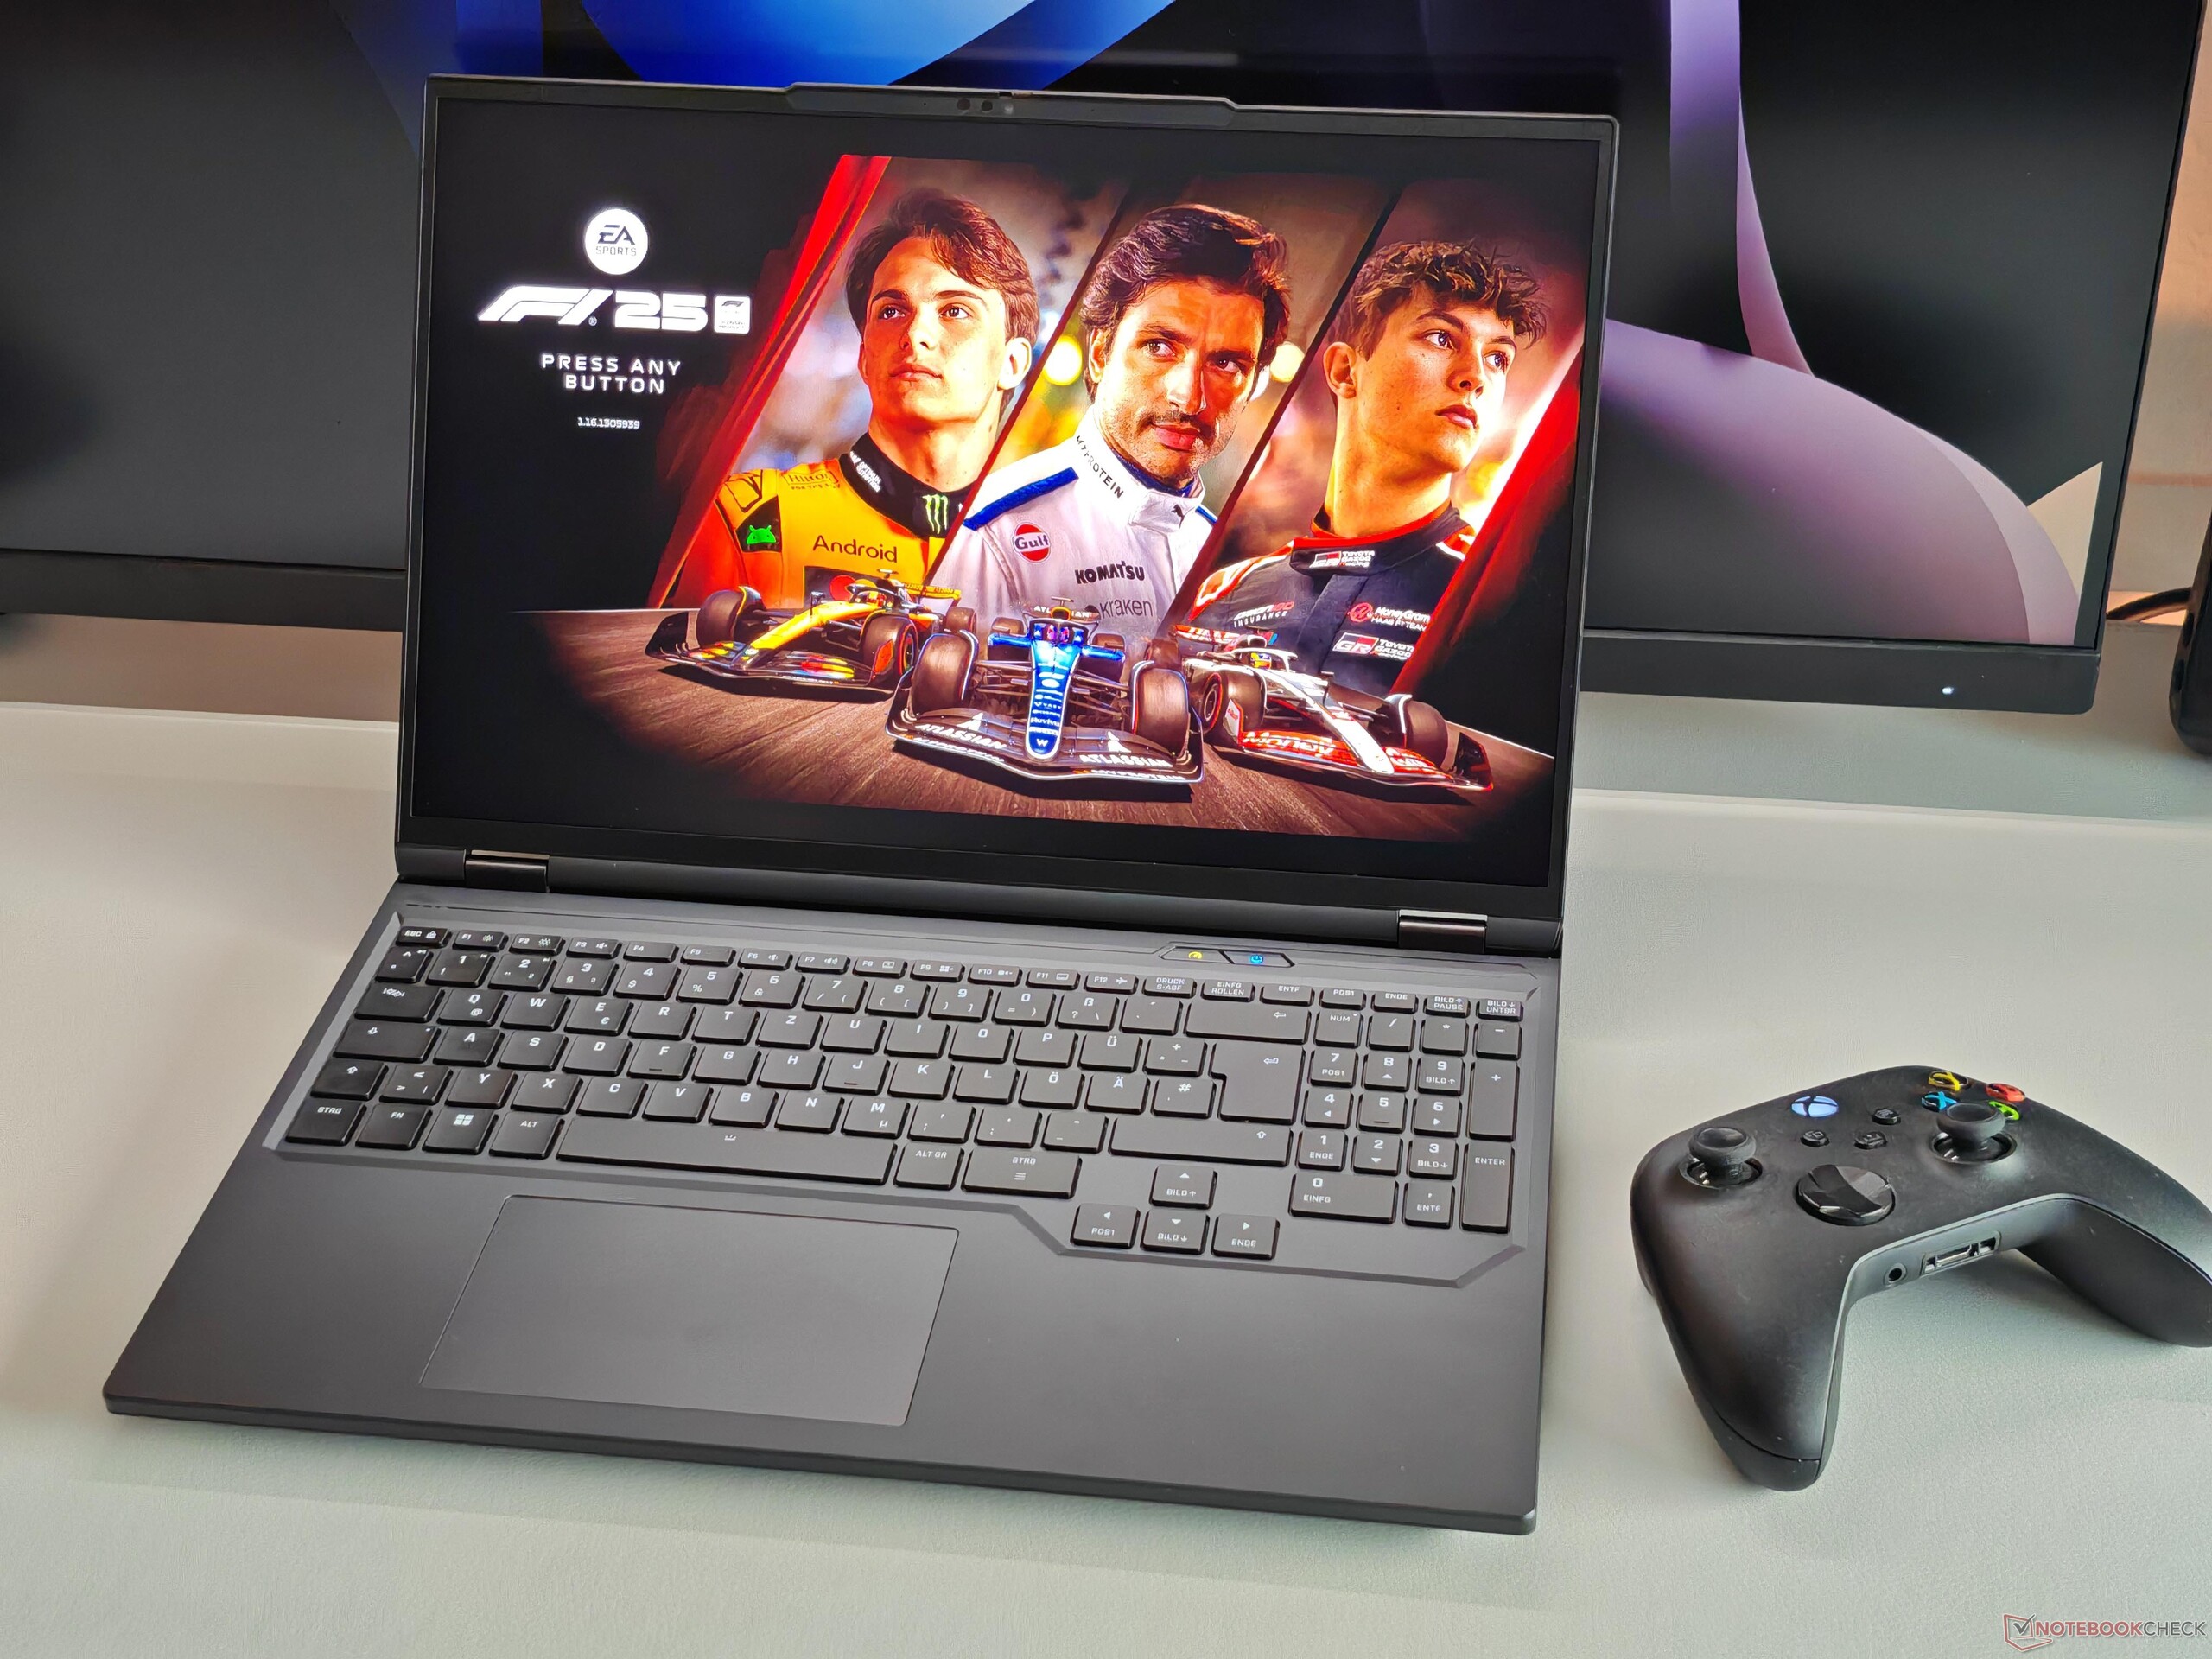
XMG 推出的 Apex 16 Max 是一款功能强大的游戏笔记本电脑,应该能吸引对价格最敏感的买家。目前,配备 IPS 显示屏和 RTX 5070 Ti 的起售价约为 2,090 欧元,而我们的测试设备售价约为 2,800 欧元,主要原因是其内存配置(64 GB 内存、2 TB SSD)和迷你 LED 面板非常厚道。
XMG 推出的 Apex 16 Max 是一款功能强大的游戏笔记本电脑,主要面向价格敏感型买家。目前,配备 IPS 显示屏和 RTX 5070 Ti 的起售价约为 2090 欧元,而我们的评测机售价约为 2800 欧元(约合人民币 3x283 元)--这主要归功于其丰富的内存配置(64 GB 内存、2 TB SSD)和迷你 LED 面板。
规格
箱子和设备
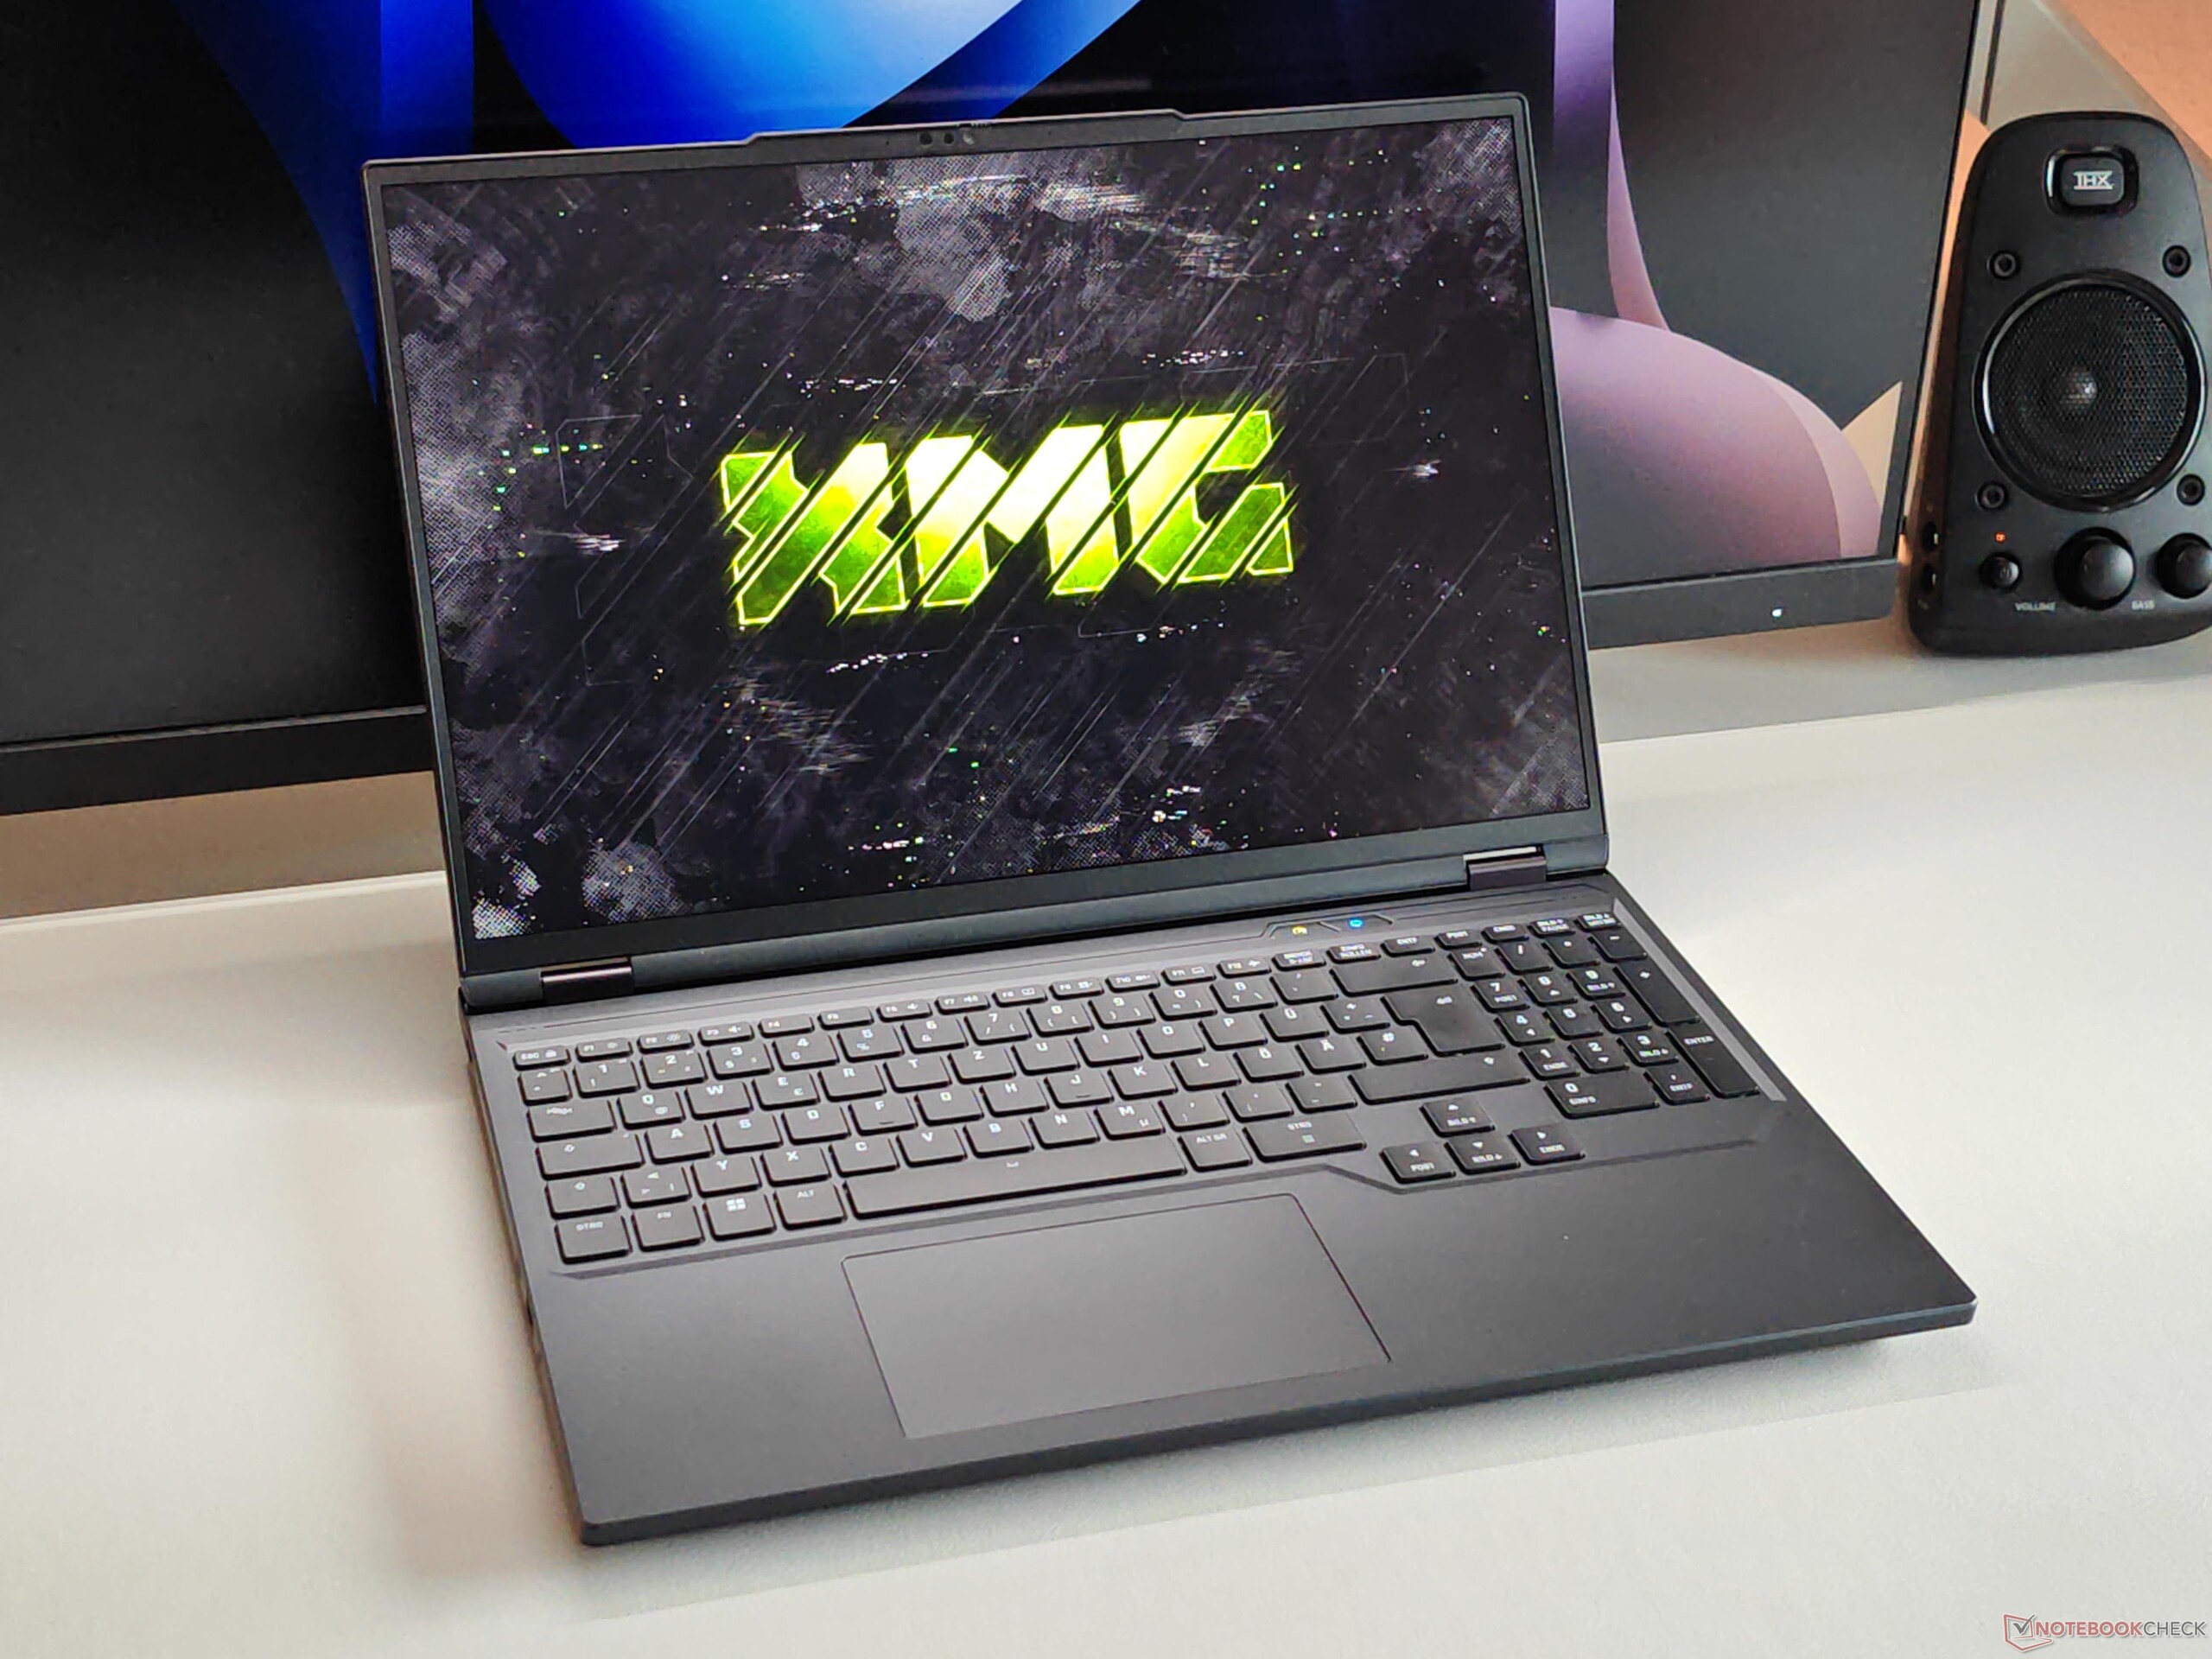
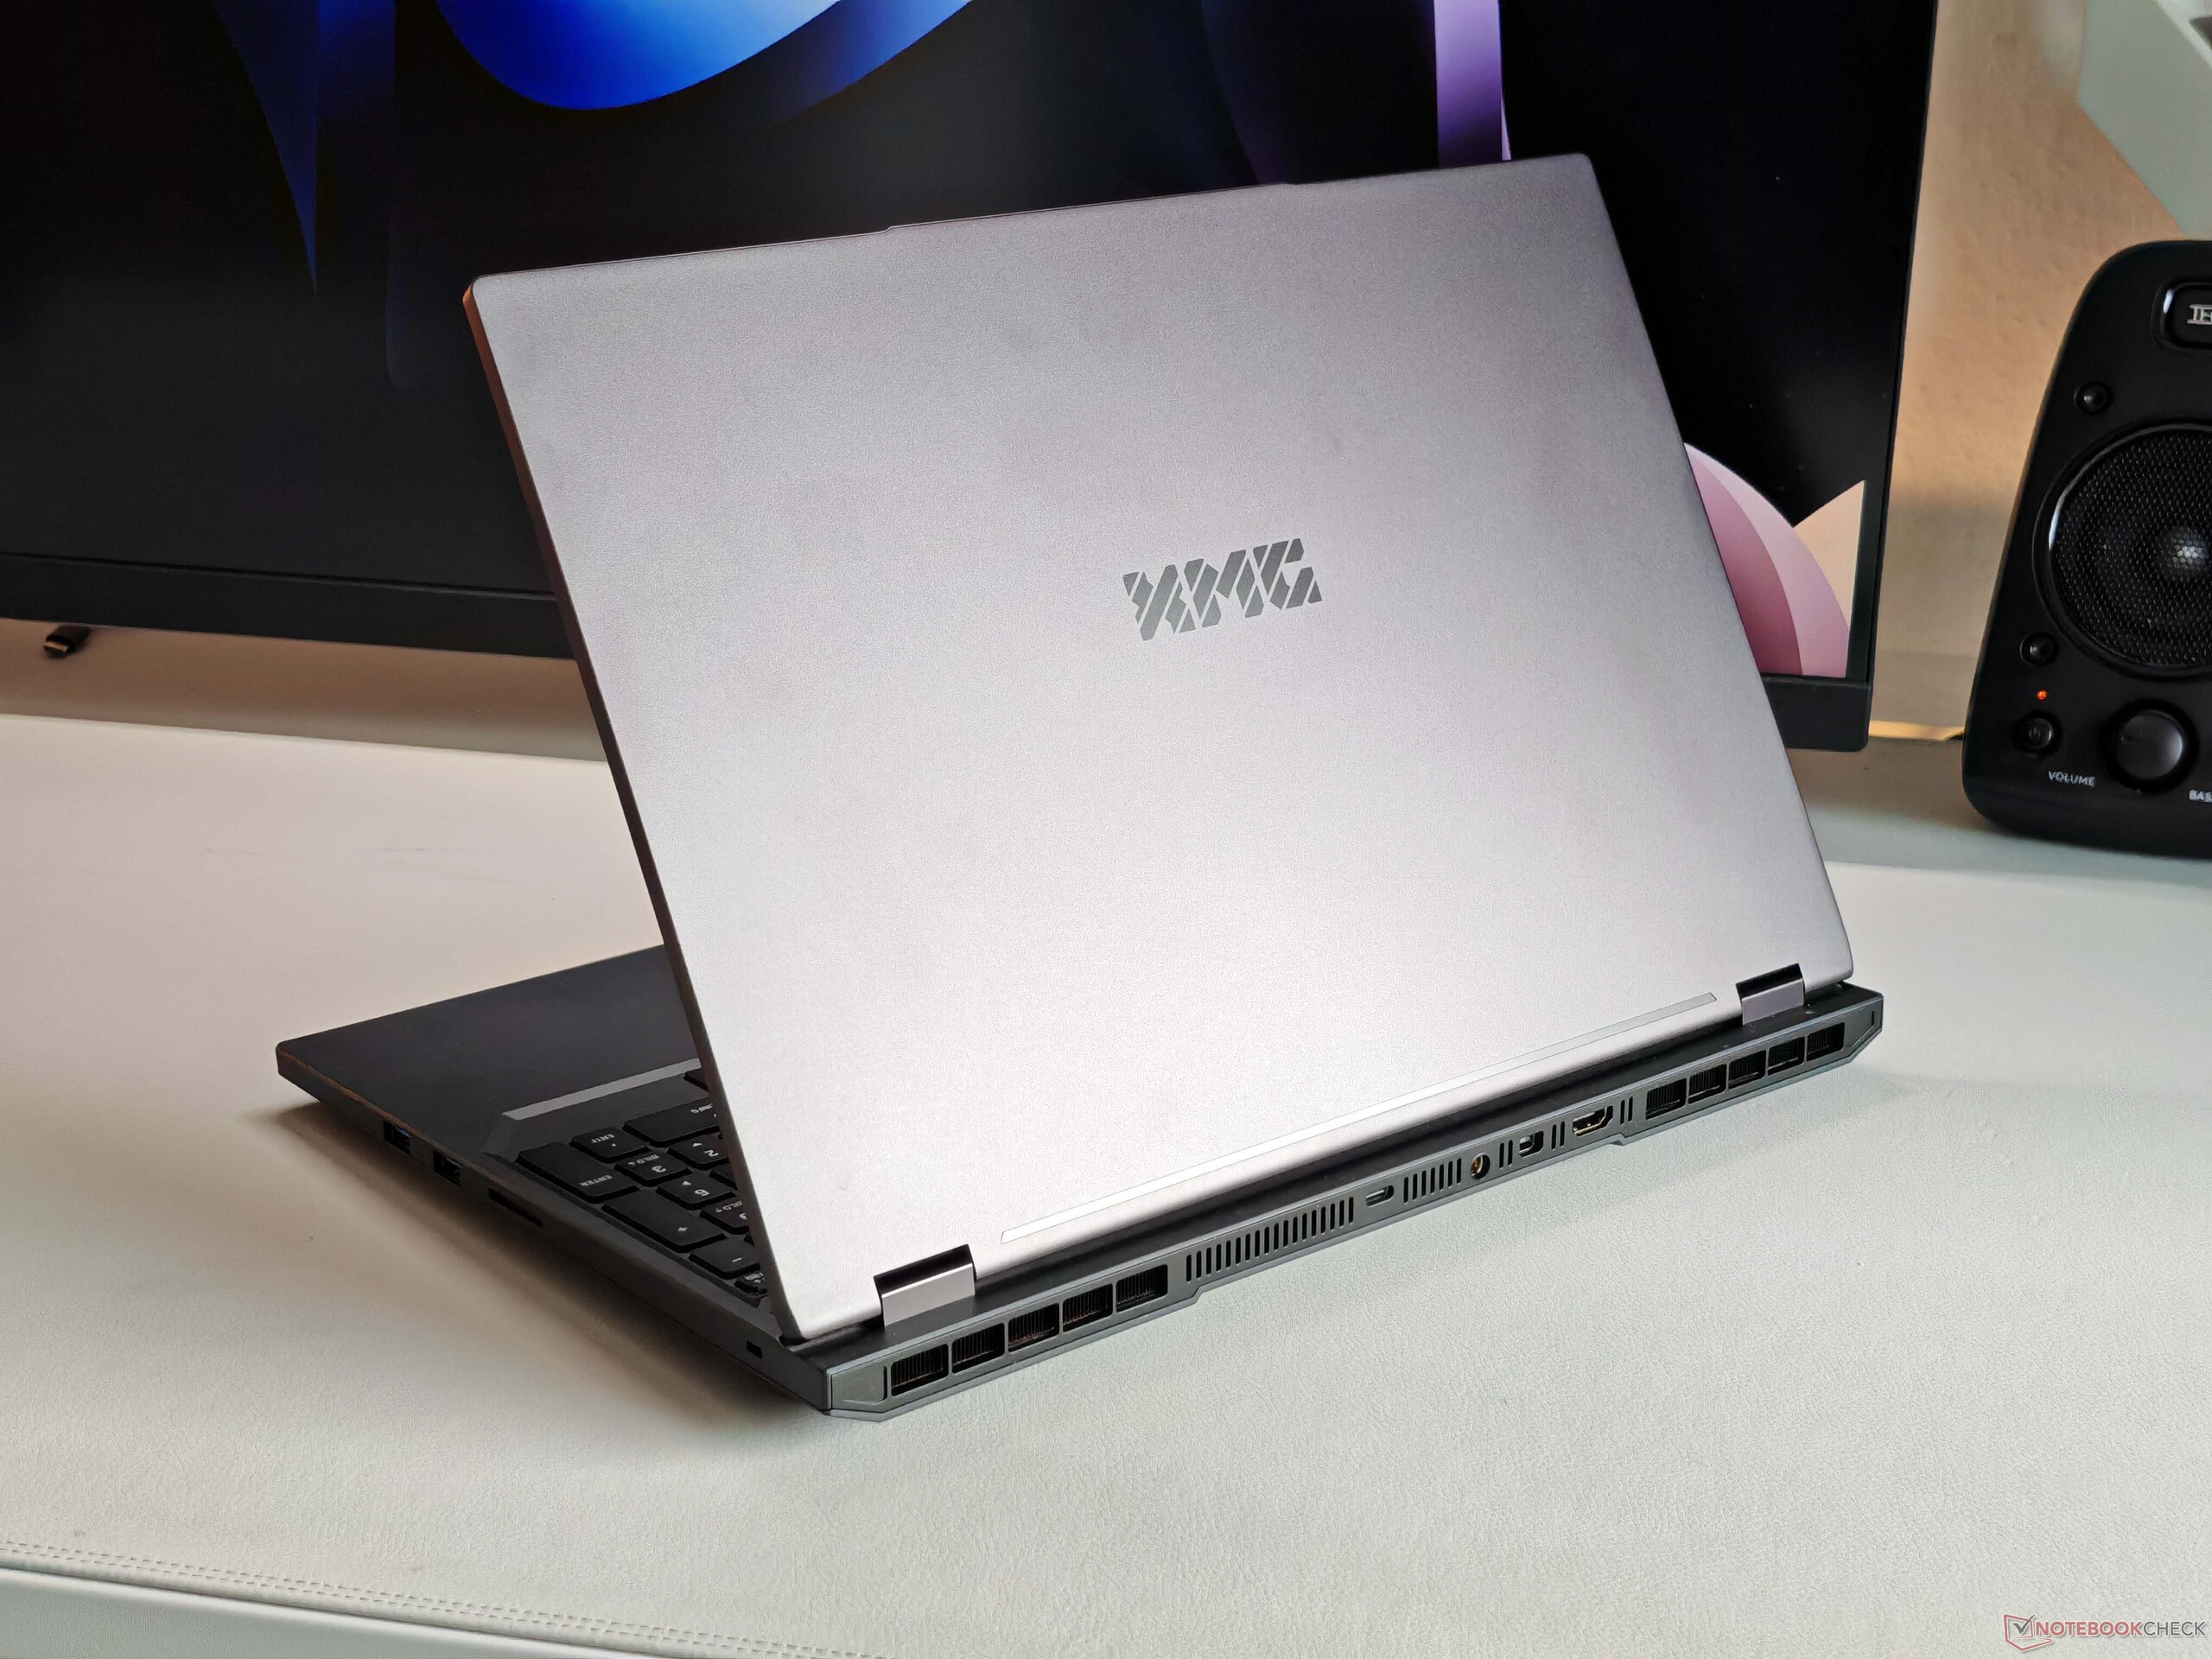
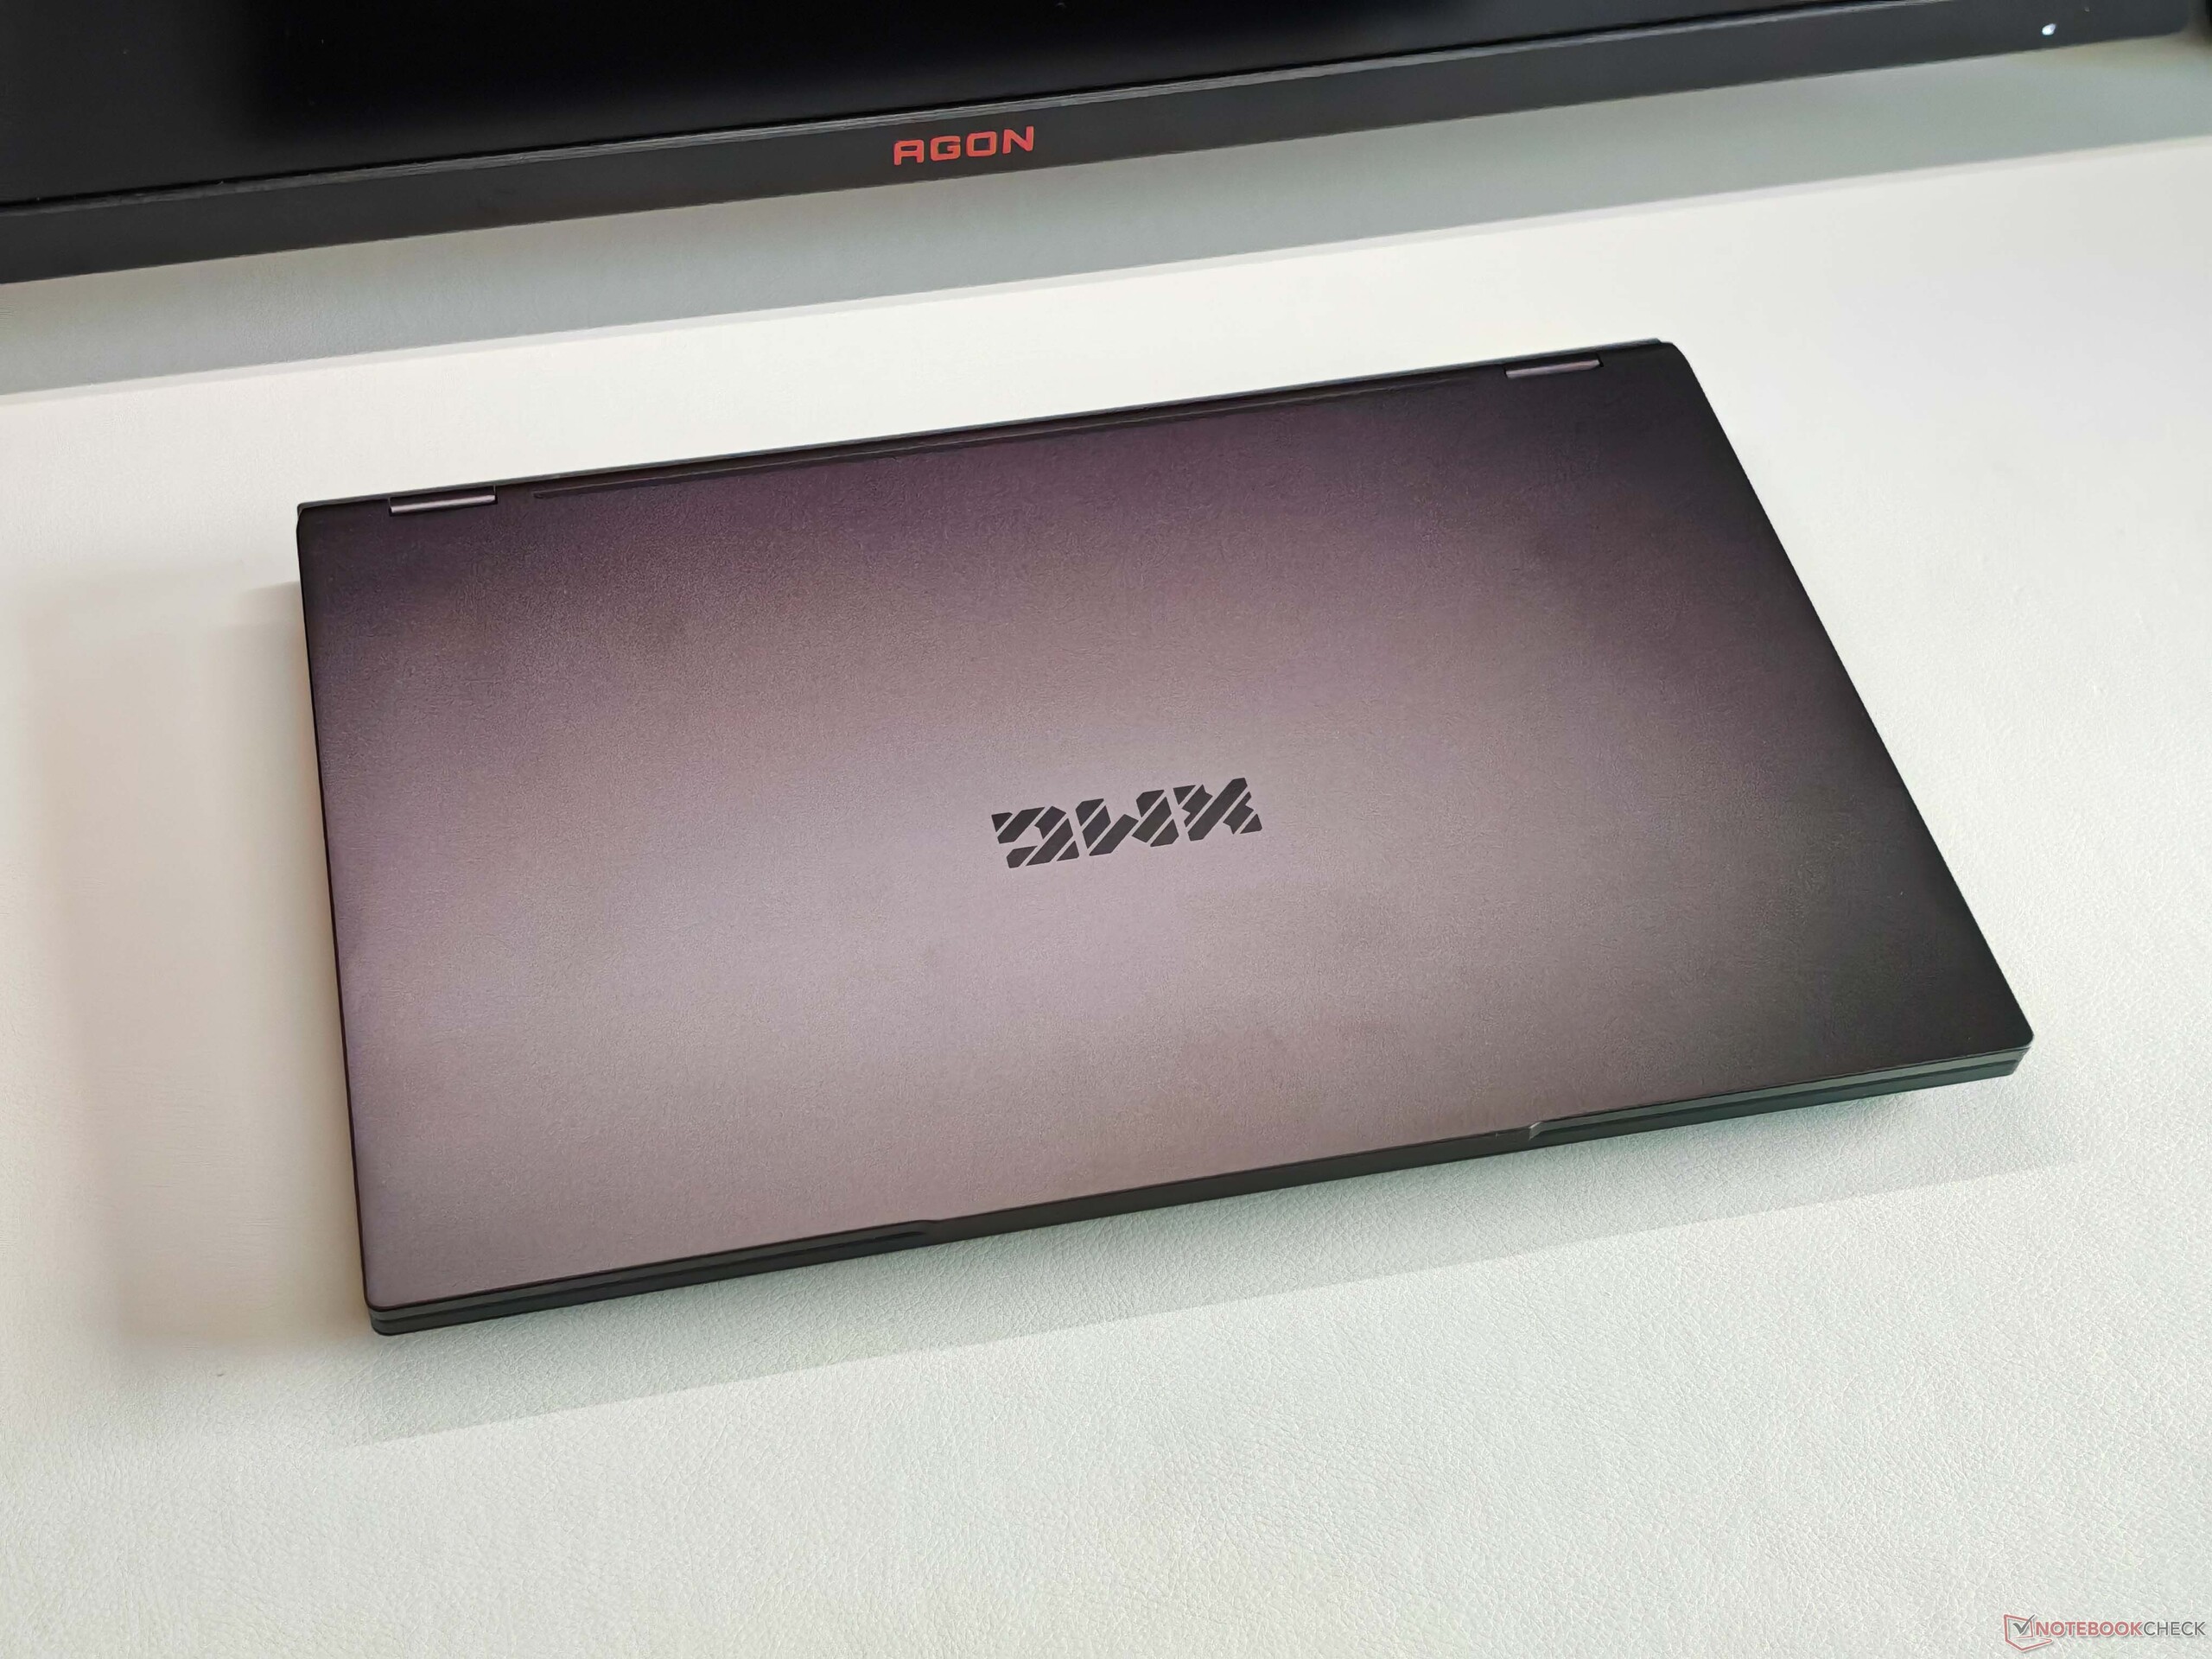
我们已经从目前的 XMG Pro 16 中了解到这款机箱的类似形式。整体设计低调,机箱上没有任何照明元素。为了尽可能降低价格,只有显示屏盖采用了铝合金材质,而底壳则是塑料材质。即便如此,整体稳定性仍然很好,铰链(最大 180 度)只允许轻微晃动。
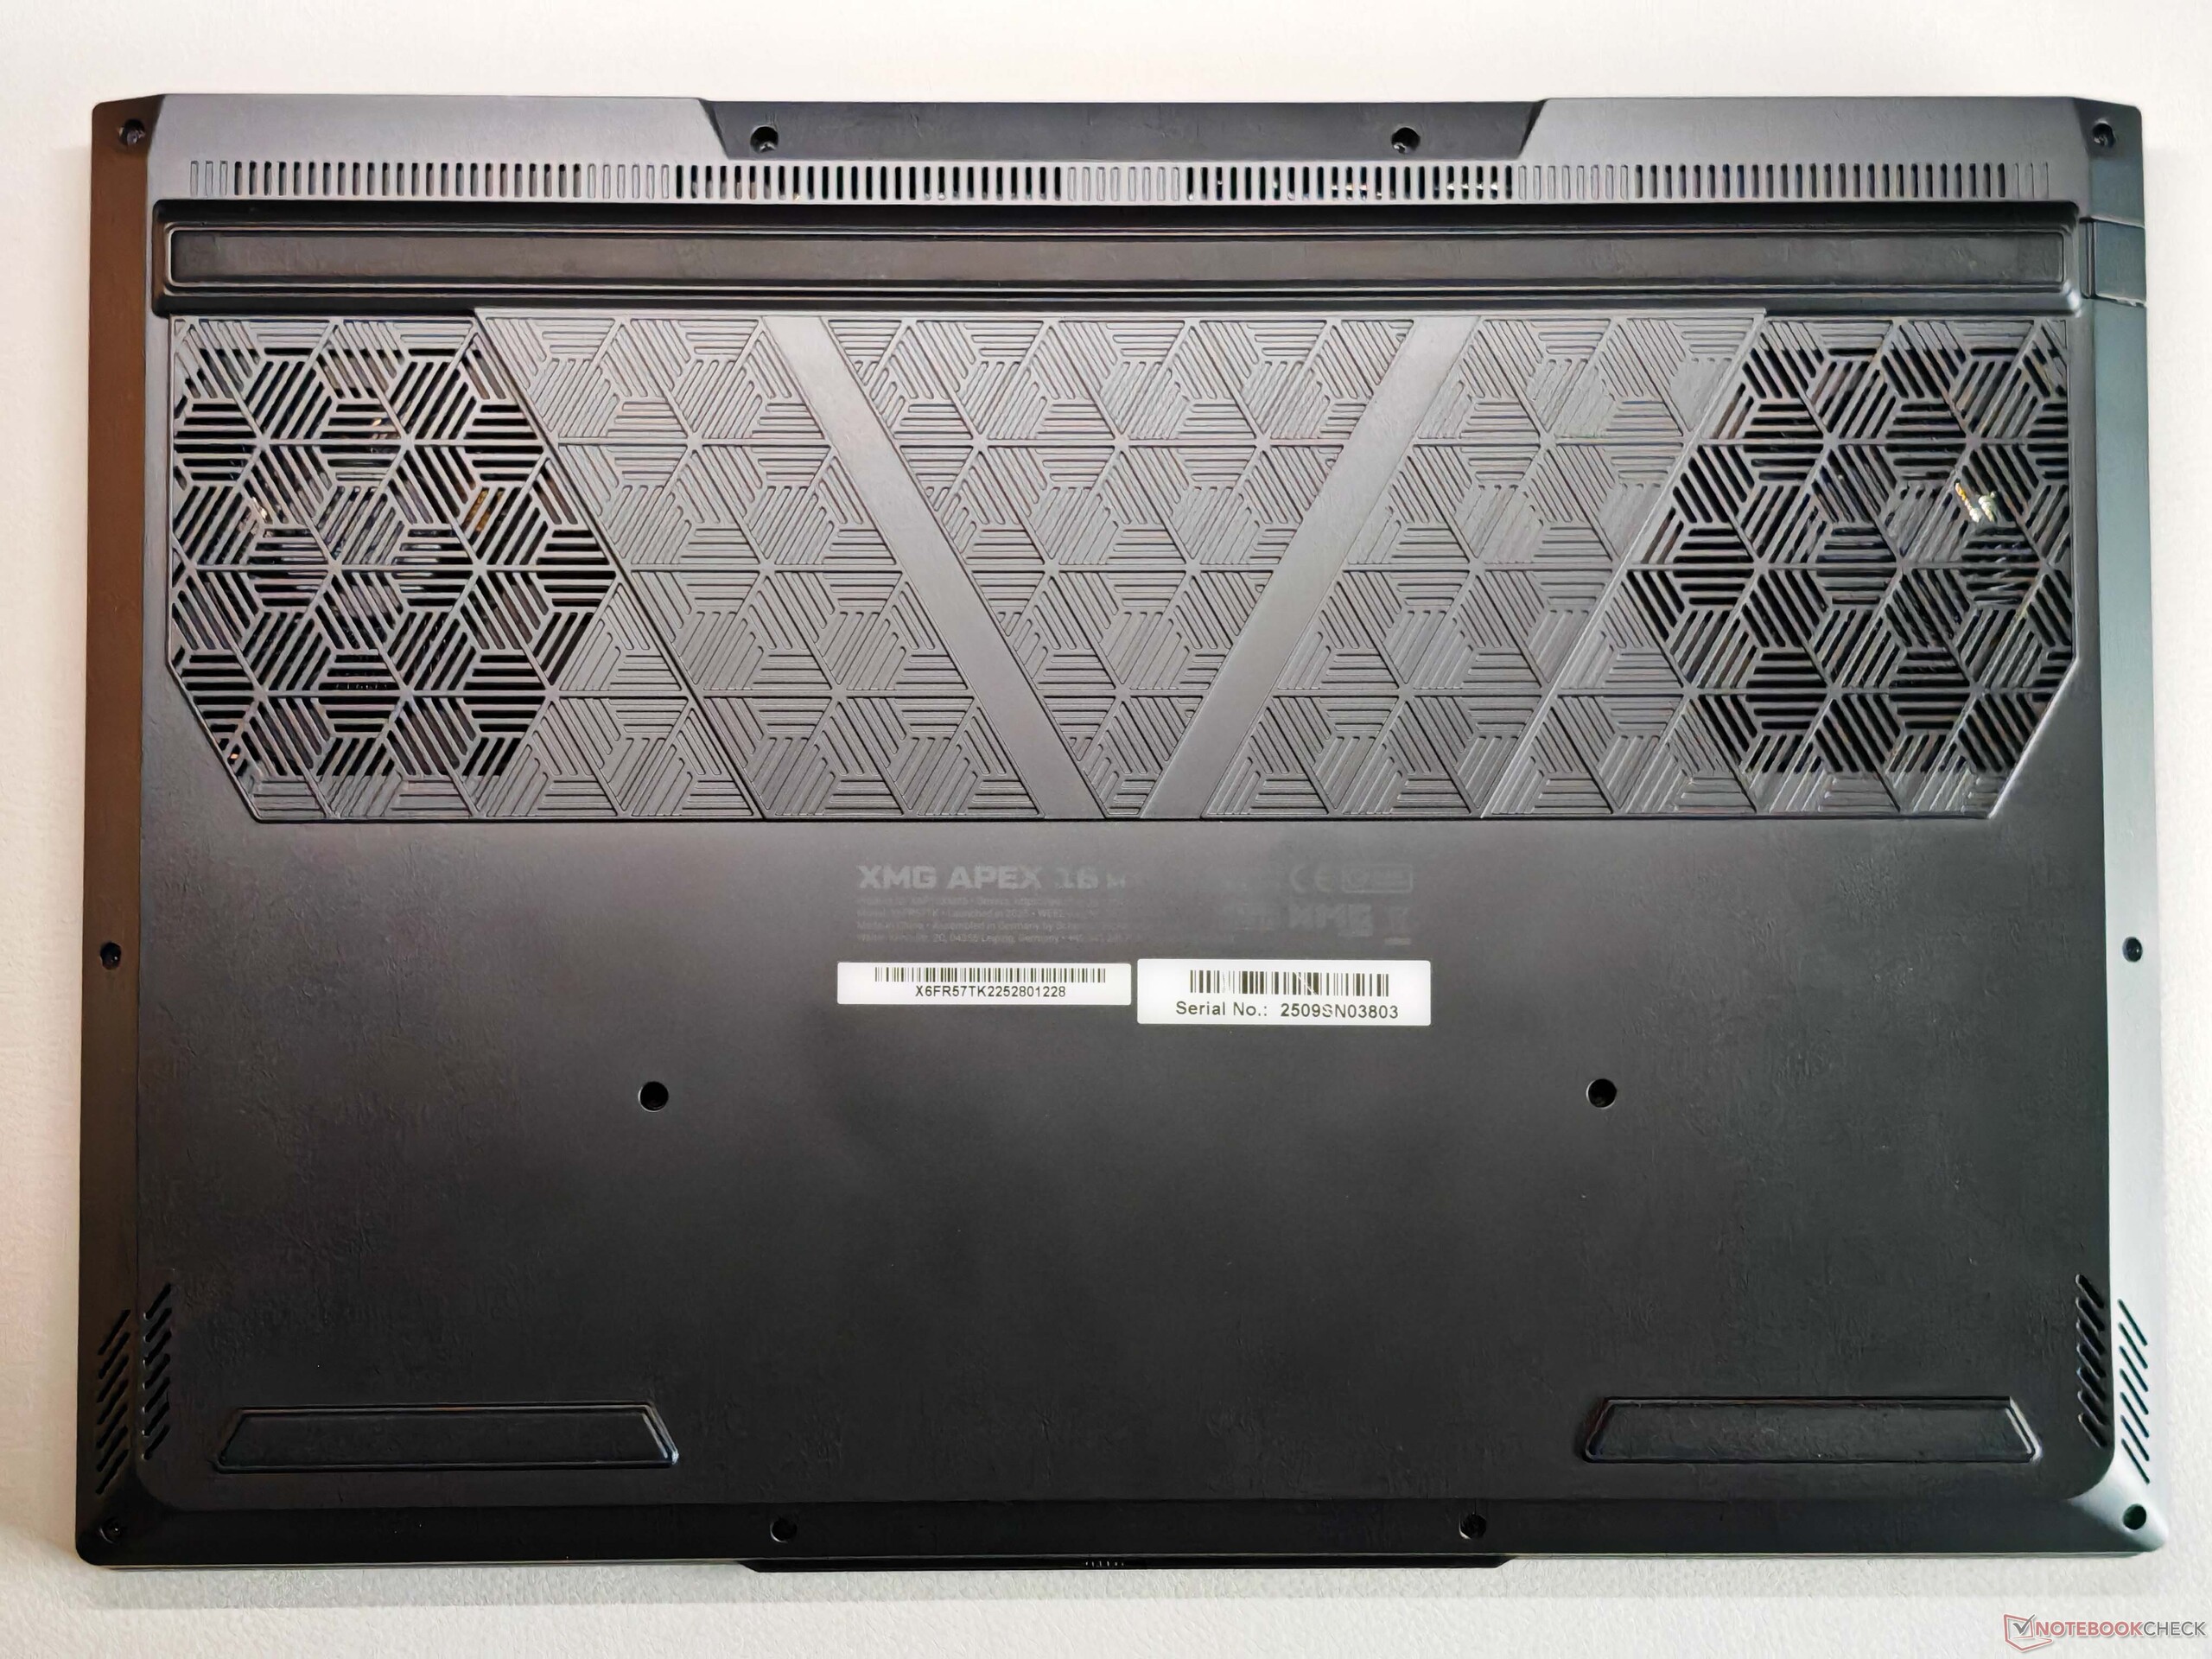
维护选项非常丰富(2×内存、2×固态硬盘),可用端口也很多,不过没有 USB 4.0 接口。除了 Wi-Fi 6E,该笔记本电脑还提供千兆以太网和全尺寸读卡器。1080p 网络摄像头(带隐私快门和红外功能)满足了其用途。


| SD Card Reader | |
| average JPG Copy Test (av. of 3 runs) | |
| Medion Erazer Major 16 X1 MD62736 (AV PRO microSD 128 GB V60) | |
| Schenker XMG Pro 16 (E25) (Angelbird AV Pro V60) | |
| Average of class Gaming (20.9 - 210, n=54, last 2 years) | |
| MSI Vector 16 HX AI A2XWHG (AV PRO microSD 128 GB V60) | |
| Acer Predator Helios Neo 16S AI PHN16S-71-94L9 (AV PRO microSD 128 GB V60) | |
| Schenker XMG APEX 16 MAX (Angelbird AV Pro V60) | |
| maximum AS SSD Seq Read Test (1GB) | |
| Schenker XMG Pro 16 (E25) (Angelbird AV Pro V60) | |
| Medion Erazer Major 16 X1 MD62736 (AV PRO microSD 128 GB V60) | |
| Average of class Gaming (25.5 - 261, n=51, last 2 years) | |
| MSI Vector 16 HX AI A2XWHG (AV PRO microSD 128 GB V60) | |
| Schenker XMG APEX 16 MAX (Angelbird AV Pro V60) | |
| Acer Predator Helios Neo 16S AI PHN16S-71-94L9 (AV PRO microSD 128 GB V60) | |
| Networking | |
| Schenker XMG APEX 16 MAX | |
| iperf3 transmit AXE11000 | |
| iperf3 receive AXE11000 | |
| Acer Predator Helios Neo 16S AI PHN16S-71-94L9 | |
| iperf3 transmit AXE11000 | |
| iperf3 receive AXE11000 | |
| Chuwi Gamebook, R9 9955HX | |
| iperf3 transmit AXE11000 | |
| iperf3 receive AXE11000 | |
| iperf3 transmit AXE11000 6GHz | |
| iperf3 receive AXE11000 6GHz | |
| Medion Erazer Major 16 X1 MD62736 | |
| iperf3 transmit AXE11000 | |
| iperf3 receive AXE11000 | |
| Lenovo Legion 5 Pro 16IAX10H | |
| iperf3 transmit AXE11000 | |
| iperf3 receive AXE11000 | |
| MSI Vector 16 HX AI A2XWHG | |
| iperf3 transmit AXE11000 | |
| iperf3 receive AXE11000 | |
| Schenker XMG Pro 16 (E25) | |
| iperf3 transmit AXE11000 | |
| iperf3 receive AXE11000 | |


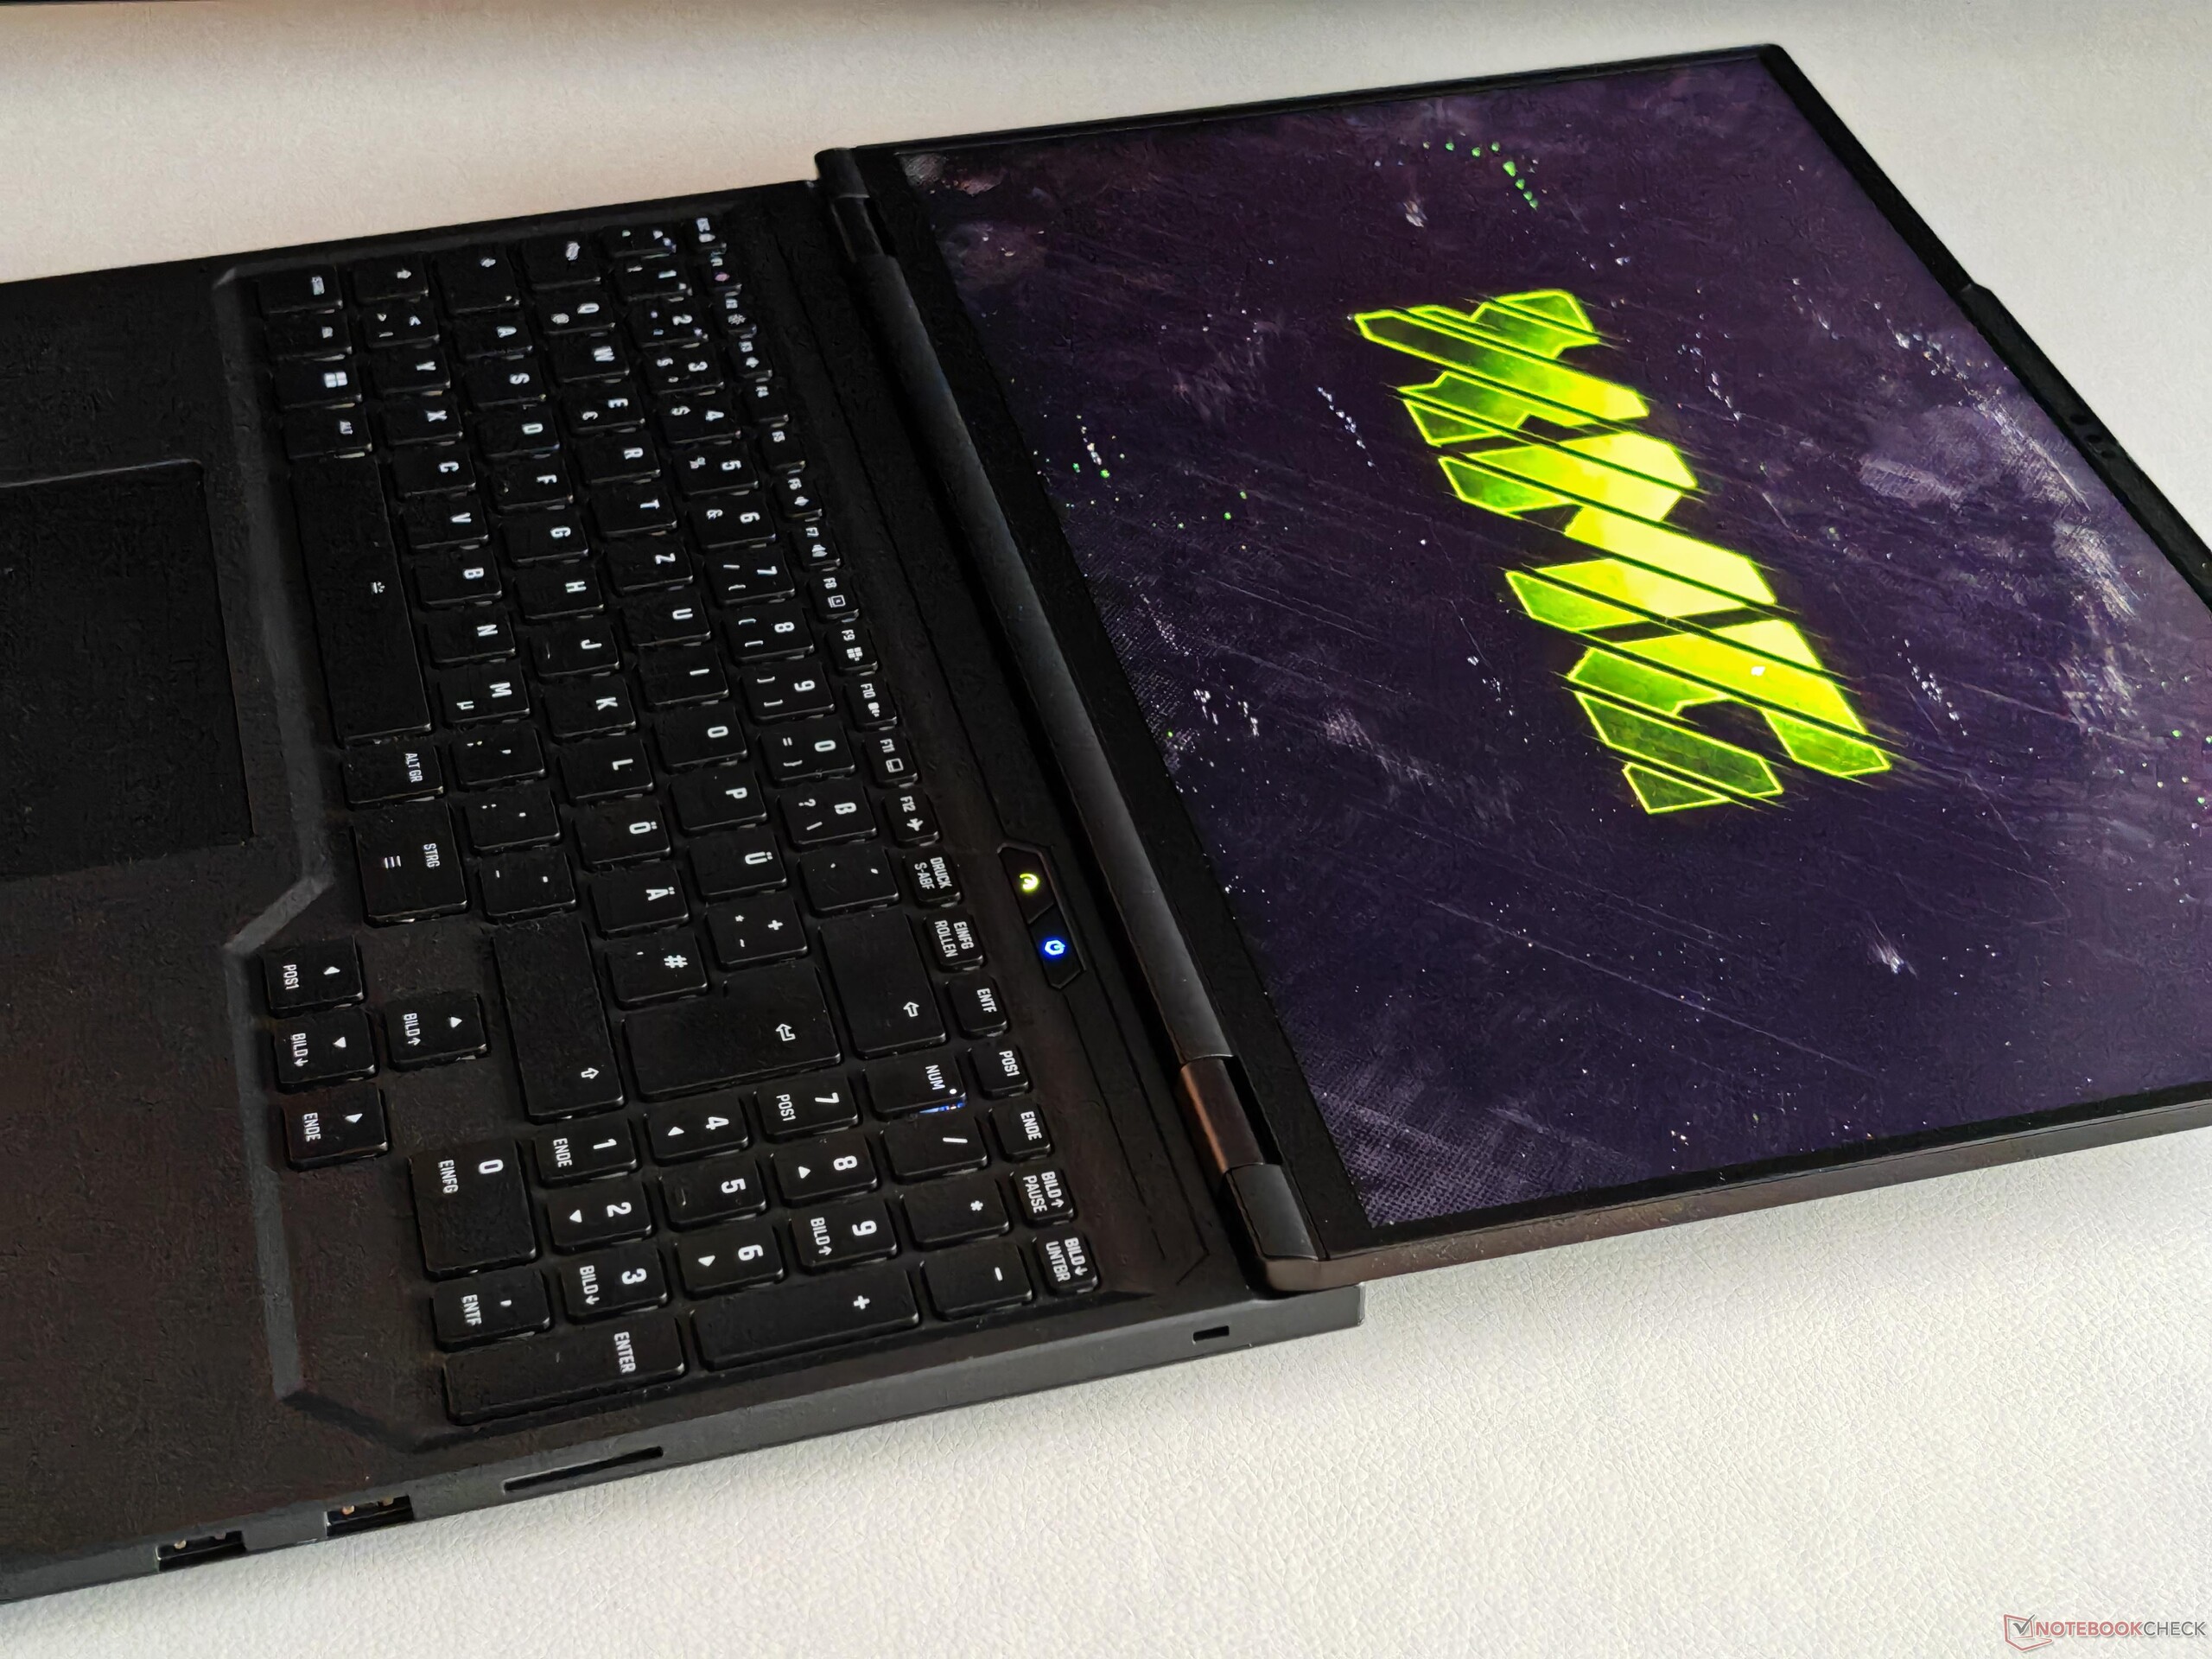
输入设备 - 带单键照明的键盘
我们已经从其他 XMG 型号中了解到这款键盘的按键背光功能,而 Apex 16 Max 上的背光功能也没有让我们失望。键程足够长,反馈精确,还有专用的数字键盘。点击板的表现也不错,不过下部区域的机械点击声有点大。


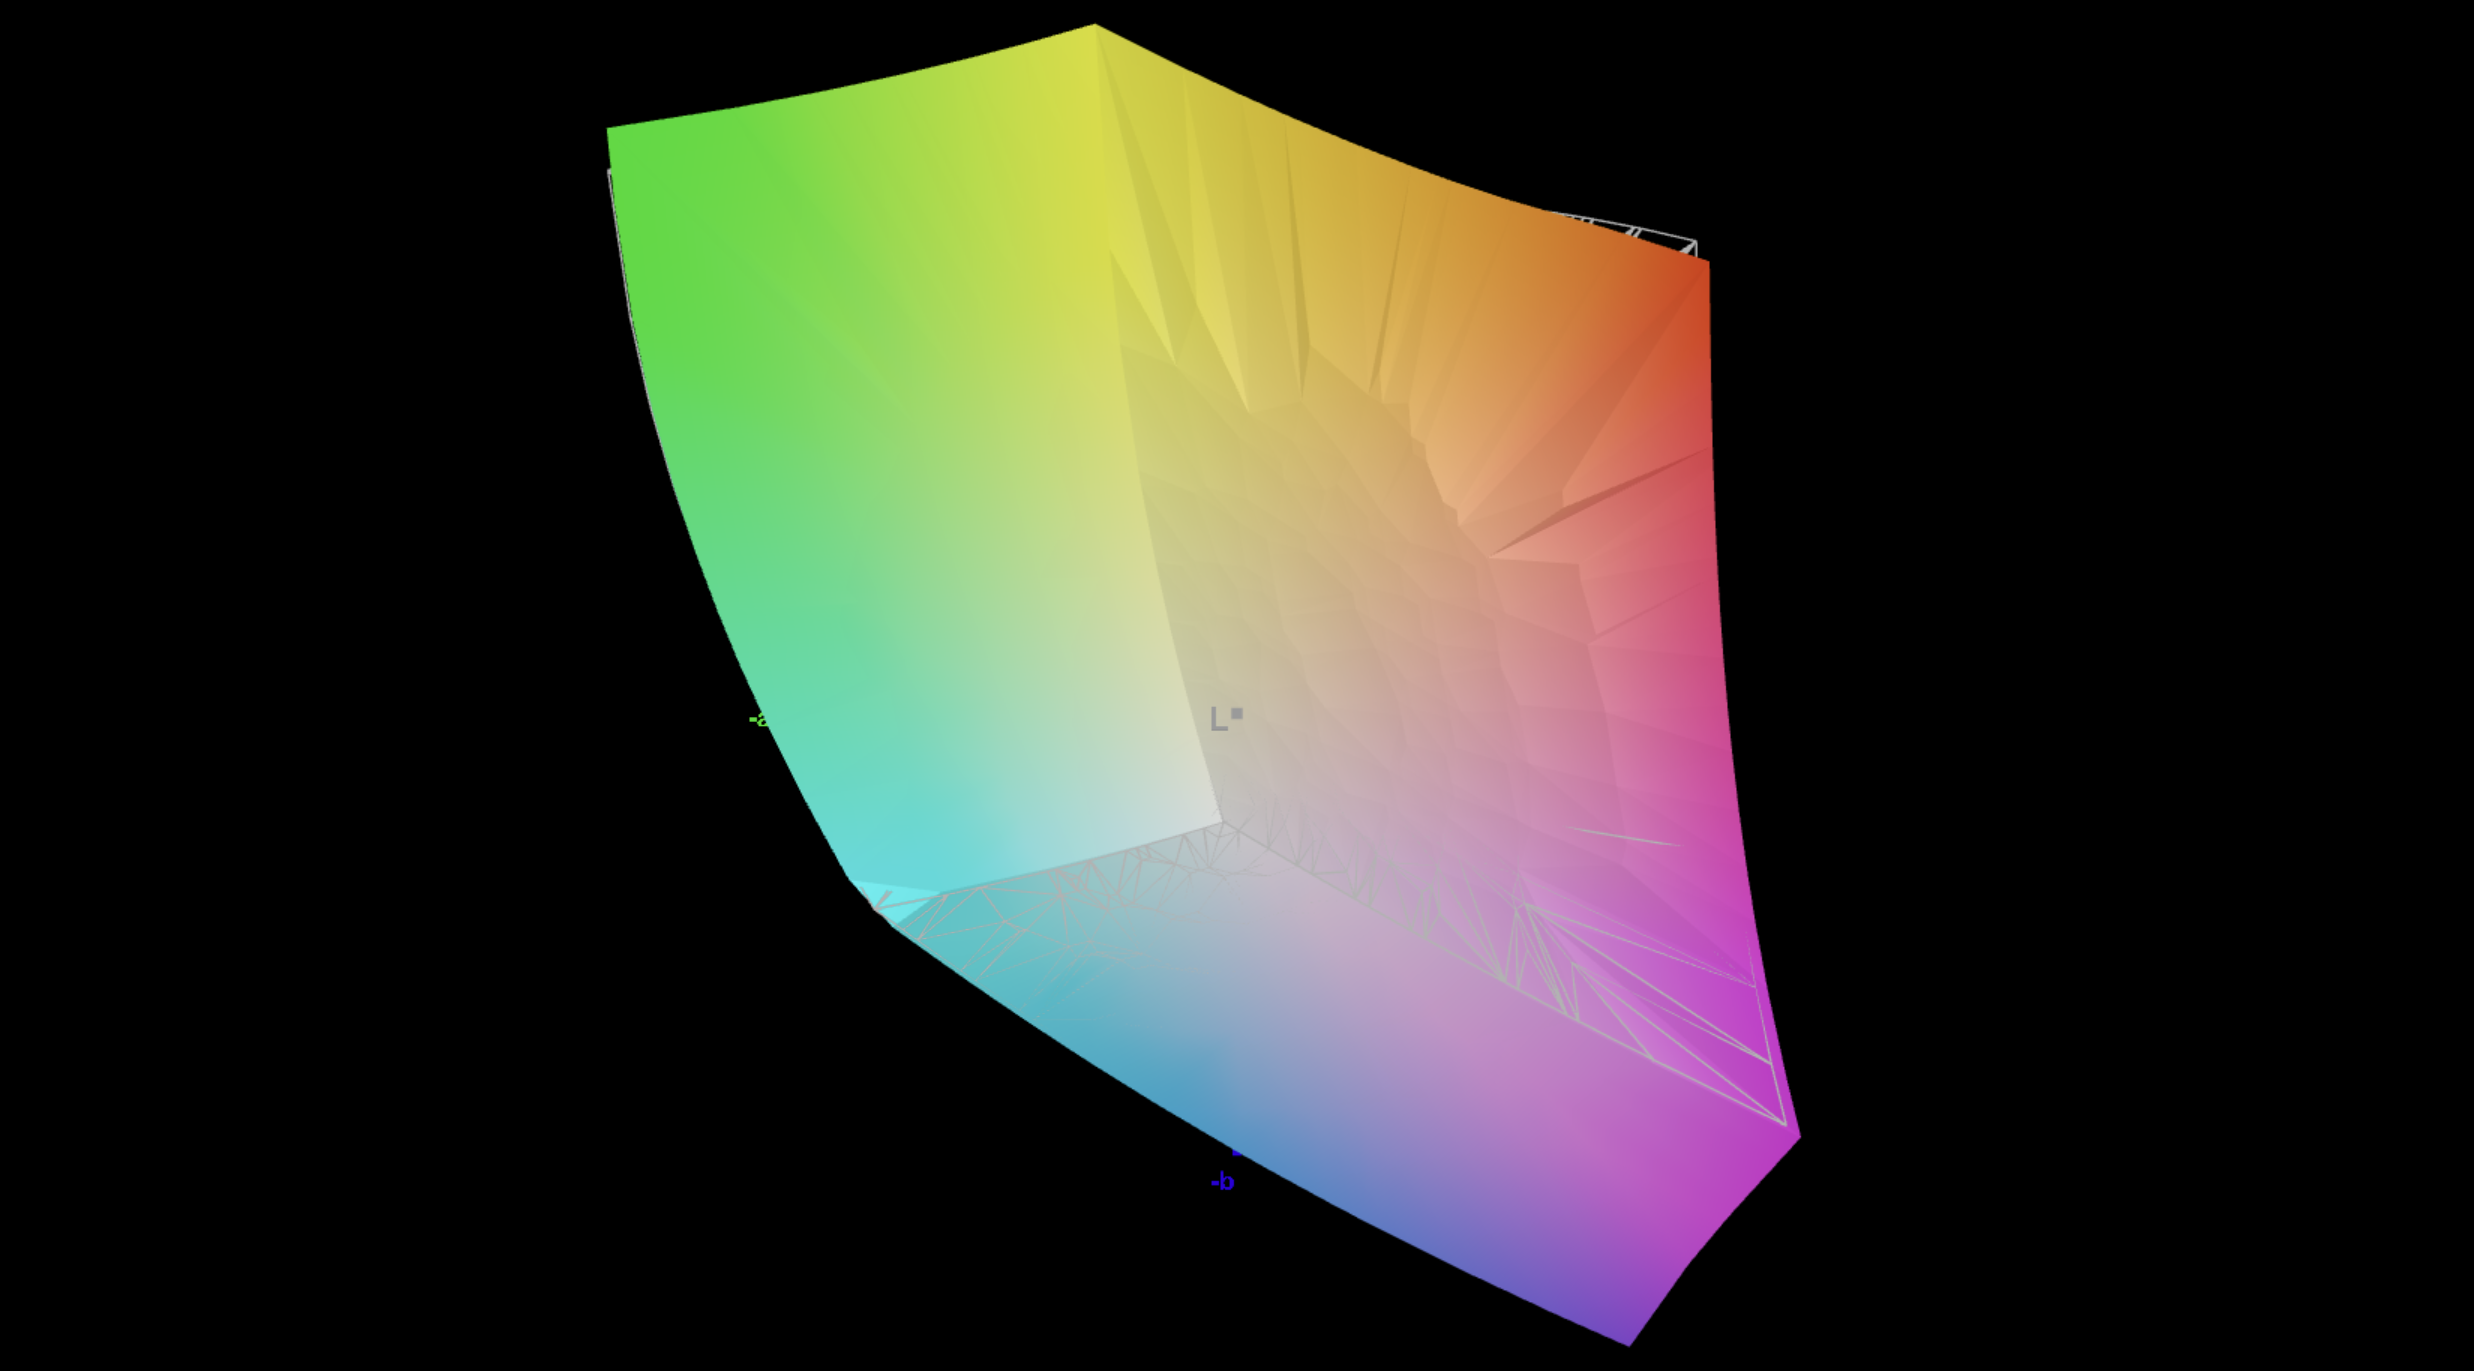
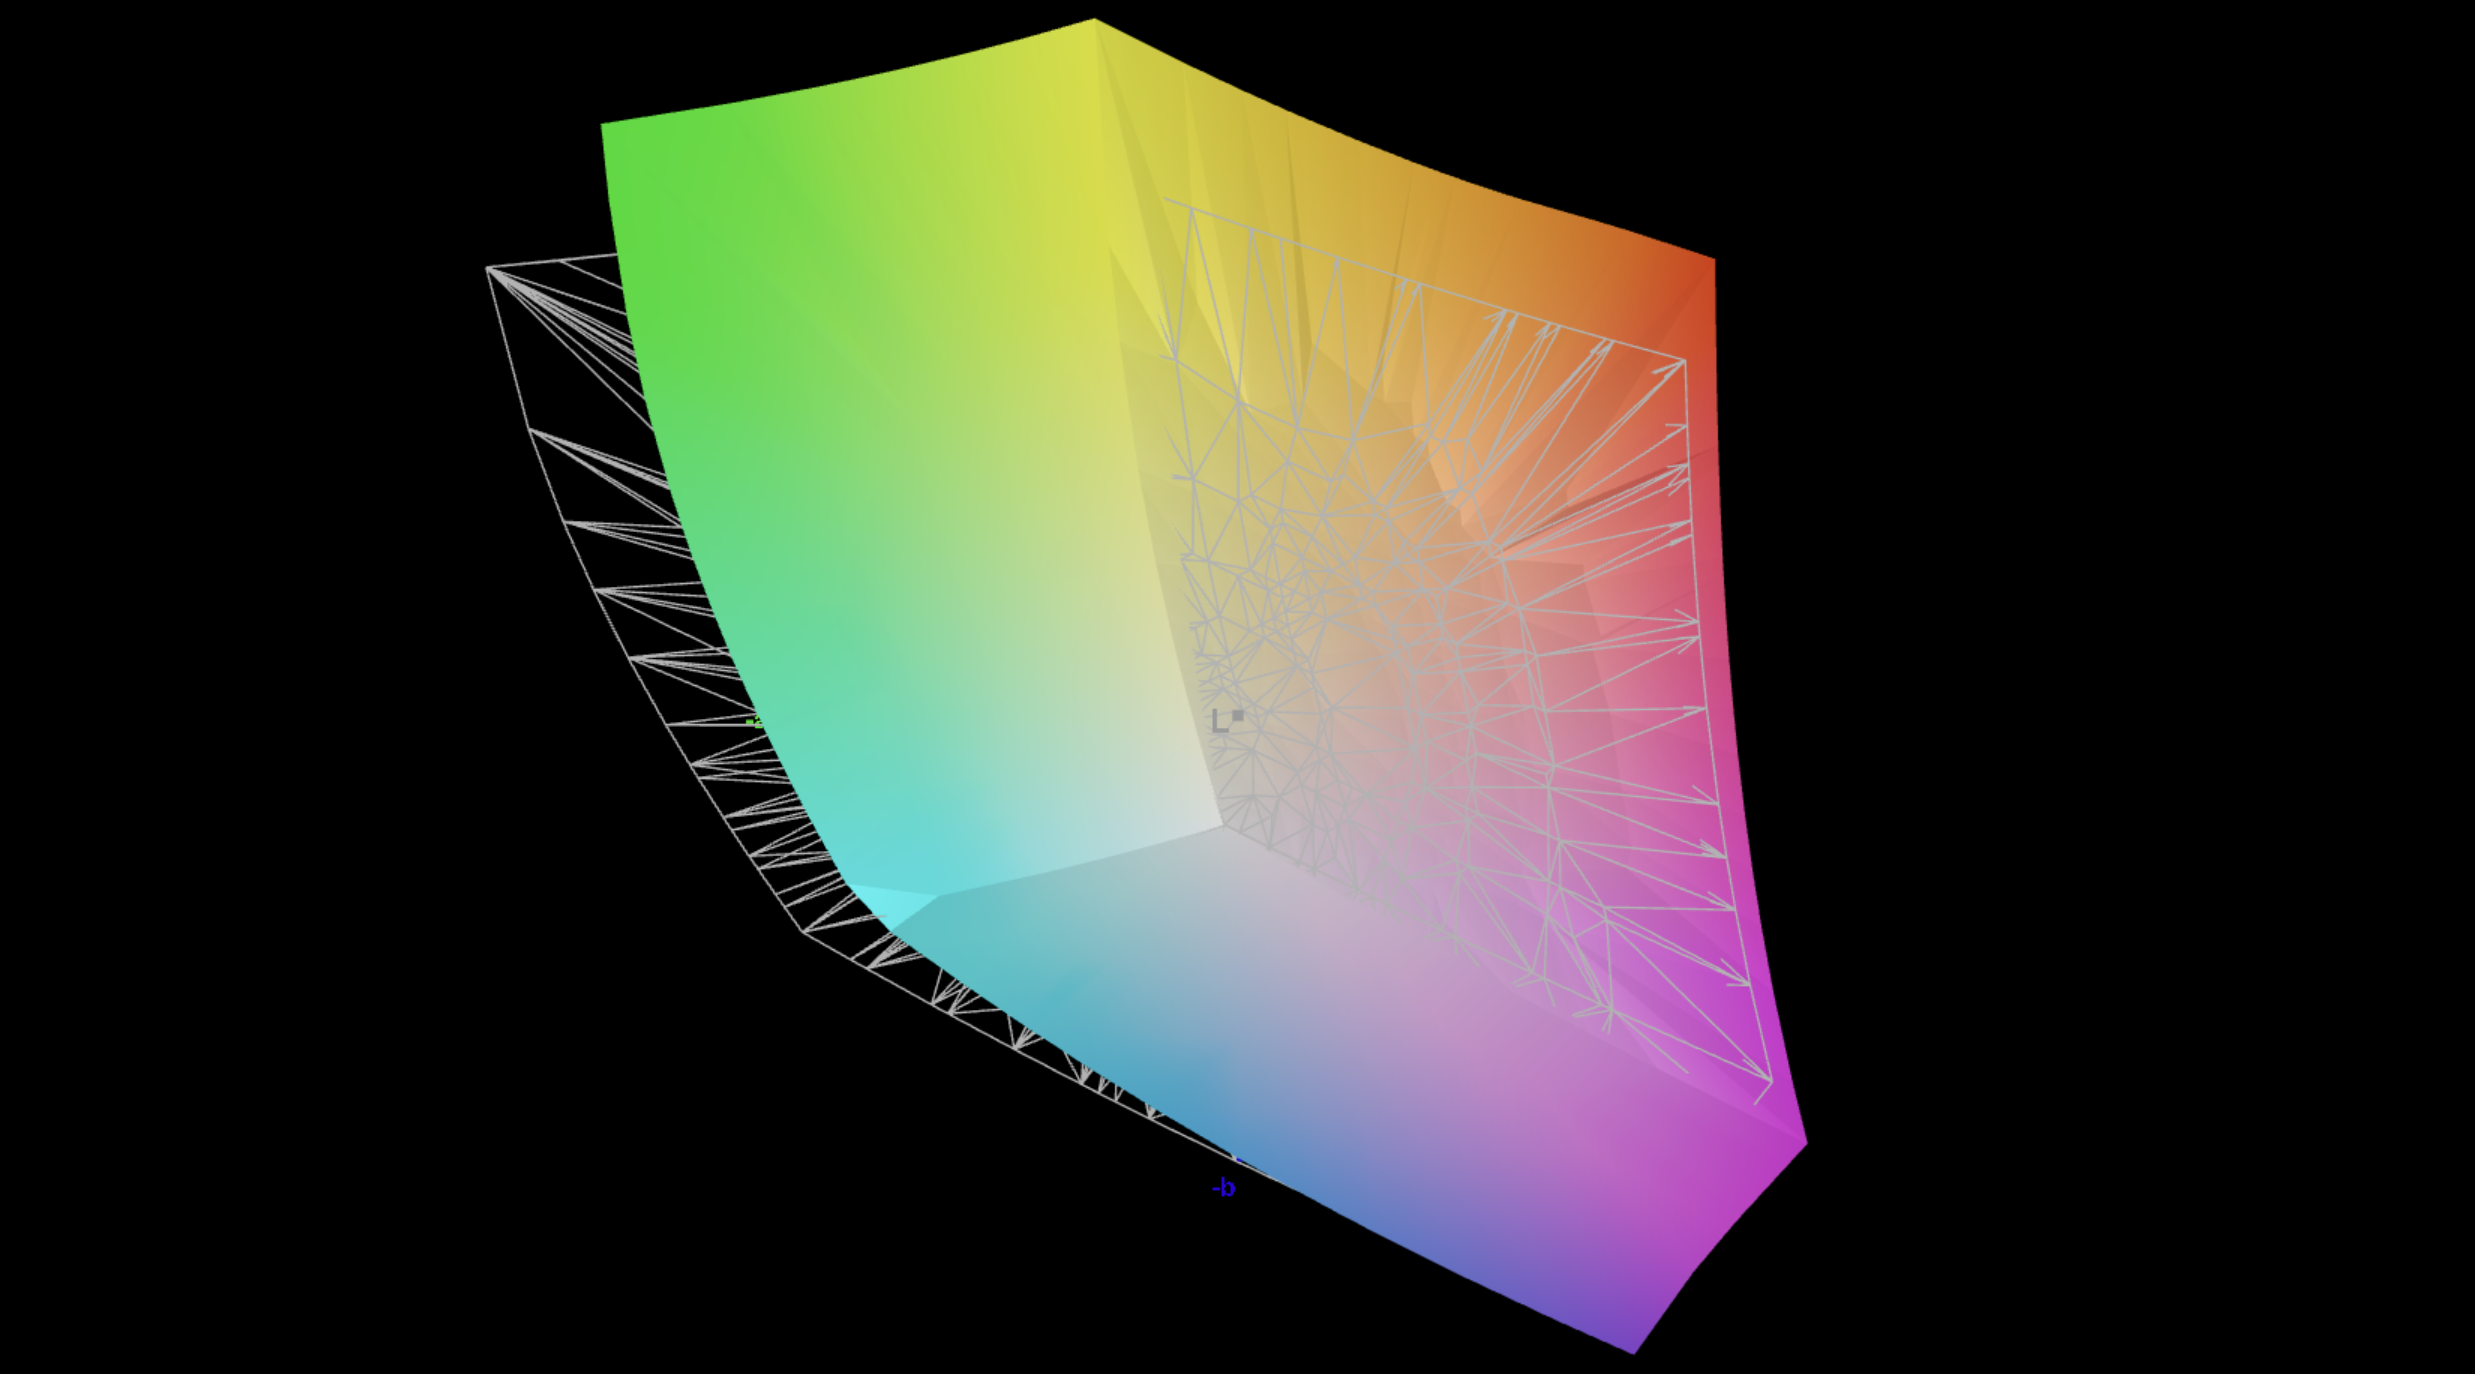
显示屏 - 1,000 cd/m² 的微型 LED 显示屏
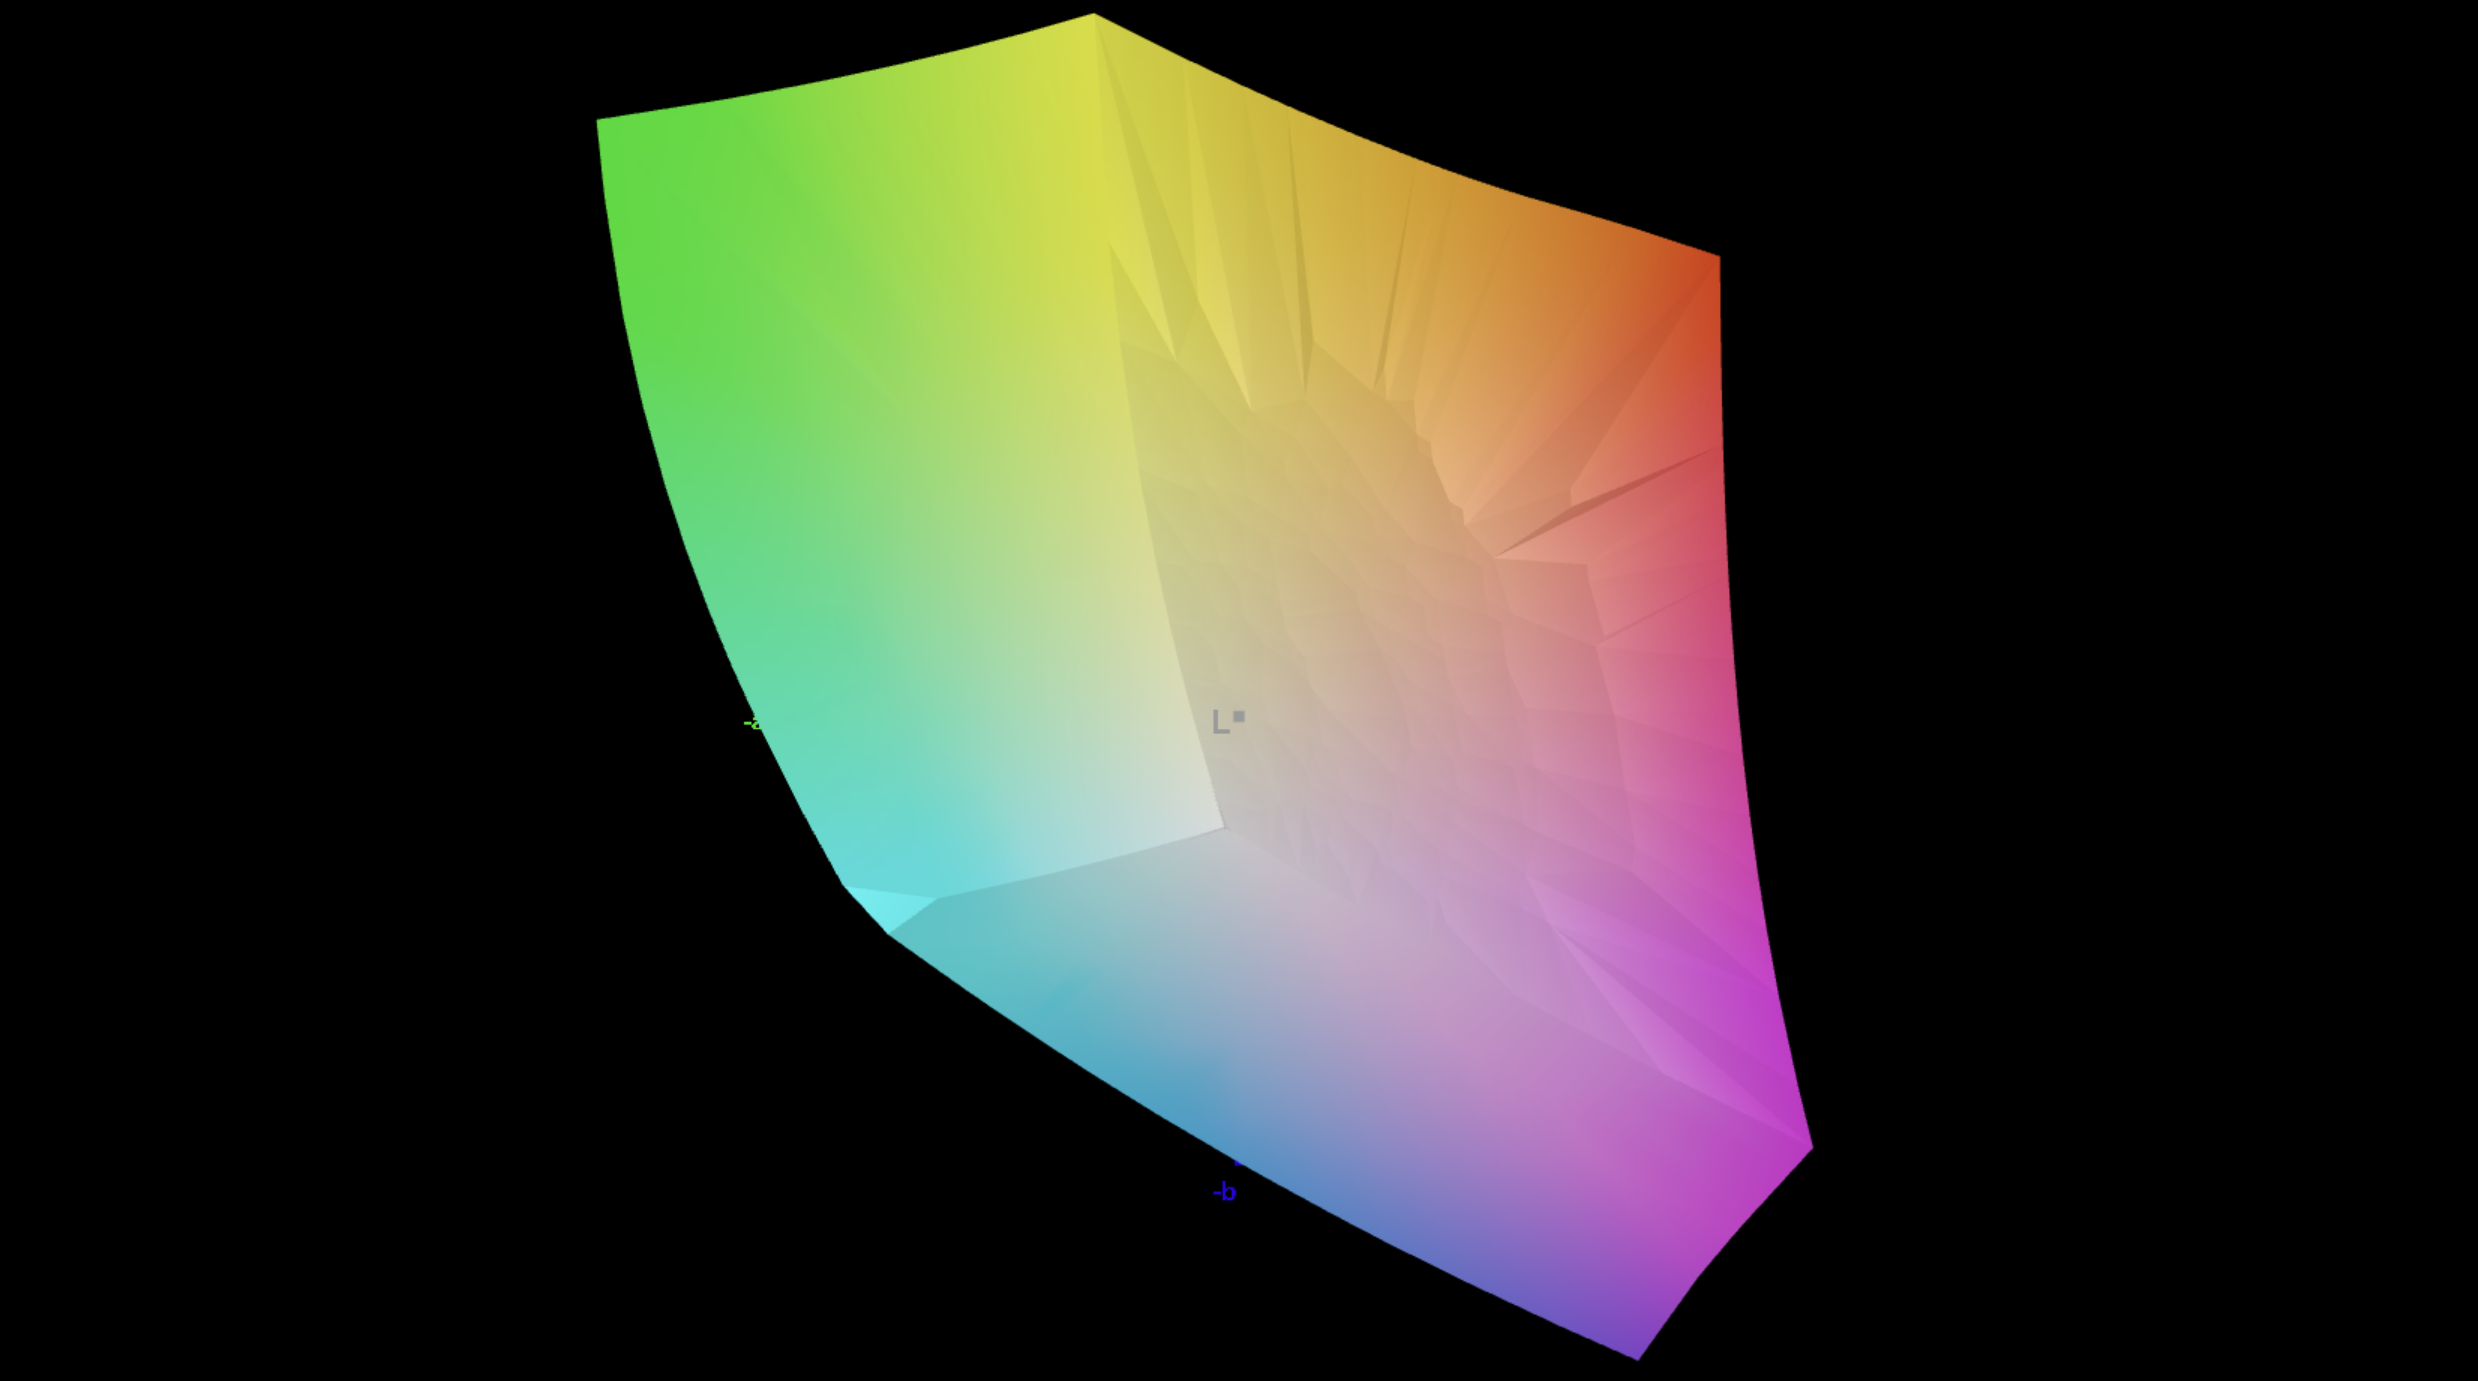
我们的测试设备配备了哑光 Mini-LED 面板(2,560 × 1,600 像素,16:10,300 Hz),我们已经从 XMG Neo 16 上了解到了这一点。 XMG Neo 16.图像质量非常出色,尤其是亮度(SDR 最高 752 cd/m²,HDR 最高 974 cd/m²),明显优于标准的 IPS 面板。可以禁用局部调光功能,这对照片编辑等工作非常有用。
不过,随机附带的色彩配置文件(P3 和 sRGB)并不理想,尽管在亮度较低时色彩准确度略有提高。我们自己的校准结果表明,仍有改进的余地。由于持续的 PWM 闪烁(尽管频率高达 20 kHz),响应时间很难测量,但总体而言,这是一款快速的 IPS 类型面板,我们在游戏时没有遇到任何问题。


| |||||||||||||||||||||||||
Brightness Distribution: 93 %
Center on Battery: 742 cd/m²
Contrast: 74200:1 (Black: 0.01 cd/m²)
ΔE ColorChecker Calman: 3 | ∀{0.5-29.43 Ø4.72}
calibrated: 1.2
ΔE Greyscale Calman: 3.6 | ∀{0.09-98 Ø4.97}
87.9% AdobeRGB 1998 (Argyll 3D)
100% sRGB (Argyll 3D)
99.7% Display P3 (Argyll 3D)
Gamma: 2.43
CCT: 6559 K
| Schenker XMG APEX 16 MAX NE160QDM-NM9, Mini-LED, 2560x1600, 16", 300 Hz | Acer Predator Helios Neo 16S AI PHN16S-71-94L9 Samsung ATNA60DL03-0, OLED, 2560x1600, 16", 240 Hz | Chuwi Gamebook, R9 9955HX BOE0D55, IPS, 2560x1600, 16", 300 Hz | Medion Erazer Major 16 X1 MD62736 NE160QDM-NZL (BOE0D55), IPS, 2560x1600, 16", 300 Hz | Lenovo Legion 5 Pro 16IAX10H ATNA60HS01-0 (Samsung SDC420A), OLED, 2560x1600, 16", 165 Hz | MSI Vector 16 HX AI A2XWHG B160QAN02.3 (AUO7DB2), IPS, 2560x1600, 16", 240 Hz | Schenker XMG Pro 16 (E25) NE160QDM-NZL, IPS, 2560x1600, 16", 300 Hz | |
|---|---|---|---|---|---|---|---|
| Display | 3% | -16% | -14% | 2% | -2% | -13% | |
| Display P3 Coverage (%) | 99.7 | 99.9 0% | 72.5 -27% | 73.2 -27% | 99.9 0% | 96.6 -3% | 74.7 -25% |
| sRGB Coverage (%) | 100 | 100 0% | 97.9 -2% | 99.8 0% | 100 0% | 99.8 0% | 99.8 0% |
| AdobeRGB 1998 Coverage (%) | 87.9 | 96.5 10% | 72.5 -18% | 73.9 -16% | 94.1 7% | 84.4 -4% | 75.4 -14% |
| Response Times | 77% | 39% | 52% | 85% | 65% | 49% | |
| Response Time Grey 50% / Grey 80% * (ms) | 17.4 ? | 0.2 ? 99% | 12.4 ? 29% | 10 ? 43% | 2 ? 89% | 4.3 ? 75% | 10.5 ? 40% |
| Response Time Black / White * (ms) | 13 ? | 0.25 ? 98% | 6.8 ? 48% | 5.2 ? 60% | 1.4 ? 89% | 6 ? 54% | 5.4 ? 58% |
| PWM Frequency (Hz) | 20253 ? | 960 | 1300 | ||||
| PWM Amplitude * (%) | 75 | 50 33% | 16.7 78% | ||||
| Screen | -42% | -557% | -553% | -18% | -485% | -587% | |
| Brightness middle (cd/m²) | 742 | 390 -47% | 576 -22% | 577 -22% | 518 -30% | 473 -36% | 538 -27% |
| Brightness (cd/m²) | 733 | 394 -46% | 545 -26% | 539 -26% | 522 -29% | 426 -42% | 508 -31% |
| Brightness Distribution (%) | 93 | 98 5% | 88 -5% | 85 -9% | 97 4% | 85 -9% | 88 -5% |
| Black Level * (cd/m²) | 0.01 | 0.04 -300% | 0.5 -4900% | 0.5 -4900% | 0.42 -4100% | 0.47 -4600% | |
| Contrast (:1) | 74200 | 9750 -87% | 1152 -98% | 1154 -98% | 1126 -98% | 1145 -98% | |
| Colorchecker dE 2000 * | 3 | 1.61 46% | 2.04 32% | 2.12 29% | 2.49 17% | 3.47 -16% | 1.9 37% |
| Colorchecker dE 2000 max. * | 4.3 | 3.49 19% | 3.56 17% | 3.32 23% | 5.25 -22% | 7.24 -68% | 4 7% |
| Colorchecker dE 2000 calibrated * | 1.2 | 1.59 -33% | 1.85 -54% | 1.33 -11% | 2.15 -79% | 1.36 -13% | |
| Greyscale dE 2000 * | 3.6 | 1.2 67% | 2.09 42% | 2.2 39% | 3.02 16% | 3.1 14% | 2.7 25% |
| Gamma | 2.43 91% | 2.235 98% | 2.3 96% | 2.123 104% | 2.37 93% | 2.486 88% | 2.24 98% |
| CCT | 6559 99% | 6580 99% | 6492 100% | 6457 101% | 6426 101% | 6832 95% | 7027 93% |
| Total Average (Program / Settings) | 13% /
-9% | -178% /
-356% | -172% /
-351% | 23% /
11% | -141% /
-303% | -184% /
-356% |
* ... smaller is better


Display Response Times
| ↔ Response Time Black to White | ||
|---|---|---|
| 13 ms ... rise ↗ and fall ↘ combined | ↗ 4.6 ms rise | 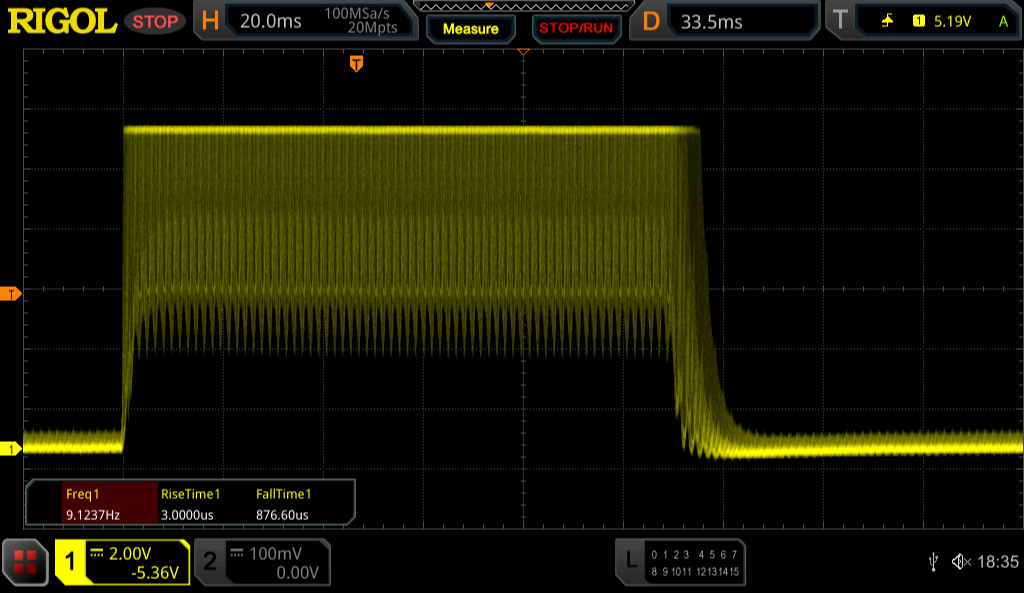 |
| ↘ 8.4 ms fall | ||
| The screen shows good response rates in our tests, but may be too slow for competitive gamers. In comparison, all tested devices range from 0.1 (minimum) to 240 (maximum) ms. » 33 % of all devices are better. This means that the measured response time is better than the average of all tested devices (19.8 ms). | ||
| ↔ Response Time 50% Grey to 80% Grey | ||
| 17.4 ms ... rise ↗ and fall ↘ combined | ↗ 8.4 ms rise | 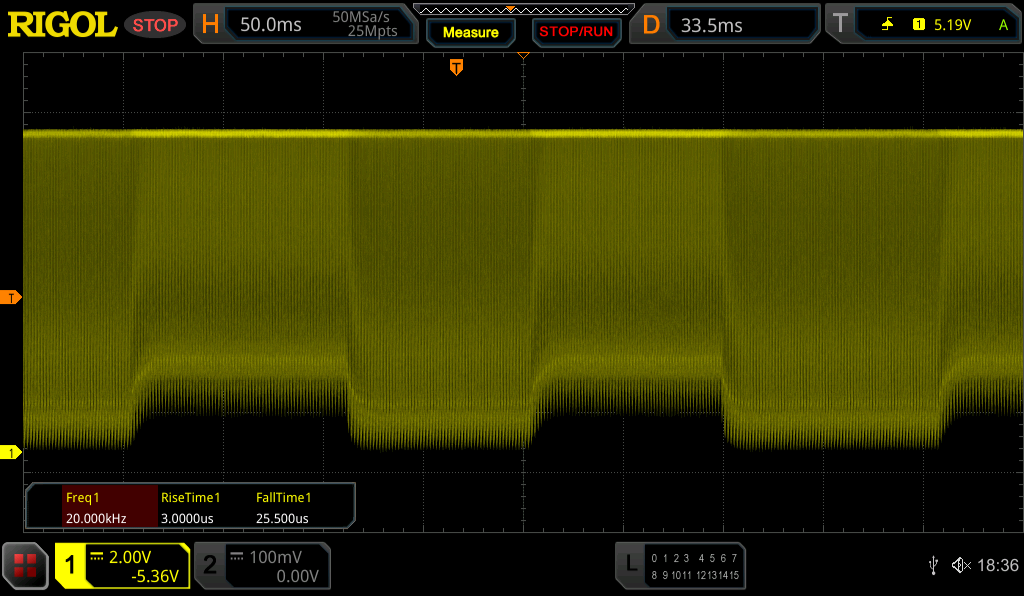 |
| ↘ 9 ms fall | ||
| The screen shows good response rates in our tests, but may be too slow for competitive gamers. In comparison, all tested devices range from 0.165 (minimum) to 636 (maximum) ms. » 32 % of all devices are better. This means that the measured response time is better than the average of all tested devices (31 ms). | ||
Screen Flickering / PWM (Pulse-Width Modulation)
| Screen flickering / PWM detected | 20253 Hz Amplitude: 75 % | ≤ 100 % brightness setting | 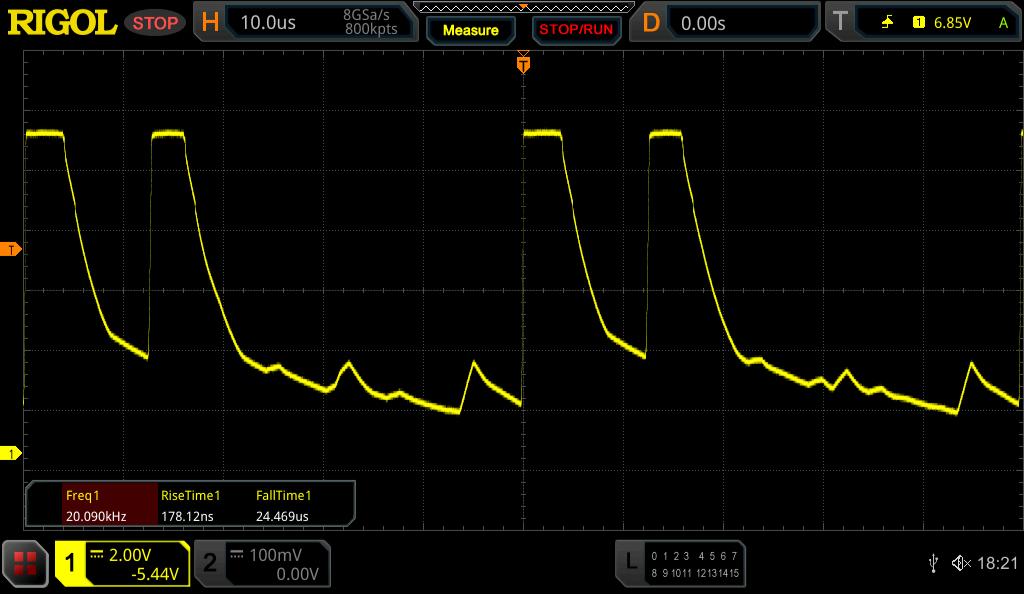 |
The display backlight flickers at 20253 Hz (worst case, e.g., utilizing PWM) Flickering detected at a brightness setting of 100 % and below. There should be no flickering or PWM above this brightness setting. The frequency of 20253 Hz is quite high, so most users sensitive to PWM should not notice any flickering. In comparison: 52 % of all tested devices do not use PWM to dim the display. If PWM was detected, an average of 7747 (minimum: 5 - maximum: 343500) Hz was measured. | |||


性能
测试条件
我们在超增压(正常)模式下进行了以下基准测试。使用电池供电时,"发烧友 "模式是可用的最高设置。
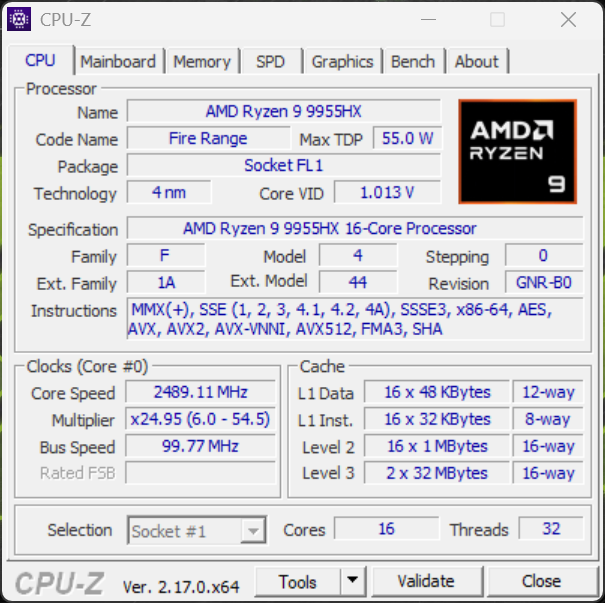
处理器
The AMD Ryzen 9 9955HX(Zen 5)是一款速度极快的移动处理器,功耗高达 135/130 瓦,性能非常稳定。例如,在我们的基准测试中,它的性能甚至超过了 英特尔酷睿至尊 9 275HX尽管英特尔芯片的功耗更高。不过,在电池供电(35 瓦)的情况下,多核性能会明显下降(-55%)。
Cinebench R15 多耐久性测试
Cinebench R23: Multi Core | Single Core
Cinebench R20: CPU (Multi Core) | CPU (Single Core)
Cinebench R15: CPU Multi 64Bit | CPU Single 64Bit
Blender: v2.79 BMW27 CPU
7-Zip 18.03: 7z b 4 | 7z b 4 -mmt1
Geekbench 6.7: Multi-Core | Single-Core
Geekbench 5.5: Multi-Core | Single-Core
HWBOT x265 Benchmark v2.2: 4k Preset
LibreOffice : 20 Documents To PDF
R Benchmark 2.5: Overall mean
| CPU Performance rating | |
| Average AMD Ryzen 9 9955HX | |
| Schenker XMG APEX 16 MAX | |
| Chuwi Gamebook, R9 9955HX | |
| Lenovo Legion 5 Pro 16IAX10H | |
| Schenker XMG Pro 16 (E25) | |
| Acer Predator Helios Neo 16S AI PHN16S-71-94L9 | |
| Medion Erazer Major 16 X1 MD62736 | |
| MSI Vector 16 HX AI A2XWHG | |
| Average of class Gaming | |
| Cinebench R23 / Multi Core | |
| Average AMD Ryzen 9 9955HX (35960 - 39690, n=9) | |
| Lenovo Legion 5 Pro 16IAX10H | |
| Schenker XMG Pro 16 (E25) | |
| Chuwi Gamebook, R9 9955HX | |
| Schenker XMG APEX 16 MAX | |
| Medion Erazer Major 16 X1 MD62736 | |
| Acer Predator Helios Neo 16S AI PHN16S-71-94L9 | |
| MSI Vector 16 HX AI A2XWHG | |
| Average of class Gaming (10488 - 40970, n=106, last 2 years) | |
| Cinebench R23 / Single Core | |
| Acer Predator Helios Neo 16S AI PHN16S-71-94L9 | |
| Lenovo Legion 5 Pro 16IAX10H | |
| Schenker XMG Pro 16 (E25) | |
| Chuwi Gamebook, R9 9955HX | |
| Schenker XMG APEX 16 MAX | |
| MSI Vector 16 HX AI A2XWHG | |
| Average AMD Ryzen 9 9955HX (1828 - 2183, n=9) | |
| Medion Erazer Major 16 X1 MD62736 | |
| Average of class Gaming (1166 - 2387, n=106, last 2 years) | |
| Cinebench R20 / CPU (Multi Core) | |
| Lenovo Legion 5 Pro 16IAX10H | |
| Average AMD Ryzen 9 9955HX (13963 - 15524, n=9) | |
| Schenker XMG Pro 16 (E25) | |
| Chuwi Gamebook, R9 9955HX | |
| Schenker XMG APEX 16 MAX | |
| Acer Predator Helios Neo 16S AI PHN16S-71-94L9 | |
| Medion Erazer Major 16 X1 MD62736 | |
| MSI Vector 16 HX AI A2XWHG | |
| Average of class Gaming (4029 - 16108, n=105, last 2 years) | |
| Cinebench R20 / CPU (Single Core) | |
| Acer Predator Helios Neo 16S AI PHN16S-71-94L9 | |
| Lenovo Legion 5 Pro 16IAX10H | |
| Schenker XMG Pro 16 (E25) | |
| Schenker XMG APEX 16 MAX | |
| Chuwi Gamebook, R9 9955HX | |
| Average AMD Ryzen 9 9955HX (819 - 856, n=9) | |
| MSI Vector 16 HX AI A2XWHG | |
| Medion Erazer Major 16 X1 MD62736 | |
| Average of class Gaming (442 - 904, n=105, last 2 years) | |
| Cinebench R15 / CPU Multi 64Bit | |
| Lenovo Legion 5 Pro 16IAX10H | |
| Average AMD Ryzen 9 9955HX (5624 - 6103, n=9) | |
| Chuwi Gamebook, R9 9955HX | |
| Schenker XMG APEX 16 MAX | |
| Schenker XMG Pro 16 (E25) | |
| Medion Erazer Major 16 X1 MD62736 | |
| Acer Predator Helios Neo 16S AI PHN16S-71-94L9 | |
| MSI Vector 16 HX AI A2XWHG | |
| Average of class Gaming (1578 - 6271, n=104, last 2 years) | |
| Cinebench R15 / CPU Single 64Bit | |
| Chuwi Gamebook, R9 9955HX | |
| Schenker XMG APEX 16 MAX | |
| Schenker XMG Pro 16 (E25) | |
| Acer Predator Helios Neo 16S AI PHN16S-71-94L9 | |
| Average AMD Ryzen 9 9955HX (320 - 338, n=9) | |
| Lenovo Legion 5 Pro 16IAX10H | |
| MSI Vector 16 HX AI A2XWHG | |
| Medion Erazer Major 16 X1 MD62736 | |
| Average of class Gaming (188.8 - 344, n=105, last 2 years) | |
| Blender / v2.79 BMW27 CPU | |
| Average of class Gaming (80 - 330, n=103, last 2 years) | |
| MSI Vector 16 HX AI A2XWHG | |
| Acer Predator Helios Neo 16S AI PHN16S-71-94L9 | |
| Medion Erazer Major 16 X1 MD62736 | |
| Lenovo Legion 5 Pro 16IAX10H | |
| Schenker XMG Pro 16 (E25) | |
| Chuwi Gamebook, R9 9955HX | |
| Schenker XMG APEX 16 MAX | |
| Average AMD Ryzen 9 9955HX (80 - 91, n=9) | |
| 7-Zip 18.03 / 7z b 4 | |
| Schenker XMG APEX 16 MAX | |
| Average AMD Ryzen 9 9955HX (132435 - 144064, n=9) | |
| Chuwi Gamebook, R9 9955HX | |
| Schenker XMG Pro 16 (E25) | |
| Lenovo Legion 5 Pro 16IAX10H | |
| Acer Predator Helios Neo 16S AI PHN16S-71-94L9 | |
| Medion Erazer Major 16 X1 MD62736 | |
| Average of class Gaming (33491 - 148086, n=104, last 2 years) | |
| MSI Vector 16 HX AI A2XWHG | |
| 7-Zip 18.03 / 7z b 4 -mmt1 | |
| Schenker XMG APEX 16 MAX | |
| Average AMD Ryzen 9 9955HX (7061 - 7462, n=9) | |
| Chuwi Gamebook, R9 9955HX | |
| Schenker XMG Pro 16 (E25) | |
| Acer Predator Helios Neo 16S AI PHN16S-71-94L9 | |
| Lenovo Legion 5 Pro 16IAX10H | |
| Medion Erazer Major 16 X1 MD62736 | |
| Average of class Gaming (4199 - 7436, n=104, last 2 years) | |
| MSI Vector 16 HX AI A2XWHG | |
| Geekbench 6.7 / Multi-Core | |
| Schenker XMG Pro 16 (E25) | |
| Lenovo Legion 5 Pro 16IAX10H | |
| Schenker XMG APEX 16 MAX | |
| Acer Predator Helios Neo 16S AI PHN16S-71-94L9 | |
| Chuwi Gamebook, R9 9955HX | |
| Average AMD Ryzen 9 9955HX (16313 - 19725, n=9) | |
| Medion Erazer Major 16 X1 MD62736 | |
| MSI Vector 16 HX AI A2XWHG | |
| Average of class Gaming (6625 - 22104, n=105, last 2 years) | |
| Geekbench 6.7 / Single-Core | |
| Schenker XMG APEX 16 MAX | |
| Average AMD Ryzen 9 9955HX (3156 - 3259, n=9) | |
| Chuwi Gamebook, R9 9955HX | |
| Acer Predator Helios Neo 16S AI PHN16S-71-94L9 | |
| Schenker XMG Pro 16 (E25) | |
| Lenovo Legion 5 Pro 16IAX10H | |
| Medion Erazer Major 16 X1 MD62736 | |
| MSI Vector 16 HX AI A2XWHG | |
| Average of class Gaming (1490 - 3259, n=105, last 2 years) | |
| Geekbench 5.5 / Multi-Core | |
| Schenker XMG Pro 16 (E25) | |
| Schenker XMG APEX 16 MAX | |
| Lenovo Legion 5 Pro 16IAX10H | |
| Acer Predator Helios Neo 16S AI PHN16S-71-94L9 | |
| Average AMD Ryzen 9 9955HX (20576 - 22716, n=9) | |
| Chuwi Gamebook, R9 9955HX | |
| Medion Erazer Major 16 X1 MD62736 | |
| MSI Vector 16 HX AI A2XWHG | |
| Average of class Gaming (6460 - 27010, n=104, last 2 years) | |
| Geekbench 5.5 / Single-Core | |
| Schenker XMG APEX 16 MAX | |
| Average AMD Ryzen 9 9955HX (2307 - 2474, n=9) | |
| Chuwi Gamebook, R9 9955HX | |
| Schenker XMG Pro 16 (E25) | |
| Lenovo Legion 5 Pro 16IAX10H | |
| Acer Predator Helios Neo 16S AI PHN16S-71-94L9 | |
| MSI Vector 16 HX AI A2XWHG | |
| Medion Erazer Major 16 X1 MD62736 | |
| Average of class Gaming (986 - 2474, n=104, last 2 years) | |
| HWBOT x265 Benchmark v2.2 / 4k Preset | |
| Average AMD Ryzen 9 9955HX (38.9 - 43, n=9) | |
| Chuwi Gamebook, R9 9955HX | |
| Schenker XMG APEX 16 MAX | |
| Schenker XMG Pro 16 (E25) | |
| Lenovo Legion 5 Pro 16IAX10H | |
| Medion Erazer Major 16 X1 MD62736 | |
| Acer Predator Helios Neo 16S AI PHN16S-71-94L9 | |
| MSI Vector 16 HX AI A2XWHG | |
| Average of class Gaming (11.5 - 44.3, n=104, last 2 years) | |
| LibreOffice / 20 Documents To PDF | |
| Average of class Gaming (33.2 - 88.8, n=104, last 2 years) | |
| Schenker XMG Pro 16 (E25) | |
| Schenker XMG APEX 16 MAX | |
| Average AMD Ryzen 9 9955HX (42.2 - 52.4, n=9) | |
| Chuwi Gamebook, R9 9955HX | |
| Acer Predator Helios Neo 16S AI PHN16S-71-94L9 | |
| Medion Erazer Major 16 X1 MD62736 | |
| MSI Vector 16 HX AI A2XWHG | |
| Lenovo Legion 5 Pro 16IAX10H | |
| R Benchmark 2.5 / Overall mean | |
| Average of class Gaming (0.3439 - 0.759, n=105, last 2 years) | |
| MSI Vector 16 HX AI A2XWHG | |
| Medion Erazer Major 16 X1 MD62736 | |
| Lenovo Legion 5 Pro 16IAX10H | |
| Schenker XMG Pro 16 (E25) | |
| Acer Predator Helios Neo 16S AI PHN16S-71-94L9 | |
| Chuwi Gamebook, R9 9955HX | |
| Average AMD Ryzen 9 9955HX (0.3439 - 0.3737, n=9) | |
| Schenker XMG APEX 16 MAX | |
* ... smaller is better
AIDA64: FP32 Ray-Trace | FPU Julia | CPU SHA3 | CPU Queen | FPU SinJulia | FPU Mandel | CPU AES | CPU ZLib | FP64 Ray-Trace | CPU PhotoWorxx
| Performance rating | |
| Schenker XMG APEX 16 MAX | |
| Average AMD Ryzen 9 9955HX | |
| Chuwi Gamebook, R9 9955HX | |
| Lenovo Legion 5 Pro 16IAX10H | |
| Schenker XMG Pro 16 (E25) | |
| Medion Erazer Major 16 X1 MD62736 | |
| Acer Predator Helios Neo 16S AI PHN16S-71-94L9 | |
| Average of class Gaming | |
| MSI Vector 16 HX AI A2XWHG | |
| AIDA64 / FP32 Ray-Trace | |
| Schenker XMG APEX 16 MAX | |
| Chuwi Gamebook, R9 9955HX | |
| Average AMD Ryzen 9 9955HX (66596 - 85542, n=9) | |
| Lenovo Legion 5 Pro 16IAX10H | |
| Schenker XMG Pro 16 (E25) | |
| Medion Erazer Major 16 X1 MD62736 | |
| Average of class Gaming (10227 - 85542, n=103, last 2 years) | |
| Acer Predator Helios Neo 16S AI PHN16S-71-94L9 | |
| MSI Vector 16 HX AI A2XWHG | |
| AIDA64 / FPU Julia | |
| Schenker XMG APEX 16 MAX | |
| Average AMD Ryzen 9 9955HX (191535 - 232031, n=9) | |
| Chuwi Gamebook, R9 9955HX | |
| Lenovo Legion 5 Pro 16IAX10H | |
| Schenker XMG Pro 16 (E25) | |
| Medion Erazer Major 16 X1 MD62736 | |
| Acer Predator Helios Neo 16S AI PHN16S-71-94L9 | |
| MSI Vector 16 HX AI A2XWHG | |
| Average of class Gaming (51376 - 238426, n=103, last 2 years) | |
| AIDA64 / CPU SHA3 | |
| Schenker XMG APEX 16 MAX | |
| Average AMD Ryzen 9 9955HX (8489 - 9780, n=9) | |
| Chuwi Gamebook, R9 9955HX | |
| Schenker XMG Pro 16 (E25) | |
| Lenovo Legion 5 Pro 16IAX10H | |
| Medion Erazer Major 16 X1 MD62736 | |
| Acer Predator Helios Neo 16S AI PHN16S-71-94L9 | |
| MSI Vector 16 HX AI A2XWHG | |
| Average of class Gaming (2180 - 9817, n=103, last 2 years) | |
| AIDA64 / CPU Queen | |
| Average AMD Ryzen 9 9955HX (153027 - 164154, n=9) | |
| Schenker XMG APEX 16 MAX | |
| Chuwi Gamebook, R9 9955HX | |
| Lenovo Legion 5 Pro 16IAX10H | |
| Schenker XMG Pro 16 (E25) | |
| Medion Erazer Major 16 X1 MD62736 | |
| Acer Predator Helios Neo 16S AI PHN16S-71-94L9 | |
| Average of class Gaming (49785 - 173351, n=89, last 2 years) | |
| MSI Vector 16 HX AI A2XWHG | |
| AIDA64 / FPU SinJulia | |
| Schenker XMG APEX 16 MAX | |
| Average AMD Ryzen 9 9955HX (29876 - 32647, n=9) | |
| Chuwi Gamebook, R9 9955HX | |
| Average of class Gaming (4424 - 33636, n=103, last 2 years) | |
| Schenker XMG Pro 16 (E25) | |
| Lenovo Legion 5 Pro 16IAX10H | |
| Medion Erazer Major 16 X1 MD62736 | |
| Acer Predator Helios Neo 16S AI PHN16S-71-94L9 | |
| MSI Vector 16 HX AI A2XWHG | |
| AIDA64 / FPU Mandel | |
| Schenker XMG APEX 16 MAX | |
| Average AMD Ryzen 9 9955HX (101131 - 128721, n=9) | |
| Chuwi Gamebook, R9 9955HX | |
| Schenker XMG Pro 16 (E25) | |
| Lenovo Legion 5 Pro 16IAX10H | |
| Medion Erazer Major 16 X1 MD62736 | |
| Acer Predator Helios Neo 16S AI PHN16S-71-94L9 | |
| MSI Vector 16 HX AI A2XWHG | |
| Average of class Gaming (25115 - 128721, n=103, last 2 years) | |
| AIDA64 / CPU AES | |
| Schenker XMG APEX 16 MAX | |
| Average AMD Ryzen 9 9955HX (146979 - 218385, n=9) | |
| Chuwi Gamebook, R9 9955HX | |
| Lenovo Legion 5 Pro 16IAX10H | |
| Schenker XMG Pro 16 (E25) | |
| Medion Erazer Major 16 X1 MD62736 | |
| Average of class Gaming (39258 - 247074, n=103, last 2 years) | |
| Acer Predator Helios Neo 16S AI PHN16S-71-94L9 | |
| MSI Vector 16 HX AI A2XWHG | |
| AIDA64 / CPU ZLib | |
| Average AMD Ryzen 9 9955HX (2186 - 2531, n=9) | |
| Schenker XMG APEX 16 MAX | |
| Chuwi Gamebook, R9 9955HX | |
| Lenovo Legion 5 Pro 16IAX10H | |
| Schenker XMG Pro 16 (E25) | |
| Medion Erazer Major 16 X1 MD62736 | |
| Acer Predator Helios Neo 16S AI PHN16S-71-94L9 | |
| Average of class Gaming (574 - 2531, n=103, last 2 years) | |
| MSI Vector 16 HX AI A2XWHG | |
| AIDA64 / FP64 Ray-Trace | |
| Schenker XMG APEX 16 MAX | |
| Chuwi Gamebook, R9 9955HX | |
| Average AMD Ryzen 9 9955HX (35252 - 45446, n=9) | |
| Lenovo Legion 5 Pro 16IAX10H | |
| Schenker XMG Pro 16 (E25) | |
| Medion Erazer Major 16 X1 MD62736 | |
| Average of class Gaming (5509 - 45446, n=103, last 2 years) | |
| Acer Predator Helios Neo 16S AI PHN16S-71-94L9 | |
| MSI Vector 16 HX AI A2XWHG | |
| AIDA64 / CPU PhotoWorxx | |
| Acer Predator Helios Neo 16S AI PHN16S-71-94L9 | |
| Schenker XMG Pro 16 (E25) | |
| Medion Erazer Major 16 X1 MD62736 | |
| Lenovo Legion 5 Pro 16IAX10H | |
| Average of class Gaming (12271 - 89891, n=103, last 2 years) | |
| Schenker XMG APEX 16 MAX | |
| Chuwi Gamebook, R9 9955HX | |
| Average AMD Ryzen 9 9955HX (35974 - 42495, n=9) | |
| MSI Vector 16 HX AI A2XWHG | |
系统性能
不出所料,系统性能非常出色,基准测试结果也非常好。
PCMark 10: Score | Essentials | Productivity | Digital Content Creation
CrossMark: Overall | Productivity | Creativity | Responsiveness
WebXPRT 3: Overall
WebXPRT 4: Overall
Mozilla Kraken 1.1: Total
| Performance rating | |
| Lenovo Legion 5 Pro 16IAX10H | |
| Chuwi Gamebook, R9 9955HX | |
| Average AMD Ryzen 9 9955HX, NVIDIA GeForce RTX 5070 Ti Laptop | |
| Schenker XMG APEX 16 MAX | |
| Schenker XMG Pro 16 (E25) | |
| Acer Predator Helios Neo 16S AI PHN16S-71-94L9 | |
| Medion Erazer Major 16 X1 MD62736 | |
| Average of class Gaming | |
| MSI Vector 16 HX AI A2XWHG | |
| PCMark 10 / Score | |
| Schenker XMG APEX 16 MAX | |
| Average AMD Ryzen 9 9955HX, NVIDIA GeForce RTX 5070 Ti Laptop (9208 - 10060, n=3) | |
| Chuwi Gamebook, R9 9955HX | |
| Schenker XMG Pro 16 (E25) | |
| Average of class Gaming (5828 - 11730, n=92, last 2 years) | |
| Acer Predator Helios Neo 16S AI PHN16S-71-94L9 | |
| Lenovo Legion 5 Pro 16IAX10H | |
| Medion Erazer Major 16 X1 MD62736 | |
| MSI Vector 16 HX AI A2XWHG | |
| PCMark 10 / Essentials | |
| Schenker XMG APEX 16 MAX | |
| Average AMD Ryzen 9 9955HX, NVIDIA GeForce RTX 5070 Ti Laptop (11178 - 11719, n=3) | |
| Schenker XMG Pro 16 (E25) | |
| Chuwi Gamebook, R9 9955HX | |
| Acer Predator Helios Neo 16S AI PHN16S-71-94L9 | |
| Medion Erazer Major 16 X1 MD62736 | |
| Lenovo Legion 5 Pro 16IAX10H | |
| MSI Vector 16 HX AI A2XWHG | |
| Average of class Gaming (8810 - 11935, n=96, last 2 years) | |
| PCMark 10 / Productivity | |
| Schenker XMG APEX 16 MAX | |
| Average AMD Ryzen 9 9955HX, NVIDIA GeForce RTX 5070 Ti Laptop (10734 - 16314, n=3) | |
| Average of class Gaming (6845 - 21327, n=94, last 2 years) | |
| Chuwi Gamebook, R9 9955HX | |
| Acer Predator Helios Neo 16S AI PHN16S-71-94L9 | |
| Lenovo Legion 5 Pro 16IAX10H | |
| Schenker XMG Pro 16 (E25) | |
| MSI Vector 16 HX AI A2XWHG | |
| Medion Erazer Major 16 X1 MD62736 | |
| PCMark 10 / Digital Content Creation | |
| Chuwi Gamebook, R9 9955HX | |
| Average AMD Ryzen 9 9955HX, NVIDIA GeForce RTX 5070 Ti Laptop (14454 - 18192, n=3) | |
| Schenker XMG Pro 16 (E25) | |
| Lenovo Legion 5 Pro 16IAX10H | |
| Acer Predator Helios Neo 16S AI PHN16S-71-94L9 | |
| Schenker XMG APEX 16 MAX | |
| Average of class Gaming (7602 - 19954, n=94, last 2 years) | |
| Medion Erazer Major 16 X1 MD62736 | |
| MSI Vector 16 HX AI A2XWHG | |
| CrossMark / Overall | |
| Chuwi Gamebook, R9 9955HX | |
| Schenker XMG Pro 16 (E25) | |
| Lenovo Legion 5 Pro 16IAX10H | |
| Average AMD Ryzen 9 9955HX, NVIDIA GeForce RTX 5070 Ti Laptop (2111 - 2215, n=3) | |
| Acer Predator Helios Neo 16S AI PHN16S-71-94L9 | |
| Schenker XMG APEX 16 MAX | |
| Medion Erazer Major 16 X1 MD62736 | |
| Average of class Gaming (1366 - 2409, n=93, last 2 years) | |
| MSI Vector 16 HX AI A2XWHG | |
| CrossMark / Productivity | |
| Lenovo Legion 5 Pro 16IAX10H | |
| Schenker XMG Pro 16 (E25) | |
| Chuwi Gamebook, R9 9955HX | |
| Acer Predator Helios Neo 16S AI PHN16S-71-94L9 | |
| Medion Erazer Major 16 X1 MD62736 | |
| Average AMD Ryzen 9 9955HX, NVIDIA GeForce RTX 5070 Ti Laptop (1882 - 1999, n=3) | |
| Schenker XMG APEX 16 MAX | |
| Average of class Gaming (1386 - 2254, n=93, last 2 years) | |
| MSI Vector 16 HX AI A2XWHG | |
| CrossMark / Creativity | |
| Average AMD Ryzen 9 9955HX, NVIDIA GeForce RTX 5070 Ti Laptop (2592 - 2660, n=3) | |
| Chuwi Gamebook, R9 9955HX | |
| Schenker XMG APEX 16 MAX | |
| Schenker XMG Pro 16 (E25) | |
| Lenovo Legion 5 Pro 16IAX10H | |
| Acer Predator Helios Neo 16S AI PHN16S-71-94L9 | |
| Medion Erazer Major 16 X1 MD62736 | |
| MSI Vector 16 HX AI A2XWHG | |
| Average of class Gaming (1343 - 2729, n=93, last 2 years) | |
| CrossMark / Responsiveness | |
| Chuwi Gamebook, R9 9955HX | |
| Lenovo Legion 5 Pro 16IAX10H | |
| Schenker XMG Pro 16 (E25) | |
| Acer Predator Helios Neo 16S AI PHN16S-71-94L9 | |
| Medion Erazer Major 16 X1 MD62736 | |
| Average AMD Ryzen 9 9955HX, NVIDIA GeForce RTX 5070 Ti Laptop (1608 - 1854, n=3) | |
| Average of class Gaming (1226 - 2334, n=93, last 2 years) | |
| Schenker XMG APEX 16 MAX | |
| MSI Vector 16 HX AI A2XWHG | |
| WebXPRT 3 / Overall | |
| Lenovo Legion 5 Pro 16IAX10H | |
| Schenker XMG Pro 16 (E25) | |
| Average AMD Ryzen 9 9955HX, NVIDIA GeForce RTX 5070 Ti Laptop (328 - 361, n=3) | |
| Chuwi Gamebook, R9 9955HX | |
| Acer Predator Helios Neo 16S AI PHN16S-71-94L9 | |
| Schenker XMG APEX 16 MAX | |
| Medion Erazer Major 16 X1 MD62736 | |
| MSI Vector 16 HX AI A2XWHG | |
| Average of class Gaming (220 - 532, n=97, last 2 years) | |
| WebXPRT 4 / Overall | |
| Schenker XMG Pro 16 (E25) | |
| Lenovo Legion 5 Pro 16IAX10H | |
| Medion Erazer Major 16 X1 MD62736 | |
| Acer Predator Helios Neo 16S AI PHN16S-71-94L9 | |
| MSI Vector 16 HX AI A2XWHG | |
| Average AMD Ryzen 9 9955HX, NVIDIA GeForce RTX 5070 Ti Laptop (282 - 322, n=3) | |
| Chuwi Gamebook, R9 9955HX | |
| Average of class Gaming (165 - 354, n=97, last 2 years) | |
| Schenker XMG APEX 16 MAX | |
| Mozilla Kraken 1.1 / Total | |
| Average of class Gaming (391 - 590, n=99, last 2 years) | |
| Schenker XMG APEX 16 MAX | |
| MSI Vector 16 HX AI A2XWHG | |
| Medion Erazer Major 16 X1 MD62736 | |
| Average AMD Ryzen 9 9955HX, NVIDIA GeForce RTX 5070 Ti Laptop (403 - 440, n=3) | |
| Lenovo Legion 5 Pro 16IAX10H | |
| Acer Predator Helios Neo 16S AI PHN16S-71-94L9 | |
| Schenker XMG Pro 16 (E25) | |
| Chuwi Gamebook, R9 9955HX | |
* ... smaller is better
| PCMark 10 Score | 10060 points | |
Help | ||
| AIDA64 / Memory Copy | |
| Acer Predator Helios Neo 16S AI PHN16S-71-94L9 | |
| Schenker XMG Pro 16 (E25) | |
| Lenovo Legion 5 Pro 16IAX10H | |
| Medion Erazer Major 16 X1 MD62736 | |
| Average of class Gaming (21750 - 129946, n=103, last 2 years) | |
| MSI Vector 16 HX AI A2XWHG | |
| Schenker XMG APEX 16 MAX | |
| Chuwi Gamebook, R9 9955HX | |
| Average AMD Ryzen 9 9955HX (53598 - 62777, n=9) | |
| AIDA64 / Memory Read | |
| Schenker XMG Pro 16 (E25) | |
| Acer Predator Helios Neo 16S AI PHN16S-71-94L9 | |
| Lenovo Legion 5 Pro 16IAX10H | |
| Medion Erazer Major 16 X1 MD62736 | |
| MSI Vector 16 HX AI A2XWHG | |
| Average of class Gaming (22956 - 118858, n=103, last 2 years) | |
| Schenker XMG APEX 16 MAX | |
| Average AMD Ryzen 9 9955HX (63953 - 67256, n=9) | |
| Chuwi Gamebook, R9 9955HX | |
| AIDA64 / Memory Write | |
| Medion Erazer Major 16 X1 MD62736 | |
| Acer Predator Helios Neo 16S AI PHN16S-71-94L9 | |
| Schenker XMG Pro 16 (E25) | |
| Lenovo Legion 5 Pro 16IAX10H | |
| Average of class Gaming (22297 - 135096, n=103, last 2 years) | |
| Schenker XMG APEX 16 MAX | |
| Average AMD Ryzen 9 9955HX (65421 - 72060, n=9) | |
| Chuwi Gamebook, R9 9955HX | |
| MSI Vector 16 HX AI A2XWHG | |
| AIDA64 / Memory Latency | |
| Lenovo Legion 5 Pro 16IAX10H | |
| Acer Predator Helios Neo 16S AI PHN16S-71-94L9 | |
| Medion Erazer Major 16 X1 MD62736 | |
| Average of class Gaming (75.3 - 259, n=103, last 2 years) | |
| MSI Vector 16 HX AI A2XWHG | |
| Schenker XMG Pro 16 (E25) | |
| Chuwi Gamebook, R9 9955HX | |
| Average AMD Ryzen 9 9955HX (92.1 - 103.5, n=9) | |
| Schenker XMG APEX 16 MAX | |
* ... smaller is better
DPC 延迟
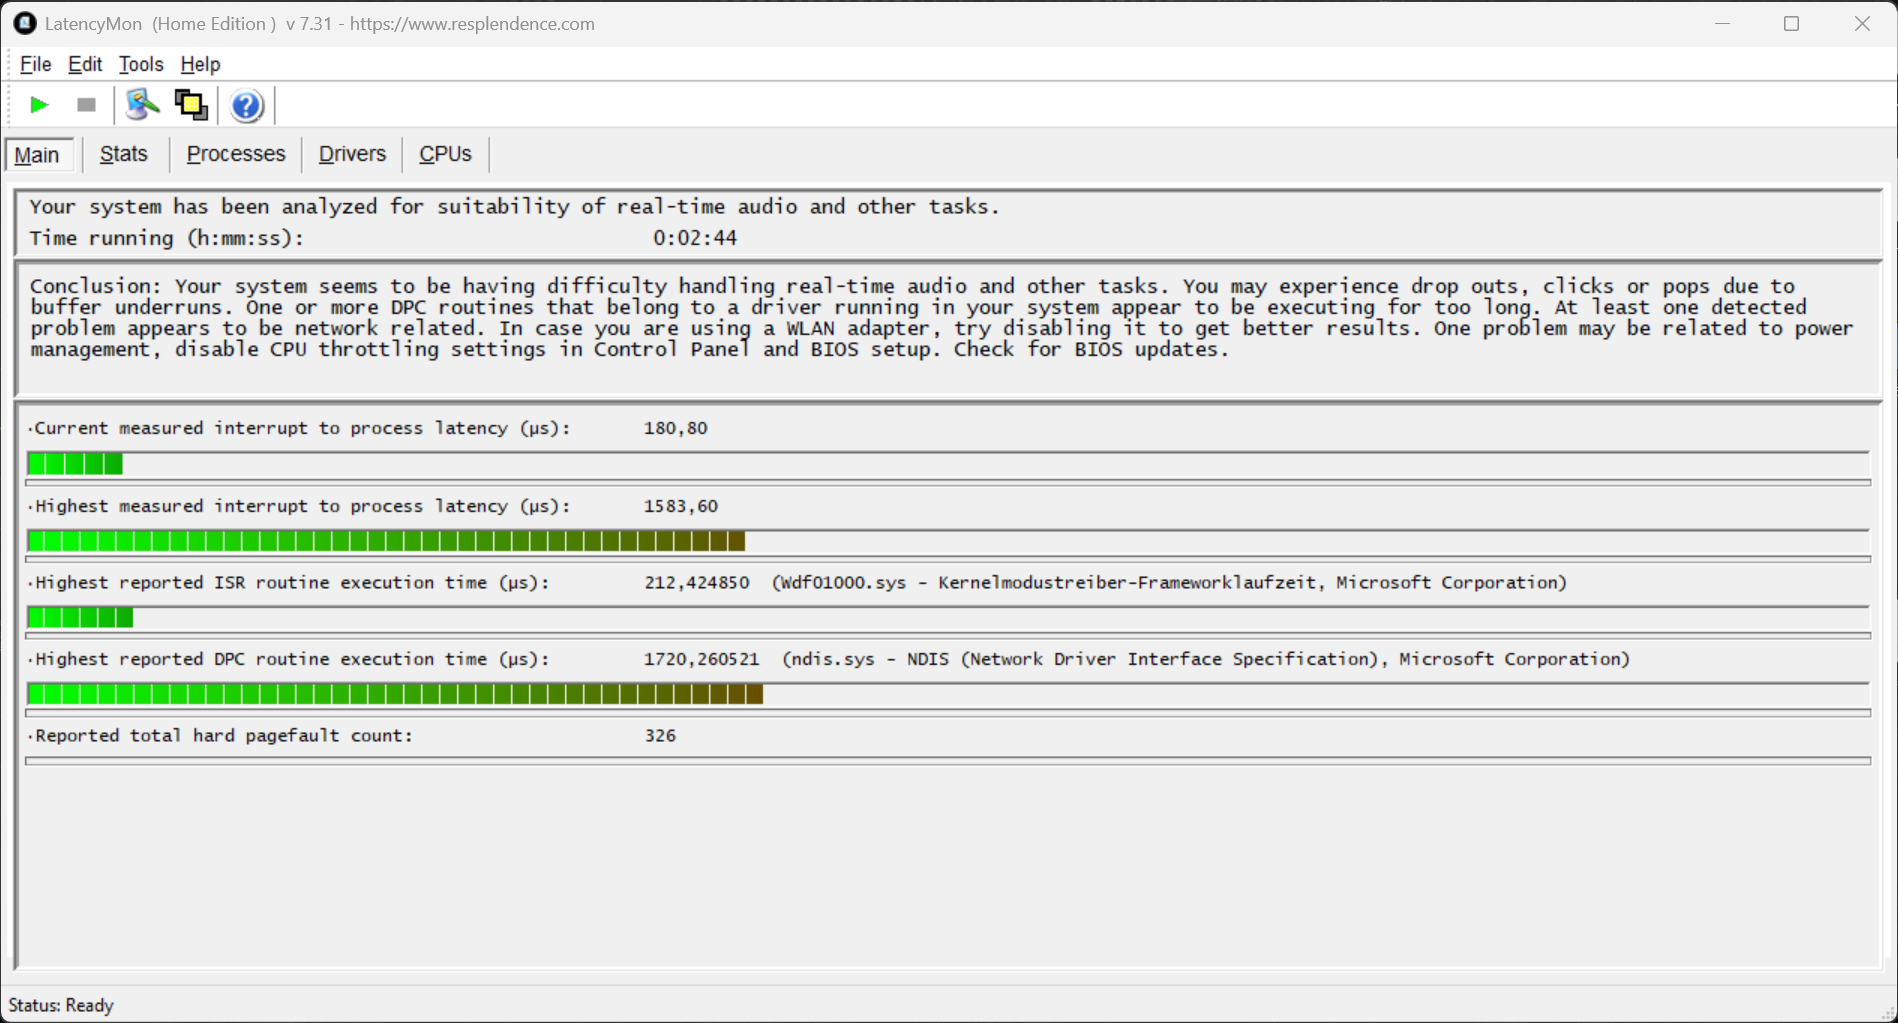
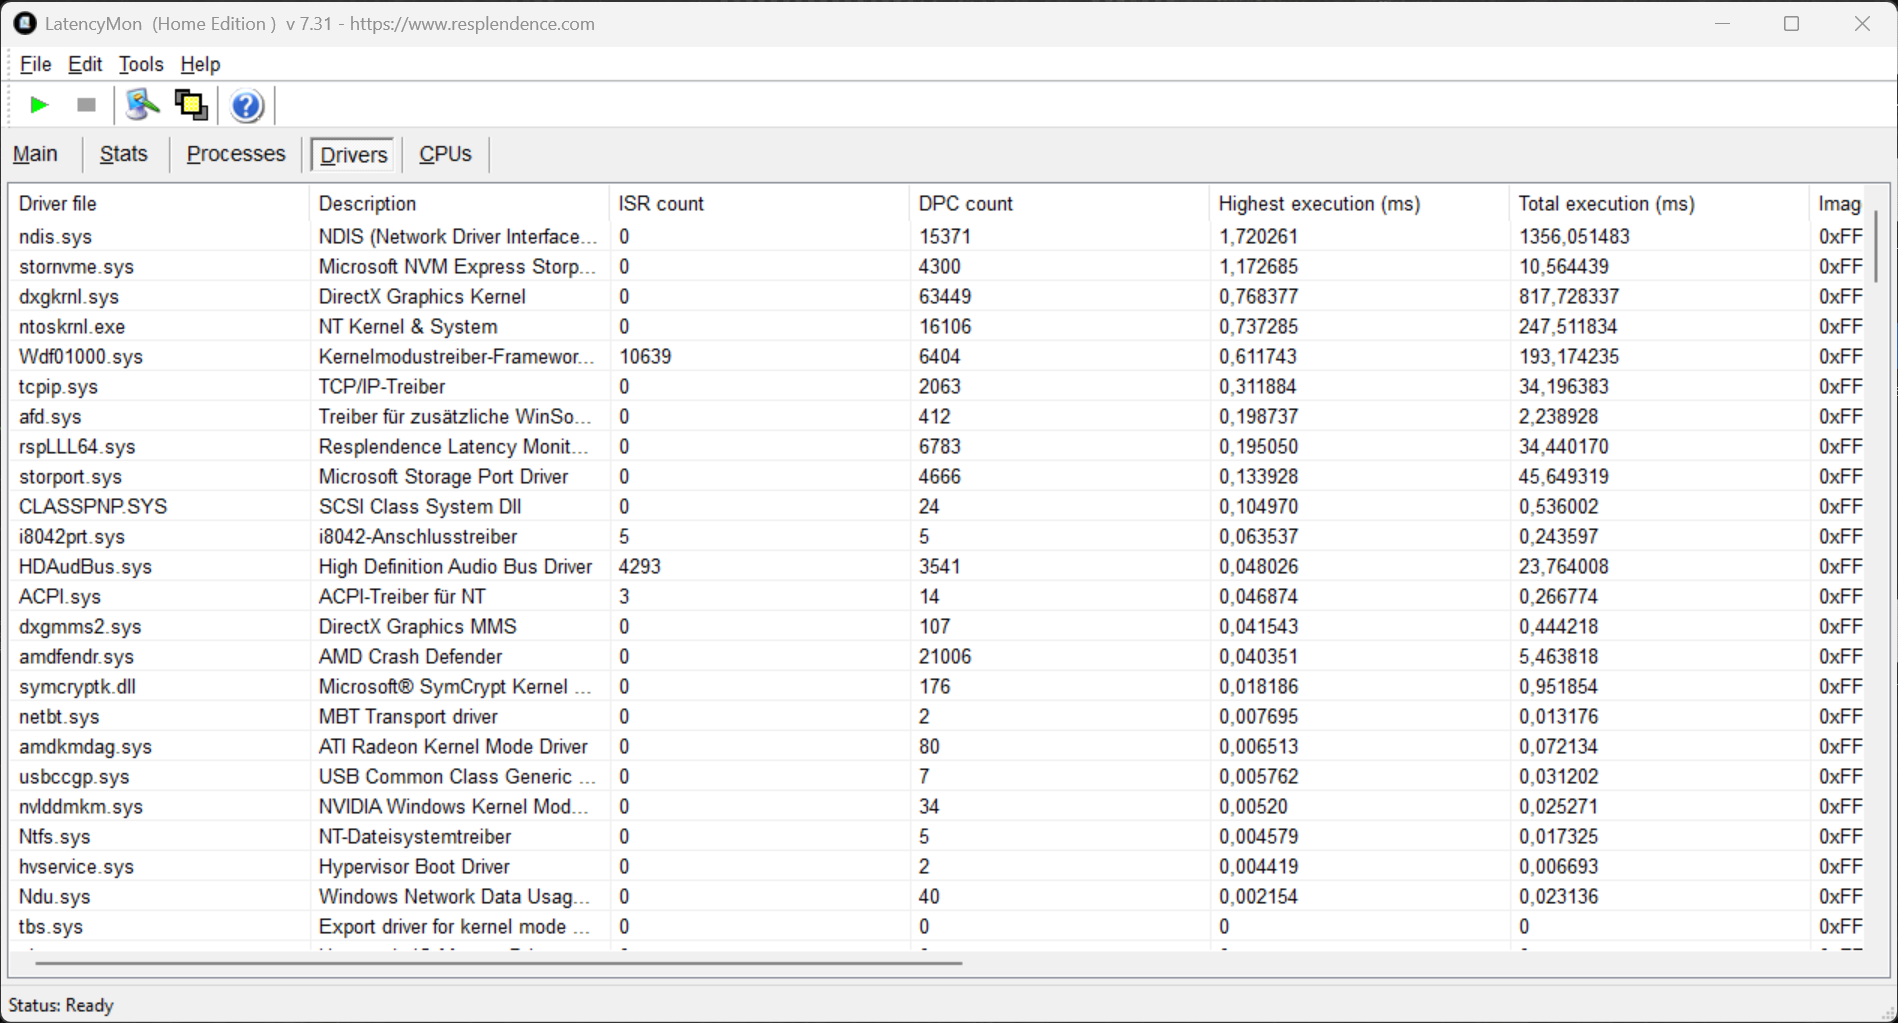
| DPC Latencies / LatencyMon - interrupt to process latency (max), Web, Youtube, Prime95 | |
| Chuwi Gamebook, R9 9955HX | |
| MSI Vector 16 HX AI A2XWHG | |
| Medion Erazer Major 16 X1 MD62736 | |
| Acer Predator Helios Neo 16S AI PHN16S-71-94L9 | |
| Schenker XMG Pro 16 (E25) | |
| Schenker XMG APEX 16 MAX | |
| Lenovo Legion 5 Pro 16IAX10H | |
* ... smaller is better
存储
Apex 16 Max 已经支持 PCIe 5.0,测试系统中安装了相应的三星 9100 Pro(2 TB,可用容量 1.73 TB)。性能非常好,而且保持稳定。第二个 M.2 2280 插槽通过 PCIe 4.0 连接。

* ... smaller is better
连续读取性能DiskSpd 读取循环,队列深度 8
图形处理器性能
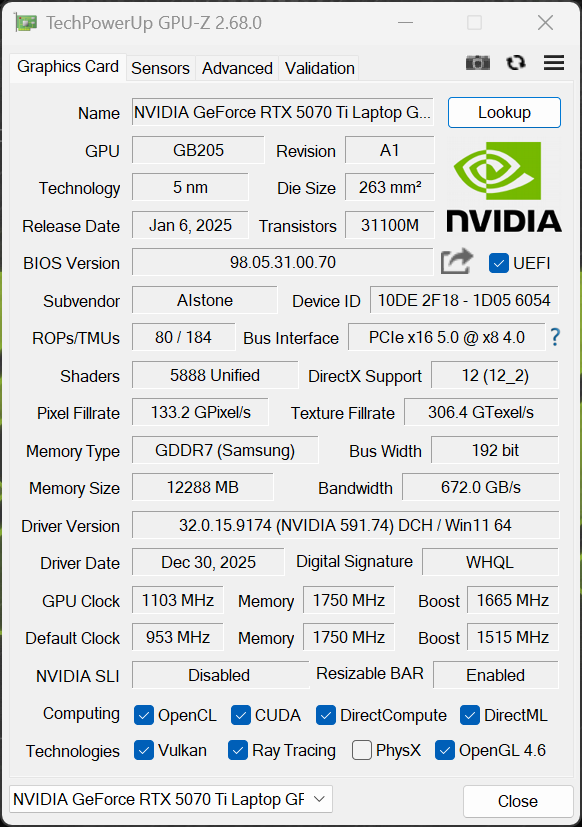
XMG 使用最快的 140 瓦移动版 GeForce RTX 5070 Ti配备 12GB VRAM。图形切换通过 Optimus 处理,但包括一个 MUX 开关。整体图形性能非常出色,即使在长时间负载情况下也能保持完全稳定。使用电池供电(40 瓦)时,性能会降低约 60%。
| 3DMark 11 Performance | 45731 points | |
| 3DMark Fire Strike Score | 39568 points | |
| 3DMark Time Spy Score | 17095 points | |
| 3DMark Steel Nomad Score | 3953 points | |
| 3DMark Steel Nomad Light Score | 18188 points | |
Help | ||
| Blender / v3.3 Classroom OPTIX/RTX | |
| Average of class Gaming (9 - 32, n=105, last 2 years) | |
| Acer Predator Helios Neo 16S AI PHN16S-71-94L9 | |
| MSI Vector 16 HX AI A2XWHG | |
| Medion Erazer Major 16 X1 MD62736 | |
| Schenker XMG APEX 16 MAX | |
| Average NVIDIA GeForce RTX 5070 Ti Laptop (13 - 19, n=14) | |
| Lenovo Legion 5 Pro 16IAX10H | |
| Schenker XMG Pro 16 (E25) | |
| Chuwi Gamebook, R9 9955HX | |
| Blender / v3.3 Classroom CUDA | |
| Average of class Gaming (15 - 228, n=105, last 2 years) | |
| Acer Predator Helios Neo 16S AI PHN16S-71-94L9 | |
| Schenker XMG APEX 16 MAX | |
| Average NVIDIA GeForce RTX 5070 Ti Laptop (24 - 33, n=14) | |
| Schenker XMG Pro 16 (E25) | |
| Medion Erazer Major 16 X1 MD62736 | |
| MSI Vector 16 HX AI A2XWHG | |
| Lenovo Legion 5 Pro 16IAX10H | |
| Chuwi Gamebook, R9 9955HX | |
| Blender / v3.3 Classroom CPU | |
| Average of class Gaming (122 - 565, n=101, last 2 years) | |
| MSI Vector 16 HX AI A2XWHG | |
| Average NVIDIA GeForce RTX 5070 Ti Laptop (122 - 361, n=14) | |
| Acer Predator Helios Neo 16S AI PHN16S-71-94L9 | |
| Medion Erazer Major 16 X1 MD62736 | |
| Lenovo Legion 5 Pro 16IAX10H | |
| Schenker XMG Pro 16 (E25) | |
| Chuwi Gamebook, R9 9955HX | |
| Schenker XMG APEX 16 MAX | |
* ... smaller is better
游戏性能
游戏性能非常出色,所有现代游戏都能在最高细节设置和原始分辨率下流畅运行。只有光线追踪有时需要 DLSS 或帧生成。在长时间游戏过程中,性能也能保持完全稳定。
| Final Fantasy XV Benchmark - 1920x1080 High Quality | |
| Lenovo Legion 5 Pro 16IAX10H | |
| Medion Erazer Major 16 X1 MD62736 | |
| Chuwi Gamebook, R9 9955HX | |
| MSI Vector 16 HX AI A2XWHG | |
| Schenker XMG APEX 16 MAX | |
| Average of class Gaming (41 - 215, n=94, last 2 years) | |
| Schenker XMG Pro 16 (E25) | |
| Strange Brigade - 1920x1080 ultra AA:ultra AF:16 | |
| Lenovo Legion 5 Pro 16IAX10H | |
| Schenker XMG APEX 16 MAX | |
| Chuwi Gamebook, R9 9955HX | |
| Average of class Gaming (76.3 - 456, n=86, last 2 years) | |
| Schenker XMG Pro 16 (E25) | |
| F1 24 | |
| 2560x1440 Ultra High Preset AA:T AF:16x | |
| Average of class Gaming (36.7 - 108.2, n=57, last 2 years) | |
| Schenker XMG APEX 16 MAX | |
| Schenker XMG Pro 16 (E25) | |
| Chuwi Gamebook, R9 9955HX | |
| Average NVIDIA GeForce RTX 5070 Ti Laptop (53.2 - 72.1, n=10) | |
| 2560x1440 Ultra High Preset + Quality DLSS AF:16x | |
| Schenker XMG APEX 16 MAX | |
| Average of class Gaming (14.3 - 159.3, n=48, last 2 years) | |
| Chuwi Gamebook, R9 9955HX | |
| Average NVIDIA GeForce RTX 5070 Ti Laptop (78.1 - 115.8, n=9) | |
| F1 25 | |
| 2560x1440 Ultra Max Preset AA:T AF:16x | |
| Schenker XMG APEX 16 MAX | |
| Chuwi Gamebook, R9 9955HX | |
| Average NVIDIA GeForce RTX 5070 Ti Laptop (18 - 26, n=7) | |
| Average of class Gaming (5 - 37.7, n=25, last 2 years) | |
| Lenovo Legion 5 Pro 16IAX10H | |
| 2560x1440 Ultra Max Preset + DLSS Quality AA:DLSS AF:16x | |
| Schenker XMG APEX 16 MAX | |
| Chuwi Gamebook, R9 9955HX | |
| Average NVIDIA GeForce RTX 5070 Ti Laptop (32 - 48.1, n=7) | |
| Average of class Gaming (9 - 67.5, n=23, last 2 years) | |
| Lenovo Legion 5 Pro 16IAX10H | |

赛博朋克 2077》超 FPS 图表
| low | med. | high | ultra | QHD DLSS | QHD | |
|---|---|---|---|---|---|---|
| GTA V (2015) | 166.3 | 157.3 | ||||
| Dota 2 Reborn (2015) | 259 | 240 | 209 | 188.4 | ||
| Final Fantasy XV Benchmark (2018) | 232 | 211 | 158.2 | 121.8 | ||
| X-Plane 11.11 (2018) | 155.8 | 123.9 | 105.6 | |||
| Strange Brigade (2018) | 579 | 468 | 387 | 340 | 236 | |
| Baldur's Gate 3 (2023) | 221 | 178.7 | 157.5 | 155.6 | 110.5 | |
| Cyberpunk 2077 (2023) | 183.7 | 164.6 | 140.6 | 128 | 96.1 | 82.9 |
| F1 24 (2024) | 315 | 270 | 110.6 | 112.4 | 72 | |
| F1 25 (2025) | 249 | 231 | 218 | 42.9 | 48.1 | 26 |
| Call of Duty Black Ops 7 (2025) | 239 | 188 | 151 | 60 | 39 |
排放与能源
噪音排放

风扇噪音主要取决于所选的性能模式。平衡模式最适合日常使用,因为风扇要么不工作,要么只发出 "嗖嗖 "的声音。但在超增压普通模式下,笔记本电脑在游戏时的噪音会非常大,达到 51 dB(A)(超增压极限模式:55 dB(A),发烧友模式:47.9 dB(A),平衡 模式:43.3 dB(A),电池模式:35.8 dB(A))。我们在测试设备上没有发现任何线圈啸叫。
Noise level
| Idle |
| 25.9 / 26.5 / 26.5 dB(A) |
| Load |
| 42.1 / 51 dB(A) |
 | ||
30 dB silent 40 dB(A) audible 50 dB(A) loud |
||
min: | ||
| Schenker XMG APEX 16 MAX R9 9955HX, GeForce RTX 5070 Ti Laptop | Acer Predator Helios Neo 16S AI PHN16S-71-94L9 Ultra 9 275HX, GeForce RTX 5070 Ti Laptop | Chuwi Gamebook, R9 9955HX R9 9955HX, GeForce RTX 5070 Ti Laptop | Medion Erazer Major 16 X1 MD62736 Ultra 7 255HX, GeForce RTX 5070 Ti Laptop | Lenovo Legion 5 Pro 16IAX10H Ultra 9 275HX, GeForce RTX 5070 Ti Laptop | MSI Vector 16 HX AI A2XWHG Ultra 7 255HX, GeForce RTX 5070 Ti Laptop | Schenker XMG Pro 16 (E25) Ultra 9 275HX, GeForce RTX 5070 Ti Laptop | |
|---|---|---|---|---|---|---|---|
| Noise | -9% | -3% | -7% | -7% | -13% | 1% | |
| off / environment * (dB) | 25.9 | 24 7% | 25 3% | 25 3% | 24 7% | 25 3% | 23.3 10% |
| Idle Minimum * (dB) | 25.9 | 24 7% | 26.3 -2% | 26 -0% | 24 7% | 33 -27% | 25 3% |
| Idle Average * (dB) | 26.5 | 30 -13% | 26.5 -0% | 27 -2% | 24 9% | 34 -28% | 25 6% |
| Idle Maximum * (dB) | 26.5 | 35 -32% | 27.3 -3% | 30 -13% | 30.9 -17% | 38 -43% | 25 6% |
| Load Average * (dB) | 42.1 | 53 -26% | 50.4 -20% | 53 -26% | 55.9 -33% | 46 -9% | 45.5 -8% |
| Cyberpunk 2077 ultra * (dB) | 51 | 52 -2% | 50.3 1% | 54 -6% | 56.72 -11% | 47 8% | 53.3 -5% |
| Load Maximum * (dB) | 51 | 54 -6% | 50.4 1% | 54 -6% | 56.72 -11% | 49 4% | 53.3 -5% |
| Witcher 3 ultra * (dB) | 50.4 |
* ... smaller is better
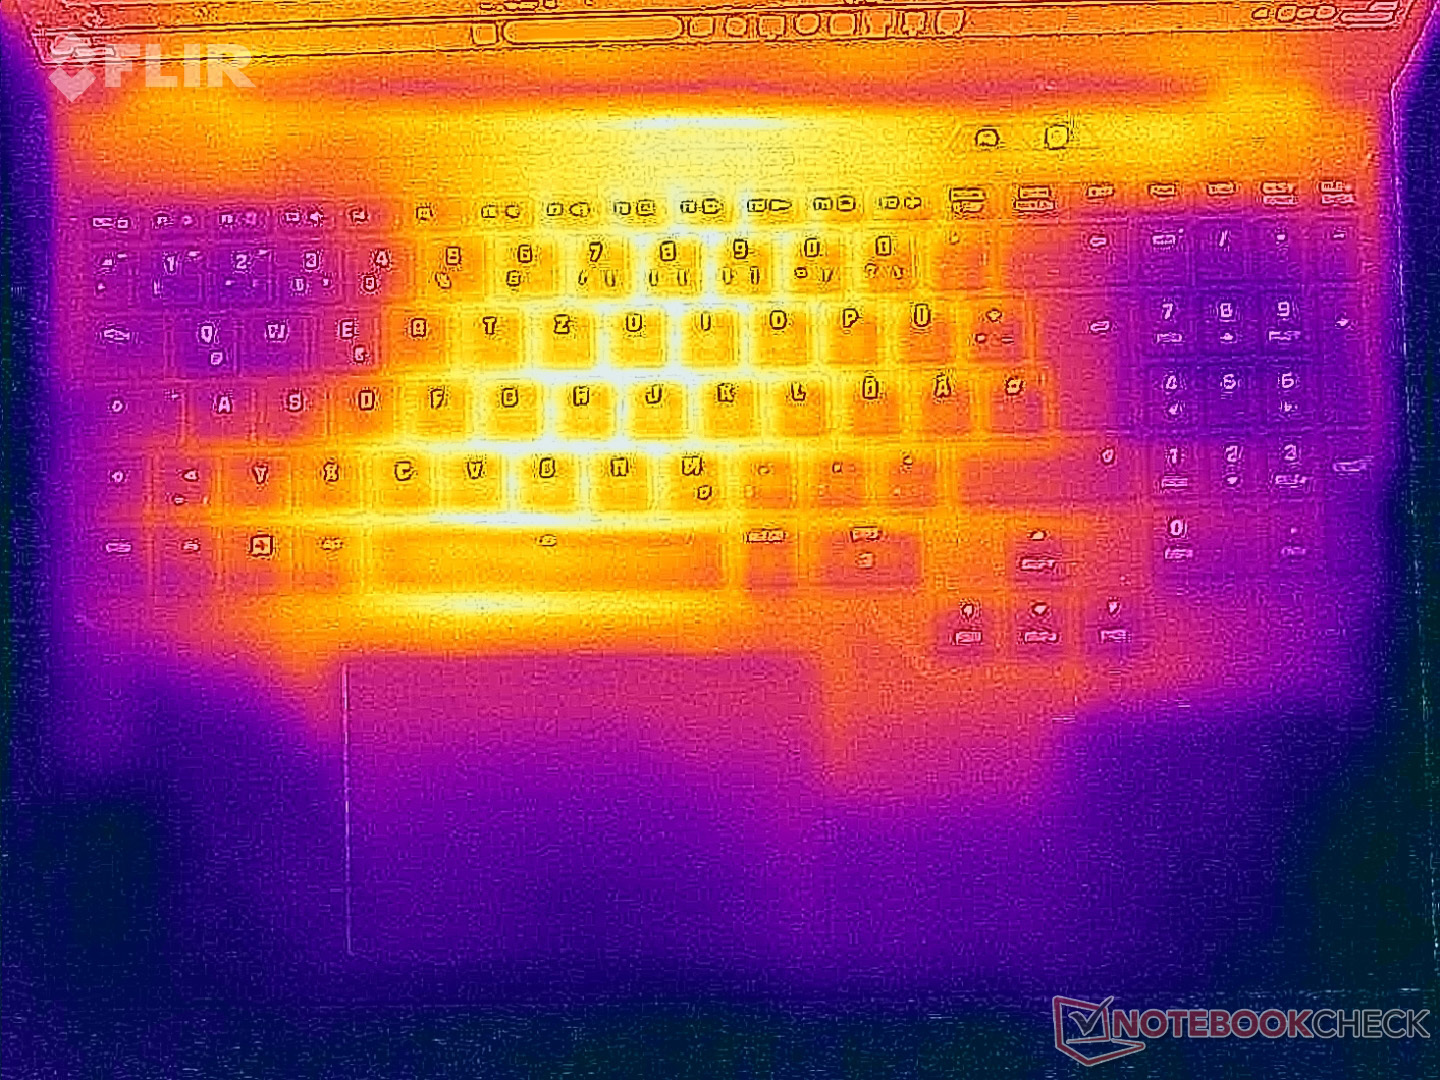
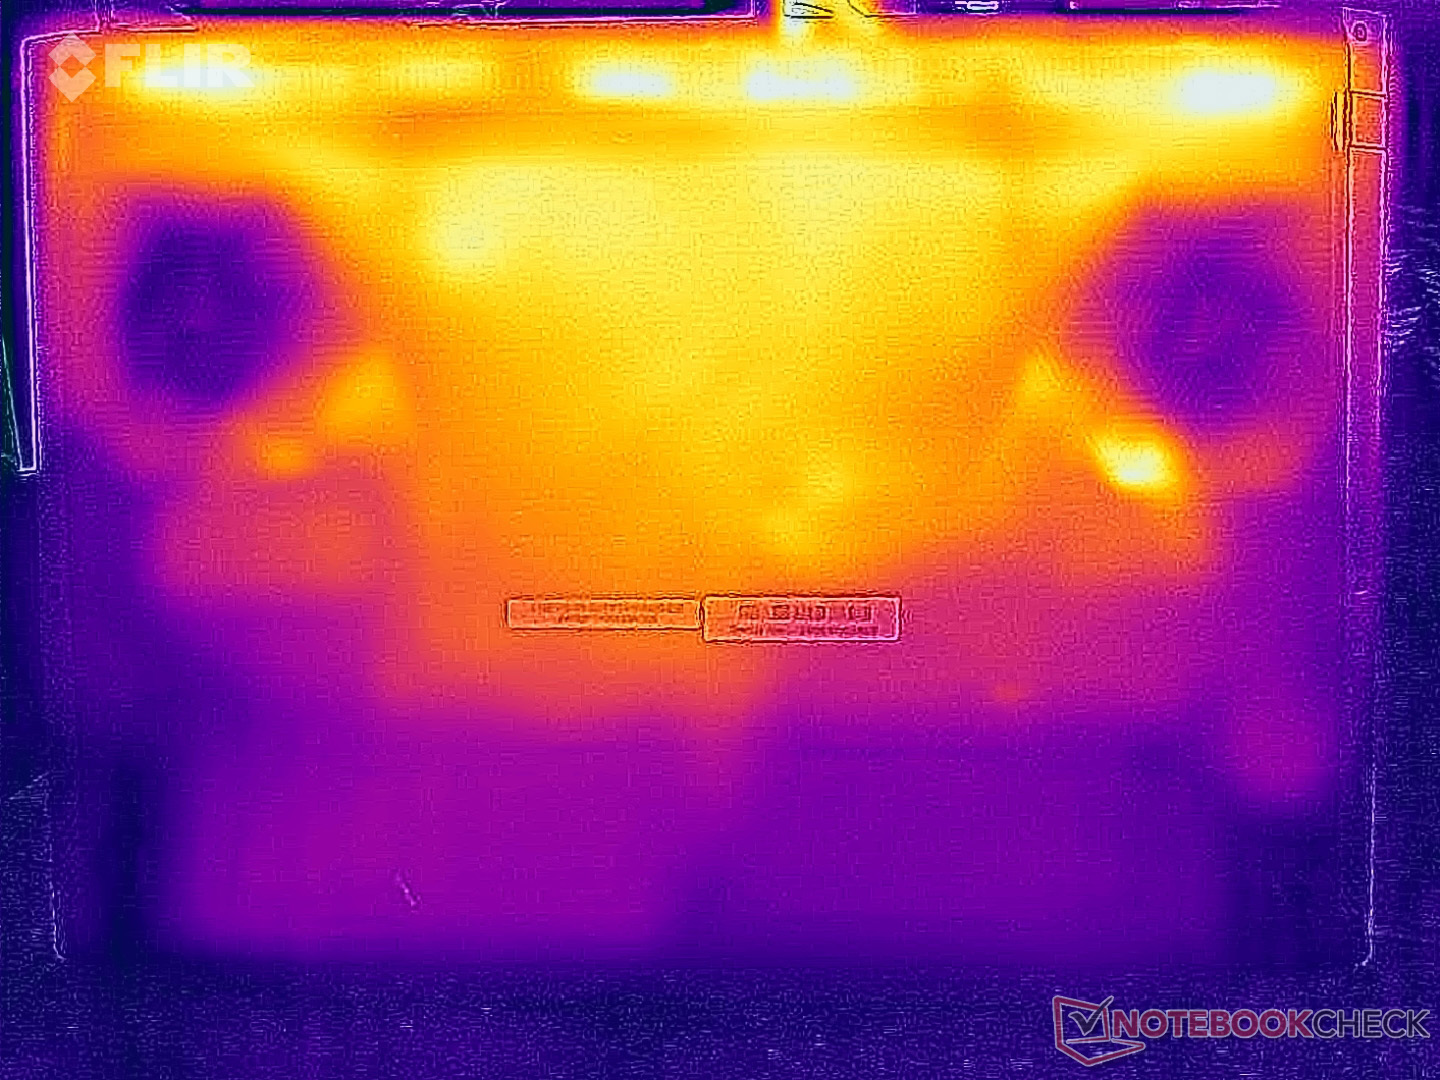
温度
表面温度一般不成问题。虽然我们在高负载情况下测得顶部和底部温度均高达 46 °C,但这并没有造成任何实际限制。在压力测试中,GPU 优先(80 °C,140 瓦),而 CPU 则为 45 瓦(70 °C)。

(-) The maximum temperature on the upper side is 46.5 °C / 116 F, compared to the average of 40.4 °C / 105 F, ranging from 21.2 to 68.8 °C for the class Gaming.
(-) The bottom heats up to a maximum of 46.4 °C / 116 F, compared to the average of 43.2 °C / 110 F
(+) In idle usage, the average temperature for the upper side is 30.1 °C / 86 F, compared to the device average of 33.9 °C / 93 F.
(-) 3: The average temperature for the upper side is 40 °C / 104 F, compared to the average of 33.9 °C / 93 F for the class Gaming.
(+) The palmrests and touchpad are reaching skin temperature as a maximum (35.4 °C / 95.7 F) and are therefore not hot.
(-) The average temperature of the palmrest area of similar devices was 28.8 °C / 83.8 F (-6.6 °C / -11.9 F).
| Schenker XMG APEX 16 MAX R9 9955HX, GeForce RTX 5070 Ti Laptop | Acer Predator Helios Neo 16S AI PHN16S-71-94L9 Ultra 9 275HX, GeForce RTX 5070 Ti Laptop | Chuwi Gamebook, R9 9955HX R9 9955HX, GeForce RTX 5070 Ti Laptop | Medion Erazer Major 16 X1 MD62736 Ultra 7 255HX, GeForce RTX 5070 Ti Laptop | Lenovo Legion 5 Pro 16IAX10H Ultra 9 275HX, GeForce RTX 5070 Ti Laptop | MSI Vector 16 HX AI A2XWHG Ultra 7 255HX, GeForce RTX 5070 Ti Laptop | Schenker XMG Pro 16 (E25) Ultra 9 275HX, GeForce RTX 5070 Ti Laptop | |
|---|---|---|---|---|---|---|---|
| Heat | 2% | -5% | -9% | -14% | -4% | -167% | |
| Maximum Upper Side * (°C) | 46.5 | 47 -1% | 51.8 -11% | 49 -5% | 48 -3% | 53 -14% | 43.2 7% |
| Maximum Bottom * (°C) | 46.4 | 55 -19% | 46.6 -0% | 50 -8% | 50 -8% | 52 -12% | 46 1% |
| Idle Upper Side * (°C) | 32.1 | 28 13% | 34.9 -9% | 36 -12% | 38 -18% | 33 -3% | 27.7 14% |
| Idle Bottom * (°C) | 33.5 | 29 13% | 33.4 -0% | 37 -10% | 42 -25% | 29 13% | 264 -688% |
* ... smaller is better
发言人
Schenker XMG APEX 16 MAX audio analysis
(±) | speaker loudness is average but good (78.3 dB)
Bass 100 - 315 Hz
(-) | nearly no bass - on average 16.7% lower than median
(±) | linearity of bass is average (10.3% delta to prev. frequency)
Mids 400 - 2000 Hz
(±) | higher mids - on average 5.6% higher than median
(+) | mids are linear (4.2% delta to prev. frequency)
Highs 2 - 16 kHz
(+) | balanced highs - only 2.2% away from median
(+) | highs are linear (6.2% delta to prev. frequency)
Overall 100 - 16.000 Hz
(±) | linearity of overall sound is average (16.8% difference to median)
Compared to same class
» 44% of all tested devices in this class were better, 11% similar, 46% worse
» The best had a delta of 6%, average was 18%, worst was 132%
Compared to all devices tested
» 30% of all tested devices were better, 8% similar, 63% worse
» The best had a delta of 4%, average was 23%, worst was 134%
Acer Predator Helios Neo 16S AI PHN16S-71-94L9 audio analysis
(+) | speakers can play relatively loud (86 dB)
Bass 100 - 315 Hz
(-) | nearly no bass - on average 24.8% lower than median
(±) | linearity of bass is average (12.6% delta to prev. frequency)
Mids 400 - 2000 Hz
(±) | higher mids - on average 5.9% higher than median
(+) | mids are linear (6.4% delta to prev. frequency)
Highs 2 - 16 kHz
(+) | balanced highs - only 2.8% away from median
(+) | highs are linear (5.9% delta to prev. frequency)
Overall 100 - 16.000 Hz
(±) | linearity of overall sound is average (17.3% difference to median)
Compared to same class
» 47% of all tested devices in this class were better, 12% similar, 41% worse
» The best had a delta of 6%, average was 18%, worst was 132%
Compared to all devices tested
» 32% of all tested devices were better, 8% similar, 59% worse
» The best had a delta of 4%, average was 23%, worst was 134%
Chuwi Gamebook, R9 9955HX audio analysis
(±) | speaker loudness is average but good (75.7 dB)
Bass 100 - 315 Hz
(-) | nearly no bass - on average 18.7% lower than median
(±) | linearity of bass is average (10.3% delta to prev. frequency)
Mids 400 - 2000 Hz
(±) | higher mids - on average 7.2% higher than median
(±) | linearity of mids is average (9.9% delta to prev. frequency)
Highs 2 - 16 kHz
(+) | balanced highs - only 3.2% away from median
(±) | linearity of highs is average (8.1% delta to prev. frequency)
Overall 100 - 16.000 Hz
(±) | linearity of overall sound is average (21.2% difference to median)
Compared to same class
» 76% of all tested devices in this class were better, 4% similar, 19% worse
» The best had a delta of 6%, average was 18%, worst was 132%
Compared to all devices tested
» 59% of all tested devices were better, 7% similar, 34% worse
» The best had a delta of 4%, average was 23%, worst was 134%
Medion Erazer Major 16 X1 MD62736 audio analysis
(+) | speakers can play relatively loud (82 dB)
Bass 100 - 315 Hz
(-) | nearly no bass - on average 19.4% lower than median
(±) | linearity of bass is average (13.5% delta to prev. frequency)
Mids 400 - 2000 Hz
(±) | higher mids - on average 8.4% higher than median
(±) | linearity of mids is average (9.1% delta to prev. frequency)
Highs 2 - 16 kHz
(+) | balanced highs - only 4.2% away from median
(+) | highs are linear (6.4% delta to prev. frequency)
Overall 100 - 16.000 Hz
(±) | linearity of overall sound is average (20.8% difference to median)
Compared to same class
» 75% of all tested devices in this class were better, 4% similar, 21% worse
» The best had a delta of 6%, average was 18%, worst was 132%
Compared to all devices tested
» 56% of all tested devices were better, 8% similar, 36% worse
» The best had a delta of 4%, average was 23%, worst was 134%
Lenovo Legion 5 Pro 16IAX10H audio analysis
(±) | speaker loudness is average but good (78.2 dB)
Bass 100 - 315 Hz
(-) | nearly no bass - on average 21.1% lower than median
(±) | linearity of bass is average (8% delta to prev. frequency)
Mids 400 - 2000 Hz
(±) | higher mids - on average 6.3% higher than median
(+) | mids are linear (6.5% delta to prev. frequency)
Highs 2 - 16 kHz
(+) | balanced highs - only 1.6% away from median
(+) | highs are linear (4.9% delta to prev. frequency)
Overall 100 - 16.000 Hz
(±) | linearity of overall sound is average (18.3% difference to median)
Compared to same class
» 58% of all tested devices in this class were better, 9% similar, 33% worse
» The best had a delta of 6%, average was 18%, worst was 132%
Compared to all devices tested
» 40% of all tested devices were better, 8% similar, 52% worse
» The best had a delta of 4%, average was 23%, worst was 134%
MSI Vector 16 HX AI A2XWHG audio analysis
(+) | speakers can play relatively loud (86 dB)
Bass 100 - 315 Hz
(±) | reduced bass - on average 12.3% lower than median
(±) | linearity of bass is average (8.5% delta to prev. frequency)
Mids 400 - 2000 Hz
(±) | higher mids - on average 9.9% higher than median
(+) | mids are linear (6.8% delta to prev. frequency)
Highs 2 - 16 kHz
(+) | balanced highs - only 1.8% away from median
(+) | highs are linear (2.9% delta to prev. frequency)
Overall 100 - 16.000 Hz
(±) | linearity of overall sound is average (15.8% difference to median)
Compared to same class
» 37% of all tested devices in this class were better, 7% similar, 56% worse
» The best had a delta of 6%, average was 18%, worst was 132%
Compared to all devices tested
» 24% of all tested devices were better, 5% similar, 70% worse
» The best had a delta of 4%, average was 23%, worst was 134%
Schenker XMG Pro 16 (E25) audio analysis
(±) | speaker loudness is average but good (79.2 dB)
Bass 100 - 315 Hz
(±) | reduced bass - on average 14.2% lower than median
(±) | linearity of bass is average (10.6% delta to prev. frequency)
Mids 400 - 2000 Hz
(±) | higher mids - on average 8.2% higher than median
(±) | linearity of mids is average (9.9% delta to prev. frequency)
Highs 2 - 16 kHz
(+) | balanced highs - only 3.8% away from median
(+) | highs are linear (5.9% delta to prev. frequency)
Overall 100 - 16.000 Hz
(±) | linearity of overall sound is average (18.5% difference to median)
Compared to same class
» 60% of all tested devices in this class were better, 8% similar, 32% worse
» The best had a delta of 6%, average was 18%, worst was 132%
Compared to all devices tested
» 42% of all tested devices were better, 8% similar, 51% worse
» The best had a delta of 4%, average was 23%, worst was 134%
能源消耗
明亮的 Mini-LED 面板在空闲时的功耗尤为明显。在压力测试开始时,我们曾短暂测得高达 320 瓦的耗电量,之后耗电量降至 242 瓦。因此,280 瓦的电源适配器大小足够。不过,超过 3 瓦的待机功耗太高了。
| Off / Standby | |
| Idle | |
| Load |
|
Key:
min: | |
| Schenker XMG APEX 16 MAX R9 9955HX, GeForce RTX 5070 Ti Laptop, Samsung 9100 Pro 2 TB, Mini-LED, 2560x1600, 16" | Acer Predator Helios Neo 16S AI PHN16S-71-94L9 Ultra 9 275HX, GeForce RTX 5070 Ti Laptop, Micron 3500 1TB MTFDKBA1T0TGD, OLED, 2560x1600, 16" | Chuwi Gamebook, R9 9955HX R9 9955HX, GeForce RTX 5070 Ti Laptop, YMTC PC41Q-1TB-B, IPS, 2560x1600, 16" | Medion Erazer Major 16 X1 MD62736 Ultra 7 255HX, GeForce RTX 5070 Ti Laptop, Phison E31 2 TB, IPS, 2560x1600, 16" | Lenovo Legion 5 Pro 16IAX10H Ultra 9 275HX, GeForce RTX 5070 Ti Laptop, Western Digital PC SN8000S SDEPNRK-1T00, OLED, 2560x1600, 16" | MSI Vector 16 HX AI A2XWHG Ultra 7 255HX, GeForce RTX 5070 Ti Laptop, Micron 2400 MTFDKBA512QFM, IPS, 2560x1600, 16" | Schenker XMG Pro 16 (E25) Ultra 9 275HX, GeForce RTX 5070 Ti Laptop, Samsung 9100 Pro 1 TB, IPS, 2560x1600, 16" | Average NVIDIA GeForce RTX 5070 Ti Laptop | Average of class Gaming | |
|---|---|---|---|---|---|---|---|---|---|
| Power Consumption | 41% | 6% | 8% | 7% | 16% | 16% | 19% | 22% | |
| Idle Minimum * (Watt) | 15.4 | 3.9 75% | 16.4 -6% | 17.8 -16% | 14 9% | 7.1 54% | 11.7 24% | 12.4 ? 19% | 13 ? 16% |
| Idle Average * (Watt) | 29.9 | 11 63% | 21.2 29% | 20.7 31% | 14.3 52% | 15.9 47% | 16.6 44% | 19.7 ? 34% | 18.7 ? 37% |
| Idle Maximum * (Watt) | 30.1 | 16.9 44% | 28.3 6% | 23.4 22% | 20.1 33% | 29.5 2% | 17.1 43% | 24.9 ? 17% | 24.3 ? 19% |
| Load Average * (Watt) | 136.4 | 123 10% | 145.6 -7% | 110 19% | 177 -30% | 124 9% | 122.4 10% | 123.6 ? 9% | 110.2 ? 19% |
| Cyberpunk 2077 ultra * (Watt) | 231 | 152.7 34% | 221 4% | 233 -1% | 255 -10% | 222 4% | 245 -6% | ||
| Cyberpunk 2077 ultra external monitor * (Watt) | 226 | 144.9 36% | 218 4% | 232 -3% | 255 -13% | 217 4% | 241 -7% | ||
| Load Maximum * (Watt) | 315 | 229 27% | 284 10% | 297 6% | 294 7% | 336 -7% | 291.5 7% | 272 ? 14% | 258 ? 18% |
* ... smaller is better
能耗 赛博朋克/压力测试
带外部监控器的能耗
电池寿命
尽管有 99 Wh 的大容量电池,但高功耗导致电池运行时间较短。在 150 cd/m² 下进行的 Wi-Fi 测试中,我们测得的续航时间不到 5 小时,而在全亮度下则降至不到 3 小时。
| Schenker XMG APEX 16 MAX R9 9955HX, GeForce RTX 5070 Ti Laptop, 99.8 Wh | Acer Predator Helios Neo 16S AI PHN16S-71-94L9 Ultra 9 275HX, GeForce RTX 5070 Ti Laptop, 76 Wh | Chuwi Gamebook, R9 9955HX R9 9955HX, GeForce RTX 5070 Ti Laptop, 77 Wh | Medion Erazer Major 16 X1 MD62736 Ultra 7 255HX, GeForce RTX 5070 Ti Laptop, 80 Wh | Lenovo Legion 5 Pro 16IAX10H Ultra 9 275HX, GeForce RTX 5070 Ti Laptop, 80 Wh | MSI Vector 16 HX AI A2XWHG Ultra 7 255HX, GeForce RTX 5070 Ti Laptop, 90 Wh | Schenker XMG Pro 16 (E25) Ultra 9 275HX, GeForce RTX 5070 Ti Laptop, 99.8 Wh | Average of class Gaming | |
|---|---|---|---|---|---|---|---|---|
| Battery Runtime | 2% | 0% | 29% | -4% | 43% | 100% | 68% | |
| WiFi Websurfing (h) | 4.9 | 5 2% | 4.9 0% | 6.3 29% | 4.9 0% | 7 43% | 9.1 86% | 7.15 ? 46% |
| WiFi Websurfing max. Brightness (h) | 2.9 | 2.7 -7% | 6.2 114% | 5.48 ? 89% |
Notebookcheck 总体评分
Schenker XMG APEX 16 MAX
- 01/16/2026 v8
Andreas Osthoff
 Total Sustainability Score:
 可比较的替代品
Image | Model / Review | Price | Weight | Height | Display |
|---|---|---|---|---|---|
1. 87.8%  | Schenker XMG APEX 16 MAX AMD Ryzen 9 9955HX ⎘ NVIDIA GeForce RTX 5070 Ti Laptop ⎘ 64 GB Memory, 2048 GB SSD | Amazon: List Price: 2815€ | 2.7 kg | 26 mm | 16.00" 2560x1600 189 PPI Mini-LED |
2. 82%  | Acer Predator Helios Neo 16S AI PHN16S-71-94L9 Intel Core Ultra 9 275HX ⎘ NVIDIA GeForce RTX 5070 Ti Laptop ⎘ 32 GB Memory, 1024 GB SSD | Amazon: List Price: 2400 EUR | 2.2 kg | 19.9 mm | 16.00" 2560x1600 189 PPI OLED |
3. 84.9%  | Chuwi Gamebook, R9 9955HX AMD Ryzen 9 9955HX ⎘ NVIDIA GeForce RTX 5070 Ti Laptop ⎘ 32 GB Memory, 1024 GB SSD | Amazon: 1. $389.96 CHUWI 2-in-1 Touchscreen Lap... 2. $328.99 CHUWI 2 in 1 Laptop Tablet, ... 3. $309.99 CHUWI LarkBox X Mini PC, Int... List Price: 2300 EUR | 2.5 kg | 21.4 mm | 16.00" 2560x1600 189 PPI IPS |
4. 85.2%  | Medion Erazer Major 16 X1 MD62736 Intel Core Ultra 7 255HX ⎘ NVIDIA GeForce RTX 5070 Ti Laptop ⎘ 32 GB Memory, SSD | Amazon: List Price: 2600 EUR | 2.5 kg | 22.7 mm | 16.00" 2560x1600 189 PPI IPS |
5. 84.5%  | Lenovo Legion 5 Pro 16IAX10H Intel Core Ultra 9 275HX ⎘ NVIDIA GeForce RTX 5070 Ti Laptop ⎘ 32 GB Memory, 1024 GB SSD | Amazon: 1. $2,999.00 Lenovo Legion Pro 5i Gen 10 ... 2. $99.97 Lenovo Slim 245W AC Adapter ... 3. $1,749.00 Lenovo Legion 5 16" WQXGA 24... List Price: 2500 Euro | 2.4 kg | 25.95 mm | 16.00" 2560x1600 189 PPI OLED |
6. 84%  | MSI Vector 16 HX AI A2XWHG Intel Core Ultra 7 255HX ⎘ NVIDIA GeForce RTX 5070 Ti Laptop ⎘ 16 GB Memory, 512 GB SSD | Amazon: List Price: 2000 EUR | 2.6 kg | 28.6 mm | 16.00" 2560x1600 189 PPI IPS |
7. 87.4%  | Schenker XMG Pro 16 (E25) Intel Core Ultra 9 275HX ⎘ NVIDIA GeForce RTX 5070 Ti Laptop ⎘ 32 GB Memory, 1024 GB SSD | Amazon: 1. $140.00 16.0" WQXGA 2560(RGB)×1600 ... 2. $150.00 Replacement Screen 16.0" for... List Price: 2480€ | 2.5 kg | 26.5 mm | 16.00" 2560x1600 189 PPI IPS |
Transparency
The selection of devices to be reviewed is made by our editorial team. The test sample was provided to the author as a loan by the manufacturer or retailer for the purpose of this review. The lender had no influence on this review, nor did the manufacturer receive a copy of this review before publication. There was no obligation to publish this review. As an independent media company, Notebookcheck is not subjected to the authority of manufacturers, retailers or publishers.
This is how Notebookcheck is testing
Every year, Notebookcheck independently reviews hundreds of laptops and smartphones using standardized procedures to ensure that all results are comparable. We have continuously developed our test methods for around 20 years and set industry standards in the process. In our test labs, high-quality measuring equipment is utilized by experienced technicians and editors. These tests involve a multi-stage validation process. Our complex rating system is based on hundreds of well-founded measurements and benchmarks, which maintains objectivity. Further information on our test methods can be found here.
