结论 - XMG Pro 16 E25 是一次重大升级
新款 XMG Pro 16 相比旧款有了显著升级,与 XMG Neo 16 的整体差距明显变小。新款 RTX 5070 Ti 笔记本电脑的性能令人印象深刻,该版本使用了 TGP 为 140 瓦的最快变体。与新款酷睿 Ultra 9 275HX 配合使用,该笔记本电脑的游戏性能同样出色,不过我们也希望看到配备 AMD Ryzen 9 9955HX 的机型。虽然在负载情况下散热噪音很大,但其温度明显低于旧型号,尽管其性能有所提高。
它的 IPS 显示屏做得不错,虽然其连接性包括 PCIe 5.0,但你不得不放弃 Thunderbolt 5、Advanced Optimus 和 Wi-Fi 7。新 Pro 16 的起售价约为 2,270 美元,性价比还是不错的。 Neo 16.
Pros
Cons
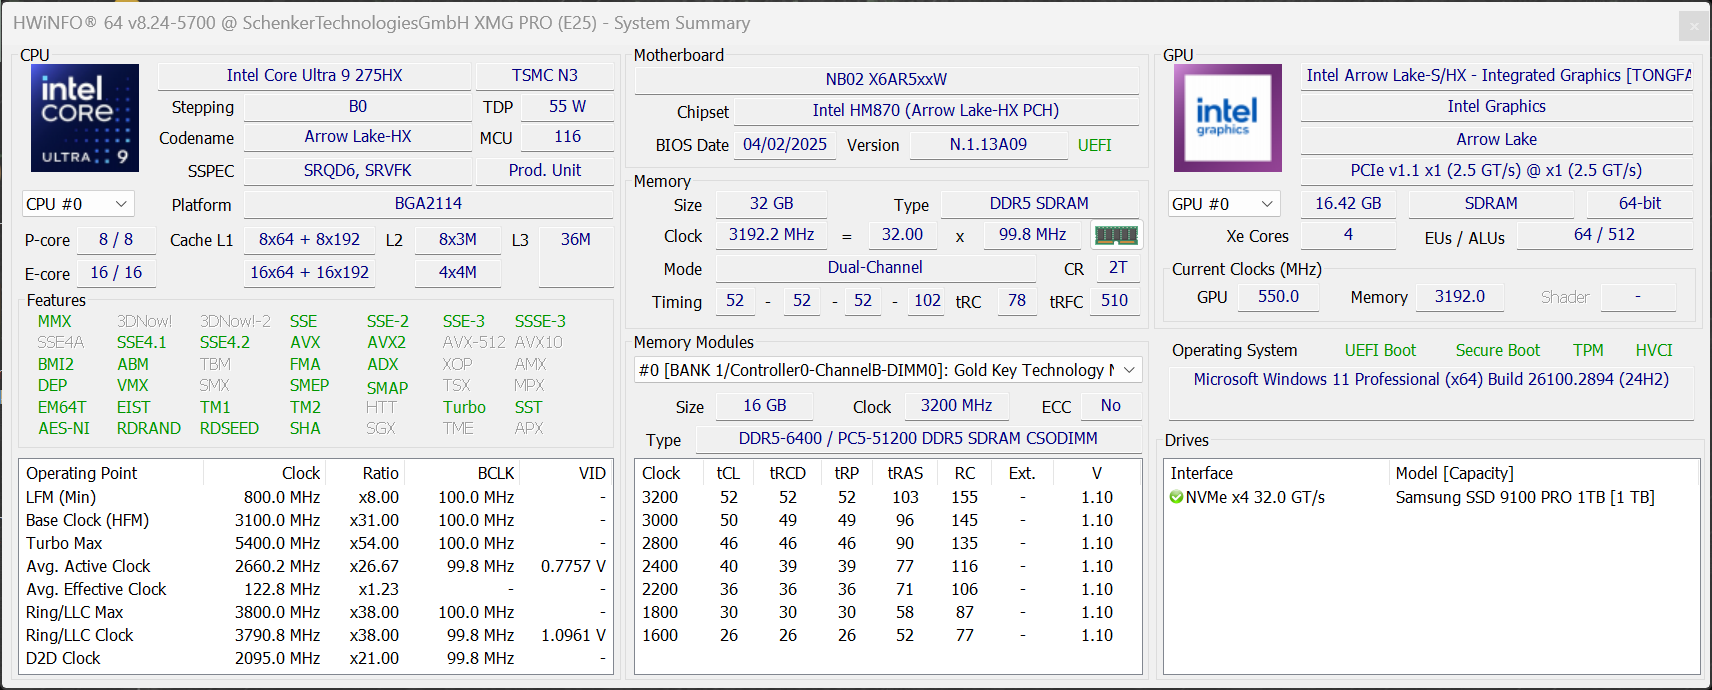
XMG 的 Pro 16 是一款面向游戏玩家和工作站用户的快速 16 英寸笔记本电脑。2025 型号采用了全新的外壳以及GeForce RTX 5070 Ti 笔记本电脑。买家可以选择两种处理器,即老款的酷睿 i9-13900HX 和新款的酷睿 Ultra 9 275HX。它采用哑光 WQHD IPS 面板(500 尼特、300 赫兹)。我们的测试设备配备了酷睿 Ultra 9 处理器、32 GB 内存和快速 1 TB 固态硬盘(PCIe 5.0),价格约为 2800 美元。
规格
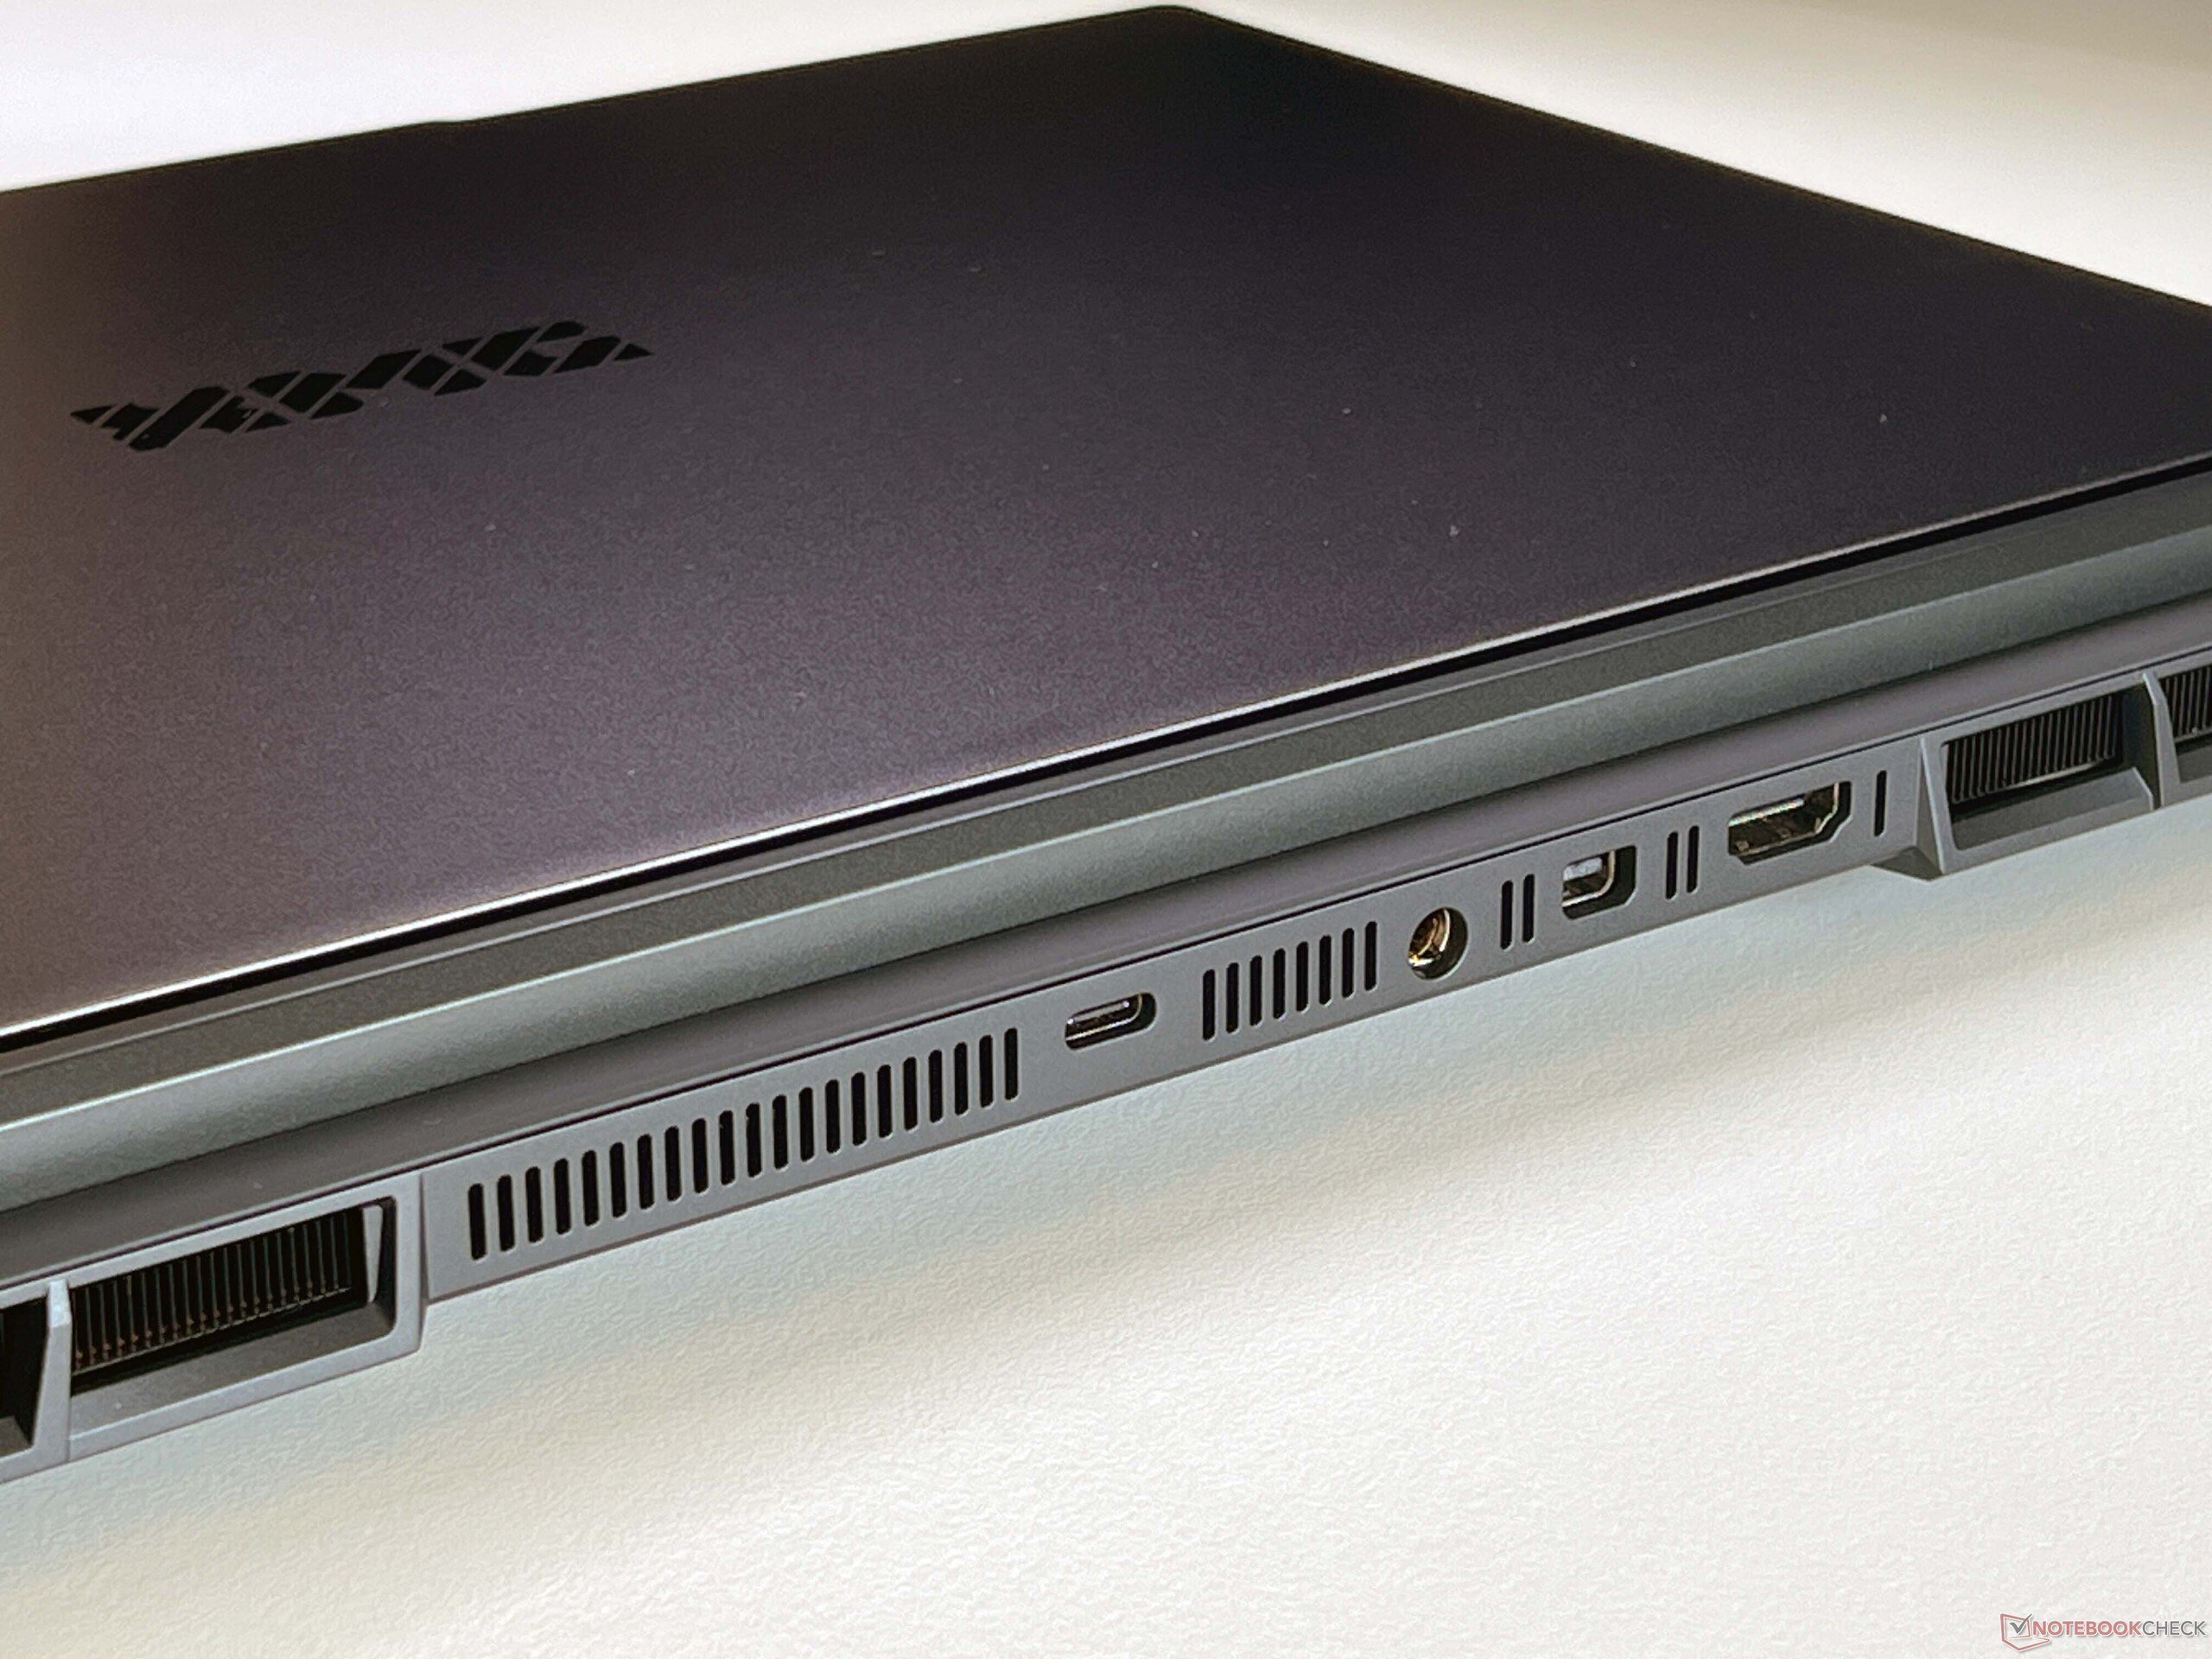
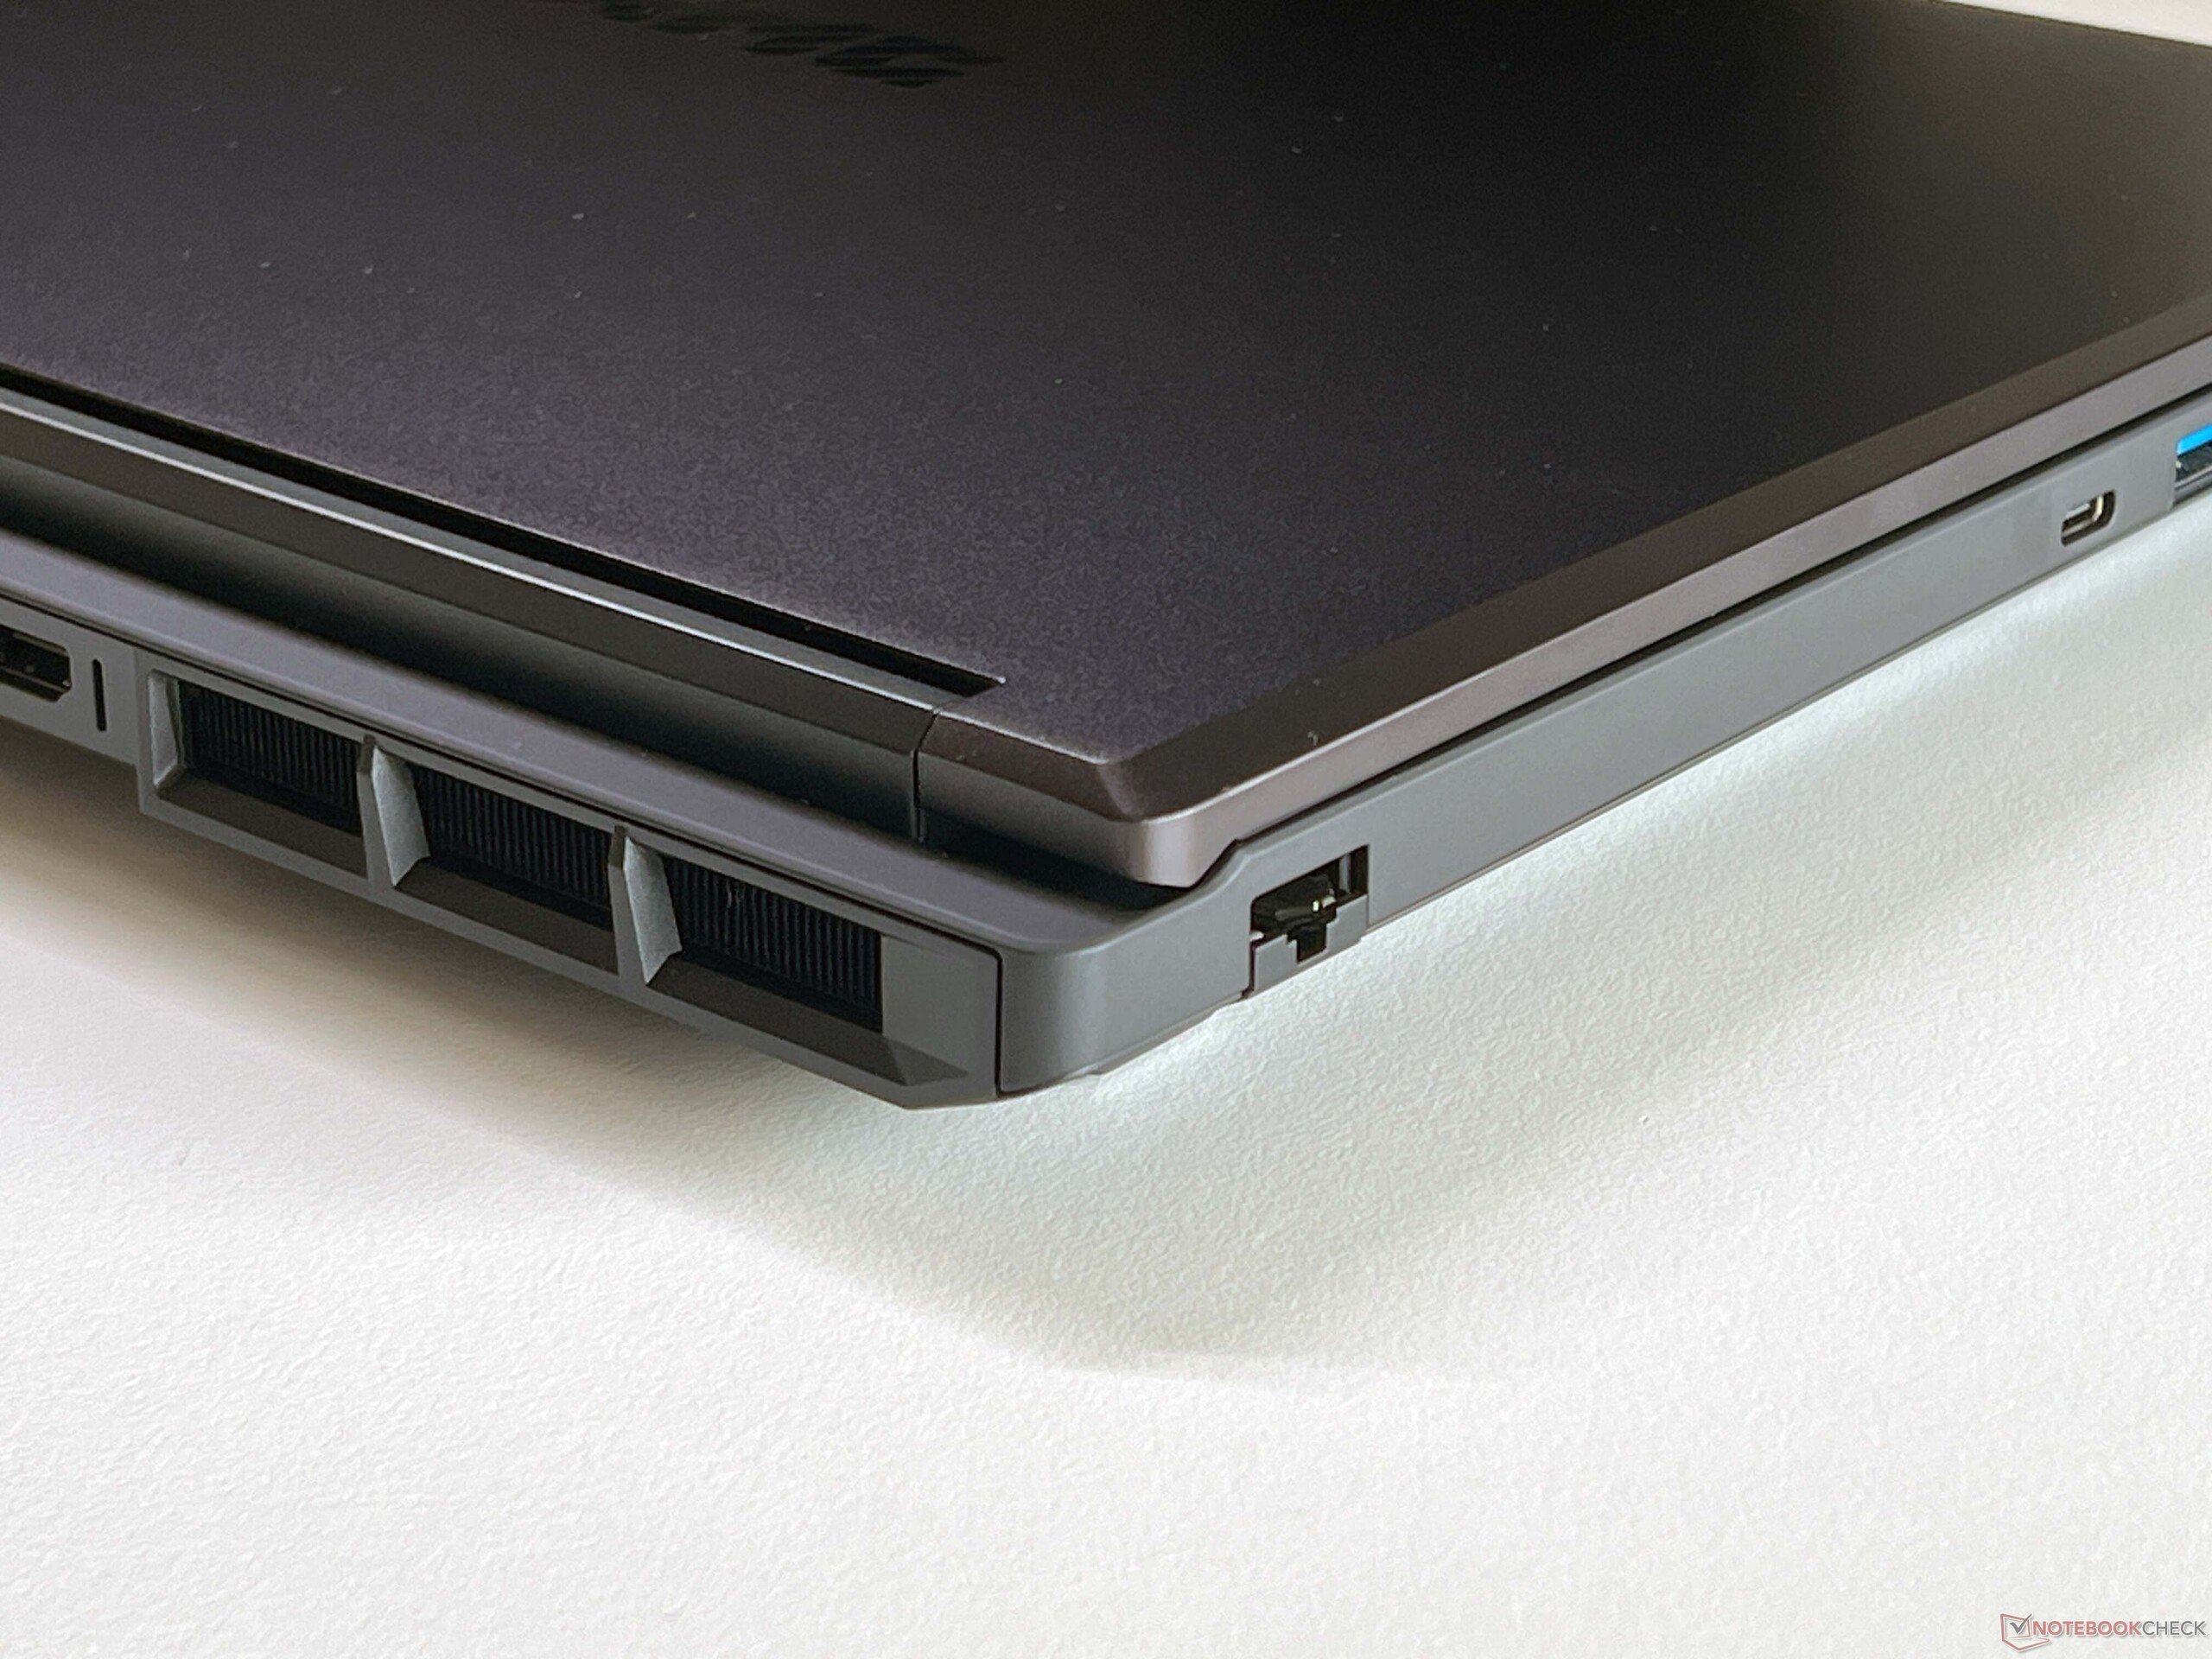
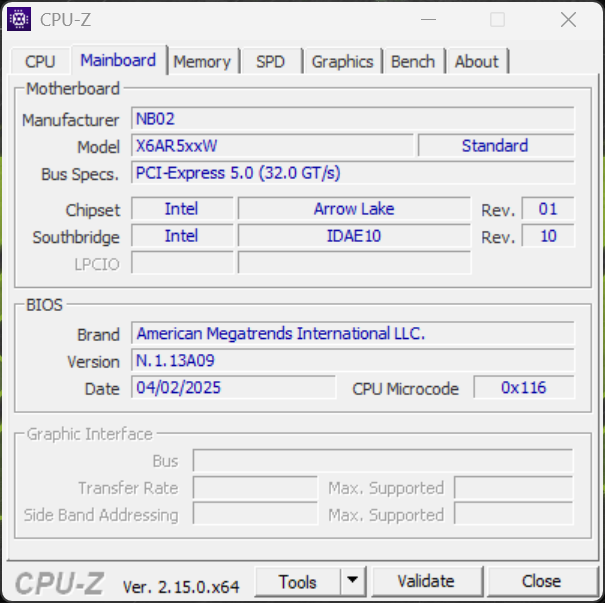
外壳和连接
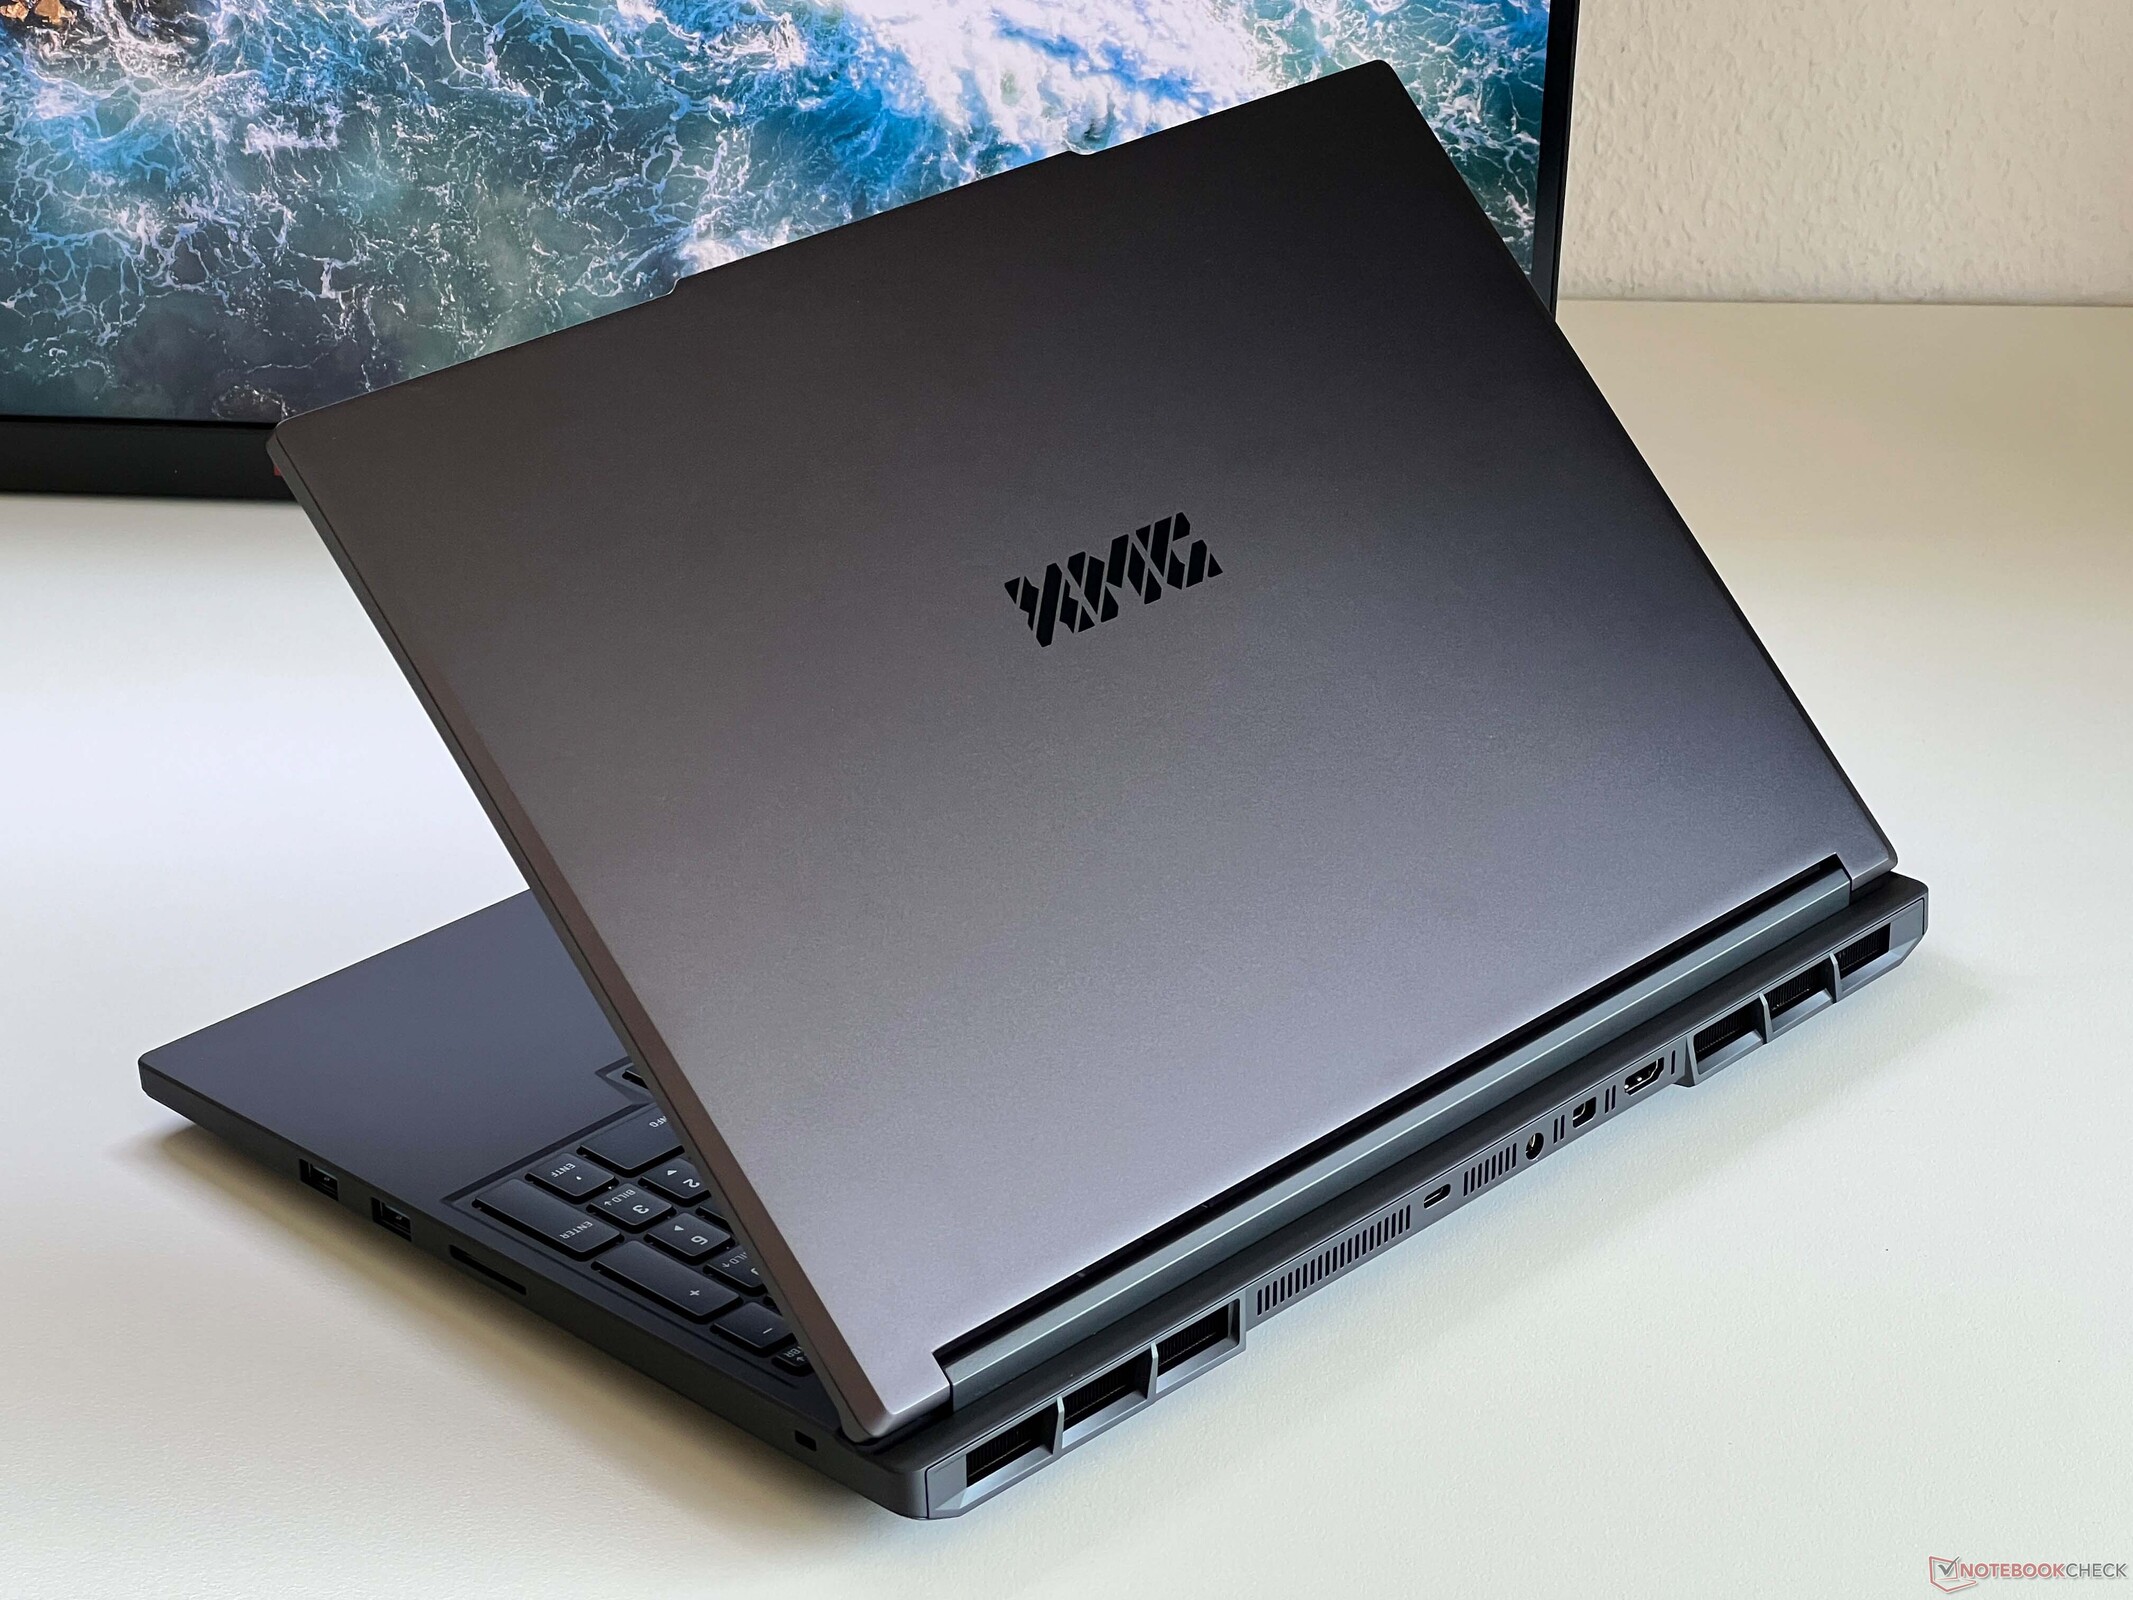
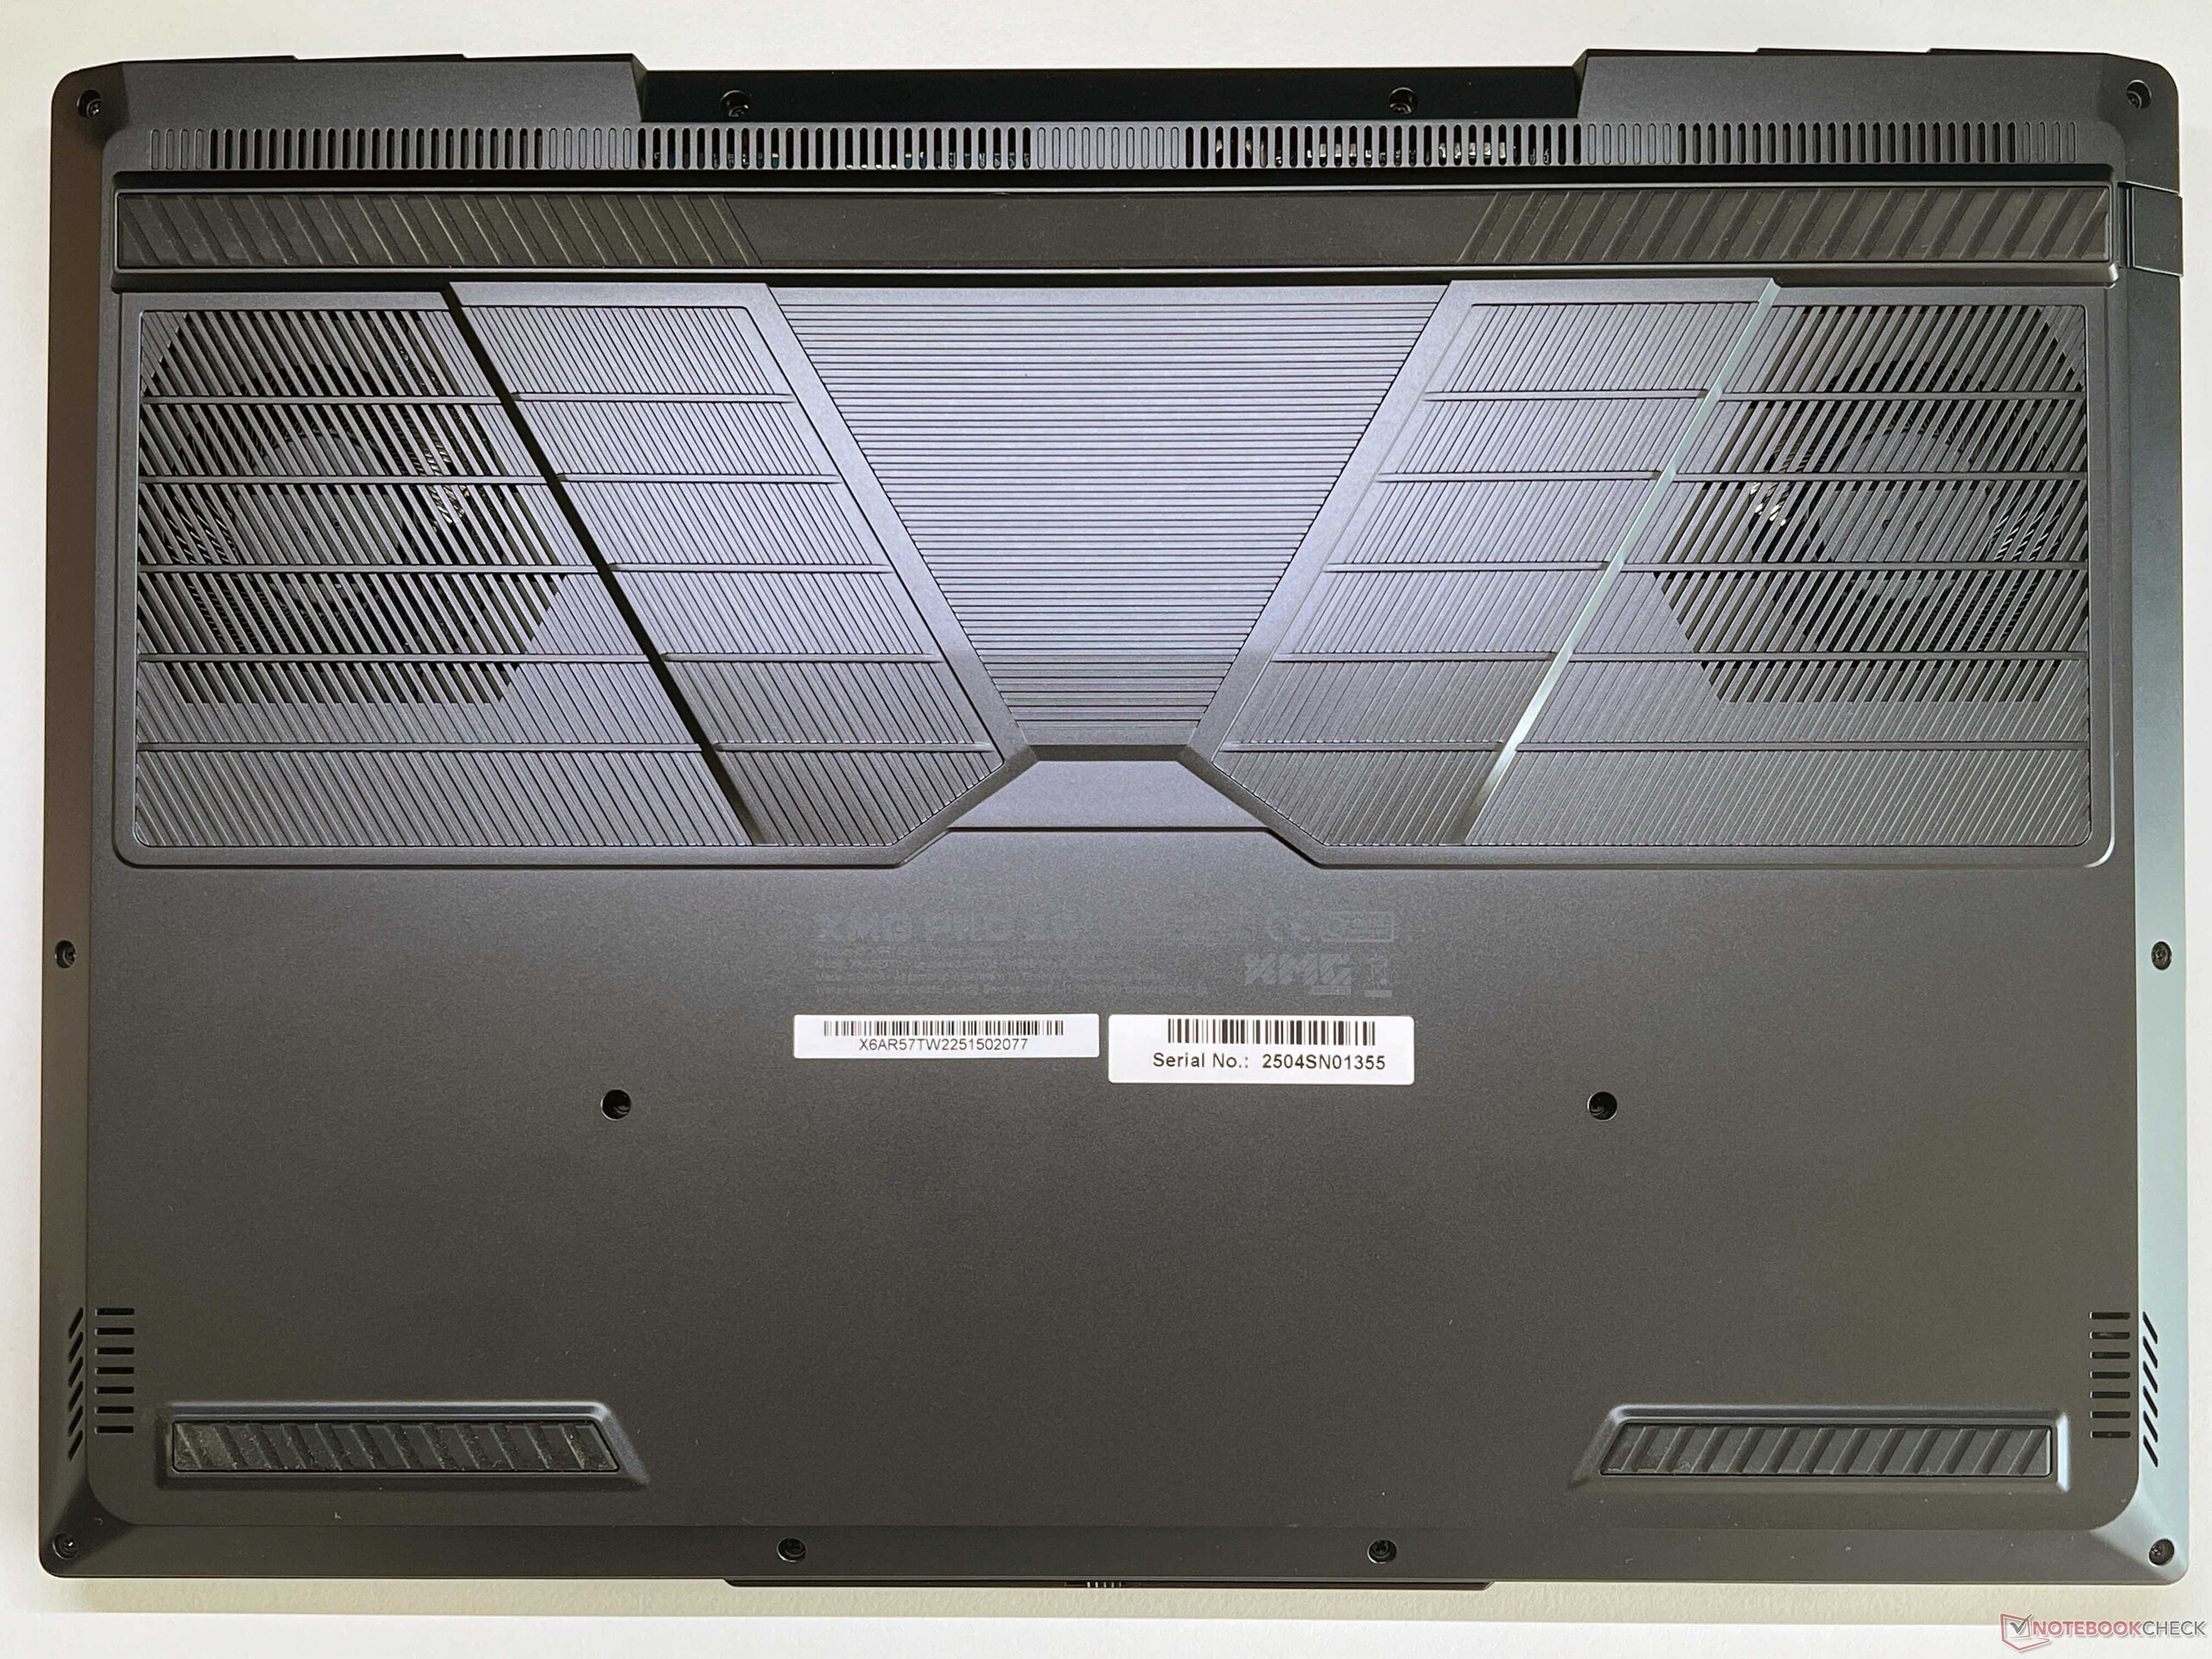
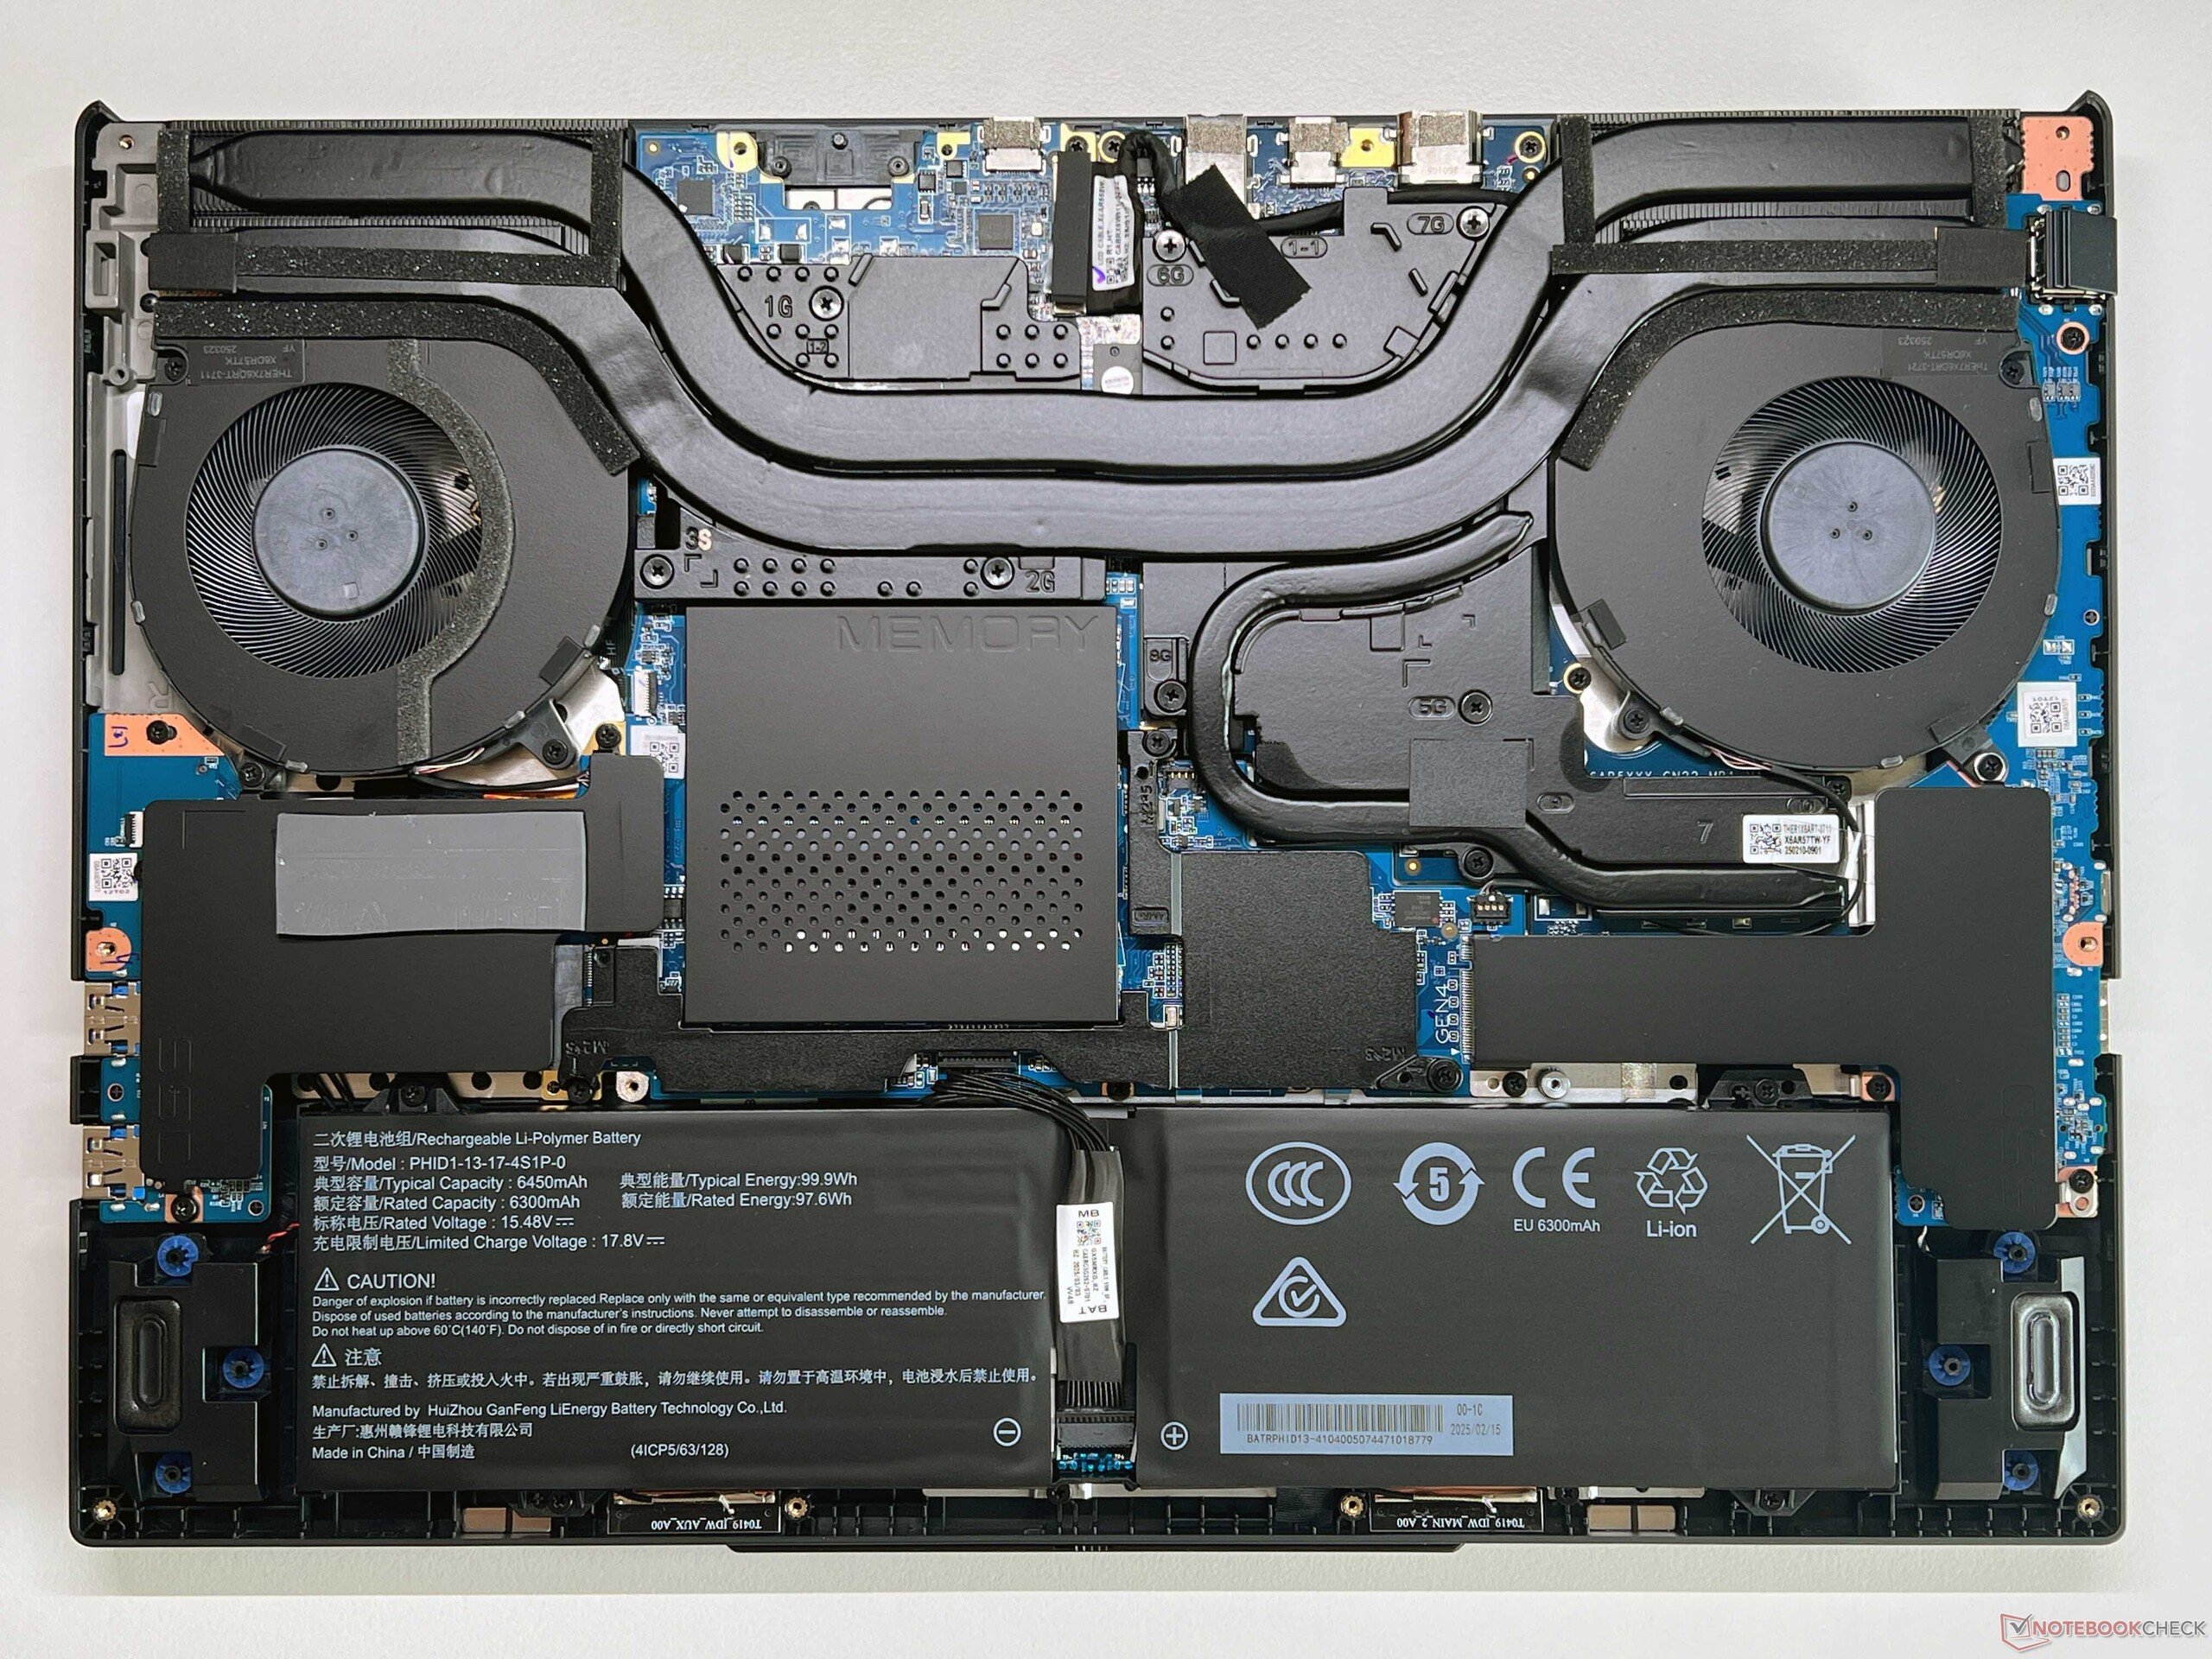
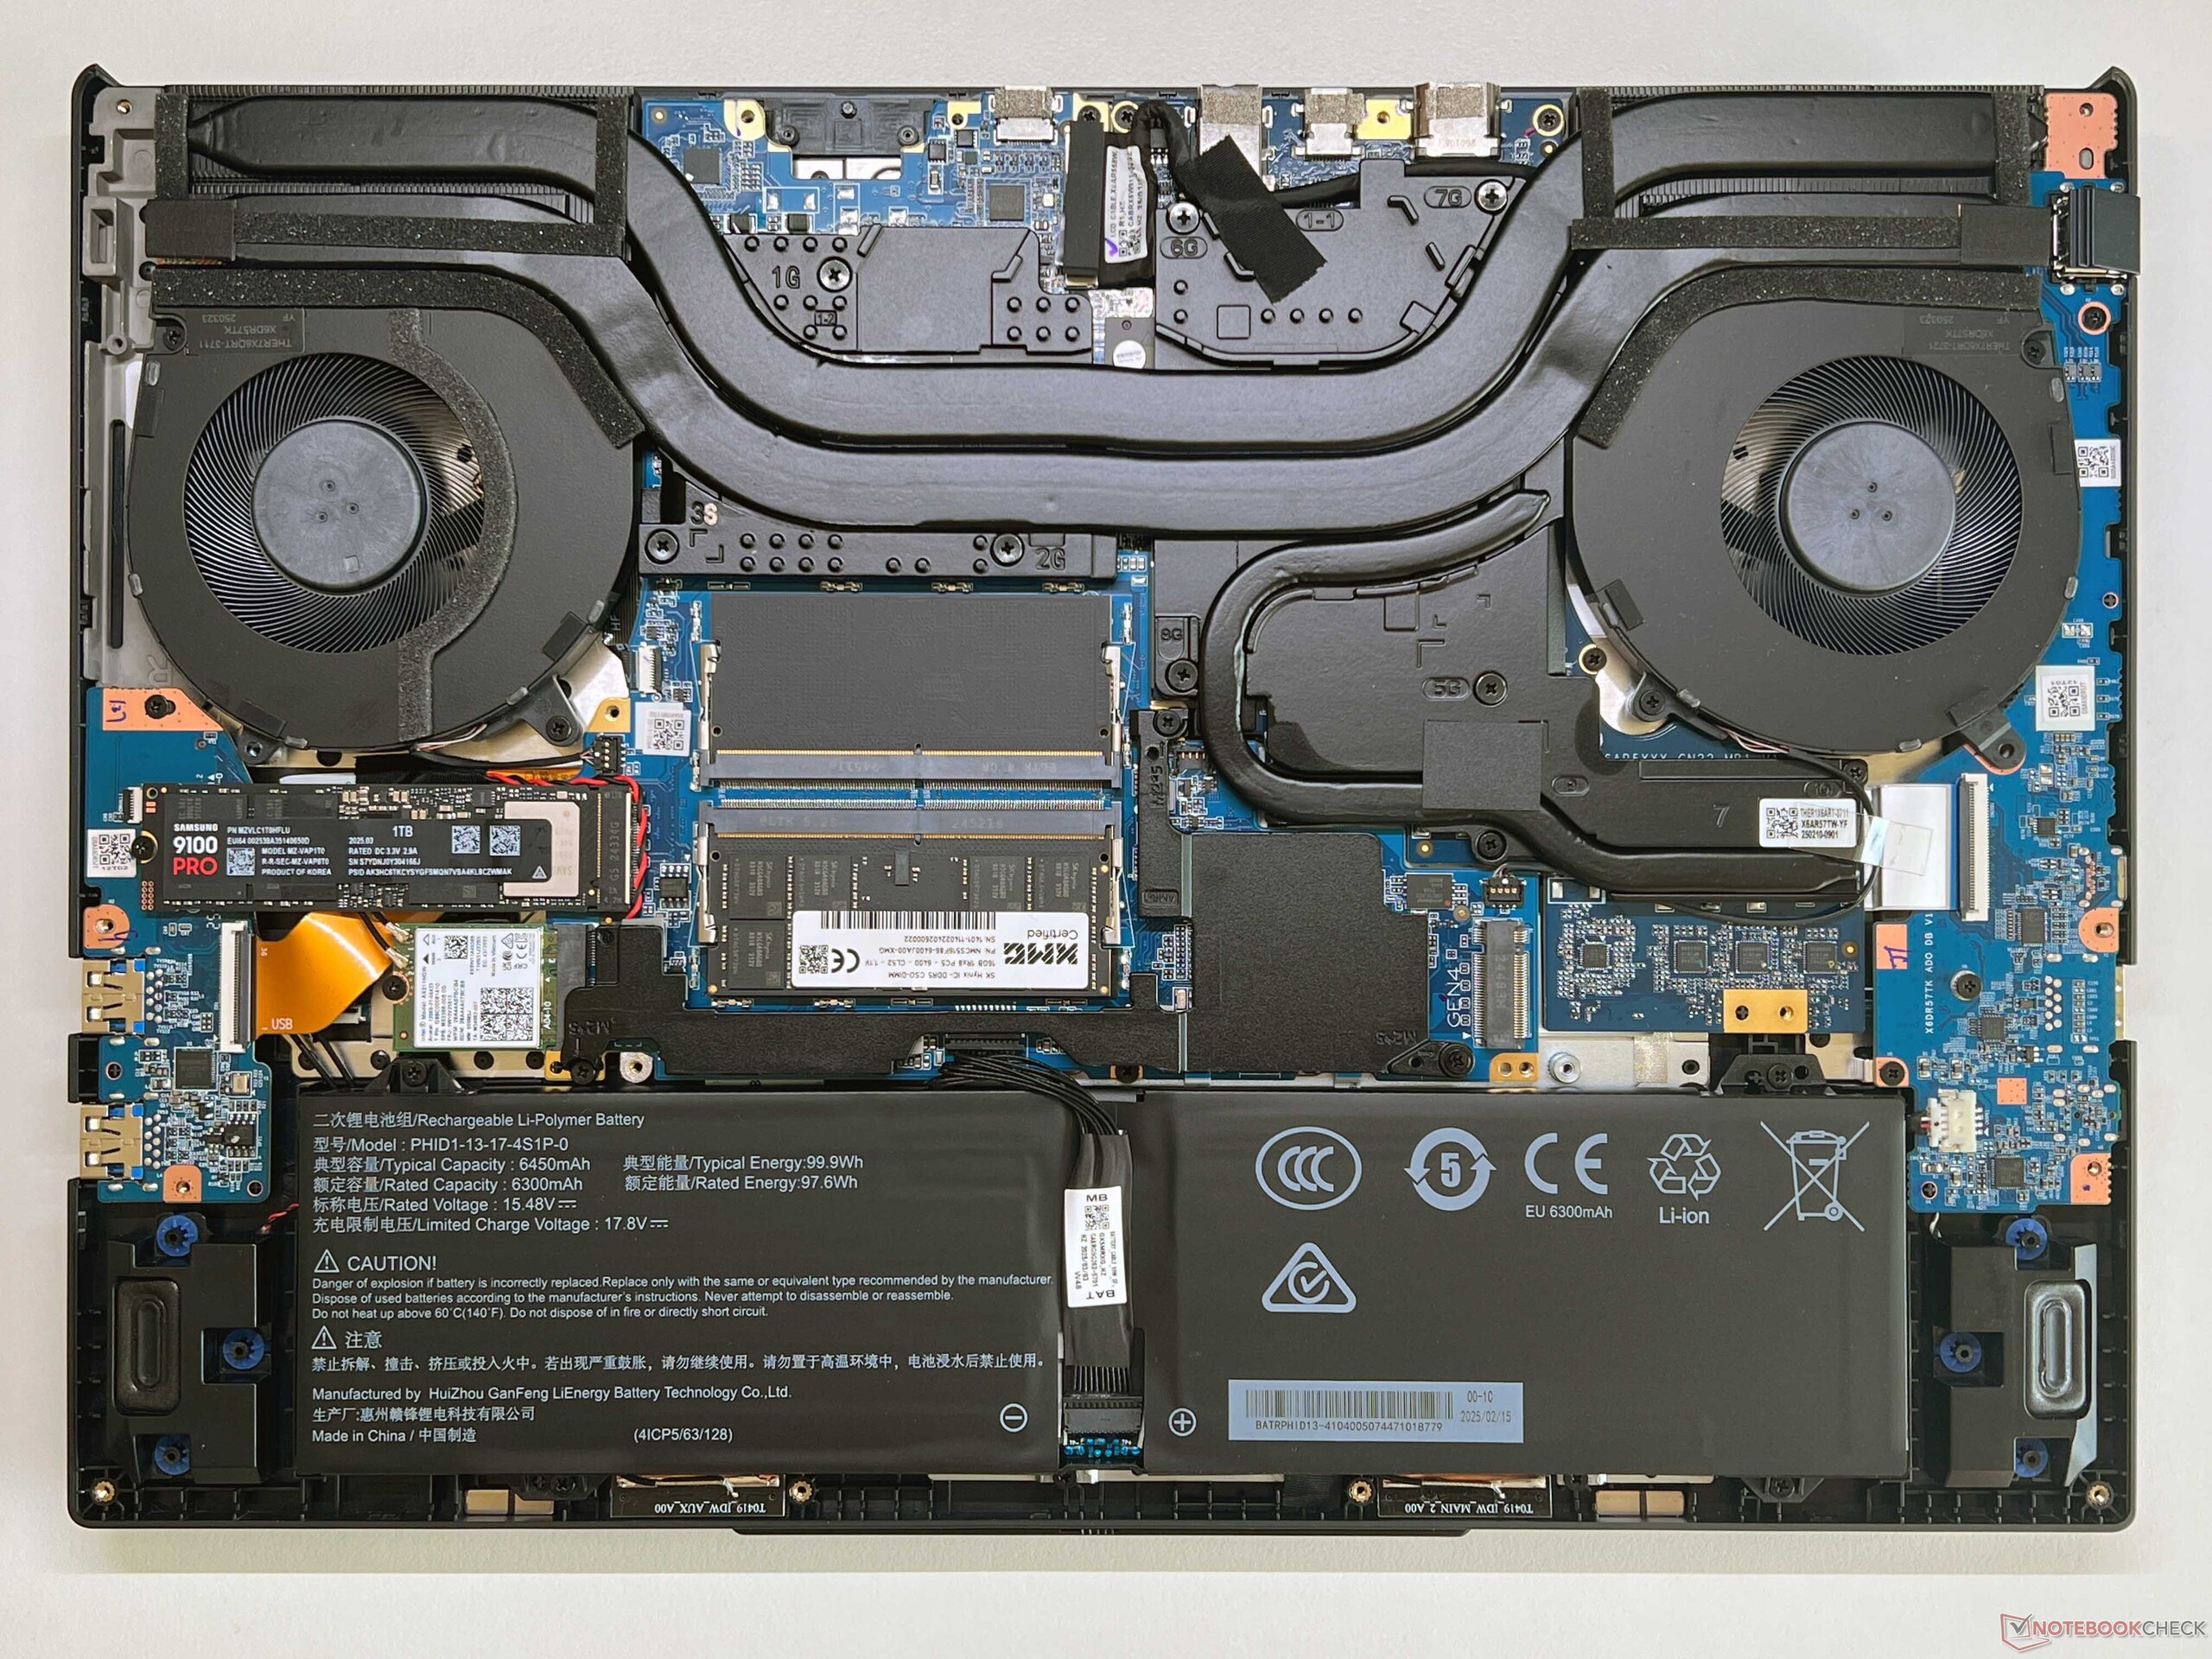
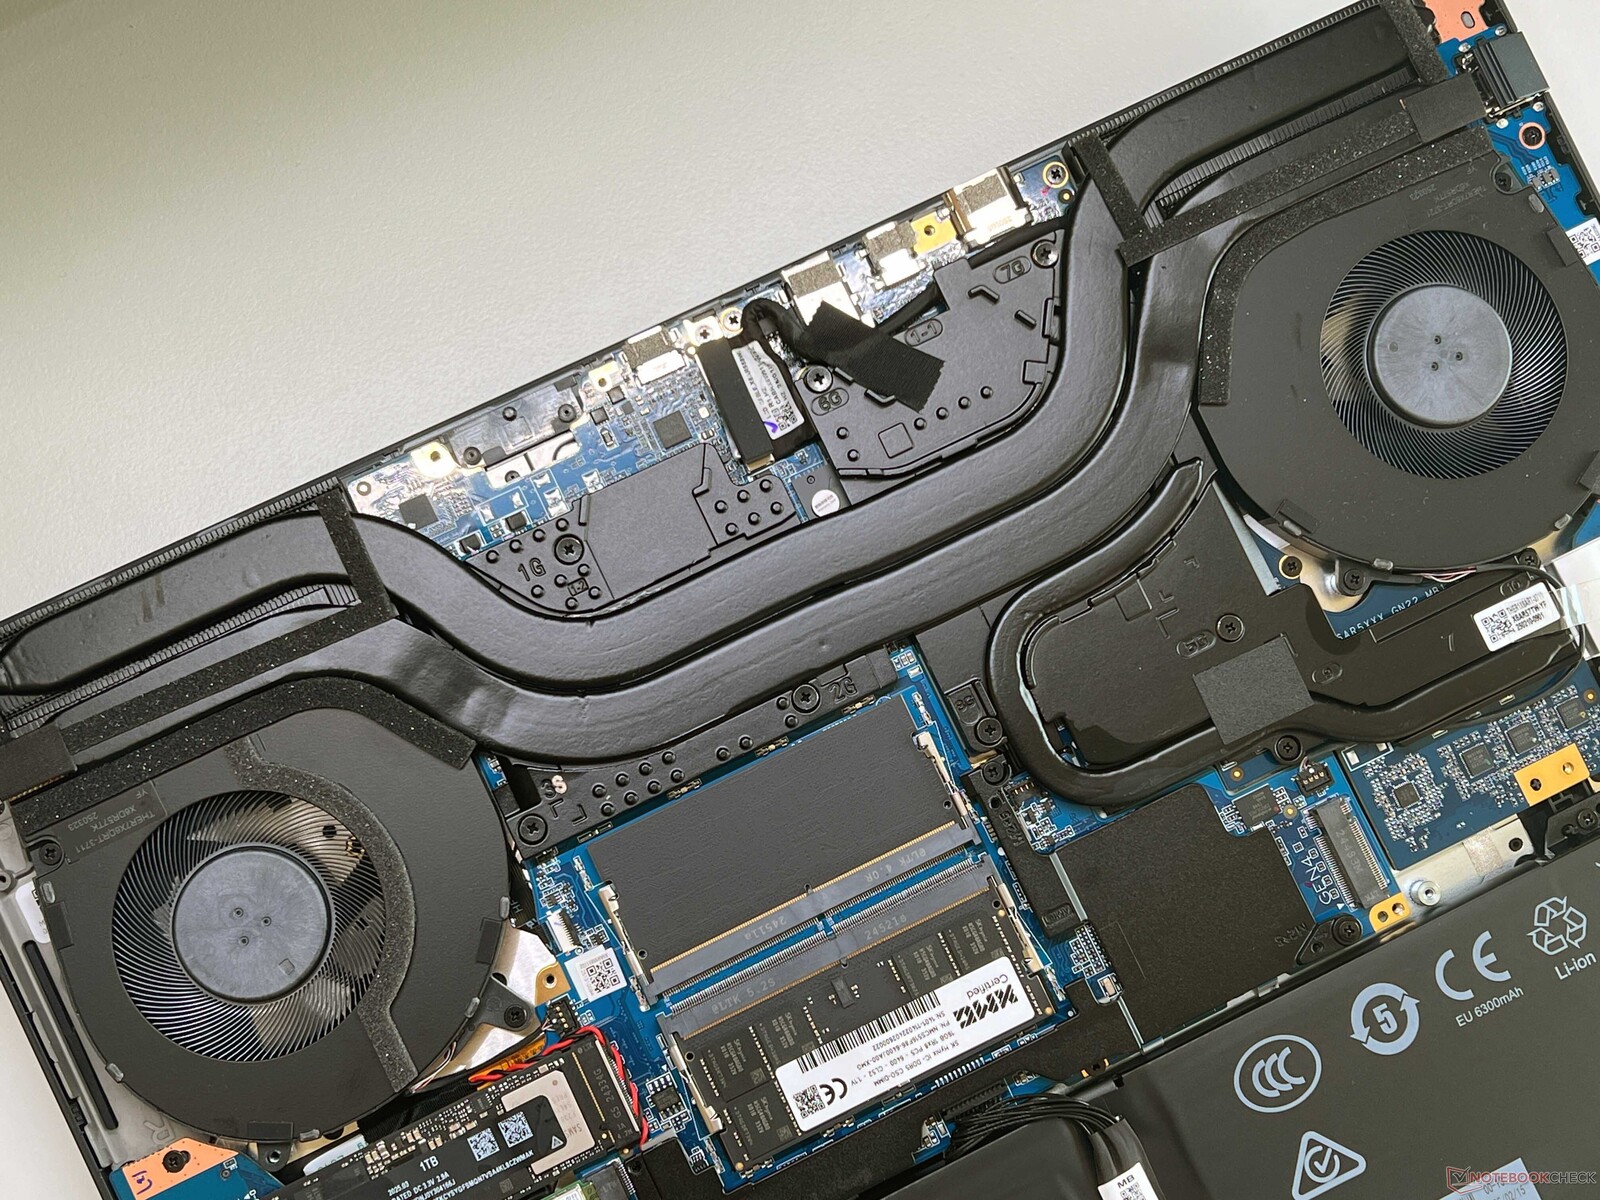
XMG Pro 16 的外壳为烟灰色,看起来非常低调,而且没有任何照明元素。它的盖子由铝制成,而底座和显示屏框架则由塑料制成。从质量角度来看,我们对其稳定性和表面处理没有任何负面意见,但其表面积聚了大量污垢。铰链调节良好(最大开启角度接近 180 度),我们在测试过程中只注意到很小的摇晃。底盖由 12 颗十字螺丝固定,可以轻松取下。在内部,你可以看到风扇、电池、WLAN 模块、两个固态硬盘插槽和两个内存插槽。不过,有些部件(包括散热垫)位于额外的螺丝固定盖下,这就增加了拆卸的难度。
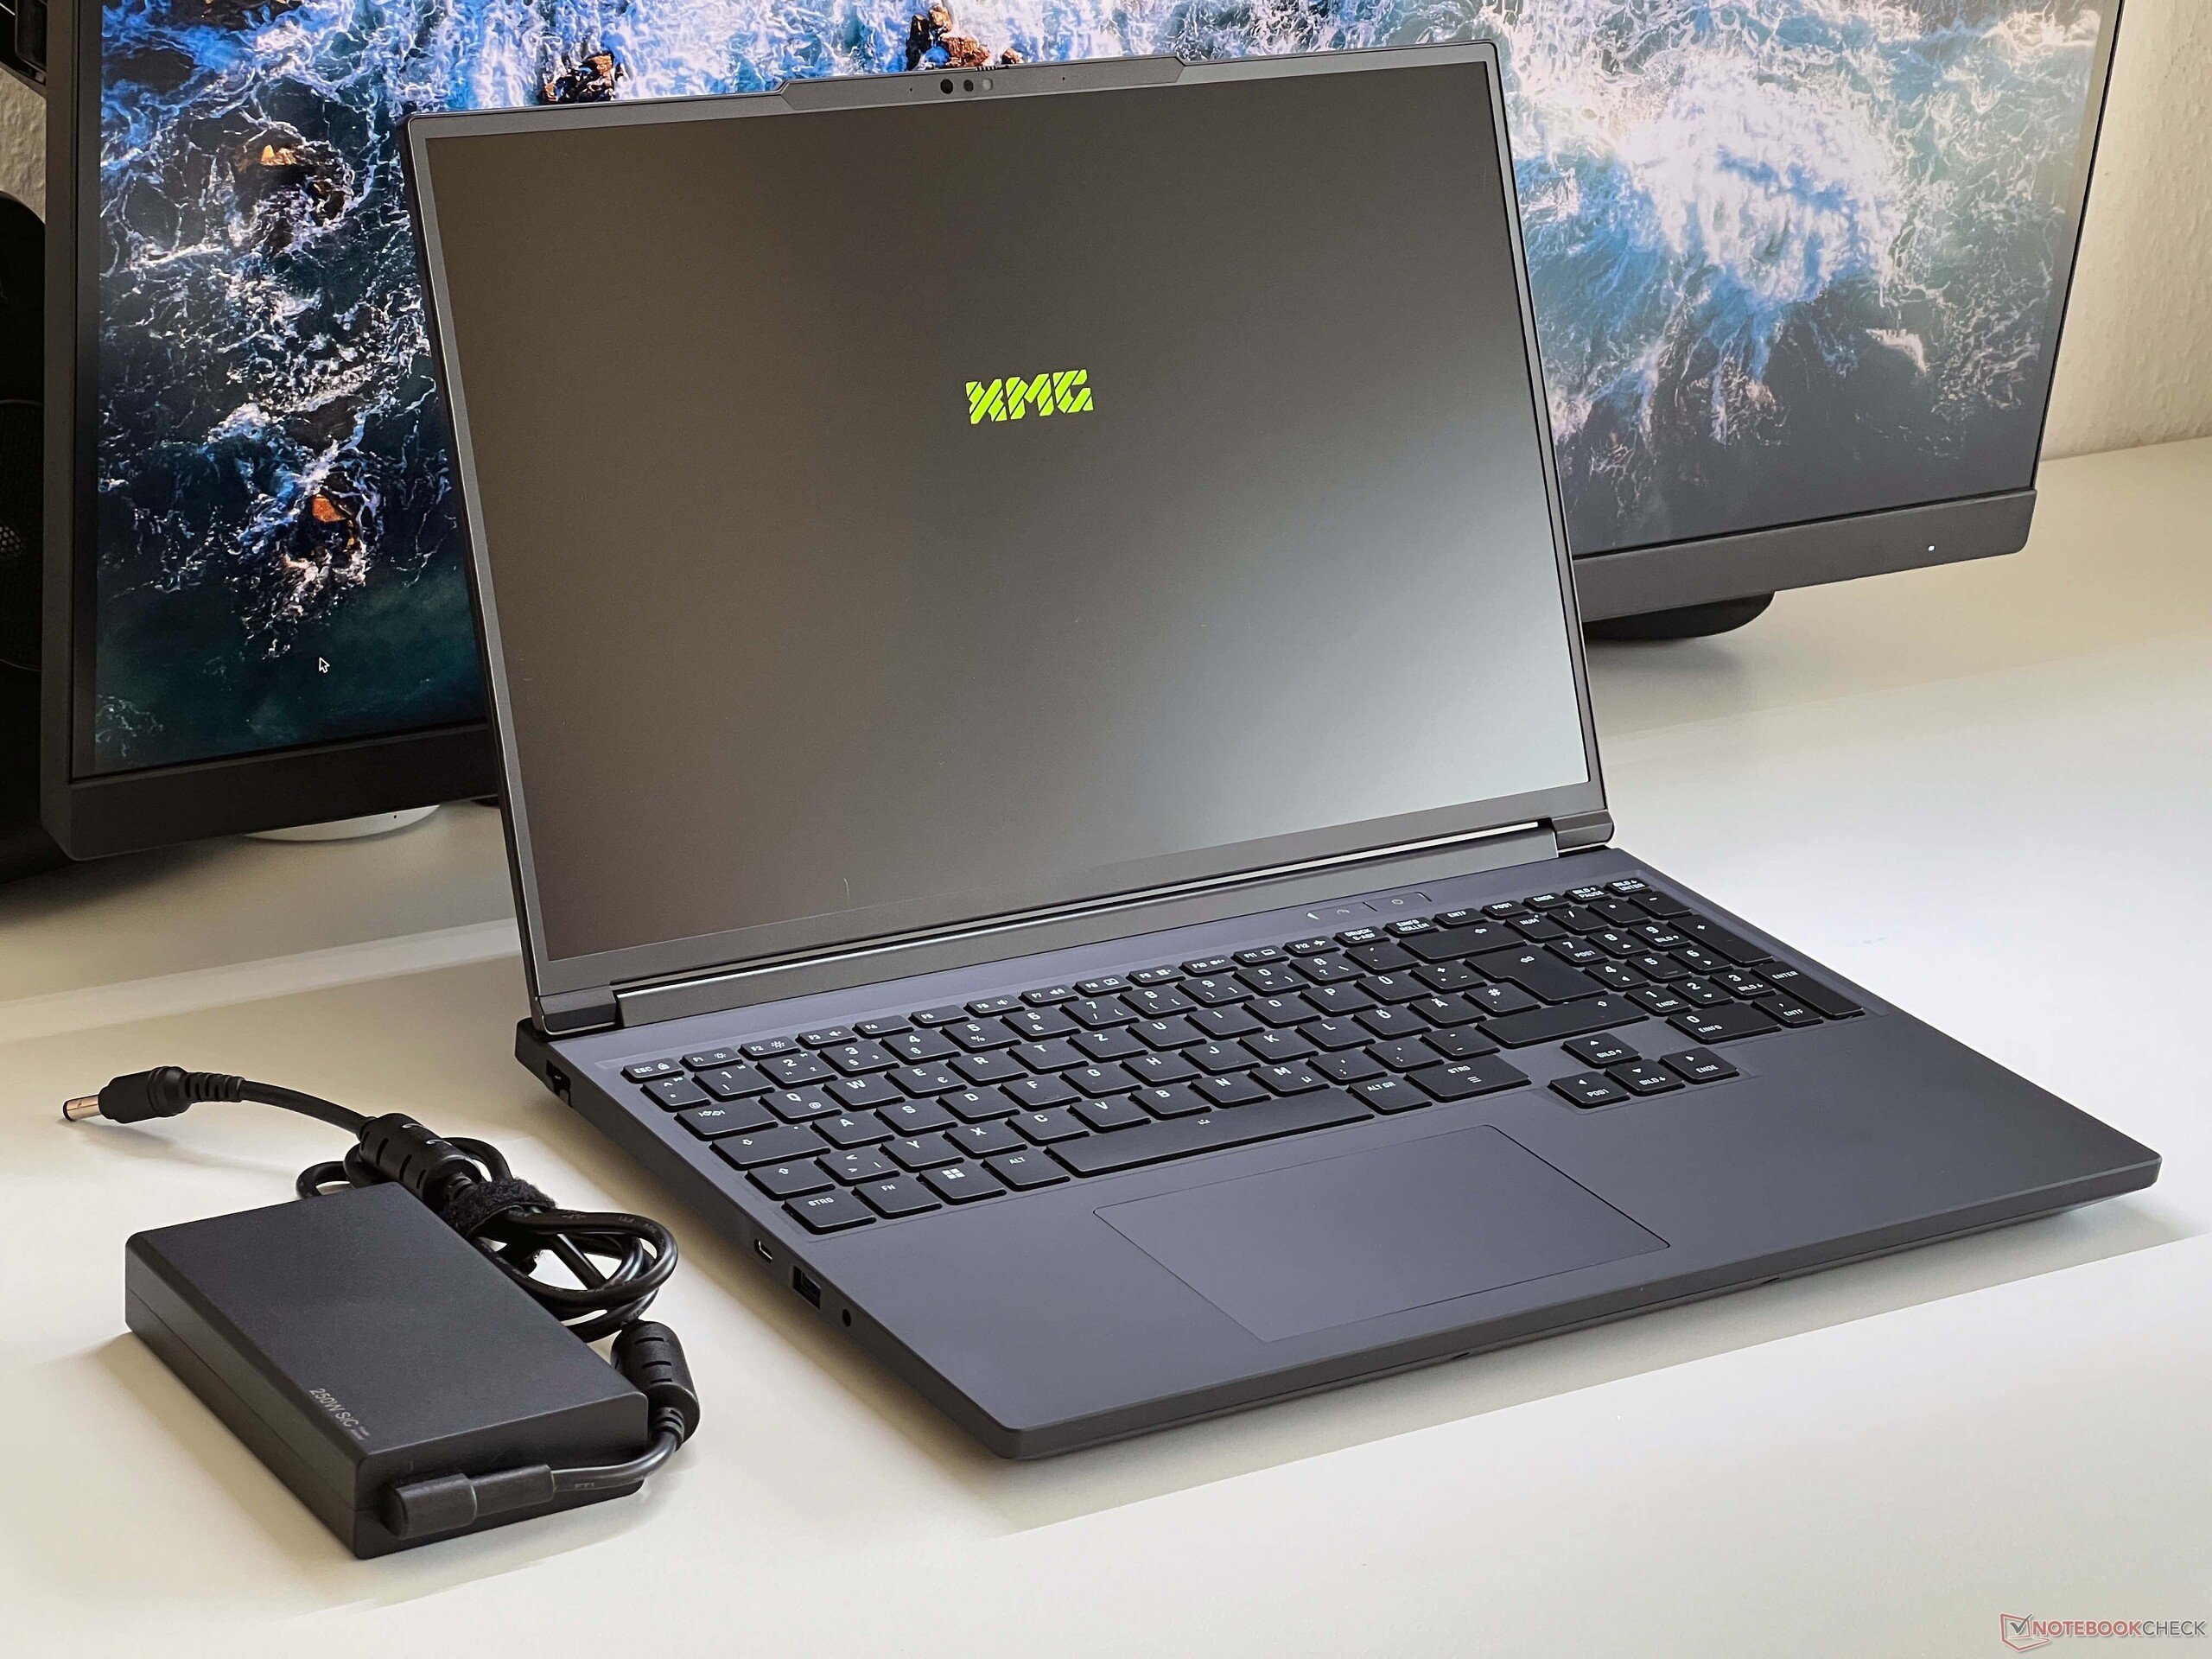
Pro 16 的用户将不得不放弃 Thunderbolt 5,但除此之外,其连接性还不错。它的端口分布对于日常使用非常实用,而且与目前许多竞争对手不同的是,它还在背面设有接口。它的全功能读卡器速度非常快,Wi-Fi 模块工作稳定,但还不支持 Wi-Fi 7 标准。该设备的 1080p 网络摄像头配有机械快门,拍照效果一般。它不是 Copilot+ 笔记本电脑,但支持网络摄像头的 Studio Effects 和实时字幕。


| SD Card Reader | |
| average JPG Copy Test (av. of 3 runs) | |
| Schenker XMG Pro 16 (E25) (Angelbird AV Pro V60) | |
| Average of class Gaming (20.9 - 210, n=55, last 2 years) | |
| Schenker XMG Pro 16 Studio (Mid 24) (AV PRO microSD 128 GB V60) | |
| maximum AS SSD Seq Read Test (1GB) | |
| Schenker XMG Pro 16 (E25) (Angelbird AV Pro V60) | |
| Average of class Gaming (25.5 - 261, n=52, last 2 years) | |
| Schenker XMG Pro 16 Studio (Mid 24) (AV PRO microSD 128 GB V60) | |
| Networking | |
| Schenker XMG Pro 16 (E25) | |
| iperf3 transmit AXE11000 | |
| iperf3 receive AXE11000 | |
| Schenker XMG Pro 16 Studio (Mid 24) | |
| iperf3 transmit AXE11000 | |
| iperf3 receive AXE11000 | |
| Asus ROG Strix G16 G615 | |
| iperf3 transmit AXE11000 | |
| iperf3 receive AXE11000 | |
| Tuxedo Sirius 16 Gen 1 | |
| iperf3 transmit AXE11000 | |
| iperf3 receive AXE11000 | |
| iperf3 transmit AXE11000 6GHz | |
| iperf3 receive AXE11000 6GHz | |
| Lenovo Legion Pro 5 16IRX9 | |
| iperf3 transmit AXE11000 | |
| iperf3 receive AXE11000 | |
| iperf3 transmit AXE11000 6GHz | |
| iperf3 receive AXE11000 6GHz | |
| Lenovo Legion Pro 7i 16 Gen 10 | |
| iperf3 transmit AXE11000 | |
| iperf3 receive AXE11000 | |
| iperf3 transmit AXE11000 6GHz | |
| iperf3 receive AXE11000 6GHz | |

 GeForce RTX 5070 Ti Laptop, Ultra 9 275HX, Samsung 9100 Pro 1 TB")
 GeForce RTX 5070 Ti Laptop, Ultra 9 275HX, Samsung 9100 Pro 1 TB")
可持续性
全球国际货运公司尚未提供任何有关该笔记本电脑二氧化碳排放量或环保认证的信息。其包装几乎完全由纸/纸板组成。
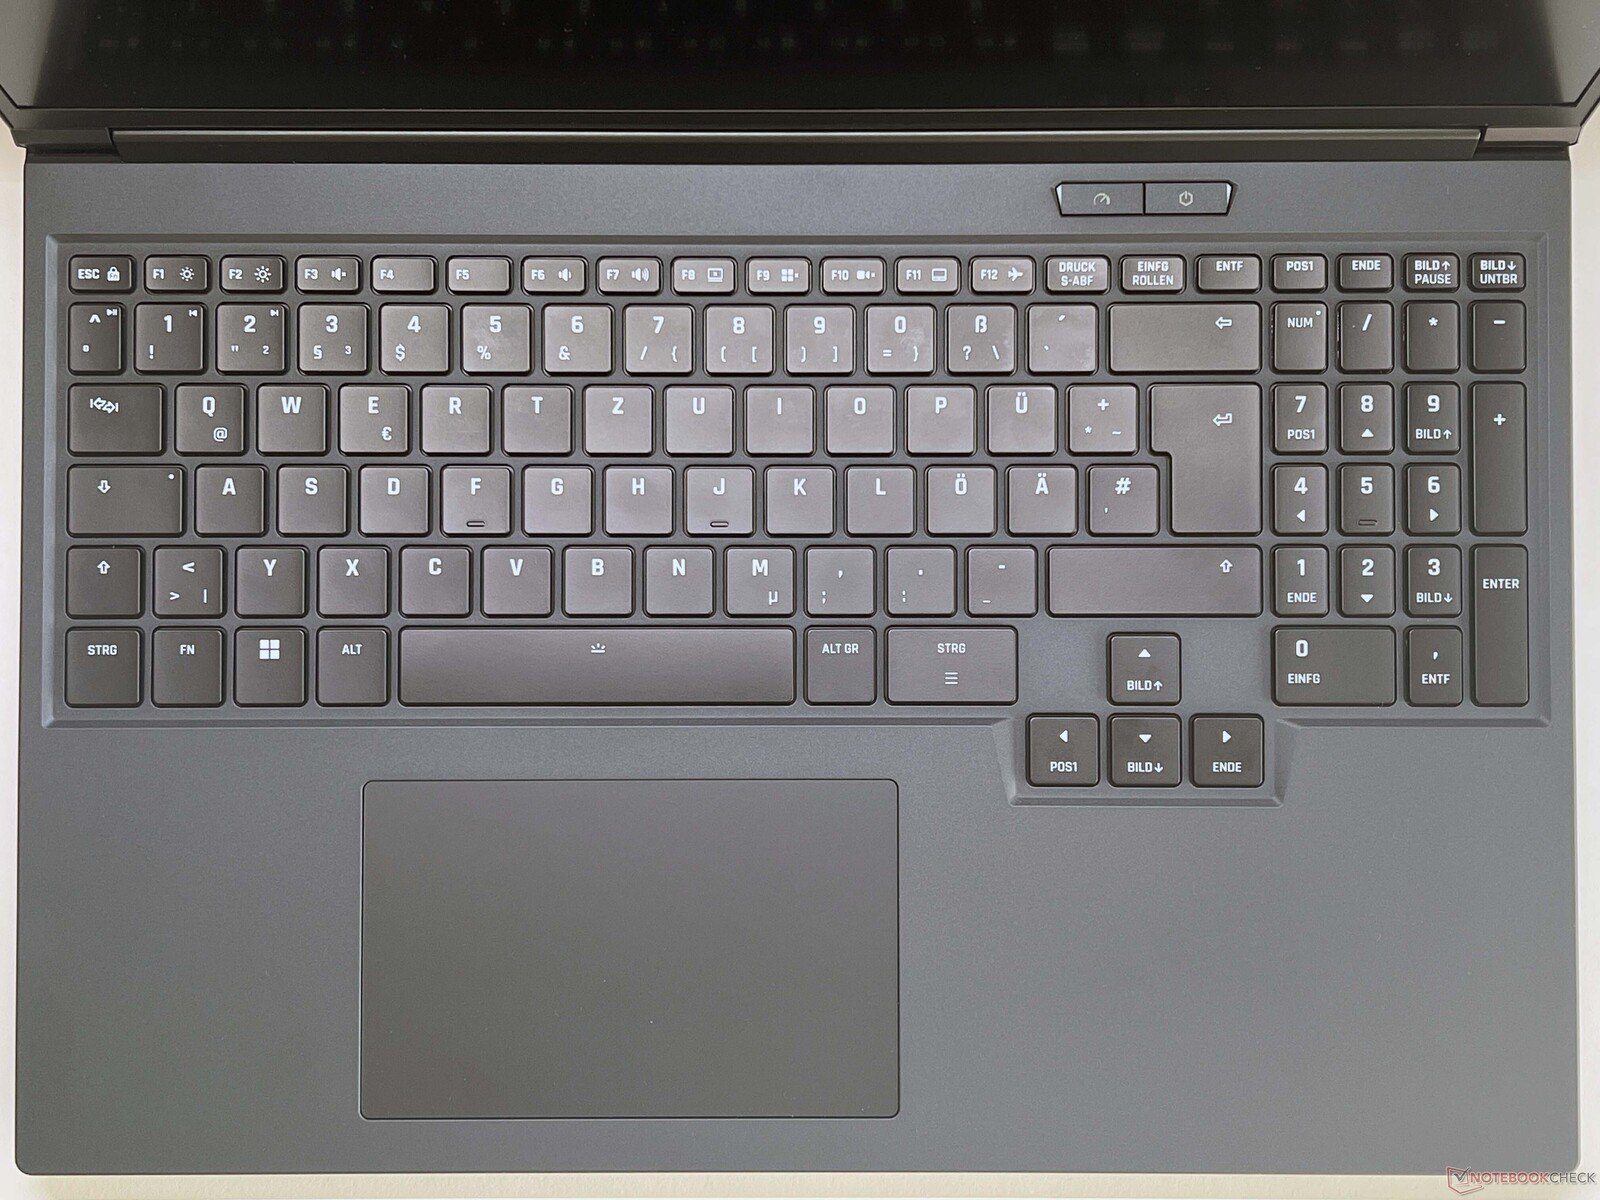
输入设备
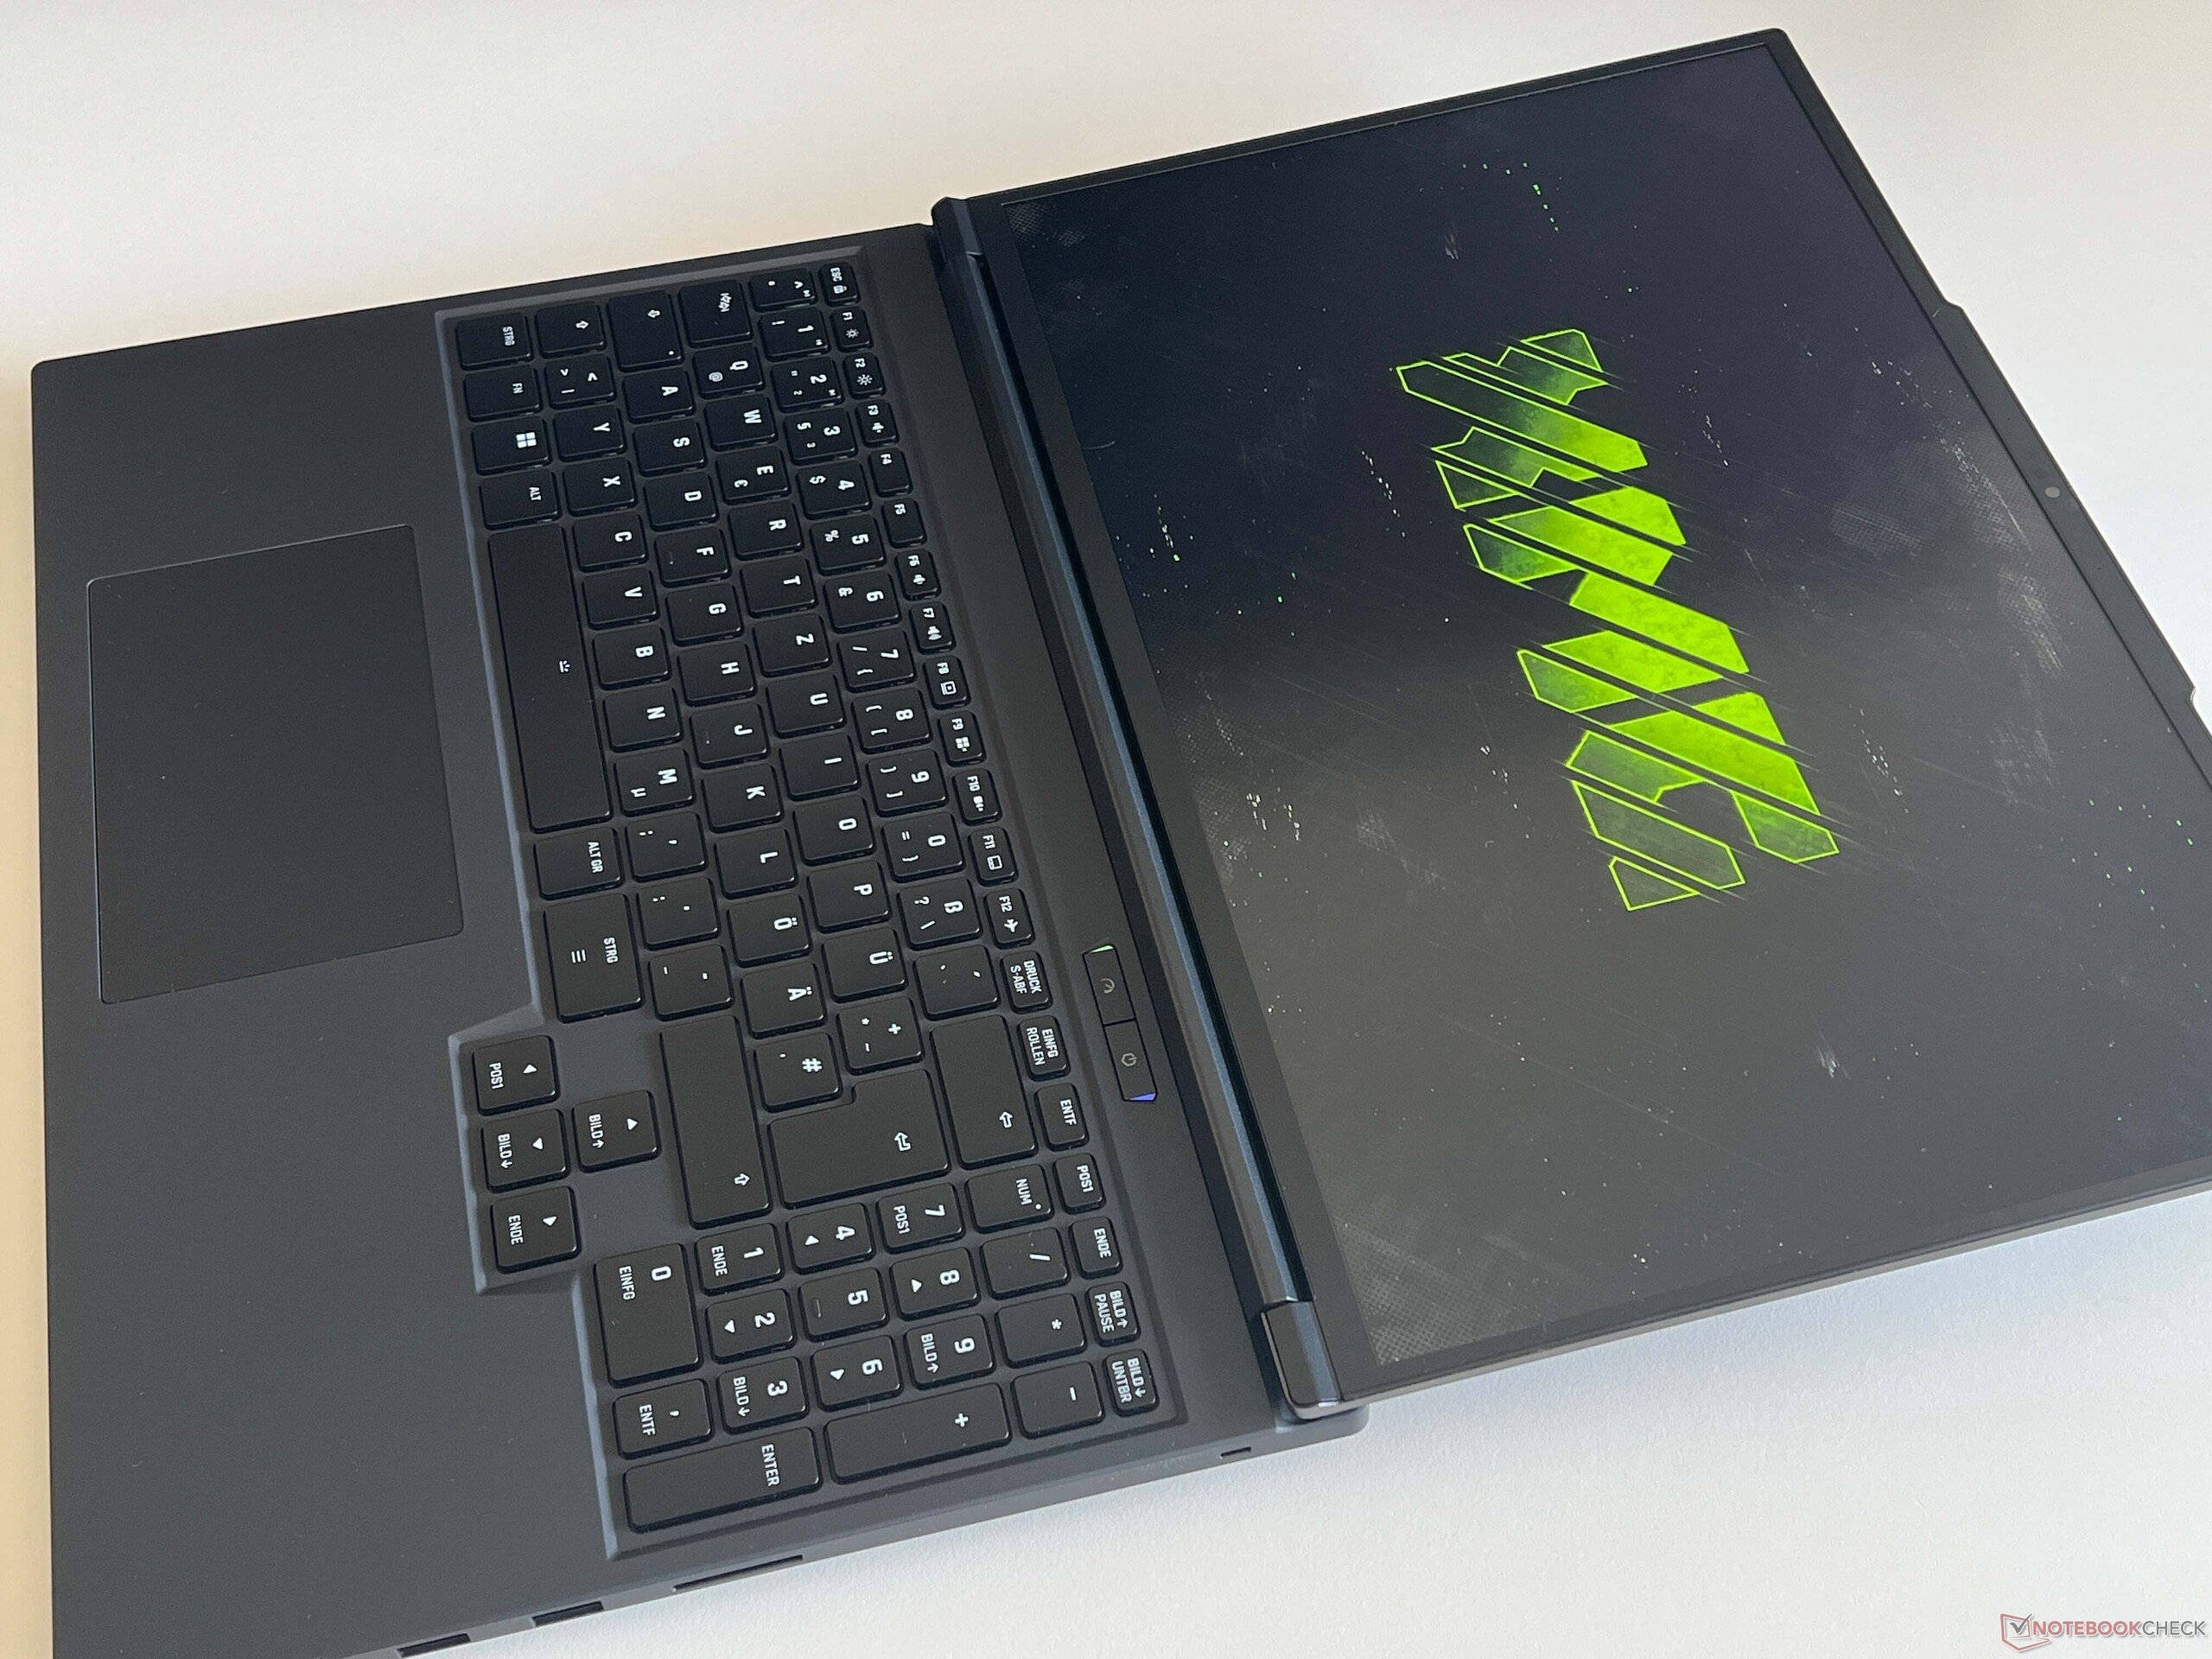
其键盘布局现在与 Neo 16包括偏移方向键,输入感觉非常舒适--尽管比不上它更昂贵的兄弟。不过,你甚至可以顺利地书写长篇文字。它具有独立的按键背光(四种强度级别),你可以在颜色上发挥创意。它的 ClickPad 虽然变小了一些(12.2 x 7.8 厘米),但仍然足够大。它发出的机械 "咔嗒 "声听起来相当响亮,但手感舒适顺滑。

显示屏 - IPS,300 赫兹

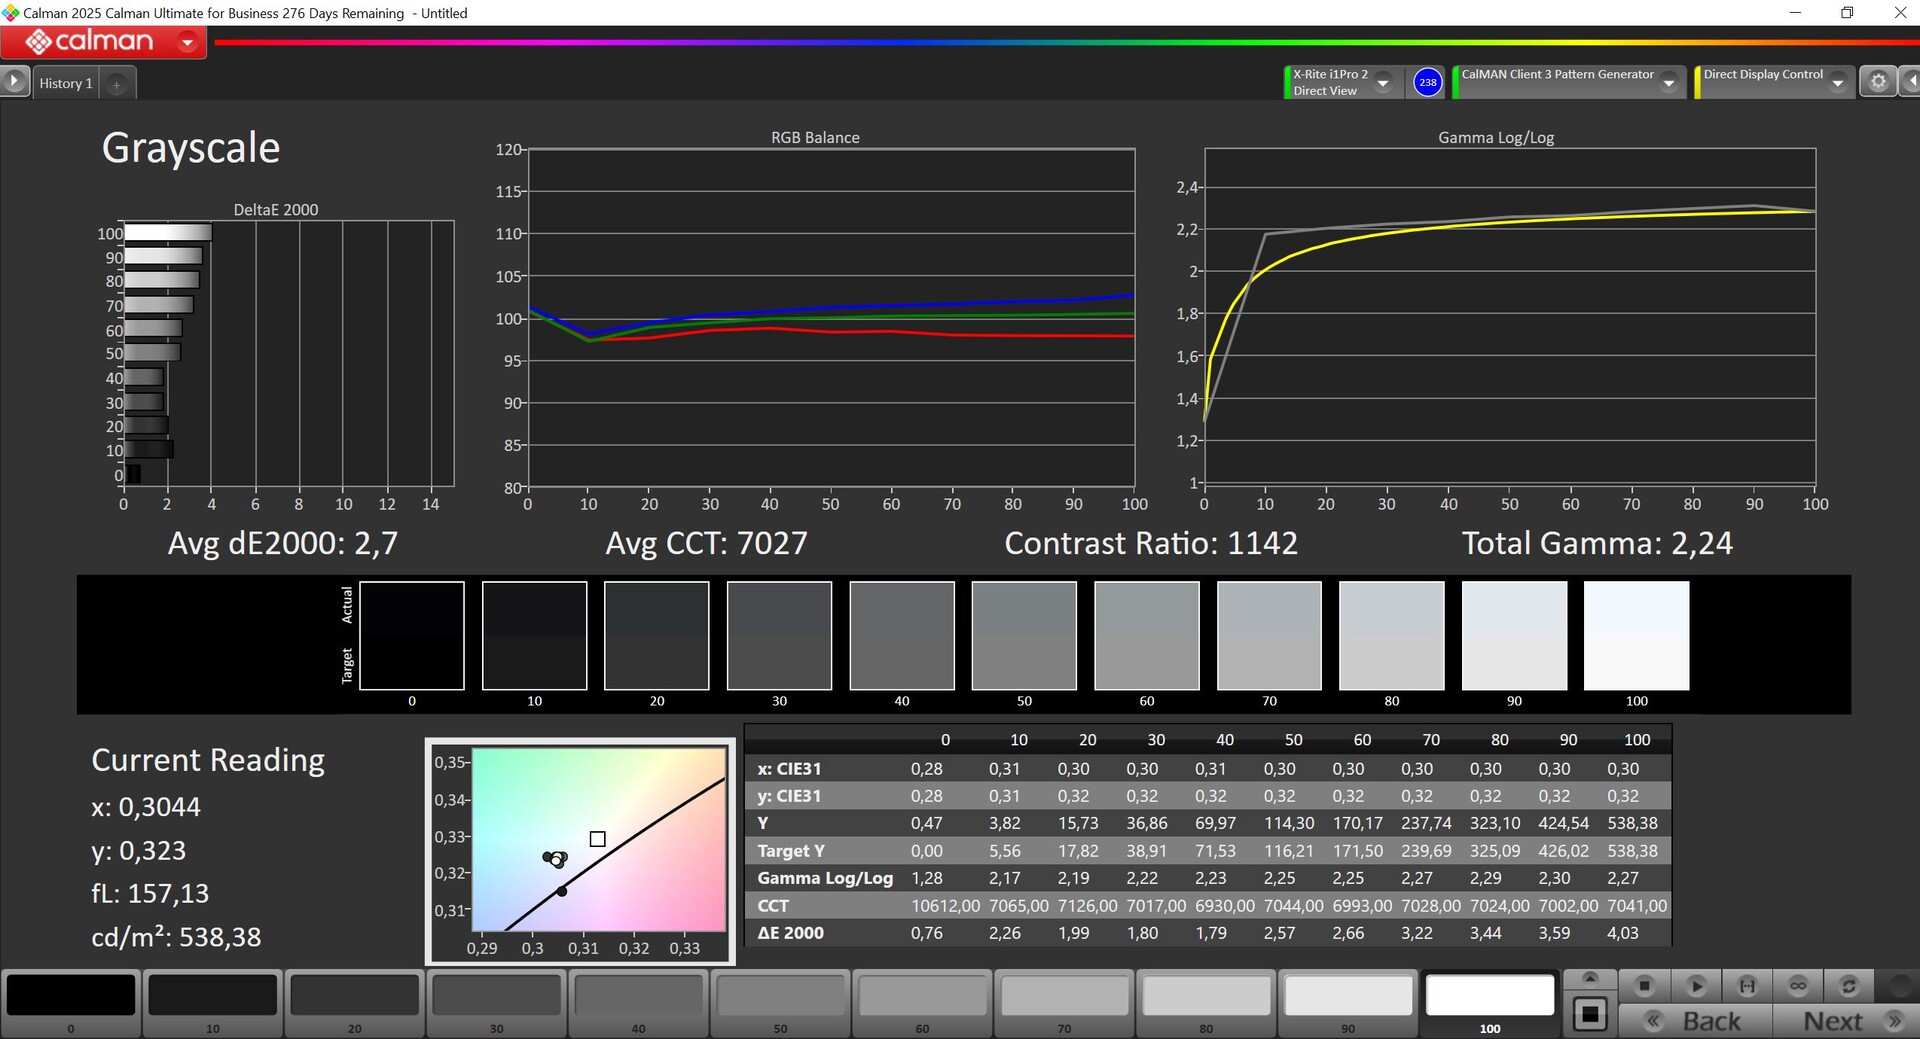
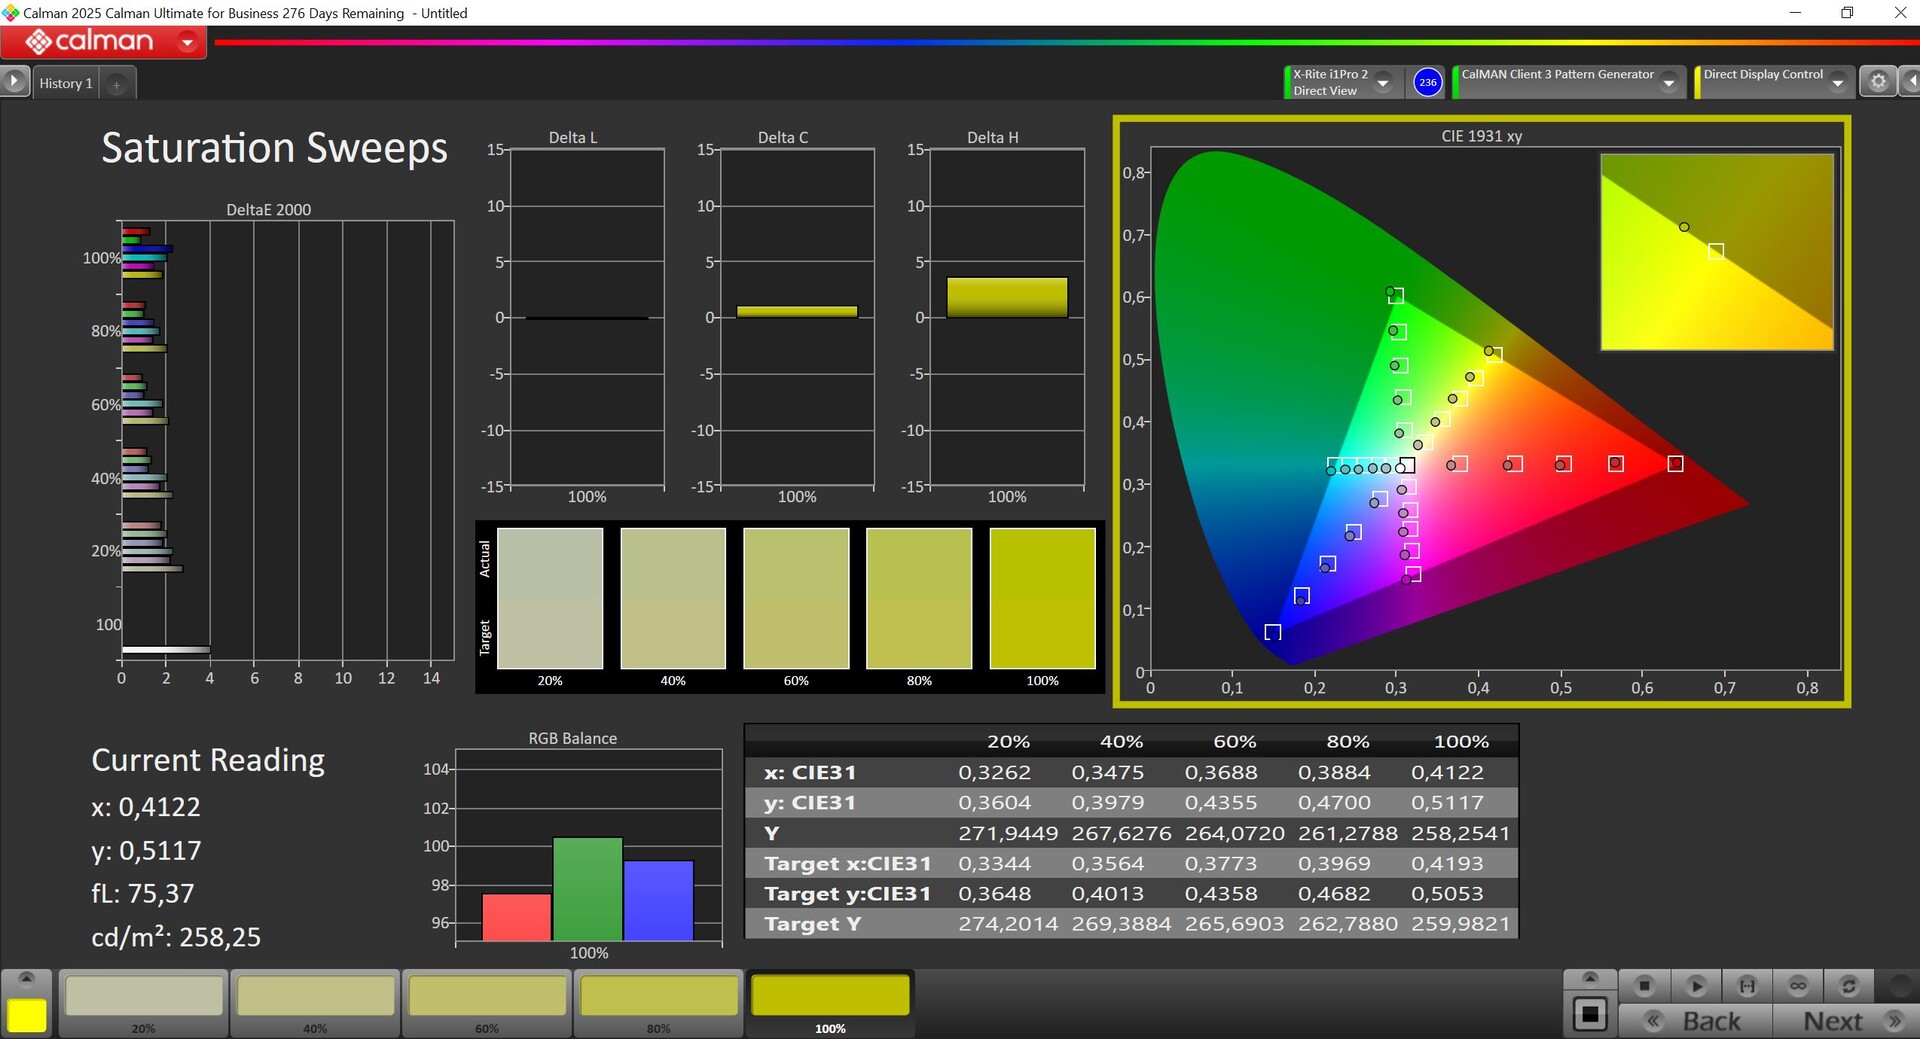
Pro 16 配备了 WQHD IPS 面板(2,560 x 1,600)。从主观上看,这款哑光面板的图像质量非常好,由于采用了 300 Hz 的刷新率,动作看起来非常流畅。其响应时间同样很快,而且我们没有发现 PWM 闪烁。
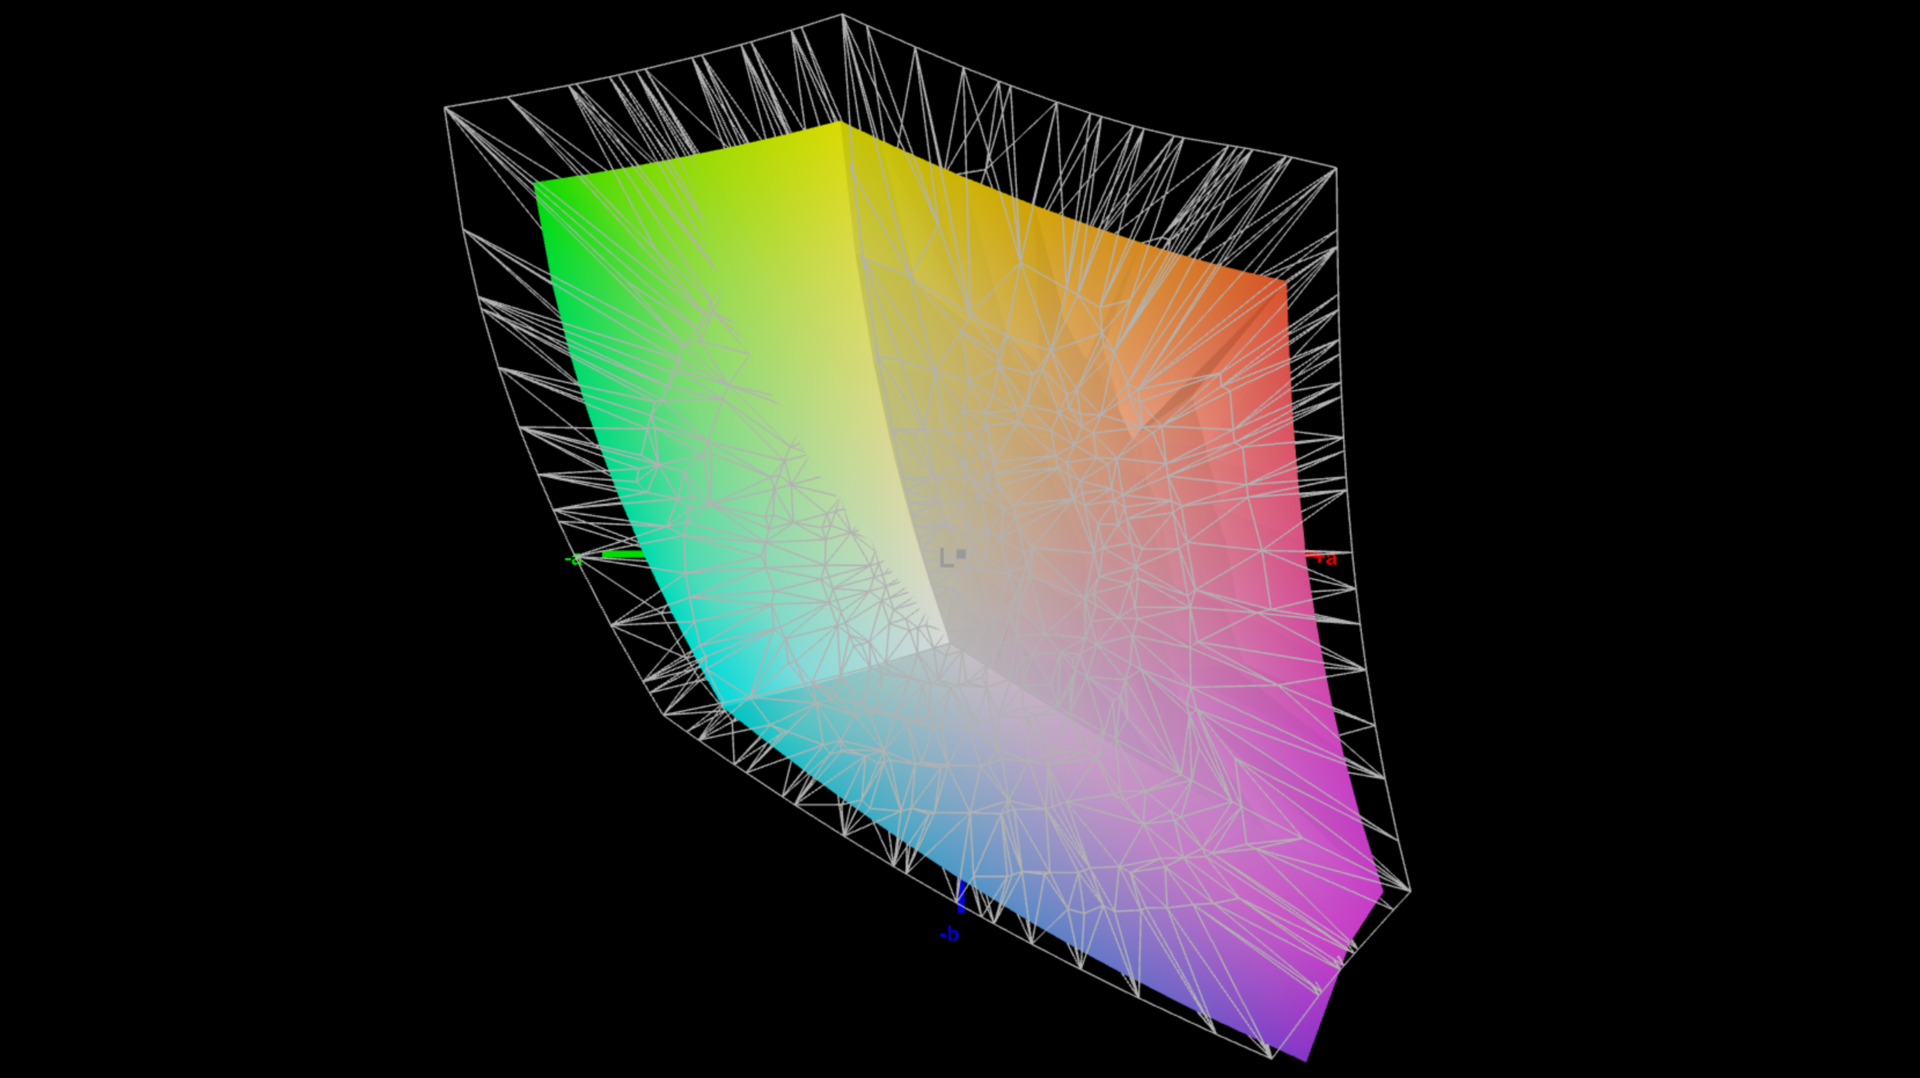
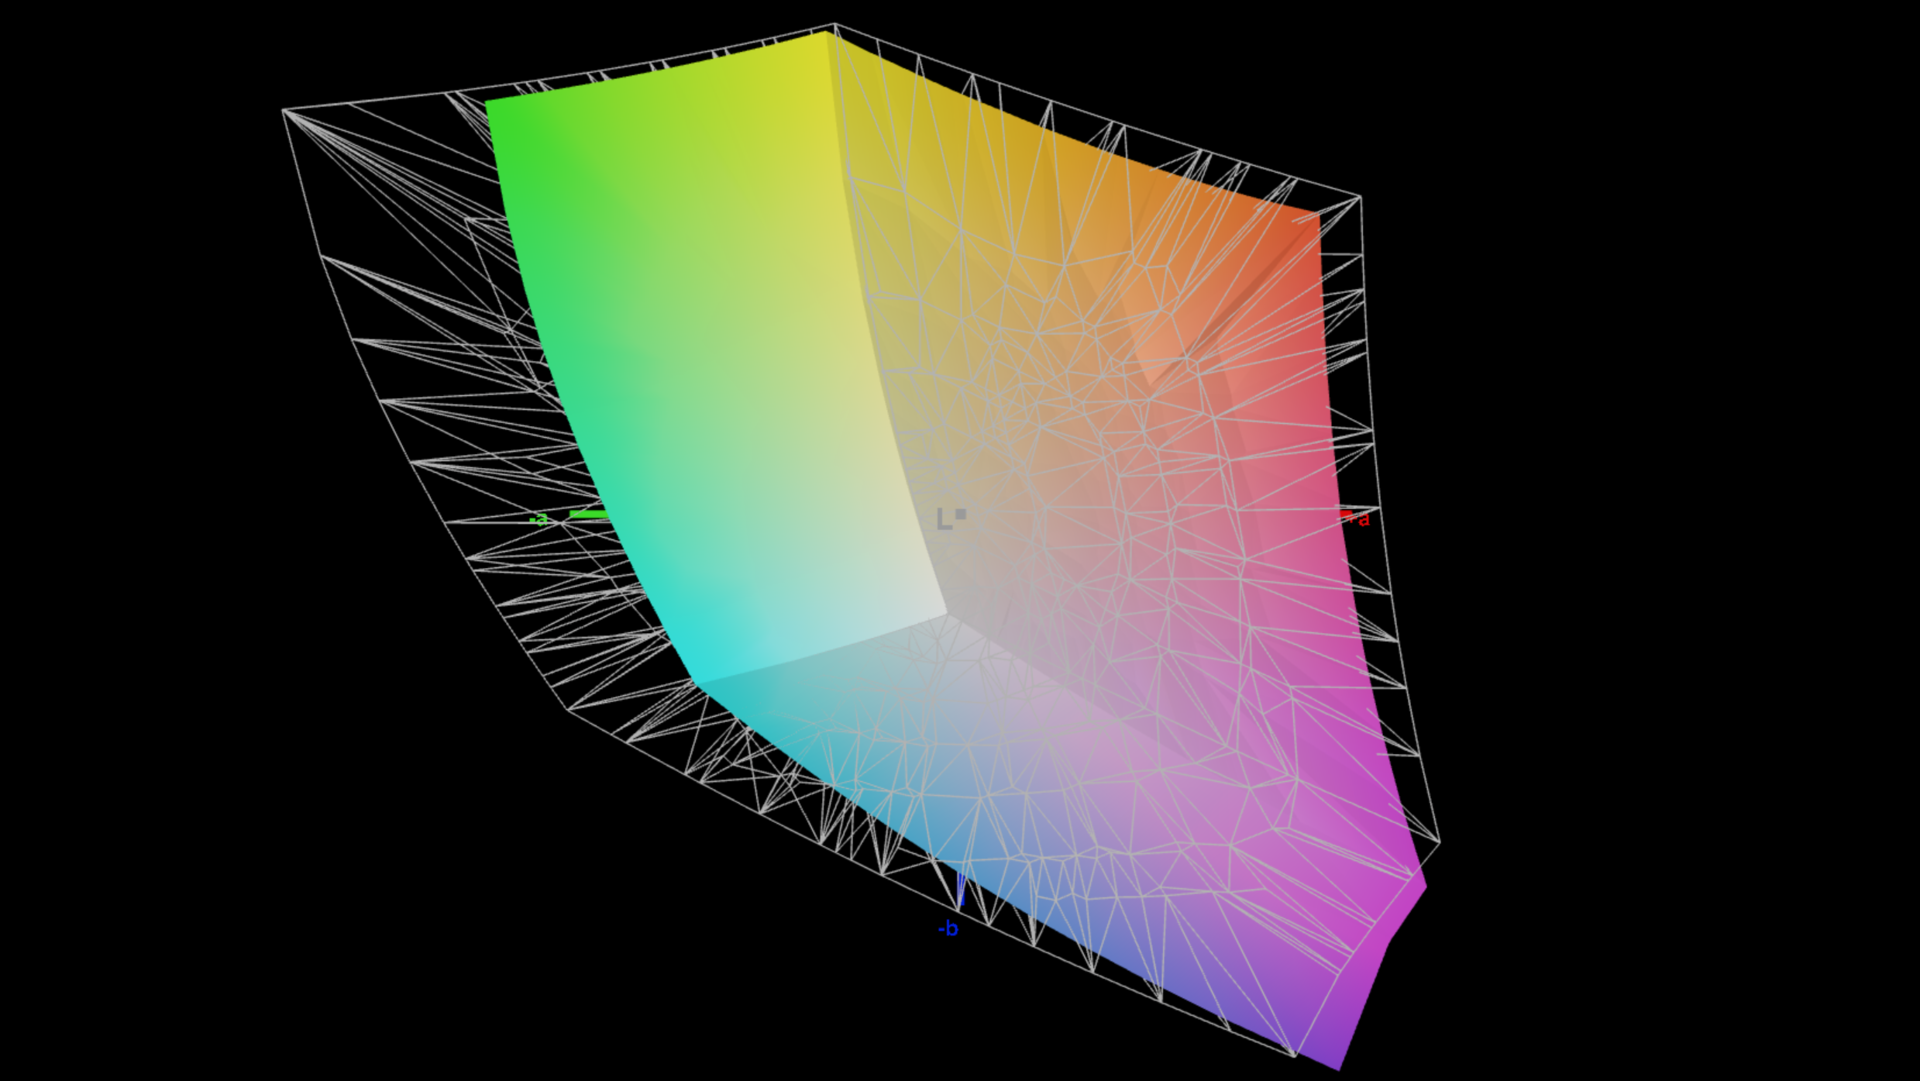
该显示器的亮度略高于 500 cd/m²,但其最大对比度因黑色水平的提高而受到一定影响,在这种情况下,OLED 或 MiniLED 面板的表现会更好。出厂时安装的 sRGB 配置文件对色彩的描绘非常准确,但有轻微偏蓝。我们通过自己的校准纠正了这一问题,但其色彩准确性随之下降。该面板完全覆盖了 sRGB 色彩空间。
| |||||||||||||||||||||||||
Brightness Distribution: 88 %
Center on Battery: 538 cd/m²
Contrast: 1145:1 (Black: 0.47 cd/m²)
ΔE ColorChecker Calman: 1.9 | ∀{0.5-29.43 Ø4.73}
ΔE Greyscale Calman: 2.7 | ∀{0.09-98 Ø4.97}
75.4% AdobeRGB 1998 (Argyll 3D)
99.8% sRGB (Argyll 3D)
74.7% Display P3 (Argyll 3D)
Gamma: 2.24
CCT: 7027 K
| Schenker XMG Pro 16 (E25) NE160QDM-NZL, IPS, 2560x1600, 16", 300 Hz | Schenker XMG Pro 16 Studio (Mid 24) BOE CQ NE160QDM-NZ1, IPS, 2560x1600, 16", 240 Hz | Asus ROG Strix G16 G615 NE160QDM-NZC, IPS, 2560x1600, 16", 240 Hz | Tuxedo Sirius 16 Gen 1 NE161QHM-NY1, IPS, 2560x1440, 16.1", 165 Hz | Lenovo Legion Pro 5 16IRX9 BOE NE160QDM-NYC, IPS, 2560x1600, 16", 165 Hz | Lenovo Legion Pro 7i 16 Gen 10 Samsung ATNA60HU01-0, OLED, 2560x1600, 16", 240 Hz | |
|---|---|---|---|---|---|---|
| Display | -5% | 17% | -7% | -5% | 19% | |
| Display P3 Coverage (%) | 74.7 | 68.8 -8% | 99.1 33% | 67.4 -10% | 69.3 -7% | 99.5 33% |
| sRGB Coverage (%) | 99.8 | 99.5 0% | 99.9 0% | 97.2 -3% | 99.4 0% | 100 0% |
| AdobeRGB 1998 Coverage (%) | 75.4 | 70.8 -6% | 89.1 18% | 69.3 -8% | 70.1 -7% | 94.4 25% |
| Response Times | -19% | 22% | -50% | -39% | 95% | |
| Response Time Grey 50% / Grey 80% * (ms) | 10.5 ? | 12.7 ? -21% | 4.6 ? 56% | 12 ? -14% | 11.9 ? -13% | 0.28 ? 97% |
| Response Time Black / White * (ms) | 5.4 ? | 6.3 ? -17% | 6.1 ? -13% | 10 ? -85% | 8.9 ? -65% | 0.43 ? 92% |
| PWM Frequency (Hz) | 1438 ? | |||||
| PWM Amplitude * (%) | 29 | |||||
| Screen | -18% | 8% | -37% | 9% | -10% | |
| Brightness middle (cd/m²) | 538 | 416 -23% | 545 1% | 302 -44% | 384 -29% | 490.4 -9% |
| Brightness (cd/m²) | 508 | 392 -23% | 536 6% | 314 -38% | 366 -28% | 498 -2% |
| Brightness Distribution (%) | 88 | 86 -2% | 89 1% | 86 -2% | 91 3% | 97 10% |
| Black Level * (cd/m²) | 0.47 | 0.38 19% | 0.41 13% | 0.38 19% | 0.35 26% | |
| Contrast (:1) | 1145 | 1095 -4% | 1329 16% | 795 -31% | 1097 -4% | |
| Colorchecker dE 2000 * | 1.9 | 2.33 -23% | 1.6 16% | 2.97 -56% | 0.97 49% | 3.2 -68% |
| Colorchecker dE 2000 max. * | 4 | 6.07 -52% | 4 -0% | 5.63 -41% | 3.57 11% | 6.04 -51% |
| Greyscale dE 2000 * | 2.7 | 3.7 -37% | 2.4 11% | 5.45 -102% | 1.5 44% | 1 63% |
| Gamma | 2.24 98% | 2.161 102% | 2.25 98% | 1.994 110% | 2.24 98% | 2.24 98% |
| CCT | 7027 93% | 7102 92% | 6737 96% | 6520 100% | 6709 97% | 6373 102% |
| Colorchecker dE 2000 calibrated * | 1.02 | 0.8 | 2.24 | 0.77 | 0.84 | |
| Total Average (Program / Settings) | -14% /
-15% | 16% /
12% | -31% /
-32% | -12% /
-2% | 35% /
17% |
* ... smaller is better

Display Response Times
| ↔ Response Time Black to White | ||
|---|---|---|
| 5.4 ms ... rise ↗ and fall ↘ combined | ↗ 1.4 ms rise | 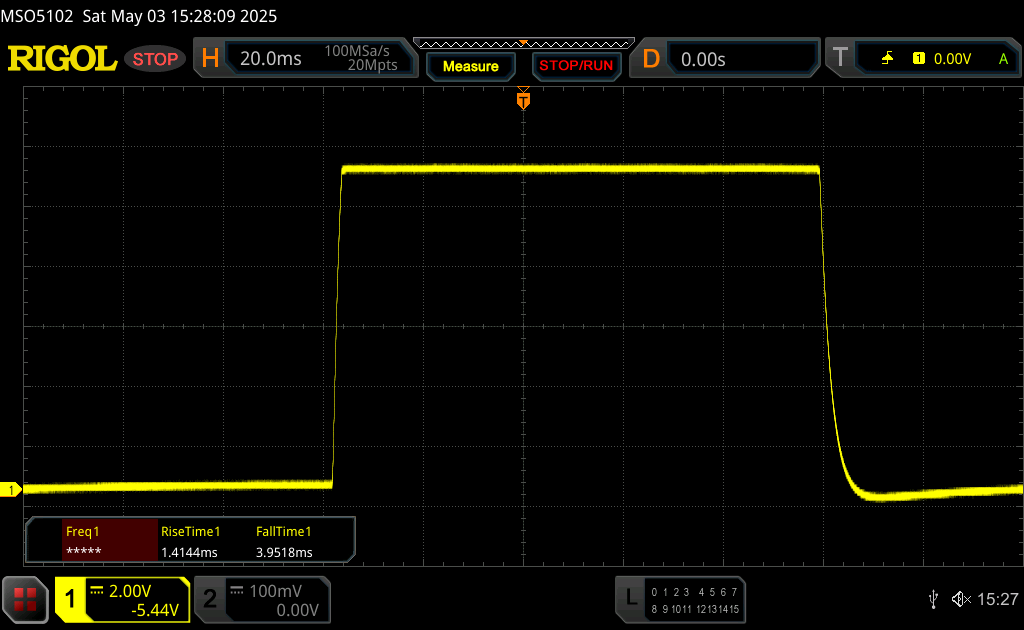 |
| ↘ 4 ms fall | ||
| The screen shows very fast response rates in our tests and should be very well suited for fast-paced gaming. In comparison, all tested devices range from 0.1 (minimum) to 240 (maximum) ms. » 18 % of all devices are better. This means that the measured response time is better than the average of all tested devices (19.9 ms). | ||
| ↔ Response Time 50% Grey to 80% Grey | ||
| 10.5 ms ... rise ↗ and fall ↘ combined | ↗ 3.4 ms rise | 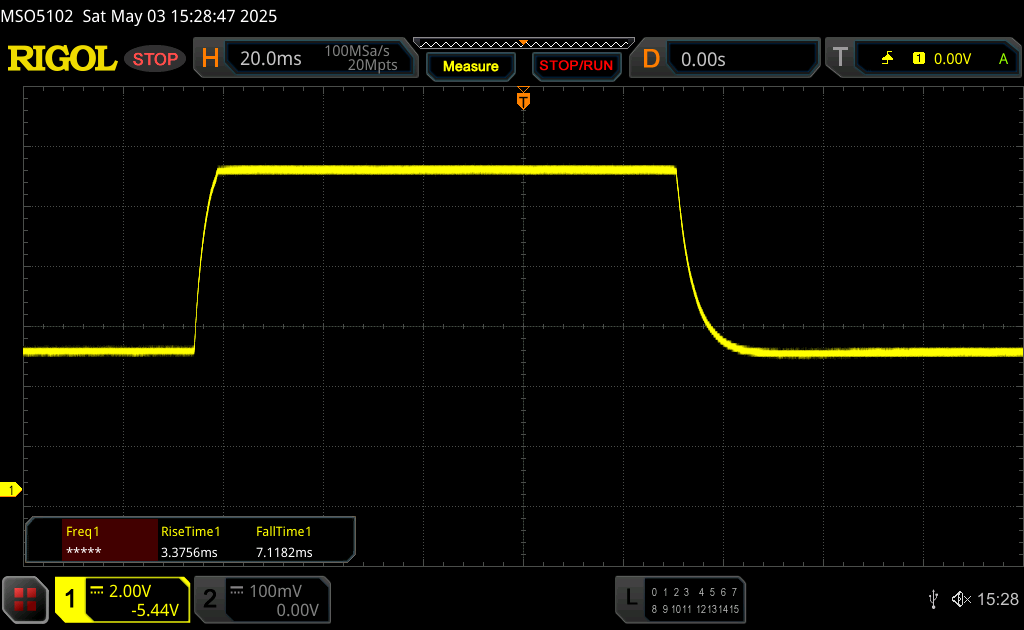 |
| ↘ 7.1 ms fall | ||
| The screen shows good response rates in our tests, but may be too slow for competitive gamers. In comparison, all tested devices range from 0.165 (minimum) to 636 (maximum) ms. » 24 % of all devices are better. This means that the measured response time is better than the average of all tested devices (31.1 ms). | ||
Screen Flickering / PWM (Pulse-Width Modulation)
| Screen flickering / PWM not detected |  | ||
In comparison: 52 % of all tested devices do not use PWM to dim the display. If PWM was detected, an average of 7798 (minimum: 5 - maximum: 343500) Hz was measured. | |||


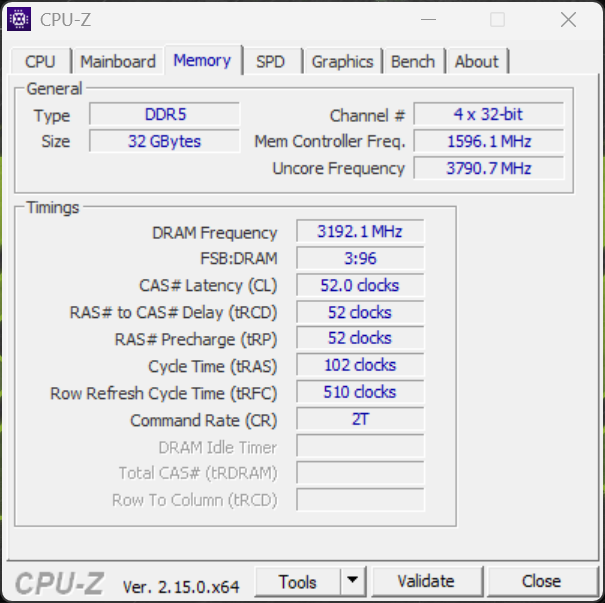
性能 - 最高 128 GB 内存
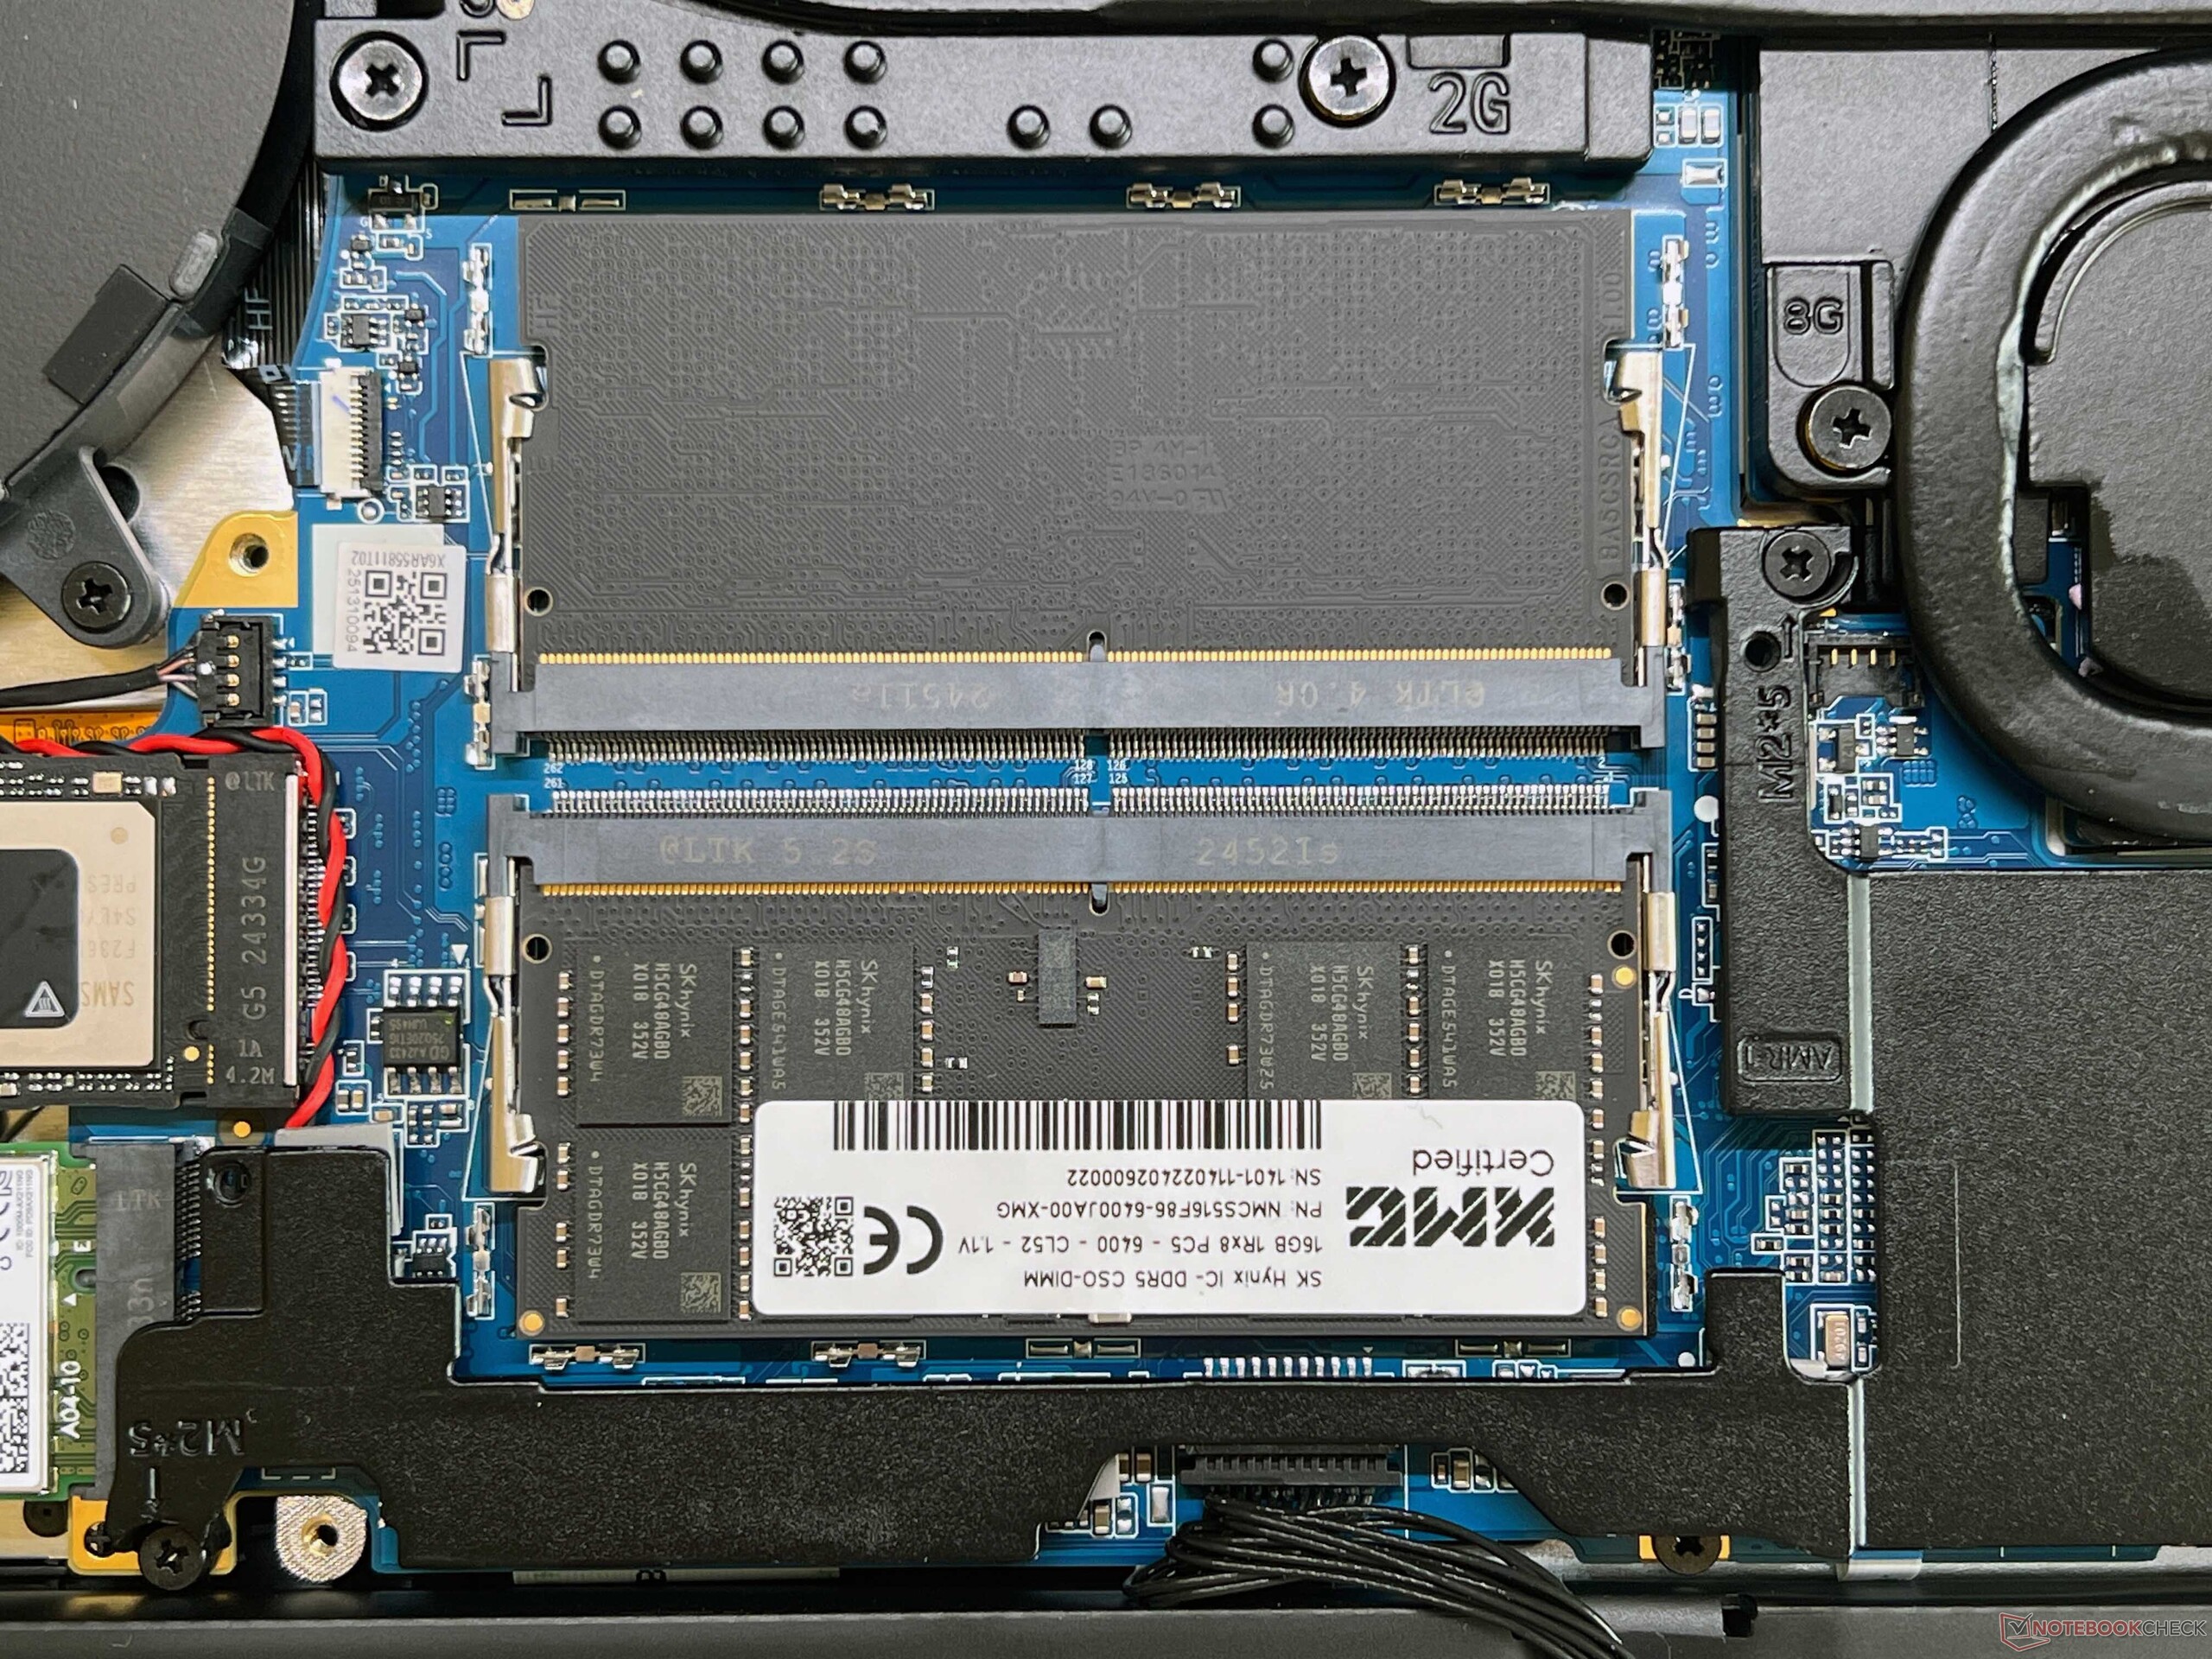
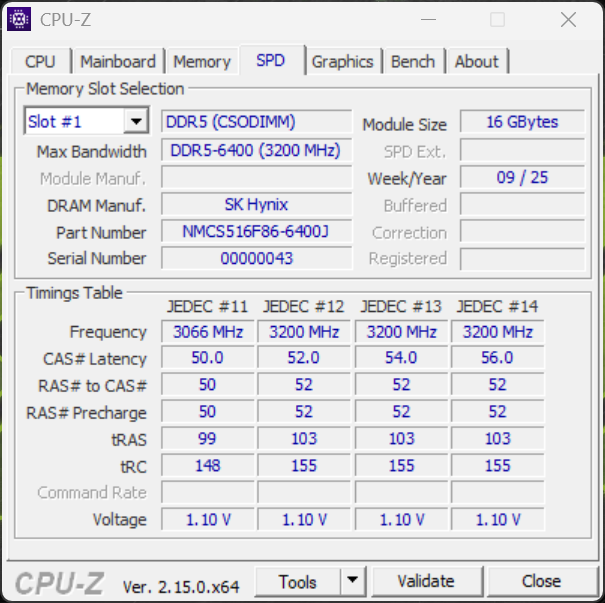
笔记本电脑的最大内存容量受购买者所选处理器的影响。与 酷睿至尊 9 275HX,您最多可选择 128 GB(DDR5-6400)。
测试条件
申克公司允许用户在各种能量曲线和手动模式之间进行选择,所有这些都可以通过热键方便地切换。我们在进行基准测试和测量时使用了 "超增压 "模式。发烧友模式是电池模式下的最大值。
| 能源概况 | TDP | CB24 Multi | TGP | Time Spy 图形 | CP2077 QHD | 最大风扇噪音排放 |
|---|---|---|---|---|---|---|
| 平衡型 | 45 瓦 | 1,348 点 | 125 瓦 | 16,186 点 | 78.9fps | 44.9 dB(A) |
| 发烧级 | 90/75 瓦 | 1,833 分 | 130 瓦 | 16,835 分 | 80.7fps | 49.4 dB(A) |
| 超增压 | 150/135 瓦 | 2,072 分 | 140 瓦 | 17,239 分 | 81.6fps | 53.3 dB(A) |
| 电池(发烧友) | 40 瓦 | 1,234 分 | 60 瓦 | 11,262 分 | 22fps | 37 dB(A) |
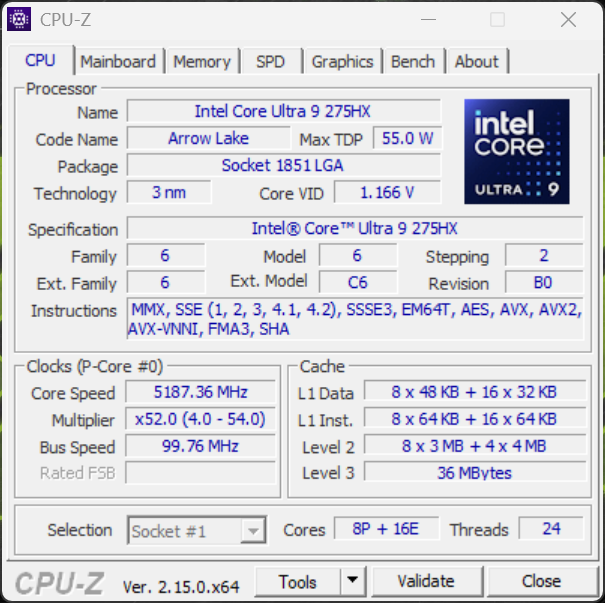
处理器 - Core Ultra 9 275HX
由于笔记本电脑的最大 TDP 为 150 瓦,因此无法利用 酷睿至尊 9 275HX的全部潜力。因此,一些游戏笔记本电脑的多核性能要稍高一些。尽管如此,它的整体性能还是非常出色的。 酷睿 i9-14900HX在所有 CPU 基准测试中都比旧版 XMG Pro 16 Studio 中的酷睿 i9-14900HX 高出 21%。此外,在连续负载情况下,它的性能一般都非常稳定。
Cinebench R15 Multi continuous test
Cinebench 2024: CPU Multi Core | CPU Single Core
Cinebench R23: Multi Core | Single Core
Cinebench R20: CPU (Multi Core) | CPU (Single Core)
Cinebench R15: CPU Multi 64Bit | CPU Single 64Bit
Blender: v2.79 BMW27 CPU
7-Zip 18.03: 7z b 4 | 7z b 4 -mmt1
Geekbench 6.7: Multi-Core | Single-Core
Geekbench 5.5: Multi-Core | Single-Core
HWBOT x265 Benchmark v2.2: 4k Preset
LibreOffice : 20 Documents To PDF
R Benchmark 2.5: Overall mean
| CPU Performance rating | |
| Asus ROG Strix G16 G615 | |
| Schenker XMG Pro 16 (E25) | |
| Lenovo Legion Pro 7i 16 Gen 10 | |
| Average Intel Core Ultra 9 275HX | |
| Lenovo Legion Pro 5 16IRX9 -2! | |
| Schenker XMG Pro 16 Studio (Mid 24) | |
| Average of class Gaming | |
| Tuxedo Sirius 16 Gen 1 -10! | |
| Cinebench 2024 / CPU Multi Core | |
| Asus ROG Strix G16 G615 | |
| Lenovo Legion Pro 7i 16 Gen 10 | |
| Schenker XMG Pro 16 (E25) | |
| Average Intel Core Ultra 9 275HX (1547 - 2288, n=27) | |
| Average of class Gaming (486 - 2298, n=92, last 2 years) | |
| Schenker XMG Pro 16 Studio (Mid 24) | |
| Cinebench 2024 / CPU Single Core | |
| Schenker XMG Pro 16 (E25) | |
| Asus ROG Strix G16 G615 | |
| Lenovo Legion Pro 7i 16 Gen 10 | |
| Average Intel Core Ultra 9 275HX (123.1 - 138.2, n=27) | |
| Average of class Gaming (95 - 138.2, n=92, last 2 years) | |
| Schenker XMG Pro 16 Studio (Mid 24) | |
| Cinebench R23 / Multi Core | |
| Lenovo Legion Pro 7i 16 Gen 10 | |
| Schenker XMG Pro 16 (E25) | |
| Average Intel Core Ultra 9 275HX (30712 - 40970, n=31) | |
| Asus ROG Strix G16 G615 | |
| Lenovo Legion Pro 5 16IRX9 | |
| Schenker XMG Pro 16 Studio (Mid 24) | |
| Average of class Gaming (10488 - 40970, n=113, last 2 years) | |
| Tuxedo Sirius 16 Gen 1 | |
| Cinebench R23 / Single Core | |
| Schenker XMG Pro 16 (E25) | |
| Lenovo Legion Pro 7i 16 Gen 10 | |
| Average Intel Core Ultra 9 275HX (2009 - 2267, n=31) | |
| Asus ROG Strix G16 G615 | |
| Lenovo Legion Pro 5 16IRX9 | |
| Schenker XMG Pro 16 Studio (Mid 24) | |
| Average of class Gaming (1166 - 2356, n=113, last 2 years) | |
| Tuxedo Sirius 16 Gen 1 | |
| Cinebench R20 / CPU (Multi Core) | |
| Schenker XMG Pro 16 (E25) | |
| Lenovo Legion Pro 7i 16 Gen 10 | |
| Average Intel Core Ultra 9 275HX (12026 - 16108, n=30) | |
| Asus ROG Strix G16 G615 | |
| Lenovo Legion Pro 5 16IRX9 | |
| Schenker XMG Pro 16 Studio (Mid 24) | |
| Average of class Gaming (4029 - 16108, n=112, last 2 years) | |
| Tuxedo Sirius 16 Gen 1 | |
| Cinebench R20 / CPU (Single Core) | |
| Schenker XMG Pro 16 (E25) | |
| Asus ROG Strix G16 G615 | |
| Average Intel Core Ultra 9 275HX (774 - 870, n=30) | |
| Lenovo Legion Pro 7i 16 Gen 10 | |
| Lenovo Legion Pro 5 16IRX9 | |
| Schenker XMG Pro 16 Studio (Mid 24) | |
| Average of class Gaming (442 - 895, n=112, last 2 years) | |
| Tuxedo Sirius 16 Gen 1 | |
| Cinebench R15 / CPU Multi 64Bit | |
| Asus ROG Strix G16 G615 | |
| Lenovo Legion Pro 7i 16 Gen 10 | |
| Schenker XMG Pro 16 (E25) | |
| Average Intel Core Ultra 9 275HX (4737 - 6271, n=30) | |
| Lenovo Legion Pro 5 16IRX9 | |
| Schenker XMG Pro 16 Studio (Mid 24) | |
| Average of class Gaming (1578 - 6271, n=113, last 2 years) | |
| Tuxedo Sirius 16 Gen 1 | |
| Cinebench R15 / CPU Single 64Bit | |
| Asus ROG Strix G16 G615 | |
| Lenovo Legion Pro 7i 16 Gen 10 | |
| Schenker XMG Pro 16 (E25) | |
| Average Intel Core Ultra 9 275HX (306 - 343, n=31) | |
| Lenovo Legion Pro 5 16IRX9 | |
| Average of class Gaming (188.8 - 343, n=112, last 2 years) | |
| Tuxedo Sirius 16 Gen 1 | |
| Schenker XMG Pro 16 Studio (Mid 24) | |
| Blender / v2.79 BMW27 CPU | |
| Average of class Gaming (80 - 330, n=110, last 2 years) | |
| Schenker XMG Pro 16 Studio (Mid 24) | |
| Lenovo Legion Pro 5 16IRX9 | |
| Average Intel Core Ultra 9 275HX (82 - 116, n=29) | |
| Schenker XMG Pro 16 (E25) | |
| Lenovo Legion Pro 7i 16 Gen 10 | |
| Asus ROG Strix G16 G615 | |
| 7-Zip 18.03 / 7z b 4 | |
| Asus ROG Strix G16 G615 | |
| Lenovo Legion Pro 7i 16 Gen 10 | |
| Schenker XMG Pro 16 (E25) | |
| Lenovo Legion Pro 5 16IRX9 | |
| Average Intel Core Ultra 9 275HX (98236 - 124155, n=30) | |
| Schenker XMG Pro 16 Studio (Mid 24) | |
| Average of class Gaming (33491 - 148086, n=111, last 2 years) | |
| 7-Zip 18.03 / 7z b 4 -mmt1 | |
| Schenker XMG Pro 16 (E25) | |
| Asus ROG Strix G16 G615 | |
| Schenker XMG Pro 16 Studio (Mid 24) | |
| Lenovo Legion Pro 5 16IRX9 | |
| Average Intel Core Ultra 9 275HX (6026 - 7149, n=30) | |
| Lenovo Legion Pro 7i 16 Gen 10 | |
| Average of class Gaming (4199 - 7436, n=111, last 2 years) | |
| Geekbench 6.7 / Multi-Core | |
| Schenker XMG Pro 16 (E25) | |
| Asus ROG Strix G16 G615 | |
| Average Intel Core Ultra 9 275HX (16033 - 21668, n=33) | |
| Lenovo Legion Pro 7i 16 Gen 10 | |
| Lenovo Legion Pro 5 16IRX9 | |
| Schenker XMG Pro 16 Studio (Mid 24) | |
| Average of class Gaming (6625 - 22104, n=112, last 2 years) | |
| Tuxedo Sirius 16 Gen 1 | |
| Geekbench 6.7 / Single-Core | |
| Schenker XMG Pro 16 (E25) | |
| Lenovo Legion Pro 7i 16 Gen 10 | |
| Average Intel Core Ultra 9 275HX (2843 - 3160, n=33) | |
| Asus ROG Strix G16 G615 | |
| Lenovo Legion Pro 5 16IRX9 | |
| Average of class Gaming (1490 - 3259, n=112, last 2 years) | |
| Schenker XMG Pro 16 Studio (Mid 24) | |
| Tuxedo Sirius 16 Gen 1 | |
| Geekbench 5.5 / Multi-Core | |
| Schenker XMG Pro 16 (E25) | |
| Asus ROG Strix G16 G615 | |
| Average Intel Core Ultra 9 275HX (19105 - 25855, n=31) | |
| Lenovo Legion Pro 7i 16 Gen 10 | |
| Lenovo Legion Pro 5 16IRX9 | |
| Schenker XMG Pro 16 Studio (Mid 24) | |
| Average of class Gaming (6460 - 27010, n=111, last 2 years) | |
| Geekbench 5.5 / Single-Core | |
| Schenker XMG Pro 16 (E25) | |
| Average Intel Core Ultra 9 275HX (2033 - 2292, n=31) | |
| Lenovo Legion Pro 7i 16 Gen 10 | |
| Asus ROG Strix G16 G615 | |
| Lenovo Legion Pro 5 16IRX9 | |
| Average of class Gaming (986 - 2474, n=111, last 2 years) | |
| Schenker XMG Pro 16 Studio (Mid 24) | |
| HWBOT x265 Benchmark v2.2 / 4k Preset | |
| Asus ROG Strix G16 G615 | |
| Schenker XMG Pro 16 (E25) | |
| Lenovo Legion Pro 7i 16 Gen 10 | |
| Average Intel Core Ultra 9 275HX (30.7 - 43.8, n=30) | |
| Lenovo Legion Pro 5 16IRX9 | |
| Average of class Gaming (11.5 - 44.3, n=111, last 2 years) | |
| Schenker XMG Pro 16 Studio (Mid 24) | |
| LibreOffice / 20 Documents To PDF | |
| Average of class Gaming (19 - 88.8, n=111, last 2 years) | |
| Schenker XMG Pro 16 (E25) | |
| Schenker XMG Pro 16 Studio (Mid 24) | |
| Average Intel Core Ultra 9 275HX (33.2 - 62.1, n=30) | |
| Lenovo Legion Pro 5 16IRX9 | |
| Asus ROG Strix G16 G615 | |
| Lenovo Legion Pro 7i 16 Gen 10 | |
| R Benchmark 2.5 / Overall mean | |
| Average of class Gaming (0.3439 - 0.759, n=112, last 2 years) | |
| Average Intel Core Ultra 9 275HX (0.3943 - 0.4568, n=30) | |
| Lenovo Legion Pro 7i 16 Gen 10 | |
| Schenker XMG Pro 16 Studio (Mid 24) | |
| Schenker XMG Pro 16 (E25) | |
| Asus ROG Strix G16 G615 | |
| Lenovo Legion Pro 5 16IRX9 | |
* ... smaller is better
AIDA64: FP32 Ray-Trace | FPU Julia | CPU SHA3 | CPU Queen | FPU SinJulia | FPU Mandel | CPU AES | CPU ZLib | FP64 Ray-Trace | CPU PhotoWorxx
| Performance rating | |
| Asus ROG Strix G16 G615 | |
| Lenovo Legion Pro 7i 16 Gen 10 | |
| Average Intel Core Ultra 9 275HX | |
| Schenker XMG Pro 16 (E25) | |
| Lenovo Legion Pro 5 16IRX9 | |
| Average of class Gaming | |
| Tuxedo Sirius 16 Gen 1 | |
| Schenker XMG Pro 16 Studio (Mid 24) | |
| AIDA64 / FP32 Ray-Trace | |
| Asus ROG Strix G16 G615 | |
| Lenovo Legion Pro 7i 16 Gen 10 | |
| Average Intel Core Ultra 9 275HX (28039 - 39895, n=30) | |
| Schenker XMG Pro 16 (E25) | |
| Average of class Gaming (10227 - 85542, n=110, last 2 years) | |
| Tuxedo Sirius 16 Gen 1 | |
| Lenovo Legion Pro 5 16IRX9 | |
| Schenker XMG Pro 16 Studio (Mid 24) | |
| AIDA64 / FPU Julia | |
| Asus ROG Strix G16 G615 | |
| Lenovo Legion Pro 7i 16 Gen 10 | |
| Average Intel Core Ultra 9 275HX (140254 - 200744, n=30) | |
| Schenker XMG Pro 16 (E25) | |
| Average of class Gaming (51376 - 238426, n=110, last 2 years) | |
| Lenovo Legion Pro 5 16IRX9 | |
| Tuxedo Sirius 16 Gen 1 | |
| Schenker XMG Pro 16 Studio (Mid 24) | |
| AIDA64 / CPU SHA3 | |
| Asus ROG Strix G16 G615 | |
| Lenovo Legion Pro 7i 16 Gen 10 | |
| Average Intel Core Ultra 9 275HX (6710 - 9817, n=30) | |
| Schenker XMG Pro 16 (E25) | |
| Lenovo Legion Pro 5 16IRX9 | |
| Average of class Gaming (2180 - 9817, n=110, last 2 years) | |
| Schenker XMG Pro 16 Studio (Mid 24) | |
| Tuxedo Sirius 16 Gen 1 | |
| AIDA64 / CPU Queen | |
| Lenovo Legion Pro 5 16IRX9 | |
| Asus ROG Strix G16 G615 | |
| Lenovo Legion Pro 7i 16 Gen 10 | |
| Schenker XMG Pro 16 Studio (Mid 24) | |
| Average Intel Core Ultra 9 275HX (113887 - 140937, n=30) | |
| Schenker XMG Pro 16 (E25) | |
| Tuxedo Sirius 16 Gen 1 | |
| Average of class Gaming (49785 - 173351, n=101, last 2 years) | |
| AIDA64 / FPU SinJulia | |
| Lenovo Legion Pro 5 16IRX9 | |
| Average of class Gaming (4424 - 33636, n=110, last 2 years) | |
| Schenker XMG Pro 16 (E25) | |
| Lenovo Legion Pro 7i 16 Gen 10 | |
| Asus ROG Strix G16 G615 | |
| Tuxedo Sirius 16 Gen 1 | |
| Schenker XMG Pro 16 Studio (Mid 24) | |
| Average Intel Core Ultra 9 275HX (11172 - 14425, n=30) | |
| AIDA64 / FPU Mandel | |
| Asus ROG Strix G16 G615 | |
| Lenovo Legion Pro 7i 16 Gen 10 | |
| Average Intel Core Ultra 9 275HX (72596 - 104508, n=30) | |
| Schenker XMG Pro 16 (E25) | |
| Average of class Gaming (25115 - 128721, n=110, last 2 years) | |
| Tuxedo Sirius 16 Gen 1 | |
| Lenovo Legion Pro 5 16IRX9 | |
| Schenker XMG Pro 16 Studio (Mid 24) | |
| AIDA64 / CPU AES | |
| Tuxedo Sirius 16 Gen 1 | |
| Asus ROG Strix G16 G615 | |
| Lenovo Legion Pro 7i 16 Gen 10 | |
| Average Intel Core Ultra 9 275HX (105608 - 247074, n=30) | |
| Schenker XMG Pro 16 (E25) | |
| Lenovo Legion Pro 5 16IRX9 | |
| Schenker XMG Pro 16 Studio (Mid 24) | |
| Average of class Gaming (39258 - 247074, n=110, last 2 years) | |
| AIDA64 / CPU ZLib | |
| Asus ROG Strix G16 G615 | |
| Lenovo Legion Pro 7i 16 Gen 10 | |
| Average Intel Core Ultra 9 275HX (1582 - 2263, n=30) | |
| Schenker XMG Pro 16 (E25) | |
| Lenovo Legion Pro 5 16IRX9 | |
| Schenker XMG Pro 16 Studio (Mid 24) | |
| Average of class Gaming (574 - 2531, n=110, last 2 years) | |
| Tuxedo Sirius 16 Gen 1 | |
| AIDA64 / FP64 Ray-Trace | |
| Asus ROG Strix G16 G615 | |
| Lenovo Legion Pro 7i 16 Gen 10 | |
| Average Intel Core Ultra 9 275HX (14847 - 21854, n=30) | |
| Schenker XMG Pro 16 (E25) | |
| Average of class Gaming (5509 - 45446, n=110, last 2 years) | |
| Tuxedo Sirius 16 Gen 1 | |
| Lenovo Legion Pro 5 16IRX9 | |
| Schenker XMG Pro 16 Studio (Mid 24) | |
| AIDA64 / CPU PhotoWorxx | |
| Lenovo Legion Pro 7i 16 Gen 10 | |
| Schenker XMG Pro 16 (E25) | |
| Average Intel Core Ultra 9 275HX (37482 - 62916, n=30) | |
| Lenovo Legion Pro 5 16IRX9 | |
| Schenker XMG Pro 16 Studio (Mid 24) | |
| Asus ROG Strix G16 G615 | |
| Average of class Gaming (12271 - 89891, n=110, last 2 years) | |
| Tuxedo Sirius 16 Gen 1 | |
系统性能
无论是在日常使用中还是在基准测试中,Pro 16 都是一款超快的系统。在我们的测试中,系统稳定性没有任何问题。
PCMark 10: Score | Essentials | Productivity | Digital Content Creation
CrossMark: Overall | Productivity | Creativity | Responsiveness
WebXPRT 3: Overall
WebXPRT 4: Overall
Mozilla Kraken 1.1: Total
| Performance rating | |
| Asus ROG Strix G16 G615 | |
| Schenker XMG Pro 16 (E25) | |
| Average Intel Core Ultra 9 275HX, NVIDIA GeForce RTX 5070 Ti Laptop | |
| Lenovo Legion Pro 7i 16 Gen 10 | |
| Lenovo Legion Pro 5 16IRX9 | |
| Schenker XMG Pro 16 Studio (Mid 24) | |
| Average of class Gaming | |
| Tuxedo Sirius 16 Gen 1 -5! | |
| PCMark 10 / Score | |
| Lenovo Legion Pro 7i 16 Gen 10 | |
| Asus ROG Strix G16 G615 | |
| Lenovo Legion Pro 5 16IRX9 | |
| Schenker XMG Pro 16 (E25) | |
| Average Intel Core Ultra 9 275HX, NVIDIA GeForce RTX 5070 Ti Laptop (8297 - 8550, n=3) | |
| Average of class Gaming (5828 - 11574, n=96, last 2 years) | |
| Schenker XMG Pro 16 Studio (Mid 24) | |
| PCMark 10 / Essentials | |
| Schenker XMG Pro 16 (E25) | |
| Lenovo Legion Pro 5 16IRX9 | |
| Lenovo Legion Pro 7i 16 Gen 10 | |
| Asus ROG Strix G16 G615 | |
| Average Intel Core Ultra 9 275HX, NVIDIA GeForce RTX 5070 Ti Laptop (10738 - 11290, n=3) | |
| Schenker XMG Pro 16 Studio (Mid 24) | |
| Average of class Gaming (8810 - 12600, n=100, last 2 years) | |
| PCMark 10 / Productivity | |
| Schenker XMG Pro 16 Studio (Mid 24) | |
| Average of class Gaming (6845 - 18766, n=98, last 2 years) | |
| Lenovo Legion Pro 5 16IRX9 | |
| Average Intel Core Ultra 9 275HX, NVIDIA GeForce RTX 5070 Ti Laptop (9591 - 9771, n=3) | |
| Schenker XMG Pro 16 (E25) | |
| Lenovo Legion Pro 7i 16 Gen 10 | |
| Asus ROG Strix G16 G615 | |
| PCMark 10 / Digital Content Creation | |
| Lenovo Legion Pro 7i 16 Gen 10 | |
| Asus ROG Strix G16 G615 | |
| Schenker XMG Pro 16 (E25) | |
| Average Intel Core Ultra 9 275HX, NVIDIA GeForce RTX 5070 Ti Laptop (14812 - 15662, n=3) | |
| Lenovo Legion Pro 5 16IRX9 | |
| Average of class Gaming (7602 - 19657, n=98, last 2 years) | |
| Schenker XMG Pro 16 Studio (Mid 24) | |
| CrossMark / Overall | |
| Schenker XMG Pro 16 (E25) | |
| Asus ROG Strix G16 G615 | |
| Average Intel Core Ultra 9 275HX, NVIDIA GeForce RTX 5070 Ti Laptop (2116 - 2193, n=3) | |
| Schenker XMG Pro 16 Studio (Mid 24) | |
| Lenovo Legion Pro 7i 16 Gen 10 | |
| Lenovo Legion Pro 5 16IRX9 | |
| Tuxedo Sirius 16 Gen 1 | |
| Average of class Gaming (1366 - 2409, n=98, last 2 years) | |
| CrossMark / Productivity | |
| Schenker XMG Pro 16 (E25) | |
| Asus ROG Strix G16 G615 | |
| Average Intel Core Ultra 9 275HX, NVIDIA GeForce RTX 5070 Ti Laptop (1967 - 2038, n=3) | |
| Tuxedo Sirius 16 Gen 1 | |
| Lenovo Legion Pro 7i 16 Gen 10 | |
| Schenker XMG Pro 16 Studio (Mid 24) | |
| Average of class Gaming (1386 - 2254, n=98, last 2 years) | |
| Lenovo Legion Pro 5 16IRX9 | |
| CrossMark / Creativity | |
| Schenker XMG Pro 16 (E25) | |
| Average Intel Core Ultra 9 275HX, NVIDIA GeForce RTX 5070 Ti Laptop (2430 - 2531, n=3) | |
| Asus ROG Strix G16 G615 | |
| Schenker XMG Pro 16 Studio (Mid 24) | |
| Lenovo Legion Pro 7i 16 Gen 10 | |
| Lenovo Legion Pro 5 16IRX9 | |
| Average of class Gaming (1343 - 2729, n=98, last 2 years) | |
| Tuxedo Sirius 16 Gen 1 | |
| CrossMark / Responsiveness | |
| Asus ROG Strix G16 G615 | |
| Tuxedo Sirius 16 Gen 1 | |
| Schenker XMG Pro 16 (E25) | |
| Average Intel Core Ultra 9 275HX, NVIDIA GeForce RTX 5070 Ti Laptop (1740 - 1844, n=3) | |
| Lenovo Legion Pro 5 16IRX9 | |
| Schenker XMG Pro 16 Studio (Mid 24) | |
| Average of class Gaming (1226 - 2334, n=98, last 2 years) | |
| Lenovo Legion Pro 7i 16 Gen 10 | |
| WebXPRT 3 / Overall | |
| Average Intel Core Ultra 9 275HX, NVIDIA GeForce RTX 5070 Ti Laptop (328 - 532, n=3) | |
| Schenker XMG Pro 16 (E25) | |
| Lenovo Legion Pro 7i 16 Gen 10 | |
| Asus ROG Strix G16 G615 | |
| Lenovo Legion Pro 5 16IRX9 | |
| Schenker XMG Pro 16 Studio (Mid 24) | |
| Average of class Gaming (242 - 532, n=101, last 2 years) | |
| WebXPRT 4 / Overall | |
| Schenker XMG Pro 16 (E25) | |
| Asus ROG Strix G16 G615 | |
| Lenovo Legion Pro 7i 16 Gen 10 | |
| Average Intel Core Ultra 9 275HX, NVIDIA GeForce RTX 5070 Ti Laptop (306 - 341, n=3) | |
| Schenker XMG Pro 16 Studio (Mid 24) | |
| Lenovo Legion Pro 5 16IRX9 | |
| Average of class Gaming (176.4 - 354, n=101, last 2 years) | |
| Tuxedo Sirius 16 Gen 1 | |
| Mozilla Kraken 1.1 / Total | |
| Tuxedo Sirius 16 Gen 1 | |
| Average of class Gaming (391 - 590, n=106, last 2 years) | |
| Schenker XMG Pro 16 Studio (Mid 24) | |
| Lenovo Legion Pro 5 16IRX9 | |
| Average Intel Core Ultra 9 275HX, NVIDIA GeForce RTX 5070 Ti Laptop (405 - 414, n=3) | |
| Lenovo Legion Pro 7i 16 Gen 10 | |
| Asus ROG Strix G16 G615 | |
| Schenker XMG Pro 16 (E25) | |
* ... smaller is better
| PCMark 10 Score | 8550 points | |
Help | ||
| AIDA64 / Memory Copy | |
| Asus ROG Strix G16 G615 | |
| Schenker XMG Pro 16 (E25) | |
| Lenovo Legion Pro 7i 16 Gen 10 | |
| Average Intel Core Ultra 9 275HX (56003 - 94460, n=30) | |
| Lenovo Legion Pro 5 16IRX9 | |
| Schenker XMG Pro 16 Studio (Mid 24) | |
| Average of class Gaming (21750 - 129946, n=110, last 2 years) | |
| Tuxedo Sirius 16 Gen 1 | |
| AIDA64 / Memory Read | |
| Schenker XMG Pro 16 (E25) | |
| Lenovo Legion Pro 7i 16 Gen 10 | |
| Lenovo Legion Pro 5 16IRX9 | |
| Schenker XMG Pro 16 Studio (Mid 24) | |
| Average Intel Core Ultra 9 275HX (55795 - 97151, n=30) | |
| Asus ROG Strix G16 G615 | |
| Average of class Gaming (22956 - 118858, n=110, last 2 years) | |
| Tuxedo Sirius 16 Gen 1 | |
| AIDA64 / Memory Write | |
| Tuxedo Sirius 16 Gen 1 | |
| Lenovo Legion Pro 7i 16 Gen 10 | |
| Schenker XMG Pro 16 (E25) | |
| Average Intel Core Ultra 9 275HX (55663 - 116129, n=30) | |
| Lenovo Legion Pro 5 16IRX9 | |
| Average of class Gaming (22297 - 135096, n=110, last 2 years) | |
| Asus ROG Strix G16 G615 | |
| Schenker XMG Pro 16 Studio (Mid 24) | |
| AIDA64 / Memory Latency | |
| Average Intel Core Ultra 9 275HX (105.8 - 161.6, n=30) | |
| Asus ROG Strix G16 G615 | |
| Lenovo Legion Pro 7i 16 Gen 10 | |
| Average of class Gaming (75.3 - 259, n=110, last 2 years) | |
| Schenker XMG Pro 16 (E25) | |
| Tuxedo Sirius 16 Gen 1 | |
| Schenker XMG Pro 16 Studio (Mid 24) | |
| Lenovo Legion Pro 5 16IRX9 | |
* ... smaller is better
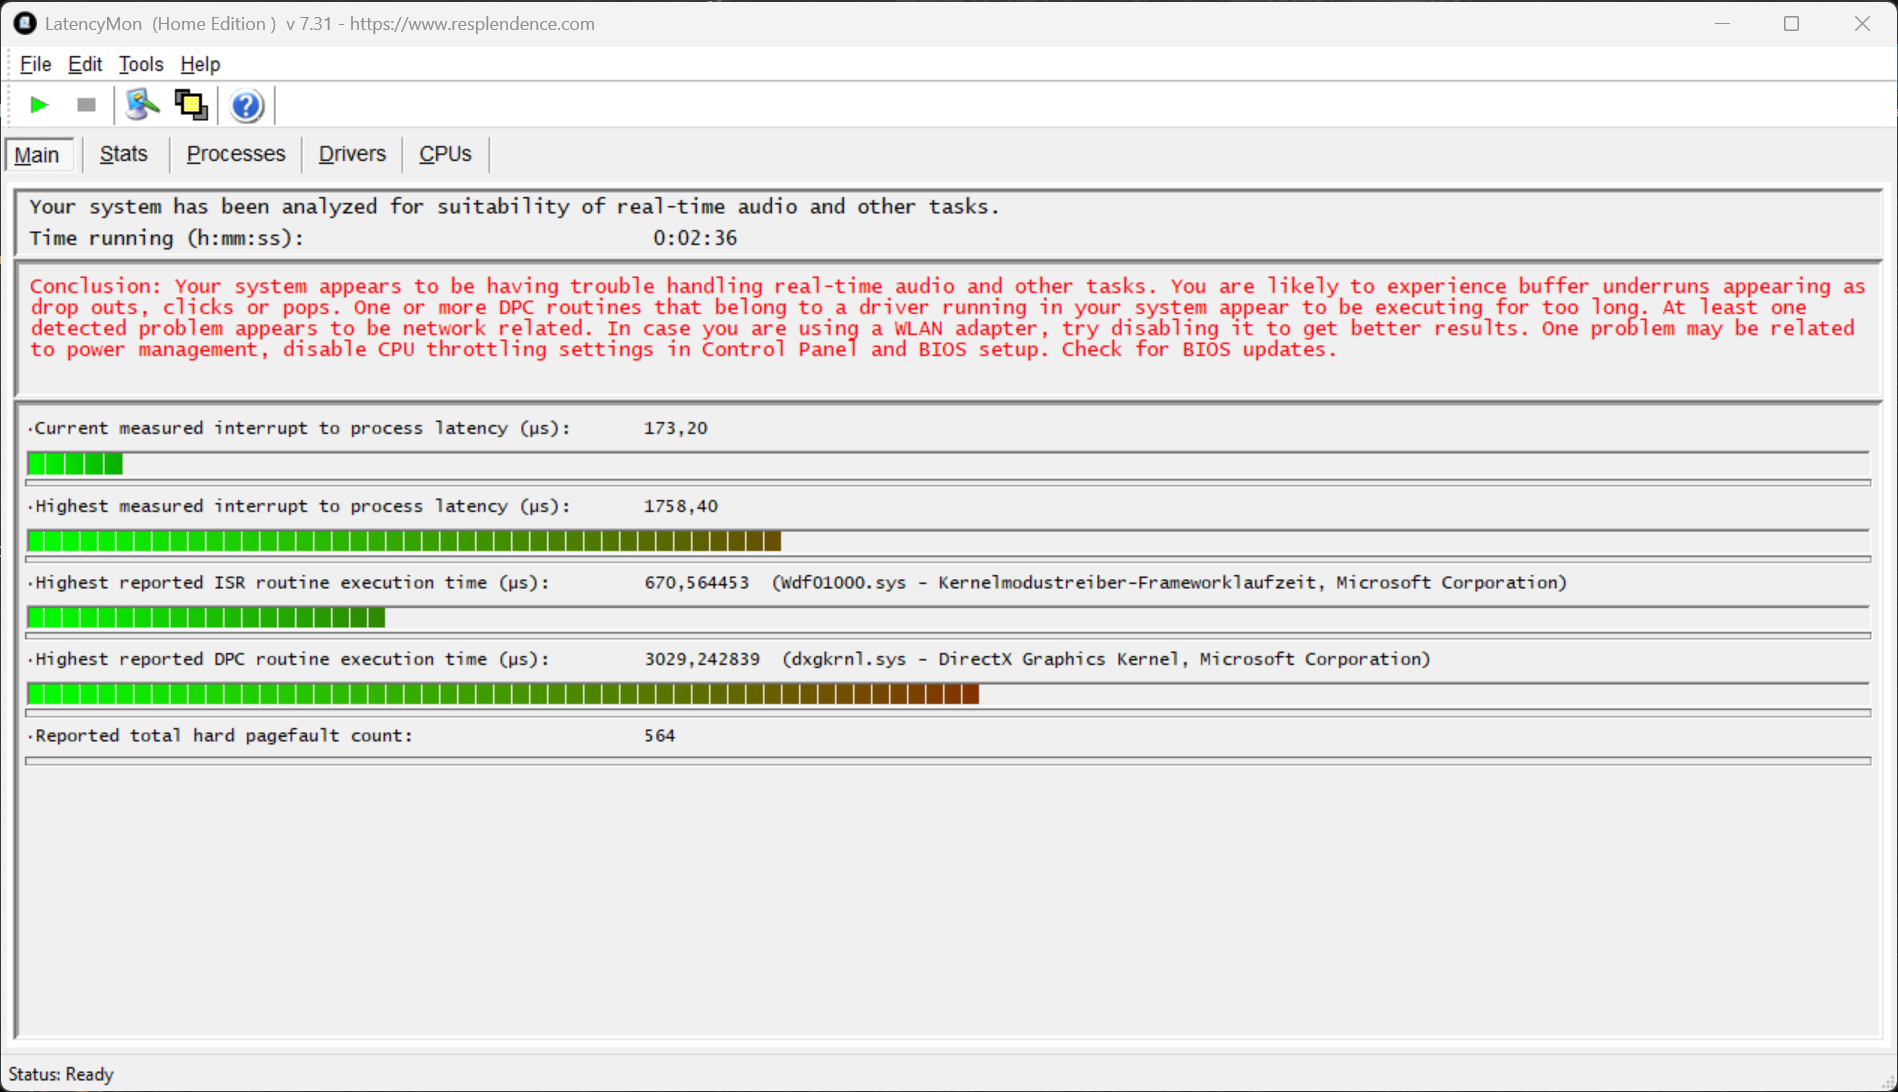
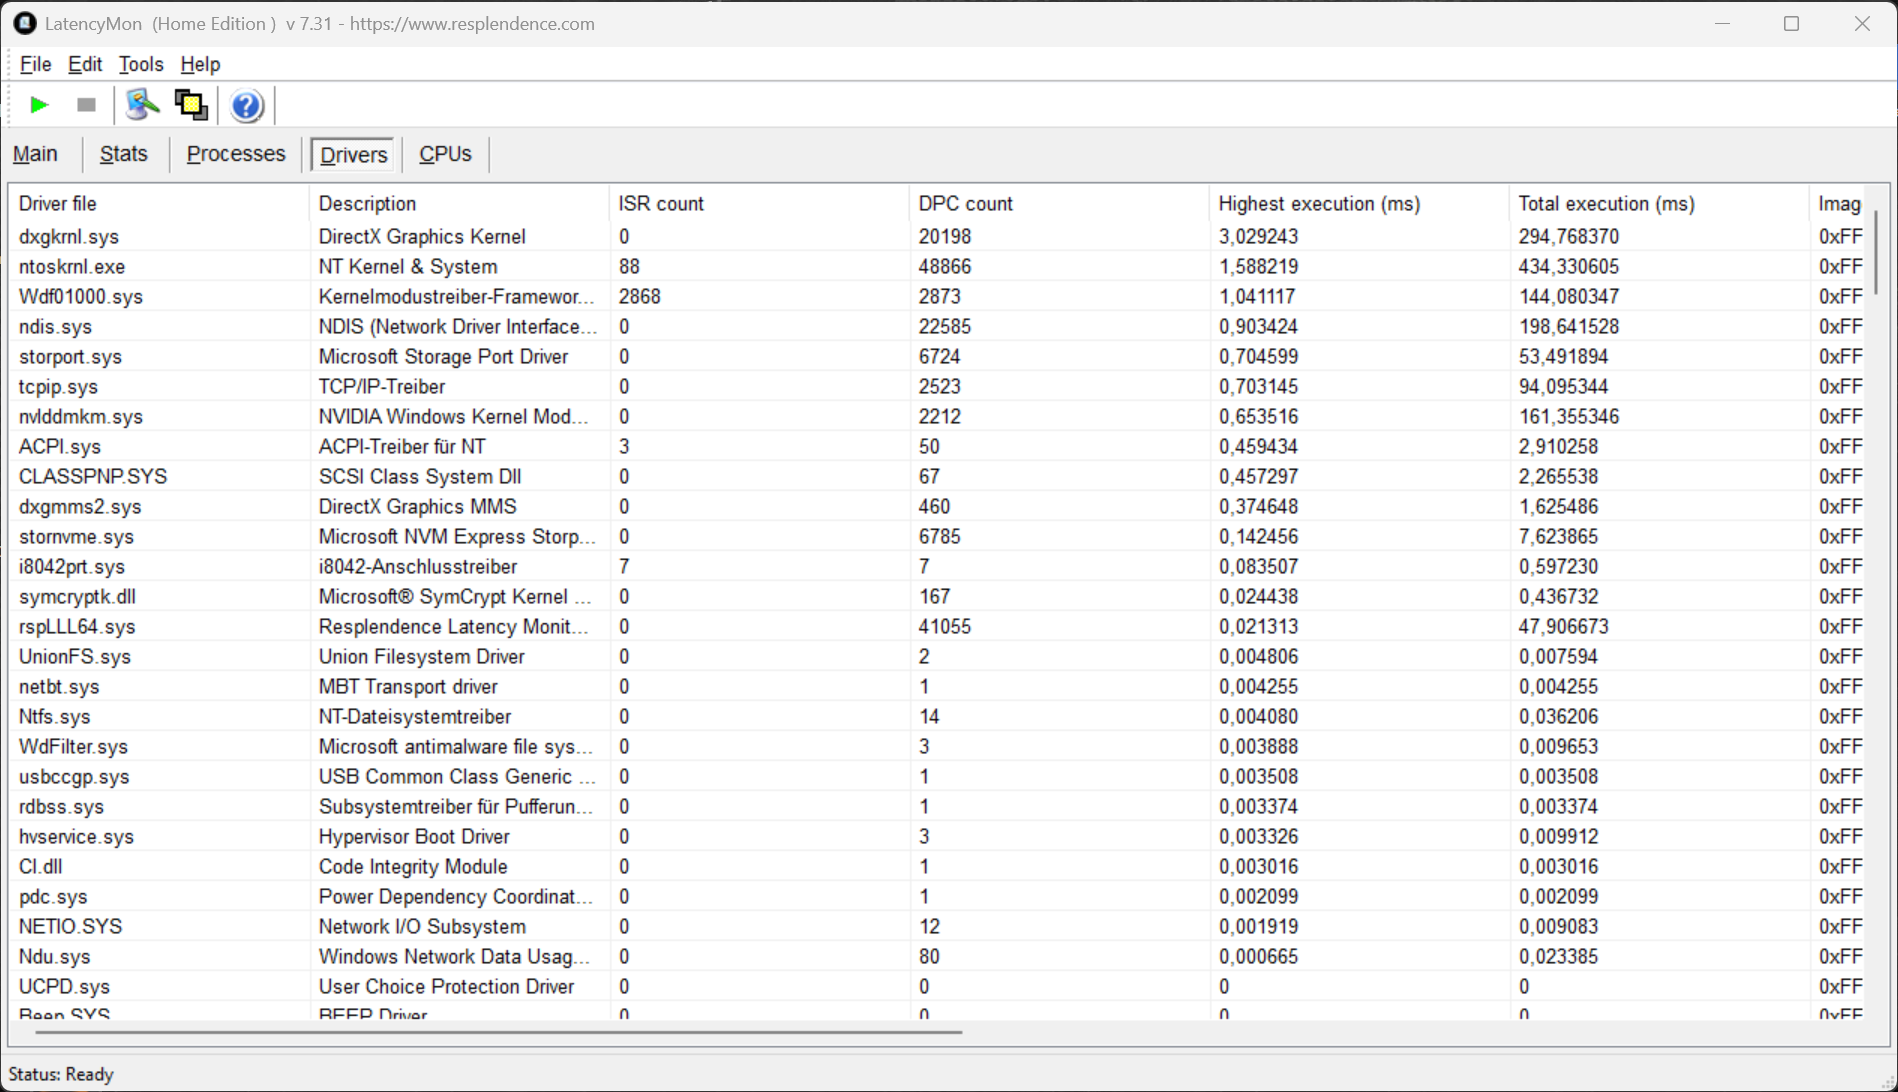
DPC 延迟
在我们的延迟测试中(上网、4K YouTube 播放、CPU 负载),使用当前 BIOS 版本的测试设备在使用实时音频应用程序时显示出轻微的限制。
| DPC Latencies / LatencyMon - interrupt to process latency (max), Web, Youtube, Prime95 | |
| Schenker XMG Pro 16 Studio (Mid 24) | |
| Schenker XMG Pro 16 (E25) | |
| Asus ROG Strix G16 G615 | |
| Lenovo Legion Pro 5 16IRX9 | |
| Lenovo Legion Pro 7i 16 Gen 10 | |
* ... smaller is better
存储设备
如果将 XMG Pro 16 配置为 Core Ultra 9 275HX,那么其两个 M.2 插槽中的一个已经支持快速 PCIe 5.0 连接。我们的测试设备配备了相应的三星 9100 固态硬盘(1 TB,用户可用容量为 868 GB)。在我们的测试过程中,它的传输速率非常高,峰值超过 10 GB/s,最重要的是,即使在长时间负载的情况下(约 10-12 GB/s),它的整体性能仍然相当稳定。

* ... smaller is better
Reading continuous performance: DiskSpd Read Loop, Queue Depth 8
图形卡
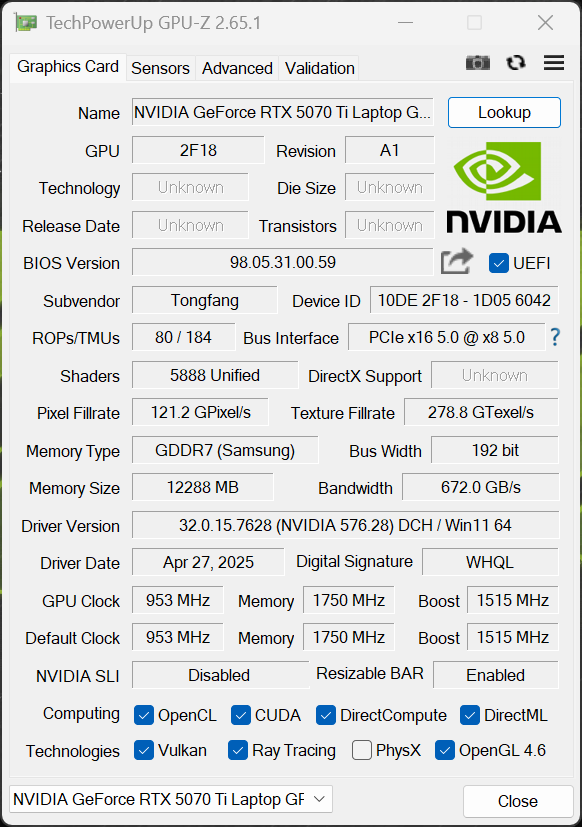
XMG Pro 16(E25)专门使用新的 英伟达GeForce RTX 5070 Ti 笔记本电脑配备 12GB VRAM。这是速度最快的机型,TGP 高达 140 瓦(115 瓦 + 25 瓦 Dynamic Boost)。正如我们在 分析中已经看到的分析中已经看到,RTX 5070 Ti 笔记本电脑在游戏时还能从这一高功耗限制中获益,而不像旧的 RTX 4070 笔记本电脑.图形切换通过普通 Optimus 技术进行,即没有高级 Optimus。虽然安装了 MUX 开关,但必须重新启动系统才能停用 iGPU。
我们在分析中已经展示了综合基准 分析简而言之,新款 RTX 5070 Ti 笔记本电脑与旧款 RTX 4080 笔记本电脑.新款 Pro 16 在合成测试中比前代产品领先约 40%,在标准 1080p 游戏测试中领先约 20%。不过,在本机分辨率下,它的领先优势更大。总体而言,您可以流畅地玩所有现代游戏,并获得较高的游戏细节;您只需使用完整的光线追踪/路径追踪功能进行升频即可,我们也在下面展示了这一功能。
| 3DMark Performance rating - Percent | |
| Lenovo Legion Pro 7i 16 Gen 10 -1! | |
| Asus ROG Strix G16 G615 | |
| Schenker XMG Pro 16 (E25) | |
| Average NVIDIA GeForce RTX 5070 Ti Laptop | |
| Average of class Gaming | |
| Lenovo Legion Pro 5 16IRX9 -1! | |
| Schenker XMG Pro 16 Studio (Mid 24) -1! | |
| Tuxedo Sirius 16 Gen 1 -3! | |
| 3DMark 11 Performance | 45656 points | |
| 3DMark Fire Strike Score | 35805 points | |
| 3DMark Time Spy Score | 17078 points | |
| 3DMark Steel Nomad Score | 4064 points | |
| 3DMark Steel Nomad Light Score | 17745 points | |
| 3DMark Steel Nomad Light Unlimited Score | 18056 points | |
Help | ||
| Blender / v3.3 Classroom OPTIX/RTX | |
| Schenker XMG Pro 16 Studio (Mid 24) | |
| Lenovo Legion Pro 5 16IRX9 | |
| Average of class Gaming (9 - 32, n=112, last 2 years) | |
| Average NVIDIA GeForce RTX 5070 Ti Laptop (13 - 19, n=14) | |
| Schenker XMG Pro 16 (E25) | |
| Lenovo Legion Pro 7i 16 Gen 10 | |
| Asus ROG Strix G16 G615 | |
| Blender / v3.3 Classroom CUDA | |
| Schenker XMG Pro 16 Studio (Mid 24) | |
| Average of class Gaming (15 - 228, n=112, last 2 years) | |
| Lenovo Legion Pro 5 16IRX9 | |
| Average NVIDIA GeForce RTX 5070 Ti Laptop (24 - 33, n=14) | |
| Schenker XMG Pro 16 (E25) | |
| Asus ROG Strix G16 G615 | |
| Lenovo Legion Pro 7i 16 Gen 10 | |
| Blender / v3.3 Classroom CPU | |
| Average of class Gaming (122 - 565, n=108, last 2 years) | |
| Schenker XMG Pro 16 Studio (Mid 24) | |
| Lenovo Legion Pro 5 16IRX9 | |
| Average NVIDIA GeForce RTX 5070 Ti Laptop (122 - 361, n=14) | |
| Lenovo Legion Pro 7i 16 Gen 10 | |
| Schenker XMG Pro 16 (E25) | |
| Asus ROG Strix G16 G615 | |
* ... smaller is better
| 设置 | Alan Wake 2 (High/Ultra + PT) | Cyberpunk 2077 Phantom Liberty (RT Overdrive) |
|---|---|---|
| 原生 | 23.5fps | 18fps |
| DLSS 质量 | 35.2fps | 35.2fps |
| DLSS 性能 | 45.7fps | 52.1fps |
| DLSS 质量 MFG x2 | 75.3fps | 62.8fps |
| DLSS 质量 MFG x4 | 124.3fps | 111.1fps |
| Performance rating - Percent | |
| Lenovo Legion Pro 7i 16 Gen 10 -1! | |
| Asus ROG Strix G16 G615 | |
| Schenker XMG Pro 16 (E25) | |
| Lenovo Legion Pro 5 16IRX9 | |
| Average of class Gaming | |
| Schenker XMG Pro 16 Studio (Mid 24) | |
| Tuxedo Sirius 16 Gen 1 -3! | |
| Cyberpunk 2077 - 1920x1080 Ultra Preset (FSR off) | |
| Lenovo Legion Pro 7i 16 Gen 10 | |
| Asus ROG Strix G16 G615 | |
| Schenker XMG Pro 16 (E25) | |
| Average of class Gaming (17.7 - 169.9, n=121, last 2 years) | |
| Lenovo Legion Pro 5 16IRX9 | |
| Schenker XMG Pro 16 Studio (Mid 24) | |
| Tuxedo Sirius 16 Gen 1 | |
| Baldur's Gate 3 - 1920x1080 Ultra Preset AA:T | |
| Lenovo Legion Pro 7i 16 Gen 10 | |
| Asus ROG Strix G16 G615 | |
| Schenker XMG Pro 16 (E25) | |
| Average of class Gaming (59.4 - 246, n=107, last 2 years) | |
| Lenovo Legion Pro 5 16IRX9 | |
| Schenker XMG Pro 16 Studio (Mid 24) | |
| Tuxedo Sirius 16 Gen 1 | |
| GTA V - 1920x1080 Highest AA:4xMSAA + FX AF:16x | |
| Asus ROG Strix G16 G615 | |
| Schenker XMG Pro 16 (E25) | |
| Average of class Gaming (48.3 - 186.9, n=103, last 2 years) | |
| Lenovo Legion Pro 5 16IRX9 | |
| Schenker XMG Pro 16 Studio (Mid 24) | |
| Final Fantasy XV Benchmark - 1920x1080 High Quality | |
| Lenovo Legion Pro 7i 16 Gen 10 | |
| Asus ROG Strix G16 G615 | |
| Schenker XMG Pro 16 (E25) | |
| Average of class Gaming (41 - 215, n=104, last 2 years) | |
| Lenovo Legion Pro 5 16IRX9 | |
| Schenker XMG Pro 16 Studio (Mid 24) | |
| Tuxedo Sirius 16 Gen 1 | |
| Strange Brigade - 1920x1080 ultra AA:ultra AF:16 | |
| Lenovo Legion Pro 7i 16 Gen 10 | |
| Asus ROG Strix G16 G615 | |
| Average of class Gaming (76.3 - 456, n=94, last 2 years) | |
| Lenovo Legion Pro 5 16IRX9 | |
| Schenker XMG Pro 16 Studio (Mid 24) | |
| Tuxedo Sirius 16 Gen 1 | |
| Schenker XMG Pro 16 (E25) | |
| Dota 2 Reborn - 1920x1080 ultra (3/3) best looking | |
| Lenovo Legion Pro 7i 16 Gen 10 | |
| Lenovo Legion Pro 5 16IRX9 | |
| Asus ROG Strix G16 G615 | |
| Schenker XMG Pro 16 (E25) | |
| Schenker XMG Pro 16 Studio (Mid 24) | |
| Average of class Gaming (84.8 - 248, n=113, last 2 years) | |
Cyberpunk 2077 ultra FPS diagram
| low | med. | high | ultra | QHD DLSS | QHD | 4K DLSS | 4K | |
|---|---|---|---|---|---|---|---|---|
| GTA V (2015) | 161 | 147.3 | ||||||
| Dota 2 Reborn (2015) | 223 | 199.7 | 189.3 | 174.8 | ||||
| Final Fantasy XV Benchmark (2018) | 217 | 183.4 | 147.8 | 125.2 | ||||
| X-Plane 11.11 (2018) | 156.9 | 144.1 | 117.5 | |||||
| Strange Brigade (2018) | 392 | 201 | 156.5 | 136.4 | 103.8 | |||
| Baldur's Gate 3 (2023) | 157 | 109.2 | ||||||
| Cyberpunk 2077 (2023) | 188.6 | 169.2 | 144.6 | 129.9 | 91.6 | 81.6 | ||
| Alan Wake 2 (2023) | 108.9 | 103.5 | 96 | 64.5 | ||||
| F1 24 (2024) | 250 | 108 | 71.2 | |||||
| Call of Duty Black Ops 6 (2024) | 152 | 142 | 100 | 94 | 65 | |||
| Anno 117: Pax Romana (2025) | 142.3 | 107.2 | 84.4 | 47.4 | 48.7 | 34.3 | 30.5 | 19.3 |
| Call of Duty Black Ops 7 (2025) | 257 | 190 | 147 | 52 | 53 | 34 | ||
| Pragmata (2026) | 192 | 146.4 | 119.4 | 96.7 | 86 | 54 | 47.7 | |
| Forza Horizon 6 (2026) | 214 | 166 | 116 | 67 | 66 | 46 | 32 | 25 |
排放与能源
噪音排放
XMG Pro 16 的风扇始终处于激活状态,但在空转和低负载(25 dB(A))时,几乎听不到风扇产生的噪音。您也可以在 BIOS 中激活被动模式,但在这种情况下,风扇经常会短时启动,感觉噪音更大。在日常使用中,尤其是在平衡模式下,该设备能保持超静音,但在游戏和满负荷运行时,其高功率限制就会产生影响。在我们的测试中,根据模式的不同,噪音值大约在 45 到 53 分贝(A)之间,因此我们建议在游戏时使用耳机。我们的测试设备上没有其他电子噪音。
Noise level
| Idle |
| 25 / 25 / 25 dB(A) |
| Load |
| 45.5 / 53.3 dB(A) |
 | ||
30 dB silent 40 dB(A) audible 50 dB(A) loud |
||
min: | ||
| Schenker XMG Pro 16 (E25) GeForce RTX 5070 Ti Laptop, Ultra 9 275HX, Samsung 9100 Pro 1 TB | Schenker XMG Pro 16 Studio (Mid 24) GeForce RTX 4070 Laptop GPU, i9-14900HX, Samsung 990 Pro 1 TB | Asus ROG Strix G16 G615 GeForce RTX 5080 Laptop, Ultra 9 275HX, Micron 2500 1TB MTFDKBA1T0QGN | Tuxedo Sirius 16 Gen 1 Radeon RX 7600M XT, R7 7840HS, Samsung SSD 980 Pro 1TB MZ-V8P1T0BW | Lenovo Legion Pro 5 16IRX9 GeForce RTX 4070 Laptop GPU, i9-14900HX, Samsung PM9A1 MZVL21T0HCLR | Lenovo Legion Pro 7i 16 Gen 10 GeForce RTX 5080 Laptop, Ultra 9 275HX, SK Hynix HFS001TEJ9X115N | |
|---|---|---|---|---|---|---|
| Noise | -13% | -5% | -5% | -3% | 7% | |
| off / environment * (dB) | 23.3 | 25 -7% | 24 -3% | 25.1 -8% | 23.9 -3% | 22.9 2% |
| Idle Minimum * (dB) | 25 | 28 -12% | 24 4% | 25.1 -0% | 24.3 3% | 22.9 8% |
| Idle Average * (dB) | 25 | 31 -24% | 30.1 -20% | 30.4 -22% | 24.3 3% | 22.9 8% |
| Idle Maximum * (dB) | 25 | 35 -40% | 30.1 -20% | 30.4 -22% | 28.9 -16% | 26.3 -5% |
| Load Average * (dB) | 45.5 | 52 -14% | 41.1 10% | 35.2 23% | 45.8 -1% | 27.8 39% |
| Cyberpunk 2077 ultra * (dB) | 53.3 | 53 1% | 54.2 -2% | 54.2 -2% | ||
| Load Maximum * (dB) | 53.3 | 52 2% | 54.2 -2% | 54.2 -2% | 56.6 -6% | 53.9 -1% |
| Witcher 3 ultra * (dB) | 51 |
* ... smaller is better
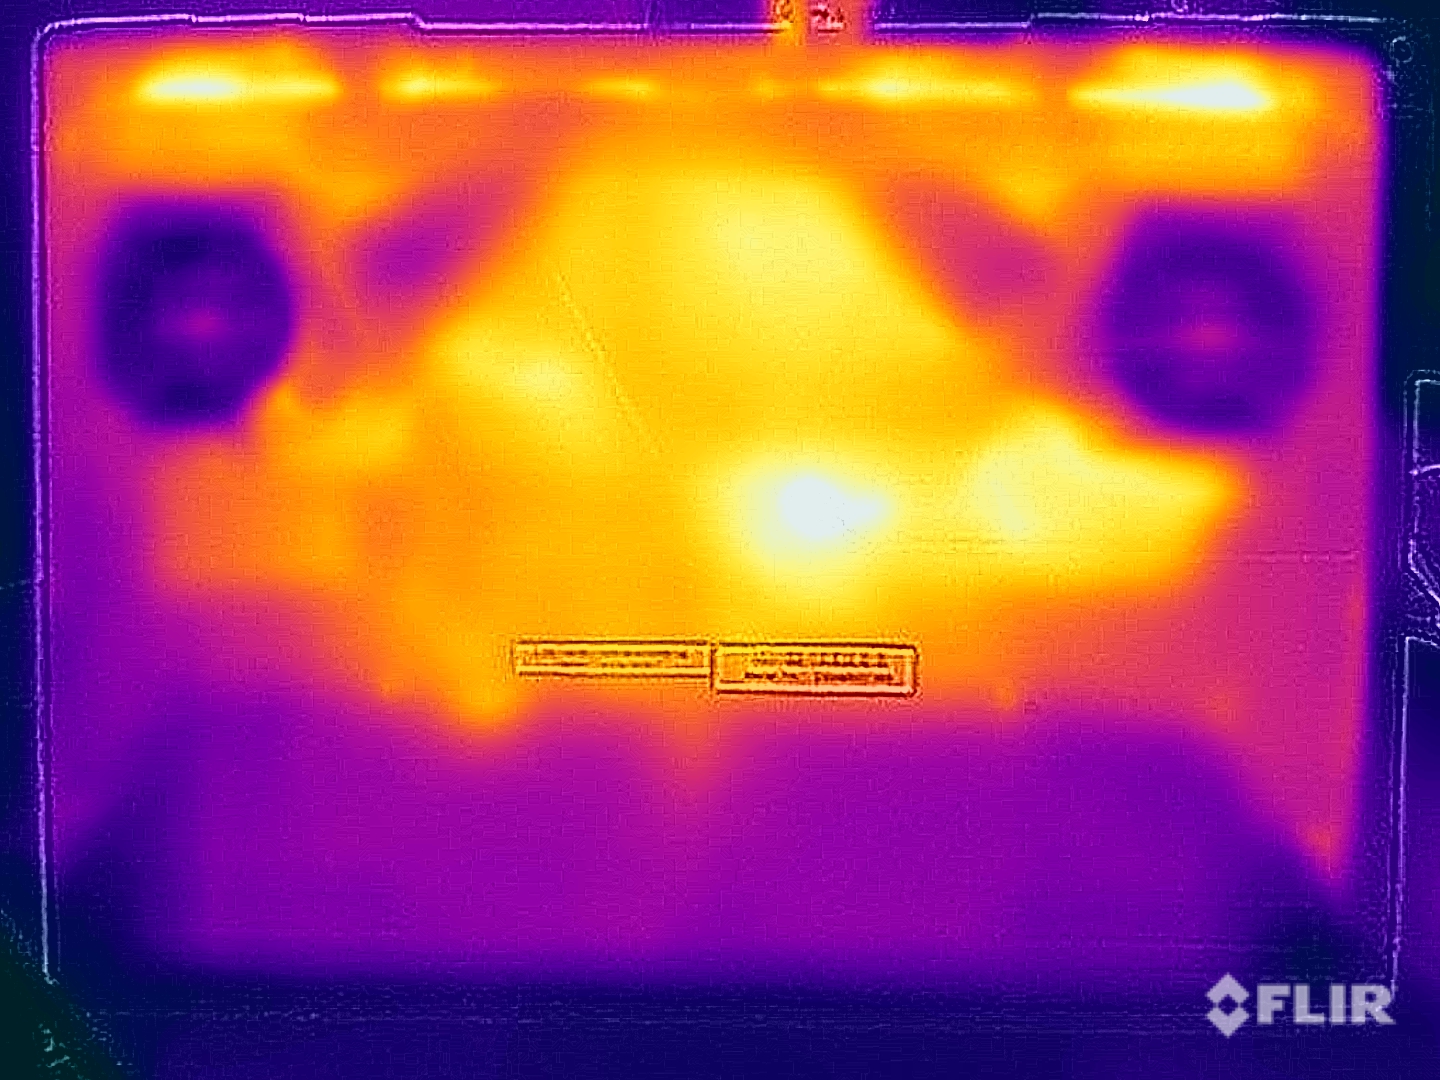
温度
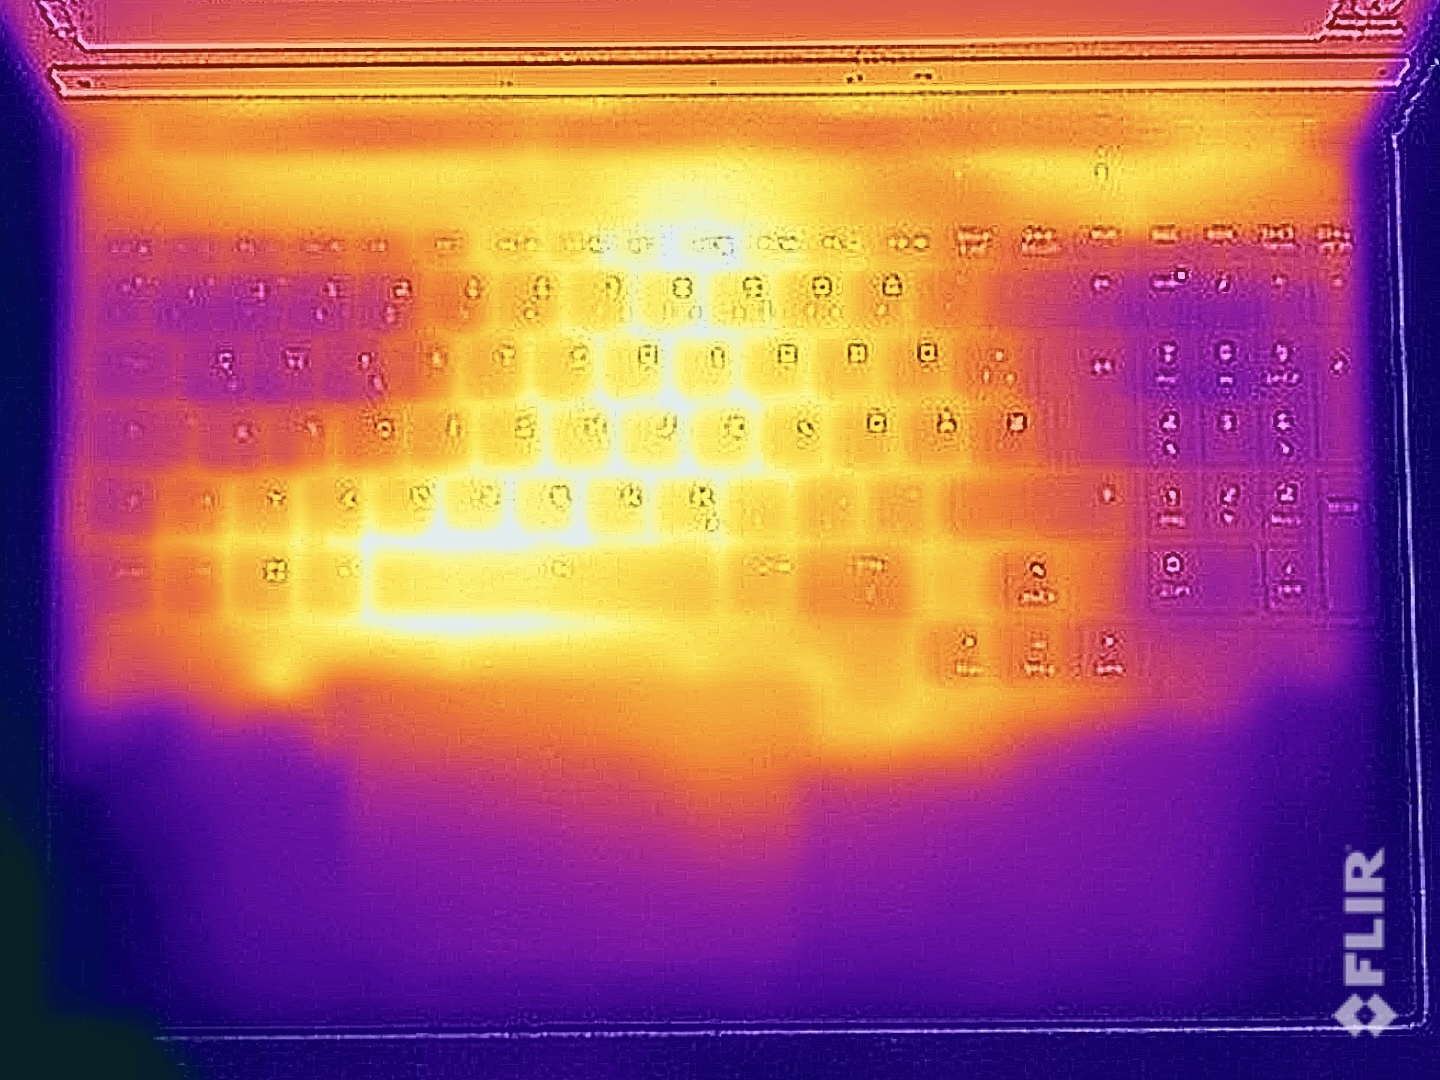
在空闲模式下和执行简单任务时,笔记本表面温度很低,但在高负载时温度会明显升高。虽然在测试过程中没有出现临界点,但一些测量点的温度超过了 40 °C。除了手指略微发热之外,我们在打字时没有发现任何问题。在压力测试中,CPU/GPU 的功耗分别为 60 瓦和 140 瓦,Pro 16 的总功耗为 200 瓦。

(±) The maximum temperature on the upper side is 43.2 °C / 110 F, compared to the average of 40.4 °C / 105 F, ranging from 21.2 to 68.8 °C for the class Gaming.
(-) The bottom heats up to a maximum of 46 °C / 115 F, compared to the average of 43.2 °C / 110 F
(+) In idle usage, the average temperature for the upper side is 27 °C / 81 F, compared to the device average of 33.9 °C / 93 F.
(-) 3: The average temperature for the upper side is 38.7 °C / 102 F, compared to the average of 33.9 °C / 93 F for the class Gaming.
(±) The palmrests and touchpad can get very hot to the touch with a maximum of 38.9 °C / 102 F.
(-) The average temperature of the palmrest area of similar devices was 28.8 °C / 83.8 F (-10.1 °C / -18.2 F).
| Schenker XMG Pro 16 (E25) Intel Core Ultra 9 275HX, NVIDIA GeForce RTX 5070 Ti Laptop | Schenker XMG Pro 16 Studio (Mid 24) Intel Core i9-14900HX, NVIDIA GeForce RTX 4070 Laptop GPU | Asus ROG Strix G16 G615 Intel Core Ultra 9 275HX, NVIDIA GeForce RTX 5080 Laptop | Tuxedo Sirius 16 Gen 1 AMD Ryzen 7 7840HS, AMD Radeon RX 7600M XT | Lenovo Legion Pro 5 16IRX9 Intel Core i9-14900HX, NVIDIA GeForce RTX 4070 Laptop GPU | Lenovo Legion Pro 7i 16 Gen 10 Intel Core Ultra 9 275HX, NVIDIA GeForce RTX 5080 Laptop | |
|---|---|---|---|---|---|---|
| Heat | -1% | 24% | 11% | 12% | 20% | |
| Maximum Upper Side * (°C) | 43.2 | 51 -18% | 39.6 8% | 54.7 -27% | 43.8 -1% | 42.6 1% |
| Maximum Bottom * (°C) | 46 | 66 -43% | 49.7 -8% | 57.1 -24% | 55.4 -20% | 41.2 10% |
| Idle Upper Side * (°C) | 27.7 | 35 -26% | 26.3 5% | 25.8 7% | 32.8 -18% | 32.6 -18% |
| Idle Bottom * (°C) | 264 | 39 85% | 27.3 90% | 32 88% | 36 86% | 32.4 88% |
* ... smaller is better
发言人
这两个立体声扬声器并不是最好的,因为声音相对较弱,就像它的前代产品一样。 前代产品一样。
Schenker XMG Pro 16 (E25) audio analysis
(±) | speaker loudness is average but good (79.2 dB)
Bass 100 - 315 Hz
(±) | reduced bass - on average 14.2% lower than median
(±) | linearity of bass is average (10.6% delta to prev. frequency)
Mids 400 - 2000 Hz
(±) | higher mids - on average 8.2% higher than median
(±) | linearity of mids is average (9.9% delta to prev. frequency)
Highs 2 - 16 kHz
(+) | balanced highs - only 3.8% away from median
(+) | highs are linear (5.9% delta to prev. frequency)
Overall 100 - 16.000 Hz
(±) | linearity of overall sound is average (18.5% difference to median)
Compared to same class
» 60% of all tested devices in this class were better, 8% similar, 32% worse
» The best had a delta of 6%, average was 18%, worst was 132%
Compared to all devices tested
» 41% of all tested devices were better, 8% similar, 51% worse
» The best had a delta of 4%, average was 24%, worst was 134%
Schenker XMG Pro 16 Studio (Mid 24) audio analysis
(±) | speaker loudness is average but good (79 dB)
Bass 100 - 315 Hz
(-) | nearly no bass - on average 15.1% lower than median
(±) | linearity of bass is average (13.6% delta to prev. frequency)
Mids 400 - 2000 Hz
(±) | higher mids - on average 5.3% higher than median
(+) | mids are linear (4.4% delta to prev. frequency)
Highs 2 - 16 kHz
(+) | balanced highs - only 4.4% away from median
(+) | highs are linear (4.9% delta to prev. frequency)
Overall 100 - 16.000 Hz
(±) | linearity of overall sound is average (17.7% difference to median)
Compared to same class
» 52% of all tested devices in this class were better, 10% similar, 38% worse
» The best had a delta of 6%, average was 18%, worst was 132%
Compared to all devices tested
» 35% of all tested devices were better, 8% similar, 57% worse
» The best had a delta of 4%, average was 24%, worst was 134%
Asus ROG Strix G16 G615 audio analysis
(+) | speakers can play relatively loud (82.2 dB)
Bass 100 - 315 Hz
(±) | reduced bass - on average 7.5% lower than median
(±) | linearity of bass is average (7.4% delta to prev. frequency)
Mids 400 - 2000 Hz
(+) | balanced mids - only 2.9% away from median
(+) | mids are linear (3.6% delta to prev. frequency)
Highs 2 - 16 kHz
(+) | balanced highs - only 2.8% away from median
(±) | linearity of highs is average (8.3% delta to prev. frequency)
Overall 100 - 16.000 Hz
(+) | overall sound is linear (9.4% difference to median)
Compared to same class
» 3% of all tested devices in this class were better, 2% similar, 95% worse
» The best had a delta of 6%, average was 18%, worst was 132%
Compared to all devices tested
» 3% of all tested devices were better, 1% similar, 96% worse
» The best had a delta of 4%, average was 24%, worst was 134%
Tuxedo Sirius 16 Gen 1 audio analysis
(+) | speakers can play relatively loud (85 dB)
Bass 100 - 315 Hz
(±) | reduced bass - on average 14.1% lower than median
(±) | linearity of bass is average (7.7% delta to prev. frequency)
Mids 400 - 2000 Hz
(±) | higher mids - on average 6.8% higher than median
(±) | linearity of mids is average (9.7% delta to prev. frequency)
Highs 2 - 16 kHz
(+) | balanced highs - only 3.7% away from median
(±) | linearity of highs is average (7% delta to prev. frequency)
Overall 100 - 16.000 Hz
(±) | linearity of overall sound is average (16.4% difference to median)
Compared to same class
» 42% of all tested devices in this class were better, 6% similar, 52% worse
» The best had a delta of 6%, average was 18%, worst was 132%
Compared to all devices tested
» 27% of all tested devices were better, 6% similar, 67% worse
» The best had a delta of 4%, average was 24%, worst was 134%
Lenovo Legion Pro 5 16IRX9 audio analysis
(±) | speaker loudness is average but good (80.7 dB)
Bass 100 - 315 Hz
(-) | nearly no bass - on average 19% lower than median
(±) | linearity of bass is average (10.1% delta to prev. frequency)
Mids 400 - 2000 Hz
(+) | balanced mids - only 4.7% away from median
(+) | mids are linear (5.7% delta to prev. frequency)
Highs 2 - 16 kHz
(+) | balanced highs - only 3.3% away from median
(+) | highs are linear (5.6% delta to prev. frequency)
Overall 100 - 16.000 Hz
(±) | linearity of overall sound is average (17.2% difference to median)
Compared to same class
» 46% of all tested devices in this class were better, 11% similar, 42% worse
» The best had a delta of 6%, average was 18%, worst was 132%
Compared to all devices tested
» 32% of all tested devices were better, 8% similar, 60% worse
» The best had a delta of 4%, average was 24%, worst was 134%
Lenovo Legion Pro 7i 16 Gen 10 audio analysis
(±) | speaker loudness is average but good (81.4 dB)
Bass 100 - 315 Hz
(±) | reduced bass - on average 7.6% lower than median
(±) | linearity of bass is average (9.4% delta to prev. frequency)
Mids 400 - 2000 Hz
(+) | balanced mids - only 4.1% away from median
(+) | mids are linear (4.8% delta to prev. frequency)
Highs 2 - 16 kHz
(+) | balanced highs - only 1.9% away from median
(+) | highs are linear (4.8% delta to prev. frequency)
Overall 100 - 16.000 Hz
(+) | overall sound is linear (9.4% difference to median)
Compared to same class
» 3% of all tested devices in this class were better, 2% similar, 95% worse
» The best had a delta of 6%, average was 18%, worst was 132%
Compared to all devices tested
» 3% of all tested devices were better, 1% similar, 96% worse
» The best had a delta of 4%, average was 24%, worst was 134%
耗电量
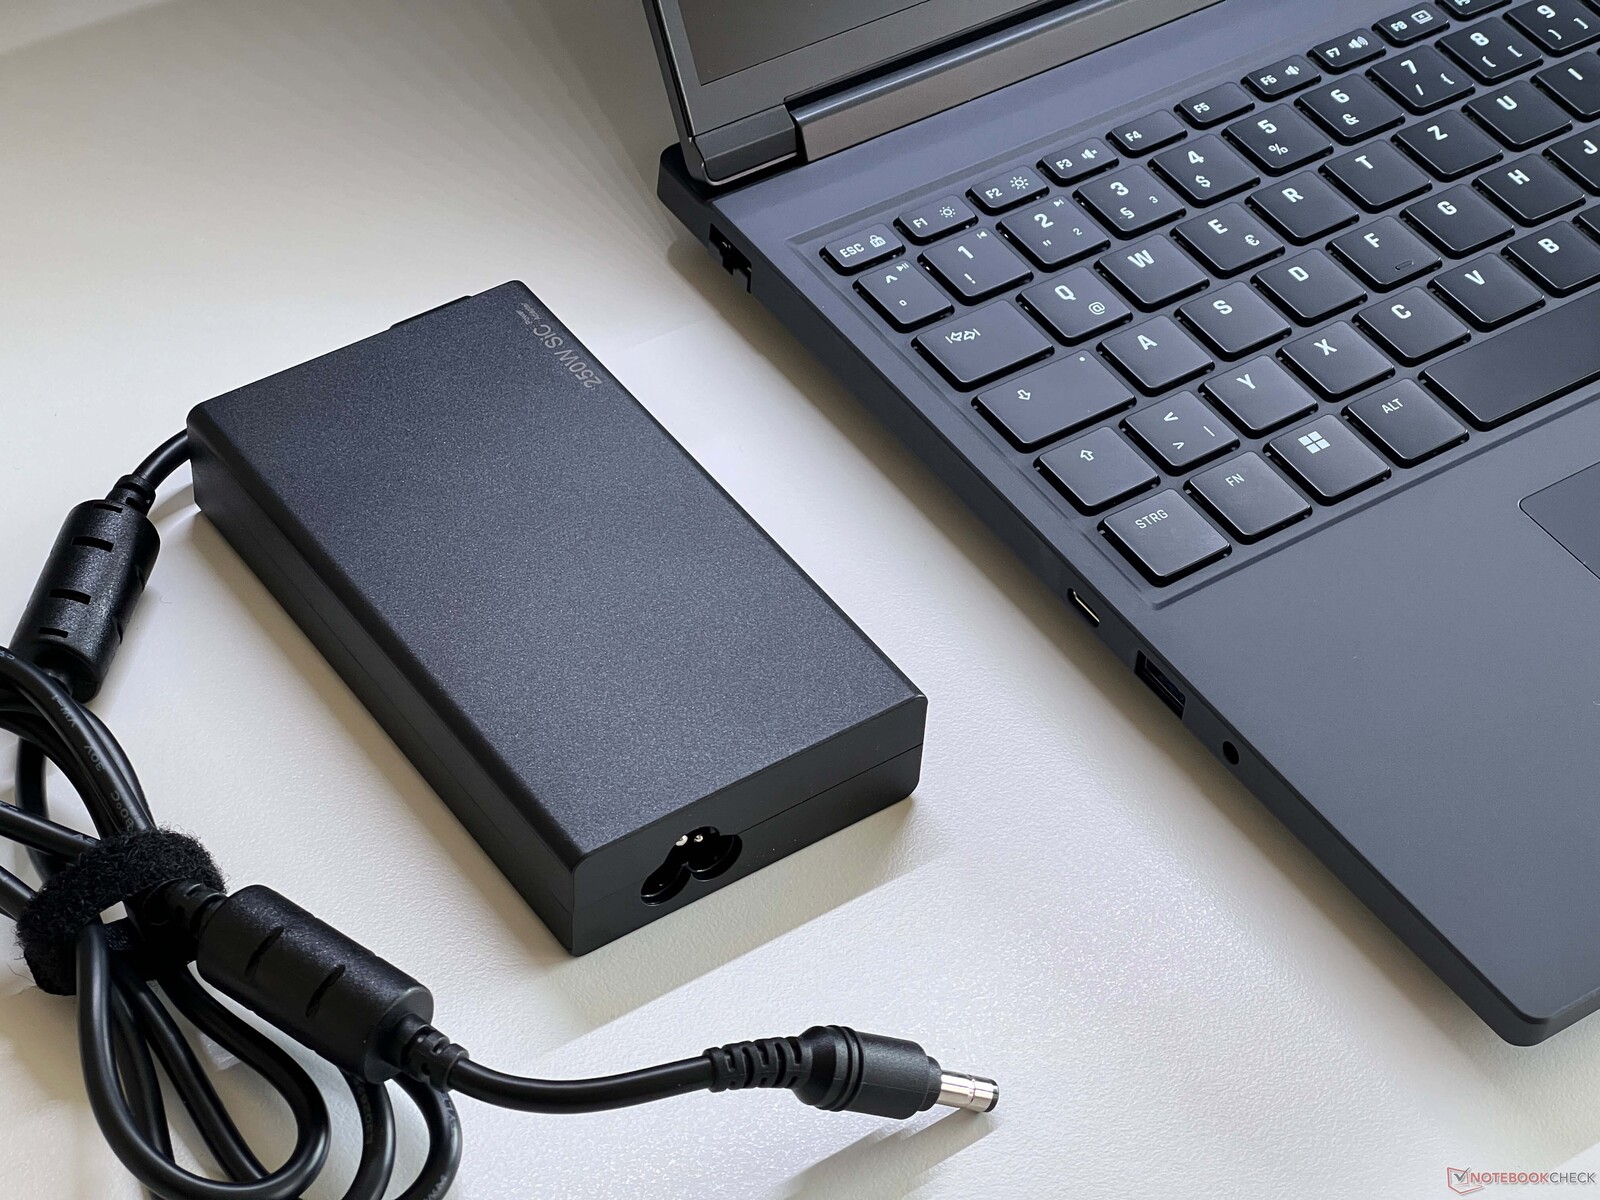
Pro 16 在空闲模式下的效率相对较高,但在负载情况下的数值符合预期。游戏时的功率约为 240-250 瓦,而在压力测试中,我们曾短暂看到高达 290 瓦的功率,随后这一数值迅速稳定在 240 瓦左右。由于提供的 250 瓦电源装置(非常小巧)可以提供 290 瓦的功率,因此在体积上完全够用。不过,我们测得的待机功耗为 2.1 瓦,这个数值太高了。
| Off / Standby | |
| Idle | |
| Load |
|
Key:
min: | |
| Schenker XMG Pro 16 (E25) Ultra 9 275HX, GeForce RTX 5070 Ti Laptop, Samsung 9100 Pro 1 TB, IPS, 2560x1600, 16" | Schenker XMG Pro 16 Studio (Mid 24) i9-14900HX, GeForce RTX 4070 Laptop GPU, Samsung 990 Pro 1 TB, IPS, 2560x1600, 16" | Asus ROG Strix G16 G615 Ultra 9 275HX, GeForce RTX 5080 Laptop, Micron 2500 1TB MTFDKBA1T0QGN, IPS, 2560x1600, 16" | Tuxedo Sirius 16 Gen 1 R7 7840HS, Radeon RX 7600M XT, Samsung SSD 980 Pro 1TB MZ-V8P1T0BW, IPS, 2560x1440, 16.1" | Lenovo Legion Pro 5 16IRX9 i9-14900HX, GeForce RTX 4070 Laptop GPU, Samsung PM9A1 MZVL21T0HCLR, IPS, 2560x1600, 16" | Lenovo Legion Pro 7i 16 Gen 10 Ultra 9 275HX, GeForce RTX 5080 Laptop, SK Hynix HFS001TEJ9X115N, OLED, 2560x1600, 16" | |
|---|---|---|---|---|---|---|
| Power Consumption | -51% | -12% | -13% | -18% | -78% | |
| Idle Minimum * (Watt) | 11.7 | 31 -165% | 10.8 8% | 15.9 -36% | 12.5 -7% | 28.5 -144% |
| Idle Average * (Watt) | 16.6 | 33 -99% | 17.7 -7% | 20.1 -21% | 24.6 -48% | 38.8 -134% |
| Idle Maximum * (Watt) | 17.1 | 41 -140% | 18.8 -10% | 23.5 -37% | 24.8 -45% | 45.6 -167% |
| Load Average * (Watt) | 122.4 | 114 7% | 139.4 -14% | 111.7 9% | 109.6 10% | 132.2 -8% |
| Cyberpunk 2077 ultra * (Watt) | 245 | 218 11% | 295 -20% | 318 -30% | ||
| Cyberpunk 2077 ultra external monitor * (Watt) | 241 | 196.8 18% | 291 -21% | 319 -32% | ||
| Load Maximum * (Watt) | 291.5 | 250 14% | 359.3 -23% | 240 18% | 284.9 2% | 384 -32% |
| Witcher 3 ultra * (Watt) | 228 | 218 |
* ... smaller is better
Power consumption Cyberpunk / stress test
Power consumption with external monitor
运行时间
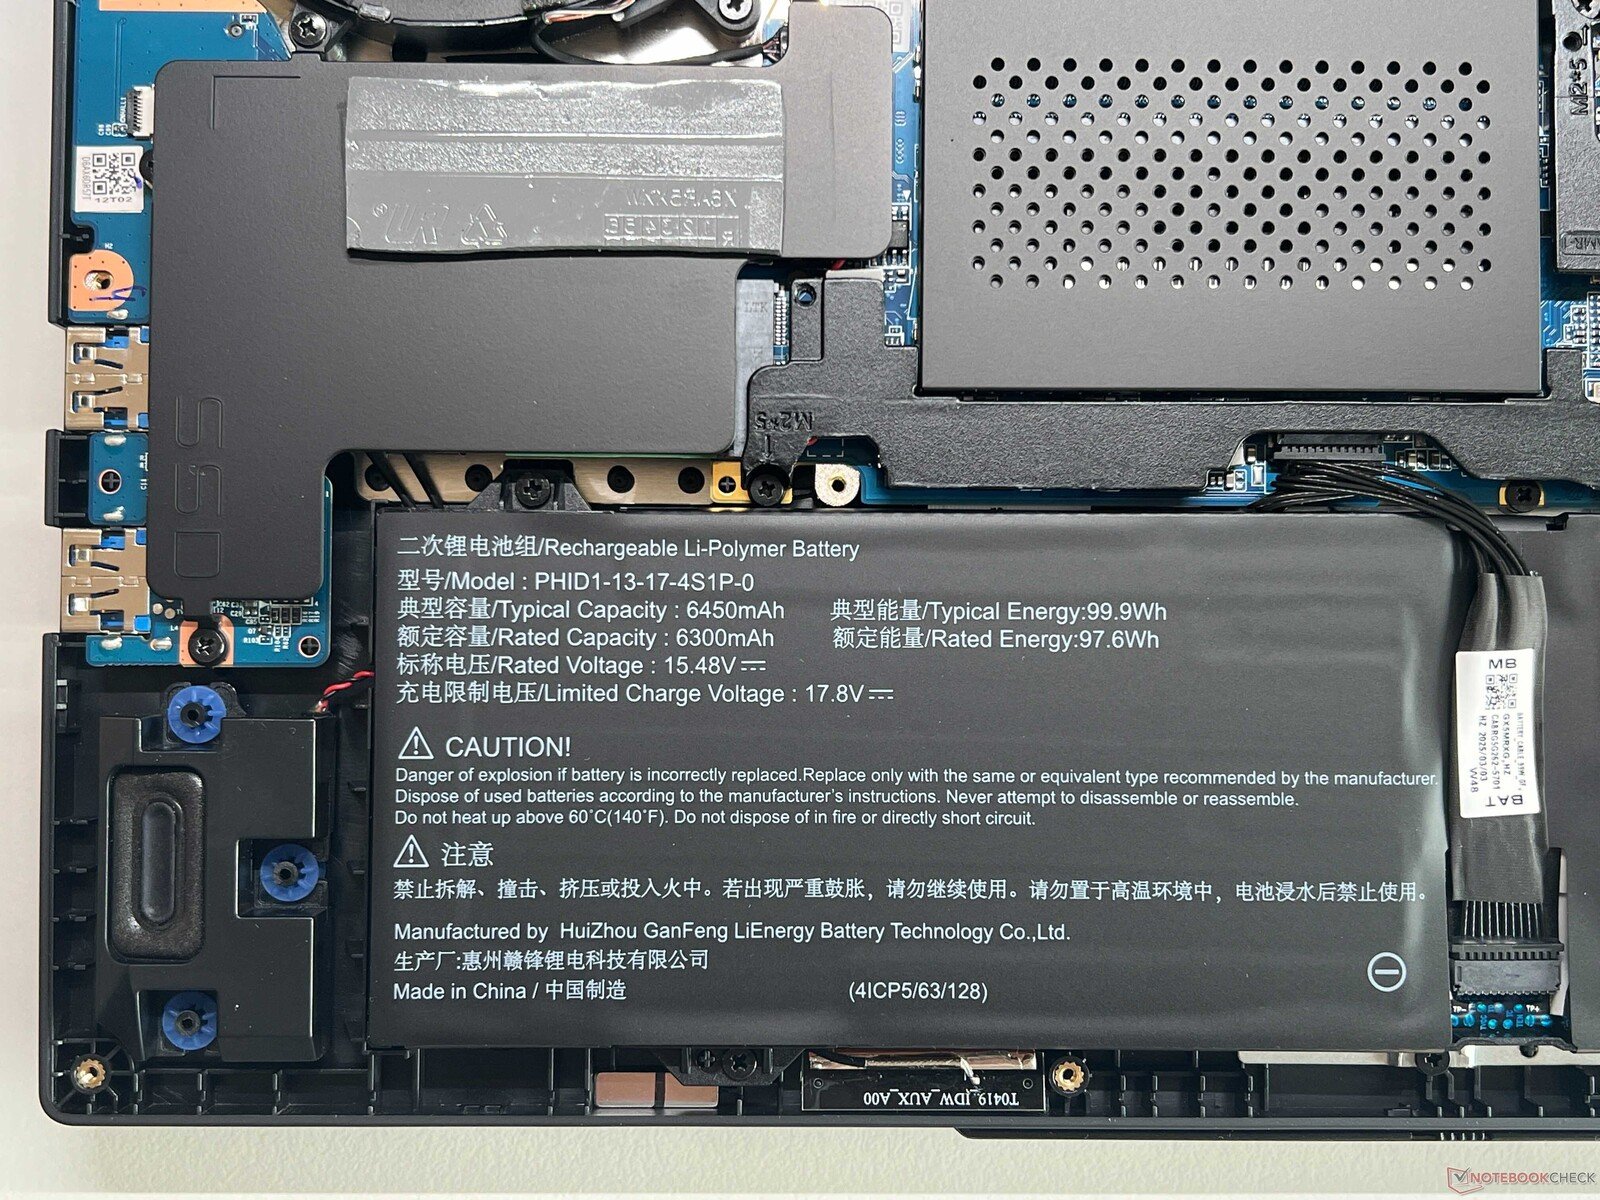
在亮度为 150 cd/m²(测试设备最大亮度的 57%)的情况下,笔记本电脑的 99.8 Wh 电池在 60 Hz 的 WLAN 测试中可持续 9 个多小时,在全亮度下可持续 6 个多小时。这些数值明显优于 前代机型(73 Wh)相比有了明显提高。在设备打开的情况下,完整的充电过程需要 116 分钟(一小时后达到 80%)。
| Battery Runtime | |
| WiFi Websurfing | |
| Schenker XMG Pro 16 (E25) | |
| Asus ROG Strix G16 G615 | |
| Tuxedo Sirius 16 Gen 1 | |
| Average of class Gaming (1.967 - 14.6, n=104, last 2 years) | |
| Schenker XMG Pro 16 Studio (Mid 24) | |
| Lenovo Legion Pro 7i 16 Gen 10 | |
| Lenovo Legion Pro 5 16IRX9 | |
| WiFi Websurfing max. Brightness | |
| Asus ROG Strix G16 G615 | |
| Schenker XMG Pro 16 (E25) | |
| Average of class Gaming (2.35 - 8.93, n=29, last 2 years) | |
Notebookcheck 总评分
Schenker XMG Pro 16 (E25)
- 05/05/2025 v8
Andreas Osthoff
 Total Sustainability Score:
 可能的替代品比较
Transparency
The selection of devices to be reviewed is made by our editorial team. The test sample was provided to the author as a loan by the manufacturer or retailer for the purpose of this review. The lender had no influence on this review, nor did the manufacturer receive a copy of this review before publication. There was no obligation to publish this review. As an independent media company, Notebookcheck is not subjected to the authority of manufacturers, retailers or publishers.
This is how Notebookcheck is testing
Every year, Notebookcheck independently reviews hundreds of laptops and smartphones using standardized procedures to ensure that all results are comparable. We have continuously developed our test methods for around 20 years and set industry standards in the process. In our test labs, high-quality measuring equipment is utilized by experienced technicians and editors. These tests involve a multi-stage validation process. Our complex rating system is based on hundreds of well-founded measurements and benchmarks, which maintains objectivity. Further information on our test methods can be found here.

