结论:成功的游戏与创作者混合体
作为一款 "专业 "笔记本电脑,略显简单的游戏设计也能吸引内容创作者。此外,Legion Pro 5 16 出色的 OLED 显示屏和强大的 3D 性能也给我们留下了深刻印象。在配备 RTX 5070 Ti 的 16 英寸笔记本电脑中,Legion Pro 无疑是性能和制造质量方面最强的代表之一。在此基础上,前代产品的诟病已被消除,这意味着最初关于联想是否在保留其优点的同时努力克服了缺点的问题可以得到肯定的回答。
不过,你会感觉到,也许是因为 OLED 的缘故,联想不得不在其他方面偷工减料。硬件方面尤其如此,有些硬件已经跟不上时代的步伐。三个 USB-A 端口中的两个传输速率只有 5 Gbps 而不是 10 Gbps,没有 Thunderbolt 5(只有 4 Gbps),没有 Wi-Fi 6E,也没有 Wi-Fi 7。此外,它还没有 SD 读卡器,这很可能会惹恼创作者。类似的问题还有播放高分辨率 YouTube 视频时出现的掉帧现象,以及在高性能下相对较大的音量。另外一个令人不满的问题是,联想在其各种或多或少强制性的软件解决方案中加入了越来越多的广告。为了客户着想,联想应该在这方面退一步!
Pros
Cons
价格和供应情况
该机型仍然很难买到,也没有在各种比较门户网站上列出。在德国,只有配备 RTX 5070(不含 "Ti")的型号有售,起价为 2,400 欧元(约合人民币 2,880 元)。
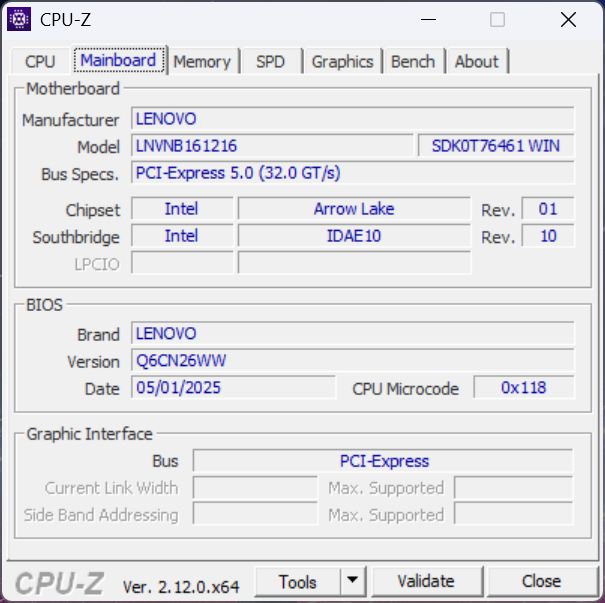
去年 Legion Pro 5 16或Legion Pro 5i 是最好、最受欢迎的游戏笔记本电脑。主要的批评意见是 SSD 发热过高、过重以及散热系统不均匀。不过,CPU 和 GPU 性能高于平均水平。联想对继任者做了哪些改变?
规格
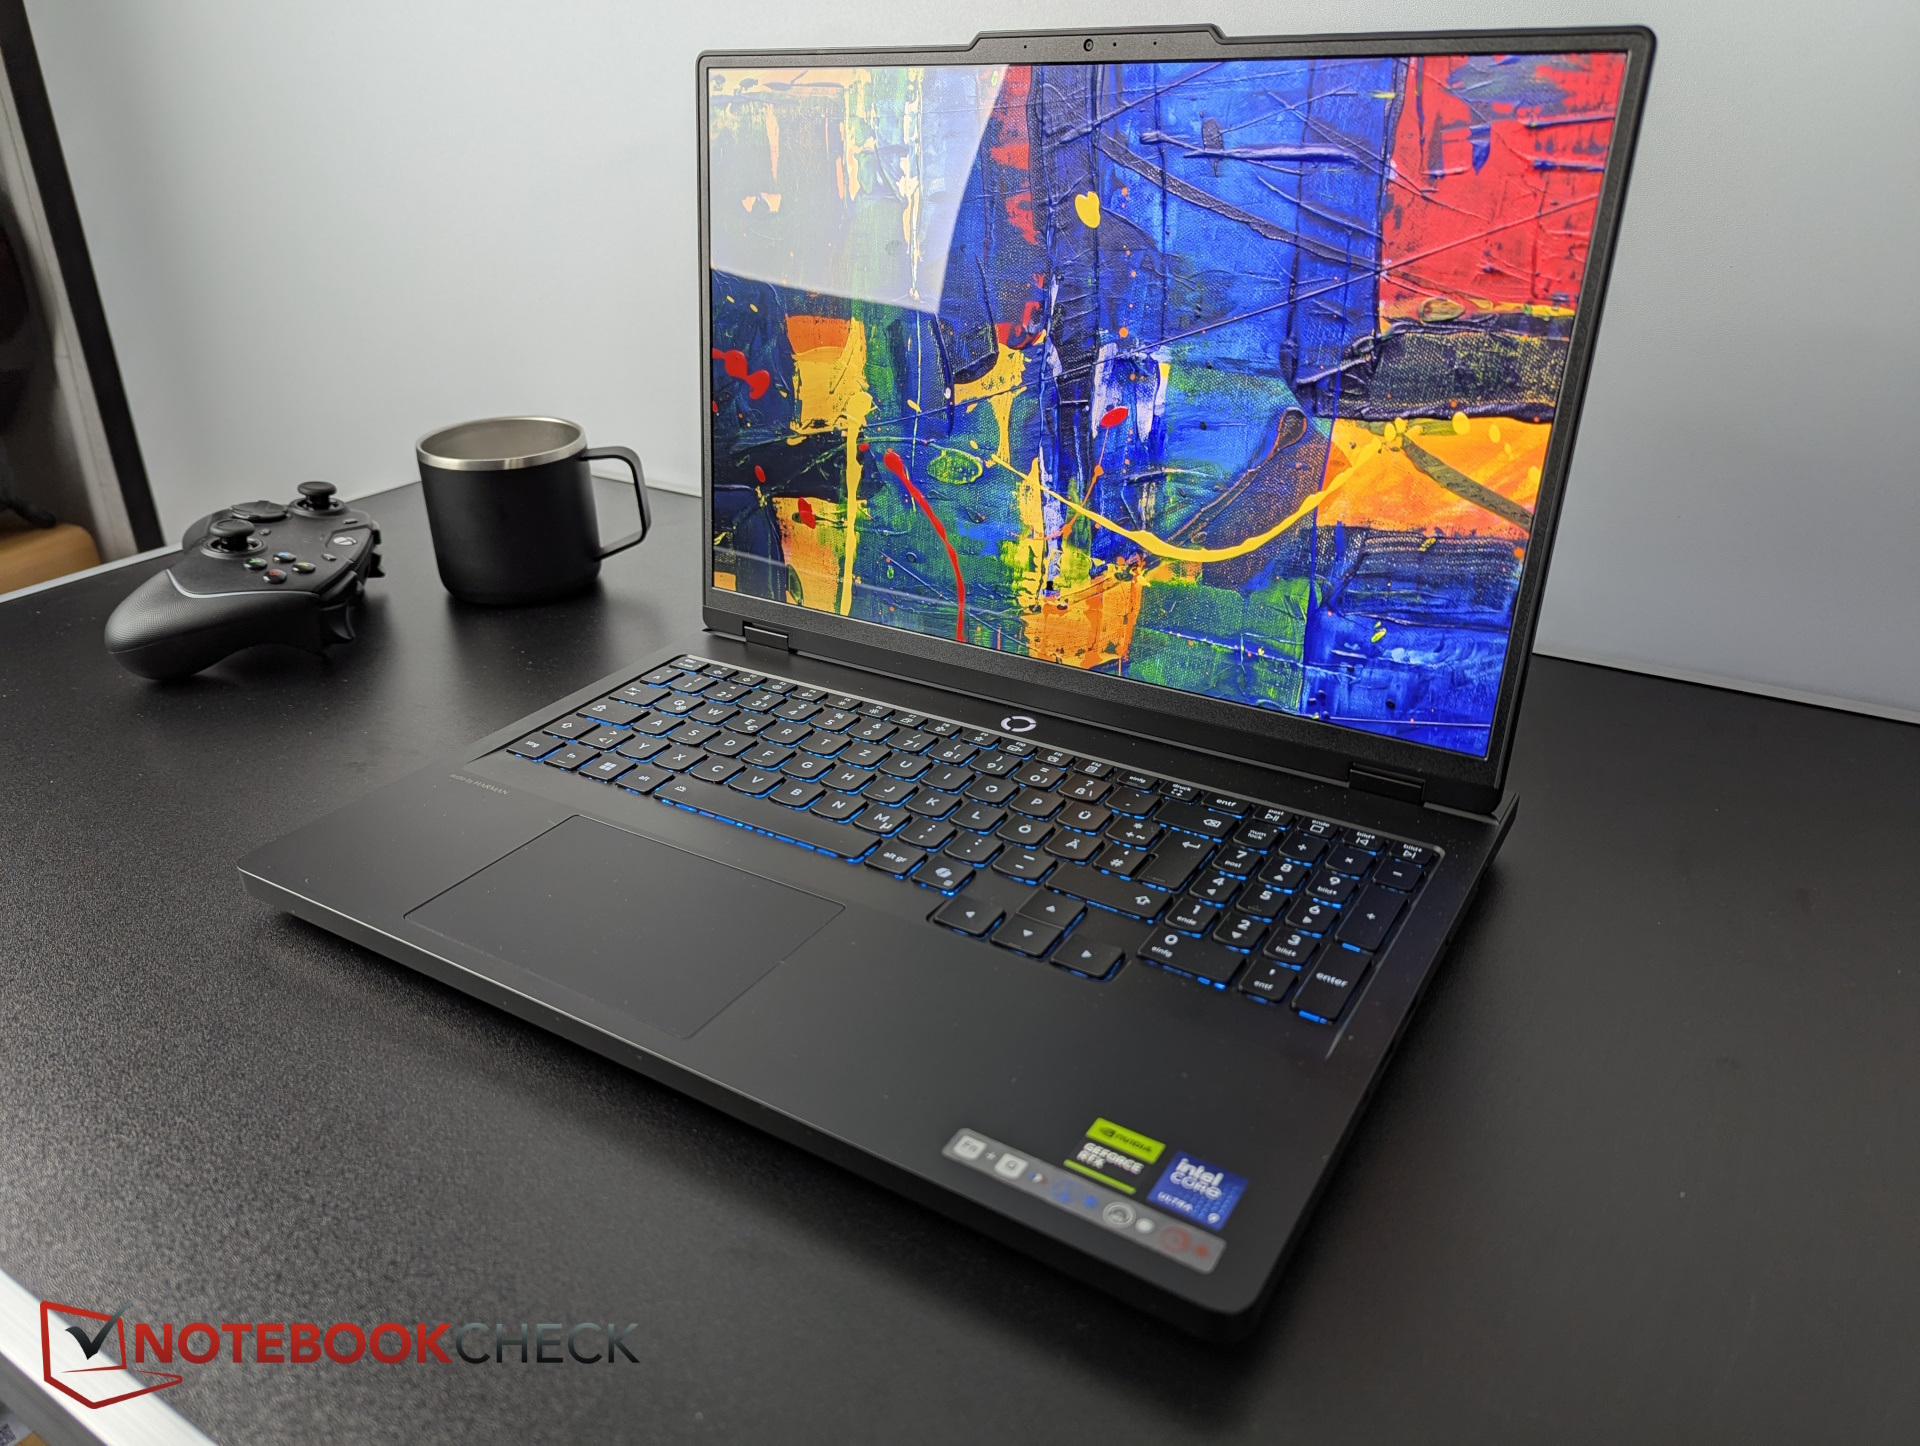
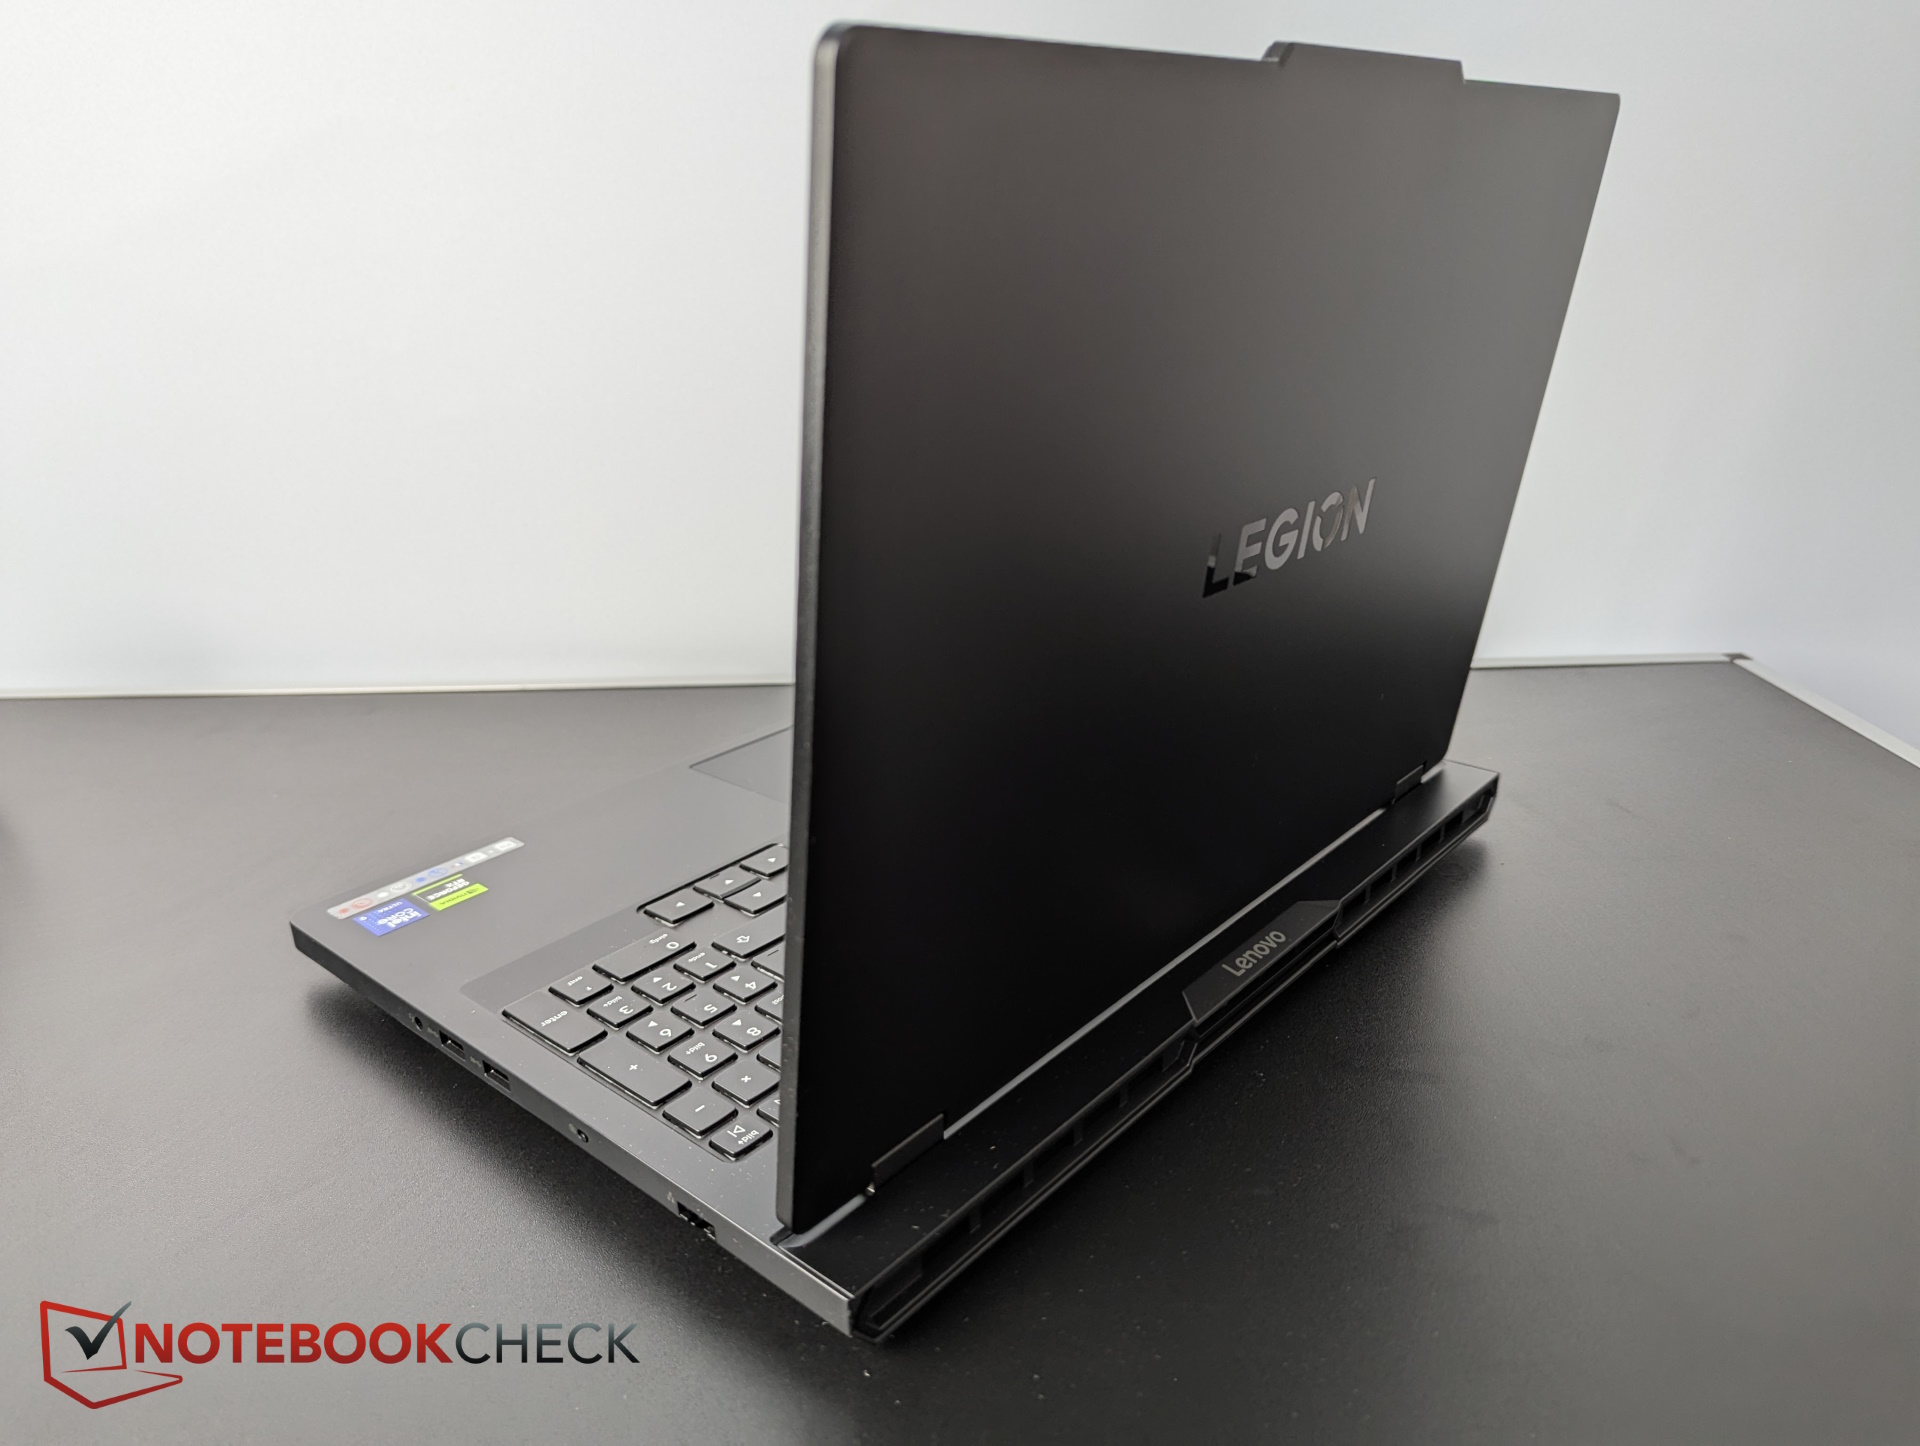
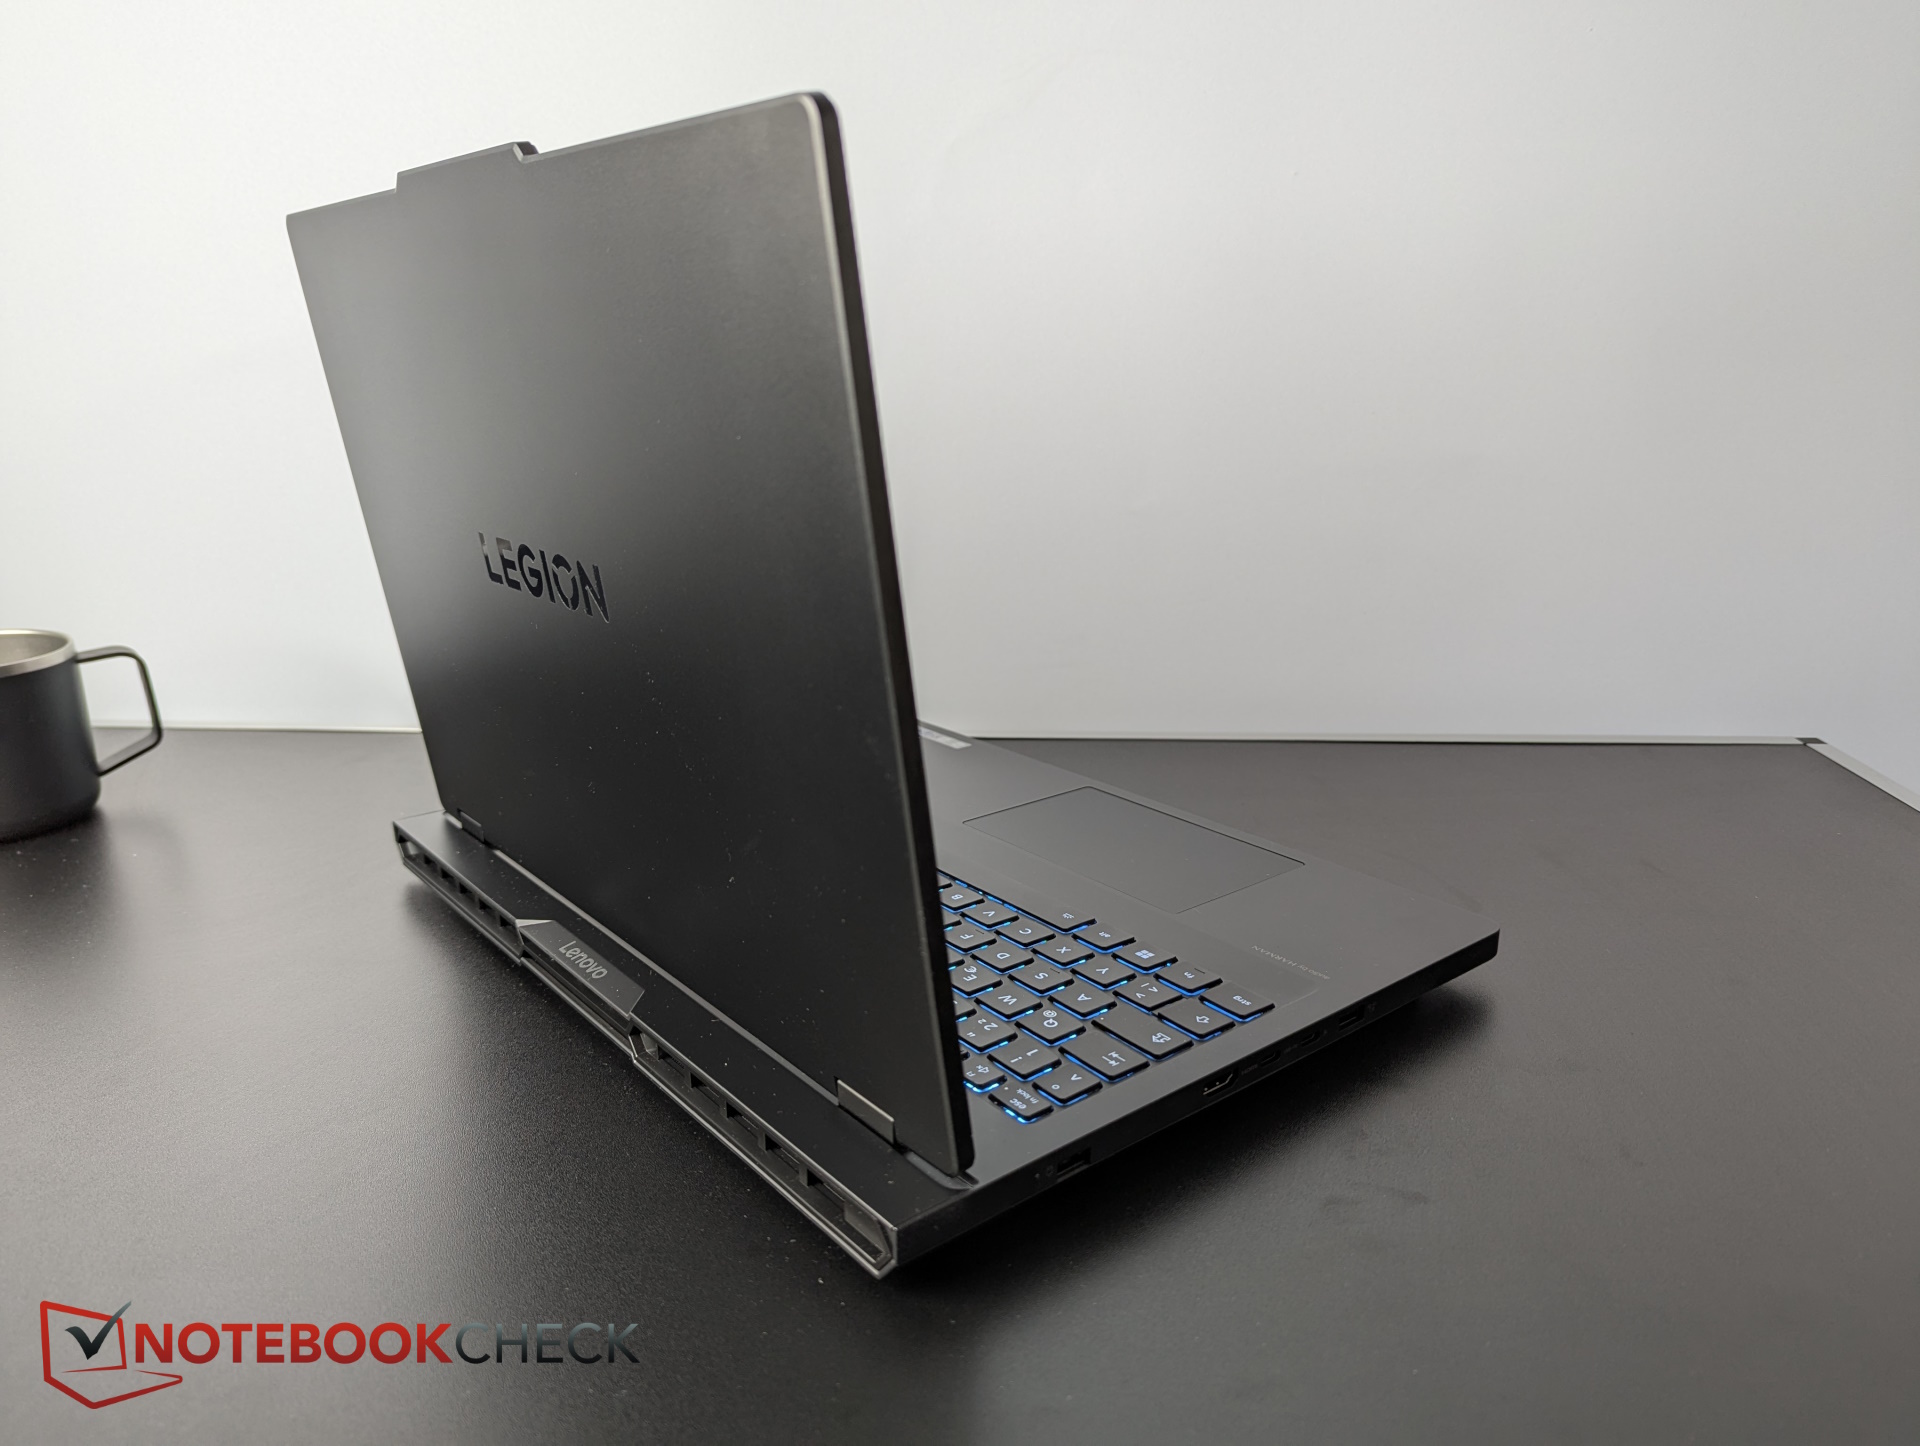
表壳 - 优雅的指纹磁铁
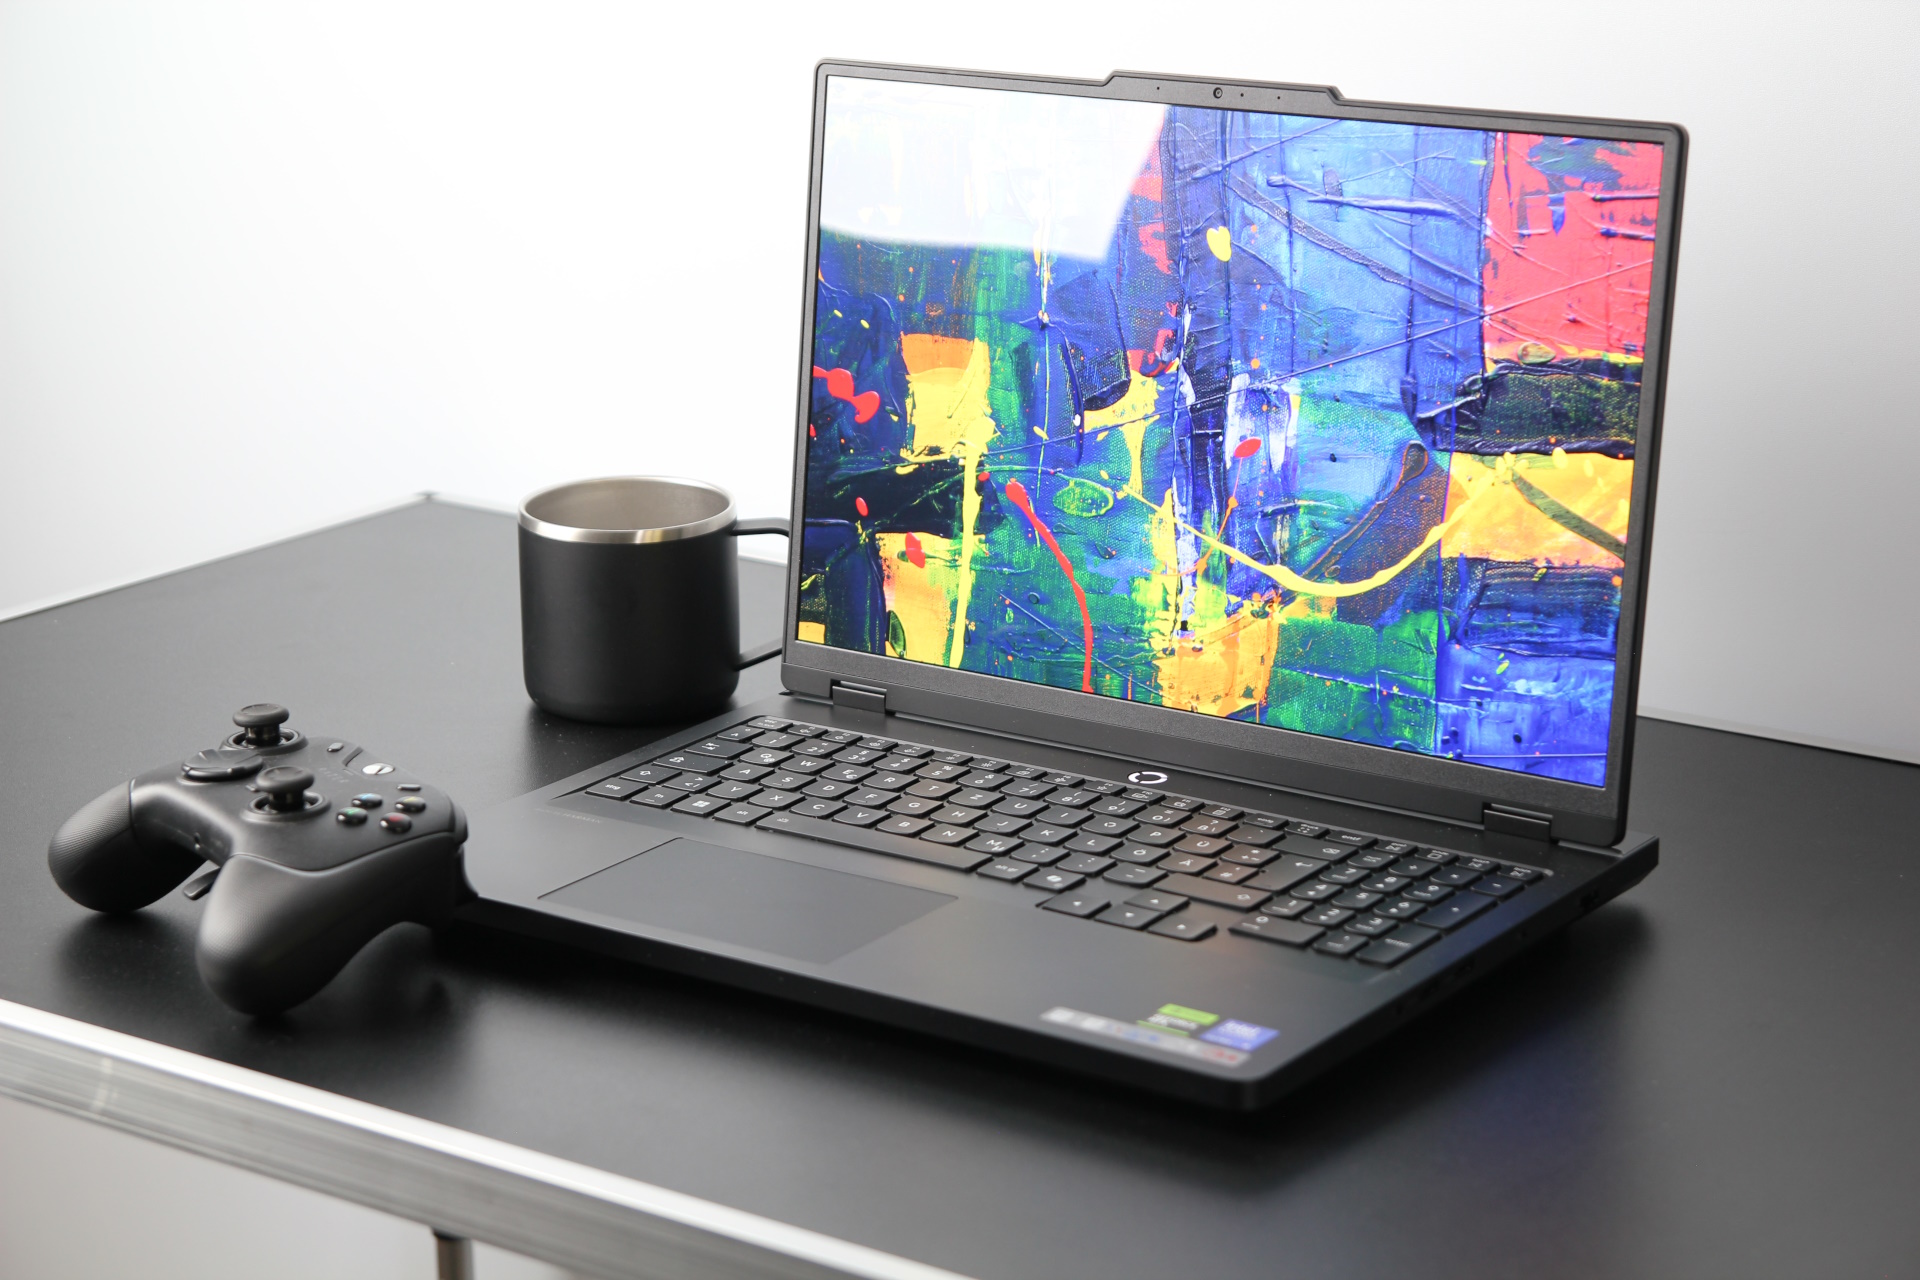
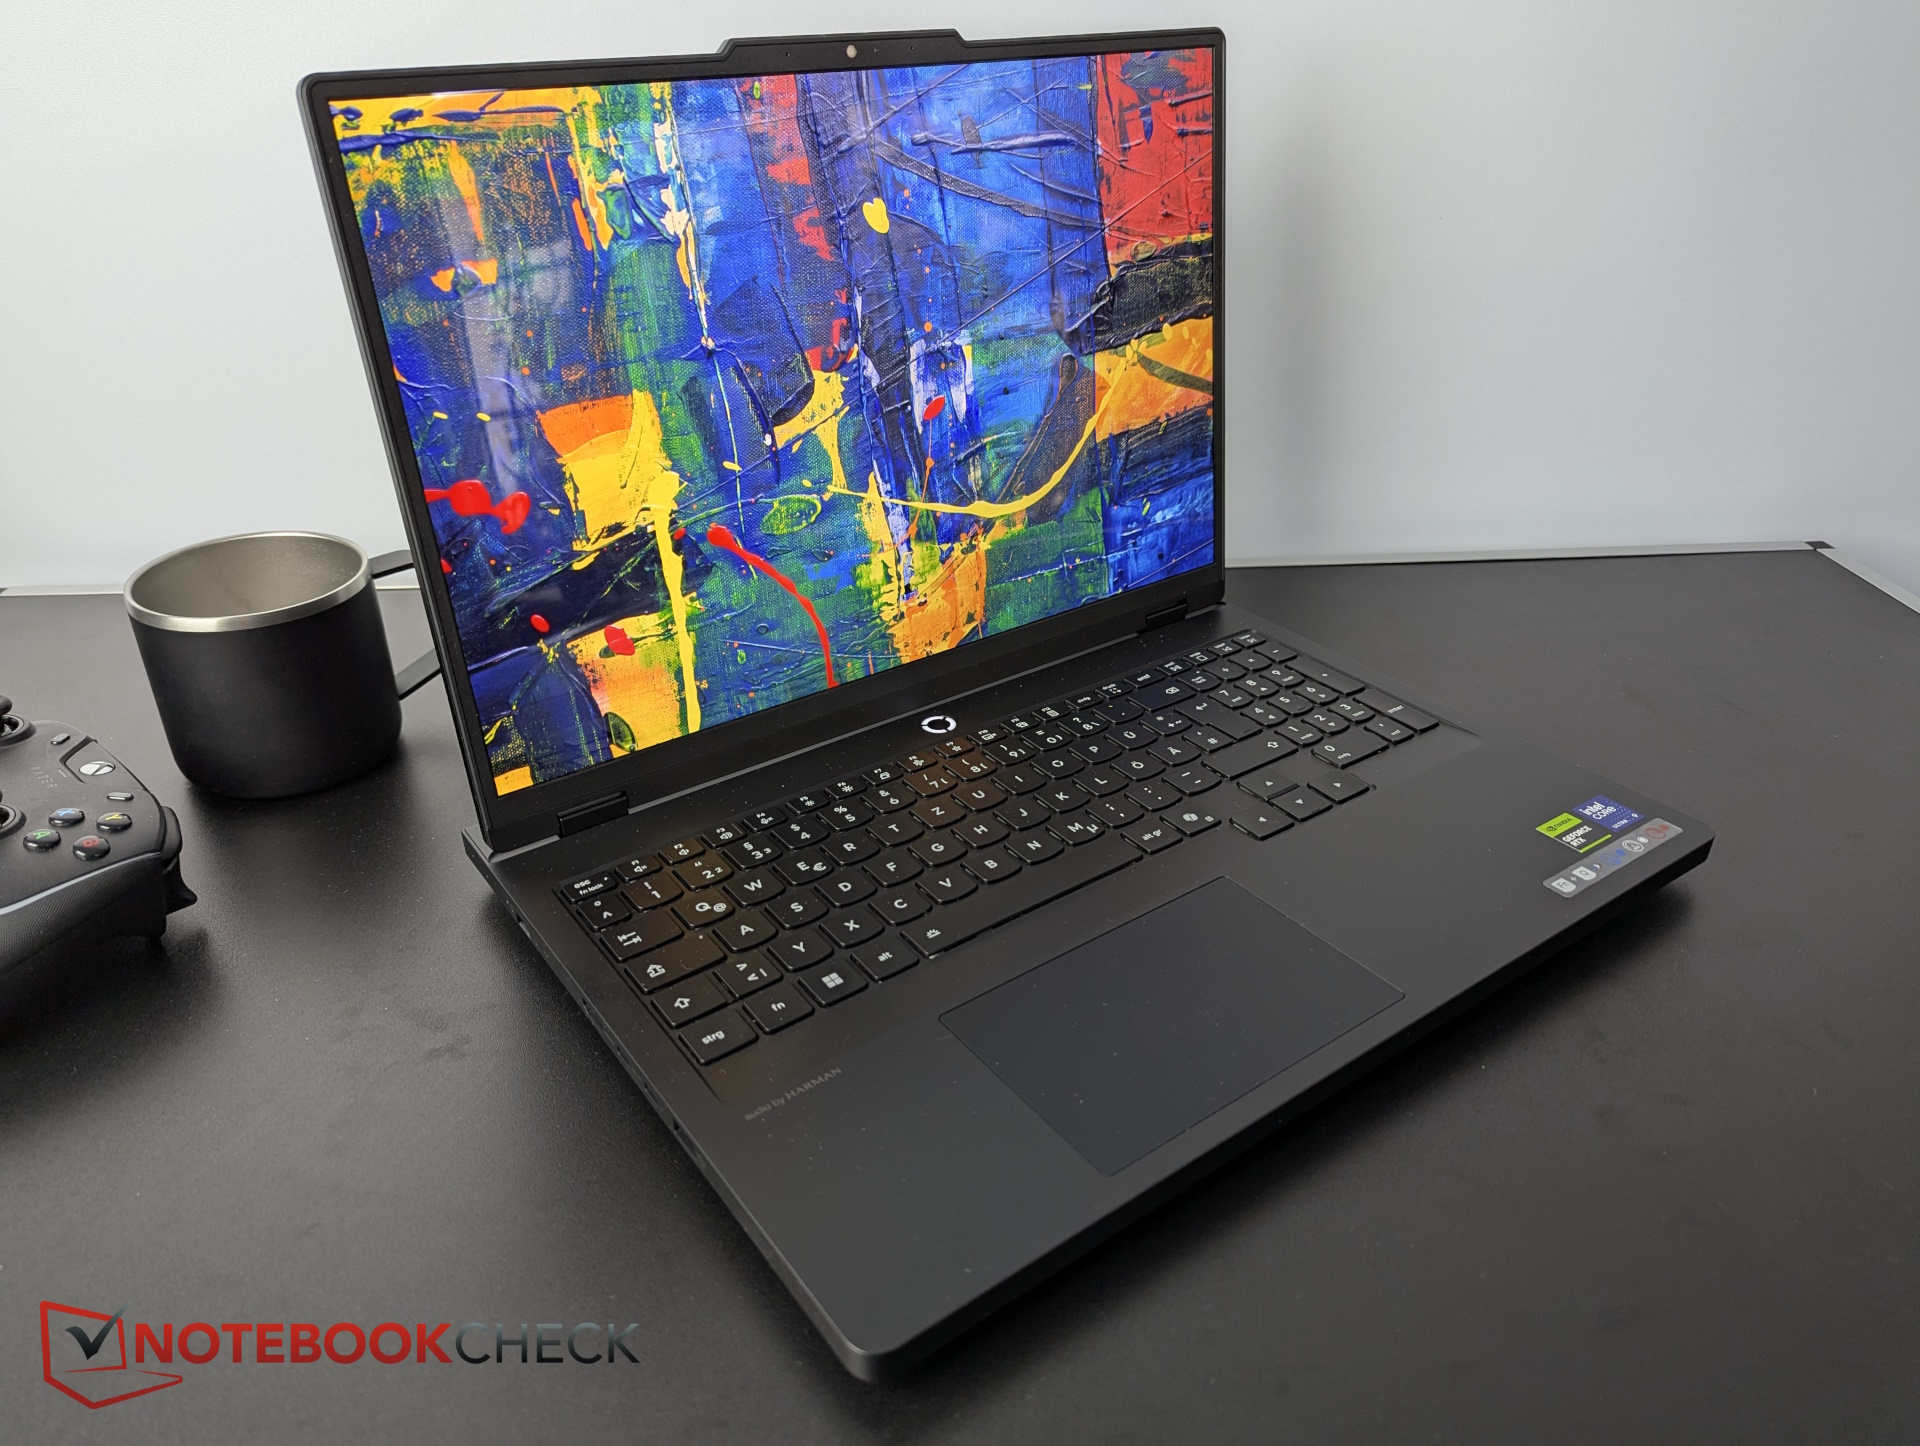
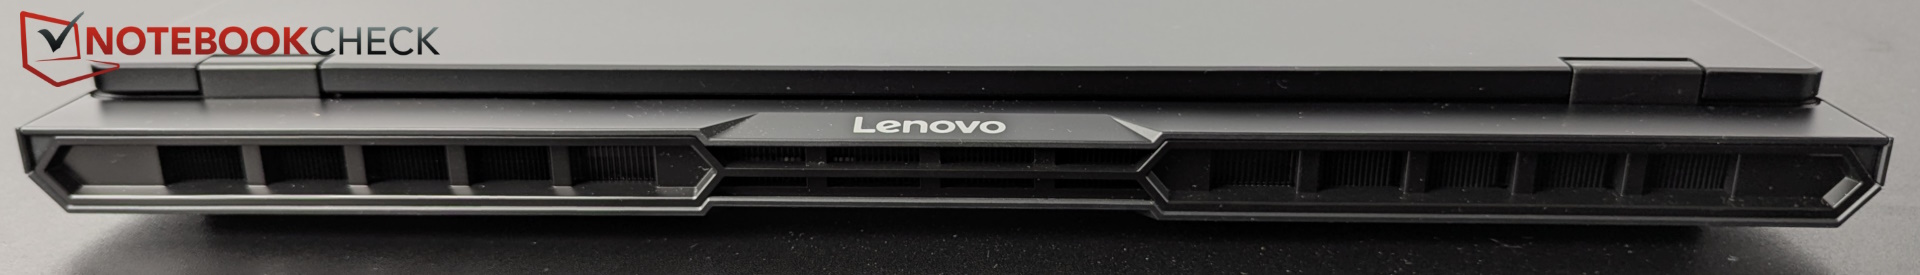
优雅的黑色塑料外壳和坚固的金属盖子是今年重新设计的。顶部的 "摄像头挡板 "依然保留,但其他地方有了很大变化。背面不再有任何端口,因为它们现在都被移到了侧面,而背面则保留了气流。总的来说,我们喜欢这样的设计,因为它在游戏和创意外观之间取得了很好的平衡。
底座可以轻微扭曲,导致右侧发出轻微的吱吱声,180 度铰链也可以更紧一些。表面很快就会积累指纹。
与上一代产品相比,新机箱薄了约 1 毫米,但深了 1 毫米,宽了 6 毫米。该级别所有其他笔记本电脑都更窄,但我们的Legion Pro 5 是除 Blade 16 和 G16 之外最薄的。重量也减轻了 100 克。


功能 - 略显老旧的Legion Pro
电源接口和 HDMI 端口现在位于左侧,LAN 端口和一个 USB-A 端口位于右侧,其他端口也从背面移到了侧面。
不过,尤其是 USB 端口不再那么现代化了。没有 Thunderbolt 5,只有版本 4,第二个 USB-C 插槽也不支持 Thunderbolt。三个 USB-A 插槽中的两个(右侧两个)只能以 5 Gbps 的速度运行,而且完全没有 SD 读卡器。
端口布局还不错,不过两侧明显比以前更拥挤了。


交流
在 Wi-Fi 7 甚至 Wi-Fi 6E 时代,Wi-Fi 6 和蓝牙 5.2 已不再令人印象深刻,尤其是在 蓝牙 6已于 2024 年 9 月推出,蓝牙 5.4 也不再是标准。前代产品已经采用了 Wi-Fi 6E,直接竞争对手的速度都更快,但至少模块是可以更换的。
网络摄像头
联想在机身顶部的宽凹槽中安装了一枚 500 万像素的摄像头。图像清晰,色彩准确度也可以接受。右侧有一个电子快门的滑动开关。


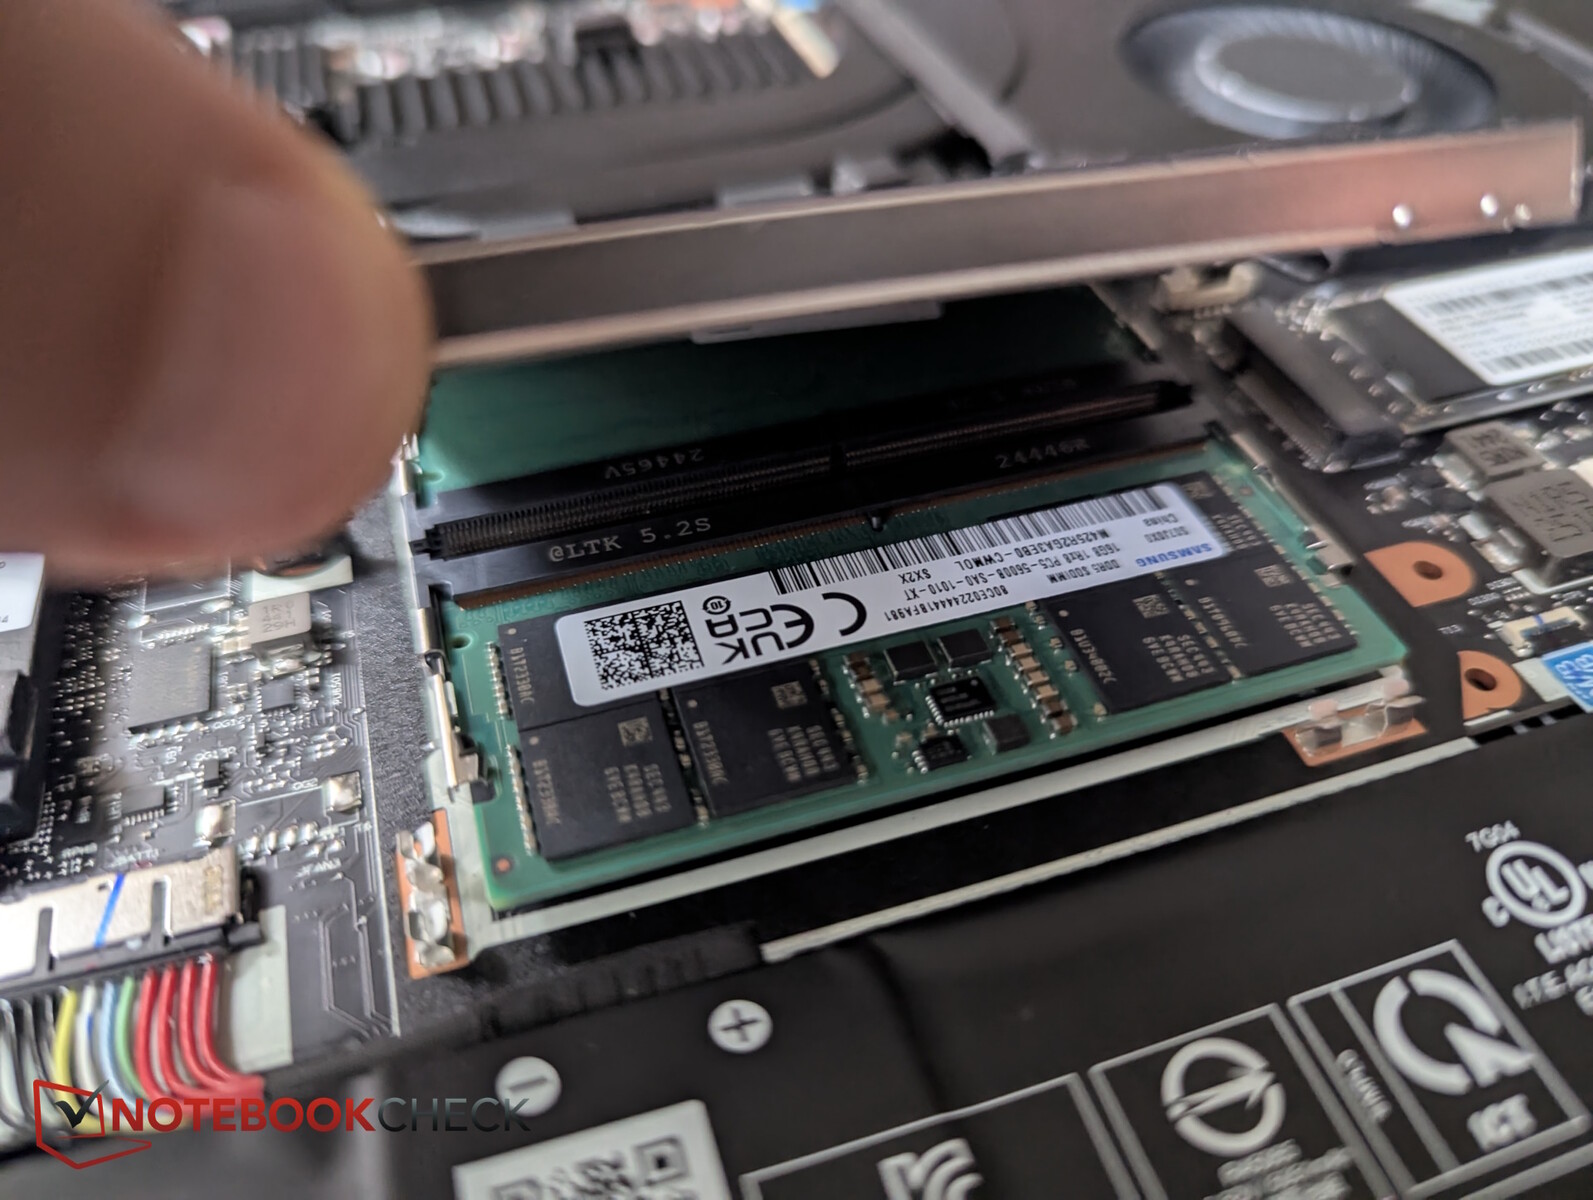
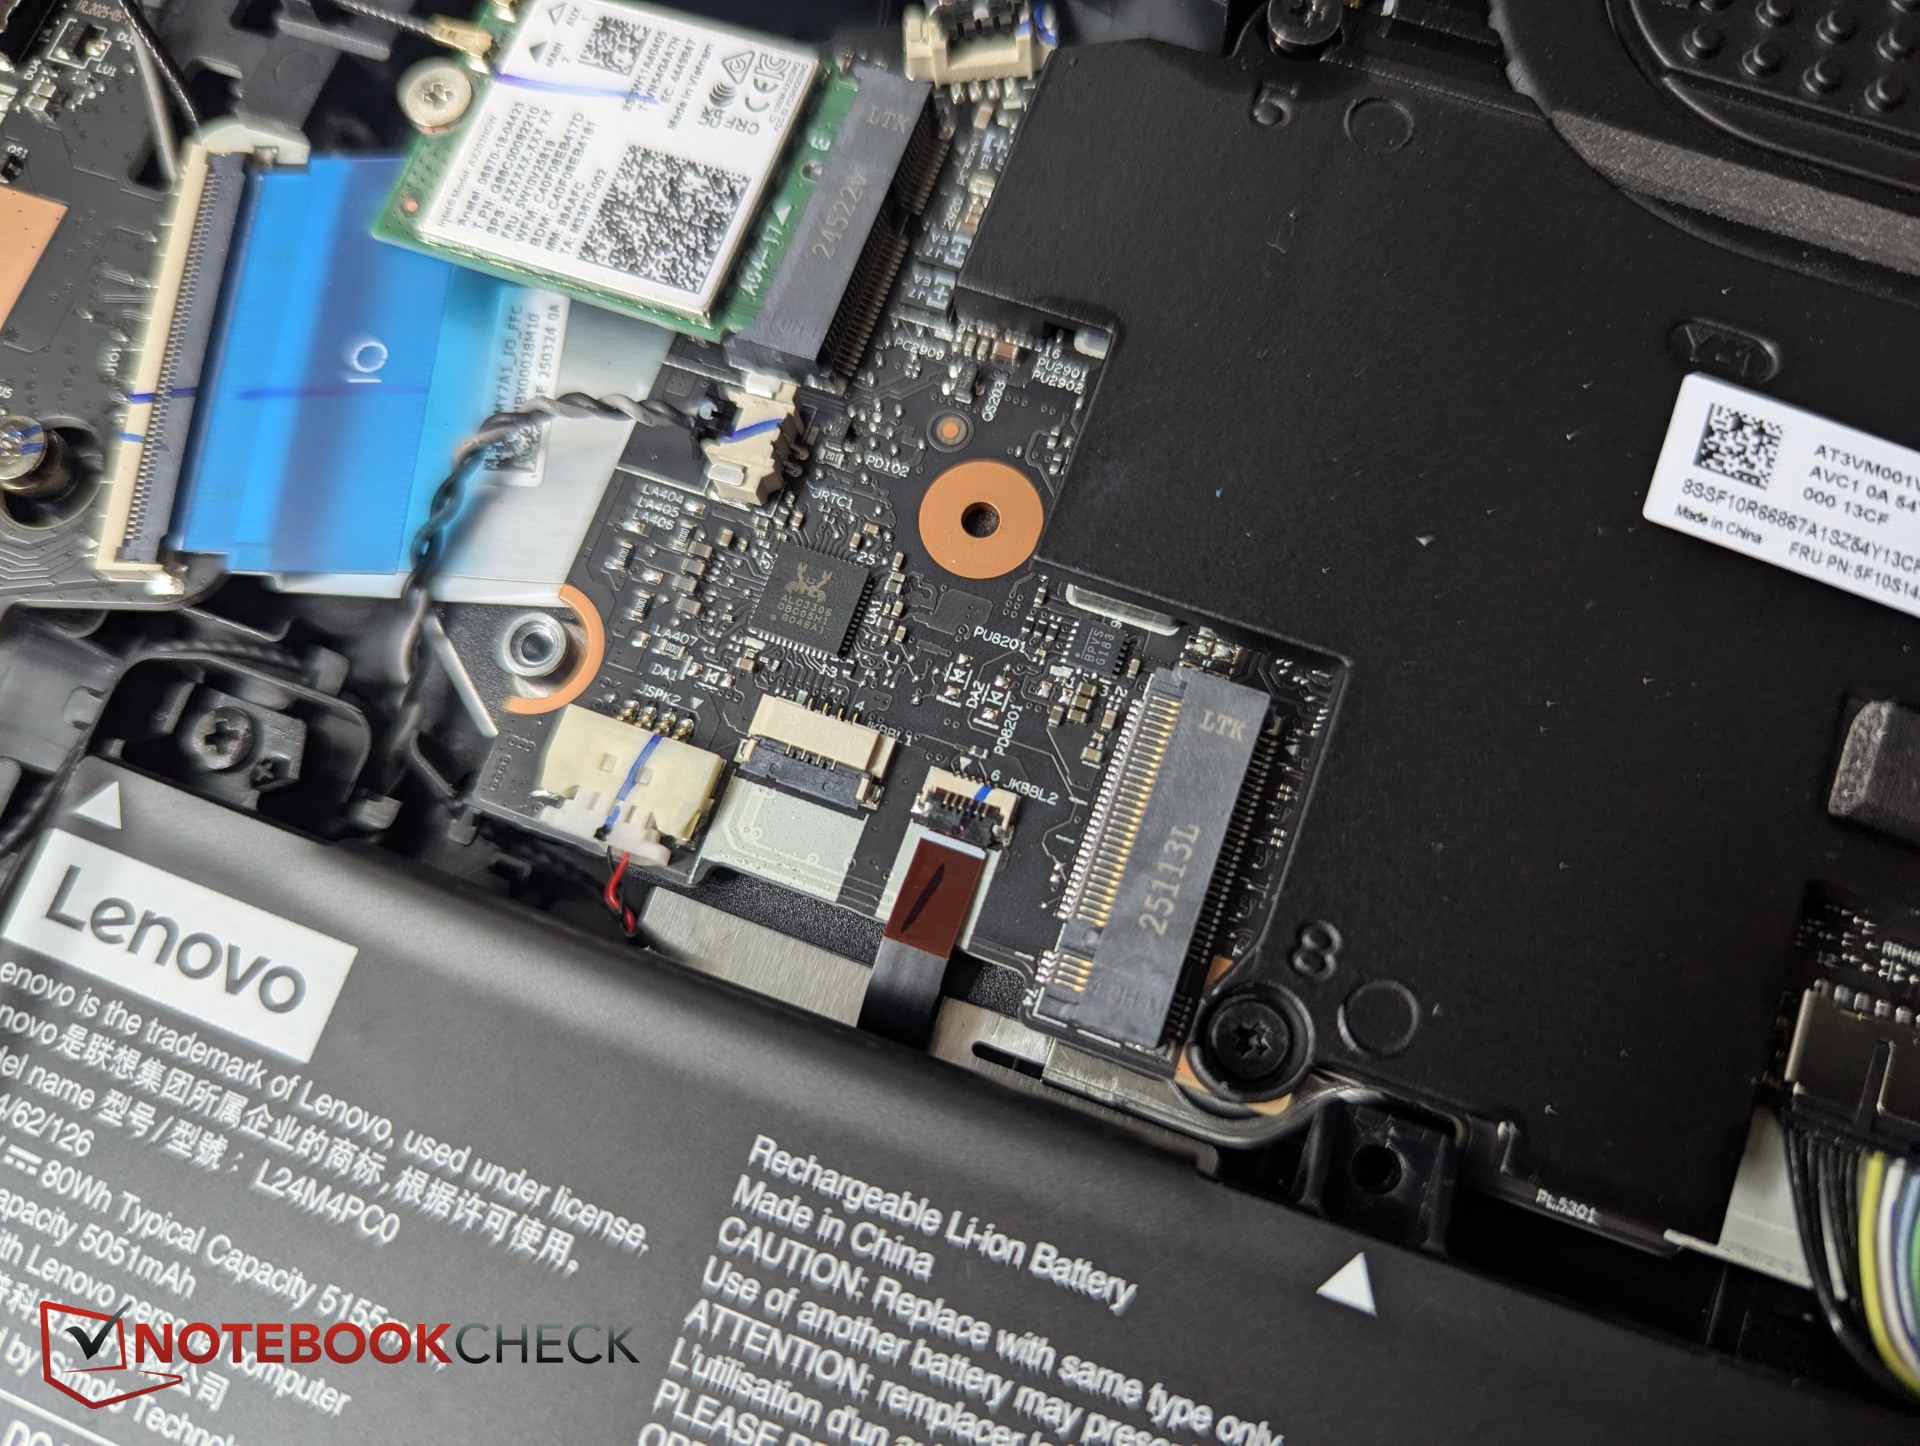
维护
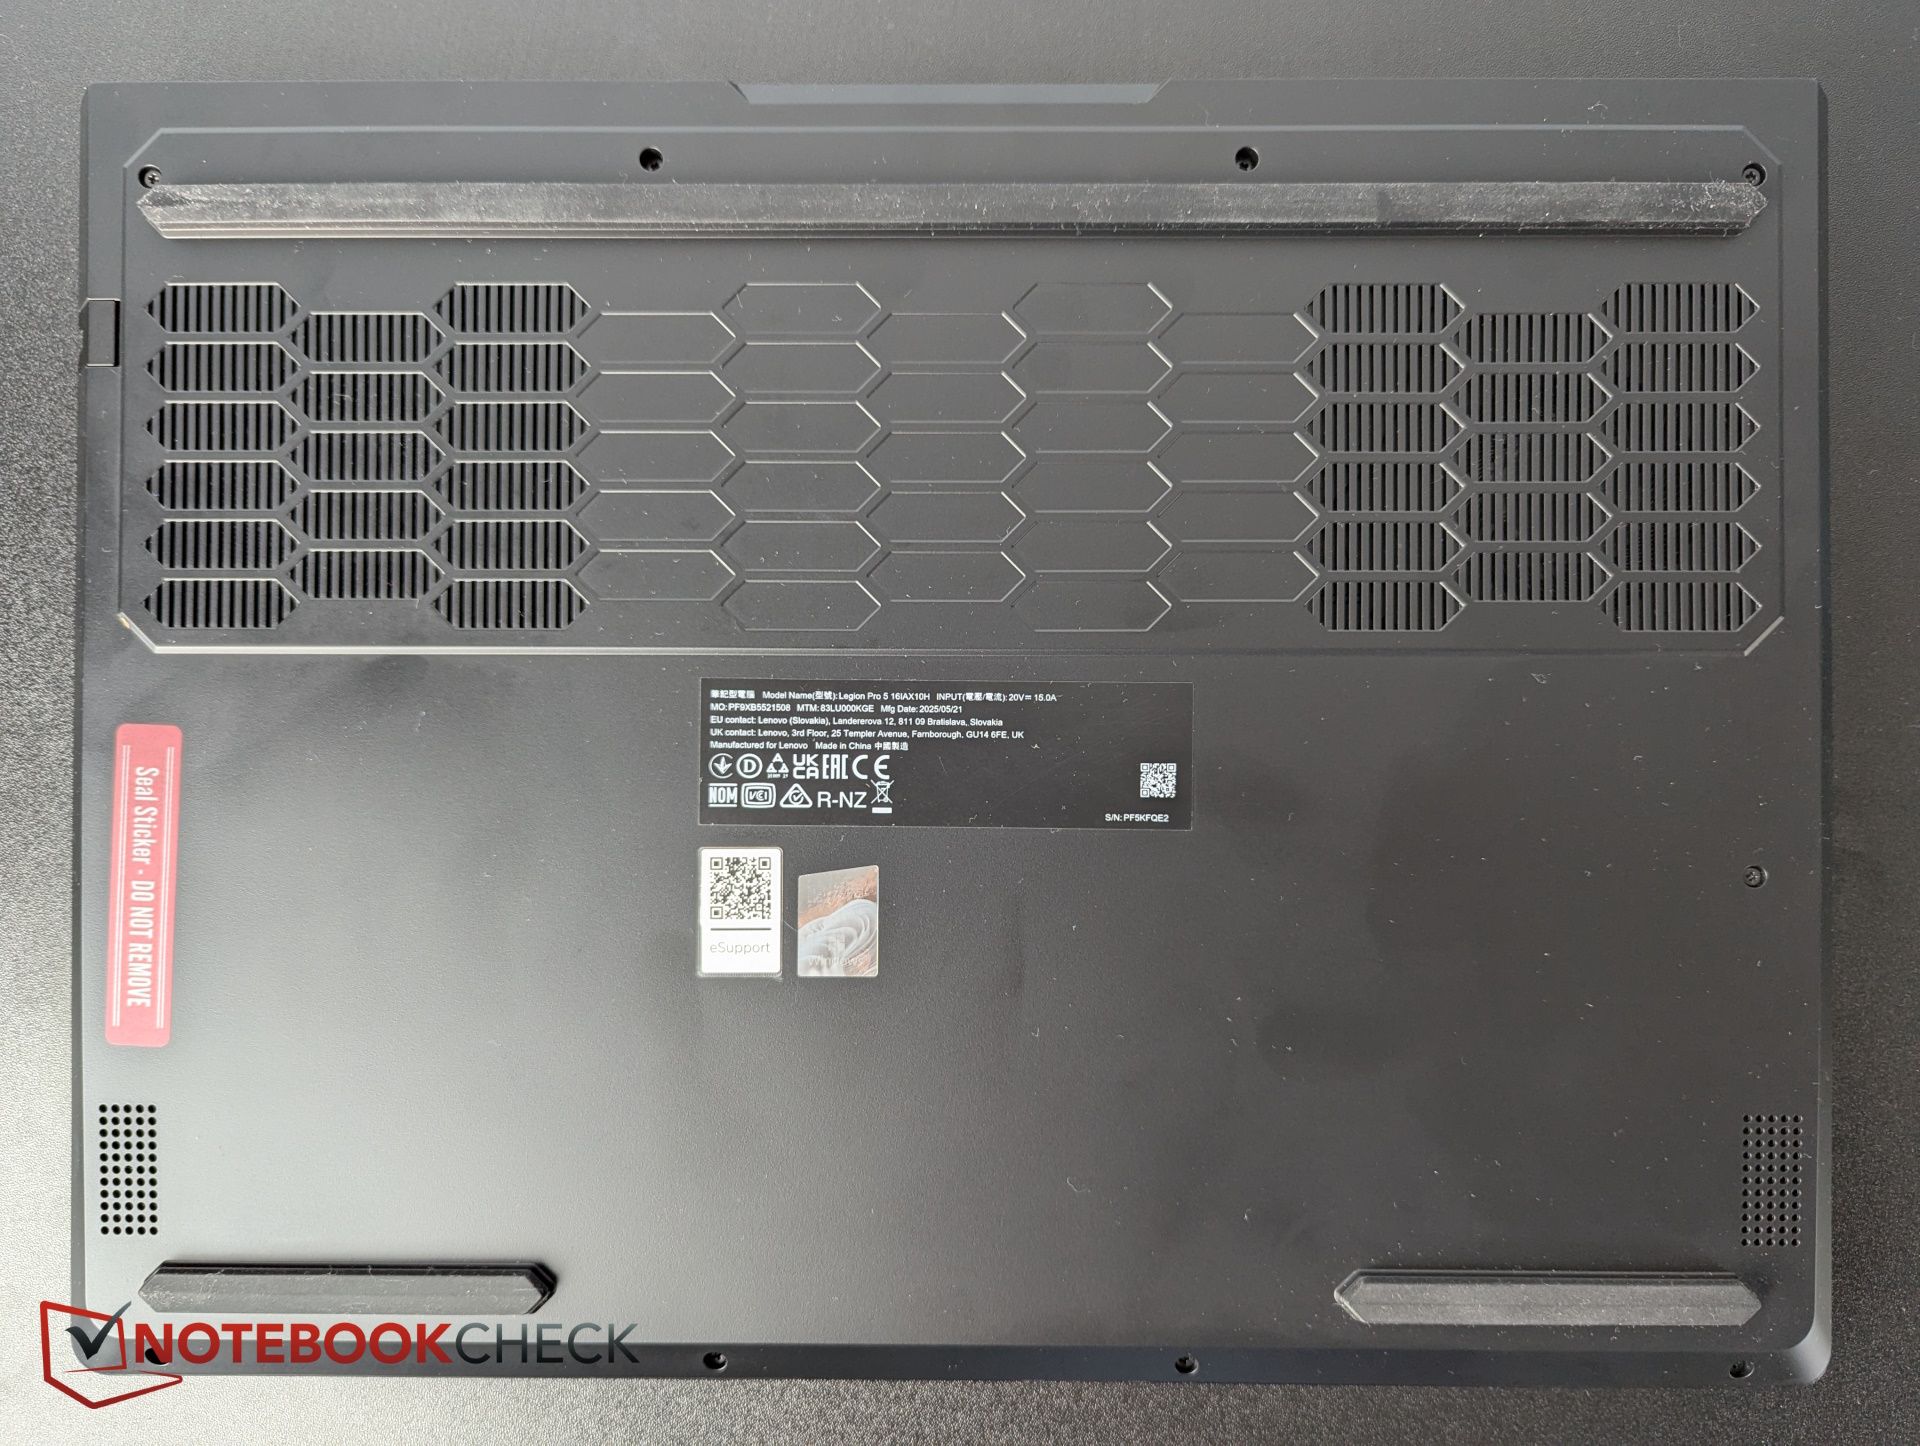
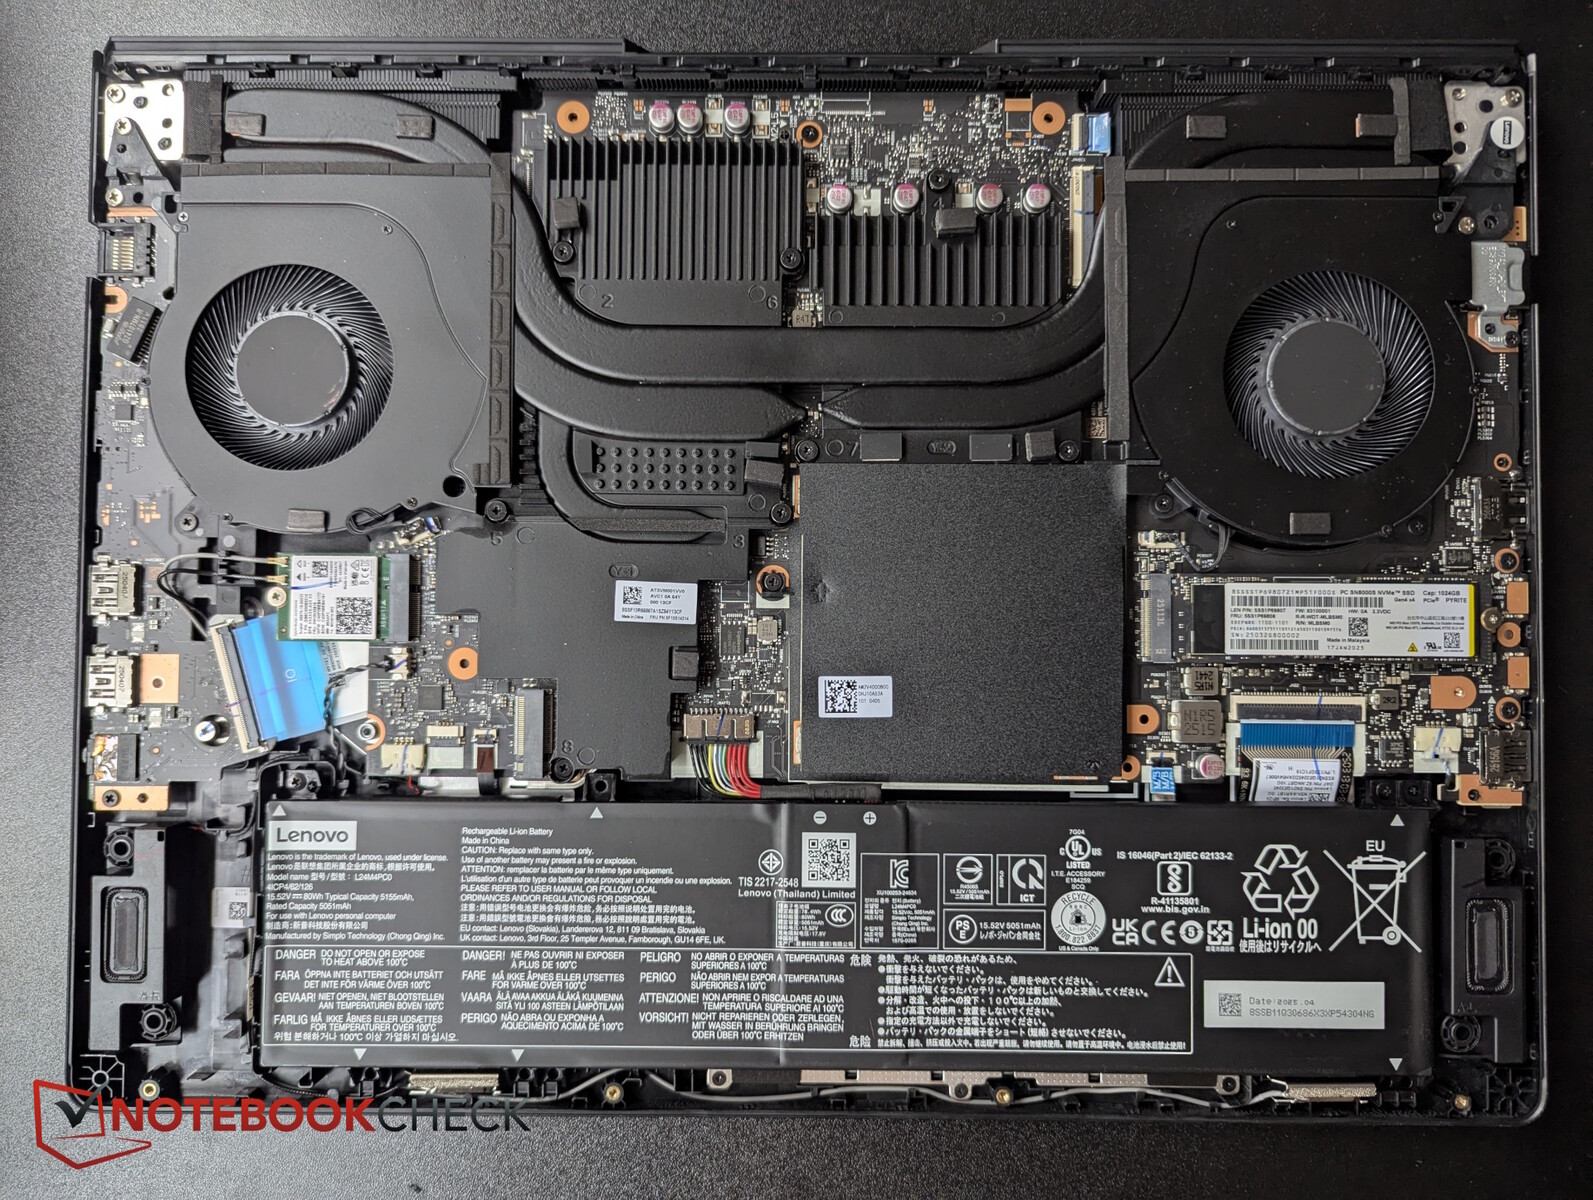
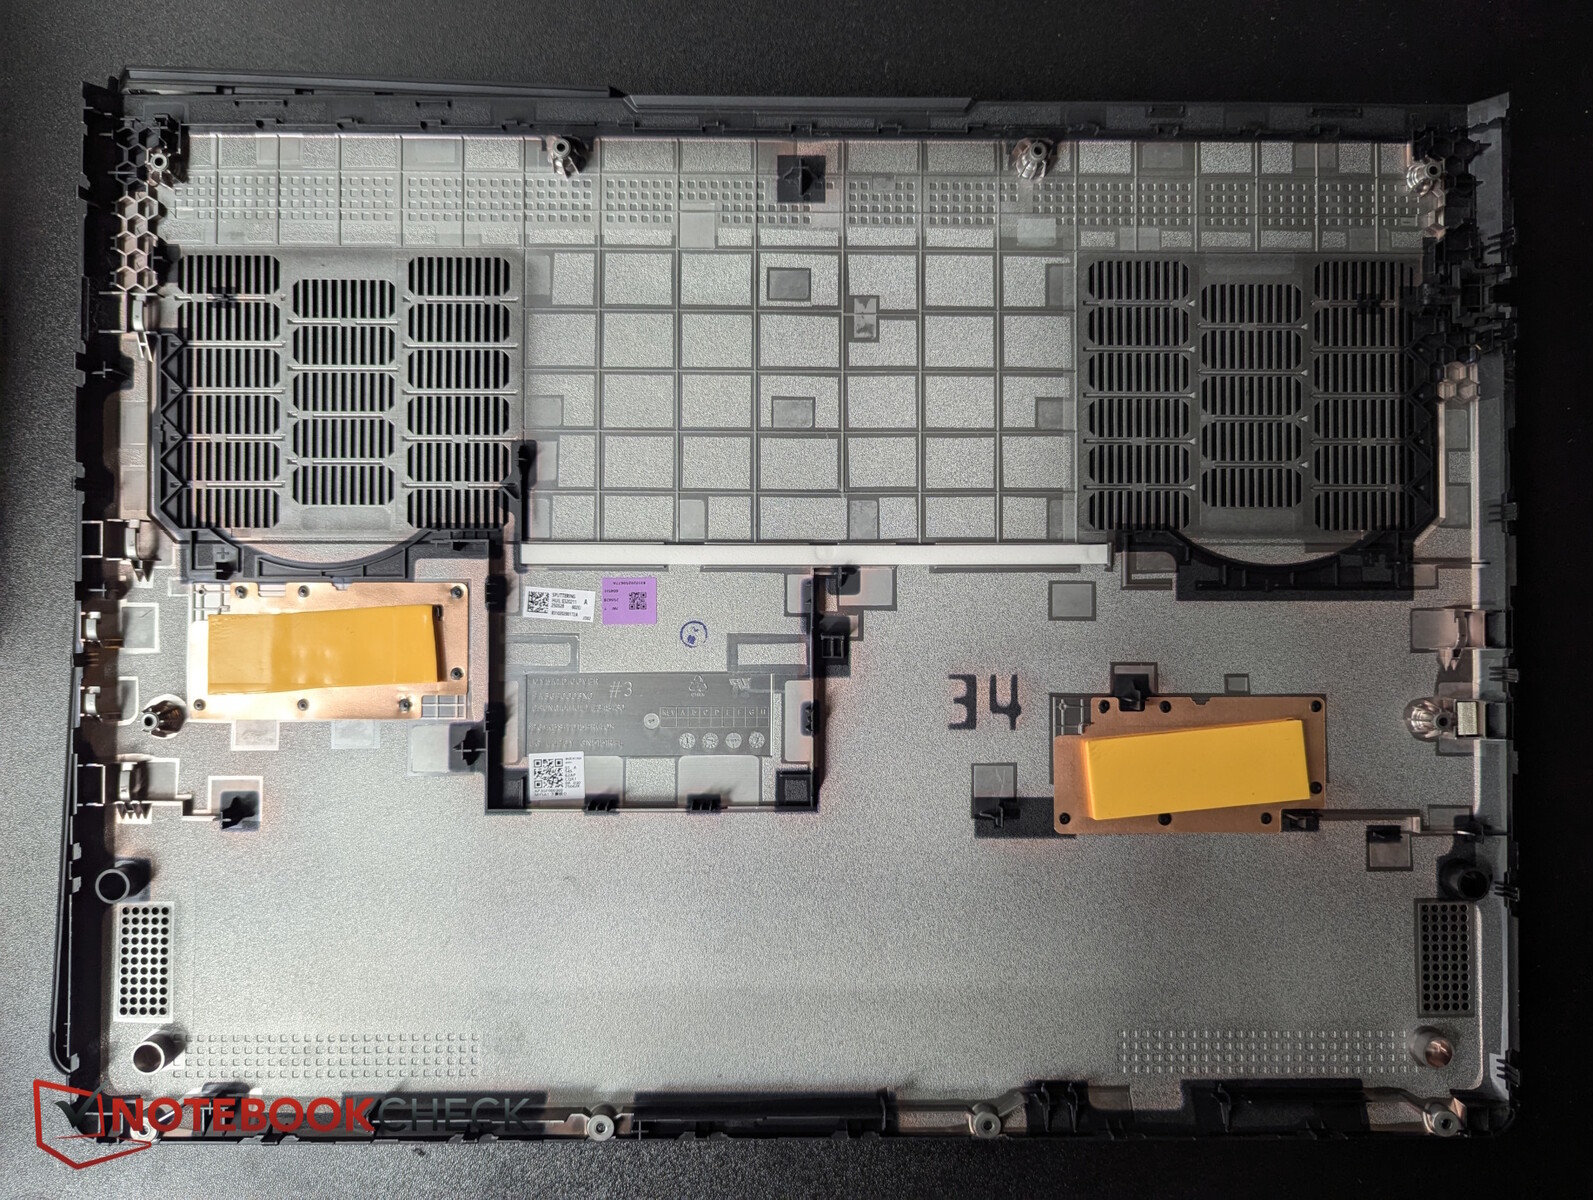
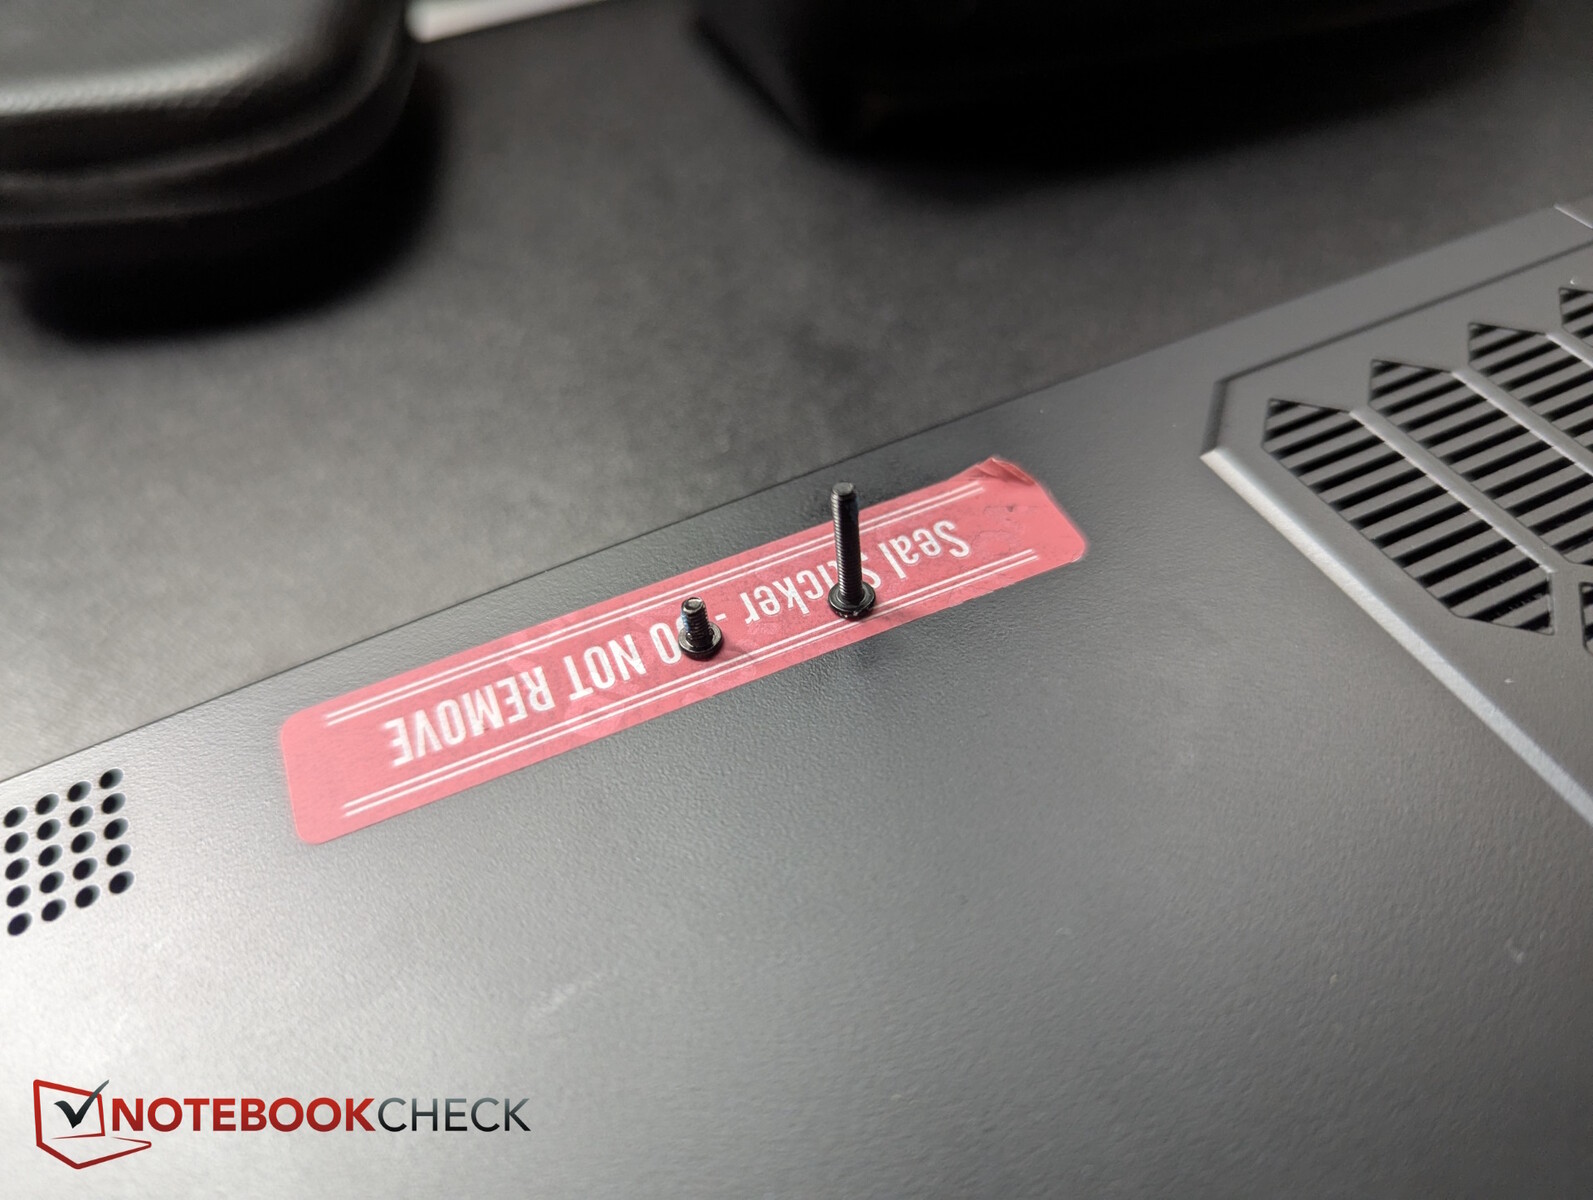
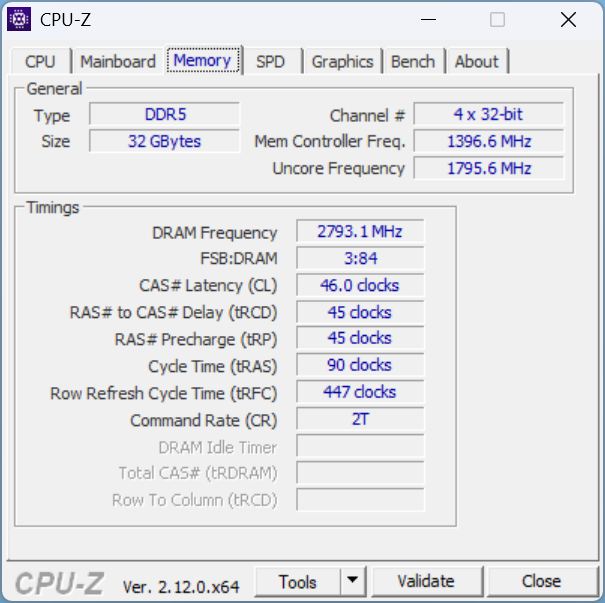
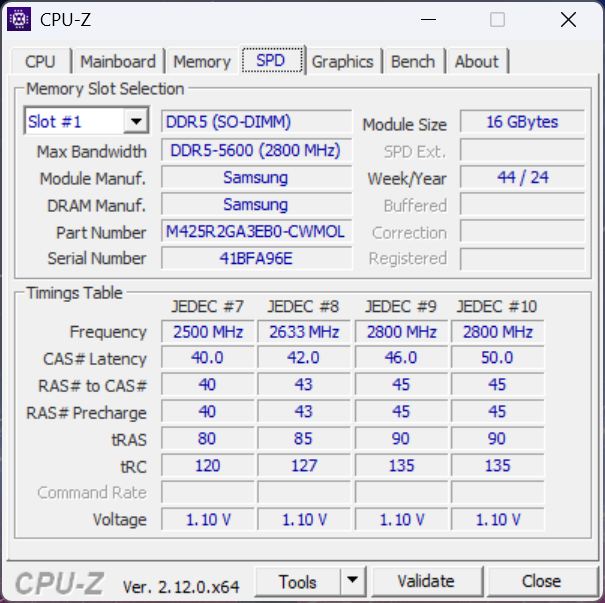
底板由 10 个螺丝(2 长)固定。即使不借助工具,也能轻松撬开。内部有两个 M.2 固态硬盘插槽、可拆卸的 Wi-Fi 模块、两个内存插槽、电池和冷却系统。
可持续性
包装由纸板和塑料混合而成,后者用作塑料袋,不仅包裹Legion 和电源,还用作Legion 边缘的胶条和绝缘泡沫。
配件和保修
联想提供两年保修服务,包括快递或随身携带服务。包装内不包括配件。
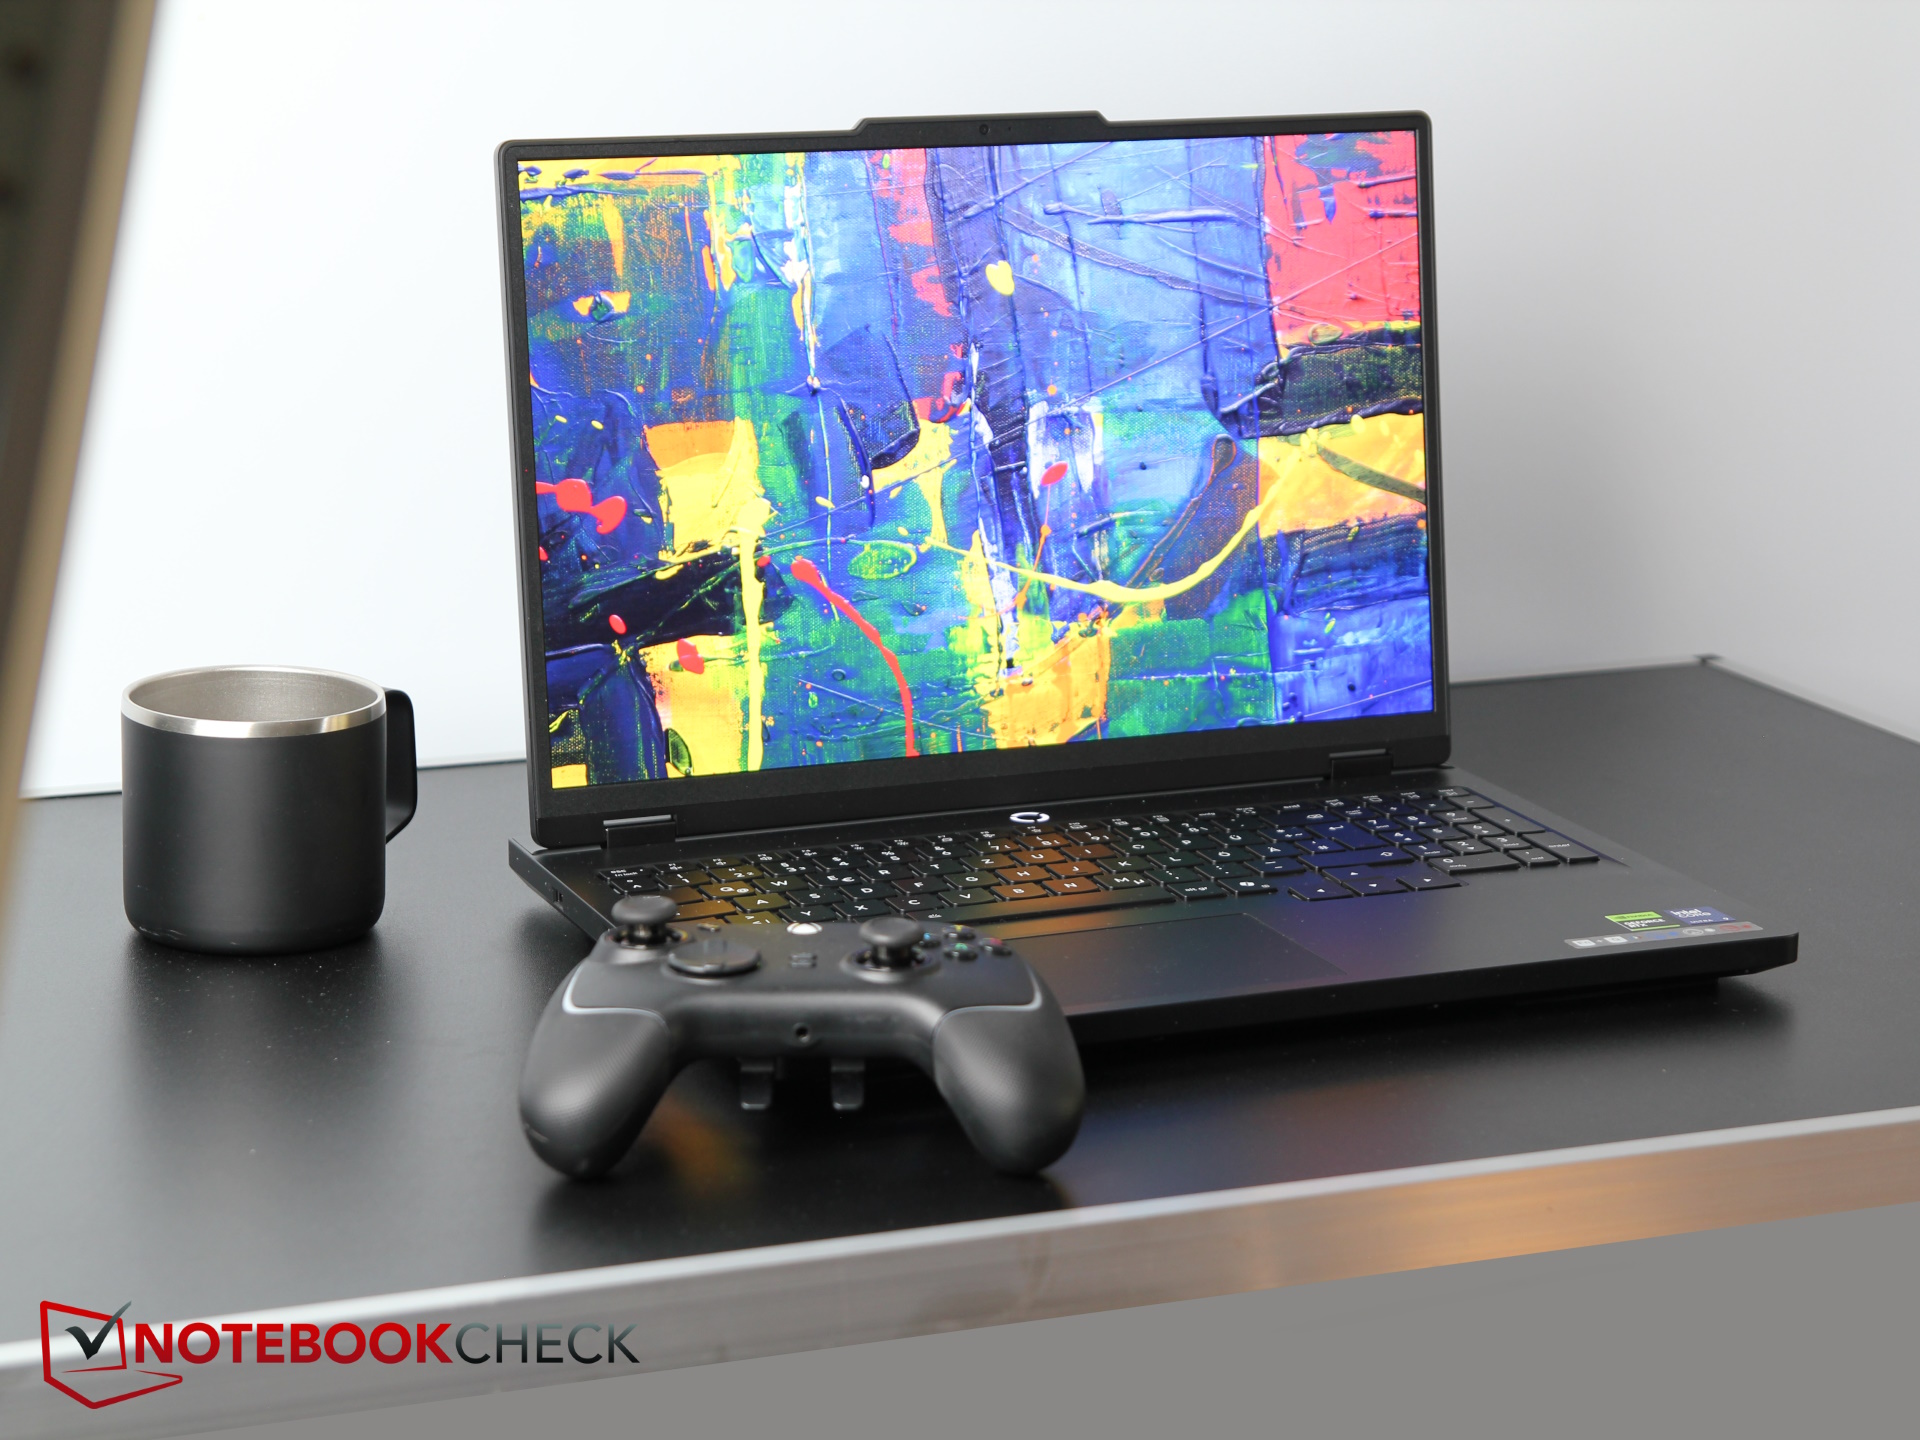
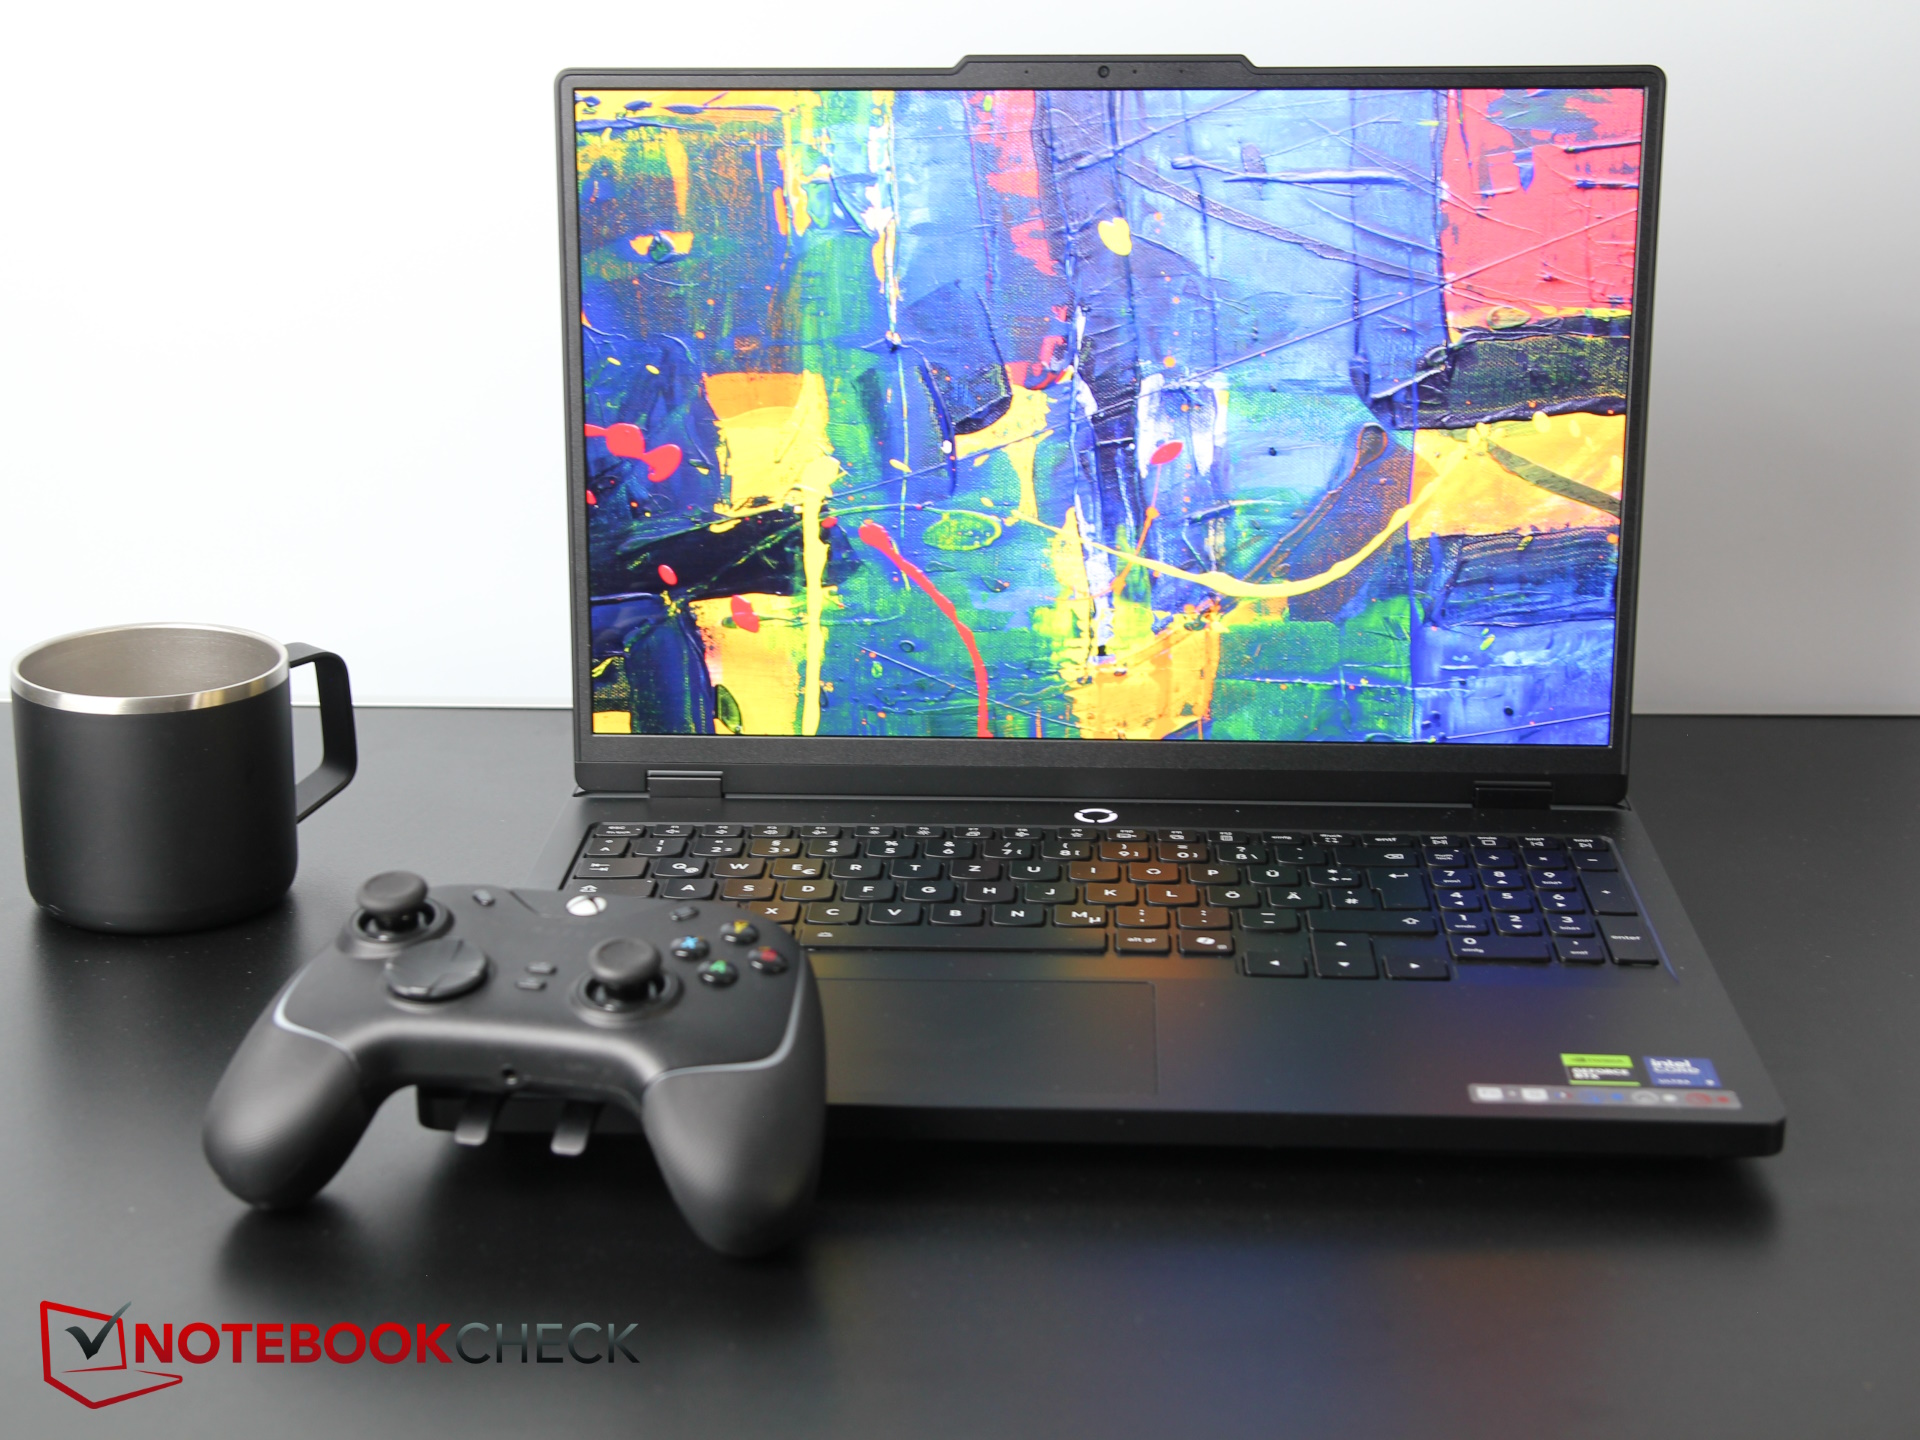
输入设备 - 适合游戏玩家
键盘
所有按键间距较大,右侧有一个窄小的数字键盘。全尺寸方向键略有偏移,电源键被设计成键盘上方的独立按键,所有这些都非常出色。RGB 背光可配置为 24 个不同区域。
虽然键程为中短,但按键的压力点清晰,反馈良好,给人留下深刻印象。总的来说,这款键盘使用起来非常舒适,键入速度也很快,按键噪音可以用安静适中来形容。
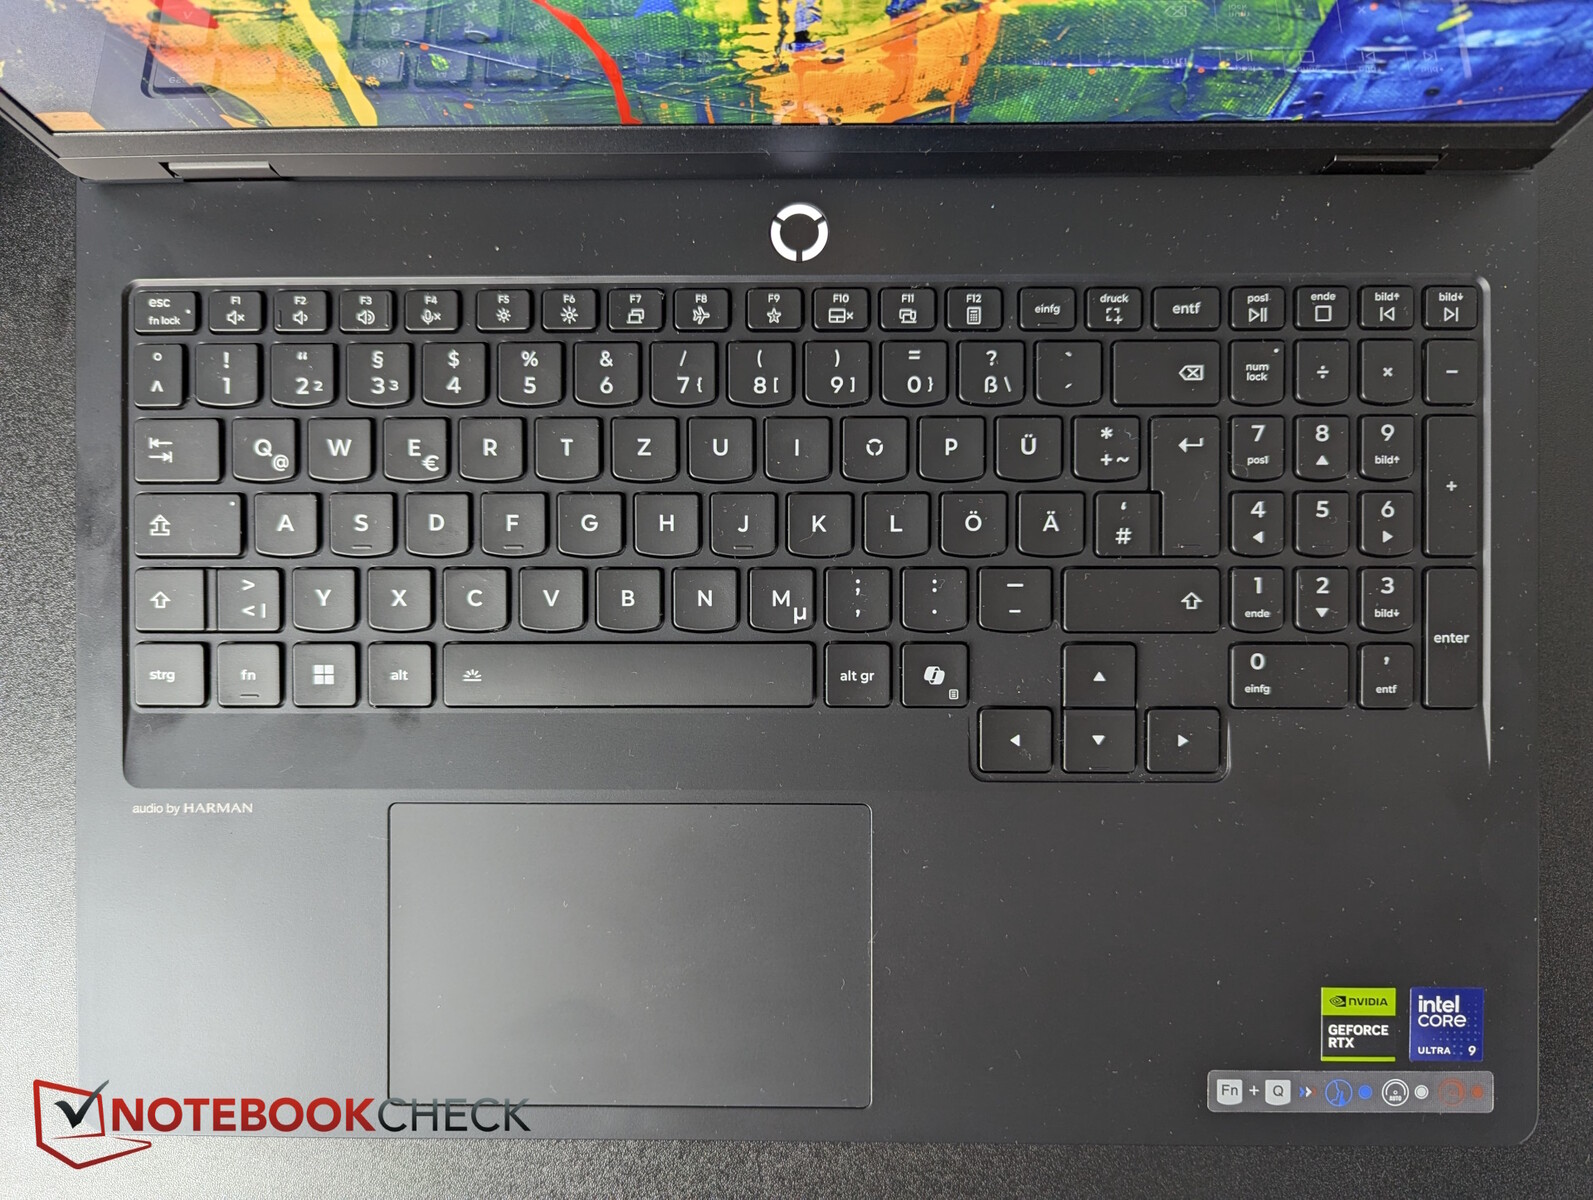
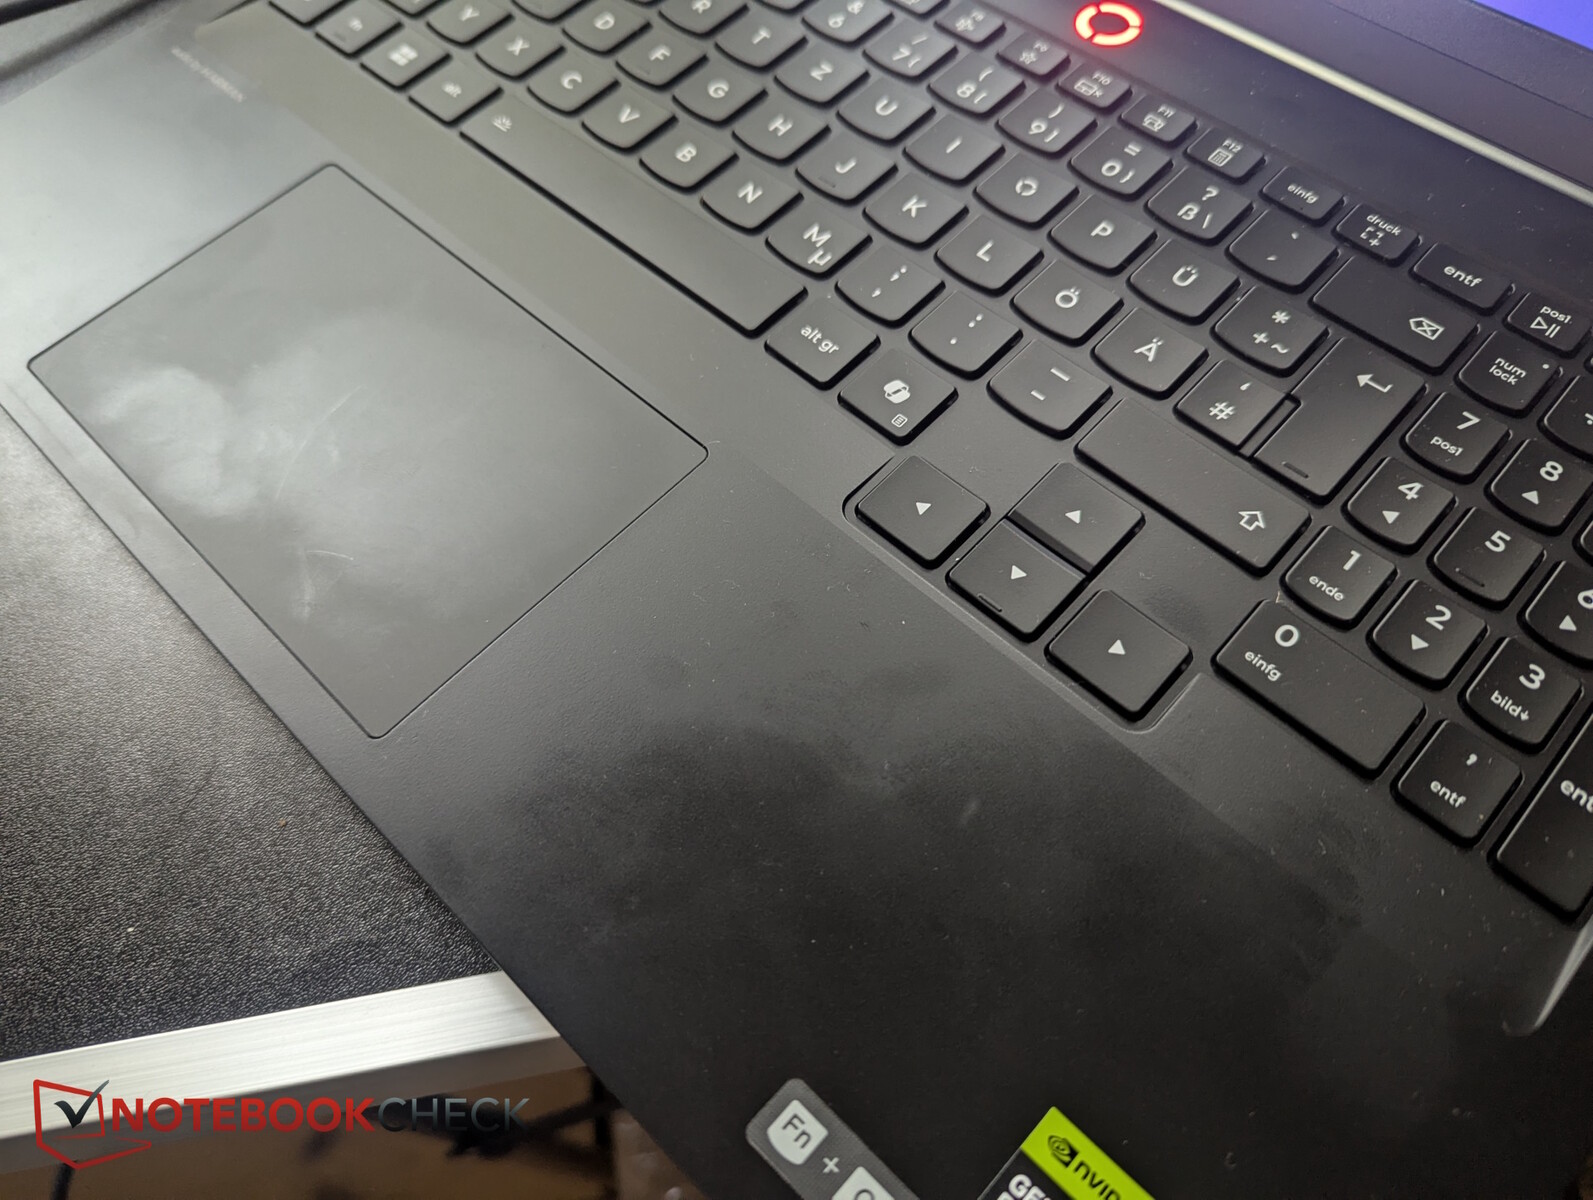
触摸板
触摸板尺寸为 12 x 7.5 厘米,表面覆盖光滑的 Mylar 材料。多点触控输入可顺利实现,集成的按键反应可靠,点击力度适中。不过,在我们的测试中,点击有时无法正确识别。
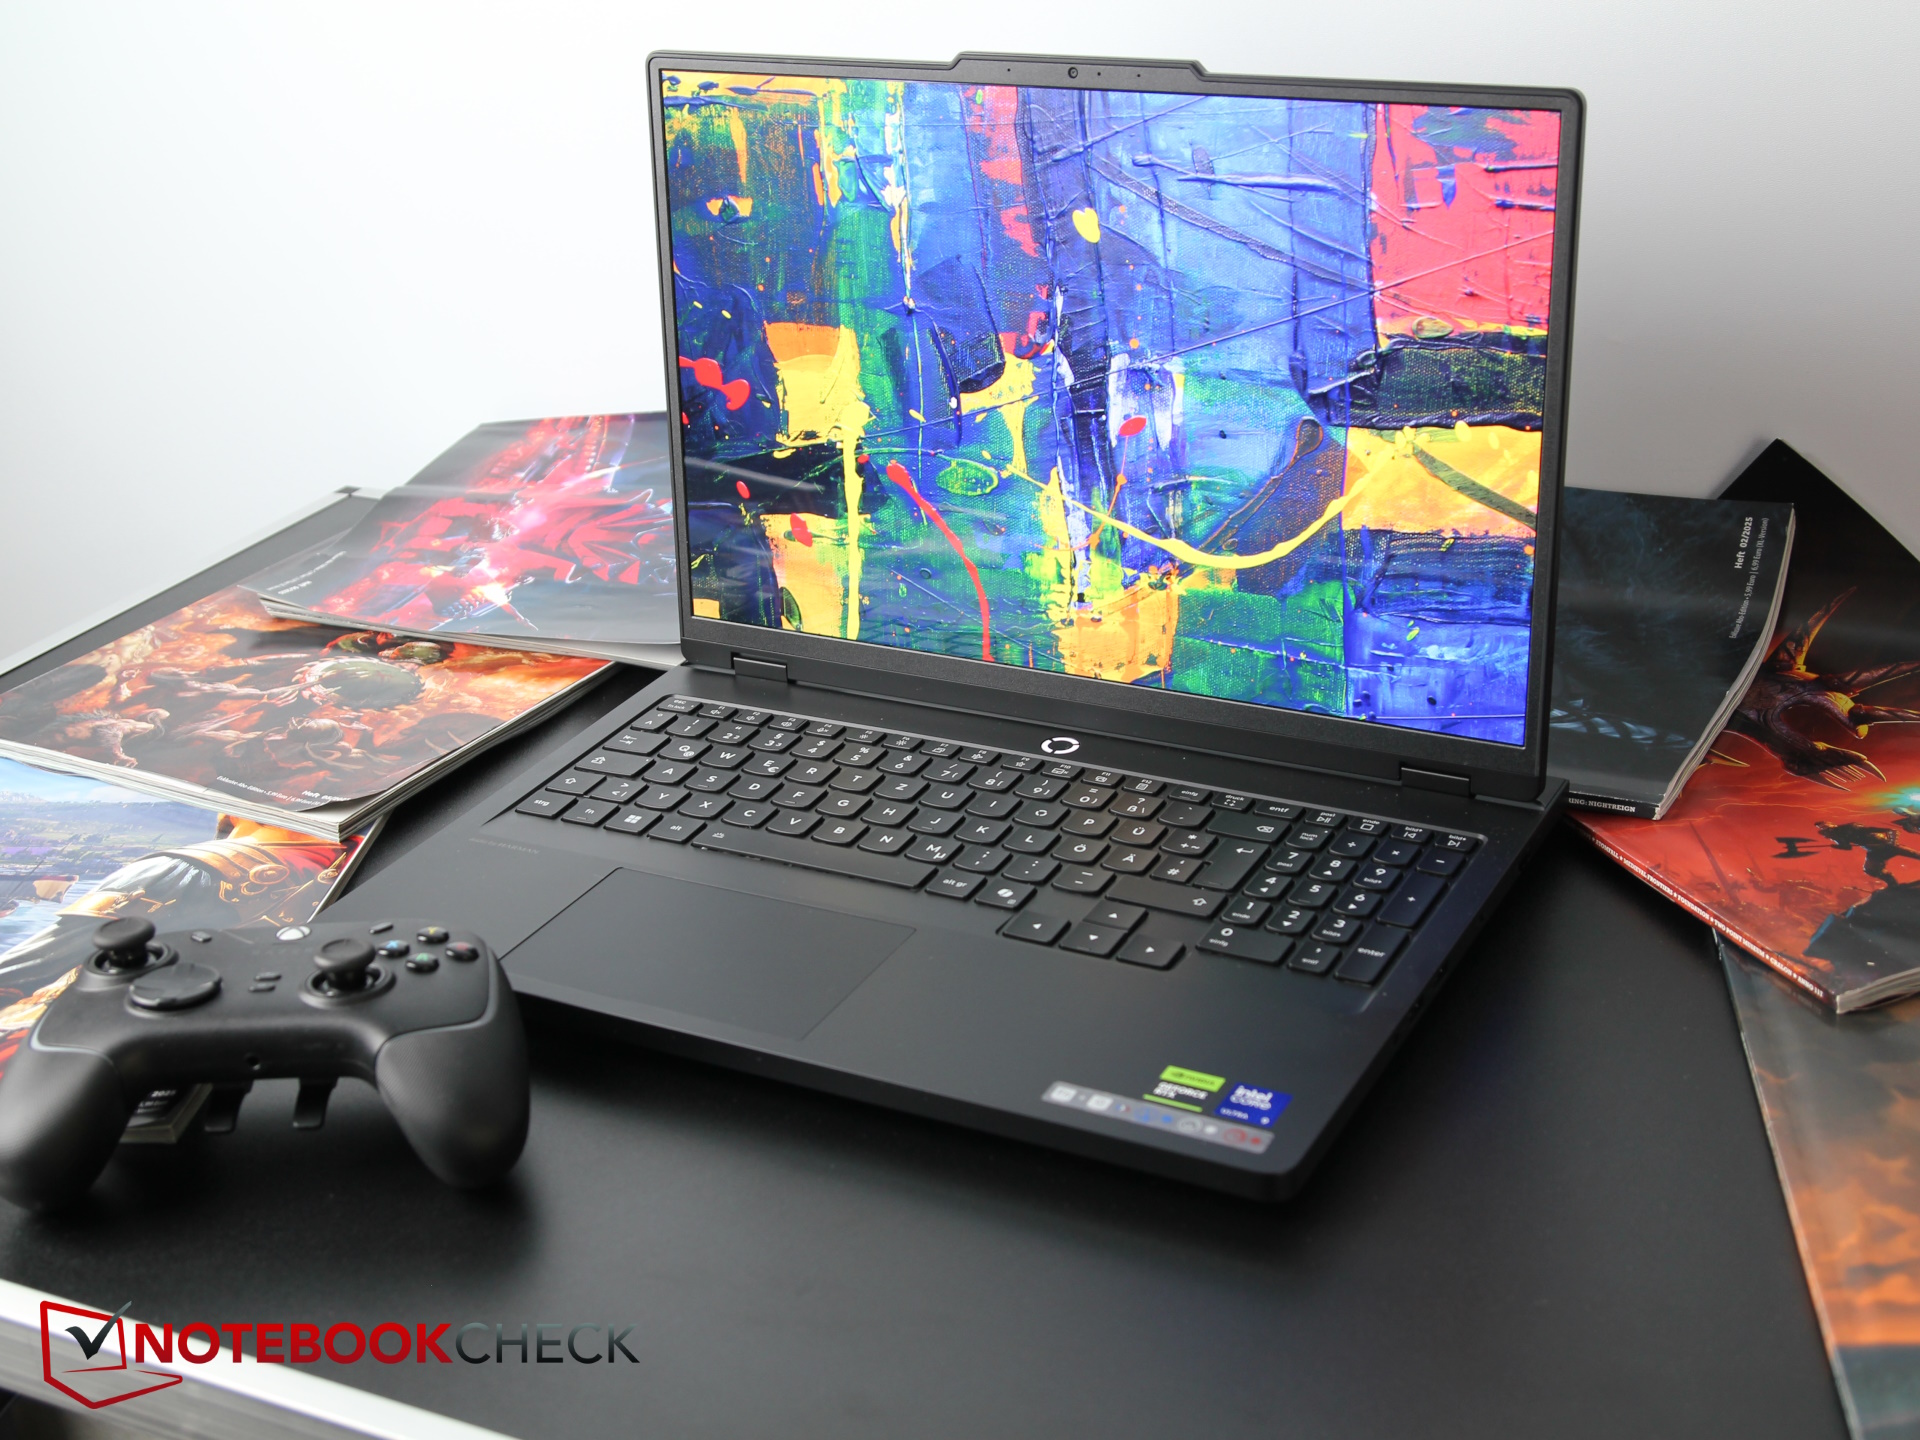
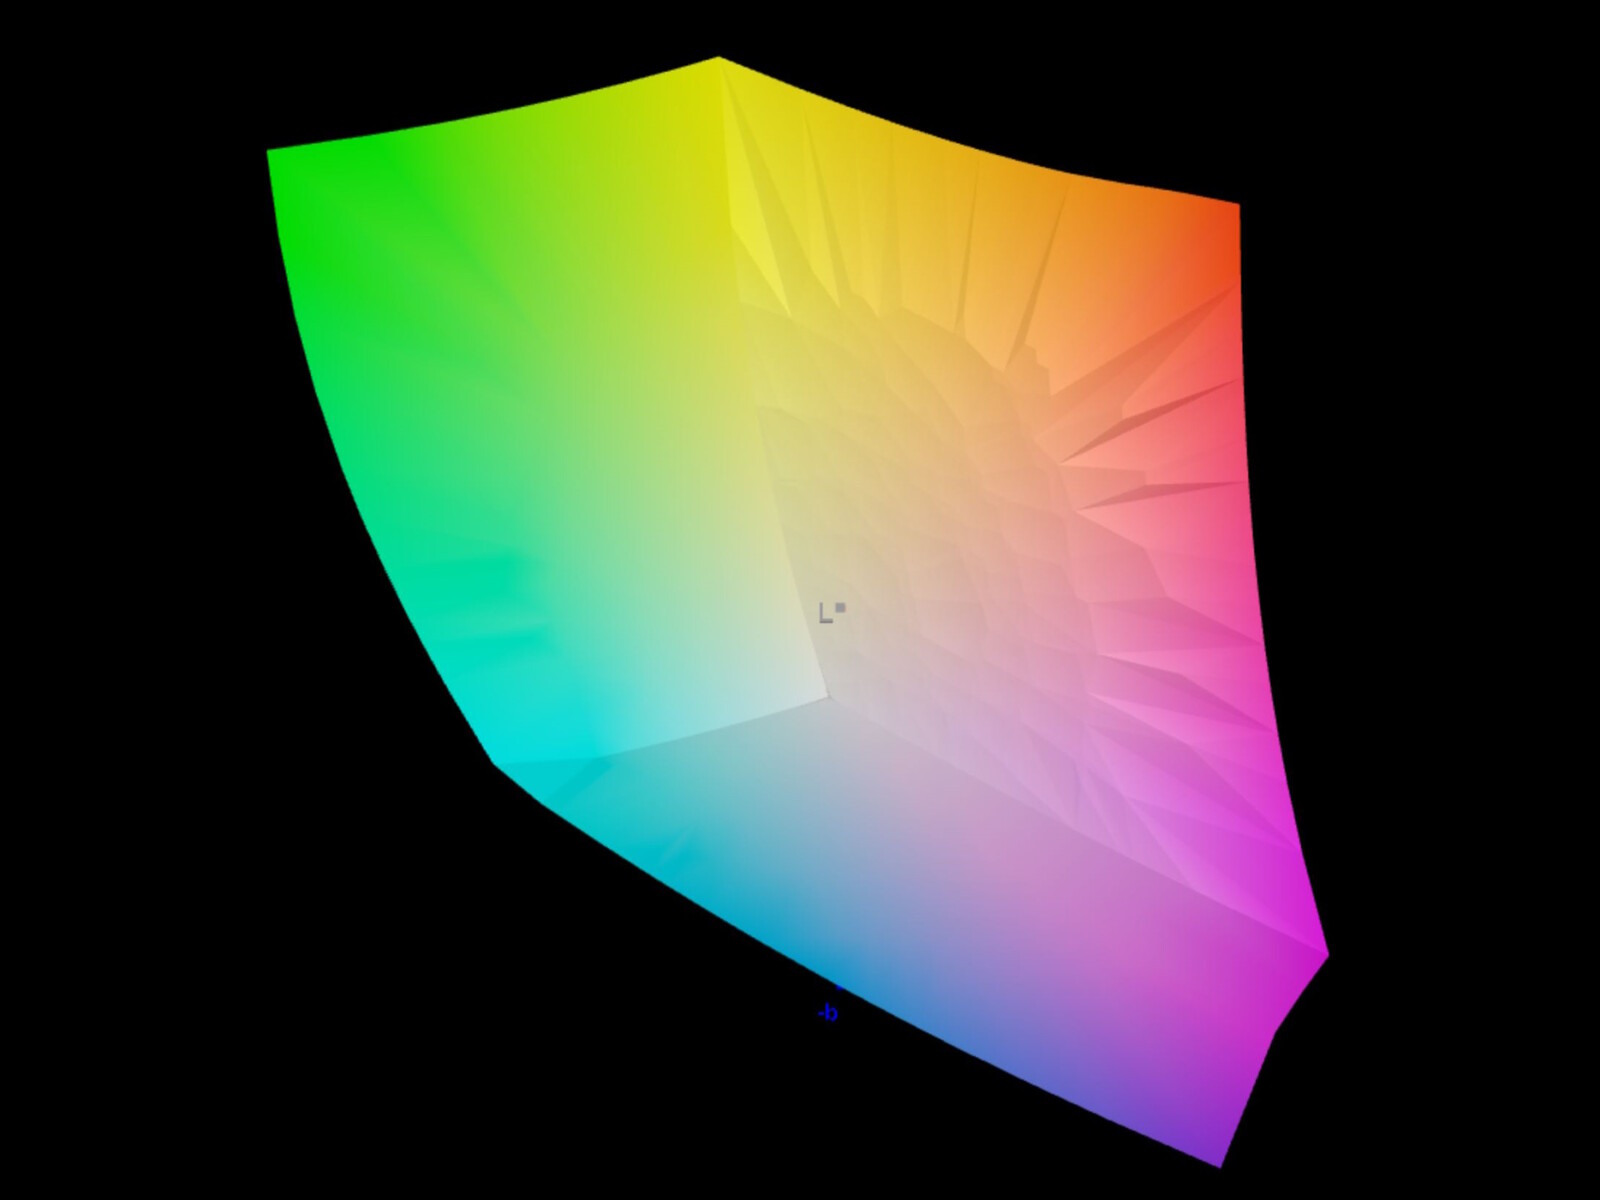
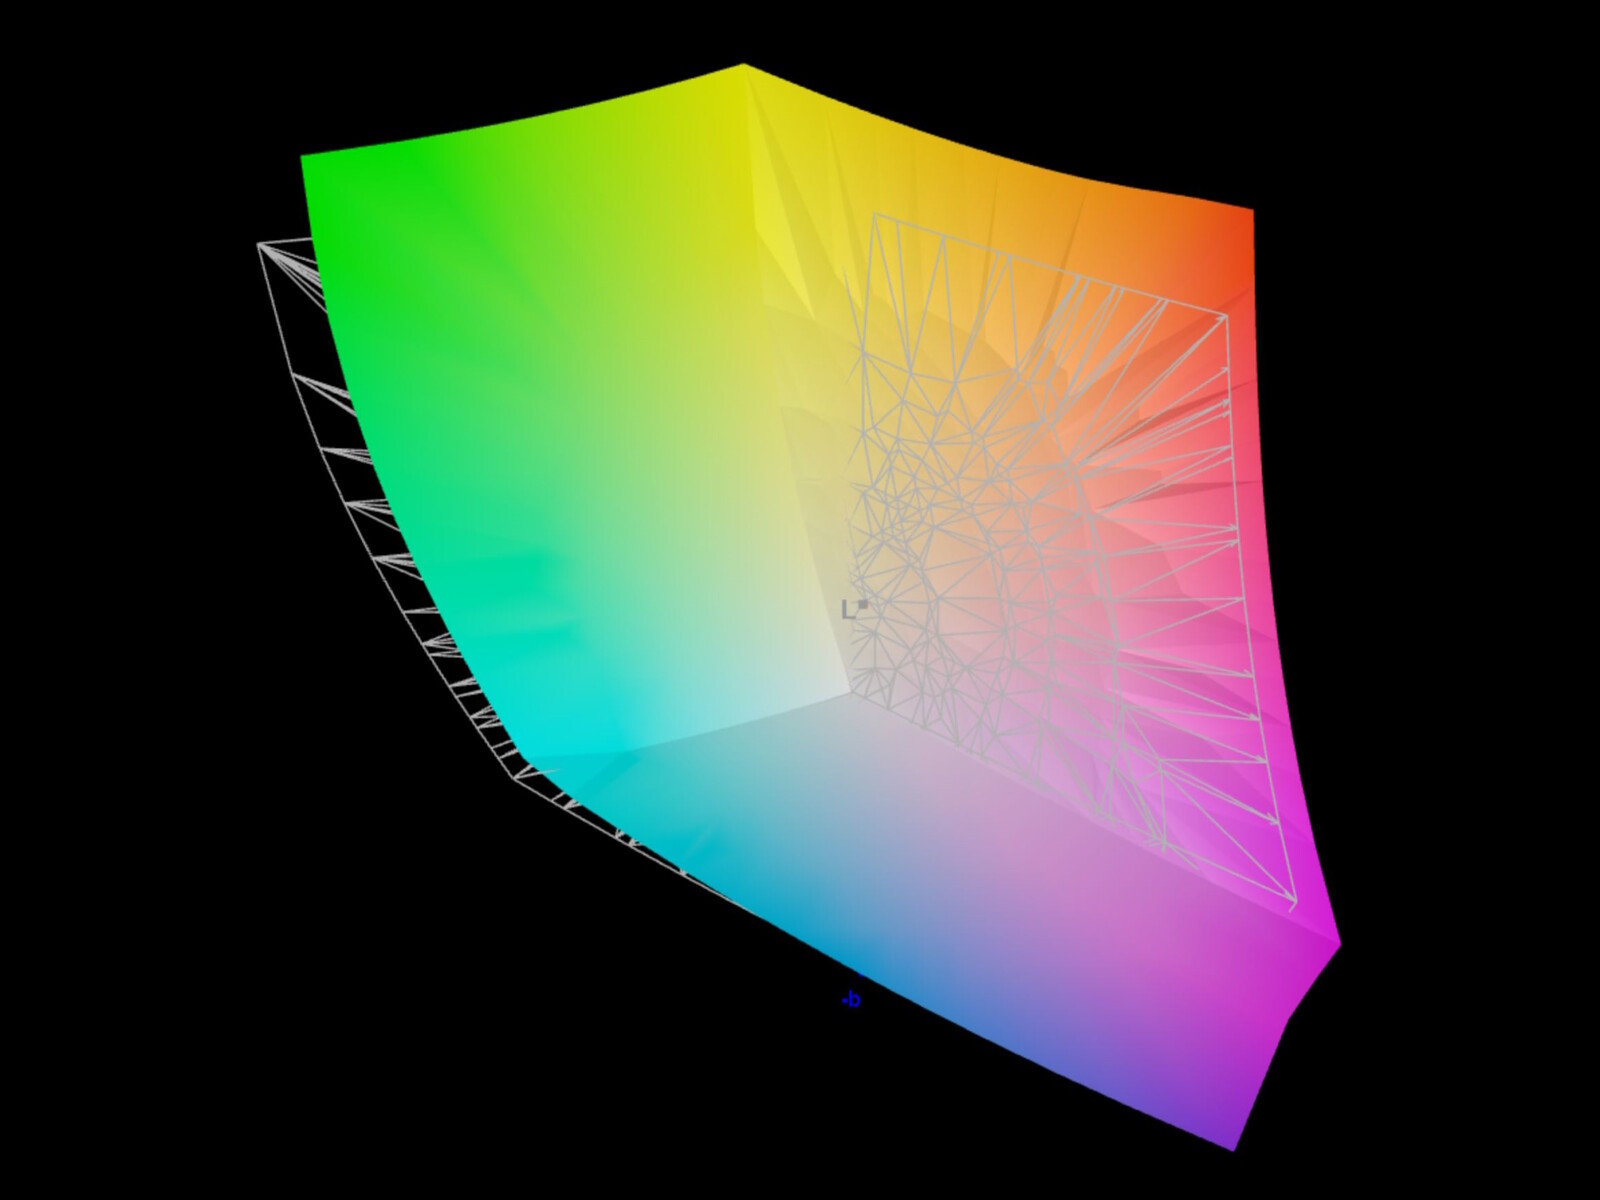
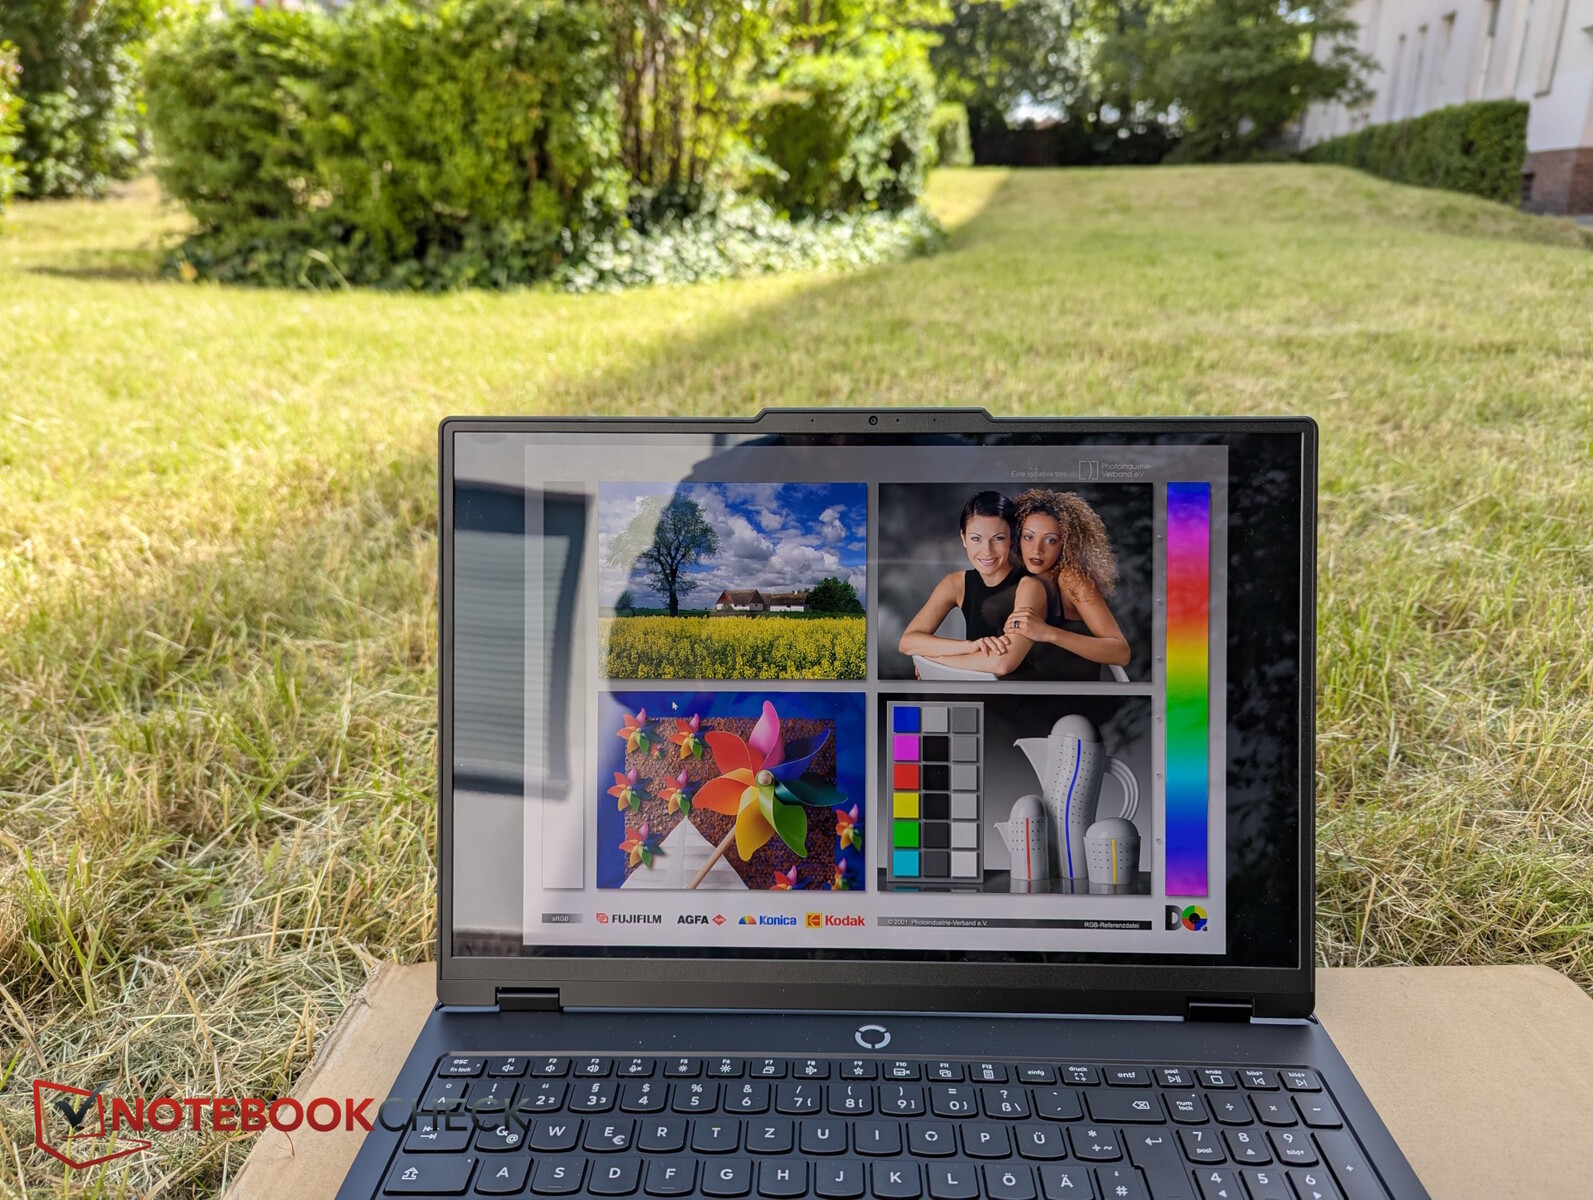
显示屏 - 炫目的 OLED
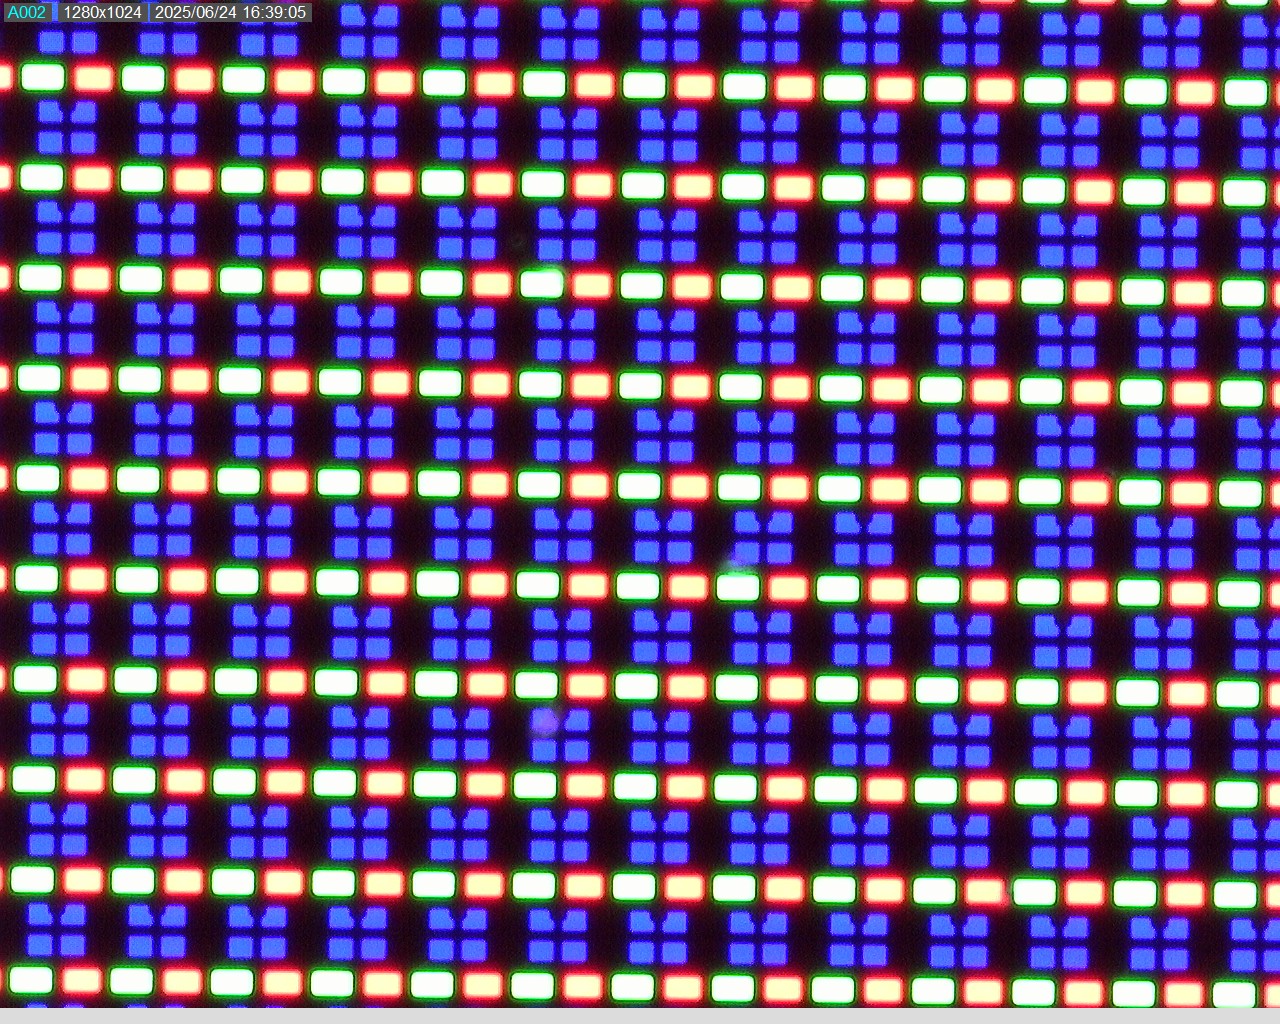
联想为 Pro 5 配备了 16 英寸亮面 OLED 显示屏,分辨率为 2,560 x 1,600 像素。该显示屏支持 DisplayHDR True Black 1000、杜比视界和 G-Sync。
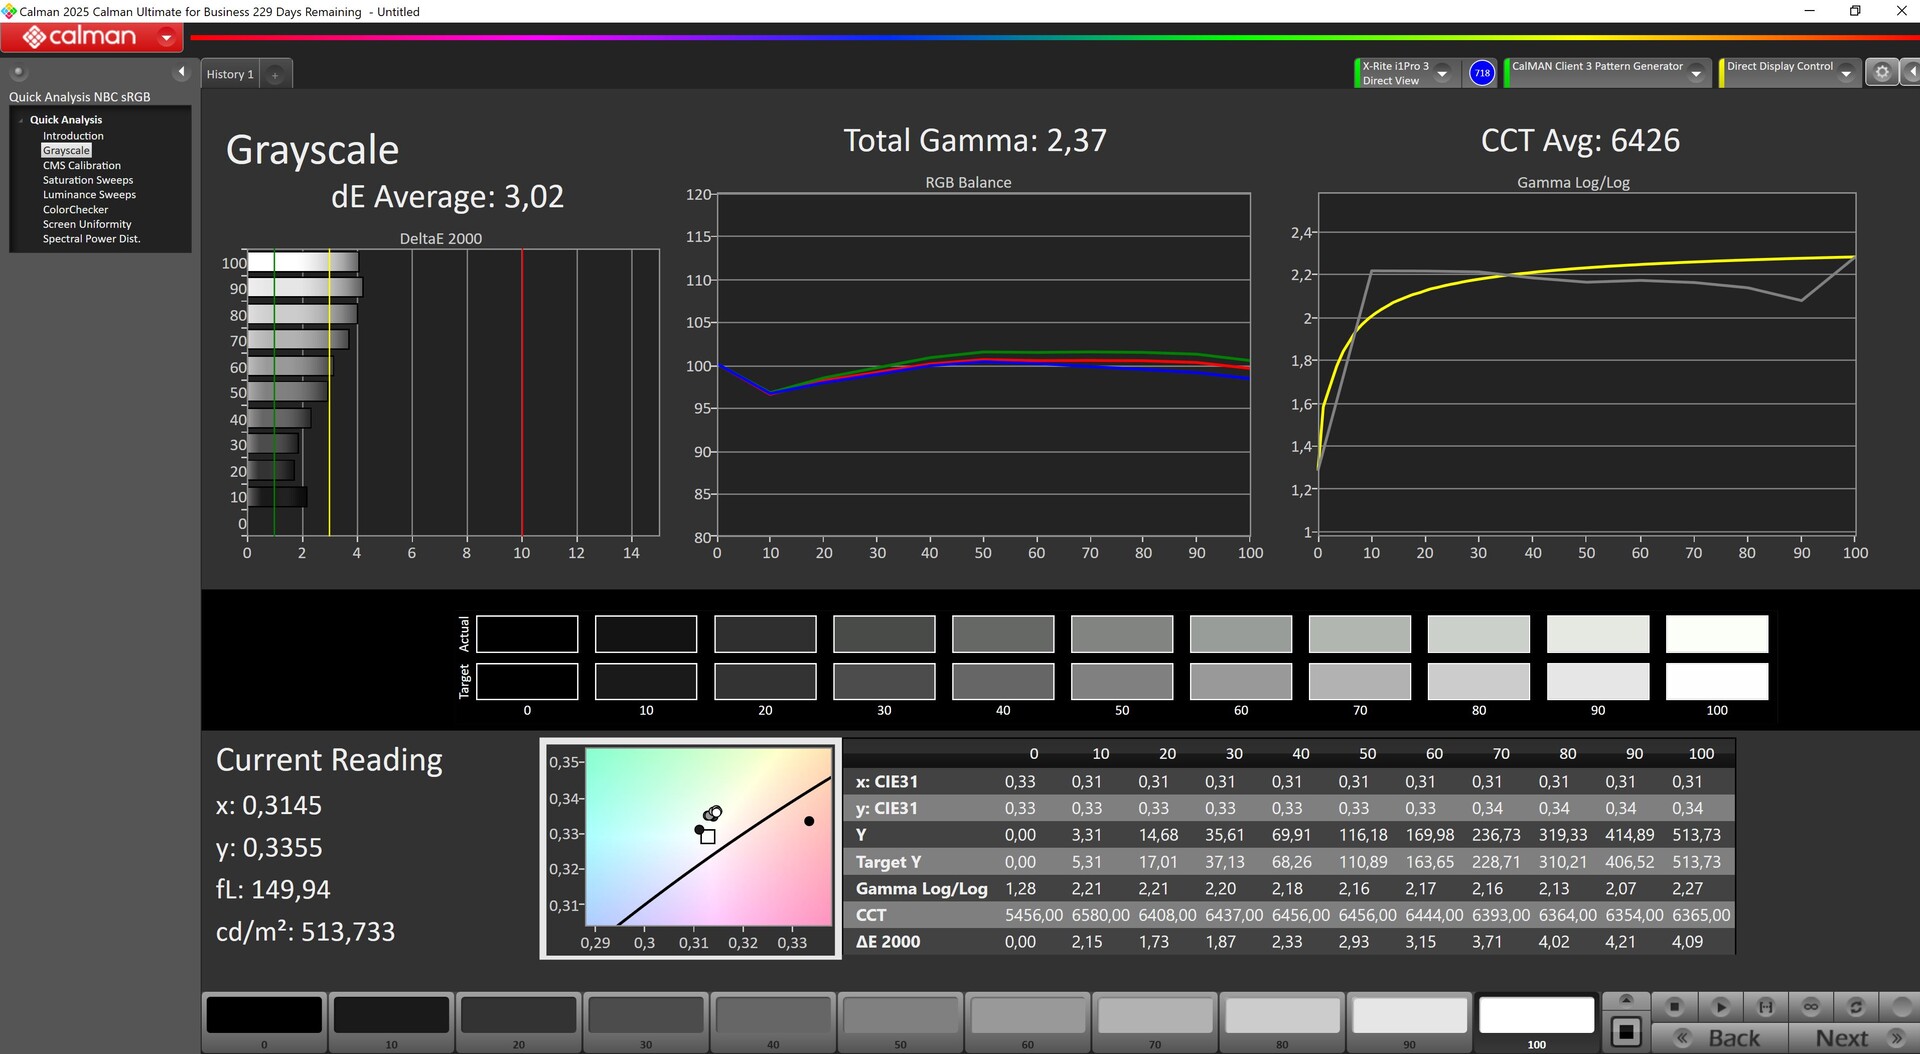
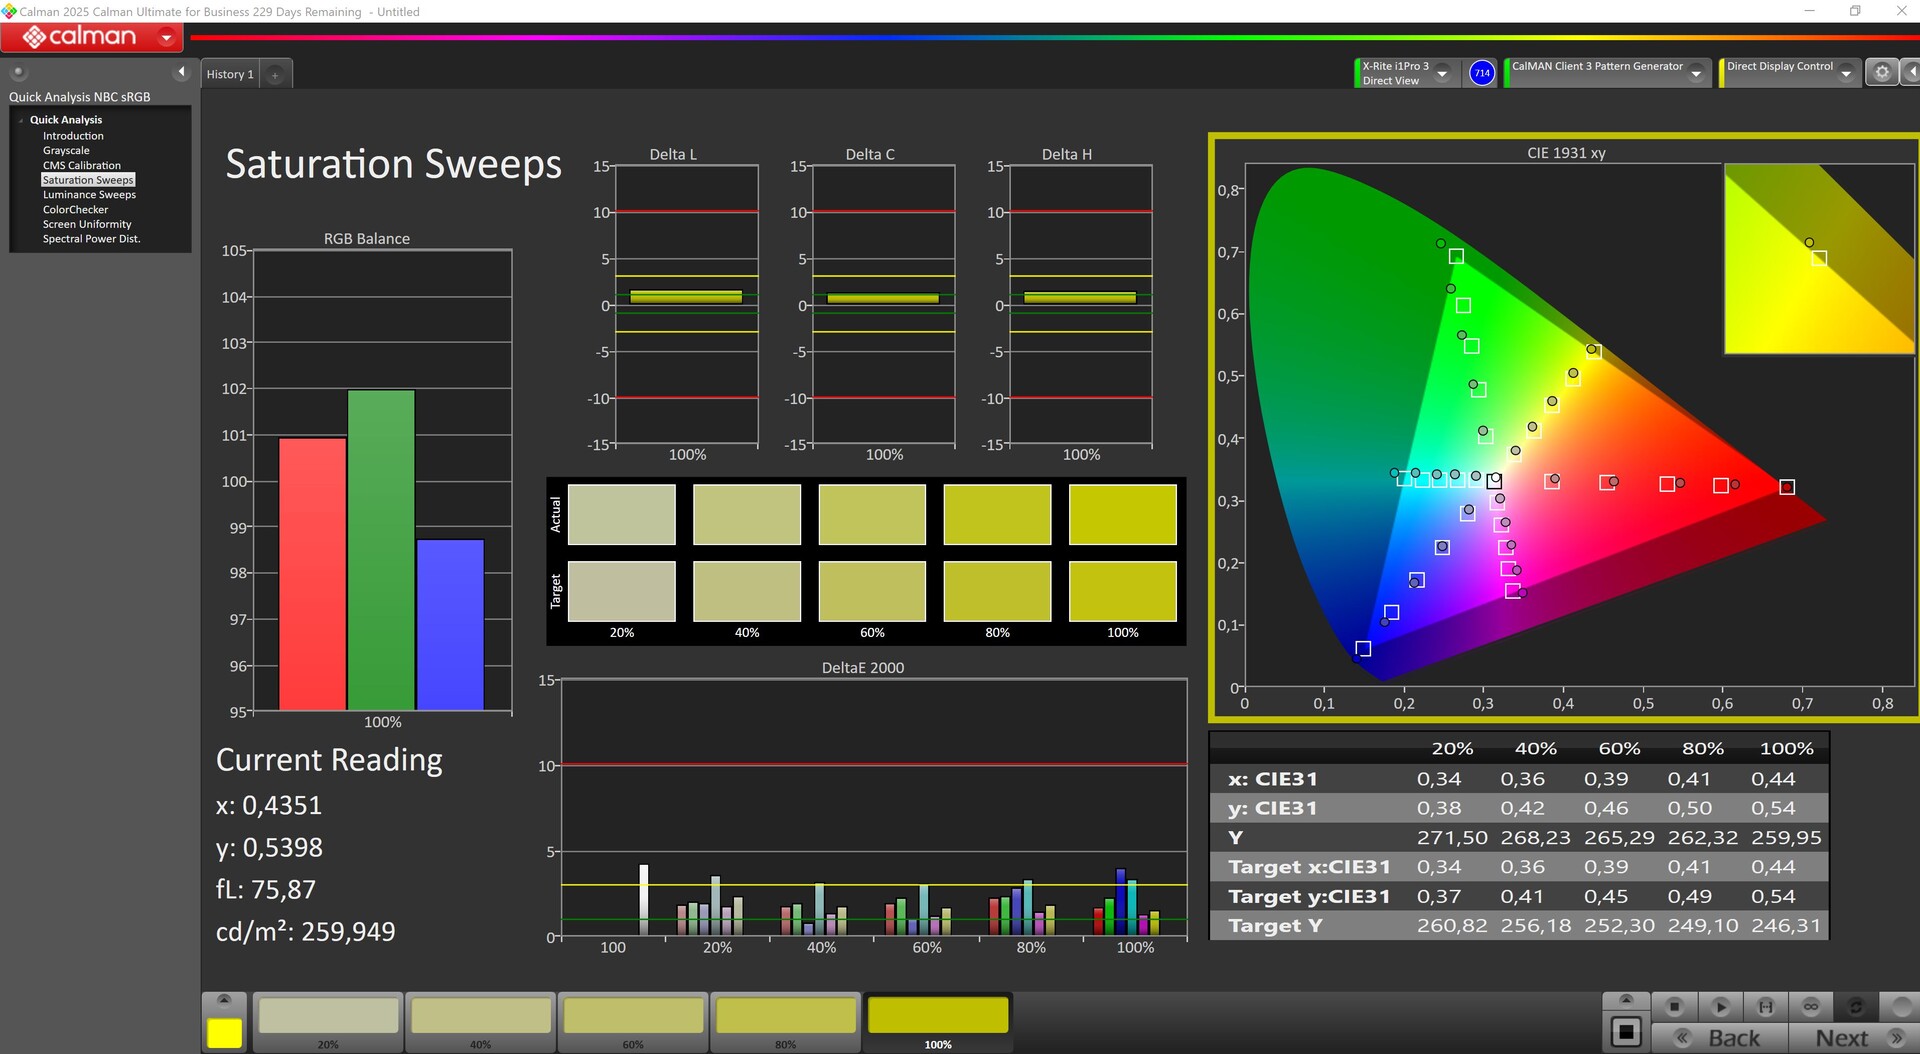
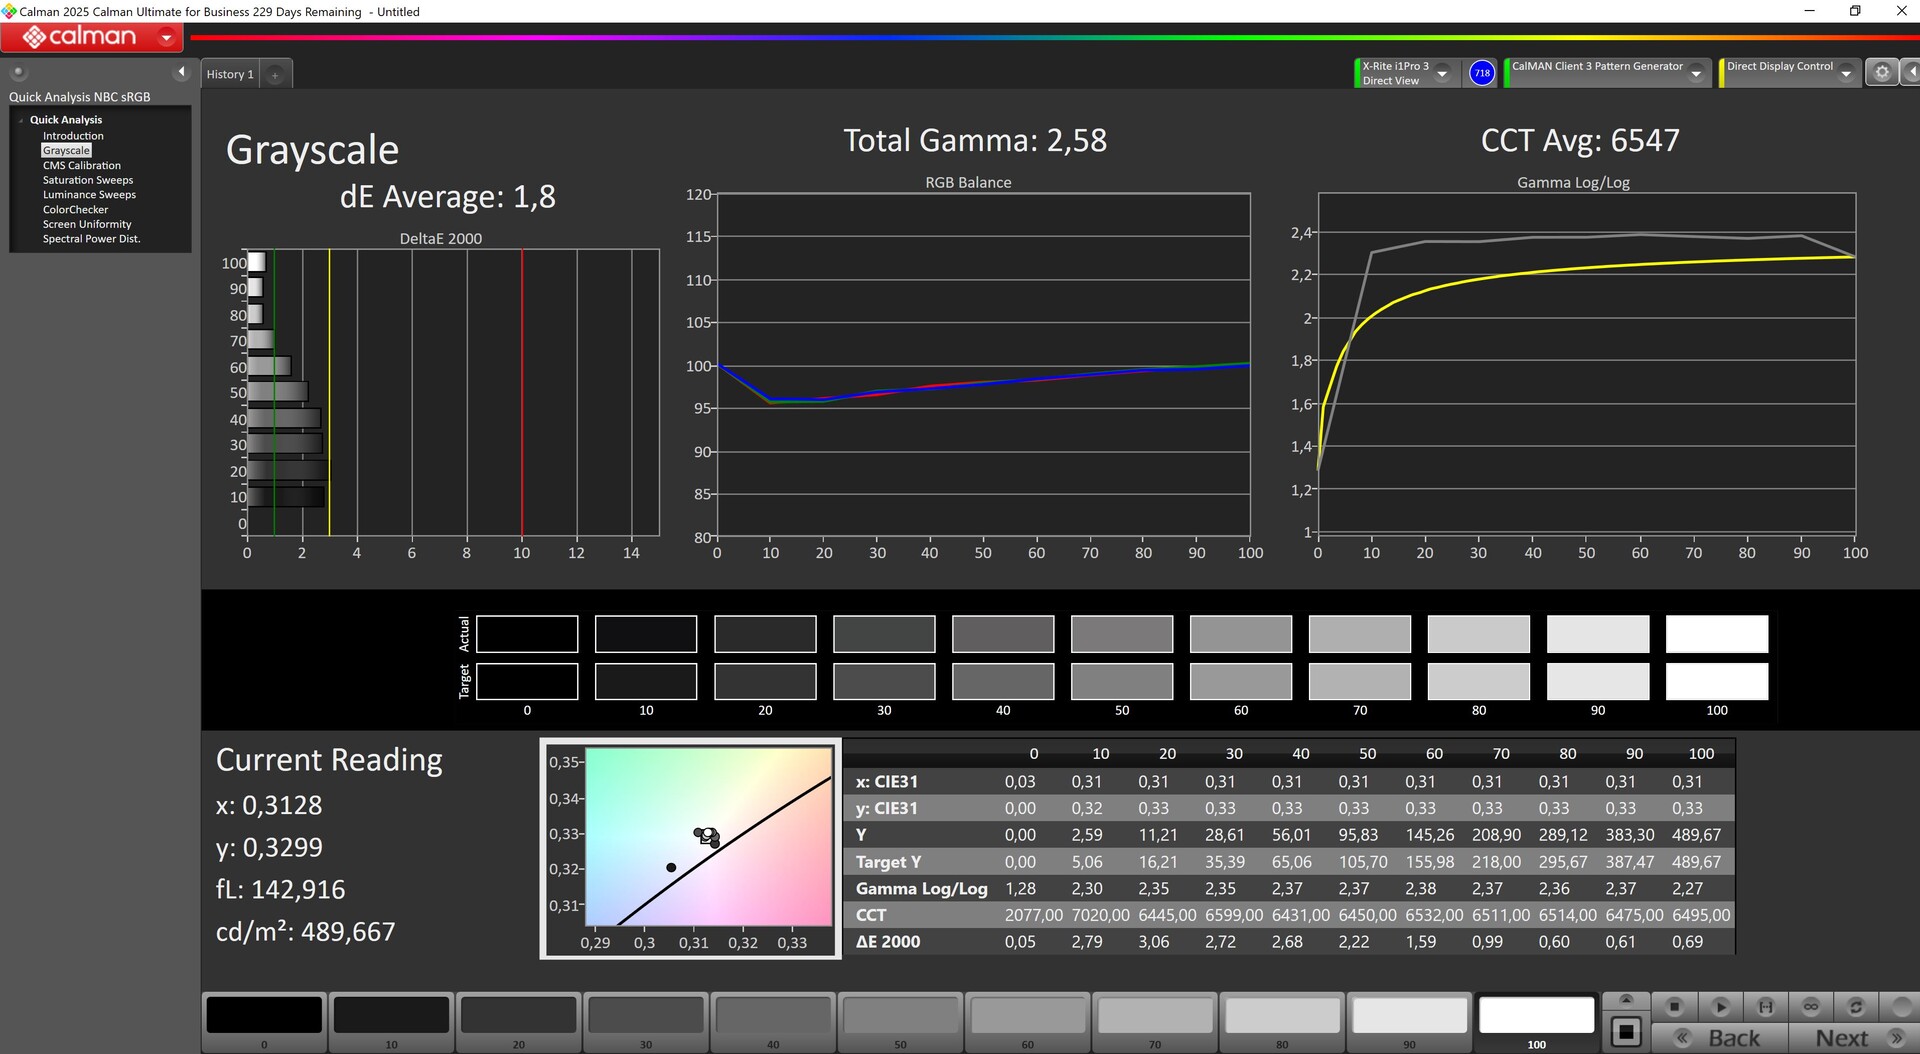
我们测得的平均亮度为 522 尼特,照度高达 97%。典型的 OLED 显示屏黑度几乎为零,因此对比度极佳。这也消除了背光渗色,而且显示速度极快(约 2 毫秒)。显示屏确实会闪烁,但频率很高,只有 1.3 kHz,即使敏感的用户也不会注意到。
| |||||||||||||||||||||||||
Brightness Distribution: 97 %
Center on Battery: 518 cd/m²
Contrast: ∞:1 (Black: 0 cd/m²)
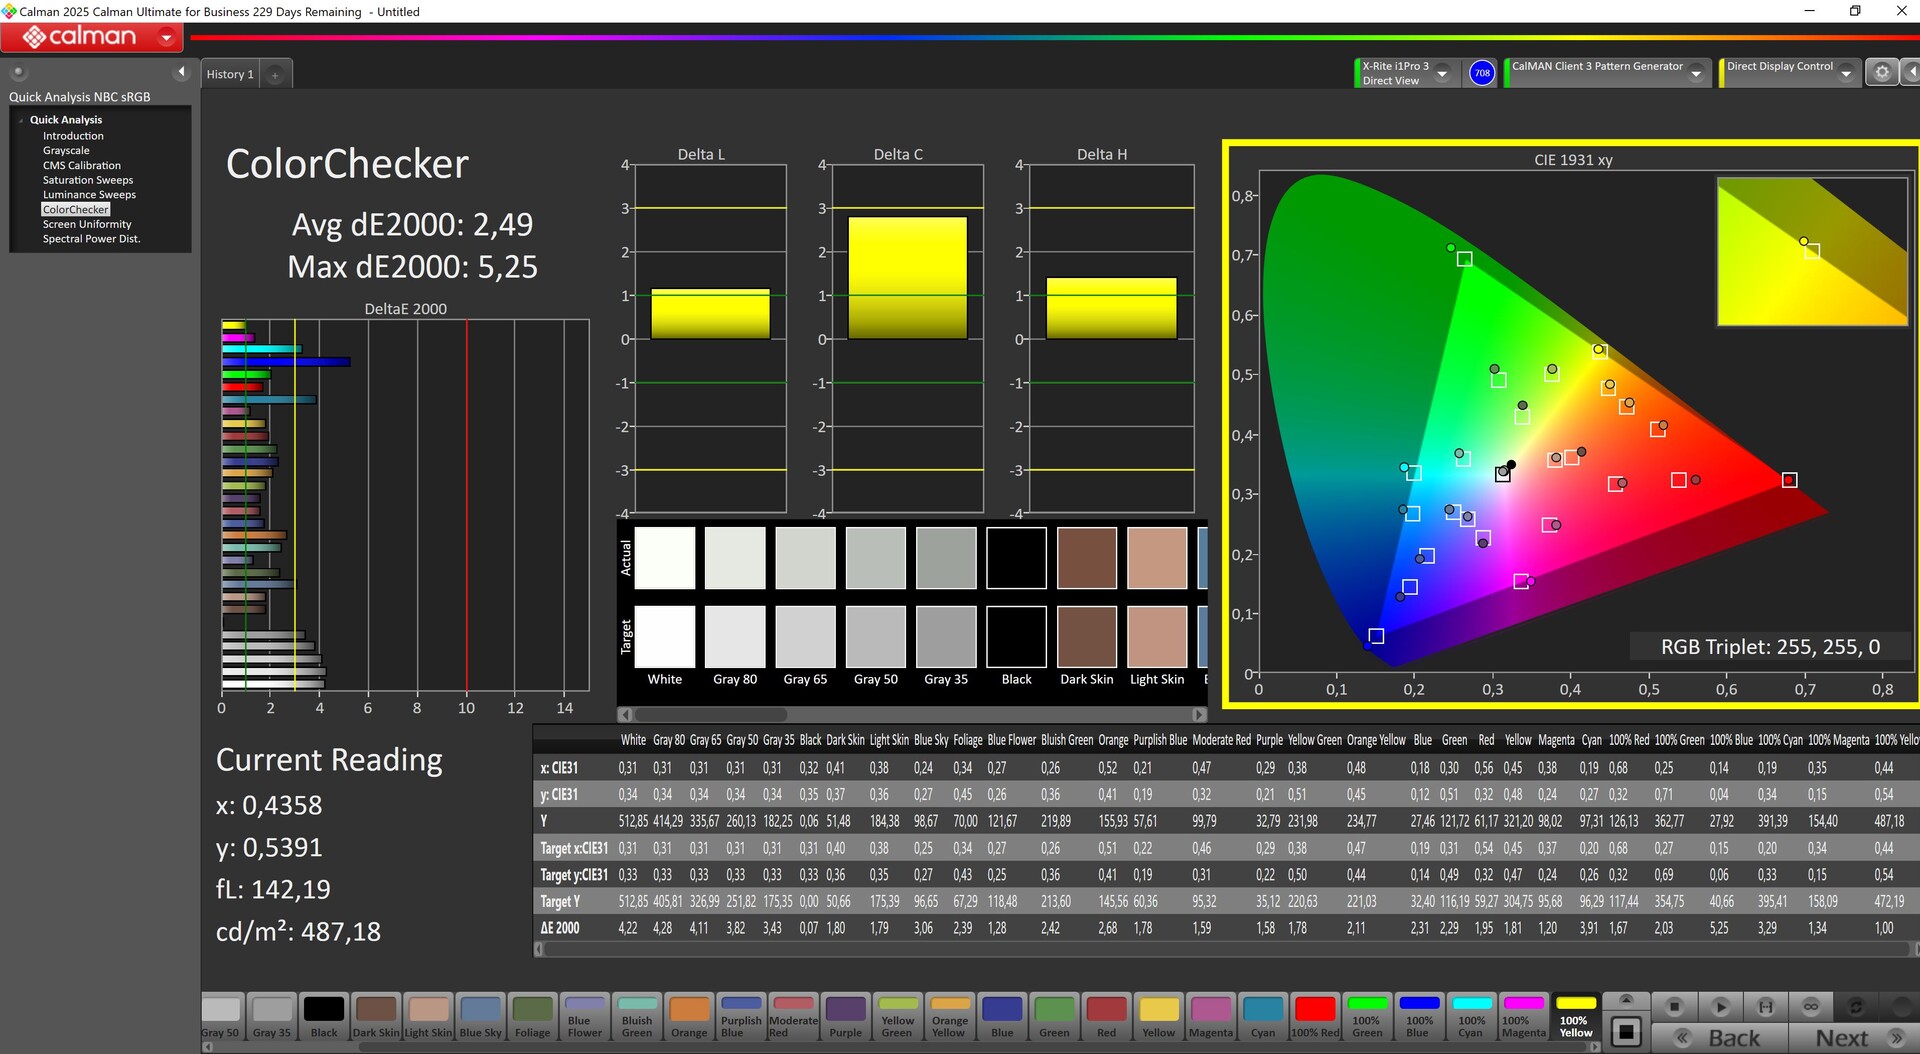
ΔE ColorChecker Calman: 2.49 | ∀{0.5-29.43 Ø4.73}
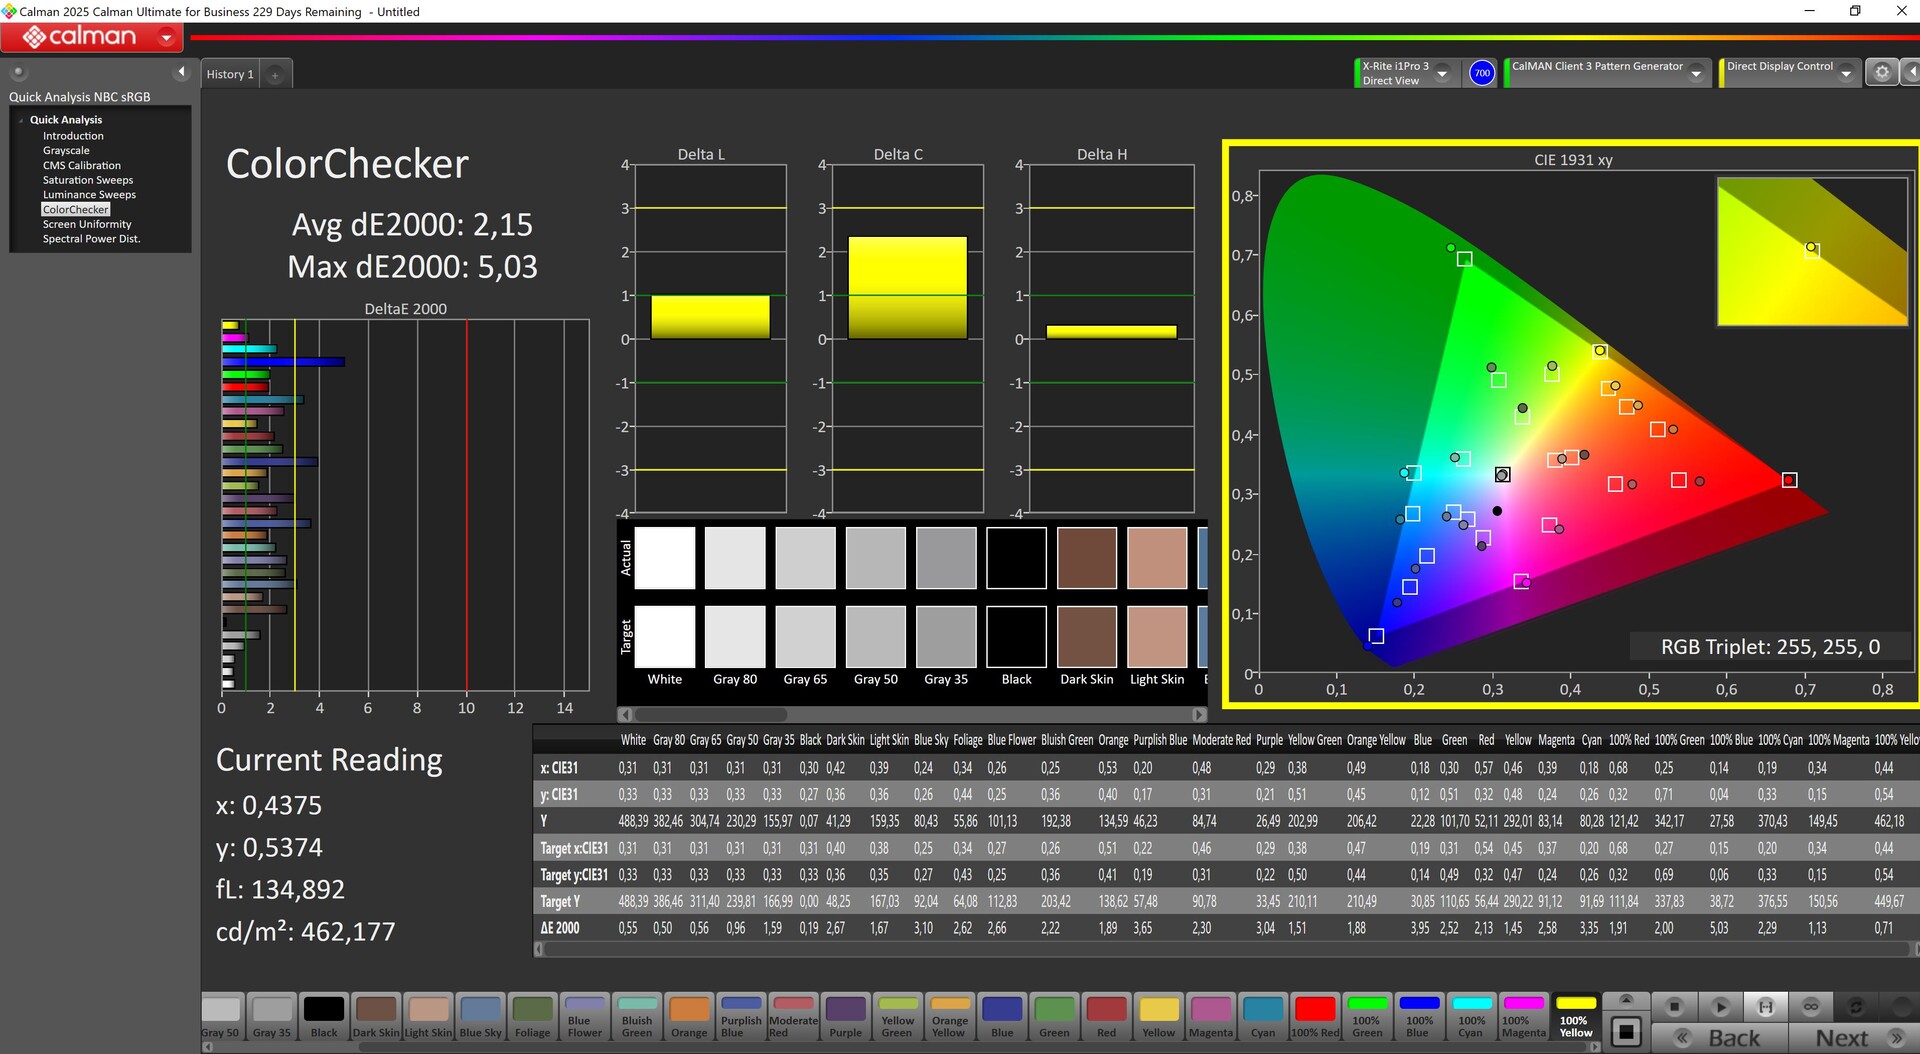
calibrated: 2.15
ΔE Greyscale Calman: 3.02 | ∀{0.09-98 Ø4.97}
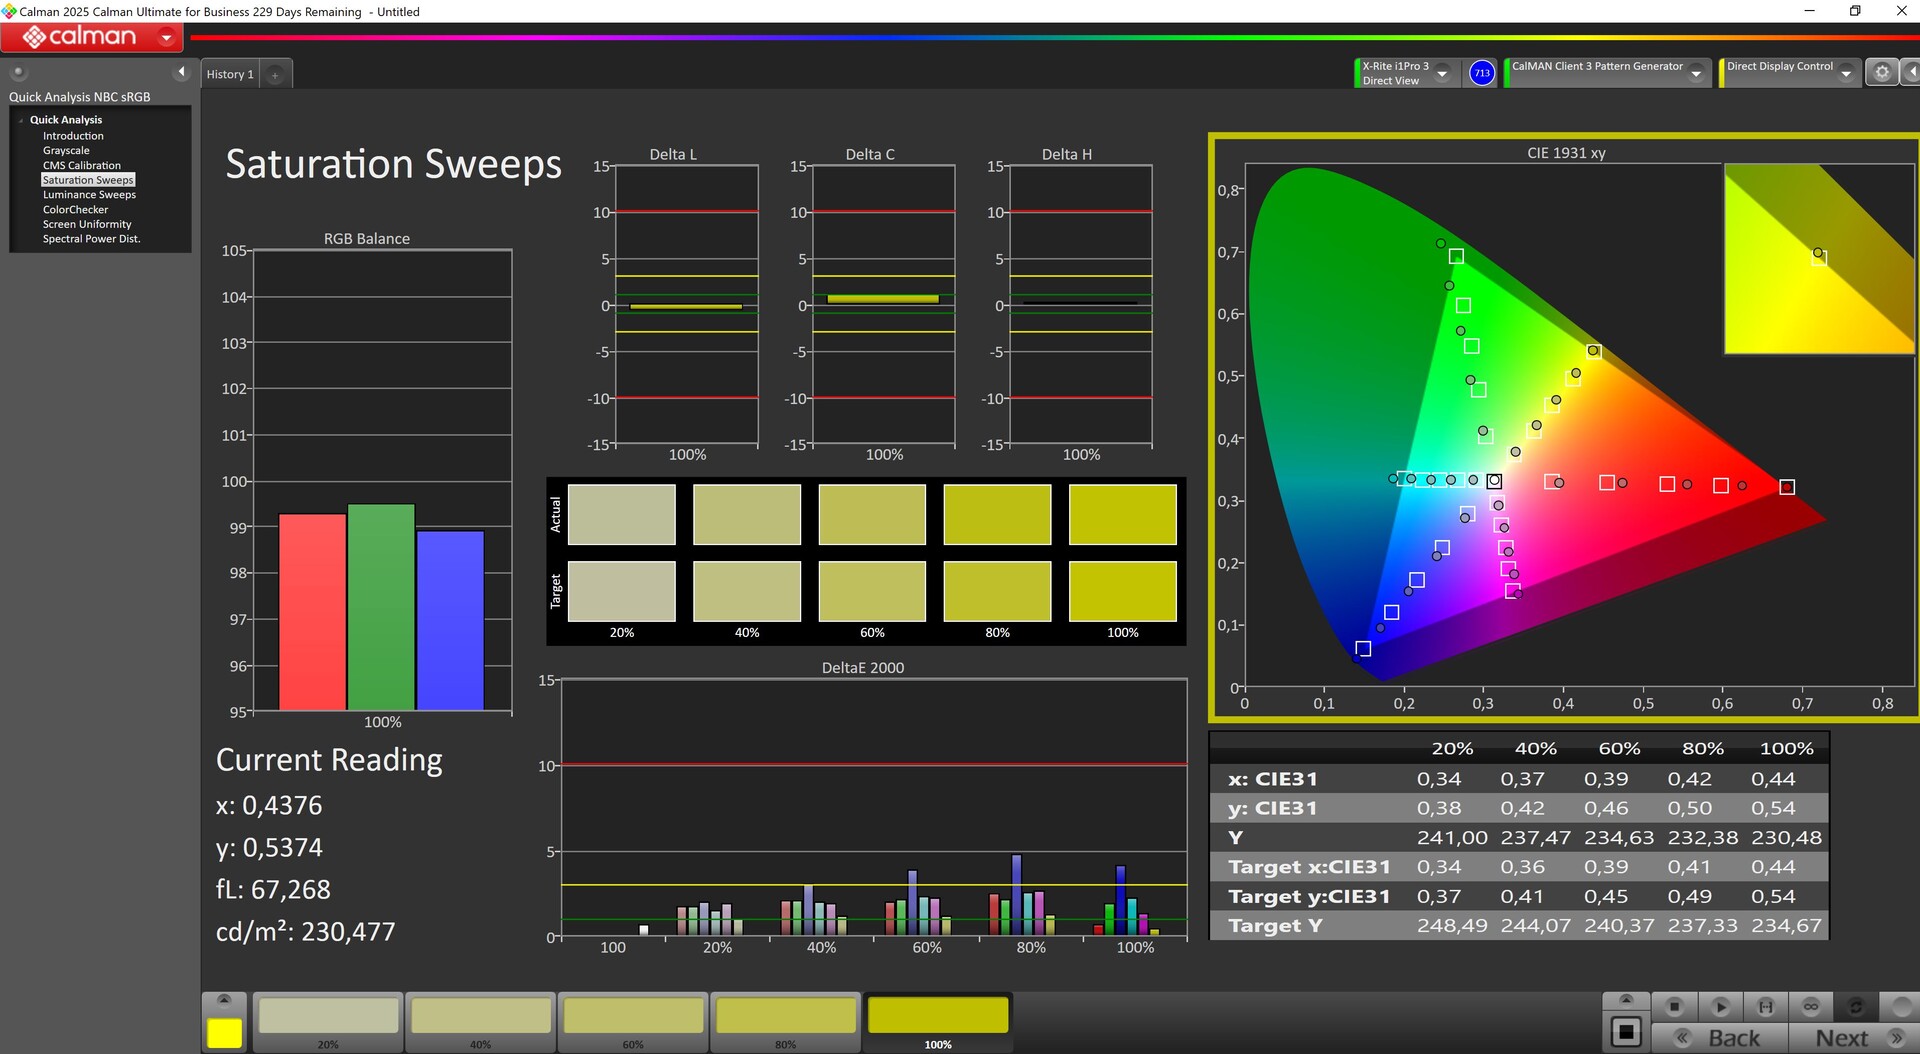
94.1% AdobeRGB 1998 (Argyll 3D)
100% sRGB (Argyll 3D)
99.9% Display P3 (Argyll 3D)
Gamma: 2.37
CCT: 6426 K
| Lenovo Legion 5 Pro 16IAX10H ATNA60HS01-0 (Samsung SDC420A), OLED, 2560x1600, 16", 165 Hz | Lenovo Legion Pro 5 16IRX9 BOE NE160QDM-NYC, IPS, 2560x1600, 16", 165 Hz | Schenker XMG Neo 16 E25 RTX 5090 Laptop NE160QDM-NM9, Mini-LED, 2560x1600, 16", 300 Hz | Aorus MASTER 16 AM6H ATNA60DL03-0 (SDC41AB), OLED, 2560x1600, 16", 240 Hz | Schenker XMG Pro 16 (E25) NE160QDM-NZL, IPS, 2560x1600, 16", 300 Hz | Asus ROG Strix Scar 16 2025 NE160QDM-NM8, Mini-LED, 2560x1600, 16", 240 Hz | Lenovo Legion Pro 7i 16 Gen 10 Samsung ATNA60HU01-0, OLED, 2560x1600, 16", 240 Hz | |
|---|---|---|---|---|---|---|---|
| Display | -19% | -2% | -2% | -15% | -2% | 0% | |
| Display P3 Coverage (%) | 99.9 | 69.3 -31% | 99.9 0% | 95.3 -5% | 74.7 -25% | 99.9 0% | 99.5 0% |
| sRGB Coverage (%) | 100 | 99.4 -1% | 100 0% | 98.8 -1% | 99.8 0% | 100 0% | 100 0% |
| AdobeRGB 1998 Coverage (%) | 94.1 | 70.1 -26% | 88.5 -6% | 94.1 0% | 75.4 -20% | 88.4 -6% | 94.4 0% |
| Response Times | -516% | -649% | -8% | -356% | -375% | 27% | |
| Response Time Grey 50% / Grey 80% * (ms) | 2 ? | 11.9 ? -495% | 17.4 ? -770% | 0.24 ? 88% | 10.5 ? -425% | 7 ? -250% | 0.28 ? 86% |
| Response Time Black / White * (ms) | 1.4 ? | 8.9 ? -536% | 13 ? -829% | 0.43 ? 69% | 5.4 ? -286% | 8.4 ? -500% | 0.43 ? 69% |
| PWM Frequency (Hz) | 1300 | 20253 | 960 | 20555 ? | 1438 ? | ||
| PWM Amplitude * (%) | 16.7 | 75 -349% | 47 -181% | 29 -74% | |||
| Screen | 21% | 14% | -3% | 9% | 46% | 11% | |
| Brightness middle (cd/m²) | 518 | 384 -26% | 888 71% | 435 -16% | 538 4% | 754 46% | 490.4 -5% |
| Brightness (cd/m²) | 522 | 366 -30% | 859 65% | 437 -16% | 508 -3% | 773 48% | 498 -5% |
| Brightness Distribution (%) | 97 | 91 -6% | 94 -3% | 96 -1% | 88 -9% | 91 -6% | 97 0% |
| Black Level * (cd/m²) | 0.35 | 0.08 | 0.47 | 0.07 | |||
| Colorchecker dE 2000 * | 2.49 | 0.97 61% | 3.3 -33% | 2.42 3% | 1.9 24% | 1 60% | 3.2 -29% |
| Colorchecker dE 2000 max. * | 5.25 | 3.57 32% | 5.5 -5% | 4.81 8% | 4 24% | 2 62% | 6.04 -15% |
| Colorchecker dE 2000 calibrated * | 2.15 | 0.77 64% | 1.5 30% | 2.03 6% | 0.84 61% | ||
| Greyscale dE 2000 * | 3.02 | 1.5 50% | 3.8 -26% | 3.11 -3% | 2.7 11% | 1 67% | 1 67% |
| Gamma | 2.37 93% | 2.24 98% | 2.46 89% | 2.48 89% | 2.24 98% | 2.14 103% | 2.24 98% |
| CCT | 6426 101% | 6709 97% | 6267 104% | 6270 104% | 7027 93% | 6493 100% | 6373 102% |
| Contrast (:1) | 1097 | 5438 | 1145 | 10771 | |||
| Total Average (Program / Settings) | -171% /
-79% | -212% /
-143% | -4% /
-4% | -121% /
-64% | -110% /
-44% | 13% /
12% |
* ... smaller is better
OLED 可完全显示 sRGB 和 Display P3,即使是 AdobeRGB 也能以 94% 的比例显示。

Legion Pro 5 的显示屏经过出厂校准。在全亮度下,偏差仍为 2.49(色彩)和略高于 3(灰度)。我们的手动校准稍微降低了 DeltaE 值。
Display Response Times
| ↔ Response Time Black to White | ||
|---|---|---|
| 1.4 ms ... rise ↗ and fall ↘ combined | ↗ 0.8 ms rise | 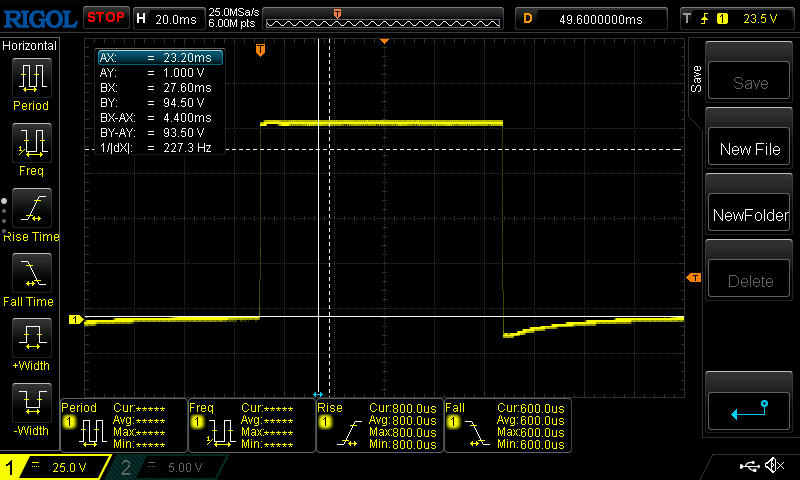 |
| ↘ 0.6 ms fall | ||
| The screen shows very fast response rates in our tests and should be very well suited for fast-paced gaming. In comparison, all tested devices range from 0.1 (minimum) to 240 (maximum) ms. » 8 % of all devices are better. This means that the measured response time is better than the average of all tested devices (19.9 ms). | ||
| ↔ Response Time 50% Grey to 80% Grey | ||
| 2 ms ... rise ↗ and fall ↘ combined | ↗ 1 ms rise | 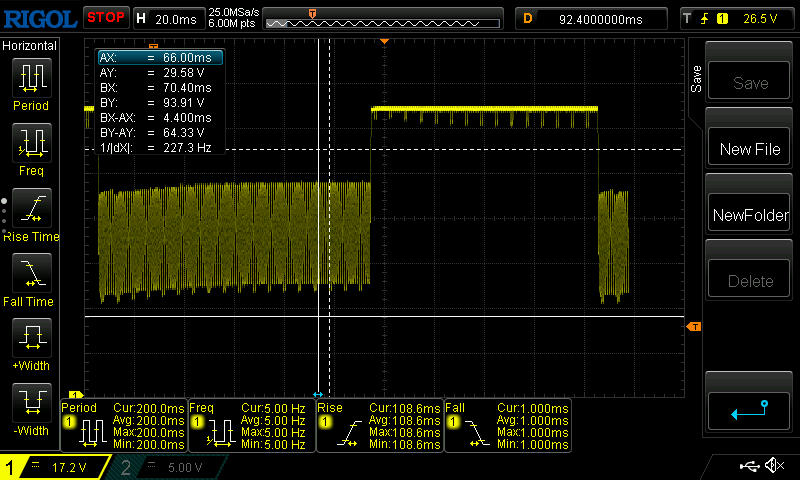 |
| ↘ 1 ms fall | ||
| The screen shows very fast response rates in our tests and should be very well suited for fast-paced gaming. In comparison, all tested devices range from 0.165 (minimum) to 636 (maximum) ms. » 10 % of all devices are better. This means that the measured response time is better than the average of all tested devices (31.1 ms). | ||
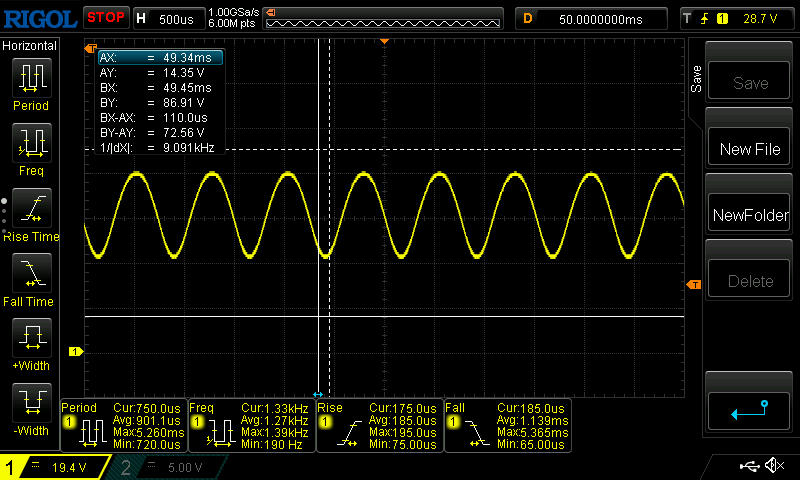
Screen Flickering / PWM (Pulse-Width Modulation)
| Screen flickering / PWM detected | 1300 Hz Amplitude: 16.7 % | 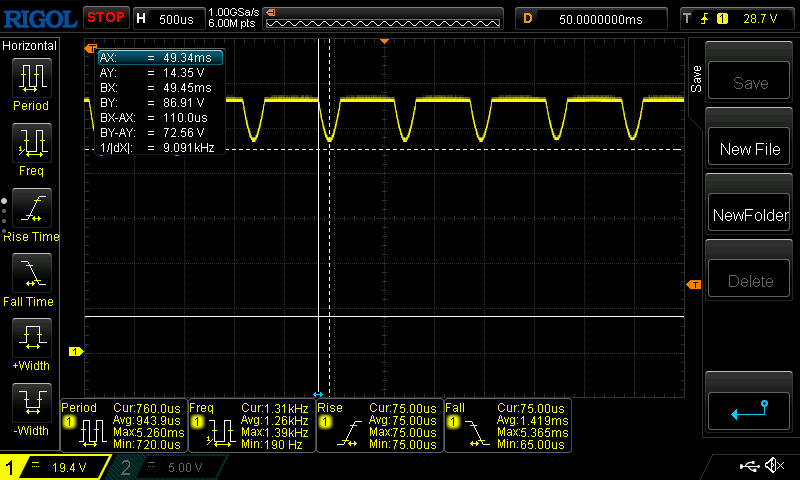 | |
The display backlight flickers at 1300 Hz (worst case, e.g., utilizing PWM) . The frequency of 1300 Hz is quite high, so most users sensitive to PWM should not notice any flickering. In comparison: 52 % of all tested devices do not use PWM to dim the display. If PWM was detected, an average of 7794 (minimum: 5 - maximum: 343500) Hz was measured. | |||


从理论上讲,反光板在室外可能会造成困扰,但由于它的亮度和对比度都很高,只要确保有直视角度和阴凉处,还是非常实用的。


性能 - 强大的 3D 性能
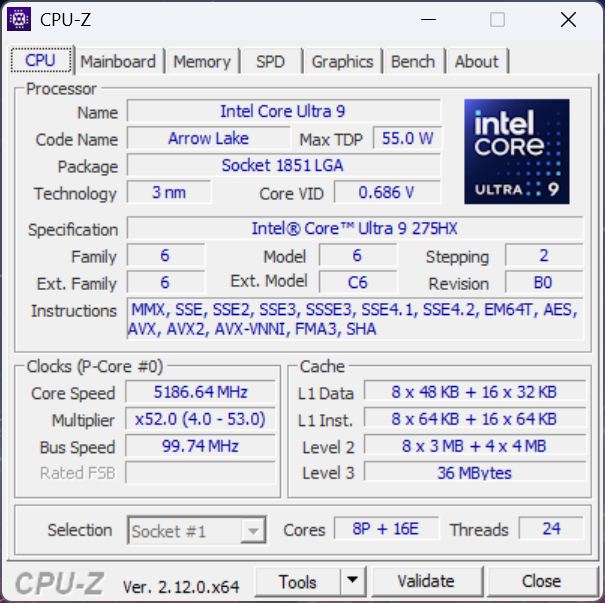
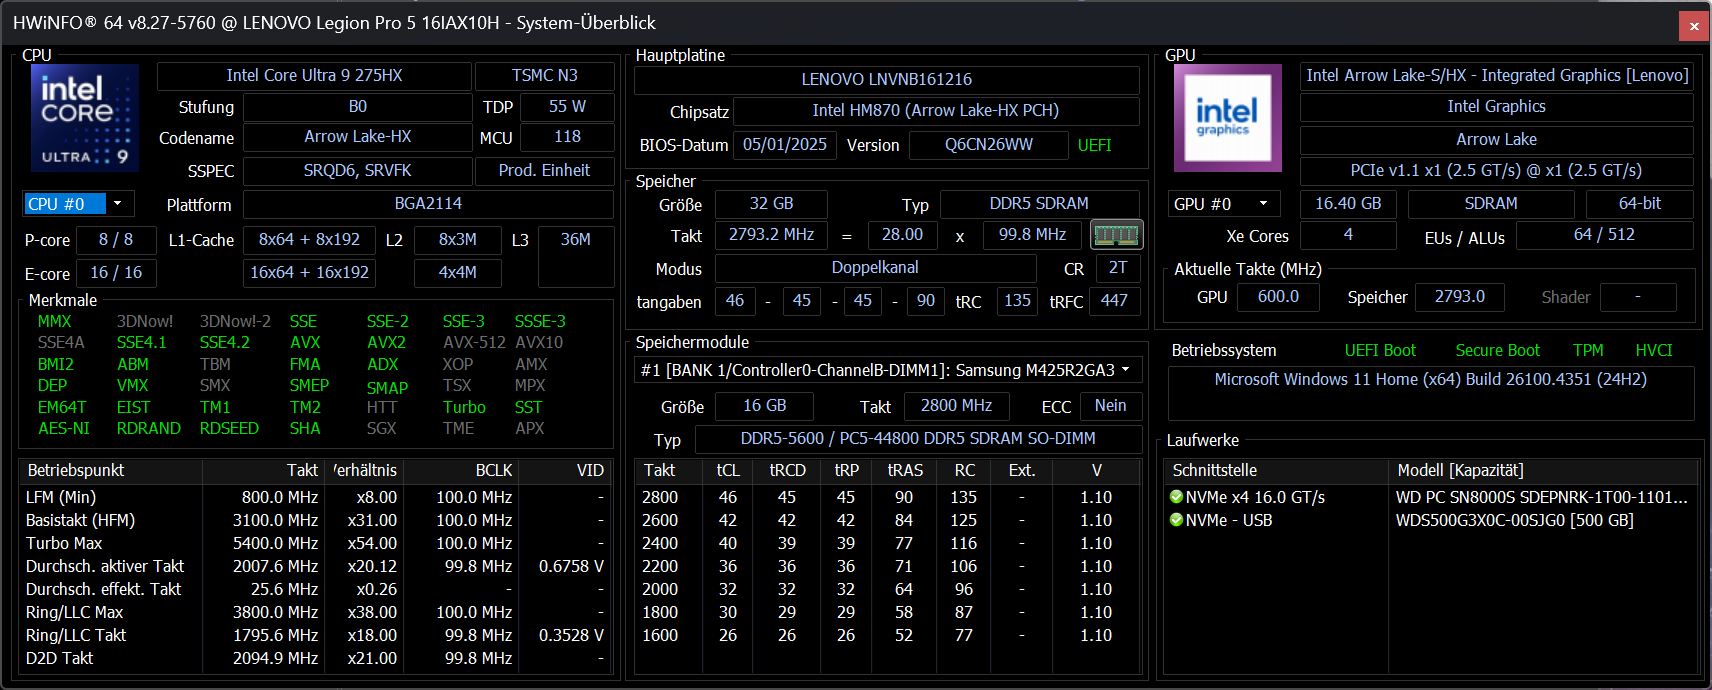
Intel Core Ultra 9 275HX,一台 RTX 5070 Ti 笔记本电脑、32 GB 内存和 1 TB SSD,Legion 将自己定位为游戏玩家。另一方面,"专业"(fessional)设备的设计和出色的 OLED 显示屏也面向内容创作者。
测试条件
遗憾的是,联想还利用自己的软件向游戏用户做广告。例如,设置性能模式所需的联想LegionSpace总是在 "游戏商店 "主屏幕上显示最新的游戏产品。第二个软件是联想 Vantage,负责更新和支持,但也会反复向用户提出调查请求或自我推销广告。此外,还预装了一个 McAfee 试用版。
有兴趣的用户可以通过浏览器链接进入联想的一般隐私政策。一般用户并不清楚 LegionSpace 和 Vantage 收集的具体数据。
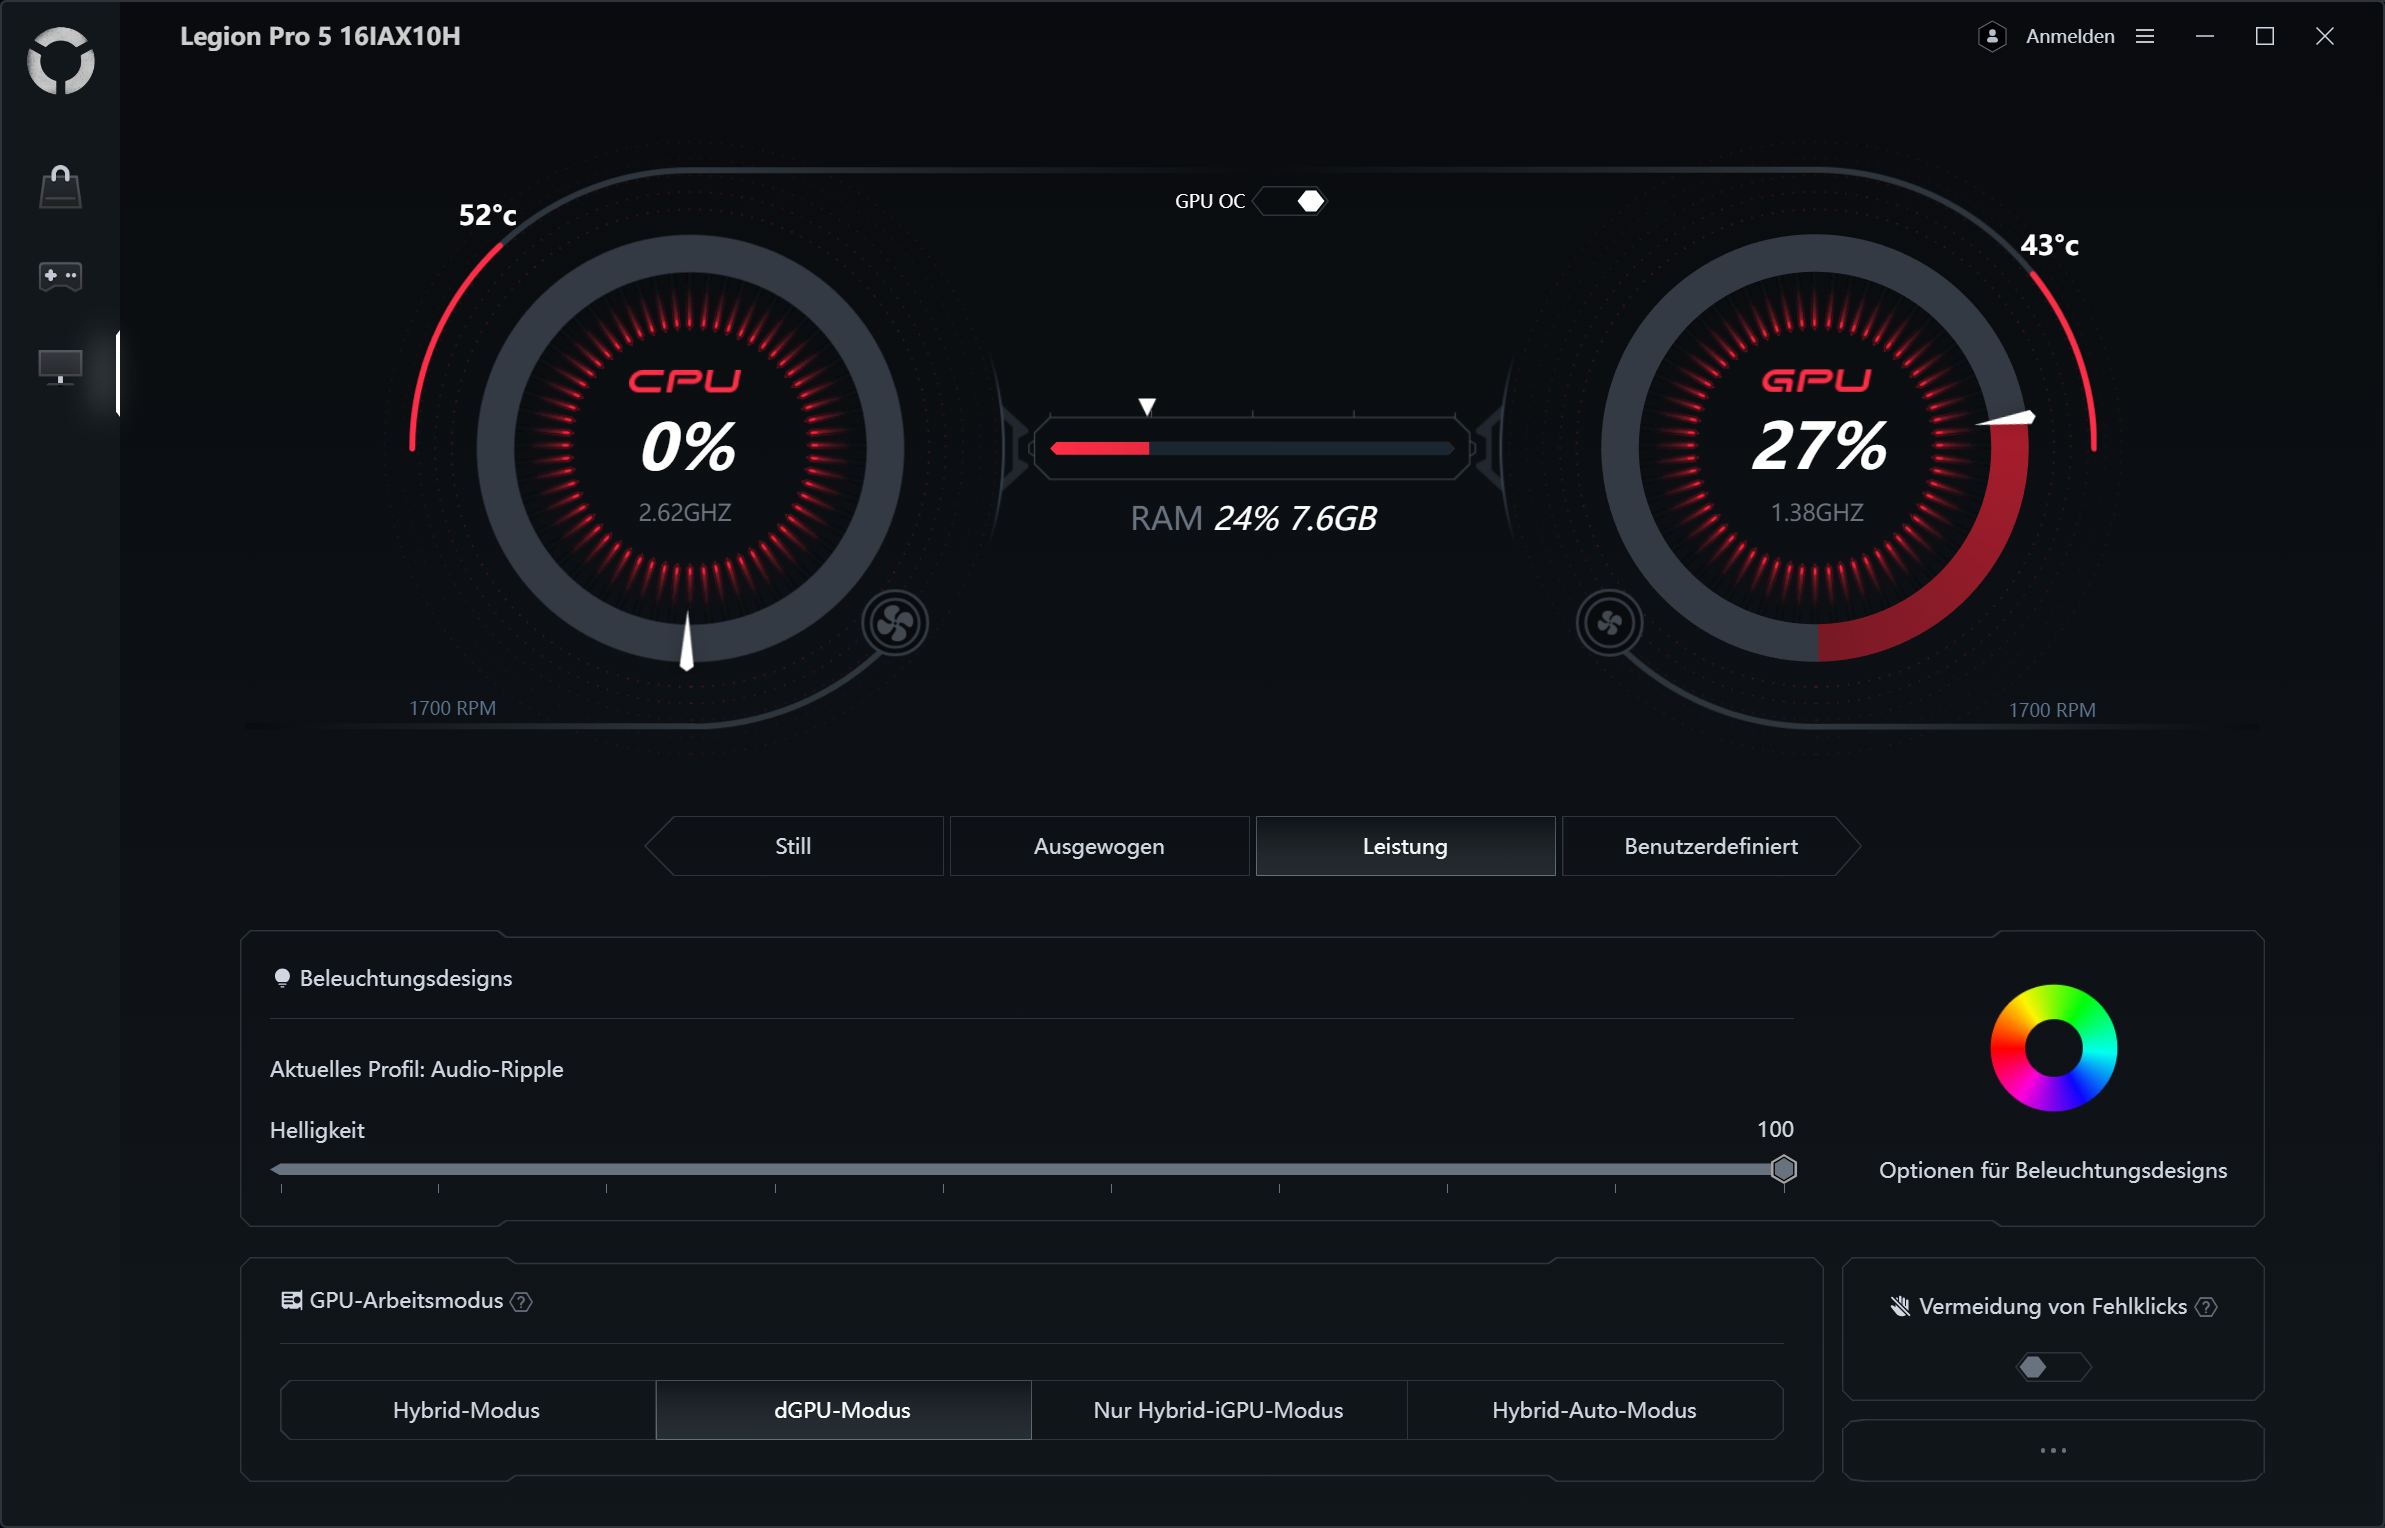
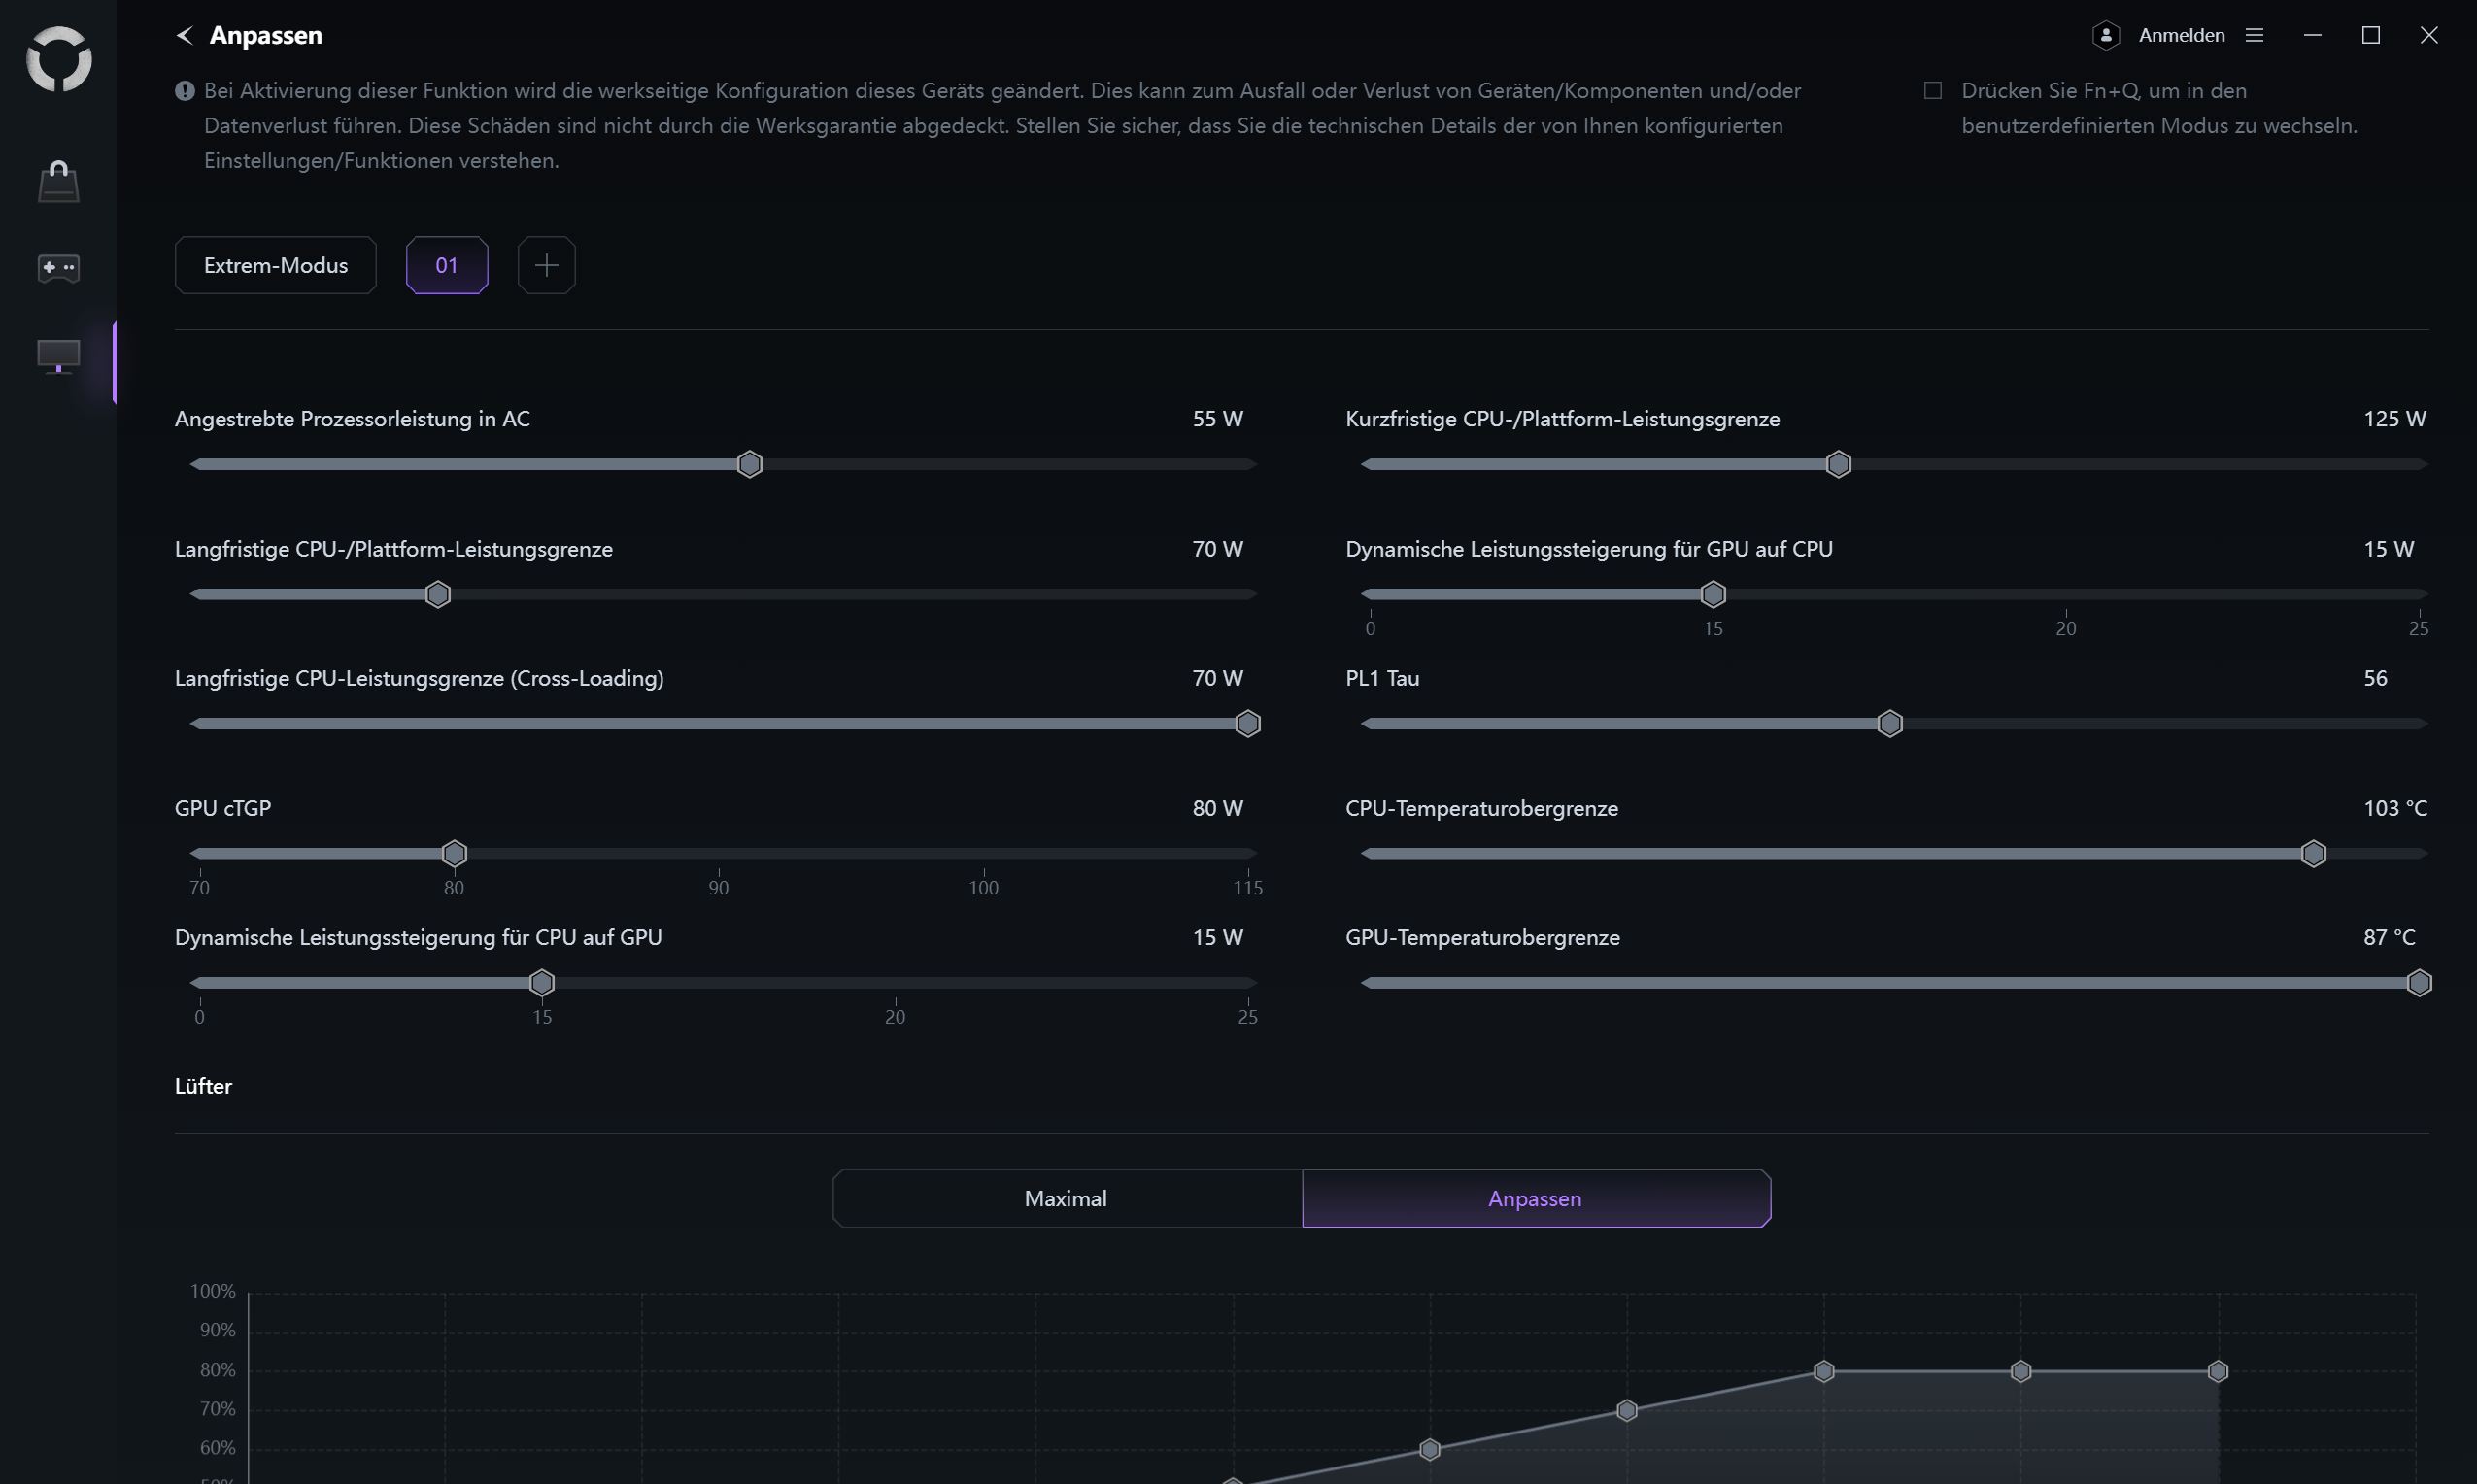
LegionSpace提供三种自动性能模式(安静、平衡、性能)和一种自定义模式,可以进行大量配置。一个方便之处是,你可以使用 fn + "Q" 在不同模式间切换。我们使用性能模式进行了基准测试。系统有一个 MUX 图形开关,需要重新启动。


| 能耗曲线 | CPU TDP | CB 15 Multi | CP 2077 FHD Ultra | 《刺客信条:阴影》FHD Ultra | 最大风扇音量 |
|---|---|---|---|---|---|
| 静音 | 65/35 瓦 | 4,076 点 | 90,6 fps | 43fps | 40.68 dB(A) |
| 平衡 | 130/70 瓦 | 5,141 分 | 103fps | 47fps | 46.37 dB(A) |
| 性能 | 185/125 瓦 | 5,885 点 | 132fps | 53fps | 56.72 dB(A) |
| 极限(用户定义) | 202/135 瓦 | 5,867 点 | 142fps | 50fps | 58.48 dB(A) |
| 电池(平衡) | 55/45 瓦 | 3,563 点 | 30fps | 30fps | 29 dB(A) |
处理器
Intel Core Ultra 9 275HX是一款高端移动 CPU。它有 24 个内核(8 个 P 内核和 16 个 E 内核),主频高达 5.4 GHz。它集成了一个具有 13 个 TOP 的小型 NPU 和一个具有 4 个 Xe 内核的 iGPU。
在 Cinebench R15 循环中,我们的Legion Pro 5 表现出了与 华硕 Scar Strix 16甚至 Neo 16 A25.然而,与 RTX 5090 竞争对手不同的是,其性能并没有保持稳定,在 5 到 6 次运行中总共下降了约 8%,达到了 XMG Pro 16.
在所有 CPU 测试中,Legion 仅位于华硕 Strix Scar 16(+1%)和 XMG Pro 16(-1%)之间。竞争对手之间的差距很小,速度最快的设备(Neo 16 E25)仅占 5% 的优势。
在远离电源插座时,无法选择性能模式,平衡模式处于激活状态。在 Cinebench R15 Multi 中,得分下降了约 37%。
Cinebench R15 Multi Continuous Test
Cinebench R23: Multi Core | Single Core
Cinebench R20: CPU (Multi Core) | CPU (Single Core)
Cinebench R15: CPU Multi 64Bit | CPU Single 64Bit
Blender: v2.79 BMW27 CPU
7-Zip 18.03: 7z b 4 | 7z b 4 -mmt1
Geekbench 6.7: Multi-Core | Single-Core
Geekbench 5.5: Multi-Core | Single-Core
HWBOT x265 Benchmark v2.2: 4k Preset
LibreOffice : 20 Documents To PDF
R Benchmark 2.5: Overall mean
| CPU Performance rating | |
| Schenker XMG Neo 16 E25 RTX 5090 Laptop | |
| Asus ROG Strix Scar 16 2025 | |
| Lenovo Legion 5 Pro 16IAX10H | |
| Schenker XMG Pro 16 (E25) | |
| Lenovo Legion Pro 7i 16 Gen 10 | |
| Aorus MASTER 16 AM6H | |
| Average Intel Core Ultra 9 275HX | |
| Lenovo Legion Pro 5 16IRX9 | |
| MSI Vector 16 HX AI A2XWHG | |
| Average of class Gaming | |
| Cinebench R23 / Multi Core | |
| Schenker XMG Neo 16 E25 RTX 5090 Laptop | |
| Asus ROG Strix Scar 16 2025 | |
| Lenovo Legion 5 Pro 16IAX10H | |
| Lenovo Legion Pro 7i 16 Gen 10 | |
| Schenker XMG Pro 16 (E25) | |
| Aorus MASTER 16 AM6H | |
| Average Intel Core Ultra 9 275HX (30712 - 40970, n=31) | |
| Lenovo Legion Pro 5 16IRX9 | |
| MSI Vector 16 HX AI A2XWHG | |
| Average of class Gaming (10488 - 40970, n=112, last 2 years) | |
| Cinebench R23 / Single Core | |
| Schenker XMG Neo 16 E25 RTX 5090 Laptop | |
| Lenovo Legion 5 Pro 16IAX10H | |
| Schenker XMG Pro 16 (E25) | |
| Aorus MASTER 16 AM6H | |
| Lenovo Legion Pro 7i 16 Gen 10 | |
| Average Intel Core Ultra 9 275HX (2009 - 2267, n=31) | |
| MSI Vector 16 HX AI A2XWHG | |
| Asus ROG Strix Scar 16 2025 | |
| Lenovo Legion Pro 5 16IRX9 | |
| Average of class Gaming (1166 - 2356, n=112, last 2 years) | |
| Cinebench R20 / CPU (Multi Core) | |
| Schenker XMG Neo 16 E25 RTX 5090 Laptop | |
| Asus ROG Strix Scar 16 2025 | |
| Lenovo Legion 5 Pro 16IAX10H | |
| Schenker XMG Pro 16 (E25) | |
| Aorus MASTER 16 AM6H | |
| Lenovo Legion Pro 7i 16 Gen 10 | |
| Average Intel Core Ultra 9 275HX (12026 - 16108, n=30) | |
| Lenovo Legion Pro 5 16IRX9 | |
| MSI Vector 16 HX AI A2XWHG | |
| Average of class Gaming (4029 - 16108, n=111, last 2 years) | |
| Cinebench R20 / CPU (Single Core) | |
| Schenker XMG Neo 16 E25 RTX 5090 Laptop | |
| Lenovo Legion 5 Pro 16IAX10H | |
| Schenker XMG Pro 16 (E25) | |
| Aorus MASTER 16 AM6H | |
| Average Intel Core Ultra 9 275HX (774 - 870, n=30) | |
| Asus ROG Strix Scar 16 2025 | |
| MSI Vector 16 HX AI A2XWHG | |
| Lenovo Legion Pro 7i 16 Gen 10 | |
| Lenovo Legion Pro 5 16IRX9 | |
| Average of class Gaming (442 - 895, n=111, last 2 years) | |
| Cinebench R15 / CPU Multi 64Bit | |
| Schenker XMG Neo 16 E25 RTX 5090 Laptop | |
| Asus ROG Strix Scar 16 2025 | |
| Lenovo Legion 5 Pro 16IAX10H | |
| Lenovo Legion Pro 7i 16 Gen 10 | |
| Aorus MASTER 16 AM6H | |
| Schenker XMG Pro 16 (E25) | |
| Average Intel Core Ultra 9 275HX (4737 - 6271, n=30) | |
| Lenovo Legion Pro 5 16IRX9 | |
| MSI Vector 16 HX AI A2XWHG | |
| Average of class Gaming (1578 - 6271, n=111, last 2 years) | |
| Cinebench R15 / CPU Single 64Bit | |
| Asus ROG Strix Scar 16 2025 | |
| Schenker XMG Neo 16 E25 RTX 5090 Laptop | |
| Lenovo Legion Pro 7i 16 Gen 10 | |
| Schenker XMG Pro 16 (E25) | |
| Lenovo Legion 5 Pro 16IAX10H | |
| Aorus MASTER 16 AM6H | |
| Average Intel Core Ultra 9 275HX (306 - 343, n=31) | |
| MSI Vector 16 HX AI A2XWHG | |
| Lenovo Legion Pro 5 16IRX9 | |
| Average of class Gaming (188.8 - 343, n=111, last 2 years) | |
| Blender / v2.79 BMW27 CPU | |
| Average of class Gaming (80 - 330, n=109, last 2 years) | |
| MSI Vector 16 HX AI A2XWHG | |
| Lenovo Legion Pro 5 16IRX9 | |
| Lenovo Legion 5 Pro 16IAX10H | |
| Average Intel Core Ultra 9 275HX (82 - 116, n=29) | |
| Aorus MASTER 16 AM6H | |
| Schenker XMG Pro 16 (E25) | |
| Lenovo Legion Pro 7i 16 Gen 10 | |
| Asus ROG Strix Scar 16 2025 | |
| Schenker XMG Neo 16 E25 RTX 5090 Laptop | |
| 7-Zip 18.03 / 7z b 4 | |
| Schenker XMG Neo 16 E25 RTX 5090 Laptop | |
| Asus ROG Strix Scar 16 2025 | |
| Lenovo Legion Pro 7i 16 Gen 10 | |
| Schenker XMG Pro 16 (E25) | |
| Lenovo Legion Pro 5 16IRX9 | |
| Average Intel Core Ultra 9 275HX (98236 - 124155, n=30) | |
| Lenovo Legion 5 Pro 16IAX10H | |
| Aorus MASTER 16 AM6H | |
| Average of class Gaming (33491 - 148086, n=110, last 2 years) | |
| MSI Vector 16 HX AI A2XWHG | |
| 7-Zip 18.03 / 7z b 4 -mmt1 | |
| Schenker XMG Neo 16 E25 RTX 5090 Laptop | |
| Schenker XMG Pro 16 (E25) | |
| Lenovo Legion Pro 5 16IRX9 | |
| Average Intel Core Ultra 9 275HX (6026 - 7149, n=30) | |
| Lenovo Legion 5 Pro 16IAX10H | |
| Aorus MASTER 16 AM6H | |
| Asus ROG Strix Scar 16 2025 | |
| Lenovo Legion Pro 7i 16 Gen 10 | |
| MSI Vector 16 HX AI A2XWHG | |
| Average of class Gaming (4199 - 7436, n=110, last 2 years) | |
| Geekbench 6.7 / Multi-Core | |
| Asus ROG Strix Scar 16 2025 | |
| Schenker XMG Neo 16 E25 RTX 5090 Laptop | |
| Schenker XMG Pro 16 (E25) | |
| Lenovo Legion 5 Pro 16IAX10H | |
| Average Intel Core Ultra 9 275HX (16033 - 21668, n=33) | |
| Aorus MASTER 16 AM6H | |
| Lenovo Legion Pro 7i 16 Gen 10 | |
| Lenovo Legion Pro 5 16IRX9 | |
| MSI Vector 16 HX AI A2XWHG | |
| Average of class Gaming (6625 - 22104, n=111, last 2 years) | |
| Geekbench 6.7 / Single-Core | |
| Schenker XMG Pro 16 (E25) | |
| Schenker XMG Neo 16 E25 RTX 5090 Laptop | |
| Lenovo Legion 5 Pro 16IAX10H | |
| Asus ROG Strix Scar 16 2025 | |
| Lenovo Legion Pro 7i 16 Gen 10 | |
| Aorus MASTER 16 AM6H | |
| Average Intel Core Ultra 9 275HX (2843 - 3160, n=33) | |
| MSI Vector 16 HX AI A2XWHG | |
| Lenovo Legion Pro 5 16IRX9 | |
| Average of class Gaming (1490 - 3259, n=111, last 2 years) | |
| Geekbench 5.5 / Multi-Core | |
| Schenker XMG Neo 16 E25 RTX 5090 Laptop | |
| Asus ROG Strix Scar 16 2025 | |
| Schenker XMG Pro 16 (E25) | |
| Average Intel Core Ultra 9 275HX (19105 - 25855, n=31) | |
| Lenovo Legion Pro 7i 16 Gen 10 | |
| Lenovo Legion 5 Pro 16IAX10H | |
| Aorus MASTER 16 AM6H | |
| Lenovo Legion Pro 5 16IRX9 | |
| MSI Vector 16 HX AI A2XWHG | |
| Average of class Gaming (6460 - 27010, n=110, last 2 years) | |
| Geekbench 5.5 / Single-Core | |
| Schenker XMG Neo 16 E25 RTX 5090 Laptop | |
| Schenker XMG Pro 16 (E25) | |
| Lenovo Legion 5 Pro 16IAX10H | |
| Asus ROG Strix Scar 16 2025 | |
| Aorus MASTER 16 AM6H | |
| Average Intel Core Ultra 9 275HX (2033 - 2292, n=31) | |
| Lenovo Legion Pro 7i 16 Gen 10 | |
| MSI Vector 16 HX AI A2XWHG | |
| Lenovo Legion Pro 5 16IRX9 | |
| Average of class Gaming (986 - 2474, n=110, last 2 years) | |
| HWBOT x265 Benchmark v2.2 / 4k Preset | |
| Schenker XMG Neo 16 E25 RTX 5090 Laptop | |
| Asus ROG Strix Scar 16 2025 | |
| Schenker XMG Pro 16 (E25) | |
| Lenovo Legion 5 Pro 16IAX10H | |
| Lenovo Legion Pro 7i 16 Gen 10 | |
| Average Intel Core Ultra 9 275HX (30.7 - 43.8, n=30) | |
| Aorus MASTER 16 AM6H | |
| MSI Vector 16 HX AI A2XWHG | |
| Lenovo Legion Pro 5 16IRX9 | |
| Average of class Gaming (11.5 - 44.3, n=110, last 2 years) | |
| LibreOffice / 20 Documents To PDF | |
| Average of class Gaming (19 - 88.8, n=110, last 2 years) | |
| Schenker XMG Pro 16 (E25) | |
| Average Intel Core Ultra 9 275HX (33.2 - 62.1, n=30) | |
| Lenovo Legion Pro 5 16IRX9 | |
| Schenker XMG Neo 16 E25 RTX 5090 Laptop | |
| Asus ROG Strix Scar 16 2025 | |
| Aorus MASTER 16 AM6H | |
| MSI Vector 16 HX AI A2XWHG | |
| Lenovo Legion Pro 7i 16 Gen 10 | |
| Lenovo Legion 5 Pro 16IAX10H | |
| R Benchmark 2.5 / Overall mean | |
| Average of class Gaming (0.3439 - 0.759, n=111, last 2 years) | |
| Aorus MASTER 16 AM6H | |
| MSI Vector 16 HX AI A2XWHG | |
| Average Intel Core Ultra 9 275HX (0.3943 - 0.4568, n=30) | |
| Asus ROG Strix Scar 16 2025 | |
| Lenovo Legion Pro 7i 16 Gen 10 | |
| Lenovo Legion 5 Pro 16IAX10H | |
| Schenker XMG Neo 16 E25 RTX 5090 Laptop | |
| Schenker XMG Pro 16 (E25) | |
| Lenovo Legion Pro 5 16IRX9 | |
* ... smaller is better
AIDA64: FP32 Ray-Trace | FPU Julia | CPU SHA3 | CPU Queen | FPU SinJulia | FPU Mandel | CPU AES | CPU ZLib | FP64 Ray-Trace | CPU PhotoWorxx
| Performance rating | |
| Schenker XMG Neo 16 A25 5090 | |
| Schenker XMG Neo 16 E25 RTX 5090 Laptop | |
| Asus ROG Strix Scar 16 2025 | |
| Aorus MASTER 16 AM6H | |
| Lenovo Legion 5 Pro 16IAX10H | |
| Average Intel Core Ultra 9 275HX | |
| Schenker XMG Pro 16 (E25) | |
| Lenovo Legion Pro 5 16IRX9 | |
| Average of class Gaming | |
| AIDA64 / FP32 Ray-Trace | |
| Schenker XMG Neo 16 A25 5090 | |
| Schenker XMG Neo 16 E25 RTX 5090 Laptop | |
| Asus ROG Strix Scar 16 2025 | |
| Aorus MASTER 16 AM6H | |
| Average Intel Core Ultra 9 275HX (28039 - 39895, n=30) | |
| Lenovo Legion 5 Pro 16IAX10H | |
| Schenker XMG Pro 16 (E25) | |
| Average of class Gaming (10227 - 85542, n=109, last 2 years) | |
| Lenovo Legion Pro 5 16IRX9 | |
| AIDA64 / FPU Julia | |
| Schenker XMG Neo 16 A25 5090 | |
| Schenker XMG Neo 16 E25 RTX 5090 Laptop | |
| Asus ROG Strix Scar 16 2025 | |
| Aorus MASTER 16 AM6H | |
| Lenovo Legion 5 Pro 16IAX10H | |
| Average Intel Core Ultra 9 275HX (140254 - 200744, n=30) | |
| Schenker XMG Pro 16 (E25) | |
| Average of class Gaming (51376 - 238426, n=109, last 2 years) | |
| Lenovo Legion Pro 5 16IRX9 | |
| AIDA64 / CPU SHA3 | |
| Schenker XMG Neo 16 E25 RTX 5090 Laptop | |
| Schenker XMG Neo 16 A25 5090 | |
| Asus ROG Strix Scar 16 2025 | |
| Aorus MASTER 16 AM6H | |
| Average Intel Core Ultra 9 275HX (6710 - 9817, n=30) | |
| Schenker XMG Pro 16 (E25) | |
| Lenovo Legion 5 Pro 16IAX10H | |
| Lenovo Legion Pro 5 16IRX9 | |
| Average of class Gaming (2180 - 9817, n=109, last 2 years) | |
| AIDA64 / CPU Queen | |
| Schenker XMG Neo 16 A25 5090 | |
| Lenovo Legion Pro 5 16IRX9 | |
| Schenker XMG Neo 16 E25 RTX 5090 Laptop | |
| Lenovo Legion 5 Pro 16IAX10H | |
| Asus ROG Strix Scar 16 2025 | |
| Aorus MASTER 16 AM6H | |
| Average Intel Core Ultra 9 275HX (113887 - 140937, n=30) | |
| Schenker XMG Pro 16 (E25) | |
| Average of class Gaming (49785 - 173351, n=100, last 2 years) | |
| AIDA64 / FPU SinJulia | |
| Schenker XMG Neo 16 A25 5090 | |
| Lenovo Legion Pro 5 16IRX9 | |
| Average of class Gaming (4424 - 33636, n=109, last 2 years) | |
| Schenker XMG Neo 16 E25 RTX 5090 Laptop | |
| Schenker XMG Pro 16 (E25) | |
| Asus ROG Strix Scar 16 2025 | |
| Lenovo Legion 5 Pro 16IAX10H | |
| Aorus MASTER 16 AM6H | |
| Average Intel Core Ultra 9 275HX (11172 - 14425, n=30) | |
| AIDA64 / FPU Mandel | |
| Schenker XMG Neo 16 A25 5090 | |
| Asus ROG Strix Scar 16 2025 | |
| Schenker XMG Neo 16 E25 RTX 5090 Laptop | |
| Aorus MASTER 16 AM6H | |
| Average Intel Core Ultra 9 275HX (72596 - 104508, n=30) | |
| Schenker XMG Pro 16 (E25) | |
| Lenovo Legion 5 Pro 16IAX10H | |
| Average of class Gaming (25115 - 128721, n=109, last 2 years) | |
| Lenovo Legion Pro 5 16IRX9 | |
| AIDA64 / CPU AES | |
| Schenker XMG Neo 16 A25 5090 | |
| Schenker XMG Neo 16 E25 RTX 5090 Laptop | |
| Asus ROG Strix Scar 16 2025 | |
| Lenovo Legion 5 Pro 16IAX10H | |
| Average Intel Core Ultra 9 275HX (105608 - 247074, n=30) | |
| Aorus MASTER 16 AM6H | |
| Schenker XMG Pro 16 (E25) | |
| Lenovo Legion Pro 5 16IRX9 | |
| Average of class Gaming (39258 - 247074, n=109, last 2 years) | |
| AIDA64 / CPU ZLib | |
| Schenker XMG Neo 16 A25 5090 | |
| Schenker XMG Neo 16 E25 RTX 5090 Laptop | |
| Asus ROG Strix Scar 16 2025 | |
| Lenovo Legion 5 Pro 16IAX10H | |
| Aorus MASTER 16 AM6H | |
| Average Intel Core Ultra 9 275HX (1582 - 2263, n=30) | |
| Schenker XMG Pro 16 (E25) | |
| Lenovo Legion Pro 5 16IRX9 | |
| Average of class Gaming (574 - 2531, n=109, last 2 years) | |
| AIDA64 / FP64 Ray-Trace | |
| Schenker XMG Neo 16 A25 5090 | |
| Asus ROG Strix Scar 16 2025 | |
| Schenker XMG Neo 16 E25 RTX 5090 Laptop | |
| Aorus MASTER 16 AM6H | |
| Average Intel Core Ultra 9 275HX (14847 - 21854, n=30) | |
| Lenovo Legion 5 Pro 16IAX10H | |
| Schenker XMG Pro 16 (E25) | |
| Average of class Gaming (5509 - 45446, n=109, last 2 years) | |
| Lenovo Legion Pro 5 16IRX9 | |
| AIDA64 / CPU PhotoWorxx | |
| Asus ROG Strix Scar 16 2025 | |
| Schenker XMG Neo 16 E25 RTX 5090 Laptop | |
| Schenker XMG Pro 16 (E25) | |
| Average Intel Core Ultra 9 275HX (37482 - 62916, n=30) | |
| Lenovo Legion Pro 5 16IRX9 | |
| Lenovo Legion 5 Pro 16IAX10H | |
| Aorus MASTER 16 AM6H | |
| Average of class Gaming (12271 - 89891, n=109, last 2 years) | |
| Schenker XMG Neo 16 A25 5090 | |
系统性能
在 PCMark 10 和 CrossMark 中,与竞争对手的差距可以忽略不计。良好的 CrossMark 成绩弥补了在 PCMark 10 中的微弱劣势,使我们的Legion Pro 甚至在整体上遥遥领先。
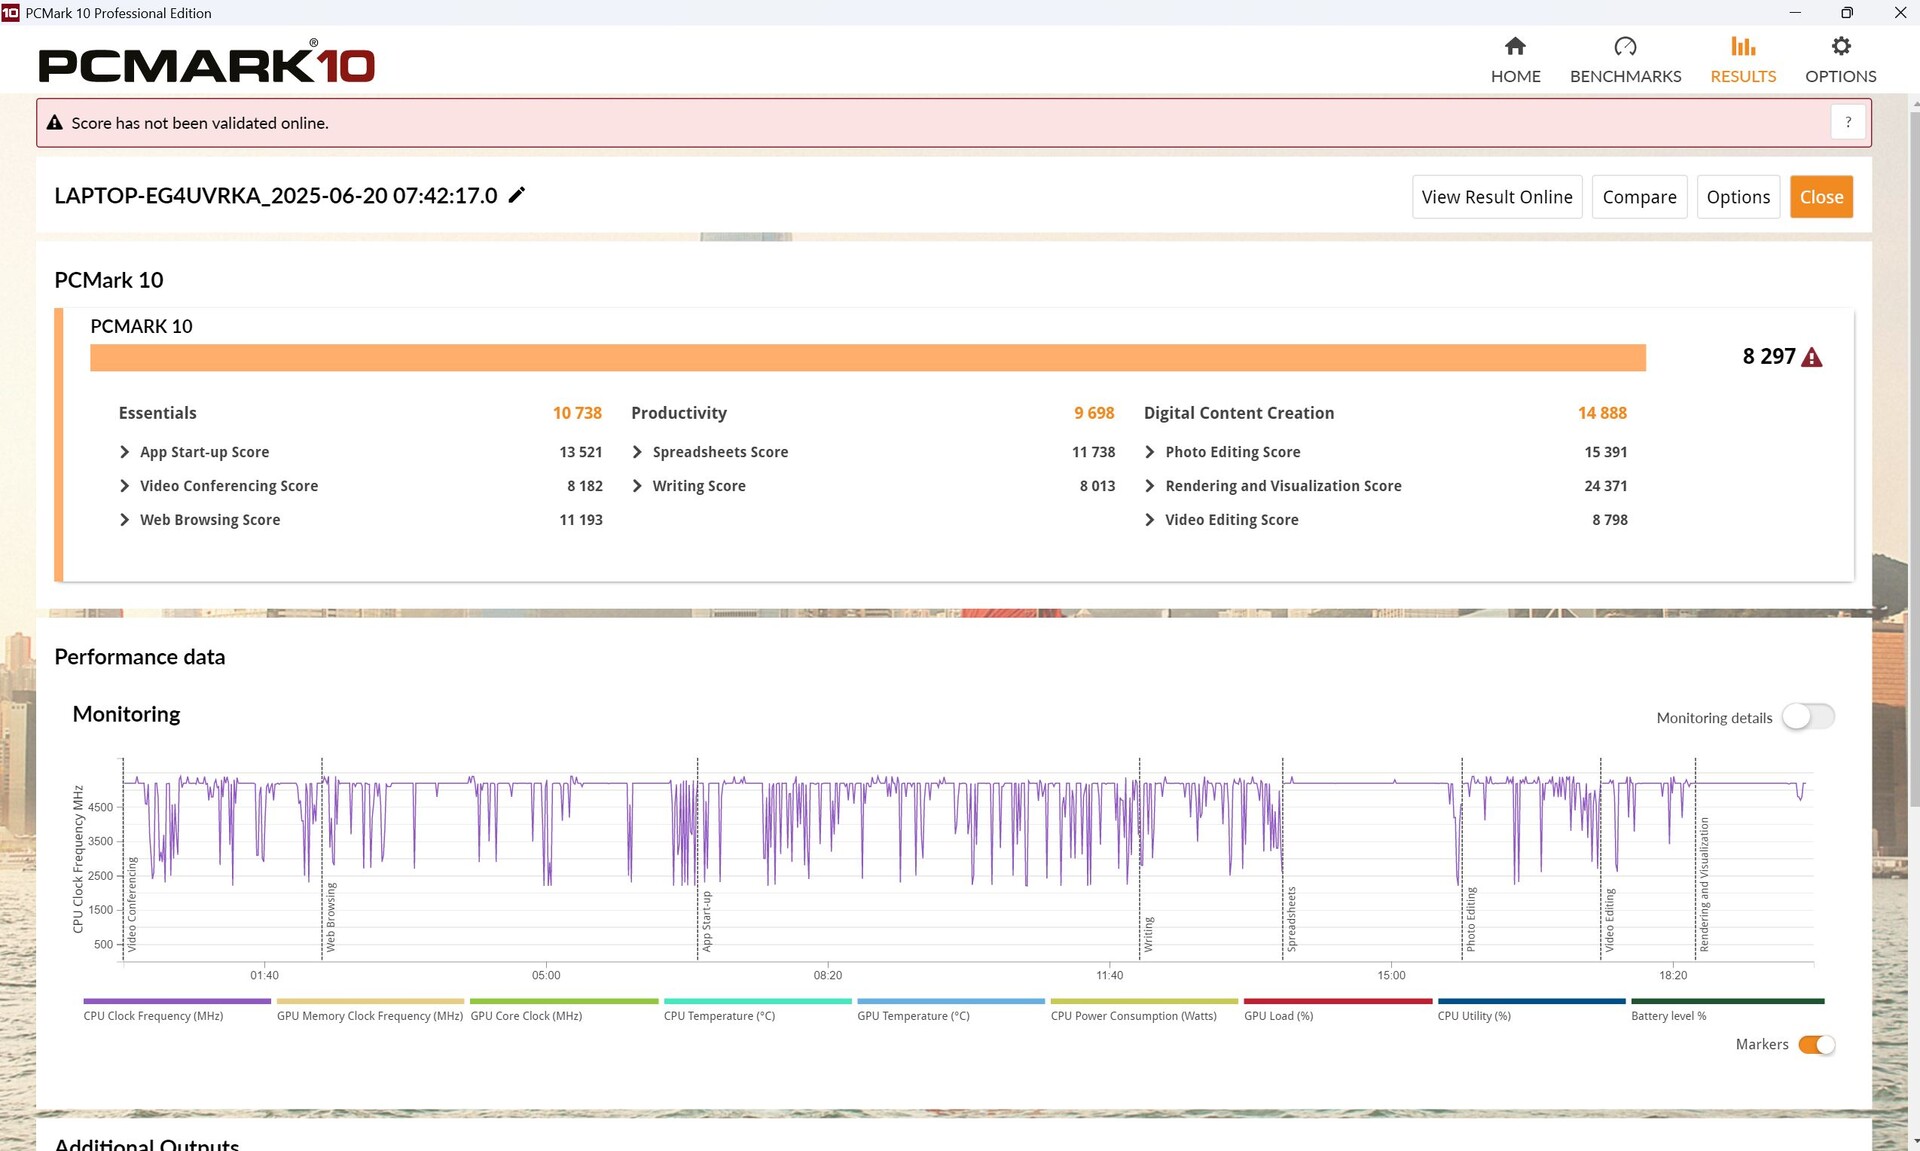
PCMark 10: Score | Essentials | Productivity | Digital Content Creation
CrossMark: Overall | Productivity | Creativity | Responsiveness
WebXPRT 3: Overall
WebXPRT 4: Overall
Mozilla Kraken 1.1: Total
| Performance rating | |
| Lenovo Legion 5 Pro 16IAX10H | |
| Schenker XMG Pro 16 (E25) | |
| Average Intel Core Ultra 9 275HX, NVIDIA GeForce RTX 5070 Ti Laptop | |
| Lenovo Legion Pro 5 16IRX9 | |
| Medion Erazer Major 16 X1 MD62736 | |
| Average of class Gaming | |
| MSI Vector 16 HX AI A2XWHG | |
| PCMark 10 / Score | |
| Lenovo Legion Pro 5 16IRX9 | |
| Schenker XMG Pro 16 (E25) | |
| Average Intel Core Ultra 9 275HX, NVIDIA GeForce RTX 5070 Ti Laptop (8297 - 8550, n=3) | |
| Average of class Gaming (5828 - 11574, n=95, last 2 years) | |
| Lenovo Legion 5 Pro 16IAX10H | |
| Medion Erazer Major 16 X1 MD62736 | |
| MSI Vector 16 HX AI A2XWHG | |
| PCMark 10 / Essentials | |
| Schenker XMG Pro 16 (E25) | |
| Lenovo Legion Pro 5 16IRX9 | |
| Average Intel Core Ultra 9 275HX, NVIDIA GeForce RTX 5070 Ti Laptop (10738 - 11290, n=3) | |
| Medion Erazer Major 16 X1 MD62736 | |
| Lenovo Legion 5 Pro 16IAX10H | |
| MSI Vector 16 HX AI A2XWHG | |
| Average of class Gaming (8810 - 12600, n=99, last 2 years) | |
| PCMark 10 / Productivity | |
| Average of class Gaming (6845 - 18766, n=97, last 2 years) | |
| Lenovo Legion Pro 5 16IRX9 | |
| Lenovo Legion 5 Pro 16IAX10H | |
| Average Intel Core Ultra 9 275HX, NVIDIA GeForce RTX 5070 Ti Laptop (9591 - 9771, n=3) | |
| Schenker XMG Pro 16 (E25) | |
| MSI Vector 16 HX AI A2XWHG | |
| Medion Erazer Major 16 X1 MD62736 | |
| PCMark 10 / Digital Content Creation | |
| Schenker XMG Pro 16 (E25) | |
| Average Intel Core Ultra 9 275HX, NVIDIA GeForce RTX 5070 Ti Laptop (14812 - 15662, n=3) | |
| Lenovo Legion 5 Pro 16IAX10H | |
| Lenovo Legion Pro 5 16IRX9 | |
| Average of class Gaming (7602 - 19657, n=97, last 2 years) | |
| Medion Erazer Major 16 X1 MD62736 | |
| MSI Vector 16 HX AI A2XWHG | |
| CrossMark / Overall | |
| Schenker XMG Pro 16 (E25) | |
| Lenovo Legion 5 Pro 16IAX10H | |
| Average Intel Core Ultra 9 275HX, NVIDIA GeForce RTX 5070 Ti Laptop (2116 - 2193, n=3) | |
| Medion Erazer Major 16 X1 MD62736 | |
| Lenovo Legion Pro 5 16IRX9 | |
| Average of class Gaming (1366 - 2409, n=97, last 2 years) | |
| MSI Vector 16 HX AI A2XWHG | |
| CrossMark / Productivity | |
| Lenovo Legion 5 Pro 16IAX10H | |
| Schenker XMG Pro 16 (E25) | |
| Average Intel Core Ultra 9 275HX, NVIDIA GeForce RTX 5070 Ti Laptop (1967 - 2038, n=3) | |
| Medion Erazer Major 16 X1 MD62736 | |
| Average of class Gaming (1386 - 2254, n=97, last 2 years) | |
| MSI Vector 16 HX AI A2XWHG | |
| Lenovo Legion Pro 5 16IRX9 | |
| CrossMark / Creativity | |
| Schenker XMG Pro 16 (E25) | |
| Average Intel Core Ultra 9 275HX, NVIDIA GeForce RTX 5070 Ti Laptop (2430 - 2531, n=3) | |
| Lenovo Legion 5 Pro 16IAX10H | |
| Medion Erazer Major 16 X1 MD62736 | |
| Lenovo Legion Pro 5 16IRX9 | |
| MSI Vector 16 HX AI A2XWHG | |
| Average of class Gaming (1343 - 2729, n=97, last 2 years) | |
| CrossMark / Responsiveness | |
| Lenovo Legion 5 Pro 16IAX10H | |
| Schenker XMG Pro 16 (E25) | |
| Average Intel Core Ultra 9 275HX, NVIDIA GeForce RTX 5070 Ti Laptop (1740 - 1844, n=3) | |
| Lenovo Legion Pro 5 16IRX9 | |
| Medion Erazer Major 16 X1 MD62736 | |
| Average of class Gaming (1226 - 2334, n=97, last 2 years) | |
| MSI Vector 16 HX AI A2XWHG | |
| WebXPRT 3 / Overall | |
| Lenovo Legion 5 Pro 16IAX10H | |
| Average Intel Core Ultra 9 275HX, NVIDIA GeForce RTX 5070 Ti Laptop (328 - 532, n=3) | |
| Schenker XMG Pro 16 (E25) | |
| Medion Erazer Major 16 X1 MD62736 | |
| Lenovo Legion Pro 5 16IRX9 | |
| MSI Vector 16 HX AI A2XWHG | |
| Average of class Gaming (242 - 532, n=100, last 2 years) | |
| WebXPRT 4 / Overall | |
| Schenker XMG Pro 16 (E25) | |
| Lenovo Legion 5 Pro 16IAX10H | |
| Average Intel Core Ultra 9 275HX, NVIDIA GeForce RTX 5070 Ti Laptop (306 - 341, n=3) | |
| Medion Erazer Major 16 X1 MD62736 | |
| MSI Vector 16 HX AI A2XWHG | |
| Lenovo Legion Pro 5 16IRX9 | |
| Average of class Gaming (176.4 - 354, n=100, last 2 years) | |
| Mozilla Kraken 1.1 / Total | |
| Average of class Gaming (391 - 590, n=105, last 2 years) | |
| Lenovo Legion Pro 5 16IRX9 | |
| MSI Vector 16 HX AI A2XWHG | |
| Medion Erazer Major 16 X1 MD62736 | |
| Lenovo Legion 5 Pro 16IAX10H | |
| Average Intel Core Ultra 9 275HX, NVIDIA GeForce RTX 5070 Ti Laptop (405 - 414, n=3) | |
| Schenker XMG Pro 16 (E25) | |
* ... smaller is better
| PCMark 10 Score | 8297 points | |
Help | ||
| AIDA64 / Memory Copy | |
| Schenker XMG Pro 16 (E25) | |
| Average Intel Core Ultra 9 275HX (56003 - 94460, n=30) | |
| Lenovo Legion Pro 5 16IRX9 | |
| Lenovo Legion 5 Pro 16IAX10H | |
| Medion Erazer Major 16 X1 MD62736 | |
| Average of class Gaming (21750 - 129946, n=109, last 2 years) | |
| MSI Vector 16 HX AI A2XWHG | |
| AIDA64 / Memory Read | |
| Schenker XMG Pro 16 (E25) | |
| Lenovo Legion 5 Pro 16IAX10H | |
| Lenovo Legion Pro 5 16IRX9 | |
| Medion Erazer Major 16 X1 MD62736 | |
| Average Intel Core Ultra 9 275HX (55795 - 97151, n=30) | |
| MSI Vector 16 HX AI A2XWHG | |
| Average of class Gaming (22956 - 118858, n=109, last 2 years) | |
| AIDA64 / Memory Write | |
| Medion Erazer Major 16 X1 MD62736 | |
| Schenker XMG Pro 16 (E25) | |
| Average Intel Core Ultra 9 275HX (55663 - 116129, n=30) | |
| Lenovo Legion 5 Pro 16IAX10H | |
| Lenovo Legion Pro 5 16IRX9 | |
| Average of class Gaming (22297 - 135096, n=109, last 2 years) | |
| MSI Vector 16 HX AI A2XWHG | |
| AIDA64 / Memory Latency | |
| Average Intel Core Ultra 9 275HX (105.8 - 161.6, n=30) | |
| Lenovo Legion 5 Pro 16IAX10H | |
| Medion Erazer Major 16 X1 MD62736 | |
| MSI Vector 16 HX AI A2XWHG | |
| Average of class Gaming (75.3 - 259, n=109, last 2 years) | |
| Schenker XMG Pro 16 (E25) | |
| Lenovo Legion Pro 5 16IRX9 | |
* ... smaller is better
DPC 延迟
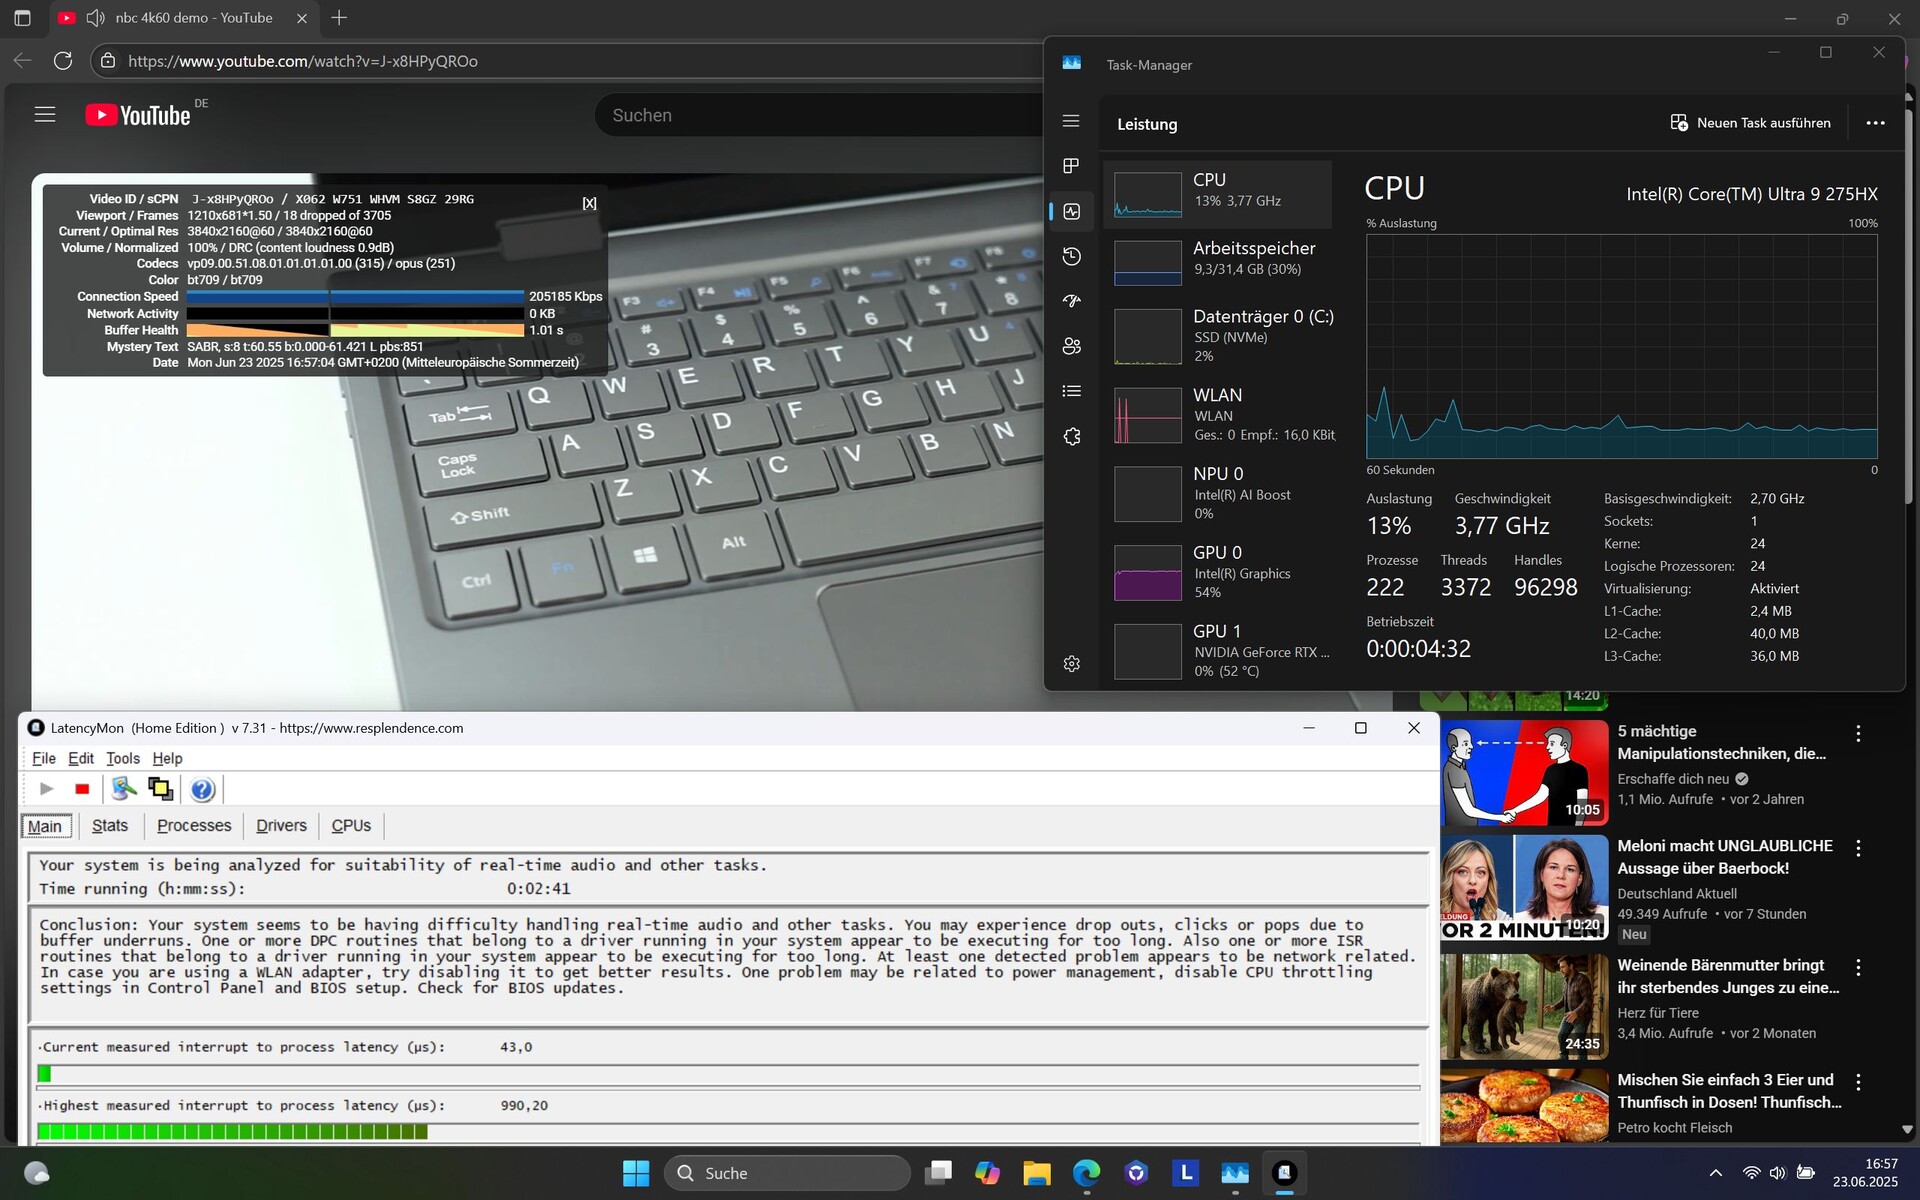
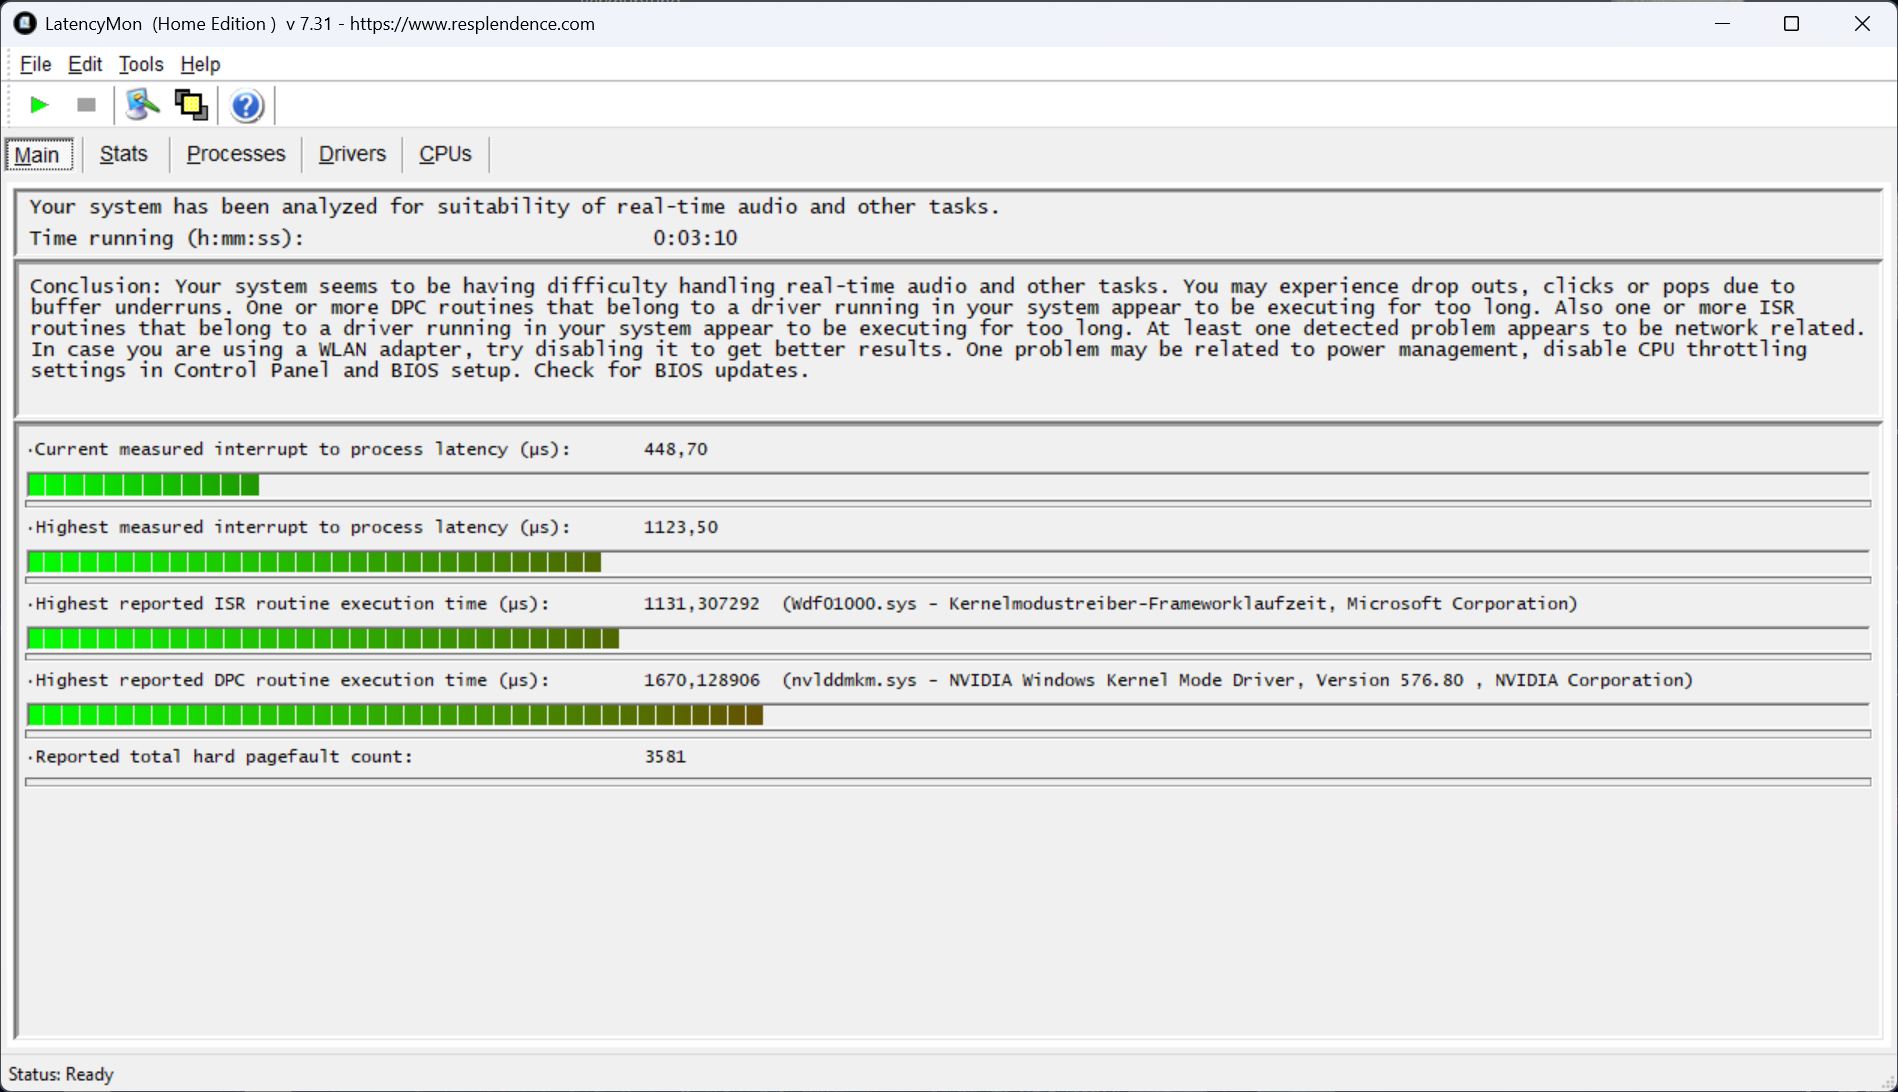
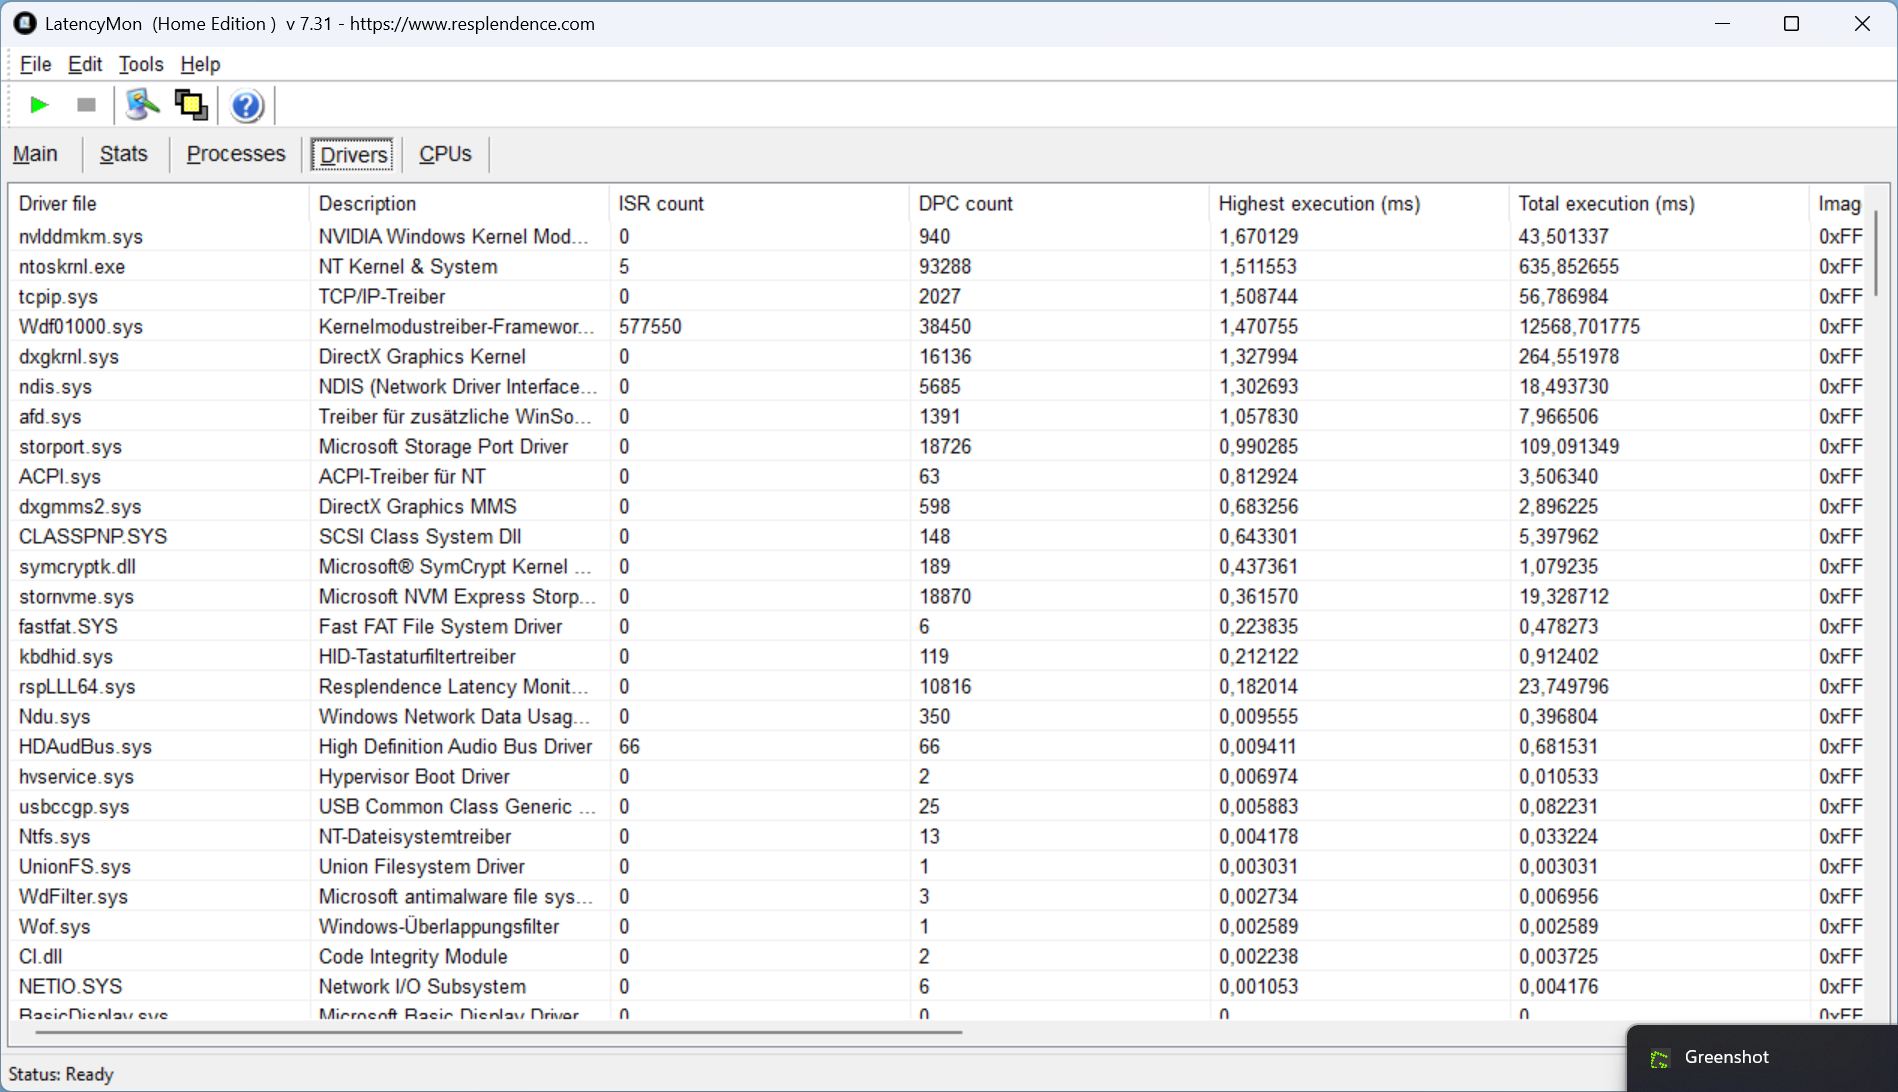
LatencyMon 在启动时检测到了初始延迟,而在启动浏览器、打开多个标签页和运行 Prime95 时,延迟则有所增加。遗憾的是,我们的 4K/60fps 测试视频也未能无丢帧(18 帧)播放。
不过,总体而言,延迟值相对较低,而竞争对手的延迟值甚至更高。不过,对于内容创作者来说,丢帧可能是一个不利因素。
| DPC Latencies / LatencyMon - interrupt to process latency (max), Web, Youtube, Prime95 | |
| MSI Vector 16 HX AI A2XWHG | |
| Medion Erazer Major 16 X1 MD62736 | |
| Schenker XMG Pro 16 (E25) | |
| Lenovo Legion 5 Pro 16IAX10H | |
| Lenovo Legion Pro 5 16IRX9 | |
* ... smaller is better
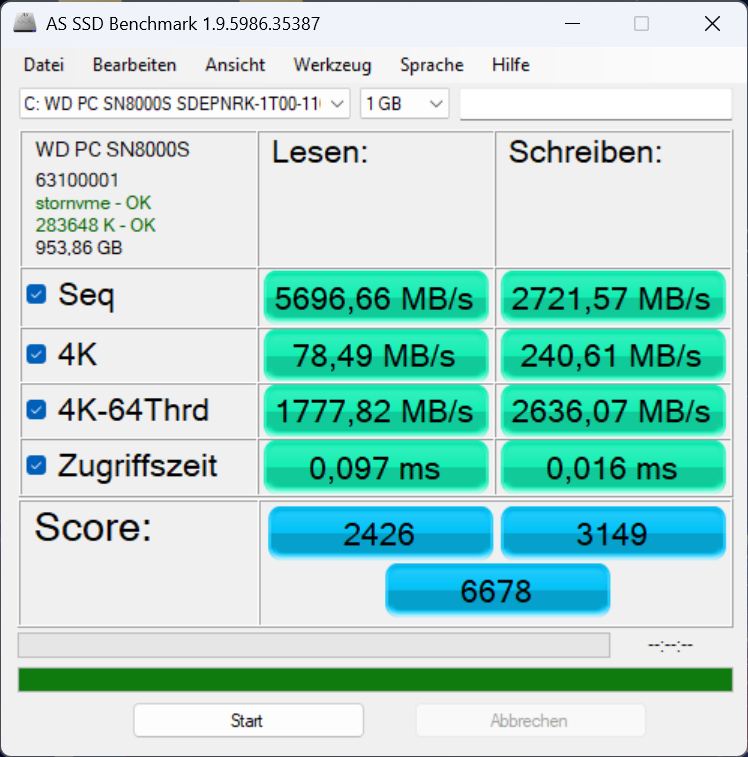
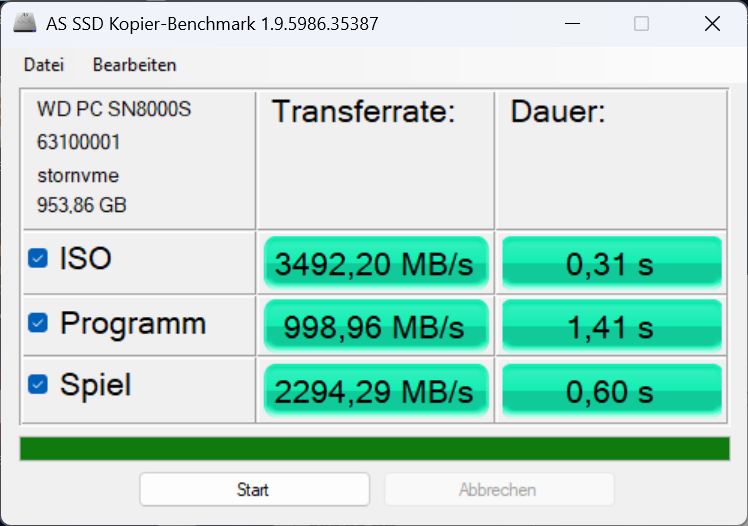
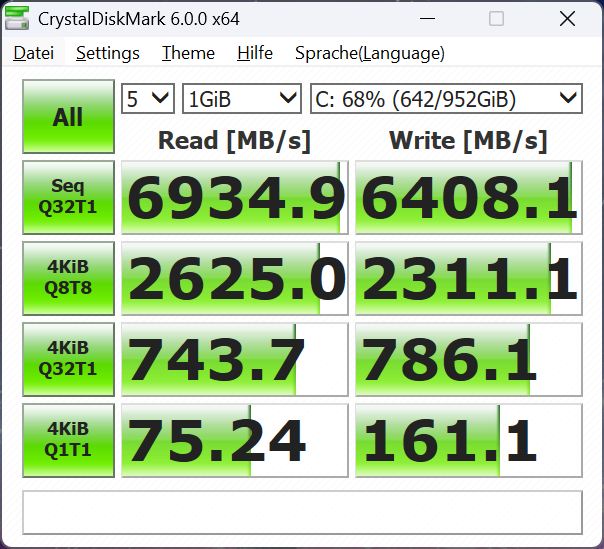
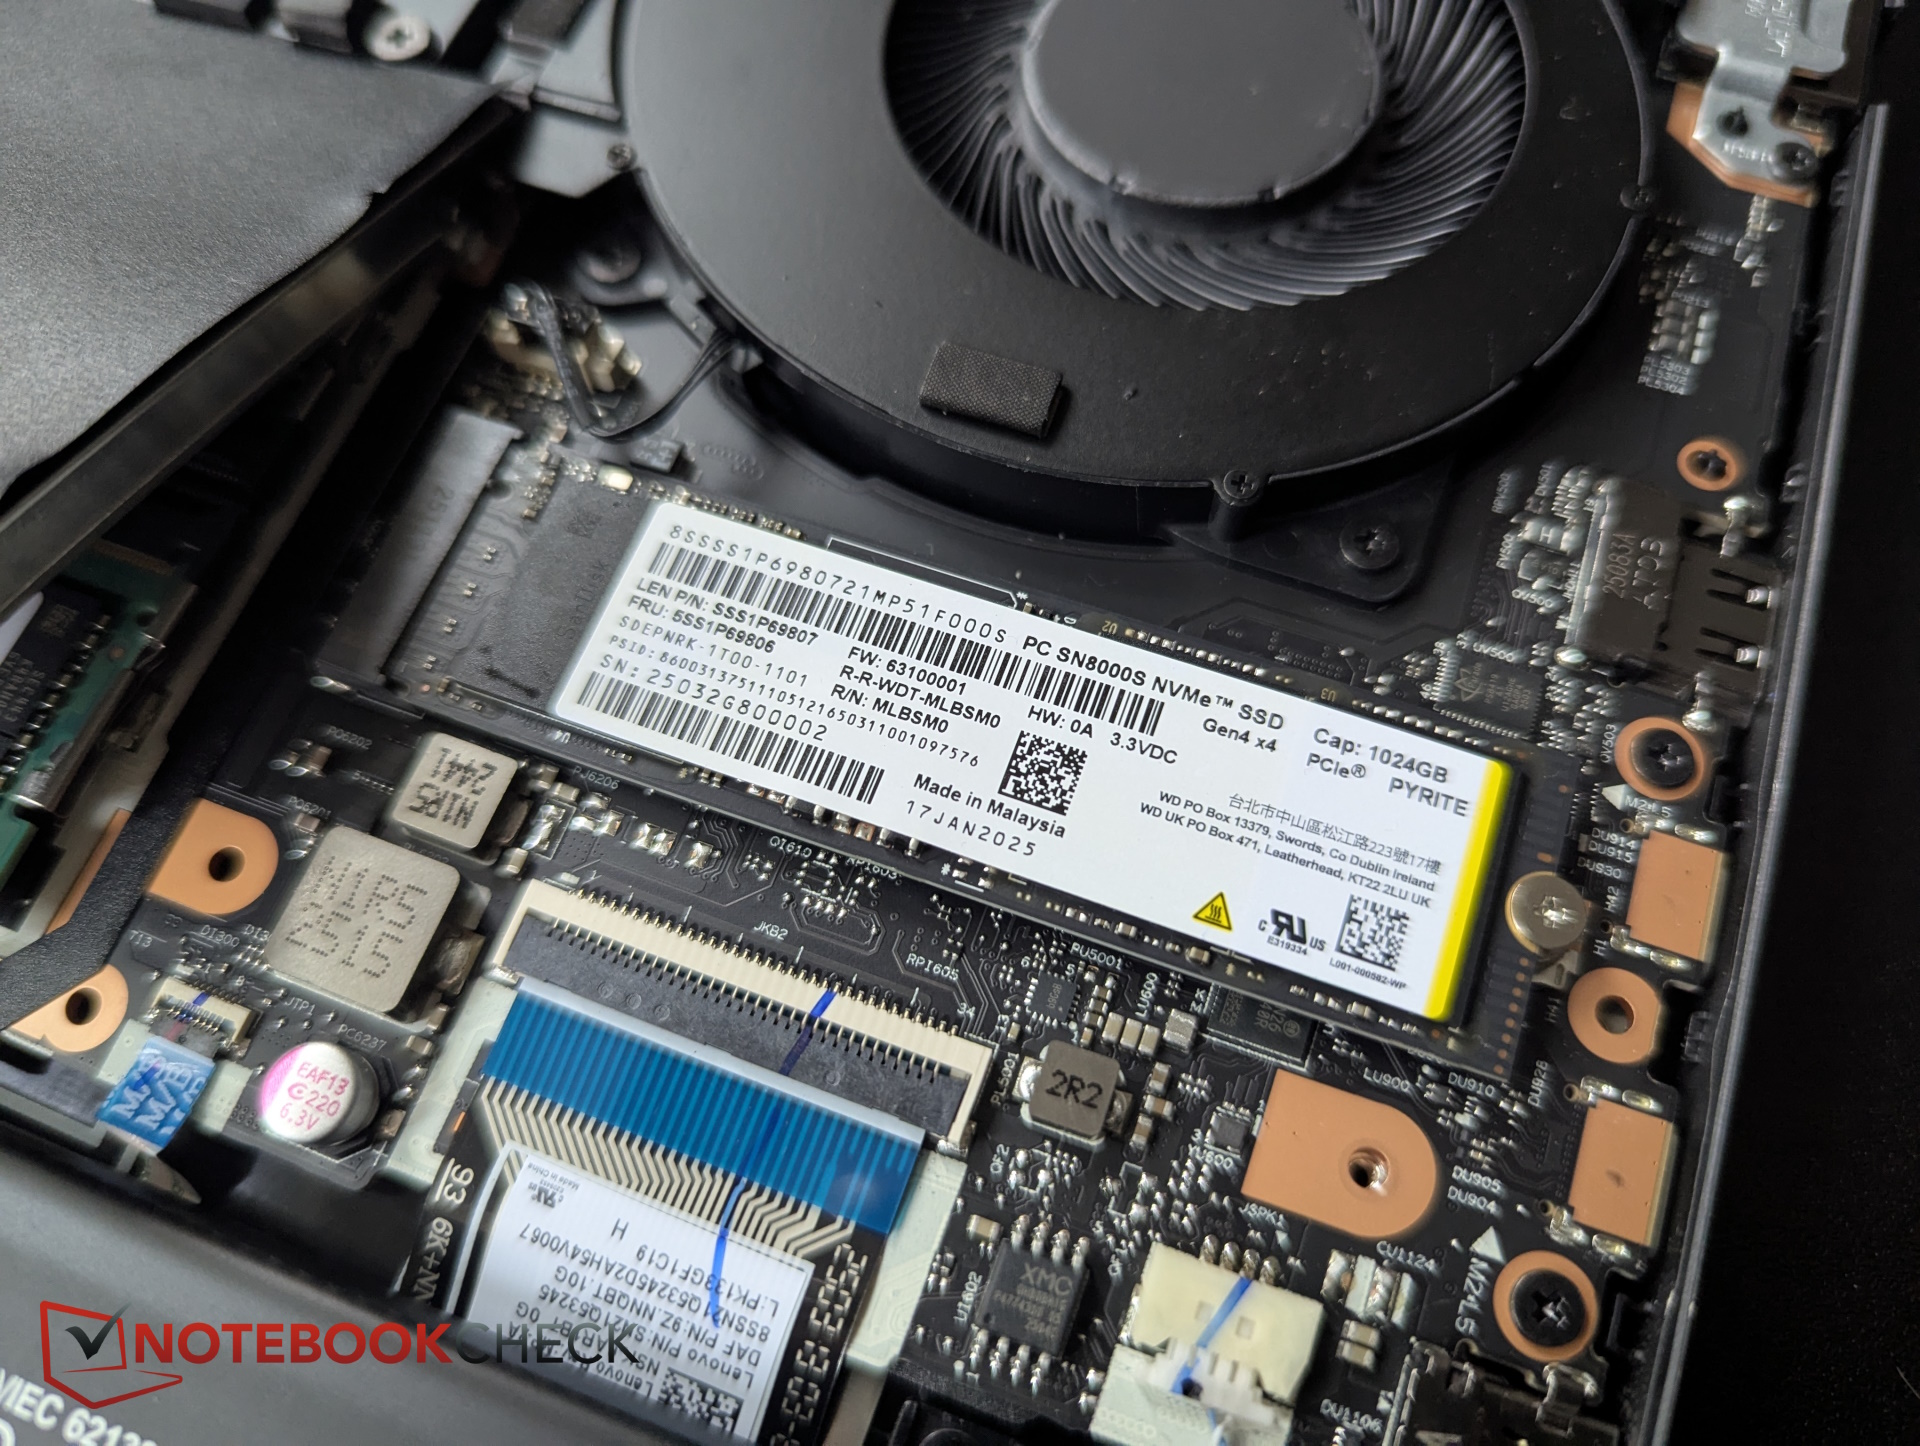
大容量存储器
有两个 M.2 固态硬盘插槽,但只有主插槽通过 PCIe 5.0 x4 连接,而空闲的第二个插槽则通过 PCIe 4.0 x4 连接。1 TB Western Digital 存储设备的传输速度还算不错,尽管不是最快的型号之一。与前代产品在我们的耐久性测试中,这款固态硬盘并没有出现节流现象。

* ... smaller is better
Continuous Performance Read: DiskSpd Read Loop, Queue Depth 8
图形处理器性能
......(英文 RTX 5070 Ti 源自 Blackwell 系列,支持多帧生成,配备 12 GB GDDR7(192 位内存总线)。
在 3DMark 测试中,它的性能比配备相同 GPU 的普通笔记本电脑高出约 5%,以微弱优势从直接竞争对手手中抢走了性能桂冠。Alienware 16 Area 51配备了 RTX 5080性能要高出约 9%。
如果Legion Pro 没有连接到电源,那么在Fire Strike 中会损失高达 85% 的 3D 性能!
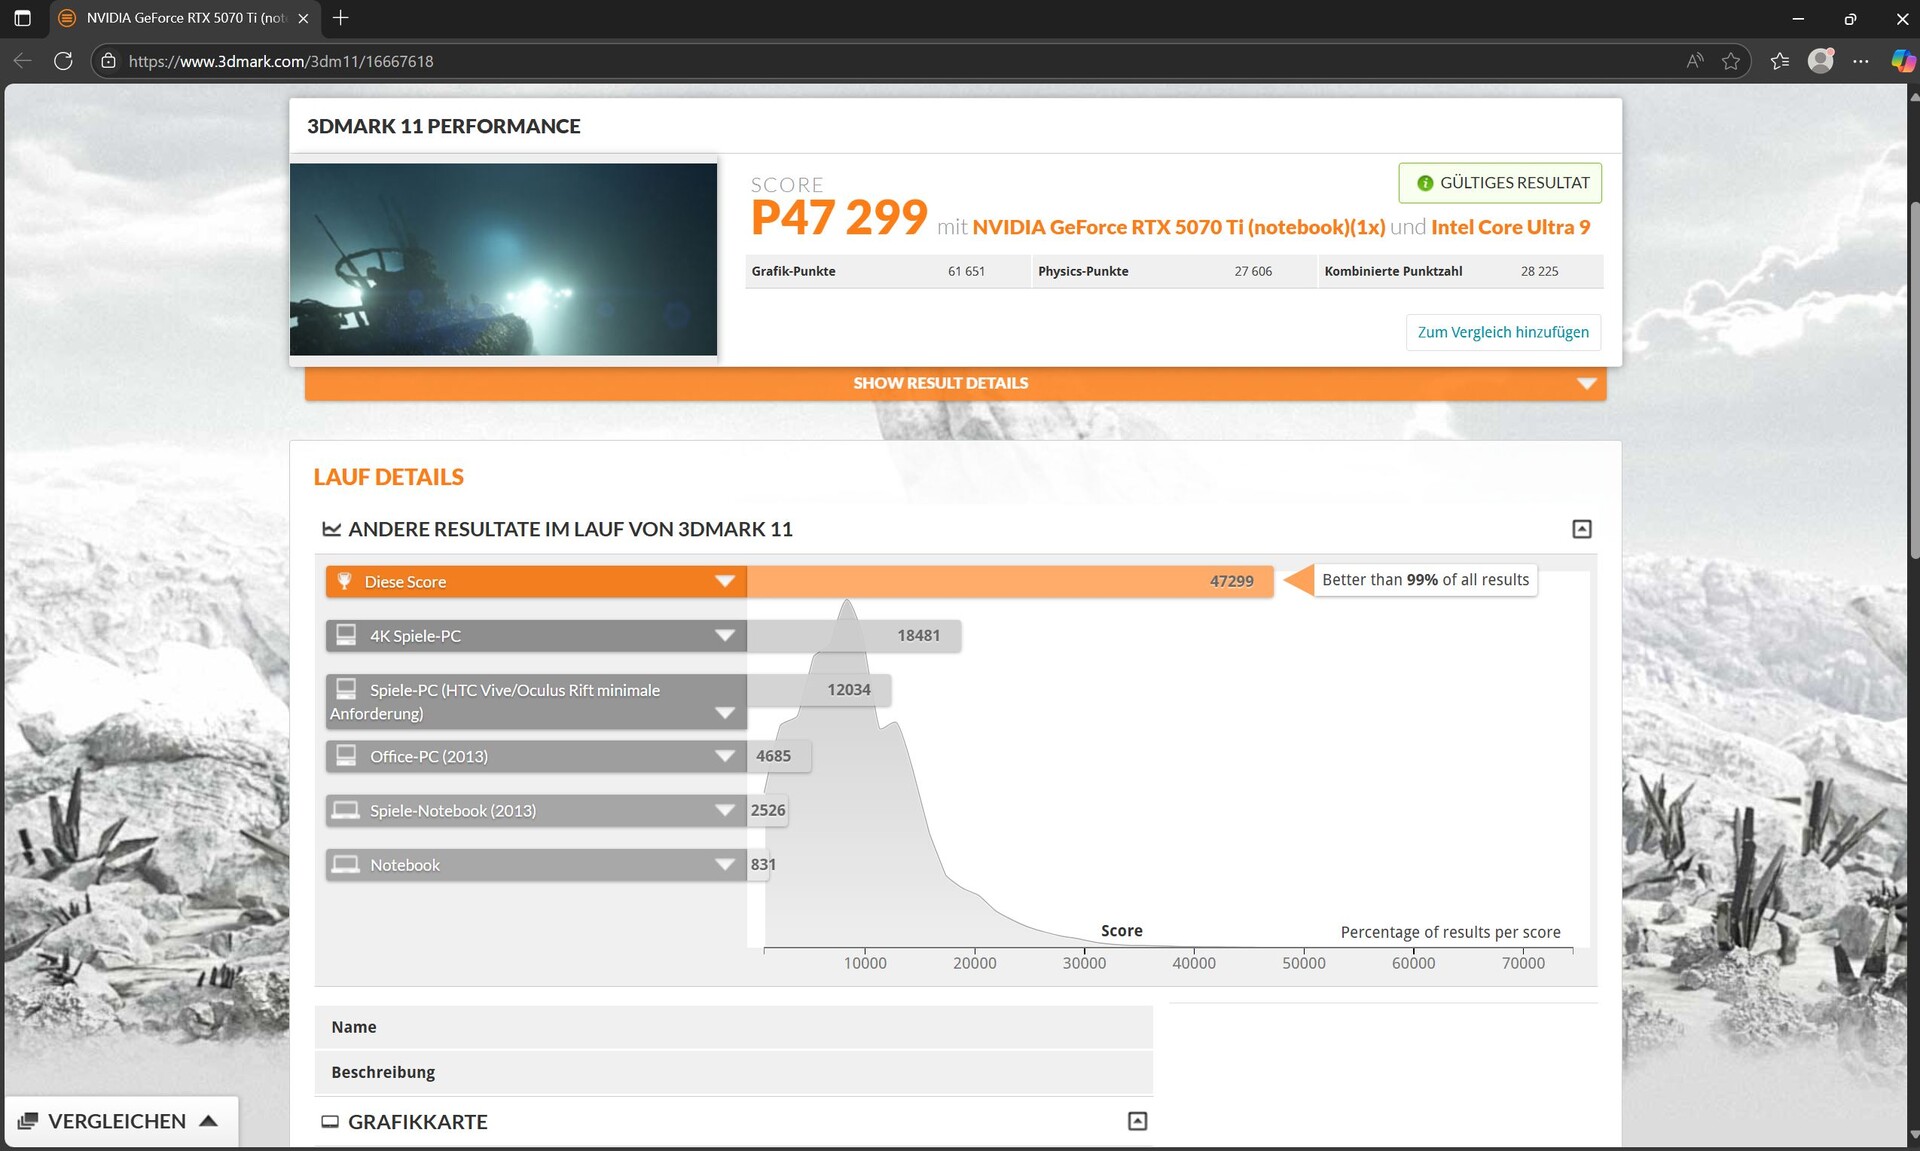
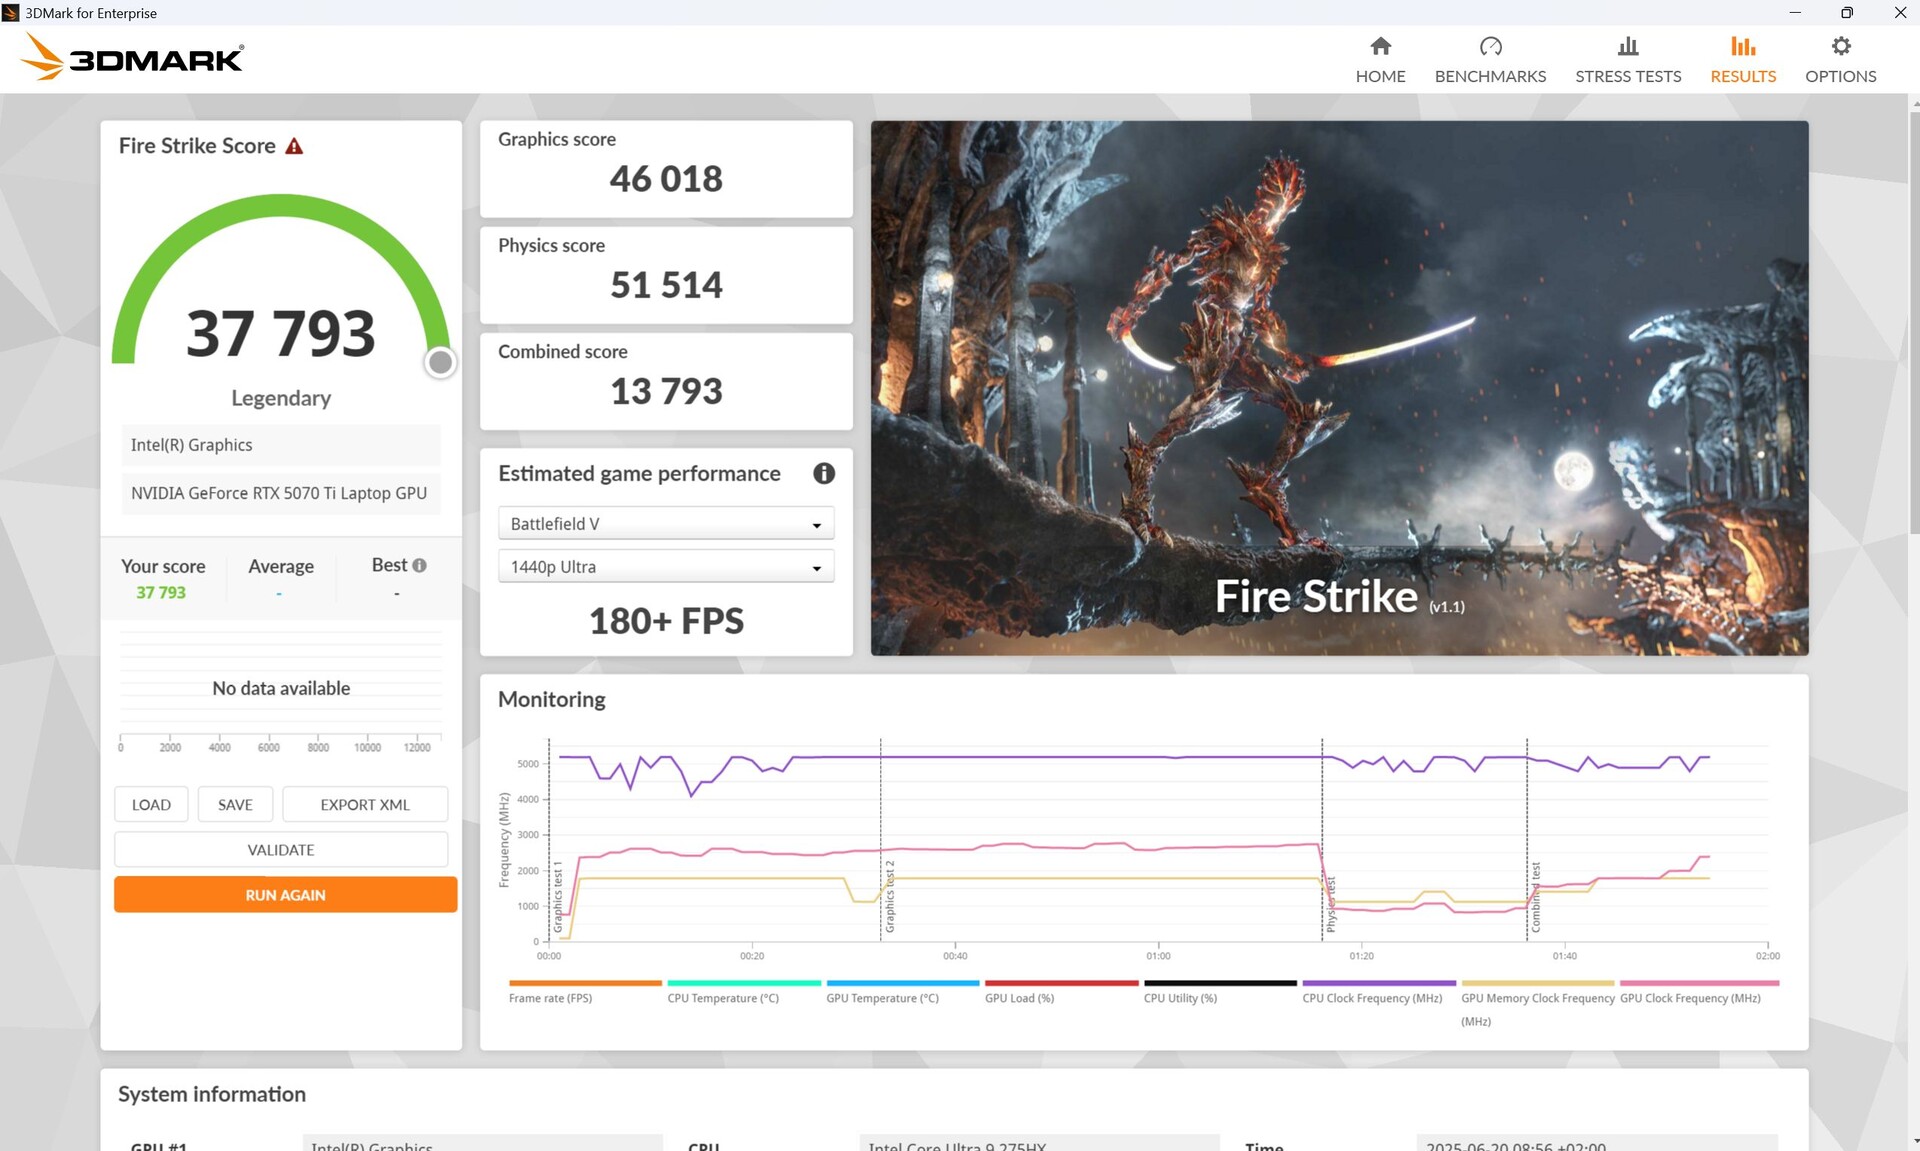
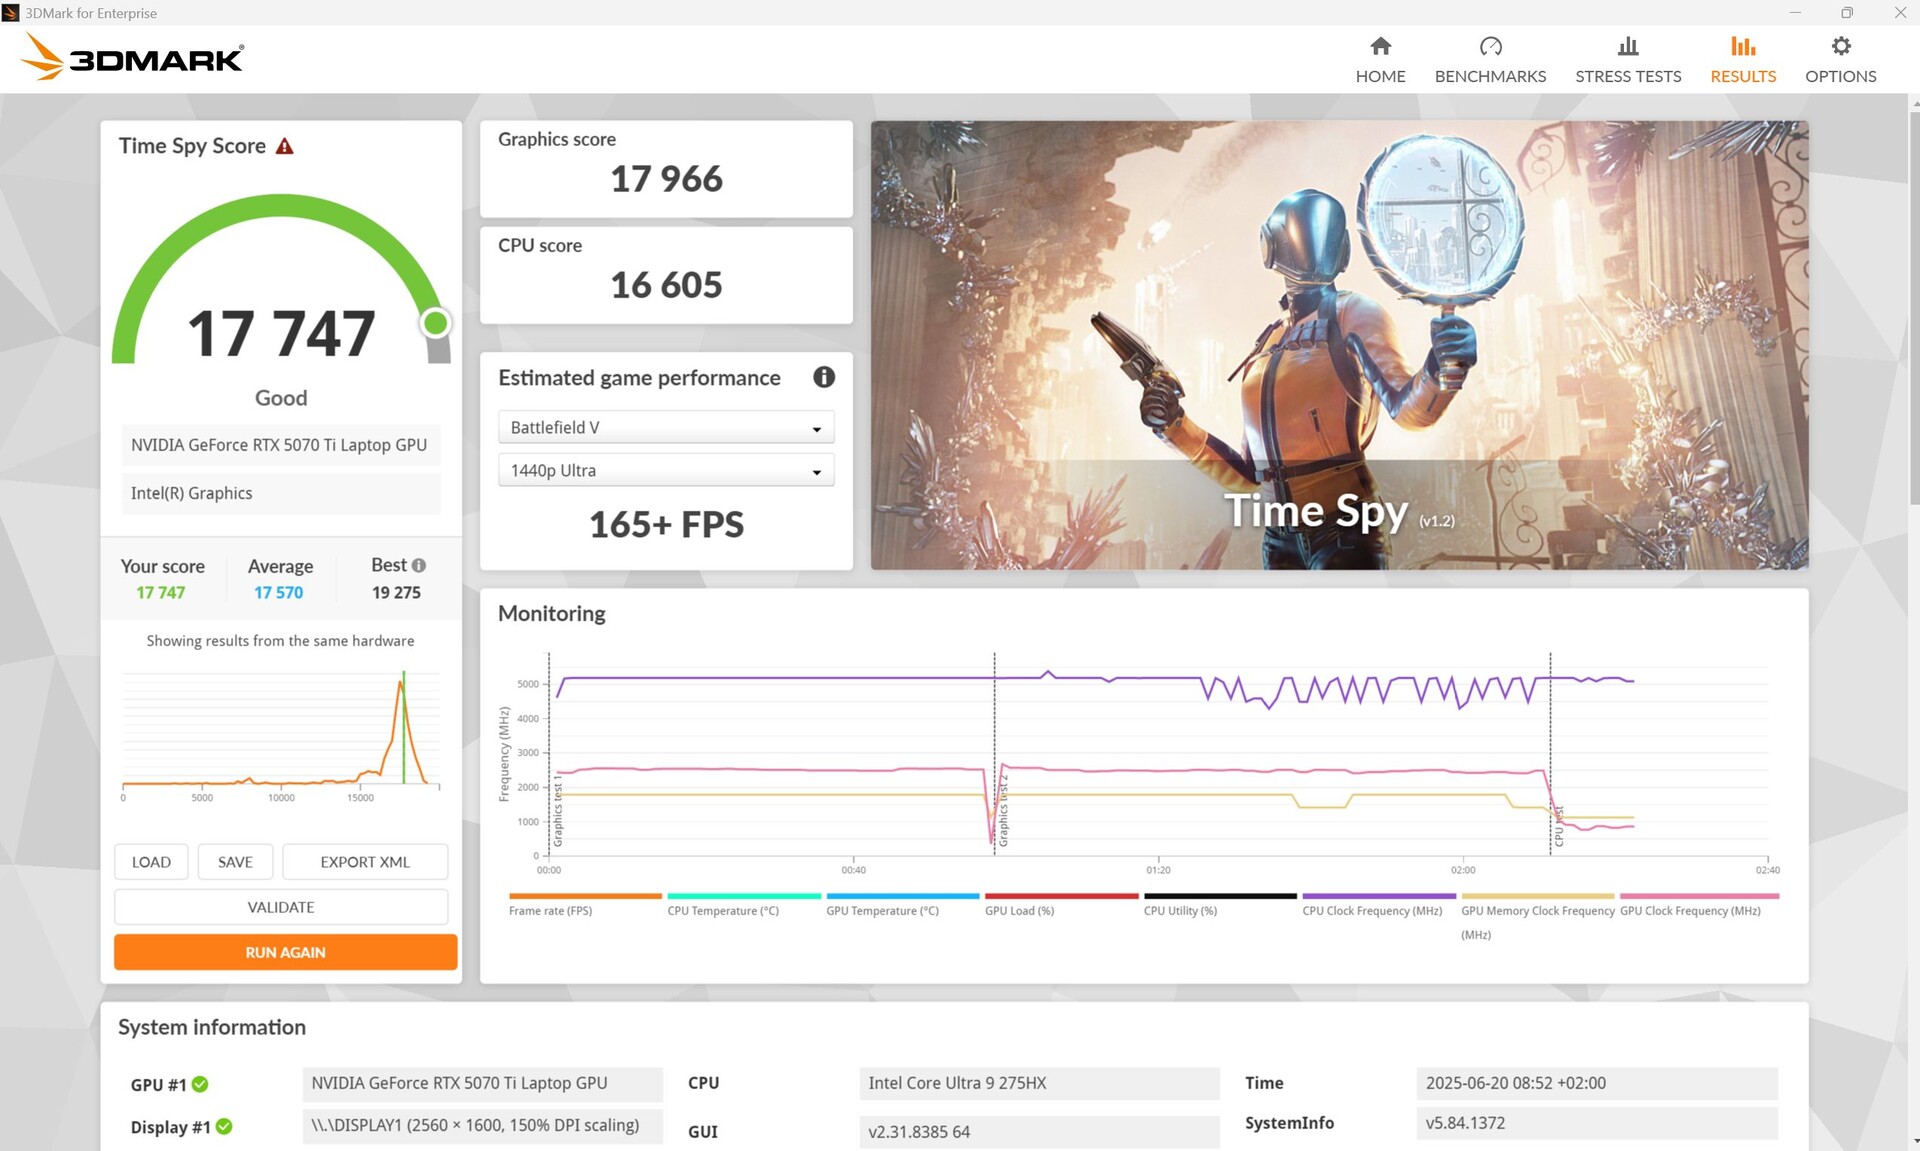
| 3DMark 11 Performance | 47299 points | |
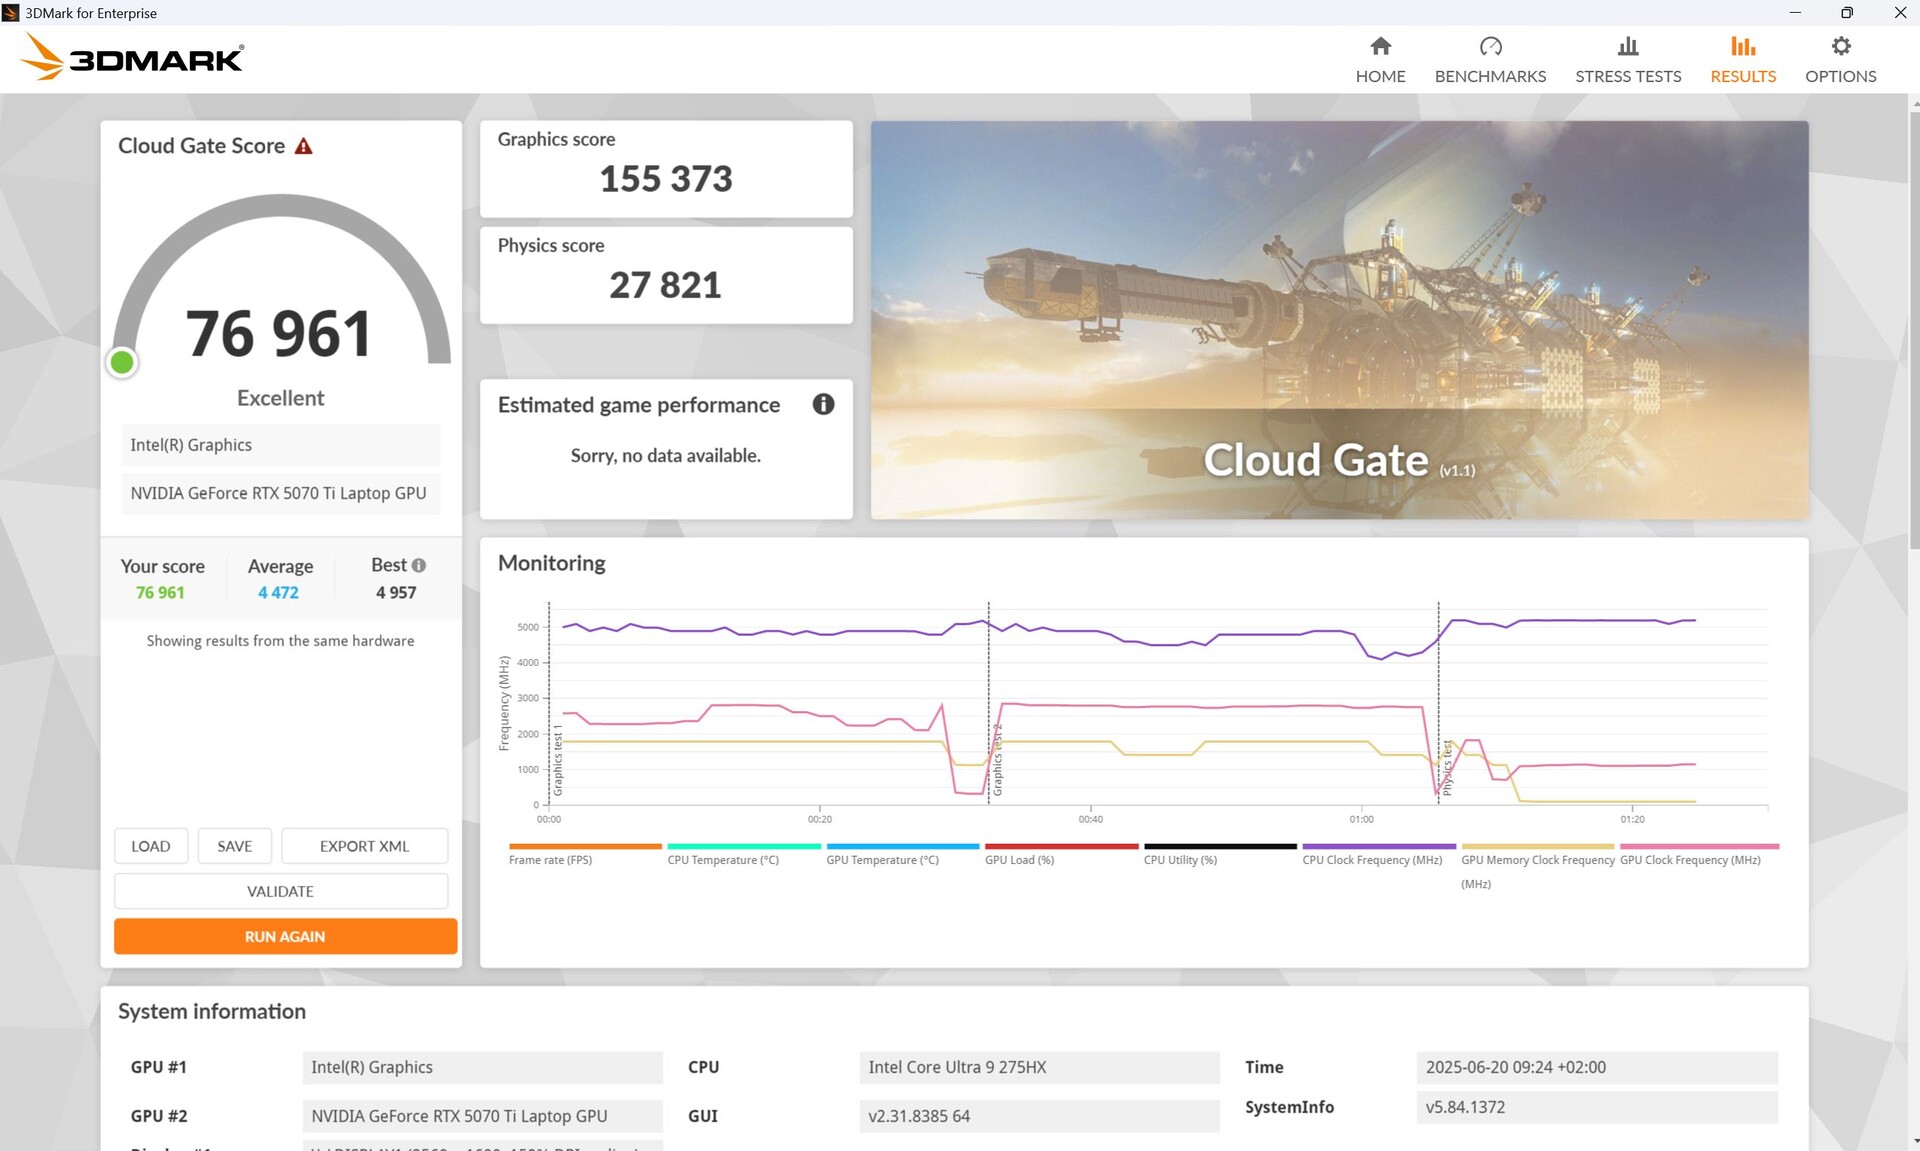
| 3DMark Cloud Gate Standard Score | 76961 points | |
| 3DMark Fire Strike Score | 37793 points | |
| 3DMark Time Spy Score | 17747 points | |
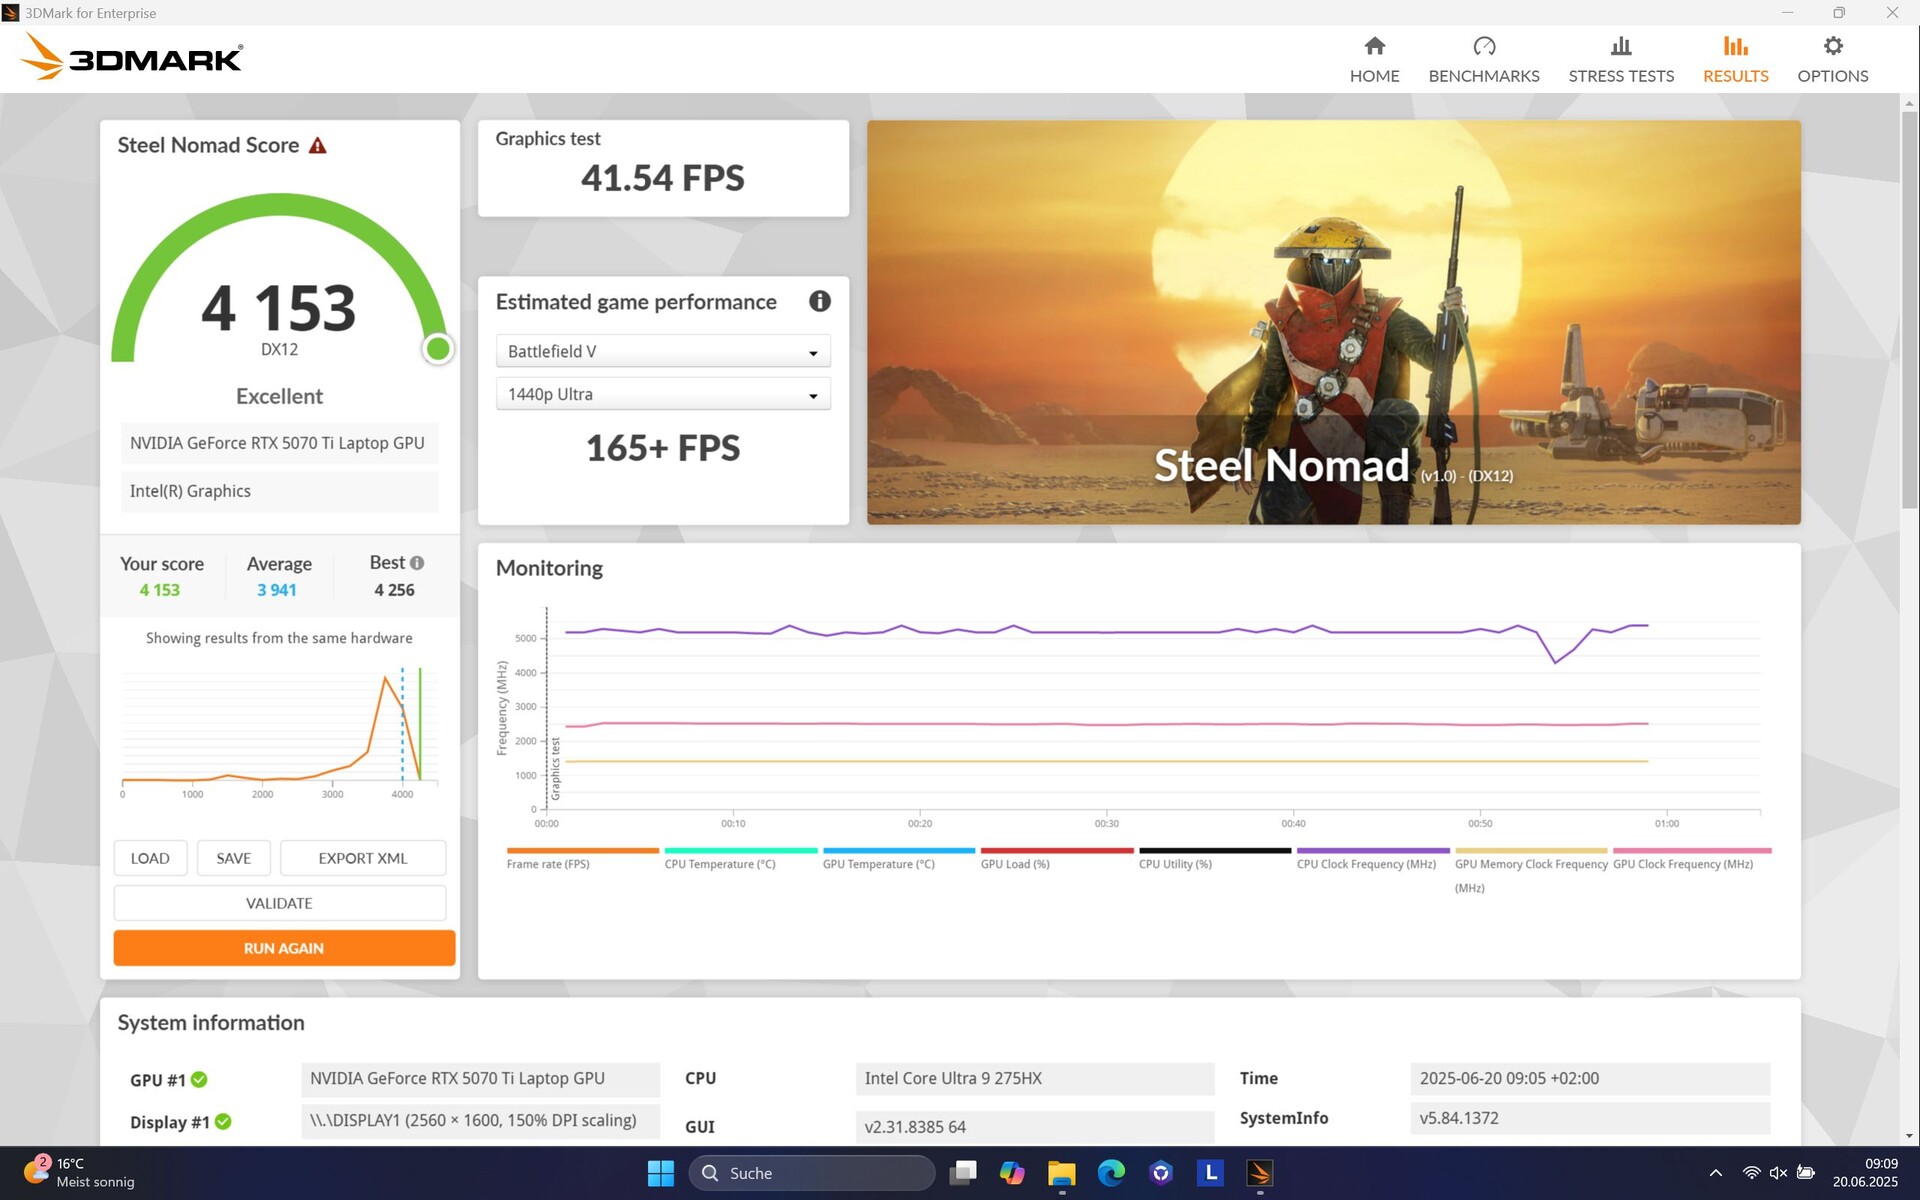
| 3DMark Steel Nomad Score | 4153 points | |
Help | ||
* ... smaller is better
游戏性能
Legion Pro 5 配备 RTX 5070 Ti在 FHD 和 QHD 下感觉最舒适。在许多游戏中也可以使用 4K,但在要求更高的游戏(如《赛博朋克 2077》)中,即使使用 DLSS 也很困难。不过,如果你想最大限度地提高显示器的帧率,那么在许多游戏中你都不得不使用全高清。
只有要求特别高的游戏,如 F1 25,即使是全高清超高清,也需要使用 DLSS。这将使这款游戏的帧数从 35 帧提高到 52 帧。在紧张的驾驶场景中,我们没有发现任何显示错误。在随后的采访中,我们注意到人物周围的边缘闪烁。得益于 DLSS 和帧生成 x4 (FG),在 毁灭战士:黑暗时代中,每秒帧数从 46 帧提高到 148 帧,而在没有 FG 的情况下,每秒帧数仍能达到 61 帧,而且我们没有发现任何恼人的延迟。
在直接对比中,Legion 表现强劲,在 16 英寸游戏屏幕的 RTX 5070 Ti 设备中遥遥领先,而SCHENKER XMG Pro 16 (E25) 则落后 10%。落后 10%。
| GTA V - 1920x1080 Highest AA:4xMSAA + FX AF:16x | |
| Schenker XMG Pro 16 (E25) | |
| Medion Erazer Major 16 X1 MD62736 | |
| Lenovo Legion 5 Pro 16IAX10H | |
| MSI Vector 16 HX AI A2XWHG | |
| Average of class Gaming (48.3 - 186.9, n=102, last 2 years) | |
| Lenovo Legion Pro 5 16IRX9 | |
| Strange Brigade - 1920x1080 ultra AA:ultra AF:16 | |
| Alienware 16 Area-51 | |
| Lenovo Legion 5 Pro 16IAX10H | |
| Average of class Gaming (76.3 - 456, n=93, last 2 years) | |
| Asus ROG Zephyrus G16 2025 5070 Ti | |
| Lenovo Legion Pro 5 16IRX9 | |
| Schenker XMG Pro 16 (E25) | |
我们的《赛博朋克 2077》图表看起来非常一致,性能没有下降。就性能而言,Legion Pro 5 比稍慢的 XMG Pro 16和其他 RTX 5070 Ti 竞争产品。
Cyberpunk 2077 ultra FPS diagram
| low | med. | high | ultra | QHD DLSS | QHD | 4K DLSS | 4K | |
|---|---|---|---|---|---|---|---|---|
| GTA V (2015) | 185.8 | 185.4 | 180.2 | 147.6 | 123.8 | 124.2 | ||
| Dota 2 Reborn (2015) | 228 | 198.2 | 189.7 | 174 | 173.1 | |||
| Final Fantasy XV Benchmark (2018) | 234 | 230 | 181.4 | 139.2 | 78.8 | |||
| X-Plane 11.11 (2018) | 155.8 | 140.1 | 116 | 108.2 | ||||
| Strange Brigade (2018) | 643 | 479 | 403 | 353 | 250 | 138.1 | ||
| Baldur's Gate 3 (2023) | 167.7 | 131.1 | 108.1 | 138.9 | 130 | 91 | 72.4 | 46.6 |
| Cyberpunk 2077 (2023) | 175.1 | 133.9 | 132.4 | 91.2 | 84.3 | 35.9 | ||
| Assassin's Creed Shadows (2025) | 81 | 77 | 63 | 53 | 49 | 44 | ||
| Doom: The Dark Ages (2025) | 93 | 77.5 | 67.3 | 65 | 61 | 45.7 | ||
| F1 25 (2025) | 242 | 217 | 171.9 | 35 | 32 | 18 |
废气排放 - 噪音非常大的专业笔记本电脑
噪音排放
怠速运转时,风扇大部分处于关闭状态,但在性能模式下,风扇偶尔会在短时间内大声转动。
在负载情况下,风扇灵活且反应灵敏,这意味着它们会在负载结束后迅速平静下来,但即使在 3DMark06 等中等负载情况下,它们也会迅速升高。在最大负载和游戏时,我们在性能模式下测得的噪音超过 56 分贝,相比之下相当大。在极限模式下,噪音甚至超过了 58 分贝。SCHENKER XMG Pro 16 (E25)或MSI Vector 16运行时明显更安静。内容创作者更倾向于切换到平衡模式,但这会导致性能降低 13%(CPU)至 22%(GPU)。
Noise level
| Idle |
| 24 / 24 / 30.9 dB(A) |
| Load |
| 55.9 / 56.72 dB(A) |
 | ||
30 dB silent 40 dB(A) audible 50 dB(A) loud |
||
min: | ||
| Lenovo Legion 5 Pro 16IAX10H GeForce RTX 5070 Ti Laptop, Ultra 9 275HX, Western Digital PC SN8000S SDEPNRK-1T00 | Lenovo Legion Pro 5 16IRX9 GeForce RTX 4070 Laptop GPU, i9-14900HX, Samsung PM9A1 MZVL21T0HCLR | Schenker XMG Pro 16 (E25) GeForce RTX 5070 Ti Laptop, Ultra 9 275HX, Samsung 9100 Pro 1 TB | MSI Vector 16 HX AI A2XWHG GeForce RTX 5070 Ti Laptop, Ultra 7 255HX, Micron 2400 MTFDKBA512QFM | MSI Vector A18 HX A9W GeForce RTX 5070 Ti Laptop, R9 9955HX | Lenovo Legion Pro 7i 16 Gen 10 GeForce RTX 5080 Laptop, Ultra 9 275HX, SK Hynix HFS001TEJ9X115N | |
|---|---|---|---|---|---|---|
| Noise | 4% | 6% | -8% | 1% | 13% | |
| off / environment * (dB) | 24 | 23.9 -0% | 23.3 3% | 25 -4% | 22.5 6% | 22.9 5% |
| Idle Minimum * (dB) | 24 | 24.3 -1% | 25 -4% | 33 -38% | 26 -8% | 22.9 5% |
| Idle Average * (dB) | 24 | 24.3 -1% | 25 -4% | 34 -42% | 26 -8% | 22.9 5% |
| Idle Maximum * (dB) | 30.9 | 28.9 6% | 25 19% | 38 -23% | 32 -4% | 26.3 15% |
| Load Average * (dB) | 55.9 | 45.8 18% | 45.5 19% | 46 18% | 44.4 21% | 27.8 50% |
| Cyberpunk 2077 ultra * (dB) | 56.72 | 53.3 6% | 47 17% | 49.8 12% | 54.2 4% | |
| Load Maximum * (dB) | 56.72 | 56.6 -0% | 53.3 6% | 49 14% | 61.6 -9% | 53.9 5% |
| Witcher 3 ultra * (dB) | 51 |
* ... smaller is better
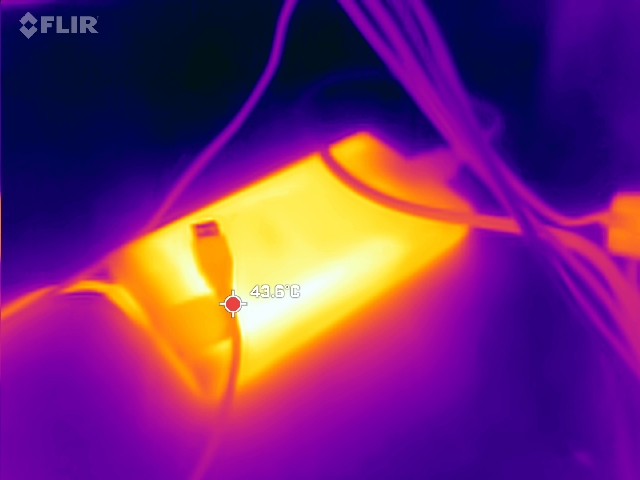
温度
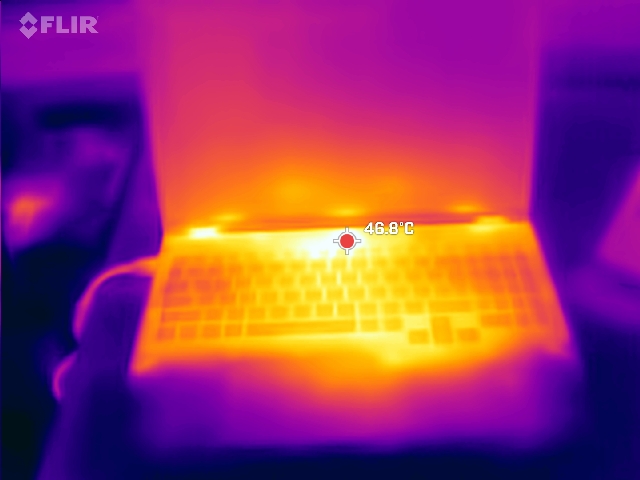
在重负载情况下,表面温度可升至 50°C 左右,尤其是设备底部,而 WASD 键的温度则相对较低(最高 39°C)。现在,风扇的散热似乎比上一代产品均匀得多。
(-) The maximum temperature on the upper side is 48 °C / 118 F, compared to the average of 40.4 °C / 105 F, ranging from 21.2 to 68.8 °C for the class Gaming.
(-) The bottom heats up to a maximum of 50 °C / 122 F, compared to the average of 43.2 °C / 110 F
(±) In idle usage, the average temperature for the upper side is 33.6 °C / 92 F, compared to the device average of 33.9 °C / 93 F.
(-) 3: The average temperature for the upper side is 38.2 °C / 101 F, compared to the average of 33.9 °C / 93 F for the class Gaming.
(±) The palmrests and touchpad can get very hot to the touch with a maximum of 37 °C / 98.6 F.
(-) The average temperature of the palmrest area of similar devices was 28.8 °C / 83.8 F (-8.2 °C / -14.8 F).
| Lenovo Legion 5 Pro 16IAX10H Intel Core Ultra 9 275HX, NVIDIA GeForce RTX 5070 Ti Laptop | Lenovo Legion Pro 5 16IRX9 Intel Core i9-14900HX, NVIDIA GeForce RTX 4070 Laptop GPU | Schenker XMG Pro 16 (E25) Intel Core Ultra 9 275HX, NVIDIA GeForce RTX 5070 Ti Laptop | Medion Erazer Major 16 X1 MD62736 Intel Core Ultra 7 255HX, NVIDIA GeForce RTX 5070 Ti Laptop | MSI Vector 16 HX AI A2XWHG Intel Core Ultra 7 255HX, NVIDIA GeForce RTX 5070 Ti Laptop | MSI Vector A18 HX A9W AMD Ryzen 9 9955HX, NVIDIA GeForce RTX 5070 Ti Laptop | Lenovo Legion Pro 7i 16 Gen 10 Intel Core Ultra 9 275HX, NVIDIA GeForce RTX 5080 Laptop | |
|---|---|---|---|---|---|---|---|
| Heat | 7% | -121% | 4% | 8% | 16% | 17% | |
| Maximum Upper Side * (°C) | 48 | 43.8 9% | 43.2 10% | 49 -2% | 53 -10% | 46.6 3% | 42.6 11% |
| Maximum Bottom * (°C) | 50 | 55.4 -11% | 46 8% | 50 -0% | 52 -4% | 45.6 9% | 41.2 18% |
| Idle Upper Side * (°C) | 38 | 32.8 14% | 27.7 27% | 36 5% | 33 13% | 31.2 18% | 32.6 14% |
| Idle Bottom * (°C) | 42 | 36 14% | 264 -529% | 37 12% | 29 31% | 28.6 32% | 32.4 23% |
* ... smaller is better
压力测试
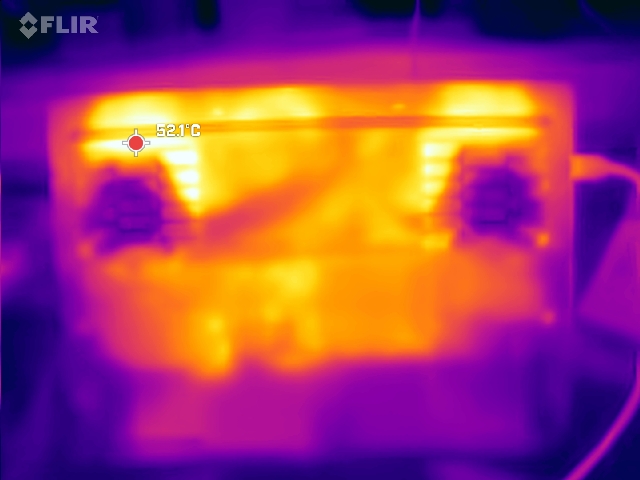
CPU 内核以 4.1 GHz(195 W)的频率短暂启动了一小时的压力测试。CPU 超过 100°C 的温度阈值后,时钟速度和功耗分别降至约 2.3 GHz 和 60 W,然后保持相对稳定。随后温度保持在 82°C 左右。
在此期间,GPU 时钟速度大致在 2.2 和 2.5 GHz 之间波动,而内存时钟速度则在 1.1 和 1.8 GHz 之间有较大的跳动。温度约为 85°C,GPU 电源功耗约为 125W。
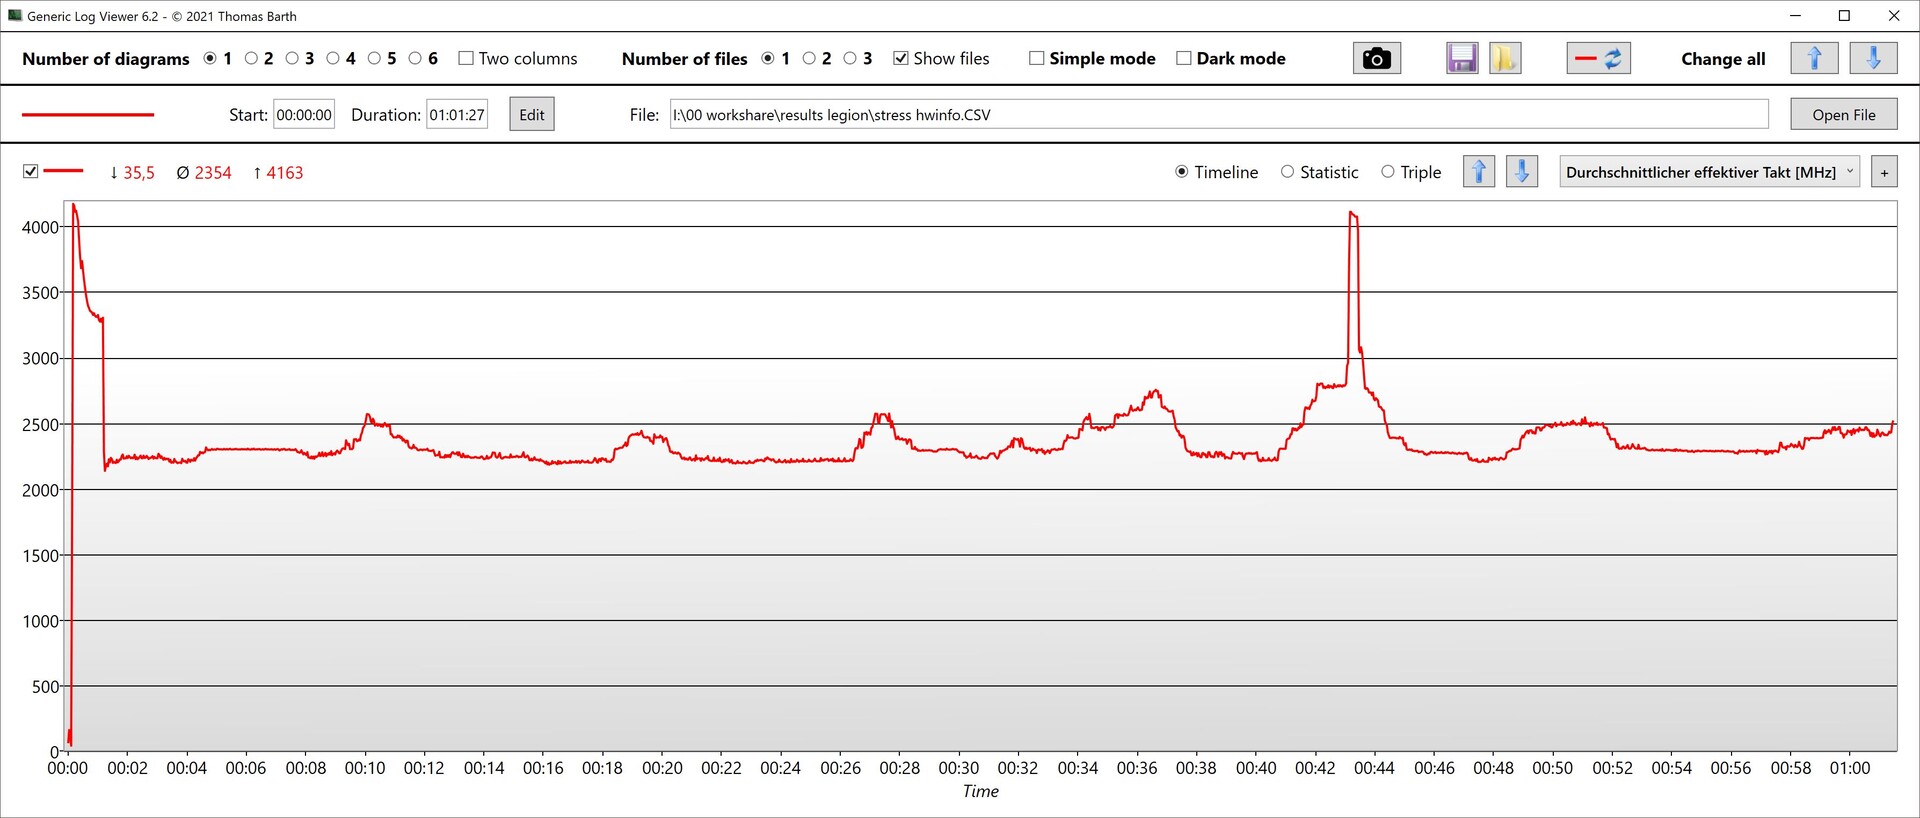
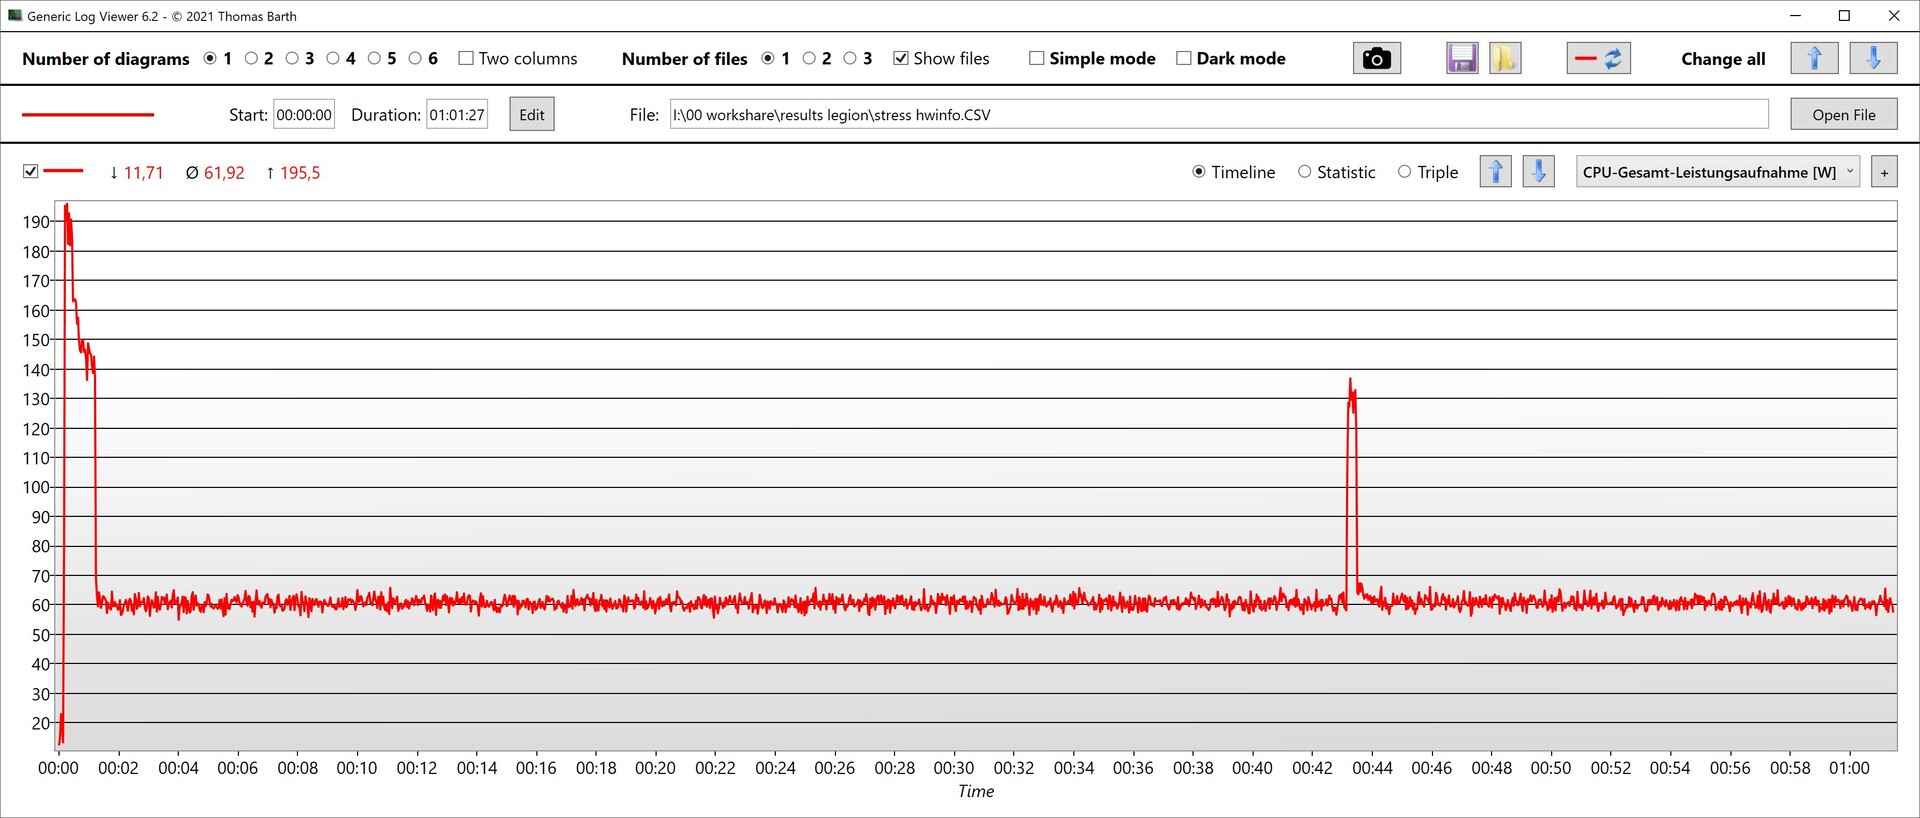

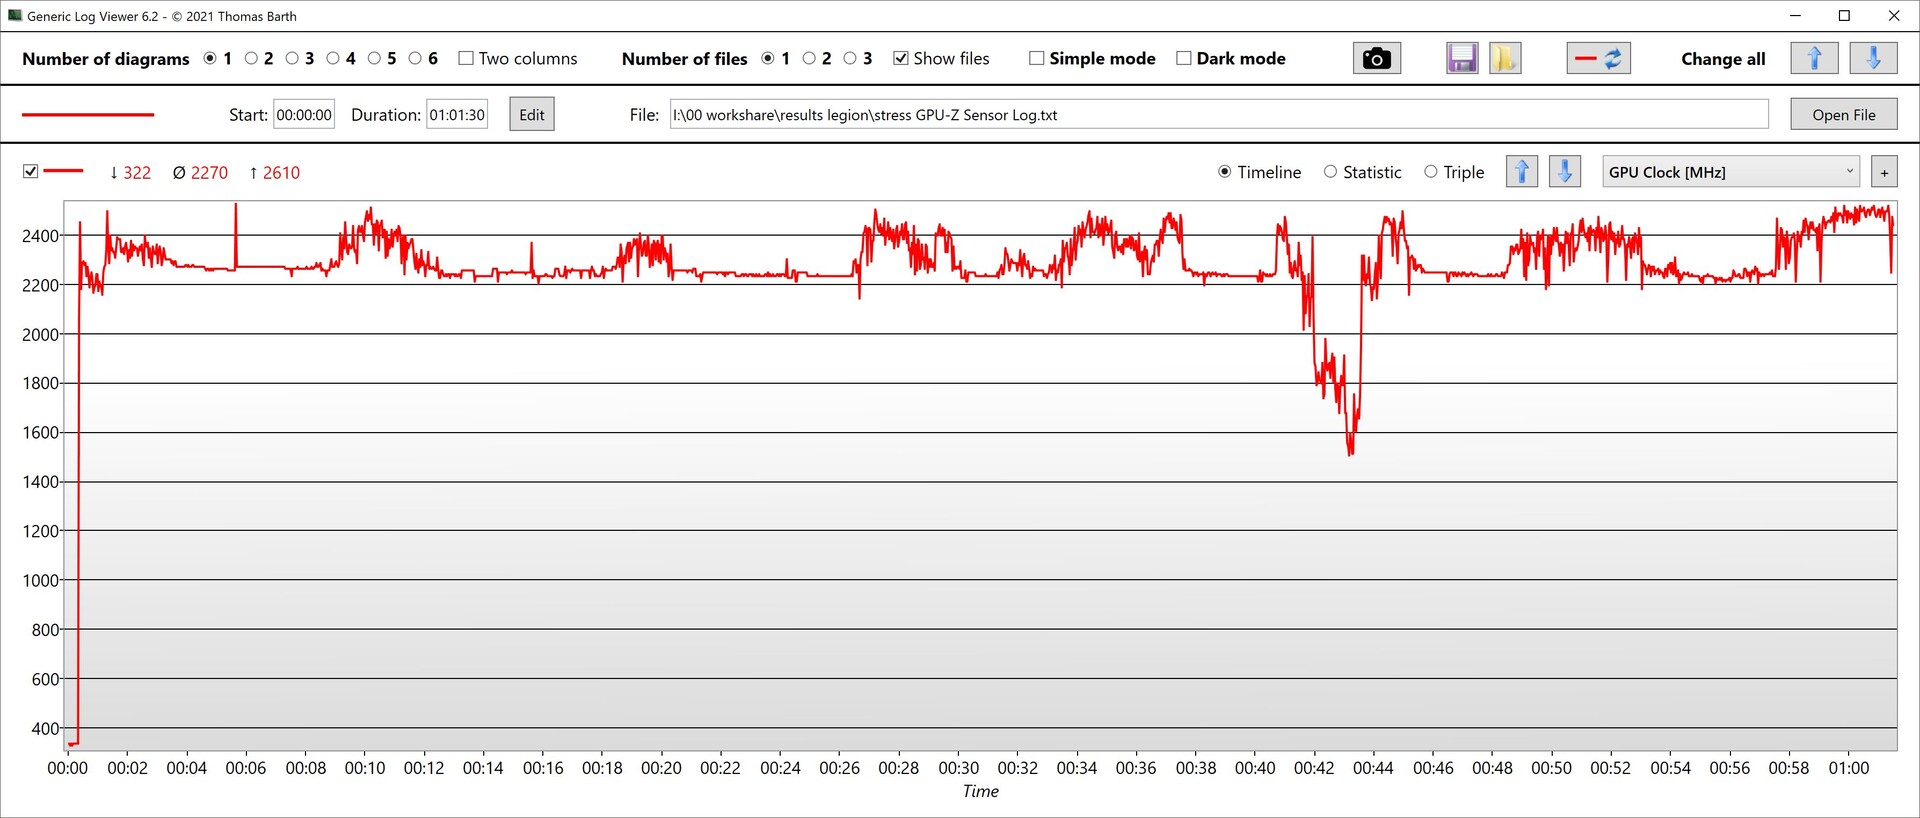
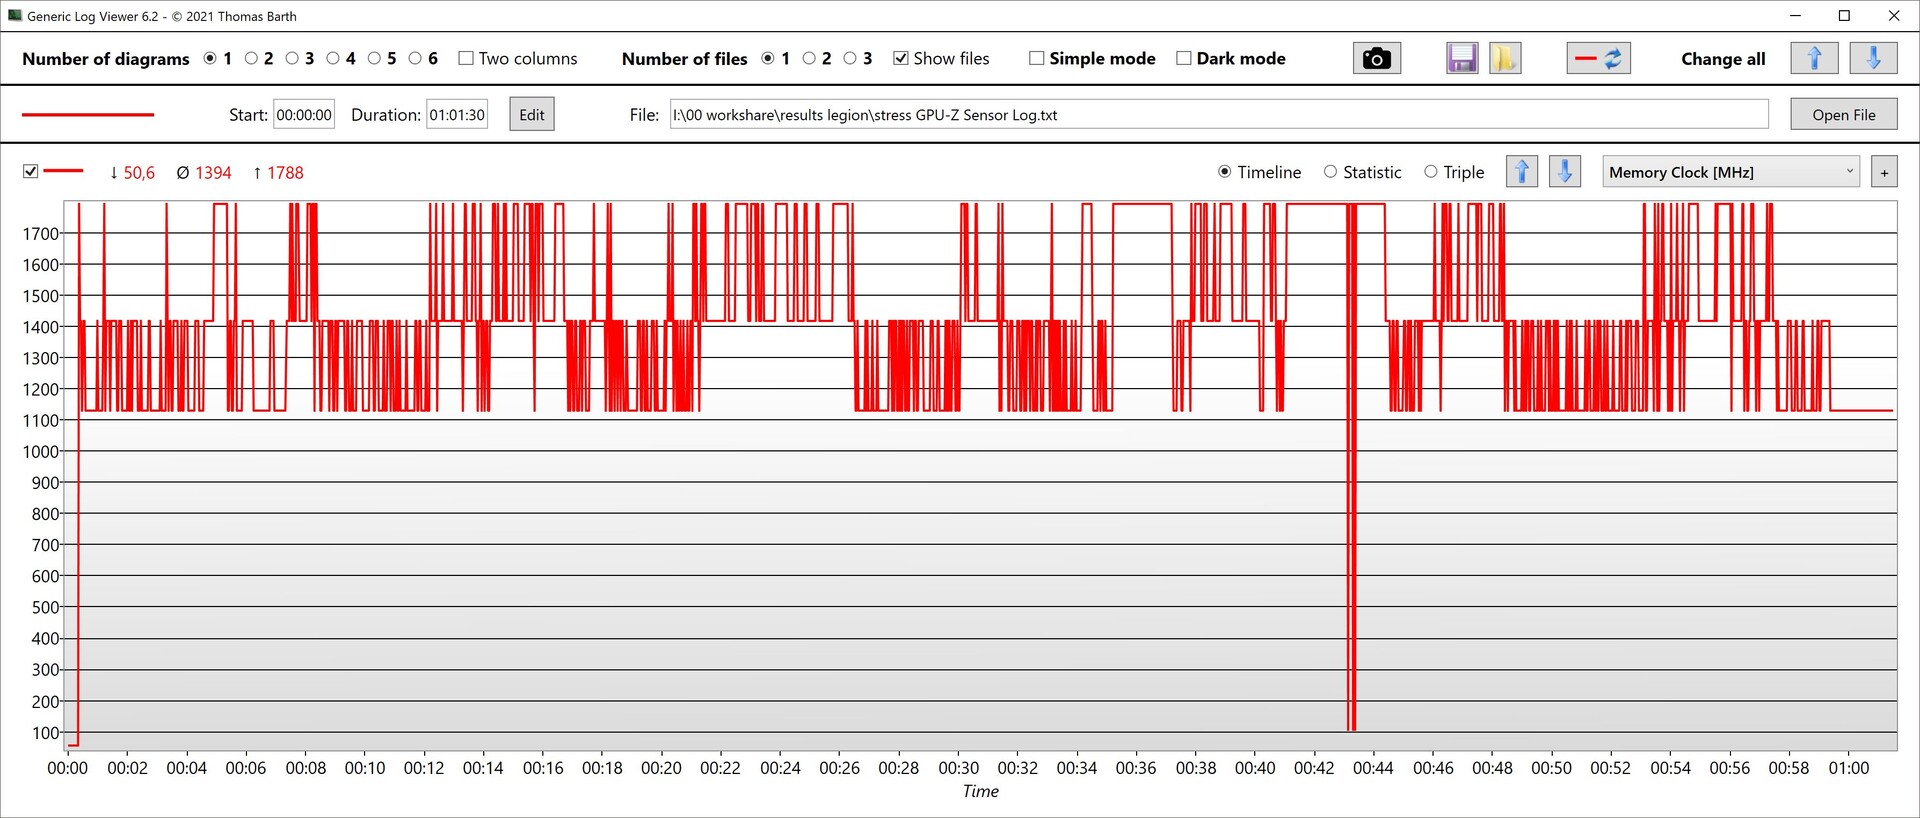
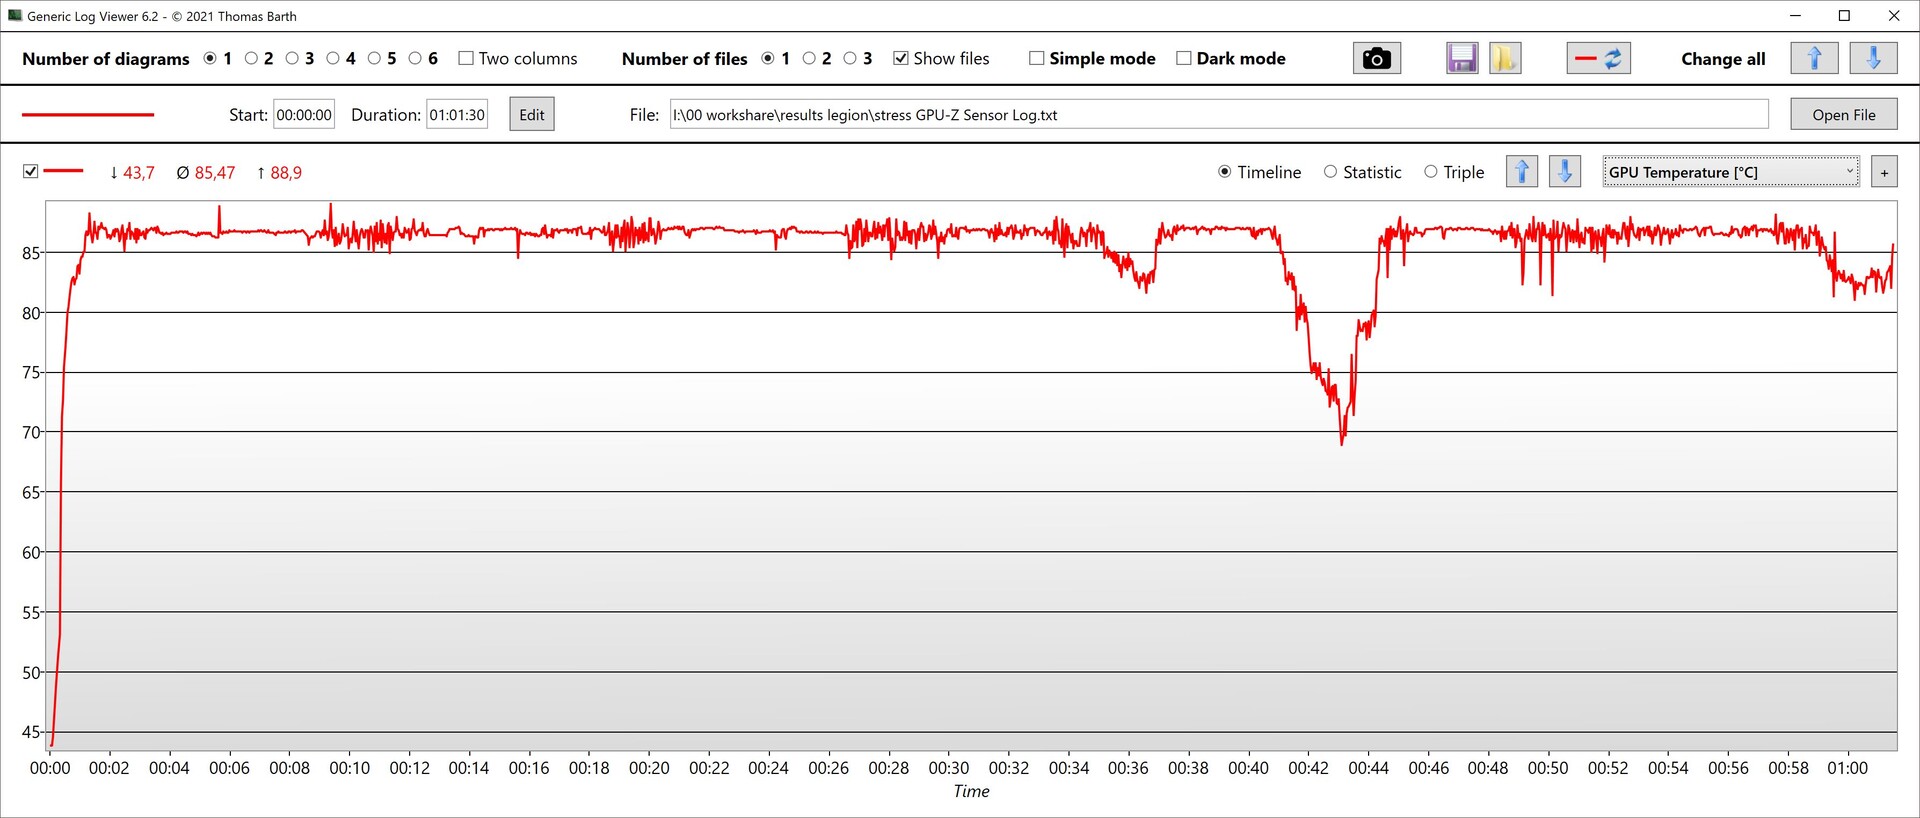
| CPU 时钟 (GHz) | GPU 时钟 (MHz) | CPU 平均温度 (°C) | GPU 平均温度 (°C) | |
| Prime95 + FurMark Stress | 2,354 | 2270 | 82 | 85 |
| 赛博朋克 2077》压力测试 | 1,862 | 2572 | 83 | 86 |
发言人
两个立体声扬声器相当实用,可提供均衡的高音,但音量不大,而且缺乏低音。耳机插孔可用于连接耳机和其他模拟音频设备。
Lenovo Legion 5 Pro 16IAX10H audio analysis
(±) | speaker loudness is average but good (78.2 dB)
Bass 100 - 315 Hz
(-) | nearly no bass - on average 21.1% lower than median
(±) | linearity of bass is average (8% delta to prev. frequency)
Mids 400 - 2000 Hz
(±) | higher mids - on average 6.3% higher than median
(+) | mids are linear (6.5% delta to prev. frequency)
Highs 2 - 16 kHz
(+) | balanced highs - only 1.6% away from median
(+) | highs are linear (4.9% delta to prev. frequency)
Overall 100 - 16.000 Hz
(±) | linearity of overall sound is average (18.3% difference to median)
Compared to same class
» 58% of all tested devices in this class were better, 9% similar, 33% worse
» The best had a delta of 6%, average was 18%, worst was 132%
Compared to all devices tested
» 40% of all tested devices were better, 8% similar, 52% worse
» The best had a delta of 4%, average was 24%, worst was 134%
Schenker XMG Pro 16 (E25) audio analysis
(±) | speaker loudness is average but good (79.2 dB)
Bass 100 - 315 Hz
(±) | reduced bass - on average 14.2% lower than median
(±) | linearity of bass is average (10.6% delta to prev. frequency)
Mids 400 - 2000 Hz
(±) | higher mids - on average 8.2% higher than median
(±) | linearity of mids is average (9.9% delta to prev. frequency)
Highs 2 - 16 kHz
(+) | balanced highs - only 3.8% away from median
(+) | highs are linear (5.9% delta to prev. frequency)
Overall 100 - 16.000 Hz
(±) | linearity of overall sound is average (18.5% difference to median)
Compared to same class
» 60% of all tested devices in this class were better, 8% similar, 32% worse
» The best had a delta of 6%, average was 18%, worst was 132%
Compared to all devices tested
» 41% of all tested devices were better, 8% similar, 51% worse
» The best had a delta of 4%, average was 24%, worst was 134%
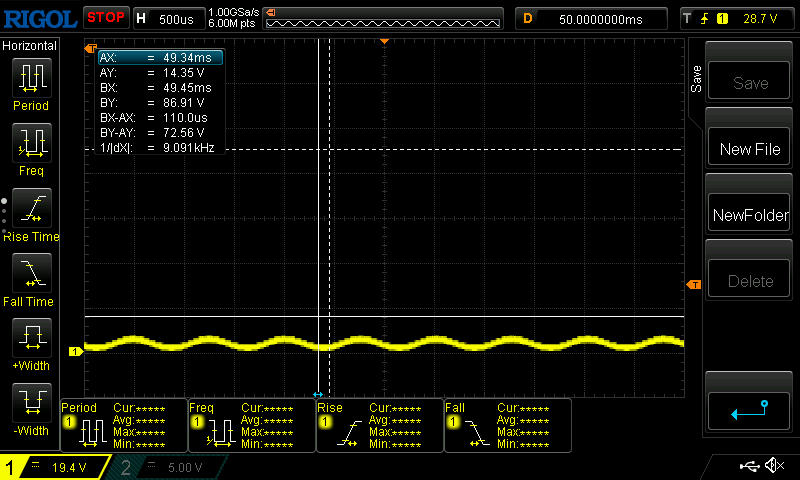
能源管理 - 电池可以更大
耗电量
理想情况下,Legion Pro 5 在空转时的能耗非常低。但是,在较长时间内,能耗会反复上升。这是大多数 RTX 5000 笔记本电脑在闲置能耗过高问题上仍然存在的一个方面。将外接显示器连接到 HDMI 输出时,dGPU 处于活动状态。
在玩游戏时,Legion Pro 5 的功耗显然略高于大多数竞争对手,因为它的性能很高。不过,两者的差距很小,MSI Vector 16 HX AI A2XWHG更耗电。
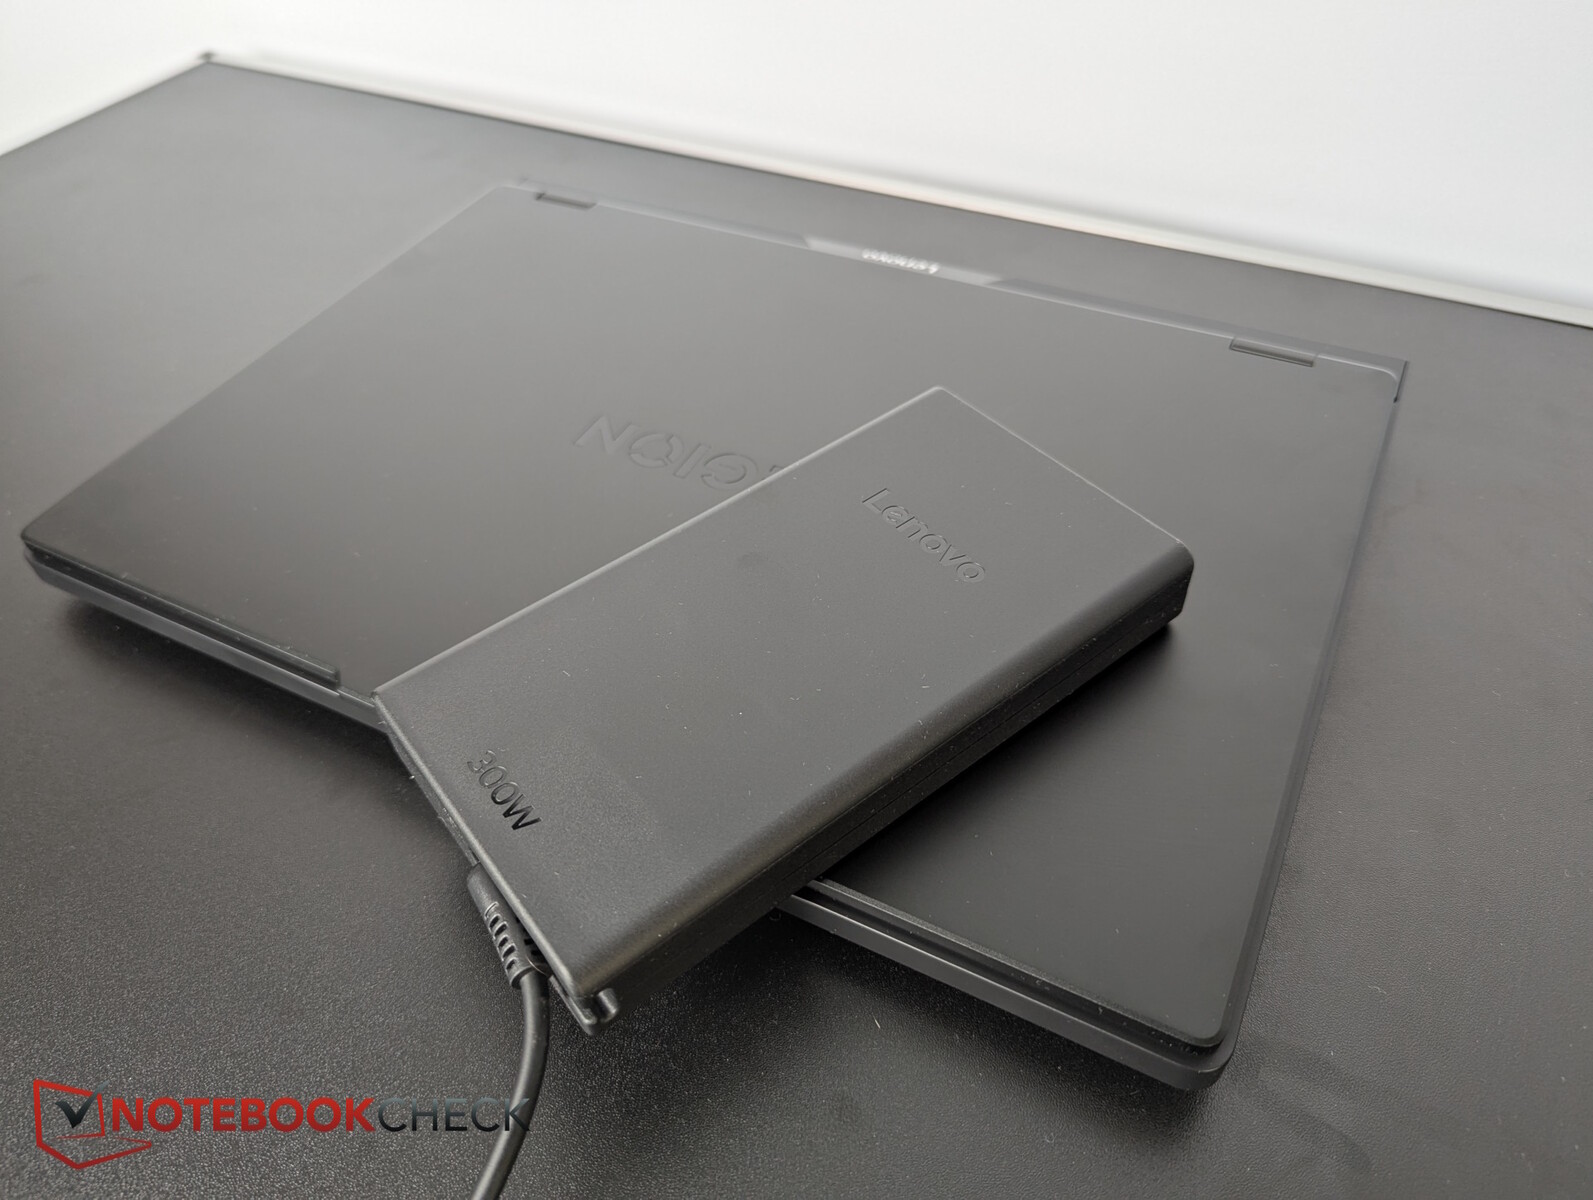
我们测得联想电源适配器的短期峰值负载高达 294 瓦。该适配器的额定功率为 300 瓦,因此无论在什么情况下都能为笔记本电脑充电。
| Off / Standby | |
| Idle | |
| Load |
|
Key:
min: | |
| Lenovo Legion 5 Pro 16IAX10H Ultra 9 275HX, GeForce RTX 5070 Ti Laptop, Western Digital PC SN8000S SDEPNRK-1T00, OLED, 2560x1600, 16" | Lenovo Legion Pro 5 16IRX9 i9-14900HX, GeForce RTX 4070 Laptop GPU, Samsung PM9A1 MZVL21T0HCLR, IPS, 2560x1600, 16" | Schenker XMG Pro 16 (E25) Ultra 9 275HX, GeForce RTX 5070 Ti Laptop, Samsung 9100 Pro 1 TB, IPS, 2560x1600, 16" | Medion Erazer Major 16 X1 MD62736 Ultra 7 255HX, GeForce RTX 5070 Ti Laptop, Phison E31 2 TB, IPS, 2560x1600, 16" | MSI Vector 16 HX AI A2XWHG Ultra 7 255HX, GeForce RTX 5070 Ti Laptop, Micron 2400 MTFDKBA512QFM, IPS, 2560x1600, 16" | MSI Vector A18 HX A9W R9 9955HX, GeForce RTX 5070 Ti Laptop, , IPS, 2560x1600, 18" | Lenovo Legion Pro 7i 16 Gen 10 Ultra 9 275HX, GeForce RTX 5080 Laptop, SK Hynix HFS001TEJ9X115N, OLED, 2560x1600, 16" | Average NVIDIA GeForce RTX 5070 Ti Laptop | Average of class Gaming | |
|---|---|---|---|---|---|---|---|---|---|
| Power Consumption | -9% | 8% | -5% | 5% | -71% | -65% | -3% | 1% | |
| Idle Minimum * (Watt) | 14 | 12.5 11% | 11.7 16% | 17.8 -27% | 7.1 49% | 20.8 -49% | 28.5 -104% | 12.4 ? 11% | 13.2 ? 6% |
| Idle Average * (Watt) | 14.3 | 24.6 -72% | 16.6 -16% | 20.7 -45% | 15.9 -11% | 52.8 -269% | 38.8 -171% | 19.7 ? -38% | 18.9 ? -32% |
| Idle Maximum * (Watt) | 20.1 | 24.8 -23% | 17.1 15% | 23.4 -16% | 29.5 -47% | 54.5 -171% | 45.6 -127% | 24.9 ? -24% | 24.3 ? -21% |
| Load Average * (Watt) | 177 | 109.6 38% | 122.4 31% | 110 38% | 124 30% | 146.6 17% | 132.2 25% | 123.6 ? 30% | 108 ? 39% |
| Cyberpunk 2077 ultra * (Watt) | 255 | 245 4% | 233 9% | 222 13% | 285 -12% | 318 -25% | |||
| Cyberpunk 2077 ultra external monitor * (Watt) | 255 | 241 5% | 232 9% | 217 15% | 278 -9% | 319 -25% | |||
| Load Maximum * (Watt) | 294 | 284.9 3% | 291.5 1% | 297 -1% | 336 -14% | 297.3 -1% | 384 -31% | 272 ? 7% | 254 ? 14% |
| Witcher 3 ultra * (Watt) | 218 |
* ... smaller is better
Power consumption Cyberpunk / stress test
Power consumption with an external monitor
电池寿命
遗憾的是,如果拔掉Legion Pro 5 的电源,OLED 的刷新率不会自动降至更省电的 60 Hz。手动切换到 60 Hz 后,在亮度降低到 150 尼特的情况下,视频和 Wi-Fi 的运行时间将近 5 小时。80 Wh 的电池容量经常被 90 Wh 或更高容量的竞争对手超越。
| Lenovo Legion 5 Pro 16IAX10H Ultra 9 275HX, GeForce RTX 5070 Ti Laptop, 80 Wh | Lenovo Legion Pro 5 16IRX9 i9-14900HX, GeForce RTX 4070 Laptop GPU, 80 Wh | Schenker XMG Pro 16 (E25) Ultra 9 275HX, GeForce RTX 5070 Ti Laptop, 99.8 Wh | Medion Erazer Major 16 X1 MD62736 Ultra 7 255HX, GeForce RTX 5070 Ti Laptop, 80 Wh | MSI Vector 16 HX AI A2XWHG Ultra 7 255HX, GeForce RTX 5070 Ti Laptop, 90 Wh | Asus ROG Zephyrus G16 2025 5070 Ti Ultra 9 285H, GeForce RTX 5070 Ti Laptop, 90 Wh | Alienware 16 Area-51 Ultra 9 275HX, GeForce RTX 5080 Laptop, 96 Wh | Lenovo Legion Pro 7i 16 Gen 10 Ultra 9 275HX, GeForce RTX 5080 Laptop, 99 Wh | Average of class Gaming | |
|---|---|---|---|---|---|---|---|---|---|
| Battery runtime | -19% | 86% | 29% | 43% | -43% | -22% | 34% | ||
| H.264 (h) | 4.8 | 8.26 ? 72% | |||||||
| WiFi v1.3 (h) | 4.9 | 4.8 -2% | 9.1 86% | 6.3 29% | 7 43% | 2.8 -43% | 5.4 10% | 7.02 ? 43% | |
| Load (h) | 1.7 | 1.1 -35% | 0.8 -53% | 1.47 ? -14% | |||||
| Reader / Idle (h) | 6.7 | 3.1 | 8.71 ? |
Notebookcheck 总体评分
说到游戏,拥有 RTX 5070 Ti 和亮丽 OLED 的Legion Pro 5 可以大显身手,但对于内容创作者来说,Legion 5 可能有点太吵了。
Lenovo Legion 5 Pro 16IAX10H
- 06/24/2025 v8
Christian Hintze
 Total Sustainability Score:
 可能的替代品比较
Transparency
The selection of devices to be reviewed is made by our editorial team. The test sample was provided to the author as a loan by the manufacturer or retailer for the purpose of this review. The lender had no influence on this review, nor did the manufacturer receive a copy of this review before publication. There was no obligation to publish this review. As an independent media company, Notebookcheck is not subjected to the authority of manufacturers, retailers or publishers.
This is how Notebookcheck is testing
Every year, Notebookcheck independently reviews hundreds of laptops and smartphones using standardized procedures to ensure that all results are comparable. We have continuously developed our test methods for around 20 years and set industry standards in the process. In our test labs, high-quality measuring equipment is utilized by experienced technicians and editors. These tests involve a multi-stage validation process. Our complex rating system is based on hundreds of well-founded measurements and benchmarks, which maintains objectivity. Further information on our test methods can be found here.

