结论:不错,但是否足以超越竞争对手?
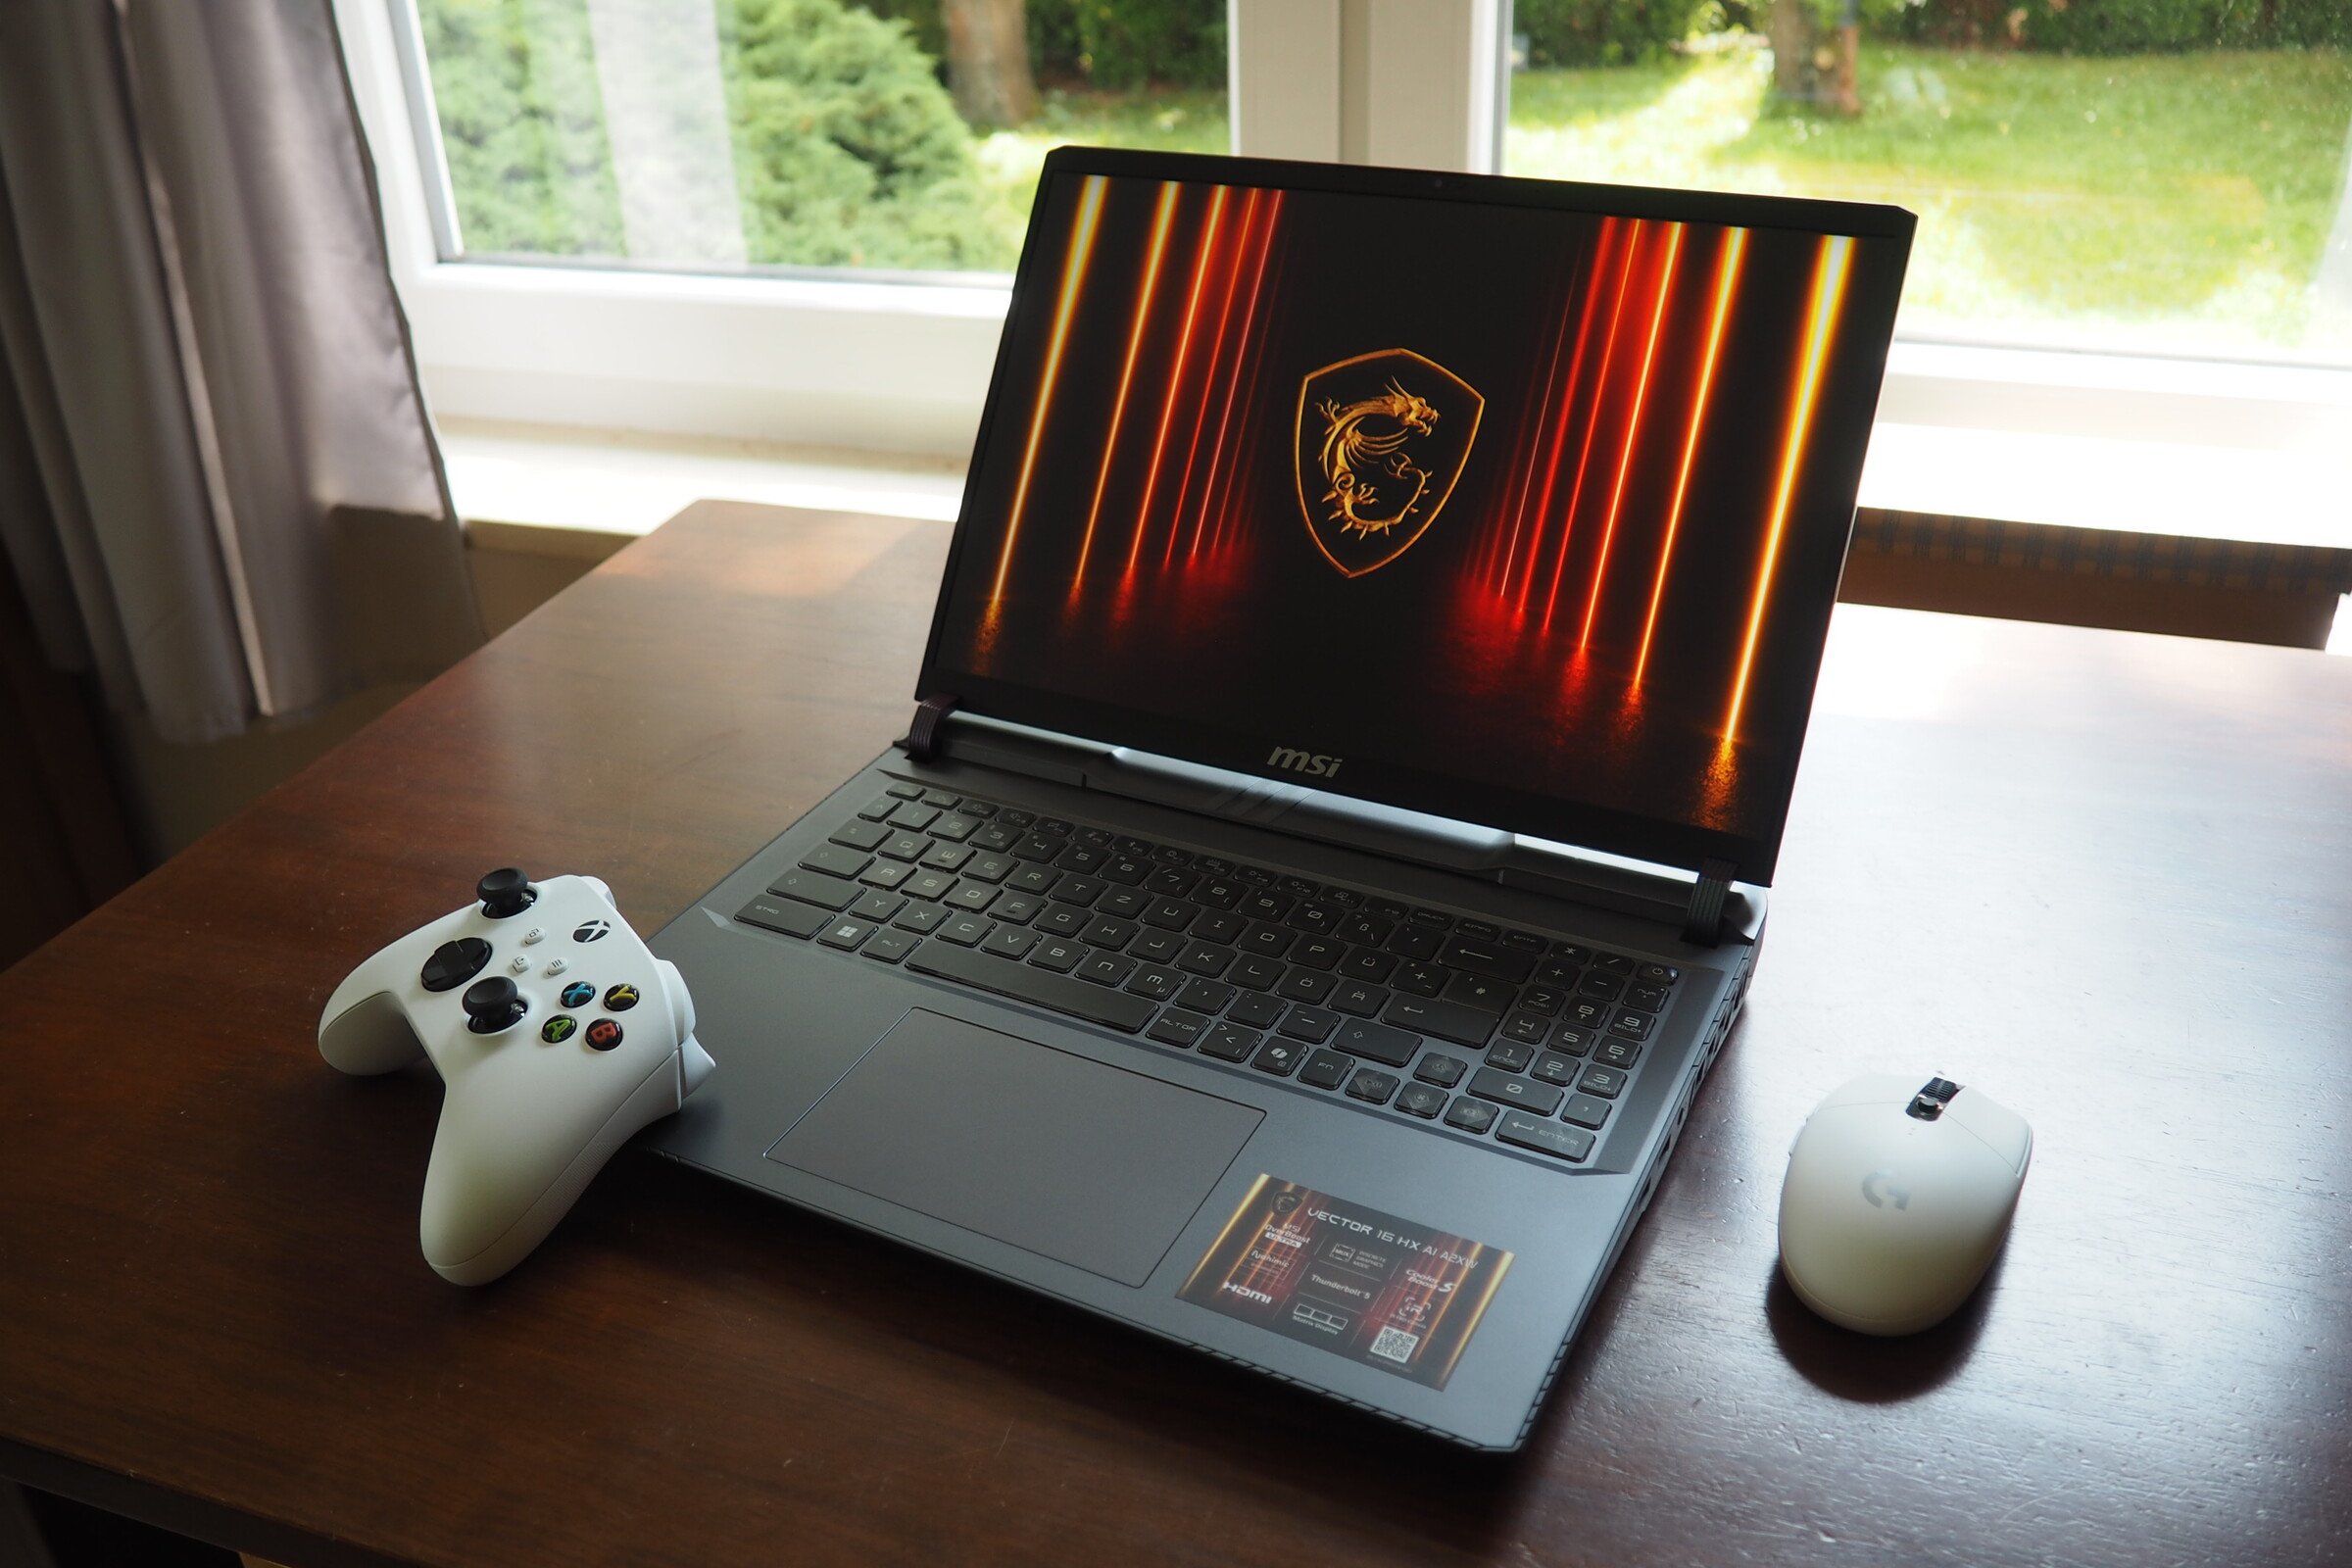
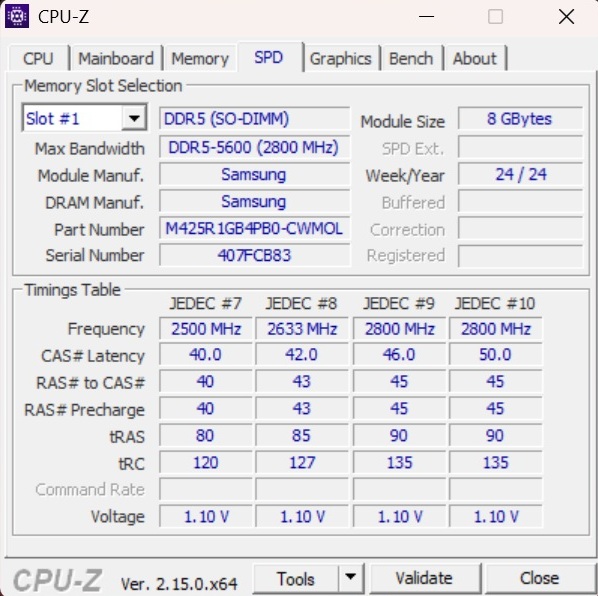
初看之下,微星的Vector 16 HX AI获得了很高的评价。所测试的 A2XWHG(074) 配置价格约为 2000 欧元,提供了强大的功能集,但相对较小的 512 GB 固态硬盘是一个明显的限制。虽然 16 GB DDR5-5600 内存(2x 8 GB SO-DIMM)可能无法激发玩家的热情,但酷睿至尊 7 255HX 和GeForce RTX 5070 Ti(配备 12 GB GDDR7 VRAM)提供了充足的游戏动力。IPS 显示屏以其锐利的 2,560 x 1,600 分辨率、流畅的 240 赫兹刷新率以及几乎完全覆盖的 sRGB 和 DCI-P3 色彩空间给人留下了深刻印象。最突出的特点是丰富的连接功能,拥有两个 Thunderbolt 5 端口。
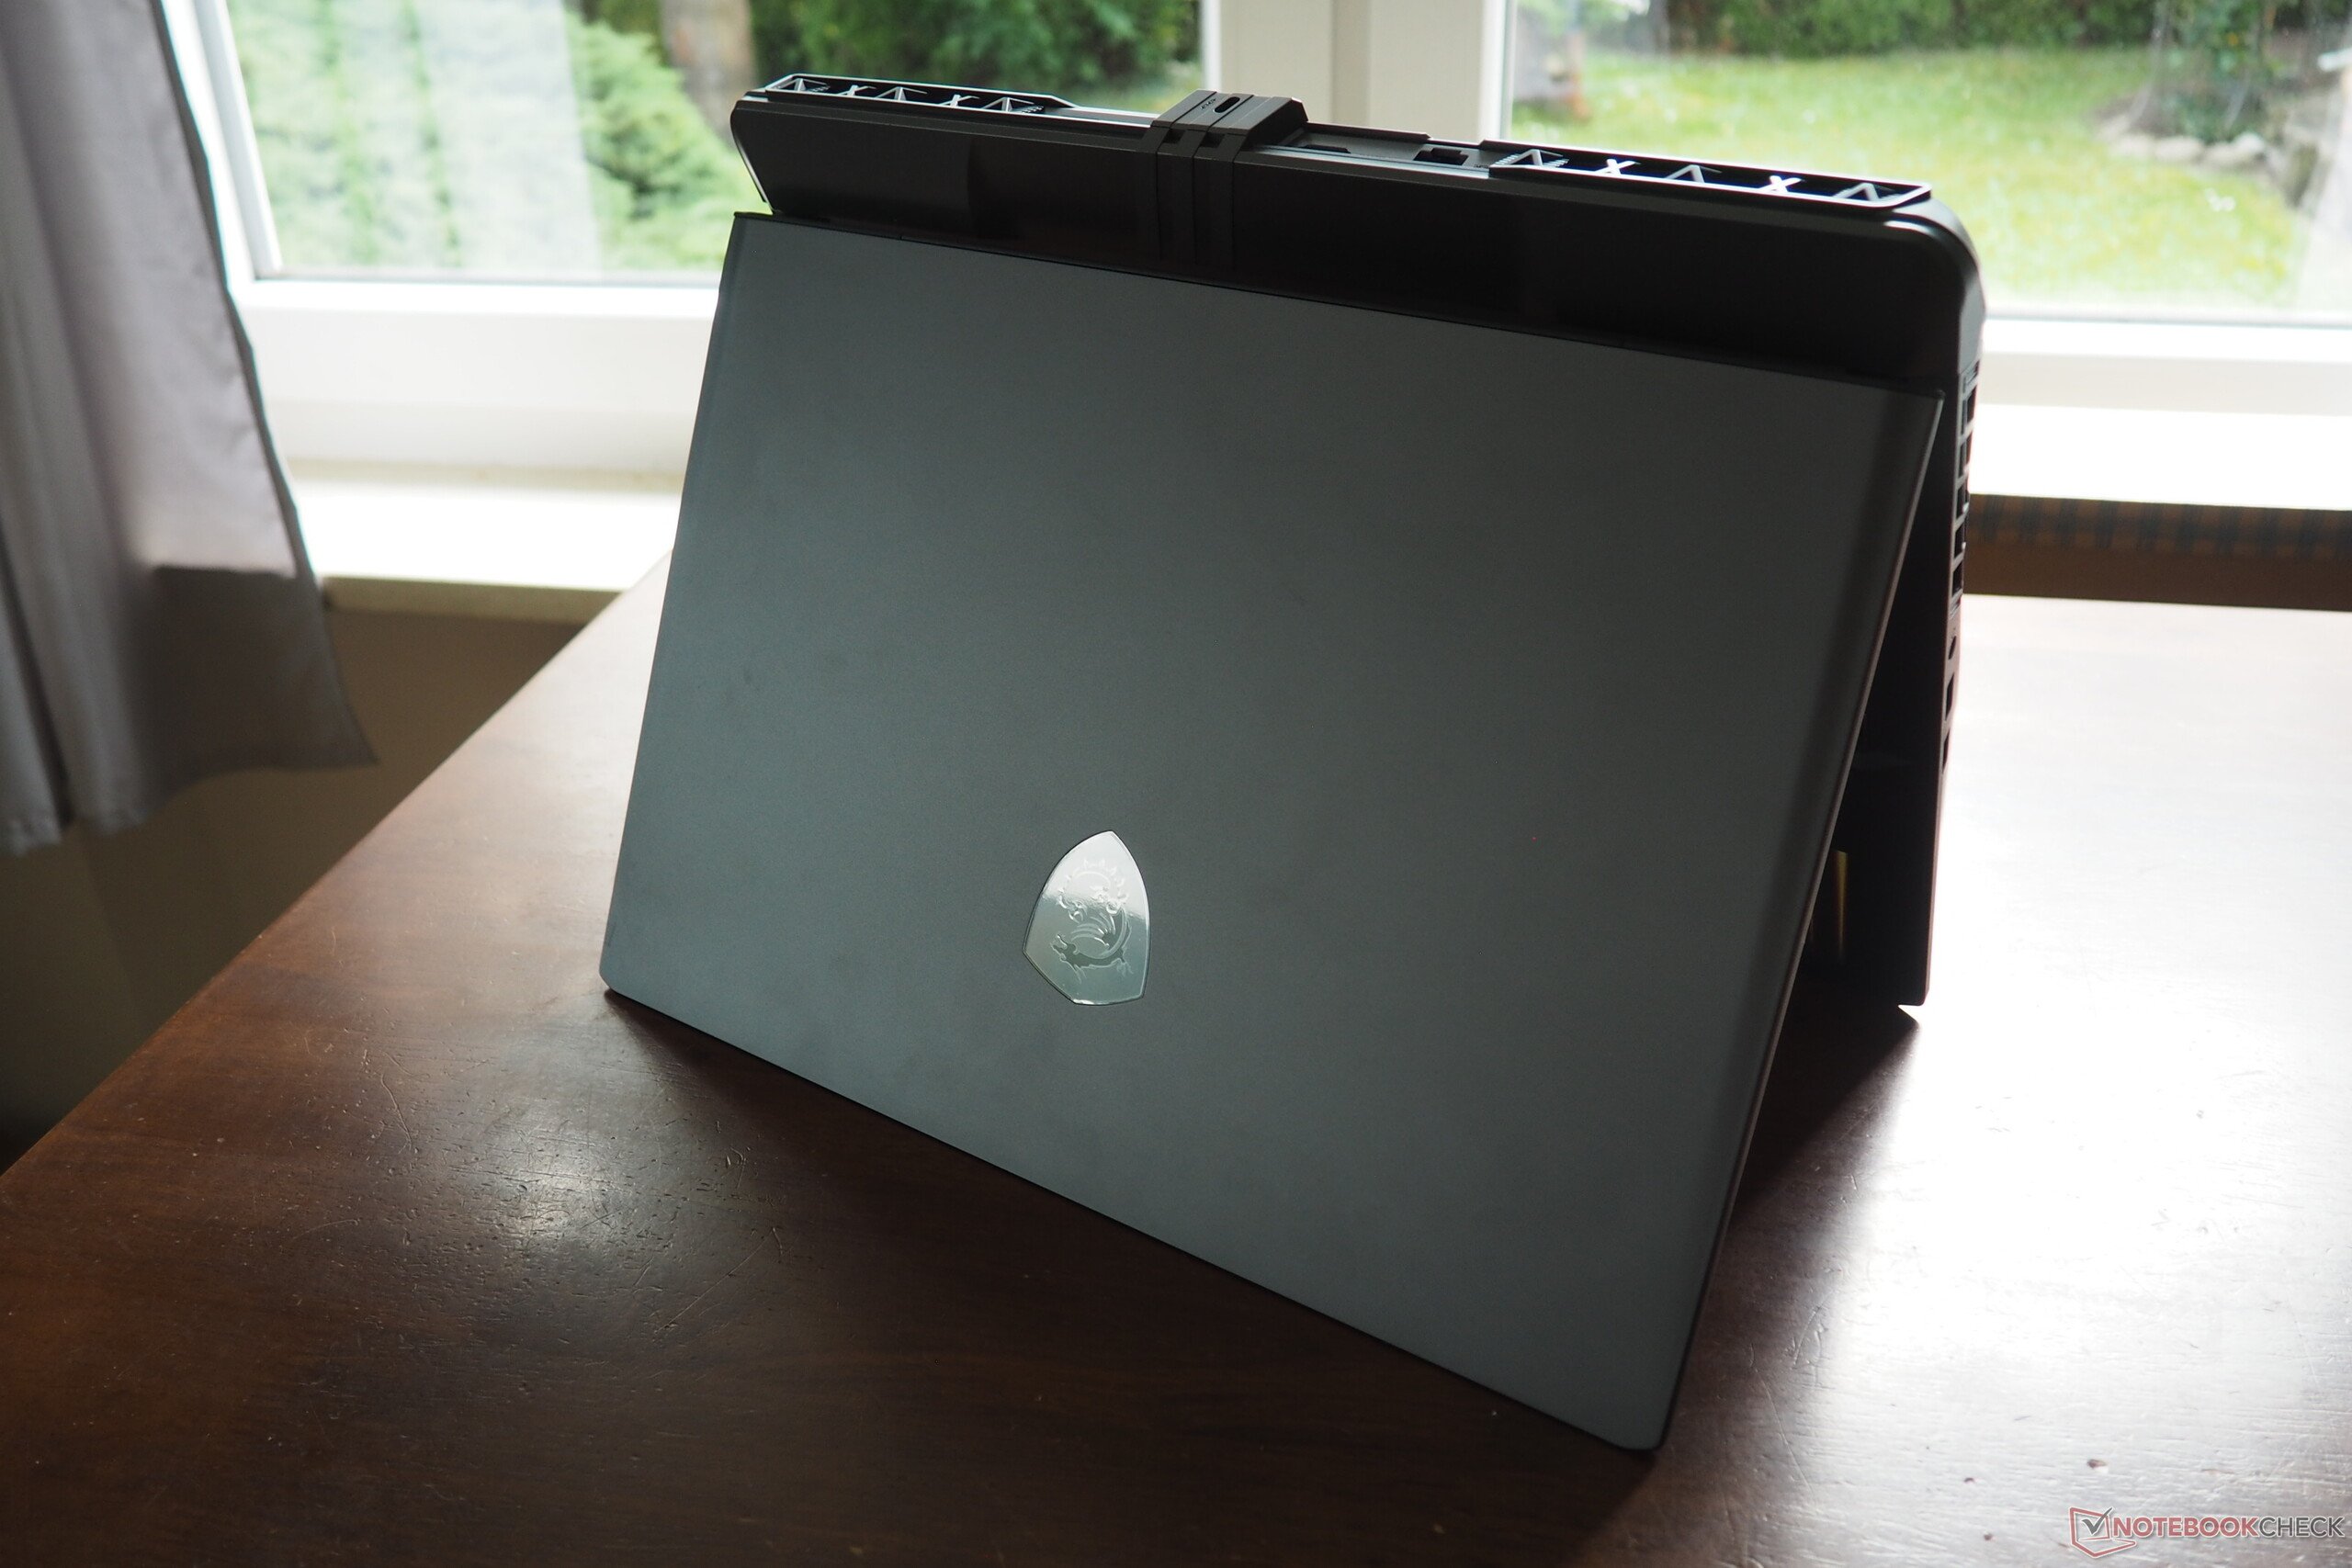
如果仔细观察个别方面,就会发现一些批评意见。例如,虽然机箱总体上设计良好,但它的开启角度相对有限,而且后部明显笨重。典型的微星键盘布局也是个人喜好的问题。电源的尺寸和重量都特别大,更适合配备 RTX 5080 或 5090 的笔记本电脑。然而,最让我们头疼的是风扇控制不理想。在 AI 模式下,Vector 16 即使在空闲时也能清楚地听到风扇的声音。从整体上看,这款 16 英寸的机器仍然获得了可靠的总体评价,尽管它离 "非常好 "还差一点。
Pros
Cons
价格和供应情况
微星 Vector 16 HX AI A2XWHG 配备酷睿至尊 7 255HX 和GeForce RTX 5070 Ti,可在多家在线零售商处购买,起价约为 2100 美元。供货情况可能因地区而异。
- $1,580.00msi Vector 16 HX AI 16” 144Hz FHD+ Gaming Laptop: Intel Core Ultra 7-255HX, NVIDIA Geforce RTX 5070Ti, 16GB DDR5, 512GB NVMe SSD, Thunderbolt 5, Wi-Fi 6E, Win 11 Home: Cosmo Gray A2XWHG-212US
- $2,749.00MSI Vector 16 HX AI A2XW Vector 16 HX AI A2XWIG-420US 16" Gaming Notebook - QHD+ - 240 Hz - Intel Core Ultra 9 275HX - 32 GB - 1 TB SSD - Cosmos Gray
- $1,756.00MSI Vector 16 HX AI A2XWHG-275US 16" Gaming Notebook - Full HD Plus - 144 Hz - Intel Core Ultra 7 255HX - 16 GB - 1 TB SSD - Cosmos Gray
Vector 16 的竞争对手包括其他新发布的 16 至 17 英寸游戏笔记本电脑,如 申克 XMG Pro 16 E25以及 Alienware 16 Area-51以及微星自己的 Katana 17 HX.前一个型号 型号我们评测的这款机型配备了酷睿 i9-14900HX和 GeForce RTX 4080也出现在我们的对比表中。
规格
底盘
底盘在很大程度上保留了前代车型的设计语言 设计语言在端口选择和布局方面进行了微妙的改进。在制造质量方面,与有些轻浮和不结实的 Katana 17 相比,它给人一种明显更加坚实和优质的感觉。虽然只有盖子是金属制造的,但底座依然给人坚固耐用的感觉。大胆的线条和醒目的外形显然是针对游戏用户设计的。Vector 16 HX AI 的重量为 2.6 千克,与其他 16 英寸竞争产品相比毫不逊色,只有 Alienware 16 因其 3.3 千克的重型机身而脱颖而出。总体而言,该机的制造质量几乎无可挑剔。
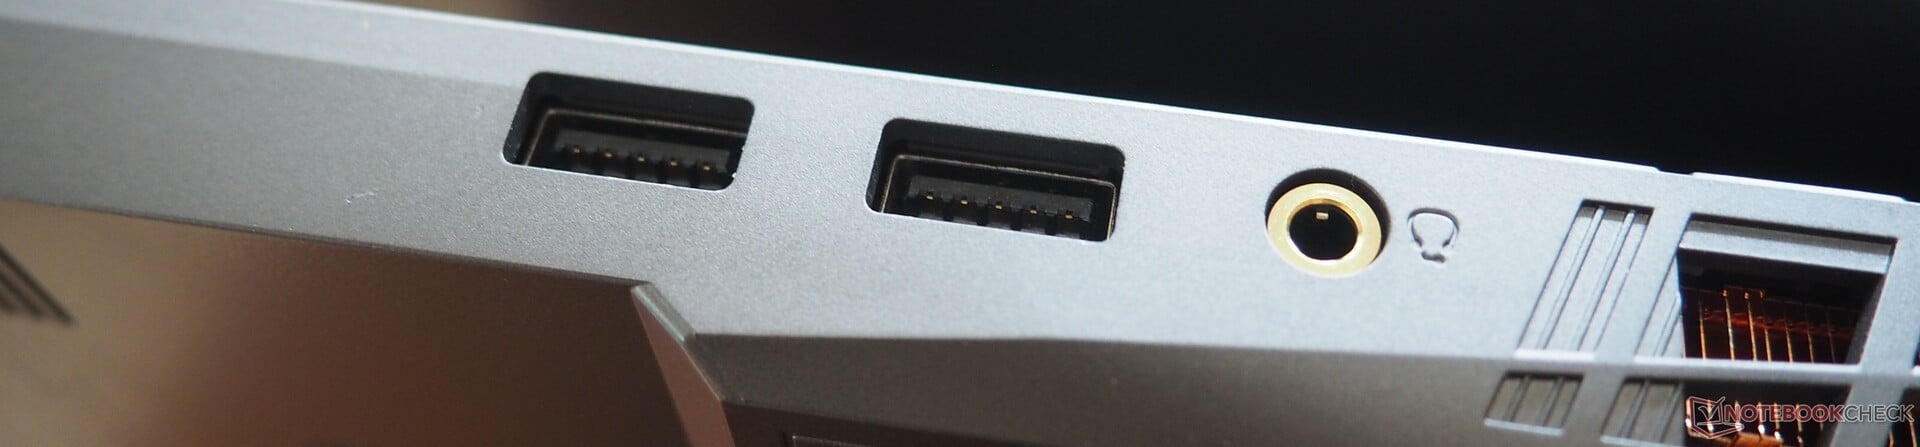
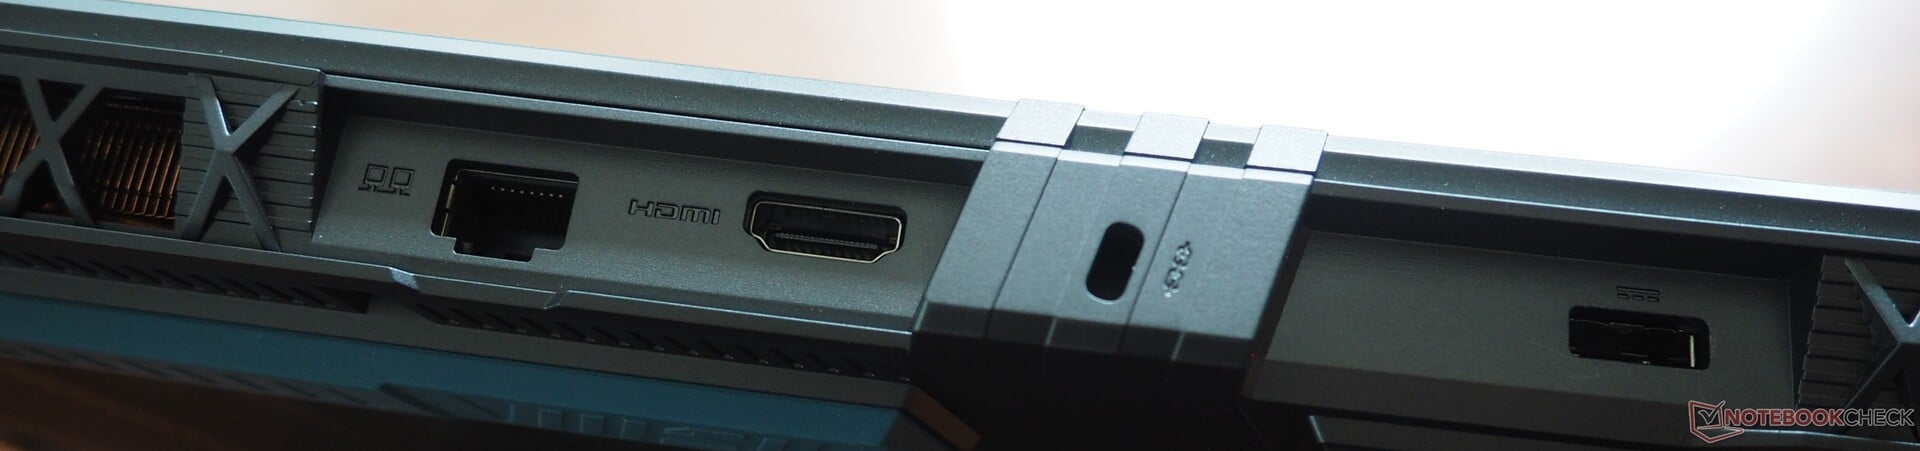
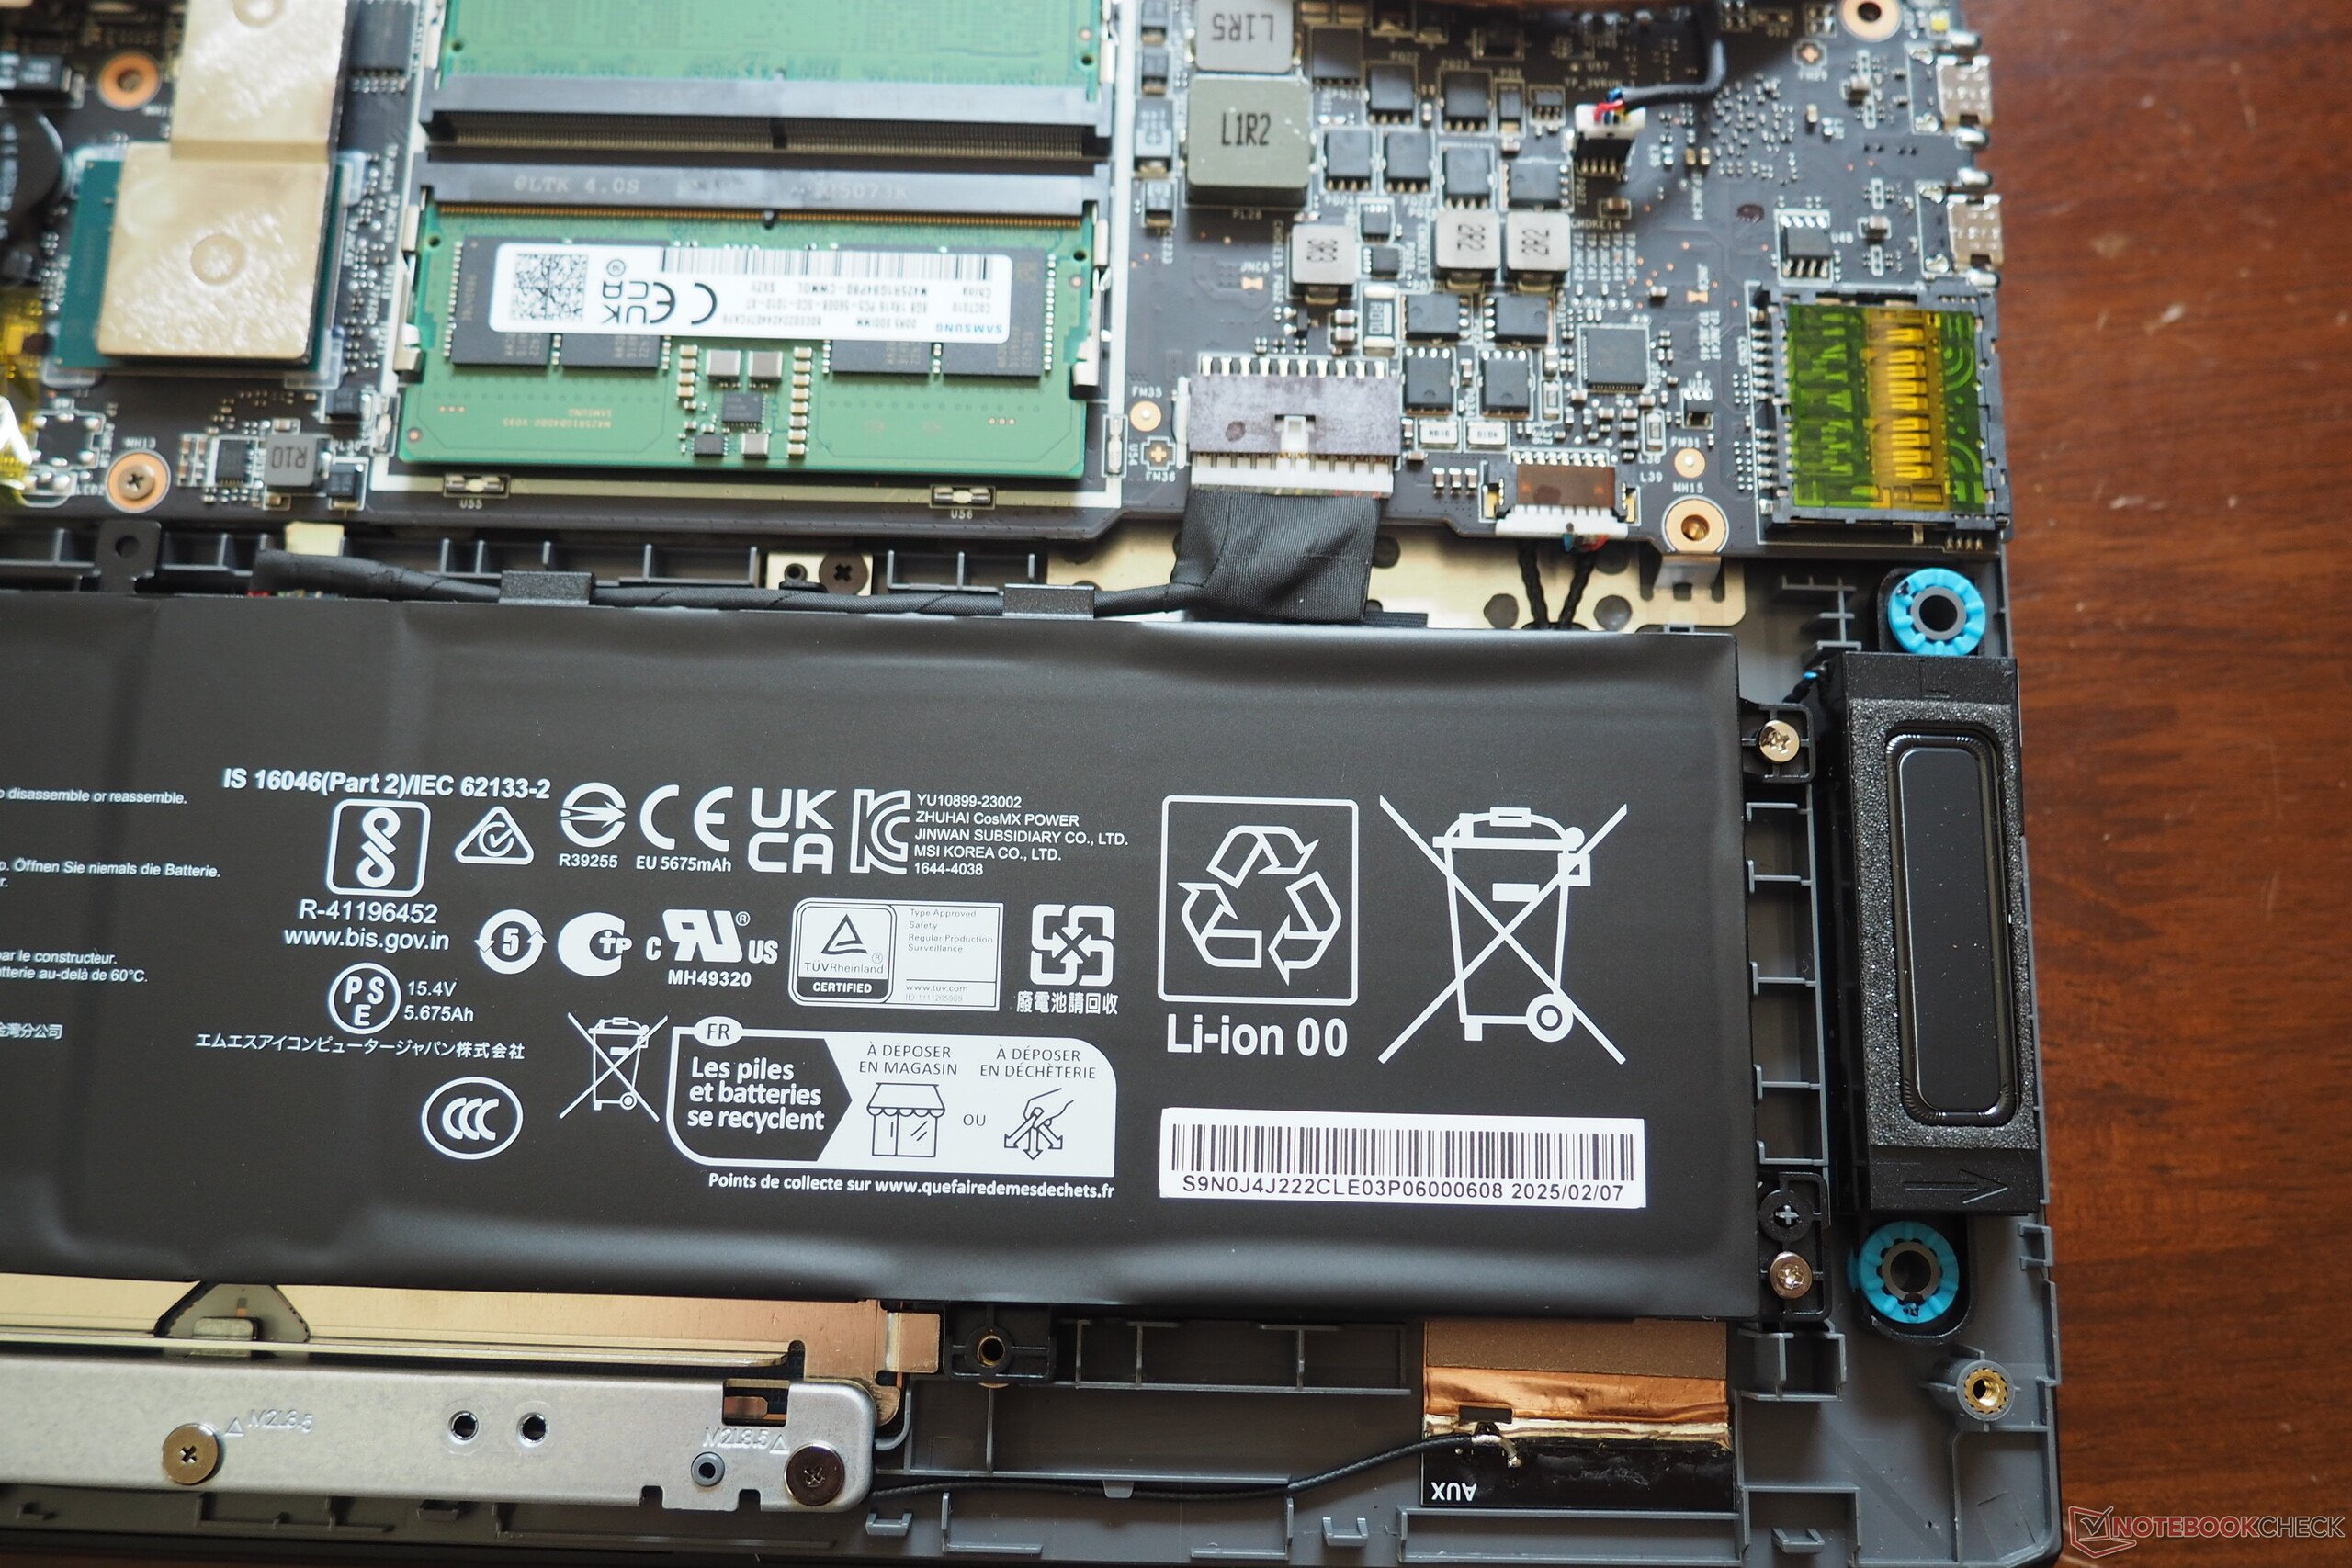
连接性和功能
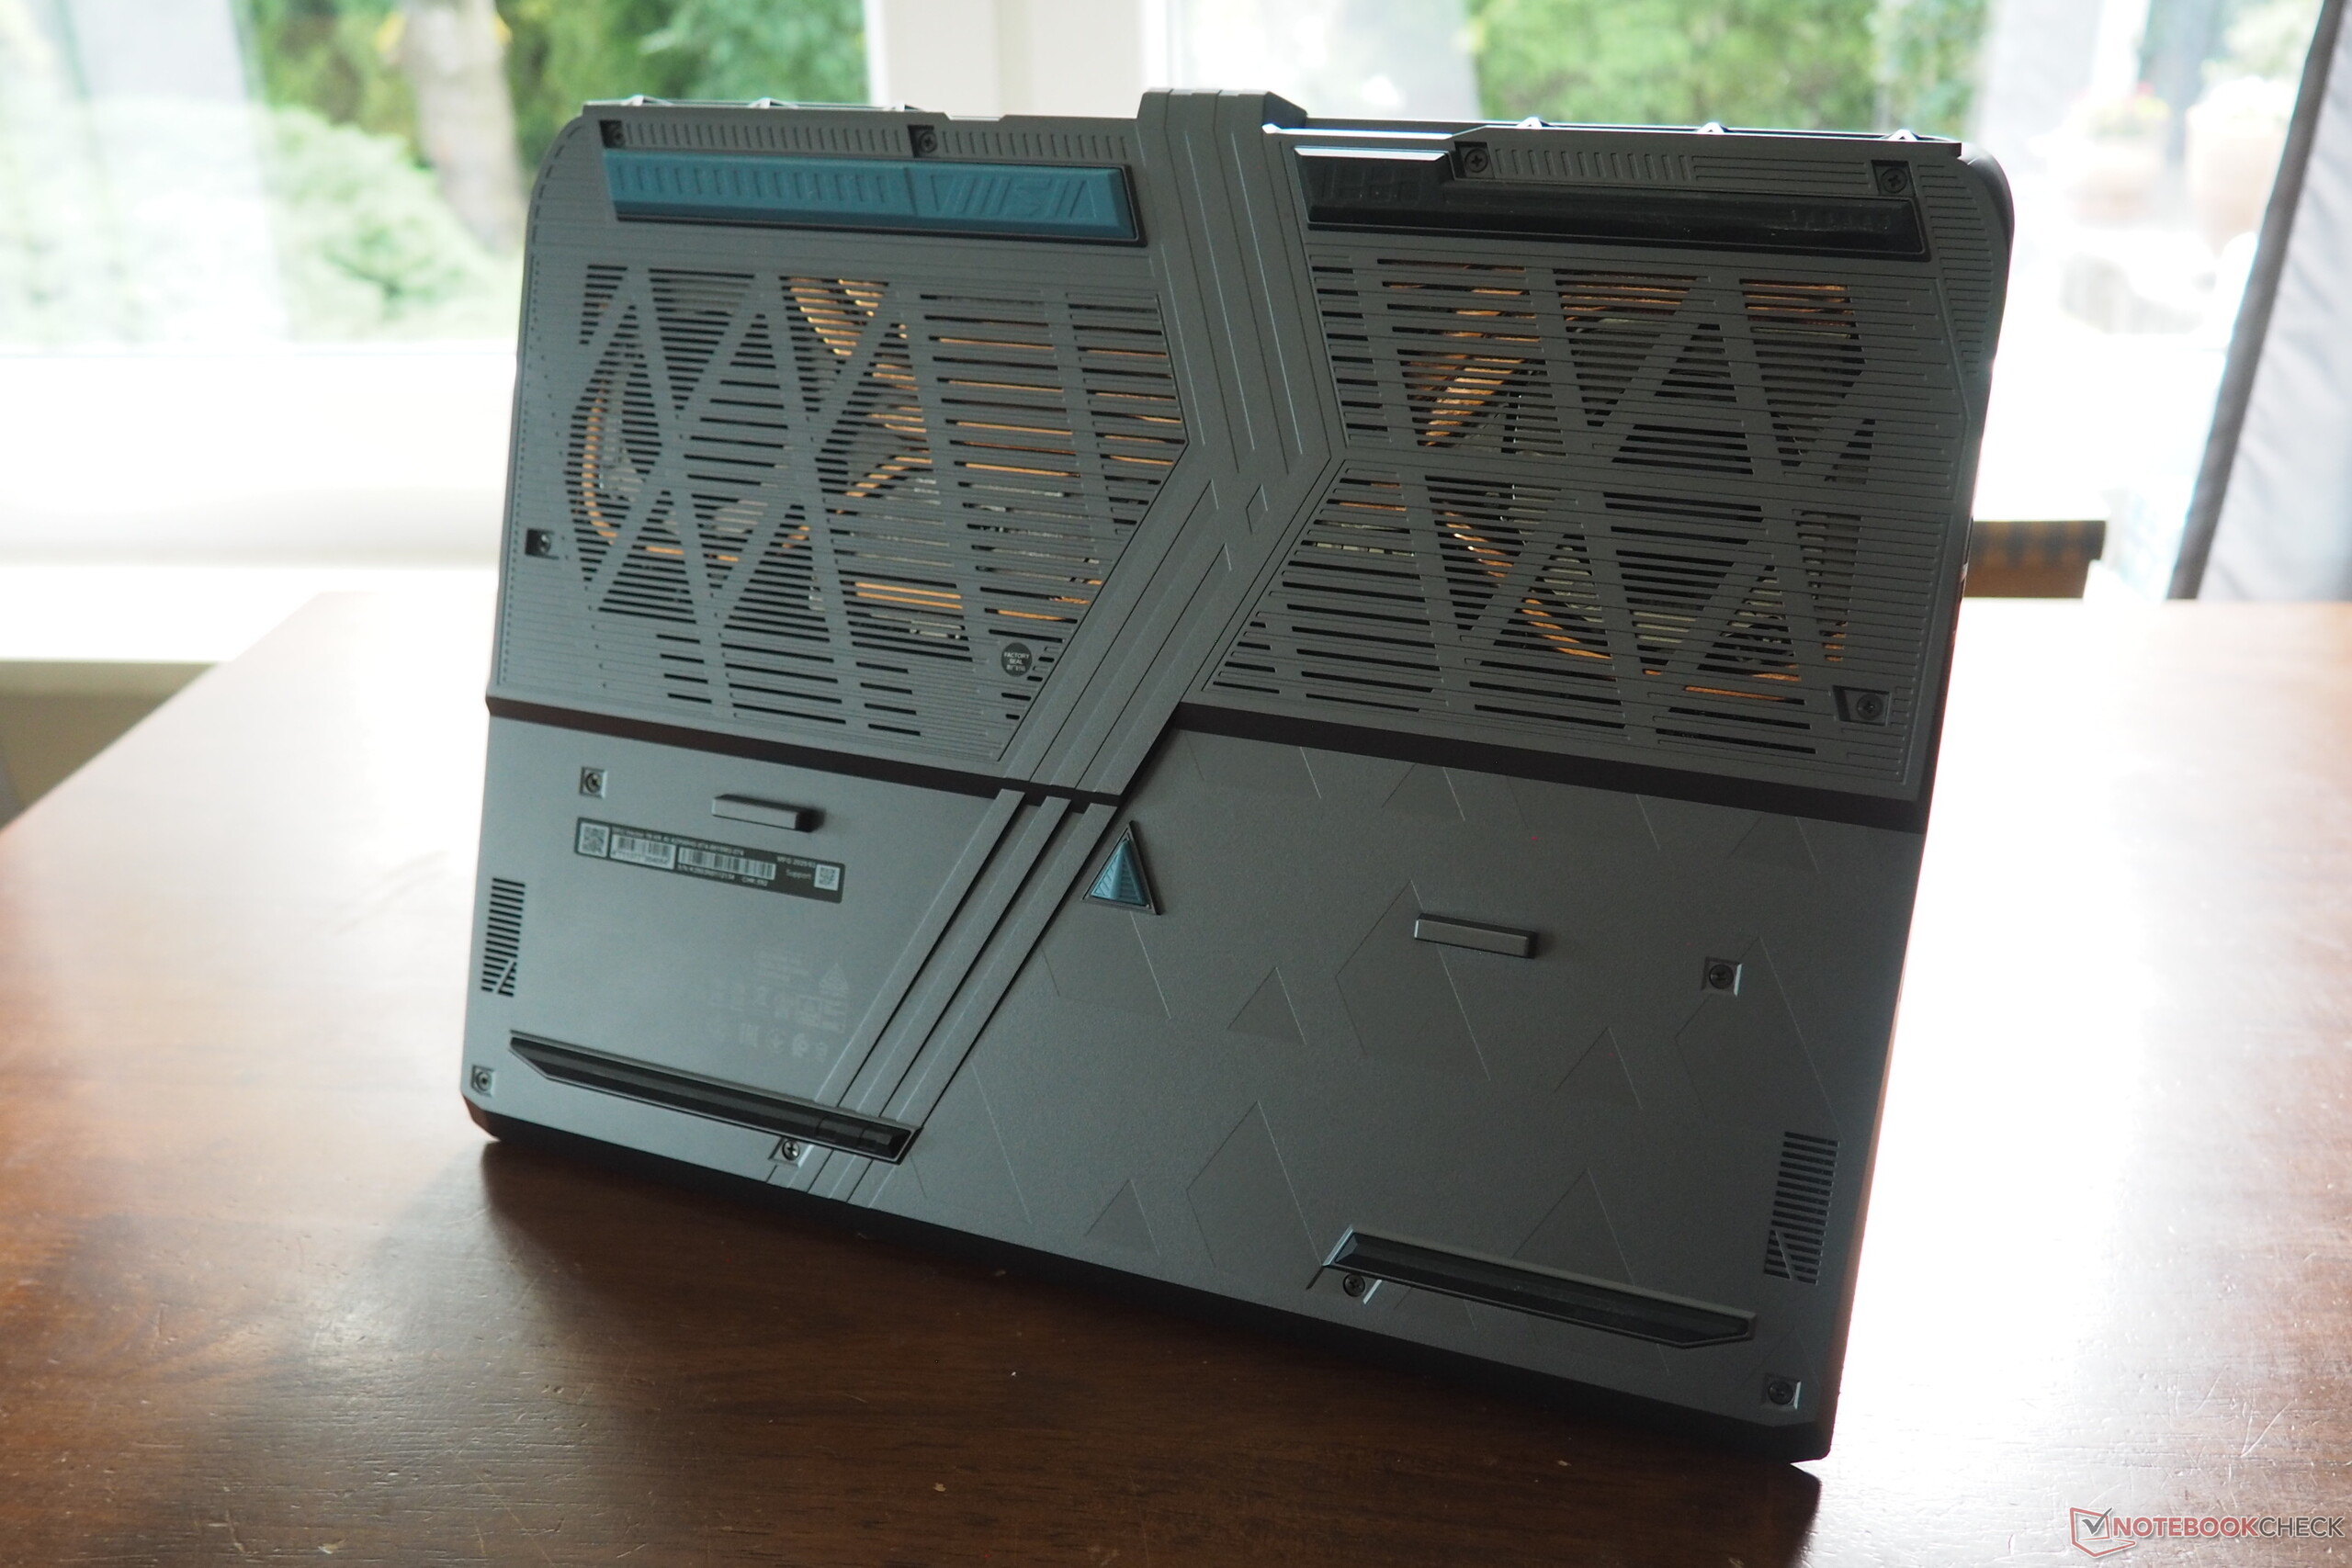
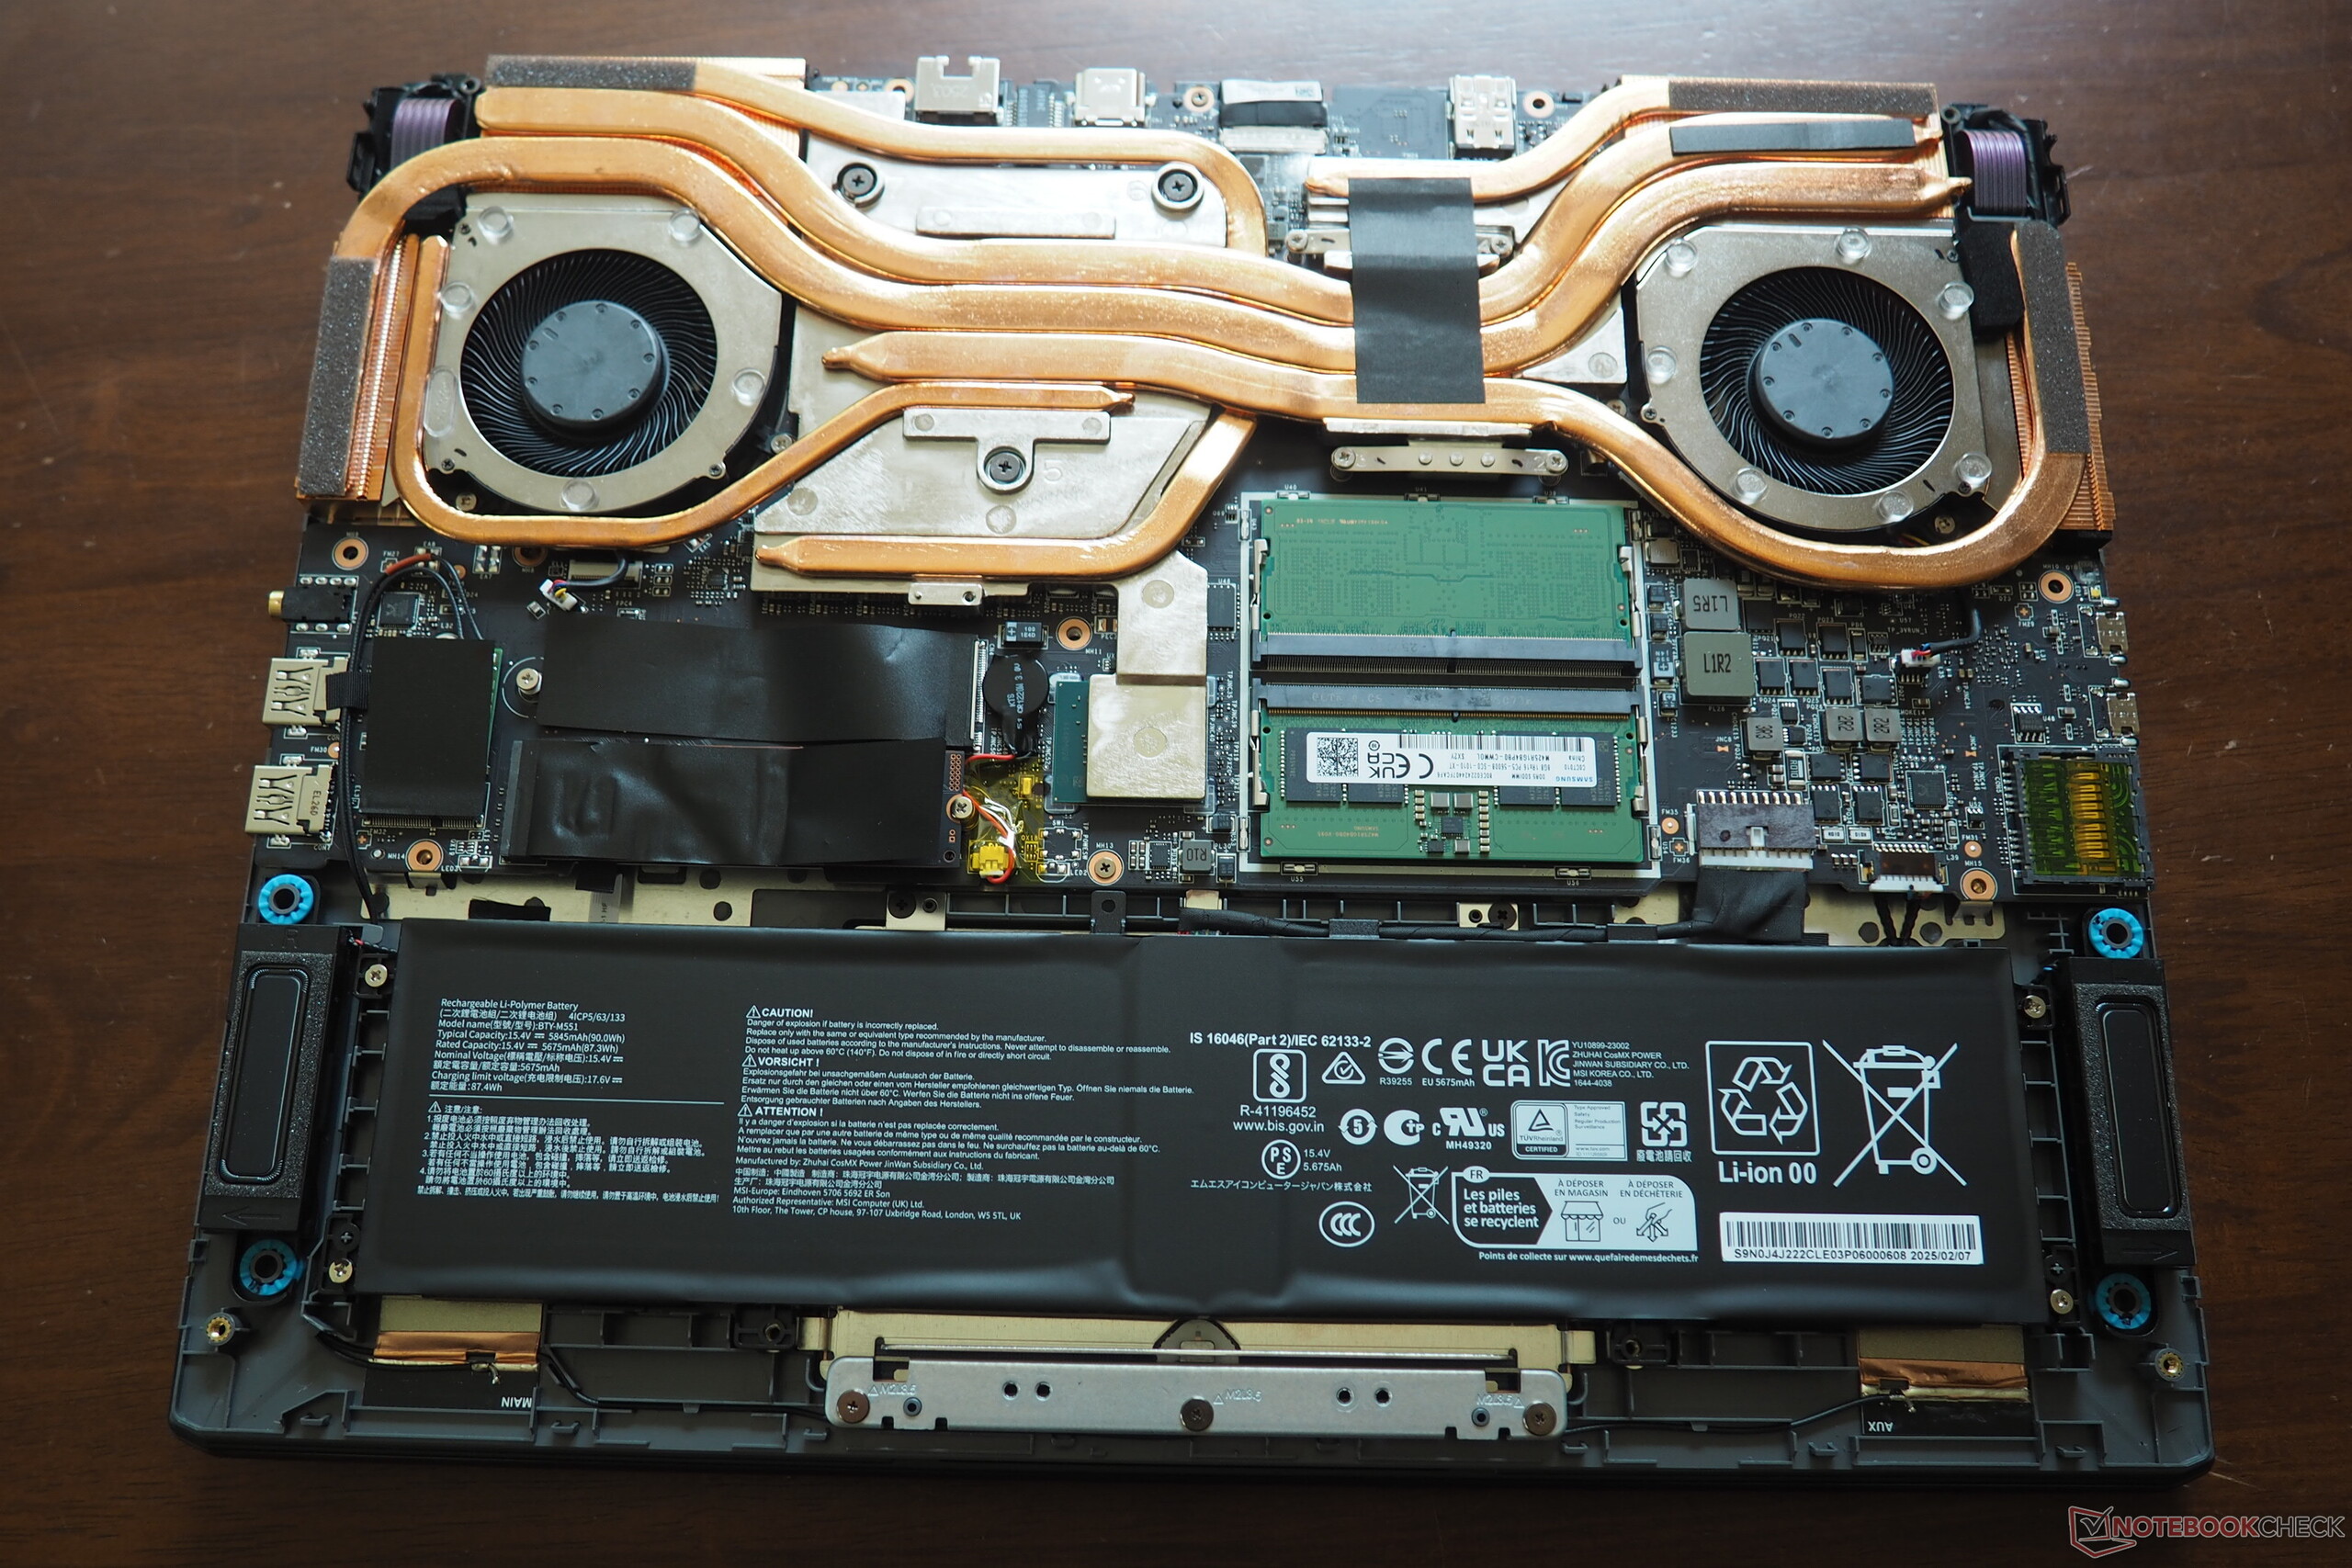
微星在连接性方面全力以赴。左侧有两个支持 Power Delivery 的 Thunderbolt 5 端口、USB 4 和 DisplayPort 2.1。右侧有两个 USB-A 3.1 Gen2 端口。此外,还有一个 HDMI 2.1 输出端口、一个 2.5 Gbit 以太网端口、一个组合音频插孔、一个 Kensington 锁插槽和一个速度适中的读卡器。无线通信由英特尔的 Wi-Fi 6E 模块(AX211)负责,该模块在接收数据时性能特别强大。全高清网络摄像头以笔记本电脑的标准来看还算不错,但并不特别令人印象深刻。与前代机型一样,该机的维护工作依然有些麻烦,因为与其他设备相比,打开机箱更加困难,也更加费时。

SD 读卡器
| SD Card Reader | |
| average JPG Copy Test (av. of 3 runs) | |
| Alienware 16 Area-51 (Toshiba Exceria Pro SDXC 64 GB UHS-II) | |
| Schenker XMG Pro 16 (E25) (Angelbird AV Pro V60) | |
| Average of class Gaming (20.9 - 210, n=55, last 2 years) | |
| MSI Vector 16 HX A14V (Toshiba Exceria Pro SDXC 64 GB UHS-II) | |
| MSI Vector 16 HX AI A2XWHG (AV PRO microSD 128 GB V60) | |
| maximum AS SSD Seq Read Test (1GB) | |
| Schenker XMG Pro 16 (E25) (Angelbird AV Pro V60) | |
| Alienware 16 Area-51 (Toshiba Exceria Pro SDXC 64 GB UHS-II) | |
| Average of class Gaming (25.5 - 261, n=52, last 2 years) | |
| MSI Vector 16 HX A14V (Toshiba Exceria Pro SDXC 64 GB UHS-II) | |
| MSI Vector 16 HX AI A2XWHG (AV PRO microSD 128 GB V60) | |
交流
网络摄像头


维护
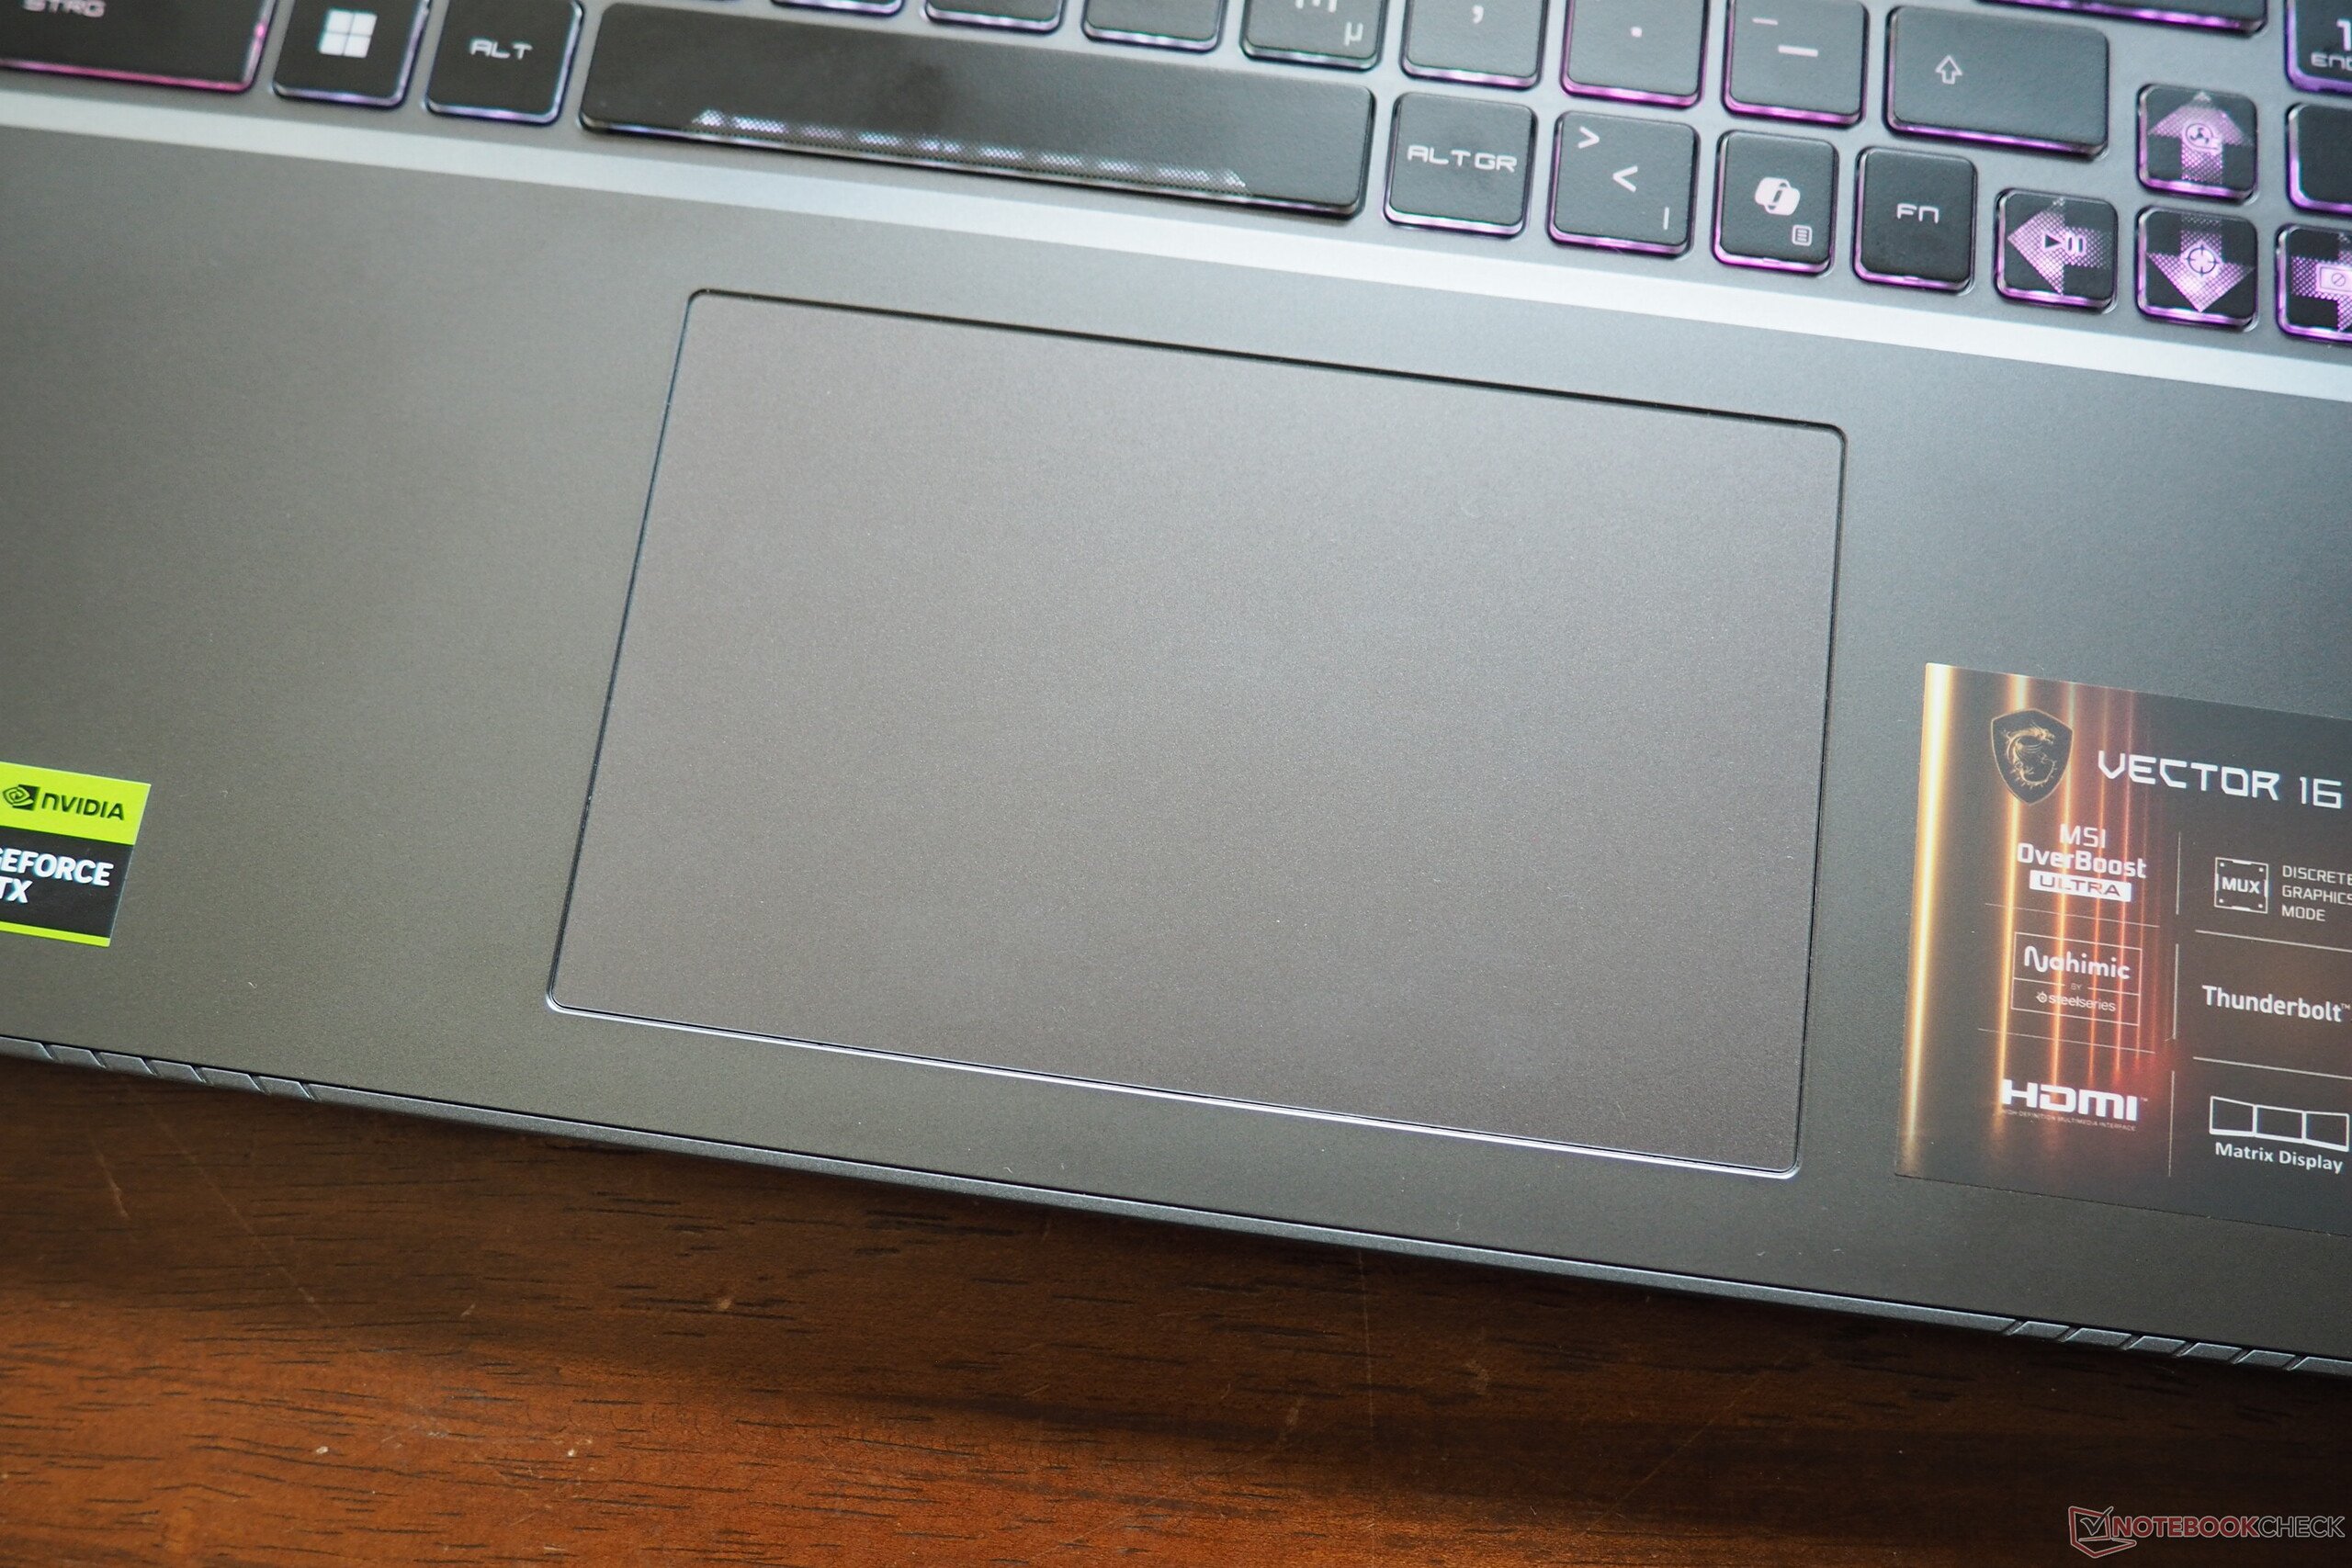
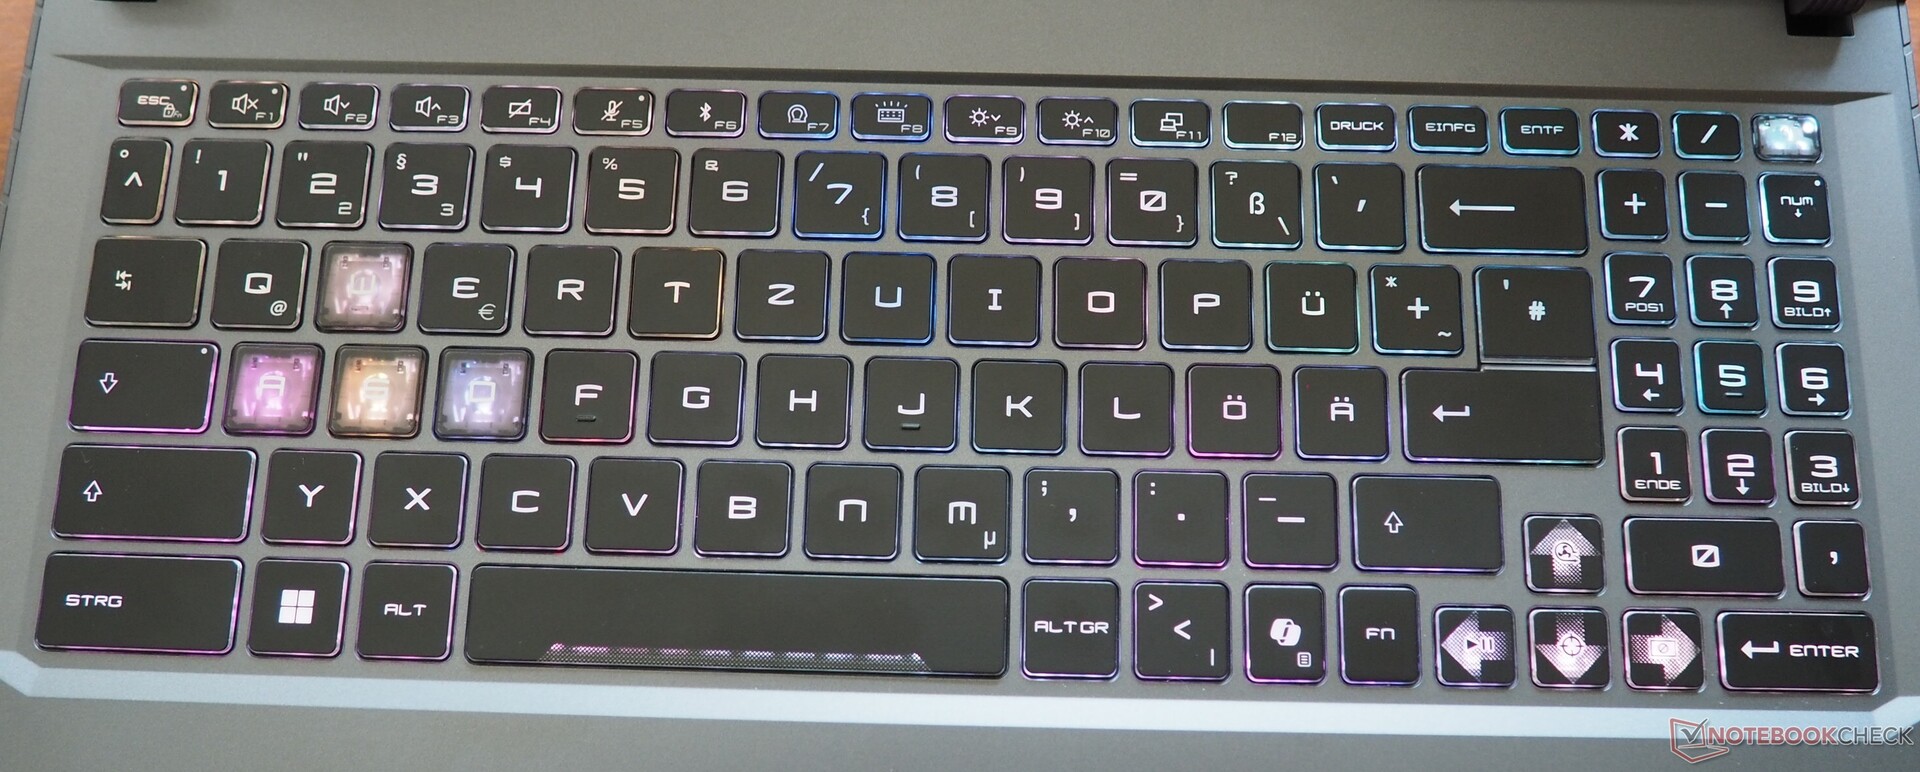
输入设备
几年来,微星一直坚持其非传统的键盘布局,这需要一些时间来适应。许多按键的位置都不符合标准布局。使用三列而非更常见的四列数字键盘的决定也让我们觉得有些奇怪。在键入手感方面,这款键盘整体表现不错,不过触感自然无法与机械键盘相媲美。该键盘的一大亮点是配备了大量 RGB 灯光,并可进行个性化定制。触摸板的尺寸为 13 厘米 x 8 厘米,滑动顺畅,精准度高。底部边缘的可点击区域反应可靠,但我们感觉有些松散。
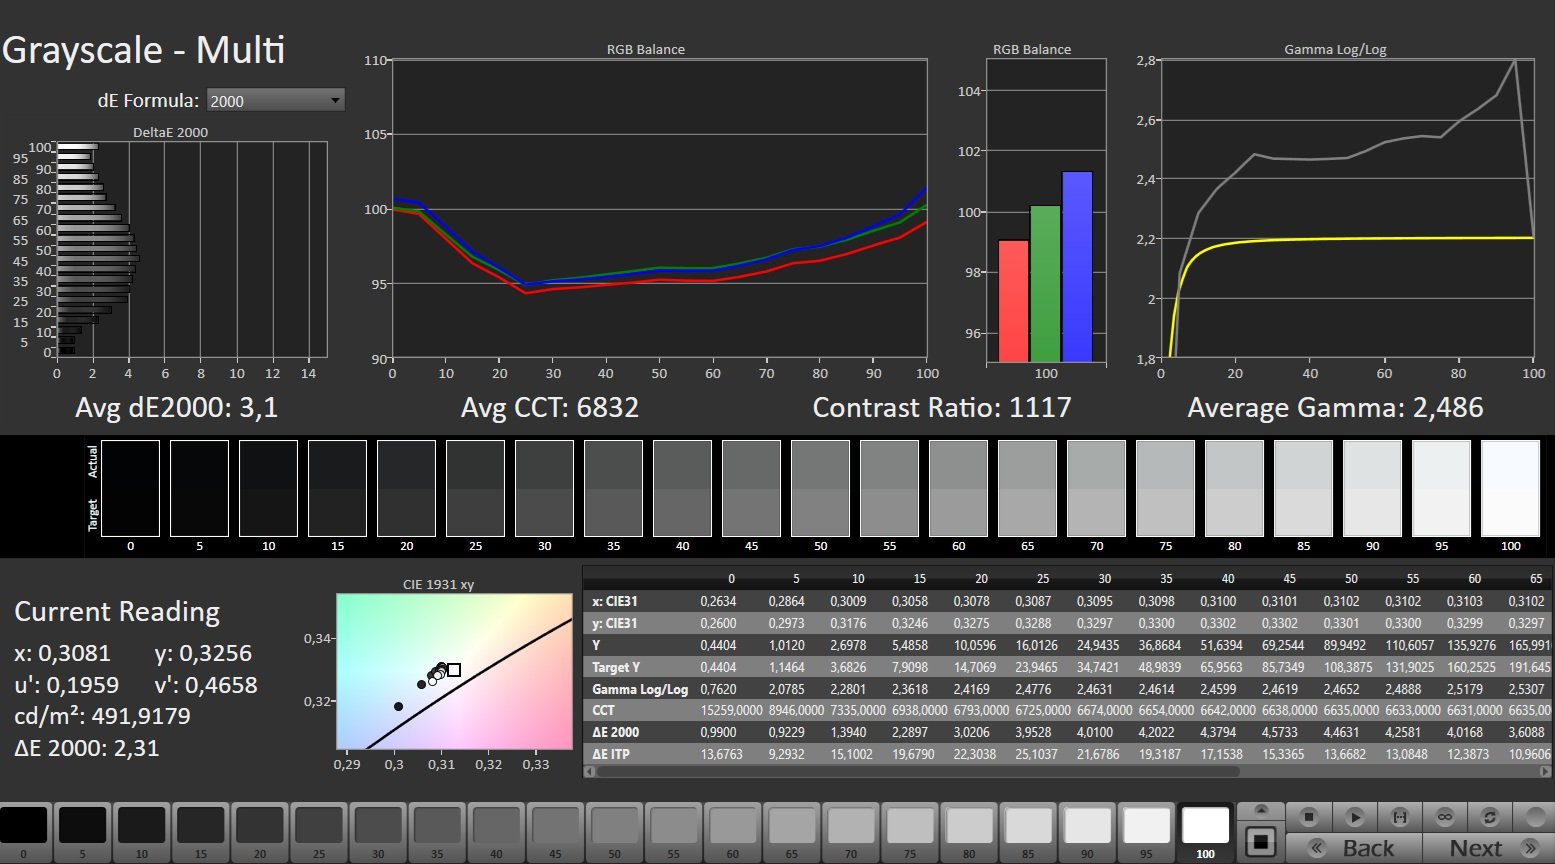
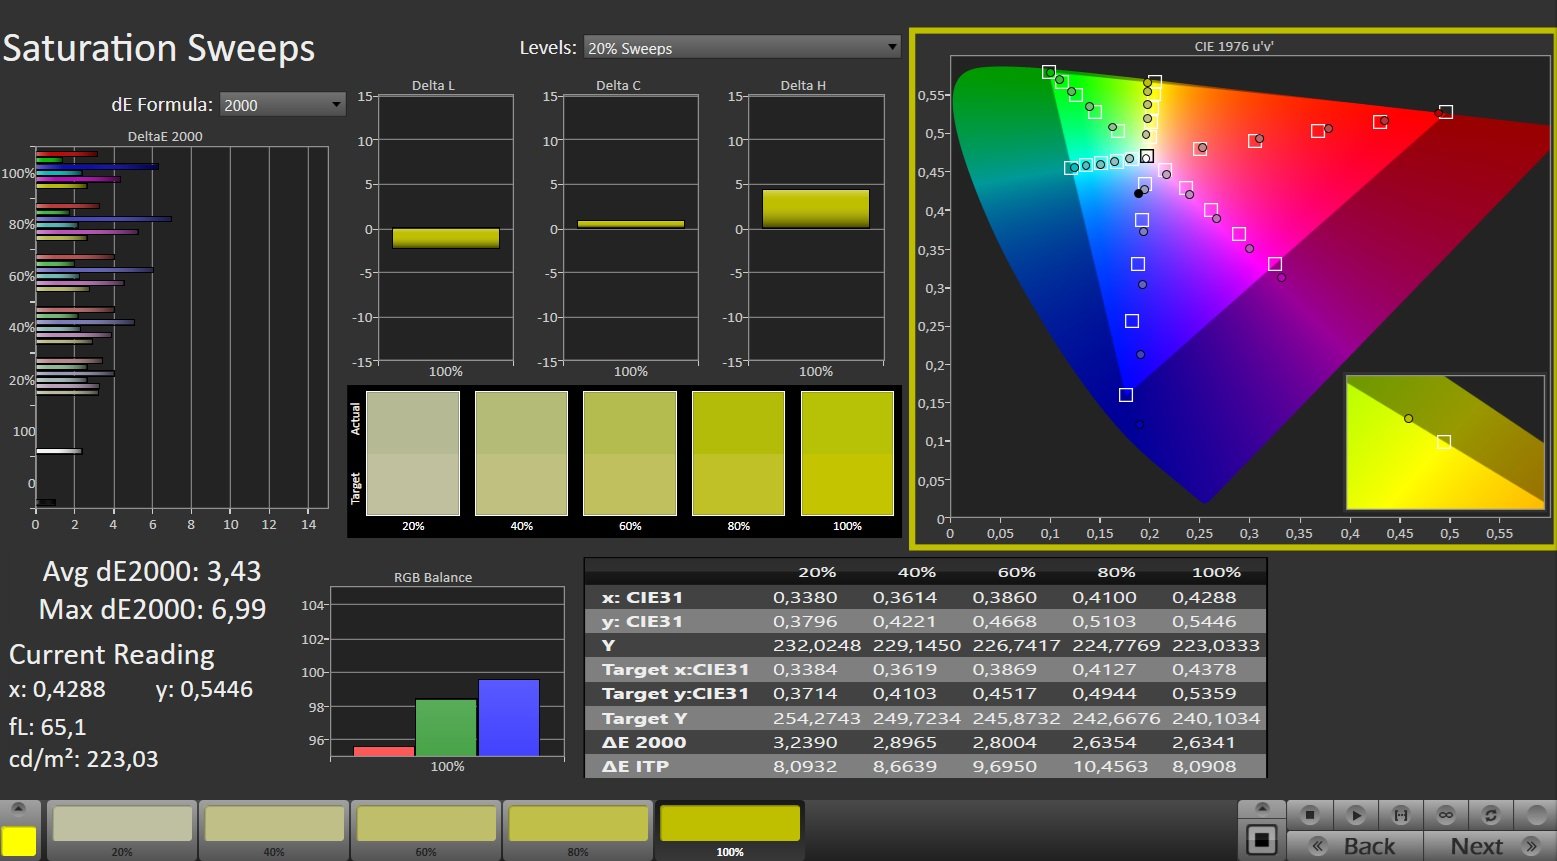
显示屏
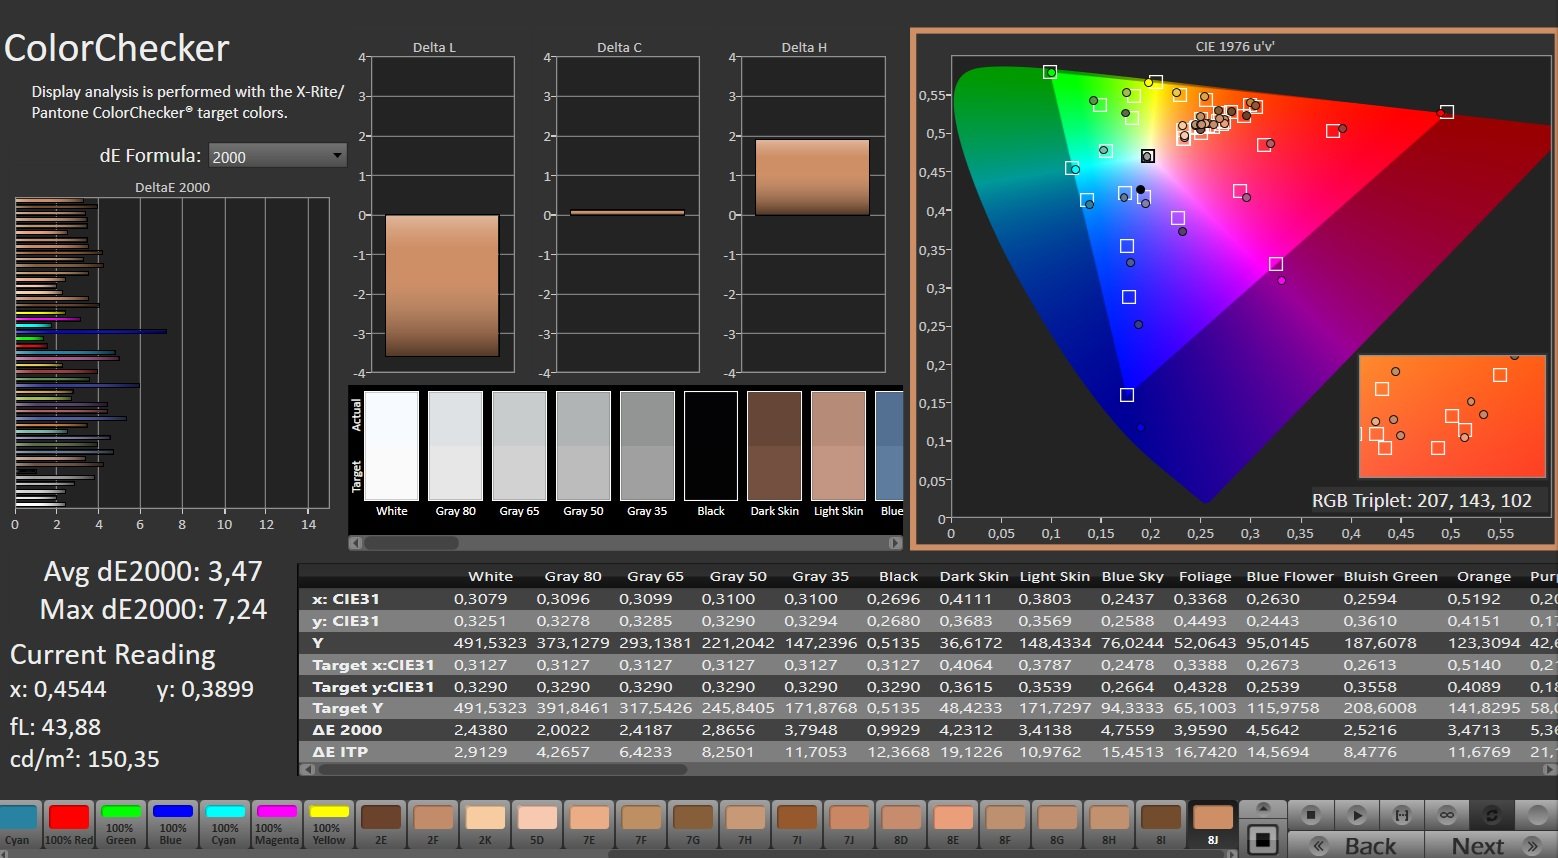
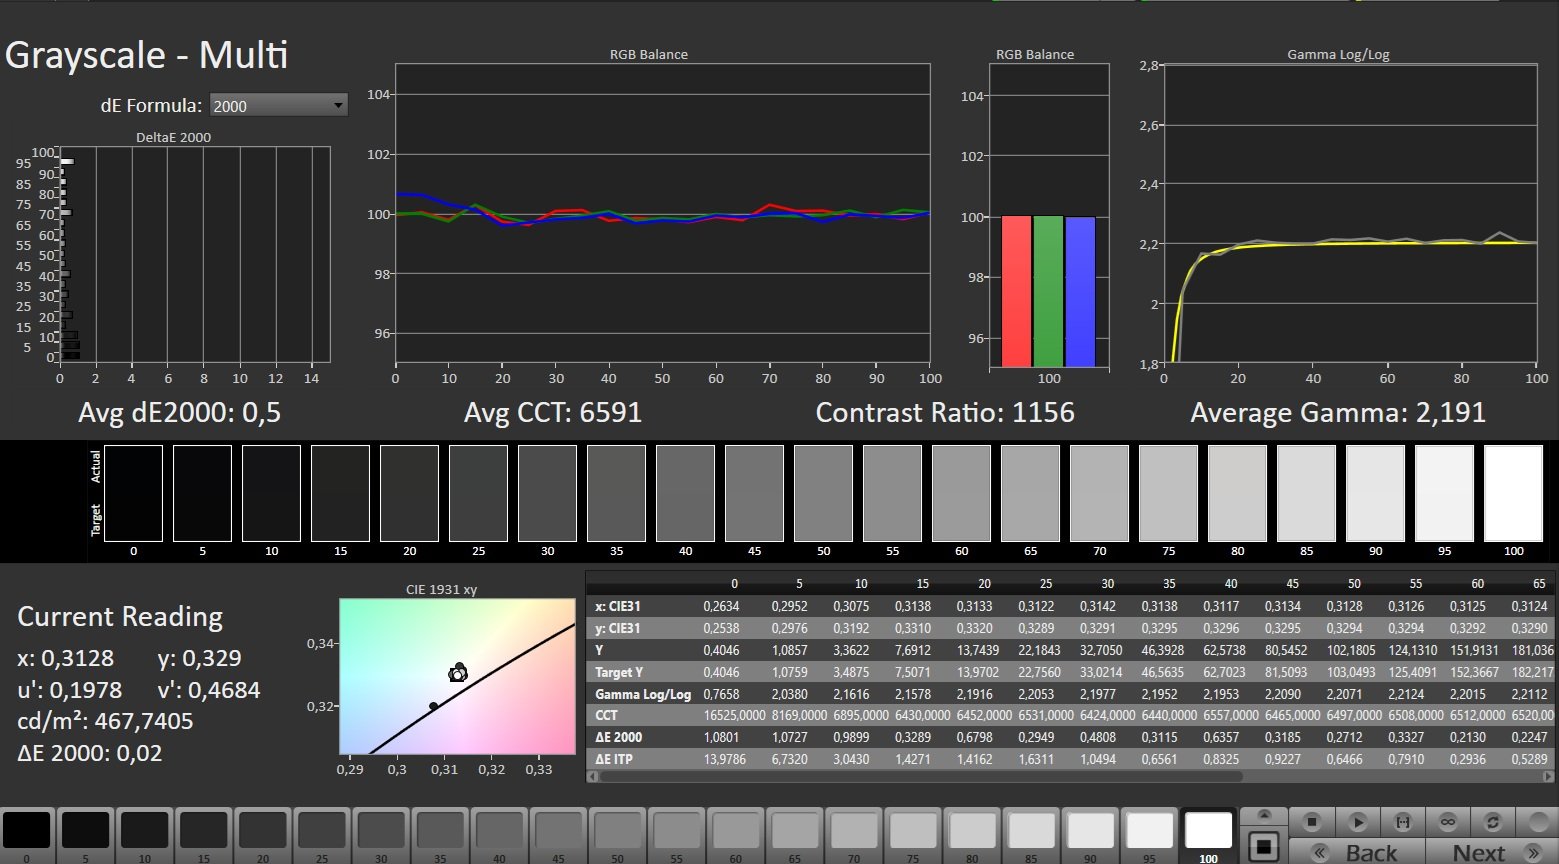
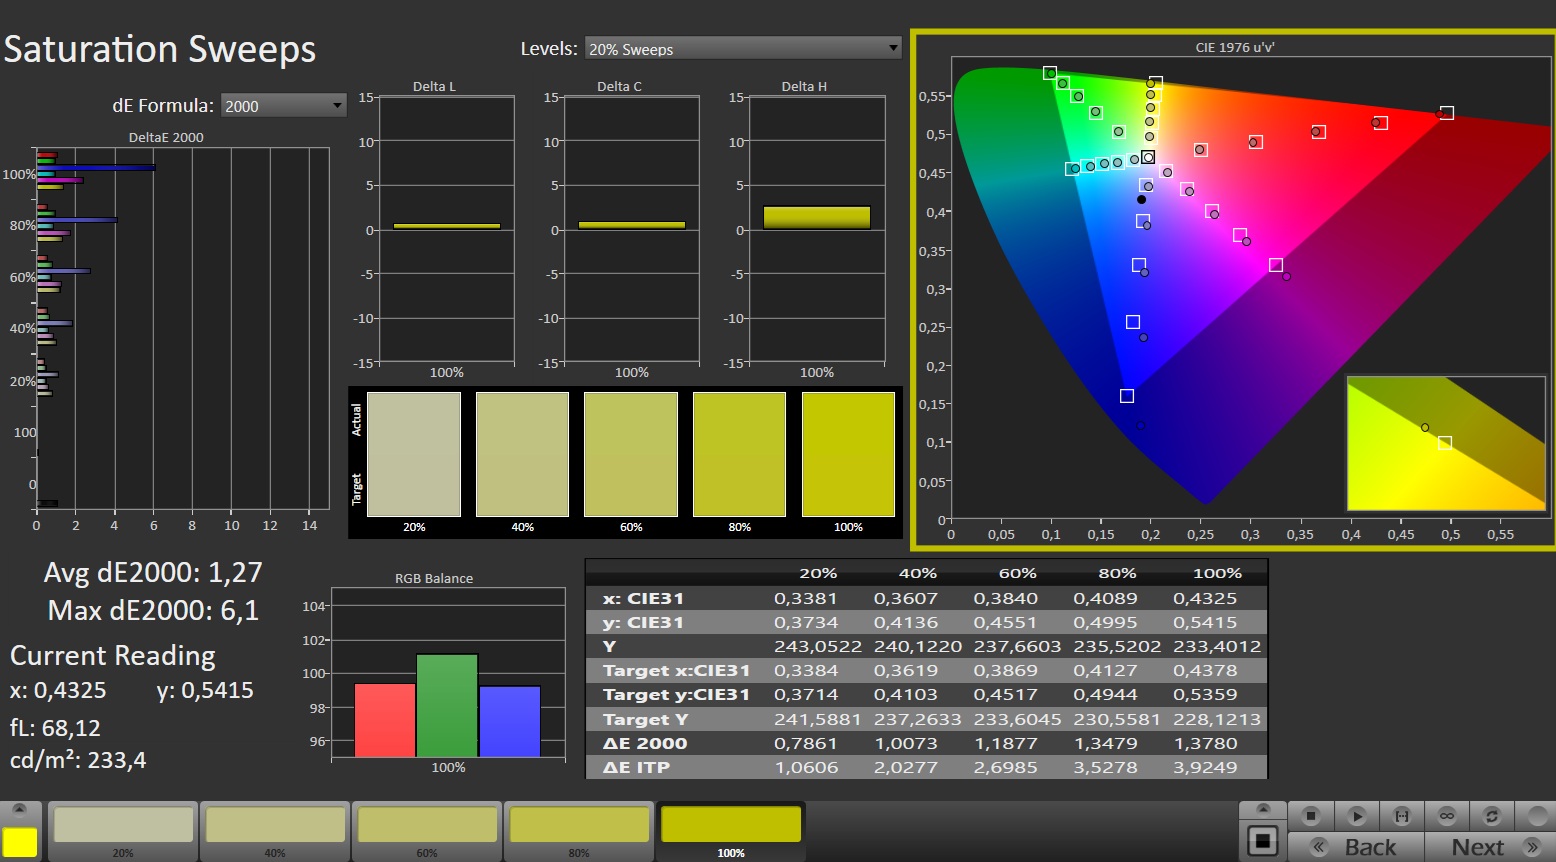
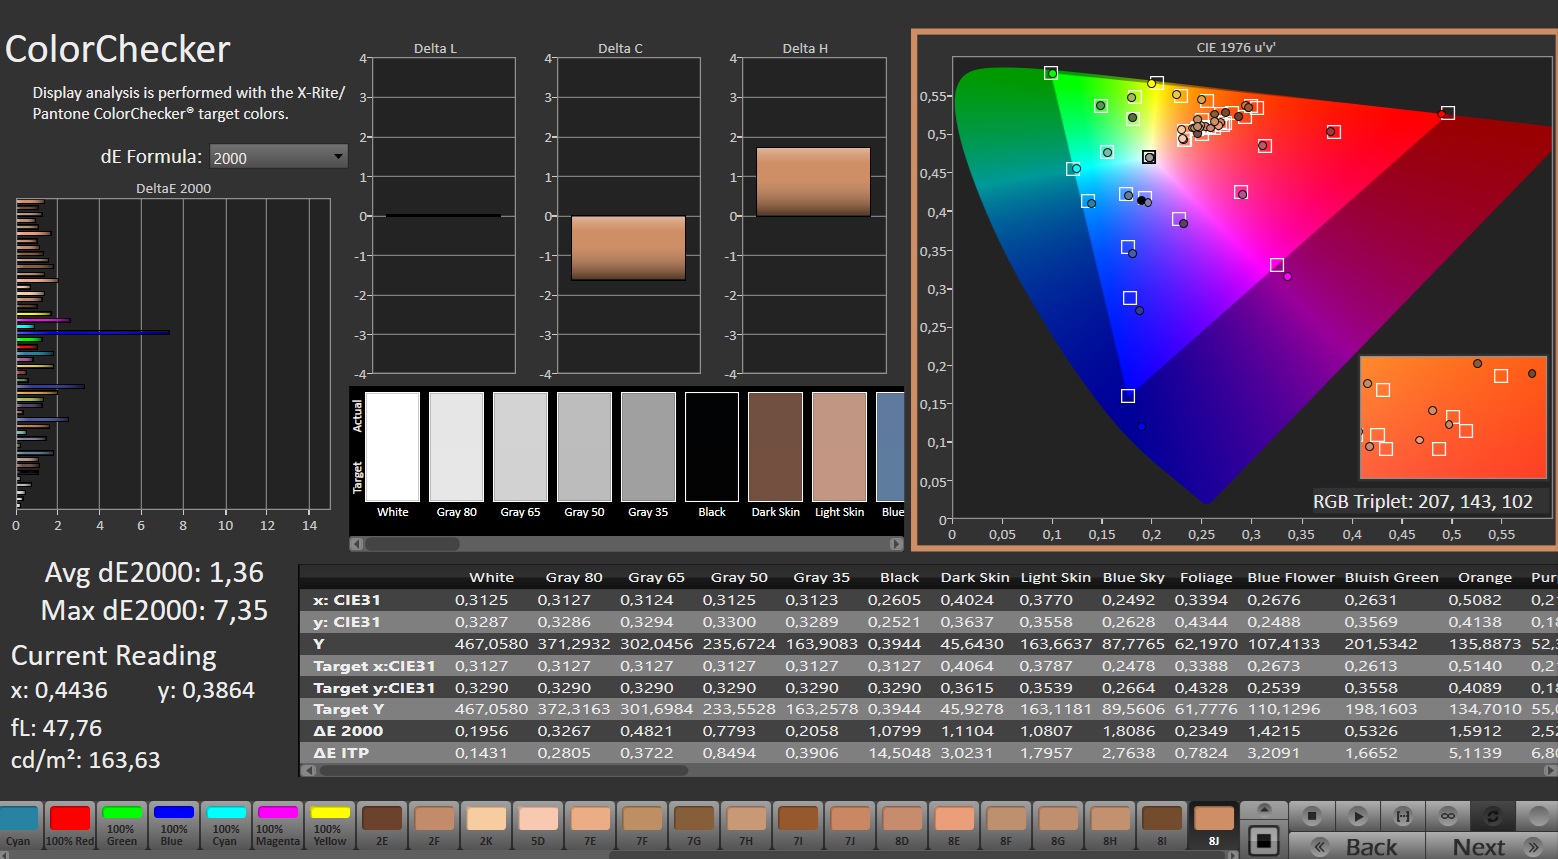
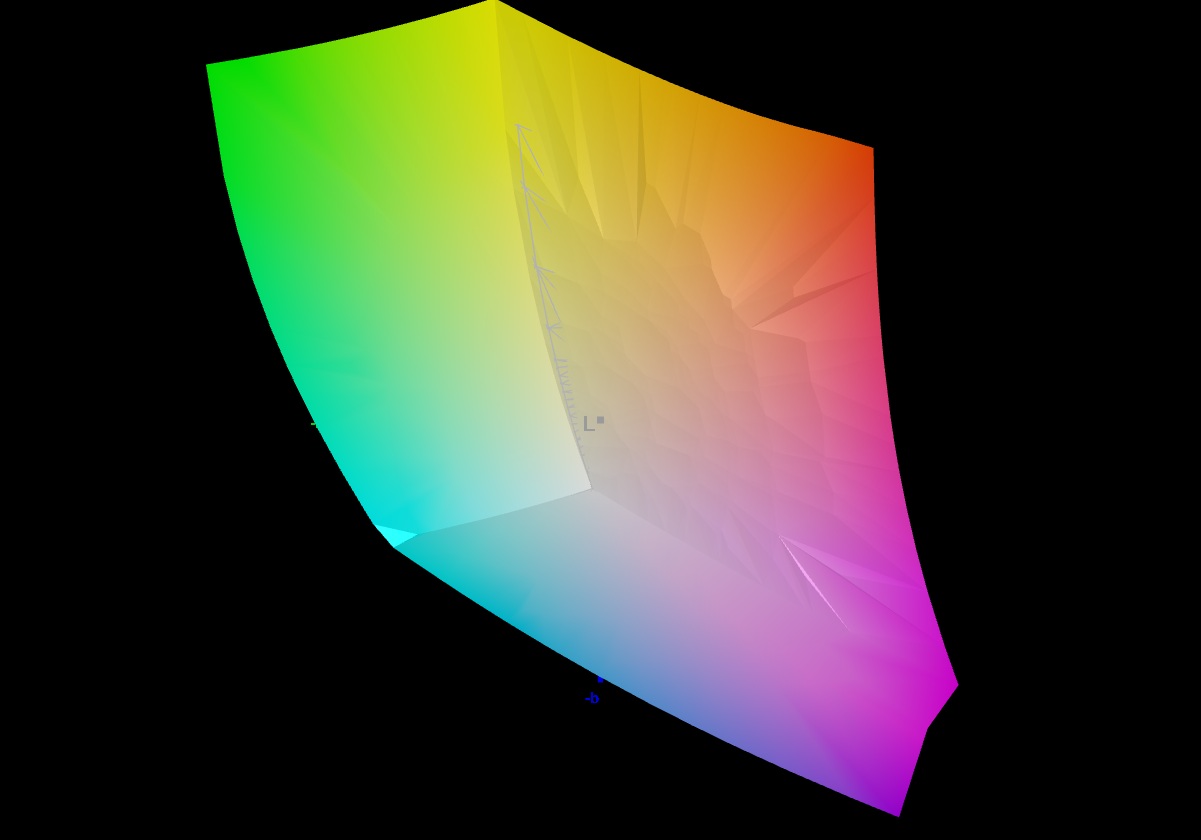
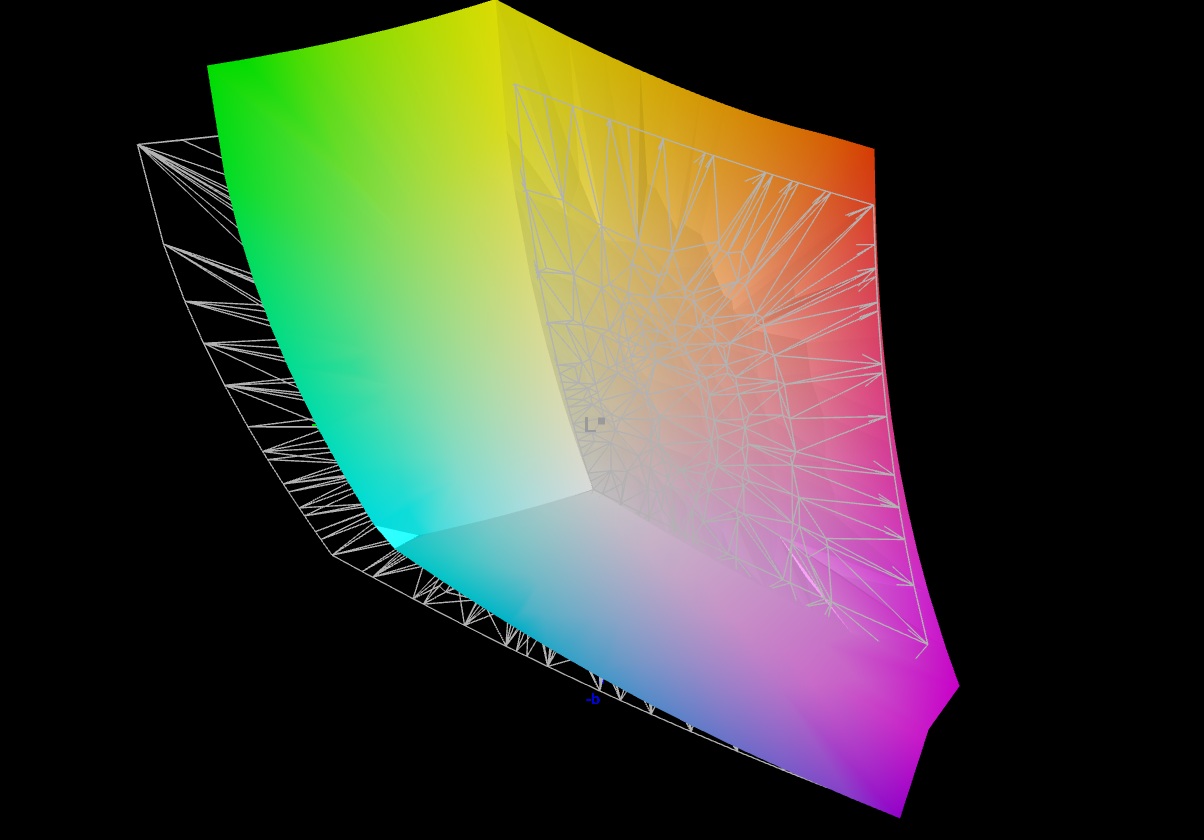
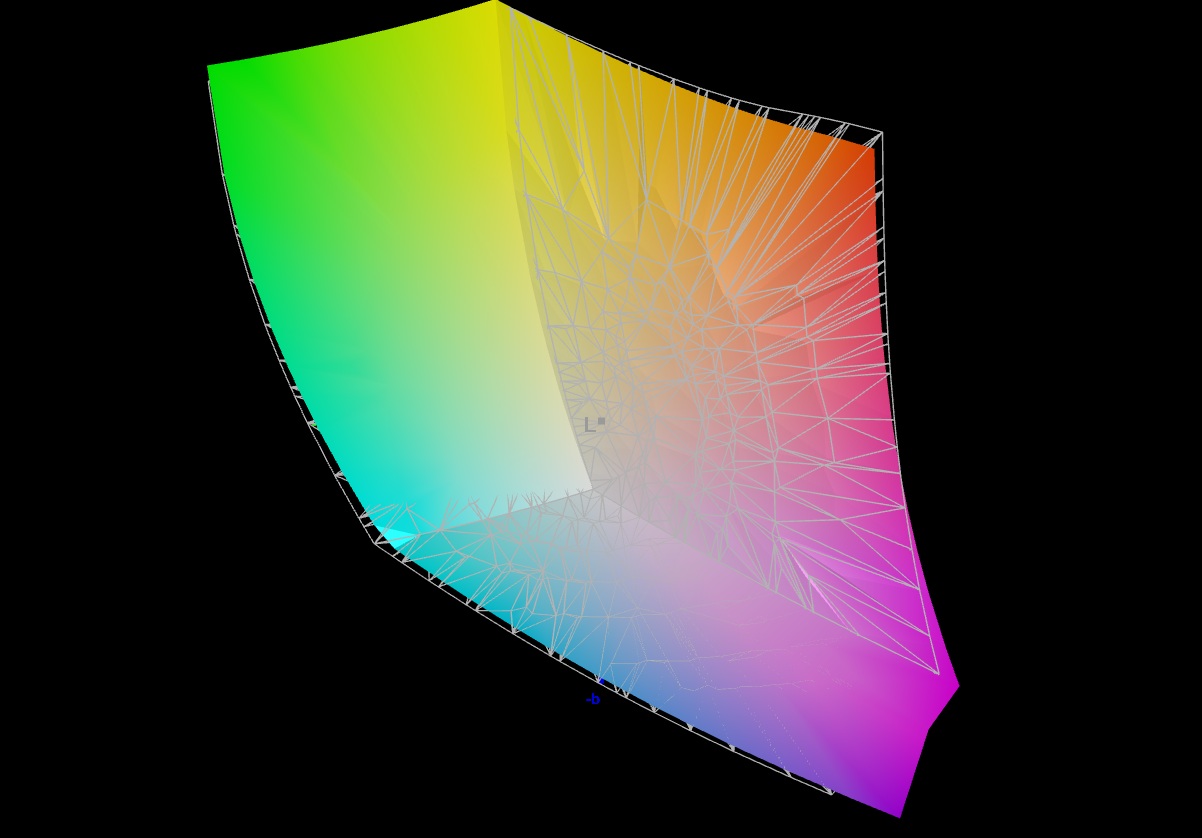
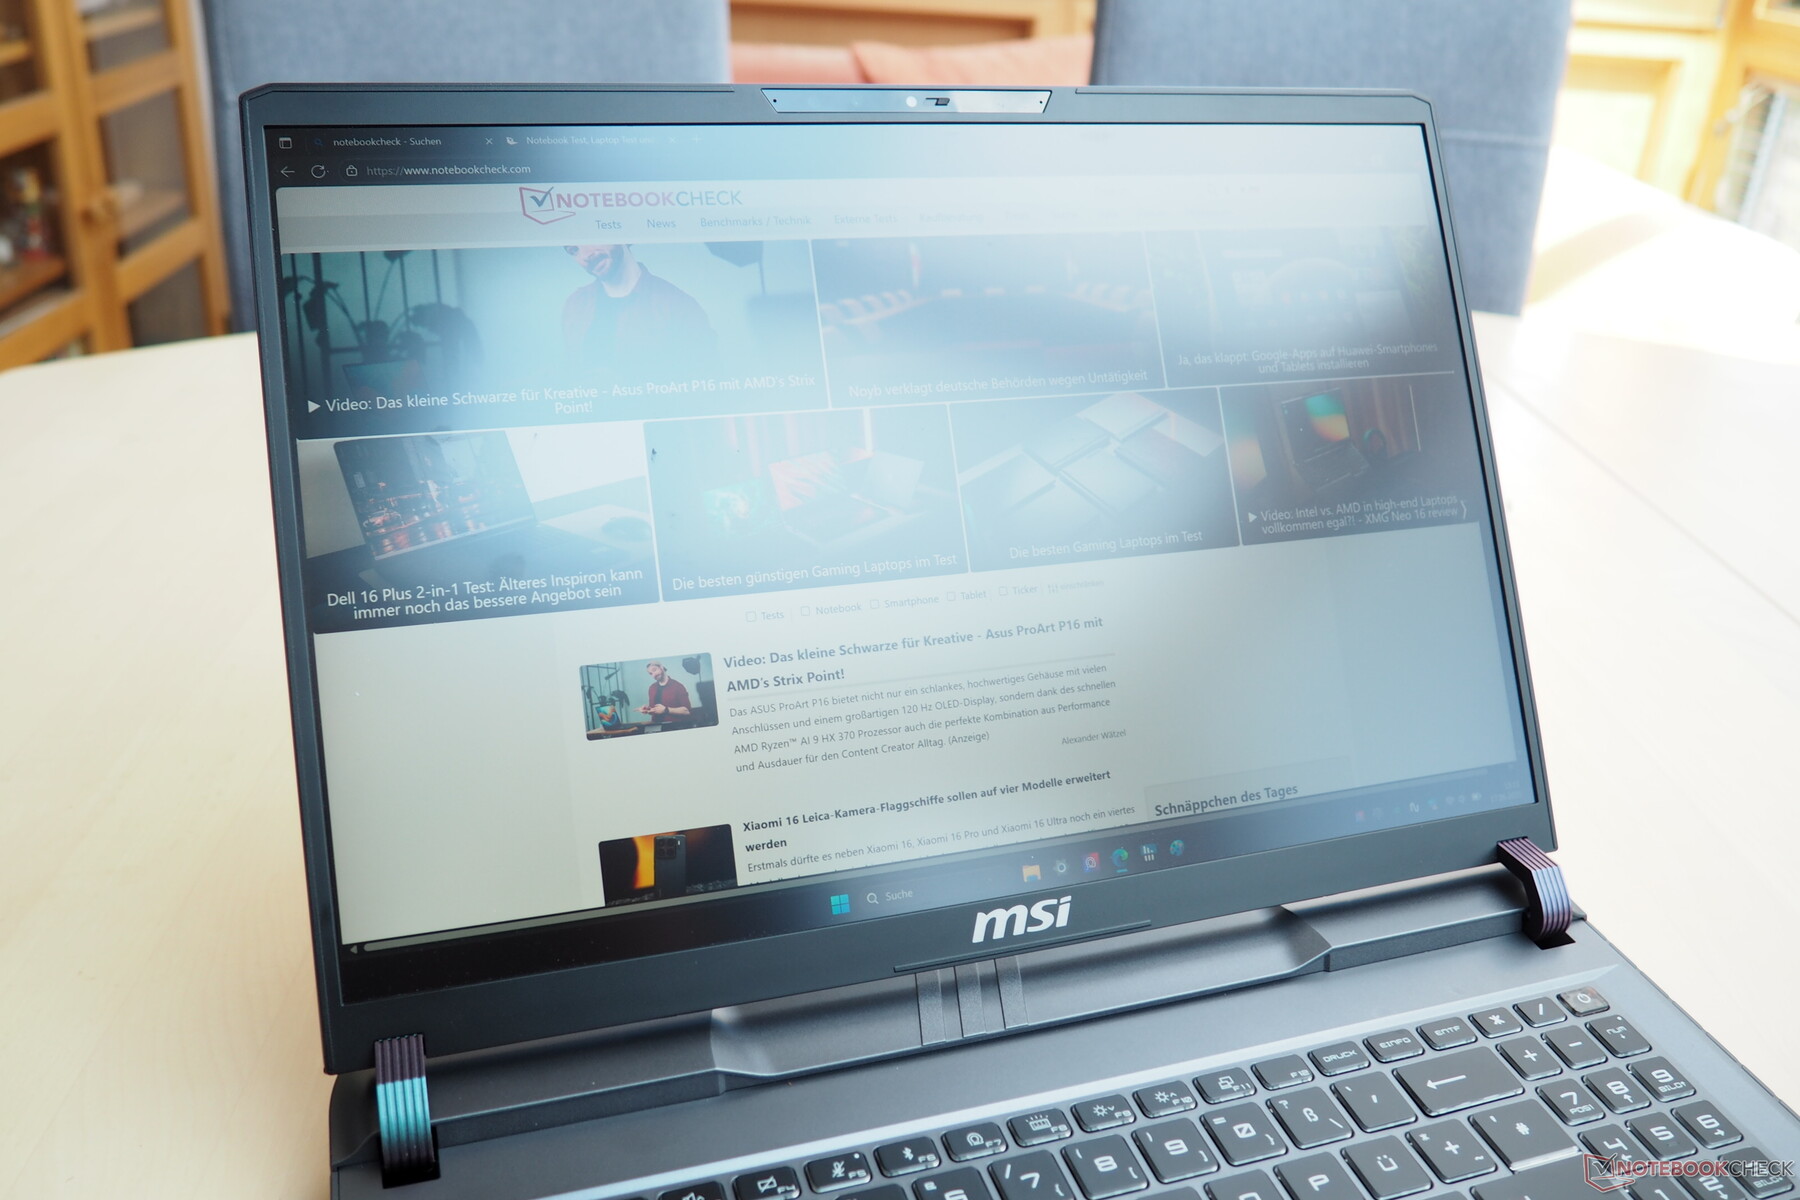
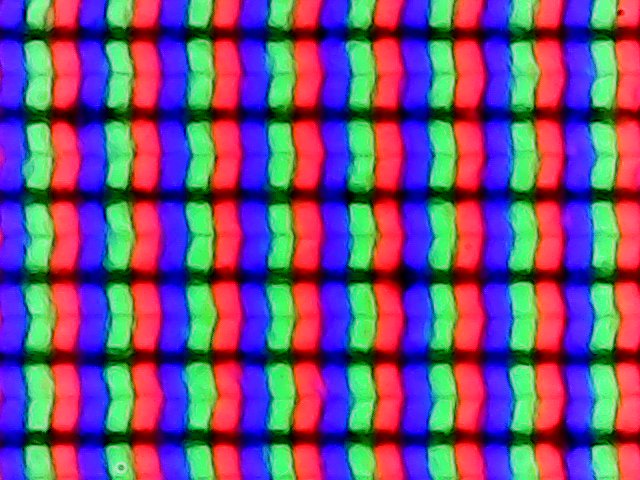
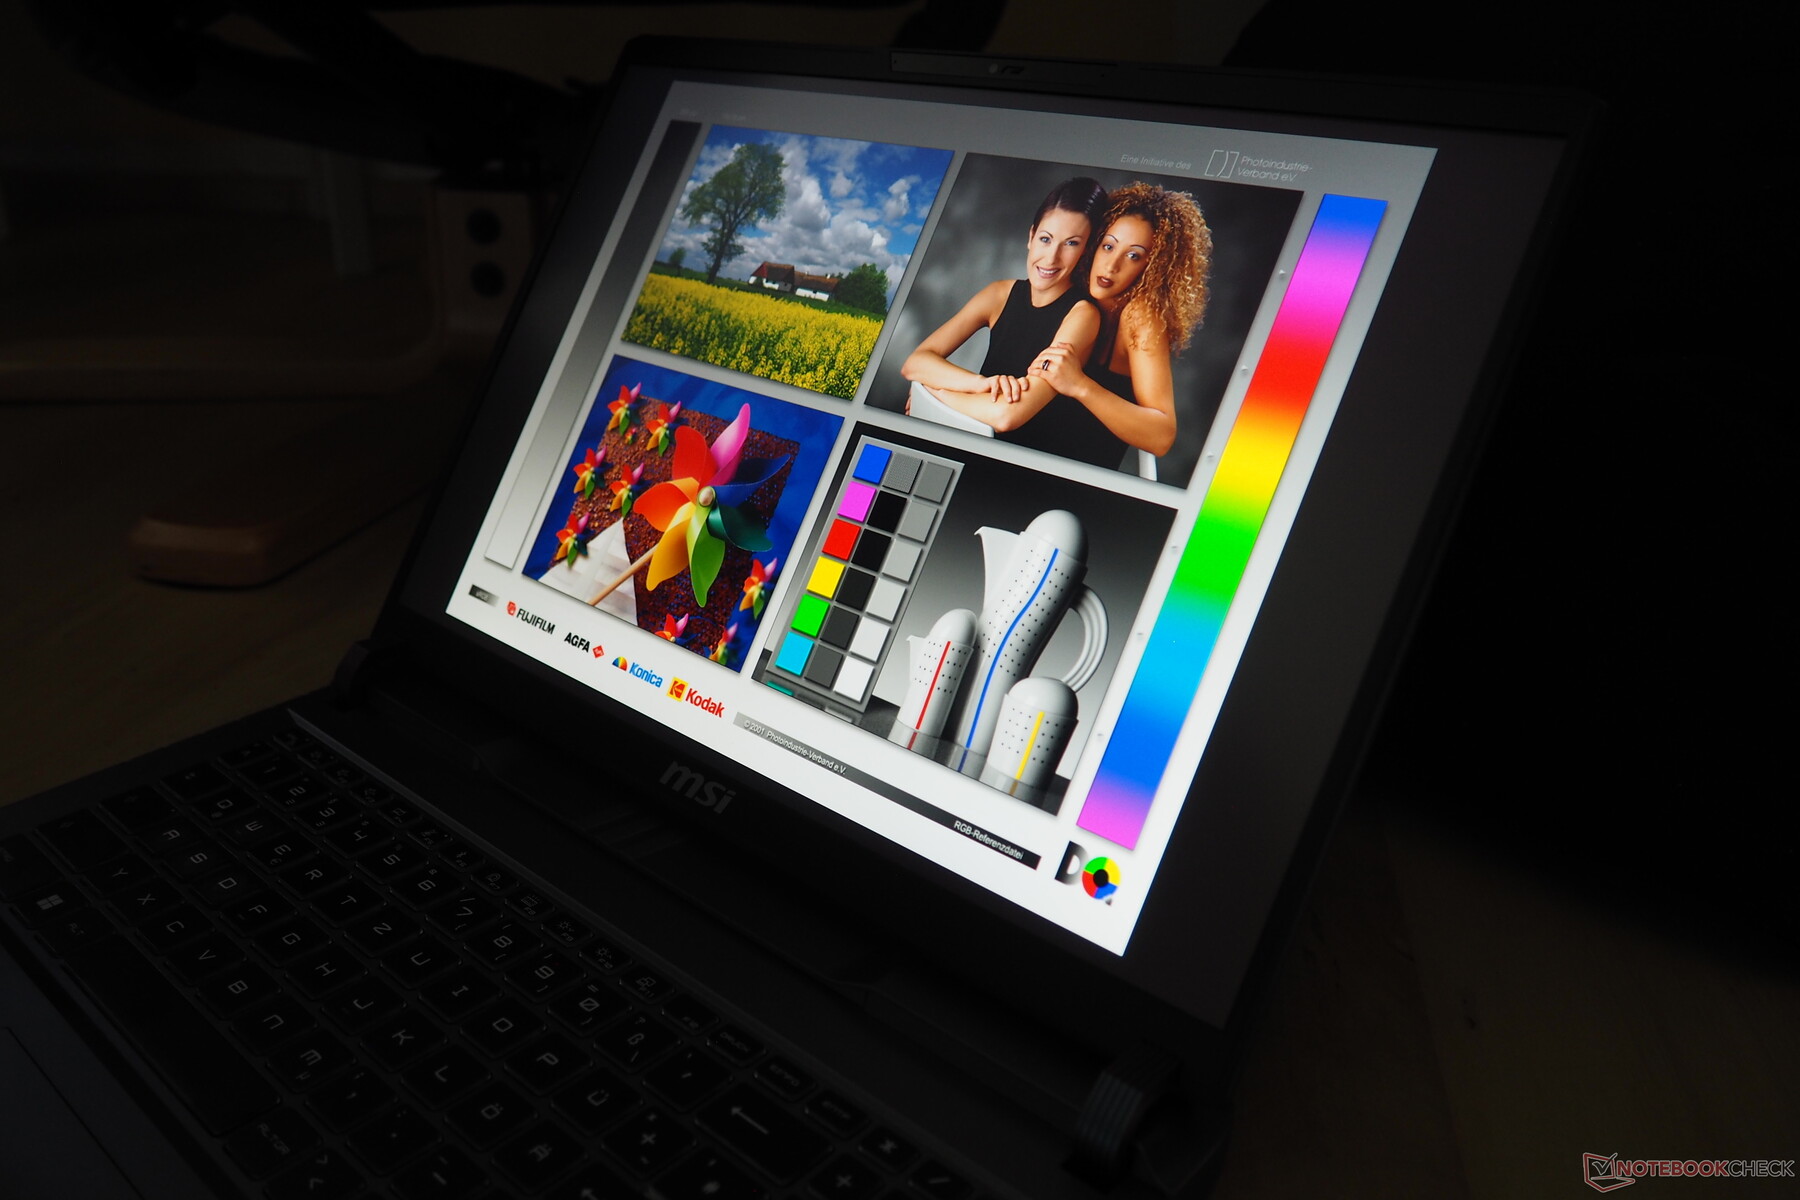
屏幕采用了当前流行的 16:10 宽高比,表现没有任何重大缺陷。虽然 IPS 面板在大多数方面还达不到 OLED 的水平,但与其他游戏笔记本电脑相比,Vector 16 仍有自己的优势。首先,它具有良好的响应时间,即使在高节奏的 3D 游戏中也足够快。显示屏的平均亮度高达 426 cd/m²,明显优于 Katana 17 的 272 cd/m²。尽管 16 英寸面板的平均黑度仅为 0.42 cd/m²,但仍超过了 1,000:1 的对比度阈值。开箱即用的色彩准确度也令人印象深刻,并可通过校准进一步提高。我们观察到屏幕没有闪烁,视角也符合典型的 IPS 标准。
| |||||||||||||||||||||||||
Brightness Distribution: 85 %
Center on Battery: 473 cd/m²
Contrast: 1126:1 (Black: 0.42 cd/m²)
ΔE ColorChecker Calman: 3.47 | ∀{0.5-29.43 Ø4.73}
calibrated: 1.36
ΔE Greyscale Calman: 3.1 | ∀{0.09-98 Ø4.97}
84.4% AdobeRGB 1998 (Argyll 3D)
99.8% sRGB (Argyll 3D)
96.6% Display P3 (Argyll 3D)
Gamma: 2.486
CCT: 6832 K
| MSI Vector 16 HX AI A2XWHG B160QAN02.3 (AUO7DB2), IPS, 2560x1600, 16", 240 Hz | MSI Vector 16 HX A14V Chi Mei N160GME-GTB, IPS, 2560x1600, 16", 240 Hz | MSI Katana 17 HX B14WGK CSOT MNH301CA3-1, IPS, 2560x1440, 17.3", 240 Hz | Schenker XMG Pro 16 (E25) NE160QDM-NZL, IPS, 2560x1600, 16", 300 Hz | Alienware 16 Area-51 AU Optronics B160QAN, IPS, 2560x1600, 16", 240 Hz | |
|---|---|---|---|---|---|
| Display | 0% | 2% | -11% | 2% | |
| Display P3 Coverage (%) | 96.6 | 95.4 -1% | 97.3 1% | 74.7 -23% | 96 -1% |
| sRGB Coverage (%) | 99.8 | 99.7 0% | 99.6 0% | 99.8 0% | 100 0% |
| AdobeRGB 1998 Coverage (%) | 84.4 | 85.4 1% | 89 5% | 75.4 -11% | 89.2 6% |
| Response Times | -62% | -37% | -67% | -16% | |
| Response Time Grey 50% / Grey 80% * (ms) | 4.3 ? | 5.7 ? -33% | 5.2 ? -21% | 10.5 ? -144% | 4.8 ? -12% |
| Response Time Black / White * (ms) | 6 ? | 11.4 ? -90% | 9.2 ? -53% | 5.4 ? 10% | 7.2 ? -20% |
| PWM Frequency (Hz) | |||||
| Screen | 5% | 13% | 16% | 2% | |
| Brightness middle (cd/m²) | 473 | 557.2 18% | 296 -37% | 538 14% | 554 17% |
| Brightness (cd/m²) | 426 | 506 19% | 272 -36% | 508 19% | 532 25% |
| Brightness Distribution (%) | 85 | 83 -2% | 87 2% | 88 4% | 88 4% |
| Black Level * (cd/m²) | 0.42 | 0.41 2% | 0.27 36% | 0.47 -12% | 0.52 -24% |
| Contrast (:1) | 1126 | 1359 21% | 1096 -3% | 1145 2% | 1065 -5% |
| Colorchecker dE 2000 * | 3.47 | 2.91 16% | 1.35 61% | 1.9 45% | 2.81 19% |
| Colorchecker dE 2000 max. * | 7.24 | 5.94 18% | 4.76 34% | 4 45% | 8.32 -15% |
| Colorchecker dE 2000 calibrated * | 1.36 | 1.63 -20% | 0.78 43% | 0.65 52% | |
| Greyscale dE 2000 * | 3.1 | 3.8 -23% | 2.7 13% | 2.7 13% | 4.7 -52% |
| Gamma | 2.486 88% | 2.23 99% | 2.201 100% | 2.24 98% | 2.3 96% |
| CCT | 6832 95% | 6408 101% | 6770 96% | 7027 93% | 6476 100% |
| Total Average (Program / Settings) | -19% /
-5% | -7% /
3% | -21% /
-3% | -4% /
-0% |
* ... smaller is better
Display Response Times
| ↔ Response Time Black to White | ||
|---|---|---|
| 6 ms ... rise ↗ and fall ↘ combined | ↗ 2.2 ms rise | 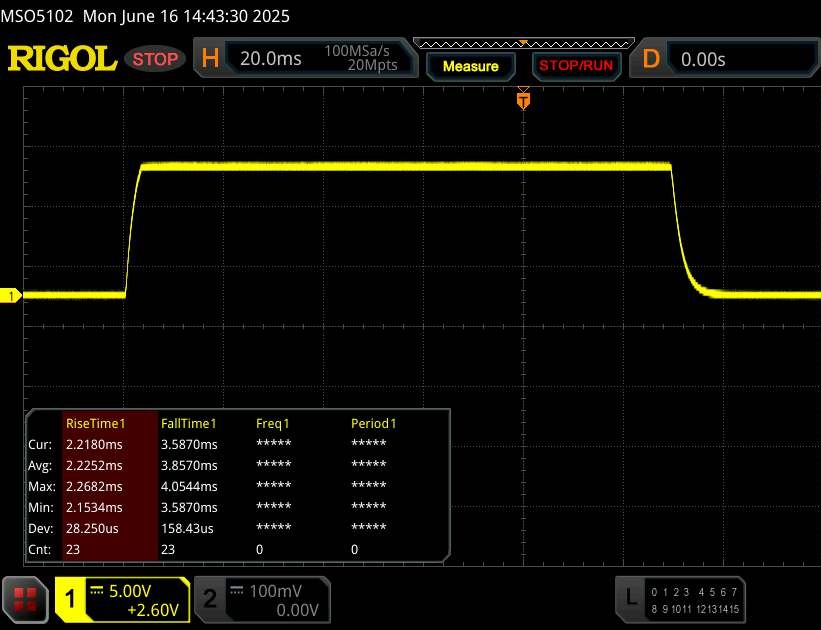 |
| ↘ 3.8 ms fall | ||
| The screen shows very fast response rates in our tests and should be very well suited for fast-paced gaming. In comparison, all tested devices range from 0.1 (minimum) to 240 (maximum) ms. » 18 % of all devices are better. This means that the measured response time is better than the average of all tested devices (19.9 ms). | ||
| ↔ Response Time 50% Grey to 80% Grey | ||
| 4.3 ms ... rise ↗ and fall ↘ combined | ↗ 1.8 ms rise | 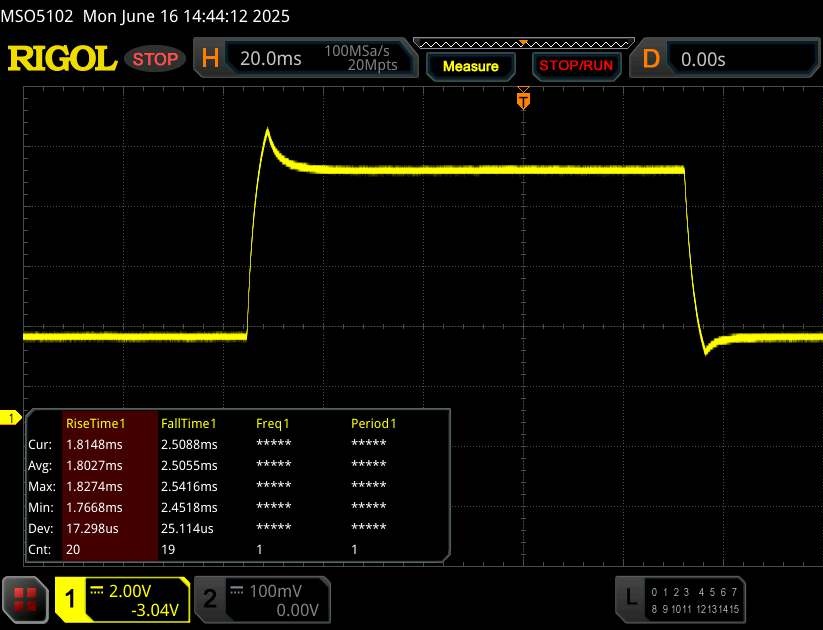 |
| ↘ 2.5 ms fall | ||
| The screen shows very fast response rates in our tests and should be very well suited for fast-paced gaming. In comparison, all tested devices range from 0.165 (minimum) to 636 (maximum) ms. » 16 % of all devices are better. This means that the measured response time is better than the average of all tested devices (31.1 ms). | ||
Screen Flickering / PWM (Pulse-Width Modulation)
| Screen flickering / PWM not detected |  | ||
In comparison: 52 % of all tested devices do not use PWM to dim the display. If PWM was detected, an average of 7798 (minimum: 5 - maximum: 343500) Hz was measured. | |||
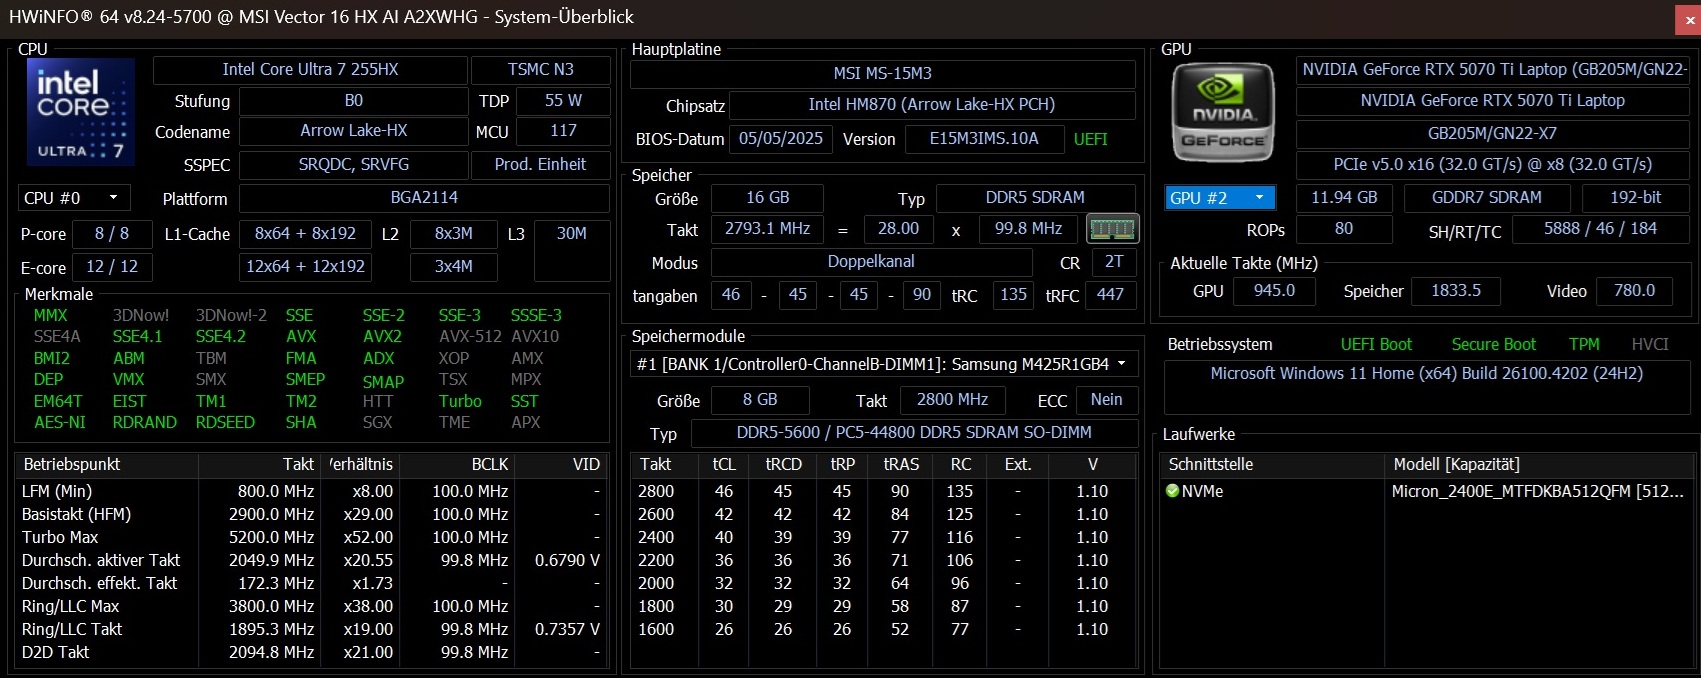
性能
Vector 16 HX 的 CPU 和 GPU 性能介于中端和高端游戏笔记本电脑之间。固态硬盘和内存各有两个插槽,可根据需要轻松升级或扩展。
测试条件
微星中心包含四种工作模式,其中 AI 配置文件用于测量,根据我们的测试,该配置文件主要基于 "平衡 "模式,而非 "最高性能 "模式。我们一般不推荐使用后者,因为 16 英寸机型在负载情况下的噪音非常大,低于 60 分贝(A)。在最高性能模式下,GPU 性能提高了近 10%。
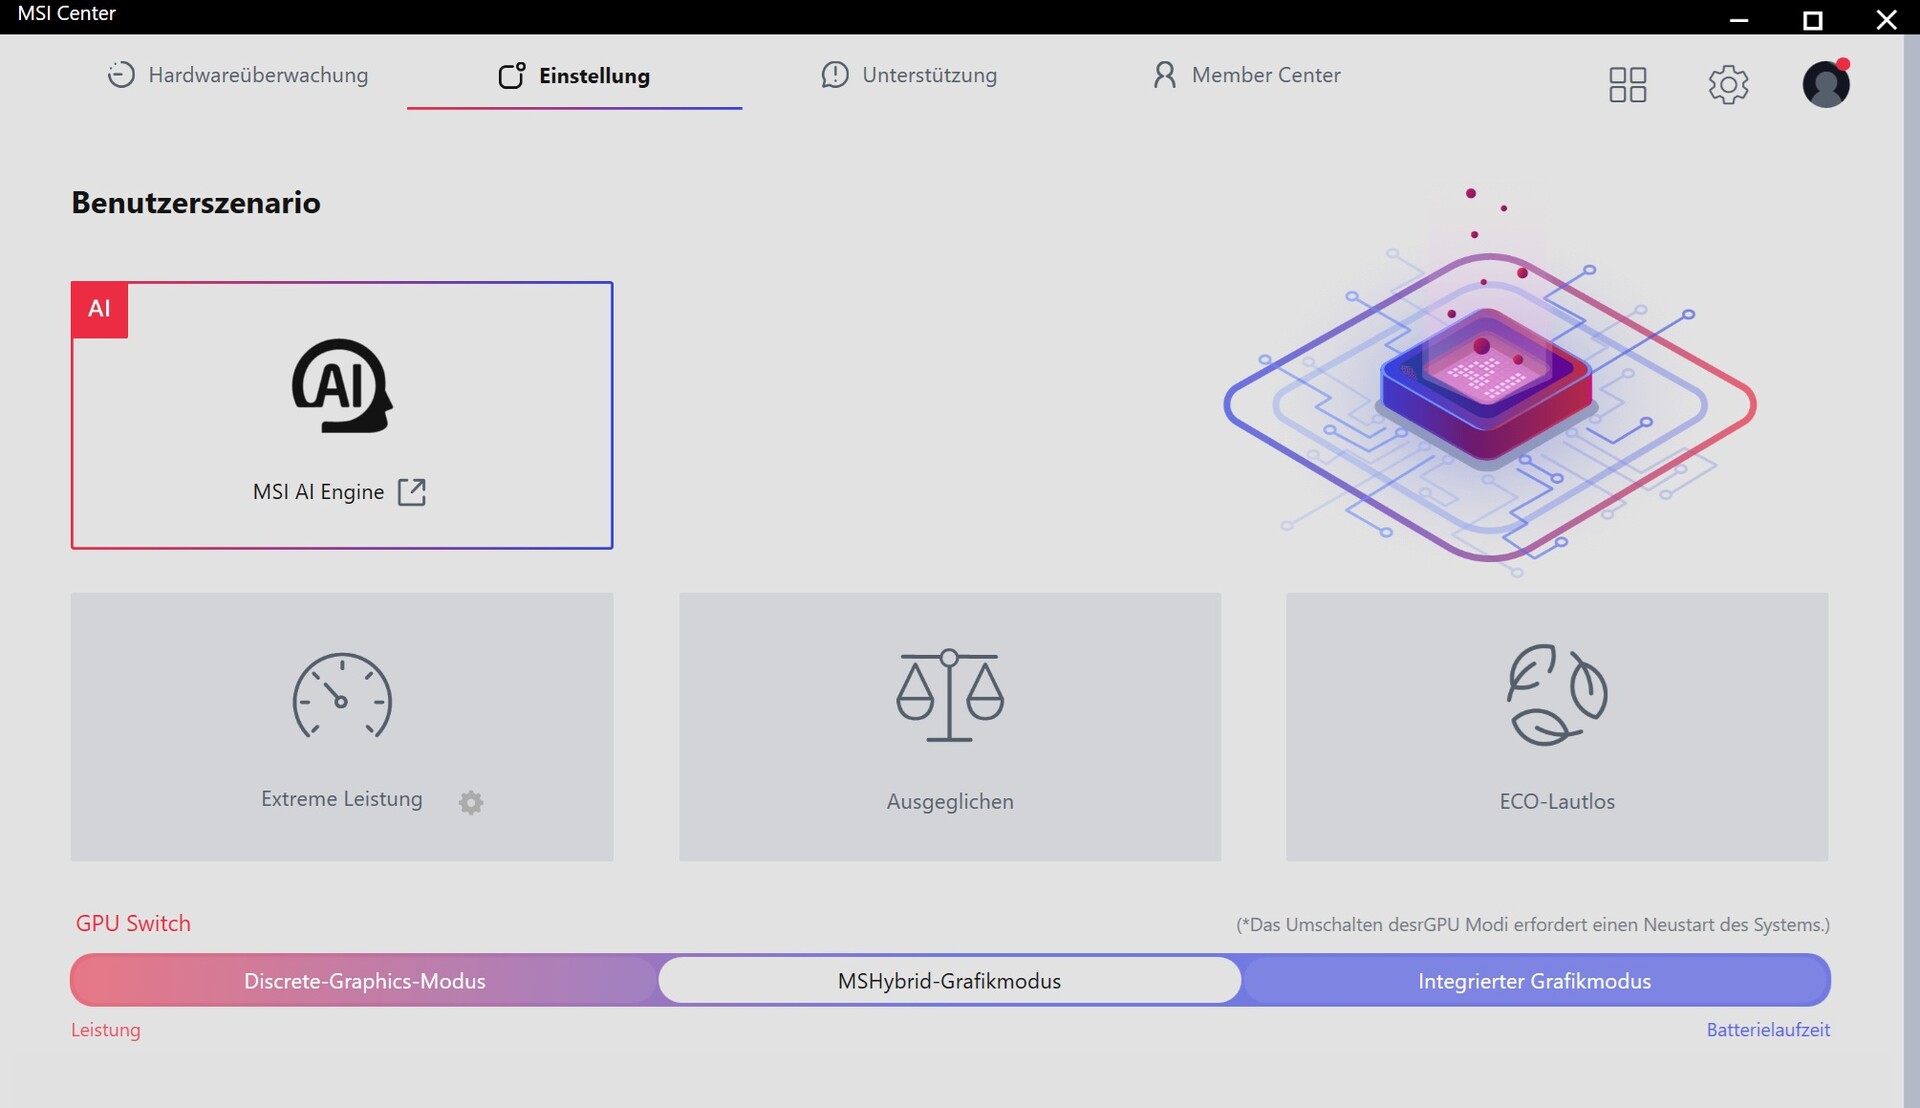

| 微星中心模式 | 微星人工智能引擎 | 极致性能 | 平衡 | 环保静音 |
| 赛博朋克 2077 噪音 | 47 dB(A) | 60 dB(A) | 47 dB(A) | 41 dB(A) |
| 赛博朋克 2077》性能(FHD/超高清) | 119.6 帧/秒 | 129.9 帧/秒 | 117.1 帧/秒 | 51.5 帧/秒 |
| Cinebench R15 Multi Score | 4118 分 | 5196 分 | 4037 分 | 1064 分 |
| CPU PL1 | 80 瓦 | 110 瓦 | 80 瓦 | 15 瓦 |
| CPU PL2 | 80 瓦 | 220 瓦 | 80 瓦 | 15 瓦 |
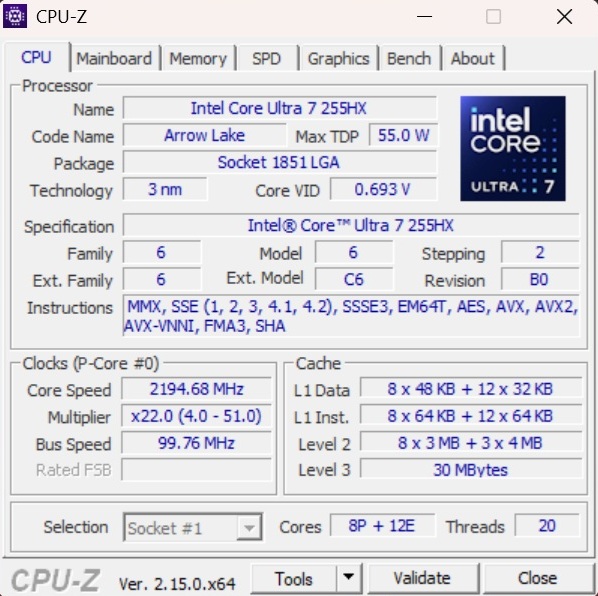
处理器
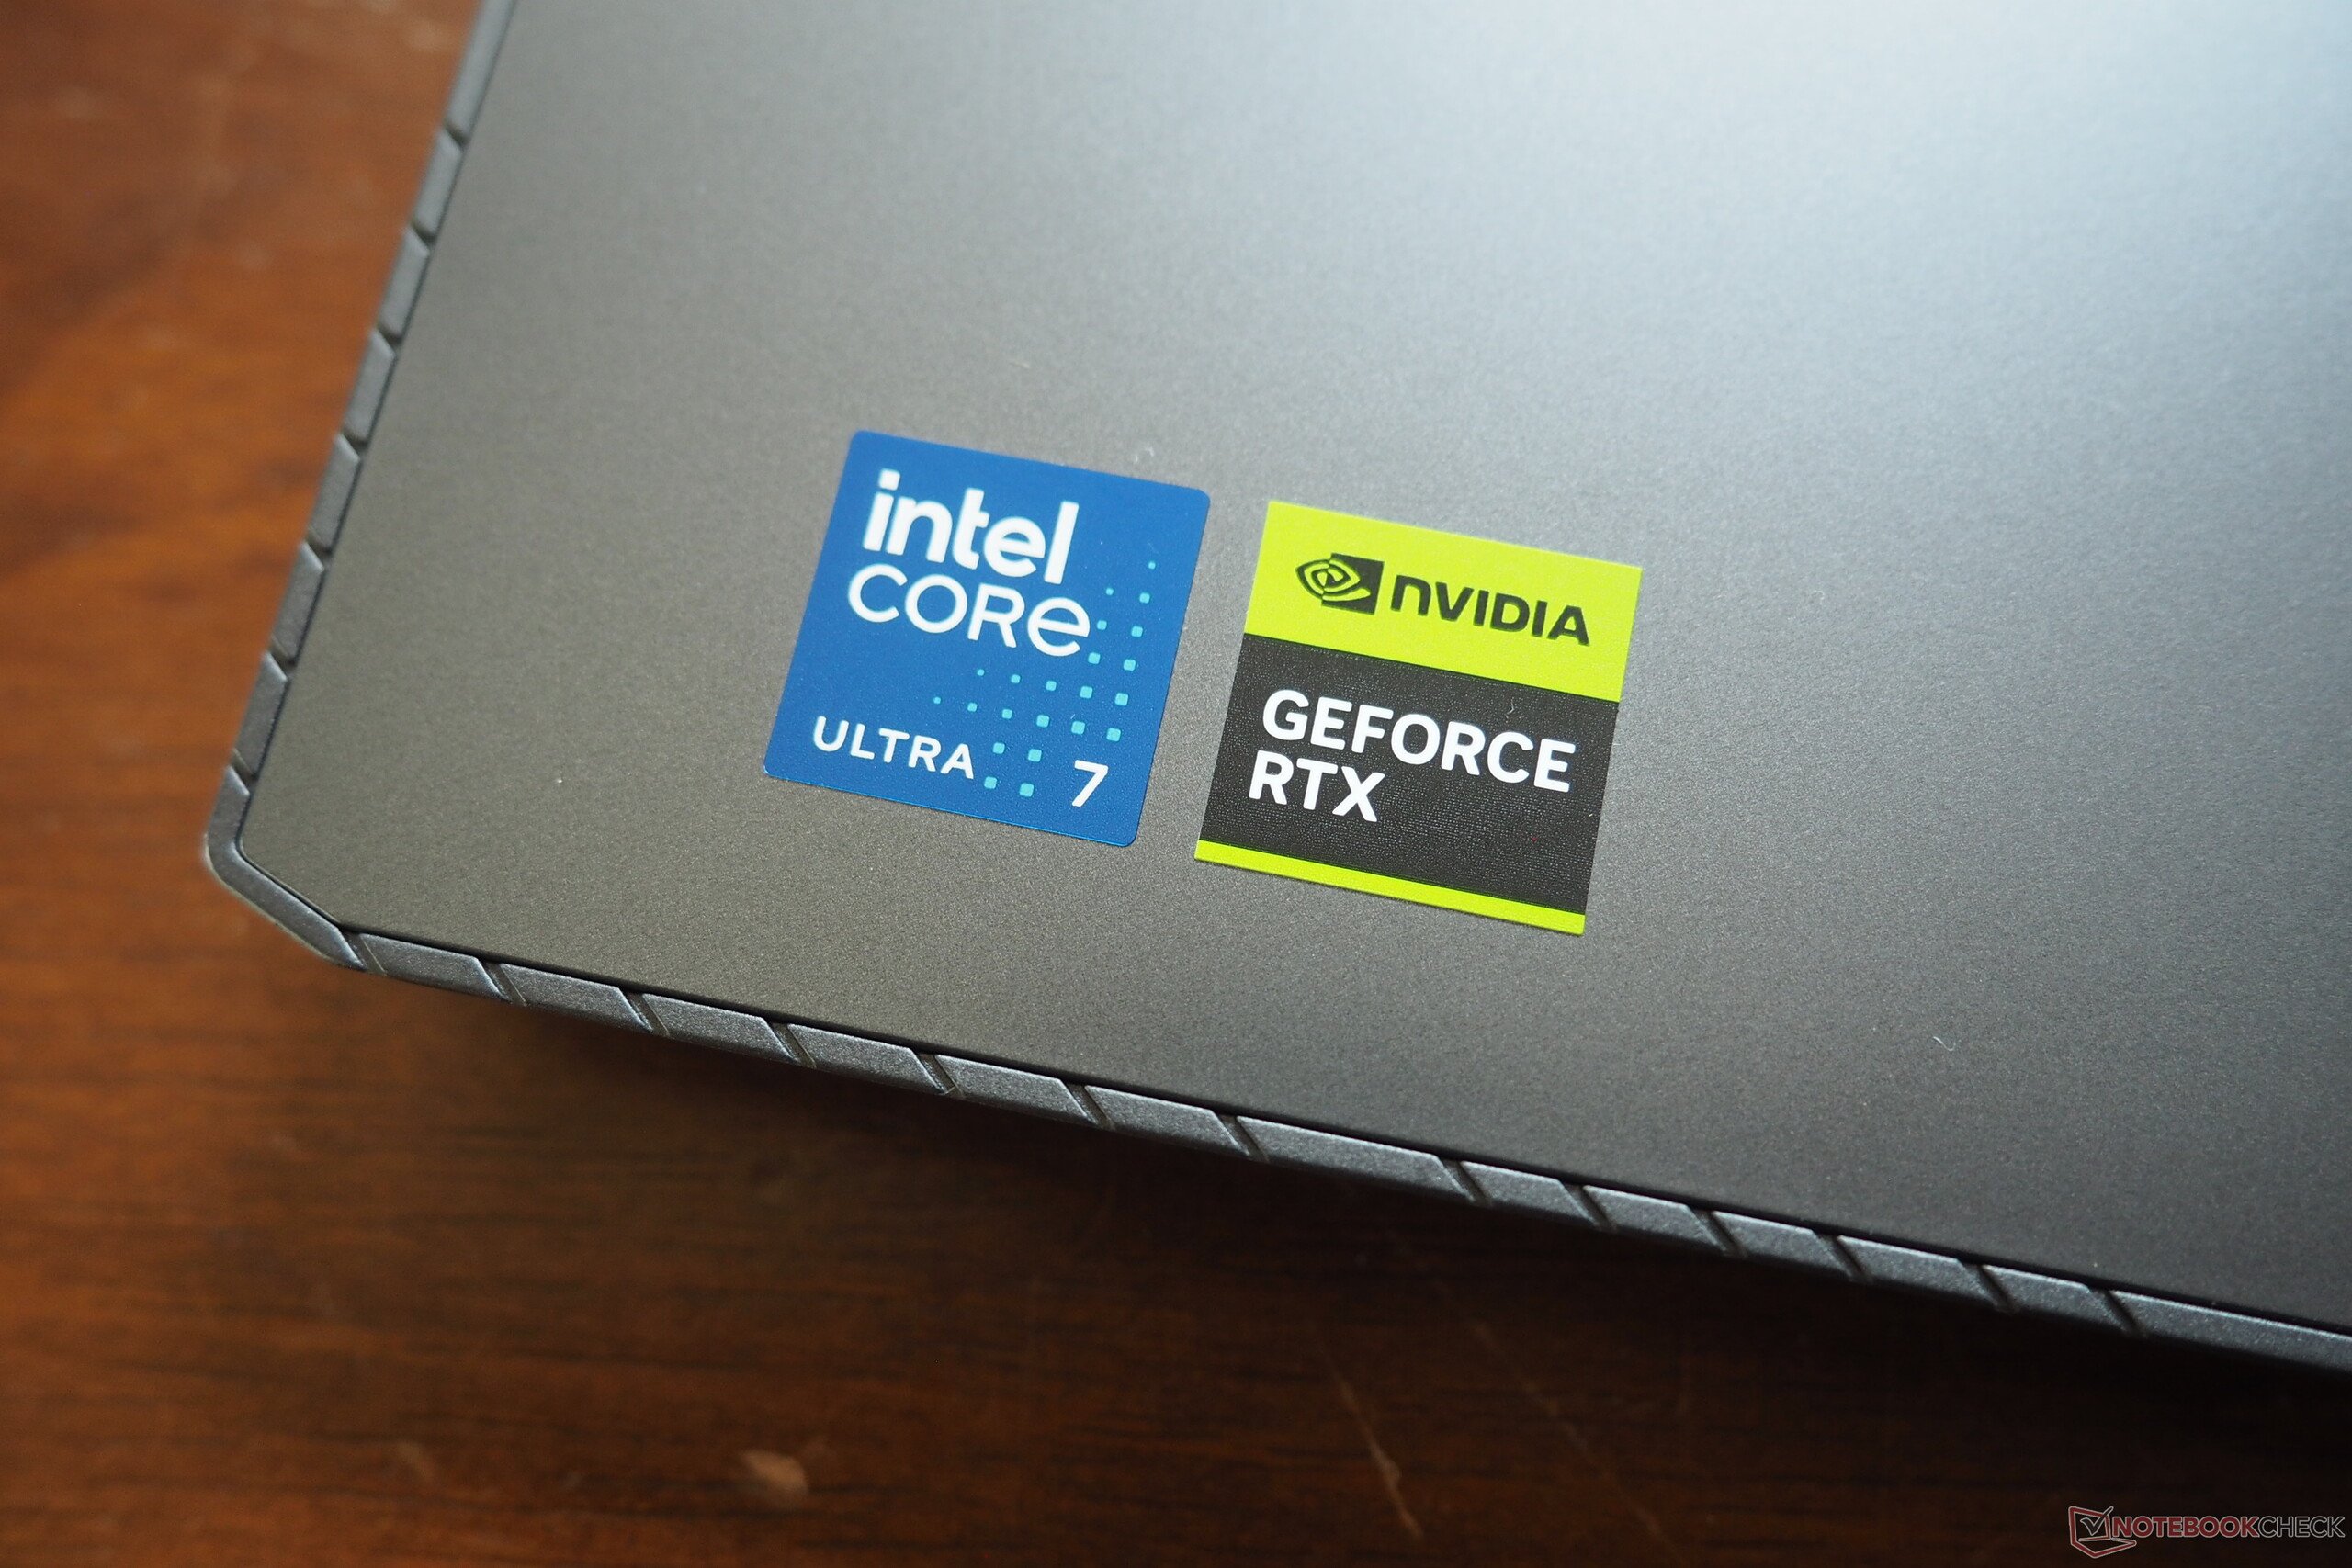
英特尔 酷睿至尊 7 255HX在 Vector 16 上首次亮相。这款 3 纳米制程的箭湖一代芯片配备了 8 个性能核心和 12 个效率核心,每个核心都没有超线程功能。在基准测试中,255HX 的表现略逊于旧款高端酷睿 i9-14900HX,但明显优于酷睿 i7-14650HX。 酷睿 i7-14650HX和 Katana 17 的酷睿 i7-14650HX 酷睿至尊 9 275HX255HX 的平均运行速度仅快 10% 左右,这对于 255HX 来说是一个可观的成绩。
Cinebench R15 multi sustained test
* ... smaller is better
AIDA64: FP32 Ray-Trace | FPU Julia | CPU SHA3 | CPU Queen | FPU SinJulia | FPU Mandel | CPU AES | CPU ZLib | FP64 Ray-Trace | CPU PhotoWorxx
| Performance rating | |
| Schenker XMG Pro 16 (E25) | |
| Alienware 16 Area-51 | |
| MSI Vector 16 HX A14V | |
| Average Intel Core Ultra 7 255HX | |
| Average of class Gaming | |
| MSI Vector 16 HX AI A2XWHG | |
| MSI Katana 17 HX B14WGK | |
| AIDA64 / FP32 Ray-Trace | |
| Schenker XMG Pro 16 (E25) | |
| Alienware 16 Area-51 | |
| Average Intel Core Ultra 7 255HX (27732 - 34250, n=5) | |
| Average of class Gaming (10227 - 85542, n=110, last 2 years) | |
| MSI Vector 16 HX A14V | |
| MSI Vector 16 HX AI A2XWHG | |
| MSI Katana 17 HX B14WGK | |
| AIDA64 / FPU Julia | |
| Schenker XMG Pro 16 (E25) | |
| Alienware 16 Area-51 | |
| Average Intel Core Ultra 7 255HX (140290 - 167758, n=5) | |
| MSI Vector 16 HX A14V | |
| MSI Vector 16 HX AI A2XWHG | |
| Average of class Gaming (51376 - 238426, n=110, last 2 years) | |
| MSI Katana 17 HX B14WGK | |
| AIDA64 / CPU SHA3 | |
| Schenker XMG Pro 16 (E25) | |
| Alienware 16 Area-51 | |
| Average Intel Core Ultra 7 255HX (6445 - 7694, n=5) | |
| MSI Vector 16 HX A14V | |
| MSI Vector 16 HX AI A2XWHG | |
| Average of class Gaming (2180 - 9817, n=110, last 2 years) | |
| MSI Katana 17 HX B14WGK | |
| AIDA64 / CPU Queen | |
| MSI Vector 16 HX A14V | |
| Alienware 16 Area-51 | |
| Schenker XMG Pro 16 (E25) | |
| Average Intel Core Ultra 7 255HX (115802 - 135237, n=5) | |
| Average of class Gaming (49785 - 173351, n=101, last 2 years) | |
| MSI Vector 16 HX AI A2XWHG | |
| MSI Katana 17 HX B14WGK | |
| AIDA64 / FPU SinJulia | |
| MSI Vector 16 HX A14V | |
| Average of class Gaming (4424 - 33636, n=110, last 2 years) | |
| Schenker XMG Pro 16 (E25) | |
| Alienware 16 Area-51 | |
| Average Intel Core Ultra 7 255HX (11066 - 12286, n=5) | |
| MSI Vector 16 HX AI A2XWHG | |
| MSI Katana 17 HX B14WGK | |
| AIDA64 / FPU Mandel | |
| Schenker XMG Pro 16 (E25) | |
| Alienware 16 Area-51 | |
| Average Intel Core Ultra 7 255HX (72938 - 87947, n=5) | |
| MSI Vector 16 HX AI A2XWHG | |
| MSI Vector 16 HX A14V | |
| Average of class Gaming (25115 - 128721, n=110, last 2 years) | |
| MSI Katana 17 HX B14WGK | |
| AIDA64 / CPU AES | |
| MSI Vector 16 HX A14V | |
| Alienware 16 Area-51 | |
| Schenker XMG Pro 16 (E25) | |
| Average Intel Core Ultra 7 255HX (96832 - 116158, n=5) | |
| Average of class Gaming (39258 - 247074, n=110, last 2 years) | |
| MSI Vector 16 HX AI A2XWHG | |
| MSI Katana 17 HX B14WGK | |
| AIDA64 / CPU ZLib | |
| MSI Vector 16 HX A14V | |
| Schenker XMG Pro 16 (E25) | |
| Alienware 16 Area-51 | |
| Average Intel Core Ultra 7 255HX (1510 - 1850, n=5) | |
| Average of class Gaming (574 - 2531, n=110, last 2 years) | |
| MSI Vector 16 HX AI A2XWHG | |
| MSI Katana 17 HX B14WGK | |
| AIDA64 / FP64 Ray-Trace | |
| Alienware 16 Area-51 | |
| Schenker XMG Pro 16 (E25) | |
| Average Intel Core Ultra 7 255HX (15137 - 18315, n=5) | |
| Average of class Gaming (5509 - 45446, n=110, last 2 years) | |
| MSI Vector 16 HX A14V | |
| MSI Vector 16 HX AI A2XWHG | |
| MSI Katana 17 HX B14WGK | |
| AIDA64 / CPU PhotoWorxx | |
| Alienware 16 Area-51 | |
| Schenker XMG Pro 16 (E25) | |
| MSI Vector 16 HX A14V | |
| Average Intel Core Ultra 7 255HX (39697 - 54070, n=5) | |
| Average of class Gaming (12271 - 89891, n=110, last 2 years) | |
| MSI Vector 16 HX AI A2XWHG | |
| MSI Katana 17 HX B14WGK | |
系统性能
事实证明,该系统的性能并不突出,16 英寸处理器的性能在预期范围内。有趣的是尽管CPU/GPU等组件的性能应该较弱,但同时测试的Katana 17启动速度更快。
PCMark 10: Score | Essentials | Productivity | Digital Content Creation
CrossMark: Overall | Productivity | Creativity | Responsiveness
WebXPRT 3: Overall
WebXPRT 4: Overall
Mozilla Kraken 1.1: Total
| Performance rating | |
| Alienware 16 Area-51 | |
| Schenker XMG Pro 16 (E25) | |
| MSI Vector 16 HX A14V | |
| Average of class Gaming | |
| Average Intel Core Ultra 7 255HX, NVIDIA GeForce RTX 5070 Ti Laptop | |
| MSI Vector 16 HX AI A2XWHG | |
| MSI Katana 17 HX B14WGK | |
| PCMark 10 / Score | |
| Alienware 16 Area-51 | |
| MSI Vector 16 HX A14V | |
| Schenker XMG Pro 16 (E25) | |
| Average of class Gaming (5828 - 11574, n=96, last 2 years) | |
| Average Intel Core Ultra 7 255HX, NVIDIA GeForce RTX 5070 Ti Laptop (7842 - 7858, n=2) | |
| MSI Vector 16 HX AI A2XWHG | |
| MSI Katana 17 HX B14WGK | |
| PCMark 10 / Essentials | |
| MSI Vector 16 HX A14V | |
| Schenker XMG Pro 16 (E25) | |
| Alienware 16 Area-51 | |
| Average Intel Core Ultra 7 255HX, NVIDIA GeForce RTX 5070 Ti Laptop (10737 - 10773, n=2) | |
| MSI Vector 16 HX AI A2XWHG | |
| Average of class Gaming (8810 - 12600, n=100, last 2 years) | |
| MSI Katana 17 HX B14WGK | |
| PCMark 10 / Productivity | |
| Average of class Gaming (6845 - 18766, n=98, last 2 years) | |
| MSI Vector 16 HX A14V | |
| Schenker XMG Pro 16 (E25) | |
| MSI Vector 16 HX AI A2XWHG | |
| Average Intel Core Ultra 7 255HX, NVIDIA GeForce RTX 5070 Ti Laptop (9270 - 9510, n=2) | |
| Alienware 16 Area-51 | |
| MSI Katana 17 HX B14WGK | |
| PCMark 10 / Digital Content Creation | |
| Alienware 16 Area-51 | |
| MSI Vector 16 HX A14V | |
| Schenker XMG Pro 16 (E25) | |
| Average of class Gaming (7602 - 19657, n=98, last 2 years) | |
| Average Intel Core Ultra 7 255HX, NVIDIA GeForce RTX 5070 Ti Laptop (12817 - 13186, n=2) | |
| MSI Vector 16 HX AI A2XWHG | |
| MSI Katana 17 HX B14WGK | |
| CrossMark / Overall | |
| Schenker XMG Pro 16 (E25) | |
| MSI Vector 16 HX A14V | |
| Alienware 16 Area-51 | |
| Average Intel Core Ultra 7 255HX, NVIDIA GeForce RTX 5070 Ti Laptop (1944 - 2097, n=2) | |
| Average of class Gaming (1366 - 2409, n=98, last 2 years) | |
| MSI Katana 17 HX B14WGK | |
| MSI Vector 16 HX AI A2XWHG | |
| CrossMark / Productivity | |
| MSI Vector 16 HX A14V | |
| Schenker XMG Pro 16 (E25) | |
| Alienware 16 Area-51 | |
| Average Intel Core Ultra 7 255HX, NVIDIA GeForce RTX 5070 Ti Laptop (1845 - 1959, n=2) | |
| MSI Katana 17 HX B14WGK | |
| Average of class Gaming (1386 - 2254, n=98, last 2 years) | |
| MSI Vector 16 HX AI A2XWHG | |
| CrossMark / Creativity | |
| Schenker XMG Pro 16 (E25) | |
| MSI Vector 16 HX A14V | |
| Alienware 16 Area-51 | |
| Average Intel Core Ultra 7 255HX, NVIDIA GeForce RTX 5070 Ti Laptop (2249 - 2400, n=2) | |
| MSI Vector 16 HX AI A2XWHG | |
| Average of class Gaming (1343 - 2729, n=98, last 2 years) | |
| MSI Katana 17 HX B14WGK | |
| CrossMark / Responsiveness | |
| Alienware 16 Area-51 | |
| MSI Vector 16 HX A14V | |
| MSI Katana 17 HX B14WGK | |
| Schenker XMG Pro 16 (E25) | |
| Average of class Gaming (1226 - 2334, n=98, last 2 years) | |
| Average Intel Core Ultra 7 255HX, NVIDIA GeForce RTX 5070 Ti Laptop (1468 - 1713, n=2) | |
| MSI Vector 16 HX AI A2XWHG | |
| WebXPRT 3 / Overall | |
| Schenker XMG Pro 16 (E25) | |
| Alienware 16 Area-51 | |
| MSI Vector 16 HX A14V | |
| Average Intel Core Ultra 7 255HX, NVIDIA GeForce RTX 5070 Ti Laptop (319 - 325, n=2) | |
| MSI Vector 16 HX AI A2XWHG | |
| Average of class Gaming (242 - 532, n=101, last 2 years) | |
| MSI Katana 17 HX B14WGK | |
| WebXPRT 4 / Overall | |
| Schenker XMG Pro 16 (E25) | |
| Alienware 16 Area-51 | |
| Average Intel Core Ultra 7 255HX, NVIDIA GeForce RTX 5070 Ti Laptop (305 - 306, n=2) | |
| MSI Vector 16 HX AI A2XWHG | |
| MSI Vector 16 HX A14V | |
| Average of class Gaming (176.4 - 354, n=101, last 2 years) | |
| MSI Katana 17 HX B14WGK | |
| Mozilla Kraken 1.1 / Total | |
| MSI Katana 17 HX B14WGK | |
| Average of class Gaming (391 - 590, n=106, last 2 years) | |
| MSI Vector 16 HX A14V | |
| MSI Vector 16 HX AI A2XWHG | |
| Average Intel Core Ultra 7 255HX, NVIDIA GeForce RTX 5070 Ti Laptop (425 - 425, n=2) | |
| Alienware 16 Area-51 | |
| Schenker XMG Pro 16 (E25) | |
* ... smaller is better
| PCMark 10 Score | 7842 points | |
Help | ||
| AIDA64 / Memory Copy | |
| Schenker XMG Pro 16 (E25) | |
| Alienware 16 Area-51 | |
| Average Intel Core Ultra 7 255HX (68939 - 104987, n=5) | |
| MSI Vector 16 HX A14V | |
| Average of class Gaming (21750 - 129946, n=110, last 2 years) | |
| MSI Vector 16 HX AI A2XWHG | |
| MSI Katana 17 HX B14WGK | |
| AIDA64 / Memory Read | |
| Schenker XMG Pro 16 (E25) | |
| Alienware 16 Area-51 | |
| Average Intel Core Ultra 7 255HX (82336 - 95821, n=5) | |
| MSI Vector 16 HX A14V | |
| MSI Vector 16 HX AI A2XWHG | |
| Average of class Gaming (22956 - 118858, n=110, last 2 years) | |
| MSI Katana 17 HX B14WGK | |
| AIDA64 / Memory Write | |
| Average Intel Core Ultra 7 255HX (66479 - 133486, n=5) | |
| Schenker XMG Pro 16 (E25) | |
| Alienware 16 Area-51 | |
| MSI Vector 16 HX A14V | |
| Average of class Gaming (22297 - 135096, n=110, last 2 years) | |
| MSI Vector 16 HX AI A2XWHG | |
| MSI Katana 17 HX B14WGK | |
| AIDA64 / Memory Latency | |
| Alienware 16 Area-51 | |
| Average Intel Core Ultra 7 255HX (104.2 - 110, n=5) | |
| MSI Vector 16 HX AI A2XWHG | |
| Average of class Gaming (75.3 - 259, n=110, last 2 years) | |
| Schenker XMG Pro 16 (E25) | |
| MSI Katana 17 HX B14WGK | |
| MSI Vector 16 HX A14V | |
* ... smaller is better
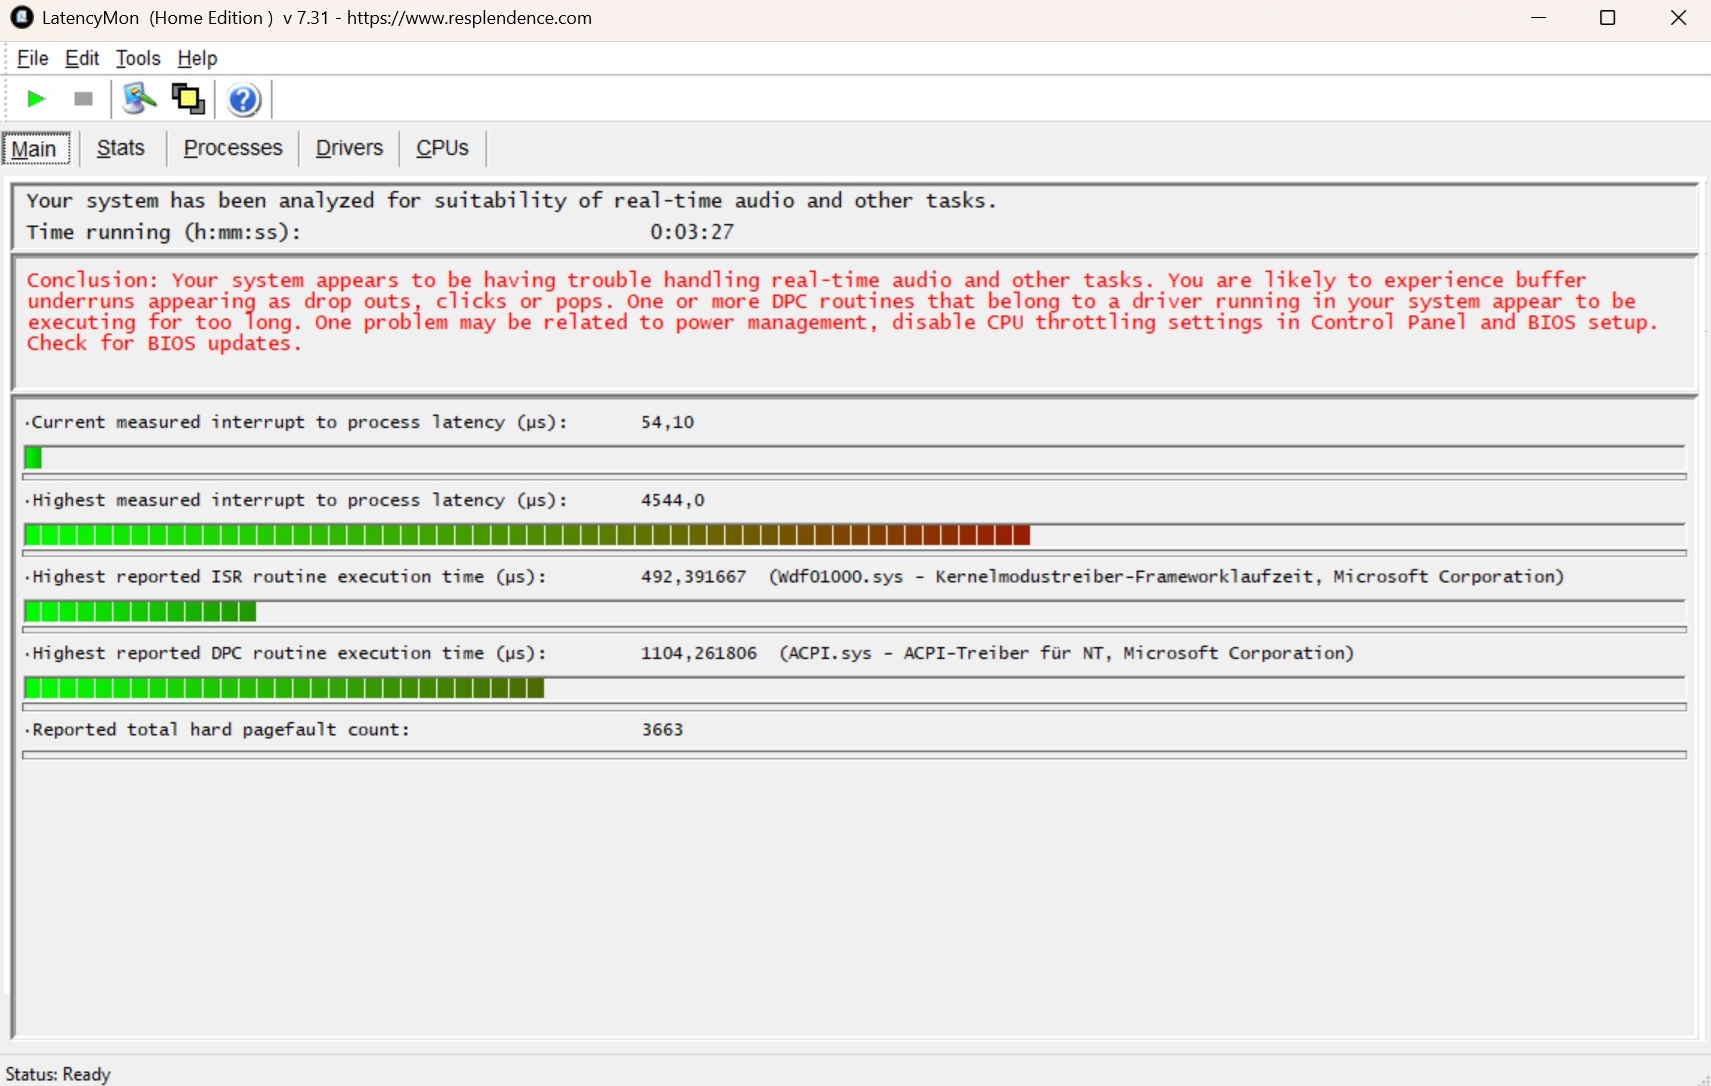
DPC 延迟
微星仍需努力解决延迟问题。根据 LatencyMon 的数据,Vector 16 和 Katana 17 的延迟值都非常高,可能会导致掉线。

| DPC Latencies / LatencyMon - interrupt to process latency (max), Web, Youtube, Prime95 | |
| MSI Katana 17 HX B14WGK | |
| MSI Vector 16 HX AI A2XWHG | |
| Alienware 16 Area-51 | |
| Schenker XMG Pro 16 (E25) | |
| MSI Vector 16 HX A14V | |
* ... smaller is better
存储
在大容量存储方面也有改进的余地。虽然内置美光硬盘的读取速度对于 NVMe 型号来说相当不错,但写入速度还有待提高。不过,16 英寸硬盘在循环测试中没有出现掉线现象。

* ... smaller is better
Sustained read performance: DiskSpd read loop, queue depth 8
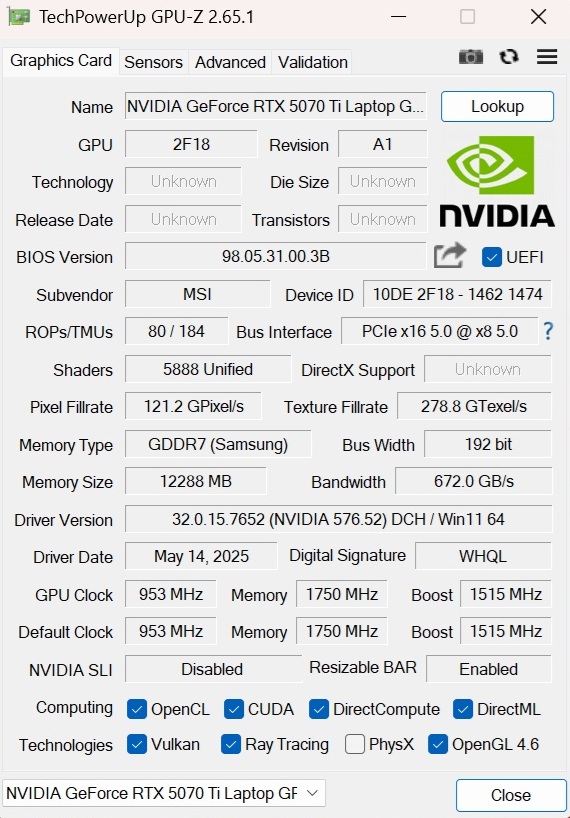
图形处理器性能
......(英文 GeForce RTX 5070 Ti在我们看来应该是真正的 RTX 5070在我们看来,RTX 5070 Ti 应该是真正的 RTX 5070,因为它的 VRAM 从 12 GB 升级到了 8 GB,已经跟不上时代的步伐。不过,Ti 版本在合成基准测试和游戏中都给人留下了不错的印象。Vector 16 中的结果基于之前确定的该显卡的平均值。微星为 Blackwell 代表提供了最大 140 瓦的 TGP(包括动态提升)。显卡 RTX 5080比 RTX 5070 Ti 高出约 20%。
| 3DMark 06 Standard Score | 60964 points | |
| 3DMark 11 Performance | 41662 points | |
| 3DMark Cloud Gate Standard Score | 61167 points | |
| 3DMark Fire Strike Score | 36625 points | |
| 3DMark Time Spy Score | 15886 points | |
Help | ||
* ... smaller is better
游戏性能
| Doom: The Dark Ages | |
| 2560x1440 Ultra Nightmare AA:T | |
| Medion Erazer Beast 18 X1 MD62731 | |
| MSI Vector 16 HX AI A2XWHG | |
| Average of class Gaming (30.4 - 92.2, n=19, last 2 years) | |
| Average NVIDIA GeForce RTX 5070 Ti Laptop (45.7 - 59.1, n=3) | |
| MSI Katana 17 HX B14WGK | |
| 2560x1440 Ultra Nightmare - DLSS Quality | |
| Medion Erazer Beast 18 X1 MD62731 | |
| MSI Vector 16 HX AI A2XWHG | |
| Average NVIDIA GeForce RTX 5070 Ti Laptop (61 - 82.5, n=3) | |
| Average of class Gaming (48 - 107.3, n=18, last 2 years) | |
| MSI Katana 17 HX B14WGK | |
| The Elder Scrolls IV Oblivion Remastered | |
| 2560x1440 Ultra Preset AA:T | |
| Medion Erazer Beast 18 X1 MD62731 | |
| Average NVIDIA GeForce RTX 5070 Ti Laptop (28 - 30.9, n=3) | |
| MSI Vector 16 HX AI A2XWHG | |
| Average of class Gaming (12.7 - 45.9, n=14, last 2 years) | |
| MSI Katana 17 HX B14WGK | |
| 2560x1440 Ultra Preset + Quality DLSS | |
| Medion Erazer Beast 18 X1 MD62731 | |
| Average NVIDIA GeForce RTX 5070 Ti Laptop (41.9 - 47.4, n=3) | |
| MSI Vector 16 HX AI A2XWHG | |
| Average of class Gaming (25.3 - 59.7, n=12, last 2 years) | |
| MSI Katana 17 HX B14WGK | |
| Kingdom Come Deliverance 2 | |
| 2560x1440 Ultra Preset | |
| Medion Erazer Beast 18 X1 MD62731 | |
| Average NVIDIA GeForce RTX 5070 Ti Laptop (59 - 65, n=3) | |
| Average of class Gaming (36.8 - 97.2, n=13, last 2 years) | |
| MSI Vector 16 HX AI A2XWHG | |
| MSI Katana 17 HX B14WGK | |
| 2560x1440 Ultra Preset + Quality DLSS | |
| Medion Erazer Beast 18 X1 MD62731 | |
| Average NVIDIA GeForce RTX 5070 Ti Laptop (79.2 - 94.7, n=3) | |
| Average of class Gaming (50.3 - 115.5, n=13, last 2 years) | |
| MSI Vector 16 HX AI A2XWHG | |
| MSI Katana 17 HX B14WGK | |
| Until Dawn | |
| 2560x1440 Ultra Preset | |
| Medion Erazer Beast 18 X1 MD62731 | |
| Average of class Gaming (30.4 - 76.6, n=11, last 2 years) | |
| MSI Vector 16 HX AI A2XWHG | |
| Average NVIDIA GeForce RTX 5070 Ti Laptop (n=1) | |
| MSI Katana 17 HX B14WGK | |
| 2560x1440 Ultra Preset + Quality DLSS + Ray Tracing | |
| Medion Erazer Beast 18 X1 MD62731 | |
| MSI Vector 16 HX AI A2XWHG | |
| Average NVIDIA GeForce RTX 5070 Ti Laptop (n=1) | |
| Average of class Gaming (39.5 - 86.3, n=10, last 2 years) | |
| MSI Katana 17 HX B14WGK | |
| Space Marine 2 | |
| 2560x1440 Ultra Preset AA:T | |
| Medion Erazer Beast 18 X1 MD62731 | |
| MSI Vector 16 HX AI A2XWHG | |
| Average NVIDIA GeForce RTX 5070 Ti Laptop (n=1) | |
| Average of class Gaming (48.2 - 107.4, n=11, last 2 years) | |
| MSI Katana 17 HX B14WGK | |
| 2560x1440 Ultra Preset + Quality DLSS | |
| Medion Erazer Beast 18 X1 MD62731 | |
| MSI Vector 16 HX AI A2XWHG | |
| Average NVIDIA GeForce RTX 5070 Ti Laptop (n=1) | |
| Average of class Gaming (58.5 - 100.8, n=10, last 2 years) | |
| MSI Katana 17 HX B14WGK | |
| Senua's Saga Hellblade 2 | |
| 2560x1440 High Preset | |
| Medion Erazer Beast 18 X1 MD62731 | |
| MSI Vector 16 HX AI A2XWHG | |
| Average NVIDIA GeForce RTX 5070 Ti Laptop (n=1) | |
| Average of class Gaming (24.2 - 63.1, n=12, last 2 years) | |
| MSI Katana 17 HX B14WGK | |
| 2560x1440 High Preset + Quality DLSS | |
| Medion Erazer Beast 18 X1 MD62731 | |
| MSI Vector 16 HX AI A2XWHG | |
| Average NVIDIA GeForce RTX 5070 Ti Laptop (n=1) | |
| Average of class Gaming (39.6 - 81.9, n=10, last 2 years) | |
| MSI Katana 17 HX B14WGK | |
| Ghost of Tsushima | |
| 2560x1440 Very High Preset AA:T | |
| Medion Erazer Beast 18 X1 MD62731 | |
| MSI Vector 16 HX AI A2XWHG | |
| Average NVIDIA GeForce RTX 5070 Ti Laptop (n=1) | |
| Average of class Gaming (22.7 - 100.3, n=14, last 2 years) | |
| MSI Katana 17 HX B14WGK | |
| 2560x1440 Very High Preset + Quality DLSS | |
| Medion Erazer Beast 18 X1 MD62731 | |
| MSI Vector 16 HX AI A2XWHG | |
| Average NVIDIA GeForce RTX 5070 Ti Laptop (n=1) | |
| Average of class Gaming (55.2 - 105.2, n=11, last 2 years) | |
| MSI Katana 17 HX B14WGK | |
| Horizon Forbidden West | |
| 2560x1440 Very High Preset AA:T | |
| Medion Erazer Beast 18 X1 MD62731 | |
| MSI Vector 16 HX AI A2XWHG | |
| Average NVIDIA GeForce RTX 5070 Ti Laptop (n=1) | |
| Average of class Gaming (39.6 - 100.9, n=10, last 2 years) | |
| MSI Katana 17 HX B14WGK | |
| 2560x1440 Very High Preset + DLSS Quality | |
| Medion Erazer Beast 18 X1 MD62731 | |
| MSI Vector 16 HX AI A2XWHG | |
| Average NVIDIA GeForce RTX 5070 Ti Laptop (n=1) | |
| Average of class Gaming (58.4 - 116.6, n=8, last 2 years) | |
| MSI Katana 17 HX B14WGK | |
| GTA V - 1920x1080 Highest AA:4xMSAA + FX AF:16x | |
| Schenker XMG Pro 16 (E25) | |
| MSI Vector 16 HX AI A2XWHG | |
| Average NVIDIA GeForce RTX 5070 Ti Laptop (98 - 166.3, n=14) | |
| MSI Vector 16 HX A14V | |
| Average of class Gaming (48.3 - 186.9, n=103, last 2 years) | |
| MSI Katana 17 HX B14WGK | |
| Final Fantasy XV Benchmark - 1920x1080 High Quality | |
| Alienware 16 Area-51 | |
| MSI Vector 16 HX A14V | |
| MSI Vector 16 HX AI A2XWHG | |
| Average NVIDIA GeForce RTX 5070 Ti Laptop (108.9 - 181.4, n=15) | |
| Schenker XMG Pro 16 (E25) | |
| Average of class Gaming (41 - 215, n=104, last 2 years) | |
| Strange Brigade - 1920x1080 ultra AA:ultra AF:16 | |
| Alienware 16 Area-51 | |
| MSI Vector 16 HX A14V | |
| Average NVIDIA GeForce RTX 5070 Ti Laptop (136.4 - 353, n=12) | |
| Average of class Gaming (76.3 - 456, n=94, last 2 years) | |
| Schenker XMG Pro 16 (E25) | |
| low | med. | high | ultra | QHD DLSS | QHD | |
|---|---|---|---|---|---|---|
| GTA V (2015) | 185.6 | 179 | 144.8 | 138.8 | ||
| Dota 2 Reborn (2015) | 209 | 183.9 | 175.8 | 164.7 | ||
| Final Fantasy XV Benchmark (2018) | 208 | 163.1 | 119.7 | |||
| X-Plane 11.11 (2018) | 138.7 | 114.7 | 106.6 | |||
| Baldur's Gate 3 (2023) | 179.1 | 151.9 | 147.4 | 99.1 | ||
| Cyberpunk 2077 (2023) | 138.5 | 135.4 | 119.6 | 75 | ||
| Counter-Strike 2 (2023) | 316 | 265 | 222 | 174.1 | ||
| Prince of Persia The Lost Crown (2024) | 358 | 358 | 357 | 356 | ||
| Helldivers 2 (2024) | 143.8 | 141.7 | 141.4 | 101.6 | ||
| Dragon's Dogma 2 (2024) | 83 | 74.8 | ||||
| Horizon Forbidden West (2024) | 131.1 | 97.5 | 96 | 93.1 | 72.6 | |
| Ghost of Tsushima (2024) | 106.5 | 102 | 83.8 | 83.9 | 60.7 | |
| Senua's Saga Hellblade 2 (2024) | 77.2 | 55 | 59.1 | 40 | ||
| Star Wars Outlaws (2024) | 70.7 | 66.5 | 55.9 | 56.8 | 40.3 | |
| Space Marine 2 (2024) | 90.9 | 88.8 | 87.7 | 84.6 | 73.1 | |
| Until Dawn (2024) | 99.3 | 85.9 | 67.7 | 61.4 | 48 | |
| Stalker 2 (2024) | 84.6 | 73.6 | 62 | 100.8 | 46.9 | |
| Kingdom Come Deliverance 2 (2025) | 145.2 | 118.8 | 84.1 | 79.2 | 59 | |
| Civilization 7 (2025) | 192.1 | 187.5 | 129.1 | |||
| The Elder Scrolls IV Oblivion Remastered (2025) | 86.9 | 78.2 | 40 | 41.9 | 28 | |
| Doom: The Dark Ages (2025) | 94.8 | 84.3 | 82.7 | 79.1 | 57.9 |
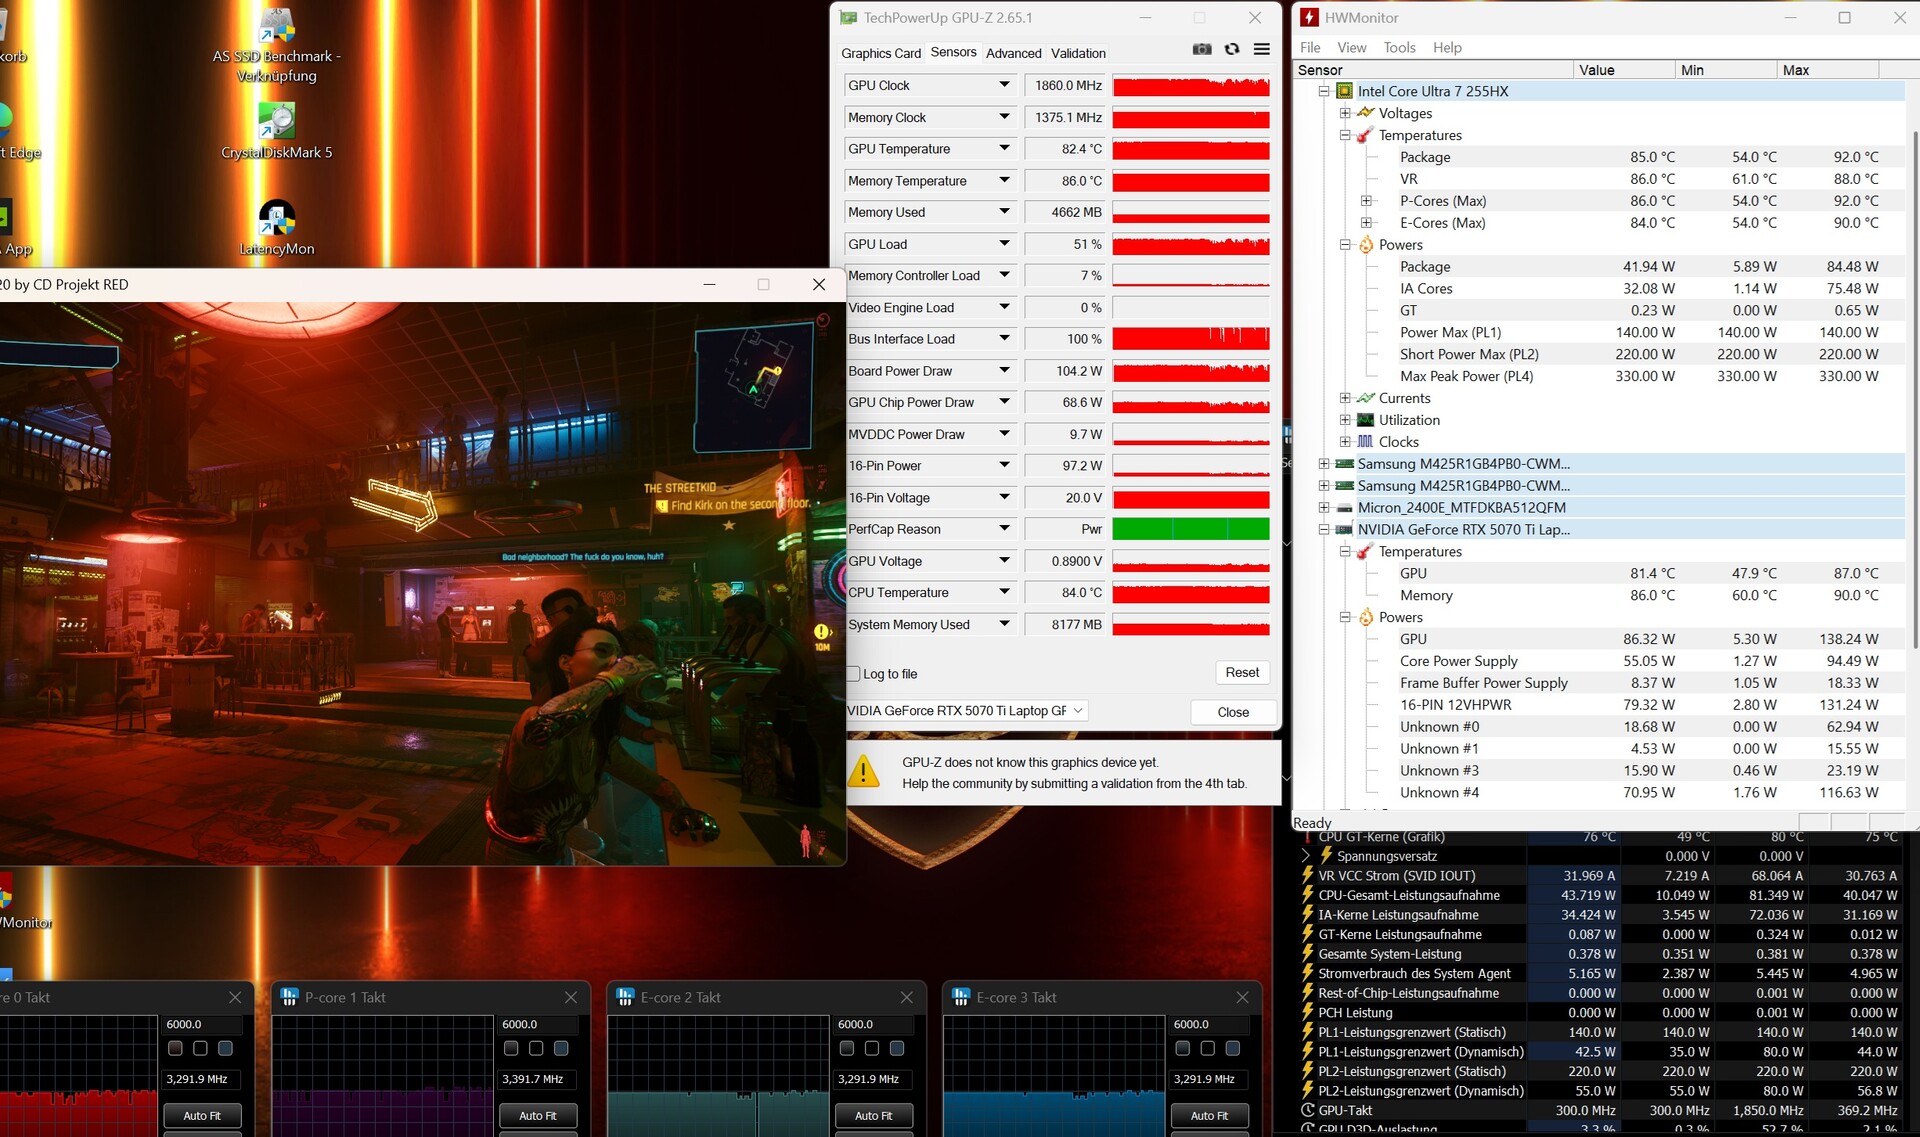
我们的 赛博朋克 2077测试也证明 GPU 性能在较长时间内保持不变。在 Cinebench 循环测试中,CPU 的情况也类似。
Cyberpunk 2077 ultra FPS chart
排放量
噪音水平
微星应该重新考虑风扇控制。如前所述,在 AI 配置文件下,两个机箱风扇在空闲时已经相当嘈杂。在 3D 模式下,Vector 16 的噪音比其他几款竞争对手要小一些,在 46 到 49 分贝之间,前提是 CPU 没有负载。不过,这并不意味着这款 16 英寸笔记本电脑很安静。
Noise level
| Idle |
| 33 / 34 / 38 dB(A) |
| Load |
| 46 / 49 dB(A) |
 | ||
30 dB silent 40 dB(A) audible 50 dB(A) loud |
||
min: | ||
| MSI Vector 16 HX AI A2XWHG Ultra 7 255HX, GeForce RTX 5070 Ti Laptop | MSI Vector 16 HX A14V i9-14900HX, GeForce RTX 4080 Laptop GPU | MSI Katana 17 HX B14WGK i7-14650HX, GeForce RTX 5070 Laptop | Schenker XMG Pro 16 (E25) Ultra 9 275HX, GeForce RTX 5070 Ti Laptop | Alienware 16 Area-51 Ultra 9 275HX, GeForce RTX 5080 Laptop | |
|---|---|---|---|---|---|
| Noise | -4% | -4% | 10% | 13% | |
| off / environment * (dB) | 25 | 23.2 7% | 25 -0% | 23.3 7% | 23.6 6% |
| Idle Minimum * (dB) | 33 | 33.5 -2% | 31 6% | 25 24% | 25.4 23% |
| Idle Average * (dB) | 34 | 33.5 1% | 32 6% | 25 26% | 27.8 18% |
| Idle Maximum * (dB) | 38 | 33.5 12% | 34 11% | 25 34% | 28.1 26% |
| Load Average * (dB) | 46 | 52.1 -13% | 50 -9% | 45.5 1% | 28.8 37% |
| Cyberpunk 2077 ultra * (dB) | 47 | 58 -23% | 53.3 -13% | 50.4 -7% | |
| Load Maximum * (dB) | 49 | 62 -27% | 59 -20% | 53.3 -9% | 56.4 -15% |
| Witcher 3 ultra * (dB) | 62 |
* ... smaller is better
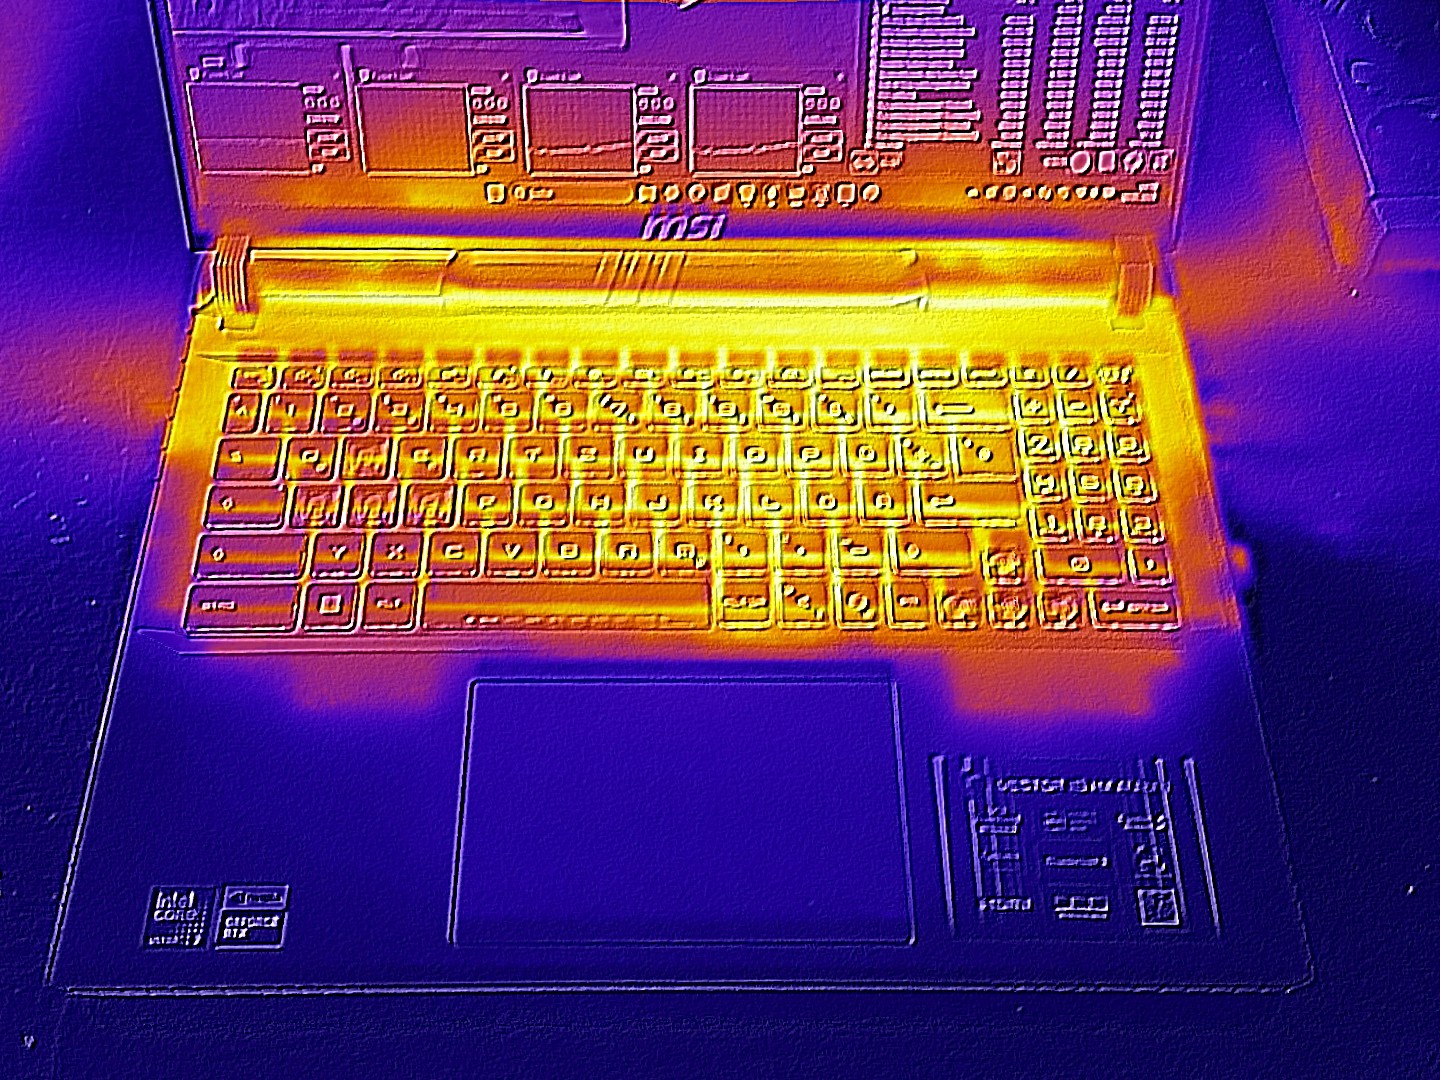
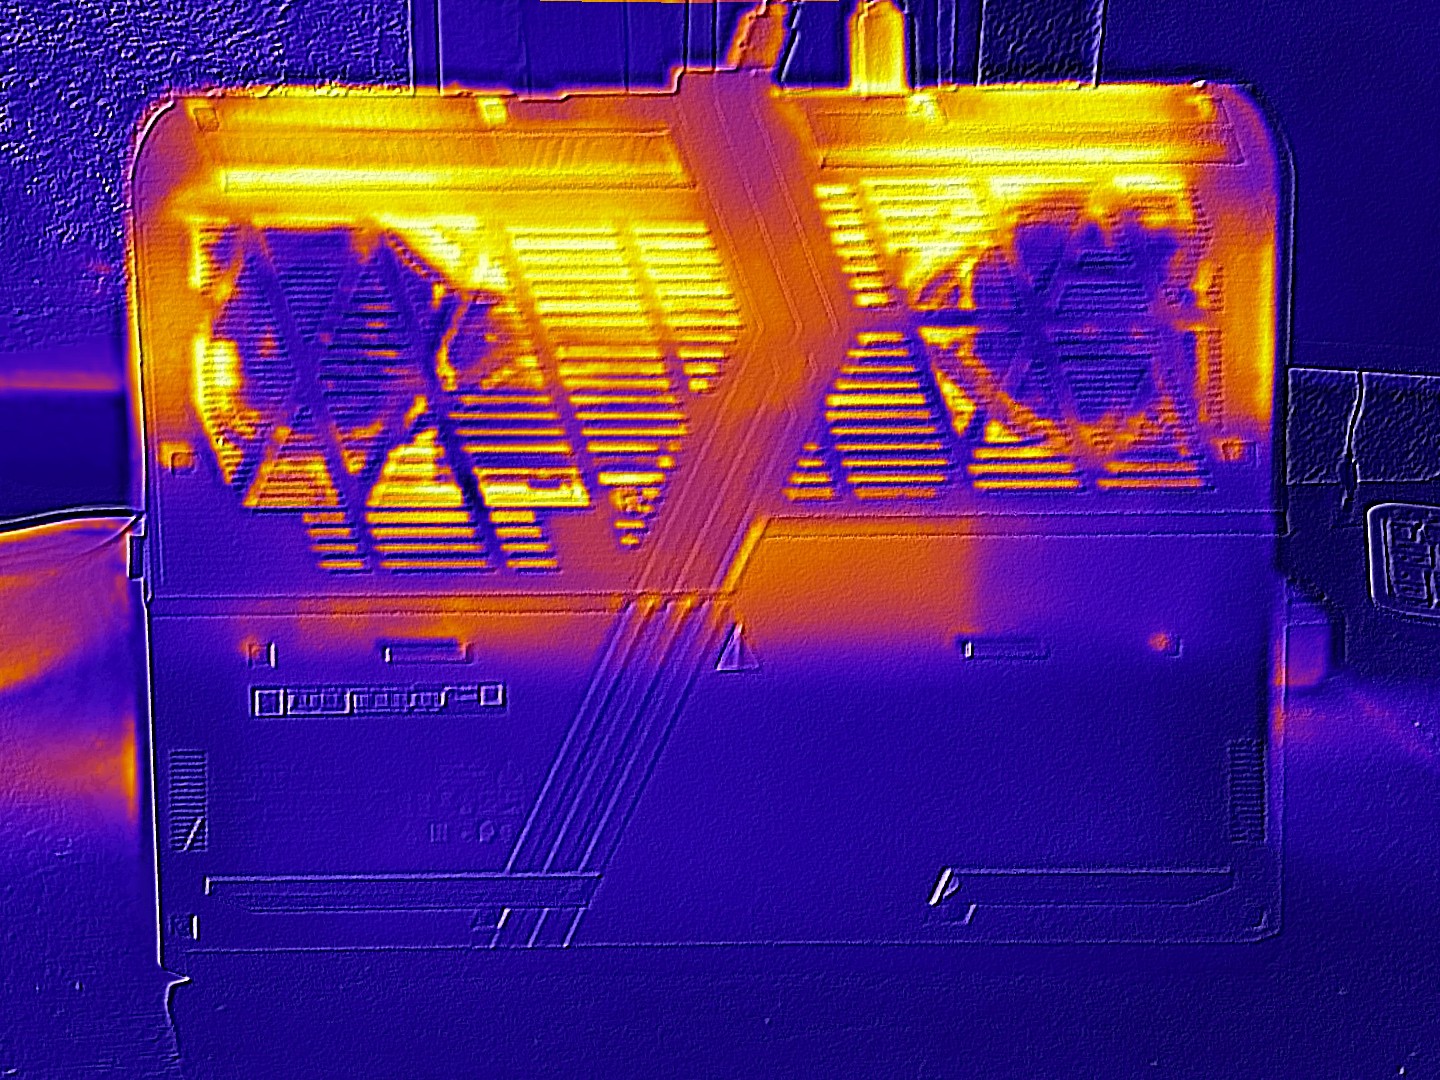
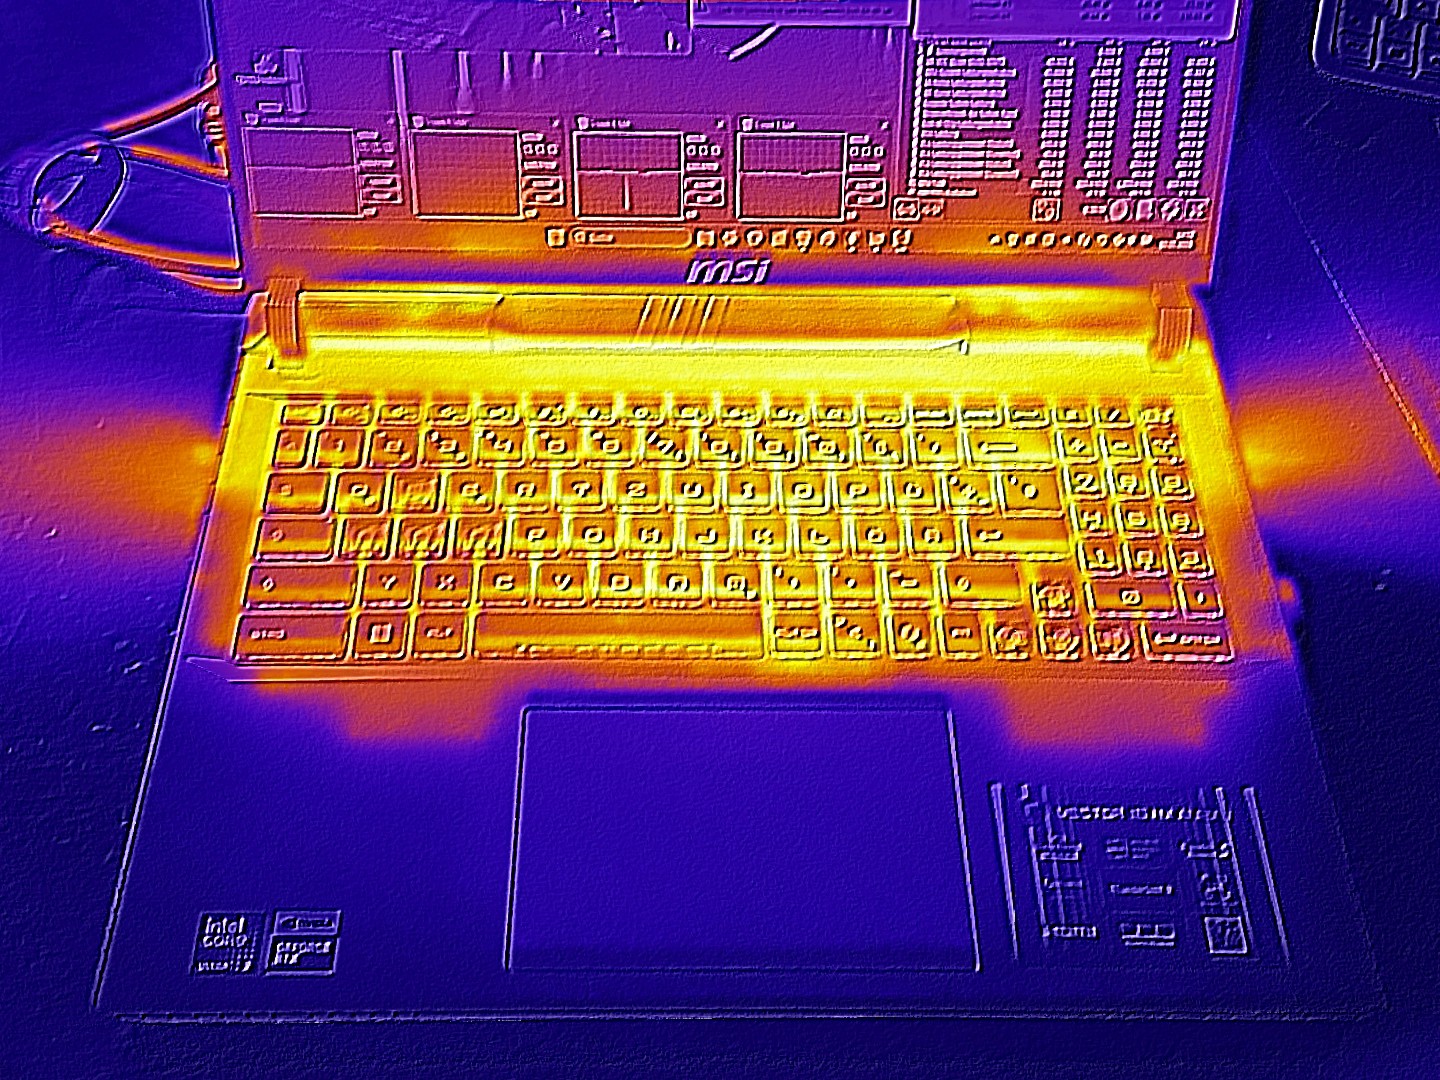
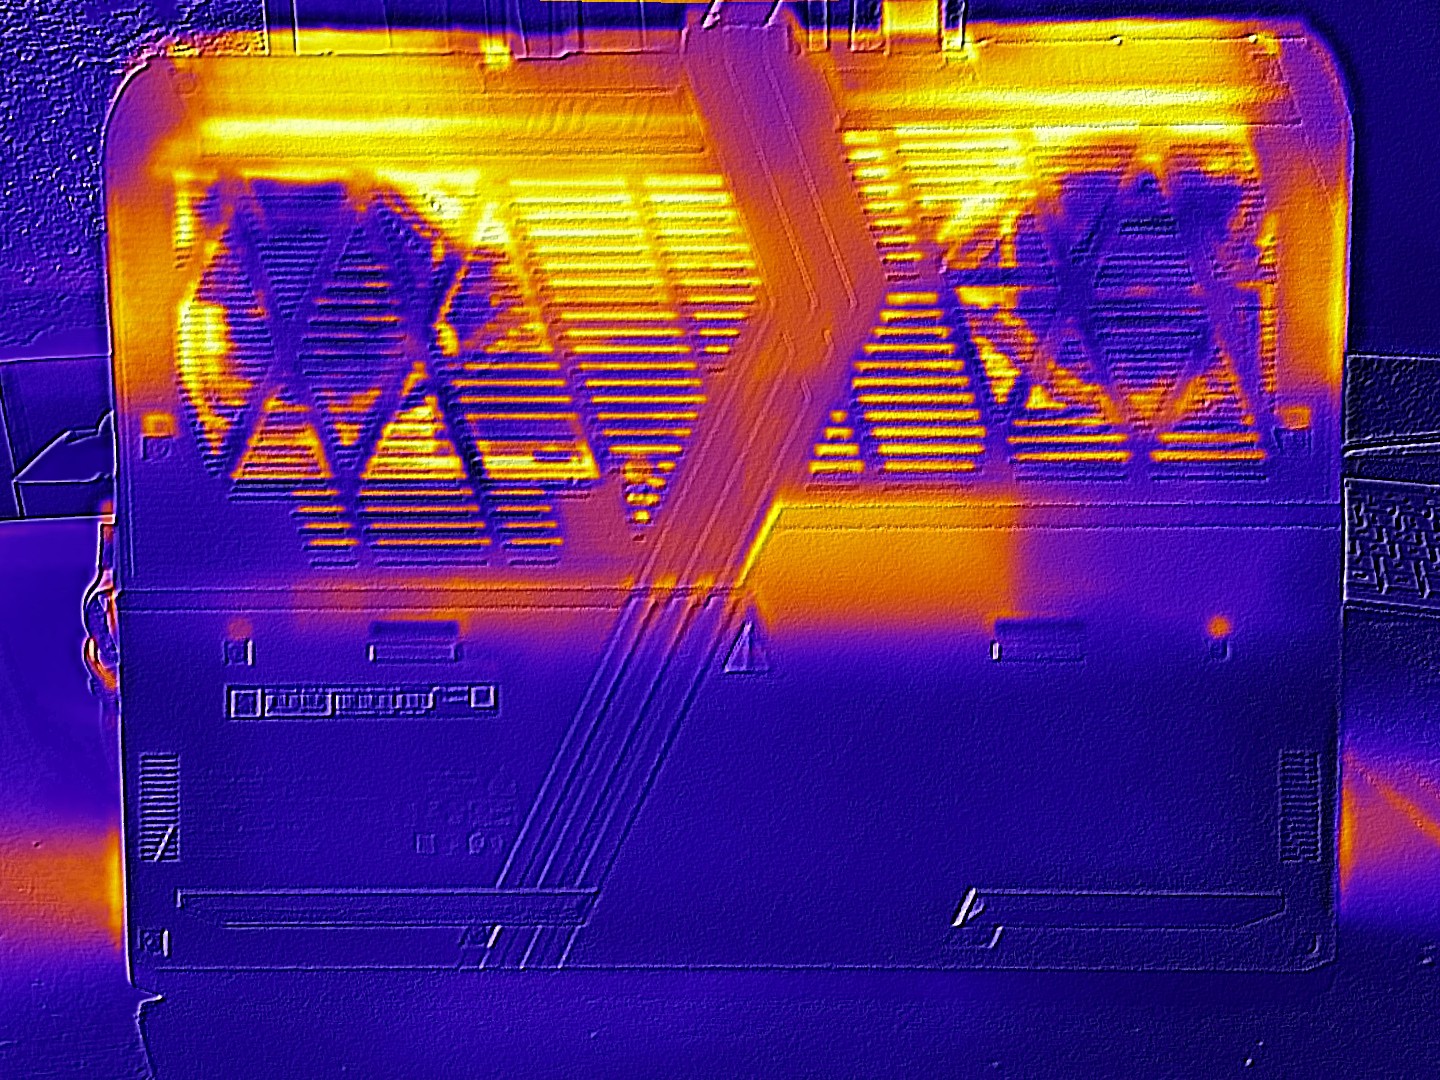
温度
在负载情况下,机箱后三分之一处温度最高。机箱顶部的峰值温度为 53 °C,底部的峰值温度为 52 °C,与同类产品相比,温度略高。不过,在闲置状态下,机箱温度通常低于 30 °C,保持舒适凉爽。
(-) The maximum temperature on the upper side is 53 °C / 127 F, compared to the average of 40.4 °C / 105 F, ranging from 21.2 to 68.8 °C for the class Gaming.
(-) The bottom heats up to a maximum of 52 °C / 126 F, compared to the average of 43.2 °C / 110 F
(+) In idle usage, the average temperature for the upper side is 28.1 °C / 83 F, compared to the device average of 33.9 °C / 93 F.
(-) 3: The average temperature for the upper side is 43.9 °C / 111 F, compared to the average of 33.9 °C / 93 F for the class Gaming.
(±) The palmrests and touchpad can get very hot to the touch with a maximum of 37 °C / 98.6 F.
(-) The average temperature of the palmrest area of similar devices was 28.8 °C / 83.8 F (-8.2 °C / -14.8 F).
| MSI Vector 16 HX AI A2XWHG Ultra 7 255HX, GeForce RTX 5070 Ti Laptop | MSI Vector 16 HX A14V i9-14900HX, GeForce RTX 4080 Laptop GPU | MSI Katana 17 HX B14WGK i7-14650HX, GeForce RTX 5070 Laptop | Schenker XMG Pro 16 (E25) Ultra 9 275HX, GeForce RTX 5070 Ti Laptop | Alienware 16 Area-51 Ultra 9 275HX, GeForce RTX 5080 Laptop | |
|---|---|---|---|---|---|
| Heat | 22% | -4% | -191% | 3% | |
| Maximum Upper Side * (°C) | 53 | 36.4 31% | 52 2% | 43.2 18% | 43.8 17% |
| Maximum Bottom * (°C) | 52 | 35.6 32% | 56 -8% | 46 12% | 40 23% |
| Idle Upper Side * (°C) | 33 | 26.6 19% | 33 -0% | 27.7 16% | 35.8 -8% |
| Idle Bottom * (°C) | 29 | 27 7% | 32 -10% | 264 -810% | 35.2 -21% |
* ... smaller is better
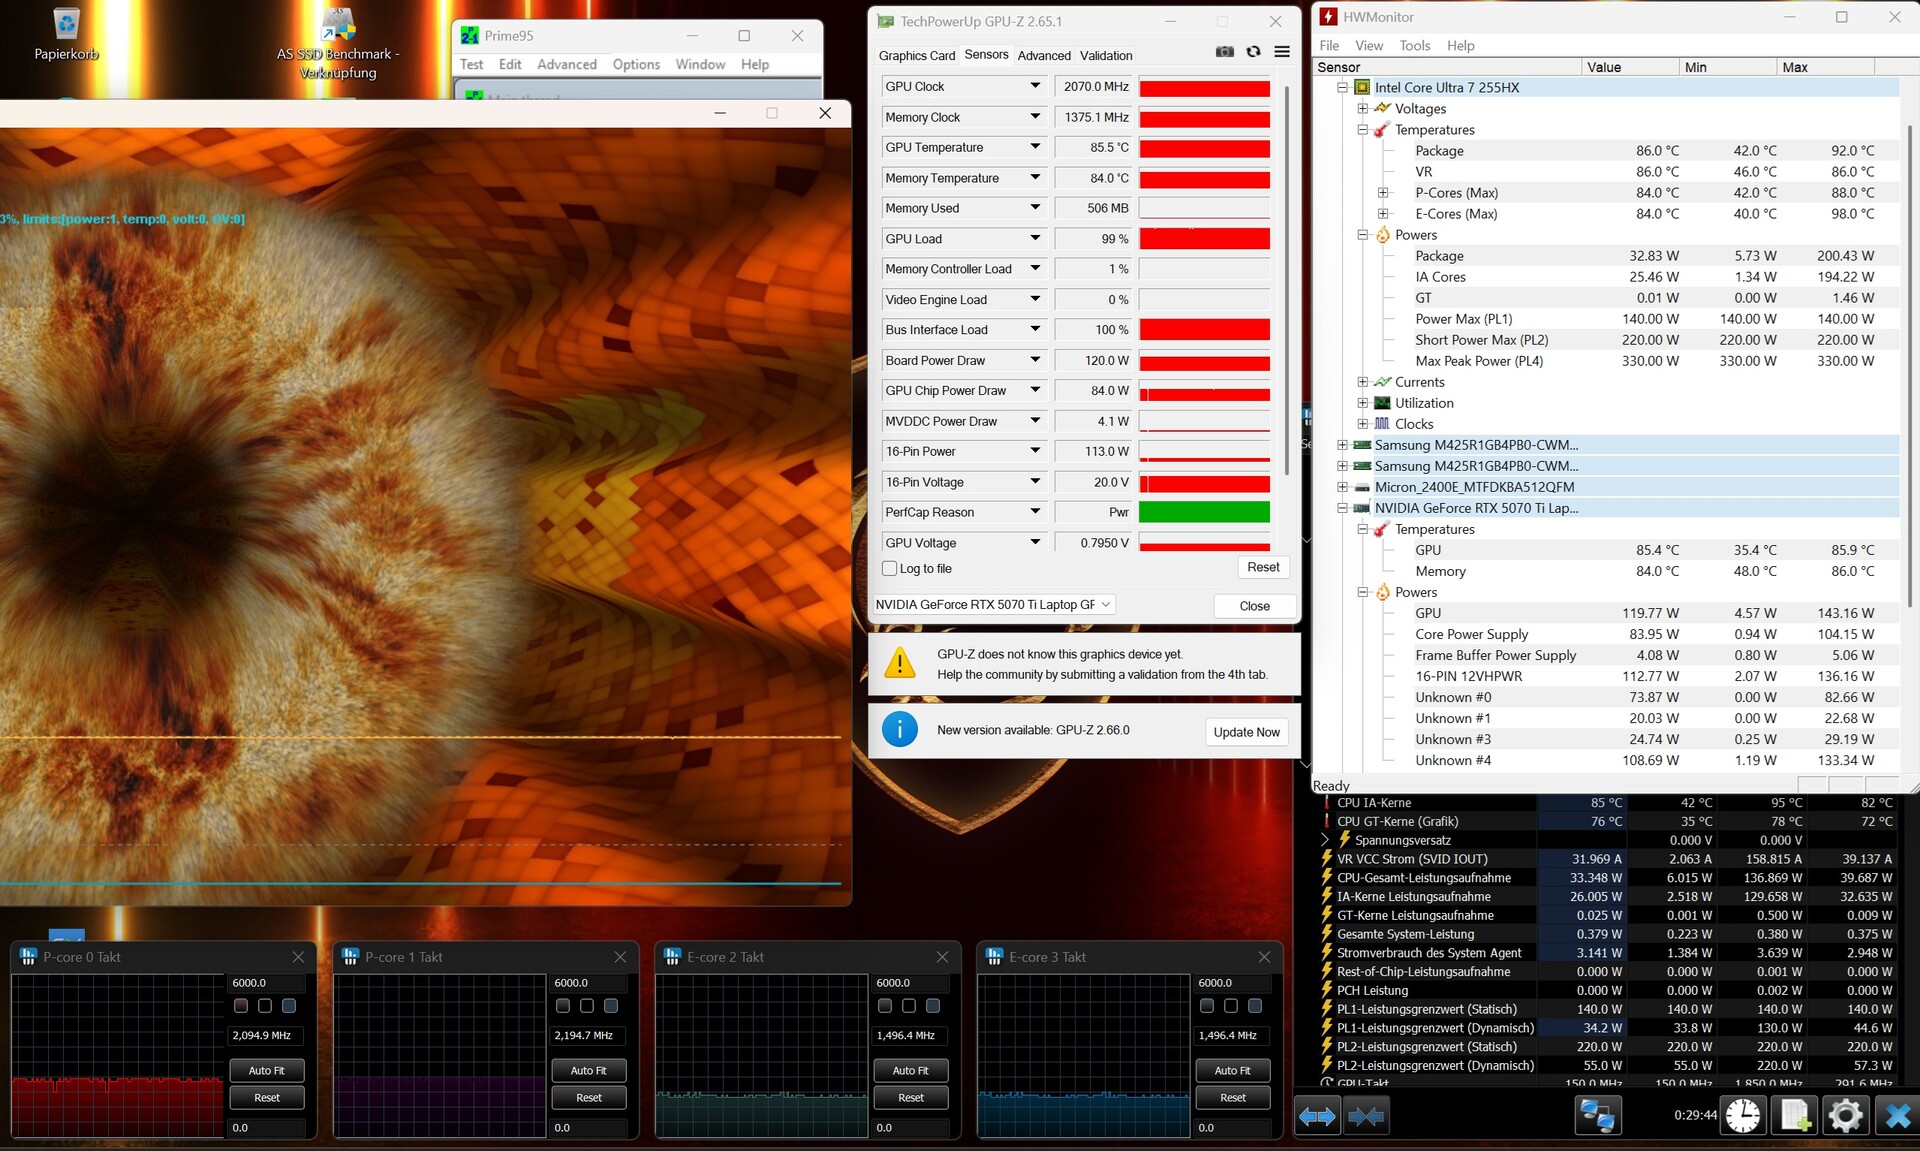
压力测试
使用 FurMark 和 Prime95 进行的压力测试结果好坏参半。CPU 和 GPU 的温度都在 86 °C 左右,既不算特别低,也不算过高。在《赛博朋克 2077》中,组件温度仅略低一些。
发言人
音质在游戏笔记本电脑中处于中等水平。通常情况下,低音可以更加明显。尽管如此,内置音响系统明显优于 Katana 17(见对比表)。
MSI Vector 16 HX AI A2XWHG audio analysis
(+) | speakers can play relatively loud (86 dB)
Bass 100 - 315 Hz
(±) | reduced bass - on average 12.3% lower than median
(±) | linearity of bass is average (8.5% delta to prev. frequency)
Mids 400 - 2000 Hz
(±) | higher mids - on average 9.9% higher than median
(+) | mids are linear (6.8% delta to prev. frequency)
Highs 2 - 16 kHz
(+) | balanced highs - only 1.8% away from median
(+) | highs are linear (2.9% delta to prev. frequency)
Overall 100 - 16.000 Hz
(±) | linearity of overall sound is average (15.8% difference to median)
Compared to same class
» 37% of all tested devices in this class were better, 7% similar, 56% worse
» The best had a delta of 6%, average was 18%, worst was 132%
Compared to all devices tested
» 24% of all tested devices were better, 5% similar, 71% worse
» The best had a delta of 4%, average was 24%, worst was 134%
MSI Katana 17 HX B14WGK audio analysis
(+) | speakers can play relatively loud (84 dB)
Bass 100 - 315 Hz
(-) | nearly no bass - on average 19% lower than median
(±) | linearity of bass is average (10.6% delta to prev. frequency)
Mids 400 - 2000 Hz
(±) | higher mids - on average 8.7% higher than median
(±) | linearity of mids is average (7.5% delta to prev. frequency)
Highs 2 - 16 kHz
(+) | balanced highs - only 4.6% away from median
(±) | linearity of highs is average (9.7% delta to prev. frequency)
Overall 100 - 16.000 Hz
(±) | linearity of overall sound is average (20.6% difference to median)
Compared to same class
» 74% of all tested devices in this class were better, 5% similar, 21% worse
» The best had a delta of 6%, average was 18%, worst was 132%
Compared to all devices tested
» 55% of all tested devices were better, 8% similar, 37% worse
» The best had a delta of 4%, average was 24%, worst was 134%
电源管理
耗电量
怠速功耗平均约为 16 瓦,低于许多其他 RTX 5070(Ti)笔记本电脑。在负载情况下,16 英寸系统的功耗介于 124 瓦(3DMark 06)和压力测试期间 336 瓦的峰值之间。在游戏过程中,功耗通常徘徊在 220 瓦左右。请注意,在使用外接显示器时,系统默认使用专用 GPU,这会导致较高的闲置功耗。
| Off / Standby | |
| Idle | |
| Load |
|
Key:
min: | |
| MSI Vector 16 HX AI A2XWHG Ultra 7 255HX, GeForce RTX 5070 Ti Laptop | MSI Vector 16 HX A14V i9-14900HX, GeForce RTX 4080 Laptop GPU | MSI Katana 17 HX B14WGK i7-14650HX, GeForce RTX 5070 Laptop | Schenker XMG Pro 16 (E25) Ultra 9 275HX, GeForce RTX 5070 Ti Laptop | Alienware 16 Area-51 Ultra 9 275HX, GeForce RTX 5080 Laptop | Average of class Gaming | |
|---|---|---|---|---|---|---|
| Power Consumption | -33% | 5% | -5% | -67% | -10% | |
| Idle Minimum * (Watt) | 7.1 | 15.8 -123% | 9.7 -37% | 11.7 -65% | 27 -280% | 13.3 ? -87% |
| Idle Average * (Watt) | 15.9 | 23.3 -47% | 15 6% | 16.6 -4% | 33.5 -111% | 19 ? -19% |
| Idle Maximum * (Watt) | 29.5 | 30 -2% | 23.7 20% | 17.1 42% | 41.4 -40% | 24.5 ? 17% |
| Load Average * (Watt) | 124 | 123.9 -0% | 126 -2% | 122.4 1% | 124.7 -1% | 108.1 ? 13% |
| Cyberpunk 2077 ultra external monitor * (Watt) | 217 | 202 7% | 241 -11% | 249 -15% | ||
| Cyberpunk 2077 ultra * (Watt) | 222 | 205 8% | 245 -10% | 256 -15% | ||
| Load Maximum * (Watt) | 336 | 306 9% | 227 32% | 291.5 13% | 367.2 -9% | 254 ? 24% |
| Witcher 3 ultra * (Watt) | 285 |
* ... smaller is better
Power consumption: Cyberpunk/stress test
Power consumption with external monitor
电池运行时间
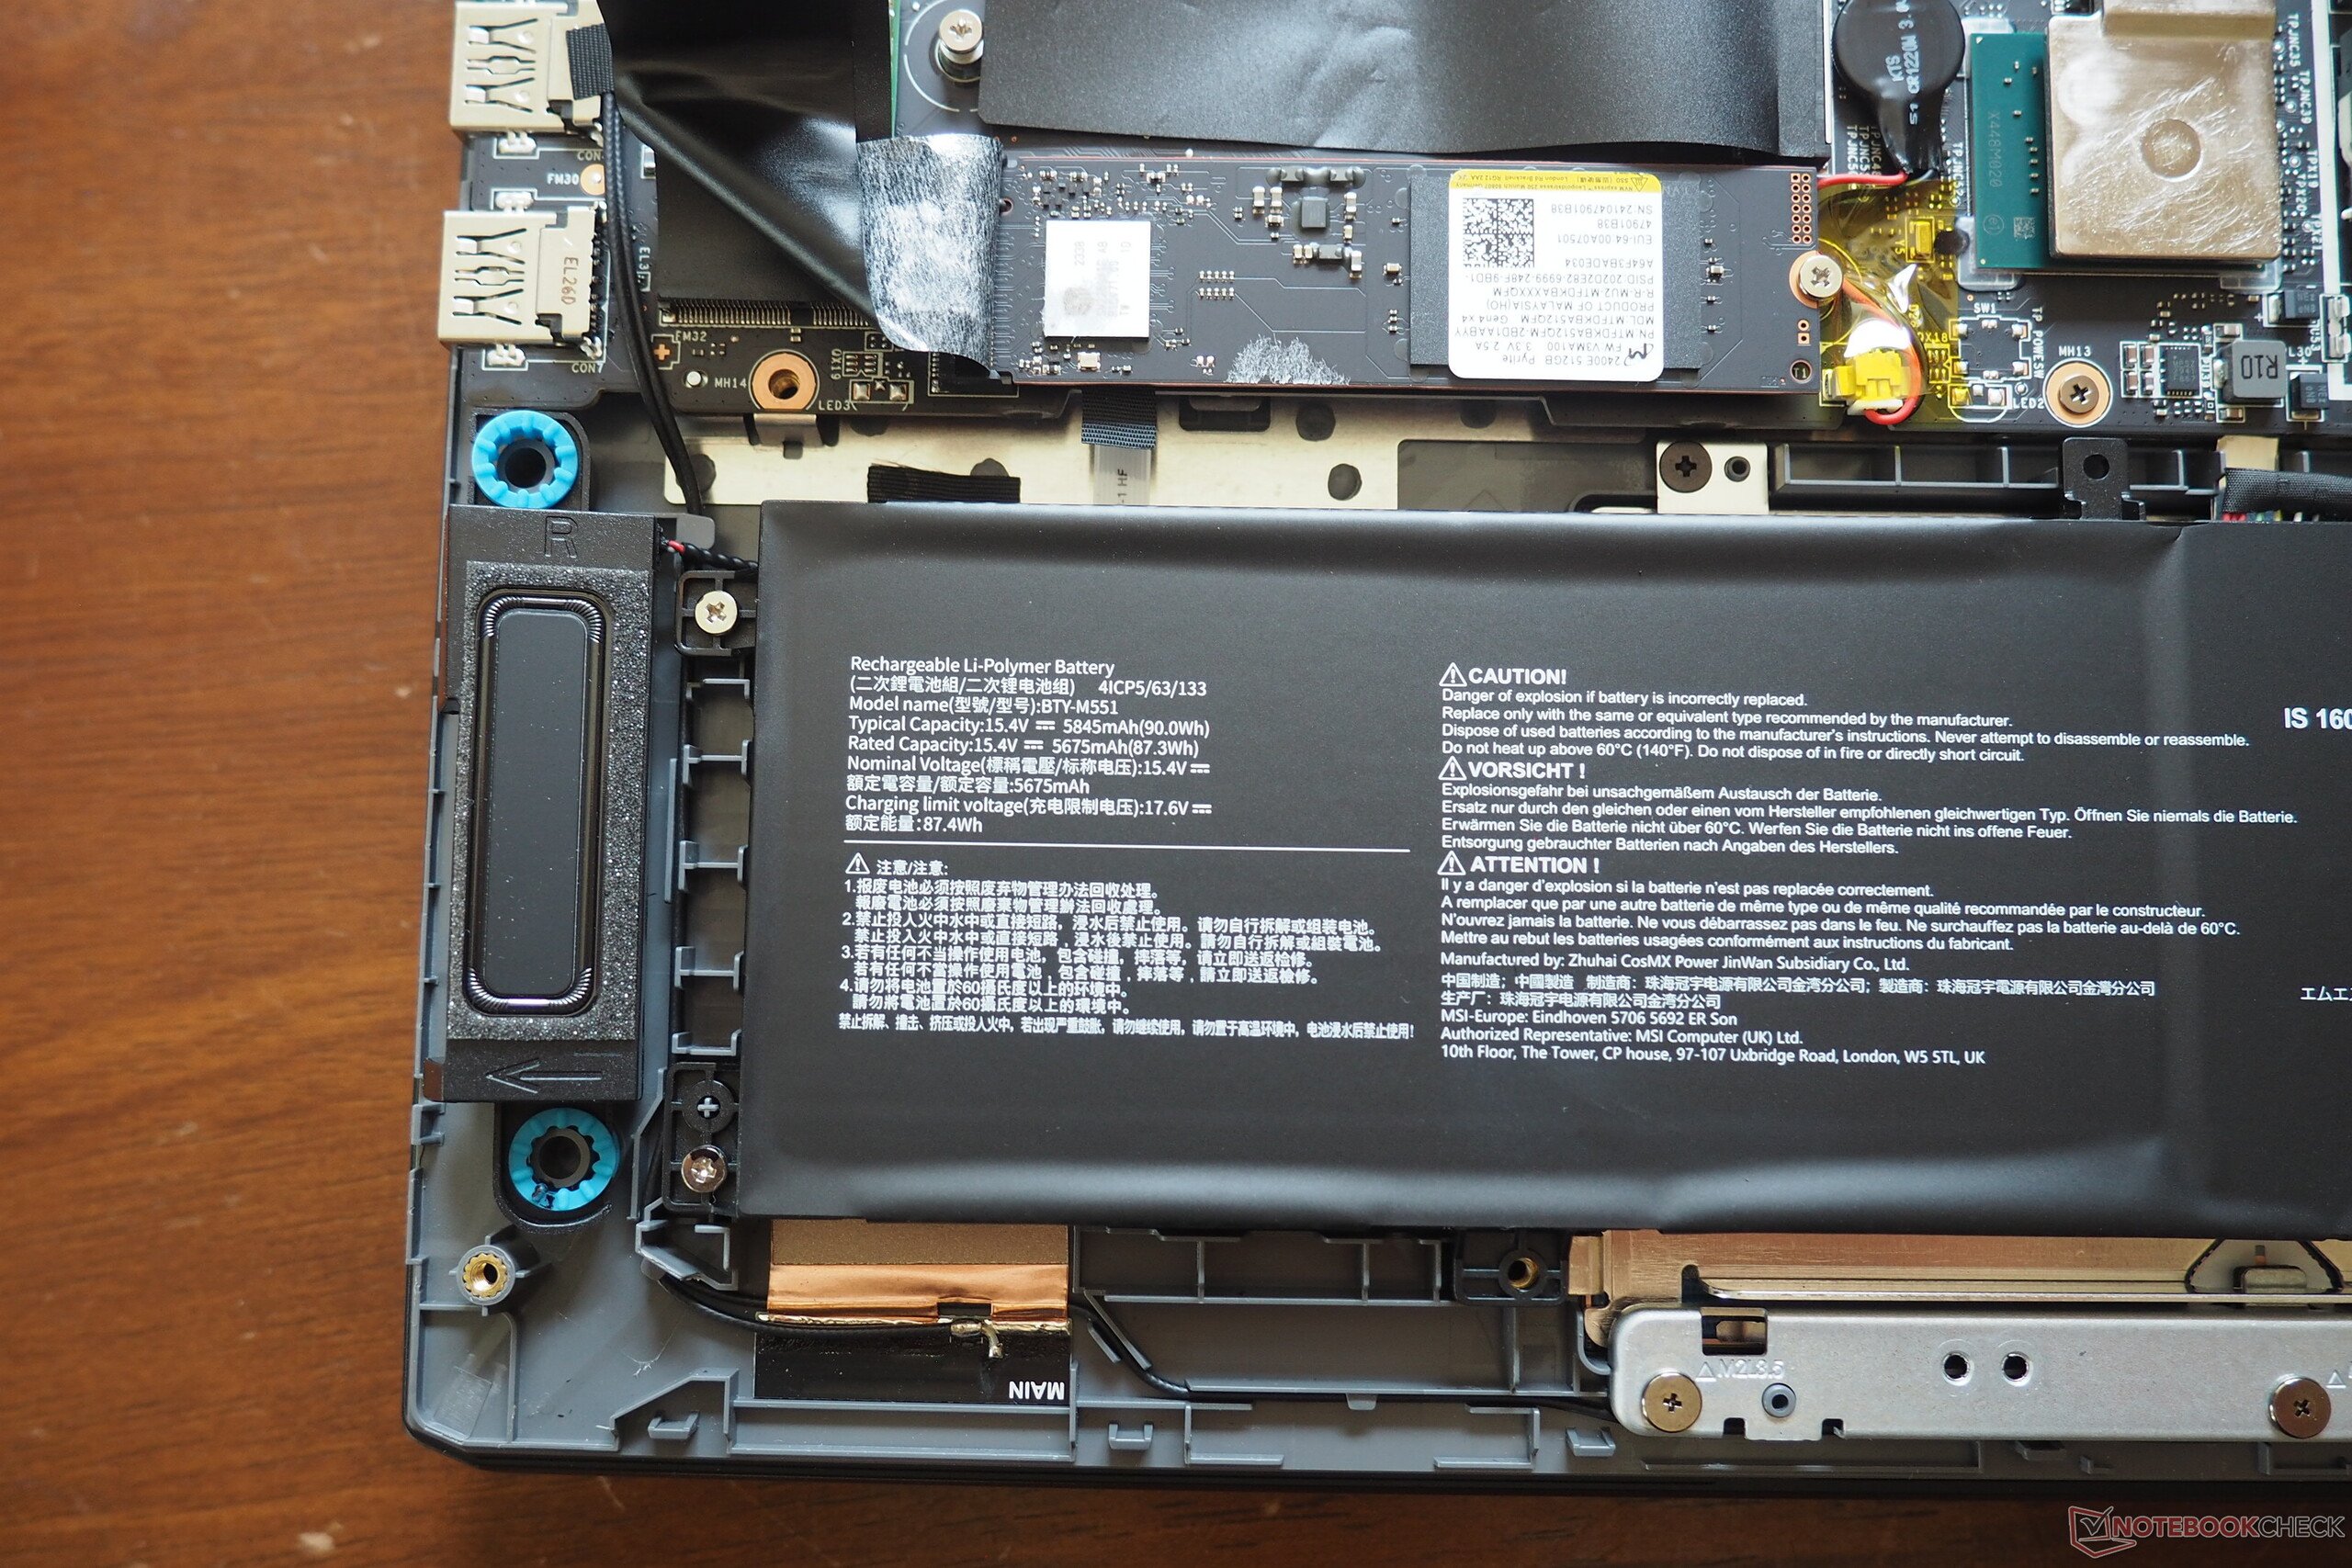
电池容量高达 90 Wh,续航能力令人印象深刻。在亮度降低至 150 cd/m² 的 Wi-Fi 测试中,这款 16 英寸笔记本电脑的续航时间不到 7 小时。尽管这一续航时间值得称赞,但申克 XMG Pro 16 仍以令人印象深刻的 9 小时续航时间占据优势。
| MSI Vector 16 HX AI A2XWHG Ultra 7 255HX, GeForce RTX 5070 Ti Laptop, 90 Wh | MSI Vector 16 HX A14V i9-14900HX, GeForce RTX 4080 Laptop GPU, 90 Wh | MSI Katana 17 HX B14WGK i7-14650HX, GeForce RTX 5070 Laptop, 75 Wh | Schenker XMG Pro 16 (E25) Ultra 9 275HX, GeForce RTX 5070 Ti Laptop, 99.8 Wh | Alienware 16 Area-51 Ultra 9 275HX, GeForce RTX 5080 Laptop, 96 Wh | Average of class Gaming | |
|---|---|---|---|---|---|---|
| Battery runtime | -21% | -27% | 30% | -60% | 0% | |
| WiFi v1.3 (h) | 7 | 5.5 -21% | 5.1 -27% | 9.1 30% | 2.8 -60% | 7.01 ? 0% |
| Reader / Idle (h) | 10.7 | 3.1 | 8.71 ? | |||
| Load (h) | 1.4 | 1.47 ? |
Notebookcheck 总体评分
微星 Vector 16 在很大程度上是一款成功的 RTX 5070(Ti)机型,不过它的风扇控制乏善可陈,让人有些失望。
MSI Vector 16 HX AI A2XWHG
- 06/20/2025 v8
Florian Glaser
 Total Sustainability Score:
 Comparable models for reference
Image | Model / Review | Price | Weight | Height | Display |
|---|---|---|---|---|---|
1. 84%  | MSI Vector 16 HX AI A2XWHG Intel Core Ultra 7 255HX ⎘ NVIDIA GeForce RTX 5070 Ti Laptop ⎘ 16 GB Memory, 512 GB SSD | Amazon: List Price: 2000 EUR | 2.6 kg | 28.6 mm | 16.00" 2560x1600 189 PPI IPS |
2. 88% v7 (old)  | MSI Vector 16 HX A14V Intel Core i9-14900HX ⎘ NVIDIA GeForce RTX 4080 Laptop GPU ⎘ 32 GB Memory, 1024 GB SSD | Amazon: 1. $2,099.99 msi Vector 16 HX AI 16” 24... 2. $2,189.00 msi Vector 16 HX AI Gaming L... 3. $2,749.00 MSI Vector 16 HX AI A2XW Vec... List Price: 2700 USD | 2.7 kg | 28.55 mm | 16.00" 2560x1600 189 PPI IPS |
3. 77.3%  | MSI Katana 17 HX B14WGK Intel Core i7-14650HX ⎘ NVIDIA GeForce RTX 5070 Laptop ⎘ 16 GB Memory, 1024 GB SSD | Amazon: List Price: 1800 EUR | 2.7 kg | 28 mm | 17.30" 2560x1440 170 PPI IPS |
4. 87.4%  | Schenker XMG Pro 16 (E25) Intel Core Ultra 9 275HX ⎘ NVIDIA GeForce RTX 5070 Ti Laptop ⎘ 32 GB Memory, 1024 GB SSD | Amazon: List Price: 2480€ | 2.5 kg | 26.5 mm | 16.00" 2560x1600 189 PPI IPS |
5. 85.7%  | Alienware 16 Area-51 Intel Core Ultra 9 275HX ⎘ NVIDIA GeForce RTX 5080 Laptop ⎘ 32 GB Memory, 1024 GB SSD | Amazon: 1. $2,348.99 Alienware 16 Area-51 Gaming ... 2. $4,299.99 Alienware 16 Area-51 Gaming ... 3. $3,799.99 Alienware 16 Area-51 Gaming ... List Price: 3500 USD | 3.3 kg | 28.5 mm | 16.00" 2560x1600 189 PPI IPS |
Transparency
The selection of devices to be reviewed is made by our editorial team. The test sample was provided to the author as a loan by the manufacturer or retailer for the purpose of this review. The lender had no influence on this review, nor did the manufacturer receive a copy of this review before publication. There was no obligation to publish this review. As an independent media company, Notebookcheck is not subjected to the authority of manufacturers, retailers or publishers.
This is how Notebookcheck is testing
Every year, Notebookcheck independently reviews hundreds of laptops and smartphones using standardized procedures to ensure that all results are comparable. We have continuously developed our test methods for around 20 years and set industry standards in the process. In our test labs, high-quality measuring equipment is utilized by experienced technicians and editors. These tests involve a multi-stage validation process. Our complex rating system is based on hundreds of well-founded measurements and benchmarks, which maintains objectivity. Further information on our test methods can be found here.
