
判决
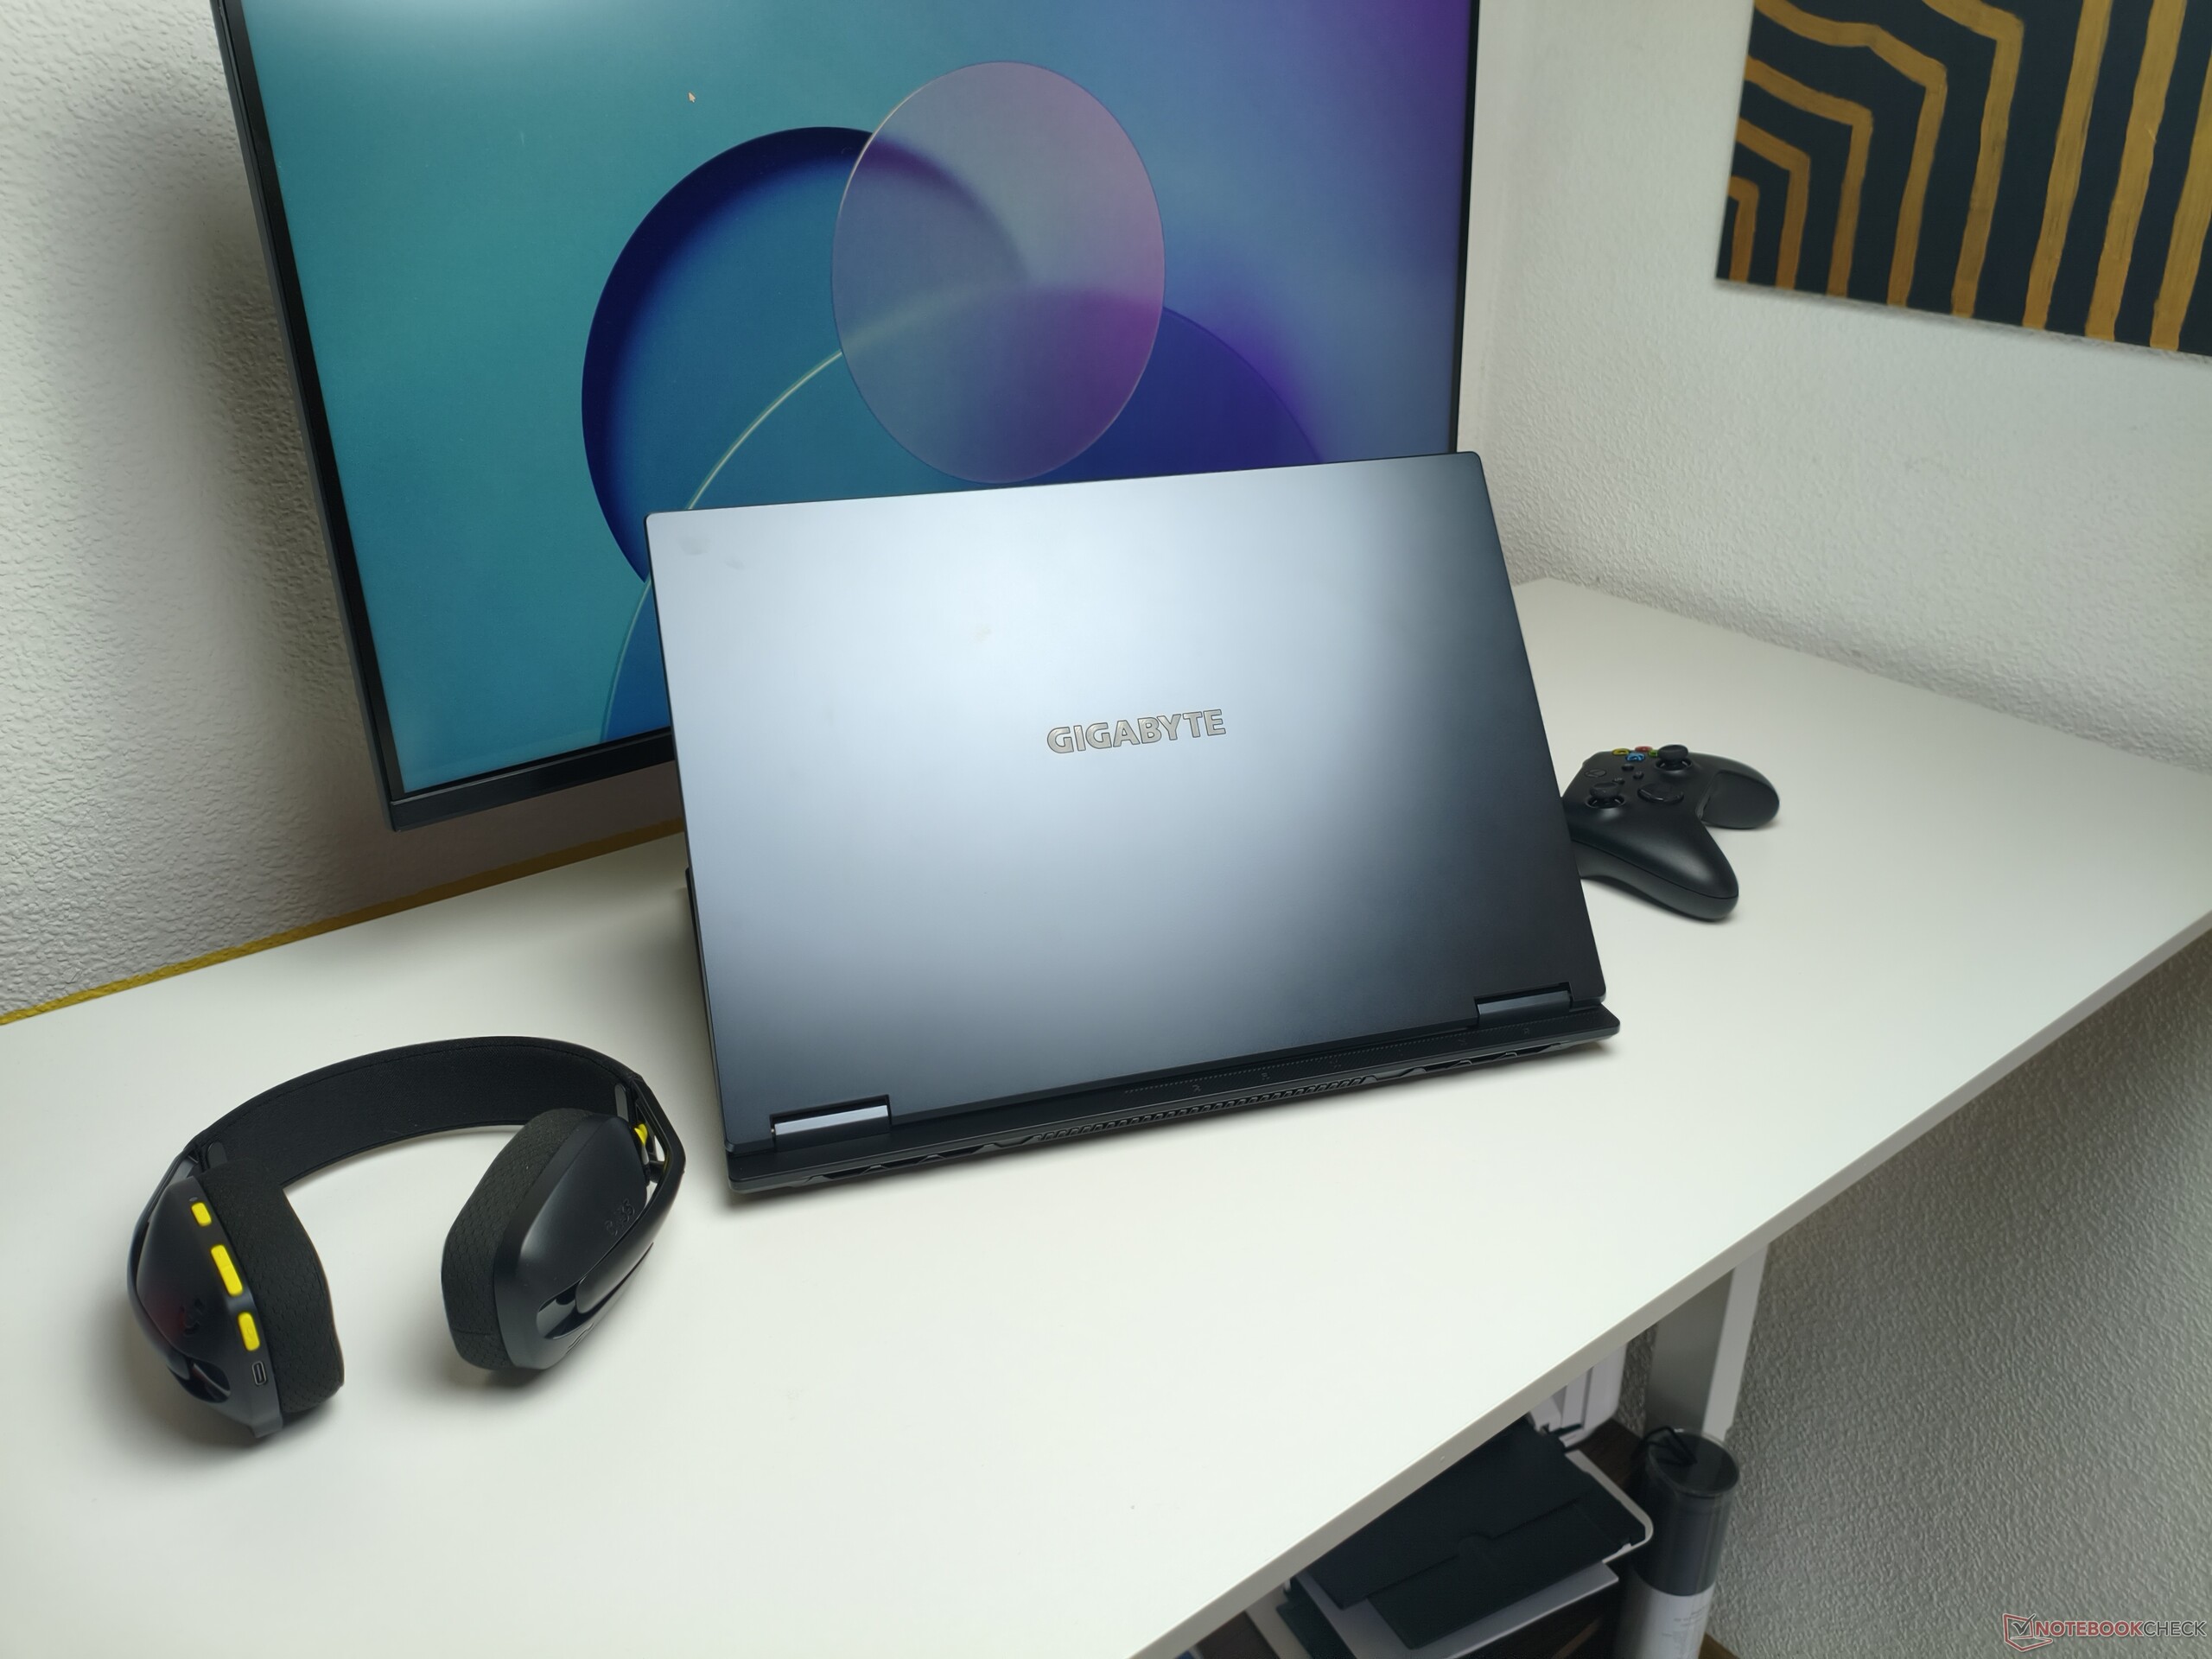
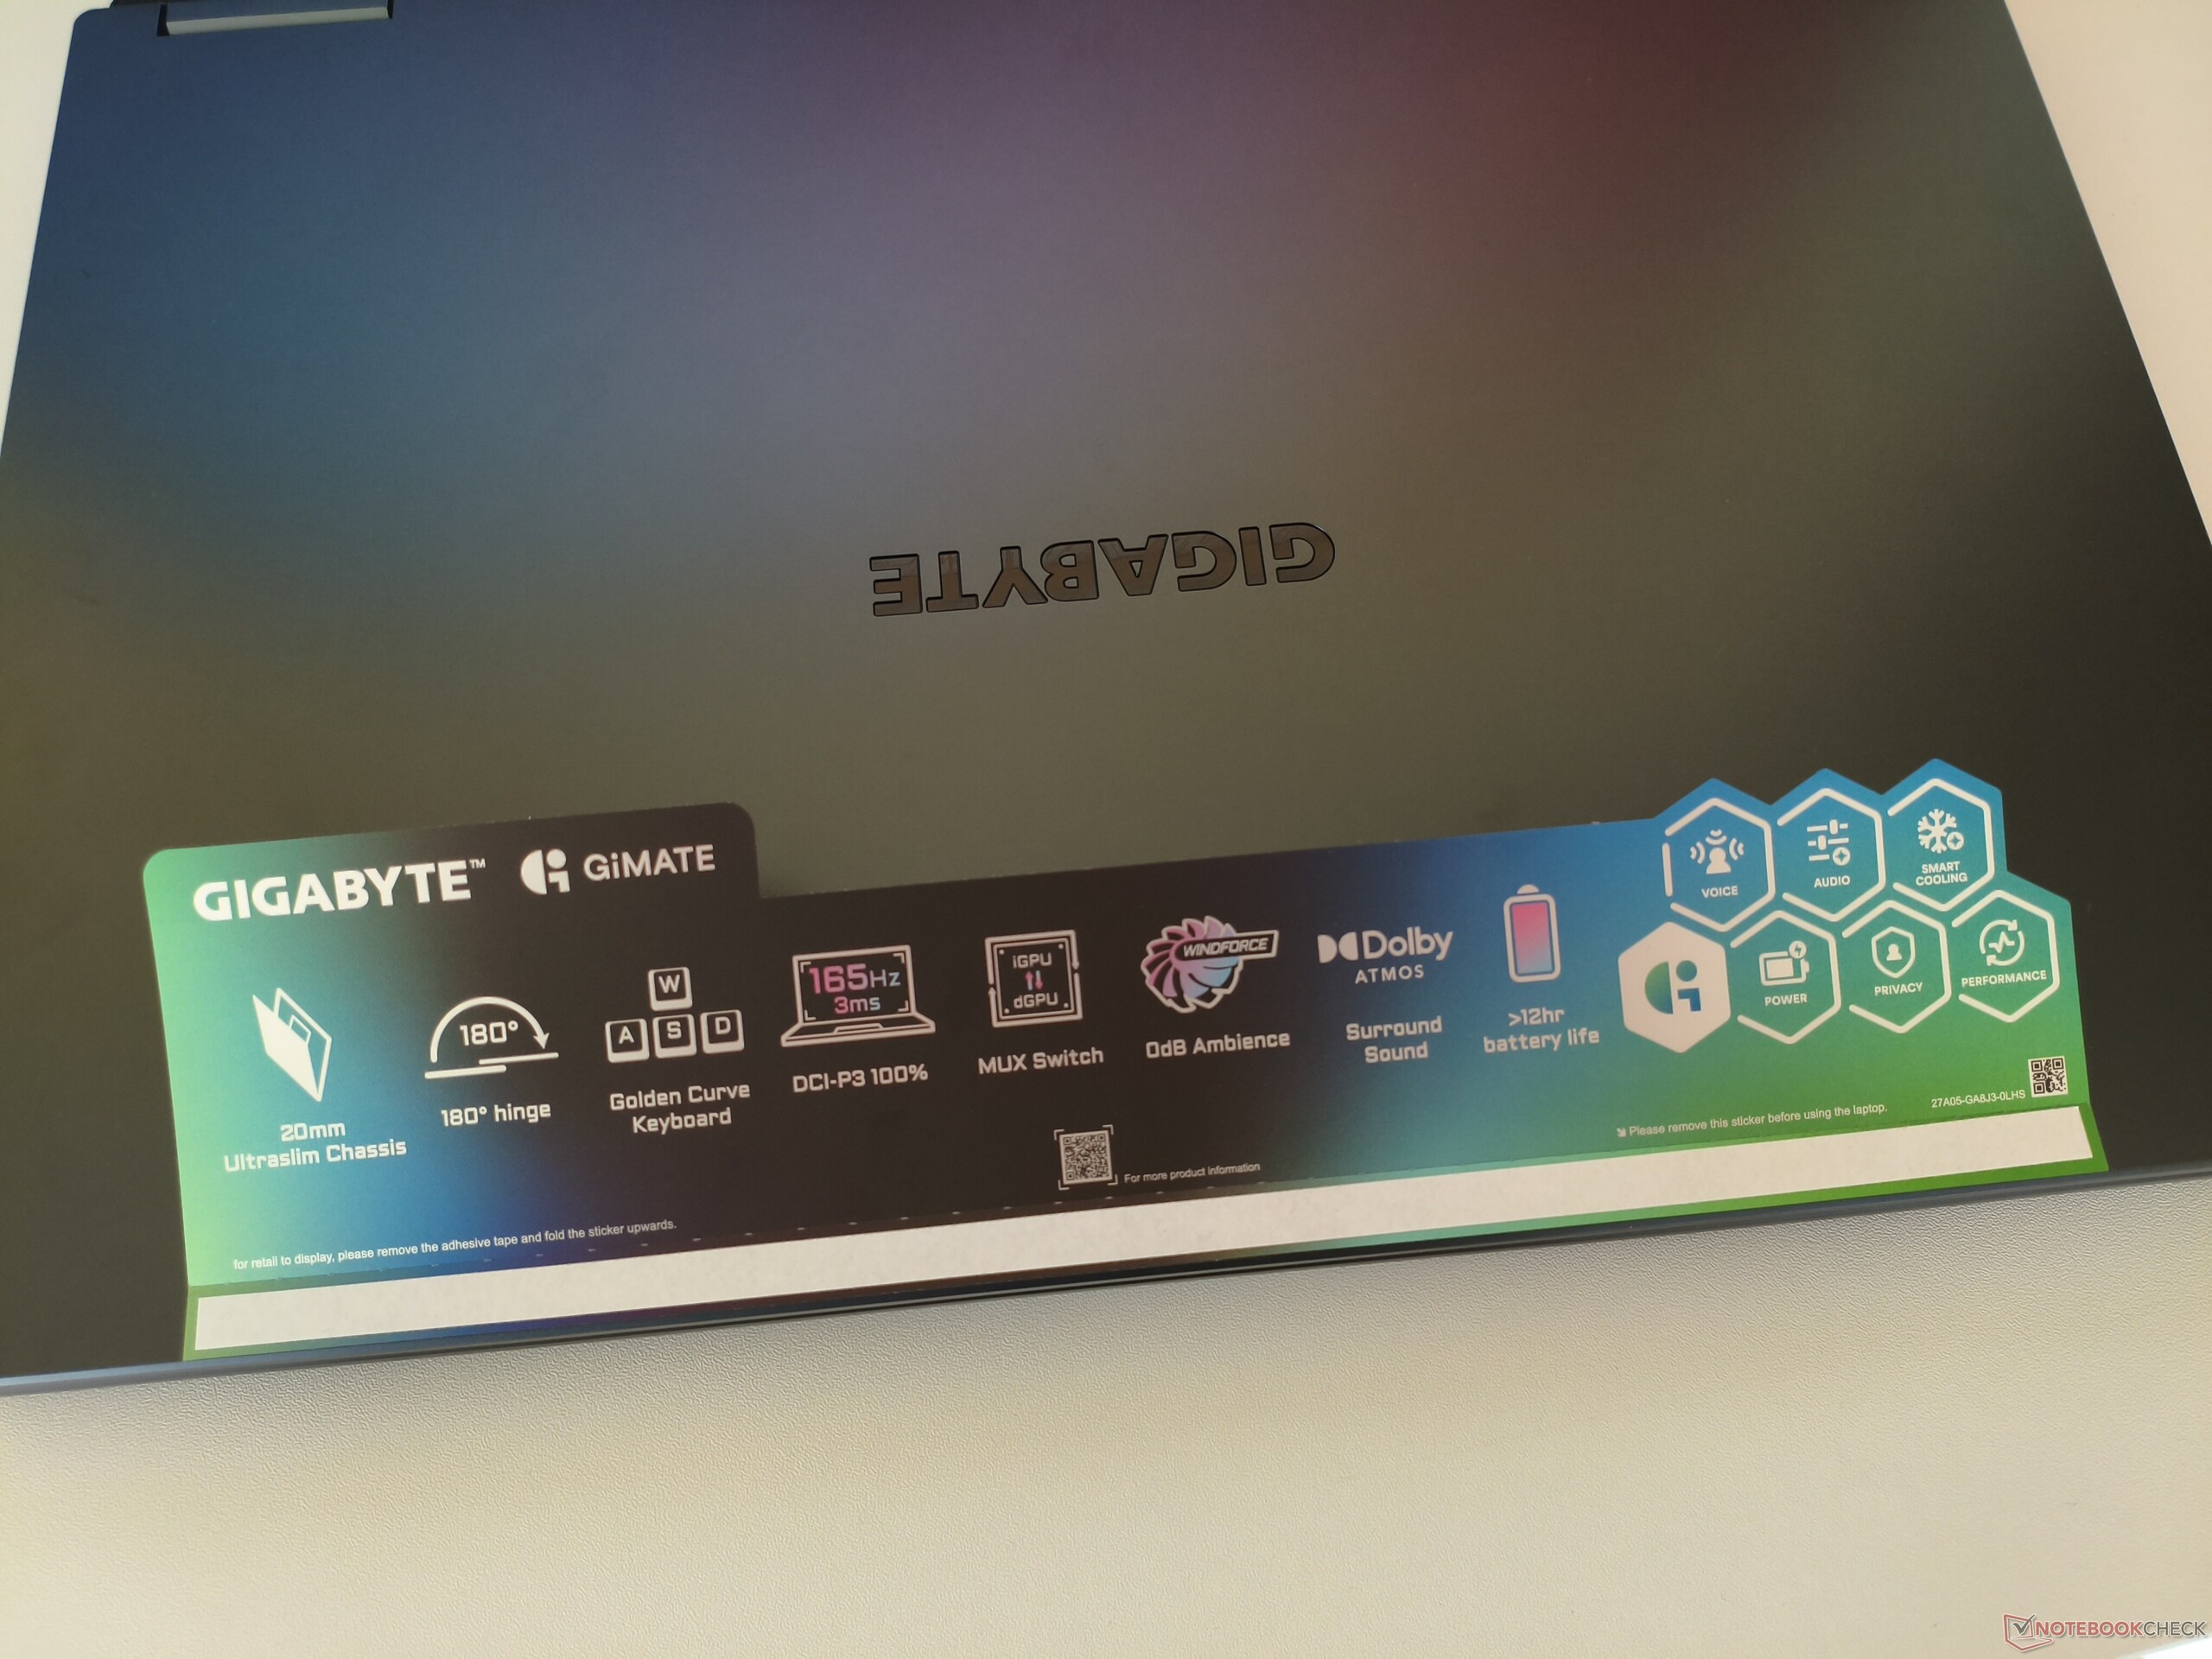
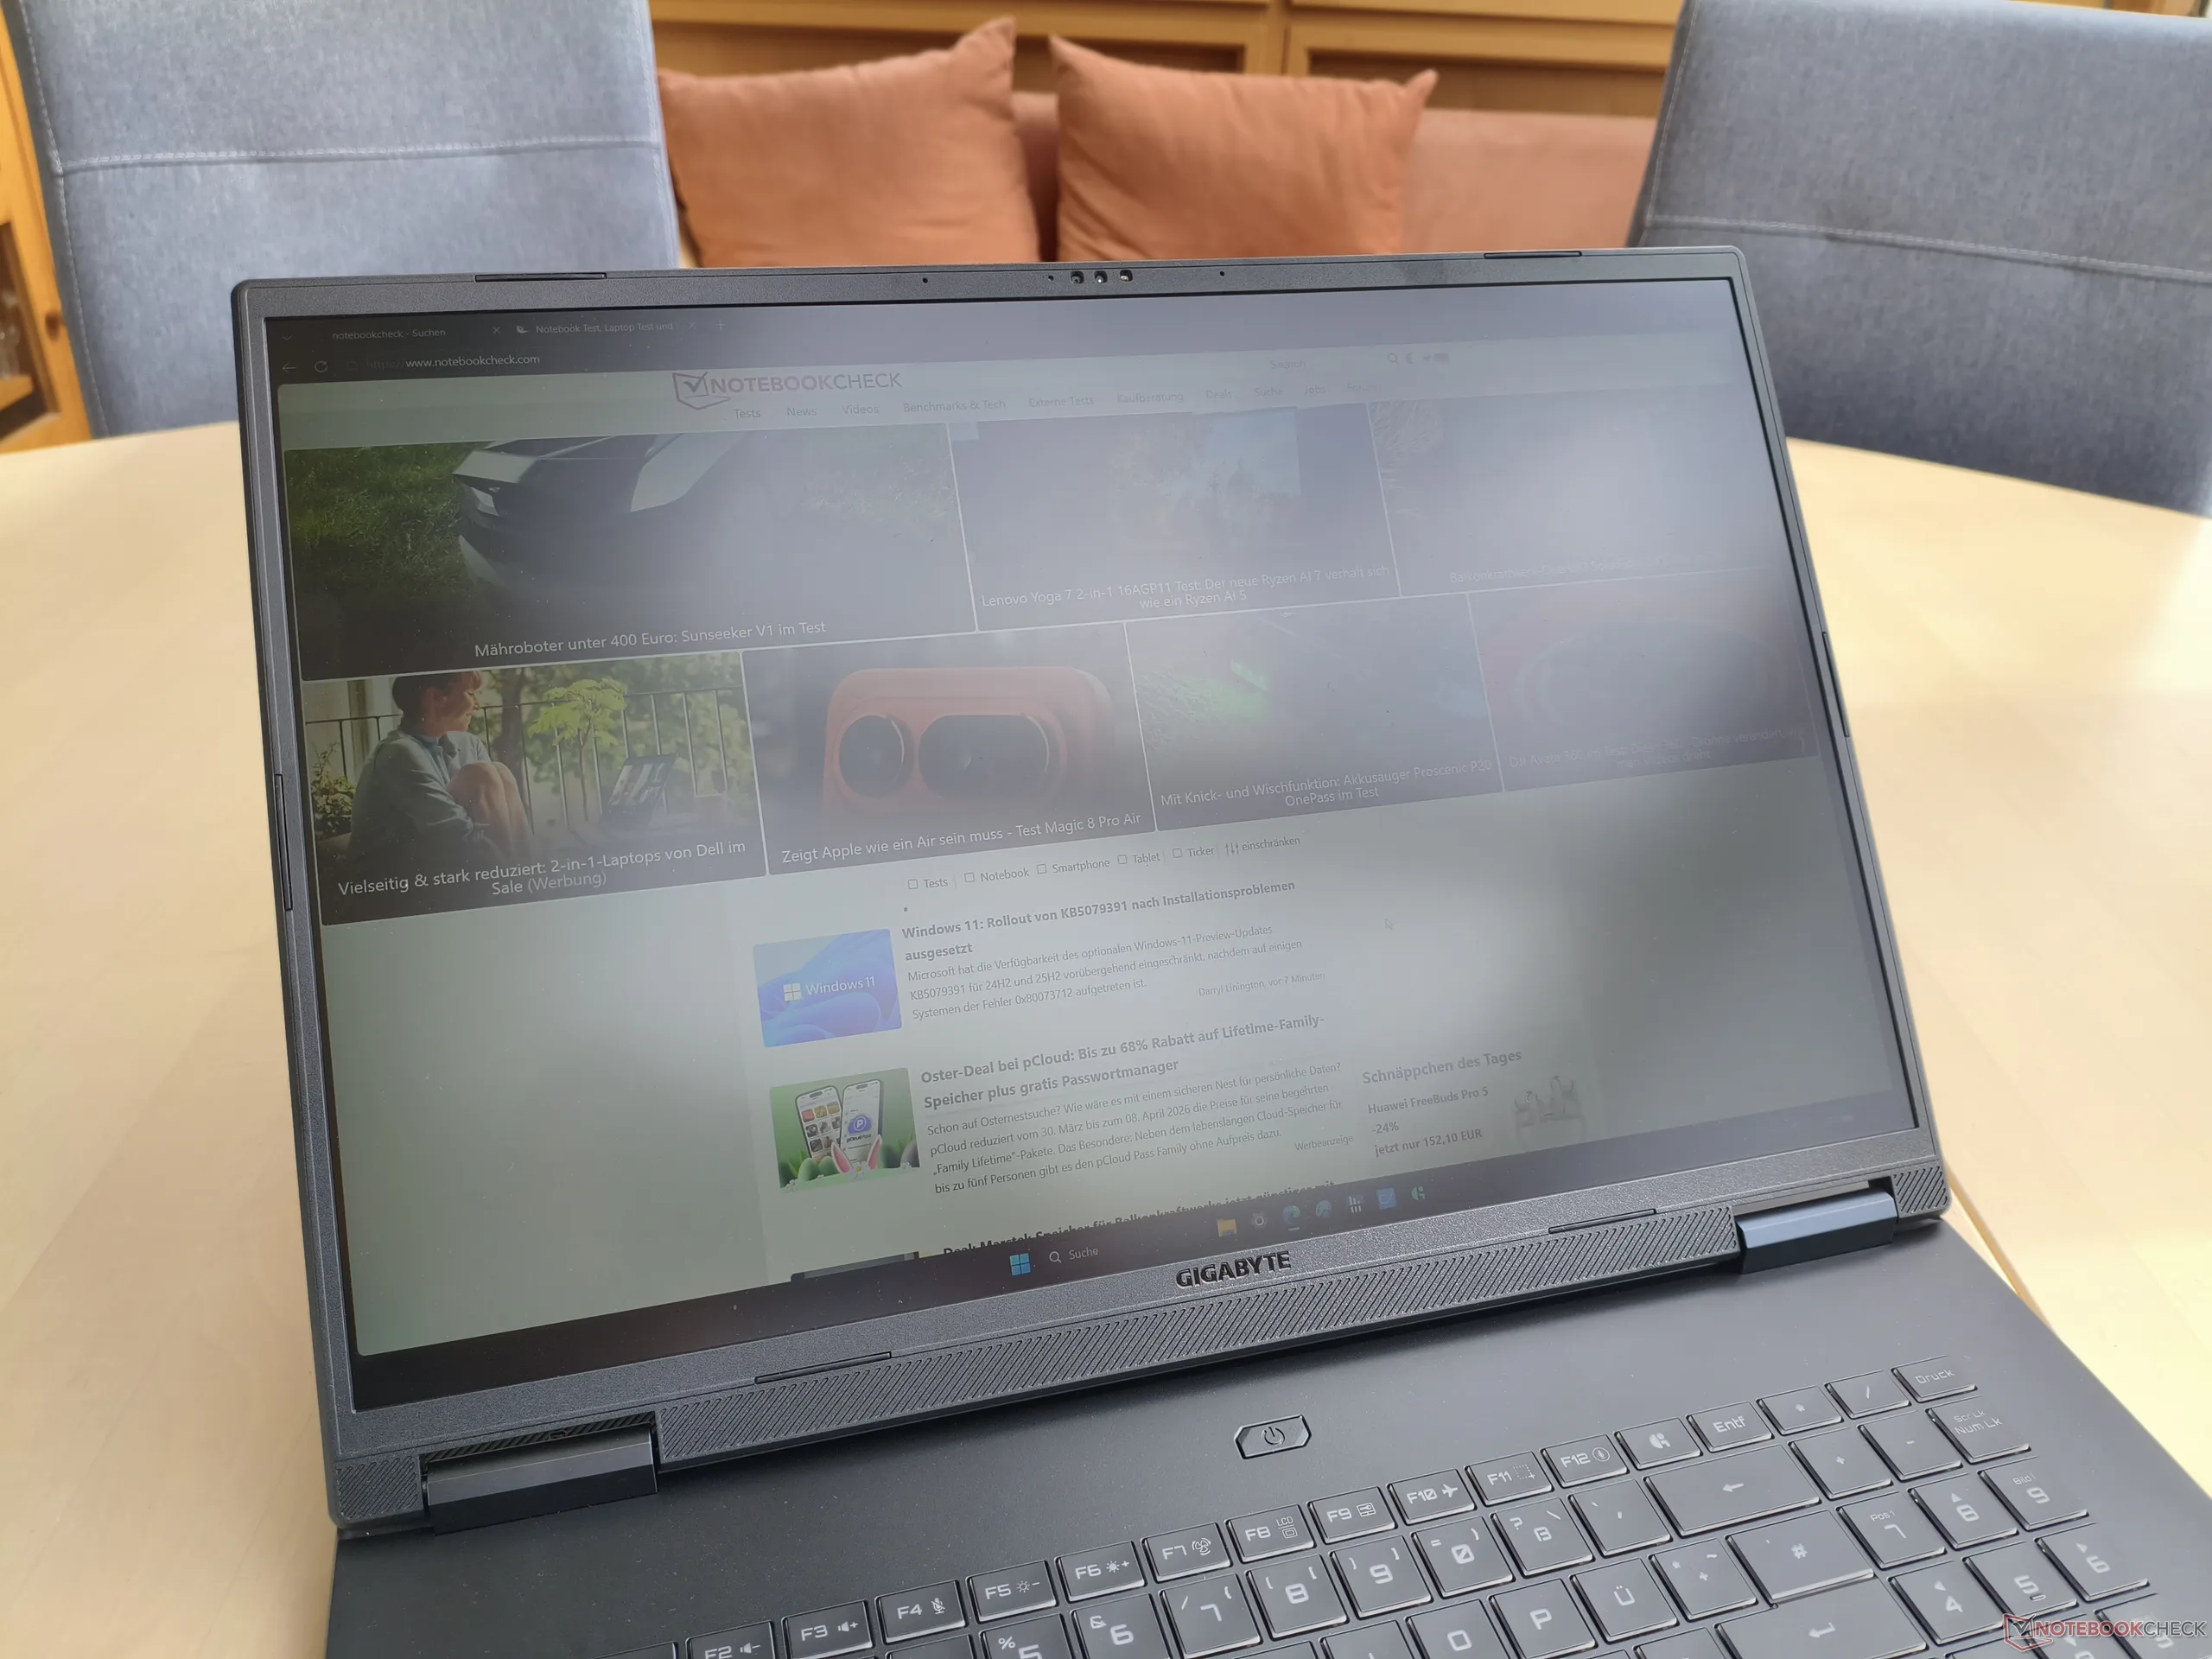
虽然 18 英寸笔记本在几年前还相当罕见,但现在越来越多的大屏幕机型正在进入市场。最近,我们测试了 16 英寸的技嘉 游戏本 A16 Pro之后,我们将目光转向了它的同胞兄弟--18 英寸版本。虽然机箱完全由塑料制成,但却给人留下了深刻的视觉印象。再加上纤薄的设计,这款笔记本电脑尽管尺寸很大,却不会让人感觉过于笨重。显示屏的质量还算不错,尽管不是特别突出。165 Hz 的面板提供了宽广的色域和充足的屏幕空间,但亮度等方面仍有待提高。
在其他方面,技嘉笔记本电脑也很难赶上竞争对手。虽然它在游戏模式下的性能可圈可点,但声音却变得非常大。使用平衡配置文件时,噪音水平会降低一些,但这是以 3D 性能大幅降低为代价的。要获得更高的总体评价,技嘉还应该改进连接选项(无读卡器、无 Thunderbolt/USB 4)、扬声器和电池容量。此外,焊接内存也限制了设备的长期升级能力。好的一面是,作为一款游戏设备,这款 18 英寸笔记本电脑的功耗相对适中,触摸板较大,M.2 插槽未被占用。
Pros
Cons
价格和供应情况
据技嘉称,采用酷睿 7 240H 和 RTX 5070 Ti 的测试配置预计售价约为 1850 美元。相比之下,采用 Ryzen 7 260 和GeForce RTX 5070 的非 Pro 版本目前的售价约为 2000 美元。
- $1,573.99GIGABYTE Gaming A18 Gaming Laptop - 165Hz 2560x1600 WQXGA - NVIDIA GeForce RTX 5060 - AMD Ryzen 7 260-1TB SSD with 32GB DDR5 RAM - Windows 11 Home - Black Steel
- $1,999.99GIGABYTE Gaming A18 Gaming Laptop - 165Hz 2560x1600 WQXGA - NVIDIA GeForce RTX 5070 - AMD Ryzen 7 260-1TB SSD with 32GB DDR5 RAM - Windows 11 Home - Black Steel
- $1,909.00GIGABYTE Gaming A18 Gaming Laptop, 2026, 18" 2560x1600 165Hz, AMD 8-Core Ryzen 7 260, NVIDIA GeForce RTX 5060, 32GB DDR5, 2TB SSD, Win11 Pro, RGB Backlit KB, Wi-Fi 6E, BT 5.2, 1080p IR Camera, Black
在本文中,我们选择了 华硕 TUF GAMING A18和 宏碁 Nitro 18 AI(都配备了 RTX 5070)、 微星 Vector A18 HX(RTX 5070 Ti),以及当前的 18 英寸参考机型--联想 联想Legion 9 18(RTX 5080) 作为竞争对手。
规格
案例
技嘉在 Gaming A18 Pro 上采用了相当简洁的设计,除了机箱底部的大胆设计外,避免了任何重大的尝试。深灰色的表面在大部分区域都给人以坚实稳固的感觉,铰链可使显示屏打开 180°,在大部分情况下都能毫不突兀地发挥其功能。制造质量也是如此,几乎没有什么可挑剔的地方。
这款 18 英寸笔记本电脑的重量略高于 6.4 磅,当然算不上轻巧,但仍比微星 Vector A18 和联想Legion 9 18(均约为 7.7 磅)等竞争对手要轻。
连接性
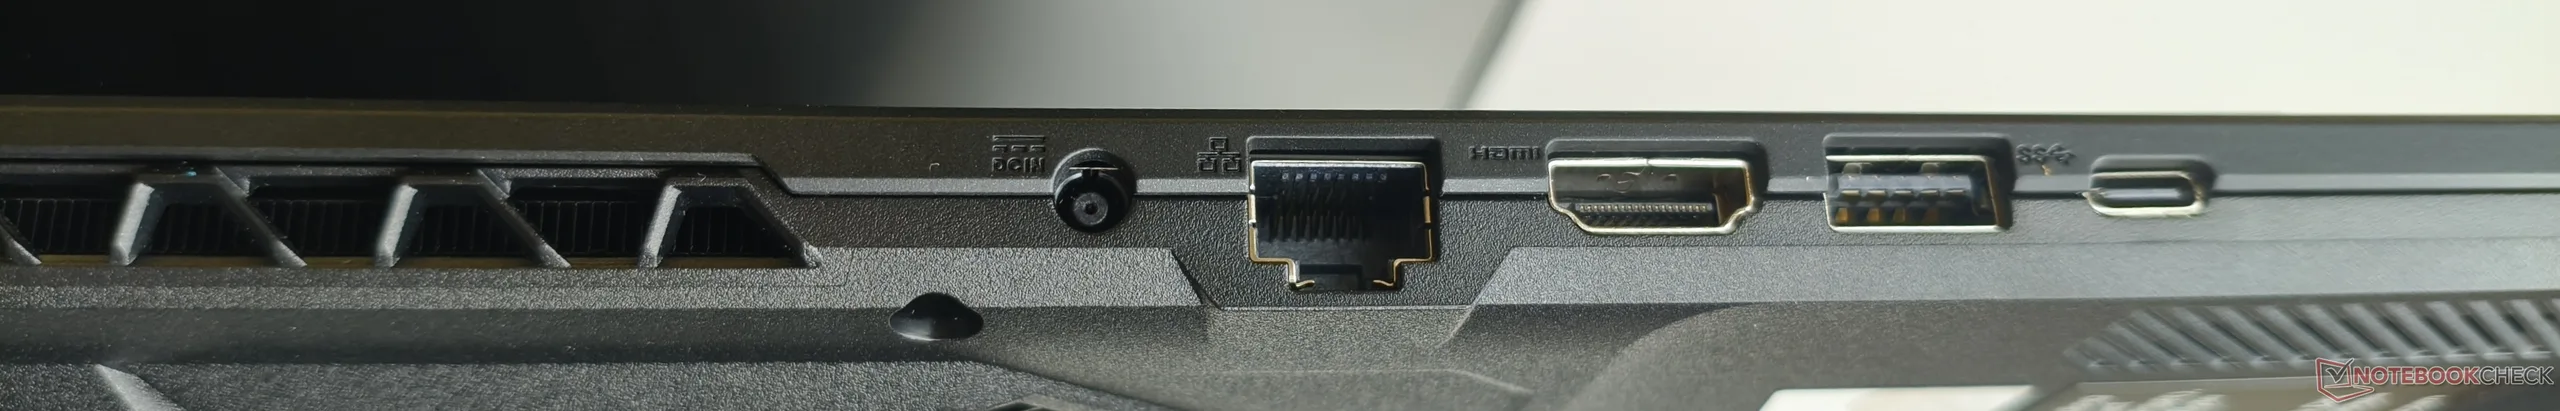
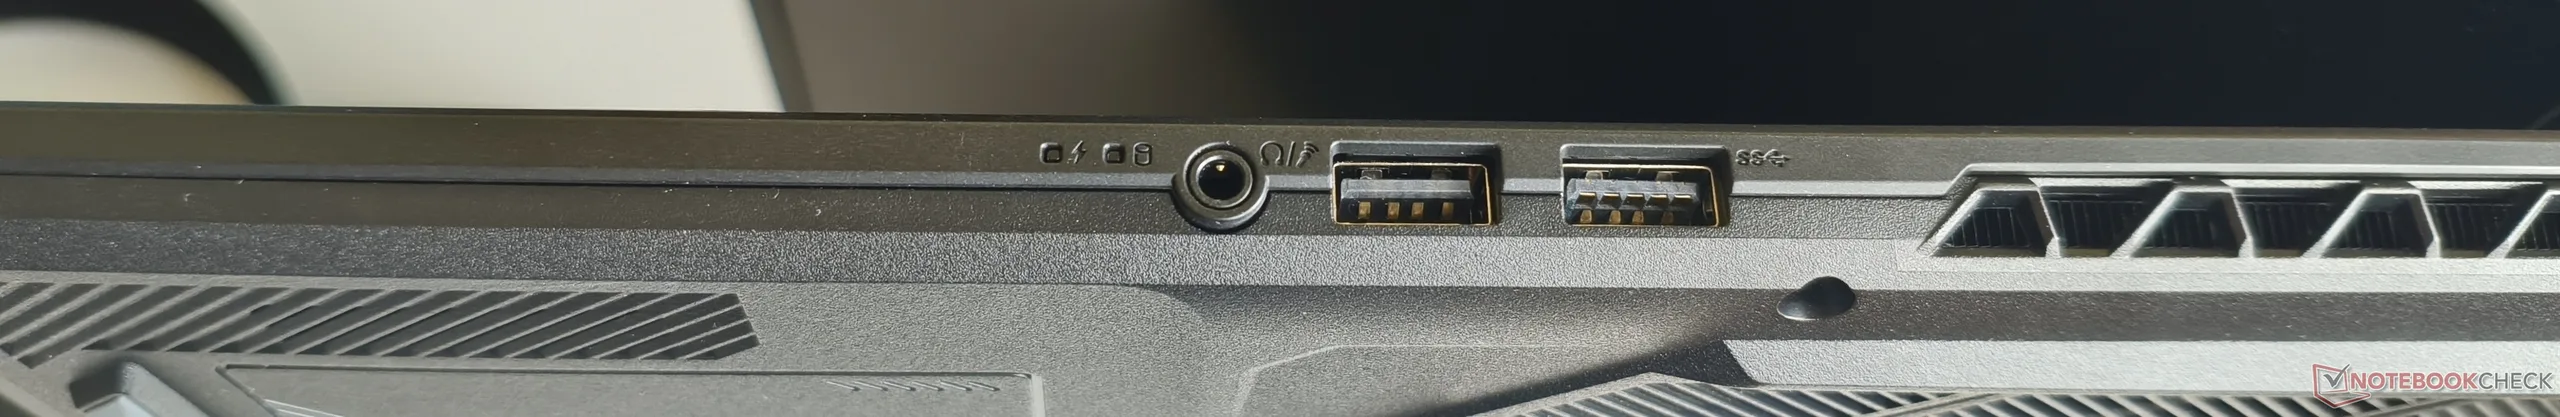
接口
对于一款 18 英寸的笔记本电脑来说,端口选择并不是特别丰富。虽然四个 USB 端口已经足够,但我们还是希望能有一个以上的 Type-C 端口,尤其是在不支持 USB 4 的情况下。没有读卡器也是一个缺点。
交流
英特尔的 Wi-Fi 6E 模块(AX211)一如既往地表现出色。由于我们最近更新了我们的参考路由器,因此没有其他设备的测试结果。
| Networking | |
| iperf3 transmit RT-BE96U WiFi7 | |
| Average of class Gaming (1989 - 4088, n=3, last 2 years) | |
| Lenovo Yoga Slim 7a 14AGP11 | |
| Gigabyte Gaming A18 Pro | |
| Average Intel Wi-Fi 6E AX211 (n=1) | |
| iperf3 receive RT-BE96U WiFi7 | |
| Average of class Gaming (1471 - 3144, n=3, last 2 years) | |
| Lenovo Yoga Slim 7a 14AGP11 | |
| Gigabyte Gaming A18 Pro | |
| Average Intel Wi-Fi 6E AX211 (n=1) | |
网络摄像头
全高清网络摄像头的色彩准确度一般,但它的表现却出人意料地好,尤其是在图像清晰度方面。与其他笔记本电脑相比,图像的模糊程度明显降低。


配件
笔记本电脑附带几本用户手册和一个 240 瓦的电源,重量不到 1.1 磅。
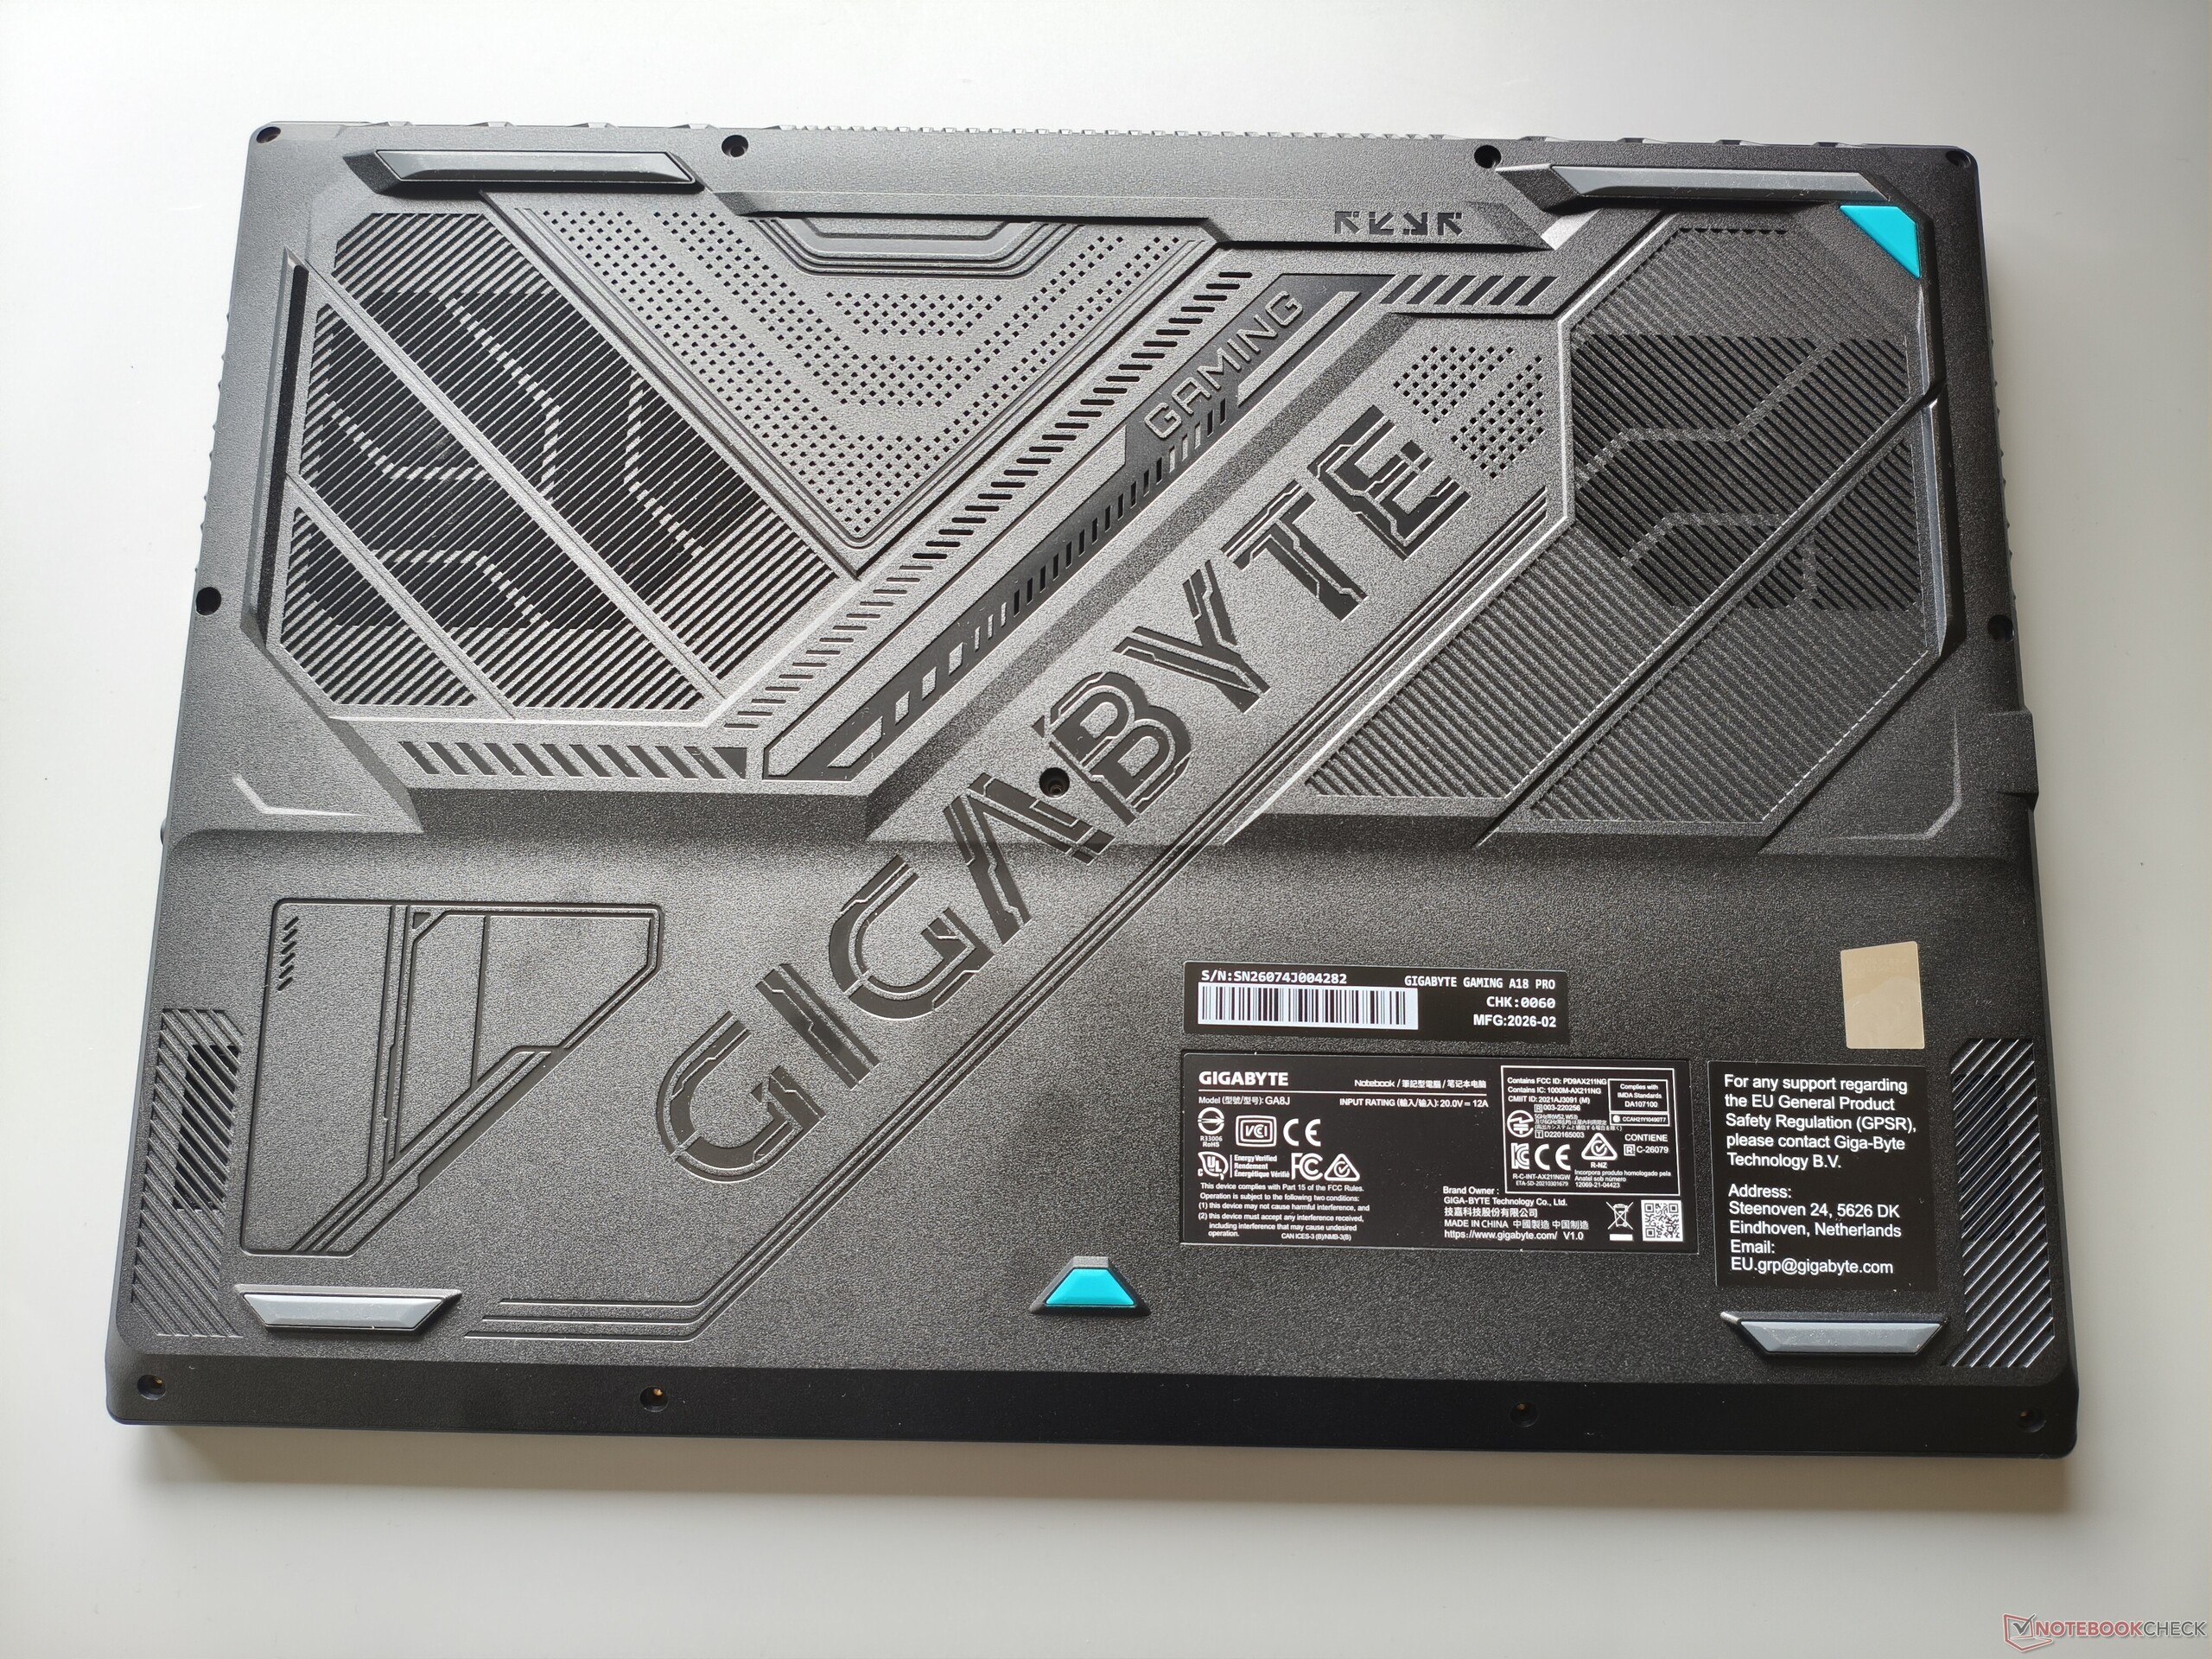
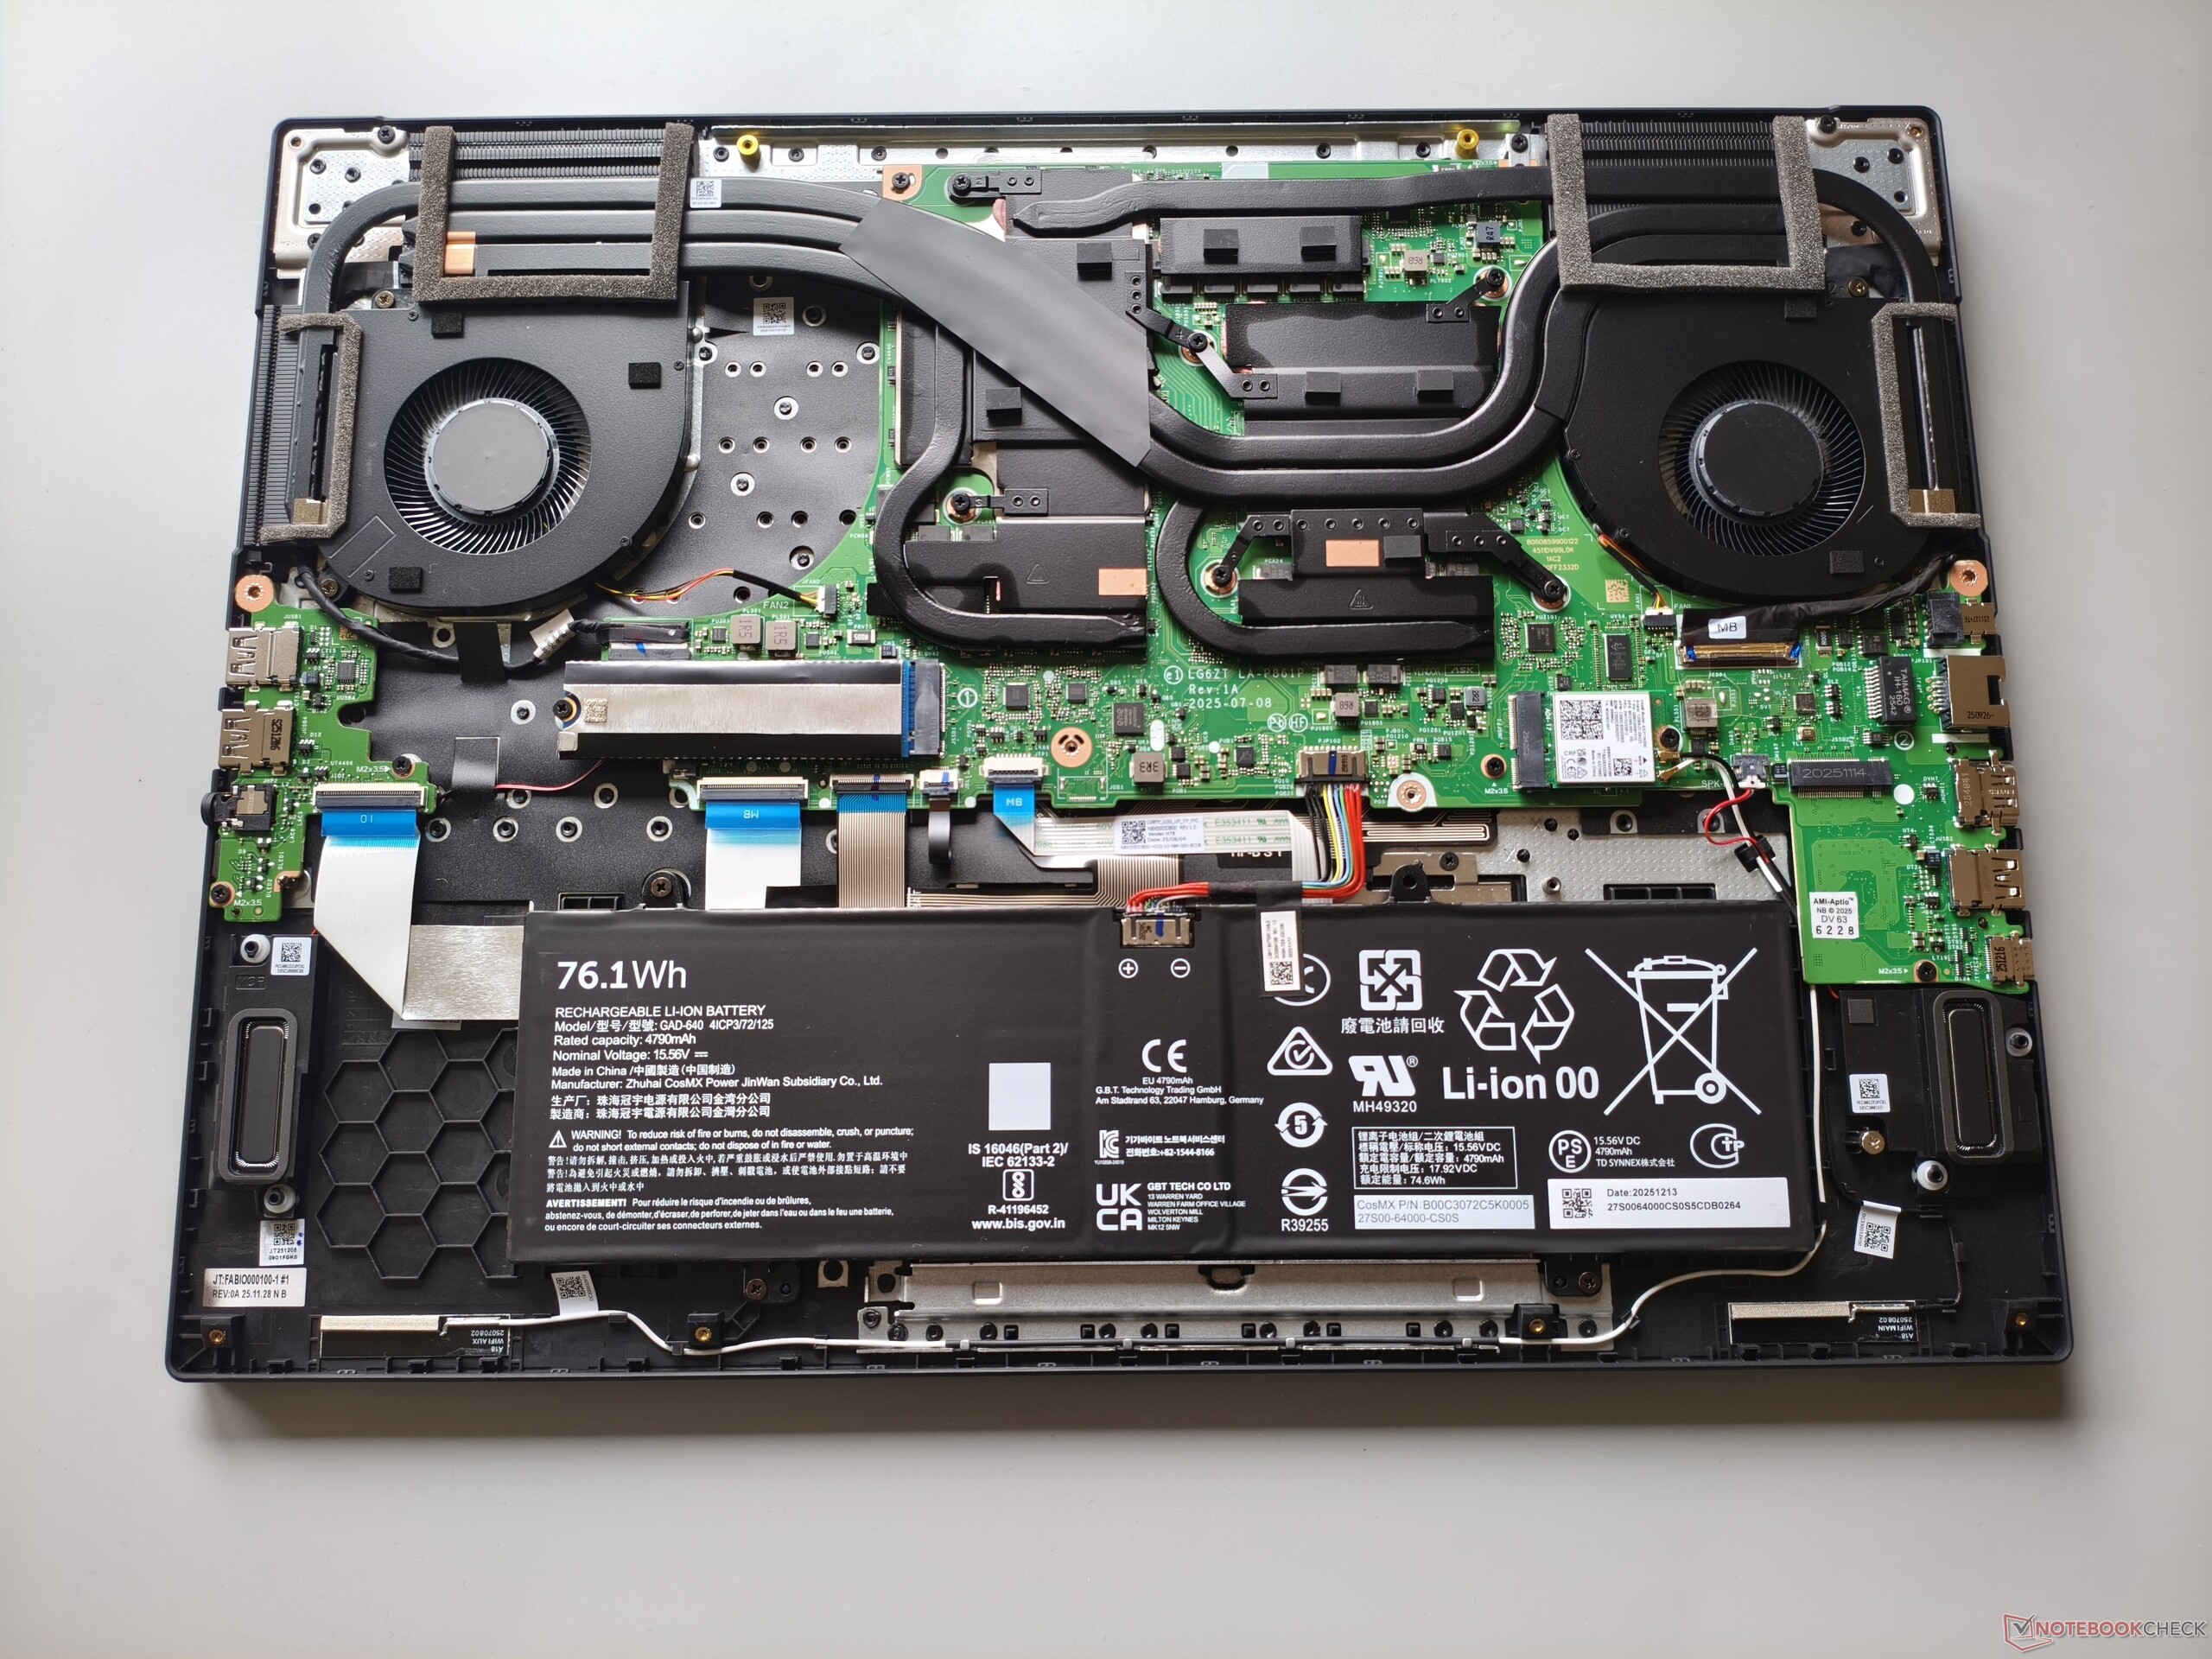
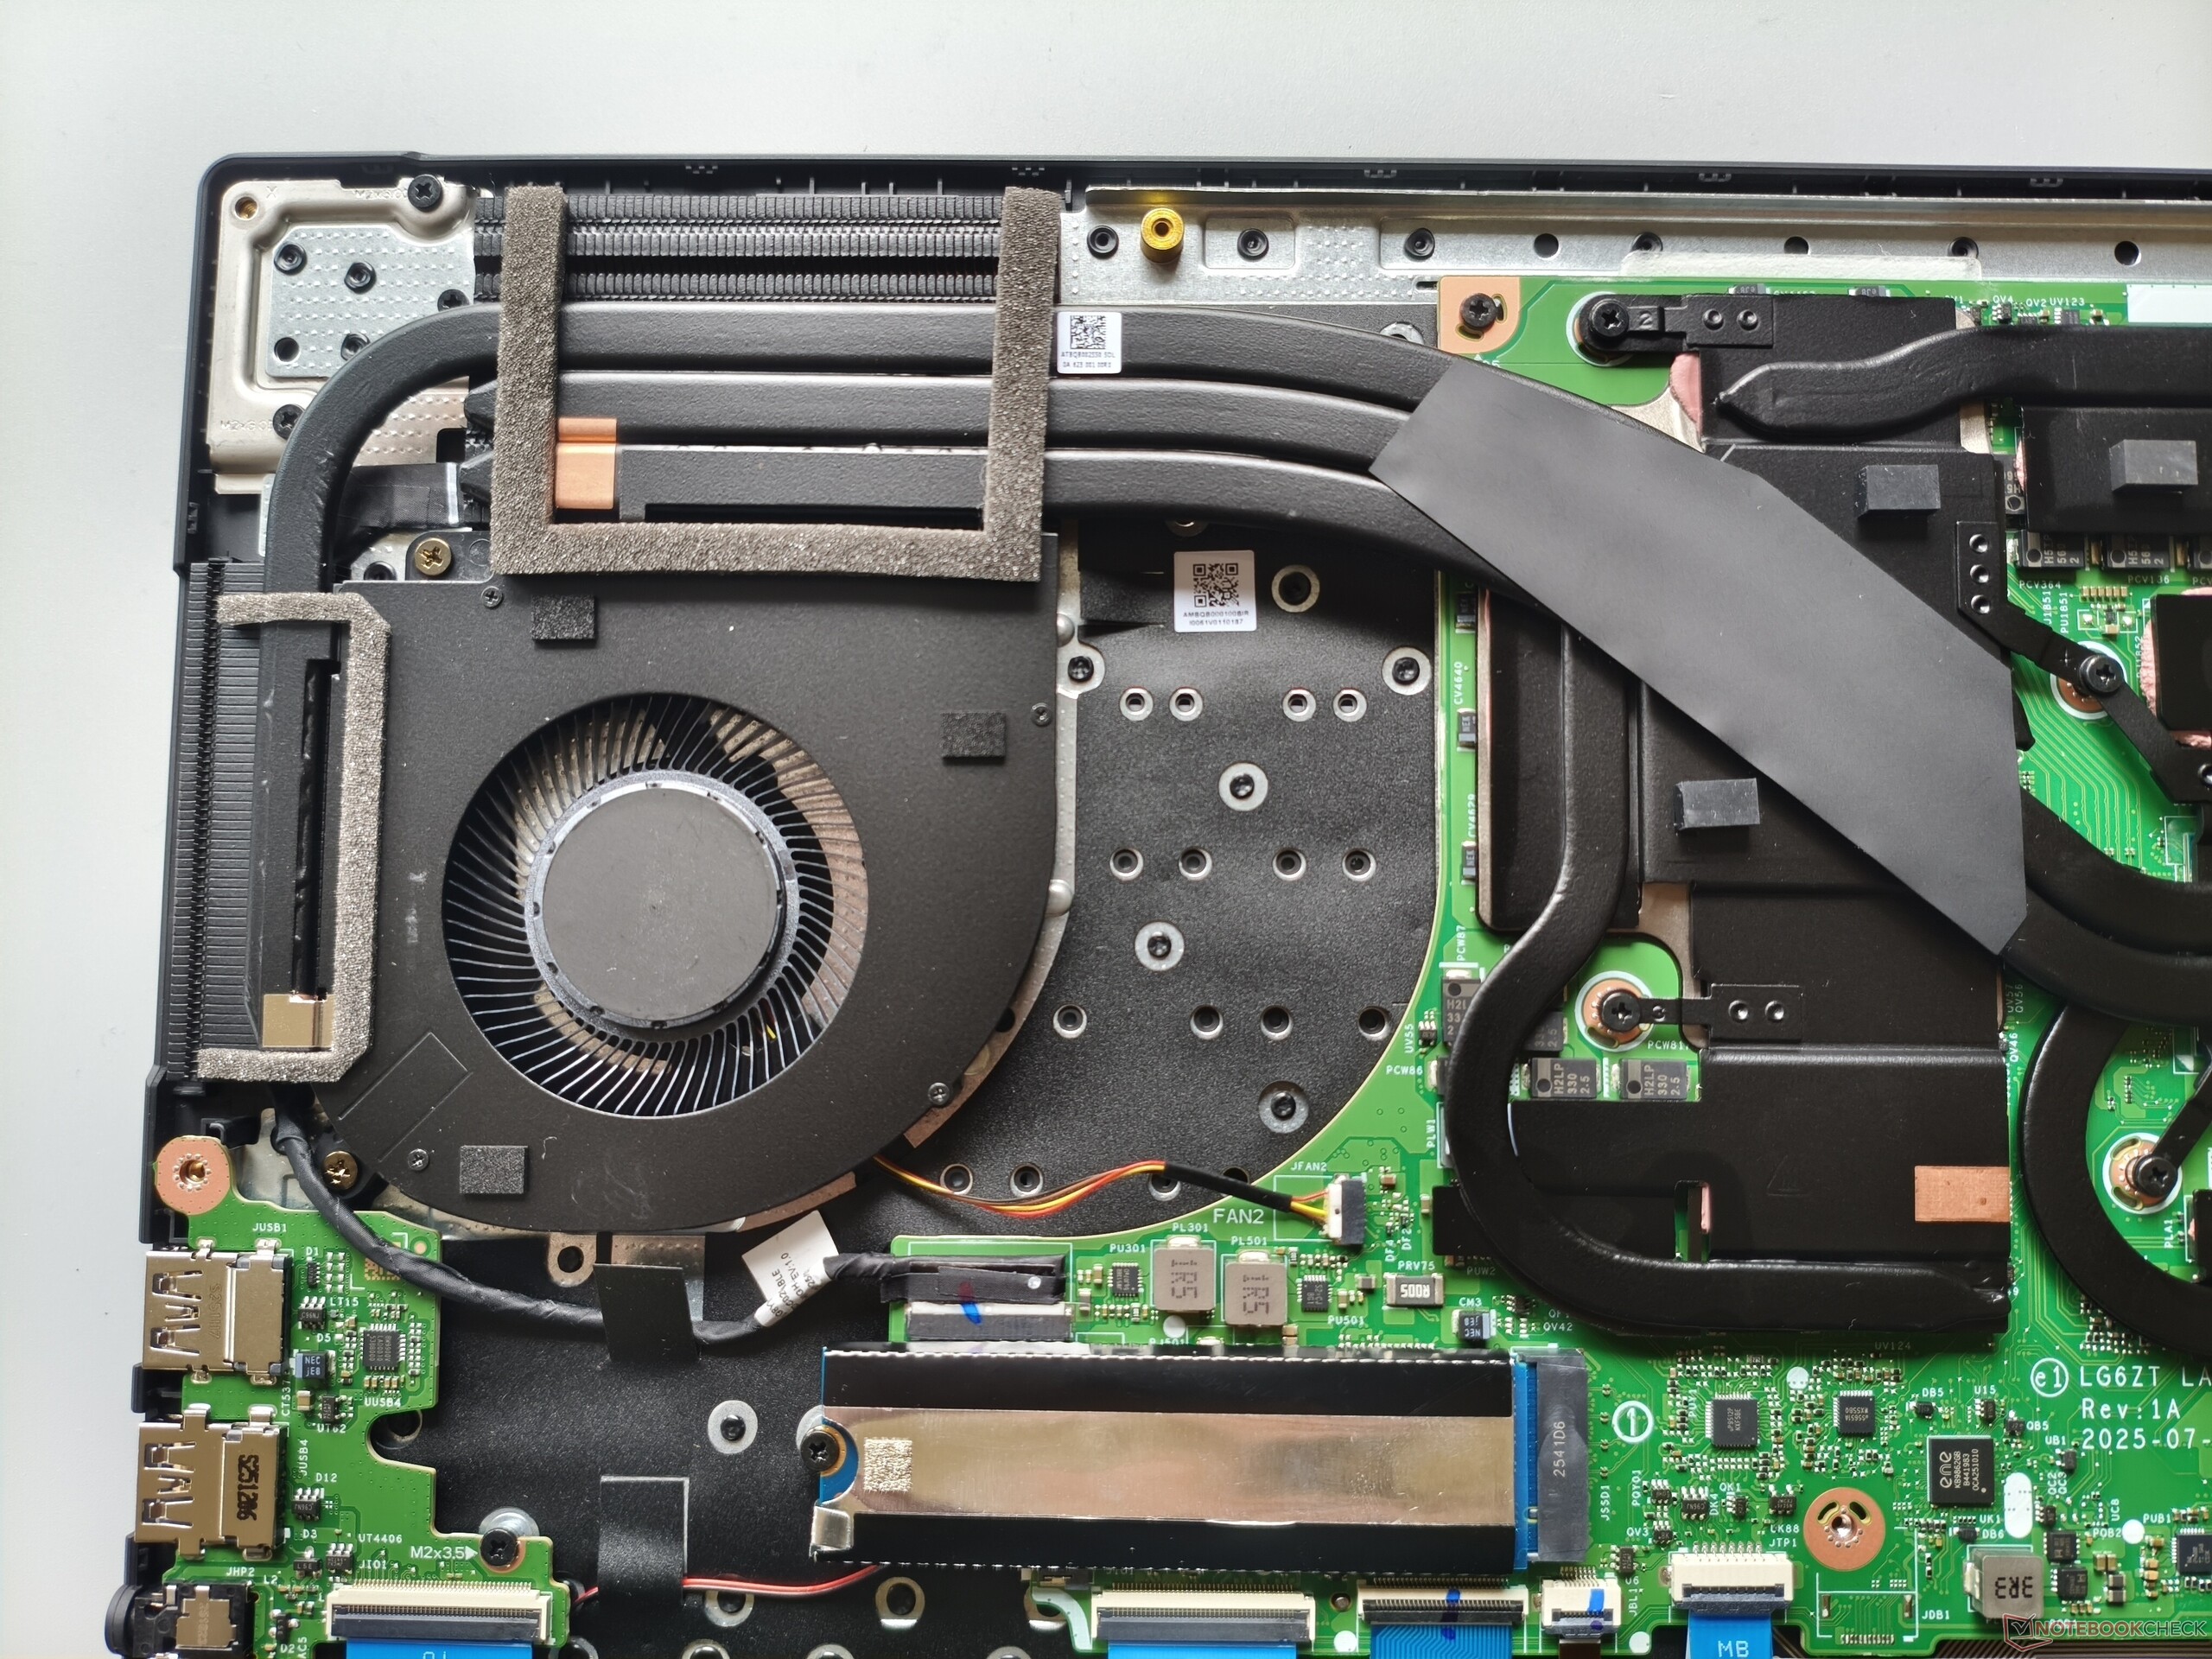
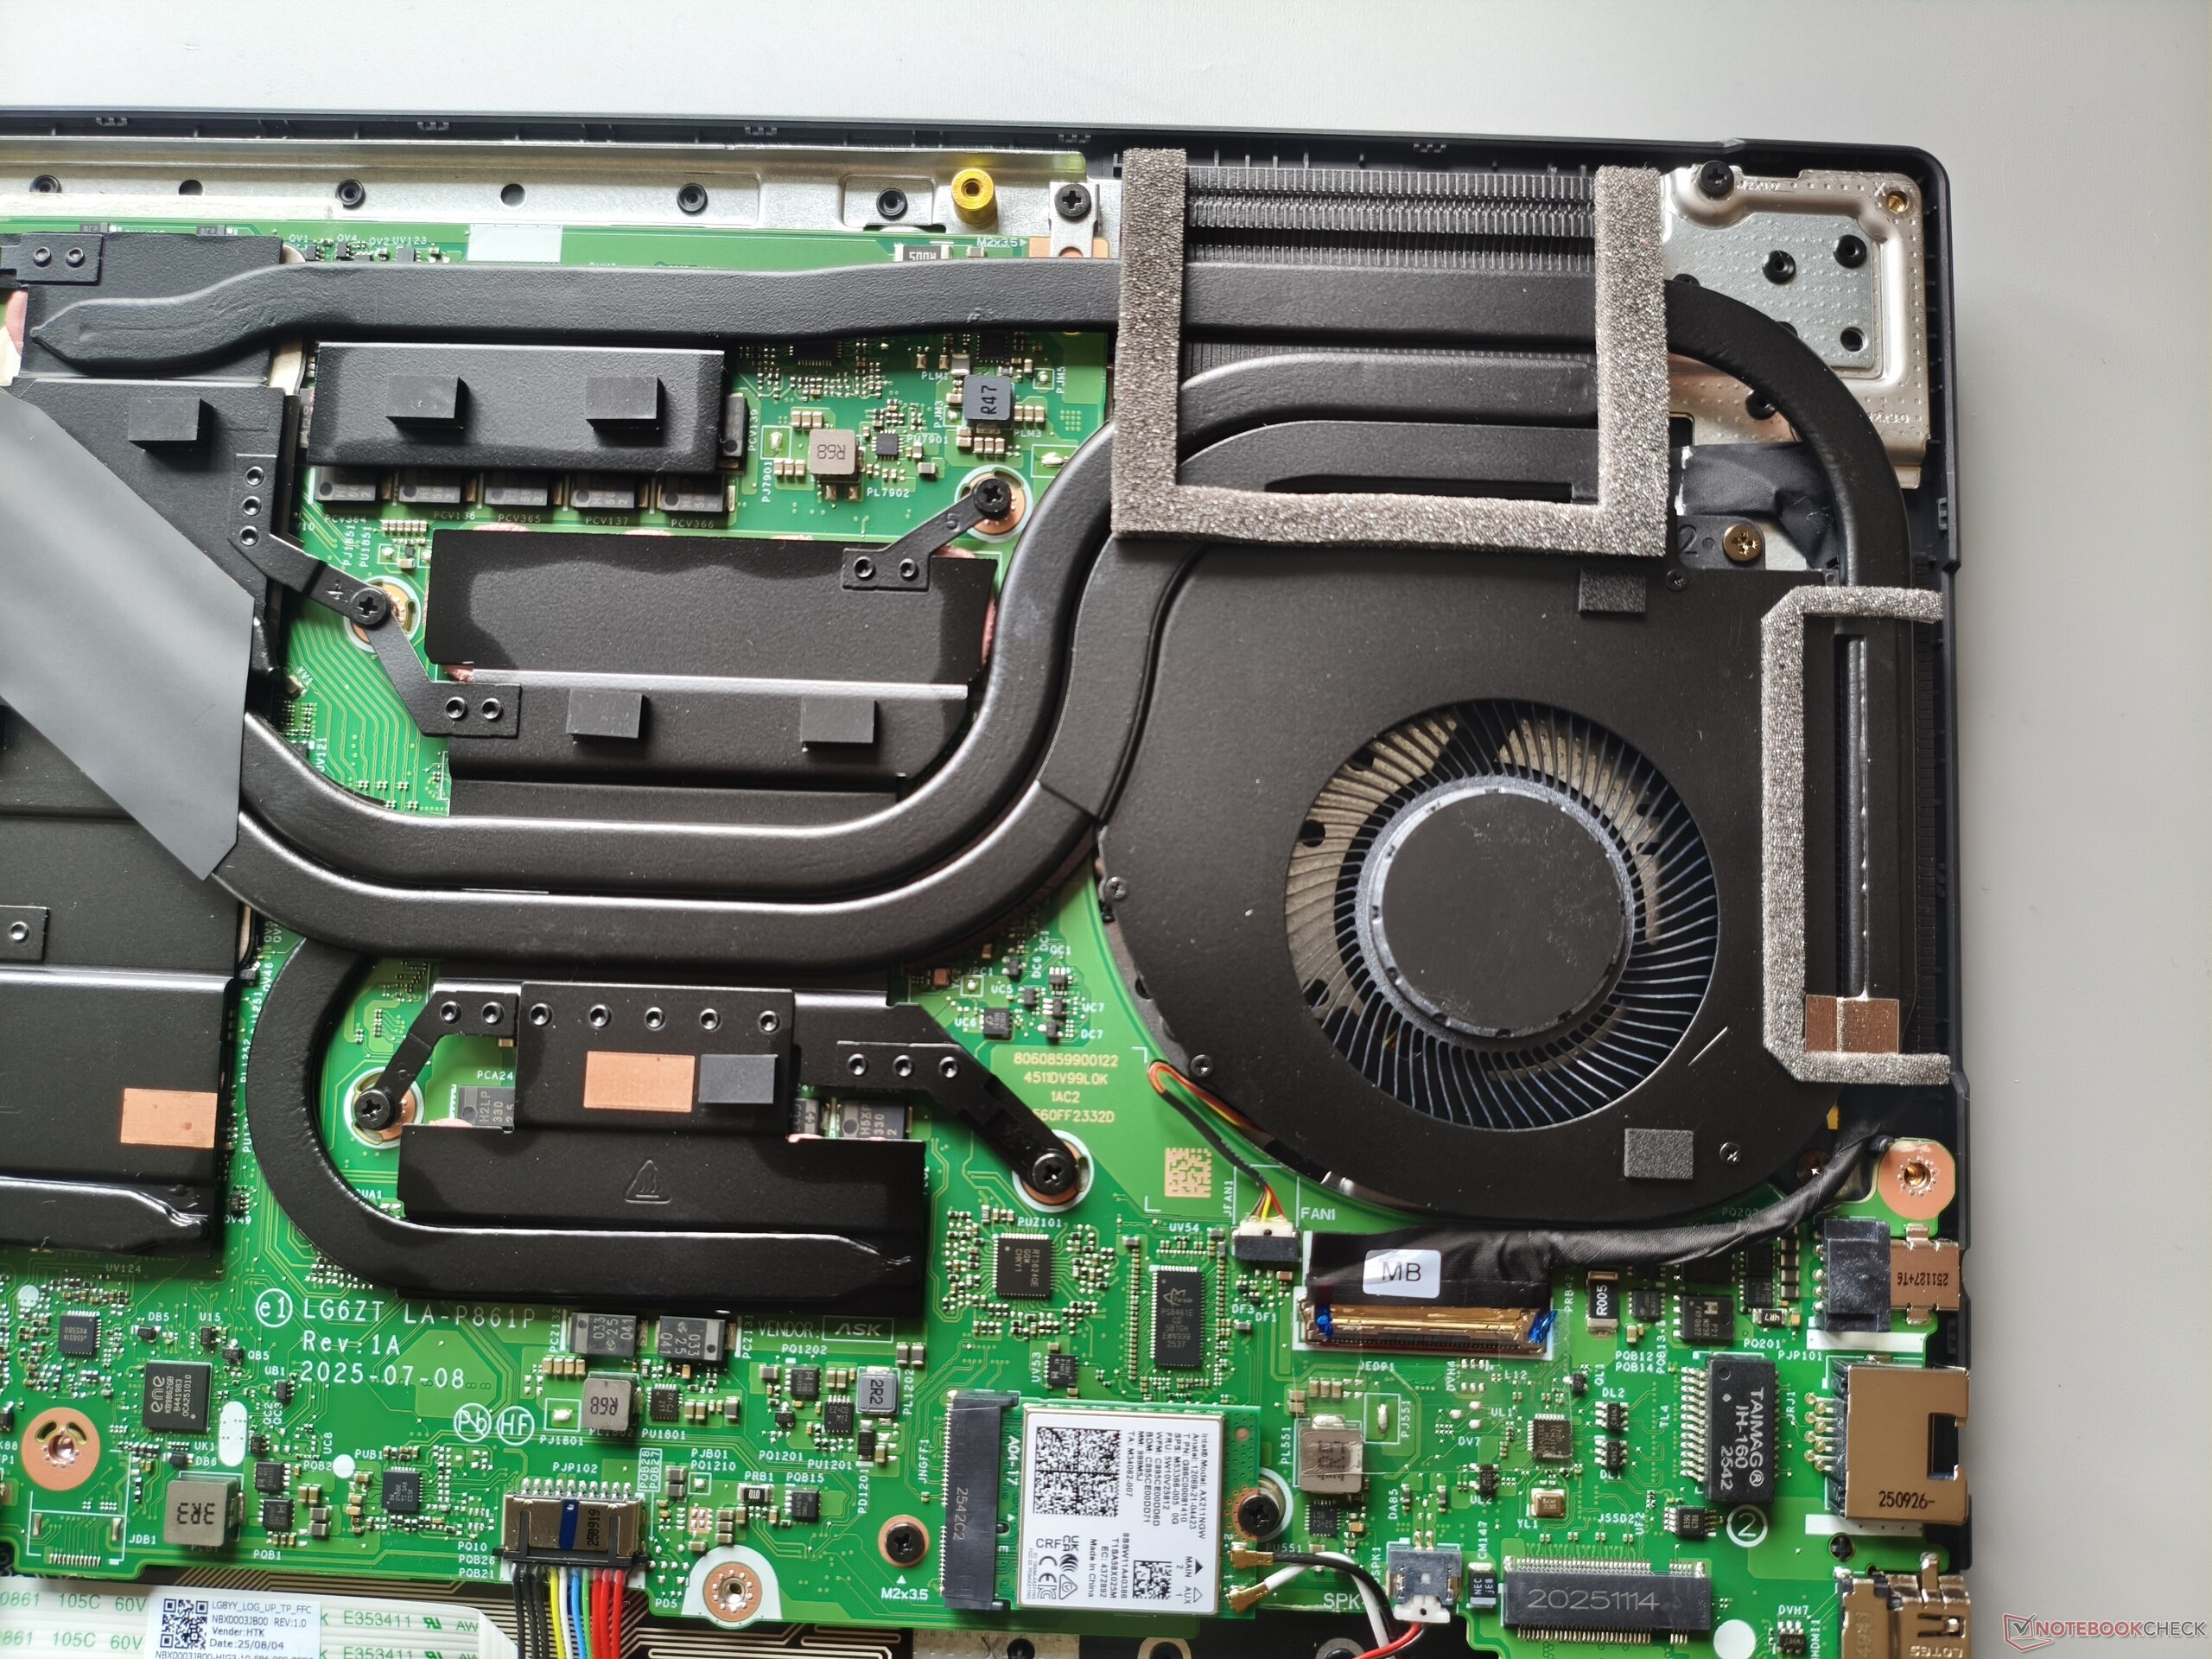
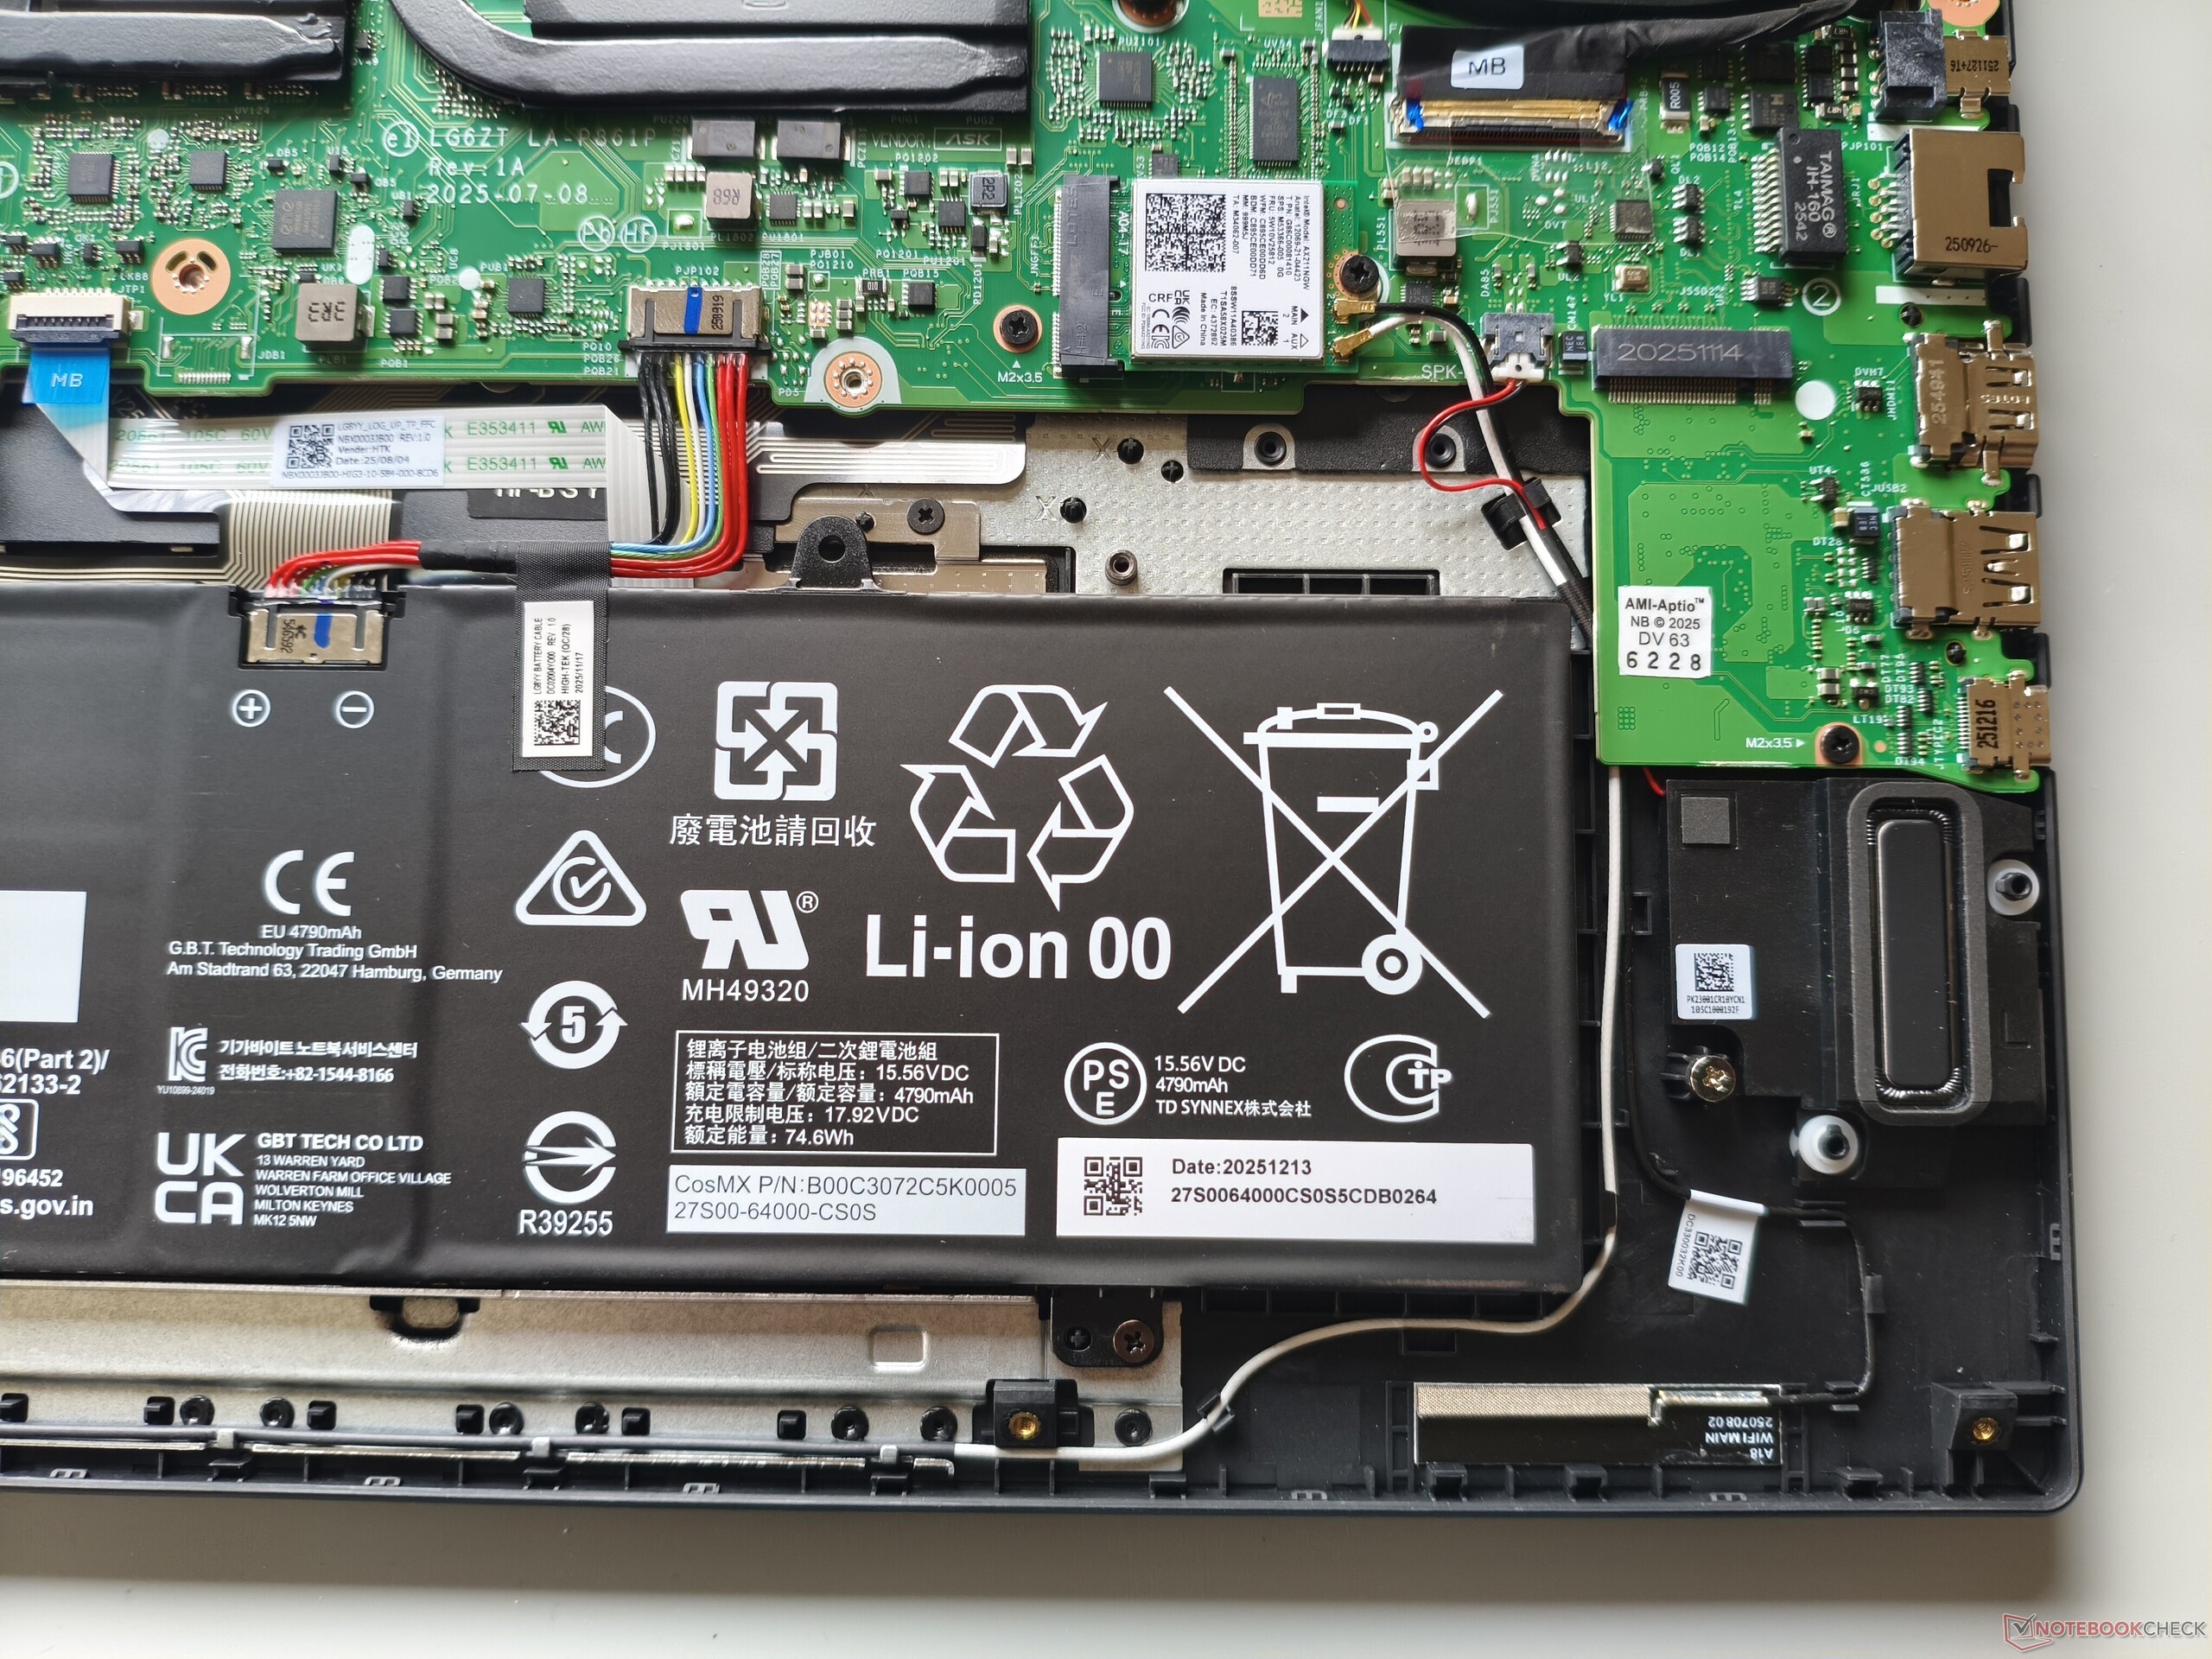
维护
松开 11 颗十字螺丝后,就可以取下底部面板。在底板下面,我们可以清楚地看到,本来是可以放一块更大的电池的。两个用于固态硬盘的 M.2 插槽(其中一个还是空闲的)相当不错,但从升级角度来看,焊接内存和缺少 SO-DIMM 插槽是一个缺点。

可持续性
包装主要由纸板制成。只有笔记本套和键盘盖是用塑料制成的。
输入设备
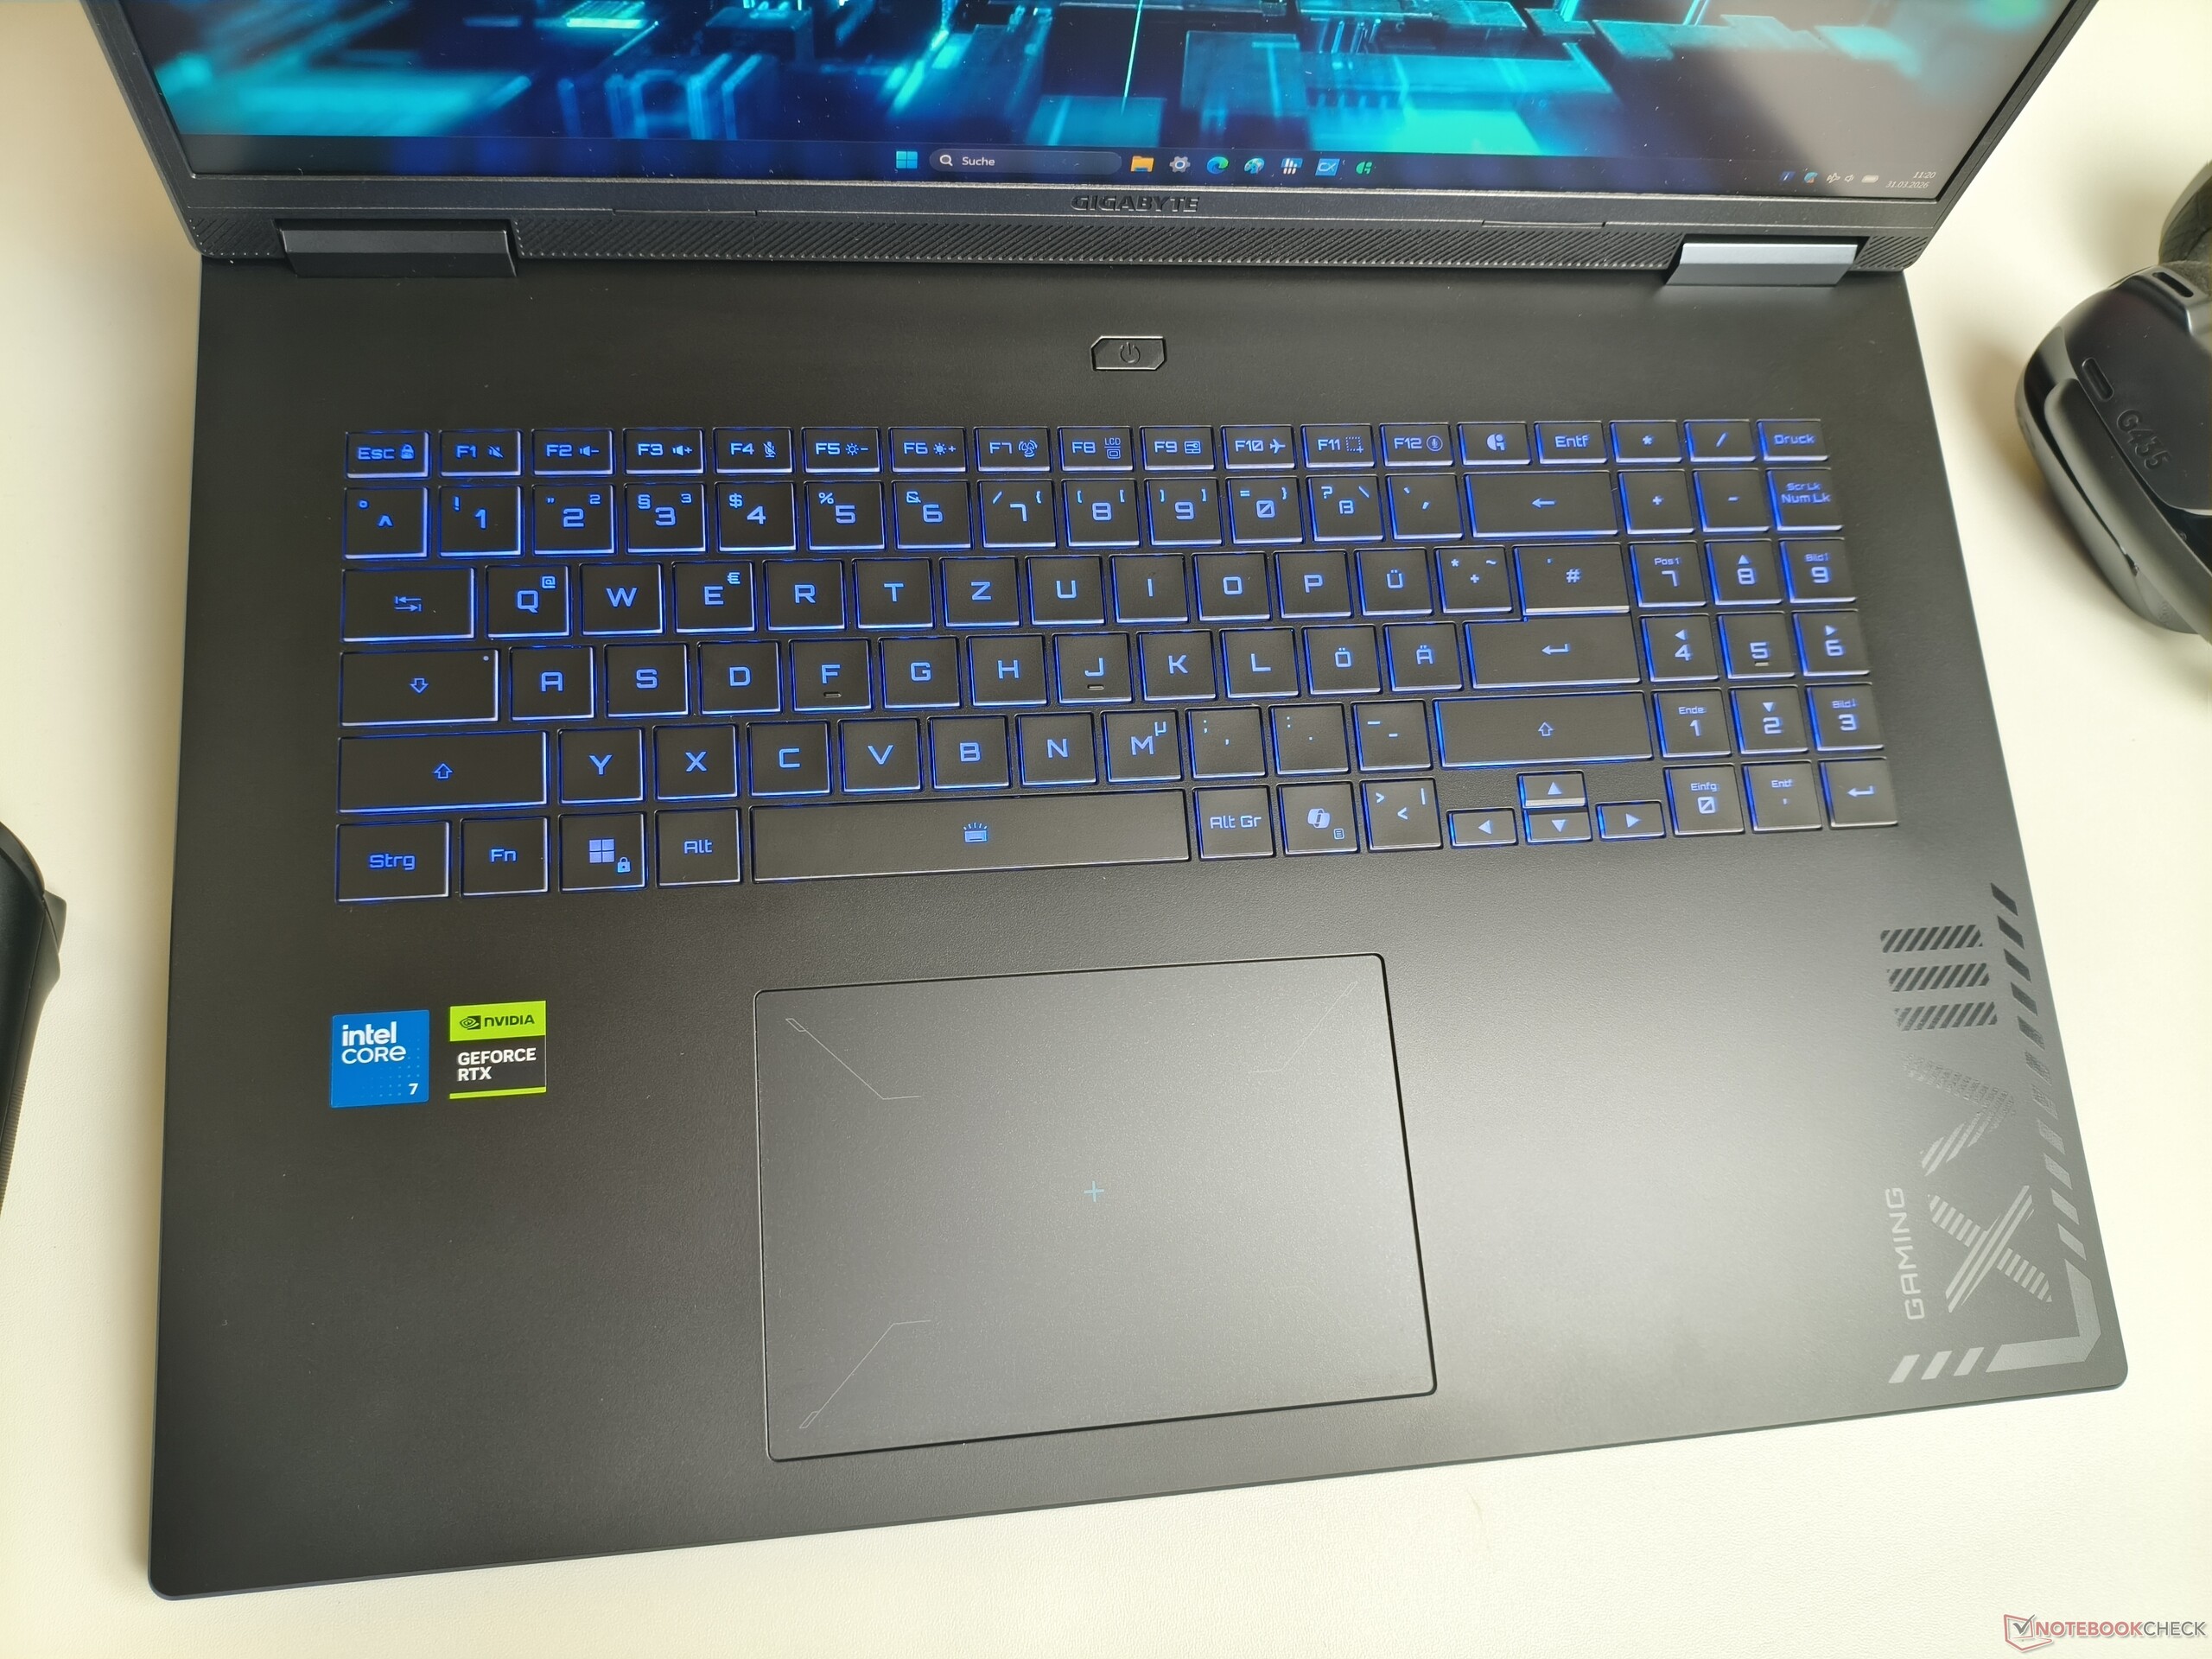
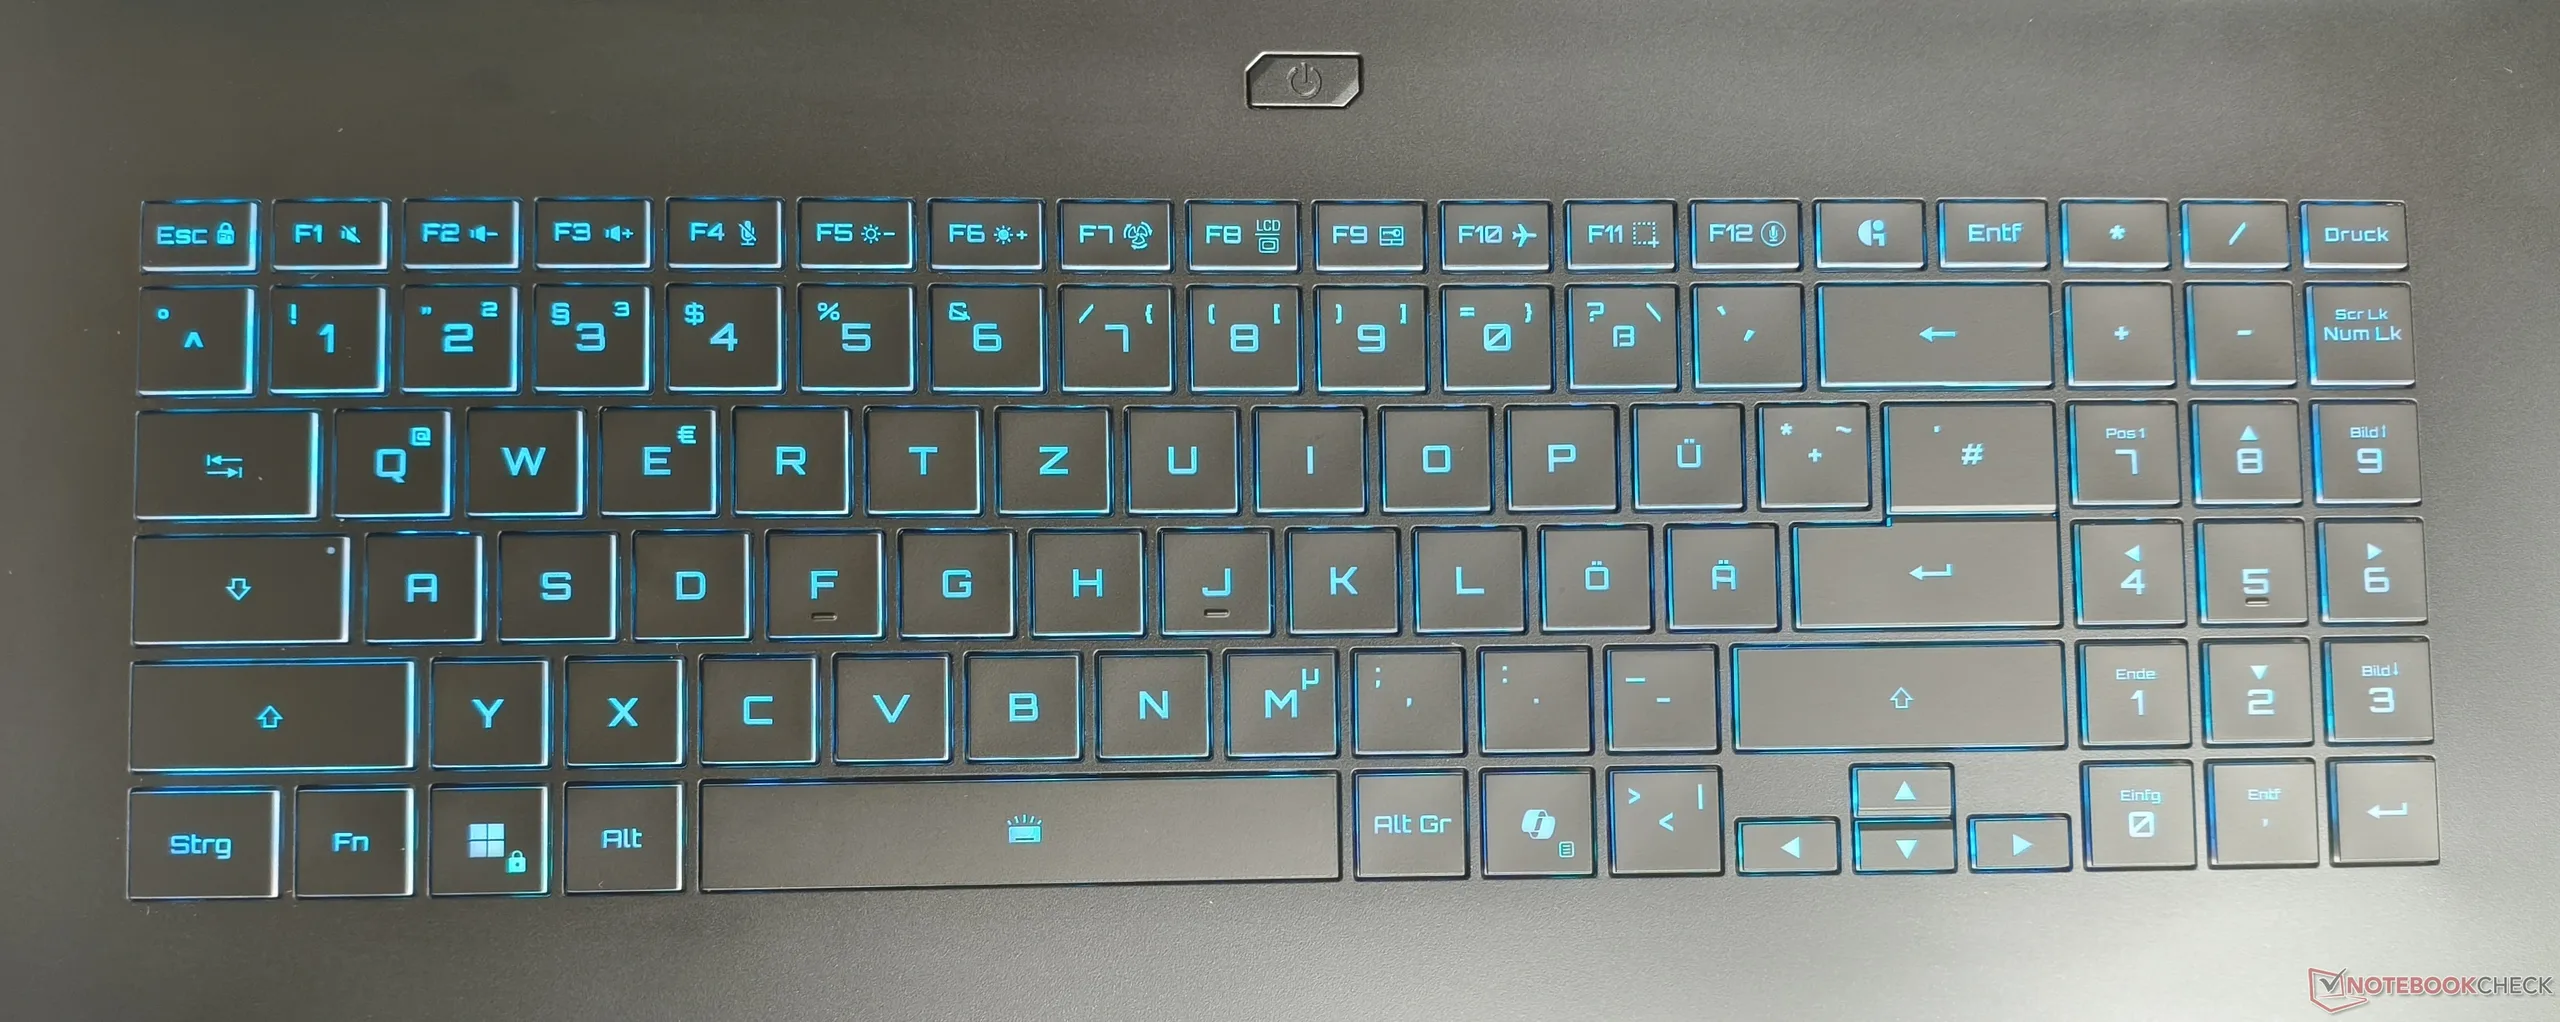
键盘
与 Gaming A16 Pro 类似,输入设备在测试中也给我们留下了深刻印象。键盘提供了扎实的反馈和触感,以及多级可调的 RGB 灯光。不过,键盘的布局似乎并不完全理想,例如,数字键盘虽然有足够的空间,但只有三列而不是四列。
触摸板
触摸板的尺寸约为 5.3 × 3.5 英寸,大小适中。在实际使用中,鼠标的替代品在很大程度上并不显眼,而且提供了良好的精度和流畅的手势支持。光滑的表面也确保了出色的滑动性能。
显示屏
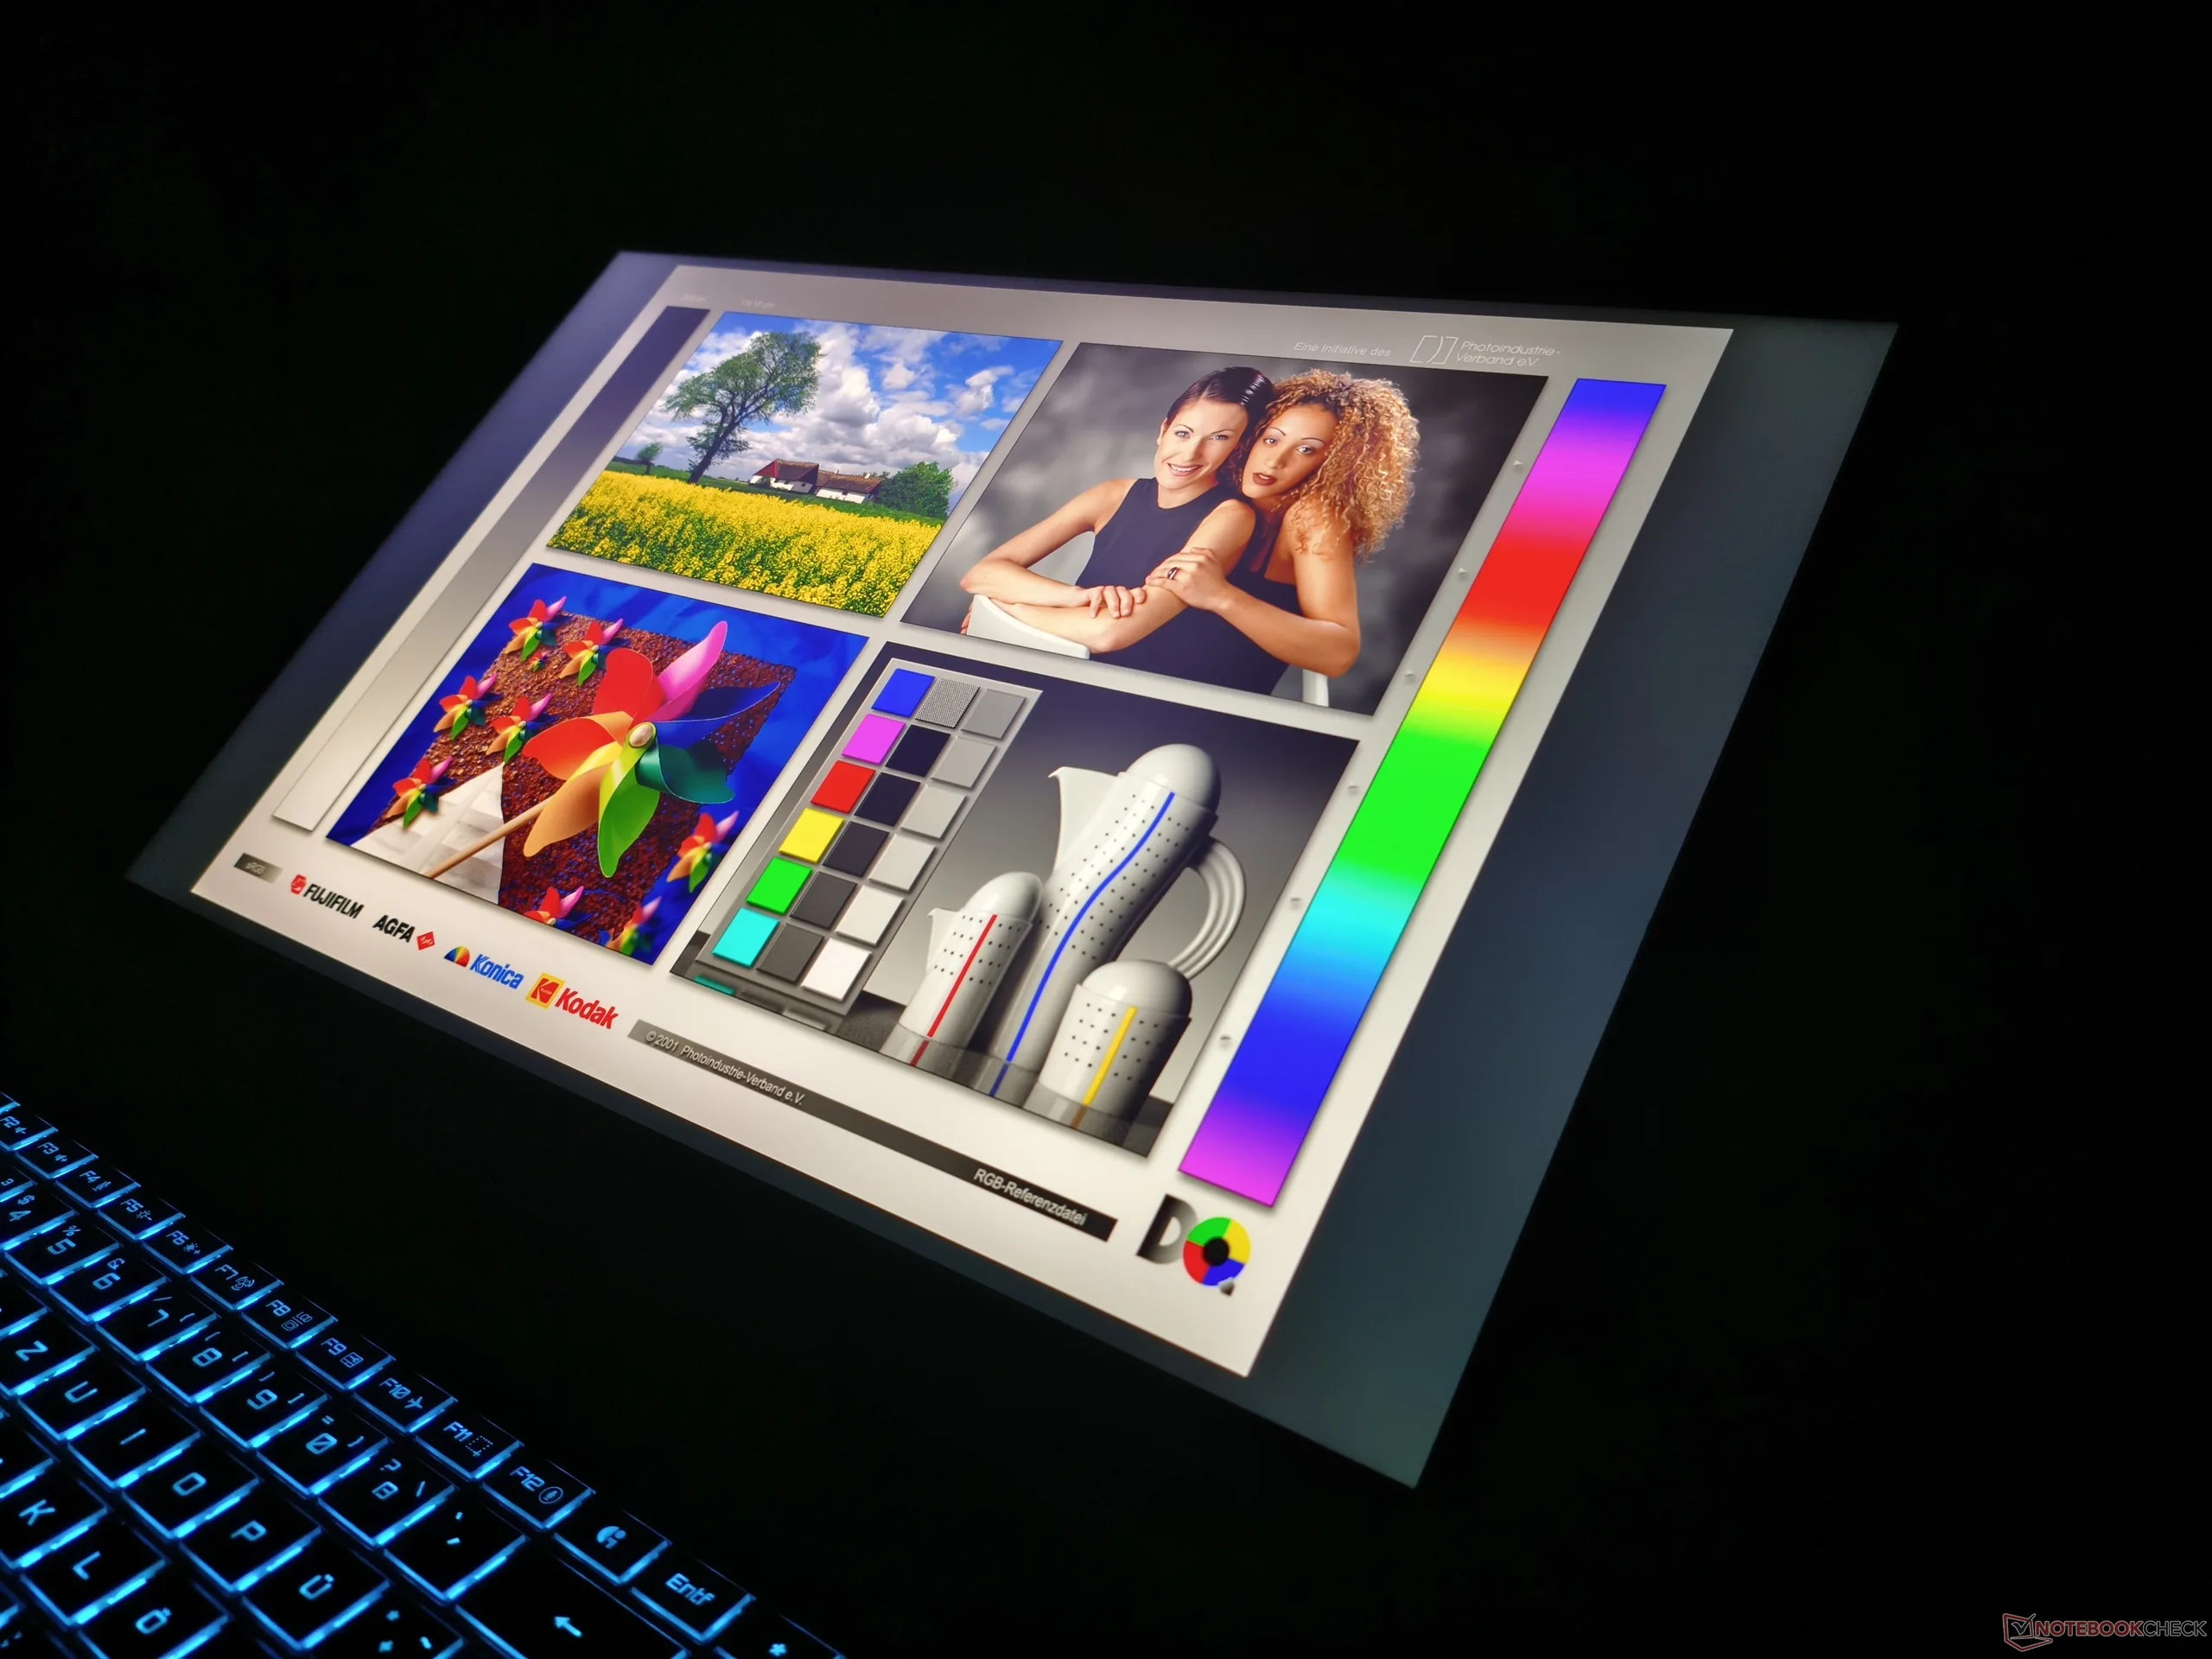
技嘉选择了 2560 × 1600 像素的 IPS 面板,几乎在所有方面都表现不俗。得益于其 0.29 cd/m² 的纯黑水平,该屏幕的对比度达到了 1,000:1,尽管 IPS 面板在这方面自然无法与 OLED 显示屏相媲美。
| |||||||||||||||||||||||||
Brightness Distribution: 88 %
Center on Battery: 317 cd/m²
Contrast: 1093:1 (Black: 0.29 cd/m²)
ΔE ColorChecker Calman: 5.29 | ∀{0.5-29.43 Ø4.72}
calibrated: 0.64
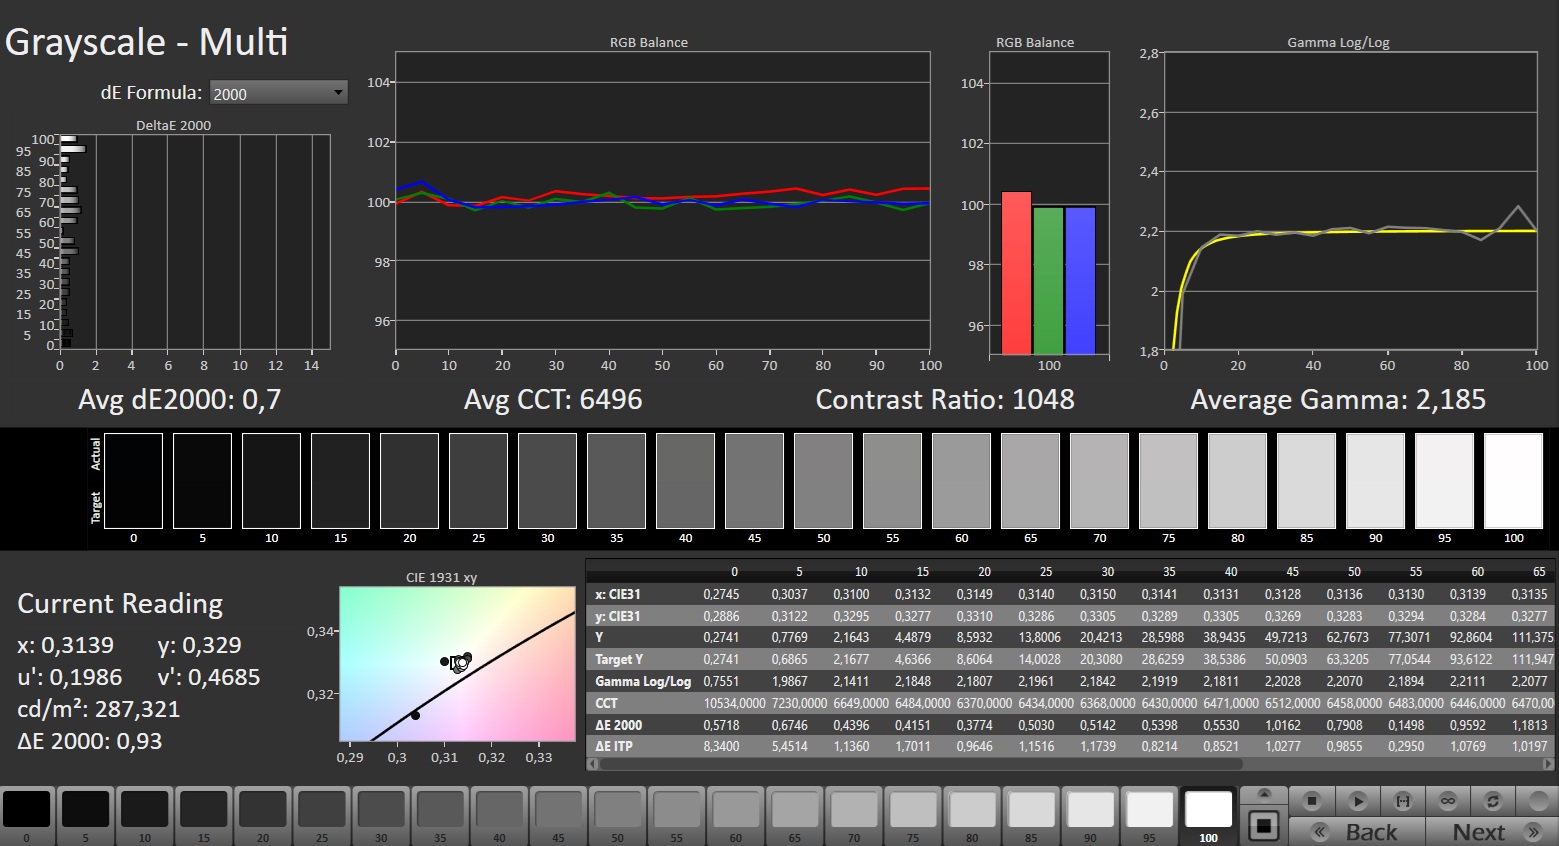
ΔE Greyscale Calman: 7.5 | ∀{0.09-98 Ø4.97}
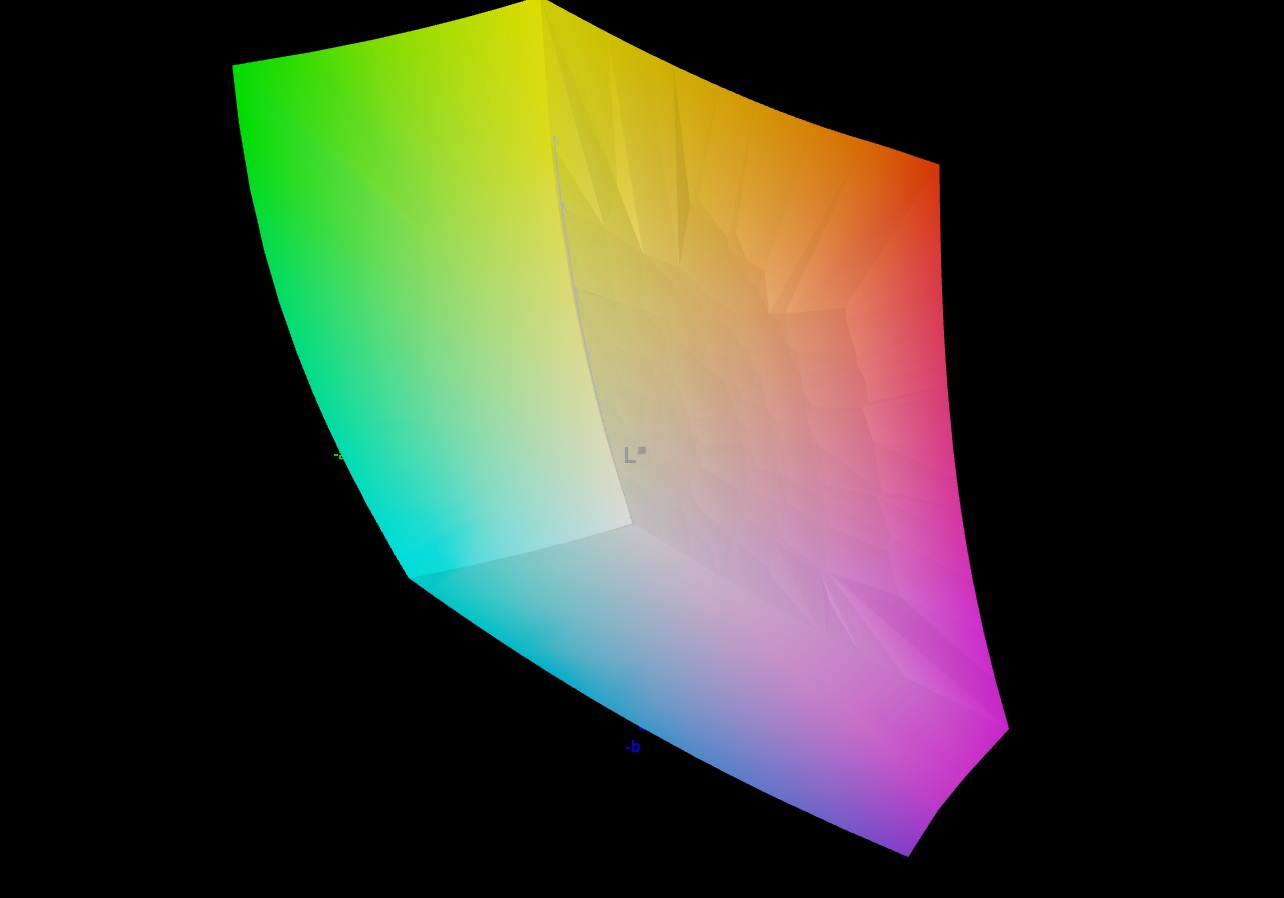
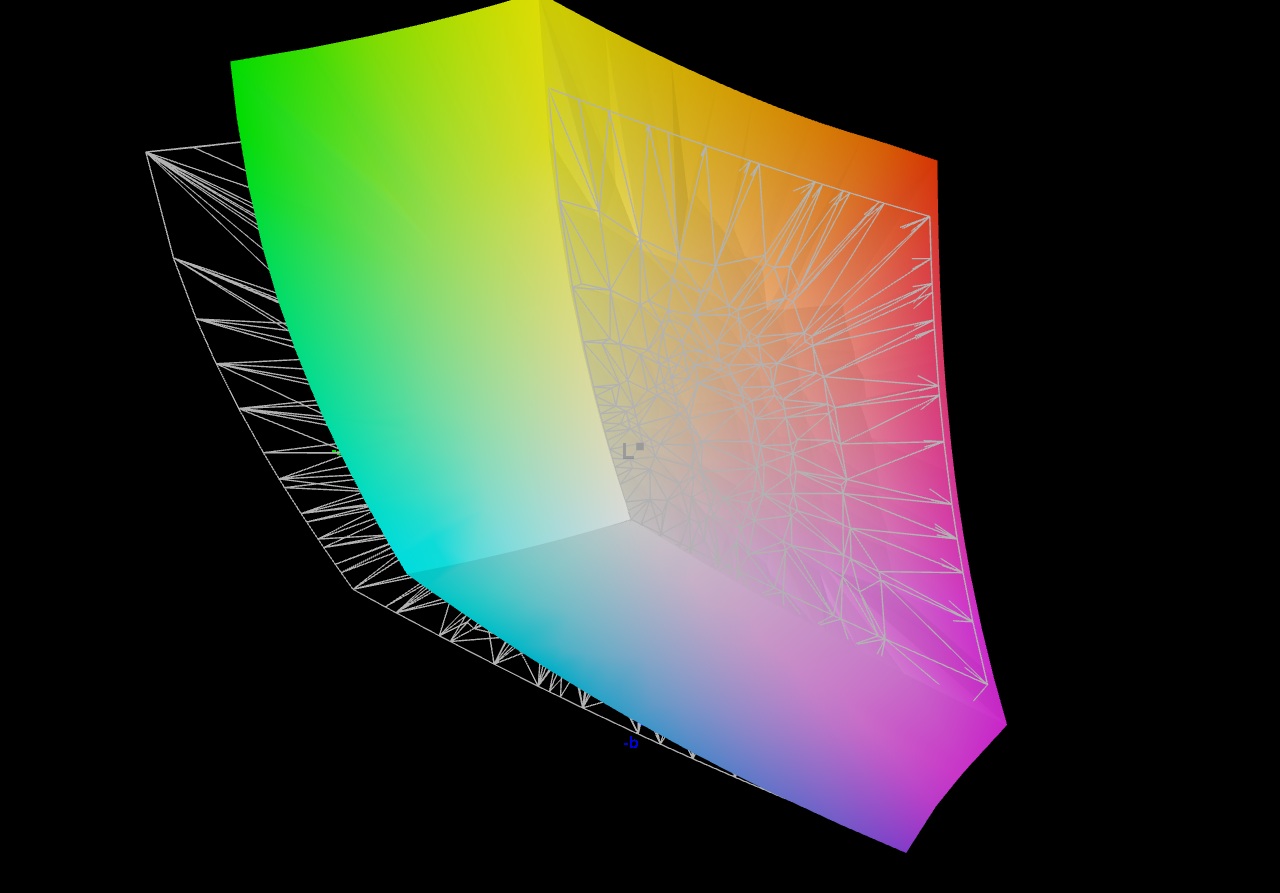
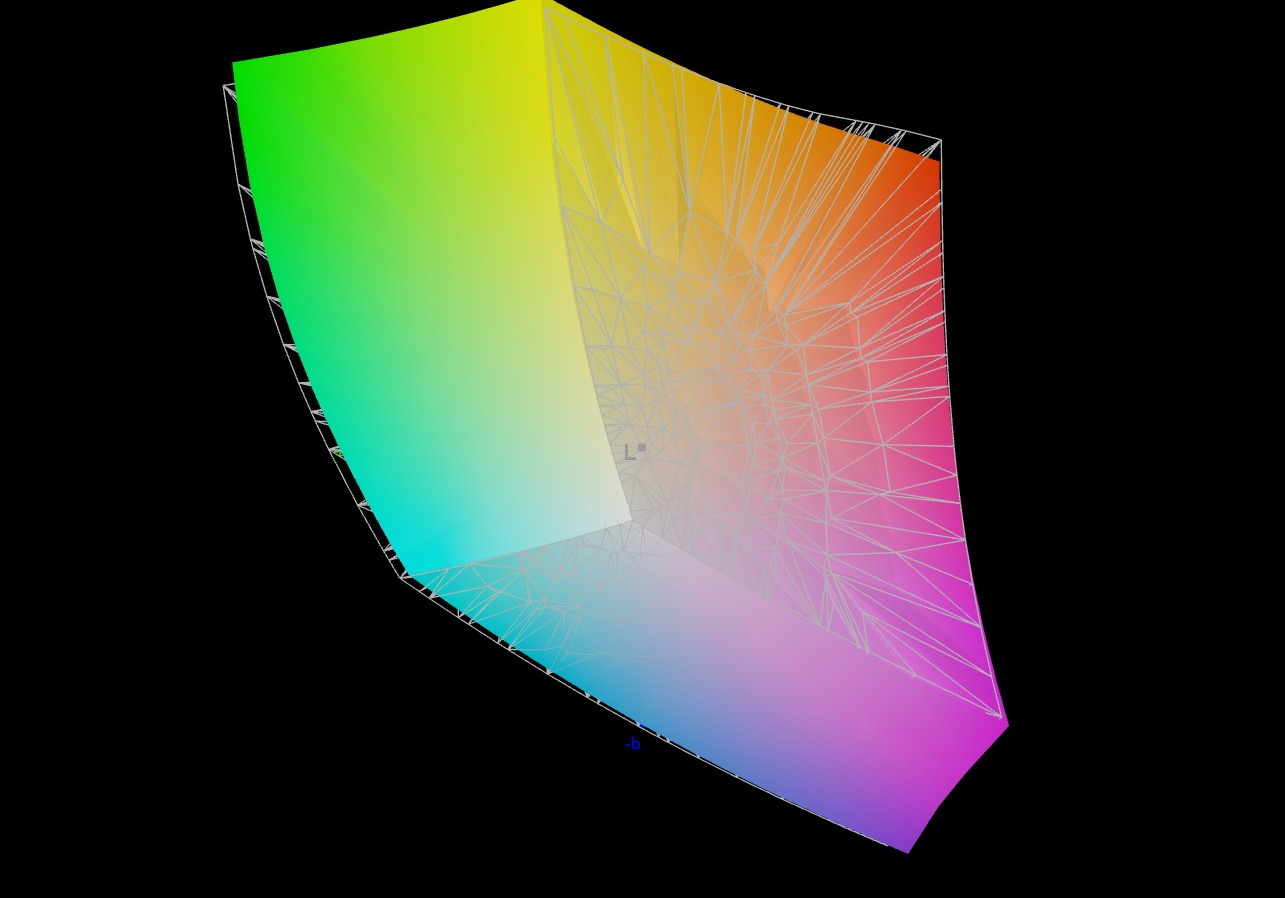
84.6% AdobeRGB 1998 (Argyll 3D)
100% sRGB (Argyll 3D)
96.9% Display P3 (Argyll 3D)
Gamma: 2.267
CCT: 6824 K
| Gigabyte Gaming A18 Pro BOE NE180QD1-MY0, IPS, 2560x1600, 18", 165 Hz | Lenovo Legion 9 18IAX10 BOE NE180QAM-NZ2, IPS, 3840x2400, 18", 240 Hz | MSI Vector A18 HX A9W AU Optronics B180QAN01.0, IPS, 2560x1600, 18", 240 Hz | Asus TUF Gaming A18 FA808UP-S8022W NE180WUM-NY3 (BOE0CEF), IPS, 1920x1200, 18", 144 Hz | Acer Nitro 18 AI AN18-61-R10V BOEhydis NE180QDM-NY1, IPS, 2560x1600, 18", 165 Hz | |
|---|---|---|---|---|---|
| Display | 1% | 1% | -17% | 0% | |
| Display P3 Coverage (%) | 96.9 | 96 -1% | 98.1 1% | 69.3 -28% | 97.2 0% |
| sRGB Coverage (%) | 100 | 100 0% | 99.9 0% | 98.1 -2% | 99.9 0% |
| AdobeRGB 1998 Coverage (%) | 84.6 | 88.8 5% | 86.3 2% | 67.9 -20% | 84.8 0% |
| Response Times | -4% | 31% | -5% | 8% | |
| Response Time Grey 50% / Grey 80% * (ms) | 7.6 ? | 9.7 ? -28% | 4.3 ? 43% | 8 ? -5% | 6.8 ? 11% |
| Response Time Black / White * (ms) | 9.9 ? | 7.8 ? 21% | 8.1 ? 18% | 10.4 ? -5% | 9.4 ? 5% |
| PWM Frequency (Hz) | |||||
| Screen | 26% | 19% | 15% | -20% | |
| Brightness middle (cd/m²) | 317 | 479.7 51% | 543 71% | 351 11% | 317 0% |
| Brightness (cd/m²) | 291 | 465 60% | 502 73% | 332 14% | 288 -1% |
| Brightness Distribution (%) | 88 | 86 -2% | 86 -2% | 89 1% | 87 -1% |
| Black Level * (cd/m²) | 0.29 | 0.27 7% | 0.56 -93% | 0.26 10% | 0.28 3% |
| Contrast (:1) | 1093 | 1777 63% | 970 -11% | 1350 24% | 1132 4% |
| Colorchecker dE 2000 * | 5.29 | 3.14 41% | 3.41 36% | 2.89 45% | 5.16 2% |
| Colorchecker dE 2000 max. * | 12.02 | 6.48 46% | 6.4 47% | 7.91 34% | 0.75 94% |
| Colorchecker dE 2000 calibrated * | 0.64 | 1.17 -83% | 0.66 -3% | 0.93 -45% | 2.42 -278% |
| Greyscale dE 2000 * | 7.5 | 3.8 49% | 3.4 55% | 4.46 41% | 7.4 1% |
| Gamma | 2.267 97% | 2.18 101% | 2.3 96% | 2.46 89% | 2.093 105% |
| CCT | 6824 95% | 7301 89% | 6070 107% | 7132 91% | 6553 99% |
| Total Average (Program / Settings) | 8% /
16% | 17% /
17% | -2% /
5% | -4% /
-11% |
* ... smaller is better
另一方面,专业用户可以期待(几乎)完全覆盖 sRGB 和 DCI-P3 色彩空间。Adobe RGB 的覆盖率约为 85%。不过,技嘉可以提高亮度;平均 291 cd/m² 的亮度对于这个价位的笔记本电脑来说相当低,一般只适合室内使用。
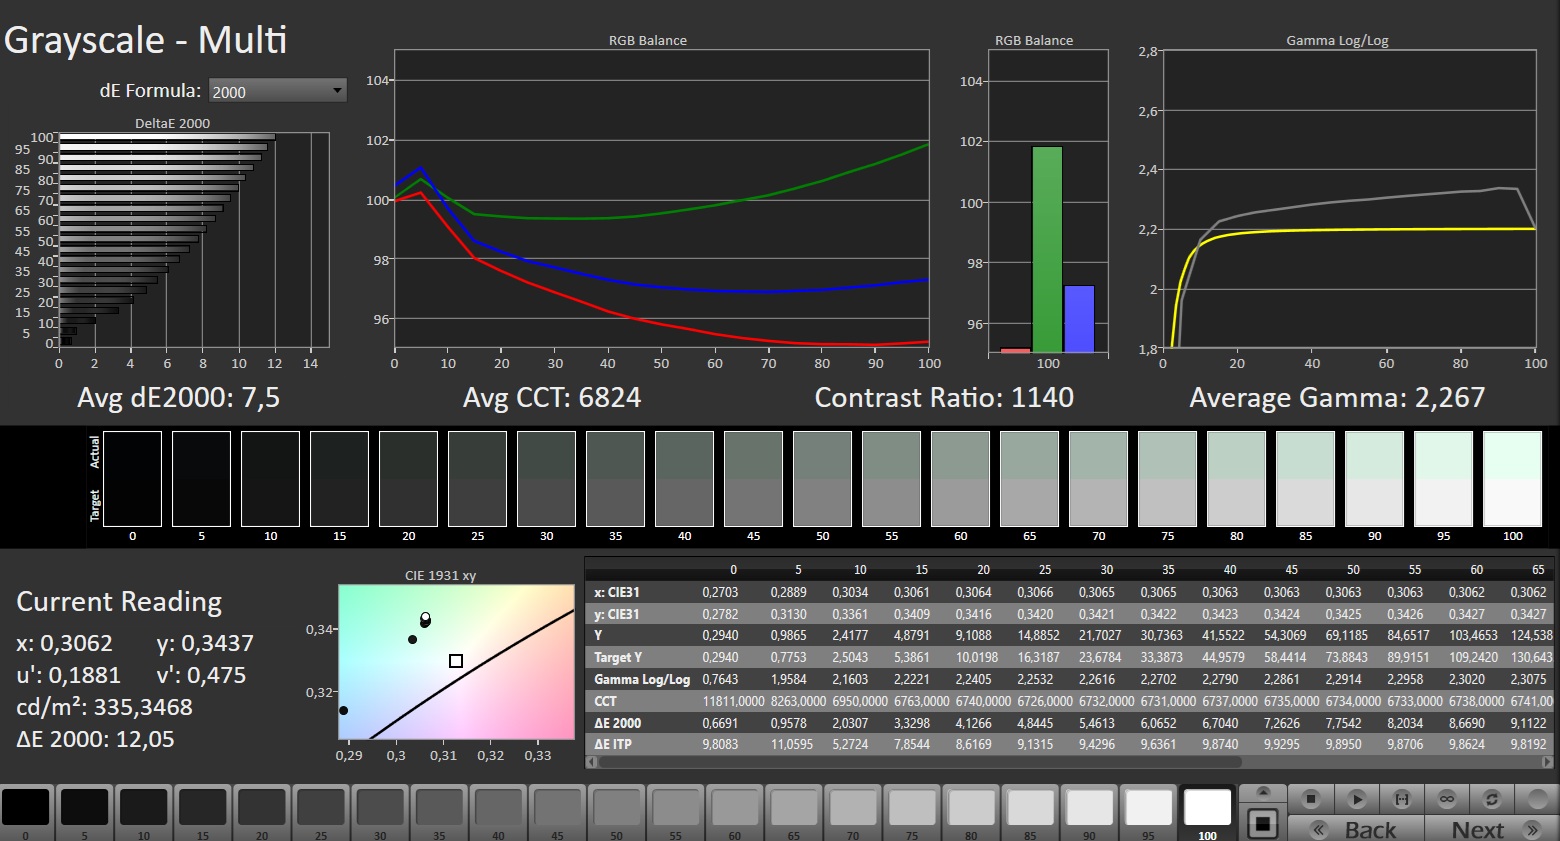
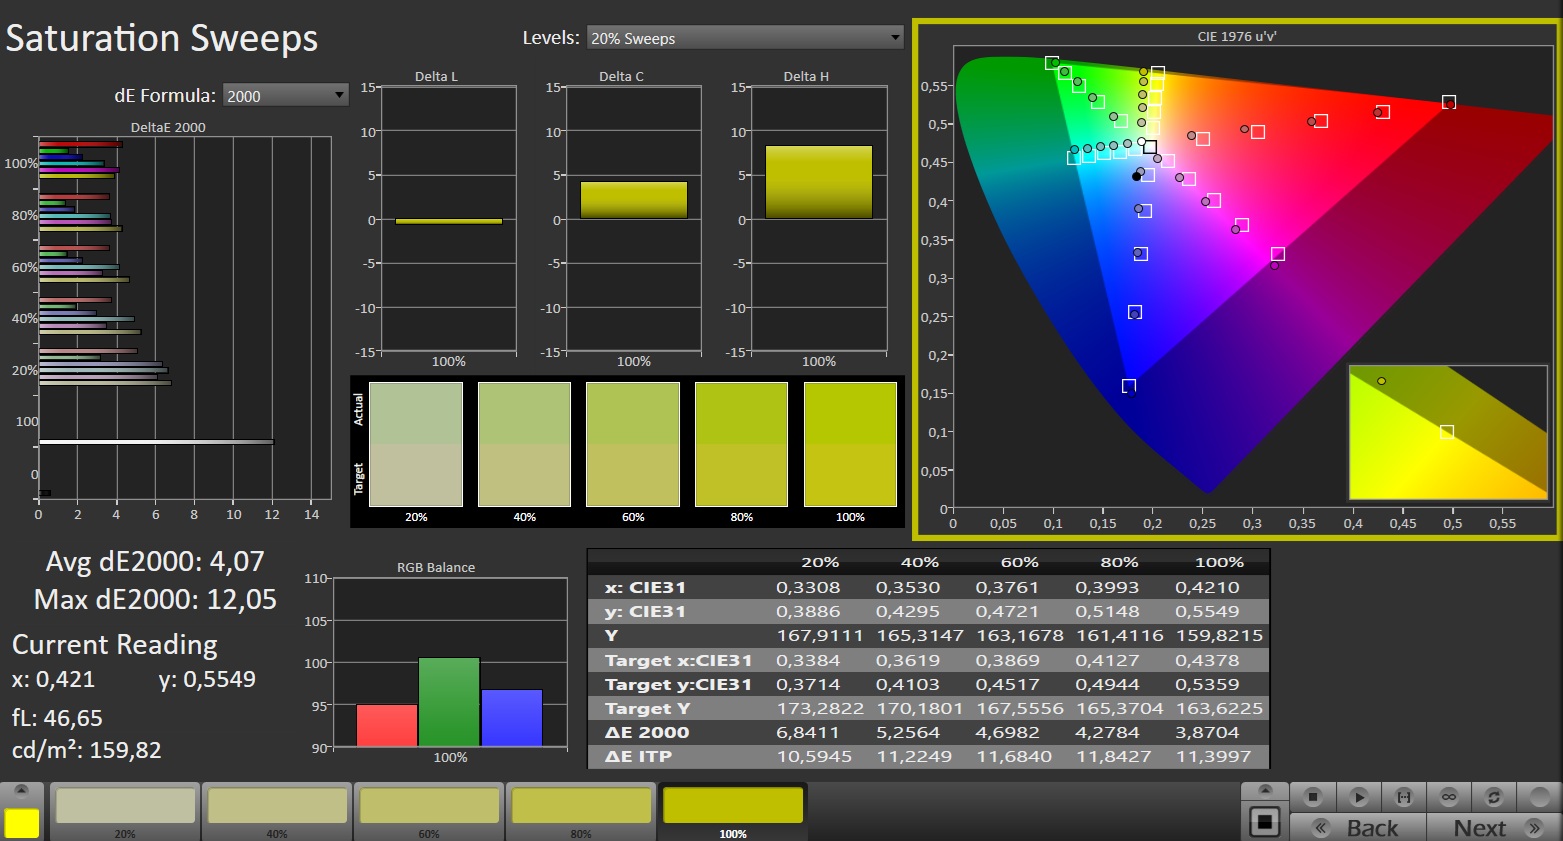
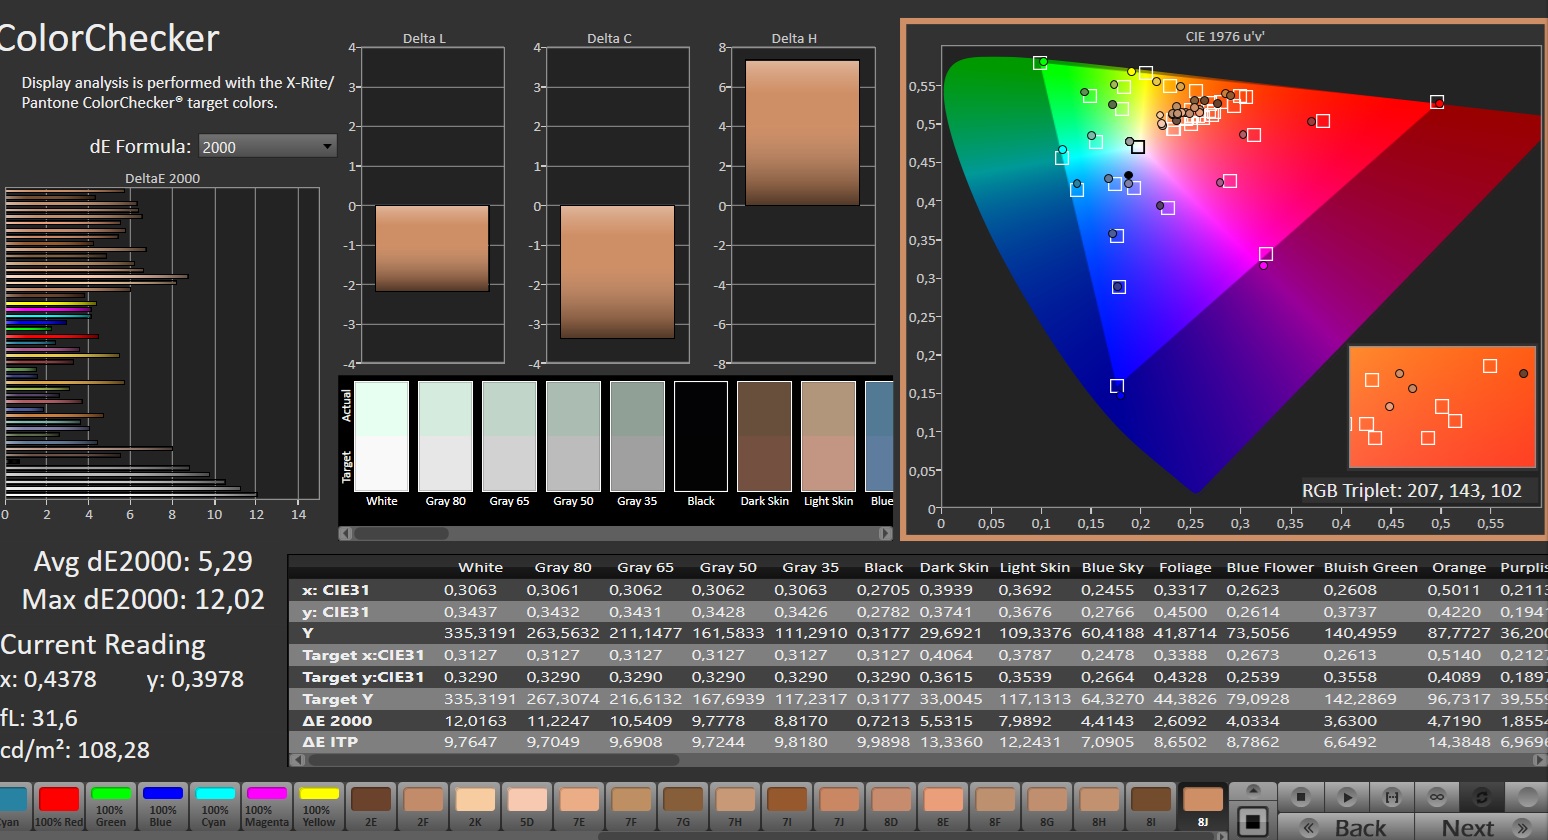
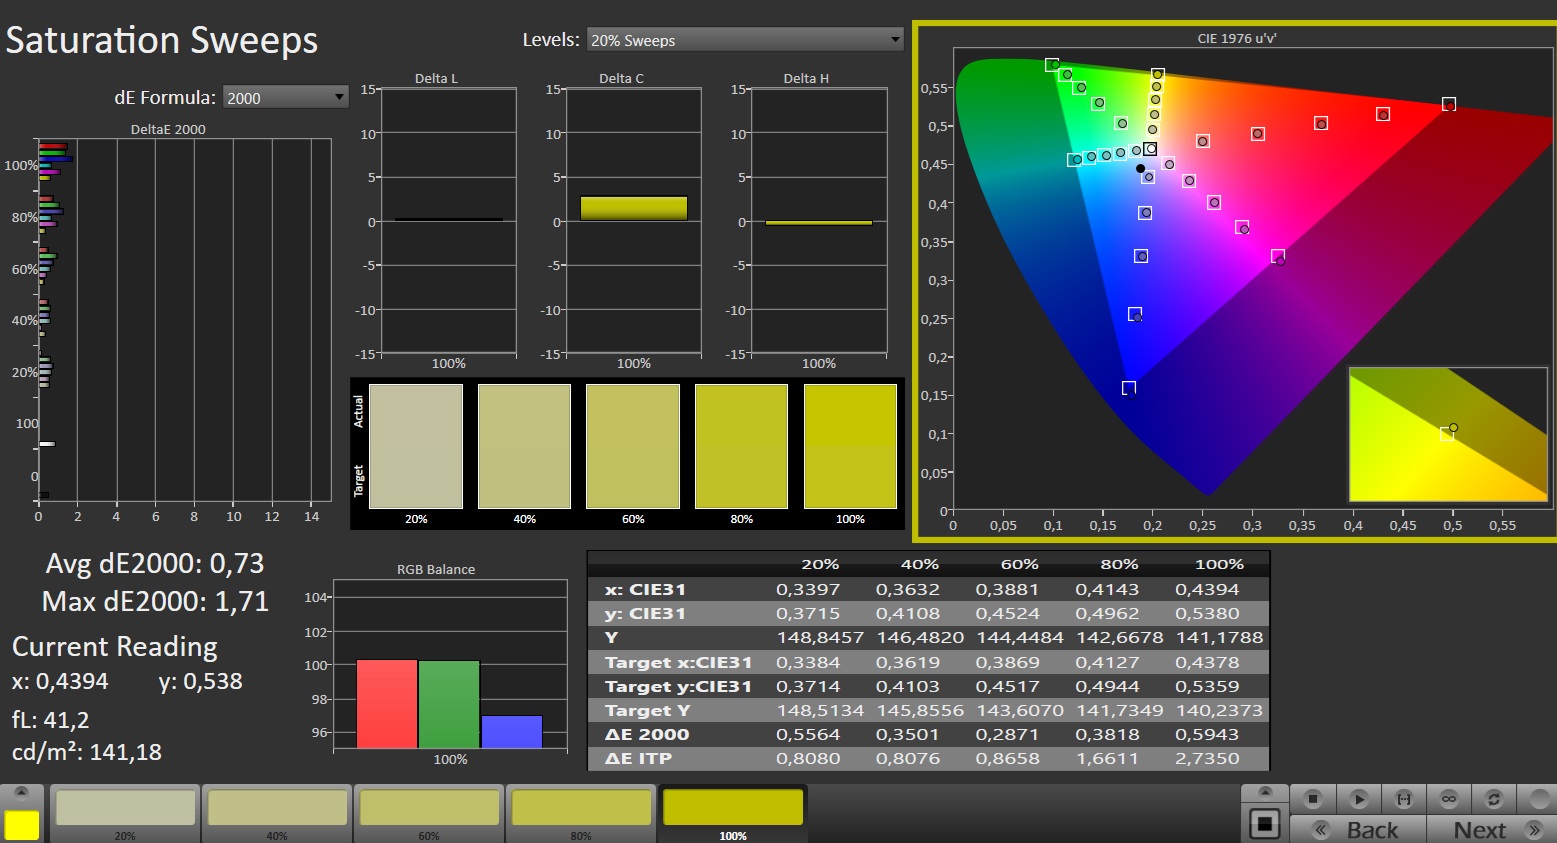
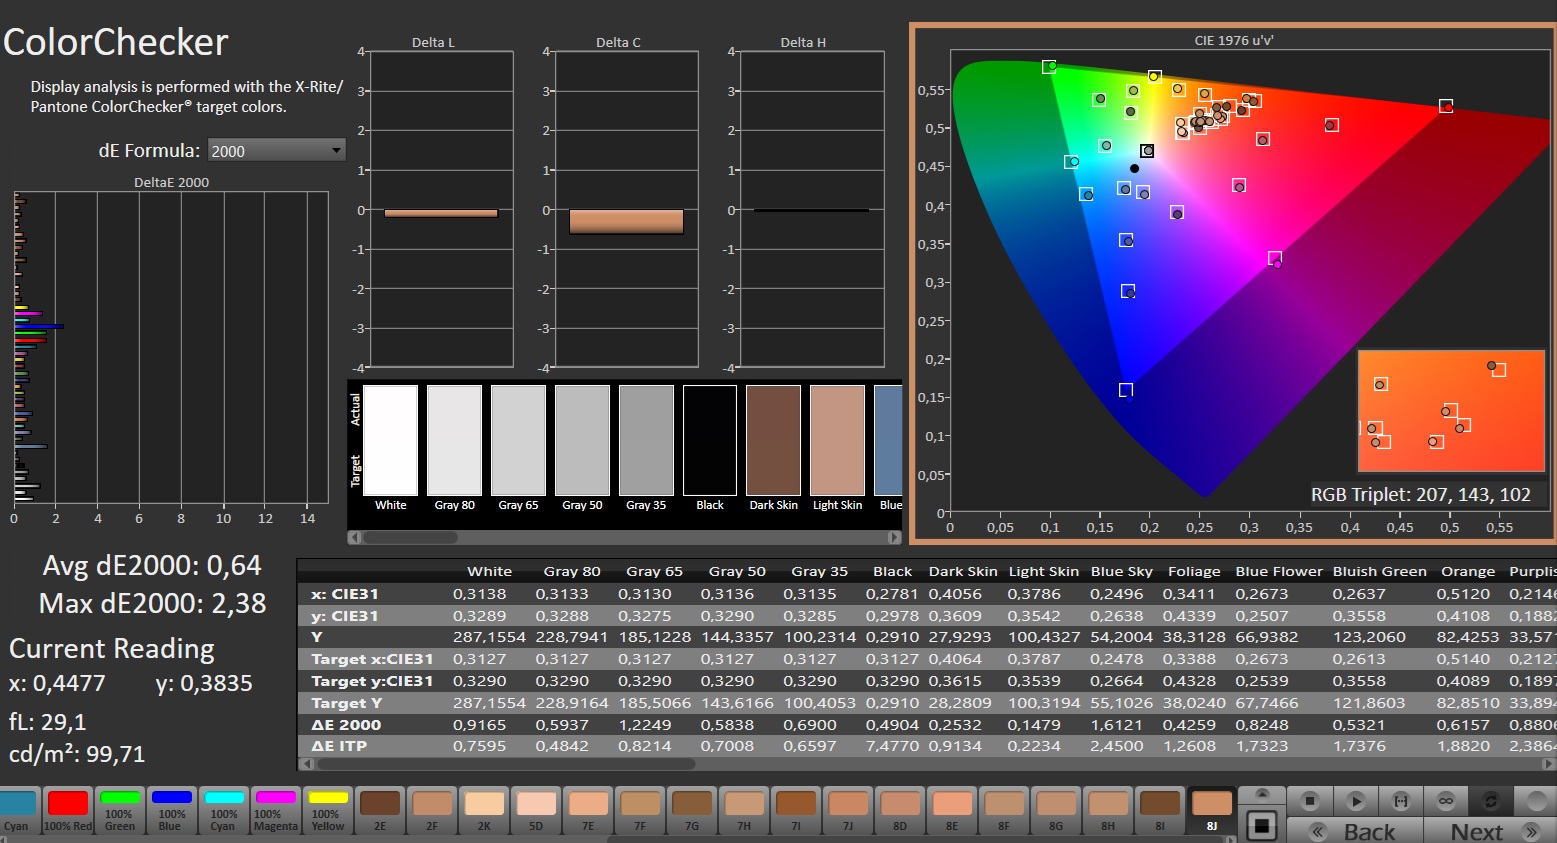
色彩准确度也不是该显示器的强项,至少在出厂设置时不是。不过,经过校准(我们的 ICC 配置文件链接在亮度图的右侧)后,图像的色彩就会变得非常准确。
可视角度和响应时间都达到了 IPS 面板的典型水平。
Display Response Times
| ↔ Response Time Black to White | ||
|---|---|---|
| 9.9 ms ... rise ↗ and fall ↘ combined | ↗ 4.7 ms rise | 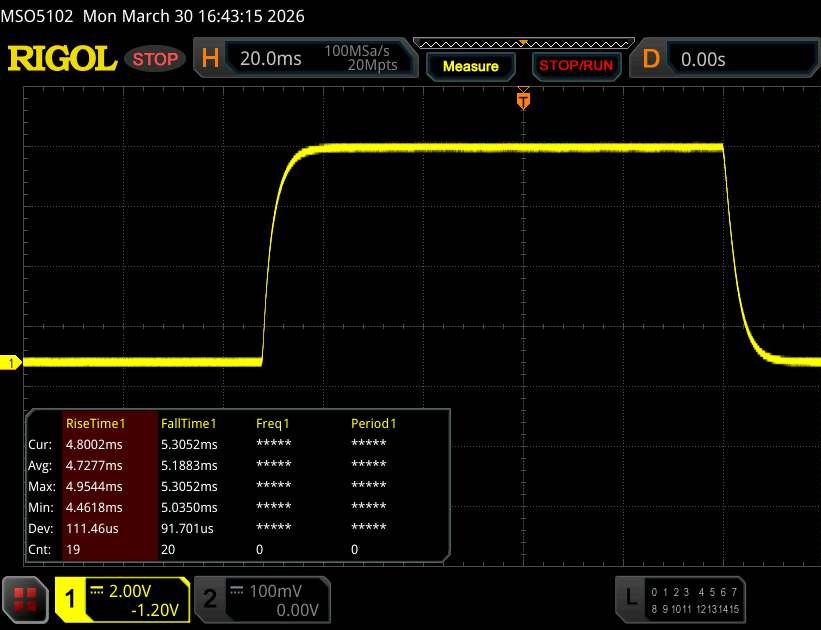 |
| ↘ 5.2 ms fall | ||
| The screen shows fast response rates in our tests and should be suited for gaming. In comparison, all tested devices range from 0.1 (minimum) to 240 (maximum) ms. » 27 % of all devices are better. This means that the measured response time is better than the average of all tested devices (19.8 ms). | ||
| ↔ Response Time 50% Grey to 80% Grey | ||
| 7.6 ms ... rise ↗ and fall ↘ combined | ↗ 3.6 ms rise | 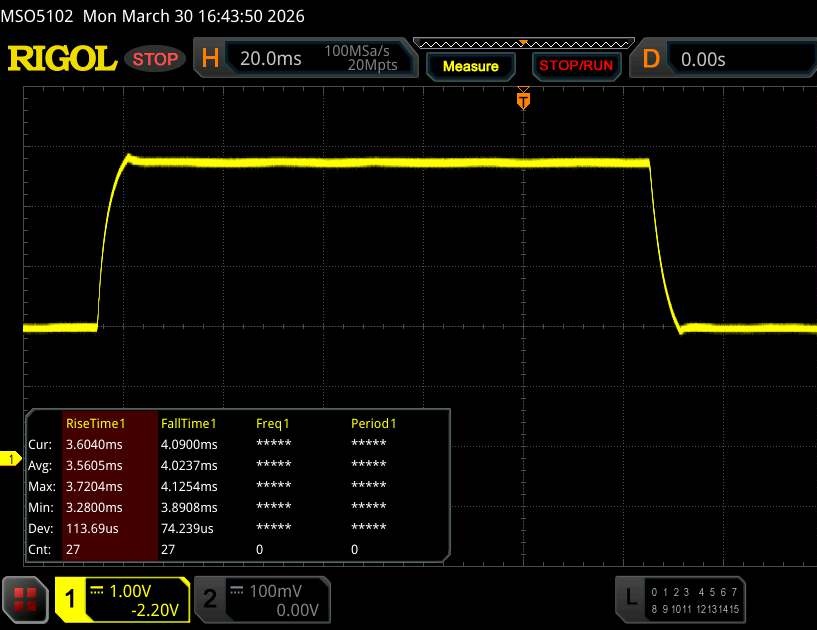 |
| ↘ 4 ms fall | ||
| The screen shows very fast response rates in our tests and should be very well suited for fast-paced gaming. In comparison, all tested devices range from 0.165 (minimum) to 636 (maximum) ms. » 20 % of all devices are better. This means that the measured response time is better than the average of all tested devices (31 ms). | ||
Screen Flickering / PWM (Pulse-Width Modulation)
| Screen flickering / PWM not detected |  | ||
In comparison: 52 % of all tested devices do not use PWM to dim the display. If PWM was detected, an average of 7765 (minimum: 5 - maximum: 343500) Hz was measured. | |||
性能
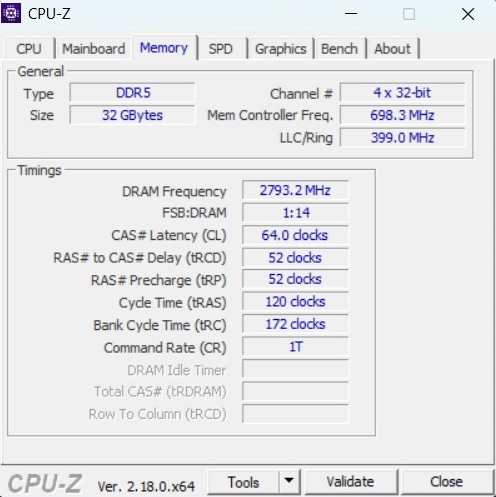
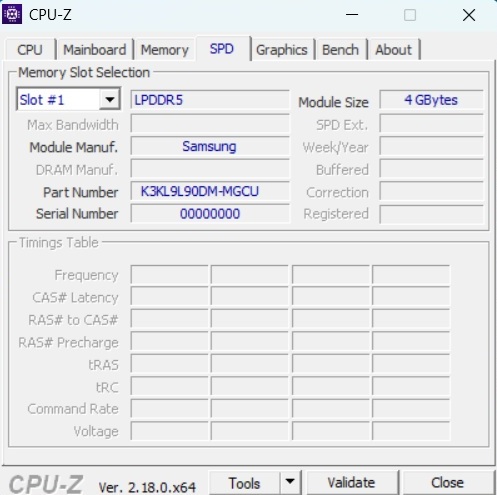
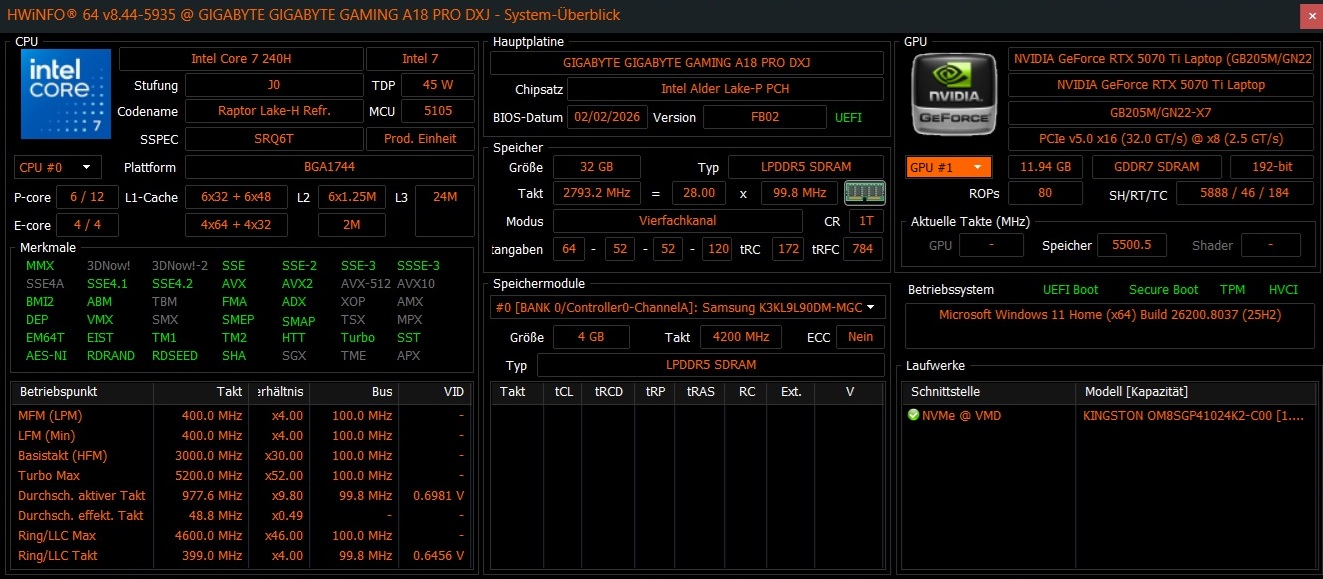
就 CPU 和 GPU 性能而言,Gaming A18 Pro 定位于中端(中上)水平。32 GB 内存足够大多数用户在未来几年使用,1 TB SSD 可以通过免费的 M.2 插槽轻松扩展。
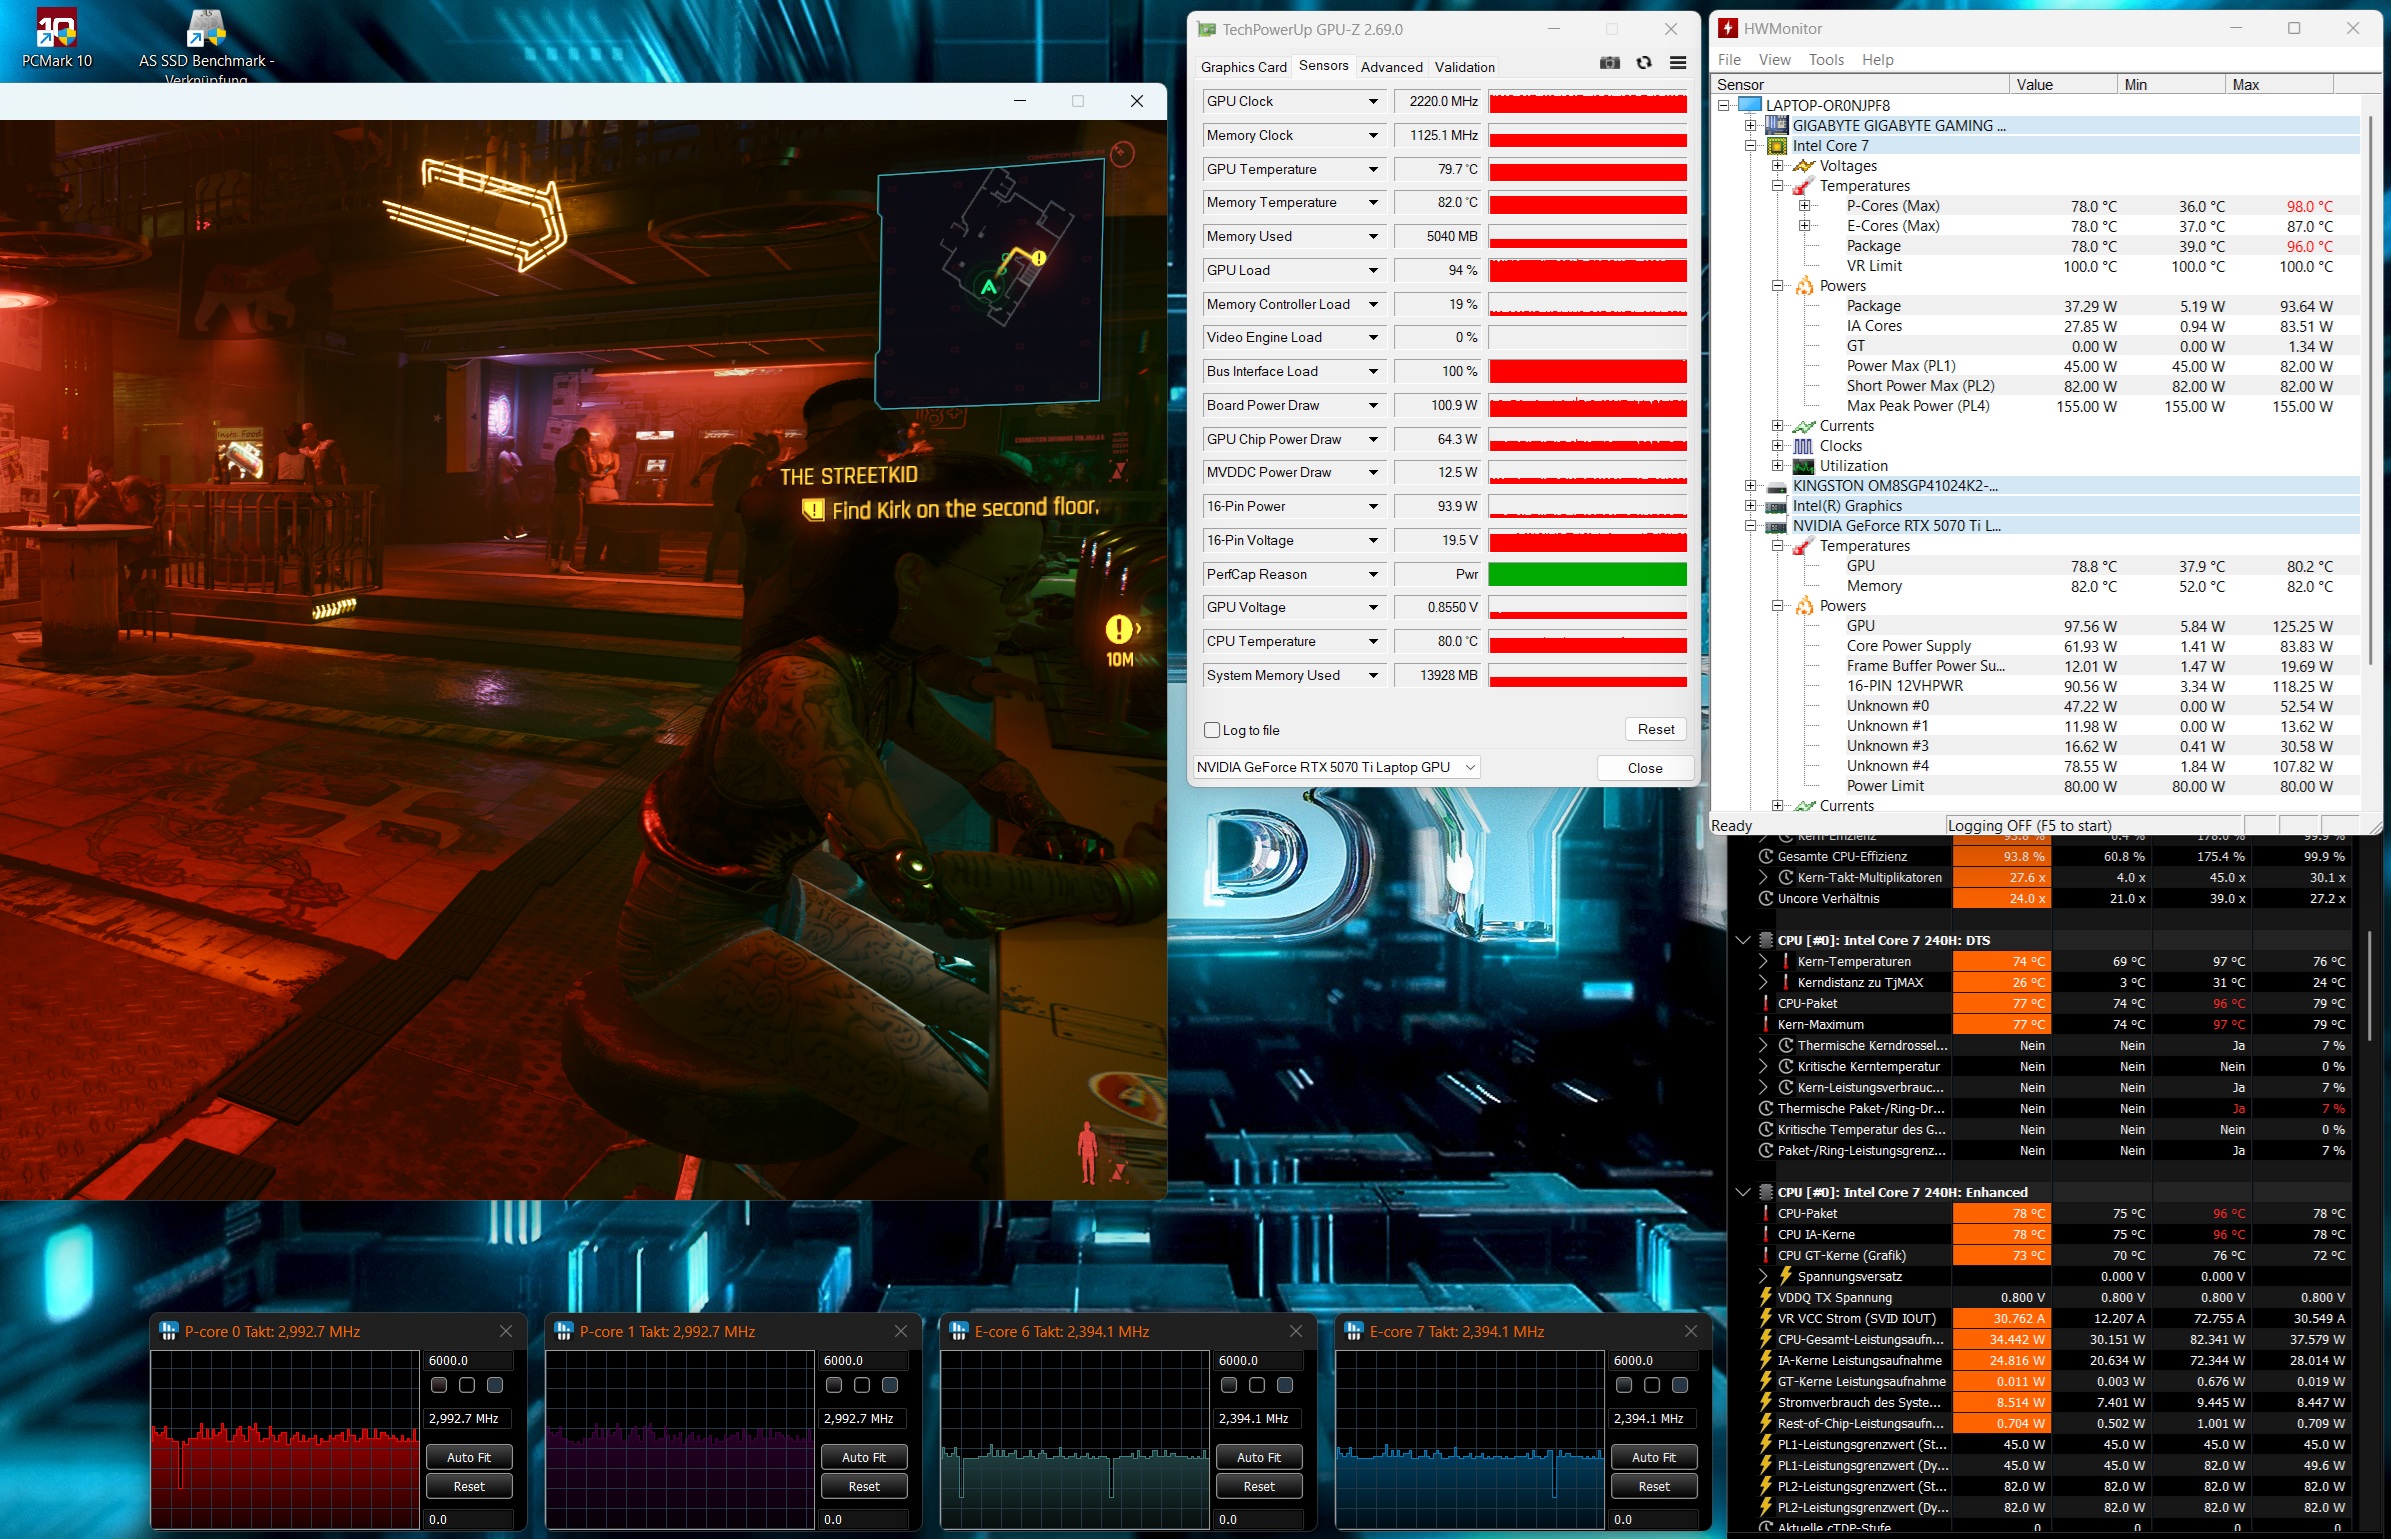
测试条件
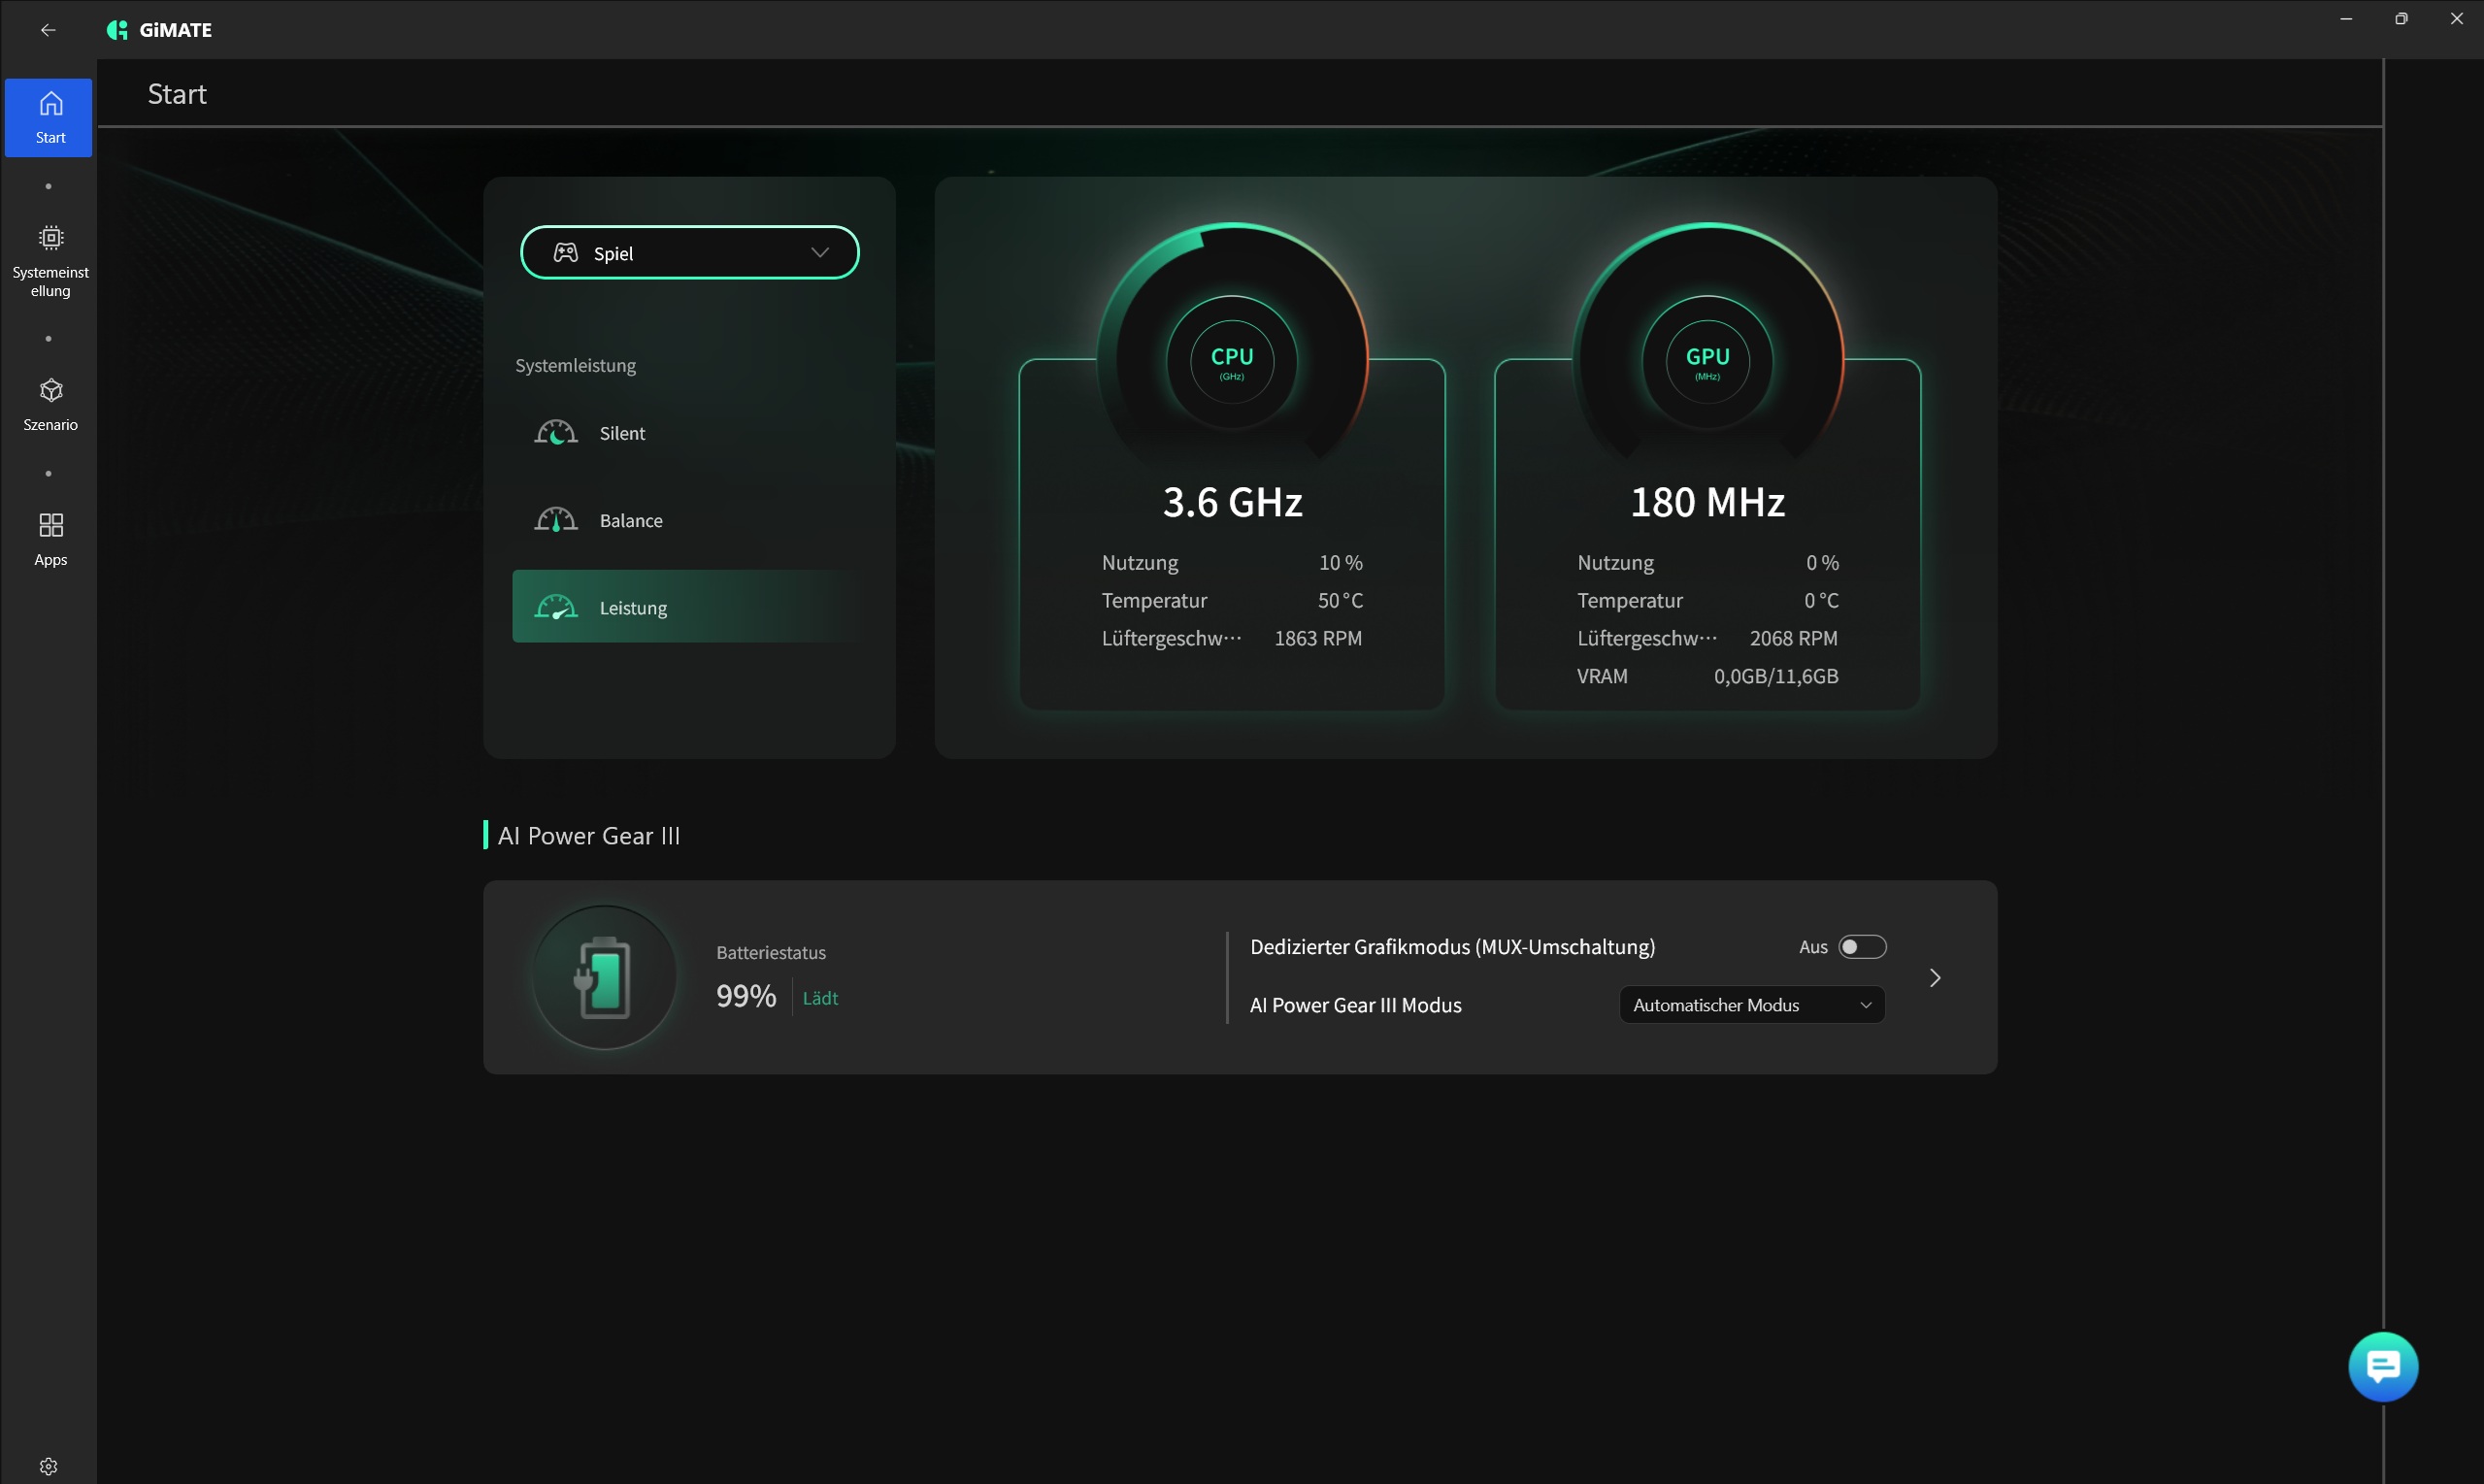
18 英寸显示屏提供五种运行模式,下表对其中三种模式进行了比较。在测量中,我们使用了游戏模式,该模式优先考虑性能,但会增加噪音。
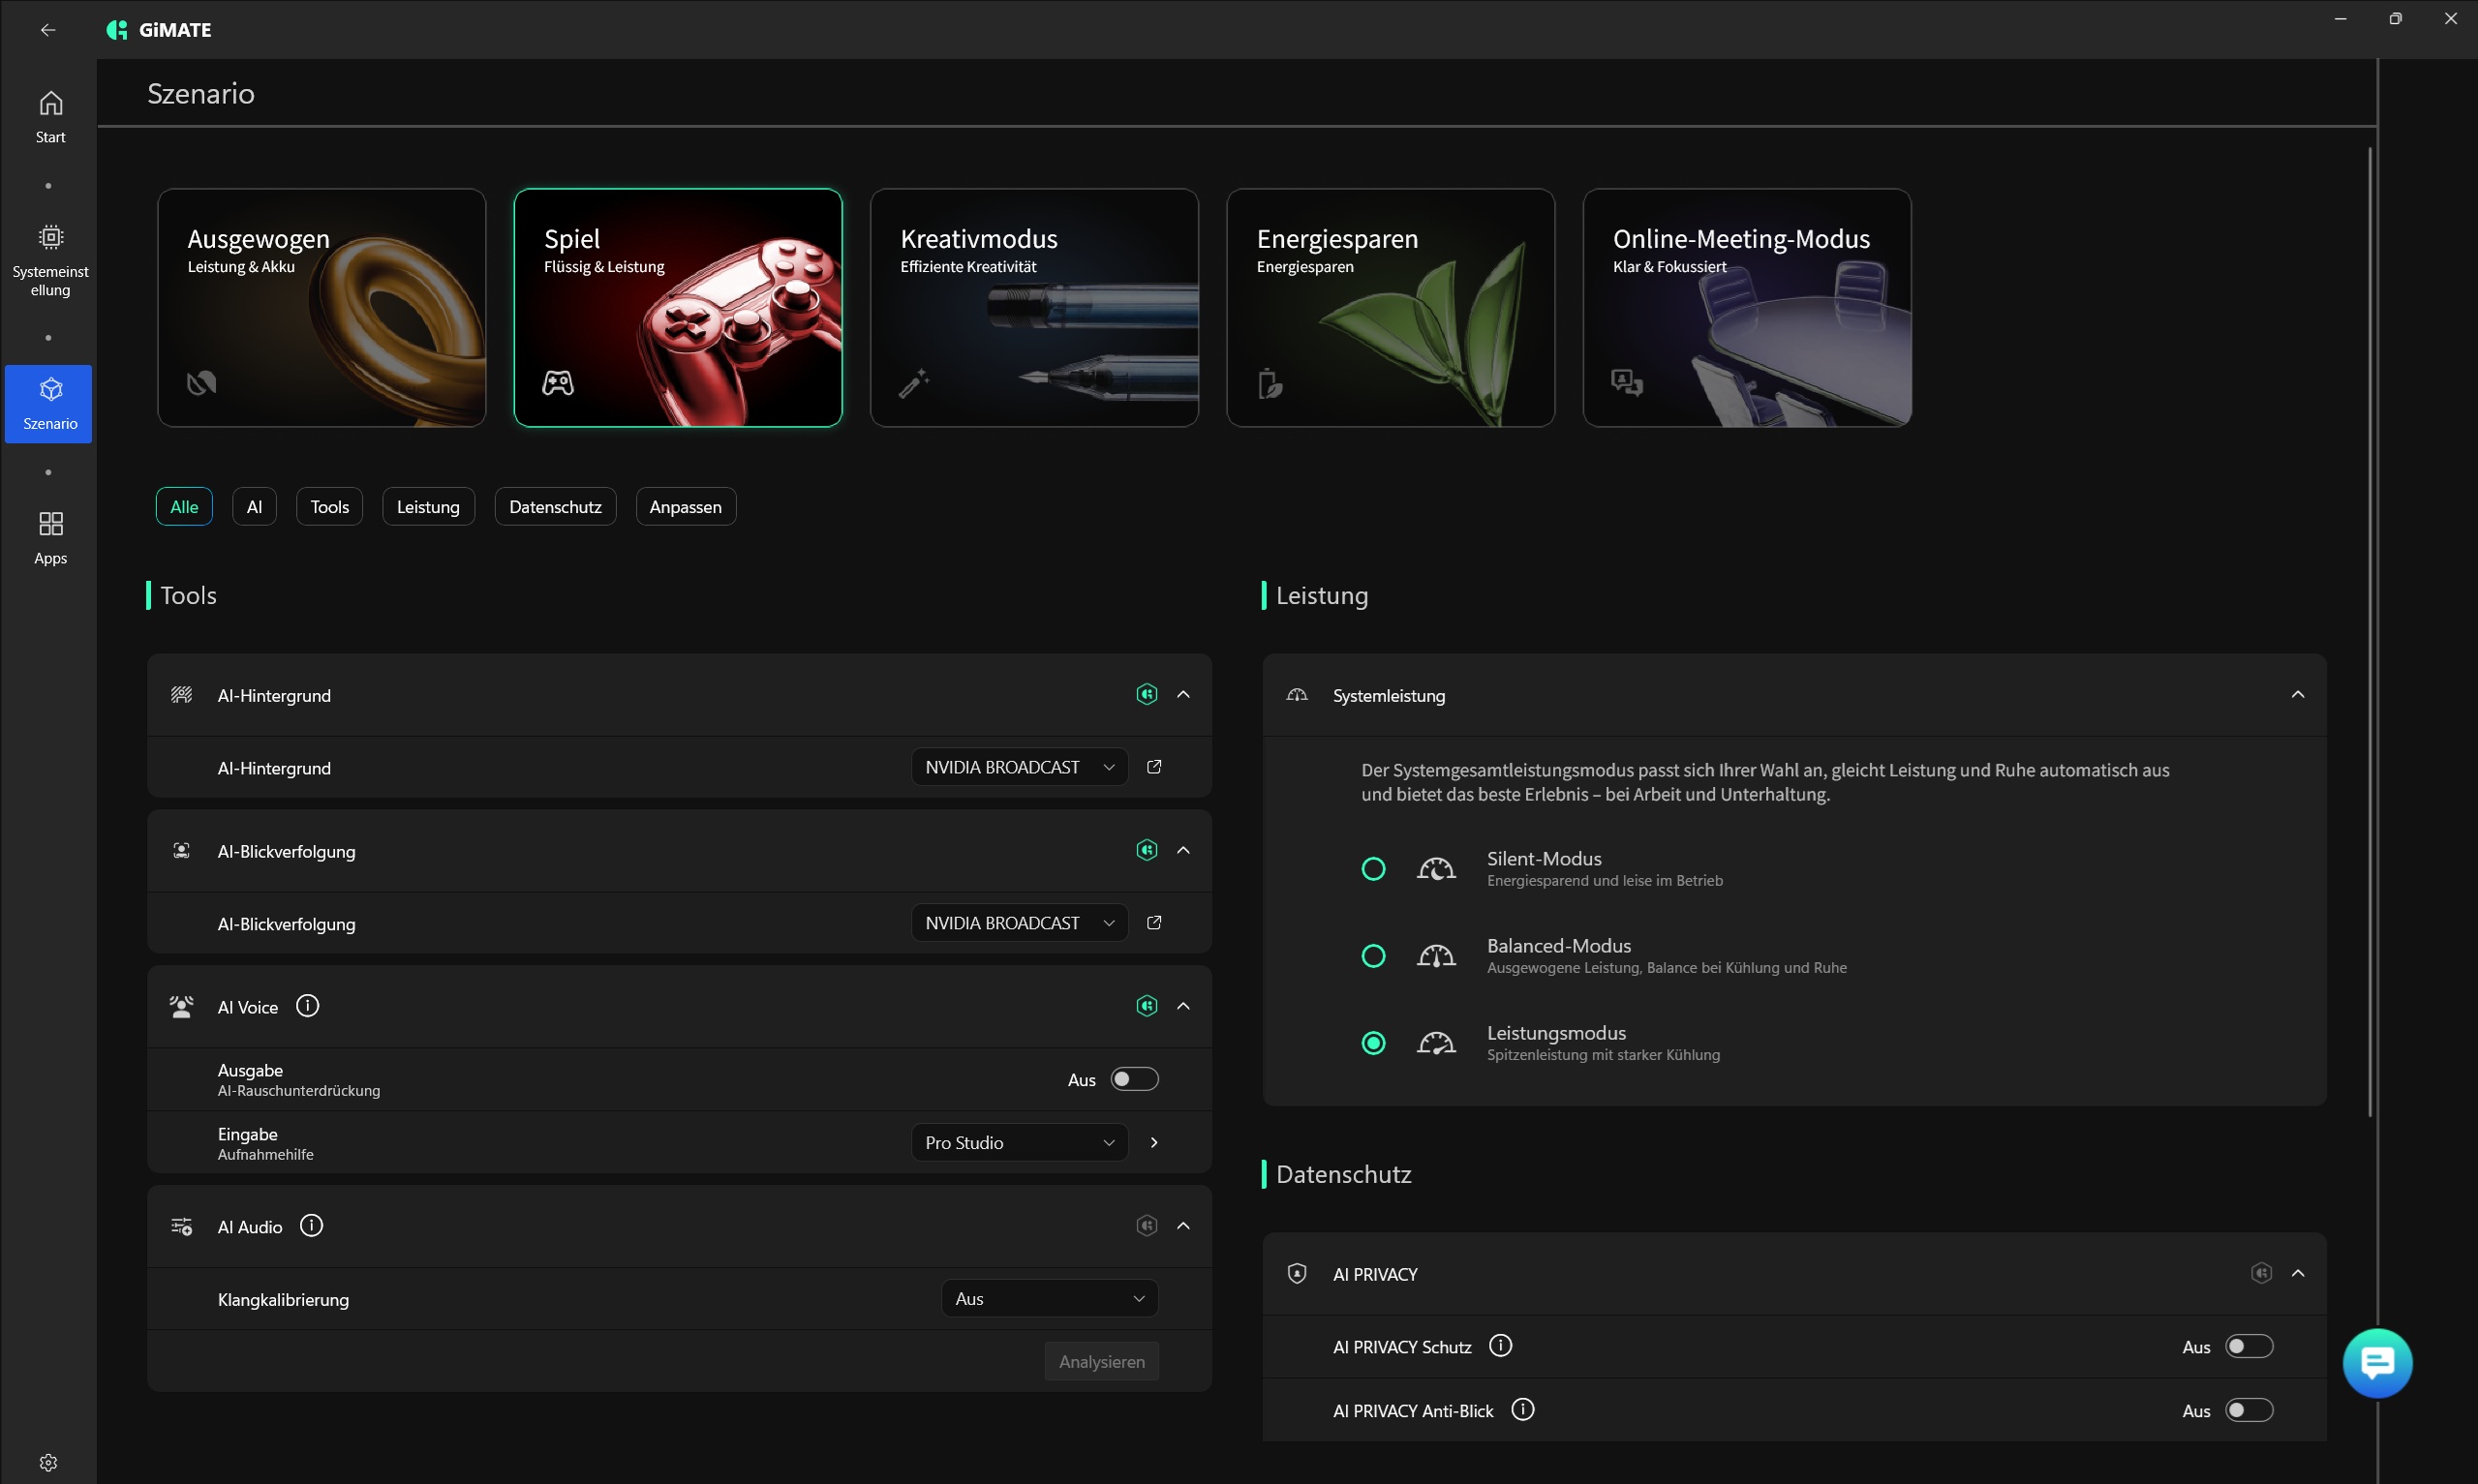
| 模式 | 游戏 | 平衡 | 节能 |
| 赛博朋克 2077 噪音 | 57 dB(A) | 48 dB(A) | 34 dB(A) |
| 赛博朋克 2077 帧率(FHD/超高清) | 107.6 fps | 89 fps | 59.5 fps |
| GPU 功耗 | ~105 W | ~85 W | ~35 W |
| CPU PL1 | 82 W | 55 W | 45 W |
| CPU PL2 | 82 W | 82 W | 60 W |
| Cinebench R15 多重得分 | 2397 分 | 2390 分 | 2155 分 |
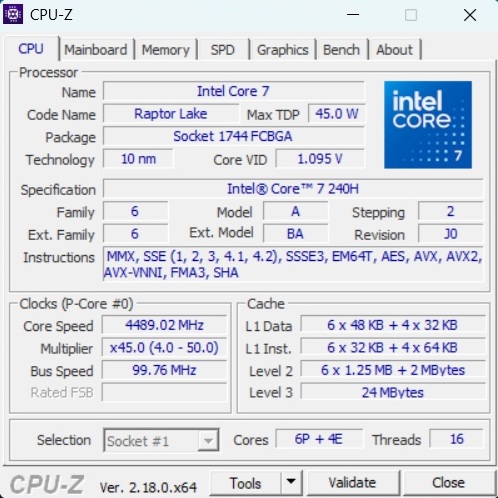
处理器
核心 7 240H 酷睿 7 240H是 Raptor Lake 系列中的一款中端芯片,拥有 6 个超线程性能内核和 4 个效率内核,共 16 个线程。在 CPU 基准测试中,240H 的性能与 AMD 的同类产品基本相当,即 Ryzen 7 260和 Ryzen AI 7 350相比,后者略胜一筹。不过,Gaming A18 Pro 无法与高端处理器(如 酷睿至尊 9 275HX和 Ryzen 9 9955HX等高端处理器竞争。
Cinebench R15 多连续测试
* ... smaller is better
AIDA64: FP32 Ray-Trace | FPU Julia | CPU SHA3 | CPU Queen | FPU SinJulia | FPU Mandel | CPU AES | CPU ZLib | FP64 Ray-Trace | CPU PhotoWorxx | CPU CheckMate
| Performance rating | |
| MSI Vector A18 HX A9W -1! | |
| Lenovo Legion 9 18IAX10 -1! | |
| Average of class Gaming | |
| Asus TUF Gaming A18 FA808UP-S8022W -1! | |
| Acer Nitro 18 AI AN18-61-R10V -1! | |
| Gigabyte Gaming A18 Pro -1! | |
| Average Intel Core 7 240H | |
| AIDA64 / FP32 Ray-Trace | |
| MSI Vector A18 HX A9W (v6.92.6600) | |
| Lenovo Legion 9 18IAX10 (v6.92.6600) | |
| Average of class Gaming (10227 - 85542, n=107, last 2 years) | |
| Acer Nitro 18 AI AN18-61-R10V (v6.92.6600) | |
| Asus TUF Gaming A18 FA808UP-S8022W (v6.92.6600) | |
| Gigabyte Gaming A18 Pro (v8.20.8100) | |
| Average Intel Core 7 240H (11867 - 15972, n=5) | |
| AIDA64 / FPU Julia | |
| MSI Vector A18 HX A9W (v6.92.6600) | |
| Lenovo Legion 9 18IAX10 (v6.92.6600) | |
| Average of class Gaming (51376 - 238426, n=107, last 2 years) | |
| Asus TUF Gaming A18 FA808UP-S8022W (v6.92.6600) | |
| Acer Nitro 18 AI AN18-61-R10V (v6.92.6600) | |
| Gigabyte Gaming A18 Pro (v8.20.8100) | |
| Average Intel Core 7 240H (59260 - 80238, n=5) | |
| AIDA64 / CPU SHA3 | |
| Lenovo Legion 9 18IAX10 (v6.92.6600) | |
| MSI Vector A18 HX A9W (v6.92.6600) | |
| Average of class Gaming (2180 - 9817, n=107, last 2 years) | |
| Asus TUF Gaming A18 FA808UP-S8022W (v6.92.6600) | |
| Acer Nitro 18 AI AN18-61-R10V (v6.92.6600) | |
| Gigabyte Gaming A18 Pro (v8.20.8100) | |
| Average Intel Core 7 240H (2455 - 3287, n=5) | |
| AIDA64 / CPU Queen | |
| MSI Vector A18 HX A9W (v6.92.6600) | |
| Lenovo Legion 9 18IAX10 (v6.92.6600) | |
| Asus TUF Gaming A18 FA808UP-S8022W (v6.92.6600) | |
| Average of class Gaming (49785 - 173351, n=95, last 2 years) | |
| Average Intel Core 7 240H (75356 - 86602, n=3) | |
| Acer Nitro 18 AI AN18-61-R10V (v6.92.6600) | |
| AIDA64 / FPU SinJulia | |
| MSI Vector A18 HX A9W (v6.92.6600) | |
| Asus TUF Gaming A18 FA808UP-S8022W (v6.92.6600) | |
| Average of class Gaming (4424 - 33636, n=107, last 2 years) | |
| Lenovo Legion 9 18IAX10 (v6.92.6600) | |
| Acer Nitro 18 AI AN18-61-R10V (v6.92.6600) | |
| Gigabyte Gaming A18 Pro (v8.20.8100) | |
| Average Intel Core 7 240H (7777 - 9366, n=5) | |
| AIDA64 / FPU Mandel | |
| MSI Vector A18 HX A9W (v6.92.6600) | |
| Lenovo Legion 9 18IAX10 (v6.92.6600) | |
| Average of class Gaming (25115 - 128721, n=107, last 2 years) | |
| Asus TUF Gaming A18 FA808UP-S8022W (v6.92.6600) | |
| Acer Nitro 18 AI AN18-61-R10V (v6.92.6600) | |
| Gigabyte Gaming A18 Pro (v8.20.8100) | |
| Average Intel Core 7 240H (29381 - 39967, n=5) | |
| AIDA64 / CPU AES | |
| Lenovo Legion 9 18IAX10 (v6.92.6600) | |
| MSI Vector A18 HX A9W (v6.92.6600) | |
| Average of class Gaming (39258 - 247074, n=107, last 2 years) | |
| Asus TUF Gaming A18 FA808UP-S8022W (v6.92.6600) | |
| Acer Nitro 18 AI AN18-61-R10V (v6.92.6600) | |
| Gigabyte Gaming A18 Pro (v8.20.8100) | |
| Average Intel Core 7 240H (50528 - 67855, n=5) | |
| AIDA64 / CPU ZLib | |
| MSI Vector A18 HX A9W (v6.92.6600) | |
| Lenovo Legion 9 18IAX10 (v6.92.6600) | |
| Average of class Gaming (574 - 2531, n=107, last 2 years) | |
| Acer Nitro 18 AI AN18-61-R10V (v6.92.6600) | |
| Asus TUF Gaming A18 FA808UP-S8022W (v6.92.6600) | |
| Gigabyte Gaming A18 Pro (v8.20.8100) | |
| Average Intel Core 7 240H (725 - 951, n=5) | |
| AIDA64 / FP64 Ray-Trace | |
| MSI Vector A18 HX A9W (v6.92.6600) | |
| Lenovo Legion 9 18IAX10 (v6.92.6600) | |
| Average of class Gaming (5509 - 45446, n=107, last 2 years) | |
| Asus TUF Gaming A18 FA808UP-S8022W (v6.92.6600) | |
| Acer Nitro 18 AI AN18-61-R10V (v6.92.6600) | |
| Gigabyte Gaming A18 Pro (v8.20.8100) | |
| Average Intel Core 7 240H (6389 - 8569, n=5) | |
| AIDA64 / CPU PhotoWorxx | |
| Lenovo Legion 9 18IAX10 (v6.92.6600) | |
| Gigabyte Gaming A18 Pro (v8.20.8100) | |
| Average of class Gaming (12271 - 89891, n=107, last 2 years) | |
| MSI Vector A18 HX A9W (v6.92.6600) | |
| Asus TUF Gaming A18 FA808UP-S8022W (v6.92.6600) | |
| Average Intel Core 7 240H (21710 - 44874, n=5) | |
| Acer Nitro 18 AI AN18-61-R10V (v6.92.6600) | |
| AIDA64 / CPU CheckMate | |
| Average of class Gaming (2930 - 11788, n=11, last 2 years) | |
| Average Intel Core 7 240H (2930 - 2938, n=2) | |
| Gigabyte Gaming A18 Pro (v8.20.8100) | |
系统性能
就整体系统性能而言,技嘉这款机型的性能介于 Nitro 18 AI 和 TUF Gaming A18 之间,成绩相当不错。
PCMark 10: Score | Essentials | Productivity | Digital Content Creation
CrossMark: Overall | Productivity | Creativity | Responsiveness
WebXPRT 3: Overall
WebXPRT 4: Overall
Mozilla Kraken 1.1: Total
| Performance rating | |
| MSI Vector A18 HX A9W | |
| Lenovo Legion 9 18IAX10 | |
| Acer Nitro 18 AI AN18-61-R10V -1! | |
| Average of class Gaming | |
| Gigabyte Gaming A18 Pro | |
| Average Intel Core 7 240H, NVIDIA GeForce RTX 5070 Ti Laptop | |
| Asus TUF Gaming A18 FA808UP-S8022W | |
| PCMark 10 / Score | |
| MSI Vector A18 HX A9W | |
| Acer Nitro 18 AI AN18-61-R10V | |
| Average of class Gaming (5828 - 11574, n=95, last 2 years) | |
| Average Intel Core 7 240H, NVIDIA GeForce RTX 5070 Ti Laptop (8234 - 8407, n=2) | |
| Gigabyte Gaming A18 Pro | |
| Lenovo Legion 9 18IAX10 | |
| Asus TUF Gaming A18 FA808UP-S8022W | |
| PCMark 10 / Essentials | |
| Lenovo Legion 9 18IAX10 | |
| MSI Vector A18 HX A9W | |
| Average of class Gaming (8810 - 12600, n=99, last 2 years) | |
| Acer Nitro 18 AI AN18-61-R10V | |
| Asus TUF Gaming A18 FA808UP-S8022W | |
| Gigabyte Gaming A18 Pro | |
| Average Intel Core 7 240H, NVIDIA GeForce RTX 5070 Ti Laptop (9053 - 9807, n=2) | |
| PCMark 10 / Productivity | |
| Acer Nitro 18 AI AN18-61-R10V | |
| Gigabyte Gaming A18 Pro | |
| Average Intel Core 7 240H, NVIDIA GeForce RTX 5070 Ti Laptop (13391 - 13612, n=2) | |
| Average of class Gaming (6845 - 21327, n=97, last 2 years) | |
| MSI Vector A18 HX A9W | |
| Lenovo Legion 9 18IAX10 | |
| Asus TUF Gaming A18 FA808UP-S8022W | |
| PCMark 10 / Digital Content Creation | |
| MSI Vector A18 HX A9W | |
| Average of class Gaming (7602 - 19657, n=97, last 2 years) | |
| Asus TUF Gaming A18 FA808UP-S8022W | |
| Acer Nitro 18 AI AN18-61-R10V | |
| Average Intel Core 7 240H, NVIDIA GeForce RTX 5070 Ti Laptop (11348 - 13301, n=2) | |
| Gigabyte Gaming A18 Pro | |
| Lenovo Legion 9 18IAX10 | |
| CrossMark / Overall | |
| Lenovo Legion 9 18IAX10 | |
| MSI Vector A18 HX A9W | |
| Average of class Gaming (1366 - 2409, n=96, last 2 years) | |
| Gigabyte Gaming A18 Pro | |
| Average Intel Core 7 240H, NVIDIA GeForce RTX 5070 Ti Laptop (1740 - 1852, n=2) | |
| Asus TUF Gaming A18 FA808UP-S8022W | |
| Acer Nitro 18 AI AN18-61-R10V | |
| CrossMark / Productivity | |
| Lenovo Legion 9 18IAX10 | |
| MSI Vector A18 HX A9W | |
| Average of class Gaming (1386 - 2254, n=96, last 2 years) | |
| Gigabyte Gaming A18 Pro | |
| Average Intel Core 7 240H, NVIDIA GeForce RTX 5070 Ti Laptop (1613 - 1732, n=2) | |
| Asus TUF Gaming A18 FA808UP-S8022W | |
| Acer Nitro 18 AI AN18-61-R10V | |
| CrossMark / Creativity | |
| MSI Vector A18 HX A9W | |
| Lenovo Legion 9 18IAX10 | |
| Average of class Gaming (1343 - 2729, n=96, last 2 years) | |
| Gigabyte Gaming A18 Pro | |
| Asus TUF Gaming A18 FA808UP-S8022W | |
| Average Intel Core 7 240H, NVIDIA GeForce RTX 5070 Ti Laptop (1925 - 1996, n=2) | |
| Acer Nitro 18 AI AN18-61-R10V | |
| CrossMark / Responsiveness | |
| Lenovo Legion 9 18IAX10 | |
| Gigabyte Gaming A18 Pro | |
| Average Intel Core 7 240H, NVIDIA GeForce RTX 5070 Ti Laptop (1611 - 1809, n=2) | |
| Average of class Gaming (1226 - 2334, n=96, last 2 years) | |
| MSI Vector A18 HX A9W | |
| Asus TUF Gaming A18 FA808UP-S8022W | |
| Acer Nitro 18 AI AN18-61-R10V | |
| WebXPRT 3 / Overall | |
| Lenovo Legion 9 18IAX10 | |
| MSI Vector A18 HX A9W | |
| Average of class Gaming (220 - 532, n=100, last 2 years) | |
| Acer Nitro 18 AI AN18-61-R10V | |
| Asus TUF Gaming A18 FA808UP-S8022W | |
| Average Intel Core 7 240H, NVIDIA GeForce RTX 5070 Ti Laptop (257 - 264, n=2) | |
| Gigabyte Gaming A18 Pro | |
| WebXPRT 4 / Overall | |
| Lenovo Legion 9 18IAX10 | |
| MSI Vector A18 HX A9W | |
| Average of class Gaming (165 - 354, n=101, last 2 years) | |
| Acer Nitro 18 AI AN18-61-R10V | |
| Asus TUF Gaming A18 FA808UP-S8022W | |
| Gigabyte Gaming A18 Pro | |
| Average Intel Core 7 240H, NVIDIA GeForce RTX 5070 Ti Laptop (238 - 239, n=2) | |
| Mozilla Kraken 1.1 / Total | |
| Asus TUF Gaming A18 FA808UP-S8022W | |
| Average Intel Core 7 240H, NVIDIA GeForce RTX 5070 Ti Laptop (552 - 555, n=2) | |
| Gigabyte Gaming A18 Pro | |
| Average of class Gaming (391 - 590, n=105, last 2 years) | |
| Lenovo Legion 9 18IAX10 | |
| MSI Vector A18 HX A9W | |
* ... smaller is better
| PCMark 10 Score | 8234 points | |
Help | ||
| AIDA64 / Memory Copy | |
| Lenovo Legion 9 18IAX10 | |
| Average of class Gaming (21750 - 129946, n=107, last 2 years) | |
| Asus TUF Gaming A18 FA808UP-S8022W | |
| Gigabyte Gaming A18 Pro | |
| MSI Vector A18 HX A9W | |
| Average Intel Core 7 240H (34965 - 69215, n=5) | |
| Acer Nitro 18 AI AN18-61-R10V | |
| AIDA64 / Memory Read | |
| Lenovo Legion 9 18IAX10 | |
| Average of class Gaming (22956 - 118858, n=107, last 2 years) | |
| MSI Vector A18 HX A9W | |
| Gigabyte Gaming A18 Pro | |
| Average Intel Core 7 240H (39706 - 71870, n=5) | |
| Asus TUF Gaming A18 FA808UP-S8022W | |
| Acer Nitro 18 AI AN18-61-R10V | |
| AIDA64 / Memory Write | |
| Lenovo Legion 9 18IAX10 | |
| Asus TUF Gaming A18 FA808UP-S8022W | |
| Gigabyte Gaming A18 Pro | |
| Average of class Gaming (22297 - 135096, n=107, last 2 years) | |
| MSI Vector A18 HX A9W | |
| Average Intel Core 7 240H (33560 - 80488, n=5) | |
| Acer Nitro 18 AI AN18-61-R10V | |
| AIDA64 / Memory Latency | |
| Gigabyte Gaming A18 Pro | |
| Lenovo Legion 9 18IAX10 | |
| Average of class Gaming (75.3 - 259, n=107, last 2 years) | |
| Average Intel Core 7 240H (97.1 - 125.6, n=5) | |
| MSI Vector A18 HX A9W | |
| Asus TUF Gaming A18 FA808UP-S8022W | |
| Acer Nitro 18 AI AN18-61-R10V | |
* ... smaller is better
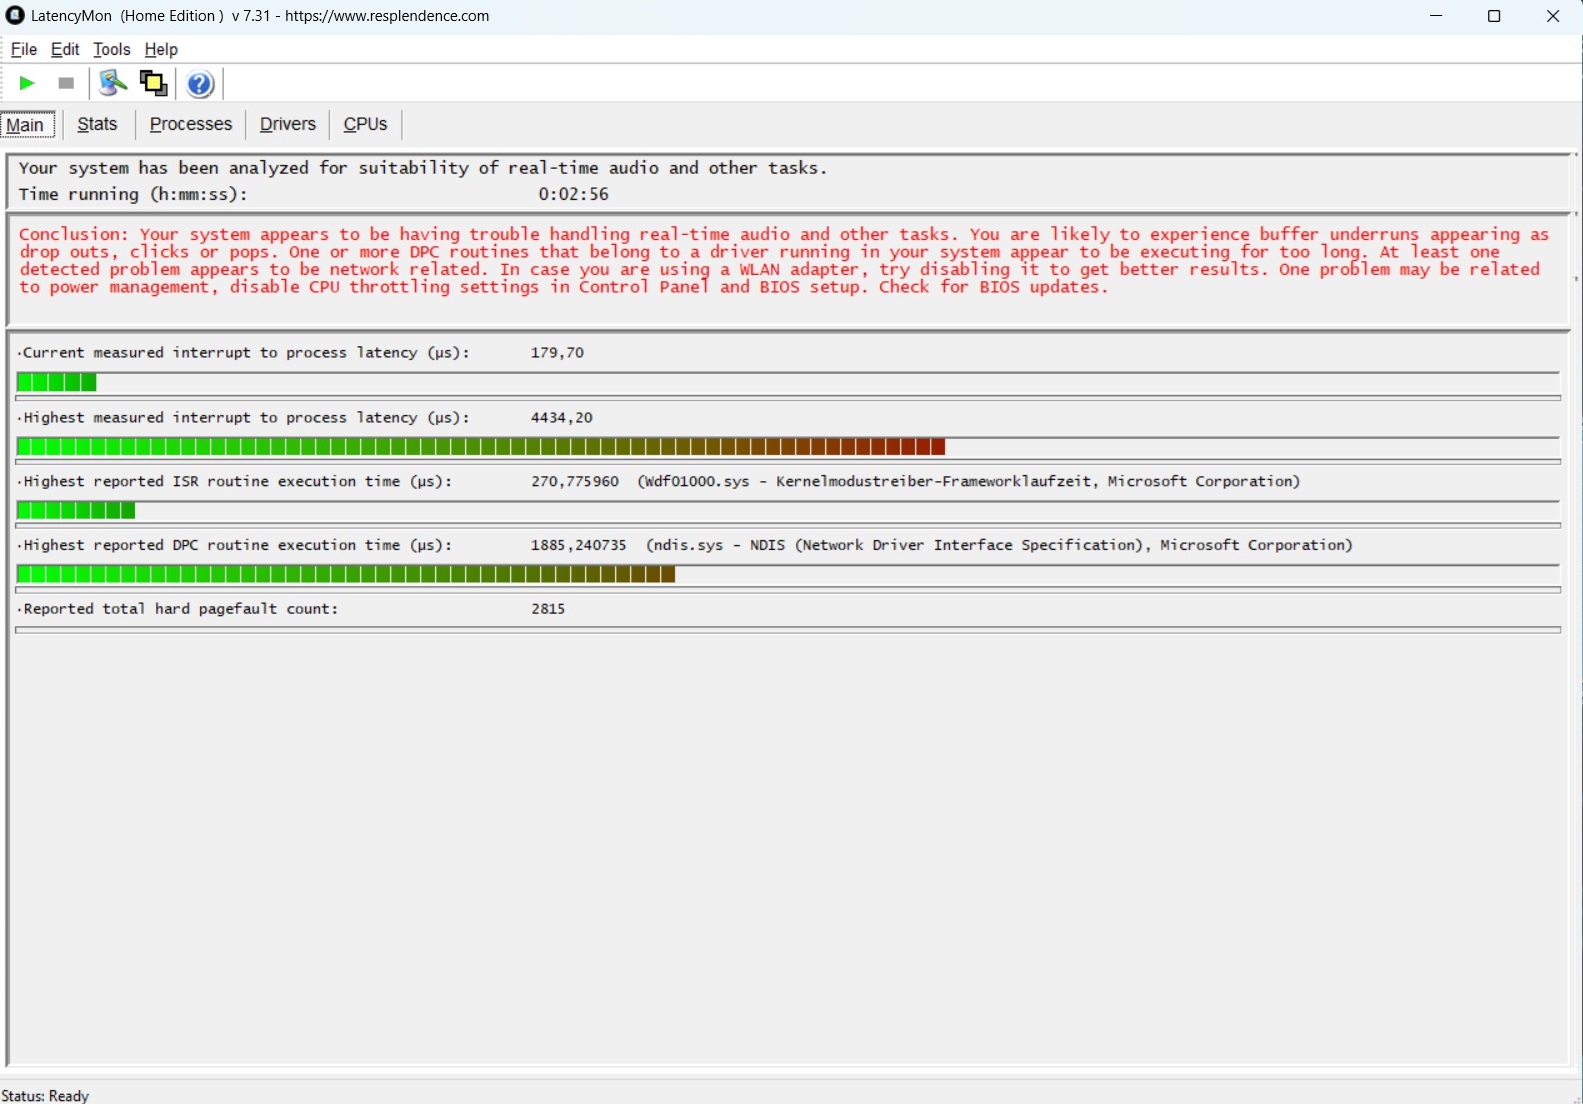
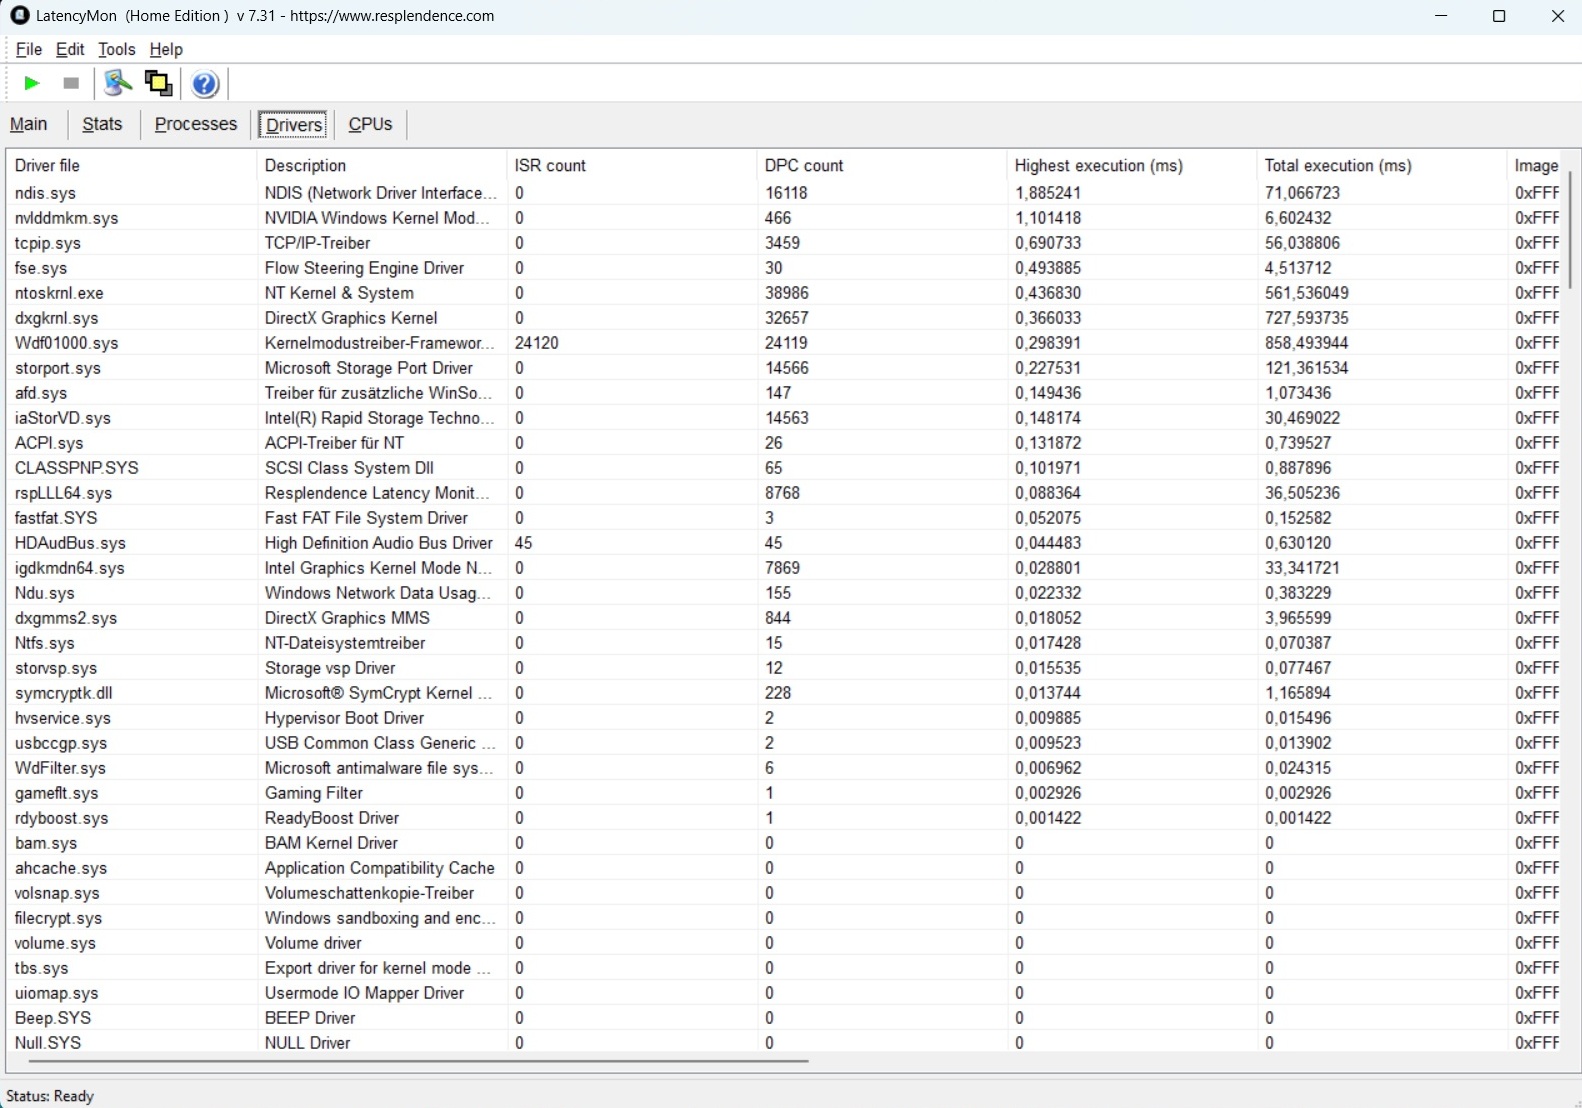
DPC 延迟
与许多笔记本电脑一样,延迟问题有待改进。LatencyMon 工具可显示某些应用或场景中的潜在问题(如短暂掉线)。
| DPC Latencies / LatencyMon - interrupt to process latency (max), Web, Youtube, Prime95 | |
| Acer Nitro 18 AI AN18-61-R10V | |
| Gigabyte Gaming A18 Pro | |
| Lenovo Legion 9 18IAX10 | |
| Asus TUF Gaming A18 FA808UP-S8022W | |
| MSI Vector A18 HX A9W | |
* ... smaller is better
存储设备
遗憾的是,内置的 1 TB SSD 并不完全稳定。在我们的循环测试中,我们观察到在某一点上有适度的波动,而大多数竞争对手的情况并非如此。不过,金士顿硬盘的基准性能相对较强,尤其是在读取操作方面。

* ... smaller is better
固态硬盘节流检查:DiskSpd 读取循环,队列深度 8
图形处理器性能
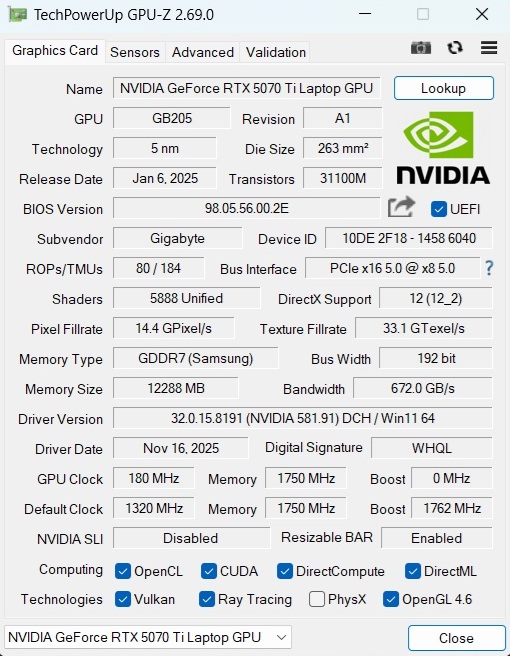
移动版GeForce RTX 5070 Ti 拥有 12GB GDDR7 VRAM 和 5,888 个着色器单元,在中端和高端市场之间游刃有余。根据 3DMark,其 GPU 性能与 RTX 5070 Ti 的既定平均值基本一致,仅有细微偏差。与之竞争的微星 Vector A18 HX 尽管运行噪音水平较低,但速度却要快 10%以上。
| 3DMark 11 Performance | 38610 points | |
| 3DMark Fire Strike Score | 29047 points | |
| 3DMark Time Spy Score | 14753 points | |
Help | ||
* ... smaller is better
游戏性能
虽然在中等分辨率或设置下,酷睿 7 240H 偶尔会成为限制因素,尤其是在老游戏中,但现代高要求游戏几乎完全依赖 GPU。除了优化较差的游戏,如 边境之地 4等优化较差的游戏外,大多数游戏都能以 QHD 分辨率、高至最高设置流畅运行。像往常一样,升频可以在需要时提供额外的空间。例如,使用 DLSS Balanced,我们在《死亡搁浅 2》(2560 × 1440,极高预设)中实现了 50 帧/秒,而不是 44 帧/秒。启用 4 倍帧生成后,平均帧率提高到了非常流畅的 149 帧/秒。
| GTA V - 1920x1080 Highest AA:4xMSAA + FX AF:16x | |
| Average NVIDIA GeForce RTX 5070 Ti Laptop (98 - 166.3, n=14) | |
| Average of class Gaming (48.3 - 186.9, n=98, last 2 years) | |
| Acer Nitro 18 AI AN18-61-R10V | |
| Asus TUF Gaming A18 FA808UP-S8022W | |
| Gigabyte Gaming A18 Pro | |
| Final Fantasy XV Benchmark - 1920x1080 High Quality | |
| Lenovo Legion 9 18IAX10 | |
| MSI Vector A18 HX A9W | |
| Average NVIDIA GeForce RTX 5070 Ti Laptop (108.9 - 181.4, n=15) | |
| Average of class Gaming (41 - 215, n=99, last 2 years) | |
| Asus TUF Gaming A18 FA808UP-S8022W | |
| Gigabyte Gaming A18 Pro | |
| Strange Brigade - 1920x1080 ultra AA:ultra AF:16 | |
| Lenovo Legion 9 18IAX10 | |
| MSI Vector A18 HX A9W | |
| Average NVIDIA GeForce RTX 5070 Ti Laptop (136.4 - 353, n=12) | |
| Average of class Gaming (76.3 - 456, n=89, last 2 years) | |
| Gigabyte Gaming A18 Pro | |
| Asus TUF Gaming A18 FA808UP-S8022W | |
| low | med. | high | ultra | QHD | |
|---|---|---|---|---|---|
| GTA V (2015) | 167.8 | 153.8 | 102.7 | ||
| Dota 2 Reborn (2015) | 130.8 | 122.3 | 115.5 | ||
| Final Fantasy XV Benchmark (2018) | 123.2 | 111.3 | |||
| X-Plane 11.11 (2018) | 93.9 | 79.3 | |||
| Strange Brigade (2018) | 328 | 301 | 279 | ||
| Baldur's Gate 3 (2023) | 146.1 | 128.3 | 125.2 | ||
| Cyberpunk 2077 (2023) | 135.9 | 119.7 | 107.6 | ||
| Monster Hunter Wilds (2025) | 63.8 | 63.2 | 56 | 48.8 | |
| Borderlands 4 (2025) | 63.3 | 55.4 | 34.5 | 23.9 | |
| The Outer Worlds 2 (2025) | 79.6 | 69.8 | 53.9 | 36.1 | |
| ARC Raiders (2025) | 155.7 | 129.2 | 89.5 | 64 | |
| Anno 117: Pax Romana (2025) | 99 | 74.6 | 42.3 | 30.3 | |
| Resident Evil Requiem (2026) | 93.1 | 90.9 | 60.1 | 40.4 | |
| Death Stranding 2 (2026) | 64.7 | 62.8 | 49.9 | 43.8 | |
| Crimson Desert (2026) | 72.9 | 70.1 | 66.1 | 52.1 |
| Resident Evil Requiem | |
| 2560x1440 Max Settings + High Ray Tracing (no upscaling) | |
| Tuxedo Stellaris 16 | |
| Average NVIDIA GeForce RTX 5070 Ti Laptop (40.4 - 42.1, n=2) | |
| Gigabyte Gaming A18 Pro | |
| Average of class Gaming (26.6 - 42.1, n=3, last 2 years) | |
| Acer Nitro 18 AI AN18-61-R10V | |
| 1920x1080 Max Settings + High Ray Tracing (no upscaling) | |
| Tuxedo Stellaris 16 | |
| Average NVIDIA GeForce RTX 5070 Ti Laptop (60.1 - 65.4, n=2) | |
| Gigabyte Gaming A18 Pro | |
| Average of class Gaming (47.7 - 65.4, n=4, last 2 years) | |
| Acer Nitro 18 AI AN18-61-R10V | |
| Crimson Desert | |
| 2560x1440 Cinematic Preset | |
| Tuxedo Stellaris 16 | |
| Average NVIDIA GeForce RTX 5070 Ti Laptop (52.1 - 60.3, n=2) | |
| Average of class Gaming (52.1 - 60.3, n=2, last 2 years) | |
| Gigabyte Gaming A18 Pro | |
| 1920x1080 Cinematic Preset | |
| Tuxedo Stellaris 16 | |
| Average NVIDIA GeForce RTX 5070 Ti Laptop (66.1 - 78, n=2) | |
| Average of class Gaming (60.1 - 78, n=3, last 2 years) | |
| Gigabyte Gaming A18 Pro | |
| Death Stranding 2 | |
| 2560x1440 Very High Preset | |
| Tuxedo Stellaris 16 | |
| Average NVIDIA GeForce RTX 5070 Ti Laptop (43.8 - 56.6, n=2) | |
| Gigabyte Gaming A18 Pro | |
| Average of class Gaming (5.49 - 56.6, n=3, last 2 years) | |
| 1920x1080 Very High Preset | |
| Tuxedo Stellaris 16 | |
| Average NVIDIA GeForce RTX 5070 Ti Laptop (49.9 - 74.3, n=2) | |
| Gigabyte Gaming A18 Pro | |
| Average of class Gaming (7.22 - 74.3, n=4, last 2 years) | |
| ARC Raiders | |
| 2560x1440 Epic Preset + Epic Raytracing AA:TSR | |
| Tuxedo Stellaris 16 | |
| Gigabyte Gaming A18 Pro | |
| Average NVIDIA GeForce RTX 5070 Ti Laptop (58 - 68.3, n=3) | |
| Acer Nitro 18 AI AN18-61-R10V | |
| Average of class Gaming (47.8 - 68.3, n=5, last 2 years) | |
| 1920x1080 Epic Preset + Epic Raytracing AA:TSR | |
| Tuxedo Stellaris 16 | |
| Gigabyte Gaming A18 Pro | |
| Average NVIDIA GeForce RTX 5070 Ti Laptop (79.8 - 98.6, n=3) | |
| Acer Nitro 18 AI AN18-61-R10V | |
| Average of class Gaming (43.5 - 98.6, n=11, last 2 years) | |
| The Outer Worlds 2 | |
| 2560x1440 Very High Preset AA:T | |
| Tuxedo Stellaris 16 | |
| Gigabyte Gaming A18 Pro | |
| Average NVIDIA GeForce RTX 5070 Ti Laptop (33.4 - 37.8, n=3) | |
| Average of class Gaming (21.5 - 37.8, n=6, last 2 years) | |
| Acer Nitro 18 AI AN18-61-R10V | |
| 1920x1080 Very High Preset AA:T | |
| Tuxedo Stellaris 16 | |
| Average NVIDIA GeForce RTX 5070 Ti Laptop (49.9 - 58.4, n=3) | |
| Gigabyte Gaming A18 Pro | |
| Acer Nitro 18 AI AN18-61-R10V | |
| Average of class Gaming (26.4 - 58.4, n=11, last 2 years) | |
| Borderlands 4 | |
| 2560x1440 Badass Preset AA:FX | |
| Tuxedo Stellaris 16 | |
| Average NVIDIA GeForce RTX 5070 Ti Laptop (22.4 - 31.4, n=3) | |
| Gigabyte Gaming A18 Pro | |
| Average of class Gaming (7.97 - 37.1, n=6, last 2 years) | |
| Acer Nitro 18 AI AN18-61-R10V | |
| 1920x1080 Badass Preset AA:FX | |
| Tuxedo Stellaris 16 | |
| Average NVIDIA GeForce RTX 5070 Ti Laptop (31.1 - 44.5, n=3) | |
| Gigabyte Gaming A18 Pro | |
| Acer Nitro 18 AI AN18-61-R10V | |
| Average of class Gaming (16 - 54, n=13, last 2 years) | |
| Monster Hunter Wilds | |
| 2560x1440 ultra, RT: high, no upscaling | |
| Lenovo Legion 9 18IAX10 | |
| Average of class Gaming (13.9 - 80.5, n=24, last 2 years) | |
| MSI Vector A18 HX A9W | |
| Average NVIDIA GeForce RTX 5070 Ti Laptop (48.8 - 55, n=3) | |
| Gigabyte Gaming A18 Pro | |
| 1920x1080 ultra, RT: high, no upscaling | |
| Lenovo Legion 9 18IAX10 | |
| MSI Vector A18 HX A9W | |
| Average of class Gaming (16.6 - 95.3, n=27, last 2 years) | |
| Average NVIDIA GeForce RTX 5070 Ti Laptop (56 - 70.8, n=3) | |
| Gigabyte Gaming A18 Pro | |
对 GPU 的长期性能进行了测试。 赛博朋克 2077.没有出现任何异常现象,帧速率在整个测试期间都相当稳定。
赛博朋克 2077》超 FPS 图表
排放量
系统噪音
如前所述,这台 18 英寸笔记本电脑在高性能模式下声音变得相当大。在《赛博朋克 2077》的测试过程中,它的噪音值达到了 57 dB(A),是测试场中的最高值,噪音水平之高令人不安,不得不使用耳机。如果机箱稍厚并配备更强的散热系统,可能会改善这方面的问题。在空闲模式下,两个风扇除了偶尔会突然加速外,噪音仍然明显较小,但 28 至 34 dB(A) 的噪音水平仍然高于同类产品。
Noise level
| Idle |
| 28 / 31 / 34 dB(A) |
| Load |
| 49 / 58 dB(A) |
 | ||
30 dB silent 40 dB(A) audible 50 dB(A) loud |
||
min: | ||
| Gigabyte Gaming A18 Pro Core 7 240H, GeForce RTX 5070 Ti Laptop | Lenovo Legion 9 18IAX10 Ultra 9 275HX, GeForce RTX 5080 Laptop | MSI Vector A18 HX A9W R9 9955HX, GeForce RTX 5070 Ti Laptop | Asus TUF Gaming A18 FA808UP-S8022W R7 260, GeForce RTX 5070 Laptop | Acer Nitro 18 AI AN18-61-R10V Ryzen AI 7 350, GeForce RTX 5070 Laptop | |
|---|---|---|---|---|---|
| Noise | 14% | 8% | 24% | 4% | |
| off / environment * (dB) | 26 | 23.3 10% | 22.5 13% | 23 12% | 24 8% |
| Idle Minimum * (dB) | 28 | 23.3 17% | 26 7% | 23 18% | 28 -0% |
| Idle Average * (dB) | 31 | 23.3 25% | 26 16% | 23 26% | 29 6% |
| Idle Maximum * (dB) | 34 | 29.1 14% | 32 6% | 23 32% | 31 9% |
| Load Average * (dB) | 49 | 46.8 4% | 44.4 9% | 32.58 34% | 49 -0% |
| Cyberpunk 2077 ultra * (dB) | 57 | 49.6 13% | 49.8 13% | 45.13 21% | 54 5% |
| Load Maximum * (dB) | 58 | 49.6 14% | 61.6 -6% | 56 3% |
* ... smaller is better
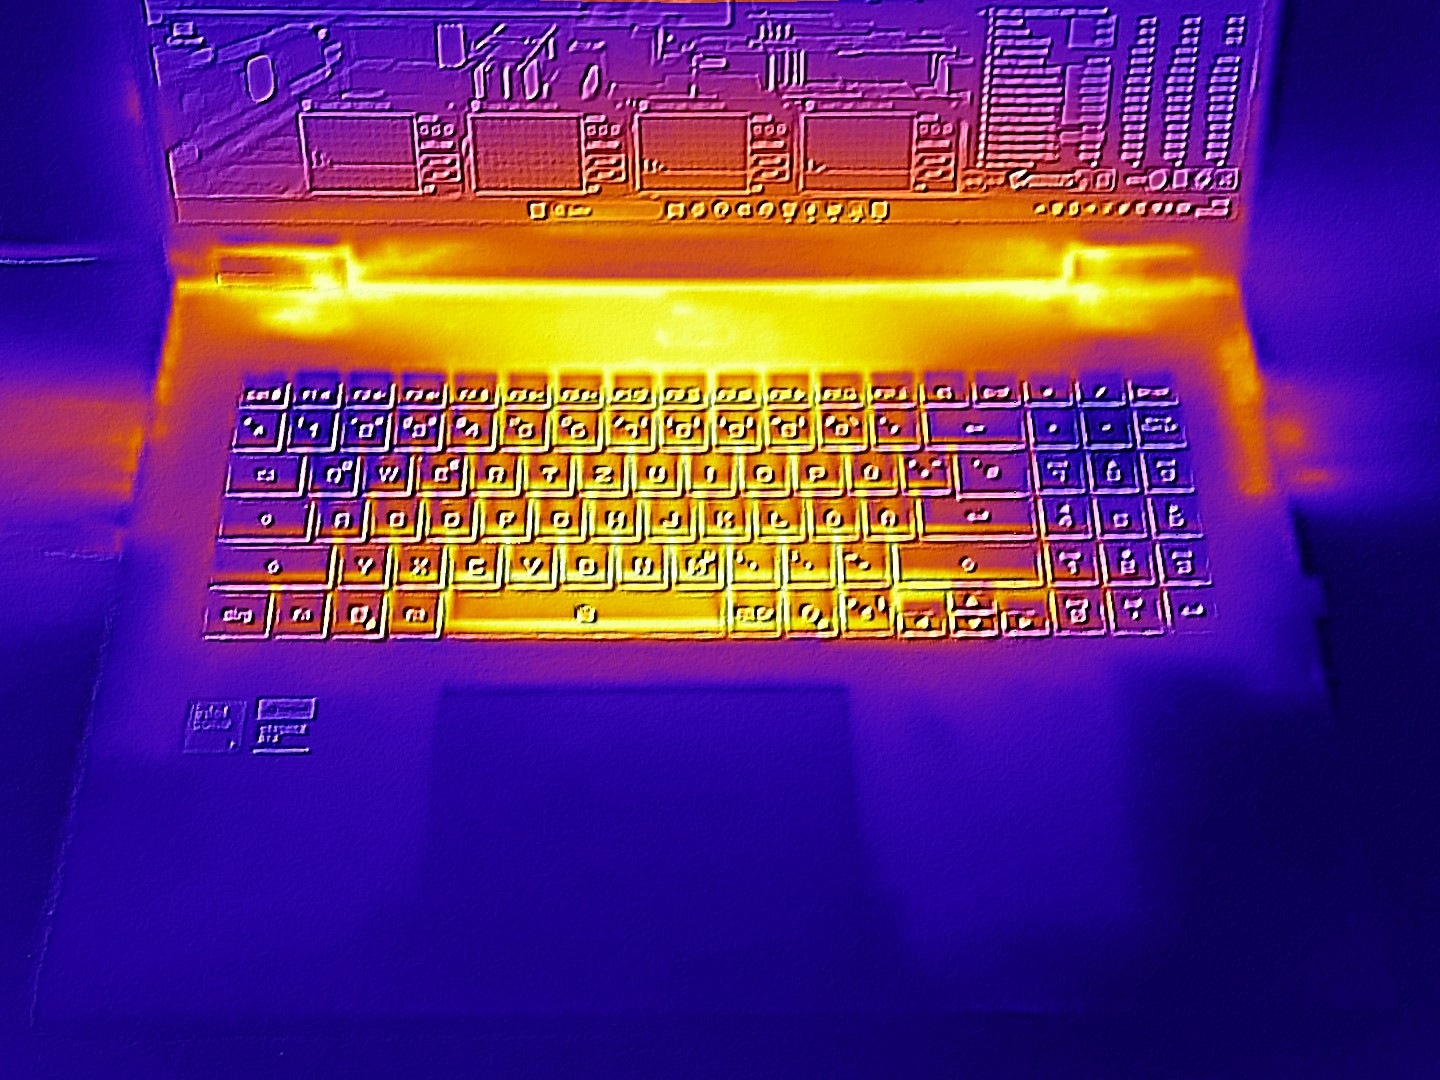
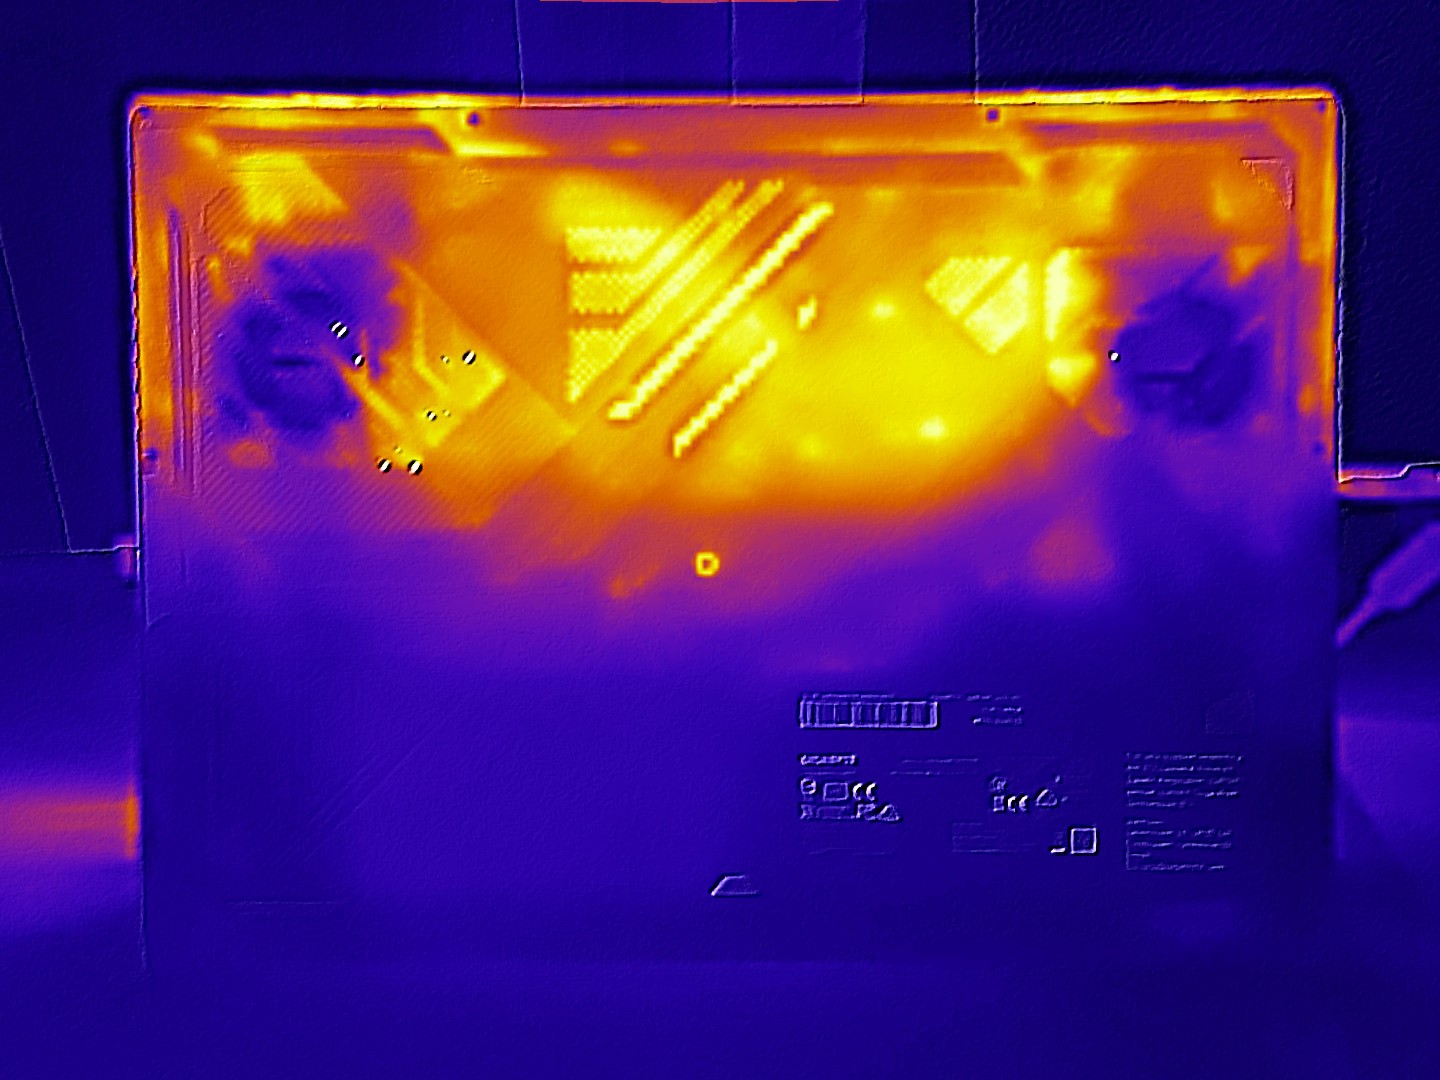
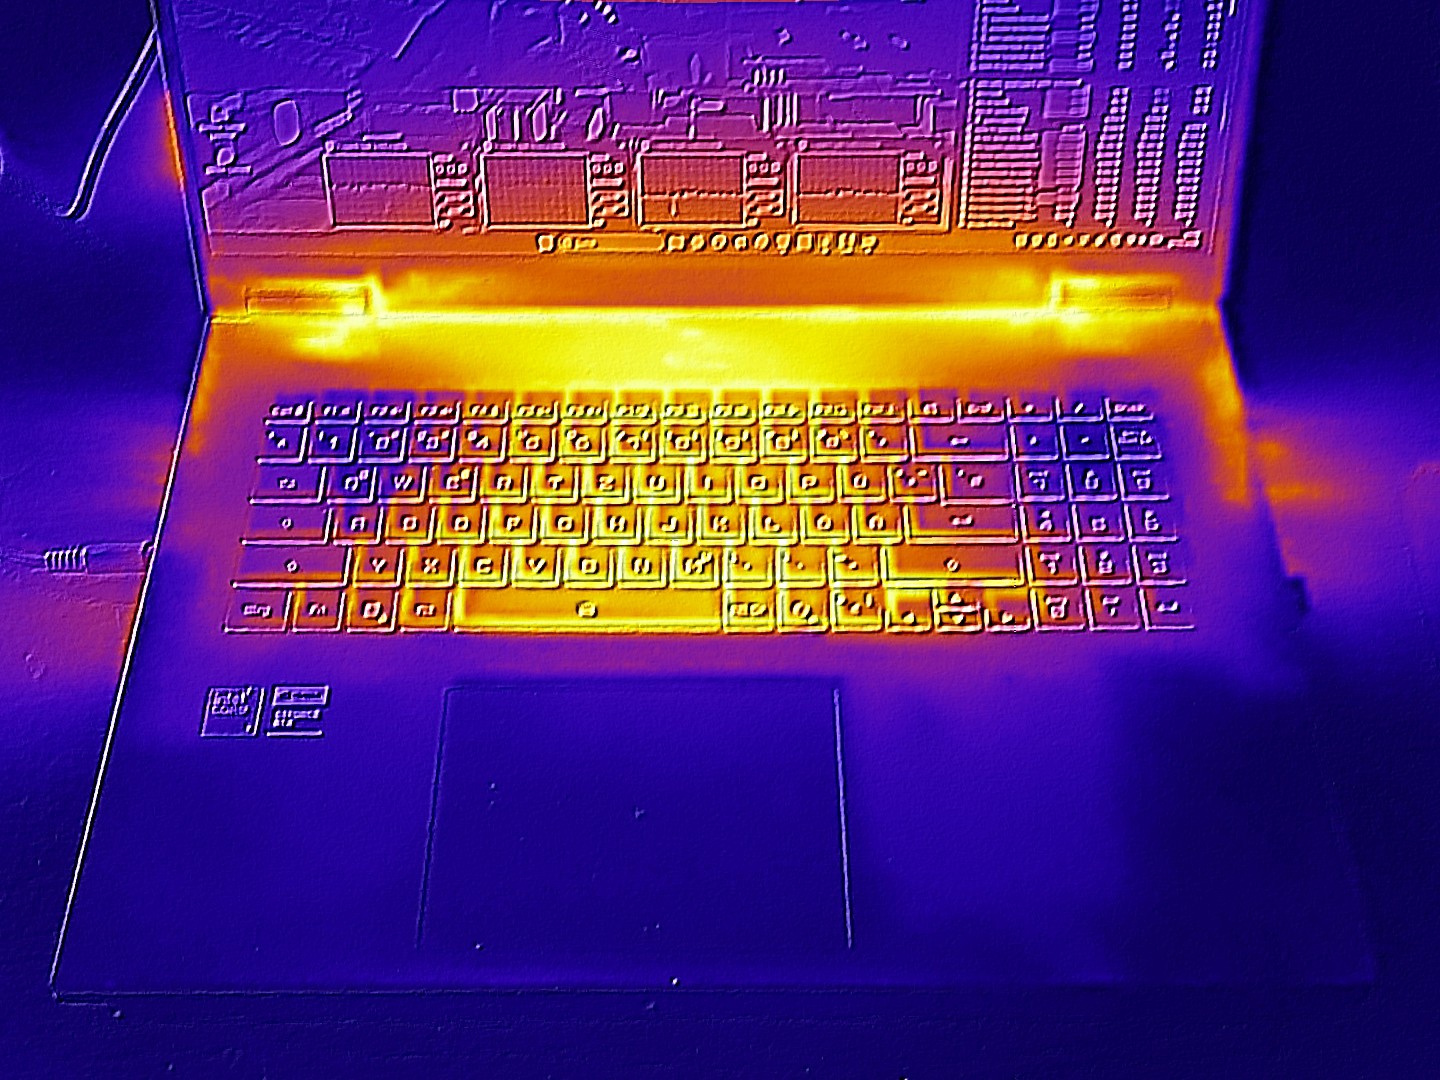
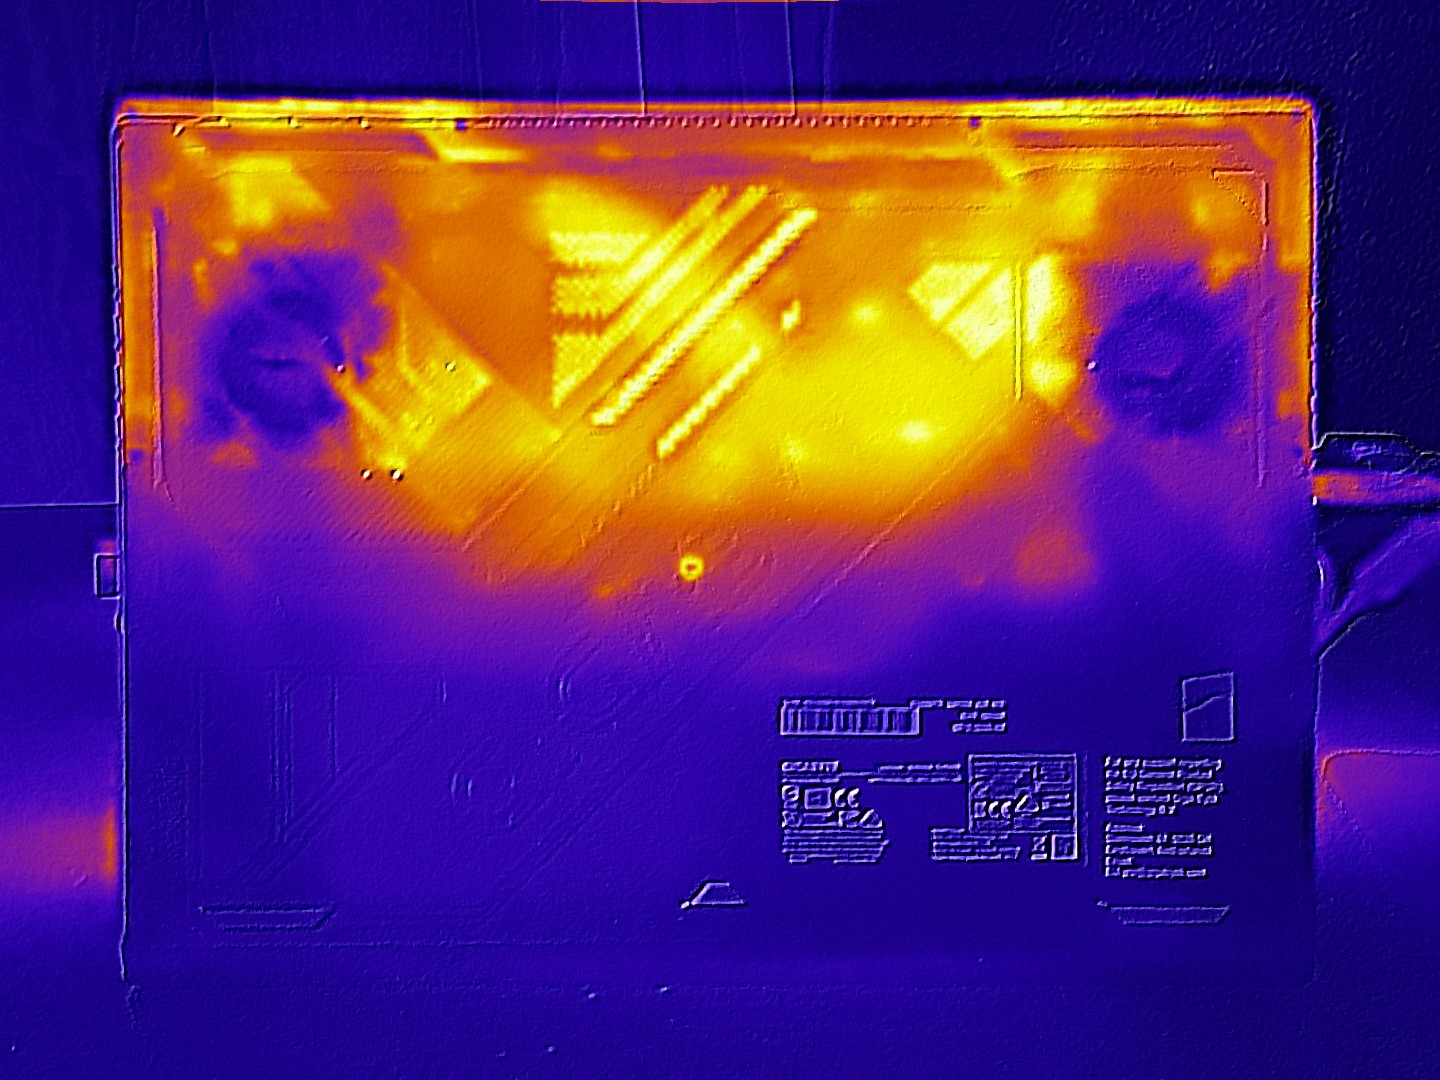
温度
温度在预期范围内。机箱顶部的最高温度约为 118°F,底部约为 120°F,这对于该性能级别的设备来说非常典型。在空闲状态下,机箱的大部分温度保持在约 86°F 以下,因此感觉仍然非常舒适。
(-) The maximum temperature on the upper side is 48 °C / 118 F, compared to the average of 40.4 °C / 105 F, ranging from 21.2 to 68.8 °C for the class Gaming.
(-) The bottom heats up to a maximum of 49 °C / 120 F, compared to the average of 43.2 °C / 110 F
(+) In idle usage, the average temperature for the upper side is 27.6 °C / 82 F, compared to the device average of 33.9 °C / 93 F.
(±) 3: The average temperature for the upper side is 38 °C / 100 F, compared to the average of 33.9 °C / 93 F for the class Gaming.
(+) The palmrests and touchpad are cooler than skin temperature with a maximum of 27 °C / 80.6 F and are therefore cool to the touch.
(±) The average temperature of the palmrest area of similar devices was 28.8 °C / 83.8 F (+1.8 °C / 3.2 F).
| Gigabyte Gaming A18 Pro Core 7 240H, GeForce RTX 5070 Ti Laptop | Lenovo Legion 9 18IAX10 Ultra 9 275HX, GeForce RTX 5080 Laptop | Medion Erazer Beast 18 X1 MD62731 Ultra 9 275HX, GeForce RTX 5080 Laptop | MSI Vector A18 HX A9W R9 9955HX, GeForce RTX 5070 Ti Laptop | Asus TUF Gaming A18 FA808UP-S8022W R7 260, GeForce RTX 5070 Laptop | Acer Nitro 18 AI AN18-61-R10V Ryzen AI 7 350, GeForce RTX 5070 Laptop | |
|---|---|---|---|---|---|---|
| Heat | -3% | -1% | 3% | 12% | 4% | |
| Maximum Upper Side * (°C) | 48 | 43 10% | 47 2% | 46.6 3% | 39 19% | 44 8% |
| Maximum Bottom * (°C) | 49 | 41.8 15% | 48 2% | 45.6 7% | 41 16% | 57 -16% |
| Idle Upper Side * (°C) | 30 | 37 -23% | 29 3% | 31.2 -4% | 27 10% | 25 17% |
| Idle Bottom * (°C) | 30 | 34.2 -14% | 33 -10% | 28.6 5% | 29 3% | 28 7% |
* ... smaller is better
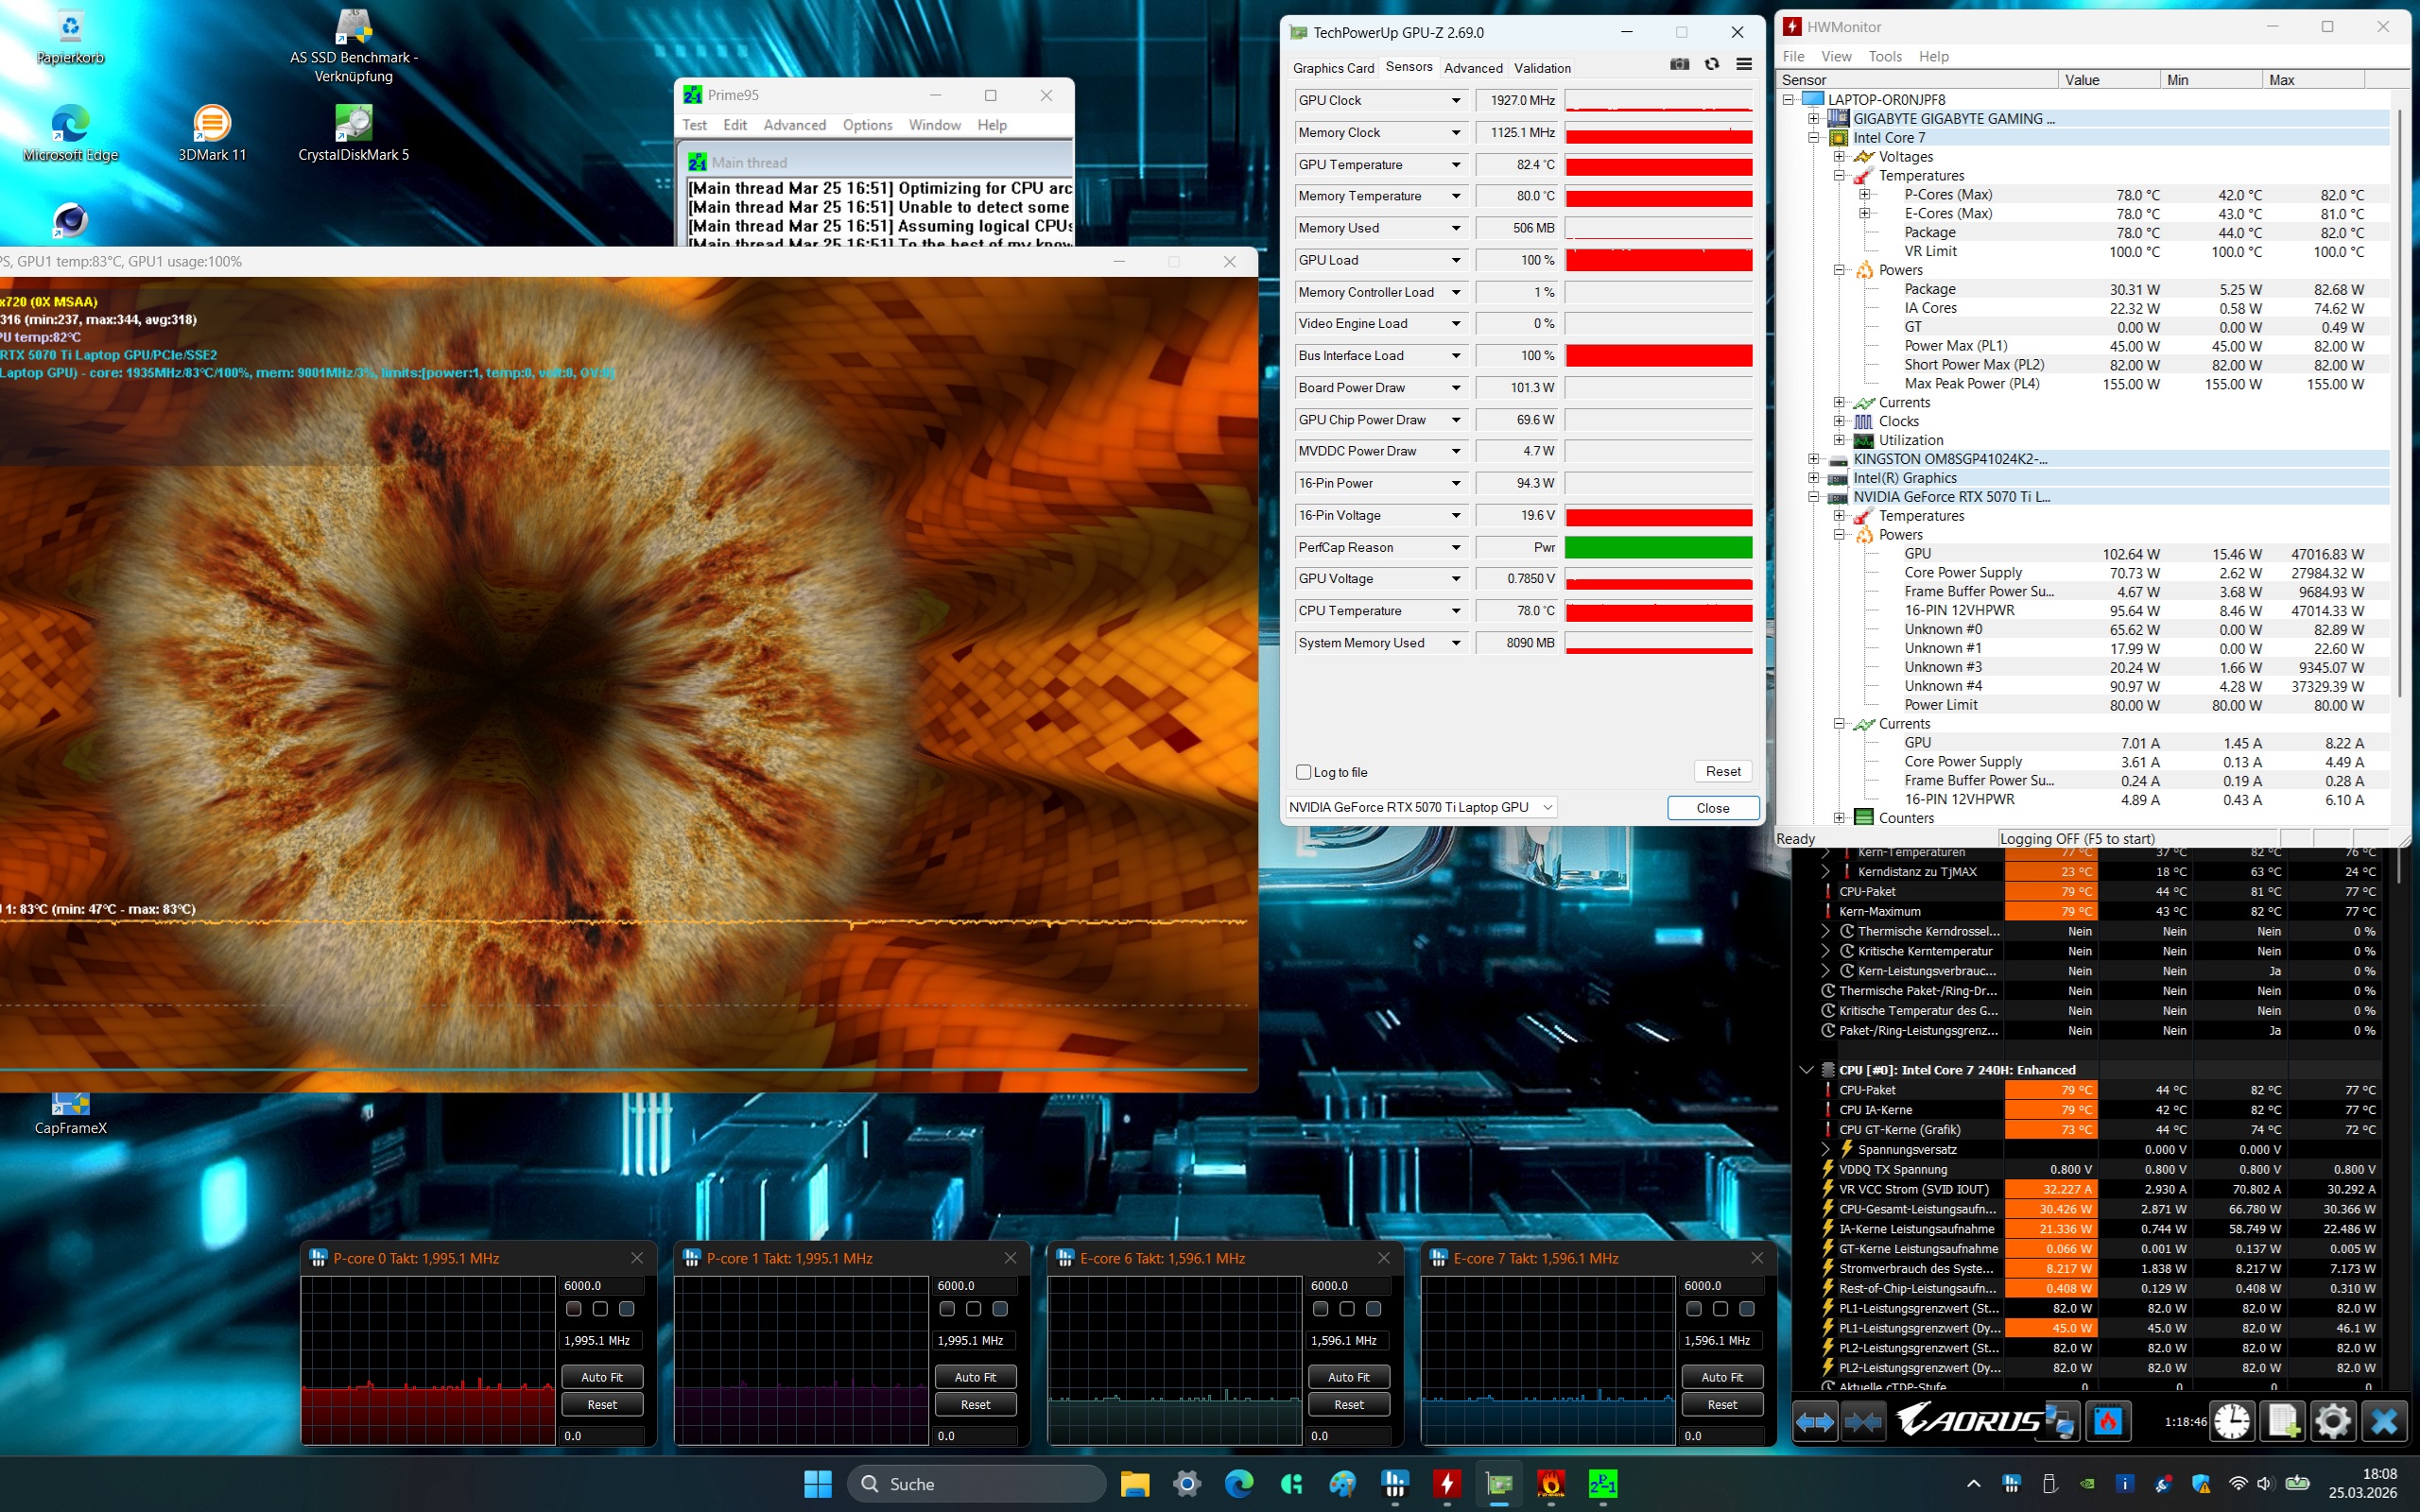
压力测试
使用 FurMark 和 Prime95 进行压力测试的结果是,CPU 和 GPU 达到 176°F 左右,既不算特别低,也不算特别高。
发言人
内置 2.0 系统的音质非常稳定,与微星 Vector A18 不相上下。与大多数笔记本电脑一样,它的弱点主要体现在低音方面。最大音量也可以再大一些。
Gigabyte Gaming A18 Pro audio analysis
(±) | speaker loudness is average but good (78 dB)
Bass 100 - 315 Hz
(±) | reduced bass - on average 7.9% lower than median
(±) | linearity of bass is average (9.2% delta to prev. frequency)
Mids 400 - 2000 Hz
(±) | higher mids - on average 5.8% higher than median
(+) | mids are linear (5.8% delta to prev. frequency)
Highs 2 - 16 kHz
(+) | balanced highs - only 2.6% away from median
(±) | linearity of highs is average (9.2% delta to prev. frequency)
Overall 100 - 16.000 Hz
(+) | overall sound is linear (13.5% difference to median)
Compared to same class
» 20% of all tested devices in this class were better, 7% similar, 73% worse
» The best had a delta of 6%, average was 18%, worst was 132%
Compared to all devices tested
» 14% of all tested devices were better, 4% similar, 82% worse
» The best had a delta of 4%, average was 24%, worst was 134%
MSI Vector A18 HX A9W audio analysis
(+) | speakers can play relatively loud (86.2 dB)
Bass 100 - 315 Hz
(-) | nearly no bass - on average 16% lower than median
(±) | linearity of bass is average (10.9% delta to prev. frequency)
Mids 400 - 2000 Hz
(±) | higher mids - on average 5.7% higher than median
(±) | linearity of mids is average (7.2% delta to prev. frequency)
Highs 2 - 16 kHz
(+) | balanced highs - only 3.3% away from median
(+) | highs are linear (6.8% delta to prev. frequency)
Overall 100 - 16.000 Hz
(+) | overall sound is linear (13.5% difference to median)
Compared to same class
» 20% of all tested devices in this class were better, 7% similar, 73% worse
» The best had a delta of 6%, average was 18%, worst was 132%
Compared to all devices tested
» 14% of all tested devices were better, 4% similar, 82% worse
» The best had a delta of 4%, average was 24%, worst was 134%
电源管理
耗电量
由于采用了相对节能的处理器,因此功耗保持适中。与同类产品相比,10 至 20 瓦的空闲功耗和 95 至 179 瓦的负载功耗都是可观的。
| Off / Standby | |
| Idle | |
| Load |
|
Key:
min: | |
| Gigabyte Gaming A18 Pro Core 7 240H, GeForce RTX 5070 Ti Laptop | Lenovo Legion 9 18IAX10 Ultra 9 275HX, GeForce RTX 5080 Laptop | MSI Vector A18 HX A9W R9 9955HX, GeForce RTX 5070 Ti Laptop | Asus TUF Gaming A18 FA808UP-S8022W R7 260, GeForce RTX 5070 Laptop | Acer Nitro 18 AI AN18-61-R10V Ryzen AI 7 350, GeForce RTX 5070 Laptop | Average of class Gaming | |
|---|---|---|---|---|---|---|
| Power Consumption | -149% | -123% | 13% | 12% | -33% | |
| Idle Minimum * (Watt) | 10 | 34.5 -245% | 20.8 -108% | 6.7 33% | 5.9 41% | 13.2 ? -32% |
| Idle Average * (Watt) | 12.5 | 44.1 -253% | 52.8 -322% | 11.6 7% | 9.6 23% | 18.9 ? -51% |
| Idle Maximum * (Watt) | 19.7 | 53.3 -171% | 54.5 -177% | 17.7 10% | 17 14% | 24.5 ? -24% |
| Load Average * (Watt) | 95 | 140.9 -48% | 146.6 -54% | 85 11% | 89 6% | 108.8 ? -15% |
| Cyberpunk 2077 ultra * (Watt) | 170.2 | 360 -112% | 285 -67% | 144 15% | 160.4 6% | |
| Cyberpunk 2077 ultra external monitor * (Watt) | 169.6 | 353 -108% | 278 -64% | 139 18% | 154.6 9% | |
| Load Maximum * (Watt) | 179 | 367.5 -105% | 297.3 -66% | 187 -4% | 210 -17% | 254 ? -42% |
* ... smaller is better
功耗 赛博朋克/压力测试
带外部监视器时的耗电量
运行时间
其竞争对手的电池容量都在 90 Wh 以上,而 Gaming A18 Pro 的电池容量只有 76 Wh。尽管如此,测得的电池续航时间还是相当可观的。在我们的 Wi-Fi 网络续航测试中,它的续航时间接近 8 小时,稳居排行榜中游。
| Gigabyte Gaming A18 Pro Core 7 240H, GeForce RTX 5070 Ti Laptop, 76 Wh | Lenovo Legion 9 18IAX10 Ultra 9 275HX, GeForce RTX 5080 Laptop, 99.9 Wh | MSI Vector A18 HX A9W R9 9955HX, GeForce RTX 5070 Ti Laptop, 99 Wh | Asus TUF Gaming A18 FA808UP-S8022W R7 260, GeForce RTX 5070 Laptop, 90 Wh | Acer Nitro 18 AI AN18-61-R10V Ryzen AI 7 350, GeForce RTX 5070 Laptop, 90 Wh | Average of class Gaming | |
|---|---|---|---|---|---|---|
| Battery runtime | -30% | -52% | 49% | 39% | -13% | |
| WiFi v1.3 (h) | 8 | 5.6 -30% | 3.8 -52% | 11.9 49% | 11.1 39% | 6.96 ? -13% |
| Reader / Idle (h) | 7 | 8.71 ? |
笔记本检查评级
技嘉 GAMING A18 Pro 的一些小缺点和更重要的缺点,如噪音相当大,使其无法在 18 英寸笔记本市场上与顶级产品竞争。微星的 Vector A18 HX在我们的测试中也配备了 RTX 5070 Ti,最终表现略胜一筹,但目前价格较高。
Gigabyte Gaming A18 Pro
- 03/31/2026 v8
Florian Glaser
 Total Sustainability Score:
 可比替代品
Image | Model / Review | Price | Weight | Height | Display |
|---|---|---|---|---|---|
1. 78.7% 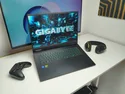 | Gigabyte Gaming A18 Pro Intel Core 7 240H ⎘ NVIDIA GeForce RTX 5070 Ti Laptop ⎘ 32 GB Memory, 1024 GB SSD | Amazon: 1. $1,573.99 GIGABYTE Gaming A18 Gaming L... 2. $1,999.99 GIGABYTE Gaming A18 Gaming L... 3. $1,909.00 GIGABYTE Gaming A18 Gaming L... List Price: 2399 EUR | 2.9 kg | 25 mm | 18.00" 2560x1600 168 PPI IPS |
2. 89.1%  | Lenovo Legion 9 18IAX10 Intel Core Ultra 9 275HX ⎘ NVIDIA GeForce RTX 5080 Laptop ⎘ 64 GB Memory, 2048 GB SSD | Amazon: List Price: 3800 USD | 3.5 kg | 27.95 mm | 18.00" 3840x2400 252 PPI IPS |
3. 84.8%  | MSI Vector A18 HX A9W AMD Ryzen 9 9955HX ⎘ NVIDIA GeForce RTX 5070 Ti Laptop ⎘ 32 GB Memory | Amazon: List Price: 3200 USD | 3.5 kg | 32.05 mm | 18.00" 2560x1600 189 PPI IPS |
4. 83.8%  | Asus TUF Gaming A18 FA808UP-S8022W AMD Ryzen 7 260 ⎘ NVIDIA GeForce RTX 5070 Laptop ⎘ 32 GB Memory, 1024 GB SSD | Amazon: List Price: 2199 Euro | 2.6 kg | 26.7 mm | 18.00" 1920x1200 126 PPI IPS |
5. 81.2%  | Acer Nitro 18 AI AN18-61-R10V AMD Ryzen AI 7 350 ⎘ NVIDIA GeForce RTX 5070 Laptop ⎘ 16 GB Memory, 1000 GB SSD | Amazon: List Price: 1900 EUR | 3 kg | 25 mm | 18.00" 2560x1600 168 PPI IPS |
Transparency
The selection of devices to be reviewed is made by our editorial team. The test sample was provided to the author as a loan by the manufacturer or retailer for the purpose of this review. The lender had no influence on this review, nor did the manufacturer receive a copy of this review before publication. There was no obligation to publish this review. As an independent media company, Notebookcheck is not subjected to the authority of manufacturers, retailers or publishers.
This is how Notebookcheck is testing
Every year, Notebookcheck independently reviews hundreds of laptops and smartphones using standardized procedures to ensure that all results are comparable. We have continuously developed our test methods for around 20 years and set industry standards in the process. In our test labs, high-quality measuring equipment is utilized by experienced technicians and editors. These tests involve a multi-stage validation process. Our complex rating system is based on hundreds of well-founded measurements and benchmarks, which maintains objectivity. Further information on our test methods can be found here.

