
总结——ROG Zephyrus G14 在 2026 年虽然价格上涨,但性能更上一层楼
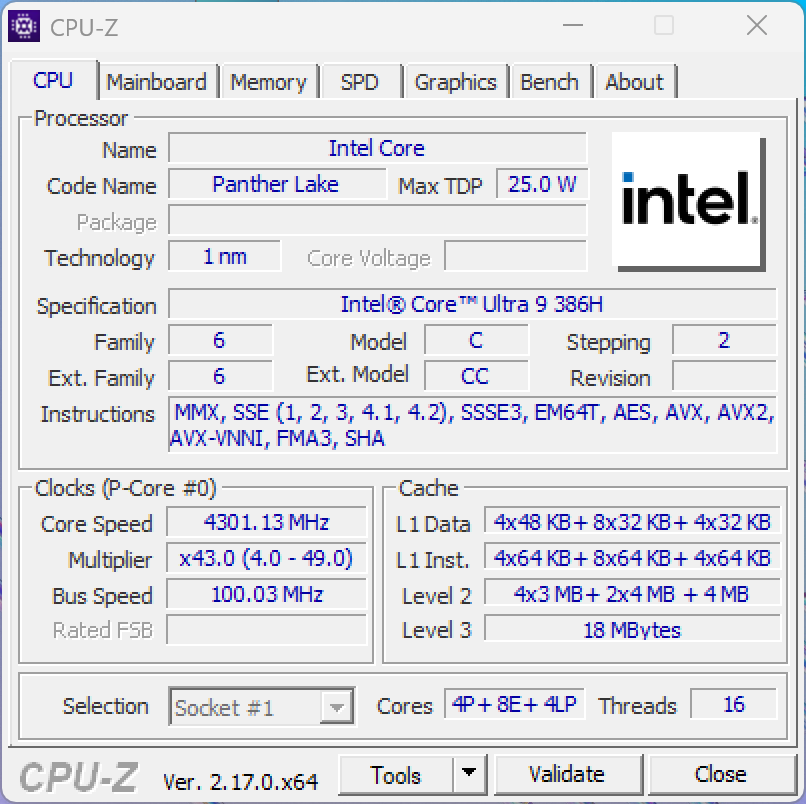
ROG Zephyrus G14原本就是最快的14英寸游戏/多媒体全能本,华硕在新款2026机型上对部分方面进行了优化。 原有的AMD处理器已被英特尔的Panther Lake处理器取代,这不仅提升了单核性能,还提高了能效,从而延长了电池续航时间。它仍是唯一搭载强劲GeForce RTX 5070 Ti显卡的14英寸游戏本,其游戏表现也确实令人满意。 配合全新OLED屏幕——其亮度远超以往——游戏画面简直令人惊艳。华硕还优化了其他方面:新增了全尺寸SD卡读卡器,并通过磁吸式(而非粘合式)螺丝盖设计,提升了对内部组件的访问便利性。此外,其键盘也是笔记本电脑中最为舒适的之一。
不过,所有这些优点都需付出代价。除了价格上涨(搭载 5070 Ti 和 32 GB 内存的型号售价为 3199 美元)外,当你想要充分发挥显卡性能时,还得忍受风扇的噪音。这意味着游戏时最好戴上耳机。 但在日常使用中,这款笔记本通常非常安静。
总而言之,华硕成功地进一步提升了ROG Zephyrus G14的性能,而全新的OLED屏幕也解决了我们对旧款机型存在的一项诟病。不过,如果你并不特别在意HDR游戏体验,我们建议选择 2025款,该机型目前仍有售,且价格明显更低(2599美元)。
Pros
Cons
- $129.99280W 250W Charger for Asus ROG Zephyrus G14 (2026) GU405 GU405AR GU405AR-XB97 Gaming Laptop Power Supply Adapter Cord
- $1,749.99EXCaliberPC [2025] ASUS ROG Zephyrus G14 GA403UM-G14.R9HX4 (AMD Ryzen 9 270, 16GB LPDDR5X, 1TB NVMe SSD, NVIDIA GeForce RTX 5060, 14" 3K OLED 120Hz, Windows 11) Gaming Laptop
- $2,999.00ASUS ROG Zephyrus G14 14" 3K OLED 120Hz Gaming Laptop Copilot+ PC AMD Ryzen AI 9 HX 370 NVIDIA RTX 5070 Ti 12GB 32GB LPDDR5X RAM 2TB SSD WiFi7 Win11 Platinum White w/2TB USB Drive, W/GaLiMu
技术规格
机箱、连接性和输入设备
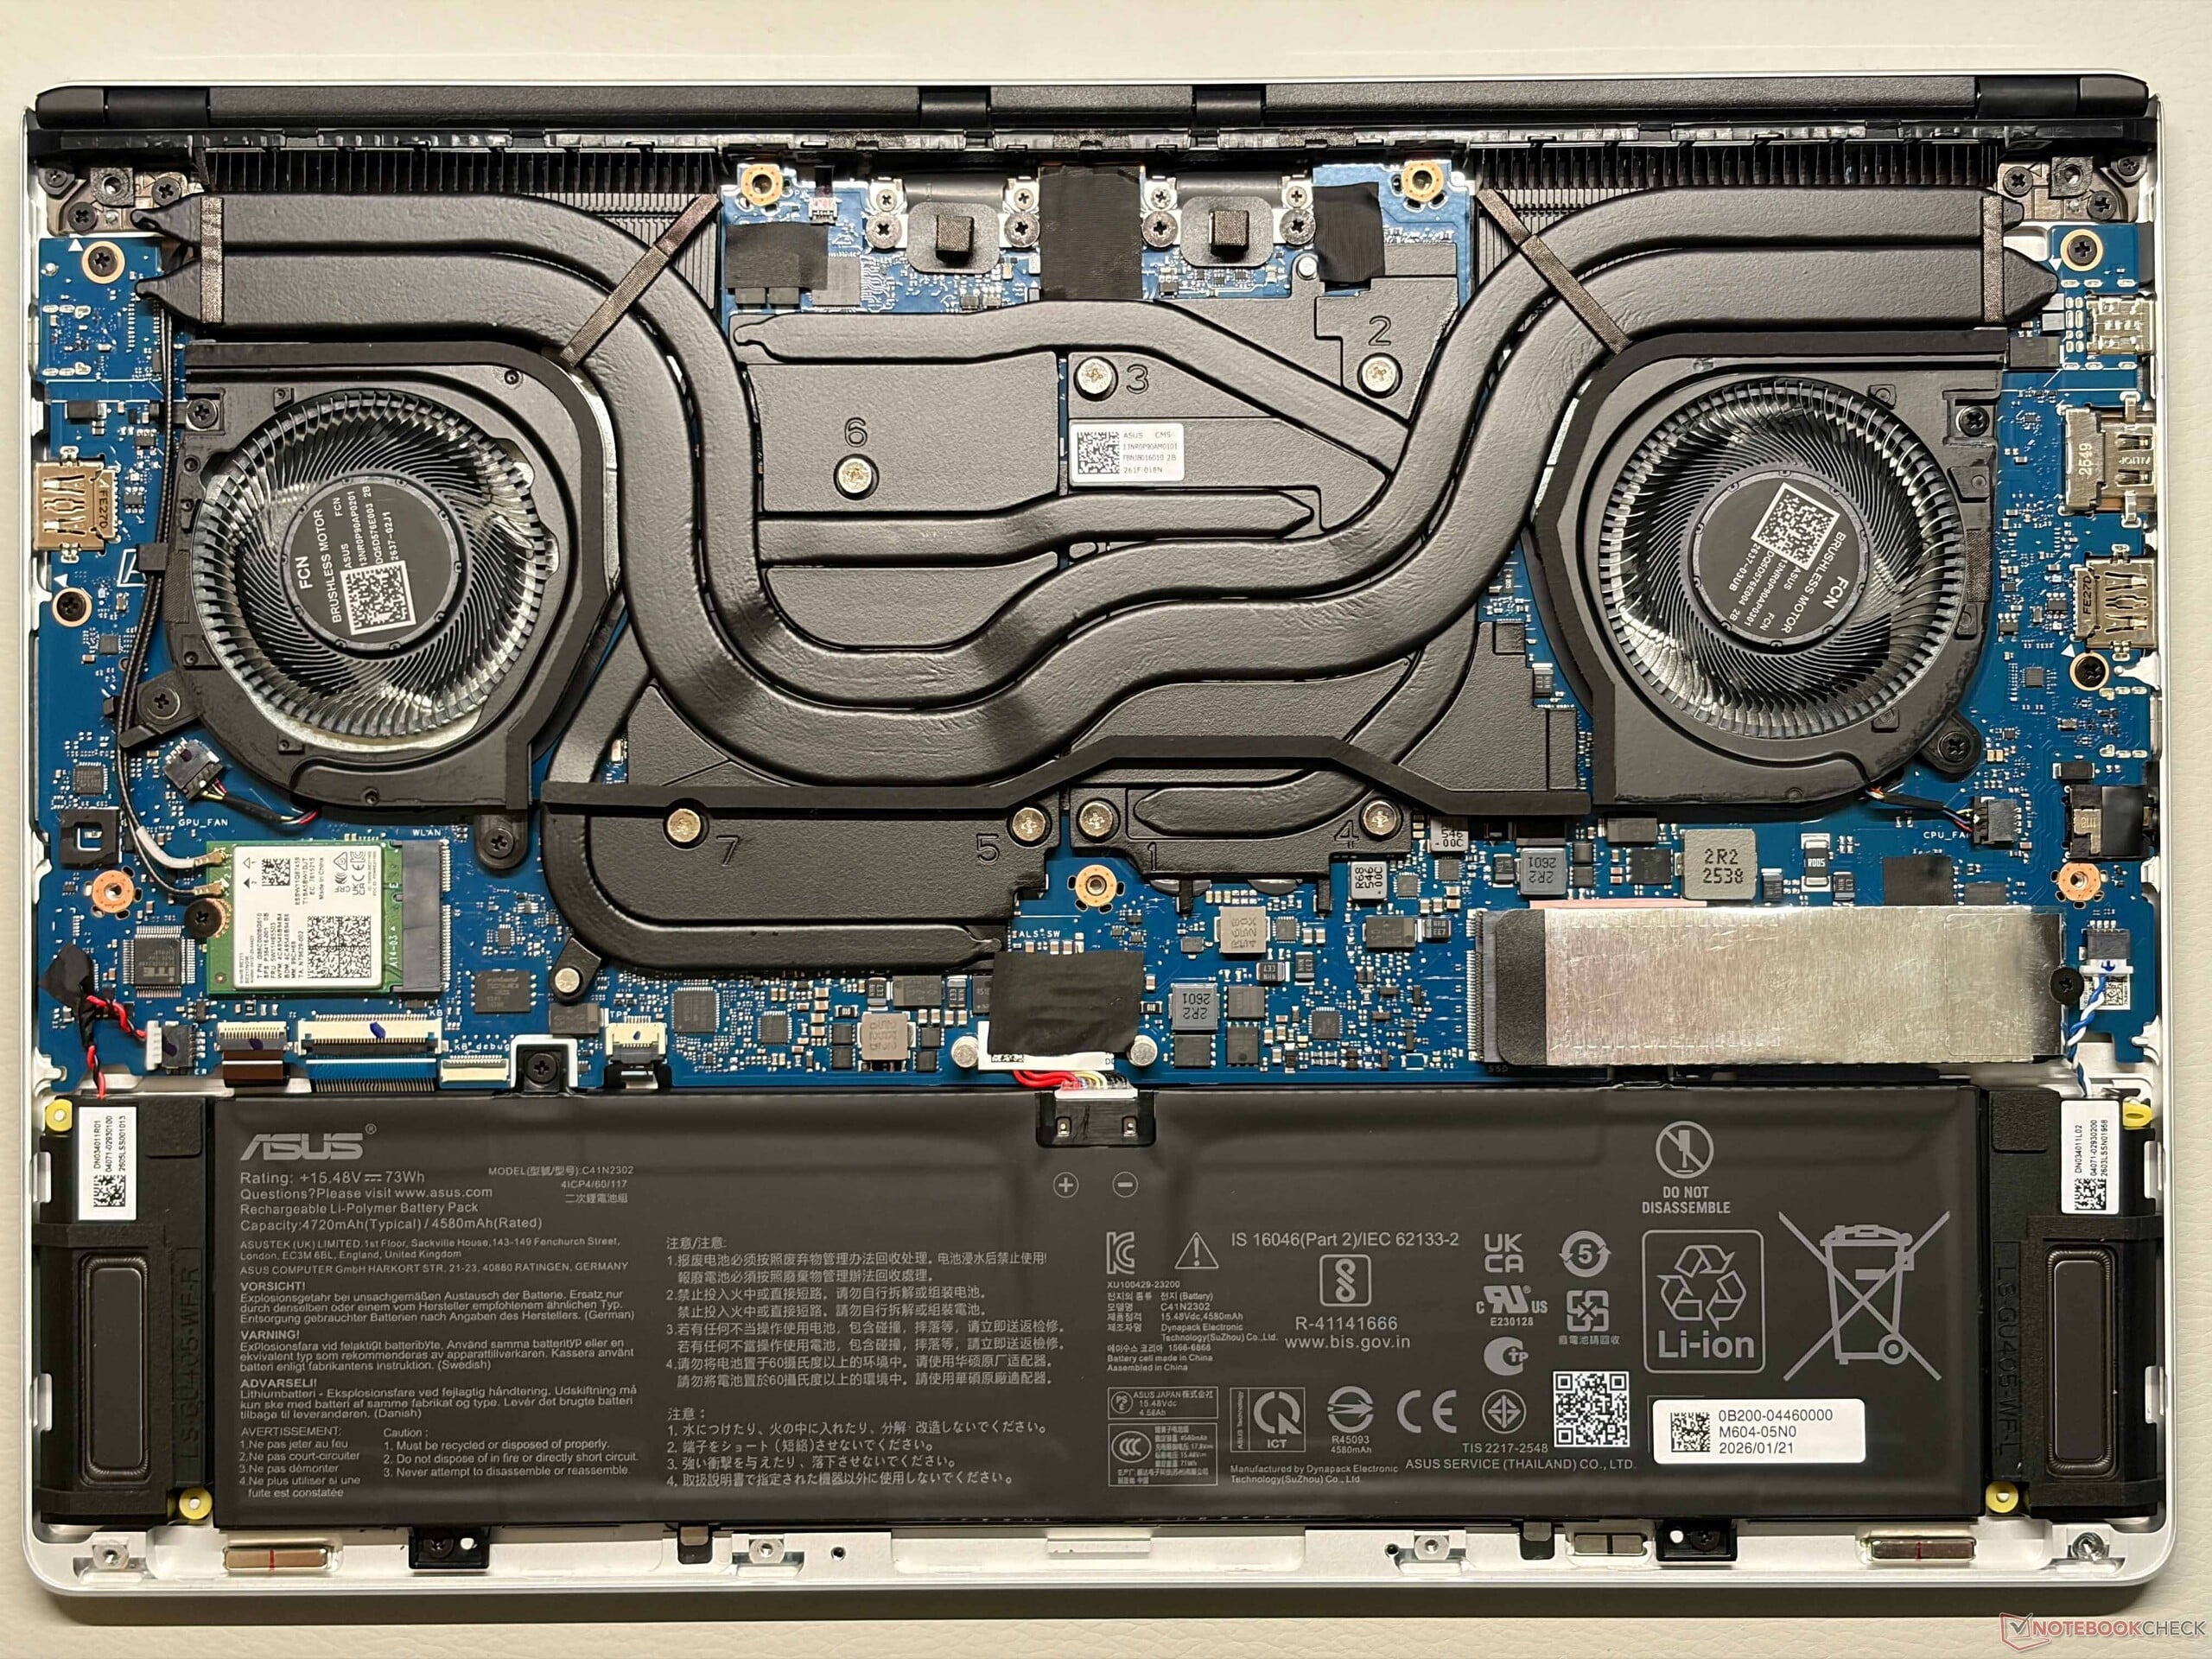
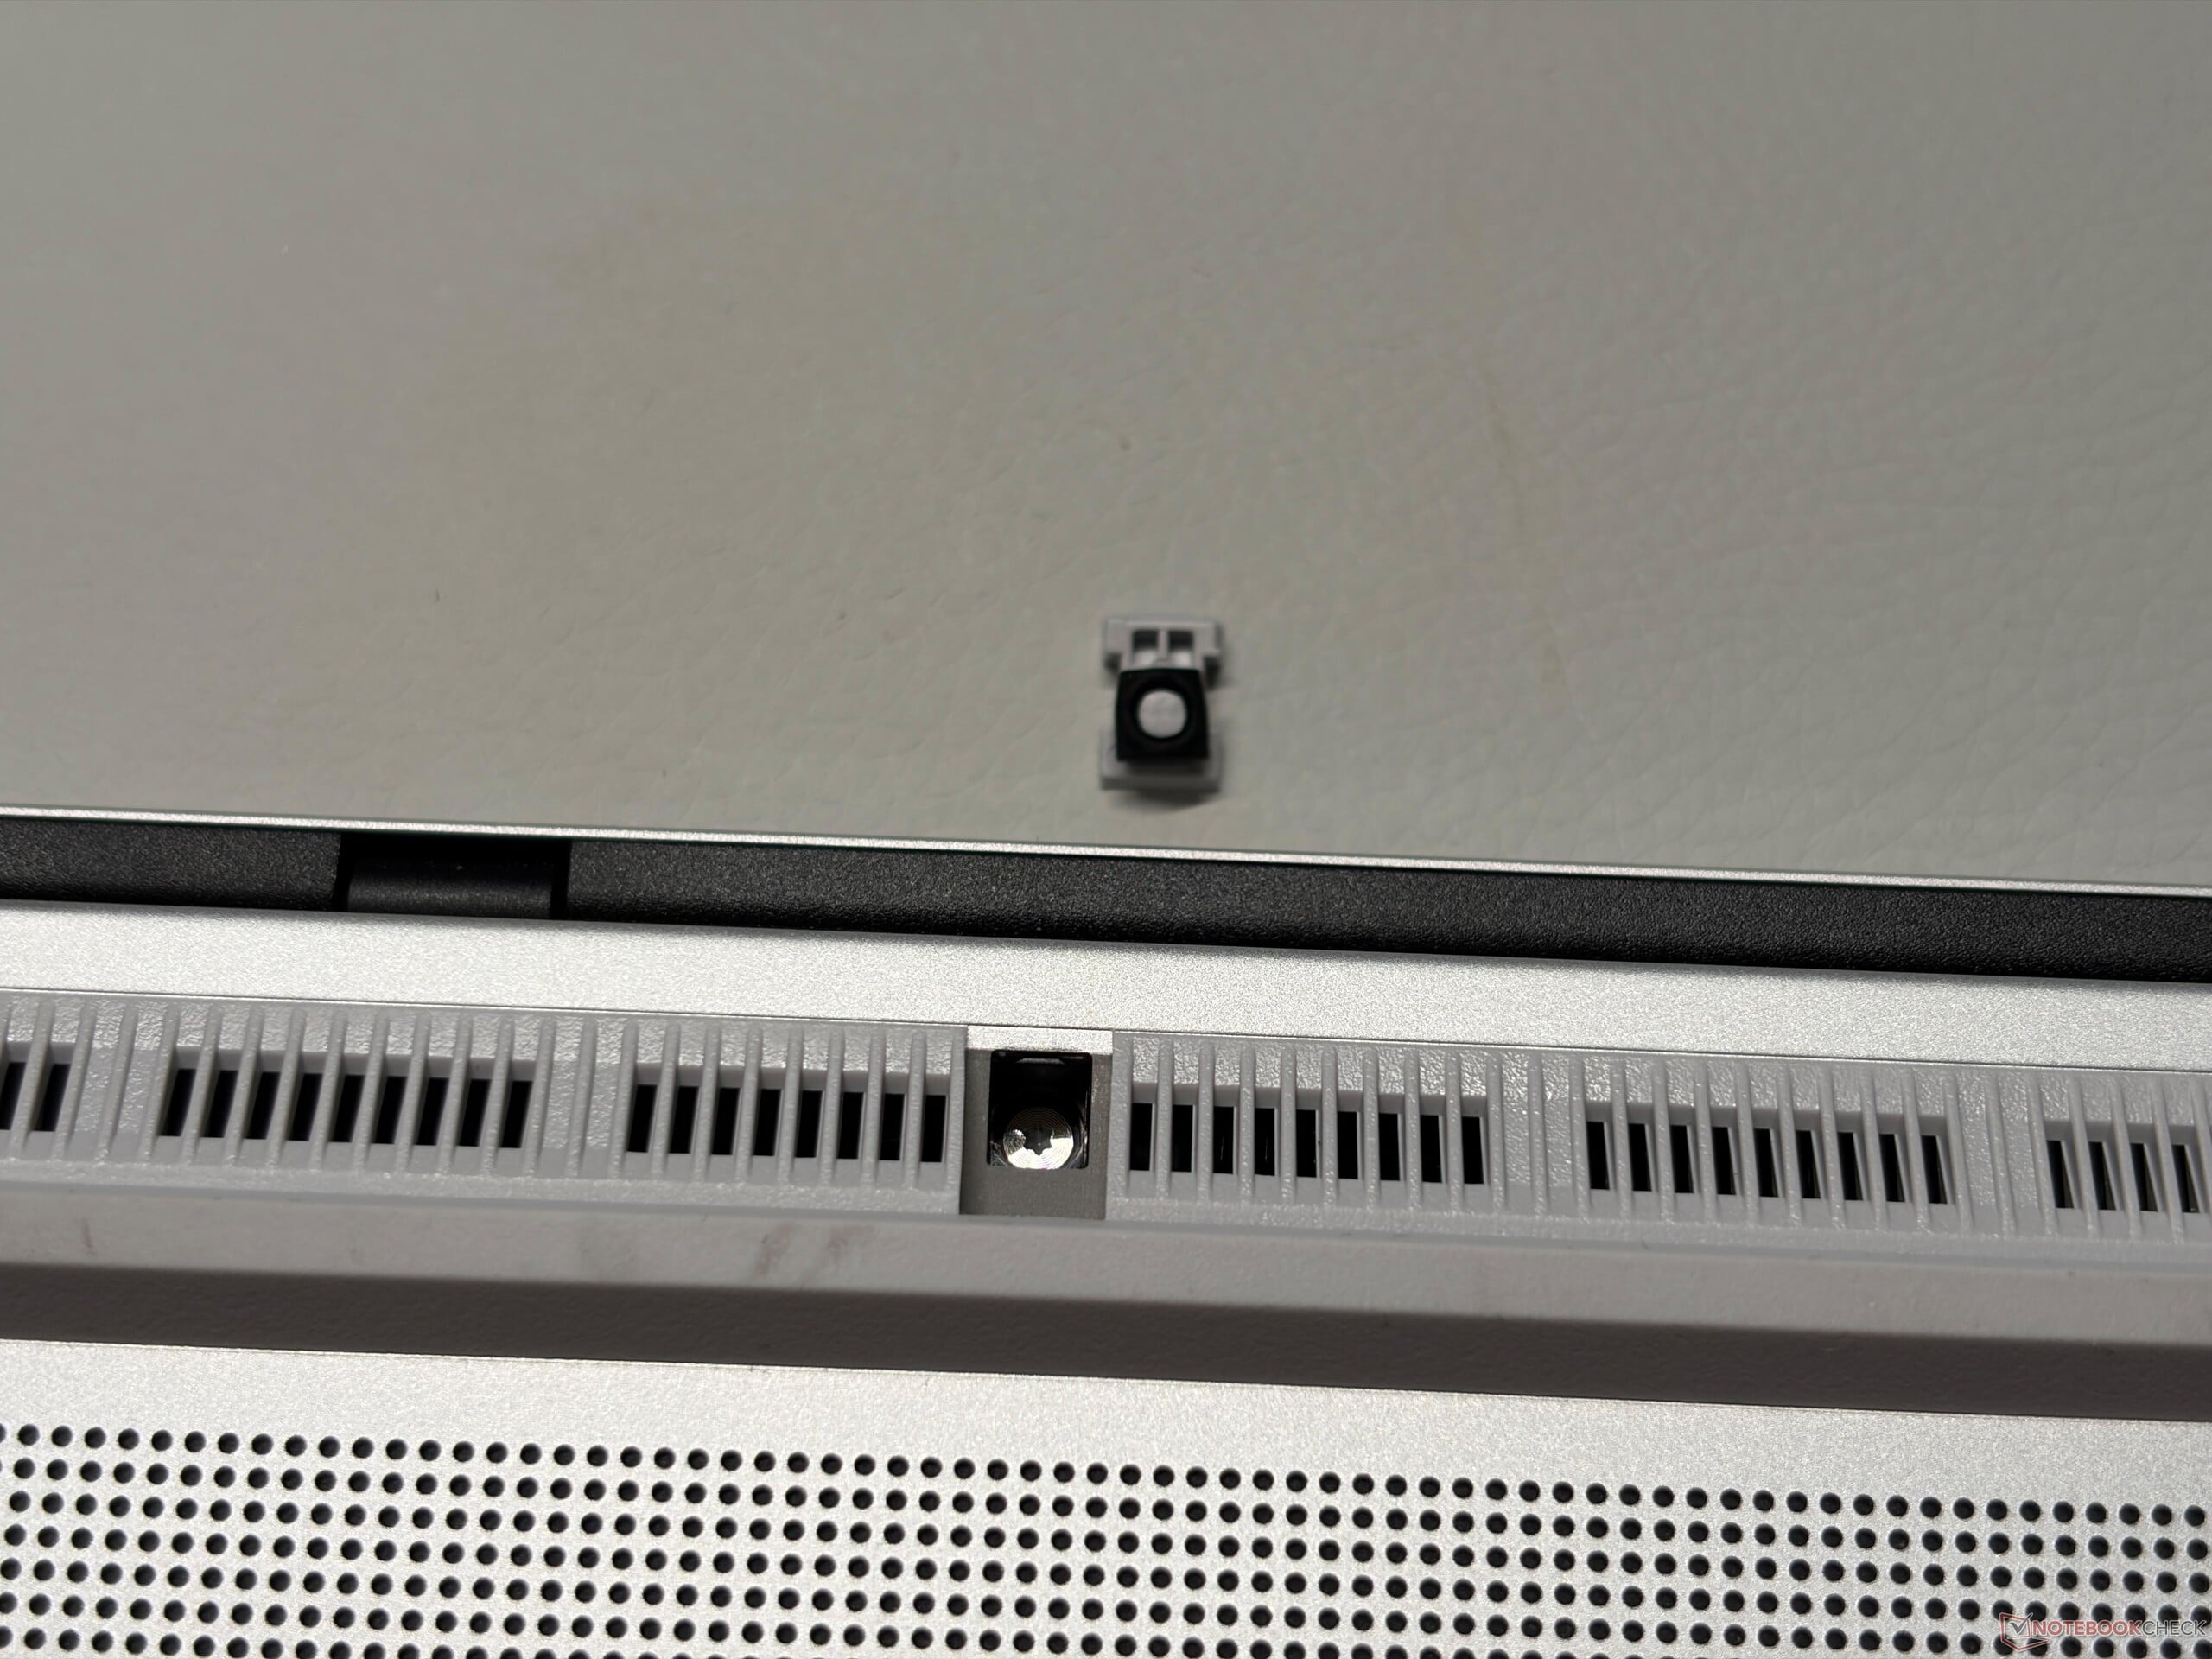
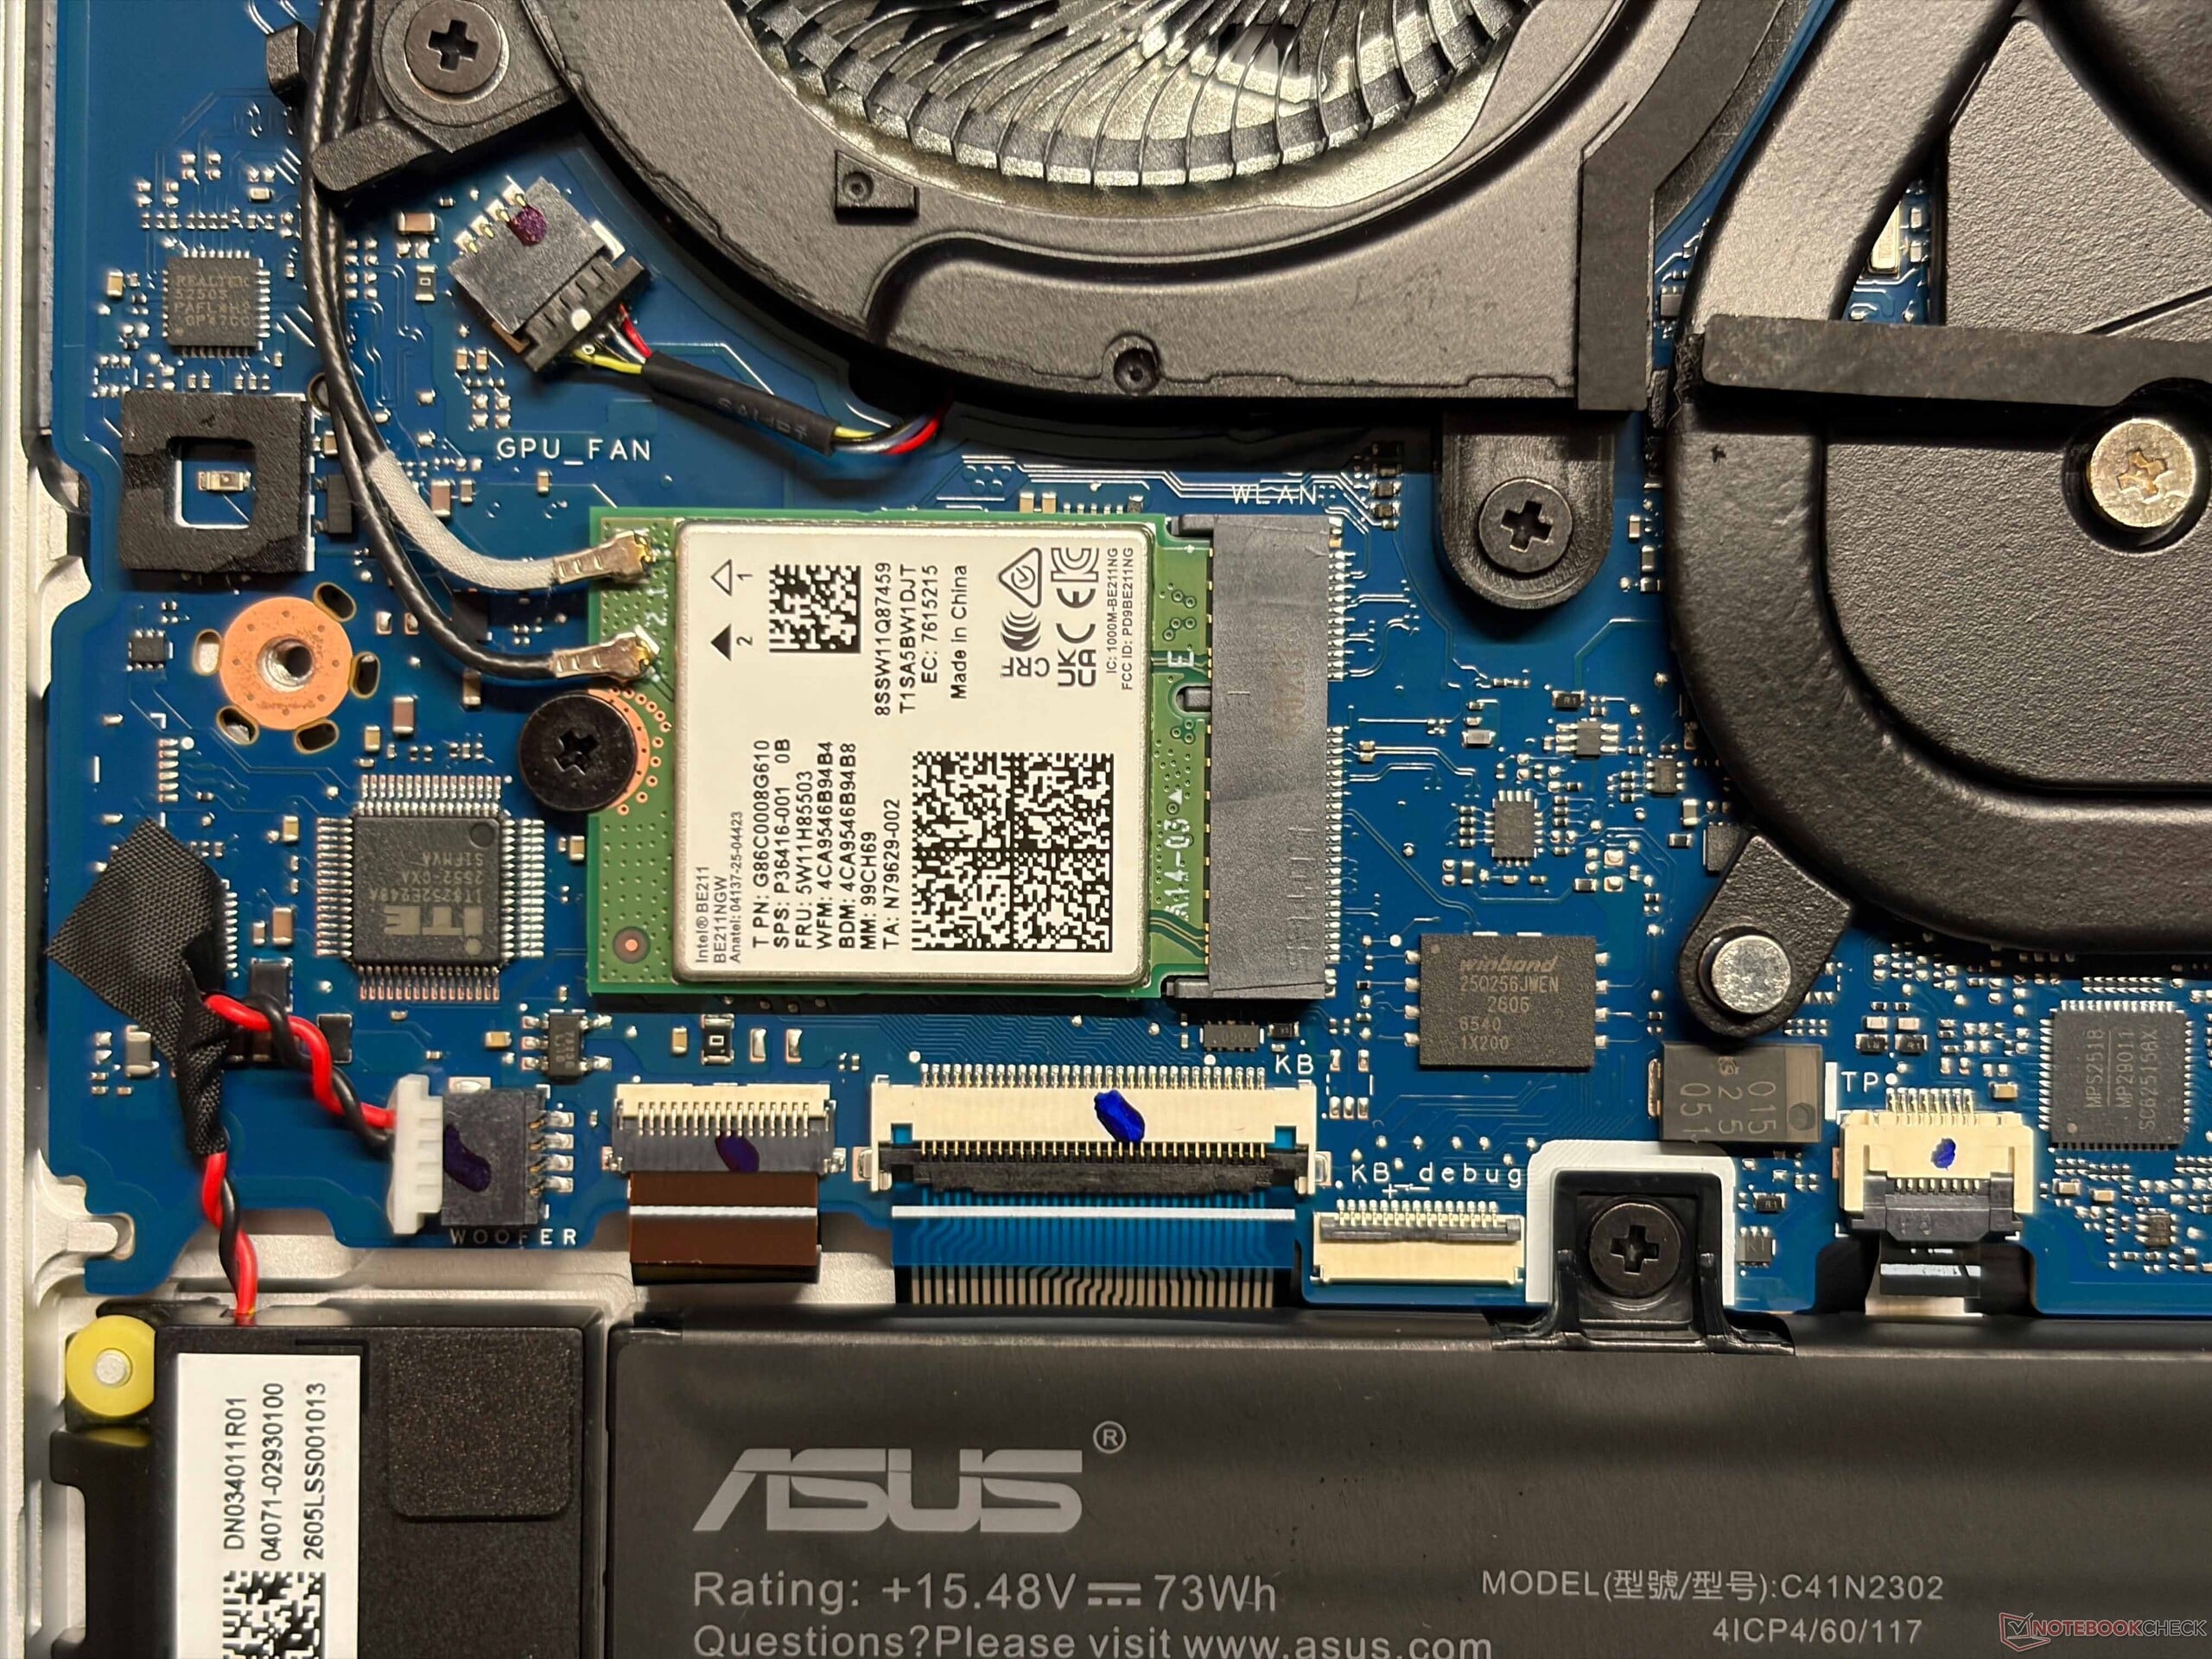
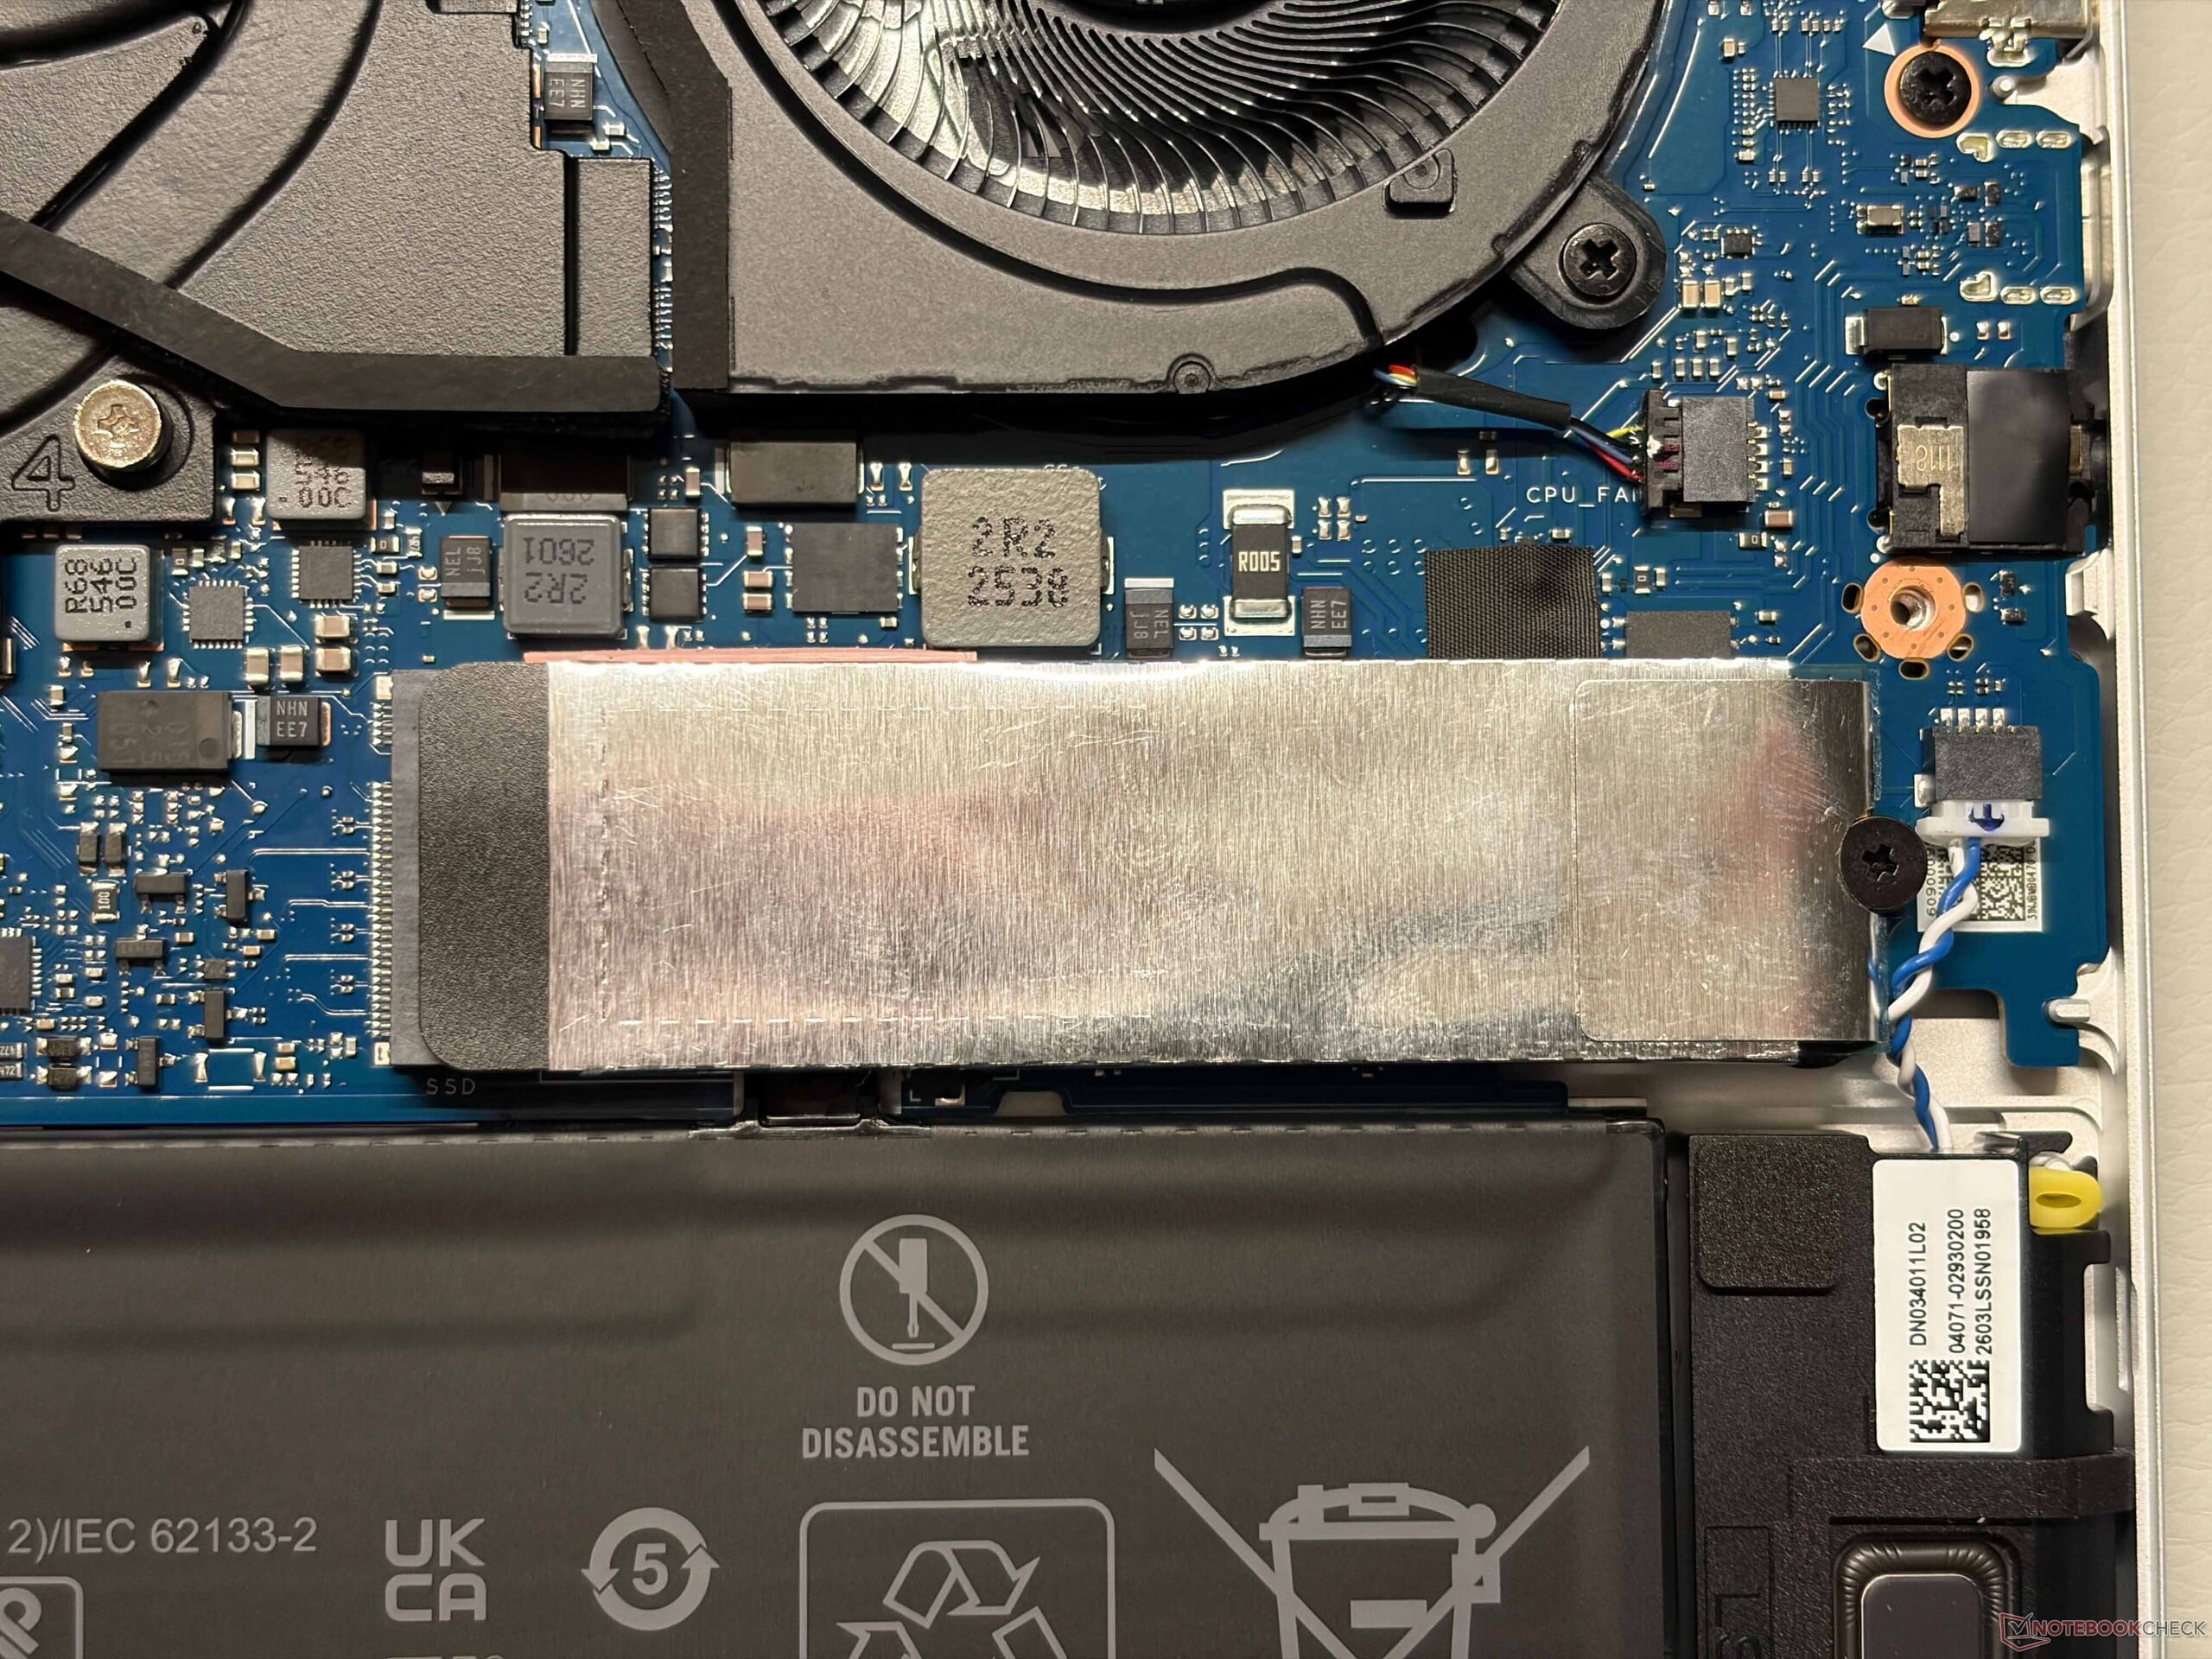
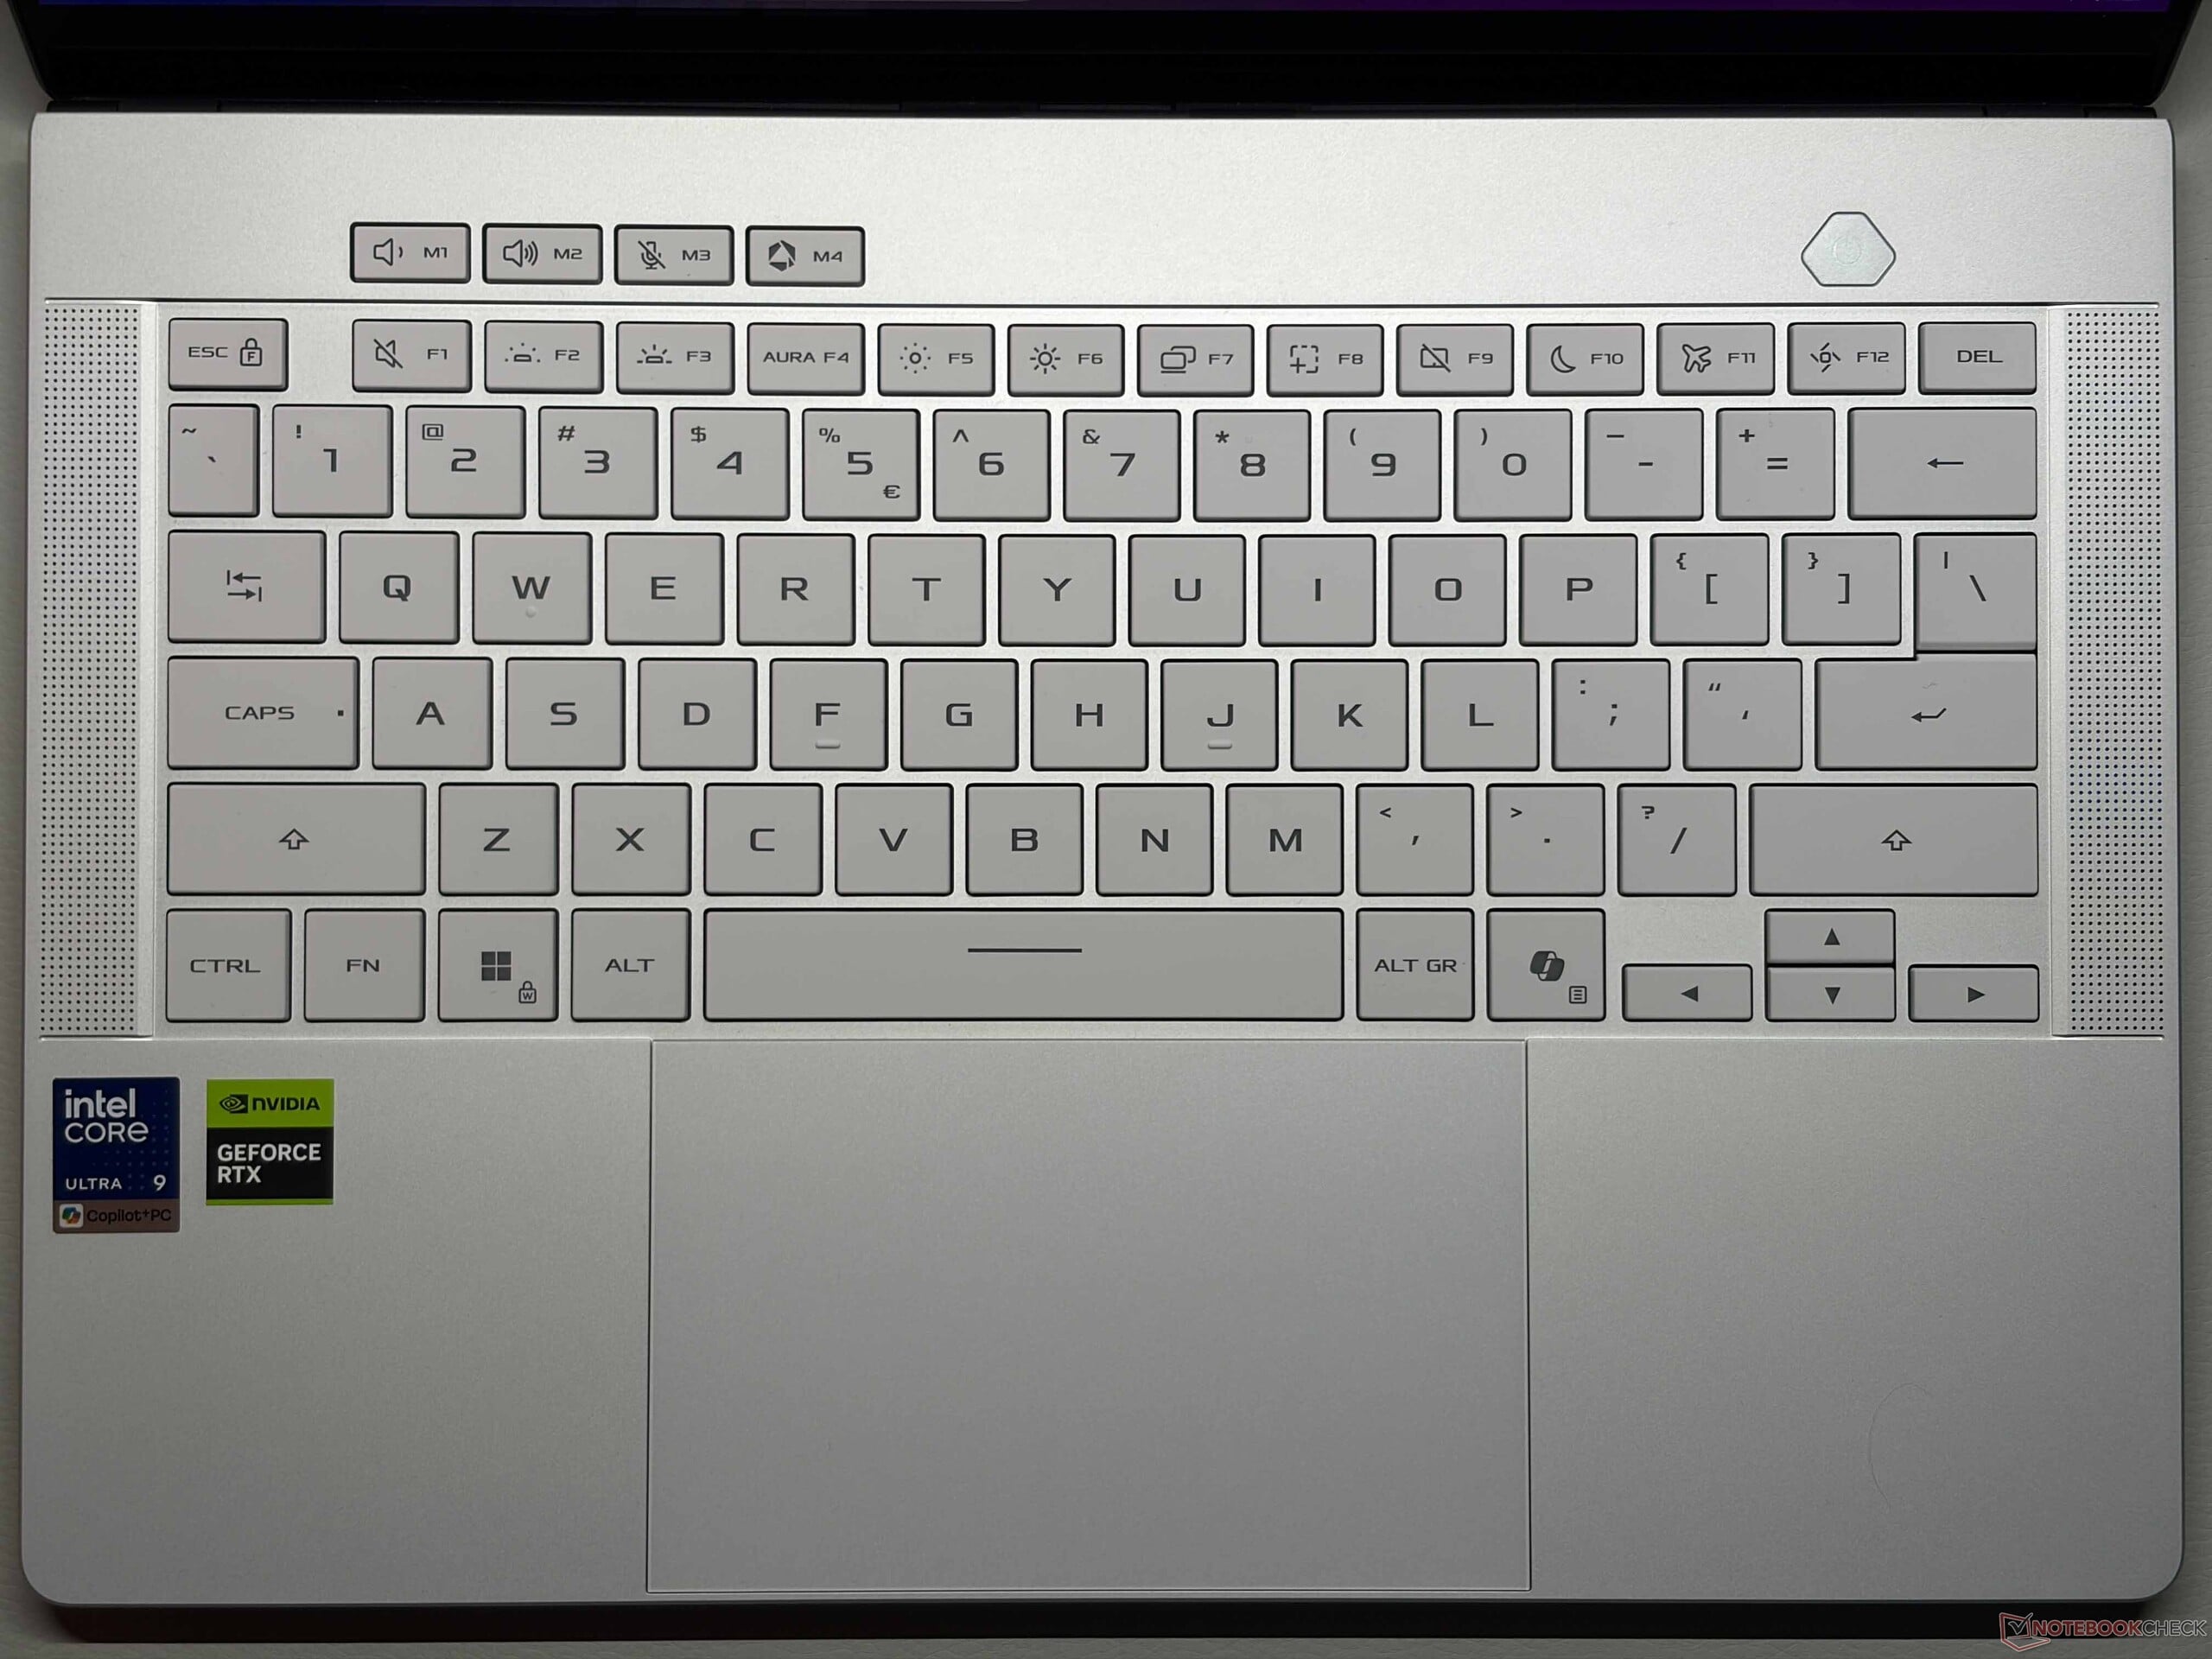
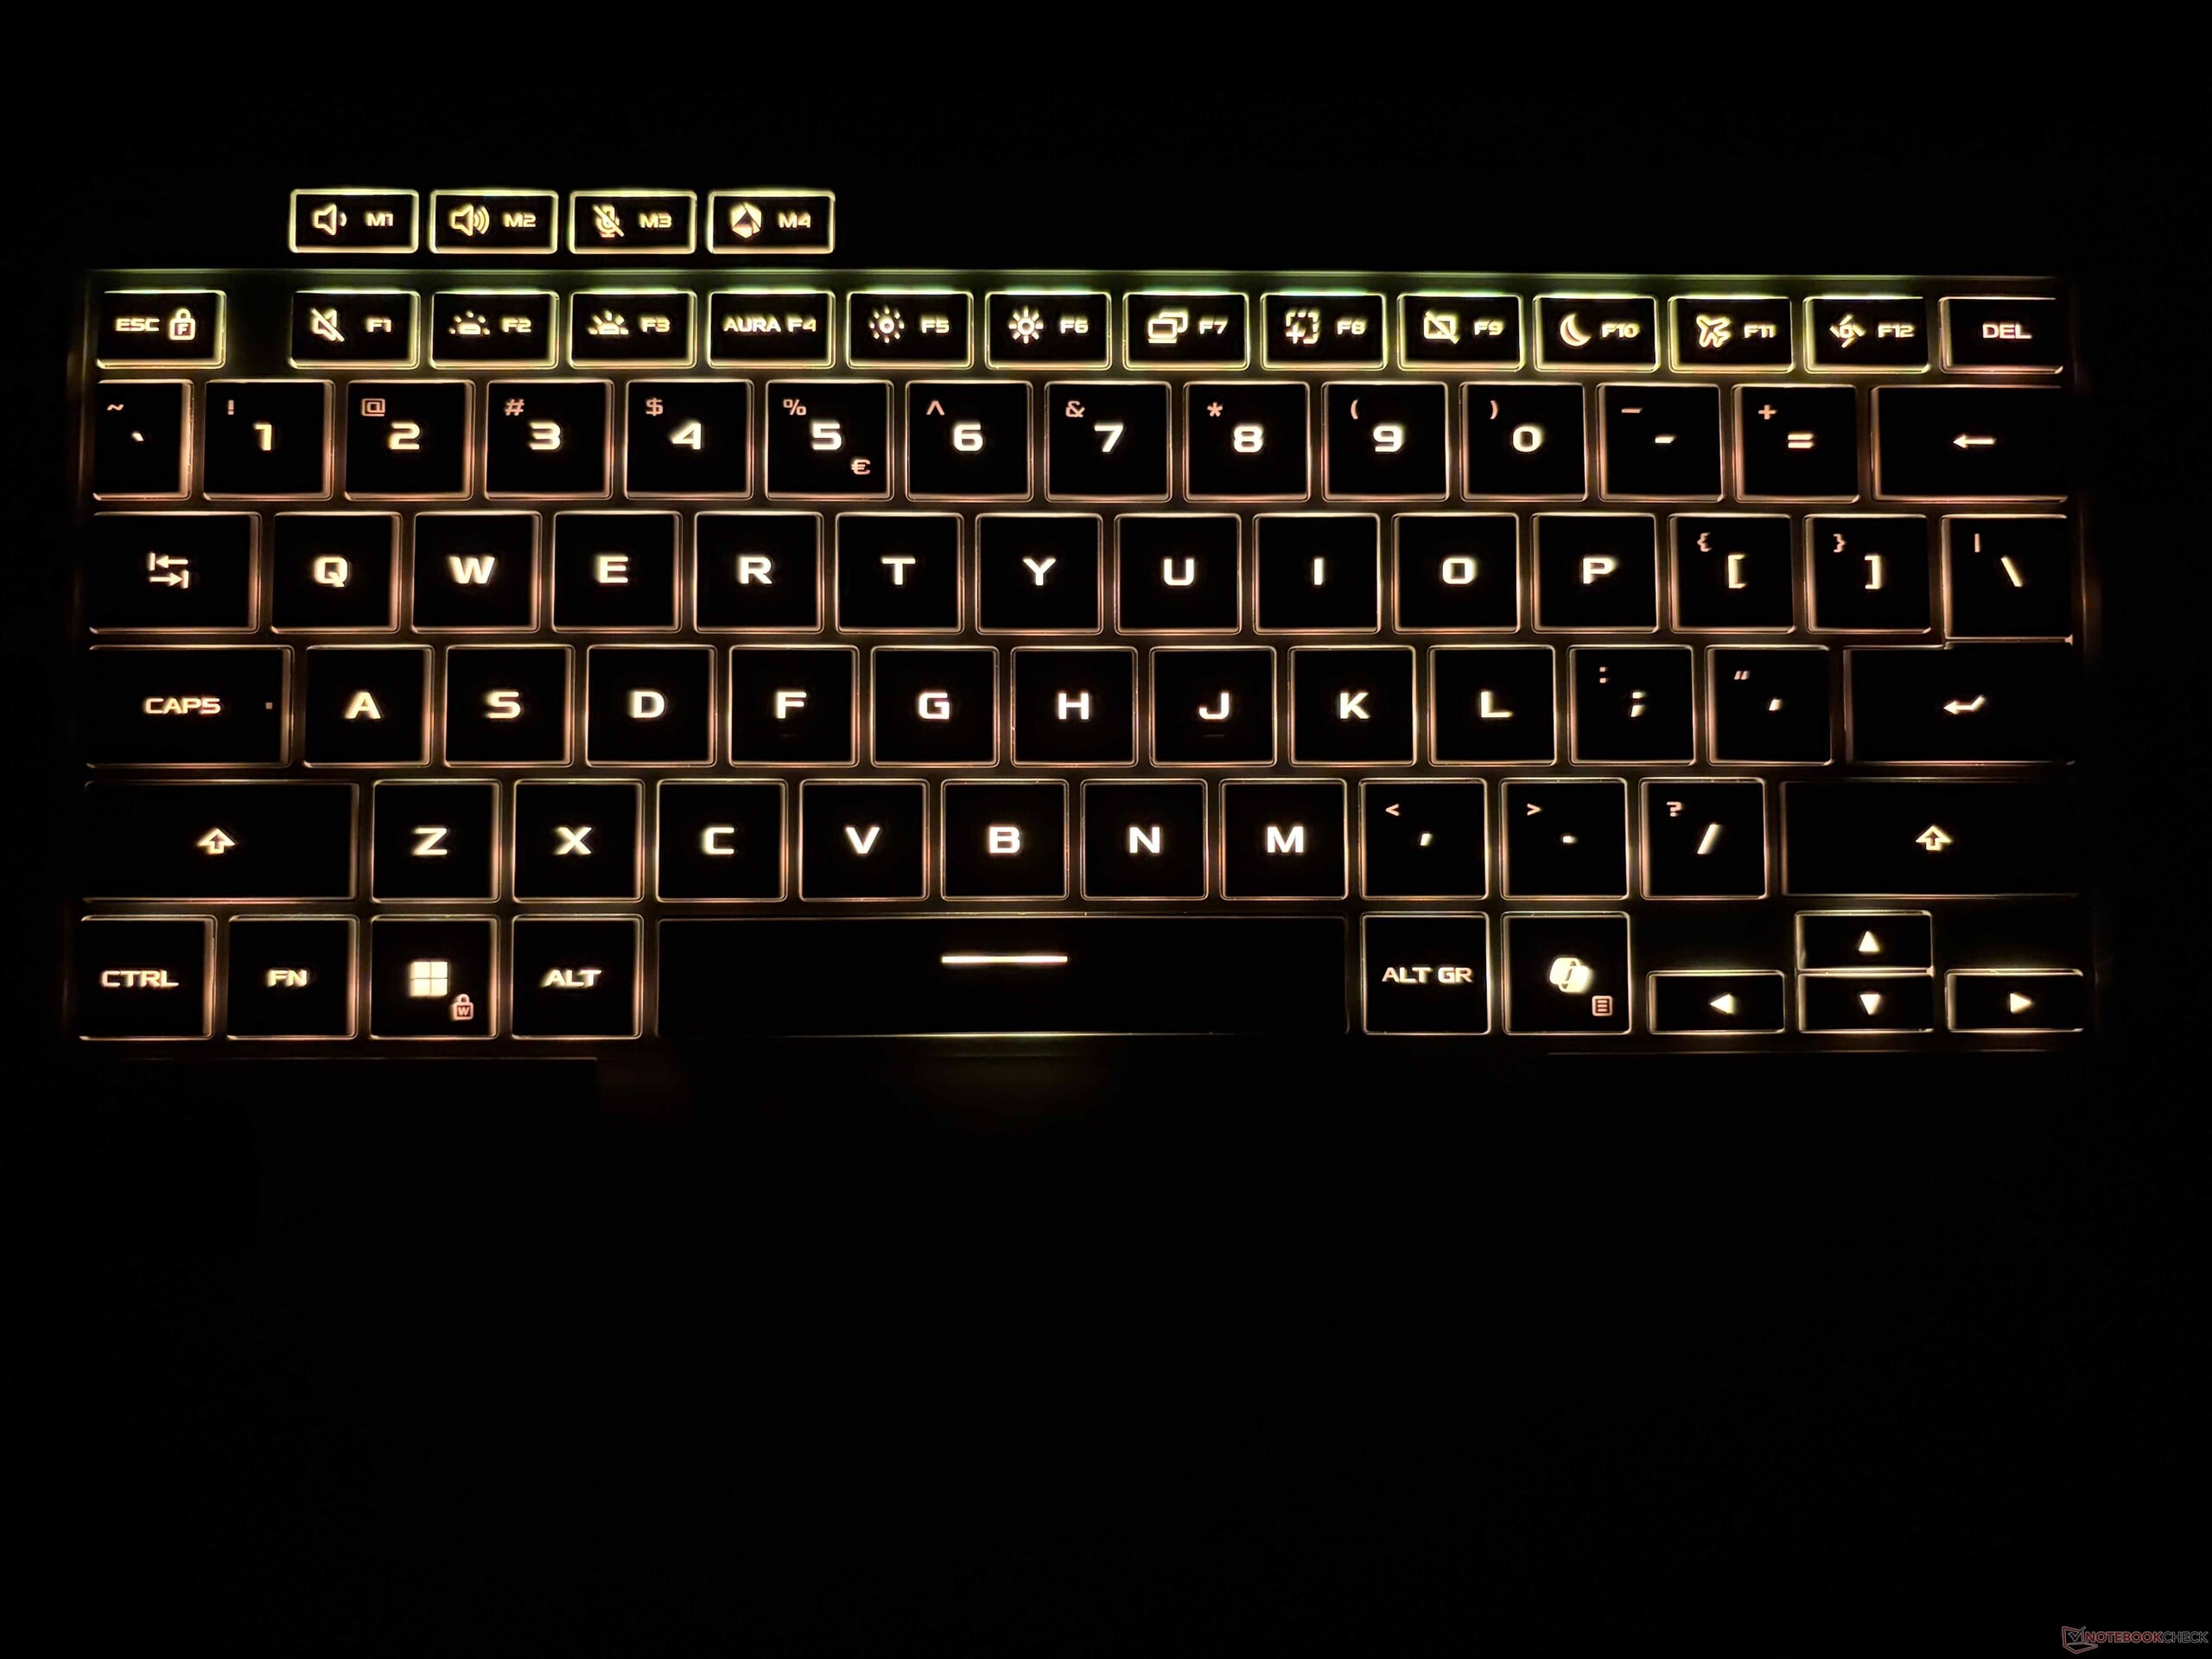
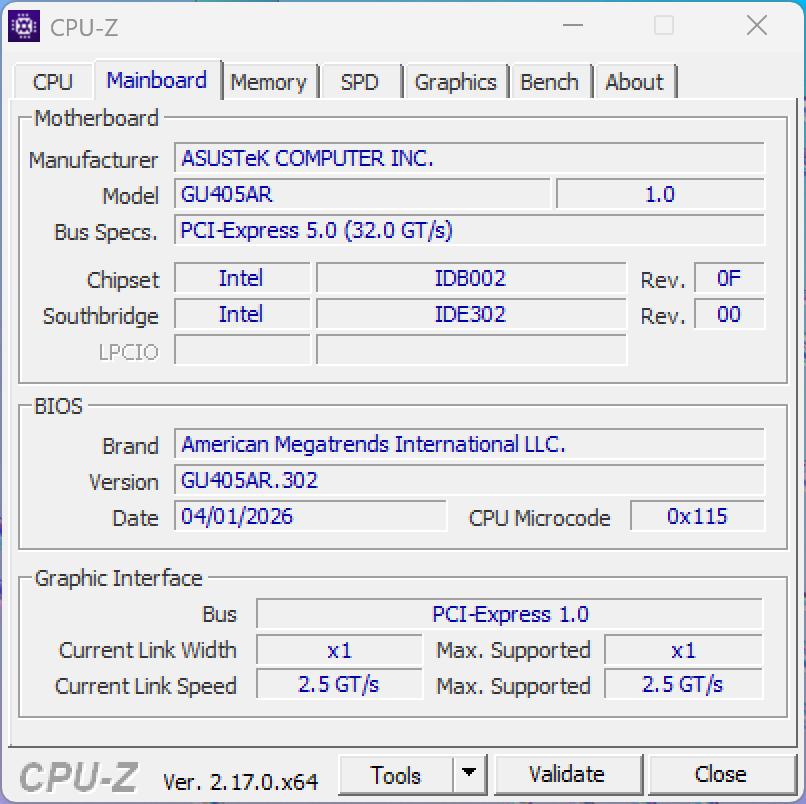
与 上一代产品相比,2026款ROG Zephyrus G14的外壳外观几乎没有变化,白色款依然非常漂亮。整体做工出色,这无疑是一款高端笔记本电脑。 华硕简化了内部组件的拆卸流程,因为机身背部的两个螺丝盖现在采用磁吸式设计,不再使用胶水固定。由于改用了英特尔处理器,内部布局略有调整,但 M.2-2280 SSD 和 Wi-Fi 模块依然可以更换。 键程为1.7毫米的键盘依然是市面上最舒适的笔记本键盘之一,触控板的点击手感出色,滑动顺畅,同样令人满意。
G14 现已支持 Thunderbolt 4 接口以及全尺寸 SD 卡读卡器。虽然不支持 SD-Express 标准,但传输速率仍高达 200 MB/s 以上。若搭配相应的路由器,Wi-Fi 7 模块的传输速度同样非常快。


| Networking | |
| Asus ROG Zephyrus G14 GU405AR | |
| iperf3 transmit Wi-Fi6/7 RT-BE96U | |
| iperf3 receive Wi-Fi6/7 RT-BE96U | |
| Acer Predator Triton 14 AI PT14-52 | |
| iperf3 receive AXE11000 | |
| iperf3 transmit AXE11000 | |
| Razer Blade 14 2025 | |
| iperf3 receive AXE11000 | |
| iperf3 transmit AXE11000 | |
| Asus ROG Zephyrus G14 2025 GA403WW | |
| iperf3 receive AXE11000 | |
| iperf3 transmit AXE11000 | |
| Apple MacBook Pro 14 2026 M5 Max | |
| iperf3 receive AXE11000 | |
| iperf3 transmit AXE11000 | |


显示屏——更亮的OLED
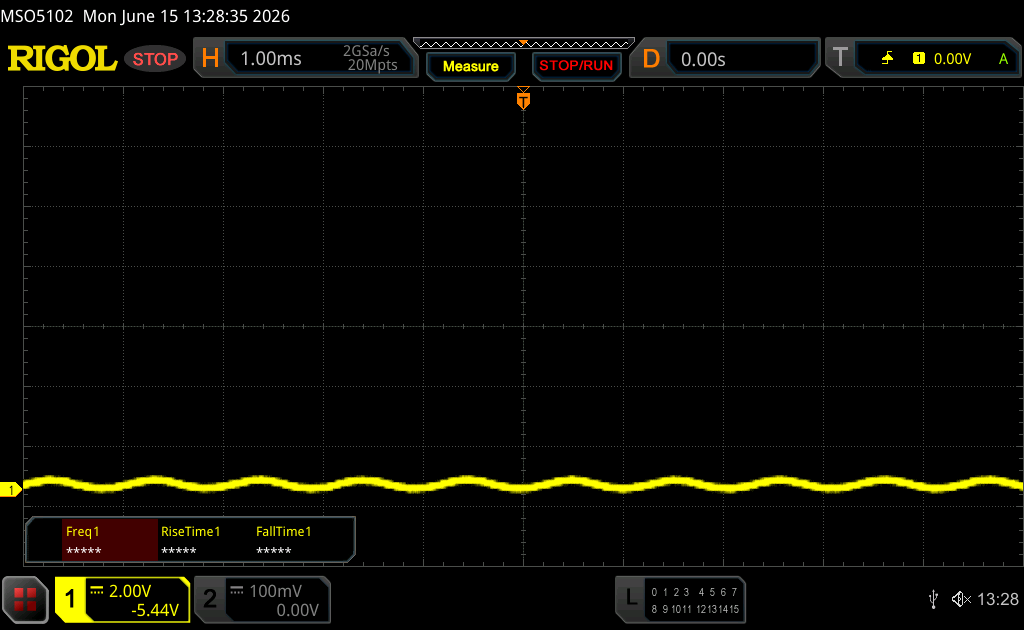
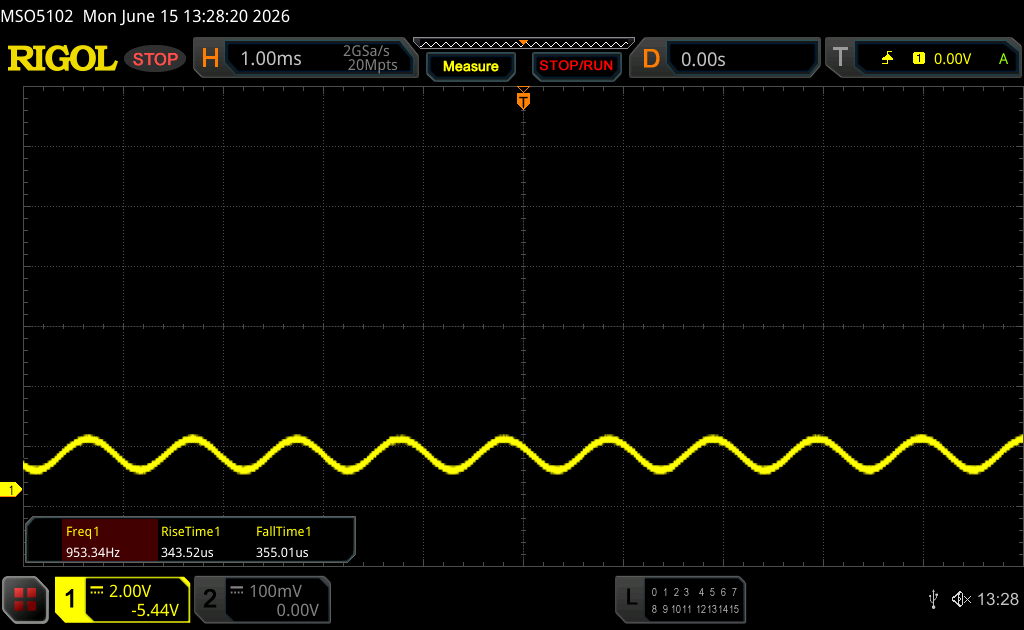
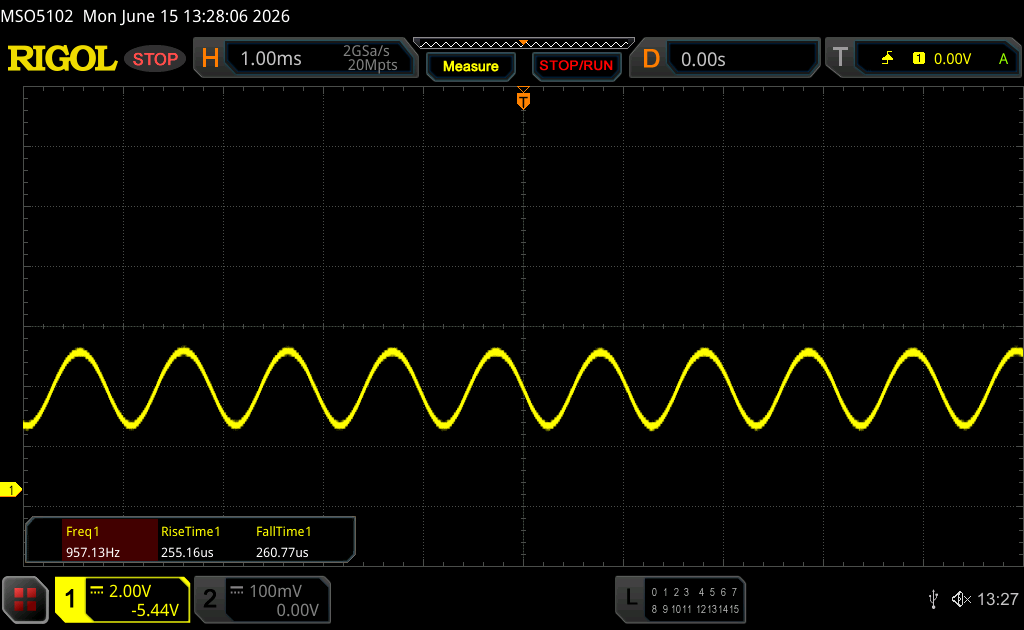
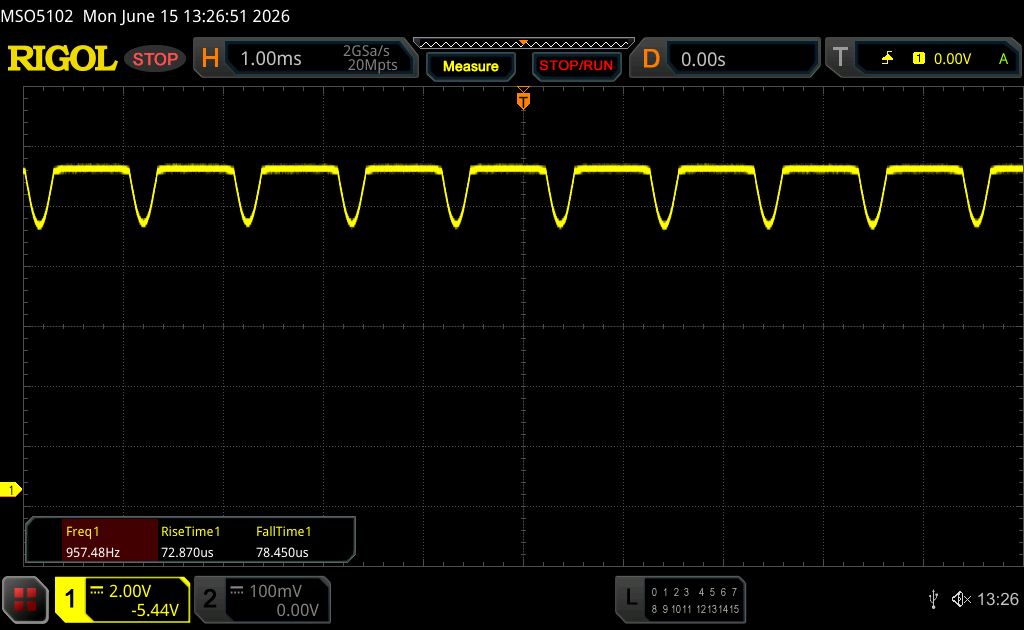
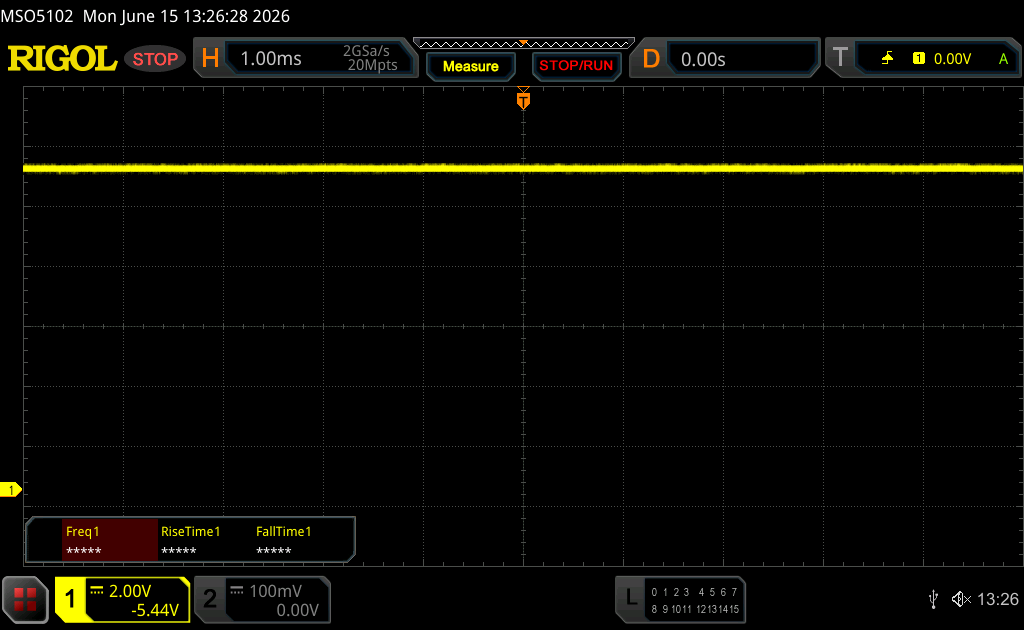
该 旧款G14 的OLED面板曾是其短板之一,因为在播放HDR内容时亮度相当有限。新款面板再次采用了2.8K分辨率和120Hz刷新率,但亮度已大幅提升。 我们使用专业级CalMAN软件进行的分析显示,新款2026机型已解决这一问题:SDR模式下的亮度略高于500尼特,而HDR内容的亮度最高可达1140尼特,因此不再有值得挑剔之处。 这款镜面面板虽不支持触控输入,但画质极佳,高亮内容也不会出现颗粒感。虽然存在PWM频闪,但频率高达960 Hz,且在大多数亮度级别下振幅都很低。华硕还通过软件提供了其无频闪的OLED调光功能。 该显示器再次提供了针对 P3 及 sRGB 的精准多色域配置文件,因此图像编辑毫无问题。我们尝试通过自行校准进一步提升色彩准确度,但未能成功。
| |||||||||||||||||||||||||
Brightness Distribution: 98 %
Center on Battery: 508 cd/m²
Contrast: 25400:1 (Black: 0.02 cd/m²)
ΔE ColorChecker Calman: 1.3 | ∀{0.5-29.43 Ø4.71}
ΔE Greyscale Calman: 2 | ∀{0.09-98 Ø4.96}
94.1% AdobeRGB 1998 (Argyll 3D)
100% sRGB (Argyll 3D)
99.8% Display P3 (Argyll 3D)
Gamma: 2.13
CCT: 6588 K
| Asus ROG Zephyrus G14 GU405AR ATNA40HQ06-0, OLED, 2880x1800, 14", 120 Hz | Acer Predator Triton 14 AI PT14-52 ATNA45AF03-0, OLED, 2880x1800, 14.5", 120 Hz | Razer Blade 14 2025 ATNA40CU05-0, OLED, 2880x1800, 14", 120 Hz | Asus ROG Zephyrus G14 2025 GA403WW ATNA40CU05-0, OLED, 2880x1800, 14", 120 Hz | Apple MacBook Pro 14 2025 M5 Mini-LED, 3024x1964, 14.2", 120 Hz | |
|---|---|---|---|---|---|
| Display | 0% | -2% | -1% | -2% | |
| Display P3 Coverage (%) | 99.8 | 99.6 0% | 99.5 0% | 99.6 0% | 99.5 0% |
| sRGB Coverage (%) | 100 | 99.9 0% | 100 0% | 100 0% | 100 0% |
| AdobeRGB 1998 Coverage (%) | 94.1 | 95.1 1% | 89.2 -5% | 89.9 -4% | 88.8 -6% |
| Response Times | 21% | 30% | 11% | -3978% | |
| Response Time Grey 50% / Grey 80% * (ms) | 2 ? | 0.48 ? 76% | 0.59 ? 70% | 0.62 ? 69% | 49.4 ? -2370% |
| Response Time Black / White * (ms) | 0.49 ? | 0.65 ? -33% | 0.63 ? -29% | 0.68 ? -39% | 47 ? -9492% |
| PWM Frequency (Hz) | 960 ? | 240 ? | 960 ? | 960 ? | 14900 |
| PWM Amplitude * (%) | 52 | 41 21% | 26 50% | 50 4% | 90 -73% |
| Screen | -41% | -20% | 30% | 22% | |
| Brightness middle (cd/m²) | 508 | 376 -26% | 361 -29% | 423 -17% | 633 25% |
| Brightness (cd/m²) | 514 | 377 -27% | 363 -29% | 424 -18% | 619 20% |
| Brightness Distribution (%) | 98 | 99 1% | 98 0% | 98 0% | 92 -6% |
| Black Level * (cd/m²) | 0.02 | 0.01 50% | |||
| Contrast (:1) | 25400 | 42300 67% | |||
| Colorchecker dE 2000 * | 1.3 | 2.7 -108% | 1.7 -31% | 0.7 46% | 1 23% |
| Colorchecker dE 2000 max. * | 3.5 | 5.3 -51% | 3.9 -11% | 1.8 49% | 2.2 37% |
| Greyscale dE 2000 * | 2 | 2.7 -35% | 2.4 -20% | 0.8 60% | 1.3 35% |
| Gamma | 2.13 103% | 2.23 99% | 2.14 103% | 2.18 101% | 2.2 100% |
| CCT | 6588 99% | 6138 106% | 6571 99% | 6505 100% | 6549 99% |
| Total Average (Program / Settings) | -7% /
-15% | 3% /
-3% | 13% /
19% | -1319% /
-984% |
* ... smaller is better


Display Response Times
| ↔ Response Time Black to White | ||
|---|---|---|
| 0.49 ms ... rise ↗ and fall ↘ combined | ↗ 0.27 ms rise | 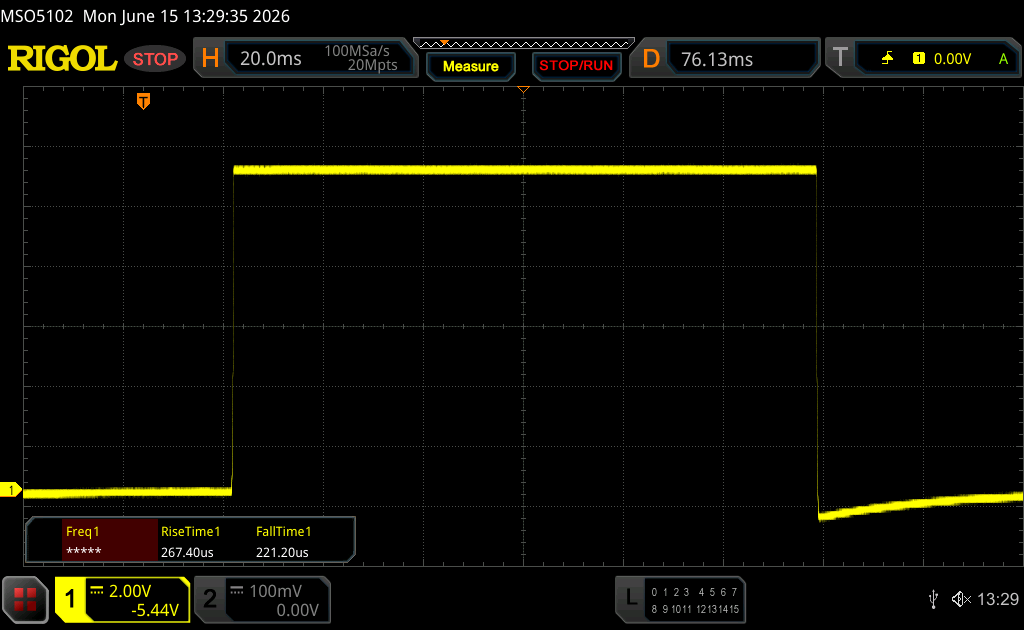 |
| ↘ 0.22 ms fall | ||
| The screen shows very fast response rates in our tests and should be very well suited for fast-paced gaming. In comparison, all tested devices range from 0.1 (minimum) to 240 (maximum) ms. » 1 % of all devices are better. This means that the measured response time is better than the average of all tested devices (19.8 ms). | ||
| ↔ Response Time 50% Grey to 80% Grey | ||
| 2 ms ... rise ↗ and fall ↘ combined | ↗ 1 ms rise | 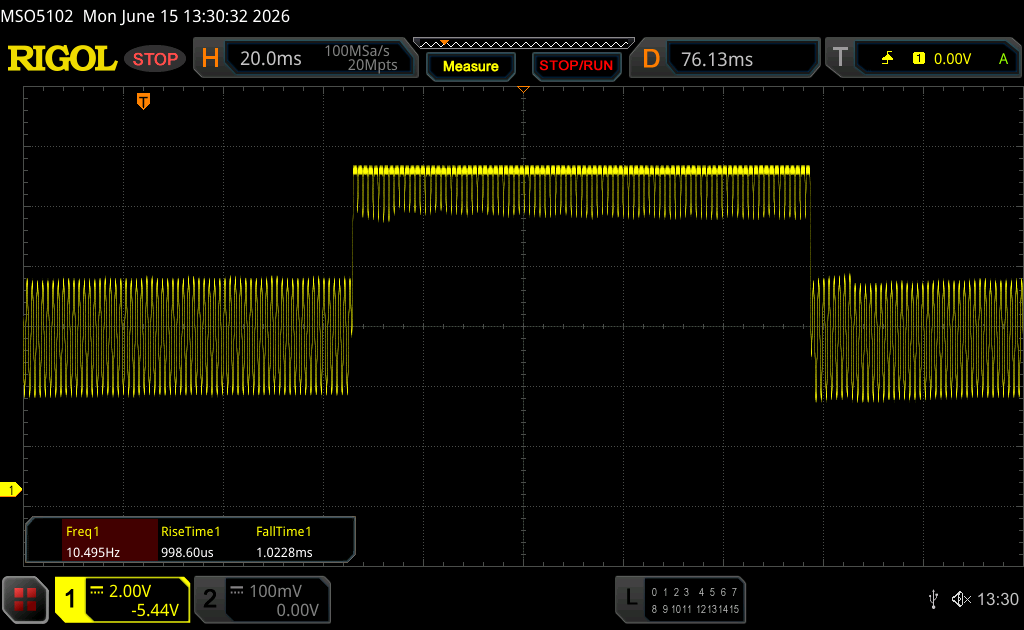 |
| ↘ 1 ms fall | ||
| The screen shows very fast response rates in our tests and should be very well suited for fast-paced gaming. In comparison, all tested devices range from 0.165 (minimum) to 636 (maximum) ms. » 10 % of all devices are better. This means that the measured response time is better than the average of all tested devices (30.9 ms). | ||
Screen Flickering / PWM (Pulse-Width Modulation)
| Screen flickering / PWM detected | 960 Hz Amplitude: 52 % | ≤ 90 % brightness setting | 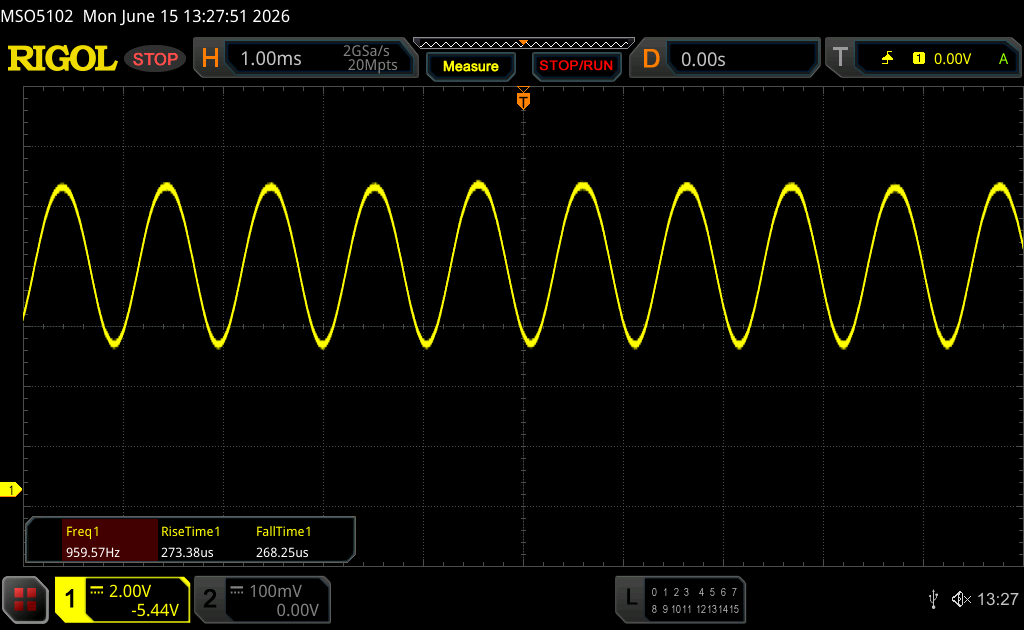 |
The display backlight flickers at 960 Hz (worst case, e.g., utilizing PWM) Flickering detected at a brightness setting of 90 % and below. There should be no flickering or PWM above this brightness setting. The frequency of 960 Hz is quite high, so most users sensitive to PWM should not notice any flickering. In comparison: 52 % of all tested devices do not use PWM to dim the display. If PWM was detected, an average of 7741 (minimum: 5 - maximum: 343500) Hz was measured. | |||


演出——潘瑟湖与布莱克韦尔
测试条件
华硕提供了大家熟悉的电源模式,若要获得最高的显卡性能,则需要启用“Turbo”模式。在日常使用场景中,您可以轻松使用“静音”模式 ,因为只要不需要独立显卡,CPU的性能几乎没有差异,而且完全足够。
| 能耗概况 | CPU TDP | CB24 Multi | GPU TGP | Time Spy 图形性能 | 《赛博朋克2077》QHD 极高画质 | 风扇最大噪音 |
|---|---|---|---|---|---|---|
| 静音模式 | 65/50 W | 1169 分 | 80/45 W | 9267 分 | 43.8 fps | 38.2 dB(A) |
| 性能 | 65/50 W | 1173 分 | 95 W | 14774 分 | 69.5 fps | 49.8 dB(A) |
| Turbo | 70 W | 1262 分 | 115 W | 16295 分 | 77.4 fps | 55.5 dB(A) |
| 电池(性能) | 54 W | 1209 分 | 45 W | 8115 分 | 39.3 fps | 38.2 dB(A) |
处理器性能
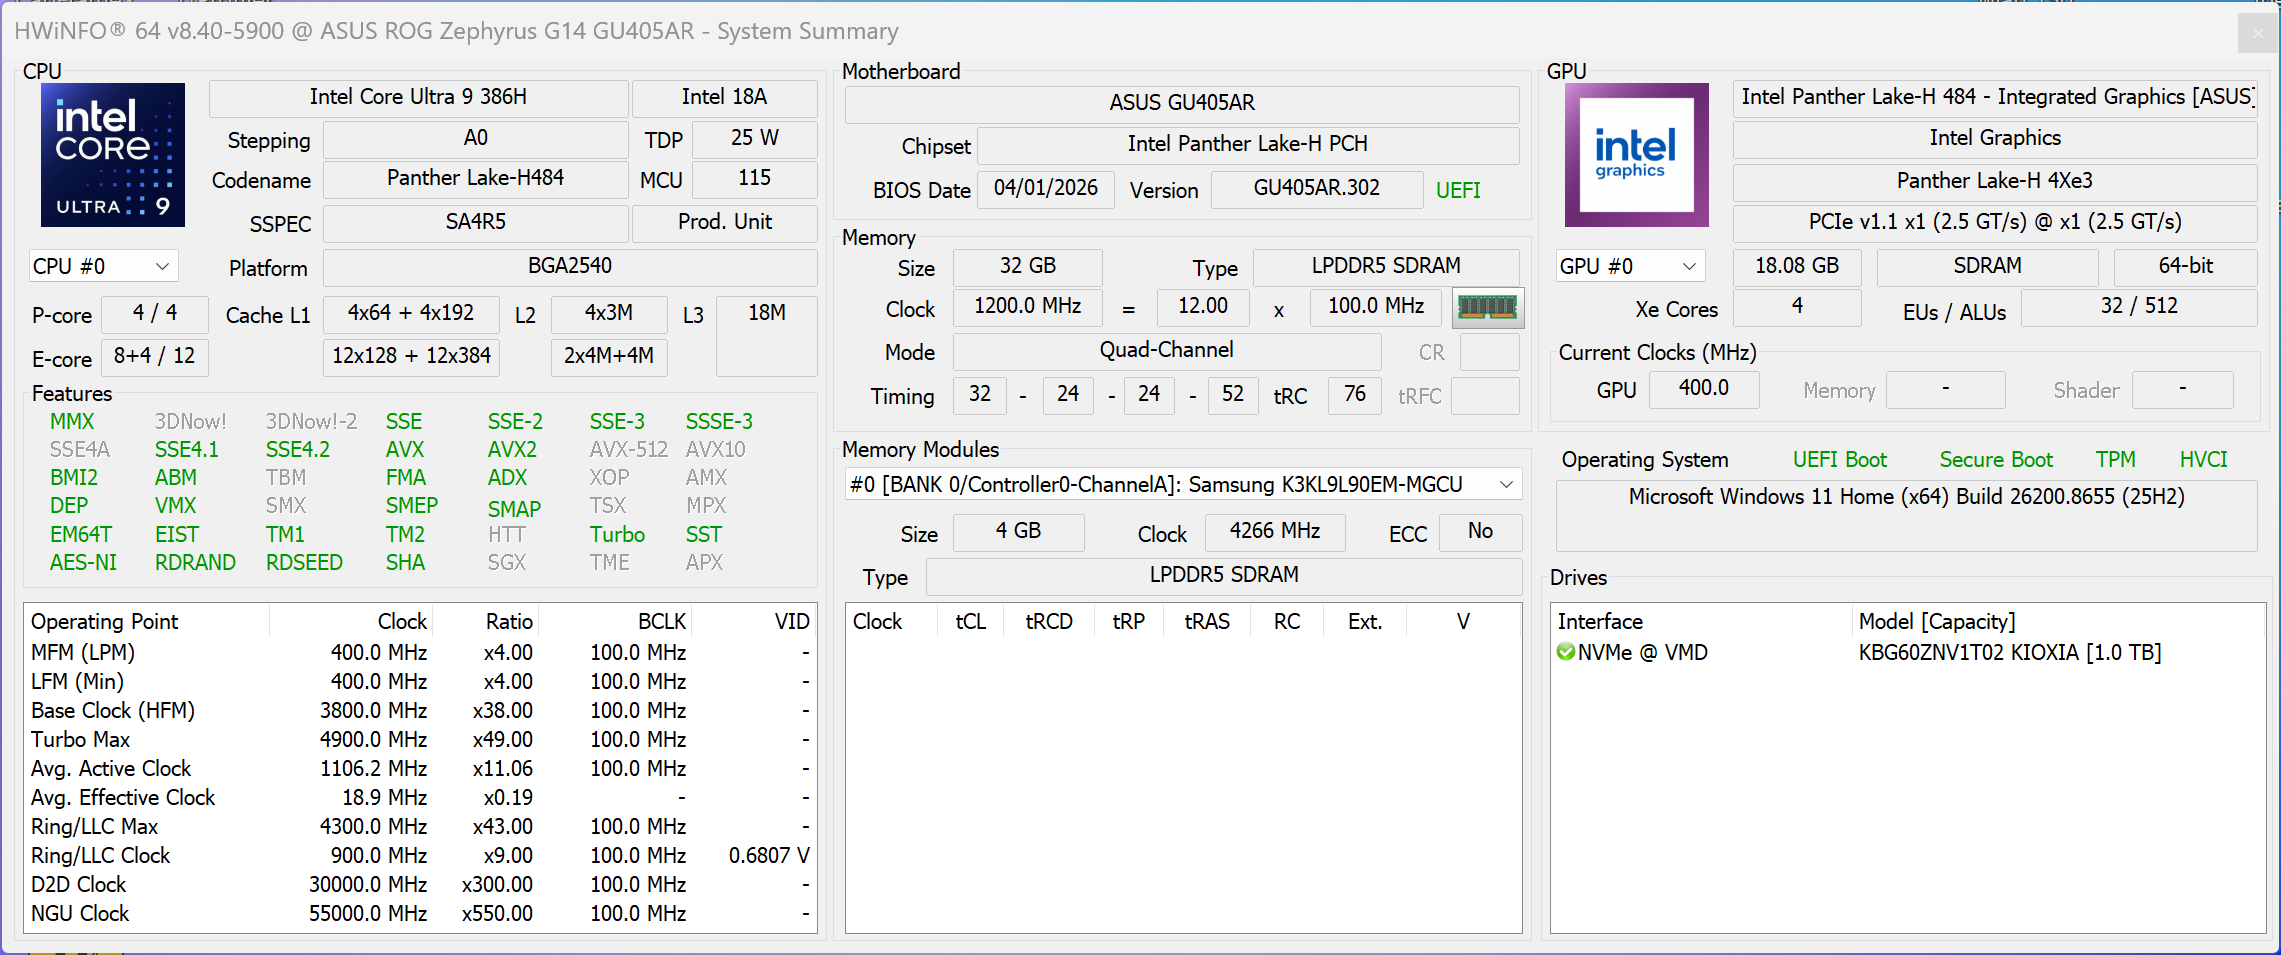
华硕将 AMD Ryzen 处理器替换为英特尔的新款 Panther Lake 型号。虽然这提升了单核处理器性能和能效(我们稍后将看到),但根据不同基准测试的结果,其多核原始性能要么与原版相当,要么略低。我们关于电源模式的表格还显示, Core Ultra 9 386H 并未真正受益于更高的功耗限制,例如从“静音模式” 切换到“涡轮模式” 时,性能提升微乎其微。
Cinebench R15 多循环测试
Cinebench 2024: CPU Multi Core | CPU Single Core
Cinebench R23: Multi Core | Single Core
Cinebench R20: CPU (Multi Core) | CPU (Single Core)
Cinebench R15: CPU Multi 64Bit | CPU Single 64Bit
Blender: v2.79 BMW27 CPU
7-Zip 18.03: 7z b 4 | 7z b 4 -mmt1
Geekbench 6.7: Multi-Core | Single-Core
Geekbench 5.5: Multi-Core | Single-Core
HWBOT x265 Benchmark v2.2: 4k Preset
LibreOffice : 20 Documents To PDF
R Benchmark 2.5: Overall mean
| CPU Performance rating | |
| Apple MacBook Pro 14 2026 M5 Max -14! | |
| Average of class Gaming | |
| Asus ROG Zephyrus G14 2025 GA403WW | |
| Asus ROG Zephyrus G14 GU405AR | |
| Average Intel Core Ultra 9 386H | |
| Razer Blade 14 2025 | |
| Acer Predator Triton 14 AI PT14-52 | |
| Cinebench 2024 / CPU Multi Core | |
| Apple MacBook Pro 14 2026 M5 Max | |
| Average of class Gaming (486 - 2327, n=88, last 2 years) | |
| Asus ROG Zephyrus G14 GU405AR | |
| Asus ROG Zephyrus G14 2025 GA403WW | |
| Average Intel Core Ultra 9 386H (873 - 1271, n=8) | |
| Razer Blade 14 2025 | |
| Acer Predator Triton 14 AI PT14-52 | |
| Cinebench 2024 / CPU Single Core | |
| Apple MacBook Pro 14 2026 M5 Max | |
| Acer Predator Triton 14 AI PT14-52 | |
| Average Intel Core Ultra 9 386H (118.1 - 126.8, n=8) | |
| Average of class Gaming (95 - 141, n=88, last 2 years) | |
| Asus ROG Zephyrus G14 GU405AR | |
| Asus ROG Zephyrus G14 2025 GA403WW | |
| Razer Blade 14 2025 | |
| Cinebench R23 / Multi Core | |
| Average of class Gaming (10488 - 42661, n=104, last 2 years) | |
| Asus ROG Zephyrus G14 2025 GA403WW | |
| Asus ROG Zephyrus G14 GU405AR | |
| Razer Blade 14 2025 | |
| Average Intel Core Ultra 9 386H (12144 - 21186, n=8) | |
| Acer Predator Triton 14 AI PT14-52 | |
| Cinebench R23 / Single Core | |
| Average Intel Core Ultra 9 386H (2010 - 2101, n=8) | |
| Average of class Gaming (1601 - 2415, n=104, last 2 years) | |
| Acer Predator Triton 14 AI PT14-52 | |
| Asus ROG Zephyrus G14 GU405AR | |
| Asus ROG Zephyrus G14 2025 GA403WW | |
| Razer Blade 14 2025 | |
| Cinebench R20 / CPU (Multi Core) | |
| Average of class Gaming (4029 - 16433, n=103, last 2 years) | |
| Asus ROG Zephyrus G14 2025 GA403WW | |
| Asus ROG Zephyrus G14 GU405AR | |
| Razer Blade 14 2025 | |
| Average Intel Core Ultra 9 386H (4757 - 8405, n=8) | |
| Acer Predator Triton 14 AI PT14-52 | |
| Cinebench R20 / CPU (Single Core) | |
| Asus ROG Zephyrus G14 2025 GA403WW | |
| Average Intel Core Ultra 9 386H (762 - 796, n=8) | |
| Average of class Gaming (622 - 913, n=103, last 2 years) | |
| Razer Blade 14 2025 | |
| Acer Predator Triton 14 AI PT14-52 | |
| Asus ROG Zephyrus G14 GU405AR | |
| Cinebench R15 / CPU Multi 64Bit | |
| Average of class Gaming (1578 - 6330, n=102, last 2 years) | |
| Asus ROG Zephyrus G14 2025 GA403WW | |
| Asus ROG Zephyrus G14 GU405AR | |
| Average Intel Core Ultra 9 386H (2197 - 3347, n=8) | |
| Razer Blade 14 2025 | |
| Acer Predator Triton 14 AI PT14-52 | |
| Cinebench R15 / CPU Single 64Bit | |
| Acer Predator Triton 14 AI PT14-52 | |
| Asus ROG Zephyrus G14 2025 GA403WW | |
| Asus ROG Zephyrus G14 GU405AR | |
| Average of class Gaming (188.8 - 350, n=103, last 2 years) | |
| Average Intel Core Ultra 9 386H (249 - 314, n=8) | |
| Razer Blade 14 2025 | |
| Blender / v2.79 BMW27 CPU | |
| Acer Predator Triton 14 AI PT14-52 | |
| Average Intel Core Ultra 9 386H (156 - 299, n=8) | |
| Razer Blade 14 2025 | |
| Asus ROG Zephyrus G14 GU405AR | |
| Average of class Gaming (79 - 330, n=101, last 2 years) | |
| Asus ROG Zephyrus G14 2025 GA403WW | |
| 7-Zip 18.03 / 7z b 4 | |
| Average of class Gaming (33491 - 148086, n=102, last 2 years) | |
| Asus ROG Zephyrus G14 2025 GA403WW | |
| Asus ROG Zephyrus G14 GU405AR | |
| Razer Blade 14 2025 | |
| Average Intel Core Ultra 9 386H (44980 - 72882, n=8) | |
| Acer Predator Triton 14 AI PT14-52 | |
| 7-Zip 18.03 / 7z b 4 -mmt1 | |
| Average of class Gaming (4824 - 7436, n=102, last 2 years) | |
| Asus ROG Zephyrus G14 GU405AR | |
| Average Intel Core Ultra 9 386H (5488 - 6493, n=8) | |
| Asus ROG Zephyrus G14 2025 GA403WW | |
| Razer Blade 14 2025 | |
| Acer Predator Triton 14 AI PT14-52 | |
| Geekbench 6.7 / Multi-Core | |
| Apple MacBook Pro 14 2026 M5 Max | |
| Asus ROG Zephyrus G14 GU405AR | |
| Average Intel Core Ultra 9 386H (13776 - 17405, n=10) | |
| Average of class Gaming (6625 - 22850, n=103, last 2 years) | |
| Asus ROG Zephyrus G14 2025 GA403WW | |
| Razer Blade 14 2025 | |
| Acer Predator Triton 14 AI PT14-52 | |
| Geekbench 6.7 / Single-Core | |
| Apple MacBook Pro 14 2026 M5 Max | |
| Asus ROG Zephyrus G14 2025 GA403WW | |
| Razer Blade 14 2025 | |
| Acer Predator Triton 14 AI PT14-52 | |
| Average of class Gaming (1982 - 3259, n=103, last 2 years) | |
| Average Intel Core Ultra 9 386H (2778 - 2919, n=10) | |
| Asus ROG Zephyrus G14 GU405AR | |
| Geekbench 5.5 / Multi-Core | |
| Average of class Gaming (6460 - 28263, n=102, last 2 years) | |
| Asus ROG Zephyrus G14 GU405AR | |
| Average Intel Core Ultra 9 386H (13098 - 17557, n=8) | |
| Asus ROG Zephyrus G14 2025 GA403WW | |
| Razer Blade 14 2025 | |
| Acer Predator Triton 14 AI PT14-52 | |
| Geekbench 5.5 / Single-Core | |
| Asus ROG Zephyrus G14 2025 GA403WW | |
| Razer Blade 14 2025 | |
| Average Intel Core Ultra 9 386H (1992 - 2162, n=8) | |
| Acer Predator Triton 14 AI PT14-52 | |
| Average of class Gaming (1403 - 2474, n=102, last 2 years) | |
| Asus ROG Zephyrus G14 GU405AR | |
| HWBOT x265 Benchmark v2.2 / 4k Preset | |
| Average of class Gaming (11.5 - 44.4, n=102, last 2 years) | |
| Asus ROG Zephyrus G14 2025 GA403WW | |
| Asus ROG Zephyrus G14 GU405AR | |
| Razer Blade 14 2025 | |
| Average Intel Core Ultra 9 386H (13.2 - 25.1, n=8) | |
| Acer Predator Triton 14 AI PT14-52 | |
| LibreOffice / 20 Documents To PDF | |
| Razer Blade 14 2025 | |
| Asus ROG Zephyrus G14 2025 GA403WW | |
| Average of class Gaming (33.2 - 88.8, n=102, last 2 years) | |
| Average Intel Core Ultra 9 386H (38.5 - 56.1, n=8) | |
| Asus ROG Zephyrus G14 GU405AR | |
| Acer Predator Triton 14 AI PT14-52 | |
| R Benchmark 2.5 / Overall mean | |
| Asus ROG Zephyrus G14 GU405AR | |
| Average Intel Core Ultra 9 386H (0.4055 - 0.4384, n=8) | |
| Average of class Gaming (0.3439 - 0.59, n=102, last 2 years) | |
| Acer Predator Triton 14 AI PT14-52 | |
| Razer Blade 14 2025 | |
| Asus ROG Zephyrus G14 2025 GA403WW | |
* ... smaller is better
AIDA64: FP32 Ray-Trace | FPU Julia | CPU SHA3 | CPU Queen | FPU SinJulia | FPU Mandel | CPU AES | CPU ZLib | FP64 Ray-Trace | CPU PhotoWorxx | CPU CheckMate
| Performance rating | |
| Asus ROG Zephyrus G14 2025 GA403WW -1! | |
| Average of class Gaming | |
| Razer Blade 14 2025 -1! | |
| Asus ROG Zephyrus G14 GU405AR -1! | |
| Average Intel Core Ultra 9 386H -1! | |
| Acer Predator Triton 14 AI PT14-52 -1! | |
| AIDA64 / FP32 Ray-Trace | |
| Asus ROG Zephyrus G14 2025 GA403WW (v6.92.6600) | |
| Average of class Gaming (10227 - 85542, n=102, last 2 years) | |
| Razer Blade 14 2025 (v6.92.6600) | |
| Asus ROG Zephyrus G14 GU405AR (v8.20.8100) | |
| Average Intel Core Ultra 9 386H (10001 - 21727, n=8) | |
| Acer Predator Triton 14 AI PT14-52 (v6.92.6600) | |
| AIDA64 / FPU Julia | |
| Average of class Gaming (51376 - 372155, n=102, last 2 years) | |
| Asus ROG Zephyrus G14 2025 GA403WW (v6.92.6600) | |
| Razer Blade 14 2025 (v6.92.6600) | |
| Asus ROG Zephyrus G14 GU405AR (v8.20.8100) | |
| Average Intel Core Ultra 9 386H (53370 - 113595, n=8) | |
| Acer Predator Triton 14 AI PT14-52 (v6.92.6600) | |
| AIDA64 / CPU SHA3 | |
| Average of class Gaming (2180 - 10115, n=102, last 2 years) | |
| Asus ROG Zephyrus G14 2025 GA403WW (v6.92.6600) | |
| Asus ROG Zephyrus G14 GU405AR (v8.20.8100) | |
| Razer Blade 14 2025 (v6.92.6600) | |
| Average Intel Core Ultra 9 386H (2776 - 5604, n=8) | |
| Acer Predator Triton 14 AI PT14-52 (v6.92.6600) | |
| AIDA64 / CPU Queen | |
| Average of class Gaming (49785 - 173351, n=86, last 2 years) | |
| Asus ROG Zephyrus G14 2025 GA403WW (v6.92.6600) | |
| Razer Blade 14 2025 (v6.92.6600) | |
| Acer Predator Triton 14 AI PT14-52 (v6.92.6600) | |
| AIDA64 / FPU SinJulia | |
| Asus ROG Zephyrus G14 2025 GA403WW (v6.92.6600) | |
| Razer Blade 14 2025 (v6.92.6600) | |
| Average of class Gaming (4424 - 33636, n=102, last 2 years) | |
| Asus ROG Zephyrus G14 GU405AR (v8.20.8100) | |
| Average Intel Core Ultra 9 386H (5314 - 7332, n=8) | |
| Acer Predator Triton 14 AI PT14-52 (v6.92.6600) | |
| AIDA64 / FPU Mandel | |
| Asus ROG Zephyrus G14 2025 GA403WW (v6.92.6600) | |
| Average of class Gaming (25115 - 196829, n=102, last 2 years) | |
| Razer Blade 14 2025 (v6.92.6600) | |
| Asus ROG Zephyrus G14 GU405AR (v8.20.8100) | |
| Average Intel Core Ultra 9 386H (28414 - 61578, n=8) | |
| Acer Predator Triton 14 AI PT14-52 (v6.92.6600) | |
| AIDA64 / CPU AES | |
| Asus ROG Zephyrus G14 2025 GA403WW (v6.92.6600) | |
| Average of class Gaming (39258 - 247074, n=102, last 2 years) | |
| Razer Blade 14 2025 (v6.92.6600) | |
| Asus ROG Zephyrus G14 GU405AR (v8.20.8100) | |
| Average Intel Core Ultra 9 386H (46362 - 72112, n=8) | |
| Acer Predator Triton 14 AI PT14-52 (v6.92.6600) | |
| AIDA64 / CPU ZLib | |
| Average of class Gaming (574 - 2531, n=102, last 2 years) | |
| Asus ROG Zephyrus G14 2025 GA403WW (v6.92.6600) | |
| Razer Blade 14 2025 (v6.92.6600) | |
| Asus ROG Zephyrus G14 GU405AR (v8.20.8100) | |
| Average Intel Core Ultra 9 386H (669 - 1271, n=8) | |
| Acer Predator Triton 14 AI PT14-52 (v6.92.6600) | |
| AIDA64 / FP64 Ray-Trace | |
| Asus ROG Zephyrus G14 2025 GA403WW (v6.92.6600) | |
| Average of class Gaming (5509 - 45446, n=102, last 2 years) | |
| Razer Blade 14 2025 (v6.92.6600) | |
| Asus ROG Zephyrus G14 GU405AR (v8.20.8100) | |
| Average Intel Core Ultra 9 386H (5138 - 11627, n=8) | |
| Acer Predator Triton 14 AI PT14-52 (v6.92.6600) | |
| AIDA64 / CPU PhotoWorxx | |
| Asus ROG Zephyrus G14 GU405AR (v8.20.8100) | |
| Average Intel Core Ultra 9 386H (54042 - 89891, n=8) | |
| Acer Predator Triton 14 AI PT14-52 (v6.92.6600) | |
| Razer Blade 14 2025 (v6.92.6600) | |
| Asus ROG Zephyrus G14 2025 GA403WW (v6.92.6600) | |
| Average of class Gaming (12271 - 89891, n=102, last 2 years) | |
| AIDA64 / CPU CheckMate | |
| Average of class Gaming (2930 - 20751, n=15, last 2 years) | |
| Asus ROG Zephyrus G14 GU405AR (v8.20.8100) | |
| Average Intel Core Ultra 9 386H (4051 - 4858, n=7) | |
系统和存储设备
系统性能表现出色,我们未遇到任何稳定性问题。 我们进行的标准化延迟测试也未发现实时音频应用存在任何问题。华硕采用了Kioxia生产的PCIe 4.0固态硬盘,存储容量为1 TB(可用空间830 GB),其传输速率非常出色,且在持续负载下表现稳定。
PCMark 10: Score | Essentials | Productivity | Digital Content Creation
CrossMark: Overall | Productivity | Creativity | Responsiveness
WebXPRT 3: Overall
WebXPRT 4: Overall
Mozilla Kraken 1.1: Total
| Performance rating | |
| Apple MacBook Pro 14 2026 M5 Max -4! | |
| Asus ROG Zephyrus G14 GU405AR | |
| Average Intel Core Ultra 9 386H, NVIDIA GeForce RTX 5070 Ti Laptop | |
| Average of class Gaming | |
| Asus ROG Zephyrus G14 2025 GA403WW | |
| Razer Blade 14 2025 | |
| Acer Predator Triton 14 AI PT14-52 | |
| PCMark 10 / Score | |
| Asus ROG Zephyrus G14 GU405AR | |
| Average Intel Core Ultra 9 386H, NVIDIA GeForce RTX 5070 Ti Laptop (n=1) | |
| Average of class Gaming (5828 - 12414, n=93, last 2 years) | |
| Asus ROG Zephyrus G14 2025 GA403WW | |
| Razer Blade 14 2025 | |
| Acer Predator Triton 14 AI PT14-52 | |
| PCMark 10 / Essentials | |
| Average of class Gaming (8810 - 11935, n=97, last 2 years) | |
| Razer Blade 14 2025 | |
| Asus ROG Zephyrus G14 2025 GA403WW | |
| Asus ROG Zephyrus G14 GU405AR | |
| Average Intel Core Ultra 9 386H, NVIDIA GeForce RTX 5070 Ti Laptop (n=1) | |
| Acer Predator Triton 14 AI PT14-52 | |
| PCMark 10 / Productivity | |
| Asus ROG Zephyrus G14 GU405AR | |
| Average Intel Core Ultra 9 386H, NVIDIA GeForce RTX 5070 Ti Laptop (n=1) | |
| Acer Predator Triton 14 AI PT14-52 | |
| Average of class Gaming (6845 - 25323, n=95, last 2 years) | |
| Asus ROG Zephyrus G14 2025 GA403WW | |
| Razer Blade 14 2025 | |
| PCMark 10 / Digital Content Creation | |
| Asus ROG Zephyrus G14 GU405AR | |
| Average Intel Core Ultra 9 386H, NVIDIA GeForce RTX 5070 Ti Laptop (n=1) | |
| Average of class Gaming (7602 - 19954, n=95, last 2 years) | |
| Asus ROG Zephyrus G14 2025 GA403WW | |
| Razer Blade 14 2025 | |
| Acer Predator Triton 14 AI PT14-52 | |
| CrossMark / Overall | |
| Apple MacBook Pro 14 2026 M5 Max | |
| Asus ROG Zephyrus G14 GU405AR | |
| Average Intel Core Ultra 9 386H, NVIDIA GeForce RTX 5070 Ti Laptop (n=1) | |
| Average of class Gaming (1366 - 2409, n=94, last 2 years) | |
| Asus ROG Zephyrus G14 2025 GA403WW | |
| Razer Blade 14 2025 | |
| Acer Predator Triton 14 AI PT14-52 | |
| CrossMark / Productivity | |
| Apple MacBook Pro 14 2026 M5 Max | |
| Average of class Gaming (1386 - 2254, n=94, last 2 years) | |
| Razer Blade 14 2025 | |
| Asus ROG Zephyrus G14 GU405AR | |
| Average Intel Core Ultra 9 386H, NVIDIA GeForce RTX 5070 Ti Laptop (n=1) | |
| Asus ROG Zephyrus G14 2025 GA403WW | |
| Acer Predator Triton 14 AI PT14-52 | |
| CrossMark / Creativity | |
| Apple MacBook Pro 14 2026 M5 Max | |
| Asus ROG Zephyrus G14 GU405AR | |
| Average Intel Core Ultra 9 386H, NVIDIA GeForce RTX 5070 Ti Laptop (n=1) | |
| Asus ROG Zephyrus G14 2025 GA403WW | |
| Razer Blade 14 2025 | |
| Average of class Gaming (1343 - 2786, n=94, last 2 years) | |
| Acer Predator Triton 14 AI PT14-52 | |
| CrossMark / Responsiveness | |
| Apple MacBook Pro 14 2026 M5 Max | |
| Asus ROG Zephyrus G14 GU405AR | |
| Average Intel Core Ultra 9 386H, NVIDIA GeForce RTX 5070 Ti Laptop (n=1) | |
| Average of class Gaming (1226 - 2334, n=94, last 2 years) | |
| Razer Blade 14 2025 | |
| Asus ROG Zephyrus G14 2025 GA403WW | |
| Acer Predator Triton 14 AI PT14-52 | |
| WebXPRT 3 / Overall | |
| Apple MacBook Pro 14 2026 M5 Max | |
| Asus ROG Zephyrus G14 2025 GA403WW | |
| Average of class Gaming (220 - 532, n=98, last 2 years) | |
| Asus ROG Zephyrus G14 GU405AR | |
| Average Intel Core Ultra 9 386H, NVIDIA GeForce RTX 5070 Ti Laptop (n=1) | |
| Acer Predator Triton 14 AI PT14-52 | |
| Razer Blade 14 2025 | |
| WebXPRT 4 / Overall | |
| Apple MacBook Pro 14 2026 M5 Max | |
| Asus ROG Zephyrus G14 GU405AR | |
| Average Intel Core Ultra 9 386H, NVIDIA GeForce RTX 5070 Ti Laptop (n=1) | |
| Average of class Gaming (165 - 354, n=98, last 2 years) | |
| Acer Predator Triton 14 AI PT14-52 | |
| Asus ROG Zephyrus G14 2025 GA403WW | |
| Razer Blade 14 2025 | |
| Mozilla Kraken 1.1 / Total | |
| Acer Predator Triton 14 AI PT14-52 | |
| Asus ROG Zephyrus G14 GU405AR | |
| Average Intel Core Ultra 9 386H, NVIDIA GeForce RTX 5070 Ti Laptop (n=1) | |
| Average of class Gaming (391 - 590, n=100, last 2 years) | |
| Razer Blade 14 2025 | |
| Asus ROG Zephyrus G14 2025 GA403WW | |
| Apple MacBook Pro 14 2026 M5 Max | |
* ... smaller is better
| PCMark 10 Score | 9049 points | |
Help | ||
| AIDA64 / Memory Copy | |
| Asus ROG Zephyrus G14 GU405AR | |
| Average Intel Core Ultra 9 386H (75437 - 129946, n=8) | |
| Acer Predator Triton 14 AI PT14-52 | |
| Razer Blade 14 2025 | |
| Asus ROG Zephyrus G14 2025 GA403WW | |
| Average of class Gaming (21750 - 129946, n=102, last 2 years) | |
| AIDA64 / Memory Read | |
| Asus ROG Zephyrus G14 GU405AR | |
| Average Intel Core Ultra 9 386H (81021 - 118858, n=8) | |
| Razer Blade 14 2025 | |
| Asus ROG Zephyrus G14 2025 GA403WW | |
| Acer Predator Triton 14 AI PT14-52 | |
| Average of class Gaming (22956 - 118858, n=102, last 2 years) | |
| AIDA64 / Memory Write | |
| Asus ROG Zephyrus G14 GU405AR | |
| Acer Predator Triton 14 AI PT14-52 | |
| Average Intel Core Ultra 9 386H (75959 - 135096, n=8) | |
| Asus ROG Zephyrus G14 2025 GA403WW | |
| Razer Blade 14 2025 | |
| Average of class Gaming (22297 - 135096, n=102, last 2 years) | |
| AIDA64 / Memory Latency | |
| Asus ROG Zephyrus G14 2025 GA403WW | |
| Average of class Gaming (75.3 - 165.4, n=102, last 2 years) | |
| Razer Blade 14 2025 | |
| Acer Predator Triton 14 AI PT14-52 | |
| Average Intel Core Ultra 9 386H (87.2 - 116.9, n=8) | |
| Asus ROG Zephyrus G14 GU405AR | |
* ... smaller is better
| DPC Latencies / LatencyMon - interrupt to process latency (max), Web, Youtube, Prime95 | |
| Razer Blade 14 2025 | |
| Average of class Gaming (410 - 11799, n=92, last 2 years) | |
| Acer Predator Triton 14 AI PT14-52 | |
| Asus ROG Zephyrus G14 GU405AR | |
| Asus ROG Zephyrus G14 2025 GA403WW | |
* ... smaller is better

* ... smaller is better
磁盘限速:DiskSpd 读取循环,队列深度 8
GPU 和游戏性能
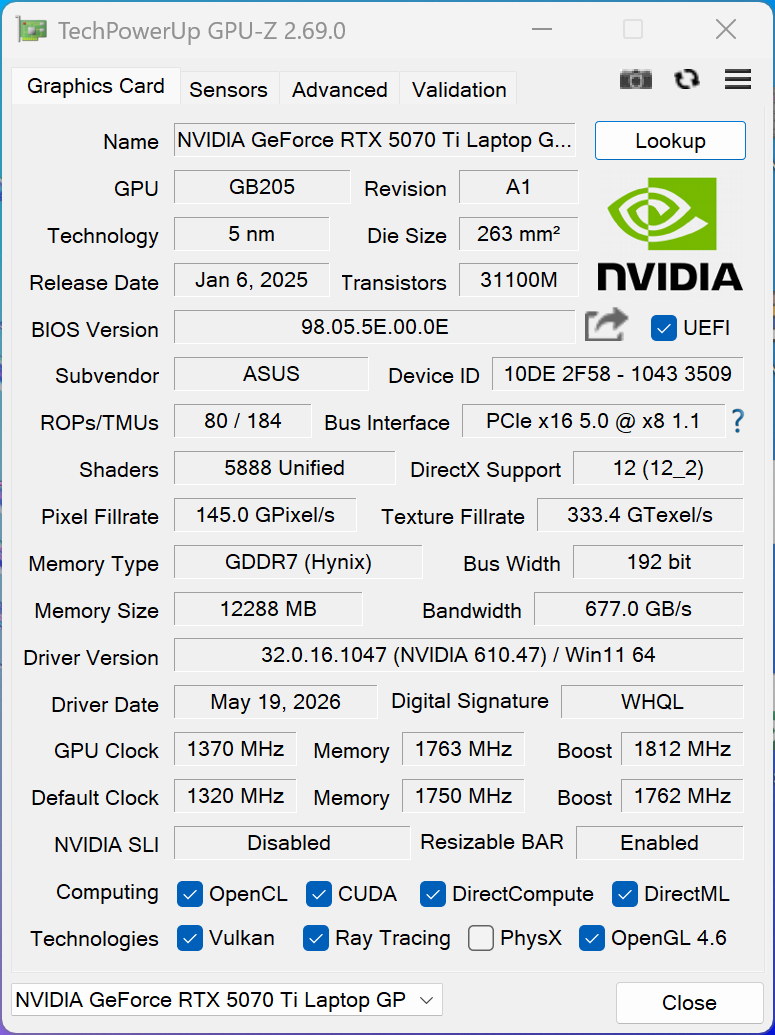
该 英伟达GeForce RTX 5070 Ti 配备12 GB显存,与去年的G14相比并未改变,但该GPU在Turbo模式下的 功耗现可达115瓦。在手动模式下甚至可达130瓦,但在基准测试中我们仅观察到微小的性能提升。 对于一款14英寸笔记本电脑而言,其GPU性能依然出色,且目前市场上根本没有竞争对手(除了 M5 Max GPU 和 搭载RTX 5080的2025款Zephyrus G14)。其游戏性能实际上比之前有所提升,有时甚至能与搭载RTX 5080的G14持平,但请注意,自那时以来驱动程序已多次更新,因此部分额外性能提升很可能是驱动程序带来的。 即使是要求较高的游戏,也能在 QHD 分辨率下流畅运行,尽管某些游戏可能需要启用 DLSS 和/或帧生成技术。
| 3DMark 11 Performance | 41208 points | |
| 3DMark Fire Strike Score | 32870 points | |
| 3DMark Time Spy Score | 16242 points | |
| 3DMark Steel Nomad Score | 3694 points | |
| 3DMark Steel Nomad Light Score | 16907 points | |
Help | ||
| Blender / v3.3 Classroom OPTIX/RTX | |
| Acer Predator Triton 14 AI PT14-52 | |
| Razer Blade 14 2025 | |
| Average of class Gaming (9 - 32, n=103, last 2 years) | |
| Asus ROG Zephyrus G14 2025 GA403WW | |
| Asus ROG Zephyrus G14 GU405AR | |
| Asus ROG Zephyrus G14 2025 5070 Ti | |
| Average NVIDIA GeForce RTX 5070 Ti Laptop (13 - 19, n=14) | |
| Blender / v3.3 Classroom CUDA | |
| Acer Predator Triton 14 AI PT14-52 | |
| Average of class Gaming (15 - 228, n=103, last 2 years) | |
| Razer Blade 14 2025 | |
| Average NVIDIA GeForce RTX 5070 Ti Laptop (24 - 33, n=14) | |
| Asus ROG Zephyrus G14 2025 5070 Ti | |
| Asus ROG Zephyrus G14 GU405AR | |
| Asus ROG Zephyrus G14 2025 GA403WW | |
| Blender / v3.3 Classroom CPU | |
| Acer Predator Triton 14 AI PT14-52 | |
| Razer Blade 14 2025 | |
| Asus ROG Zephyrus G14 GU405AR | |
| Average of class Gaming (122 - 565, n=99, last 2 years) | |
| Asus ROG Zephyrus G14 2025 5070 Ti | |
| Asus ROG Zephyrus G14 2025 GA403WW | |
| Average NVIDIA GeForce RTX 5070 Ti Laptop (122 - 361, n=14) | |
| Apple MacBook Pro 14 2026 M5 Max | |
| Blender / v3.3 Classroom METAL | |
| Apple MacBook Pro 14 2026 M5 Max | |
* ... smaller is better
| Final Fantasy XV Benchmark - 1920x1080 High Quality | |
| Average of class Gaming (64.2 - 215, n=91, last 2 years) | |
| Asus ROG Zephyrus G14 GU405AR | |
| Asus ROG Zephyrus G14 2025 GA403WW | |
| Razer Blade 14 2025 | |
| Asus ROG Zephyrus G14 2025 5070 Ti | |
| Acer Predator Triton 14 AI PT14-52 | |
| Strange Brigade - 1920x1080 ultra AA:ultra AF:16 | |
| Asus ROG Zephyrus G14 2025 GA403WW | |
| Asus ROG Zephyrus G14 GU405AR | |
| Average of class Gaming (113.6 - 458, n=83, last 2 years) | |
| Asus ROG Zephyrus G14 2025 5070 Ti | |
| Razer Blade 14 2025 | |
| Acer Predator Triton 14 AI PT14-52 | |
| Dota 2 Reborn - 1920x1080 ultra (3/3) best looking | |
| Average of class Gaming (84.8 - 252, n=104, last 2 years) | |
| Asus ROG Zephyrus G14 GU405AR | |
| Razer Blade 14 2025 | |
| Asus ROG Zephyrus G14 2025 GA403WW | |
| Asus ROG Zephyrus G14 2025 5070 Ti | |
| Acer Predator Triton 14 AI PT14-52 | |
| Forza Horizon 6 | |
| 2560x1440 extreme + RT AA:T | |
| Average of class Gaming (15 - 66, n=6, last 2 years) | |
| Average NVIDIA GeForce RTX 5070 Ti Laptop (42 - 46, n=3) | |
| Asus ROG Zephyrus G14 GU405AR | |
| 2560x1440 extreme + RT + DLSS perf. AA:T | |
| Average NVIDIA GeForce RTX 5070 Ti Laptop (56 - 66, n=3) | |
| Asus ROG Zephyrus G14 GU405AR | |
| Average of class Gaming (18 - 88, n=5, last 2 years) | |
| F1 25 | |
| 2560x1440 Ultra Max Preset AA:T AF:16x | |
| Asus ROG Zephyrus G14 GU405AR | |
| Average NVIDIA GeForce RTX 5070 Ti Laptop (18 - 26, n=7) | |
| Average of class Gaming (5 - 39.1, n=26, last 2 years) | |
| Asus ROG Zephyrus G14 2025 5070 Ti | |
| Razer Blade 14 2025 | |
| 2560x1440 Ultra Max Preset + DLSS Quality AA:DLSS AF:16x | |
| Asus ROG Zephyrus G14 GU405AR | |
| Average NVIDIA GeForce RTX 5070 Ti Laptop (32 - 48.1, n=7) | |
| Average of class Gaming (9 - 67.5, n=23, last 2 years) | |
| Asus ROG Zephyrus G14 2025 5070 Ti | |
| Razer Blade 14 2025 | |
《赛博朋克2077》超高清帧率图表
| low | med. | high | ultra | QHD DLSS | QHD | |
|---|---|---|---|---|---|---|
| GTA V (2015) | 148.2 | 133.1 | ||||
| Dota 2 Reborn (2015) | 183.9 | 166.5 | 159.2 | 150.1 | ||
| Final Fantasy XV Benchmark (2018) | 219 | 195.8 | 151 | 119.6 | ||
| X-Plane 11.11 (2018) | 122 | 112.3 | 104.5 | |||
| Strange Brigade (2018) | 514 | 324 | 330 | 295 | 209 | |
| Baldur's Gate 3 (2023) | 196.8 | 166.8 | 145.4 | 141.9 | 120 | |
| Cyberpunk 2077 (2023) | 147.3 | 142.4 | 124.5 | 111.9 | 88.5 | 77.4 |
| F1 24 (2024) | 268 | 261 | 101.4 | 102.5 | 66.5 | |
| Assassin's Creed Shadows (2025) | 86 | 80 | 68 | 52 | 52 | 44 |
| F1 25 (2025) | 220 | 207 | 183.3 | 37.9 | 41.3 | 22.6 |
| Forza Horizon 6 (2026) | 182 | 141 | 104 | 62 | 58 | 42 |
| 007 First Light (2026) | 88 | 82.5 | 73.2 | 70 | 50 |
排放与能耗
系统噪音

风扇噪音在很大程度上取决于电源模式;在“Turbo”模式下 ,风扇会以约35 dB(A)的噪音水平持续运转,这显然非常明显。 其优点在于,无需提高风扇转速即可应对峰值负载。对于日常任务,我们强烈推荐使用“静音模式 ”,因为此时风扇大部分时间都会处于停转状态。 在“Turbo”模式下进行游戏时,风扇噪音会达到55 dB(A),非常响亮,因此您需要佩戴耳机。在“Performance”模式下 进行游戏时,噪音也并未明显降低,仍接近50 dB(A),这是为获得高性能所付出的代价。我们未检测到其他电子噪音。
Noise level
| Idle |
| 26 / 35.1 / 35.1 dB(A) |
| Load |
| 35.1 / 55.5 dB(A) |
 | ||
30 dB silent 40 dB(A) audible 50 dB(A) loud |
||
min: | ||
| Asus ROG Zephyrus G14 GU405AR Ultra 9 386H, GeForce RTX 5070 Ti Laptop | Acer Predator Triton 14 AI PT14-52 Core Ultra 9 288V, GeForce RTX 5070 Laptop | Razer Blade 14 2025 Ryzen AI 9 365, GeForce RTX 5070 Laptop | Asus ROG Zephyrus G14 2025 GA403WW Ryzen AI 9 HX 370, GeForce RTX 5080 Laptop | Apple MacBook Pro 14 2026 M5 Max M5 Max, M5 Max 40-Core GPU | |
|---|---|---|---|---|---|
| Noise | 6% | 7% | -3% | 15% | |
| off / environment * (dB) | 26 | 24.9 4% | 23.7 9% | 23.3 10% | 23.1 11% |
| Idle Minimum * (dB) | 26 | 24.9 4% | 23.7 9% | 29.1 -12% | 23.1 11% |
| Idle Average * (dB) | 35.1 | 24.9 29% | 23.7 32% | 29.1 17% | 23.1 34% |
| Idle Maximum * (dB) | 35.1 | 30.5 13% | 27 23% | 29.1 17% | 23.1 34% |
| Load Average * (dB) | 35.1 | 36.1 -3% | 44.9 -28% | 54.4 -55% | 36.8 -5% |
| Cyberpunk 2077 ultra * (dB) | 55.5 | 57.9 -4% | 54.6 2% | 54.4 2% | 47.8 14% |
| Load Maximum * (dB) | 55.5 | 57.9 -4% | 54.6 2% | 54.4 2% | 53.2 4% |
* ... smaller is better
温度
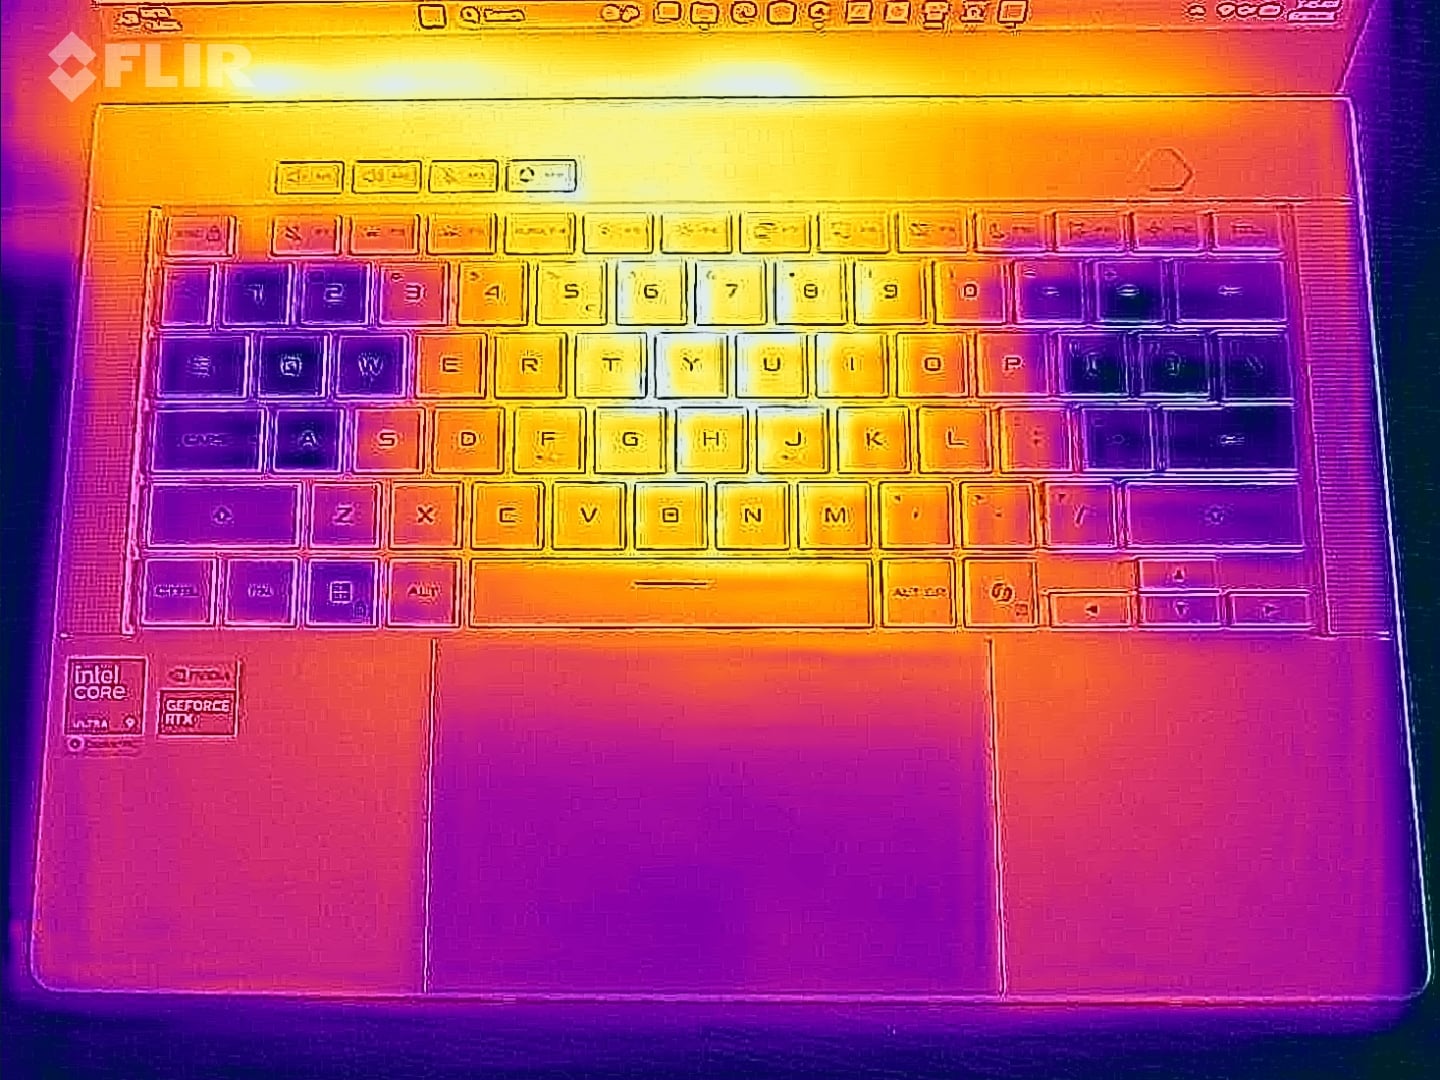
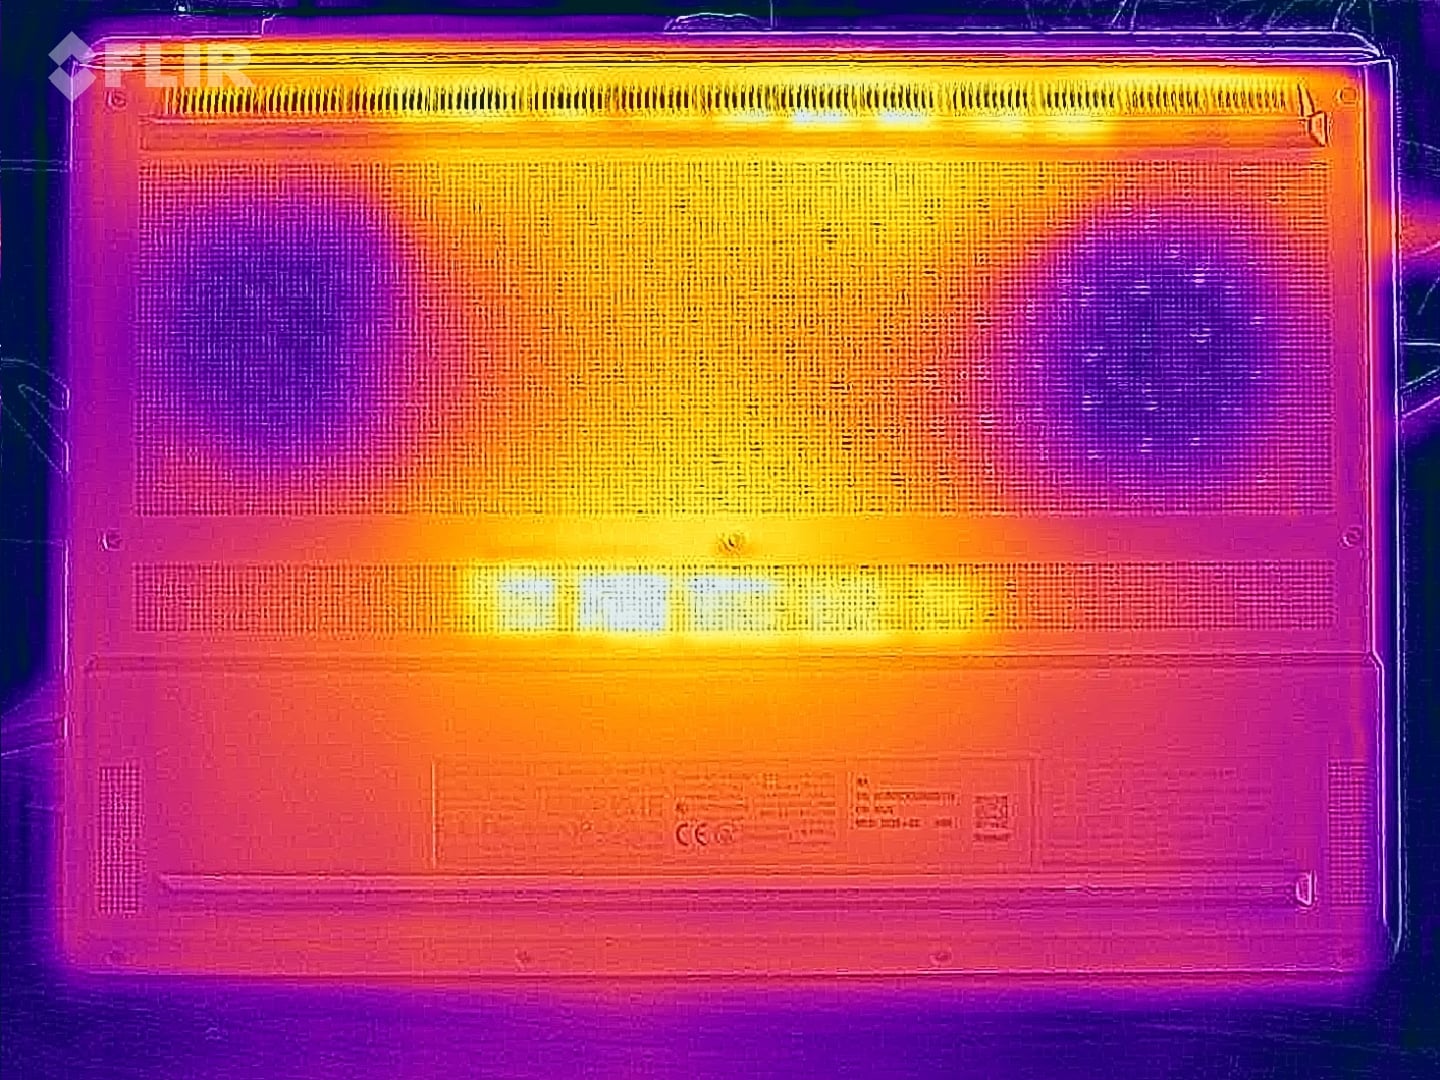
即使在满载状态下,Zephyrus G14 的表面温度也完全无需担心。 我们在机身底部的热点处测得的温度仅略高于 40 °C,而键盘区域的温度则更低,因此使用上没有任何限制。在压力测试期间,GPU 功耗保持在 100 瓦(约 74 °C),CPU 功耗为 35 瓦(约 79 °C)。

(±) The maximum temperature on the upper side is 41.7 °C / 107 F, compared to the average of 40.4 °C / 105 F, ranging from 21.2 to 68.8 °C for the class Gaming.
(±) The bottom heats up to a maximum of 41.5 °C / 107 F, compared to the average of 43.2 °C / 110 F
(+) In idle usage, the average temperature for the upper side is 24.5 °C / 76 F, compared to the device average of 33.9 °C / 93 F.
(±) 3: The average temperature for the upper side is 36.3 °C / 97 F, compared to the average of 33.9 °C / 93 F for the class Gaming.
(+) The palmrests and touchpad are cooler than skin temperature with a maximum of 31.5 °C / 88.7 F and are therefore cool to the touch.
(-) The average temperature of the palmrest area of similar devices was 28.8 °C / 83.8 F (-2.7 °C / -4.9 F).
| Asus ROG Zephyrus G14 GU405AR Ultra 9 386H, GeForce RTX 5070 Ti Laptop | Acer Predator Triton 14 AI PT14-52 Core Ultra 9 288V, GeForce RTX 5070 Laptop | Razer Blade 14 2025 Ryzen AI 9 365, GeForce RTX 5070 Laptop | Asus ROG Zephyrus G14 2025 GA403WW Ryzen AI 9 HX 370, GeForce RTX 5080 Laptop | Apple MacBook Pro 14 2026 M5 Max M5 Max, M5 Max 40-Core GPU | |
|---|---|---|---|---|---|
| Heat | -10% | -19% | -23% | 1% | |
| Maximum Upper Side * (°C) | 41.7 | 42.9 -3% | 47 -13% | 51.2 -23% | 47 -13% |
| Maximum Bottom * (°C) | 41.5 | 47.4 -14% | 49.6 -20% | 50.3 -21% | 40.5 2% |
| Idle Upper Side * (°C) | 25 | 27.3 -9% | 29.8 -19% | 30.2 -21% | 23.3 7% |
| Idle Bottom * (°C) | 24.8 | 28.1 -13% | 30.7 -24% | 30.9 -25% | 23.4 6% |
* ... smaller is better
演讲嘉宾
扬声器表现出色,G14 配备了目前市面上笔记本电脑中数一数二的音响系统。
Asus ROG Zephyrus G14 GU405AR audio analysis
(+) | speakers can play relatively loud (85.9 dB)
Bass 100 - 315 Hz
(+) | good bass - only 4.3% away from median
(±) | linearity of bass is average (7.1% delta to prev. frequency)
Mids 400 - 2000 Hz
(+) | balanced mids - only 2.8% away from median
(+) | mids are linear (2.8% delta to prev. frequency)
Highs 2 - 16 kHz
(+) | balanced highs - only 3% away from median
(+) | highs are linear (3.6% delta to prev. frequency)
Overall 100 - 16.000 Hz
(+) | overall sound is linear (6.7% difference to median)
Compared to same class
» 0% of all tested devices in this class were better, 1% similar, 99% worse
» The best had a delta of 6%, average was 18%, worst was 132%
Compared to all devices tested
» 1% of all tested devices were better, 0% similar, 99% worse
» The best had a delta of 4%, average was 23%, worst was 134%
Acer Predator Triton 14 AI PT14-52 audio analysis
(+) | speakers can play relatively loud (90.7 dB)
Bass 100 - 315 Hz
(±) | reduced bass - on average 11.9% lower than median
(±) | linearity of bass is average (10.3% delta to prev. frequency)
Mids 400 - 2000 Hz
(±) | higher mids - on average 10.1% higher than median
(+) | mids are linear (6.9% delta to prev. frequency)
Highs 2 - 16 kHz
(±) | reduced highs - on average 5.2% lower than median
(+) | highs are linear (4.4% delta to prev. frequency)
Overall 100 - 16.000 Hz
(±) | linearity of overall sound is average (17.9% difference to median)
Compared to same class
» 55% of all tested devices in this class were better, 9% similar, 36% worse
» The best had a delta of 6%, average was 18%, worst was 132%
Compared to all devices tested
» 37% of all tested devices were better, 8% similar, 55% worse
» The best had a delta of 4%, average was 23%, worst was 134%
Razer Blade 14 2025 audio analysis
(±) | speaker loudness is average but good (79.6 dB)
Bass 100 - 315 Hz
(±) | reduced bass - on average 9% lower than median
(±) | linearity of bass is average (7.4% delta to prev. frequency)
Mids 400 - 2000 Hz
(±) | higher mids - on average 9% higher than median
(+) | mids are linear (5.4% delta to prev. frequency)
Highs 2 - 16 kHz
(+) | balanced highs - only 3.2% away from median
(+) | highs are linear (5% delta to prev. frequency)
Overall 100 - 16.000 Hz
(±) | linearity of overall sound is average (15.1% difference to median)
Compared to same class
» 32% of all tested devices in this class were better, 6% similar, 61% worse
» The best had a delta of 6%, average was 18%, worst was 132%
Compared to all devices tested
» 21% of all tested devices were better, 4% similar, 75% worse
» The best had a delta of 4%, average was 23%, worst was 134%
Asus ROG Zephyrus G14 2025 GA403WW audio analysis
(±) | speaker loudness is average but good (81.2 dB)
Bass 100 - 315 Hz
(+) | good bass - only 2.8% away from median
(±) | linearity of bass is average (8.1% delta to prev. frequency)
Mids 400 - 2000 Hz
(+) | balanced mids - only 3.9% away from median
(+) | mids are linear (5.6% delta to prev. frequency)
Highs 2 - 16 kHz
(±) | reduced highs - on average 5.9% lower than median
(+) | highs are linear (4.3% delta to prev. frequency)
Overall 100 - 16.000 Hz
(+) | overall sound is linear (10.4% difference to median)
Compared to same class
» 6% of all tested devices in this class were better, 2% similar, 92% worse
» The best had a delta of 6%, average was 18%, worst was 132%
Compared to all devices tested
» 5% of all tested devices were better, 1% similar, 93% worse
» The best had a delta of 4%, average was 23%, worst was 134%
Apple MacBook Pro 14 2026 M5 Max audio analysis
(+) | speakers can play relatively loud (83.1 dB)
Bass 100 - 315 Hz
(+) | good bass - only 4.5% away from median
(±) | linearity of bass is average (7.1% delta to prev. frequency)
Mids 400 - 2000 Hz
(+) | balanced mids - only 1.3% away from median
(+) | mids are linear (2.5% delta to prev. frequency)
Highs 2 - 16 kHz
(+) | balanced highs - only 3.3% away from median
(+) | highs are linear (3.7% delta to prev. frequency)
Overall 100 - 16.000 Hz
(+) | overall sound is linear (6.5% difference to median)
Compared to same class
» 4% of all tested devices in this class were better, 1% similar, 95% worse
» The best had a delta of 5%, average was 17%, worst was 45%
Compared to all devices tested
» 1% of all tested devices were better, 0% similar, 99% worse
» The best had a delta of 4%, average was 23%, worst was 134%
功耗与电池续航时间
我们的功耗测试数据显示,在空闲状态下,该机型较前代产品略有提升,但在满载状态下,由于GeForce 显卡的TGP更高,功耗数值略有上升。随附的250W电源适配器完全足够使用,因为在压力测试中,230瓦的峰值功耗很快就会稳定在170/180瓦左右。
电池容量仍为73 Wh,但改用英特尔处理器后,在我们的Wi-Fi测试中电池续航时间显著延长。在150尼特的亮度下,新款2026机型续航时间接近14.5小时,因此比前代机型多出4小时。 若将 SDR 亮度调至最高(该亮度现已高于此前水平),两者差距虽有所缩小,但新款机型的续航时间仍更长。

| Off / Standby | |
| Idle | |
| Load |
|
Key:
min: | |
| Asus ROG Zephyrus G14 GU405AR Ultra 9 386H, GeForce RTX 5070 Ti Laptop, Kioxia BG6 KBG60ZNV1T02, OLED, 2880x1800, 14" | Acer Predator Triton 14 AI PT14-52 Core Ultra 9 288V, GeForce RTX 5070 Laptop, Micron 3400 1TB MTFDKBA1T0TFH, OLED, 2880x1800, 14.5" | Razer Blade 14 2025 Ryzen AI 9 365, GeForce RTX 5070 Laptop, Samsung PM9A1 MZVL21T0HCLR, OLED, 2880x1800, 14" | Asus ROG Zephyrus G14 2025 GA403WW Ryzen AI 9 HX 370, GeForce RTX 5080 Laptop, WD PC SN740 SDDPNQE-2T00, OLED, 2880x1800, 14" | Apple MacBook Pro 14 2026 M5 Max M5 Max, M5 Max 40-Core GPU, Apple SSD AP8192Z, Mini-LED, 3024x1964, 14.2" | Average NVIDIA GeForce RTX 5070 Ti Laptop | Average of class Gaming | |
|---|---|---|---|---|---|---|---|
| Power Consumption | -23% | -32% | -19% | 11% | -129% | -126% | |
| Idle Minimum * (Watt) | 3.9 | 9.3 -138% | 9.3 -138% | 6.7 -72% | 2.5 36% | 12.4 ? -218% | 13.1 ? -236% |
| Idle Average * (Watt) | 7.8 | 12.2 -56% | 11.1 -42% | 8.8 -13% | 11.6 -49% | 19.7 ? -153% | 19 ? -144% |
| Idle Maximum * (Watt) | 8.1 | 12.5 -54% | 11.2 -38% | 9.3 -15% | 11.8 -46% | 24.9 ? -207% | 24.6 ? -204% |
| Load Average * (Watt) | 82.2 | 68.4 17% | 91.9 -12% | 121.5 -48% | 95.6 -16% | 123.6 ? -50% | 111.3 ? -35% |
| Cyberpunk 2077 ultra * (Watt) | 162.9 | 134 18% | 171.5 -5% | 157.4 3% | 89.4 45% | ||
| Cyberpunk 2077 ultra external monitor * (Watt) | 161.6 | 132.2 18% | 168.6 -4% | 155.5 4% | 86.4 47% | ||
| Load Maximum * (Watt) | 230.7 | 145.4 37% | 195 15% | 218.1 5% | 98.8 57% | 272 ? -18% | 260 ? -13% |
* ... smaller is better
Notebookcheck 评分
Asus ROG Zephyrus G14 GU405AR
- 06/19/2026 v8
Andreas Osthoff
 Total Sustainability Score:
 潜在竞争对手对比
Image | Model / Review | Price | Weight | Height | Display |
|---|---|---|---|---|---|
1. 89.9%  | Asus ROG Zephyrus G14 GU405AR Intel Core Ultra 9 386H ⎘ NVIDIA GeForce RTX 5070 Ti Laptop ⎘ 32 GB Memory, 1024 GB SSD | Amazon: 1. $129.99 280W 250W Charger for Asus R... 2. $1,749.99 EXCaliberPC [2025] ASUS ROG ... 3. $2,999.00 ASUS ROG Zephyrus G14 14" 3K... List Price: 3299€ | 1.6 kg | 16.3 mm | 14.00" 2880x1800 243 PPI OLED |
2. 82.6%  | Acer Predator Triton 14 AI PT14-52 Intel Core Ultra 9 288V ⎘ NVIDIA GeForce RTX 5070 Laptop ⎘ 32 GB Memory, 1024 GB SSD | Amazon: List Price: 2999€ | 1.6 kg | 17.31 mm | 14.50" 2880x1800 234 PPI OLED |
3. 87.2%  | Razer Blade 14 2025 AMD Ryzen AI 9 365 ⎘ NVIDIA GeForce RTX 5070 Laptop ⎘ 32 GB Memory, 1024 GB SSD | Amazon: List Price: 2399€ | 1.6 kg | 16.2 mm | 14.00" 2880x1800 243 PPI OLED |
4. 88.9%  | Asus ROG Zephyrus G14 2025 GA403WW AMD Ryzen AI 9 HX 370 ⎘ NVIDIA GeForce RTX 5080 Laptop ⎘ 64 GB Memory, 2048 GB SSD | Amazon: List Price: 3899€ | 1.6 kg | 18.3 mm | 14.00" 2880x1800 243 PPI OLED |
5. 90.2%  | Apple MacBook Pro 14 2026 M5 Max Apple M5 Max ⎘ Apple M5 Max 40-Core GPU ⎘ 128 GB Memory, 8192 GB SSD | Amazon: List Price: 8589€ | 1.6 kg | 15.5 mm | 14.20" 3024x1964 254 PPI Mini-LED |
6. 88.5%  | Asus ROG Zephyrus G14 2025 5070 Ti AMD Ryzen AI 9 HX 370 ⎘ NVIDIA GeForce RTX 5070 Ti Laptop ⎘ 32 GB Memory, 2048 GB SSD | Amazon: List Price: 3399€ | 1.6 kg | 18.3 mm | 14.00" 2880x1800 243 PPI OLED |
Transparency
The selection of devices to be reviewed is made by our editorial team. The test sample was provided to the author as a loan by the manufacturer or retailer for the purpose of this review. The lender had no influence on this review, nor did the manufacturer receive a copy of this review before publication. There was no obligation to publish this review. As an independent media company, Notebookcheck is not subjected to the authority of manufacturers, retailers or publishers.
This is how Notebookcheck is testing
Every year, Notebookcheck independently reviews hundreds of laptops and smartphones using standardized procedures to ensure that all results are comparable. We have continuously developed our test methods for around 20 years and set industry standards in the process. In our test labs, high-quality measuring equipment is utilized by experienced technicians and editors. These tests involve a multi-stage validation process. Our complex rating system is based on hundreds of well-founded measurements and benchmarks, which maintains objectivity. Further information on our test methods can be found here.

