微星 Vector A18 HX A9W 笔记本电脑评测: GeForce RTX 5070 Ti 才是王道
微星最均衡的游戏笔记本电脑之一。
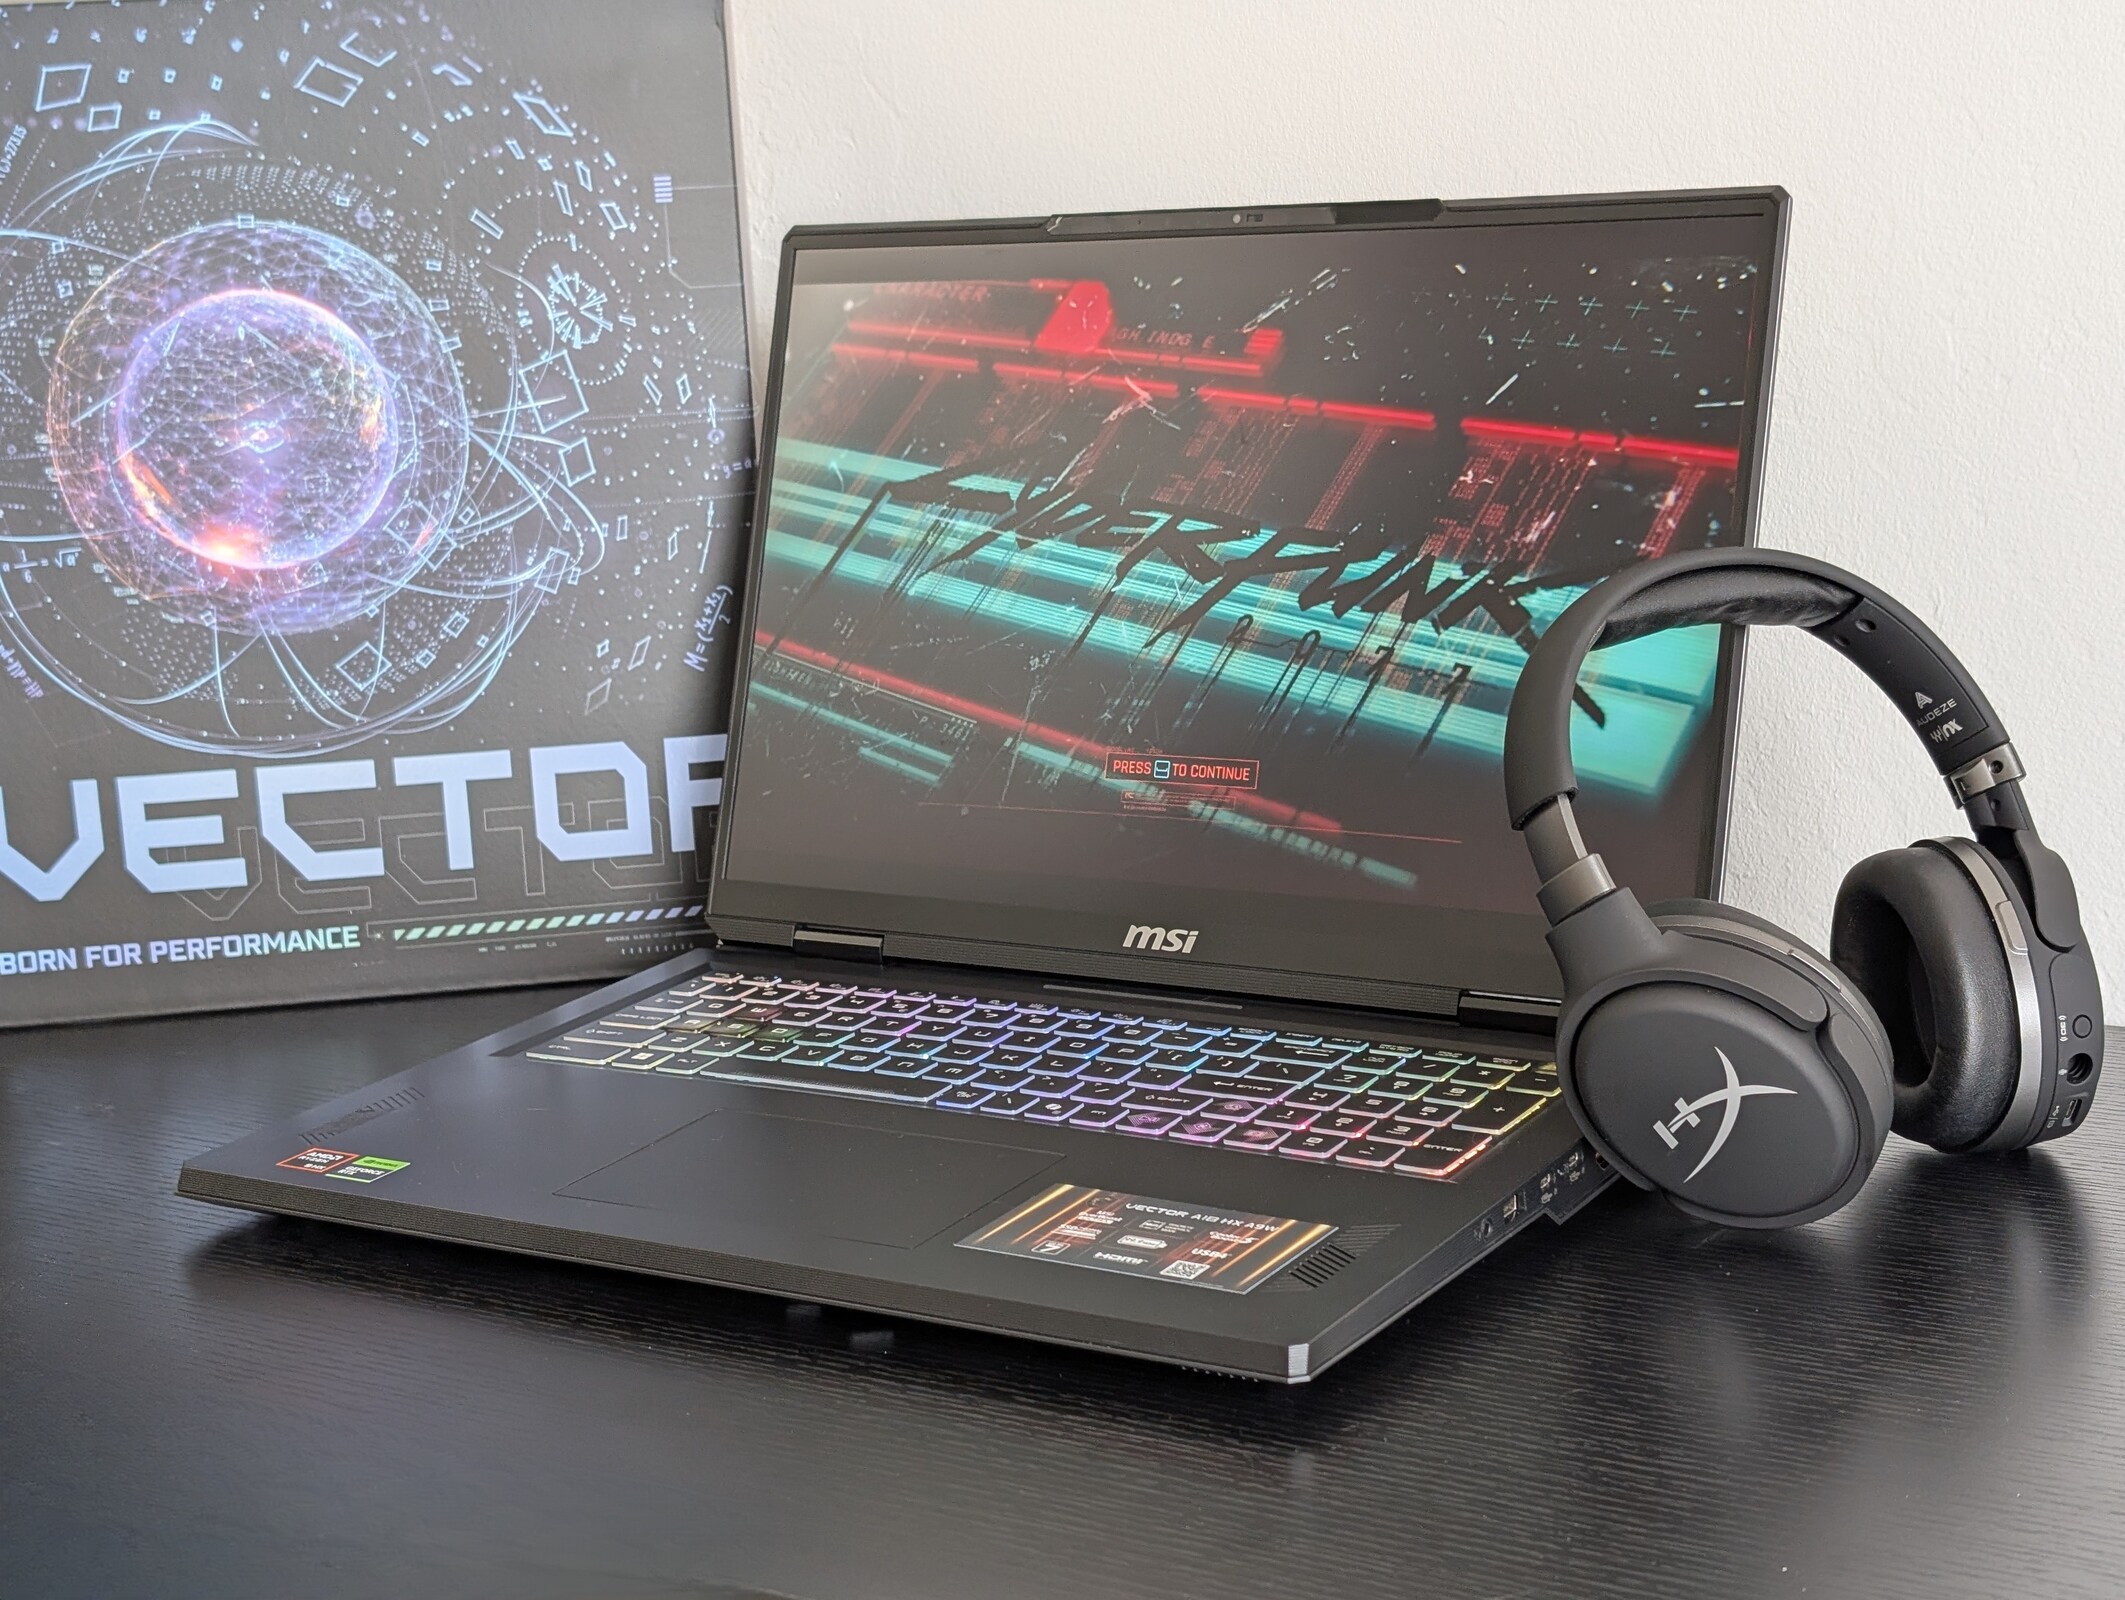
Vector A18 HX 是首批将 AMD Zen 5 CPU 与GeForce RTX 5070 Ti 搭配使用的 18 英寸游戏笔记本电脑之一。考虑到其厚重的尺寸和巨大的 400 W AC 适配器,它很好地平衡了效率和性能。Allen Ngo, 👁 Allen Ngo (translated by DeepL / Ninh Duy) Published 🇺🇸 🇫🇷 ...
结论 - 微星最均衡的游戏笔记本电脑之一
缆线 Raider 18 HX是一款发烧级游戏机,在性能、结构和功能方面几乎没有妥协。可想而知,它也是微星最昂贵的机型之一。对于想省点钱的用户来说,Vector A18 HX 本质上是一款经过调整的 Raider 18 HX,去掉了一些辅助功能和超高端选项,如 G-Sync 和 RGB LED 灯条。机箱在其他方面几乎完全相同,甚至在尺寸和材料方面也是如此,这意味着核心用户体验依然存在,但价格却降低了数百美元(甚至数千美元)。
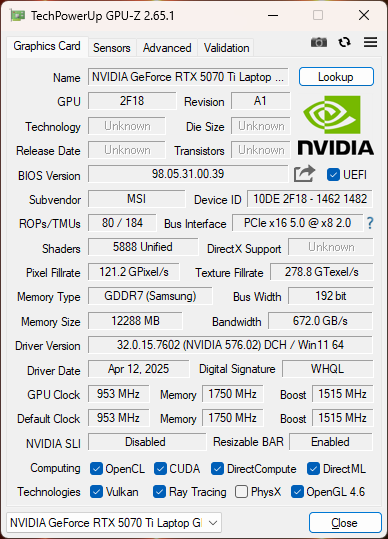
与此同时,140 W 移动 RTX 5070 Ti 的性能接近于 175 W 移动 RTX 4080,在不牺牲太多性能的情况下提高了效率。
我们在测试机上遇到了 Nvidia 驱动程序和点击板粘连的问题,因此我们建议在购买时立即检查是否有任何质量异常。我们也不推荐任何配置较低的 1200p 面板,因为它们可能缺乏完整的 sRGB 覆盖范围,或者质量不如 1600p 或更高的面板。想要更便携的游戏玩家可能会发现 Vector A18 比大多数替代产品更厚或更大,包括 宏碁掠夺者 Helios 18或 华硕 Strix Scar 18.除此之外,在兼顾结构、性能和价格方面,这是微星较好的游戏笔记本电脑之一。
Pros
Cons
微星 Vector 系列介于经济型的 Sword/Katana 系列和高端的 Raider 系列游戏笔记本电脑之间,是游戏玩家的中间选择。尽管如此,它仍然是一款强劲的游戏机,配备了一些最快的处理器和显卡,可以与竞争对手的最佳产品相媲美。
我们的测试机是中间配置,配备 1600p240 Hz IPS 显示屏、Ryzen (()() CPU 和 140 WGeForce RTX 5070 Ti GPU,零售价约为 ))()()() 。顶级配置配备了 2400p120 mini-LED 显示屏和 175 WGeForce RTX 5080 GPU,零售价()))()()更高。如果用户想要更快的 RTX 5090,就必须再往上看看 Raider 18 HX 系列。
Vector A18 HX 的替代产品包括其他 18 英寸游戏笔记本电脑,如())()、())()或())()。
更多微星评论:
- 薄型 GF63 12VE
- Claw 8 AI+
- 巅峰 E13 AI Evo
- GeForce RTX 5070 Ti 16G Ventus
- 卡塔纳 A17
尺寸比较
案例
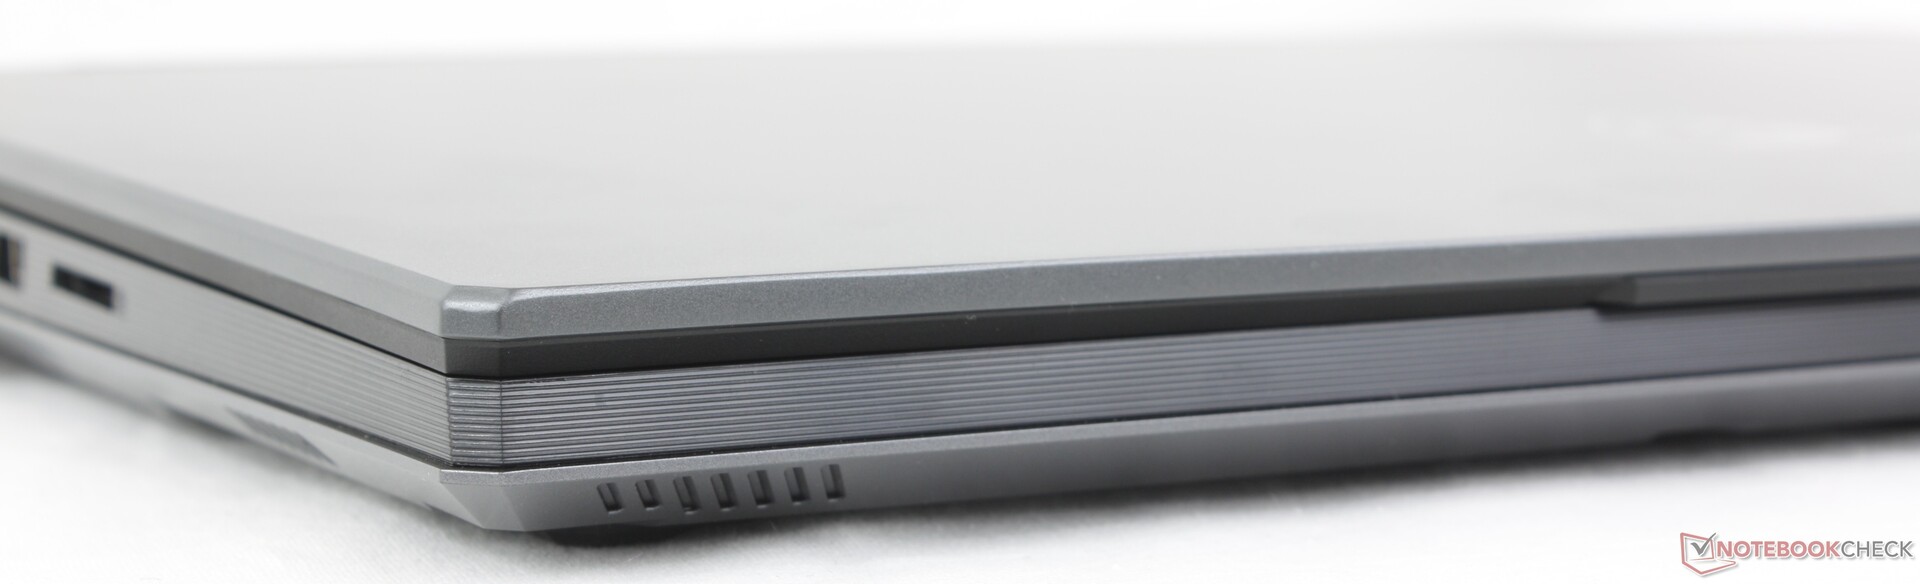
由于 Vector A18 继承了 Raider 系列的镂空设计,因此机箱材料和手感与价格更高的 Raider 18 HX 基本相同。与低端微星机型(如 Katana、Sowrd 或 Thin 系列)的廉价或塑料感相比,Vector A18 的表面坚硬而奢华。
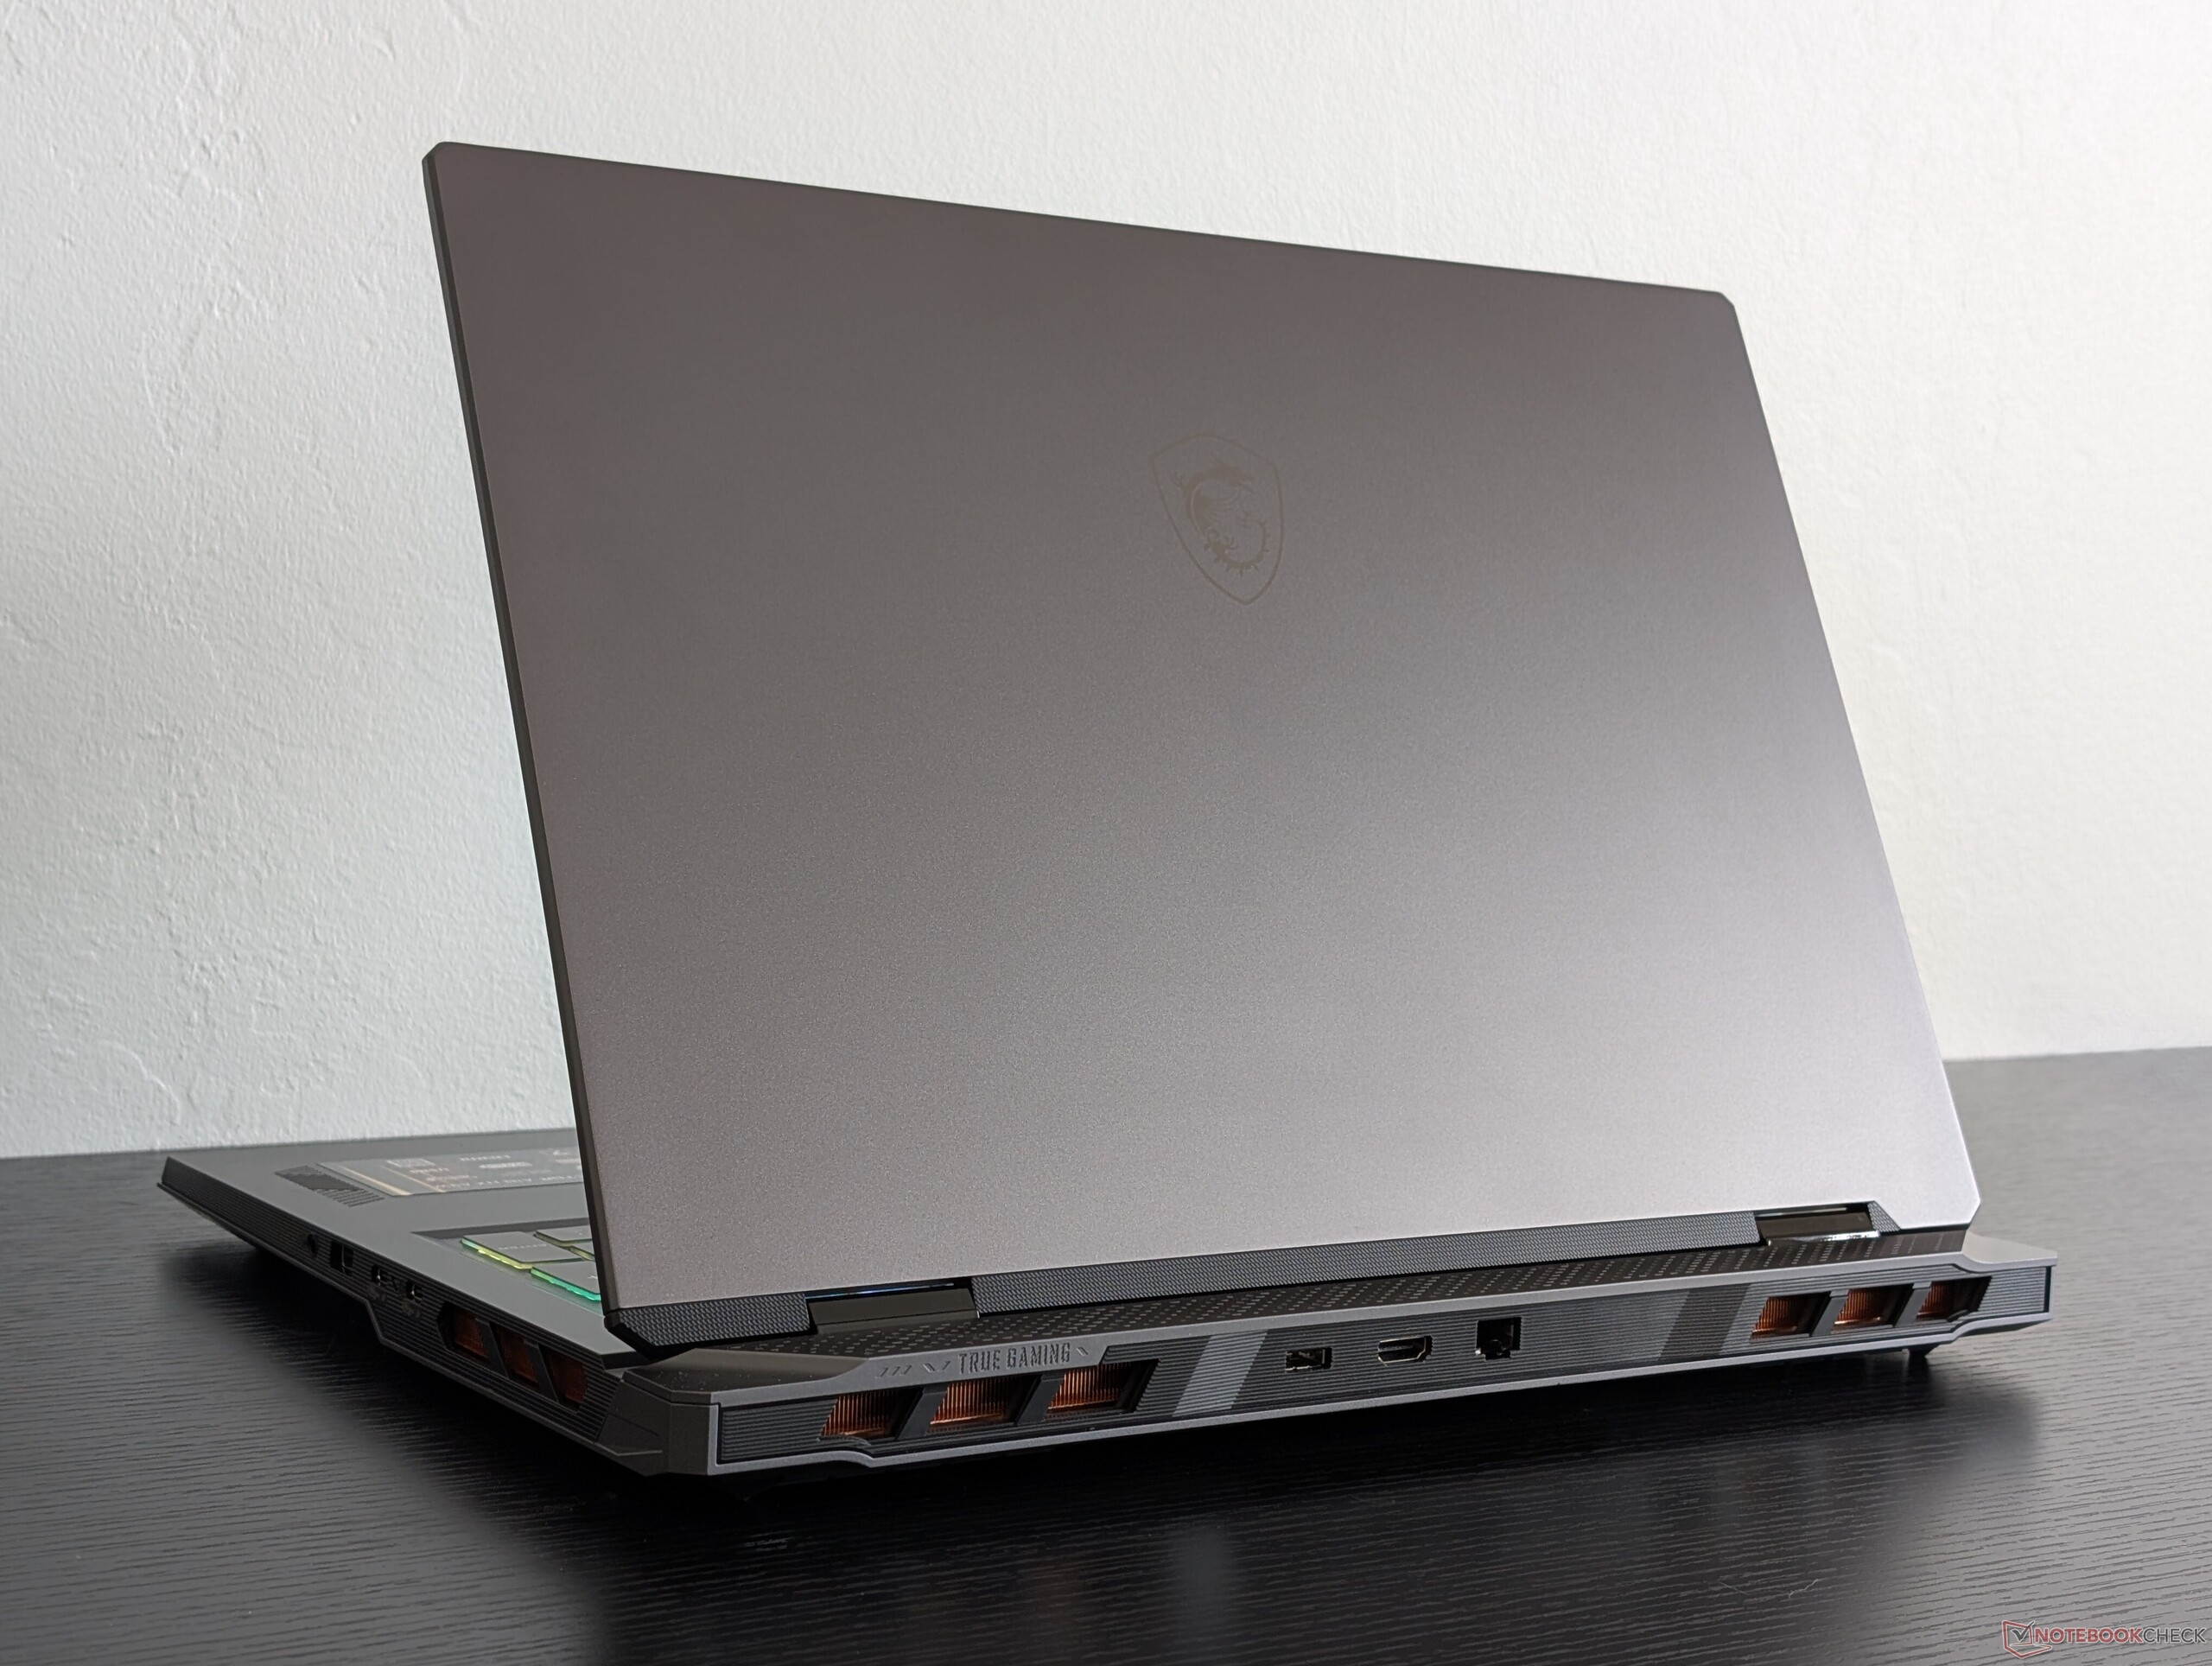
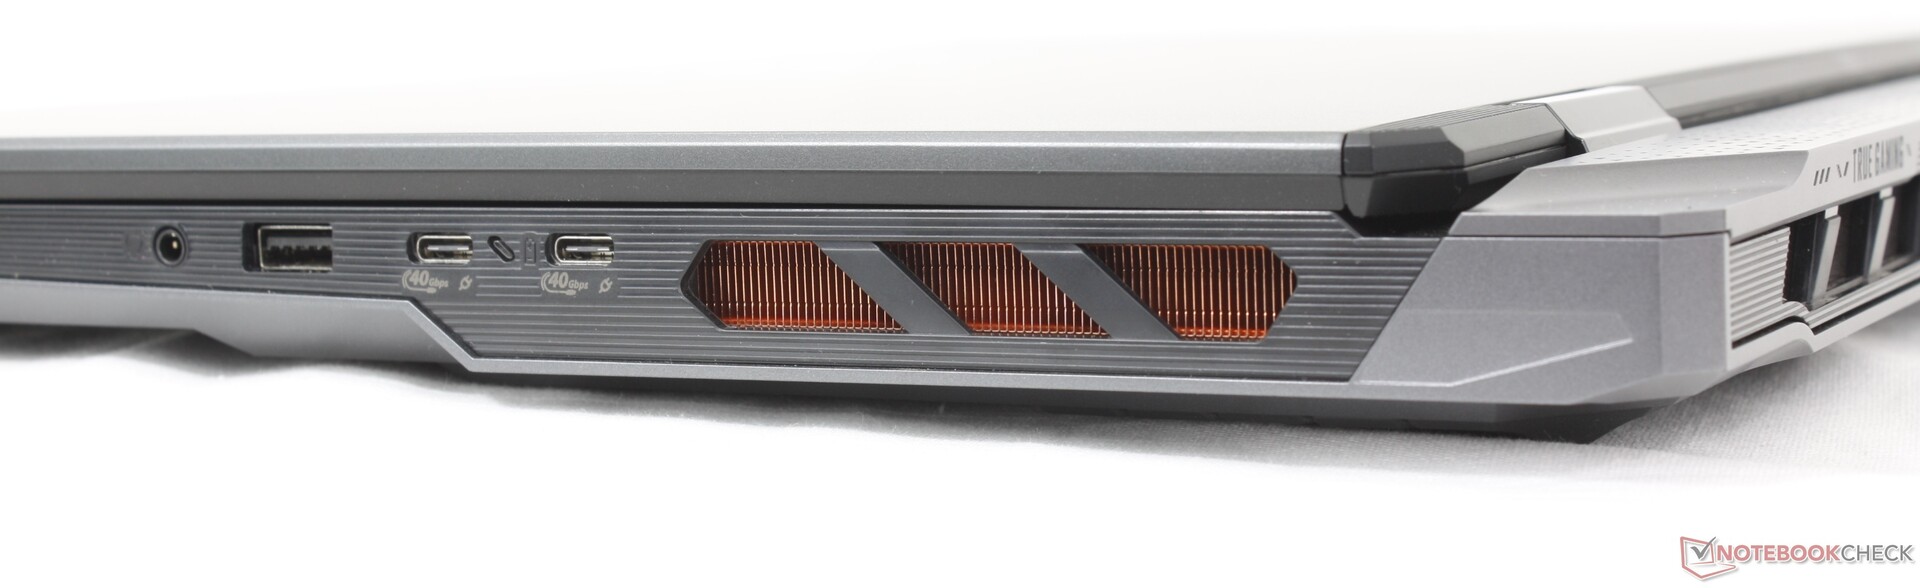
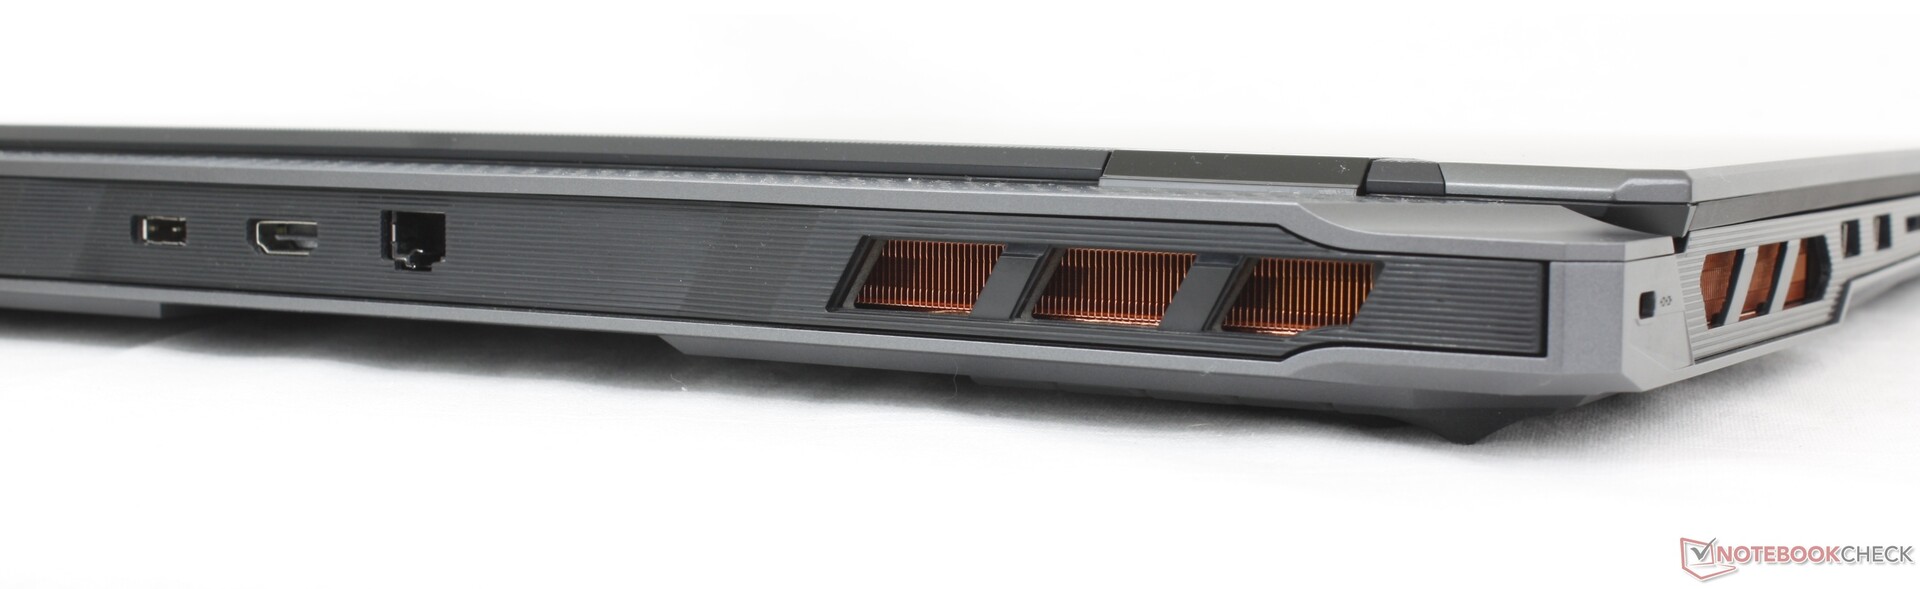
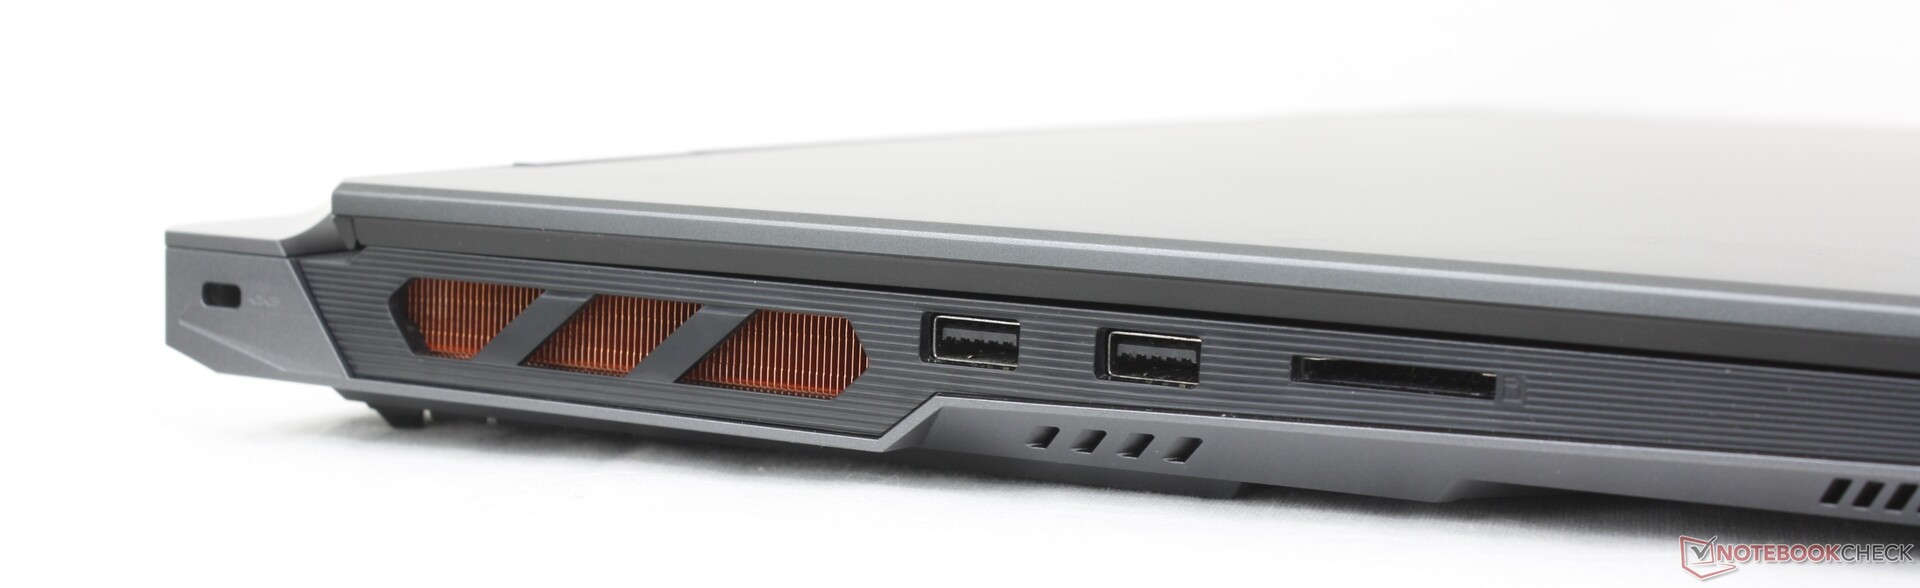
连接性
尽管尺寸不同,但端口选项和位置与 Vector 16 略有不同。Vector A18 用户拥有两个 USB-C 端口(而不是三个)和三个 USB-A 端口(而不是两个)。
SD 读卡器
| SD Card Reader | |
| average JPG Copy Test (av. of 3 runs) | |
| MSI Vector A18 HX A9W (Toshiba Exceria Pro SDXC 64 GB UHS-II) | |
| Alienware m18 R2 (Toshiba Exceria Pro SDXC 64 GB UHS-II) | |
| Razer Blade 18 2024 RZ09-0509 (Toshiba Exceria Pro SDXC 64 GB UHS-II) | |
| Acer Predator Helios 18 PH18-72-98MW (AV PRO microSD 128 GB V60) | |
| MSI Raider 18 HX A14V (Toshiba Exceria Pro SDXC 64 GB UHS-II) | |
| maximum AS SSD Seq Read Test (1GB) | |
| MSI Vector A18 HX A9W (Toshiba Exceria Pro SDXC 64 GB UHS-II) | |
| Razer Blade 18 2024 RZ09-0509 (Toshiba Exceria Pro SDXC 64 GB UHS-II) | |
| Alienware m18 R2 (Toshiba Exceria Pro SDXC 64 GB UHS-II) | |
| MSI Raider 18 HX A14V (Toshiba Exceria Pro SDXC 64 GB UHS-II) | |
| Acer Predator Helios 18 PH18-72-98MW (AV PRO microSD 128 GB V60) | |
交流
| Networking | |
| iperf3 transmit AXE11000 | |
| Asus Strix Scar 18 G835LX | |
| MSI Vector A18 HX A9W | |
| Razer Blade 18 2024 RZ09-0509 | |
| Acer Predator Helios 18 PH18-72-98MW | |
| Alienware m18 R2 | |
| MSI Raider 18 HX A14V | |
| iperf3 receive AXE11000 | |
| Acer Predator Helios 18 PH18-72-98MW | |
| Asus Strix Scar 18 G835LX | |
| MSI Vector A18 HX A9W | |
| Razer Blade 18 2024 RZ09-0509 | |
| Alienware m18 R2 | |
| MSI Raider 18 HX A14V | |
| iperf3 transmit AXE11000 6GHz | |
| MSI Vector A18 HX A9W | |
| Razer Blade 18 2024 RZ09-0509 | |
| MSI Raider 18 HX A14V | |
| Alienware m18 R2 | |
| iperf3 receive AXE11000 6GHz | |
| MSI Vector A18 HX A9W | |
| Razer Blade 18 2024 RZ09-0509 | |
| Alienware m18 R2 | |
| MSI Raider 18 HX A14V | |
网络摄像头
200 万像素网络摄像头标配红外和物理隐私滑块。


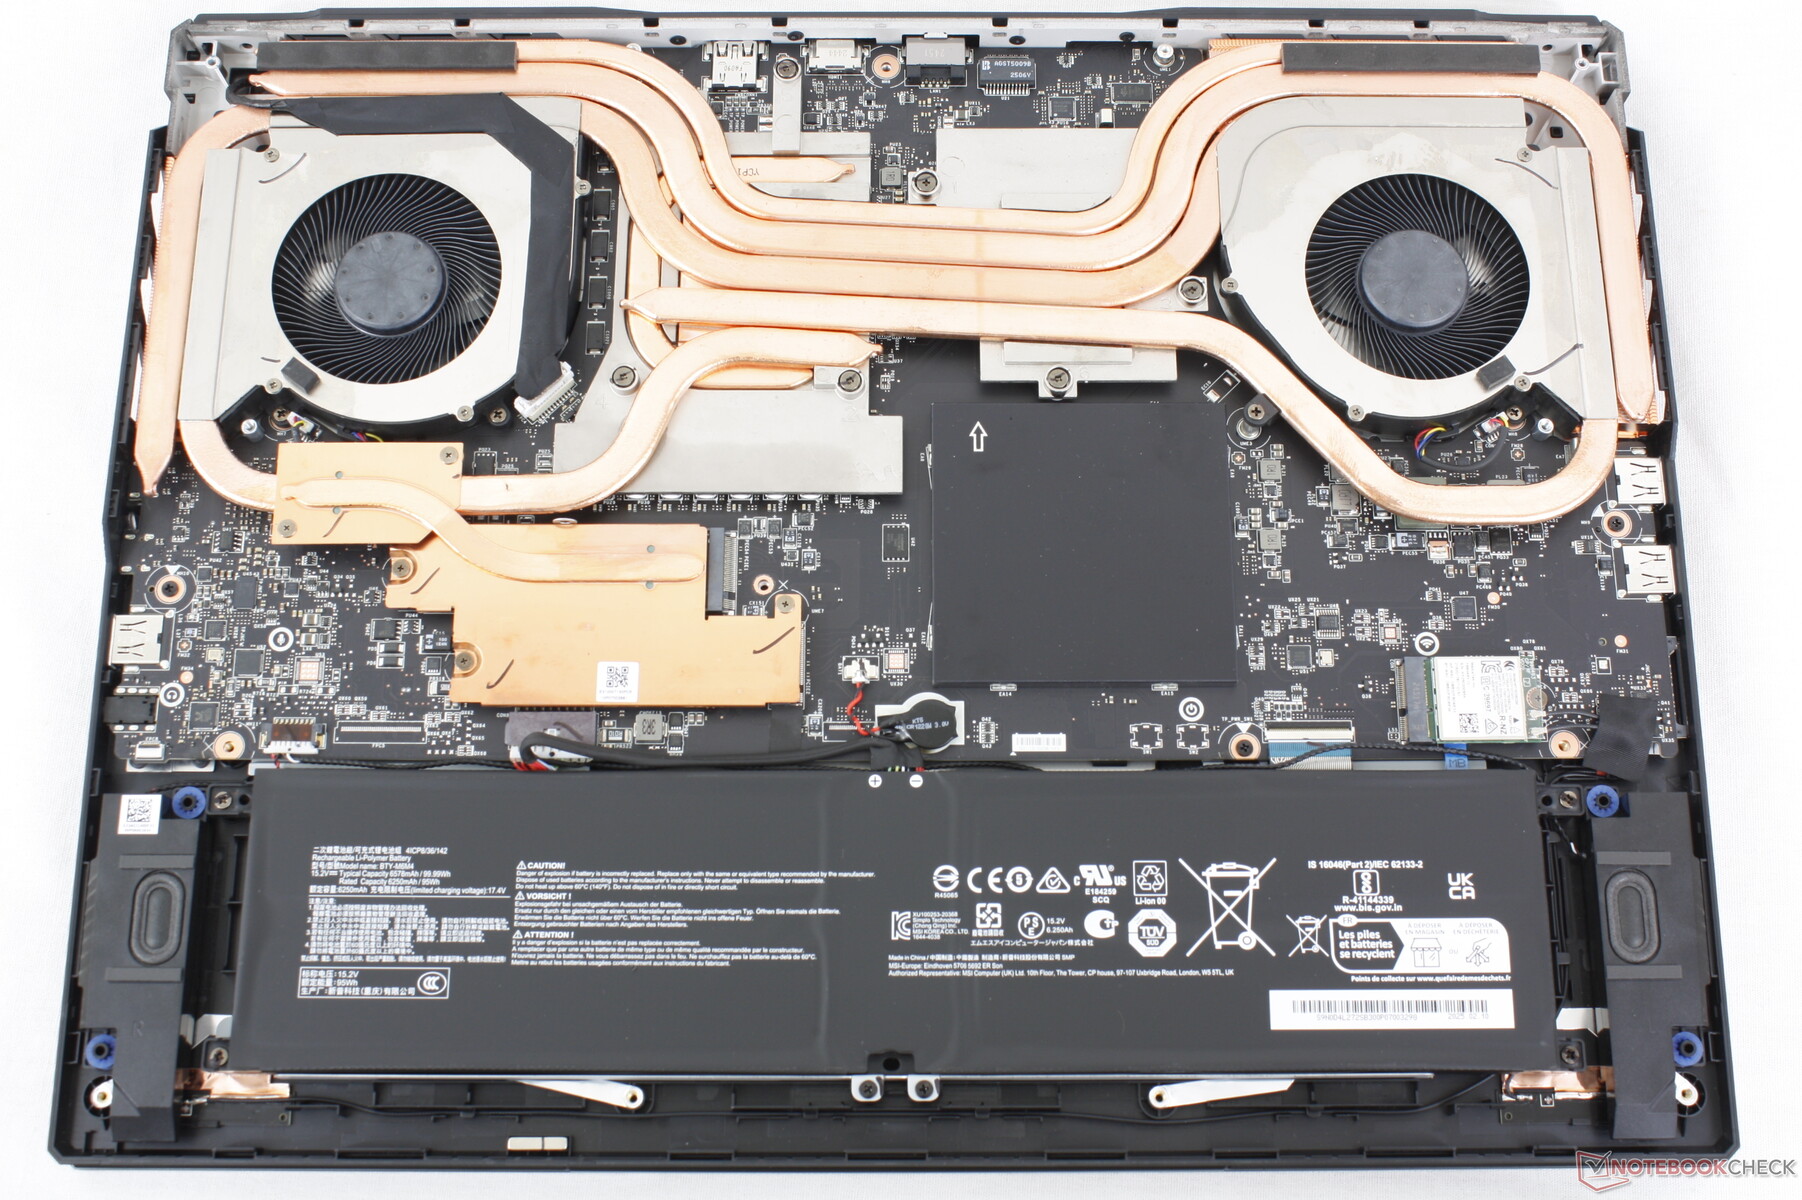
维护
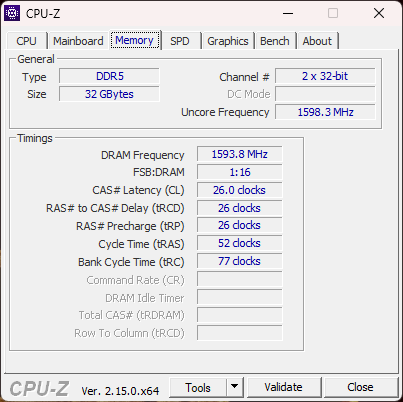
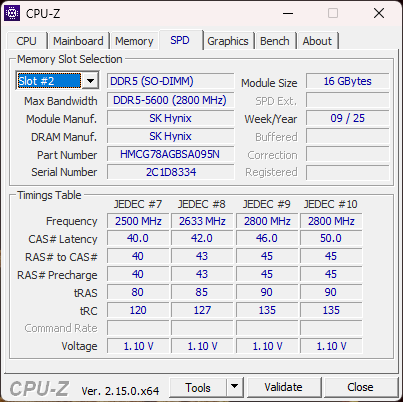
用户可以轻松访问两个 DDR5 SODIMM 插槽、两个 M.2 2280 SSD 插槽和可移动 WLAN 模块。请注意,两个固态硬盘插槽中的一个支持 PCIe5 驱动器。
可持续性
微星没有明确提及在制造过程中使用了任何可回收材料。包装主要是纸和纸板,但笔记本电脑和交流适配器周围有塑料包装。
配件和保修
包装盒内除了交流适配器和文件外,没有其他附件。如果在美国购买,制造商通常提供一年有限保修。
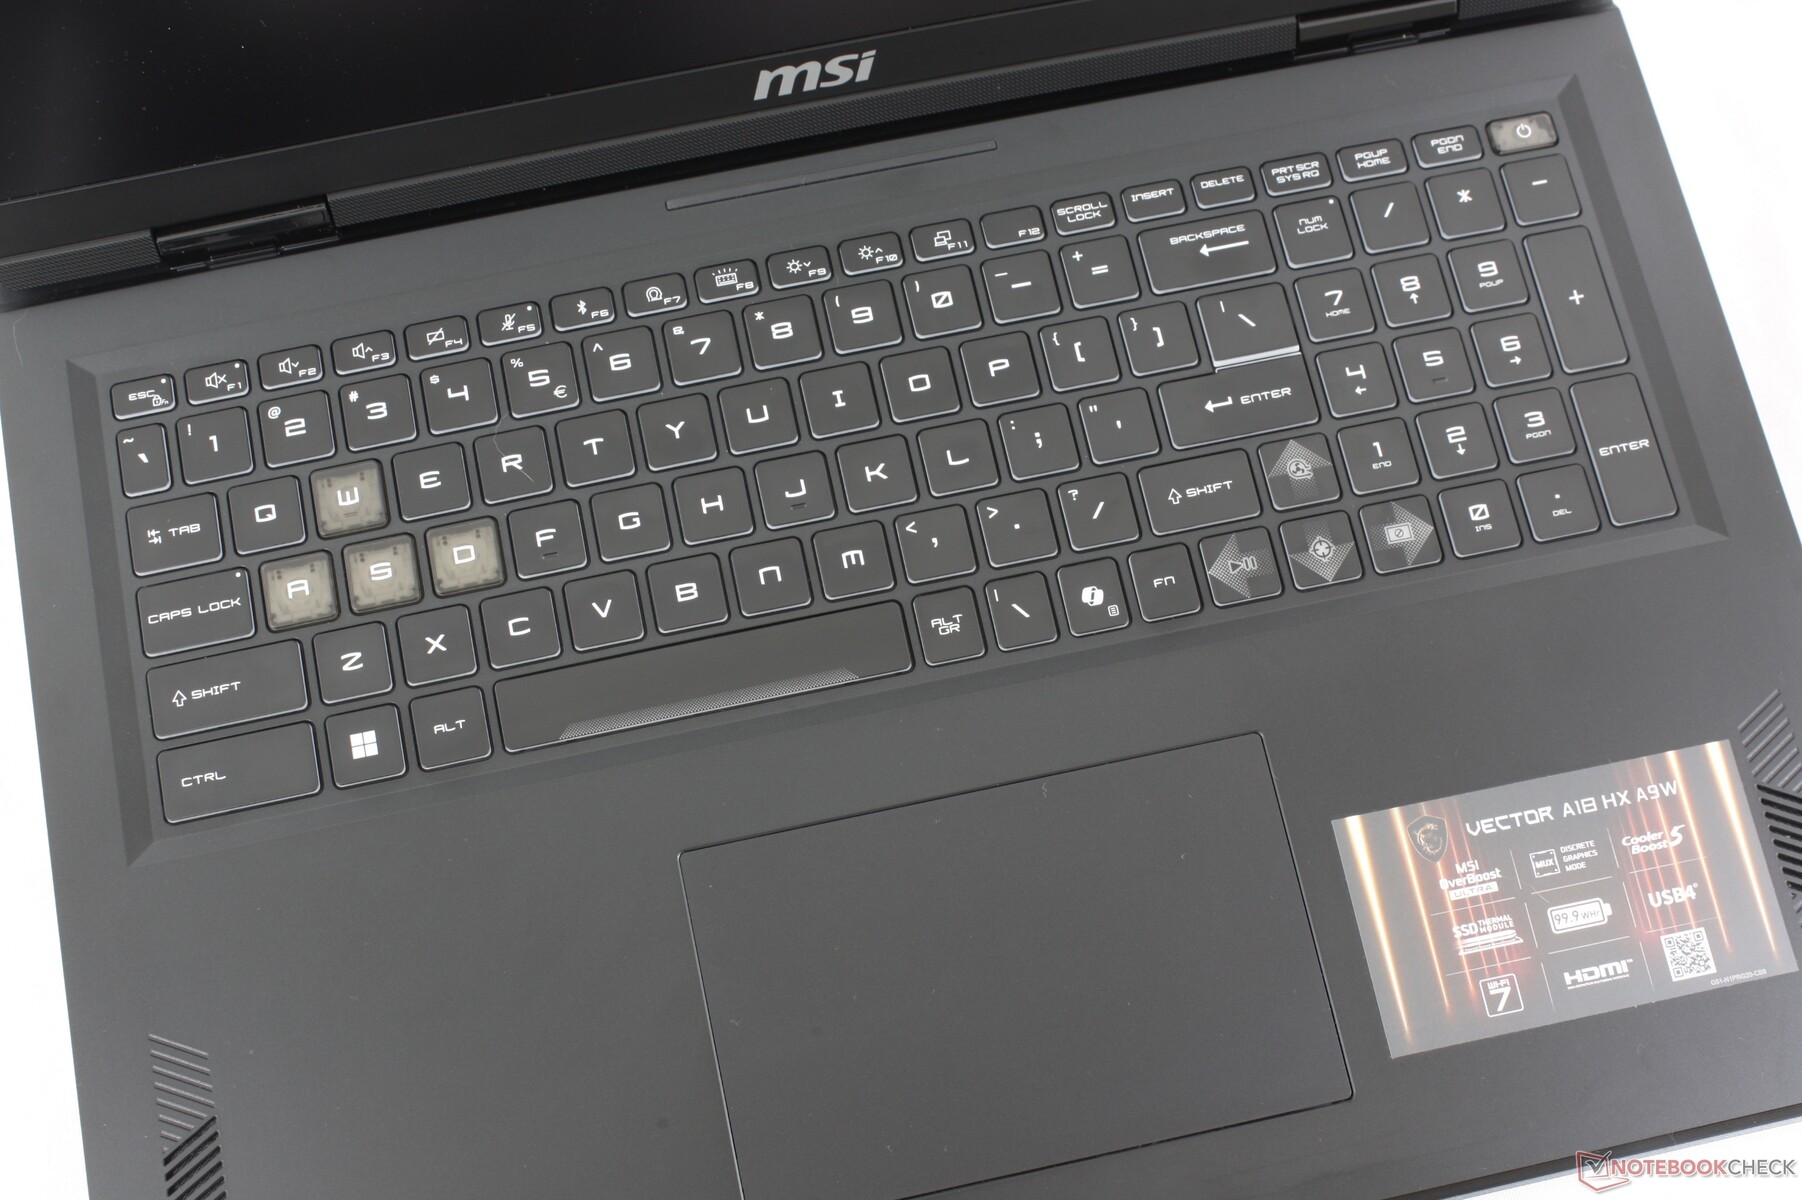
输入设备
键盘和触摸板
键盘是 Vector 16 的升级版,按键稍大,看起来更像更昂贵的 Raider 18 HX 的键盘。特别是方向键和数字键盘,感觉比其他大多数笔记本电脑的键盘更宽敞。
点击板尺寸与 Raider 18 HX 完全相同(13 x 8.2 厘米)。我们的设备上的点击板可能存在缺陷,因为在按压其表面时经常会卡住。我们建议在购买后立即仔细检查点击板是否有任何异常。
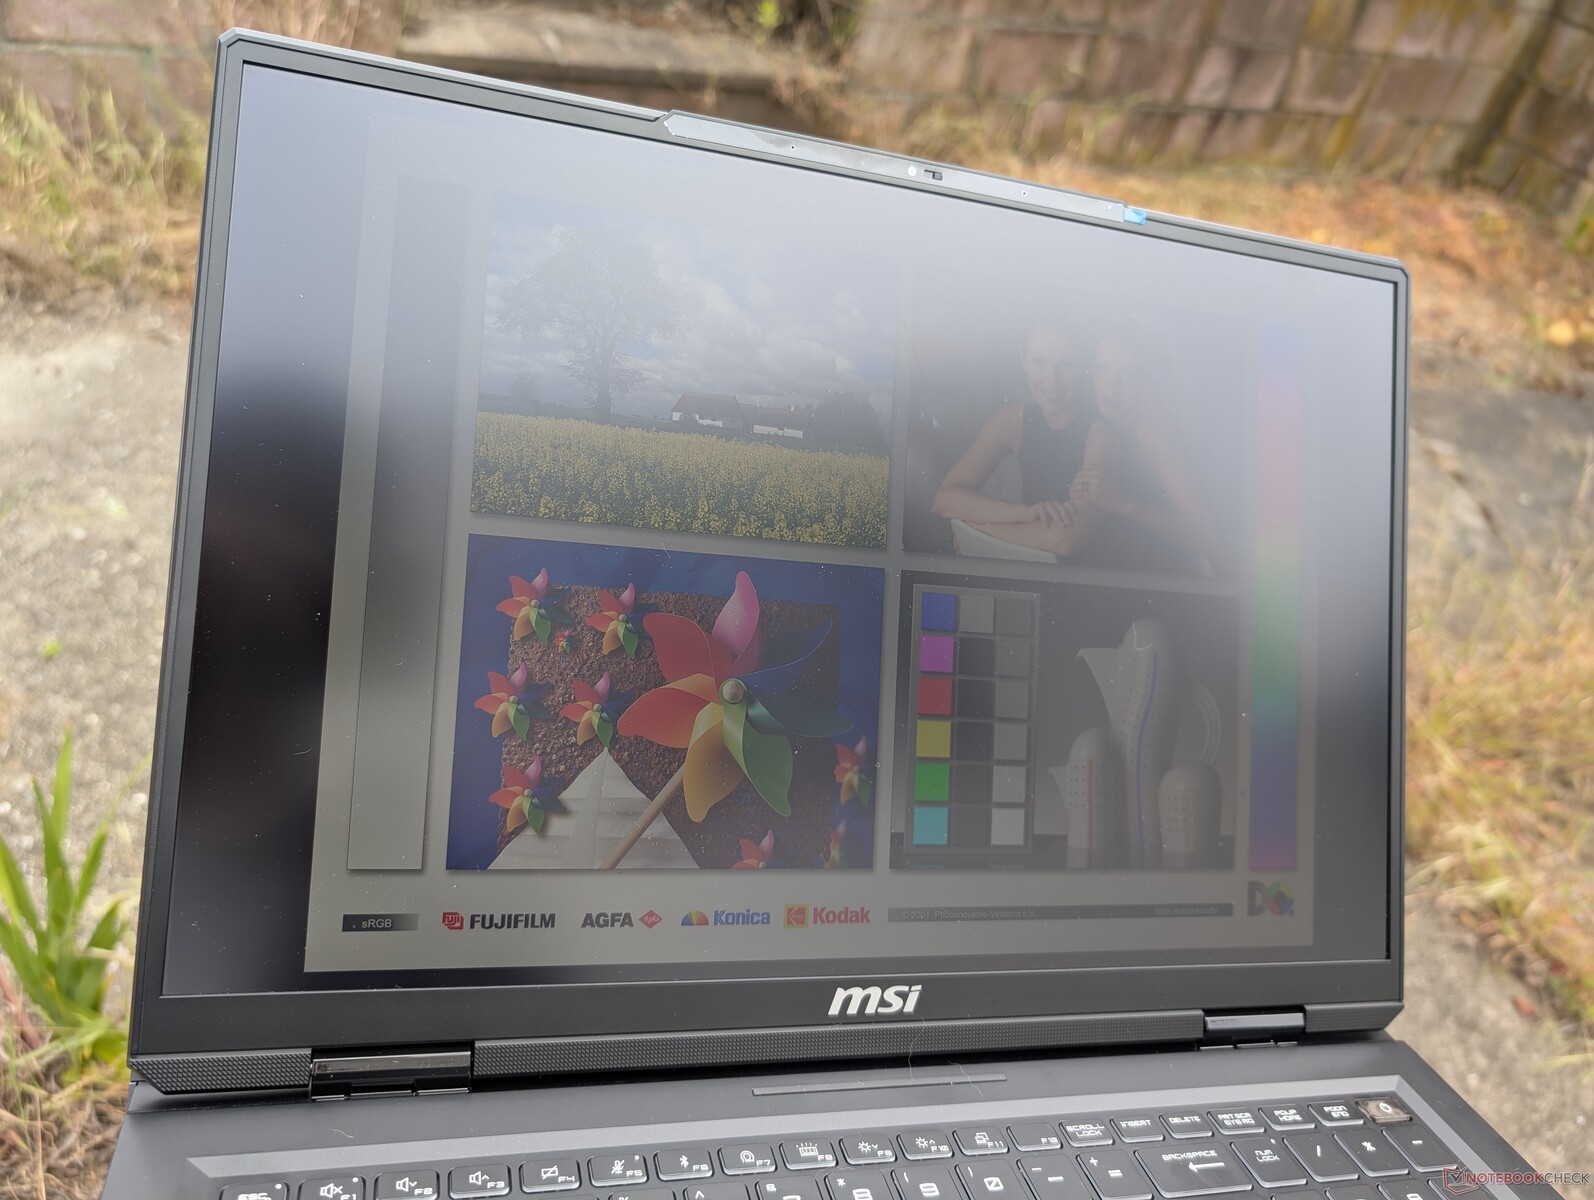
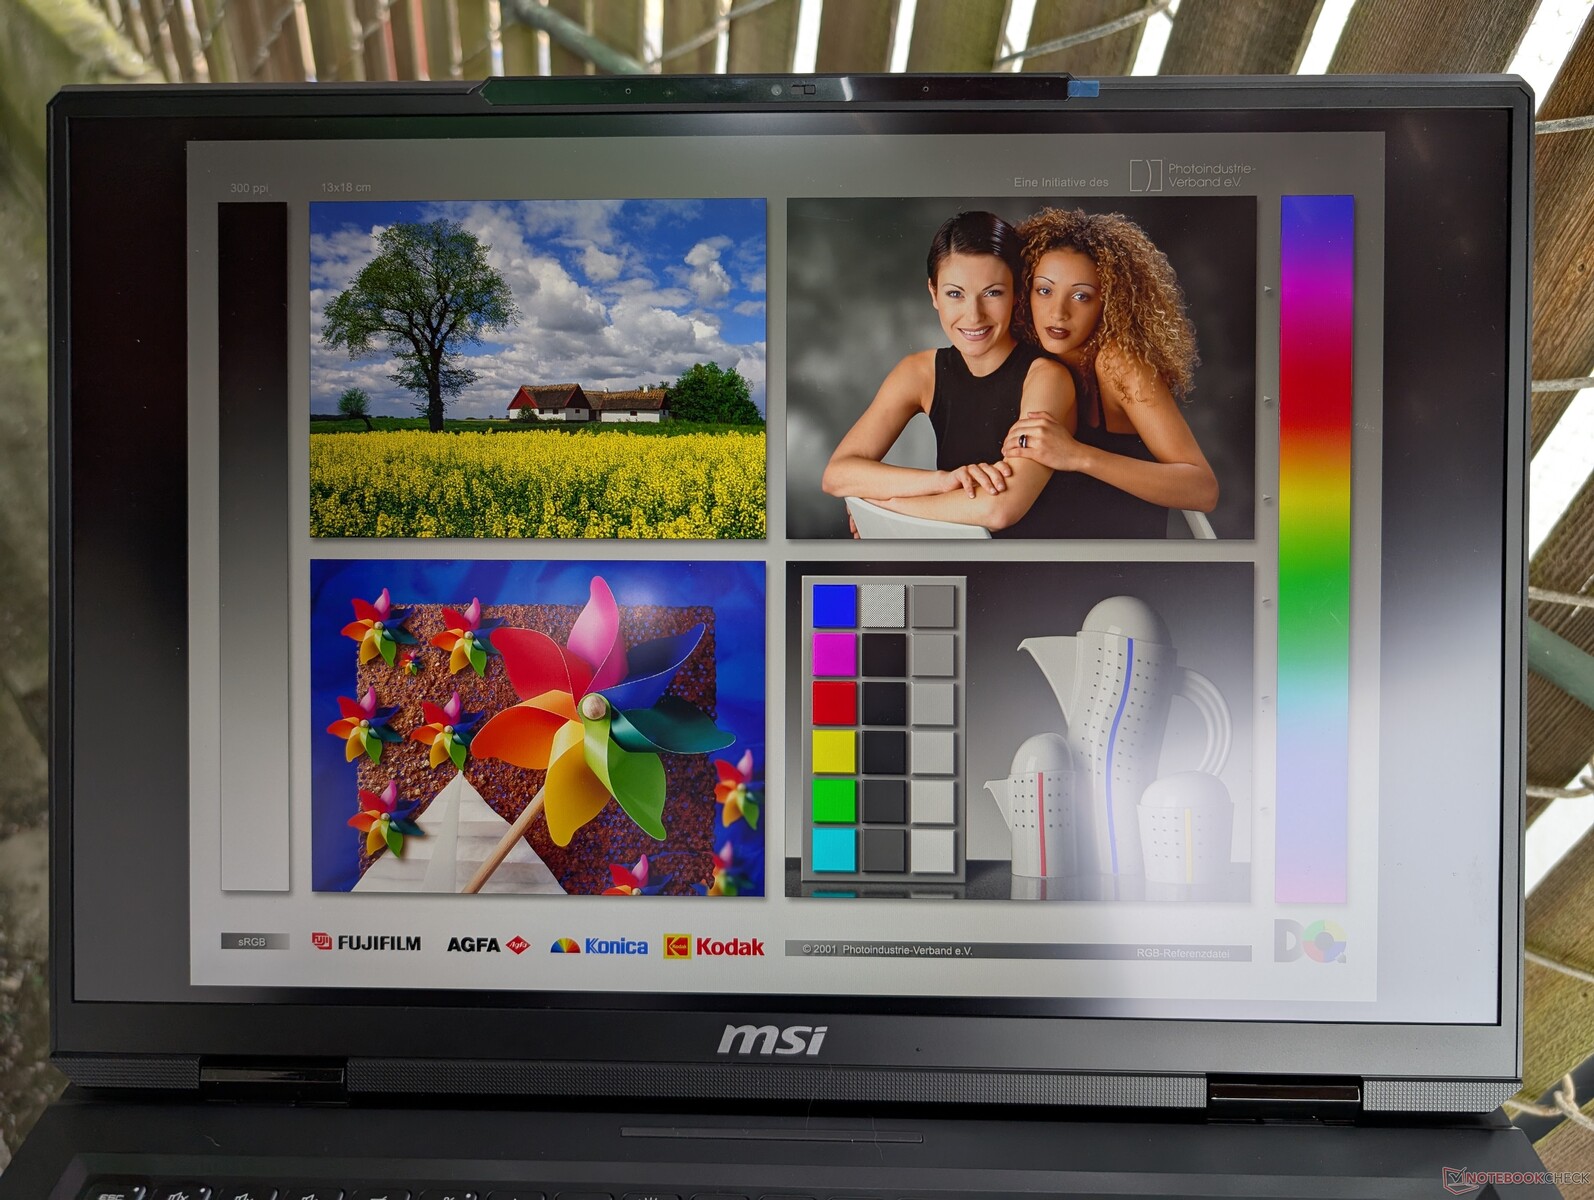
显示屏
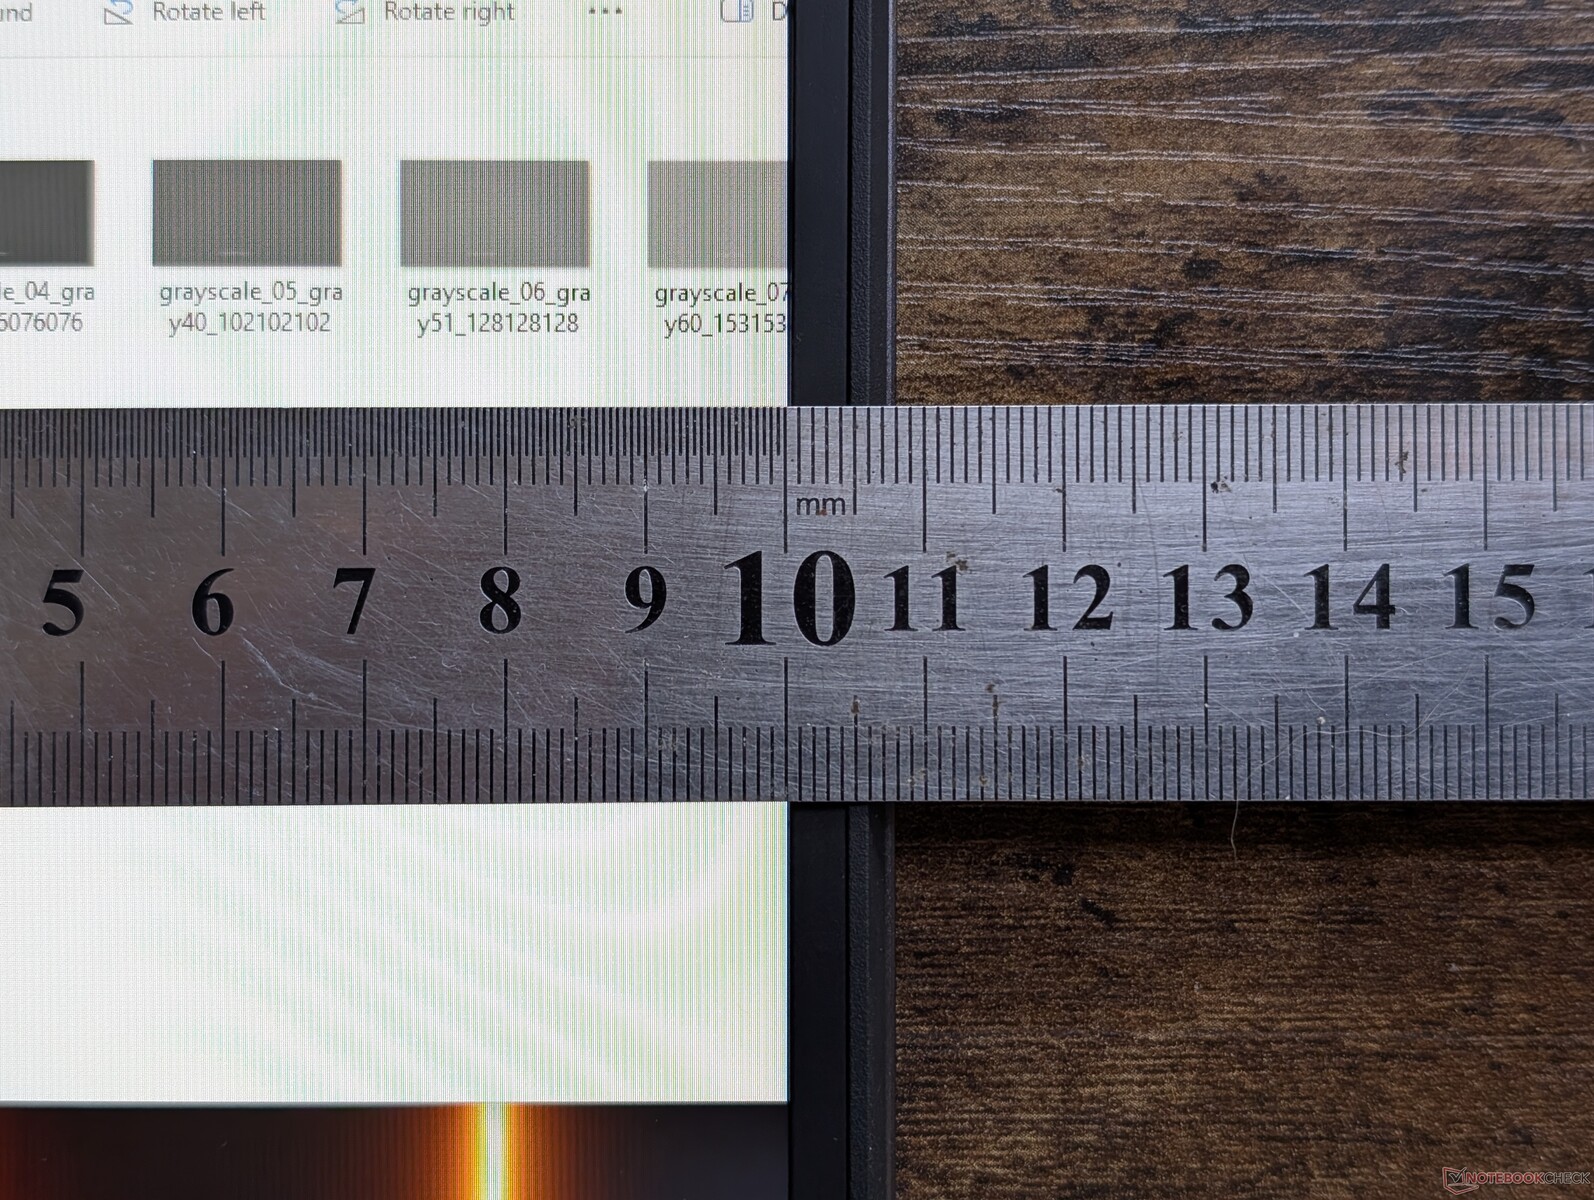
共有以下五种显示屏可供选择。我们的测量结果只反映了在我们的评测配置上使用的粗体选项:
- 2400p,Mini-LED,120 Hz
- 1600p,IPS,240 赫兹
- 1200p,IPS,165 赫兹
- 2400p,IPS,240 赫兹
- 1200p,IPS,144 赫兹
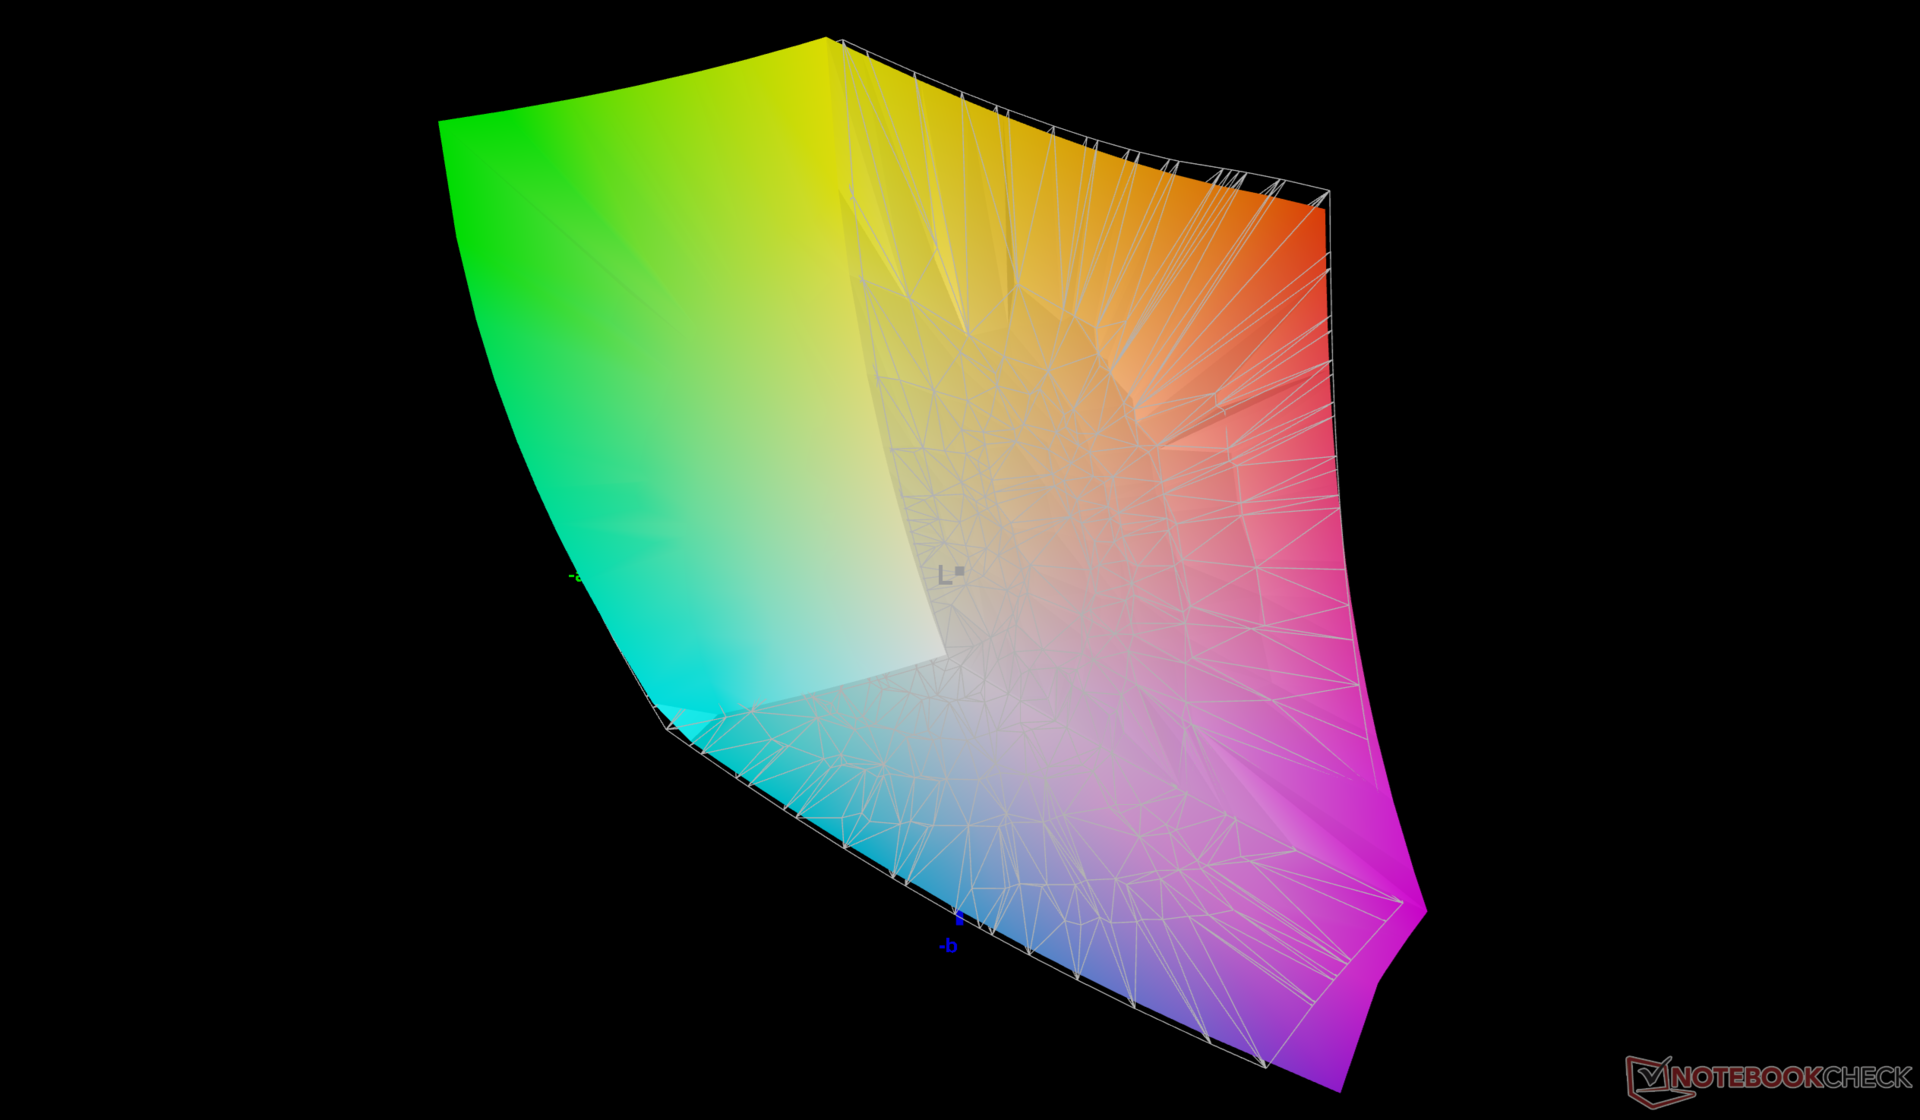
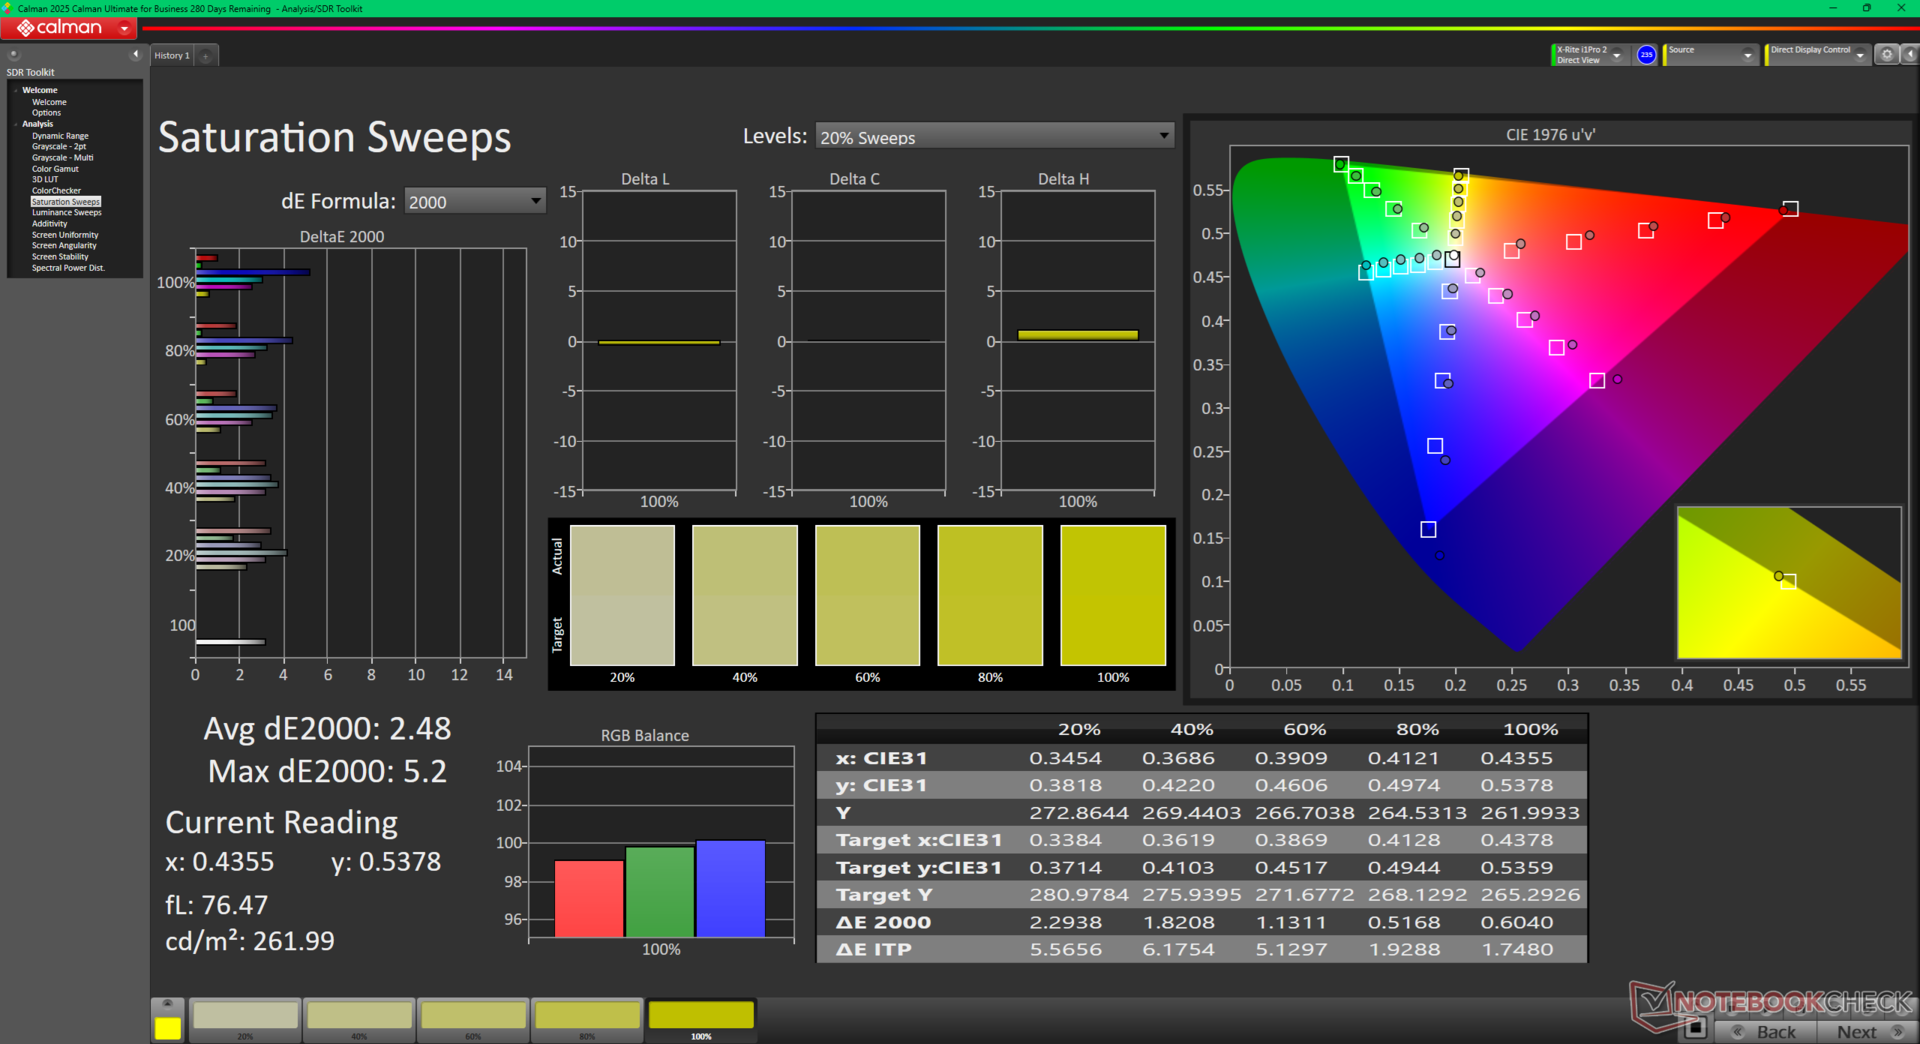
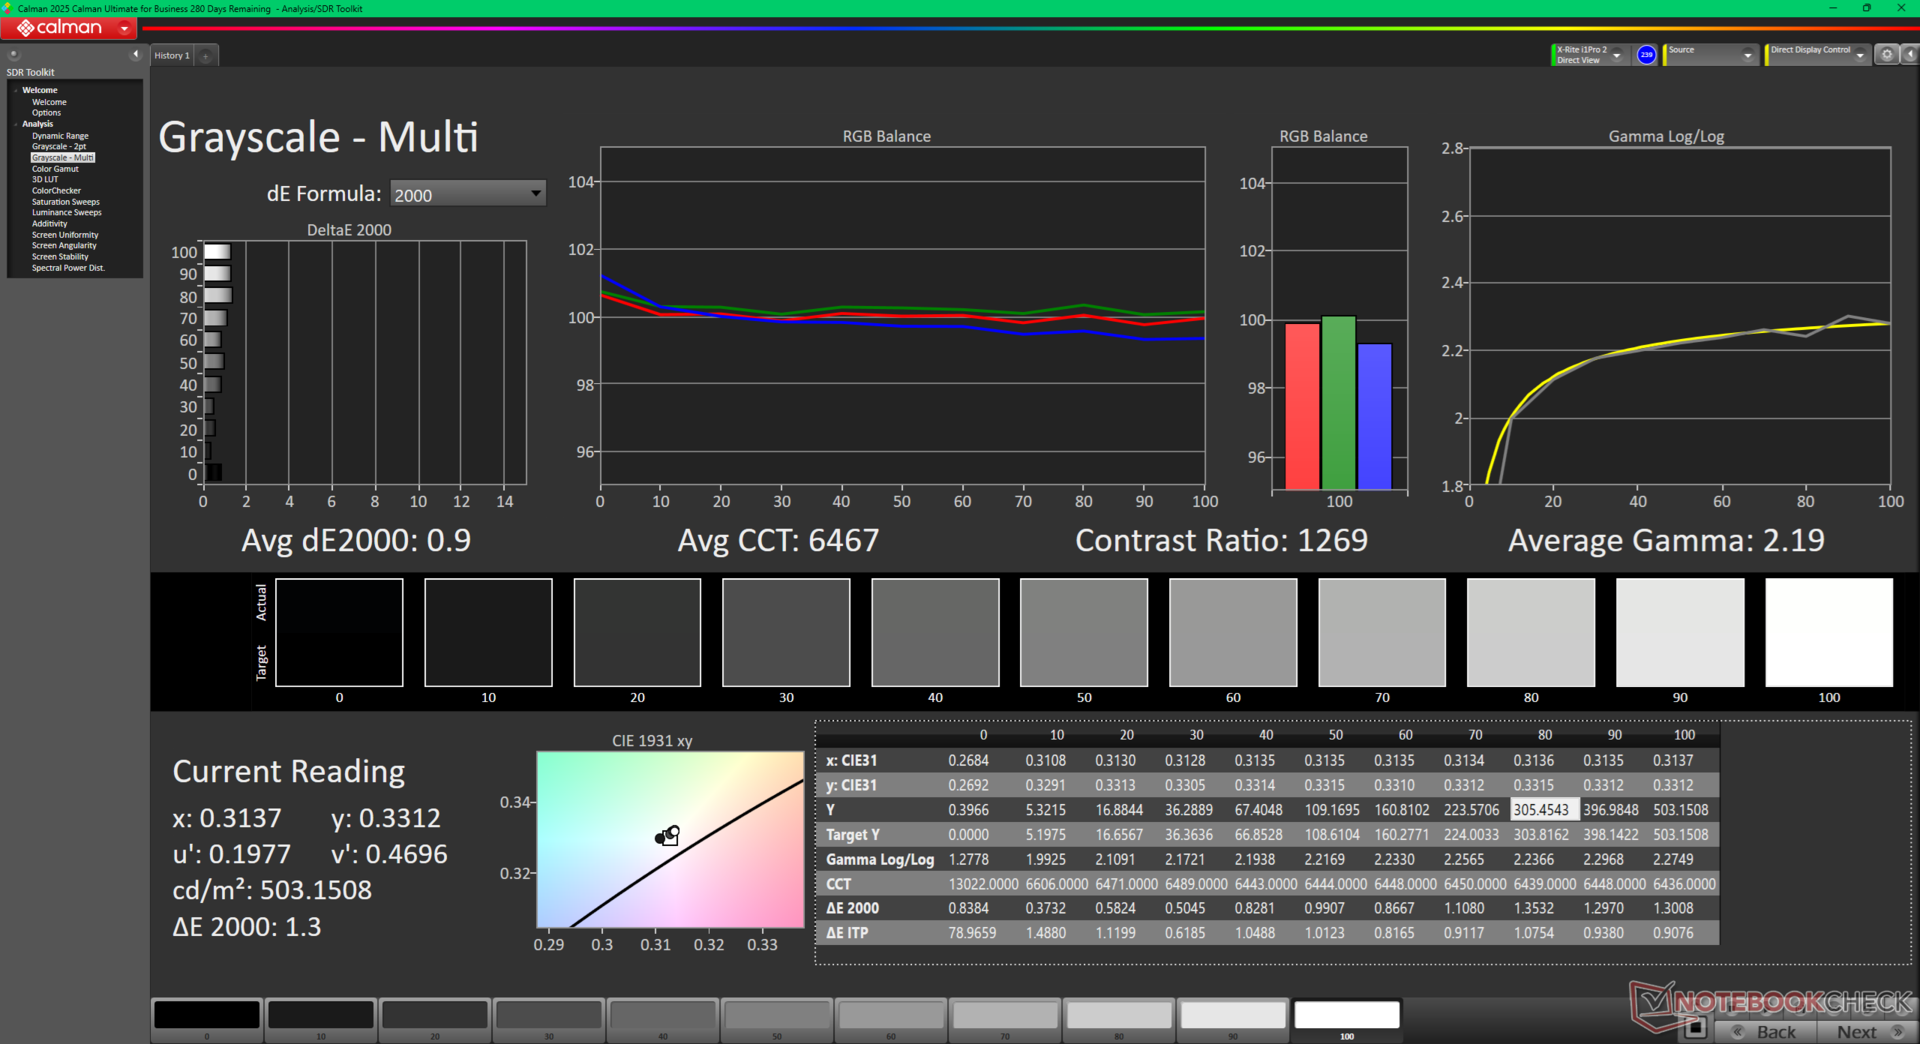
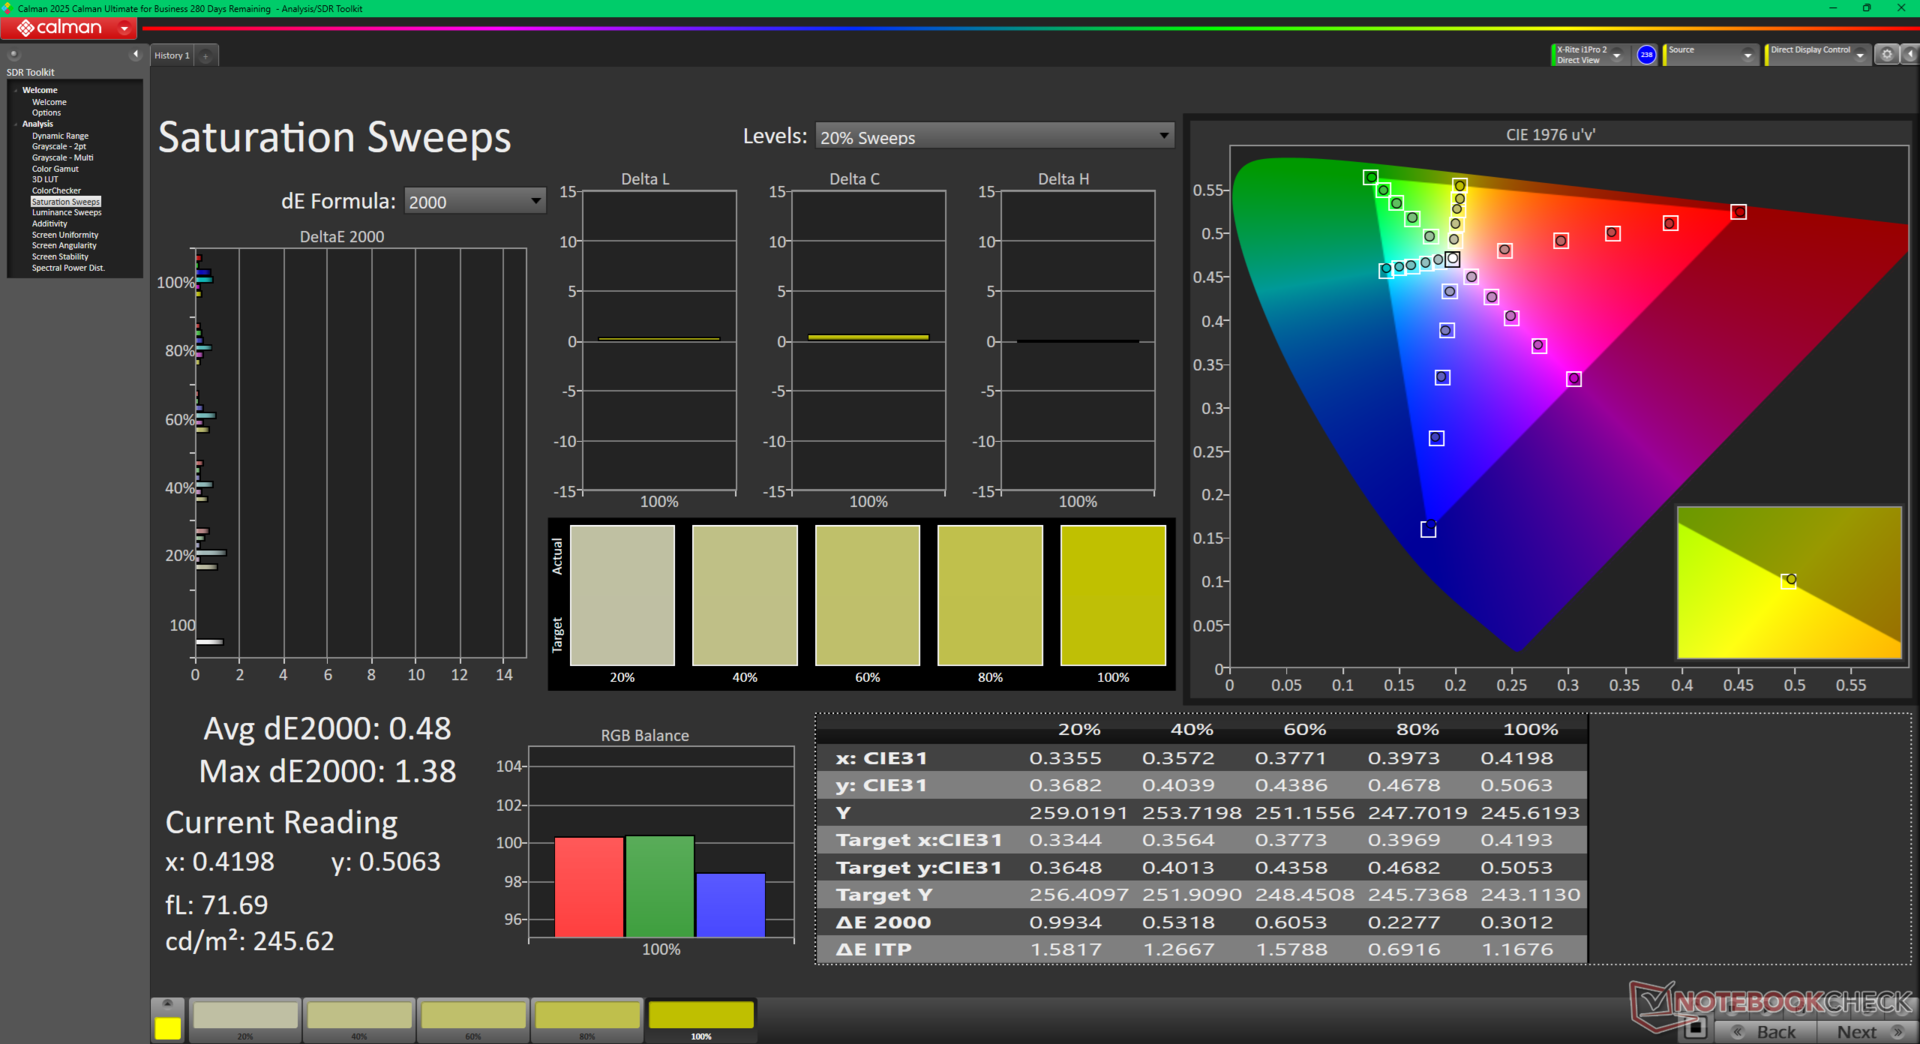
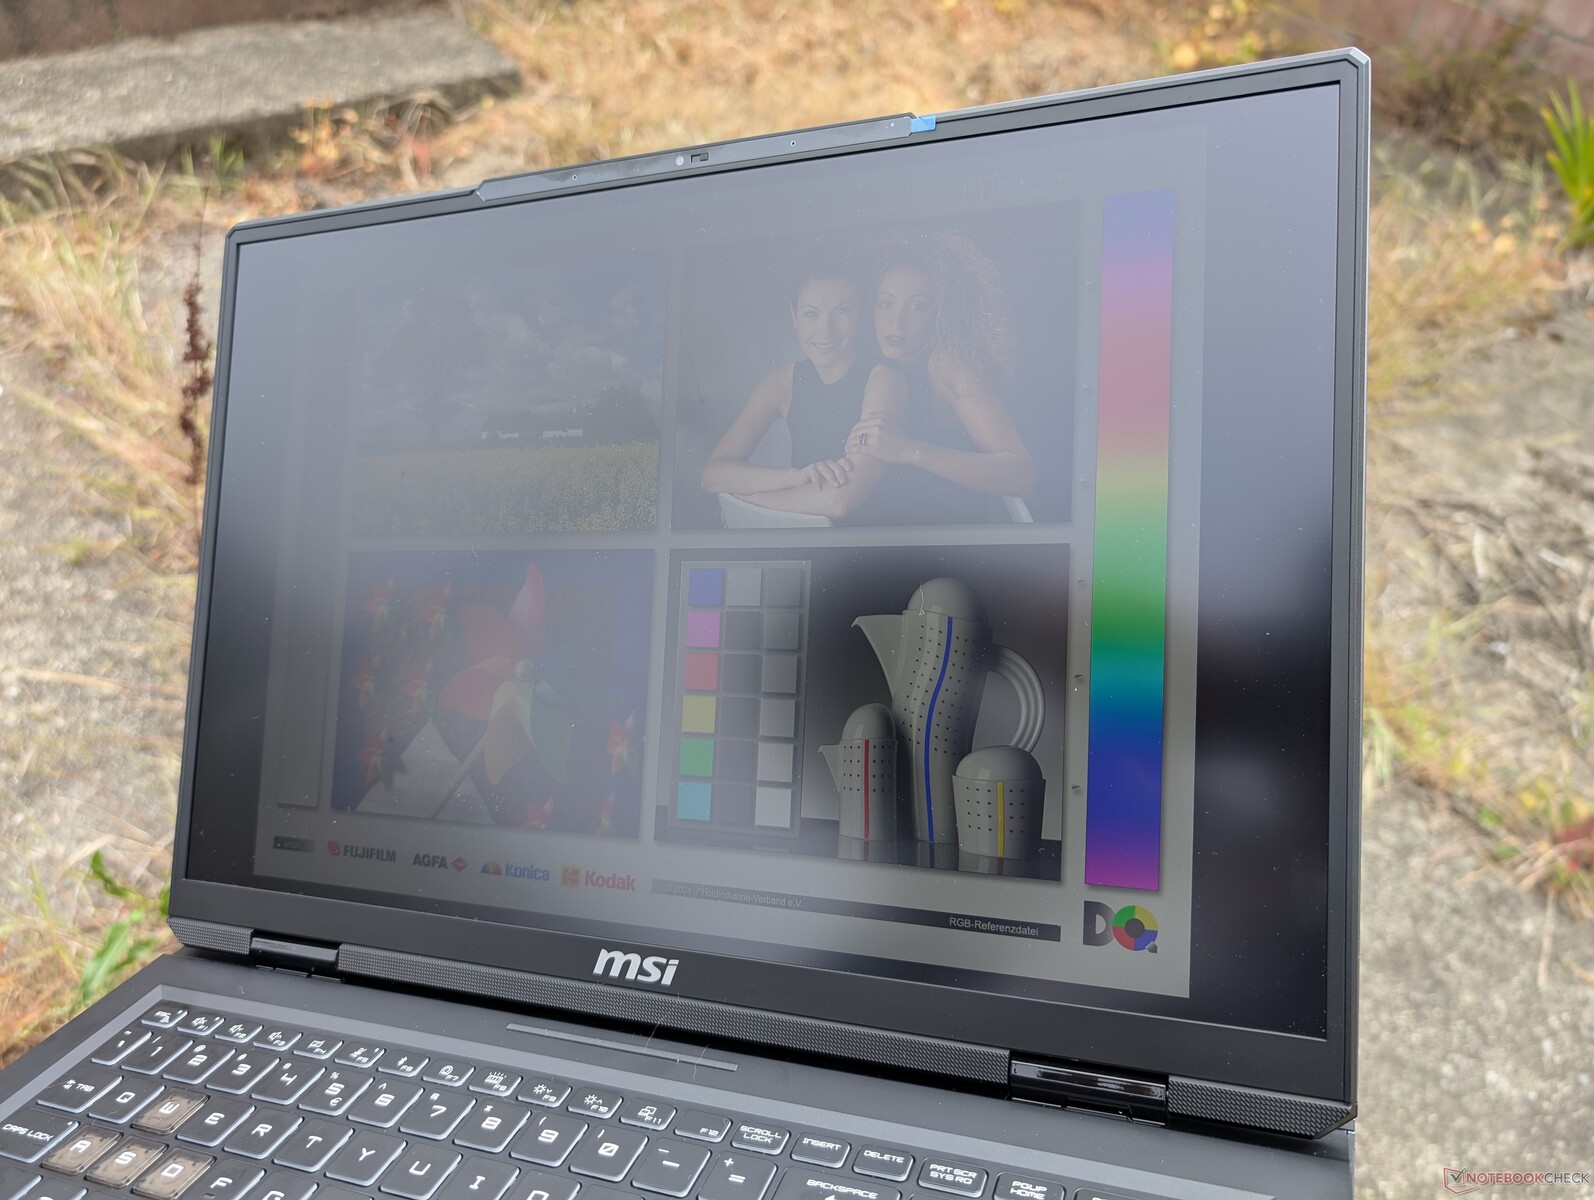
1600p240 选项因其宽 P3 色彩和快速响应时间,在游戏和内容编辑之间取得了很好的平衡。它的亮度不如 mini-LED,也不支持 HDR 播放,但平均亮度超过 500 尼特,足以满足大多数需求。请注意,本机不支持 G-Sync。

| |||||||||||||||||||||||||
Brightness Distribution: 86 %
Center on Battery: 516.7 cd/m²
Contrast: 970:1 (Black: 0.56 cd/m²)
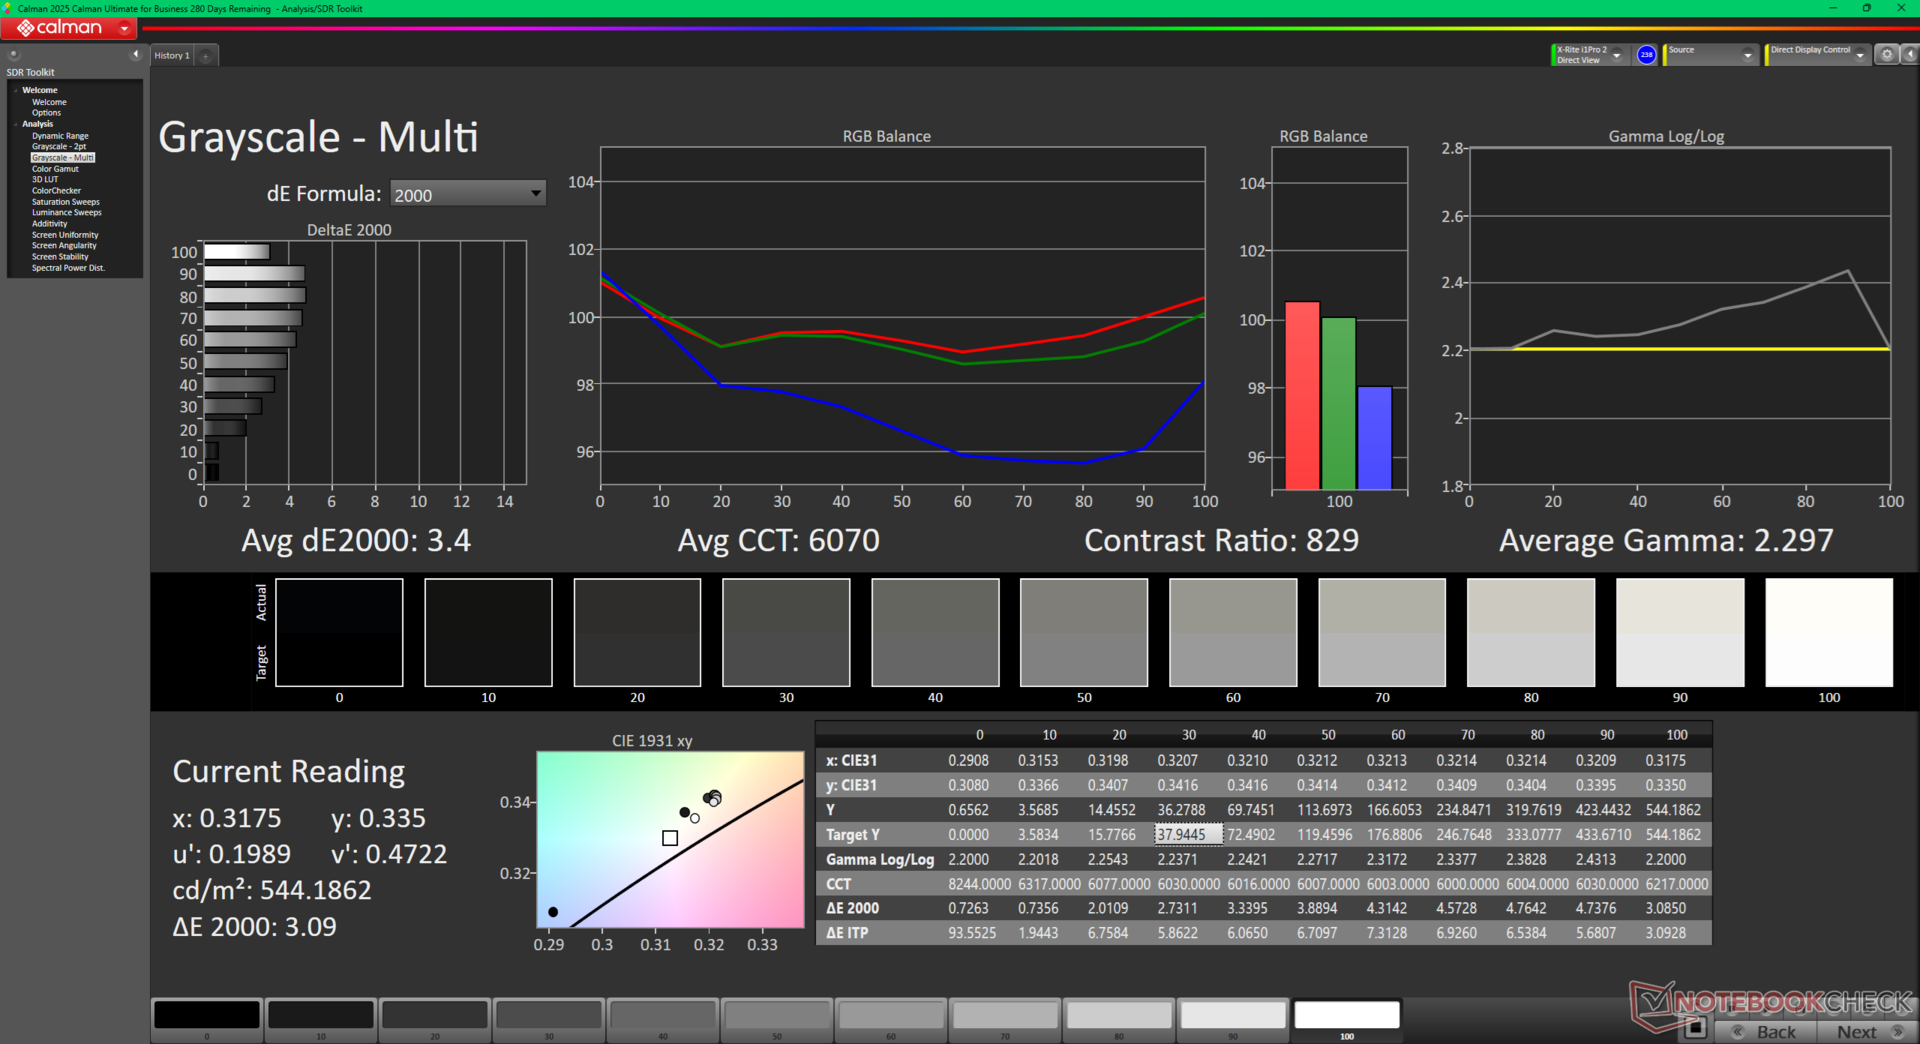
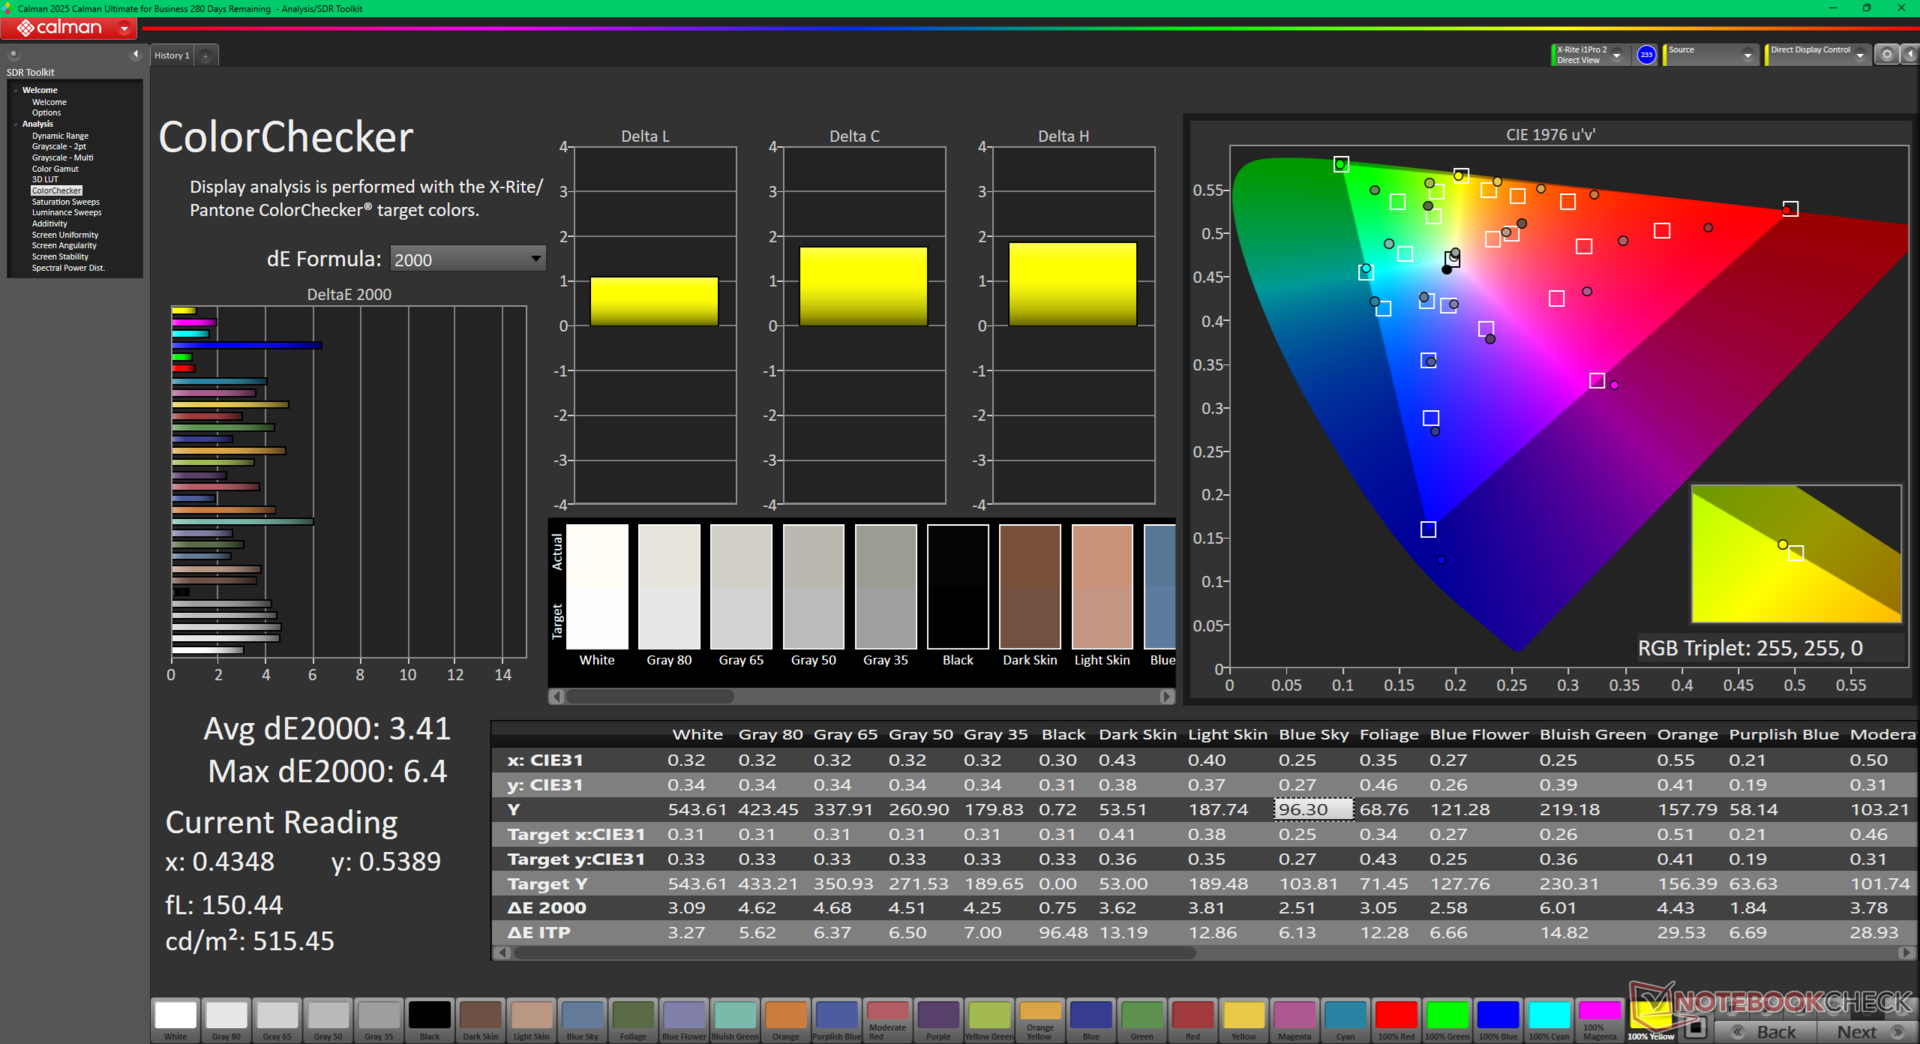
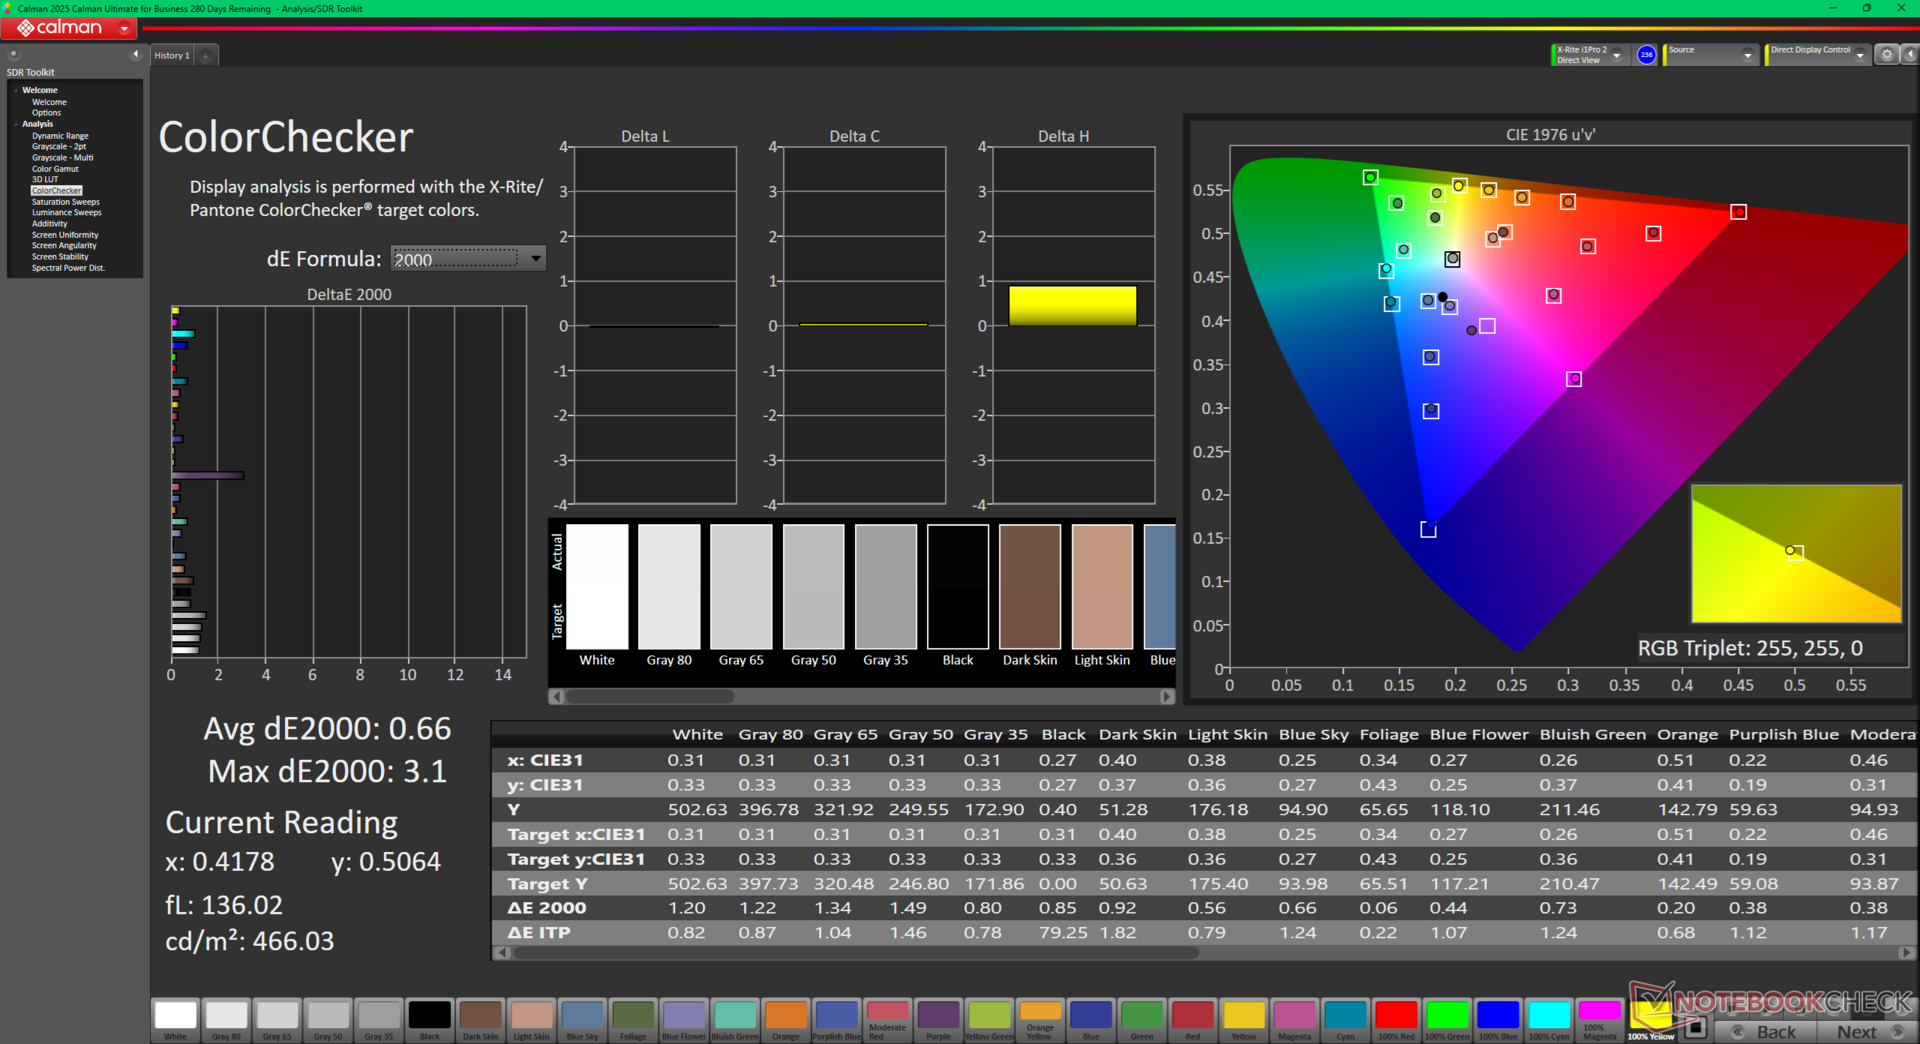
ΔE ColorChecker Calman: 3.41 | ∀{0.5-29.43 Ø4.72}
calibrated: 0.66
ΔE Greyscale Calman: 3.4 | ∀{0.09-98 Ø4.97}
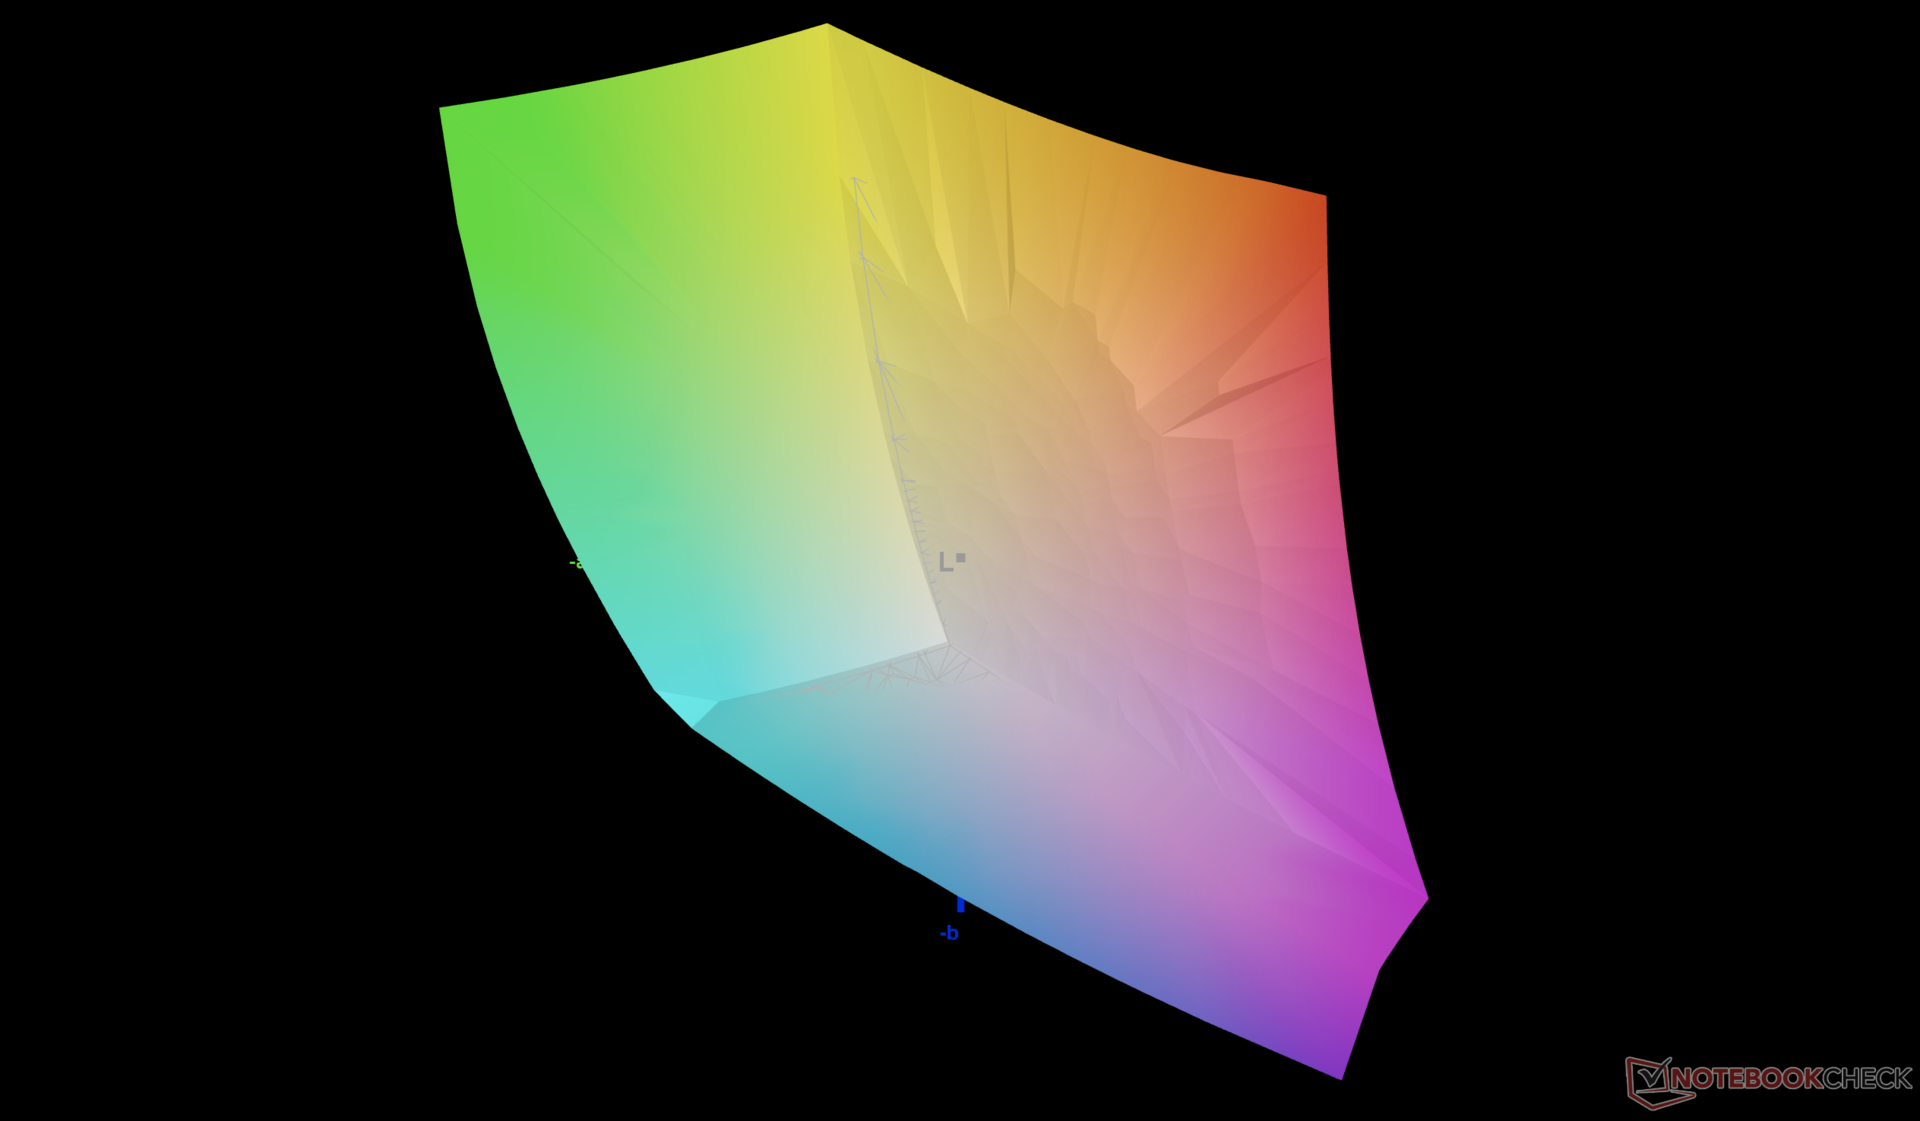
86.3% AdobeRGB 1998 (Argyll 3D)
99.9% sRGB (Argyll 3D)
98.1% Display P3 (Argyll 3D)
Gamma: 2.3
CCT: 6070 K
| MSI Vector A18 HX A9W AU Optronics B180QAN01.0, IPS, 2560x1600, 18", 240 Hz | MSI Raider 18 HX A14V AU Optronics B180ZAN1.0, Mini-LED, 3840x2400, 18", 120 Hz | Asus Strix Scar 18 G835LX N180QDM-NM2, Mini-LED, 2560x1600, 18", 240 Hz | Razer Blade 18 2024 RZ09-0509 BOE NE180QDM-NM1, Mini-LED, 2560x1600, 18", 300 Hz | Alienware m18 R2 BOE NE18NZ1, IPS, 2560x1600, 18", 165 Hz | Acer Predator Helios 18 PH18-72-98MW B180QAN01.2 (AUO45A8), Mini-LED, 2560x1600, 18", 250 Hz | |
|---|---|---|---|---|---|---|
| Display | -1% | 1% | 1% | 1% | 3% | |
| Display P3 Coverage (%) | 98.1 | 96.6 -2% | 99 1% | 99 1% | 97.8 0% | 99.7 2% |
| sRGB Coverage (%) | 99.9 | 99.9 0% | 100 0% | 100 0% | 99.5 0% | 100 0% |
| AdobeRGB 1998 Coverage (%) | 86.3 | 84.8 -2% | 87.2 1% | 86.9 1% | 88.9 3% | 91.6 6% |
| Response Times | -489% | -50% | -75% | -26% | -102% | |
| Response Time Grey 50% / Grey 80% * (ms) | 4.3 ? | 10.4 ? -142% | 7.4 ? -72% | 7.6 ? -77% | 5.3 ? -23% | 8 ? -86% |
| Response Time Black / White * (ms) | 8.1 ? | 75.8 ? -836% | 10.4 ? -28% | 14 ? -73% | 10.4 ? -28% | 17.6 ? -117% |
| PWM Frequency (Hz) | 2606.2 ? | 20610 ? | 26444 ? | 4832 ? | ||
| PWM Amplitude * (%) | 90 | 100 | ||||
| Screen | -55% | 131% | 19% | -0% | 200% | |
| Brightness middle (cd/m²) | 543 | 575.7 6% | 764 41% | 605.4 11% | 271.8 -50% | 722 33% |
| Brightness (cd/m²) | 502 | 574 14% | 747 49% | 600 20% | 275 -45% | 724 44% |
| Brightness Distribution (%) | 86 | 94 9% | 93 8% | 97 13% | 78 -9% | 93 8% |
| Black Level * (cd/m²) | 0.56 | 0.1 82% | 0.62 -11% | 0.27 52% | 0.04 93% | |
| Contrast (:1) | 970 | 7640 688% | 976 1% | 1007 4% | 18050 1761% | |
| Colorchecker dE 2000 * | 3.41 | 3.56 -4% | 1.2 65% | 1.53 55% | 2.48 27% | 3.4 -0% |
| Colorchecker dE 2000 max. * | 6.4 | 8.64 -35% | 2.8 56% | 4.15 35% | 5.59 13% | 5.32 17% |
| Colorchecker dE 2000 calibrated * | 0.66 | 2.69 -308% | 0.56 15% | 1.6 -142% | ||
| Greyscale dE 2000 * | 3.4 | 5.6 -65% | 1.5 56% | 2.6 24% | 3.7 -9% | 3.8 -12% |
| Gamma | 2.3 96% | 2.34 94% | 2.17 101% | 2.22 99% | 2.2 100% | 2.383 92% |
| CCT | 6070 107% | 7872 83% | 6556 99% | 6843 95% | 6355 102% | 7051 92% |
| Total Average (Program / Settings) | -182% /
-114% | 27% /
73% | -18% /
0% | -8% /
-4% | 34% /
115% |
* ... smaller is better
Display Response Times
| ↔ Response Time Black to White | ||
|---|---|---|
| 8.1 ms ... rise ↗ and fall ↘ combined | ↗ 4 ms rise | 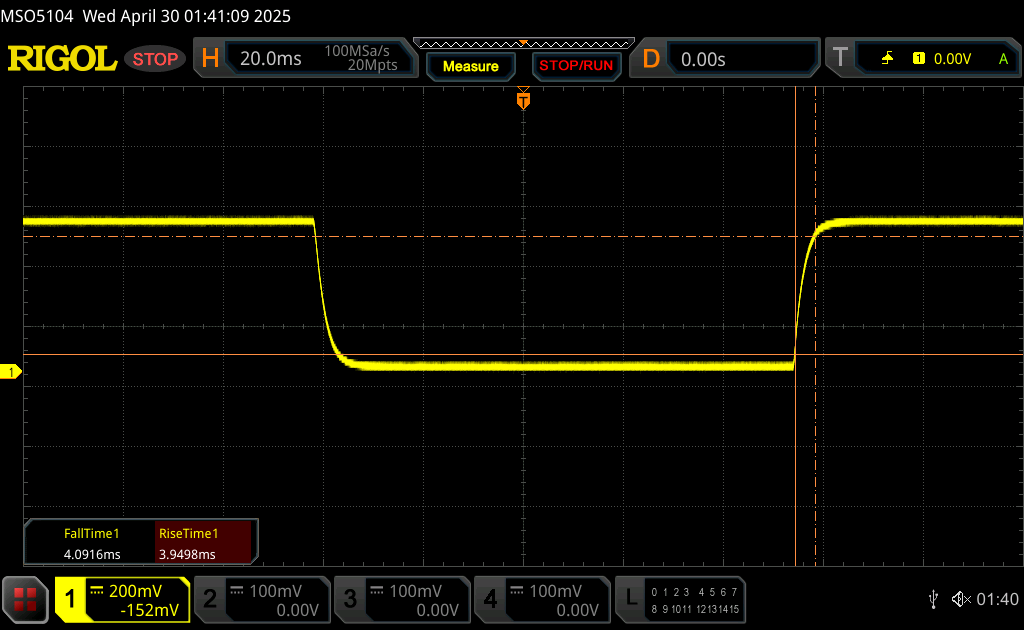 |
| ↘ 4.1 ms fall | ||
| The screen shows fast response rates in our tests and should be suited for gaming. In comparison, all tested devices range from 0.1 (minimum) to 240 (maximum) ms. » 23 % of all devices are better. This means that the measured response time is better than the average of all tested devices (19.8 ms). | ||
| ↔ Response Time 50% Grey to 80% Grey | ||
| 4.3 ms ... rise ↗ and fall ↘ combined | ↗ 1.8 ms rise | 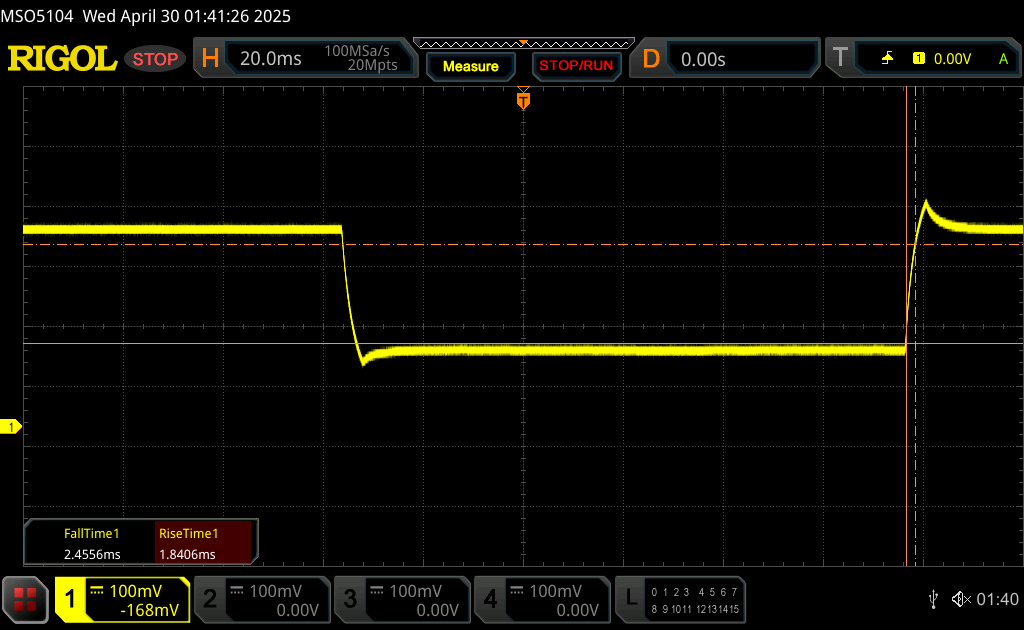 |
| ↘ 2.5 ms fall | ||
| The screen shows very fast response rates in our tests and should be very well suited for fast-paced gaming. In comparison, all tested devices range from 0.165 (minimum) to 636 (maximum) ms. » 16 % of all devices are better. This means that the measured response time is better than the average of all tested devices (31 ms). | ||
Screen Flickering / PWM (Pulse-Width Modulation)
| Screen flickering / PWM not detected | 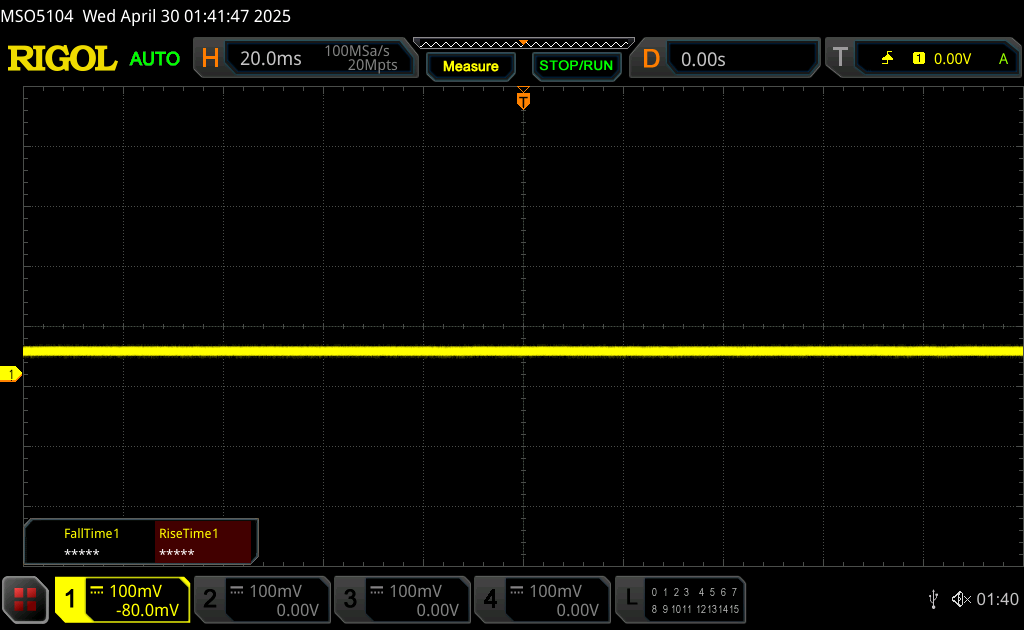 | ||
In comparison: 52 % of all tested devices do not use PWM to dim the display. If PWM was detected, an average of 7763 (minimum: 5 - maximum: 343500) Hz was measured. | |||
性能
测试条件
在运行以下基准测试之前,我们将 MSI Center 设置为极致性能模式和独立 GPU 模式。
处理器
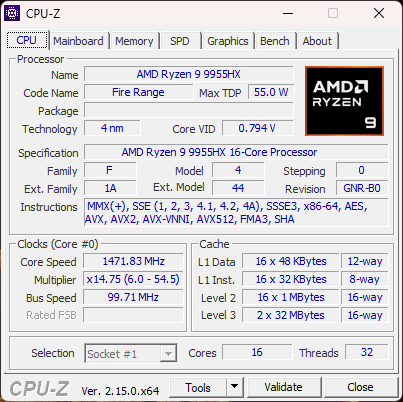
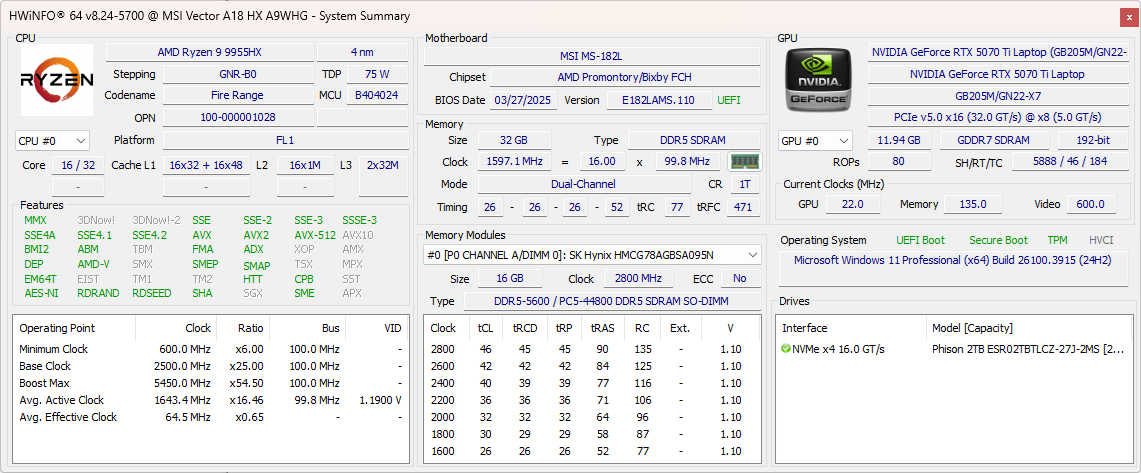
在多线程负载方面,Ryzen 9 9955HX 与酷睿 Ultra 9 275HX 不相上下,而在单线程应用方面,Ryzen 9 9955HX 的速度最多只能降低 20%。最值得注意的是,它的性能比上一代酷睿 i9-14900HX 高出 30%,而且在这一过程中无需过度耗电。
需要注意的是,这款 AMD 处理器没有 NPU,但主流游戏玩家的目标受众可能不会介意。
Cinebench R15 Multi Loop
Cinebench R23: Multi Core | Single Core
Cinebench R20: CPU (Multi Core) | CPU (Single Core)
Cinebench R15: CPU Multi 64Bit | CPU Single 64Bit
Blender: v2.79 BMW27 CPU
7-Zip 18.03: 7z b 4 | 7z b 4 -mmt1
Geekbench 6.7: Multi-Core | Single-Core
Geekbench 5.5: Multi-Core | Single-Core
HWBOT x265 Benchmark v2.2: 4k Preset
LibreOffice : 20 Documents To PDF
R Benchmark 2.5: Overall mean
| CPU Performance rating | |
| Asus Strix Scar 18 G835LX | |
| Average AMD Ryzen 9 9955HX | |
| MSI Vector A18 HX A9W | |
| Alienware m18 R1 AMD | |
| MSI Raider 18 HX A14V | |
| Alienware m18 R1 -2! | |
| Acer Predator Helios 18 N23Q2 | |
| Asus ROG Strix G18 G814JI -2! | |
| Cinebench R23 / Multi Core | |
| MSI Vector A18 HX A9W | |
| Asus Strix Scar 18 G835LX | |
| Average AMD Ryzen 9 9955HX (35960 - 39690, n=9) | |
| Alienware m18 R1 AMD | |
| Alienware m18 R1 | |
| Acer Predator Helios 18 N23Q2 | |
| MSI Raider 18 HX A14V | |
| Asus ROG Strix G18 G814JI | |
| Cinebench R23 / Single Core | |
| Asus Strix Scar 18 G835LX | |
| MSI Raider 18 HX A14V | |
| Average AMD Ryzen 9 9955HX (1828 - 2183, n=9) | |
| Alienware m18 R1 | |
| Acer Predator Helios 18 N23Q2 | |
| Alienware m18 R1 AMD | |
| Asus ROG Strix G18 G814JI | |
| MSI Vector A18 HX A9W | |
| Cinebench R20 / CPU (Multi Core) | |
| MSI Vector A18 HX A9W | |
| Asus Strix Scar 18 G835LX | |
| Average AMD Ryzen 9 9955HX (13963 - 15524, n=9) | |
| Alienware m18 R1 AMD | |
| Alienware m18 R1 | |
| Acer Predator Helios 18 N23Q2 | |
| MSI Raider 18 HX A14V | |
| Asus ROG Strix G18 G814JI | |
| Cinebench R20 / CPU (Single Core) | |
| Asus Strix Scar 18 G835LX | |
| MSI Raider 18 HX A14V | |
| Average AMD Ryzen 9 9955HX (819 - 856, n=9) | |
| MSI Vector A18 HX A9W | |
| Alienware m18 R1 | |
| Acer Predator Helios 18 N23Q2 | |
| Alienware m18 R1 AMD | |
| Asus ROG Strix G18 G814JI | |
| Cinebench R15 / CPU Multi 64Bit | |
| MSI Vector A18 HX A9W | |
| Asus Strix Scar 18 G835LX | |
| Average AMD Ryzen 9 9955HX (5624 - 6103, n=9) | |
| Alienware m18 R1 AMD | |
| Alienware m18 R1 | |
| MSI Raider 18 HX A14V | |
| Acer Predator Helios 18 N23Q2 | |
| Asus ROG Strix G18 G814JI | |
| Cinebench R15 / CPU Single 64Bit | |
| Asus Strix Scar 18 G835LX | |
| Average AMD Ryzen 9 9955HX (320 - 338, n=9) | |
| MSI Vector A18 HX A9W | |
| MSI Raider 18 HX A14V | |
| Alienware m18 R1 AMD | |
| Alienware m18 R1 | |
| Acer Predator Helios 18 N23Q2 | |
| Asus ROG Strix G18 G814JI | |
| Blender / v2.79 BMW27 CPU | |
| Asus ROG Strix G18 G814JI | |
| Acer Predator Helios 18 N23Q2 | |
| MSI Raider 18 HX A14V | |
| Alienware m18 R1 | |
| Alienware m18 R1 AMD | |
| Asus Strix Scar 18 G835LX | |
| Average AMD Ryzen 9 9955HX (80 - 91, n=9) | |
| MSI Vector A18 HX A9W | |
| 7-Zip 18.03 / 7z b 4 | |
| MSI Vector A18 HX A9W | |
| Alienware m18 R1 AMD | |
| Average AMD Ryzen 9 9955HX (132435 - 144064, n=9) | |
| Alienware m18 R1 | |
| Asus Strix Scar 18 G835LX | |
| MSI Raider 18 HX A14V | |
| Acer Predator Helios 18 N23Q2 | |
| Asus ROG Strix G18 G814JI | |
| 7-Zip 18.03 / 7z b 4 -mmt1 | |
| Alienware m18 R1 AMD | |
| Average AMD Ryzen 9 9955HX (7061 - 7462, n=9) | |
| MSI Vector A18 HX A9W | |
| Asus Strix Scar 18 G835LX | |
| Acer Predator Helios 18 N23Q2 | |
| Alienware m18 R1 | |
| MSI Raider 18 HX A14V | |
| Asus ROG Strix G18 G814JI | |
| Geekbench 6.7 / Multi-Core | |
| Asus Strix Scar 18 G835LX | |
| Average AMD Ryzen 9 9955HX (16313 - 19725, n=9) | |
| Acer Predator Helios 18 N23Q2 | |
| MSI Raider 18 HX A14V | |
| Alienware m18 R1 AMD | |
| MSI Vector A18 HX A9W | |
| Geekbench 6.7 / Single-Core | |
| Average AMD Ryzen 9 9955HX (3156 - 3259, n=9) | |
| MSI Vector A18 HX A9W | |
| Asus Strix Scar 18 G835LX | |
| MSI Raider 18 HX A14V | |
| Acer Predator Helios 18 N23Q2 | |
| Alienware m18 R1 AMD | |
| Geekbench 5.5 / Multi-Core | |
| Asus Strix Scar 18 G835LX | |
| MSI Vector A18 HX A9W | |
| Alienware m18 R1 | |
| Average AMD Ryzen 9 9955HX (20576 - 22716, n=9) | |
| Acer Predator Helios 18 N23Q2 | |
| MSI Raider 18 HX A14V | |
| Alienware m18 R1 AMD | |
| Asus ROG Strix G18 G814JI | |
| Geekbench 5.5 / Single-Core | |
| Average AMD Ryzen 9 9955HX (2307 - 2474, n=9) | |
| MSI Vector A18 HX A9W | |
| Asus Strix Scar 18 G835LX | |
| MSI Raider 18 HX A14V | |
| Alienware m18 R1 AMD | |
| Alienware m18 R1 | |
| Acer Predator Helios 18 N23Q2 | |
| Asus ROG Strix G18 G814JI | |
| HWBOT x265 Benchmark v2.2 / 4k Preset | |
| MSI Vector A18 HX A9W | |
| Asus Strix Scar 18 G835LX | |
| Average AMD Ryzen 9 9955HX (38.9 - 43, n=9) | |
| Alienware m18 R1 AMD | |
| Alienware m18 R1 | |
| MSI Raider 18 HX A14V | |
| Acer Predator Helios 18 N23Q2 | |
| Asus ROG Strix G18 G814JI | |
| LibreOffice / 20 Documents To PDF | |
| Asus ROG Strix G18 G814JI | |
| Acer Predator Helios 18 N23Q2 | |
| Alienware m18 R1 | |
| Average AMD Ryzen 9 9955HX (42.2 - 52.4, n=9) | |
| MSI Vector A18 HX A9W | |
| Alienware m18 R1 AMD | |
| Asus Strix Scar 18 G835LX | |
| MSI Raider 18 HX A14V | |
| R Benchmark 2.5 / Overall mean | |
| Asus ROG Strix G18 G814JI | |
| Alienware m18 R1 AMD | |
| Acer Predator Helios 18 N23Q2 | |
| Asus Strix Scar 18 G835LX | |
| Alienware m18 R1 | |
| MSI Raider 18 HX A14V | |
| Average AMD Ryzen 9 9955HX (0.3439 - 0.3737, n=9) | |
| MSI Vector A18 HX A9W | |
* ... smaller is better
AIDA64: FP32 Ray-Trace | FPU Julia | CPU SHA3 | CPU Queen | FPU SinJulia | FPU Mandel | CPU AES | CPU ZLib | FP64 Ray-Trace | CPU PhotoWorxx
| Performance rating | |
| MSI Vector A18 HX A9W | |
| Average AMD Ryzen 9 9955HX | |
| Asus Strix Scar 18 G835LX | |
| Alienware m18 R2 | |
| MSI Raider 18 HX A14V | |
| Razer Blade 18 2024 RZ09-0509 | |
| Acer Predator Helios 18 PH18-72-98MW | |
| AIDA64 / FP32 Ray-Trace | |
| MSI Vector A18 HX A9W | |
| Average AMD Ryzen 9 9955HX (66596 - 85542, n=9) | |
| Asus Strix Scar 18 G835LX | |
| Alienware m18 R2 | |
| MSI Raider 18 HX A14V | |
| Razer Blade 18 2024 RZ09-0509 | |
| Acer Predator Helios 18 PH18-72-98MW | |
| AIDA64 / FPU Julia | |
| MSI Vector A18 HX A9W | |
| Average AMD Ryzen 9 9955HX (191535 - 232031, n=9) | |
| Asus Strix Scar 18 G835LX | |
| Alienware m18 R2 | |
| MSI Raider 18 HX A14V | |
| Razer Blade 18 2024 RZ09-0509 | |
| Acer Predator Helios 18 PH18-72-98MW | |
| AIDA64 / CPU SHA3 | |
| MSI Vector A18 HX A9W | |
| Asus Strix Scar 18 G835LX | |
| Average AMD Ryzen 9 9955HX (8489 - 9780, n=9) | |
| Alienware m18 R2 | |
| MSI Raider 18 HX A14V | |
| Razer Blade 18 2024 RZ09-0509 | |
| Acer Predator Helios 18 PH18-72-98MW | |
| AIDA64 / CPU Queen | |
| MSI Vector A18 HX A9W | |
| Average AMD Ryzen 9 9955HX (153027 - 164154, n=9) | |
| MSI Raider 18 HX A14V | |
| Asus Strix Scar 18 G835LX | |
| Alienware m18 R2 | |
| Acer Predator Helios 18 PH18-72-98MW | |
| Razer Blade 18 2024 RZ09-0509 | |
| AIDA64 / FPU SinJulia | |
| MSI Vector A18 HX A9W | |
| Average AMD Ryzen 9 9955HX (29876 - 32647, n=9) | |
| MSI Raider 18 HX A14V | |
| Alienware m18 R2 | |
| Razer Blade 18 2024 RZ09-0509 | |
| Acer Predator Helios 18 PH18-72-98MW | |
| Asus Strix Scar 18 G835LX | |
| AIDA64 / FPU Mandel | |
| MSI Vector A18 HX A9W | |
| Average AMD Ryzen 9 9955HX (101131 - 128721, n=9) | |
| Asus Strix Scar 18 G835LX | |
| Alienware m18 R2 | |
| MSI Raider 18 HX A14V | |
| Razer Blade 18 2024 RZ09-0509 | |
| Acer Predator Helios 18 PH18-72-98MW | |
| AIDA64 / CPU AES | |
| Average AMD Ryzen 9 9955HX (146979 - 218385, n=9) | |
| MSI Vector A18 HX A9W | |
| Asus Strix Scar 18 G835LX | |
| Alienware m18 R2 | |
| MSI Raider 18 HX A14V | |
| Razer Blade 18 2024 RZ09-0509 | |
| Acer Predator Helios 18 PH18-72-98MW | |
| AIDA64 / CPU ZLib | |
| MSI Vector A18 HX A9W | |
| Average AMD Ryzen 9 9955HX (2186 - 2531, n=9) | |
| Asus Strix Scar 18 G835LX | |
| Alienware m18 R2 | |
| MSI Raider 18 HX A14V | |
| Razer Blade 18 2024 RZ09-0509 | |
| Acer Predator Helios 18 PH18-72-98MW | |
| AIDA64 / FP64 Ray-Trace | |
| MSI Vector A18 HX A9W | |
| Average AMD Ryzen 9 9955HX (35252 - 45446, n=9) | |
| Asus Strix Scar 18 G835LX | |
| Alienware m18 R2 | |
| MSI Raider 18 HX A14V | |
| Razer Blade 18 2024 RZ09-0509 | |
| Acer Predator Helios 18 PH18-72-98MW | |
| AIDA64 / CPU PhotoWorxx | |
| Asus Strix Scar 18 G835LX | |
| Alienware m18 R2 | |
| Razer Blade 18 2024 RZ09-0509 | |
| Acer Predator Helios 18 PH18-72-98MW | |
| MSI Vector A18 HX A9W | |
| Average AMD Ryzen 9 9955HX (35974 - 42495, n=9) | |
| MSI Raider 18 HX A14V | |
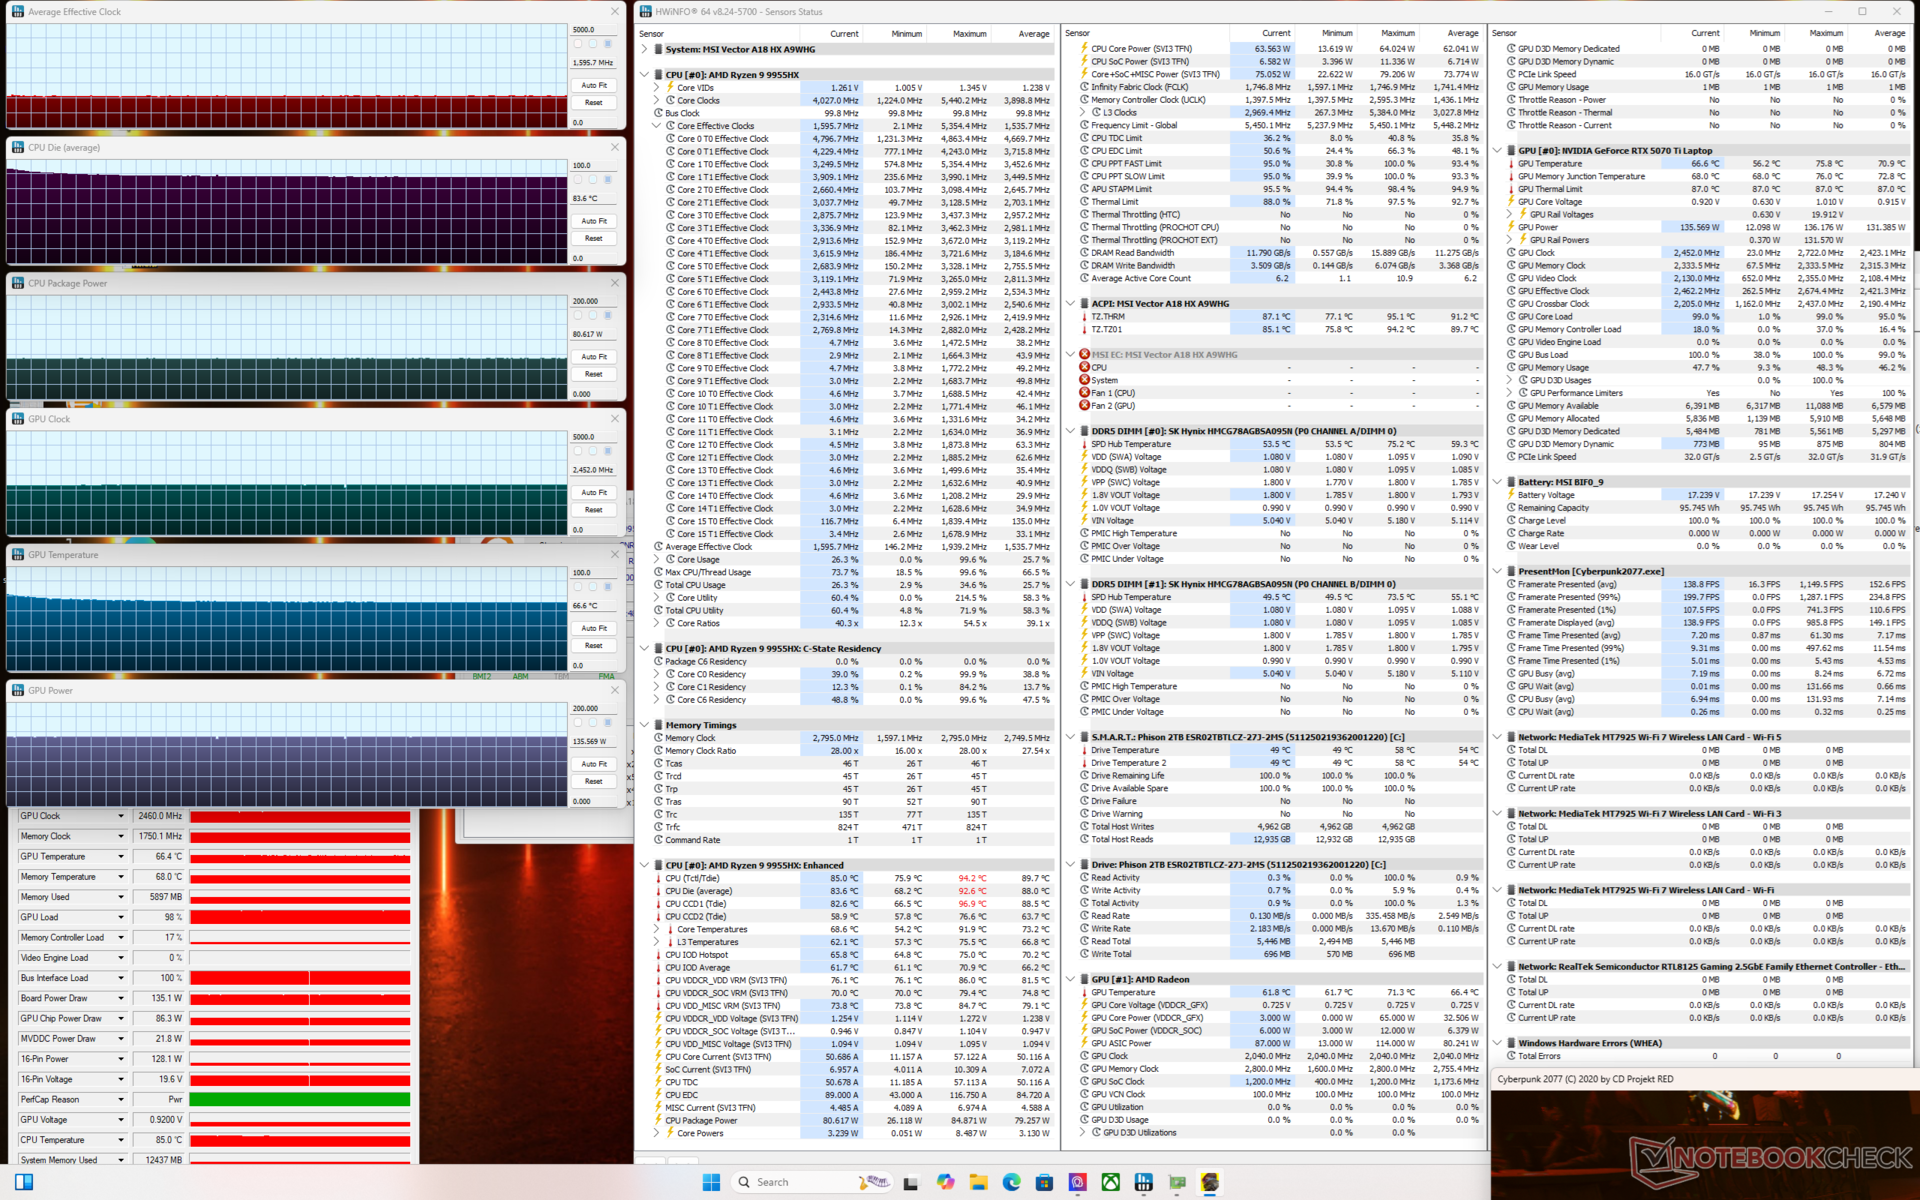
压力测试
运行 Prime95 时,CPU 稳定在 4.5 GHz、145 W 和 91 C。如果运行游戏模式,CPU 和 GPU 的温度将分别稳定在 86 C 和 75 C,如果运行 Cooler Boost(即最大风扇)模式,温度将分别稳定在 84 C 和 67 C。请注意,如果配置 175 W RTX 5080 而不是我们的 140 W RTX 5070 Ti,GPU 的运行温度预计会更高。即便如此,CPU 的运行温度还是超出了我们的预期,尤其是 Raider 18 HX 中的 Core i9-14900HX 在类似条件下的运行温度要低几摄氏度。
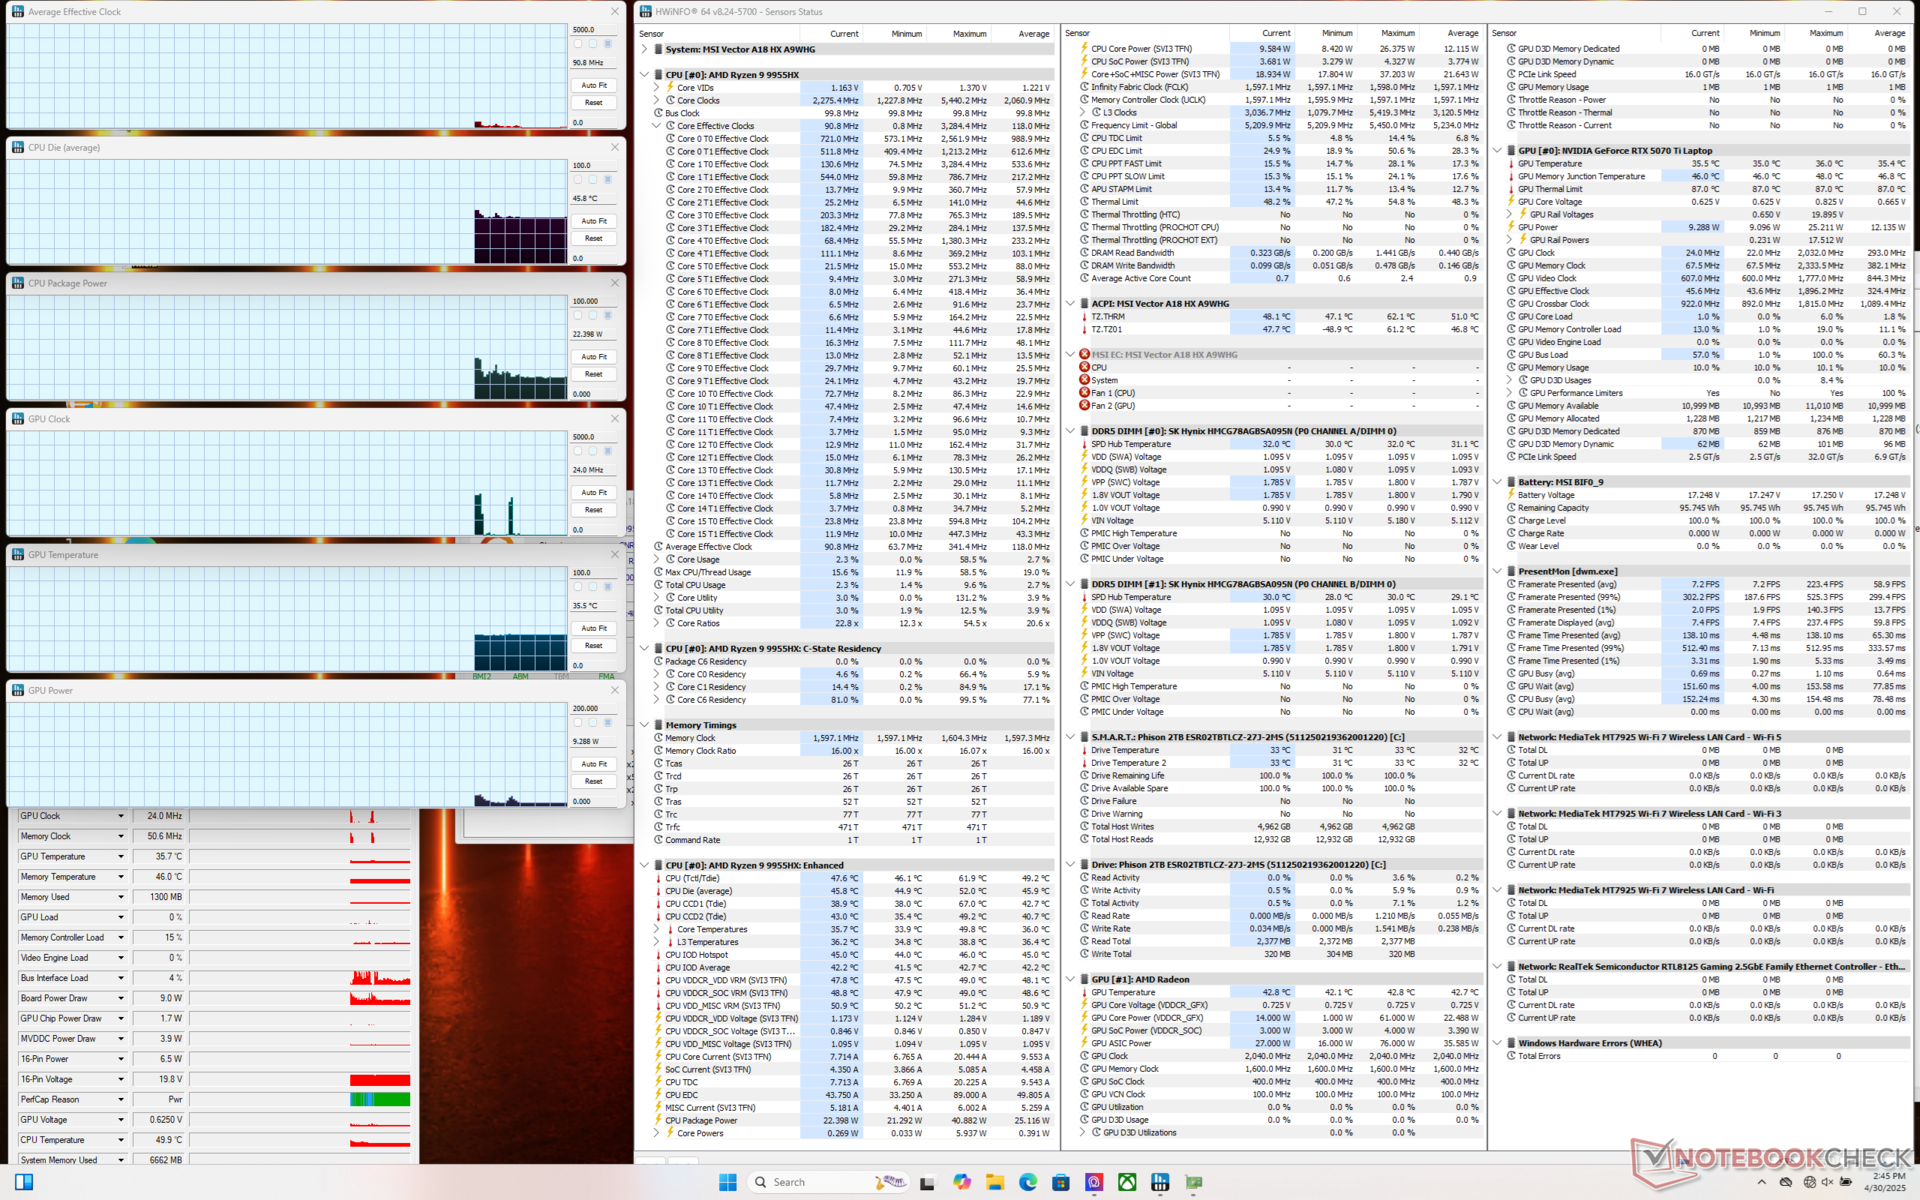
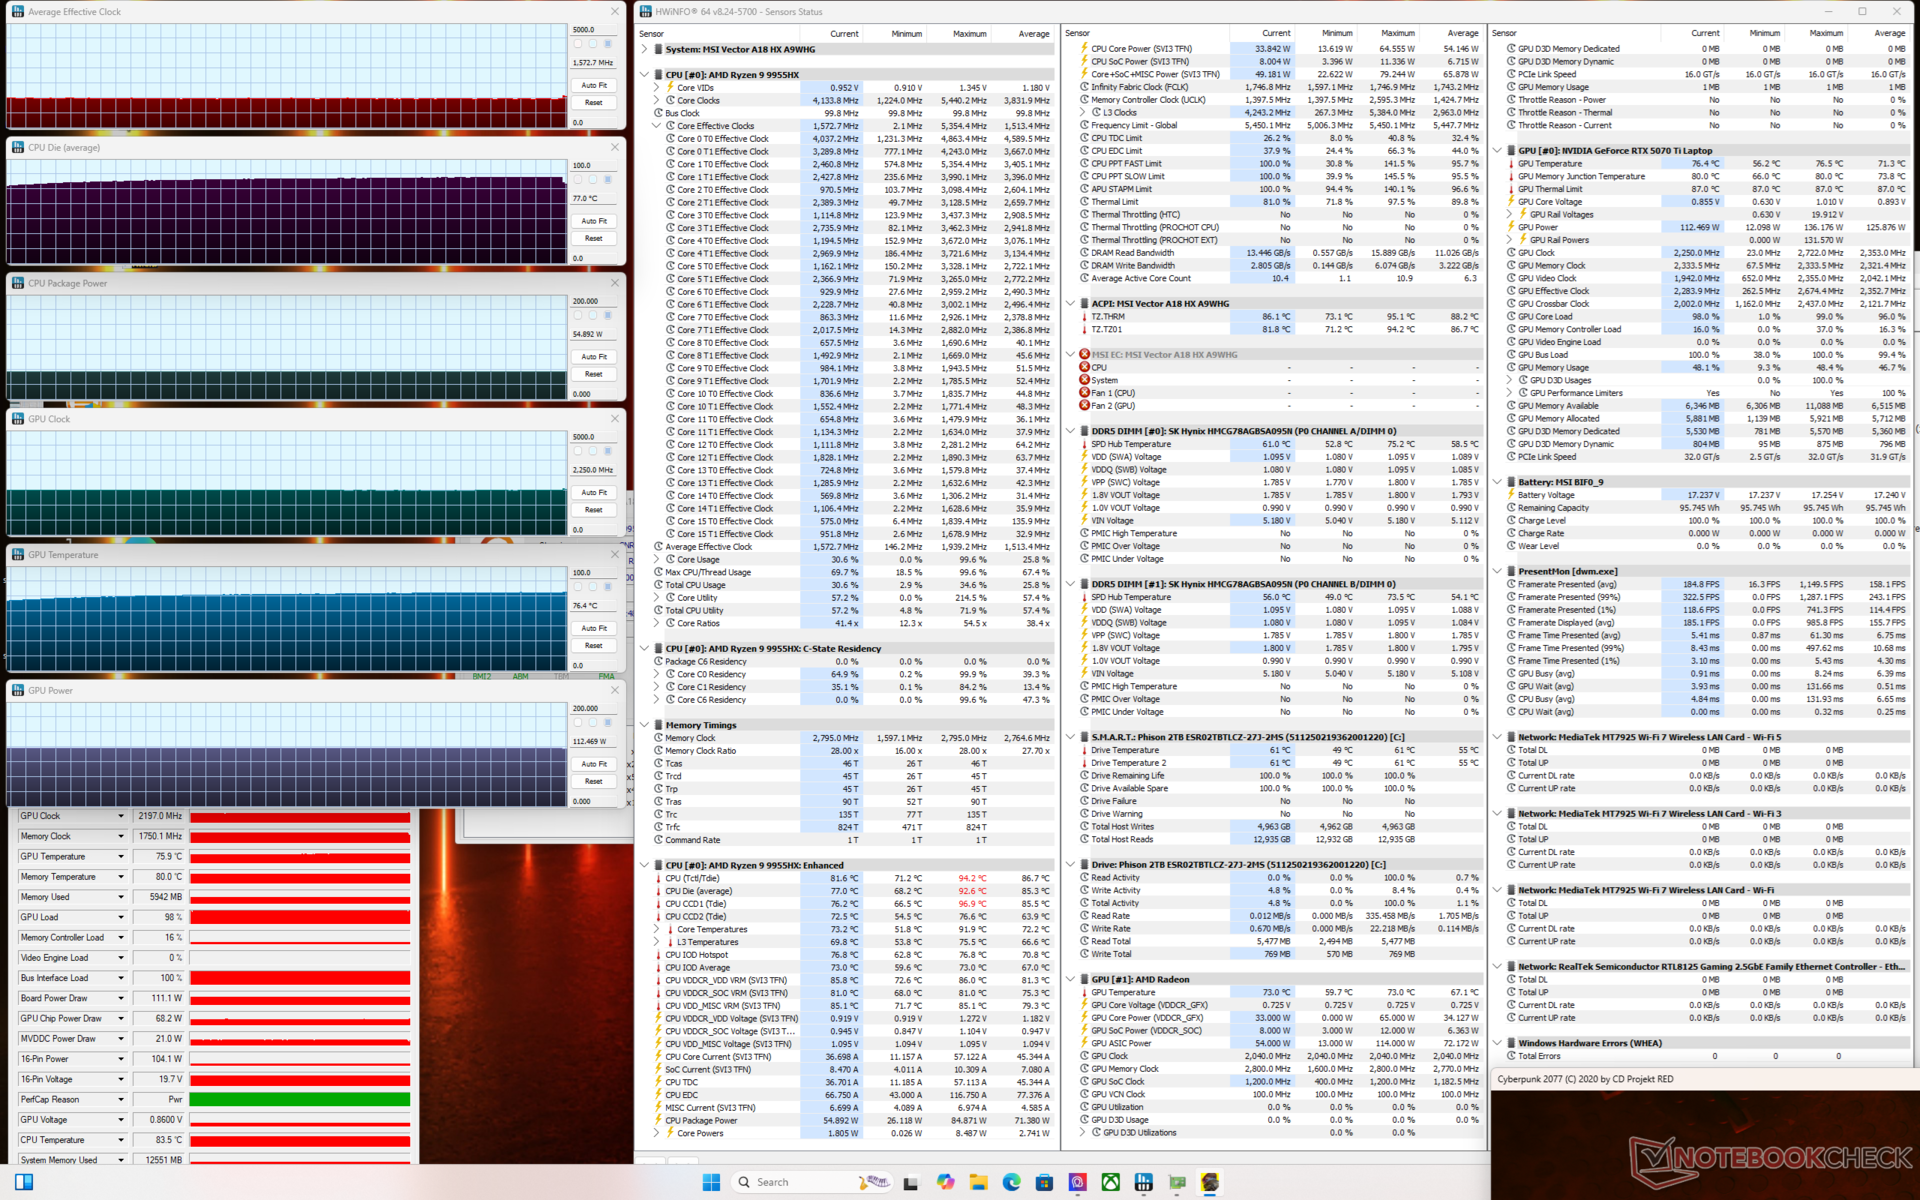
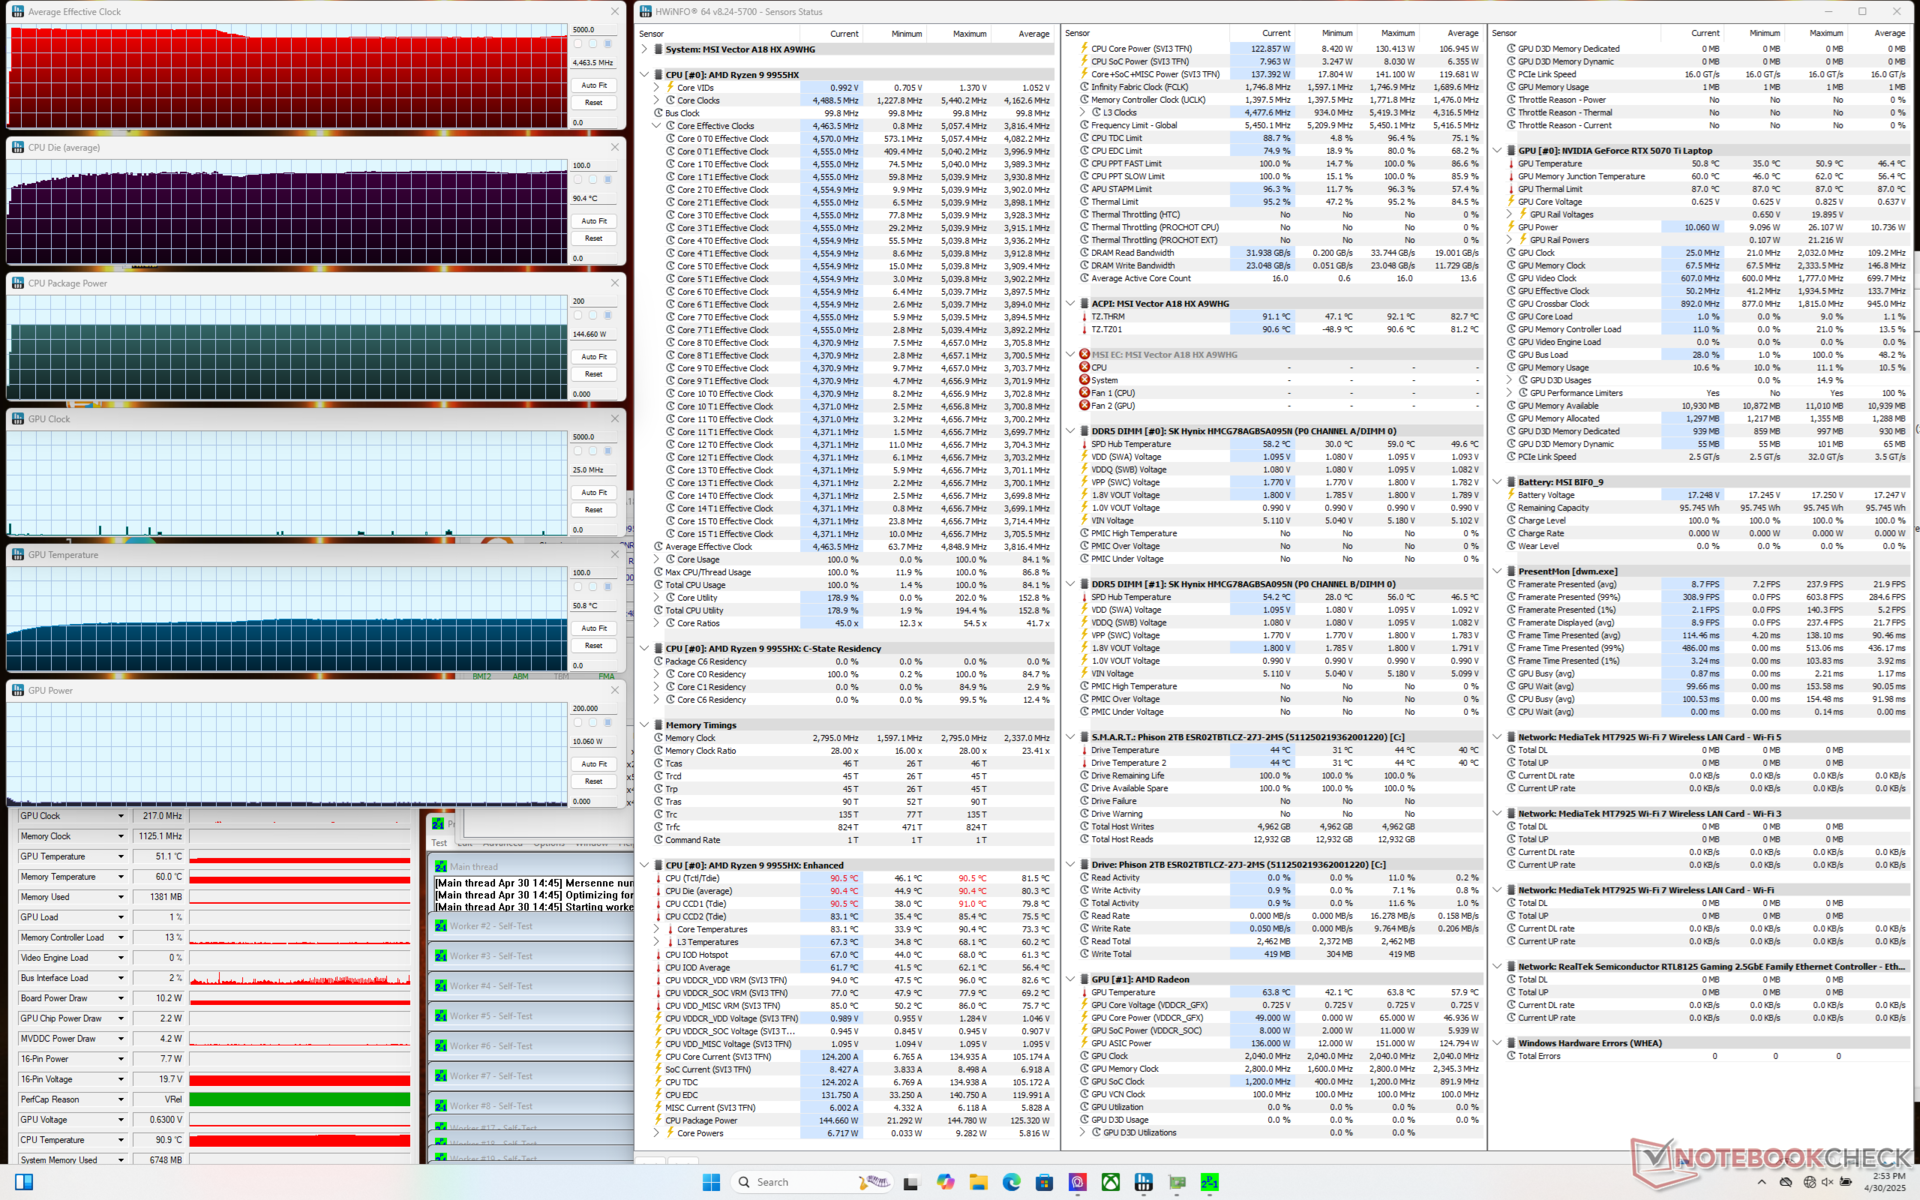
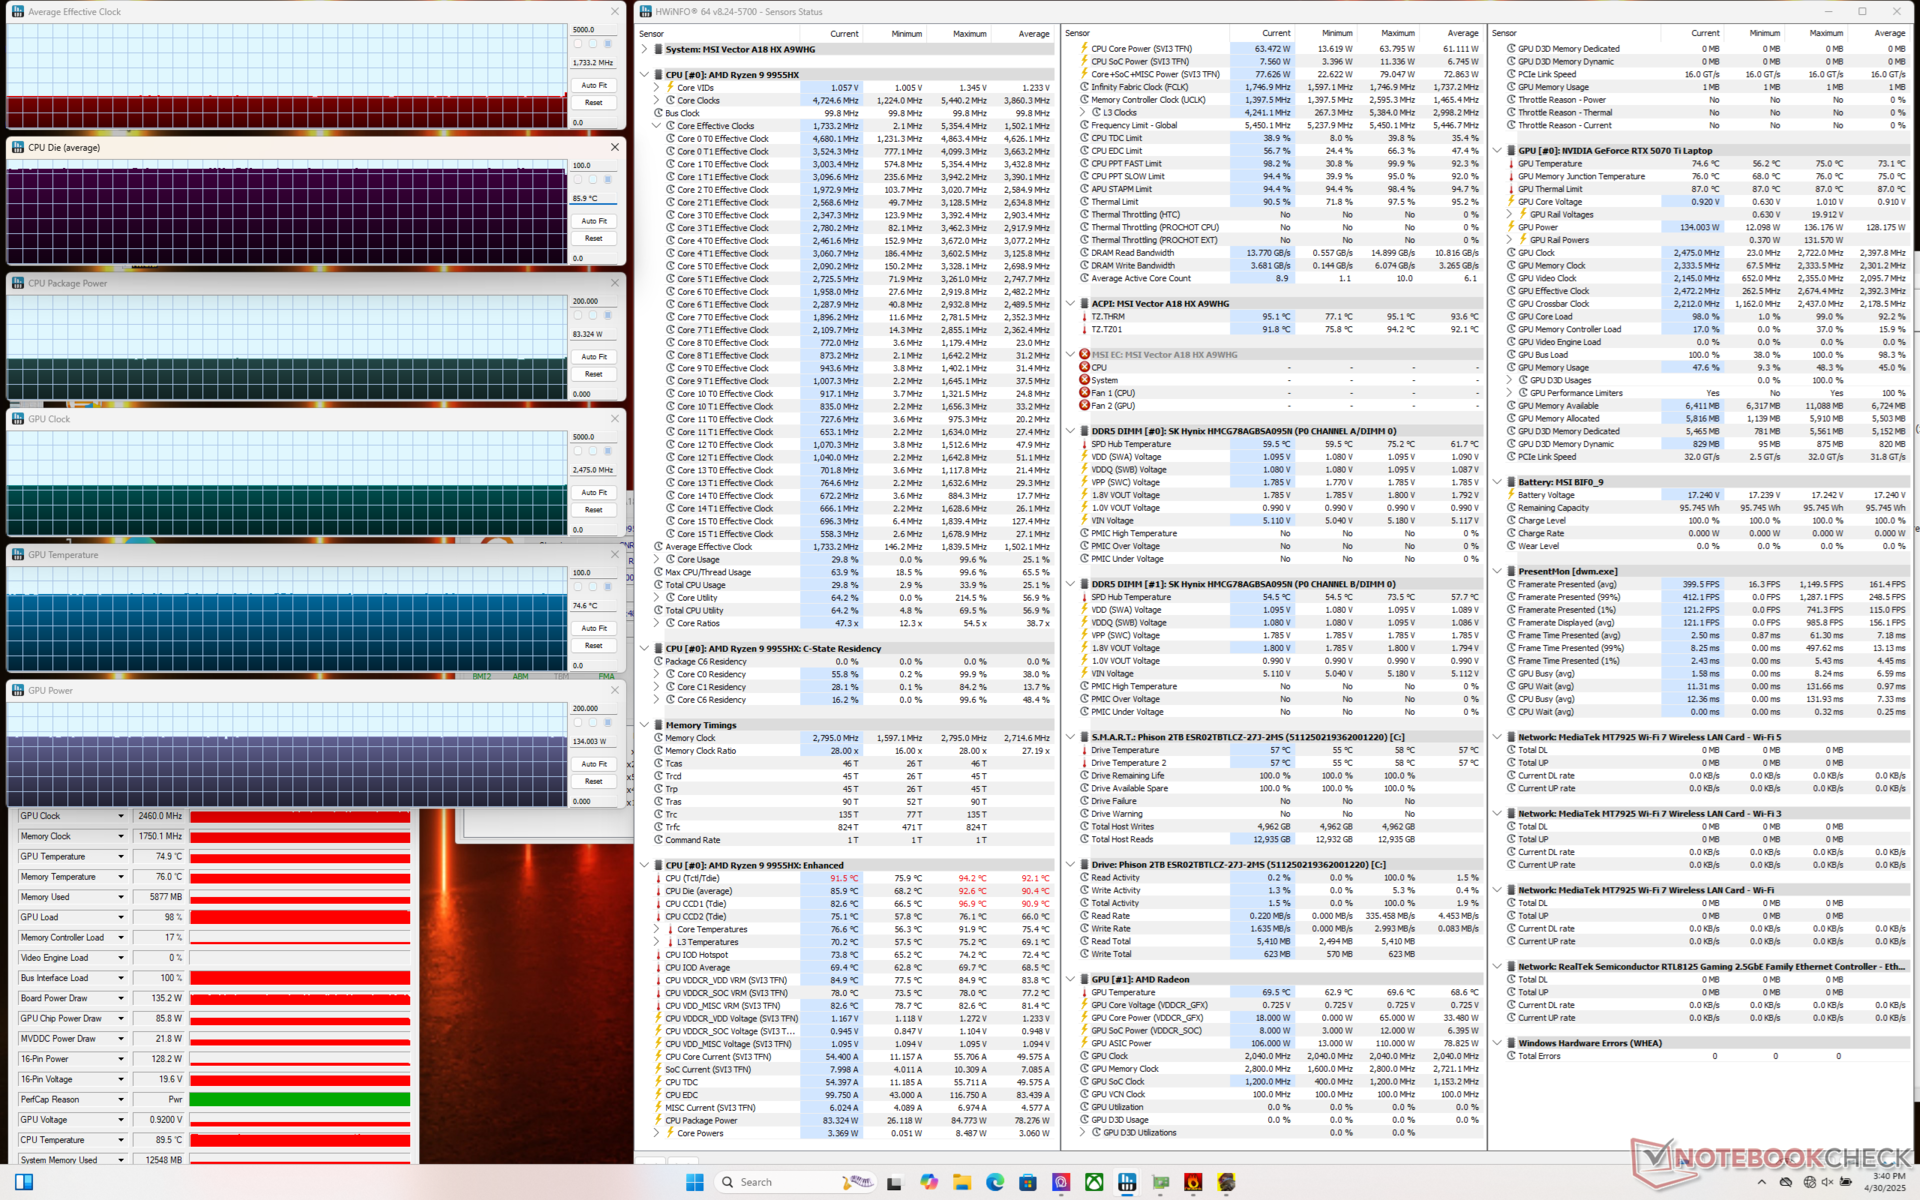
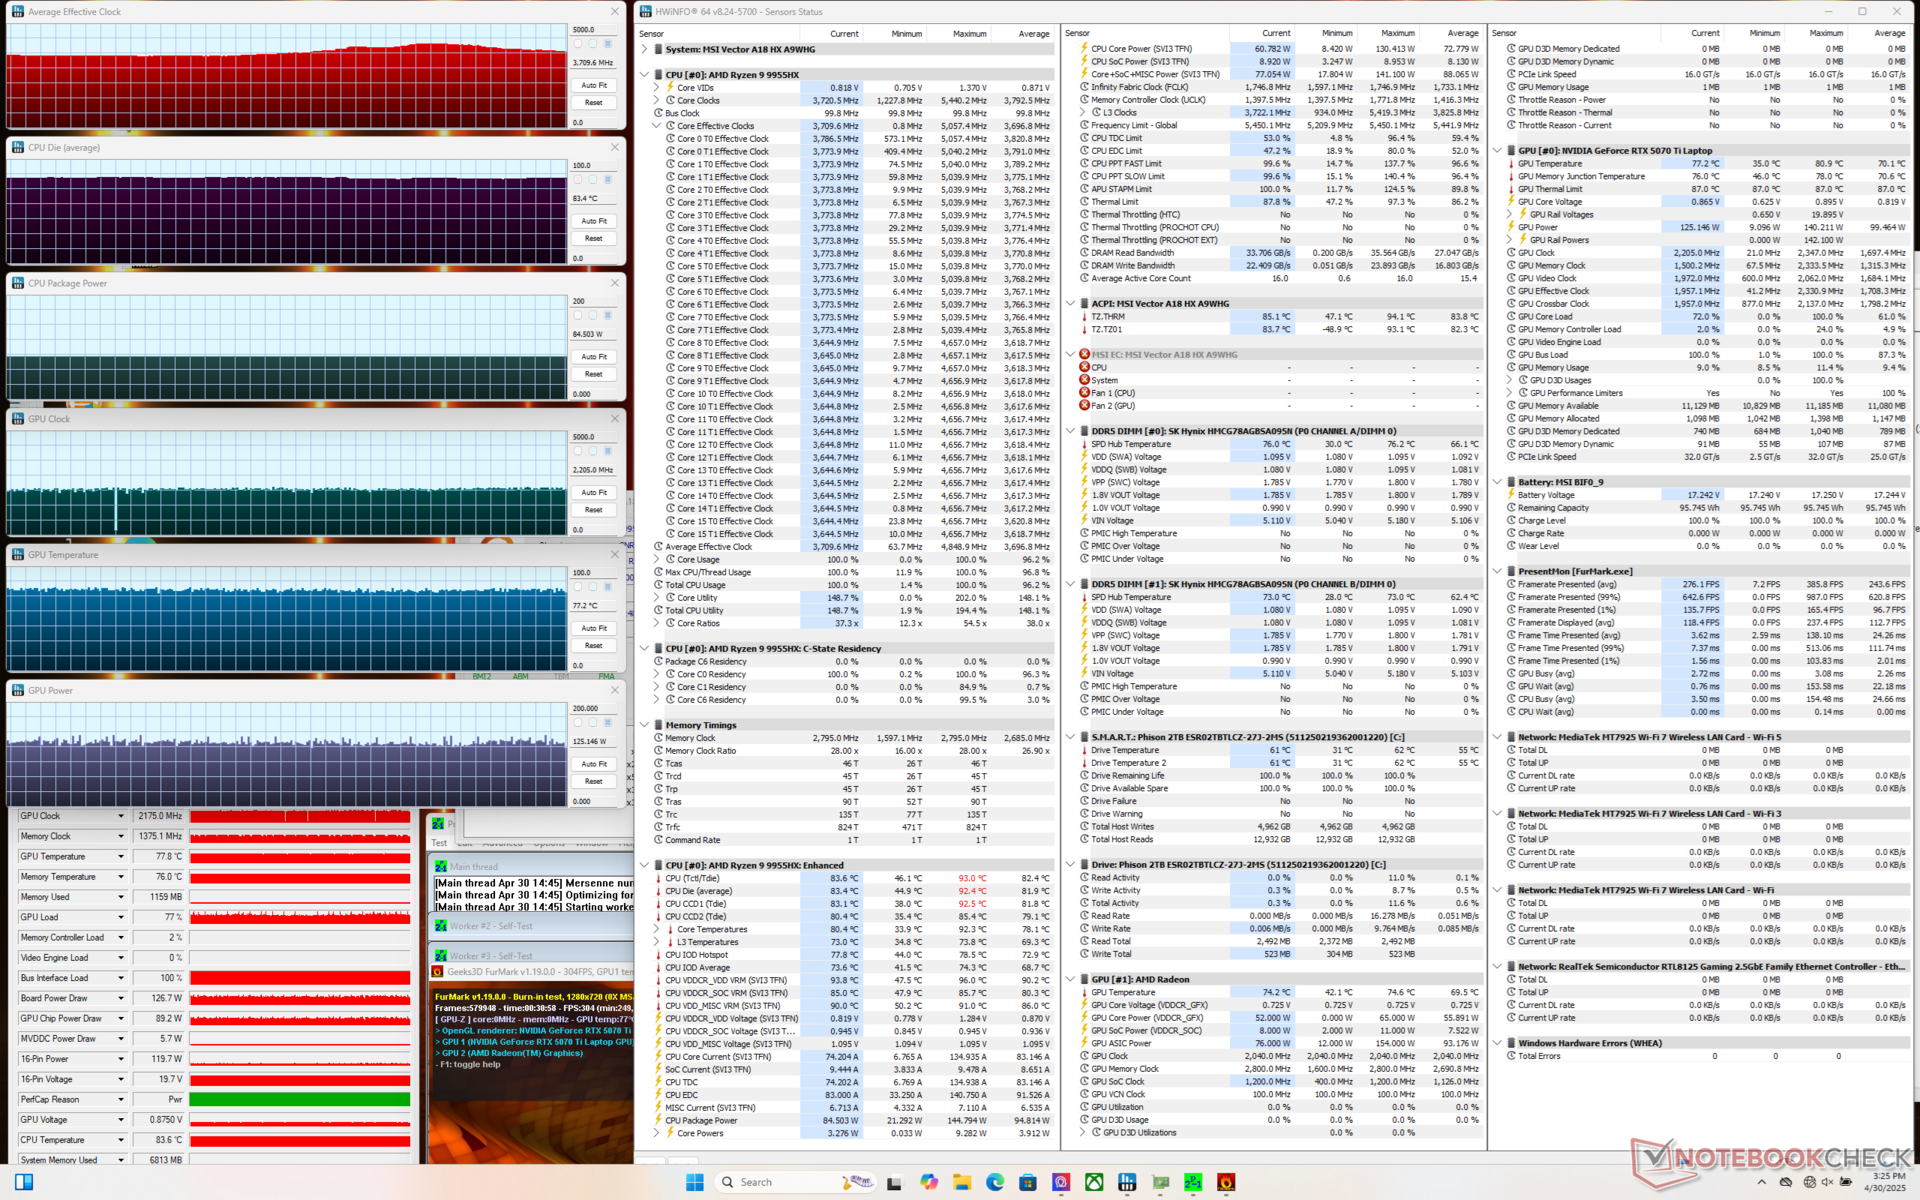
| 平均 CPU 时钟 (GHz) | GPU 时钟 (MHz) | 平均 CPU 温度 (°C) | 平均 GPU 温度 (°C) | |
| 系统闲置 | -- | -- | 46 | 36 |
| Prime95 压力 | 4.5 | -- | 91 | 51 |
| Prime95 + FurMark 压力 | 3.7 | 2175 | 83 | 77 |
| 赛博朋克 2077》压力(平衡模式) | 1.6 | 2250 | 84 | 77 |
| 赛博朋克 2077》压力(性能模式) | 1.7 | 2475 | 86 | 75 |
| 赛博朋克2077压力(性能模式,开启冷却器增强功能) | 1.6 | 2452 | 84 | 67 |
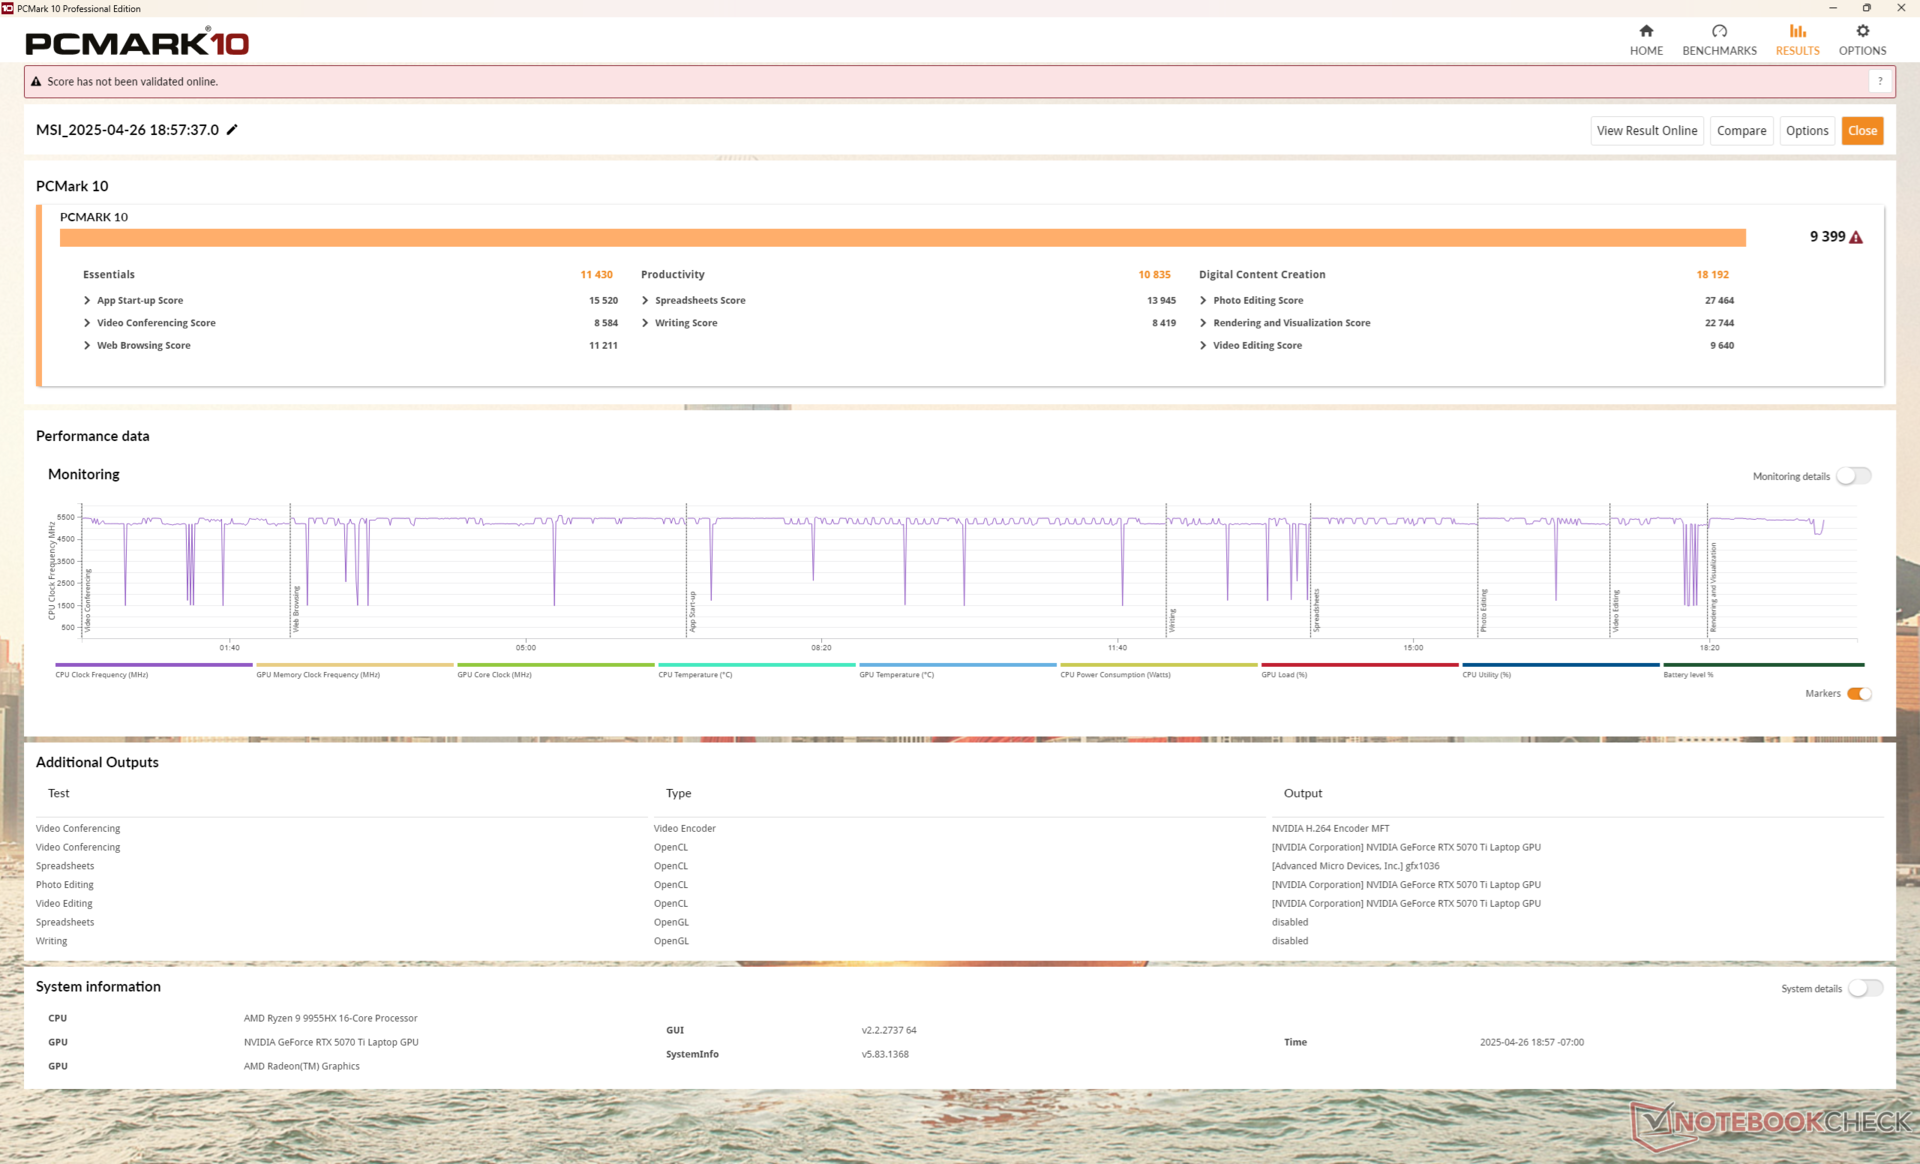
系统性能
CrossMark: Overall | Productivity | Creativity | Responsiveness
WebXPRT 3: Overall
WebXPRT 4: Overall
Mozilla Kraken 1.1: Total
| PCMark 10 / Score | |
| Average AMD Ryzen 9 9955HX, NVIDIA GeForce RTX 5070 Ti Laptop (9208 - 10060, n=3) | |
| MSI Vector A18 HX A9W | |
| Alienware m18 R2 | |
| MSI Raider 18 HX A14V | |
| Razer Blade 18 2024 RZ09-0509 | |
| Asus Strix Scar 18 G835LX | |
| Acer Predator Helios 18 PH18-72-98MW | |
| PCMark 10 / Essentials | |
| MSI Raider 18 HX A14V | |
| Average AMD Ryzen 9 9955HX, NVIDIA GeForce RTX 5070 Ti Laptop (11178 - 11719, n=3) | |
| MSI Vector A18 HX A9W | |
| Alienware m18 R2 | |
| Razer Blade 18 2024 RZ09-0509 | |
| Acer Predator Helios 18 PH18-72-98MW | |
| Asus Strix Scar 18 G835LX | |
| PCMark 10 / Productivity | |
| Average AMD Ryzen 9 9955HX, NVIDIA GeForce RTX 5070 Ti Laptop (10734 - 16314, n=3) | |
| Alienware m18 R2 | |
| MSI Raider 18 HX A14V | |
| MSI Vector A18 HX A9W | |
| Razer Blade 18 2024 RZ09-0509 | |
| Acer Predator Helios 18 PH18-72-98MW | |
| Asus Strix Scar 18 G835LX | |
| PCMark 10 / Digital Content Creation | |
| MSI Vector A18 HX A9W | |
| Asus Strix Scar 18 G835LX | |
| Average AMD Ryzen 9 9955HX, NVIDIA GeForce RTX 5070 Ti Laptop (14454 - 18192, n=3) | |
| Alienware m18 R2 | |
| MSI Raider 18 HX A14V | |
| Razer Blade 18 2024 RZ09-0509 | |
| Acer Predator Helios 18 PH18-72-98MW | |
| CrossMark / Overall | |
| Asus Strix Scar 18 G835LX | |
| MSI Vector A18 HX A9W | |
| Average AMD Ryzen 9 9955HX, NVIDIA GeForce RTX 5070 Ti Laptop (2111 - 2215, n=3) | |
| MSI Raider 18 HX A14V | |
| Alienware m18 R2 | |
| Razer Blade 18 2024 RZ09-0509 | |
| CrossMark / Productivity | |
| Asus Strix Scar 18 G835LX | |
| MSI Raider 18 HX A14V | |
| MSI Vector A18 HX A9W | |
| Average AMD Ryzen 9 9955HX, NVIDIA GeForce RTX 5070 Ti Laptop (1882 - 1999, n=3) | |
| Razer Blade 18 2024 RZ09-0509 | |
| Alienware m18 R2 | |
| CrossMark / Creativity | |
| MSI Vector A18 HX A9W | |
| Average AMD Ryzen 9 9955HX, NVIDIA GeForce RTX 5070 Ti Laptop (2592 - 2660, n=3) | |
| Asus Strix Scar 18 G835LX | |
| Alienware m18 R2 | |
| MSI Raider 18 HX A14V | |
| Razer Blade 18 2024 RZ09-0509 | |
| CrossMark / Responsiveness | |
| MSI Raider 18 HX A14V | |
| Asus Strix Scar 18 G835LX | |
| Alienware m18 R2 | |
| Razer Blade 18 2024 RZ09-0509 | |
| Average AMD Ryzen 9 9955HX, NVIDIA GeForce RTX 5070 Ti Laptop (1608 - 1854, n=3) | |
| MSI Vector A18 HX A9W | |
| WebXPRT 3 / Overall | |
| MSI Vector A18 HX A9W | |
| Asus Strix Scar 18 G835LX | |
| Average AMD Ryzen 9 9955HX, NVIDIA GeForce RTX 5070 Ti Laptop (328 - 361, n=3) | |
| Razer Blade 18 2024 RZ09-0509 | |
| MSI Raider 18 HX A14V | |
| Alienware m18 R2 | |
| WebXPRT 4 / Overall | |
| Asus Strix Scar 18 G835LX | |
| MSI Vector A18 HX A9W | |
| MSI Raider 18 HX A14V | |
| Alienware m18 R2 | |
| Average AMD Ryzen 9 9955HX, NVIDIA GeForce RTX 5070 Ti Laptop (282 - 322, n=3) | |
| Mozilla Kraken 1.1 / Total | |
| Razer Blade 18 2024 RZ09-0509 | |
| MSI Raider 18 HX A14V | |
| Acer Predator Helios 18 PH18-72-98MW | |
| Alienware m18 R2 | |
| Average AMD Ryzen 9 9955HX, NVIDIA GeForce RTX 5070 Ti Laptop (403 - 440, n=3) | |
| Asus Strix Scar 18 G835LX | |
| MSI Vector A18 HX A9W | |
* ... smaller is better
| PCMark 10 Score | 9399 points | |
Help | ||
| AIDA64 / Memory Copy | |
| Asus Strix Scar 18 G835LX | |
| Alienware m18 R2 | |
| Acer Predator Helios 18 PH18-72-98MW | |
| Razer Blade 18 2024 RZ09-0509 | |
| MSI Raider 18 HX A14V | |
| MSI Vector A18 HX A9W | |
| Average AMD Ryzen 9 9955HX (53598 - 62777, n=9) | |
| AIDA64 / Memory Read | |
| Asus Strix Scar 18 G835LX | |
| Alienware m18 R2 | |
| Acer Predator Helios 18 PH18-72-98MW | |
| Razer Blade 18 2024 RZ09-0509 | |
| Average AMD Ryzen 9 9955HX (63953 - 67256, n=9) | |
| MSI Vector A18 HX A9W | |
| MSI Raider 18 HX A14V | |
| AIDA64 / Memory Write | |
| Asus Strix Scar 18 G835LX | |
| Alienware m18 R2 | |
| Acer Predator Helios 18 PH18-72-98MW | |
| MSI Vector A18 HX A9W | |
| Average AMD Ryzen 9 9955HX (65421 - 72060, n=9) | |
| Razer Blade 18 2024 RZ09-0509 | |
| MSI Raider 18 HX A14V | |
| AIDA64 / Memory Latency | |
| Asus Strix Scar 18 G835LX | |
| MSI Vector A18 HX A9W | |
| Average AMD Ryzen 9 9955HX (92.1 - 103.5, n=9) | |
| MSI Raider 18 HX A14V | |
| Razer Blade 18 2024 RZ09-0509 | |
| Alienware m18 R2 | |
| Acer Predator Helios 18 PH18-72-98MW | |
* ... smaller is better
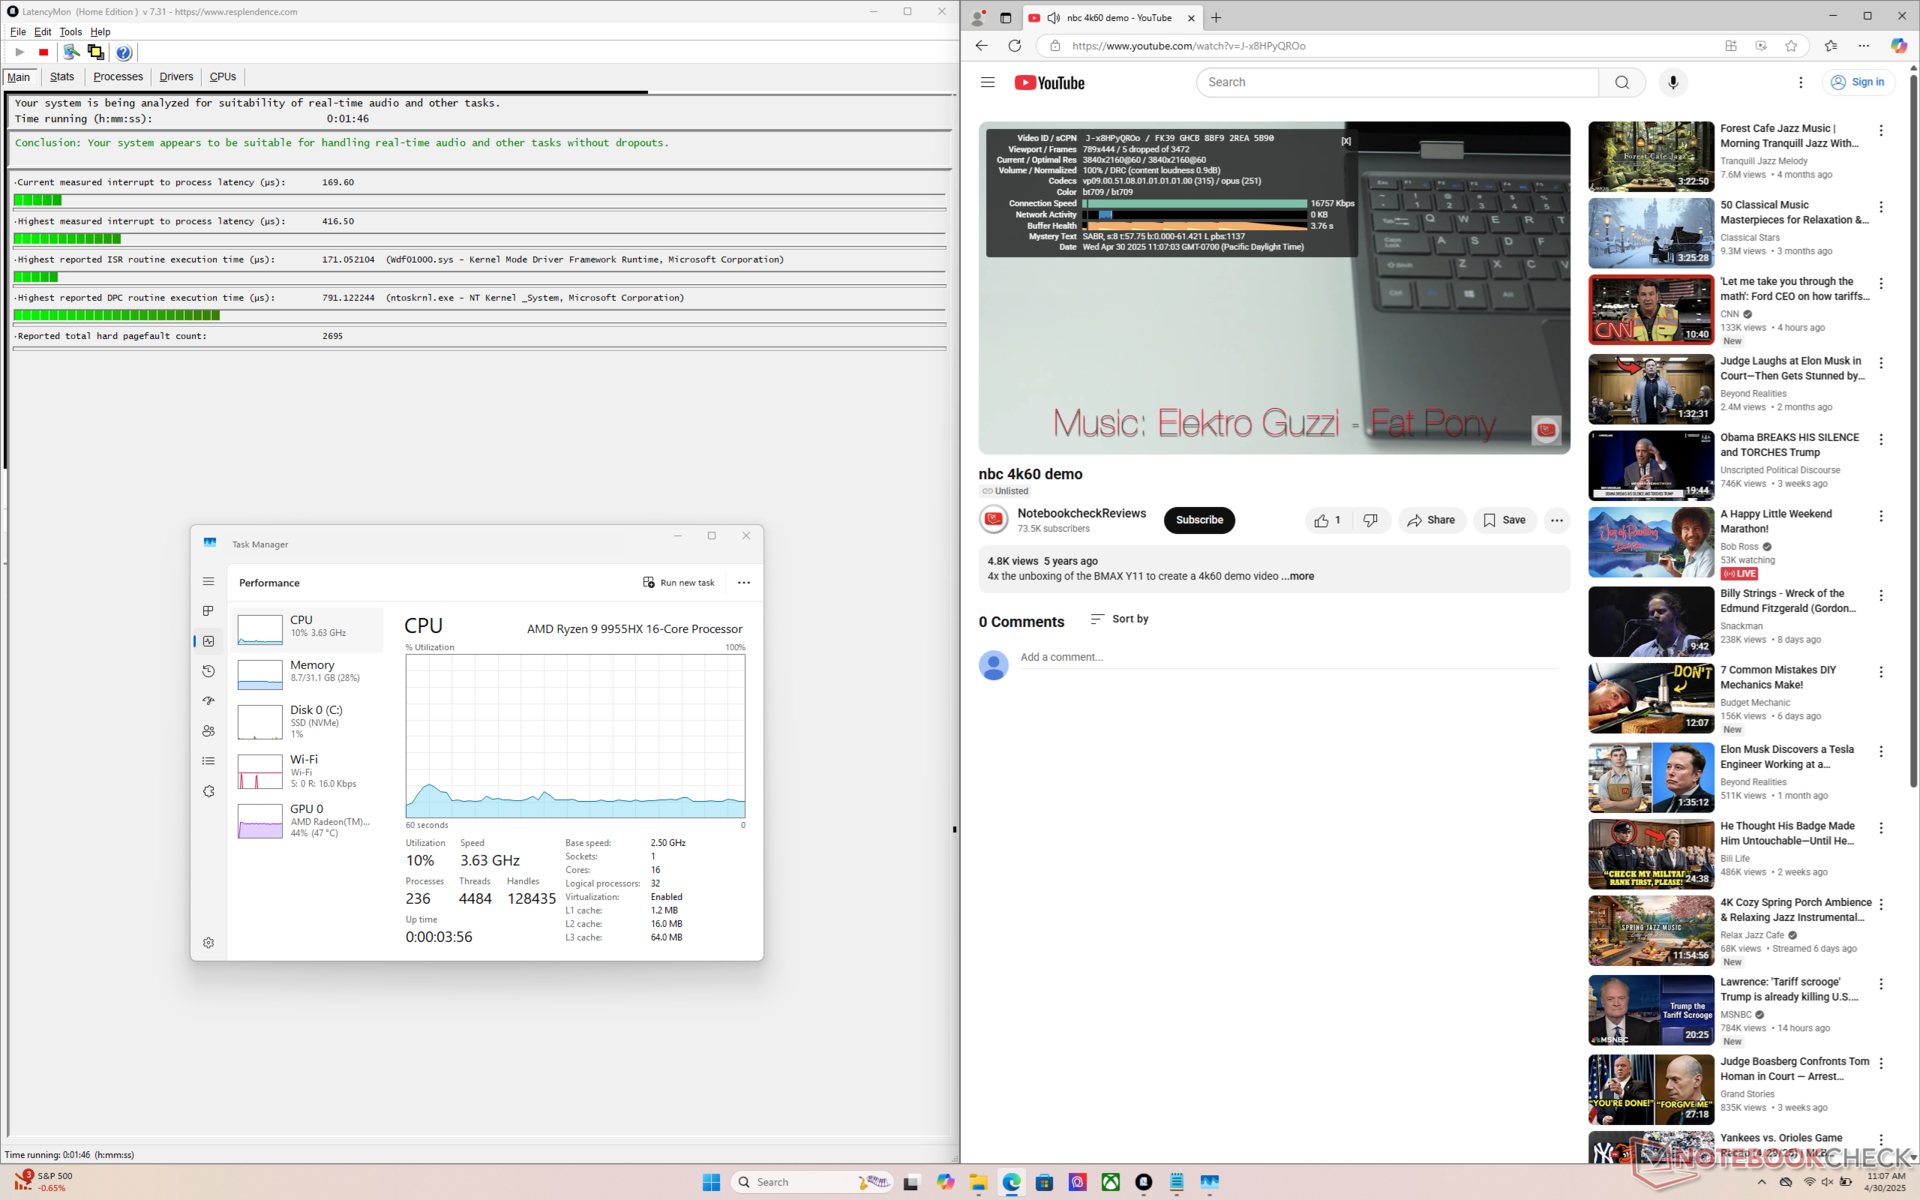
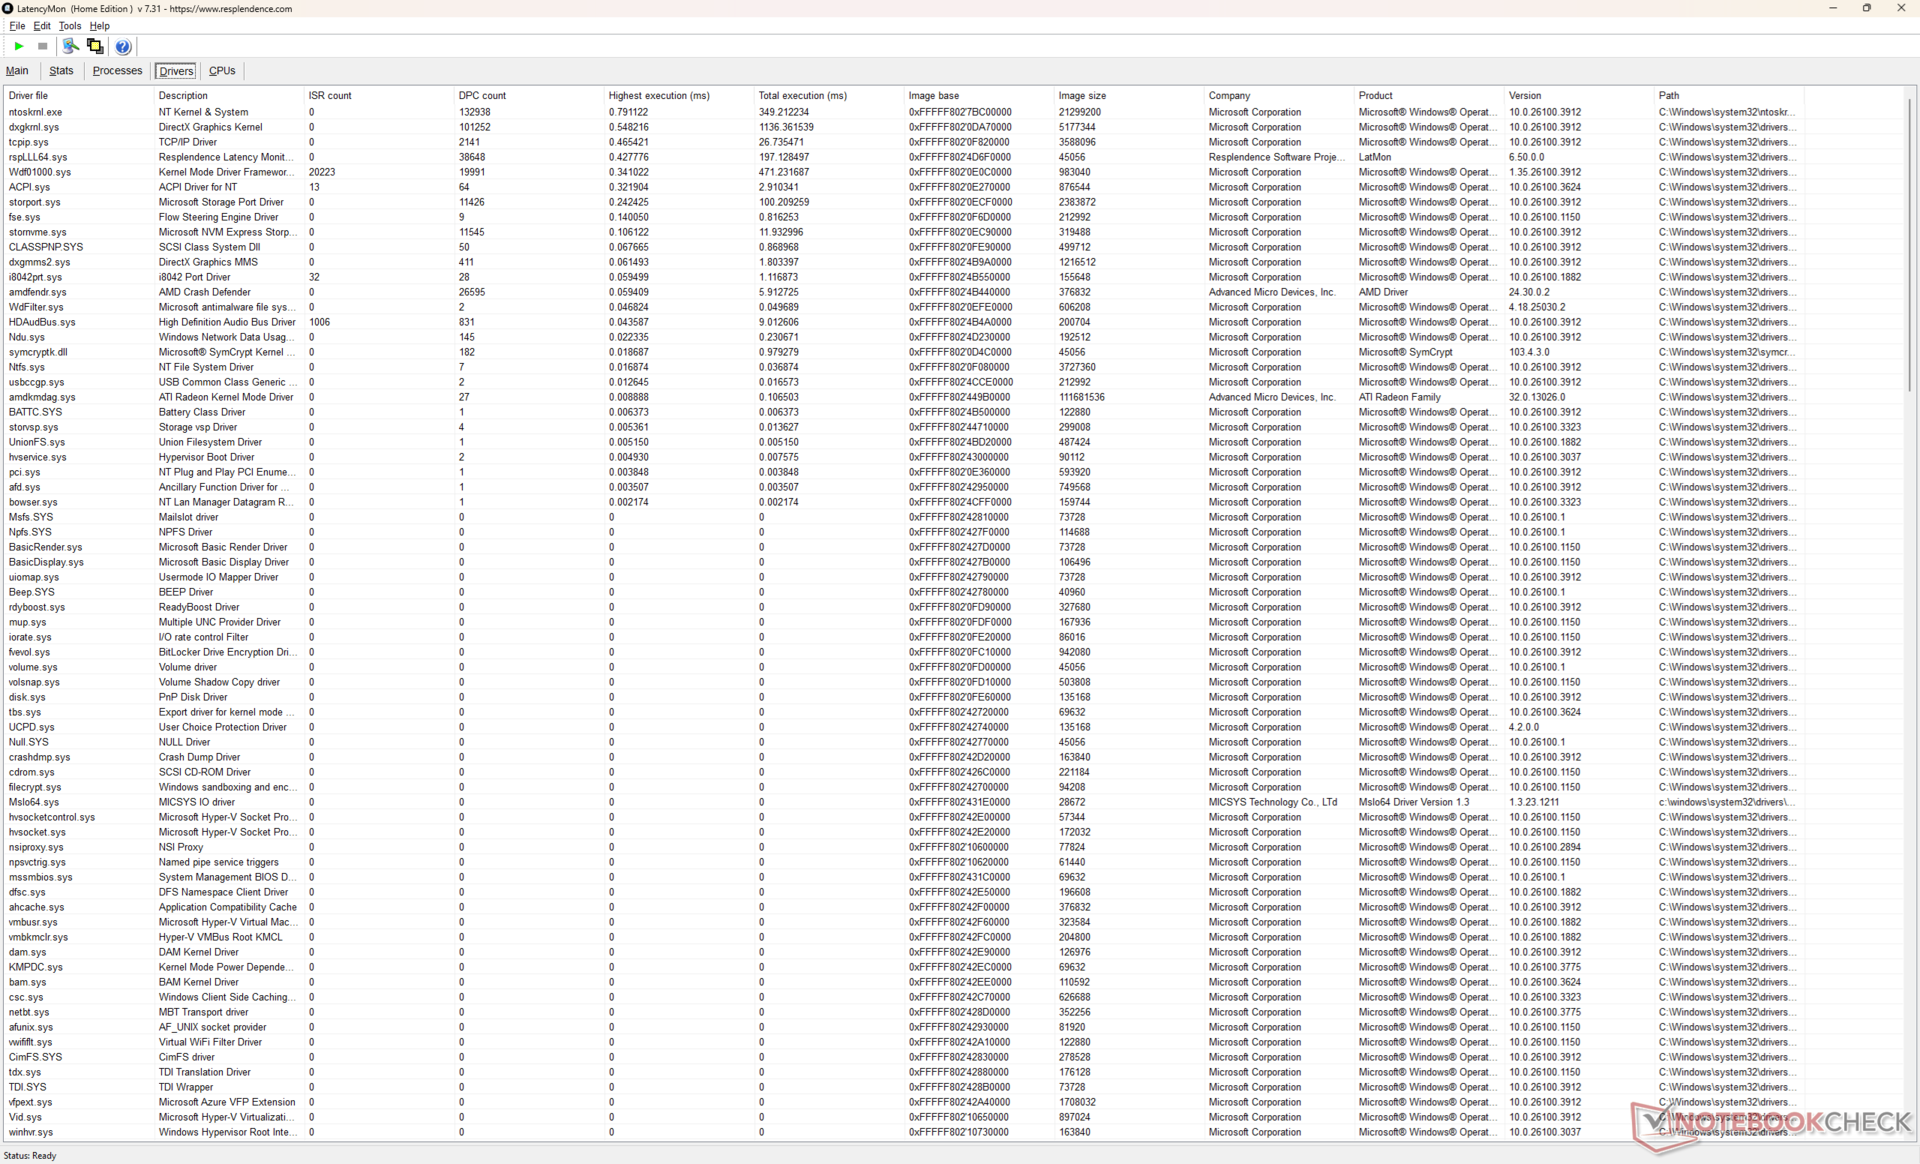
DPC 延迟
在打开主页的多个浏览器标签页时,LatencyMon 没有显示重大的 DPC 问题。不过,4K60 视频回放并不完美,在 60 秒的时间范围内记录了 5 次丢帧。
| DPC Latencies / LatencyMon - interrupt to process latency (max), Web, Youtube, Prime95 | |
| MSI Raider 18 HX A14V | |
| Acer Predator Helios 18 PH18-72-98MW | |
| Alienware m18 R2 | |
| Razer Blade 18 2024 RZ09-0509 | |
| Asus Strix Scar 18 G835LX | |
| MSI Vector A18 HX A9W | |
* ... smaller is better
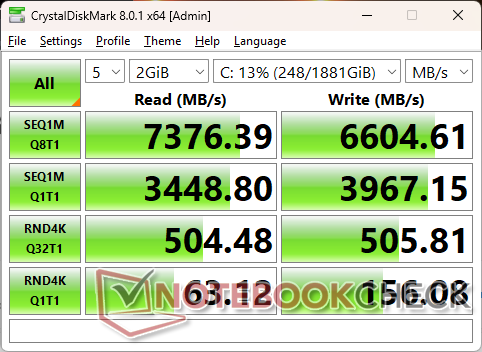
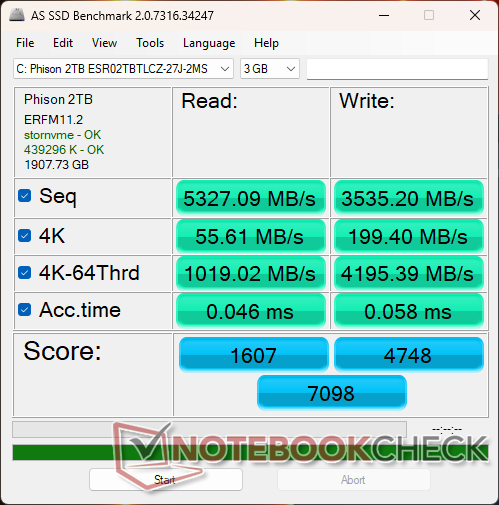
存储设备
微星的这款机型是为数不多的包含专用固态硬盘散热器的游戏笔记本电脑之一,可更好地支持 PCIe5 固态硬盘。我们测试设备中的 PCIe4 硬盘能够维持高达 7000 MB/s 的传输速率,并且没有明显的节流现象。

| Drive Performance rating - Percent | |
| Alienware m18 R2 | |
| MSI Raider 18 HX A14V | |
| Acer Predator Helios 18 PH18-72-98MW | |
| MSI Vector A18 HX A9W | |
| Asus Strix Scar 18 G835LX | |
| Razer Blade 18 2024 RZ09-0509 | |
* ... smaller is better
Disk Throttling: DiskSpd Read Loop, Queue Depth 8
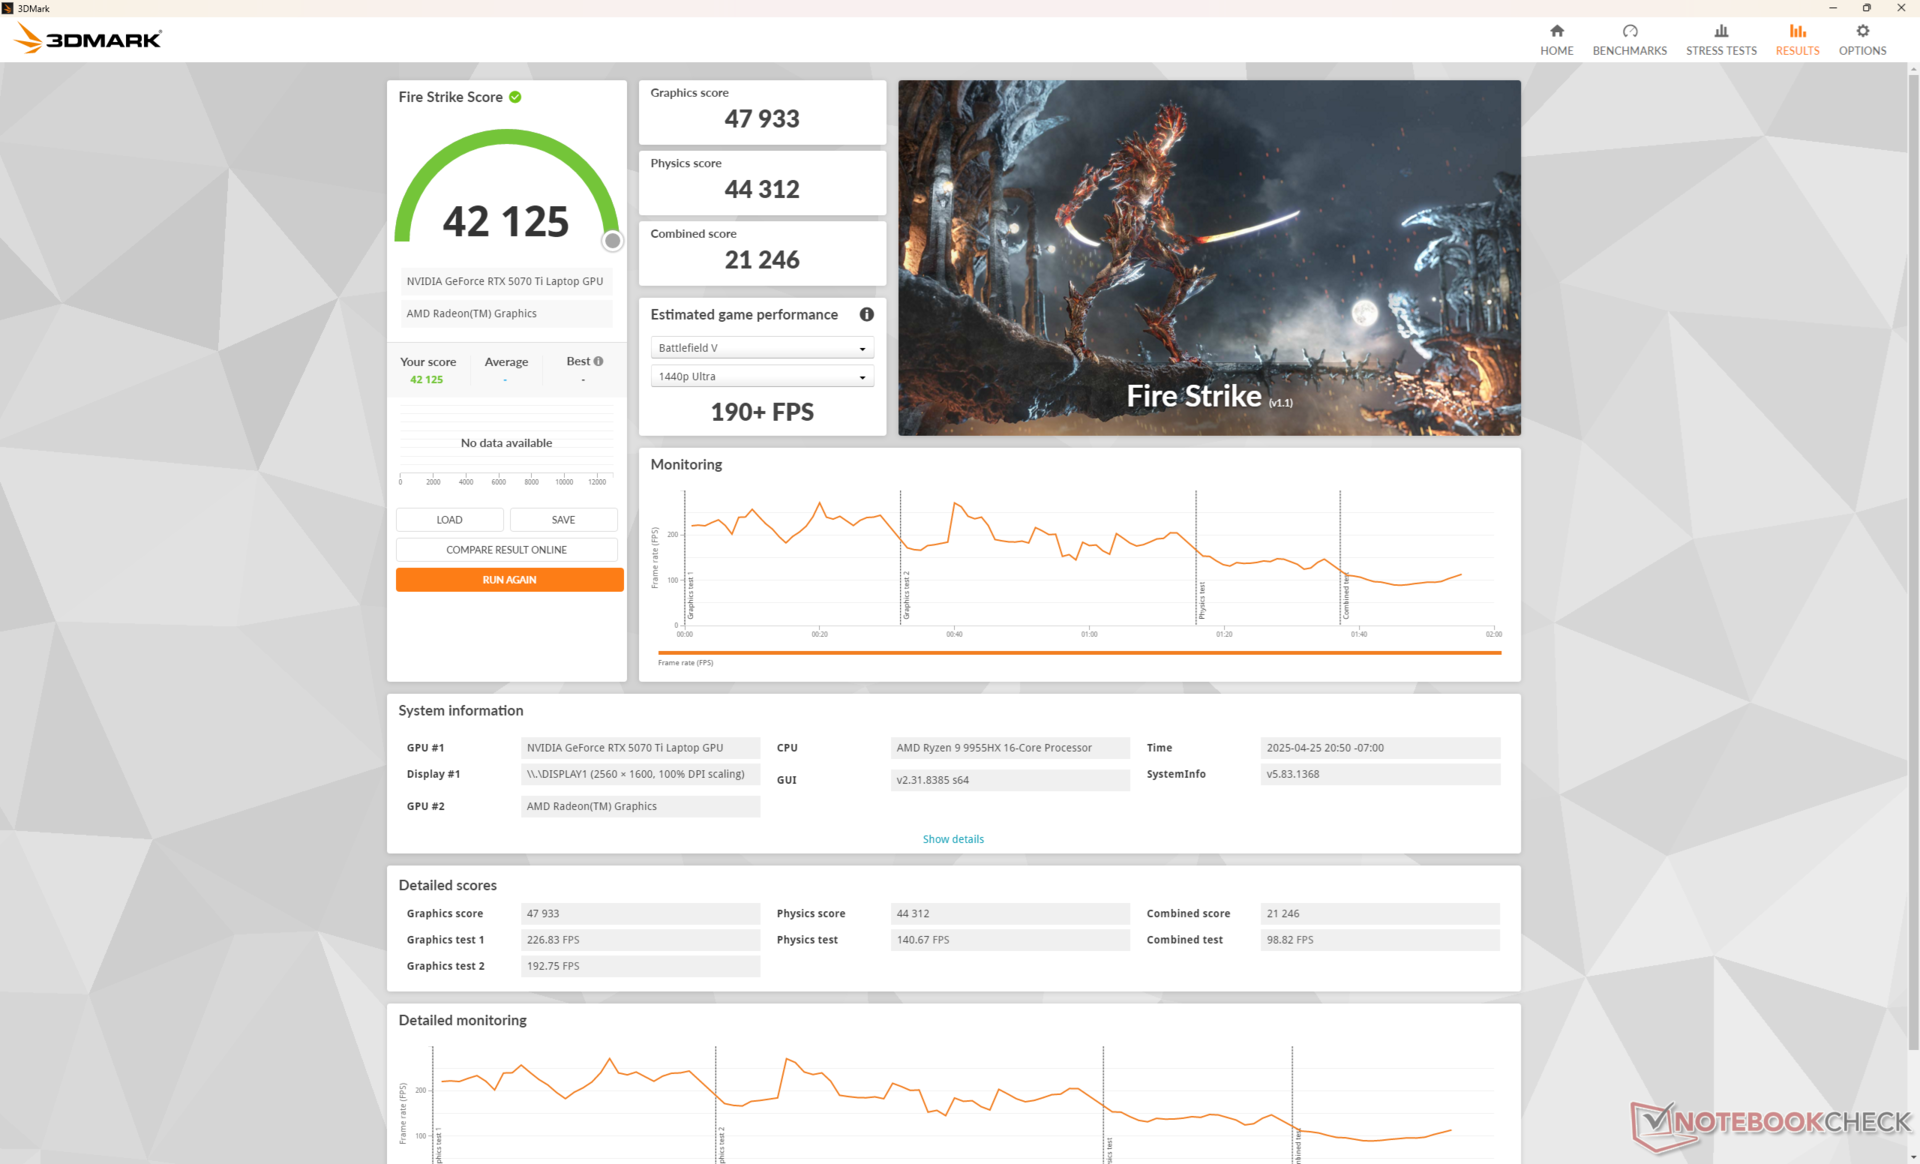
图形处理器性能
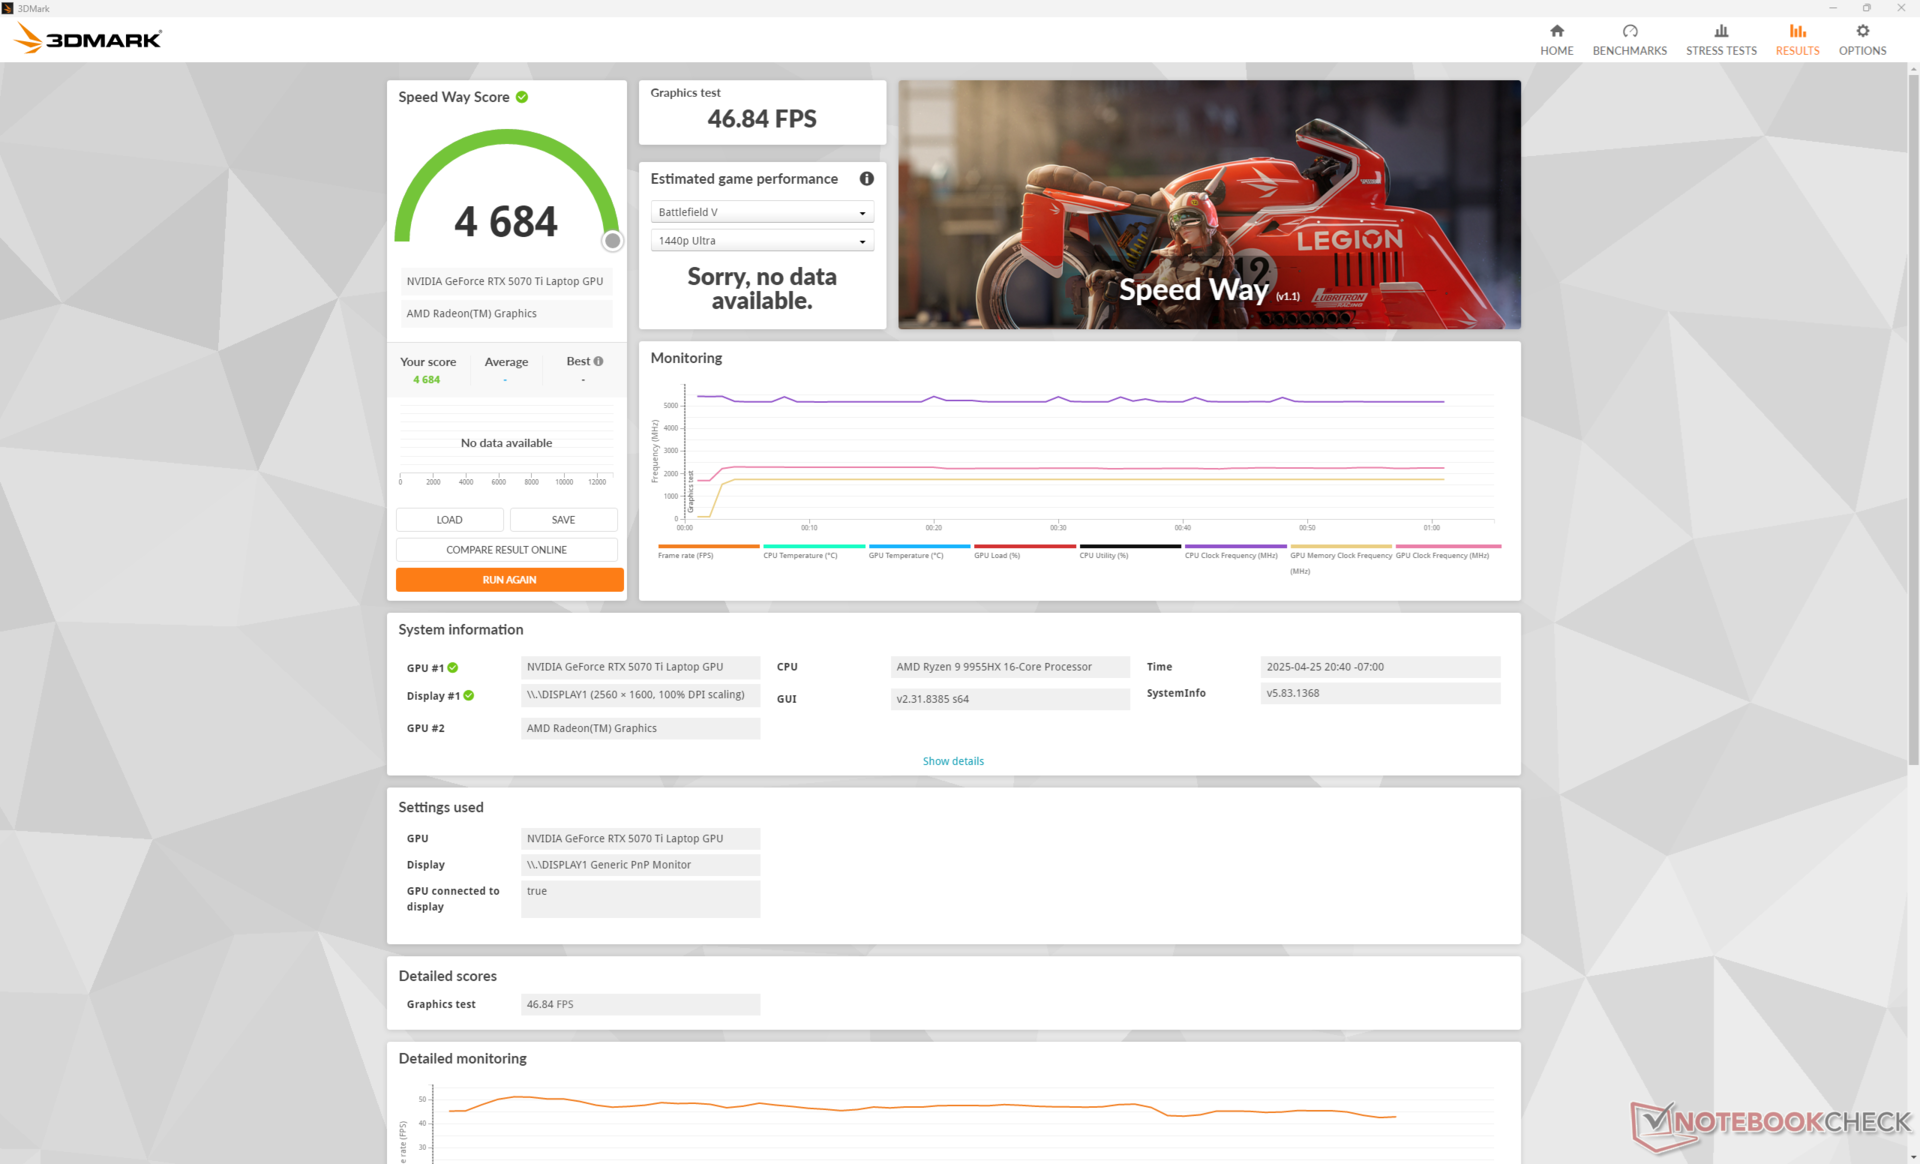
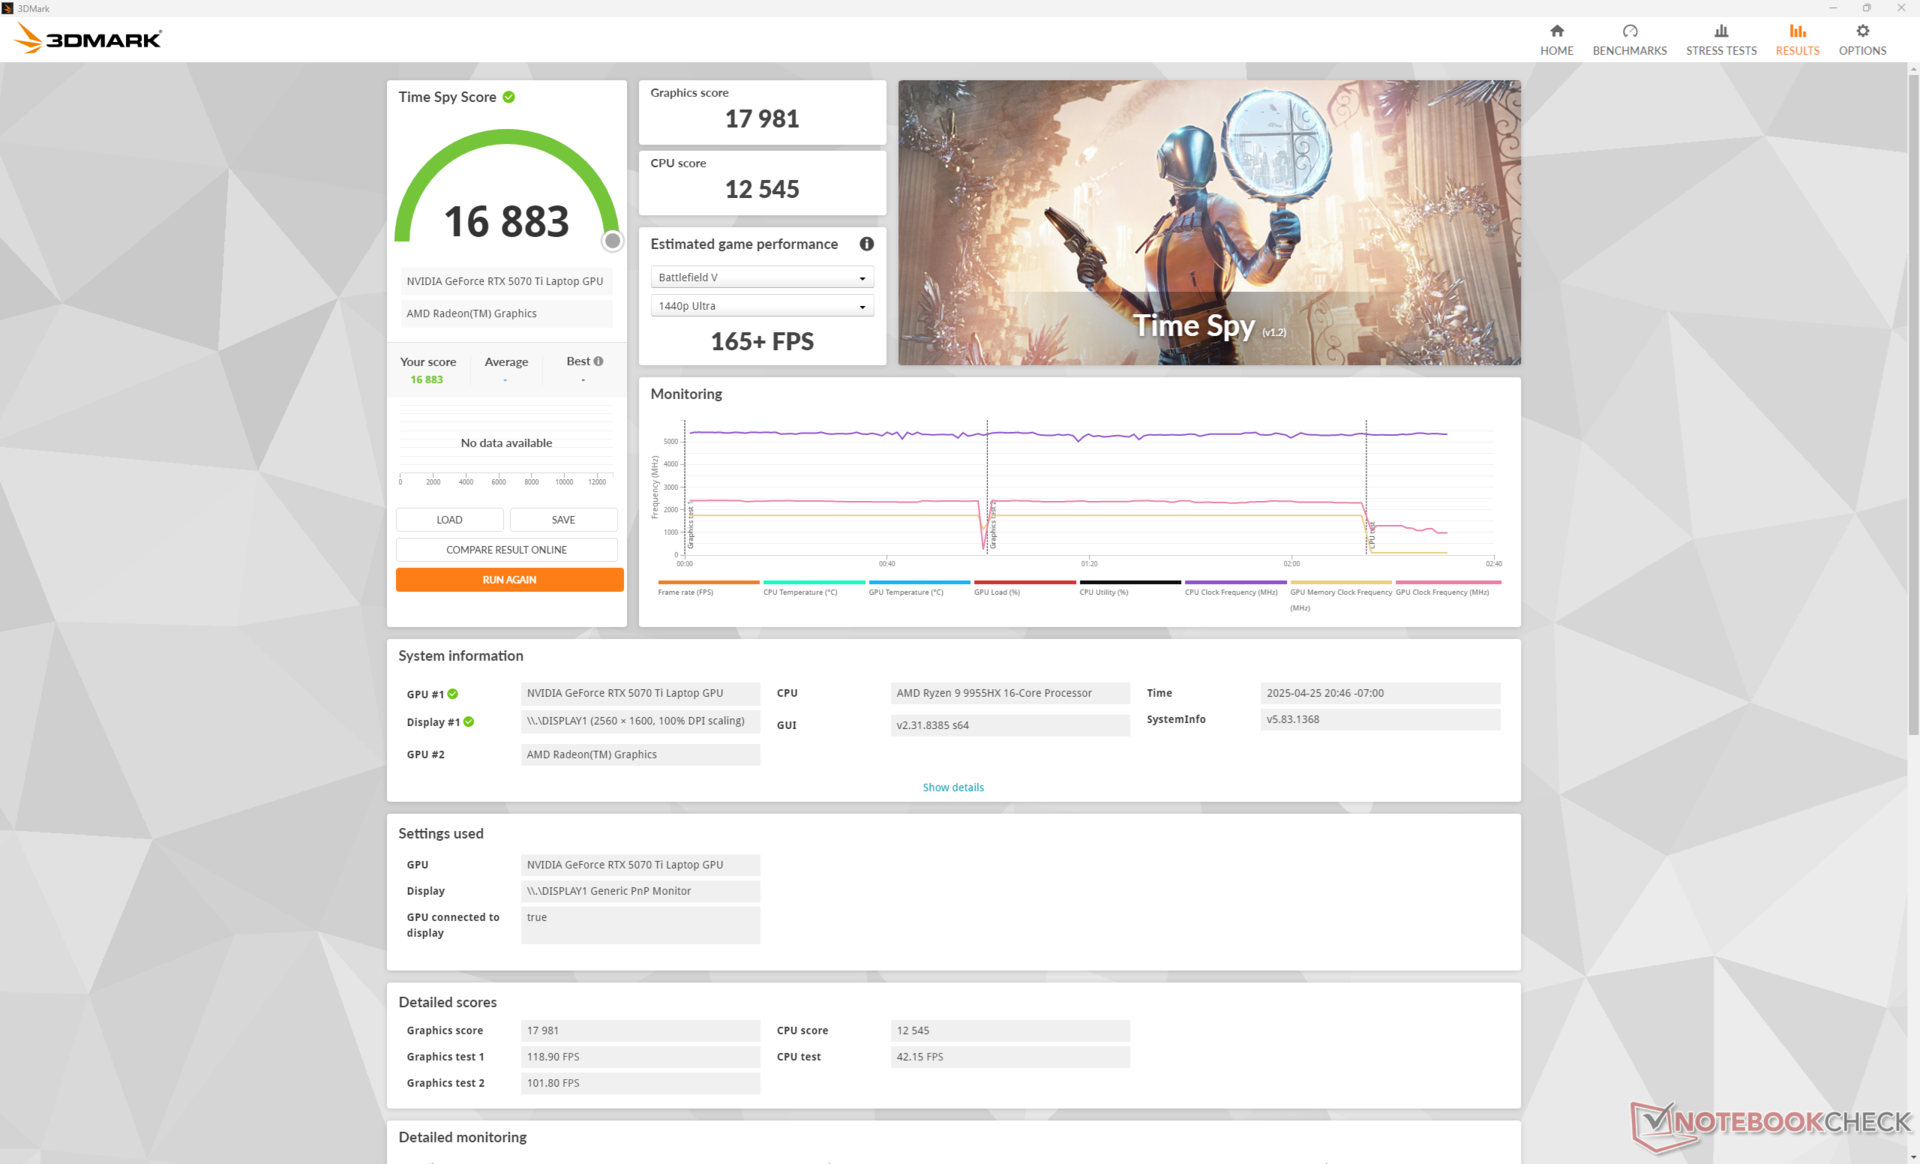
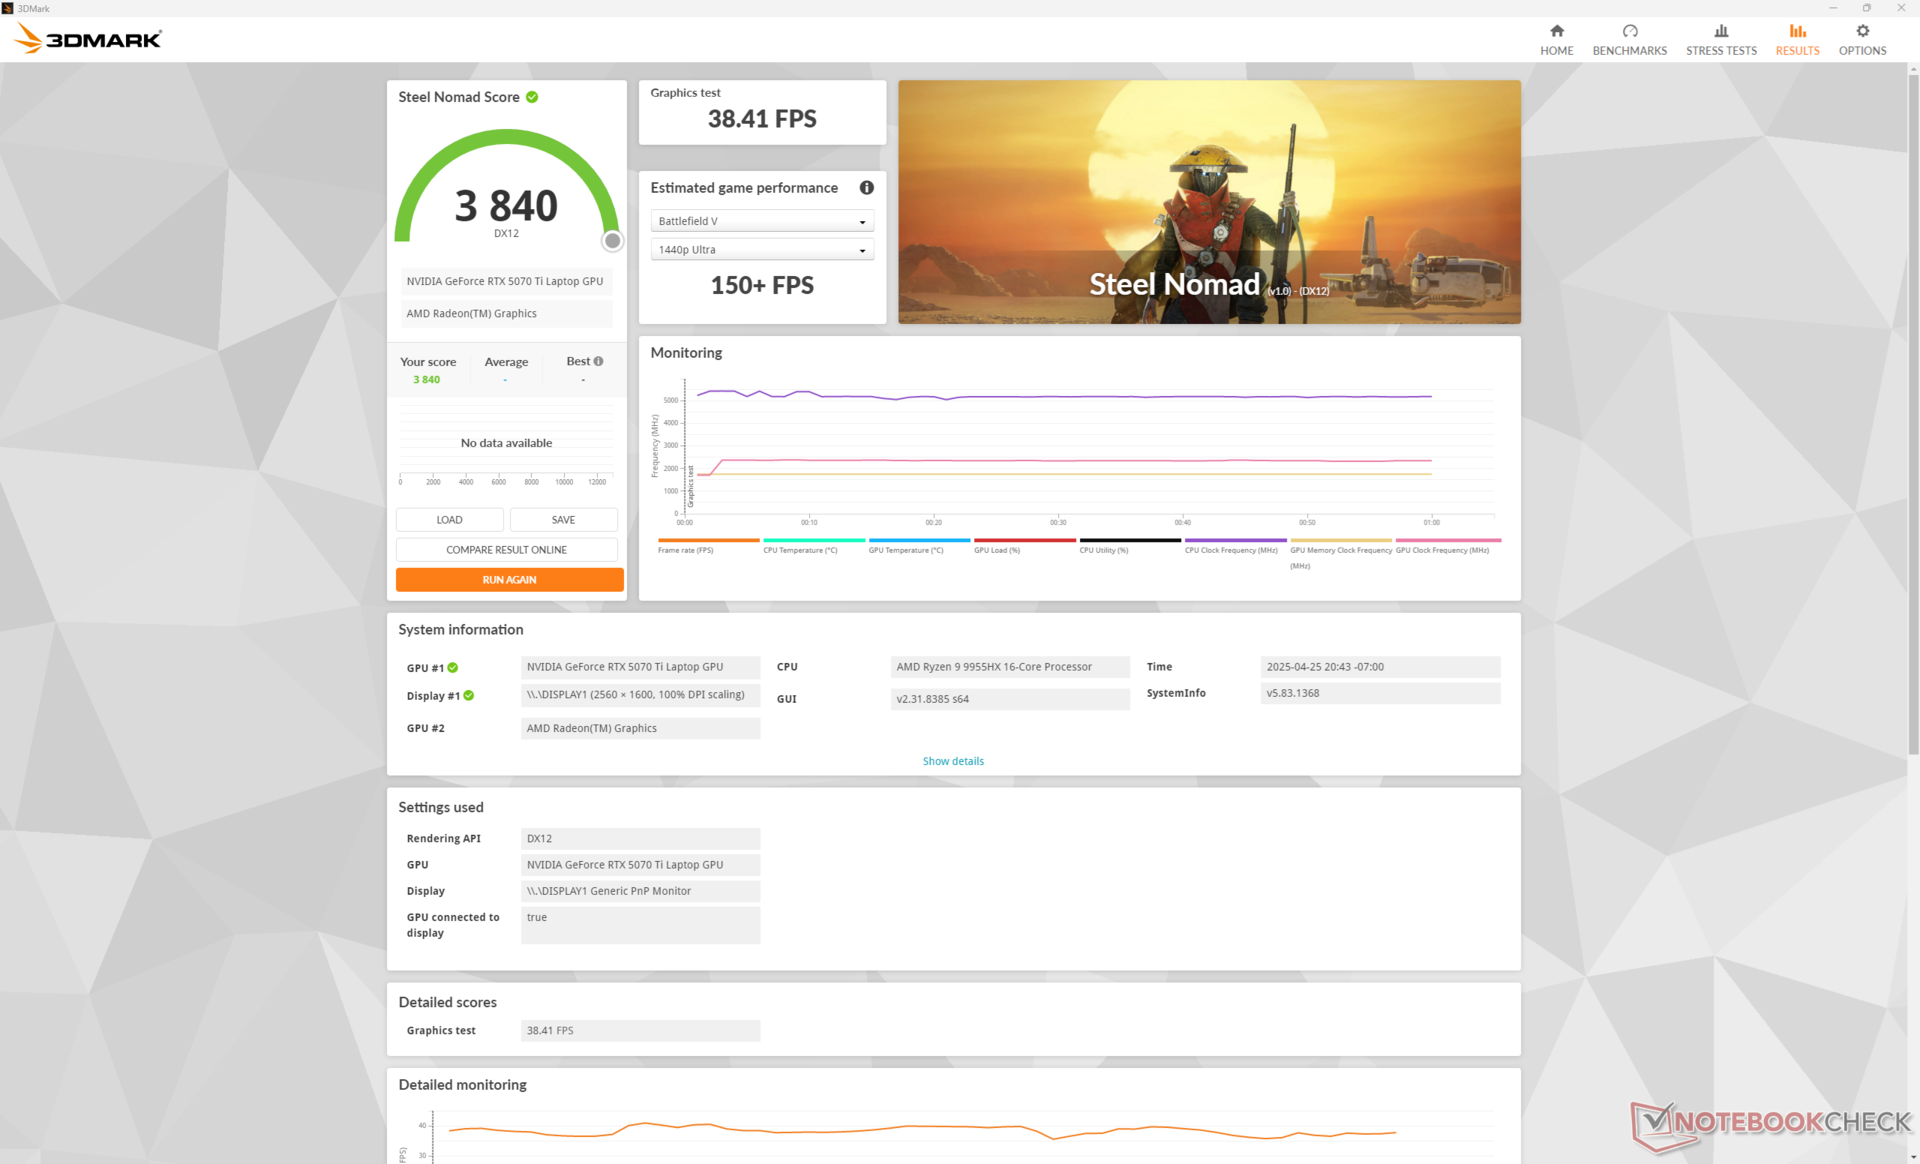
使用 140 WGeForce RTX 5070 Ti 的 3DMark 结果与 Raider 18 HX 上 175 WGeForce RTX 4080 的结果几乎不相上下。升级到 RTX 5080 配置后,DX12 游戏的性能可提高 25% 至 30%。
| 电源配置文件 | 图形分数 | 物理得分 | 综合得分 |
| 冷却器提升模式 | 48837 | 44787 | 21174 |
| 性能模式 | 47933 (-2%) | 44312 (-1%) | 21246 (-0%) |
| 平衡模式 | 45444 (-7%) | 40341 (-10%) | 18011 (-15%) |
| 电池电量 | 4546 (-90%) | 27512 (-39%) | 2426 (-89%) |
如Fire Strike 上表所示,"性能 "模式和 "冷却增强 "模式(即最大风扇模式)之间的性能差异基本可以忽略不计。
| 3DMark 11 Performance | 45350 points | |
| 3DMark Fire Strike Score | 42125 points | |
| 3DMark Time Spy Score | 16883 points | |
| 3DMark Steel Nomad Score | 3840 points | |
Help | ||
* ... smaller is better
游戏性能
RTX 5070 Ti 功能强大,足以在超设置下以原生 QHD 分辨率和稳定的 60 FPS 运行大多数游戏。不过,像《刺客信条暗影》或《怪物猎人荒野》这样要求更高的游戏可能需要 DLSS 才能达到 60+ FPS。多帧生成功能在支持的游戏上运行良好,当禁用 RT 等要求更高的功能时,可达到面板的原始刷新率。
在测试过程中,某些游戏(包括《怪物猎人荒野行动》和《夺宝奇兵 》)在启用最高 4K 设置时会不断崩溃,这可能是由于驱动程序问题造成的。否则,在 RTX 5080 或 RTX 5090 笔记本电脑上运行时不会出现这些崩溃现象。
Cyberpunk 2077 ultra FPS Chart
| low | med. | high | ultra | QHD DLSS | QHD FSR | QHD | 4K DLSS | 4K FSR | 4K | |
|---|---|---|---|---|---|---|---|---|---|---|
| Dota 2 Reborn (2015) | 256 | 217 | 215 | 193 | 170.7 | |||||
| Final Fantasy XV Benchmark (2018) | 180.1 | 134.2 | 77.5 | |||||||
| X-Plane 11.11 (2018) | 173.7 | 136.4 | 115.5 | 91.8 | ||||||
| Strange Brigade (2018) | 347 | 246 | 131.7 | |||||||
| Baldur's Gate 3 (2023) | 246.1 | 175.5 | 102.5 | 91.4 | ||||||
| Cyberpunk 2077 (2023) | 203 | 178.7 | 154.1 | 135.5 | 102.1 | 87.5 | 33.6 | 37.1 | ||
| F1 24 (2024) | 114.8 | 115.8 | 113.8 | 72.1 | 61.4 | 35.6 | ||||
| Indiana Jones and the Great Circle (2024) | 107.4 | 99.9 | 82.5 | 43.1 | ||||||
| Monster Hunter Wilds (2025) | 70.8 | 70.6 | 55 | 33.4 | ||||||
| Assassin's Creed Shadows (2025) | 52 | 58 | 45 | 44 | 32 |
排放量
系统噪音
中低负载运行时的风扇噪音和表现与我们在 Raider 18 HX 上体验到的类似。不过,在游戏时,Vector A18 的风扇噪音普遍较小,在平衡模式、性能模式和 Cooler Boost 模式下分别为 44 dB(A)、50 dB(A) 和 62 dB(A)。
Noise level
| Idle |
| 26 / 26 / 32 dB(A) |
| Load |
| 44.4 / 61.6 dB(A) |
 | ||
30 dB silent 40 dB(A) audible 50 dB(A) loud |
||
min: | ||
| MSI Vector A18 HX A9W GeForce RTX 5070 Ti Laptop, R9 9955HX | MSI Raider 18 HX A14V GeForce RTX 4080 Laptop GPU, i9-14900HX, Samsung PM9A1 MZVL22T0HBLB | Asus Strix Scar 18 G835LX GeForce RTX 5090 Laptop, Ultra 9 275HX, WD PC SN8000S 2TB | Razer Blade 18 2024 RZ09-0509 GeForce RTX 4090 Laptop GPU, i9-14900HX | Alienware m18 R2 GeForce RTX 4090 Laptop GPU, i9-14900HX, SK Hynix PC811 HFS002TEM9X152N | Acer Predator Helios 18 PH18-72-98MW GeForce RTX 4090 Laptop GPU, i9-14900HX, 2x SK Hynix HFS001TEJ9X115N (RAID 0) | |
|---|---|---|---|---|---|---|
| Noise | -6% | -3% | 4% | 7% | -16% | |
| off / environment * (dB) | 22.5 | 23.3 -4% | 23.3 -4% | 23.4 -4% | 23.6 -5% | 25 -11% |
| Idle Minimum * (dB) | 26 | 28.6 -10% | 29.8 -15% | 23.9 8% | 23.8 8% | 30 -15% |
| Idle Average * (dB) | 26 | 28.6 -10% | 29.8 -15% | 28.2 -8% | 26.1 -0% | 36 -38% |
| Idle Maximum * (dB) | 32 | 31.3 2% | 29.8 7% | 29 9% | 31.5 2% | 44 -38% |
| Load Average * (dB) | 44.4 | 44.1 1% | 42.9 3% | 36.8 17% | 31.5 29% | 48 -8% |
| Cyberpunk 2077 ultra * (dB) | 49.8 | 59.4 -19% | 53.7 -8% | |||
| Load Maximum * (dB) | 61.6 | 62.7 -2% | 53.7 13% | 61.1 1% | 56.6 8% | 51 17% |
| Witcher 3 ultra * (dB) | 54.1 | 52.1 | 49 |
* ... smaller is better
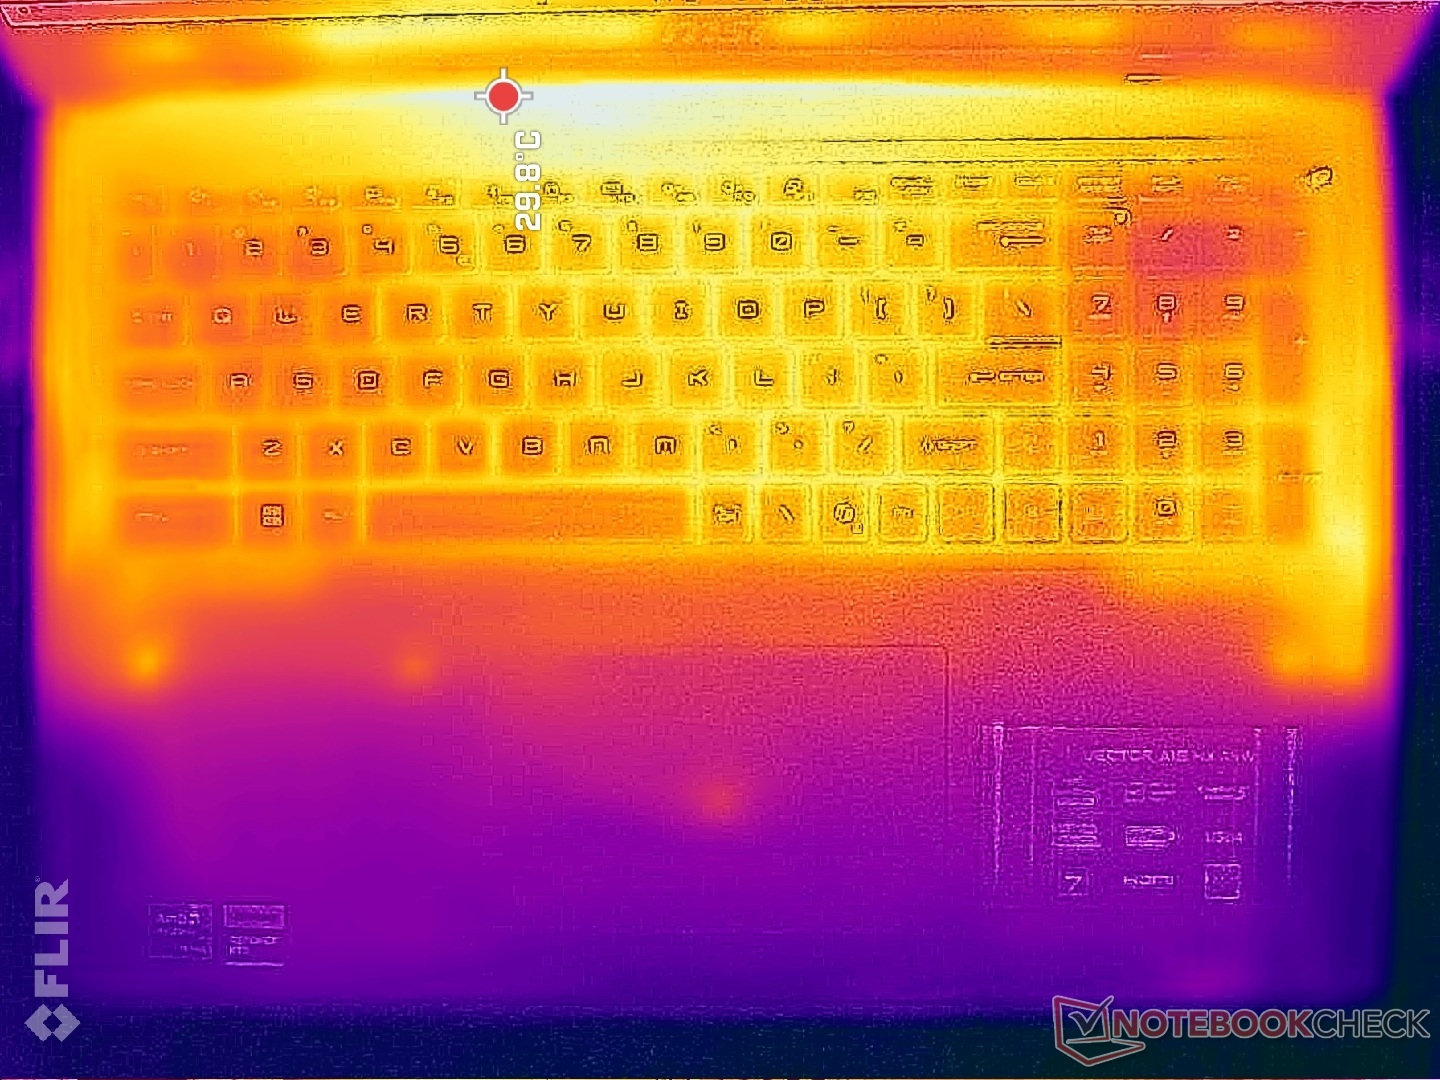
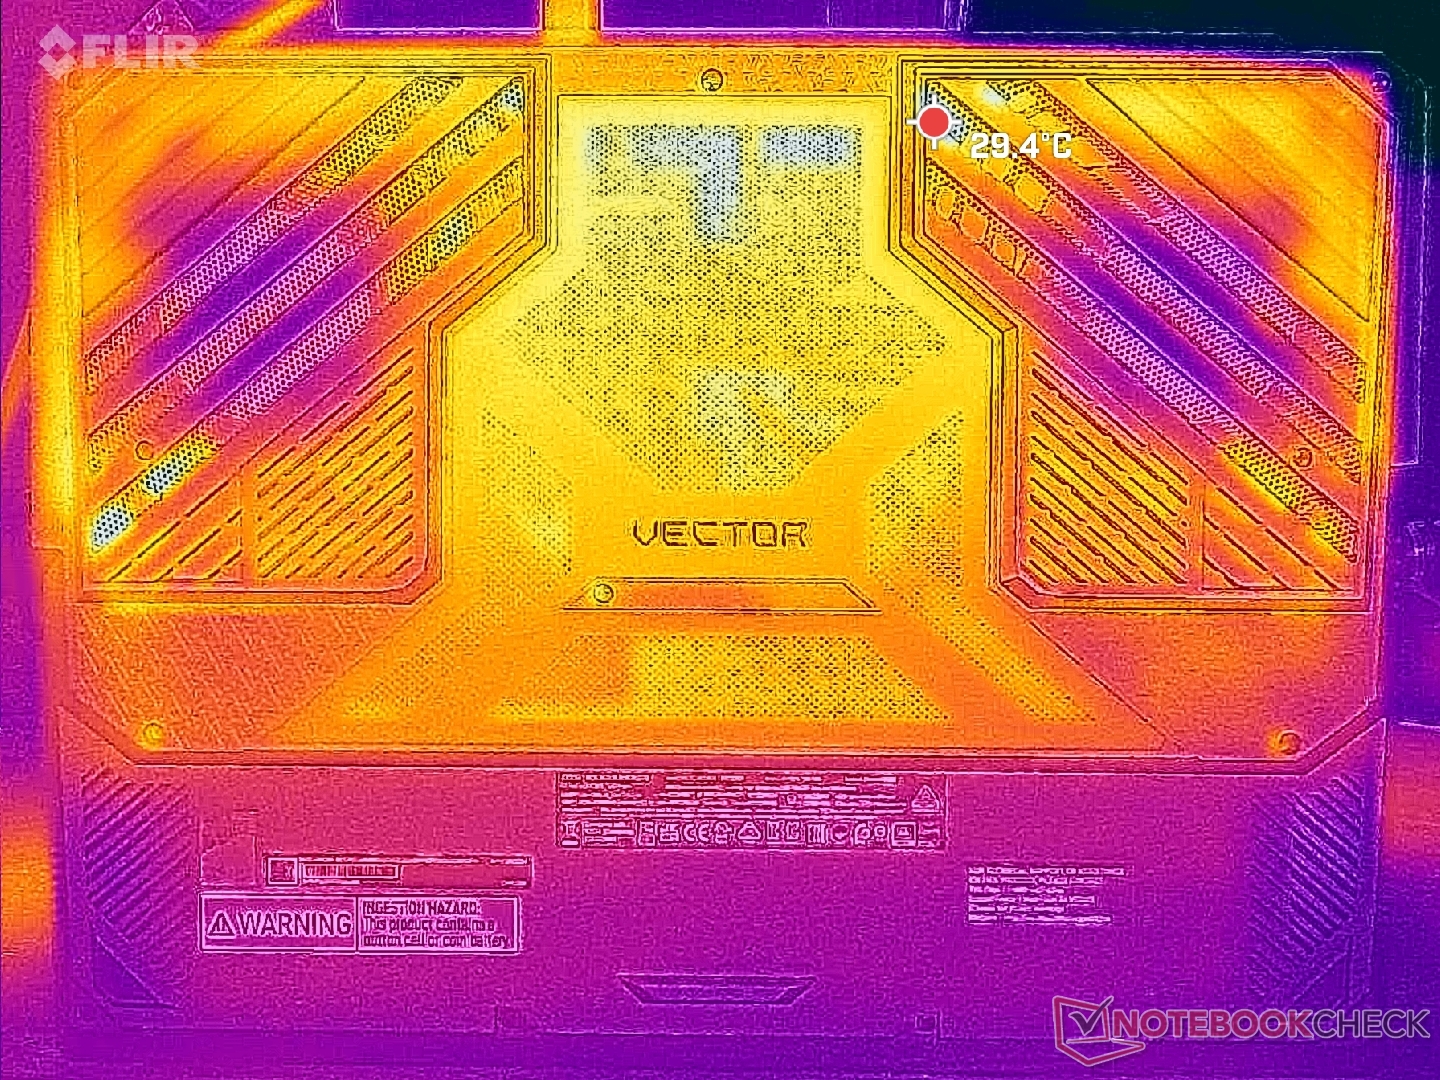
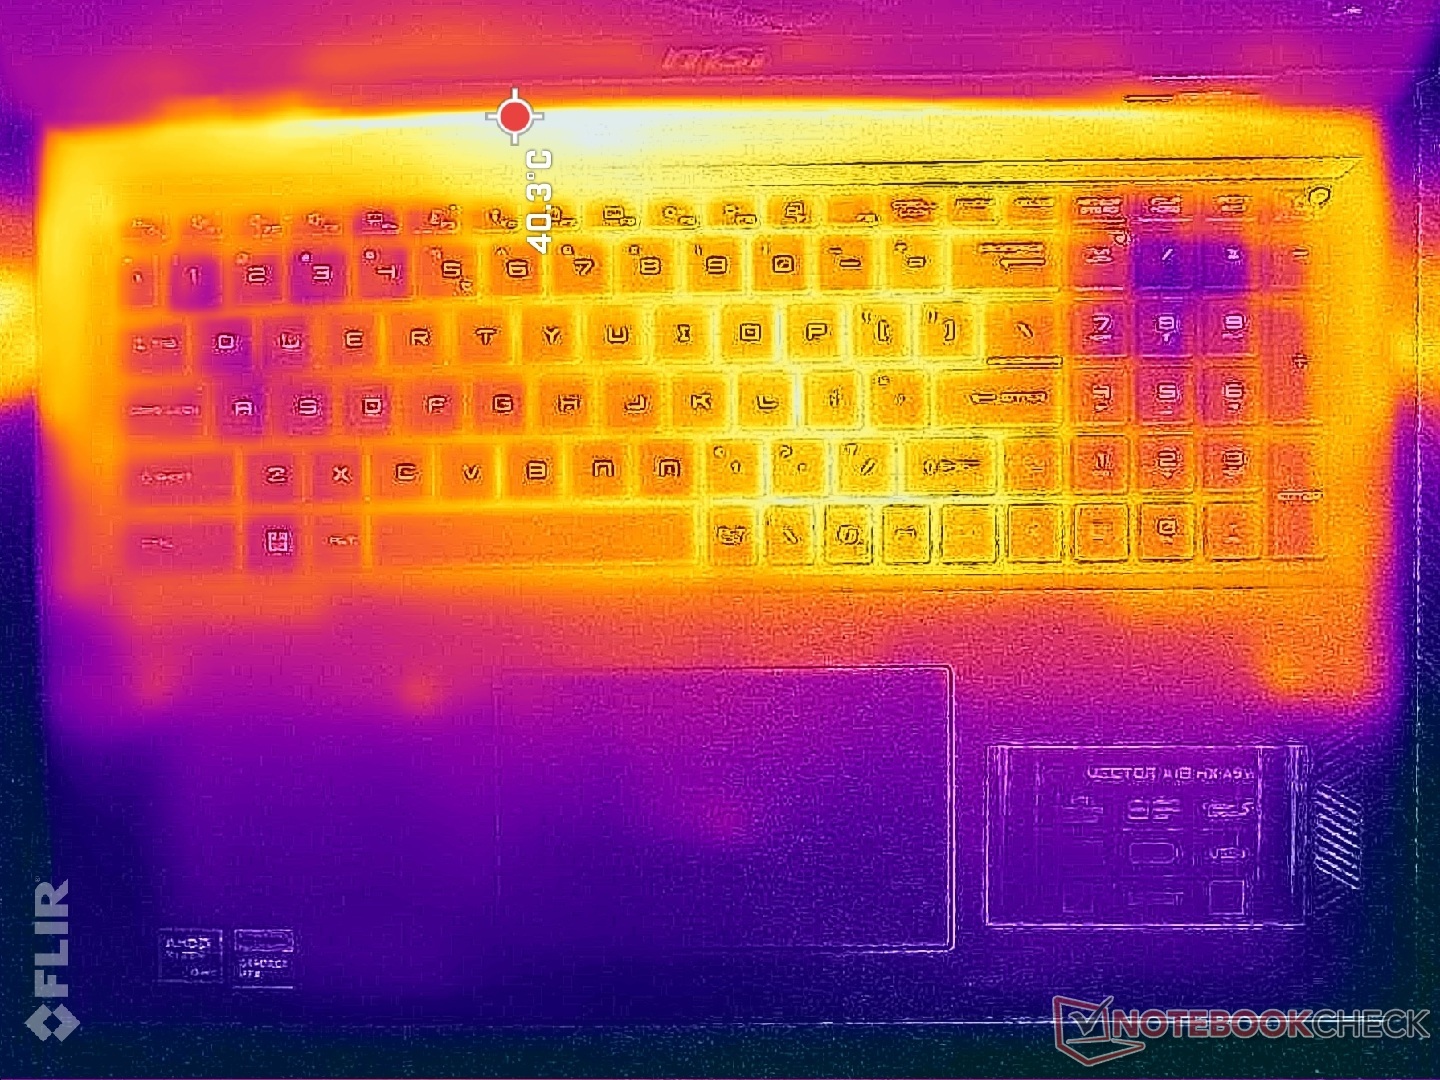
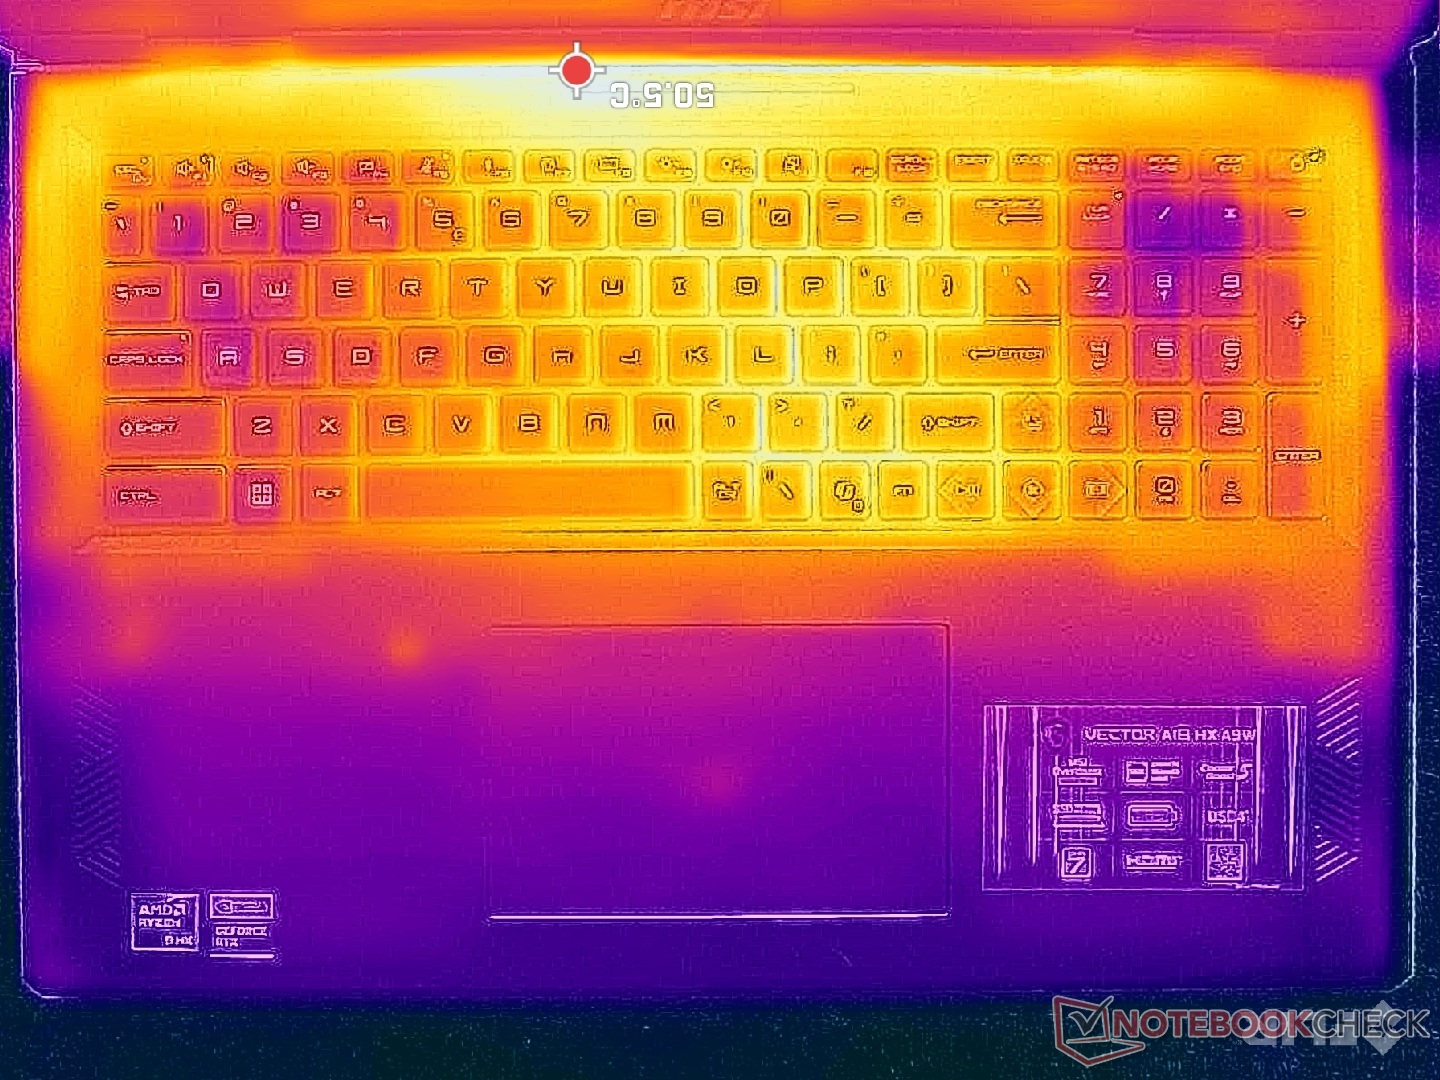
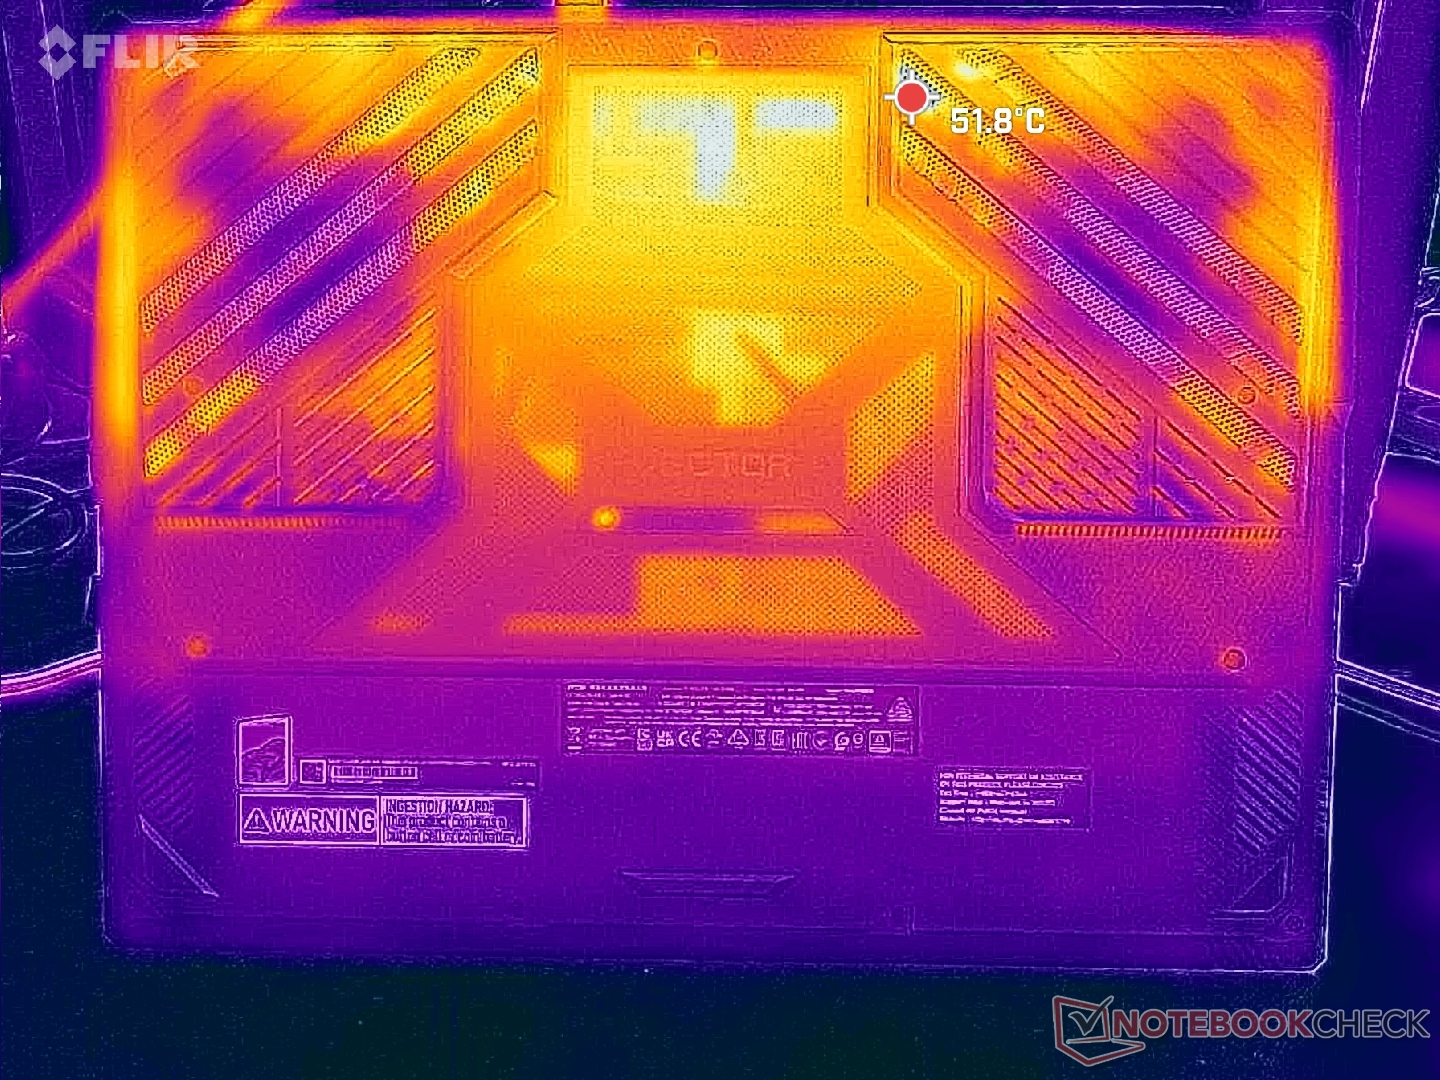
温度
键盘中心的表面温度最高,而 WASD 键和数字键盘区域的温度较低,因为它们位于两个内部风扇的正上方。掌托在游戏时不会明显发热,手感更舒适。
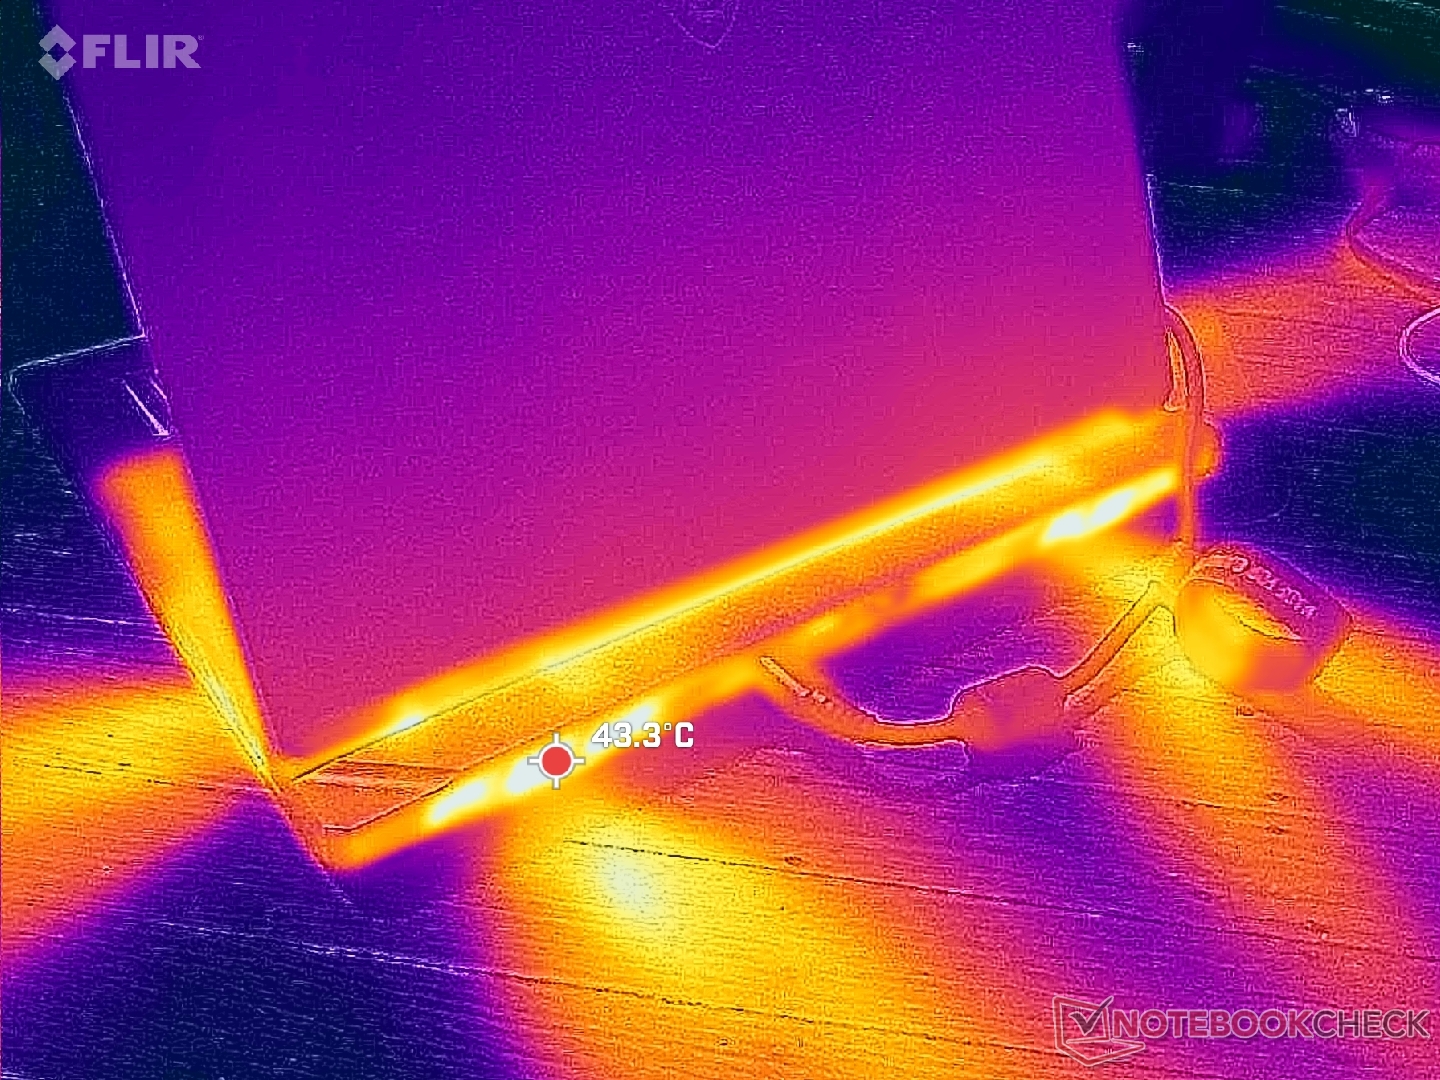
(-) The maximum temperature on the upper side is 46.6 °C / 116 F, compared to the average of 40.4 °C / 105 F, ranging from 21.2 to 68.8 °C for the class Gaming.
(-) The bottom heats up to a maximum of 45.6 °C / 114 F, compared to the average of 43.2 °C / 110 F
(+) In idle usage, the average temperature for the upper side is 27.4 °C / 81 F, compared to the device average of 33.9 °C / 93 F.
(±) 3: The average temperature for the upper side is 32 °C / 90 F, compared to the average of 33.9 °C / 93 F for the class Gaming.
(+) The palmrests and touchpad are cooler than skin temperature with a maximum of 30.2 °C / 86.4 F and are therefore cool to the touch.
(±) The average temperature of the palmrest area of similar devices was 28.8 °C / 83.8 F (-1.4 °C / -2.6 F).
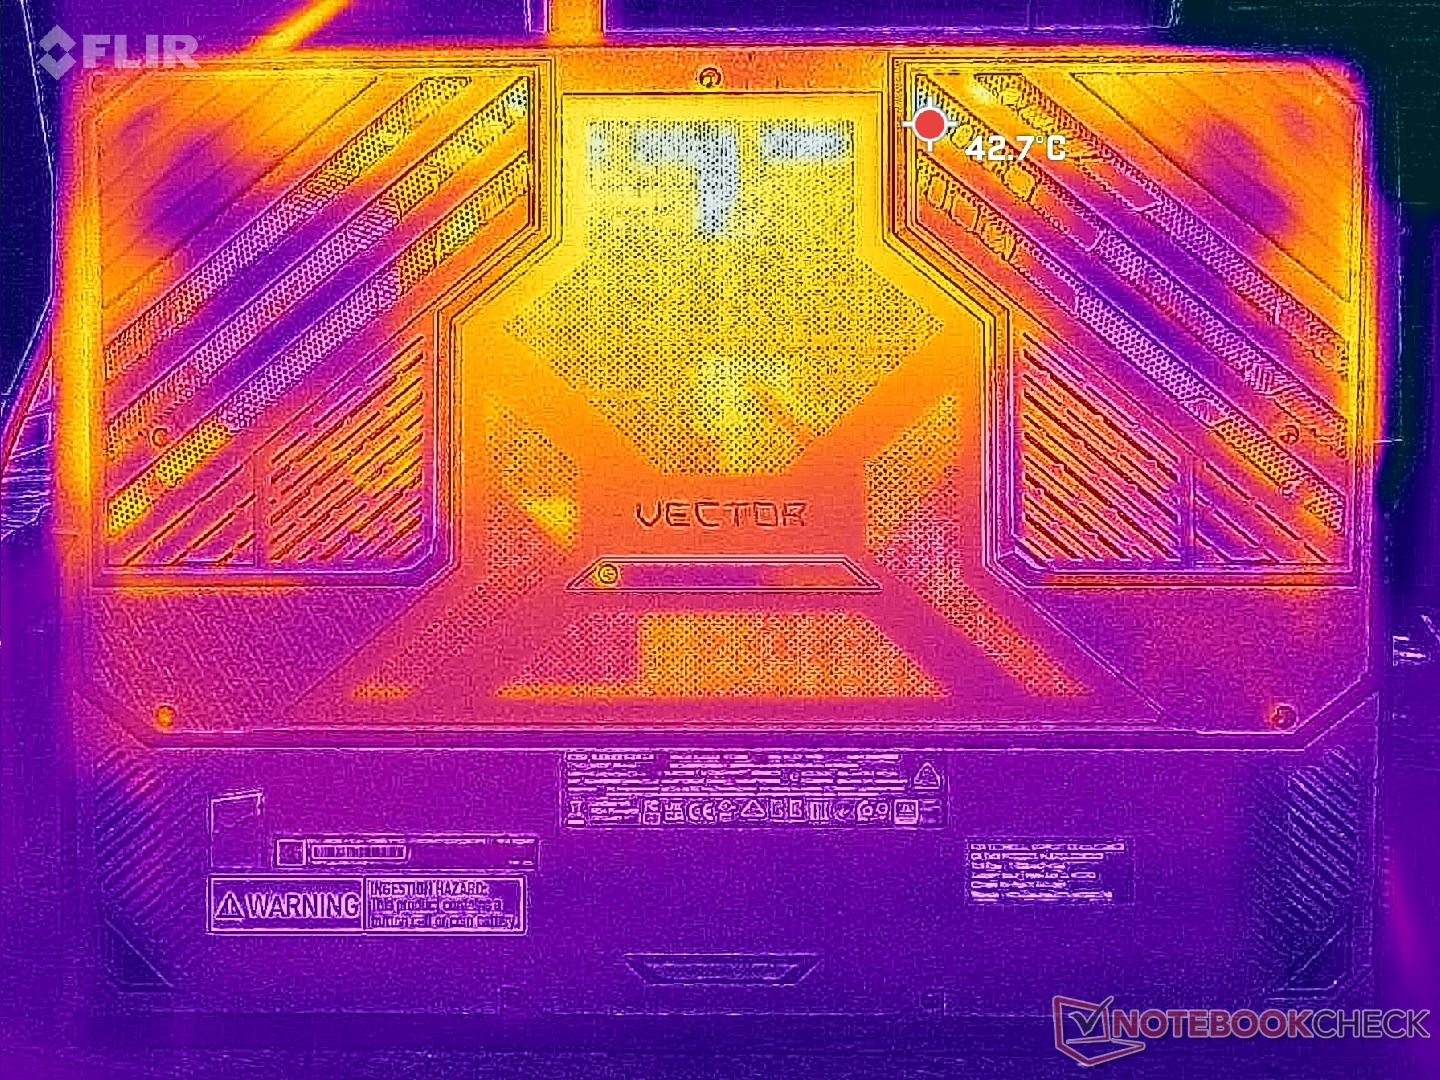
| MSI Vector A18 HX A9W AMD Ryzen 9 9955HX, NVIDIA GeForce RTX 5070 Ti Laptop | MSI Raider 18 HX A14V Intel Core i9-14900HX, NVIDIA GeForce RTX 4080 Laptop GPU | Asus Strix Scar 18 G835LX Intel Core Ultra 9 275HX, NVIDIA GeForce RTX 5090 Laptop | Razer Blade 18 2024 RZ09-0509 Intel Core i9-14900HX, NVIDIA GeForce RTX 4090 Laptop GPU | Alienware m18 R2 Intel Core i9-14900HX, NVIDIA GeForce RTX 4090 Laptop GPU | Acer Predator Helios 18 PH18-72-98MW Intel Core i9-14900HX, NVIDIA GeForce RTX 4090 Laptop GPU | |
|---|---|---|---|---|---|---|
| Heat | -7% | 2% | -7% | -13% | -11% | |
| Maximum Upper Side * (°C) | 46.6 | 40.8 12% | 45.6 2% | 43.2 7% | 41.2 12% | 43 8% |
| Maximum Bottom * (°C) | 45.6 | 43.4 5% | 46 -1% | 42.6 7% | 34.6 24% | 59 -29% |
| Idle Upper Side * (°C) | 31.2 | 36.4 -17% | 28.9 7% | 36 -15% | 42.8 -37% | 32 -3% |
| Idle Bottom * (°C) | 28.6 | 36.4 -27% | 29.2 -2% | 36.4 -27% | 43.6 -52% | 34 -19% |
* ... smaller is better
发言人
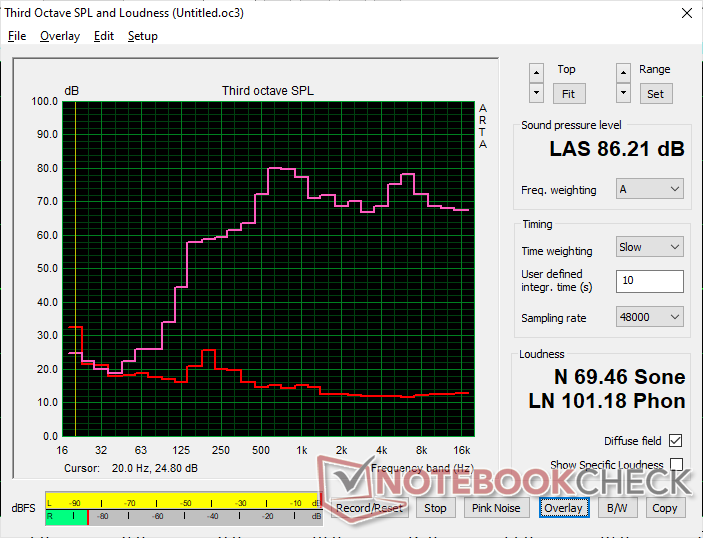
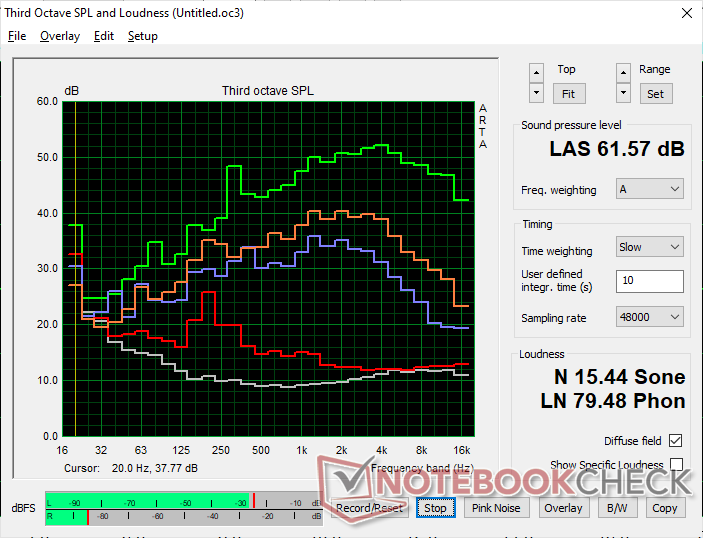
MSI Vector A18 HX A9W audio analysis
(+) | speakers can play relatively loud (86.2 dB)
Bass 100 - 315 Hz
(-) | nearly no bass - on average 16% lower than median
(±) | linearity of bass is average (10.9% delta to prev. frequency)
Mids 400 - 2000 Hz
(±) | higher mids - on average 5.7% higher than median
(±) | linearity of mids is average (7.2% delta to prev. frequency)
Highs 2 - 16 kHz
(+) | balanced highs - only 3.3% away from median
(+) | highs are linear (6.8% delta to prev. frequency)
Overall 100 - 16.000 Hz
(+) | overall sound is linear (13.5% difference to median)
Compared to same class
» 20% of all tested devices in this class were better, 7% similar, 73% worse
» The best had a delta of 6%, average was 18%, worst was 132%
Compared to all devices tested
» 14% of all tested devices were better, 4% similar, 82% worse
» The best had a delta of 4%, average was 24%, worst was 134%
Apple MacBook Pro 16 2021 M1 Pro audio analysis
(+) | speakers can play relatively loud (84.7 dB)
Bass 100 - 315 Hz
(+) | good bass - only 3.8% away from median
(+) | bass is linear (5.2% delta to prev. frequency)
Mids 400 - 2000 Hz
(+) | balanced mids - only 1.3% away from median
(+) | mids are linear (2.1% delta to prev. frequency)
Highs 2 - 16 kHz
(+) | balanced highs - only 1.9% away from median
(+) | highs are linear (2.7% delta to prev. frequency)
Overall 100 - 16.000 Hz
(+) | overall sound is linear (4.6% difference to median)
Compared to same class
» 0% of all tested devices in this class were better, 0% similar, 100% worse
» The best had a delta of 5%, average was 17%, worst was 45%
Compared to all devices tested
» 0% of all tested devices were better, 0% similar, 100% worse
» The best had a delta of 4%, average was 24%, worst was 134%
能源管理
耗电量
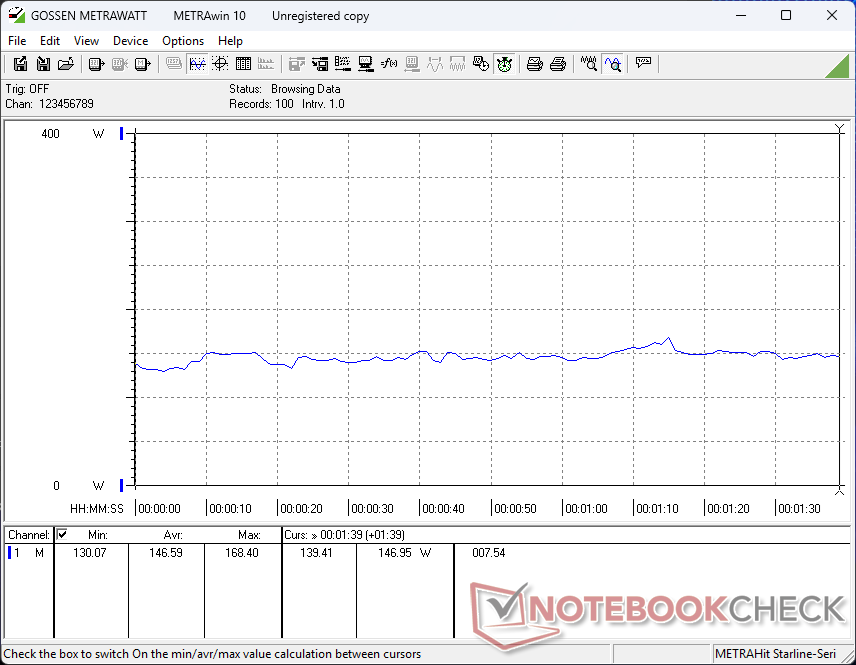
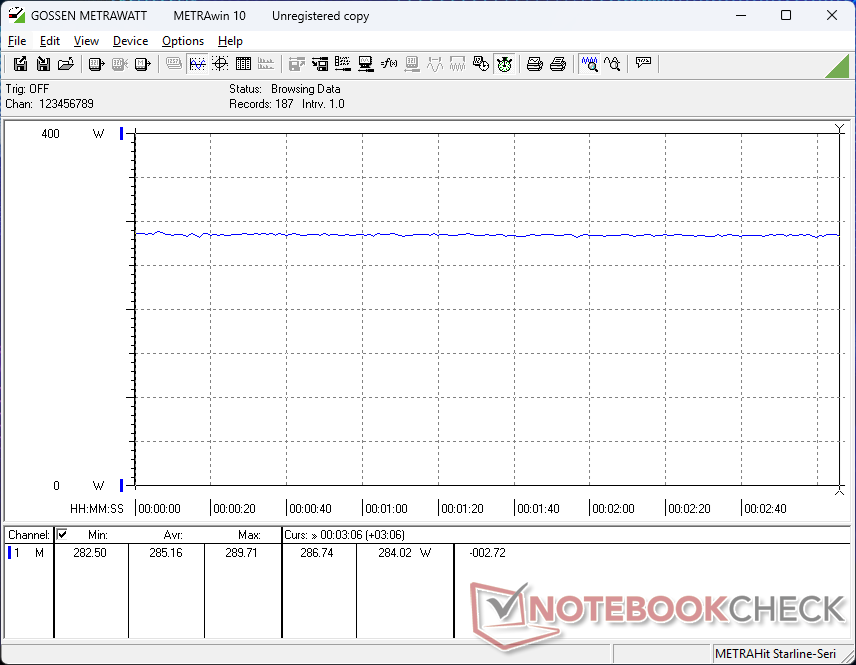
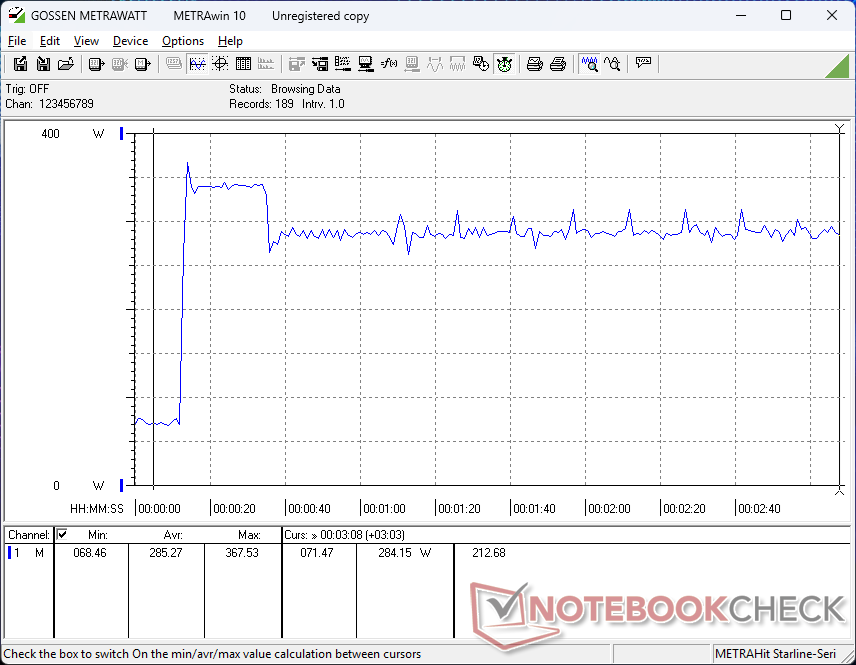
运行 Prime95 时的功耗比搭载酷睿 i9-14900HX 处理器的 Raider 18 HX 高出约 10%,而多线程性能却提升了 30%。同样,运行 FurMark 时的功耗比搭载 RTX 4080 的 Raider 18 HX 低约 20%,而图形性能却不相上下。因此,Vector A18 HX 是一款每瓦性能更高的高效游戏笔记本电脑。
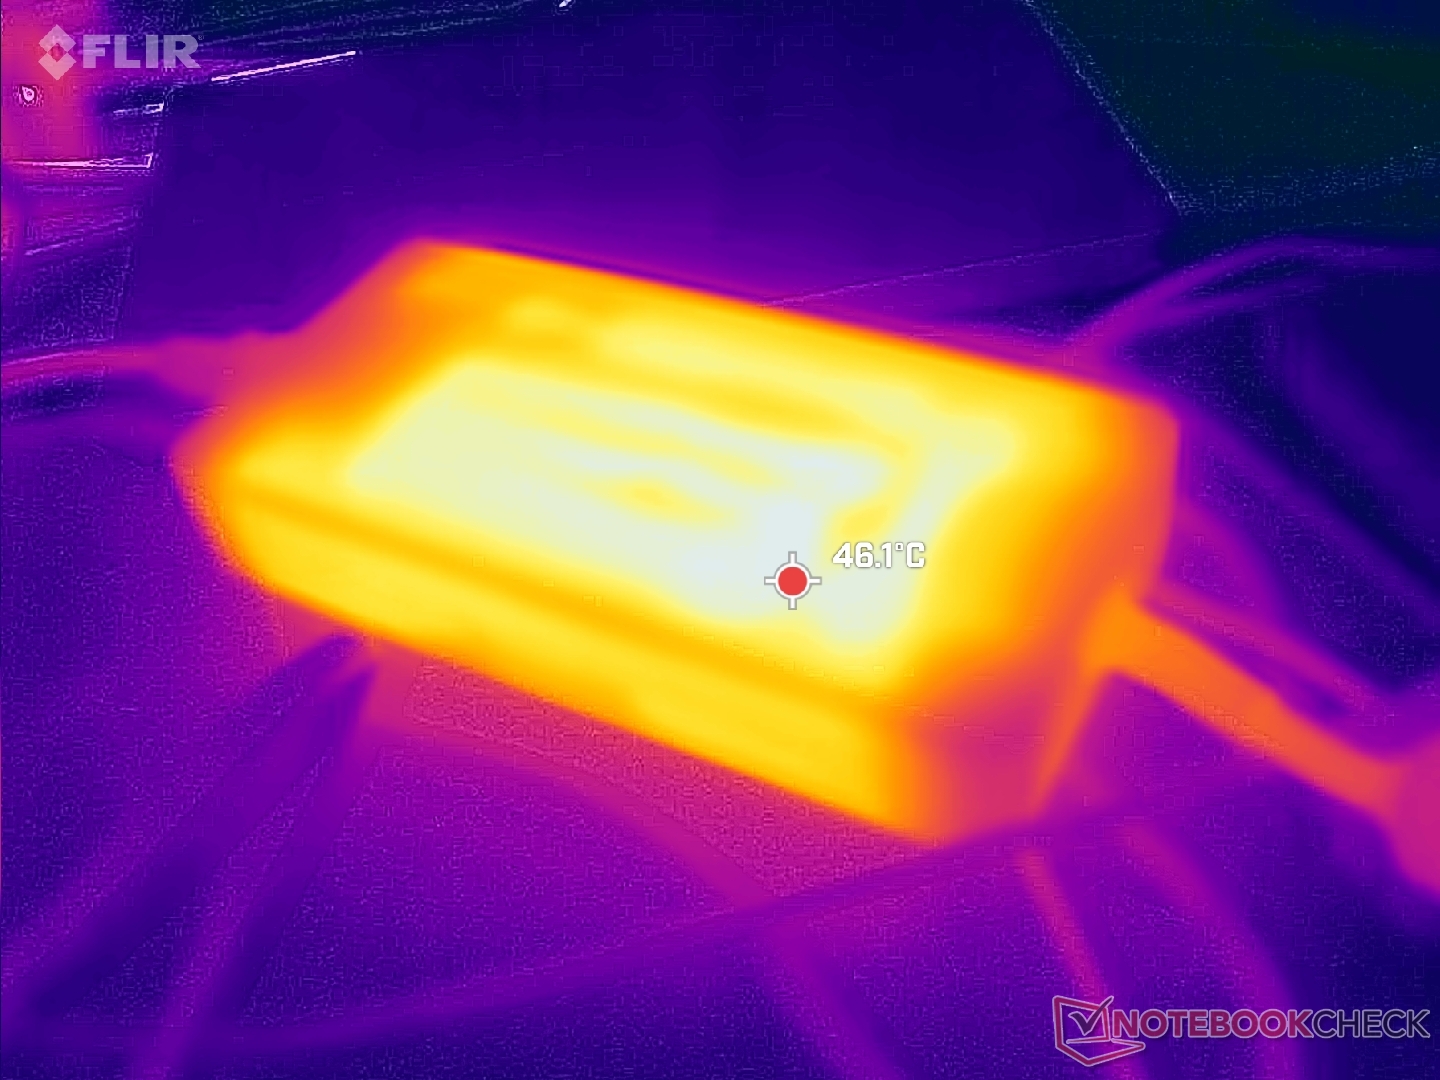
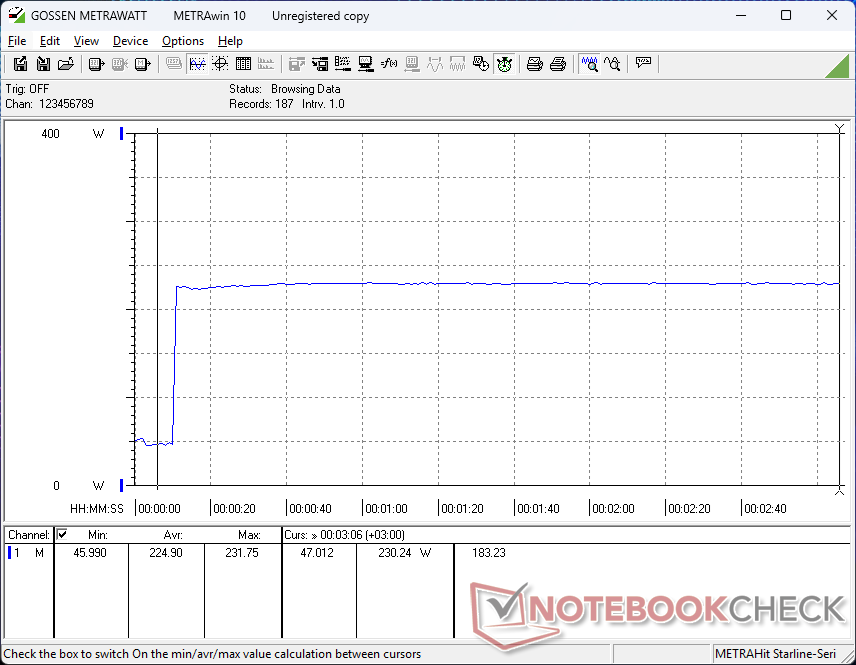
400 瓦交流适配器相当大,约 18.8 x 8.8 x 3.3 厘米。我们在 140 W RTX 5070 Ti 配置上只能记录到 297 W 的最大功耗,但 175 W RTX 5080 配置的功耗可能会更高。
| Off / Standby | |
| Idle | |
| Load |
|
Key:
min: | |
| MSI Vector A18 HX A9W R9 9955HX, GeForce RTX 5070 Ti Laptop, , IPS, 2560x1600, 18" | MSI Raider 18 HX A14V i9-14900HX, GeForce RTX 4080 Laptop GPU, Samsung PM9A1 MZVL22T0HBLB, Mini-LED, 3840x2400, 18" | Asus Strix Scar 18 G835LX Ultra 9 275HX, GeForce RTX 5090 Laptop, WD PC SN8000S 2TB, Mini-LED, 2560x1600, 18" | Razer Blade 18 2024 RZ09-0509 i9-14900HX, GeForce RTX 4090 Laptop GPU, , Mini-LED, 2560x1600, 18" | Alienware m18 R2 i9-14900HX, GeForce RTX 4090 Laptop GPU, SK Hynix PC811 HFS002TEM9X152N, IPS, 2560x1600, 18" | Acer Predator Helios 18 PH18-72-98MW i9-14900HX, GeForce RTX 4090 Laptop GPU, 2x SK Hynix HFS001TEJ9X115N (RAID 0), Mini-LED, 2560x1600, 18" | |
|---|---|---|---|---|---|---|
| Power Consumption | -0% | 4% | 3% | 14% | 0% | |
| Idle Minimum * (Watt) | 20.8 | 27.7 -33% | 11.4 45% | 25.4 -22% | 10.6 49% | 31 -49% |
| Idle Average * (Watt) | 52.8 | 38.3 27% | 39.2 26% | 37.7 29% | 20.9 60% | 35 34% |
| Idle Maximum * (Watt) | 54.5 | 47.1 14% | 40.2 26% | 57.9 -6% | 40 27% | 43 21% |
| Load Average * (Watt) | 146.6 | 121.2 17% | 161.2 -10% | 128.4 12% | 201.1 -37% | 144 2% |
| Cyberpunk 2077 ultra external monitor * (Watt) | 278 | 306 -10% | 295 -6% | |||
| Cyberpunk 2077 ultra * (Watt) | 285 | 313 -10% | 303 -6% | |||
| Load Maximum * (Watt) | 297.3 | 321.8 -8% | 430.9 -45% | 297.9 -0% | 378.9 -27% | 318 -7% |
| Witcher 3 ultra * (Watt) | 273.1 | 358 | 228 |
* ... smaller is better
Power Consumption Cyberpunk / Stress Test
Power Consumption external Monitor
电池寿命
| MSI Vector A18 HX A9W R9 9955HX, GeForce RTX 5070 Ti Laptop, 99 Wh | MSI Raider 18 HX A14V i9-14900HX, GeForce RTX 4080 Laptop GPU, 99.9 Wh | Asus Strix Scar 18 G835LX Ultra 9 275HX, GeForce RTX 5090 Laptop, 90 Wh | Razer Blade 18 2024 RZ09-0509 i9-14900HX, GeForce RTX 4090 Laptop GPU, 91.7 Wh | Alienware m18 R2 i9-14900HX, GeForce RTX 4090 Laptop GPU, 97 Wh | Acer Predator Helios 18 PH18-72-98MW i9-14900HX, GeForce RTX 4090 Laptop GPU, 90 Wh | |
|---|---|---|---|---|---|---|
| Battery runtime | -25% | 45% | 5% | 26% | -16% | |
| Reader / Idle (h) | 7 | 4.4 -37% | 6.6 -6% | |||
| WiFi v1.3 (h) | 3.8 | 3.3 -13% | 5.5 45% | 4.4 16% | 4.8 26% | 3.2 -16% |
| Load (h) | 1.3 | 1.2 | 1 | 1.1 | ||
| H.264 (h) | 5.8 | |||||
| Cyberpunk 2077 ultra 150cd (h) | 0.7 |
笔记本检查评级
MSI Vector A18 HX A9W
- 05/07/2025 v8
Allen Ngo
 Total Sustainability Score:
 Potential Competitors in Comparison
Image | Model / Review | Price | Weight | Height | Display |
|---|---|---|---|---|---|
1. 84.8%  | MSI Vector A18 HX A9W AMD Ryzen 9 9955HX ⎘ NVIDIA GeForce RTX 5070 Ti Laptop ⎘ 32 GB Memory | Amazon: List Price: 3200 USD | 3.5 kg | 32.05 mm | 18.00" 2560x1600 189 PPI IPS |
2. 84.7%  | MSI Raider 18 HX A14V Intel Core i9-14900HX ⎘ NVIDIA GeForce RTX 4080 Laptop GPU ⎘ 64 GB Memory, 2048 GB SSD | Amazon: 1. $4,079.25 msi Raider 18 HX AI 18” 12... 2. $74.99 330W 280W Laptop Charger Fit... 3. $3,899.00 EXCaliberPC [2025] MSI Raide... List Price: 3400 USD | 3.6 kg | 32 mm | 18.00" 3840x2400 252 PPI Mini-LED |
3. 88%  | Asus Strix Scar 18 G835LX Intel Core Ultra 9 275HX ⎘ NVIDIA GeForce RTX 5090 Laptop ⎘ 64 GB Memory, 2048 GB SSD | Amazon: List Price: 5799€ | 3.3 kg | 32 mm | 18.00" 2560x1600 168 PPI Mini-LED |
4. 90.5% v7 (old)  | Razer Blade 18 2024 RZ09-0509 Intel Core i9-14900HX ⎘ NVIDIA GeForce RTX 4090 Laptop GPU ⎘ 32 GB Memory | Amazon: List Price: 4500 USD | 3.1 kg | 21.9 mm | 18.00" 2560x1600 168 PPI Mini-LED |
5. 89.5% v7 (old) 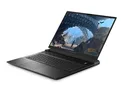 | Alienware m18 R2 Intel Core i9-14900HX ⎘ NVIDIA GeForce RTX 4090 Laptop GPU ⎘ 32 GB Memory, 2048 GB SSD | Amazon: 1. $2,599.97 Alienware M18 R2 Gaming Lapt... 2. $2,300.34 Alienware 18 Area-51 Gaming ... 3. $3,799.00 Dell Alienware 18 Area-51 Ga... List Price: 3300 USD | 4 kg | 26.7 mm | 18.00" 2560x1600 168 PPI IPS |
6. 87.1% v7 (old)  | Acer Predator Helios 18 PH18-72-98MW Intel Core i9-14900HX ⎘ NVIDIA GeForce RTX 4090 Laptop GPU ⎘ 32 GB Memory, 2048 GB SSD | Amazon: 1. $23.99 DC Power Jack Charging Port ... 2. $52.99 OSISZI 2026 330w 280W Laptop... 3. $69.00 330W 19.5V 16.92A AC Charger... | 3.3 kg | 29.5 mm | 18.00" 2560x1600 168 PPI Mini-LED |
Transparency
The selection of devices to be reviewed is made by our editorial team. The test sample was provided to the author as a loan by the manufacturer or retailer for the purpose of this review. The lender had no influence on this review, nor did the manufacturer receive a copy of this review before publication. There was no obligation to publish this review. As an independent media company, Notebookcheck is not subjected to the authority of manufacturers, retailers or publishers.
This is how Notebookcheck is testing
Every year, Notebookcheck independently reviews hundreds of laptops and smartphones using standardized procedures to ensure that all results are comparable. We have continuously developed our test methods for around 20 years and set industry standards in the process. In our test labs, high-quality measuring equipment is utilized by experienced technicians and editors. These tests involve a multi-stage validation process. Our complex rating system is based on hundreds of well-founded measurements and benchmarks, which maintains objectivity. Further information on our test methods can be found here.

