结论:功能更强大,价格更昂贵
我们对 2025 年版 Alienware 16X Aurora 的主要抱怨之一是缺少 OLED、HDR 支持和GeForce RTX 5070 Ti 选项。一年后的今天,2026 款 16X Aurora 可以配置所有这些缺失的功能以及全新的 酷睿至尊 9 290HX Plus作为比现有 Core Ultra 9 275HX 更高级的 CPU 选项。
首先,新 CPU 带来的好处很少,尤其是对游戏玩家而言,因此可以说这是选择 2026 16X Aurora 而不是 2025 型号的最差理由。相反,新的 RTX 5070 Ti 才是主要卖点,因为它比去年的 RTX 5070 运行速度更快。
同时,雾面 OLED 面板在该领域是独一无二的,因为大多数其他面板都是亮面的。图像质量比已经很棒的基础 IPS 选件更好,但哑光覆盖会带来一些颗粒感,以减少眩光。亮度也只是 OLED 的平均水平;竞争产品 联想Legion Pro 5相比之下,联想 Pro 5 采用的是亮面 OLED 面板,亮度更高。
在其他方面,用户体验与去年相同。重量仍然比大多数竞争对手重,但不错的可扩展性和非常坚固的设计部分抵消了这一劣势。也许更新机型最令人讨厌的一点是,新的 RTX 5070 Ti 选项与酷睿至尊 9 290HX Plus 绑定,尽管该 CPU 与现有的酷睿至尊 9 275HX 相比几乎没有增加任何游戏体验。如今笔记本电脑的价格如此之高,如果能有更多的配置自由度,就能让许多人更轻松地购买 Alienware。
Pros
Cons
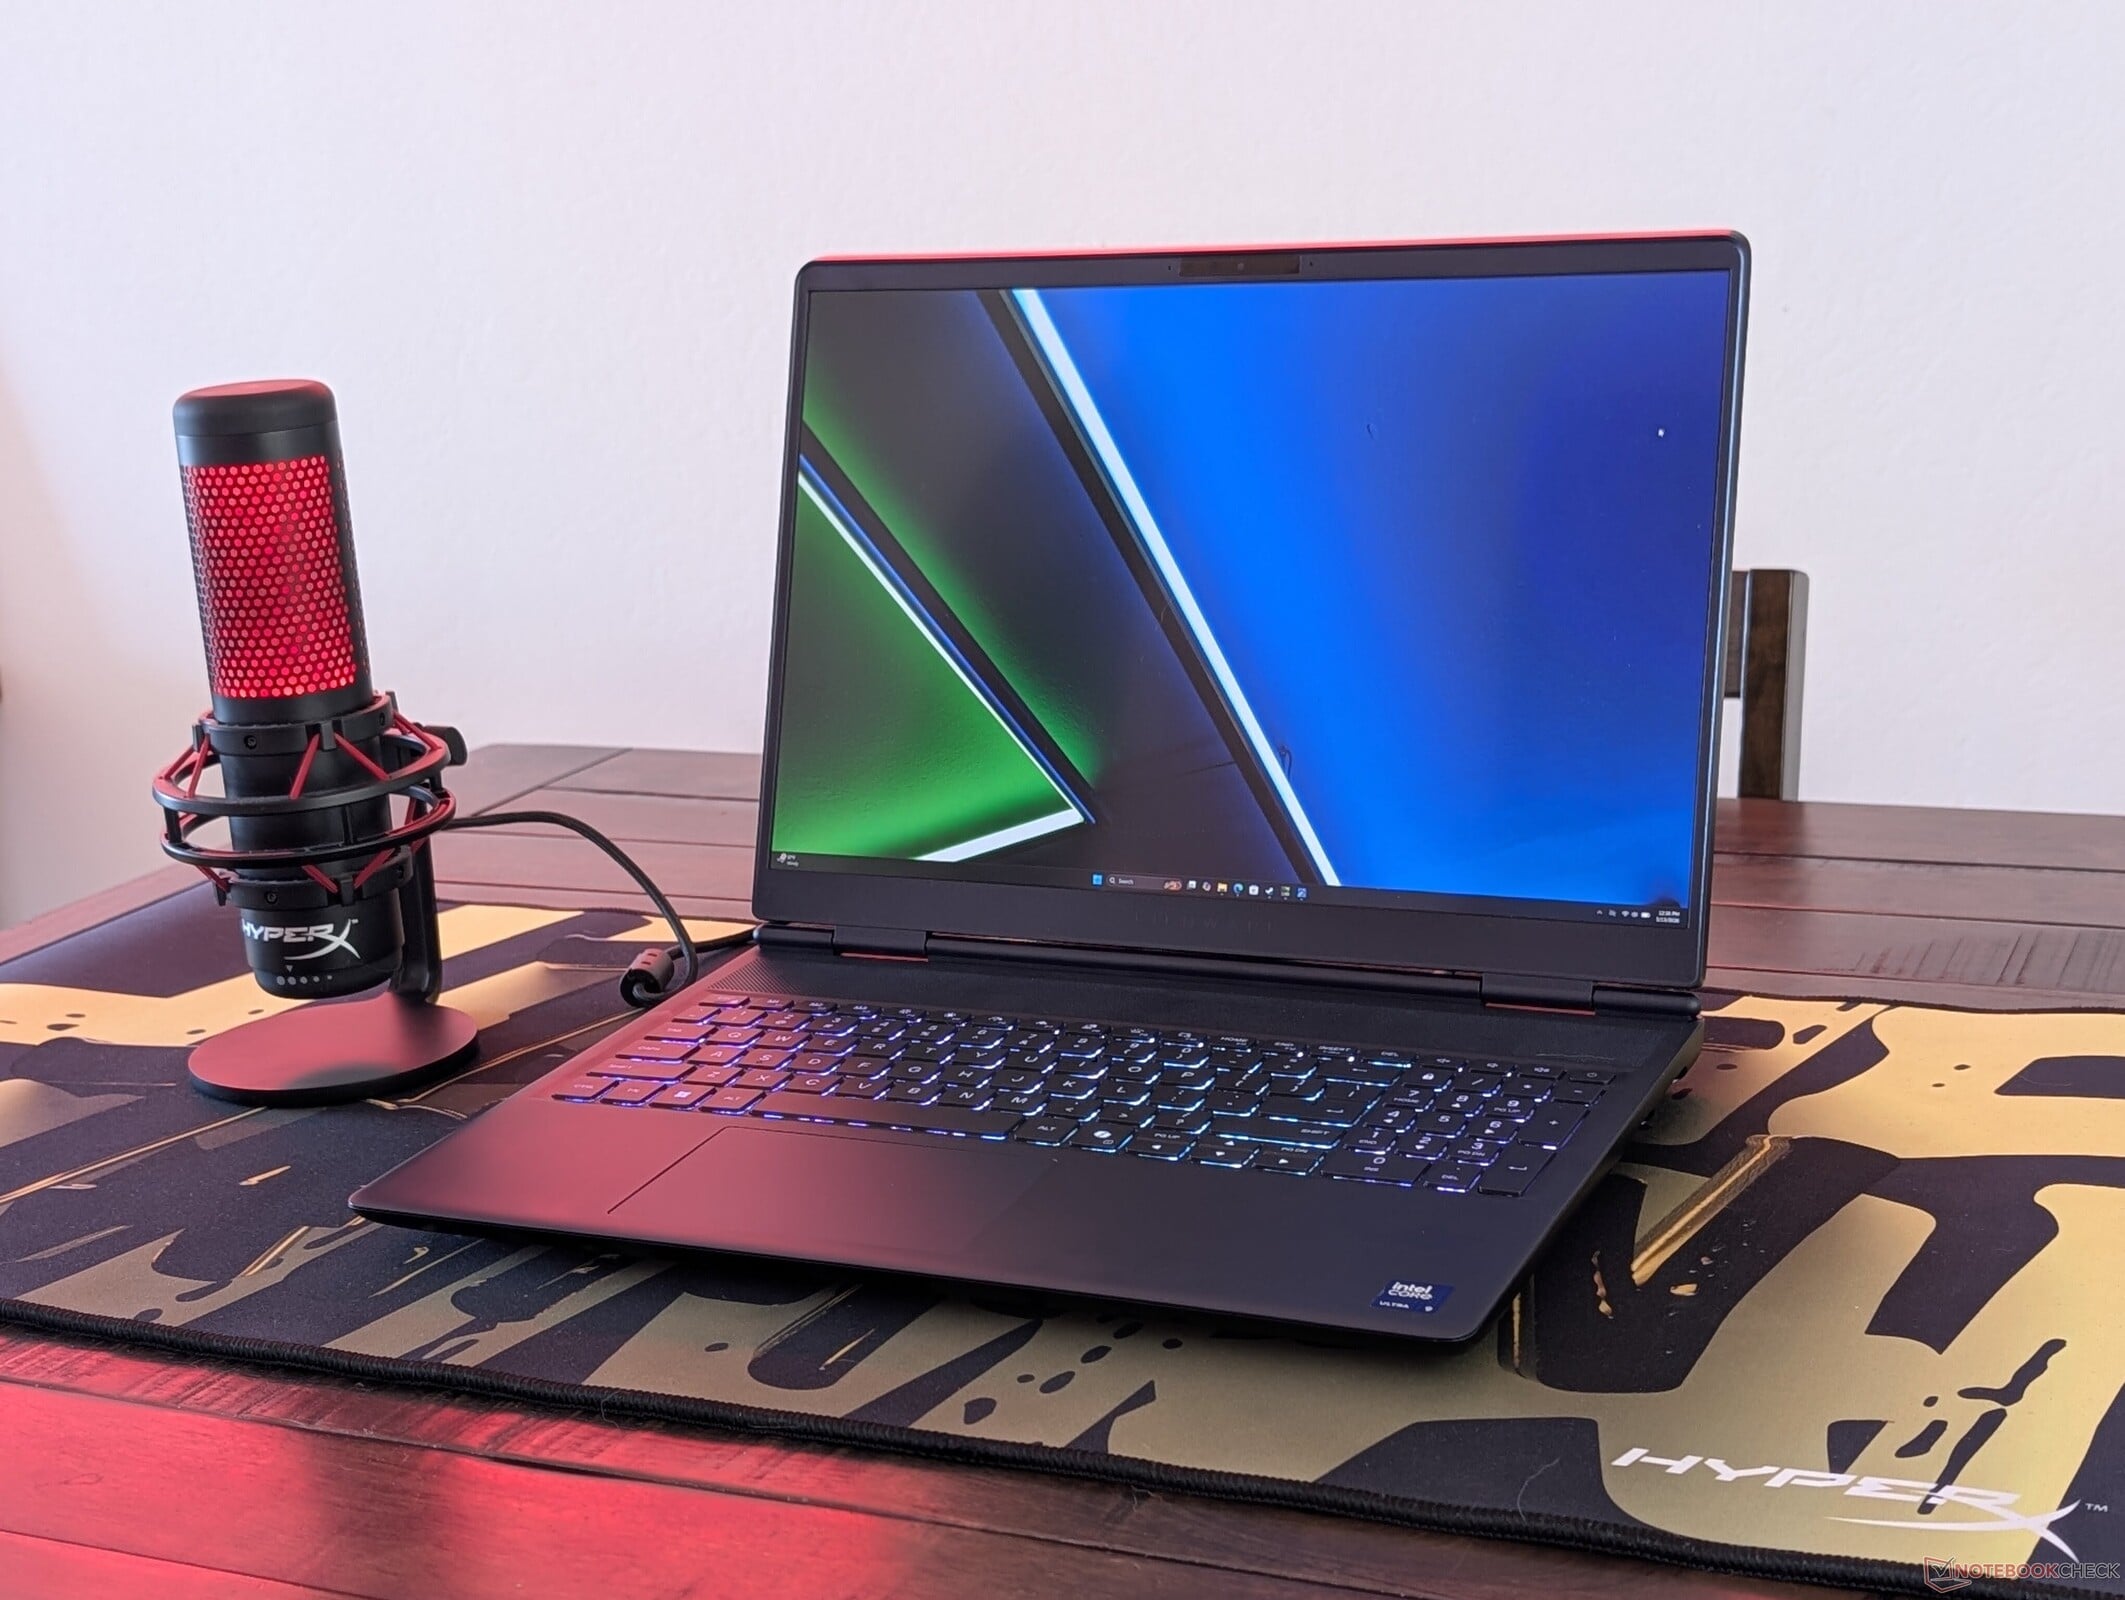
Alienware 16X Aurora 今年又推出了新的 CPU、GPU 和显示器选件,以补充 2025 型号的现有选件。该机箱在外观上与 2025 机型完全相同,更多详情可参见我们的 现有评测.
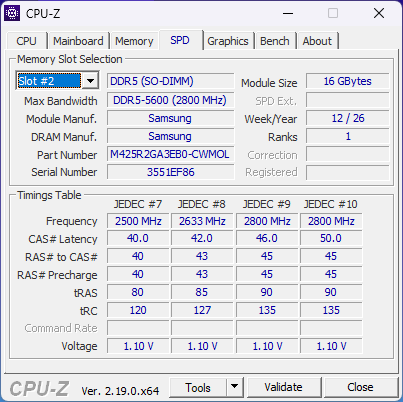
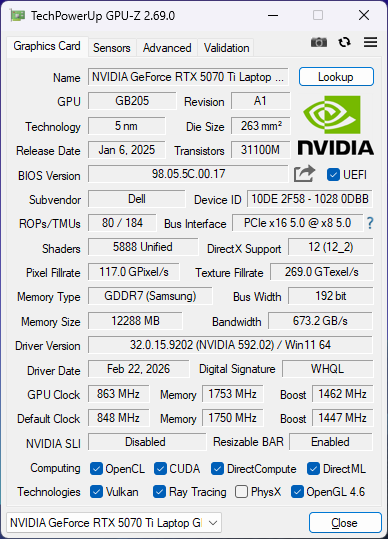
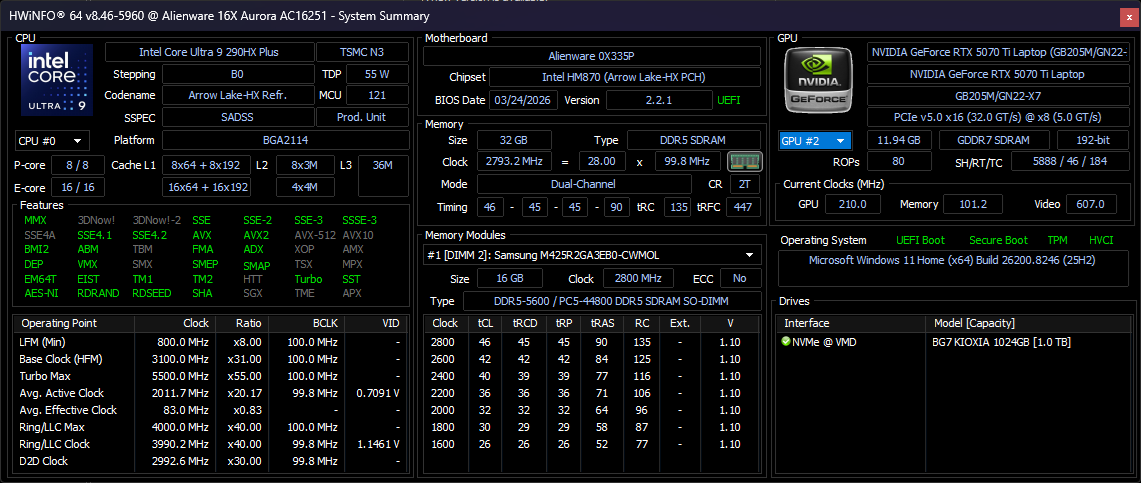
我们的测试机是最高配置,配备了箭湖酷睿 9 290HX Plus、GeForce RTX 5070 Ti 和 1600p OLED 显示屏,售价约为 3000 美元。此前,16X 极光仅限于 Core Ultra 9 275HX、RTX 5070 和 1600p IPS 显示屏。
该领域的竞争对手包括其他中高档 16 英寸游戏笔记本电脑,如 华硕 ROG Zephyrus G16, 宏碁掠夺者 Helios Neo或 微星 Vector 16 HX.
更多 Alienware 评论:
规格
案例

连接性


交流
网络摄像头


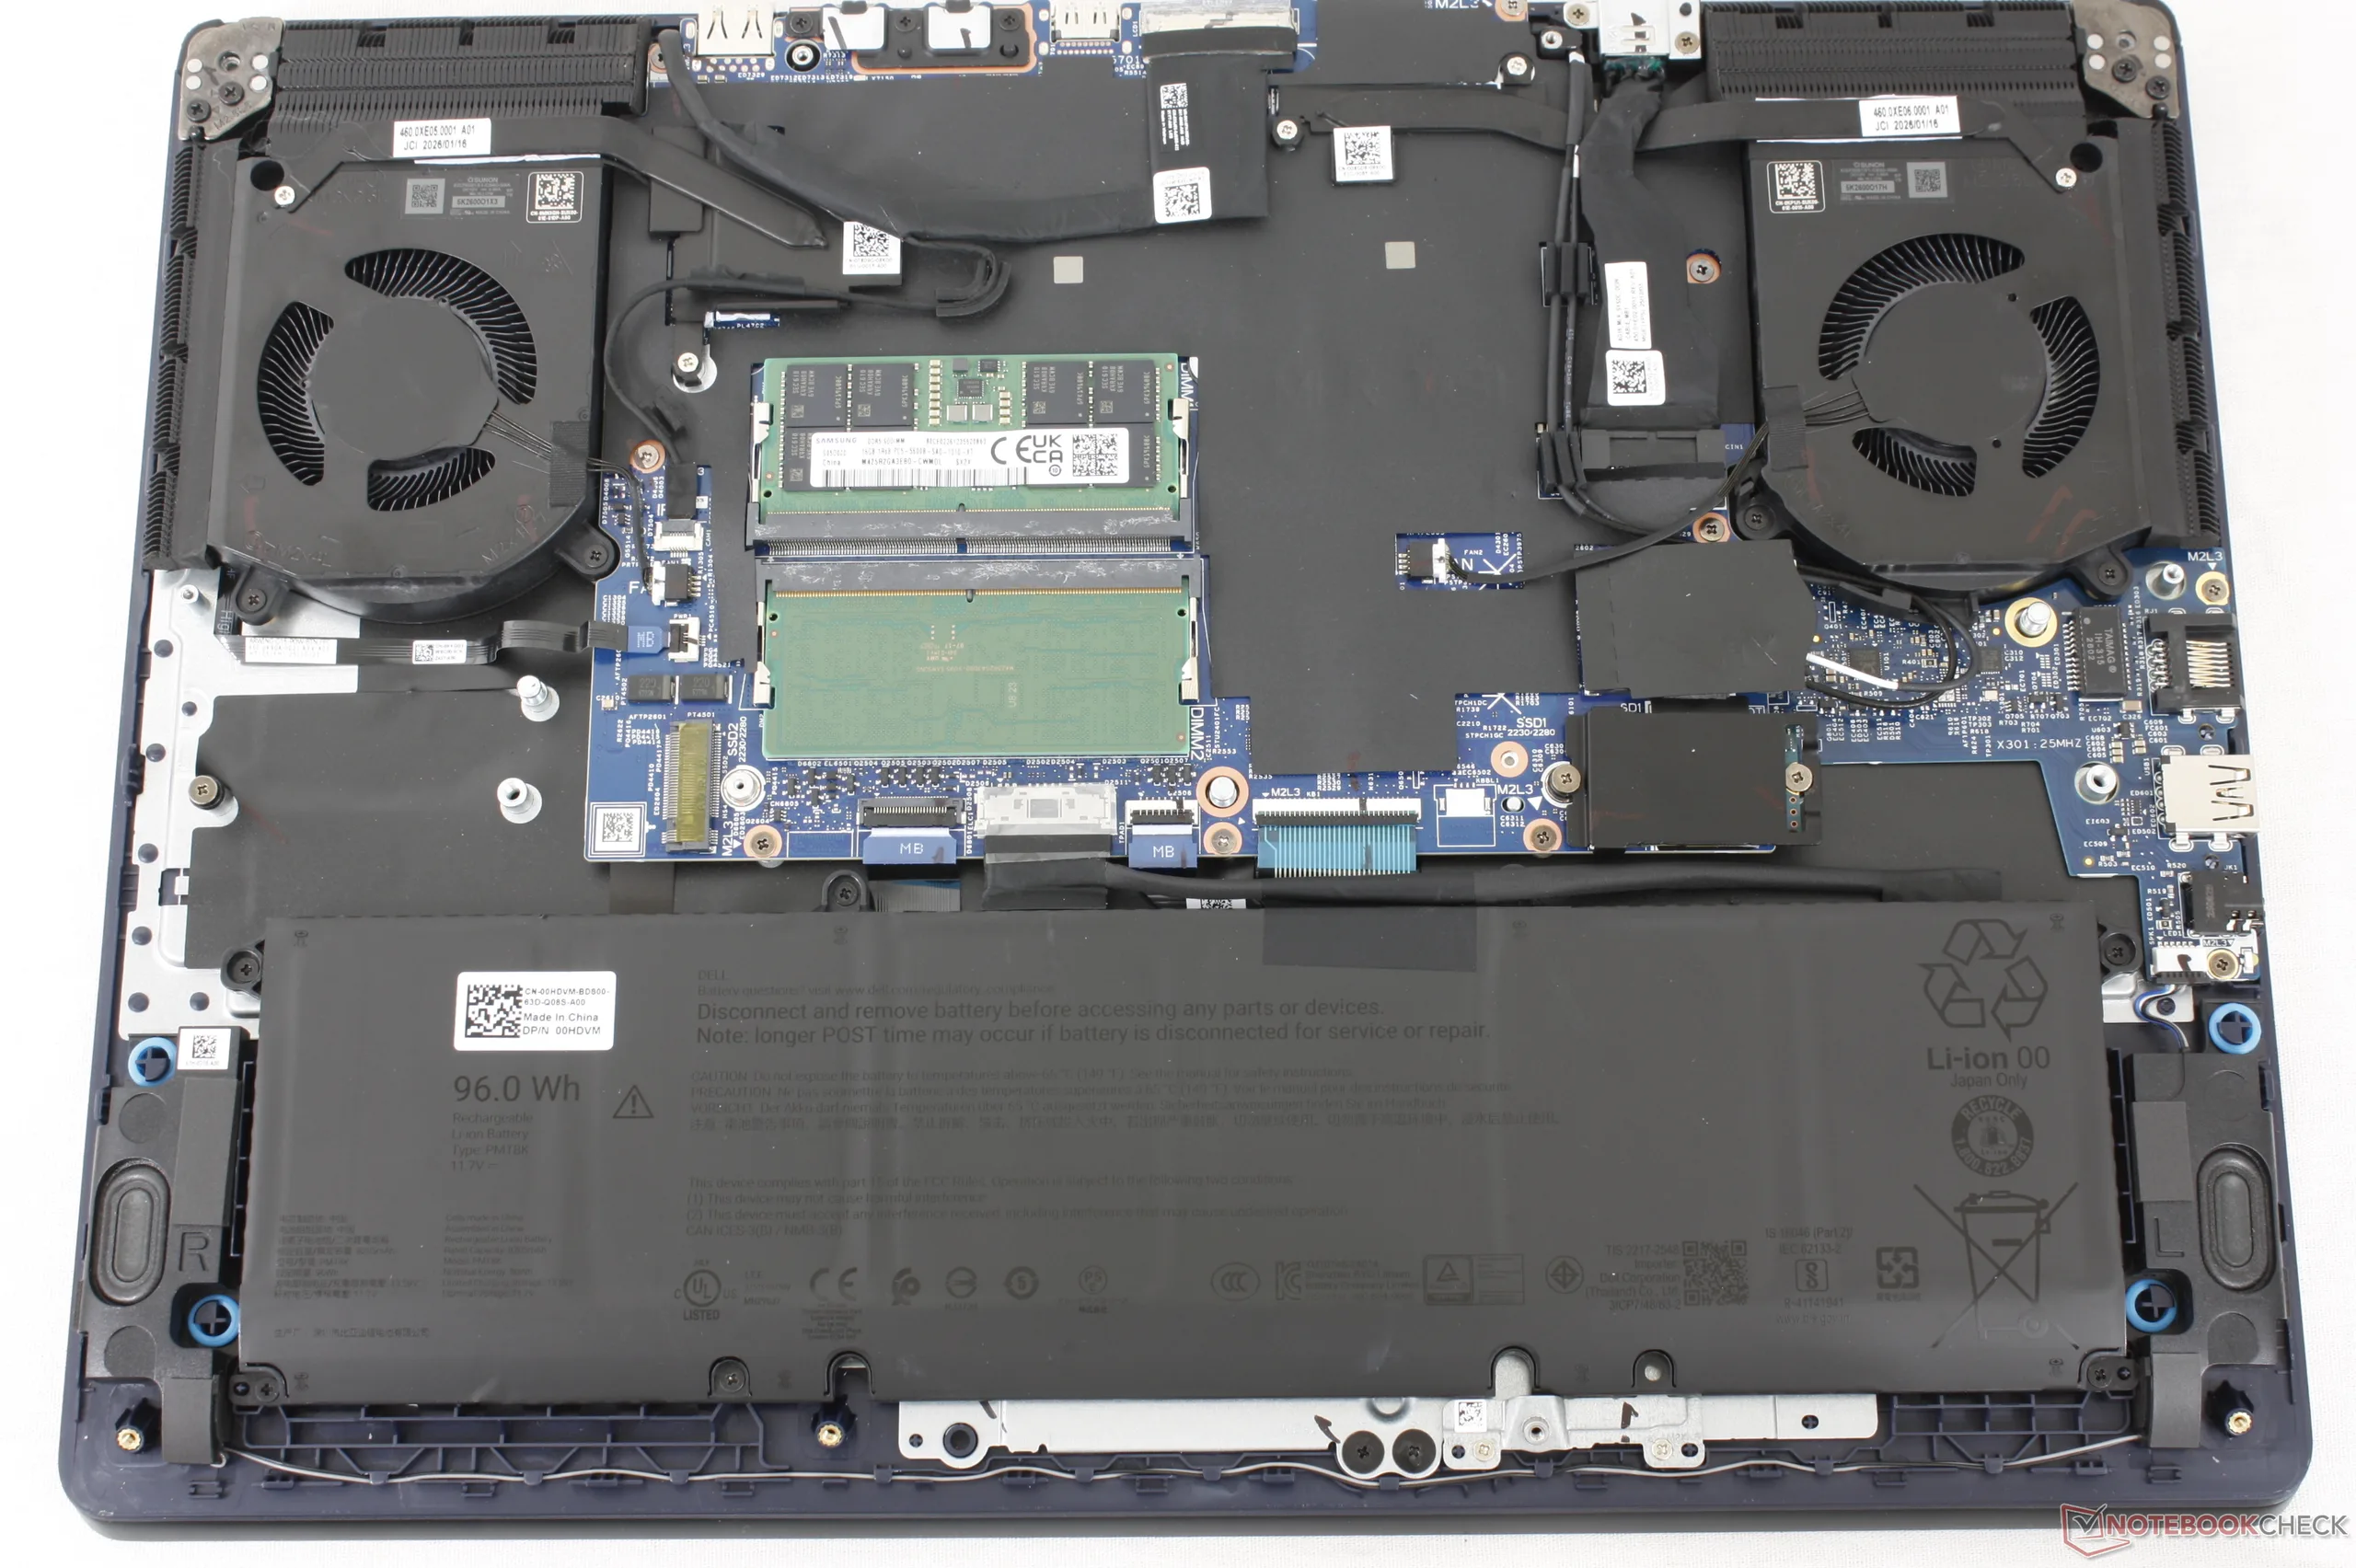
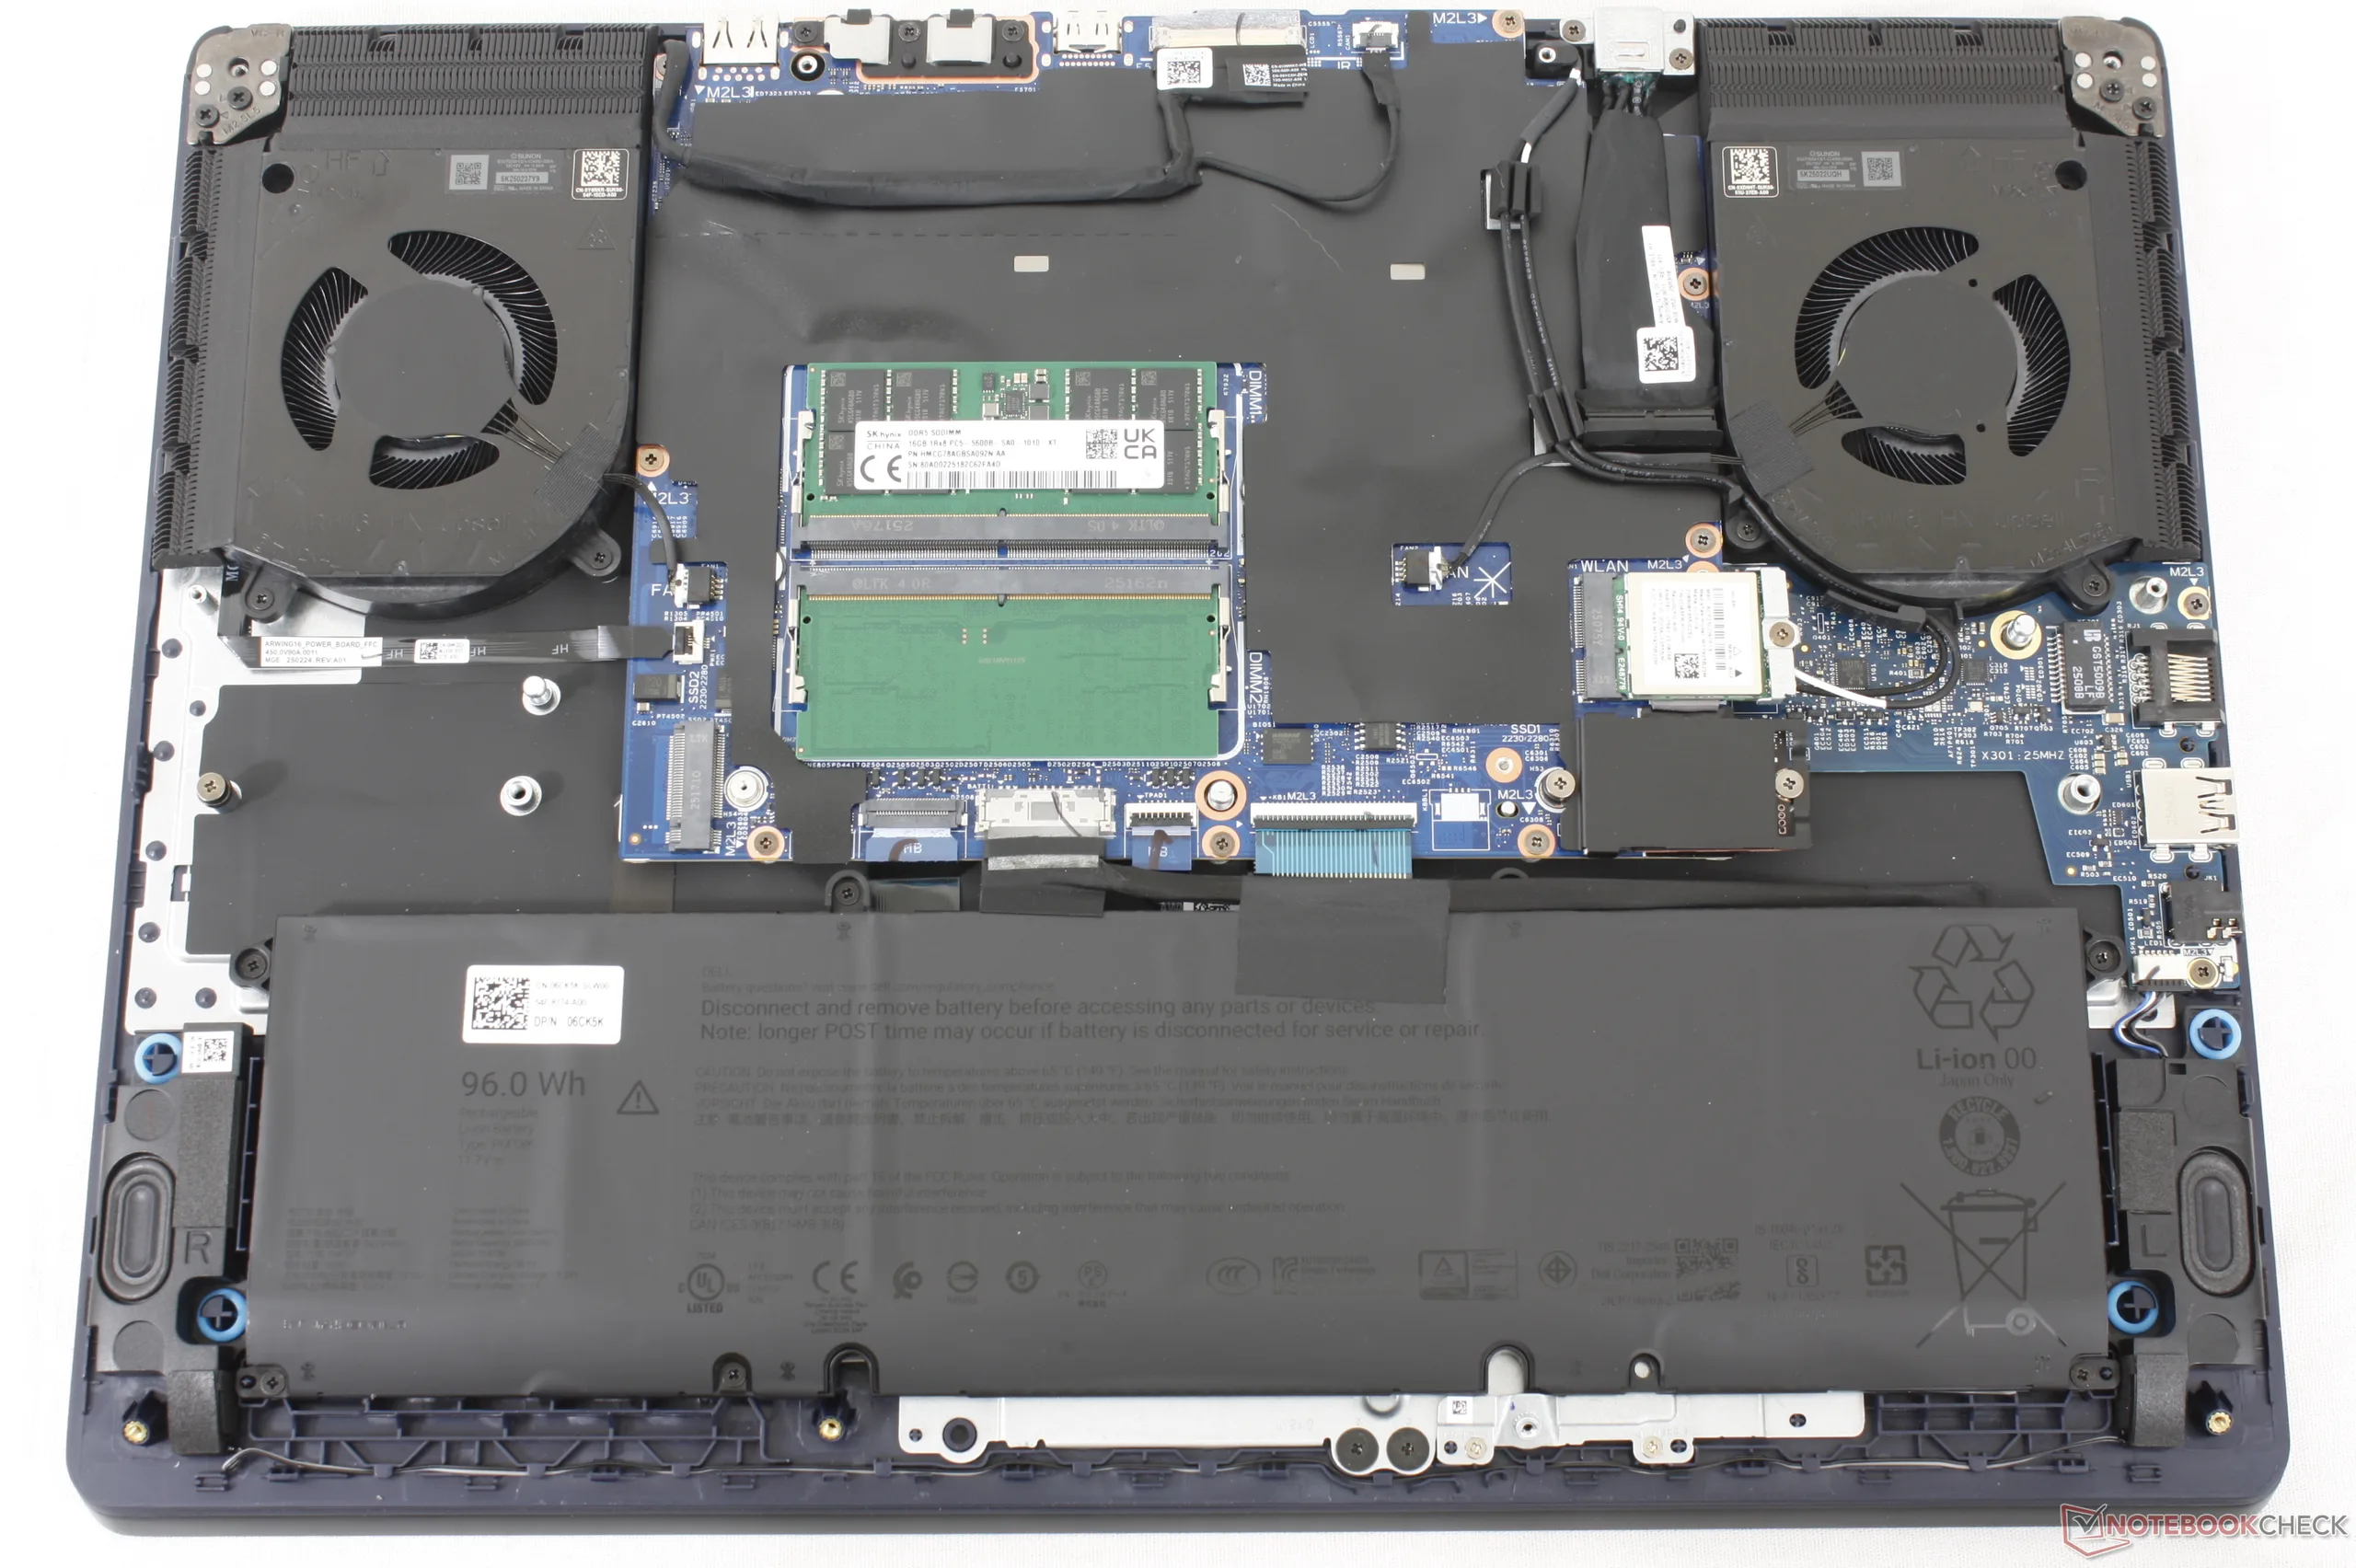
维护
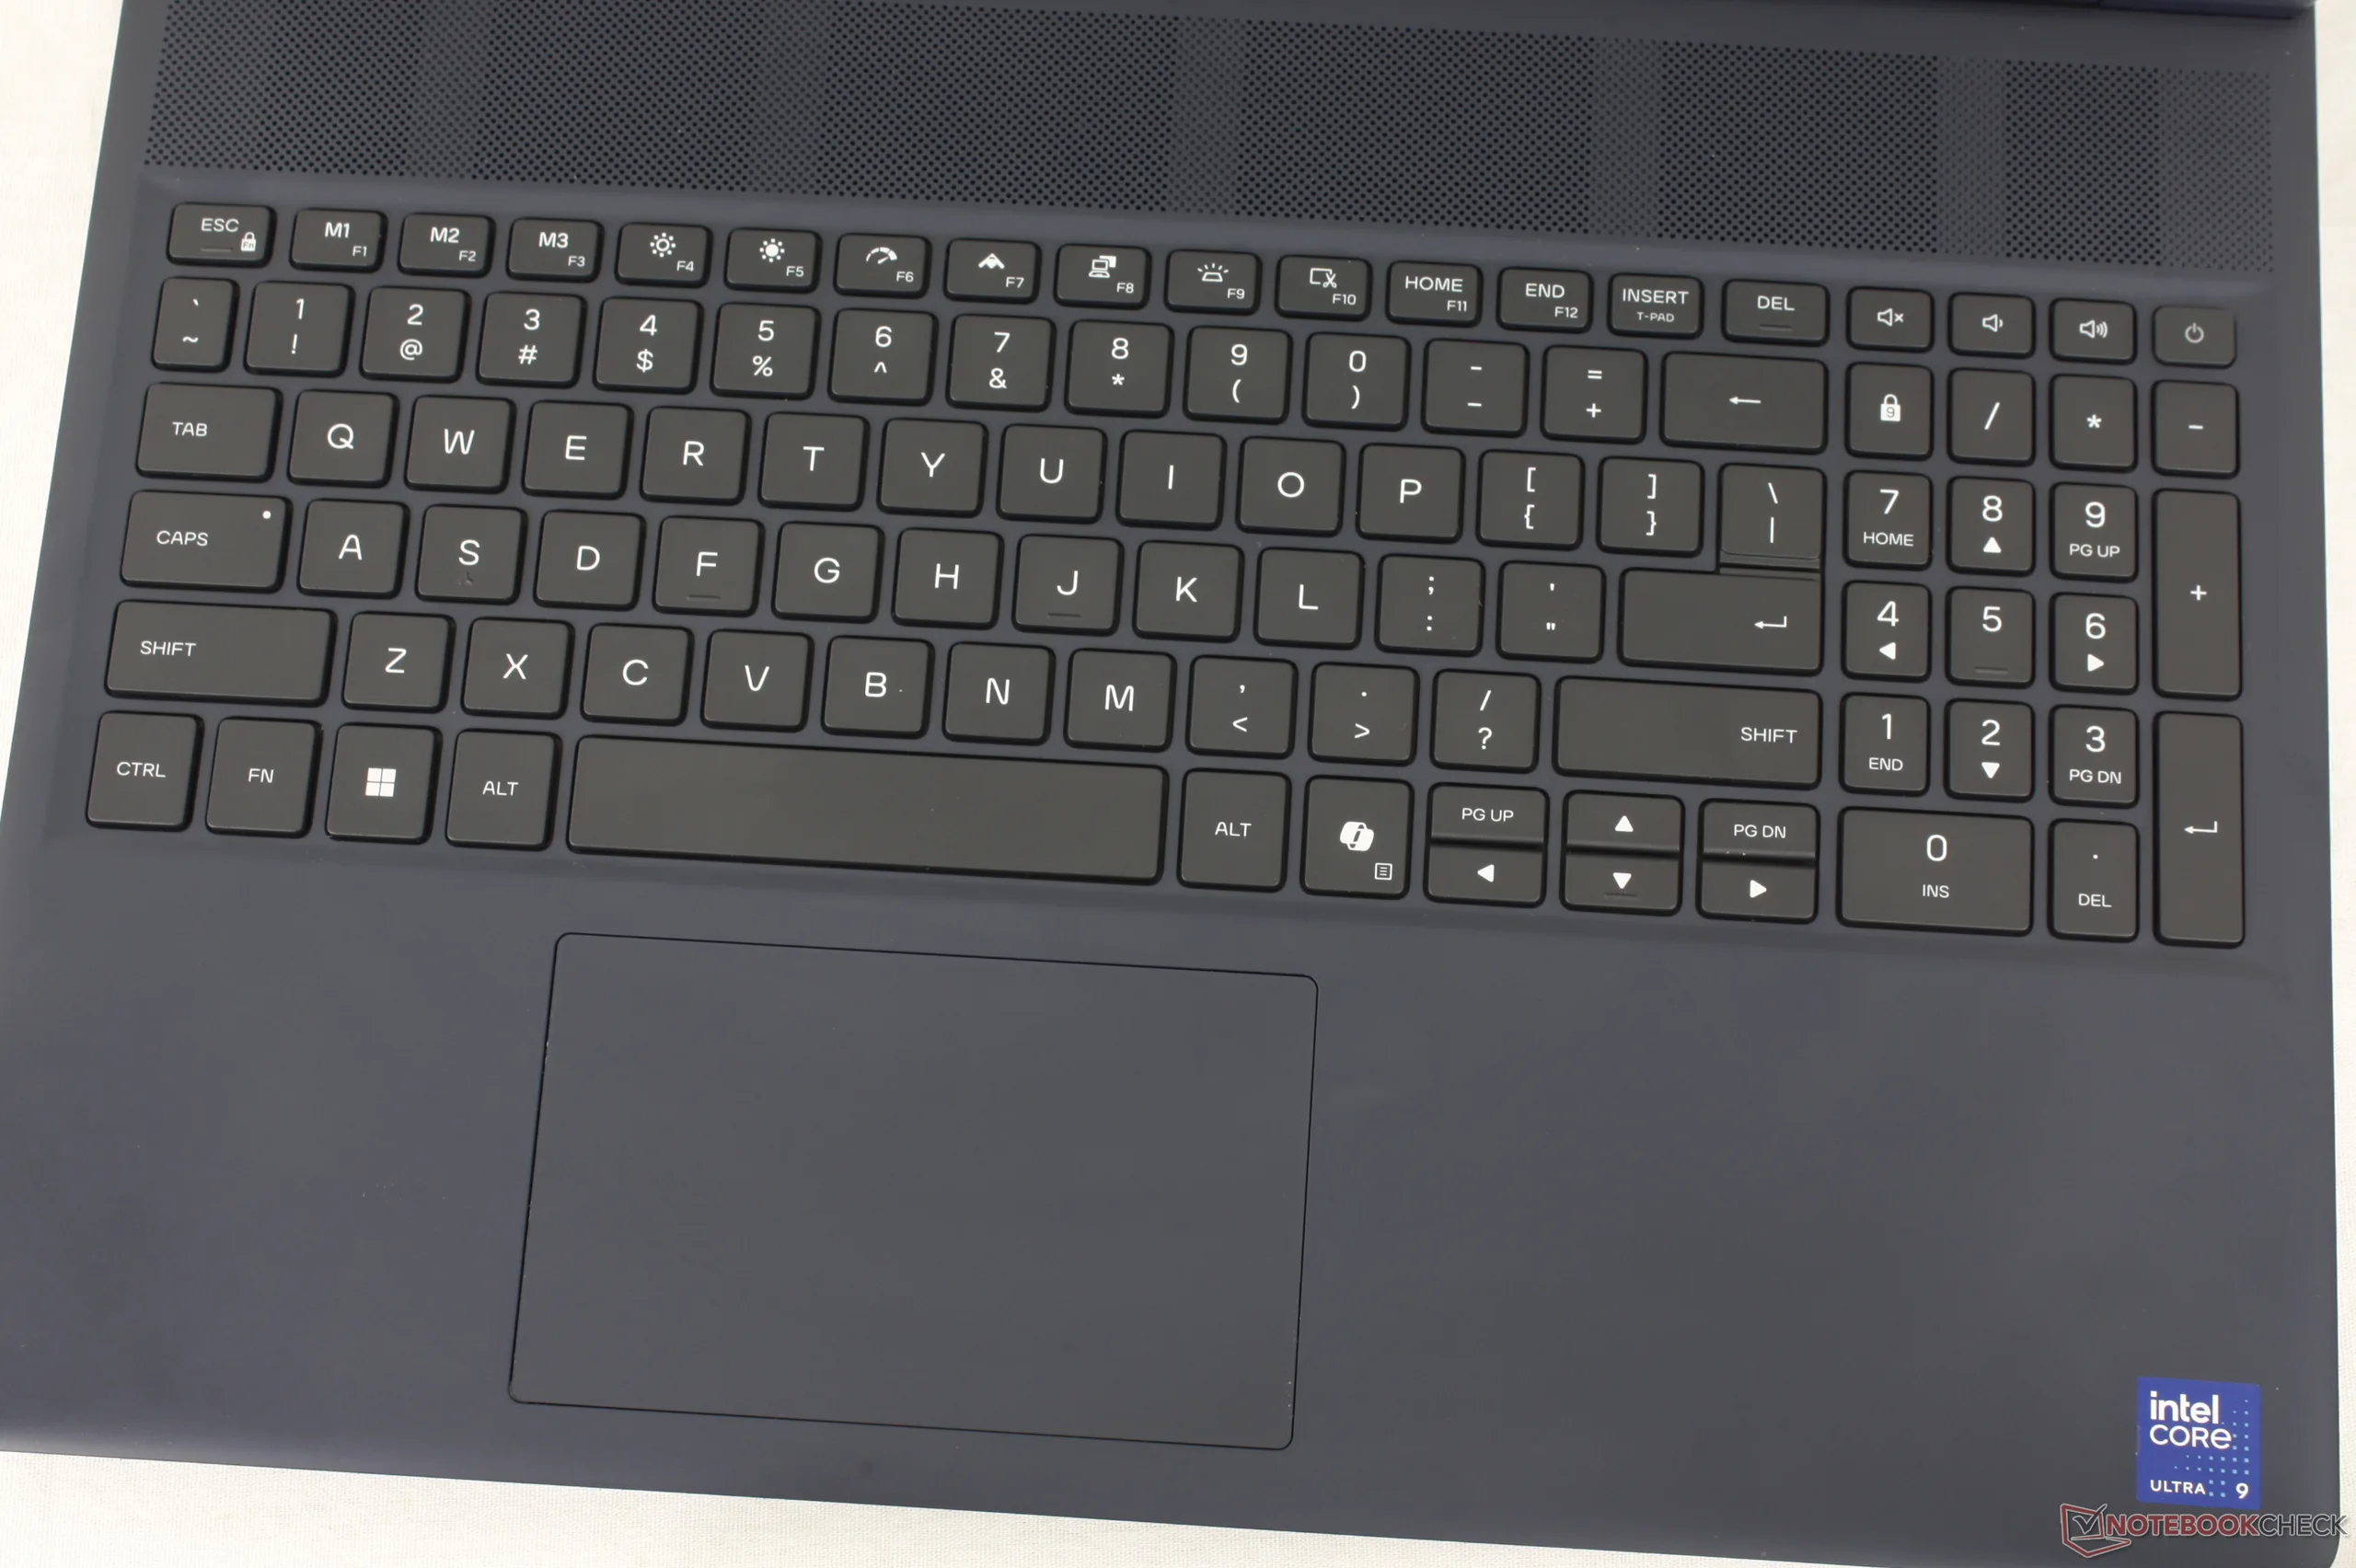
输入设备
显示屏

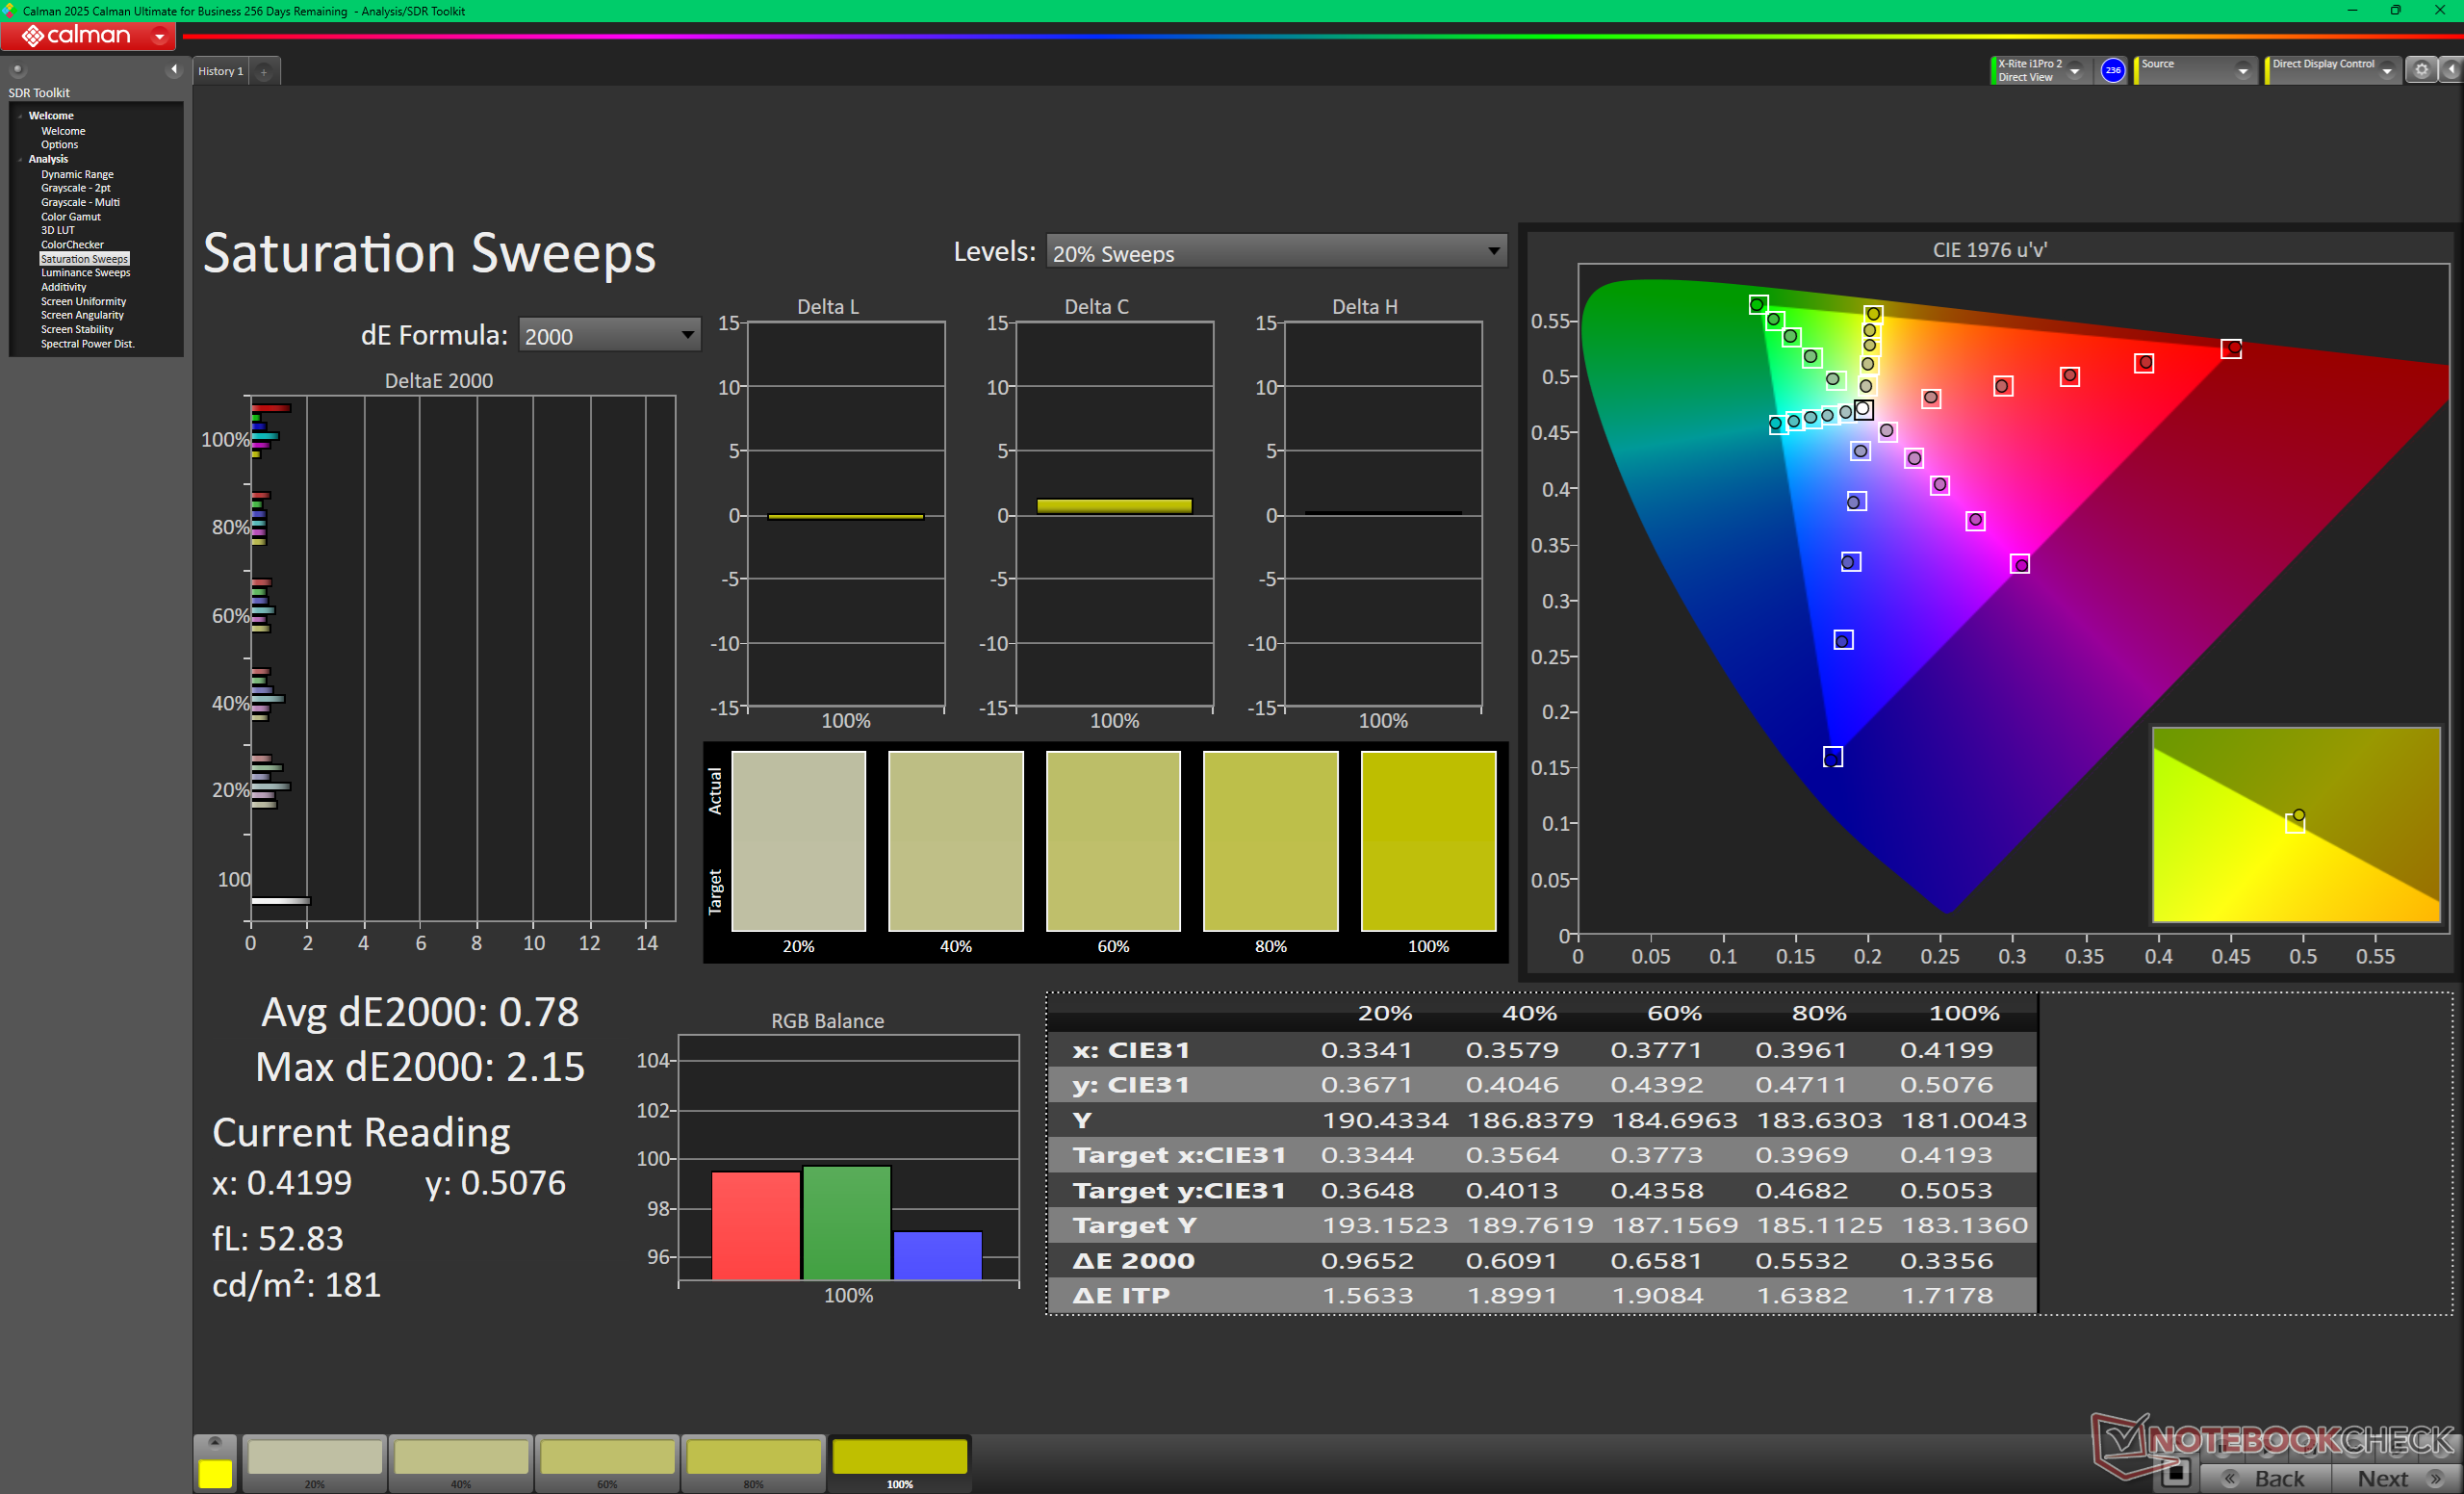
Aurora 16X 系列今年新推出了雾面 OLED 面板,它与现有的 IPS 面板一样,具有 240 Hz 原生刷新率、2560 x 1600 分辨率和 G-Sync 支持,同时还具有 OLED 的所有优点,包括更快的响应时间、更深的黑阶和适当的 HDR 支持。
OLED 面板的一个显著缺点是,在 SDR 模式下,它比 IPS 面板暗淡约 100 尼特,如下表所示。在 SDR 模式下,最大亮度可达 390 尼特;在 HDR 模式下,最大亮度可达 621 尼特,与制造商宣传的 620 尼特不相上下。
遗憾的是,亚光 OLED 面板仍然表现出与去年 IPS 面板类似的颗粒感。虽然不至于让人特别分心,但肯定不如新款 XPS 16.
| |||||||||||||||||||||||||
Brightness Distribution: 98 %
Center on Battery: 380.5 cd/m²
Contrast: ∞:1 (Black: 0 cd/m²)
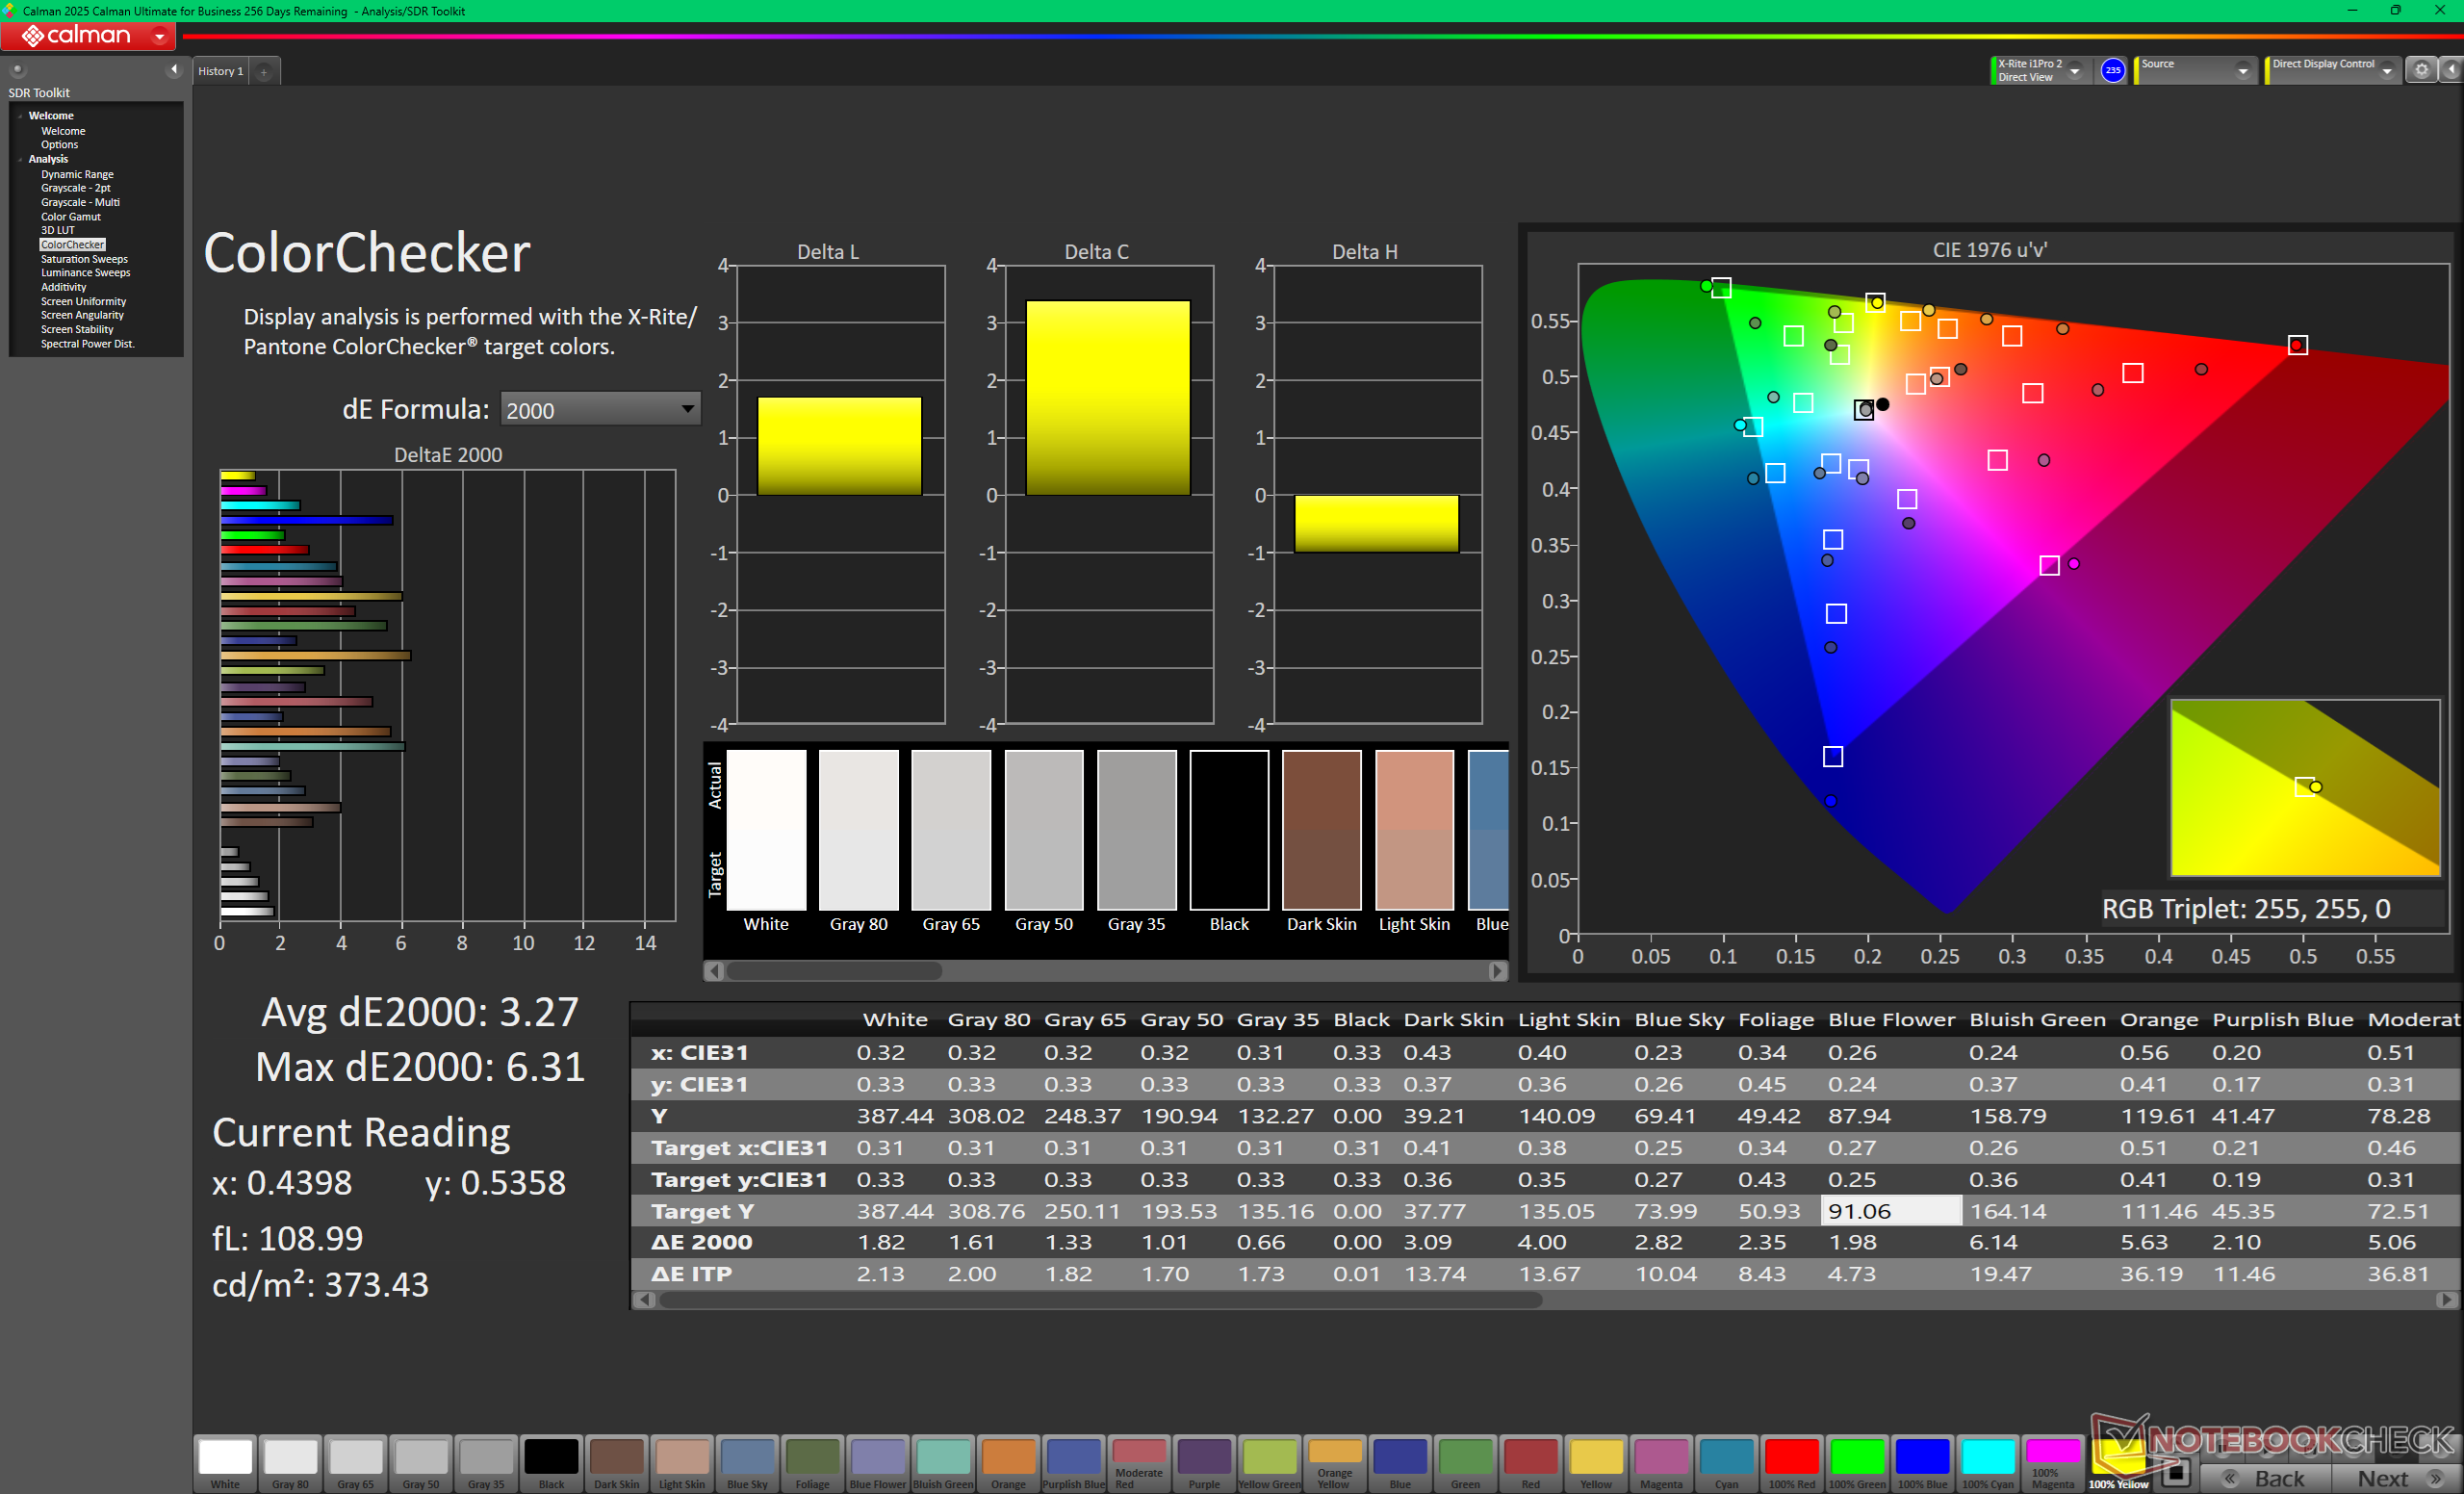
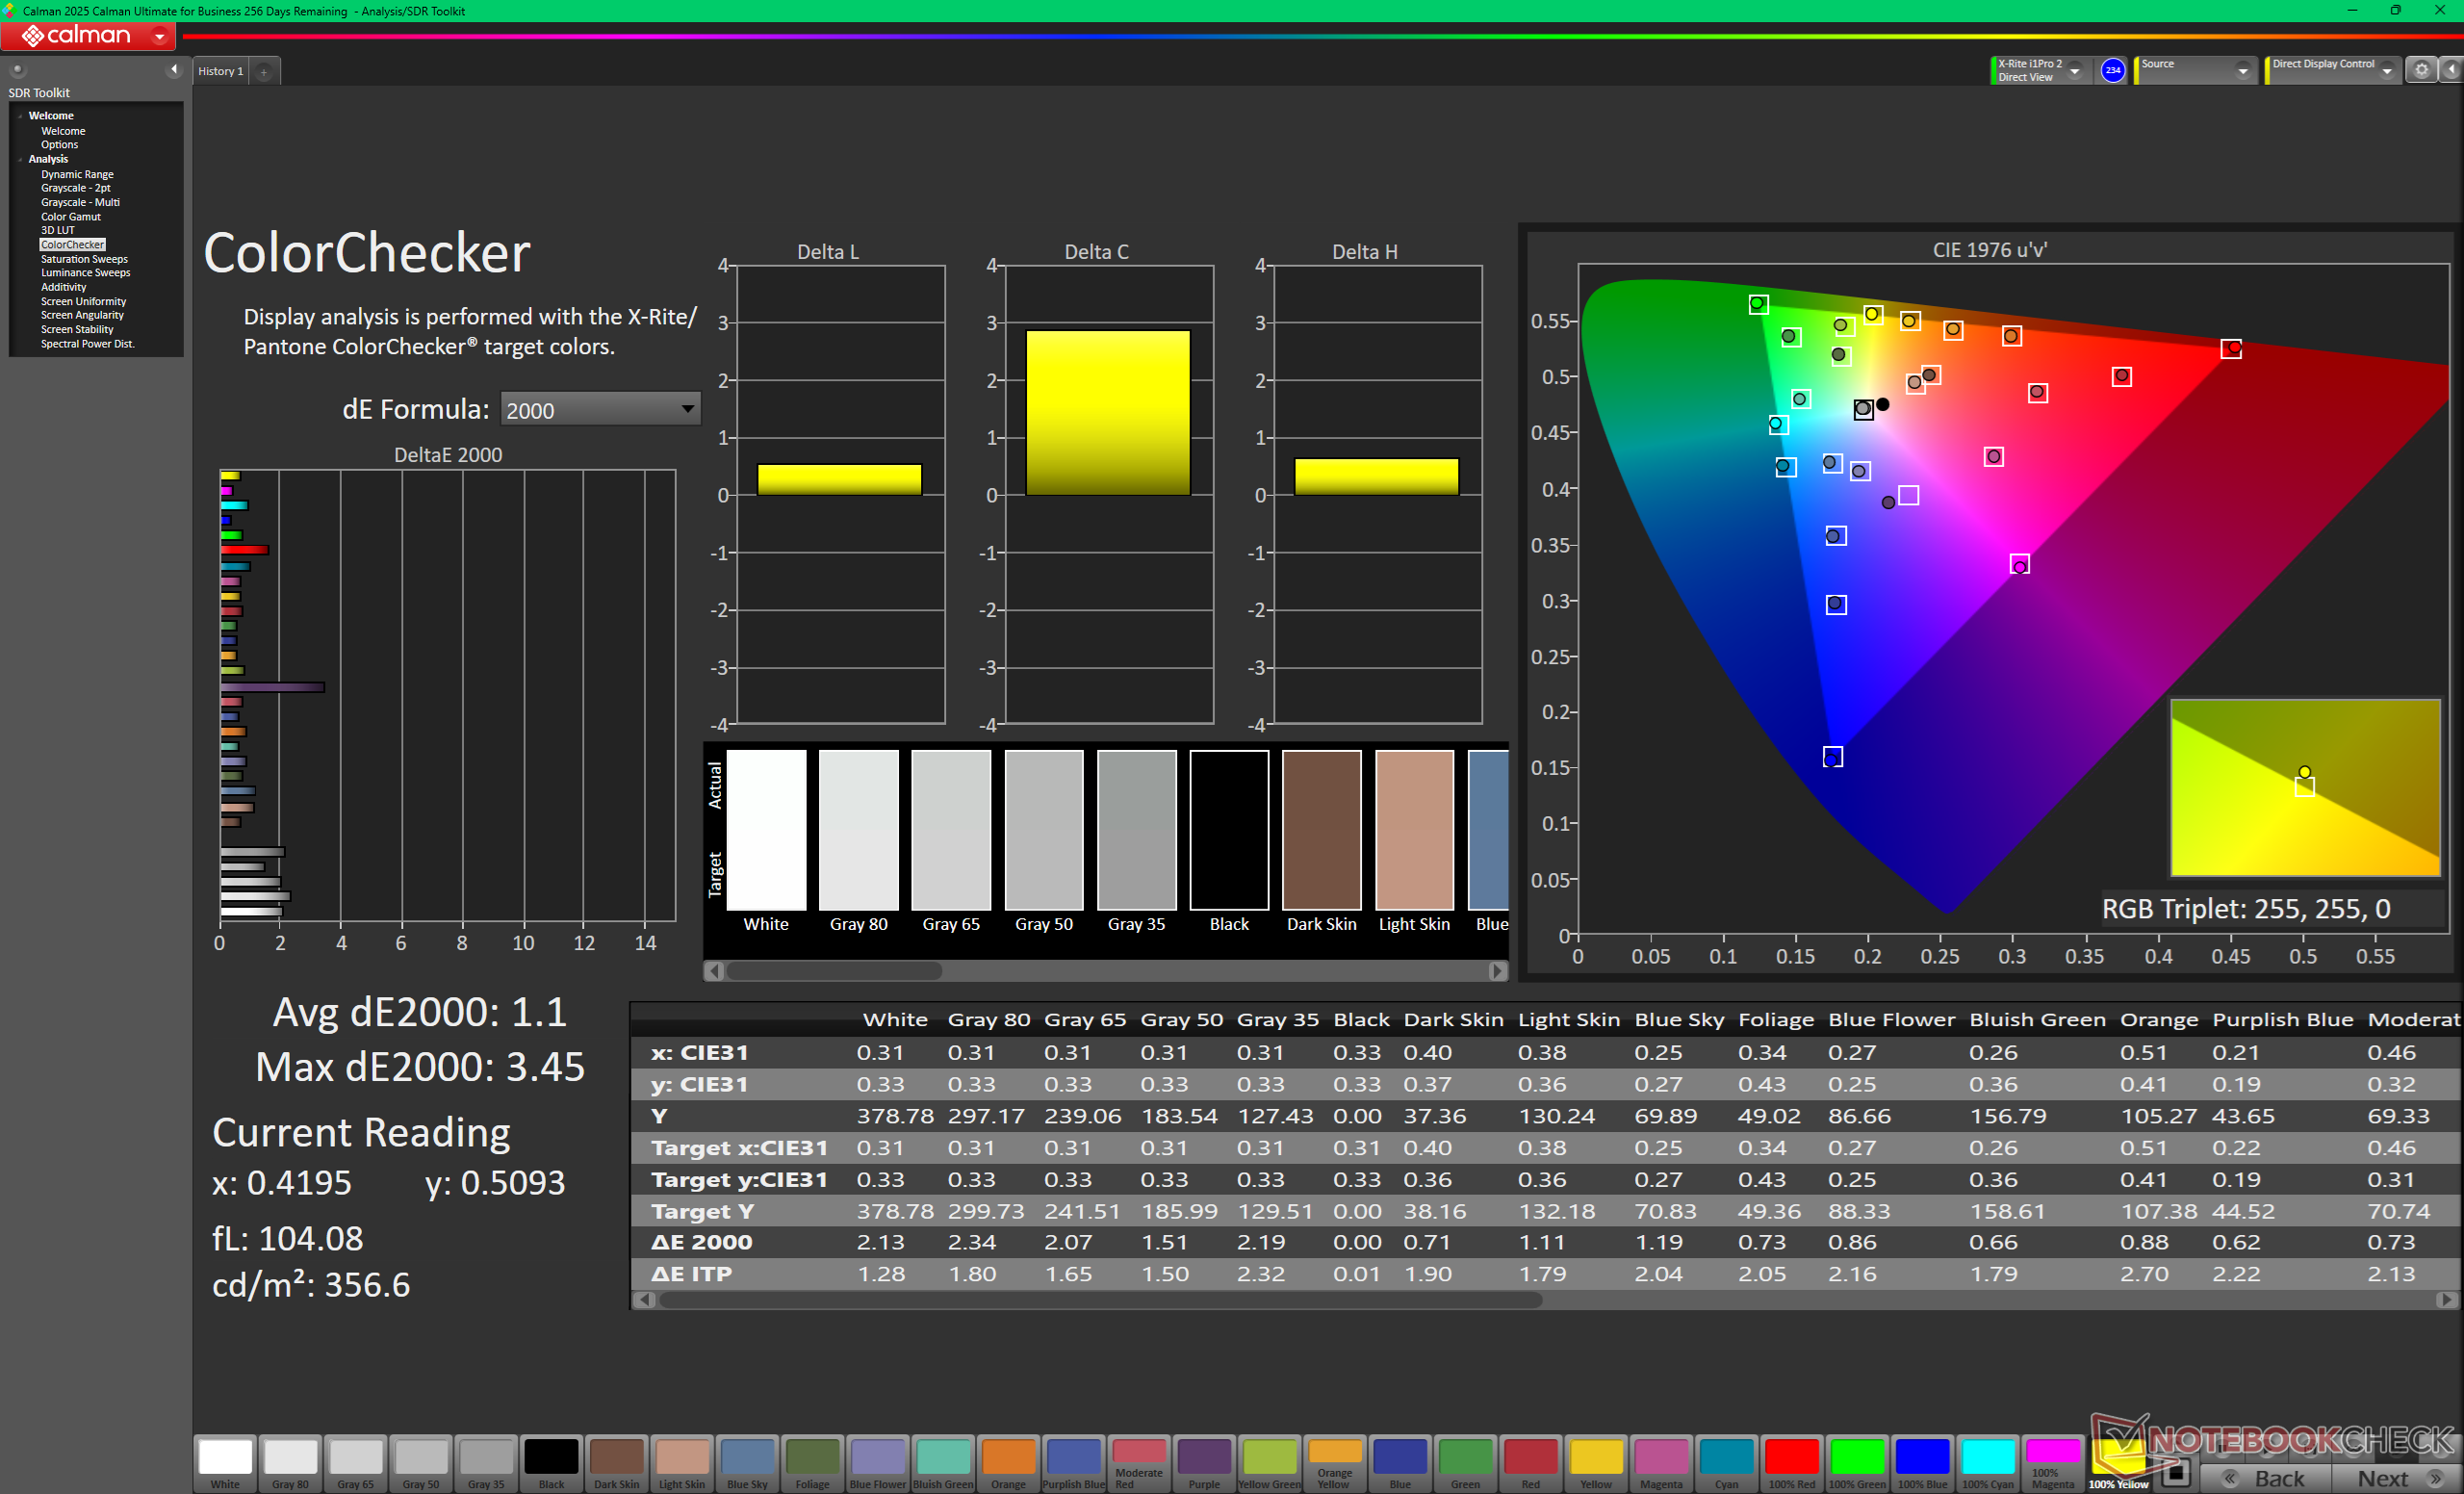
ΔE ColorChecker Calman: 3.27 | ∀{0.5-29.43 Ø4.73}
calibrated: 1.1
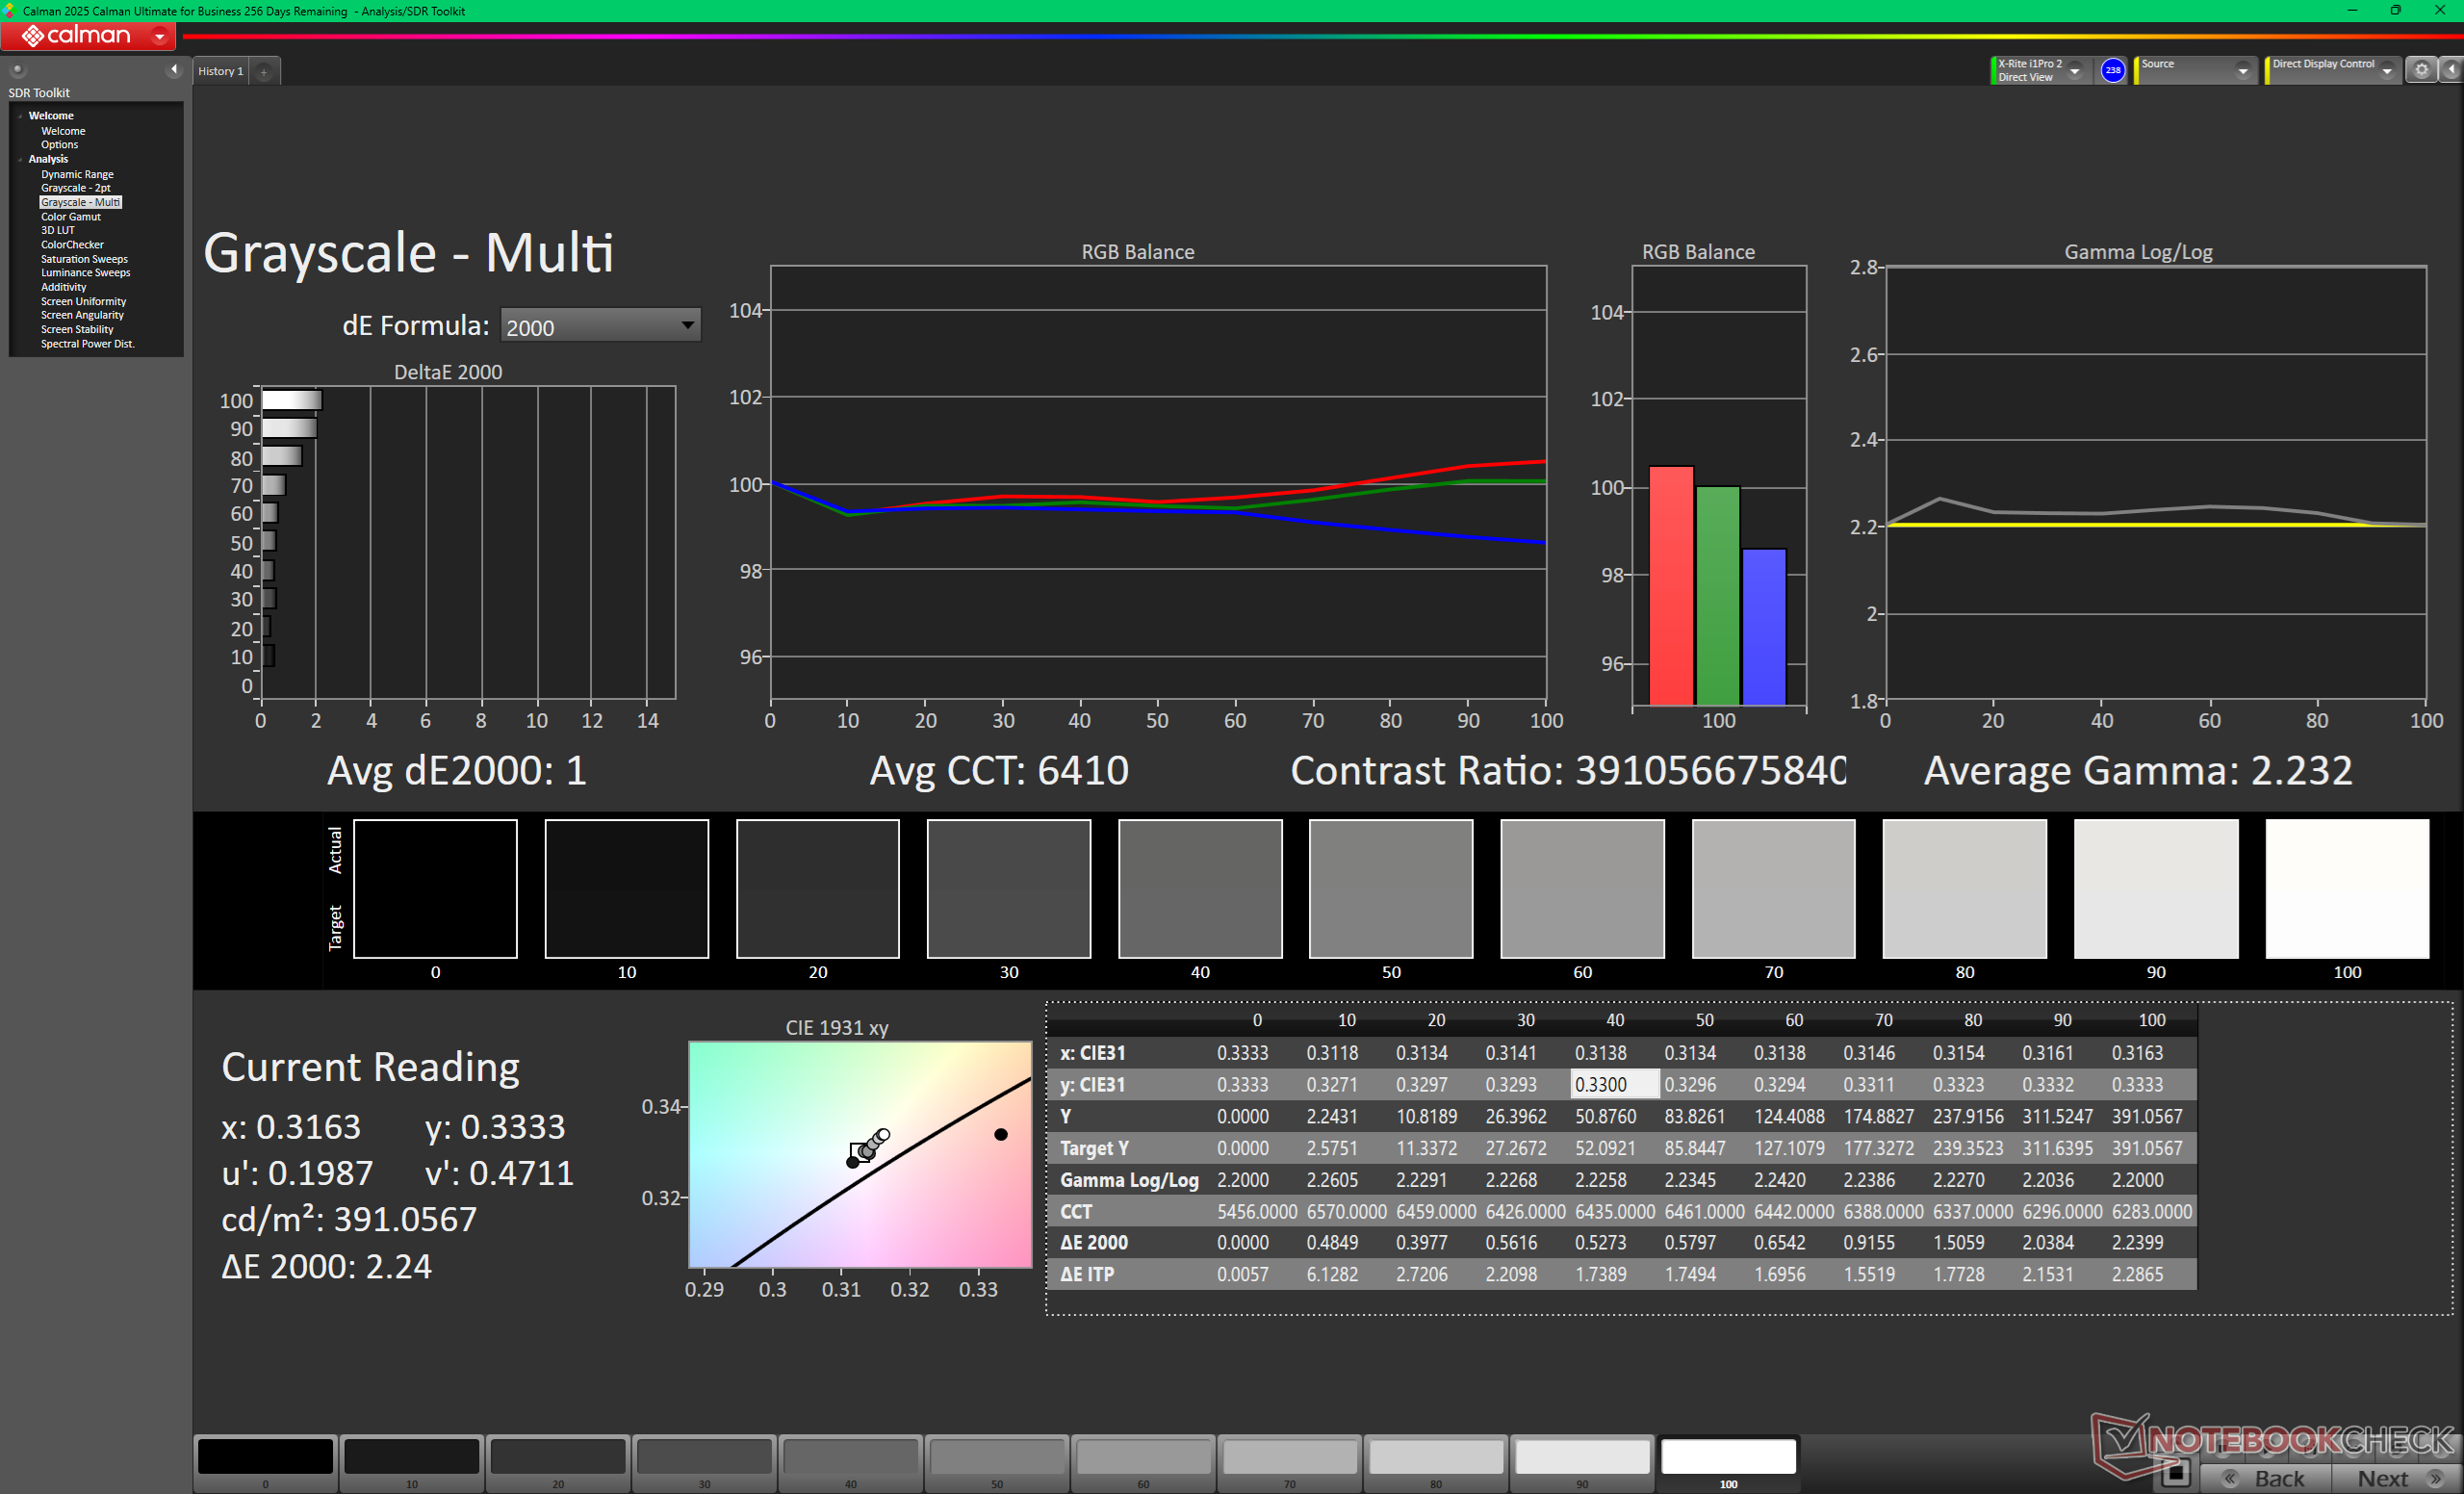
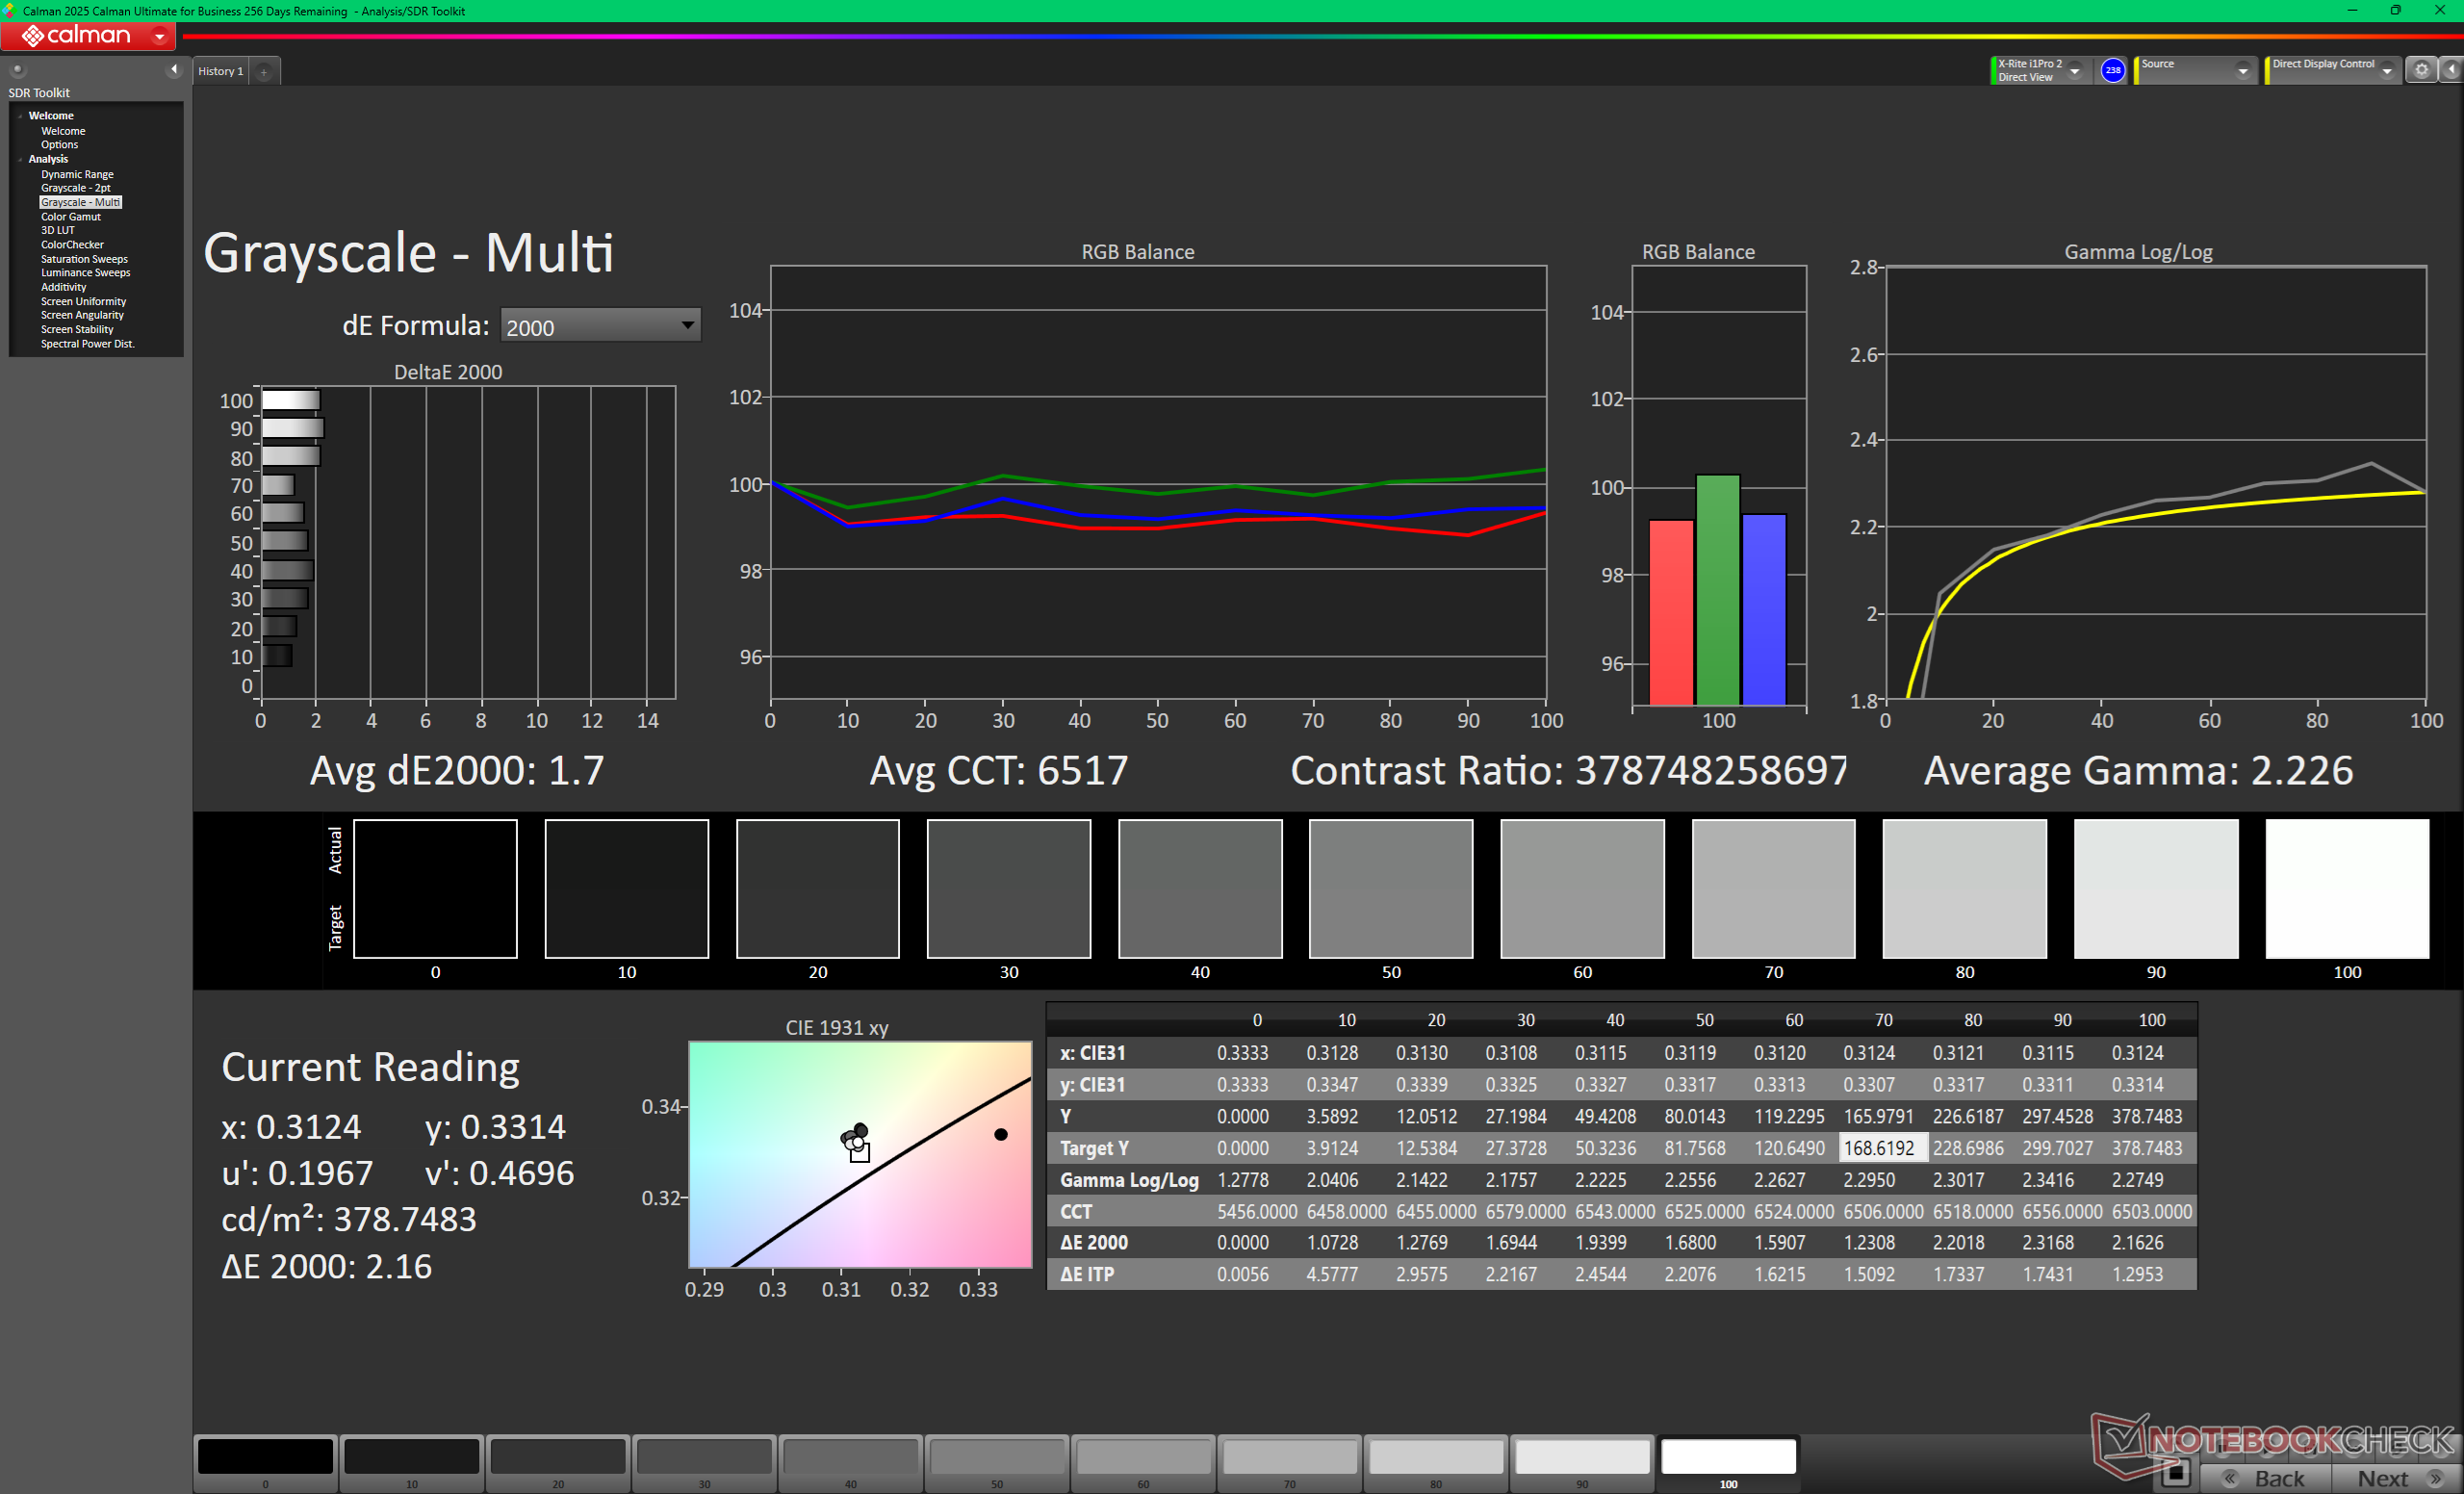
ΔE Greyscale Calman: 1 | ∀{0.09-98 Ø4.97}
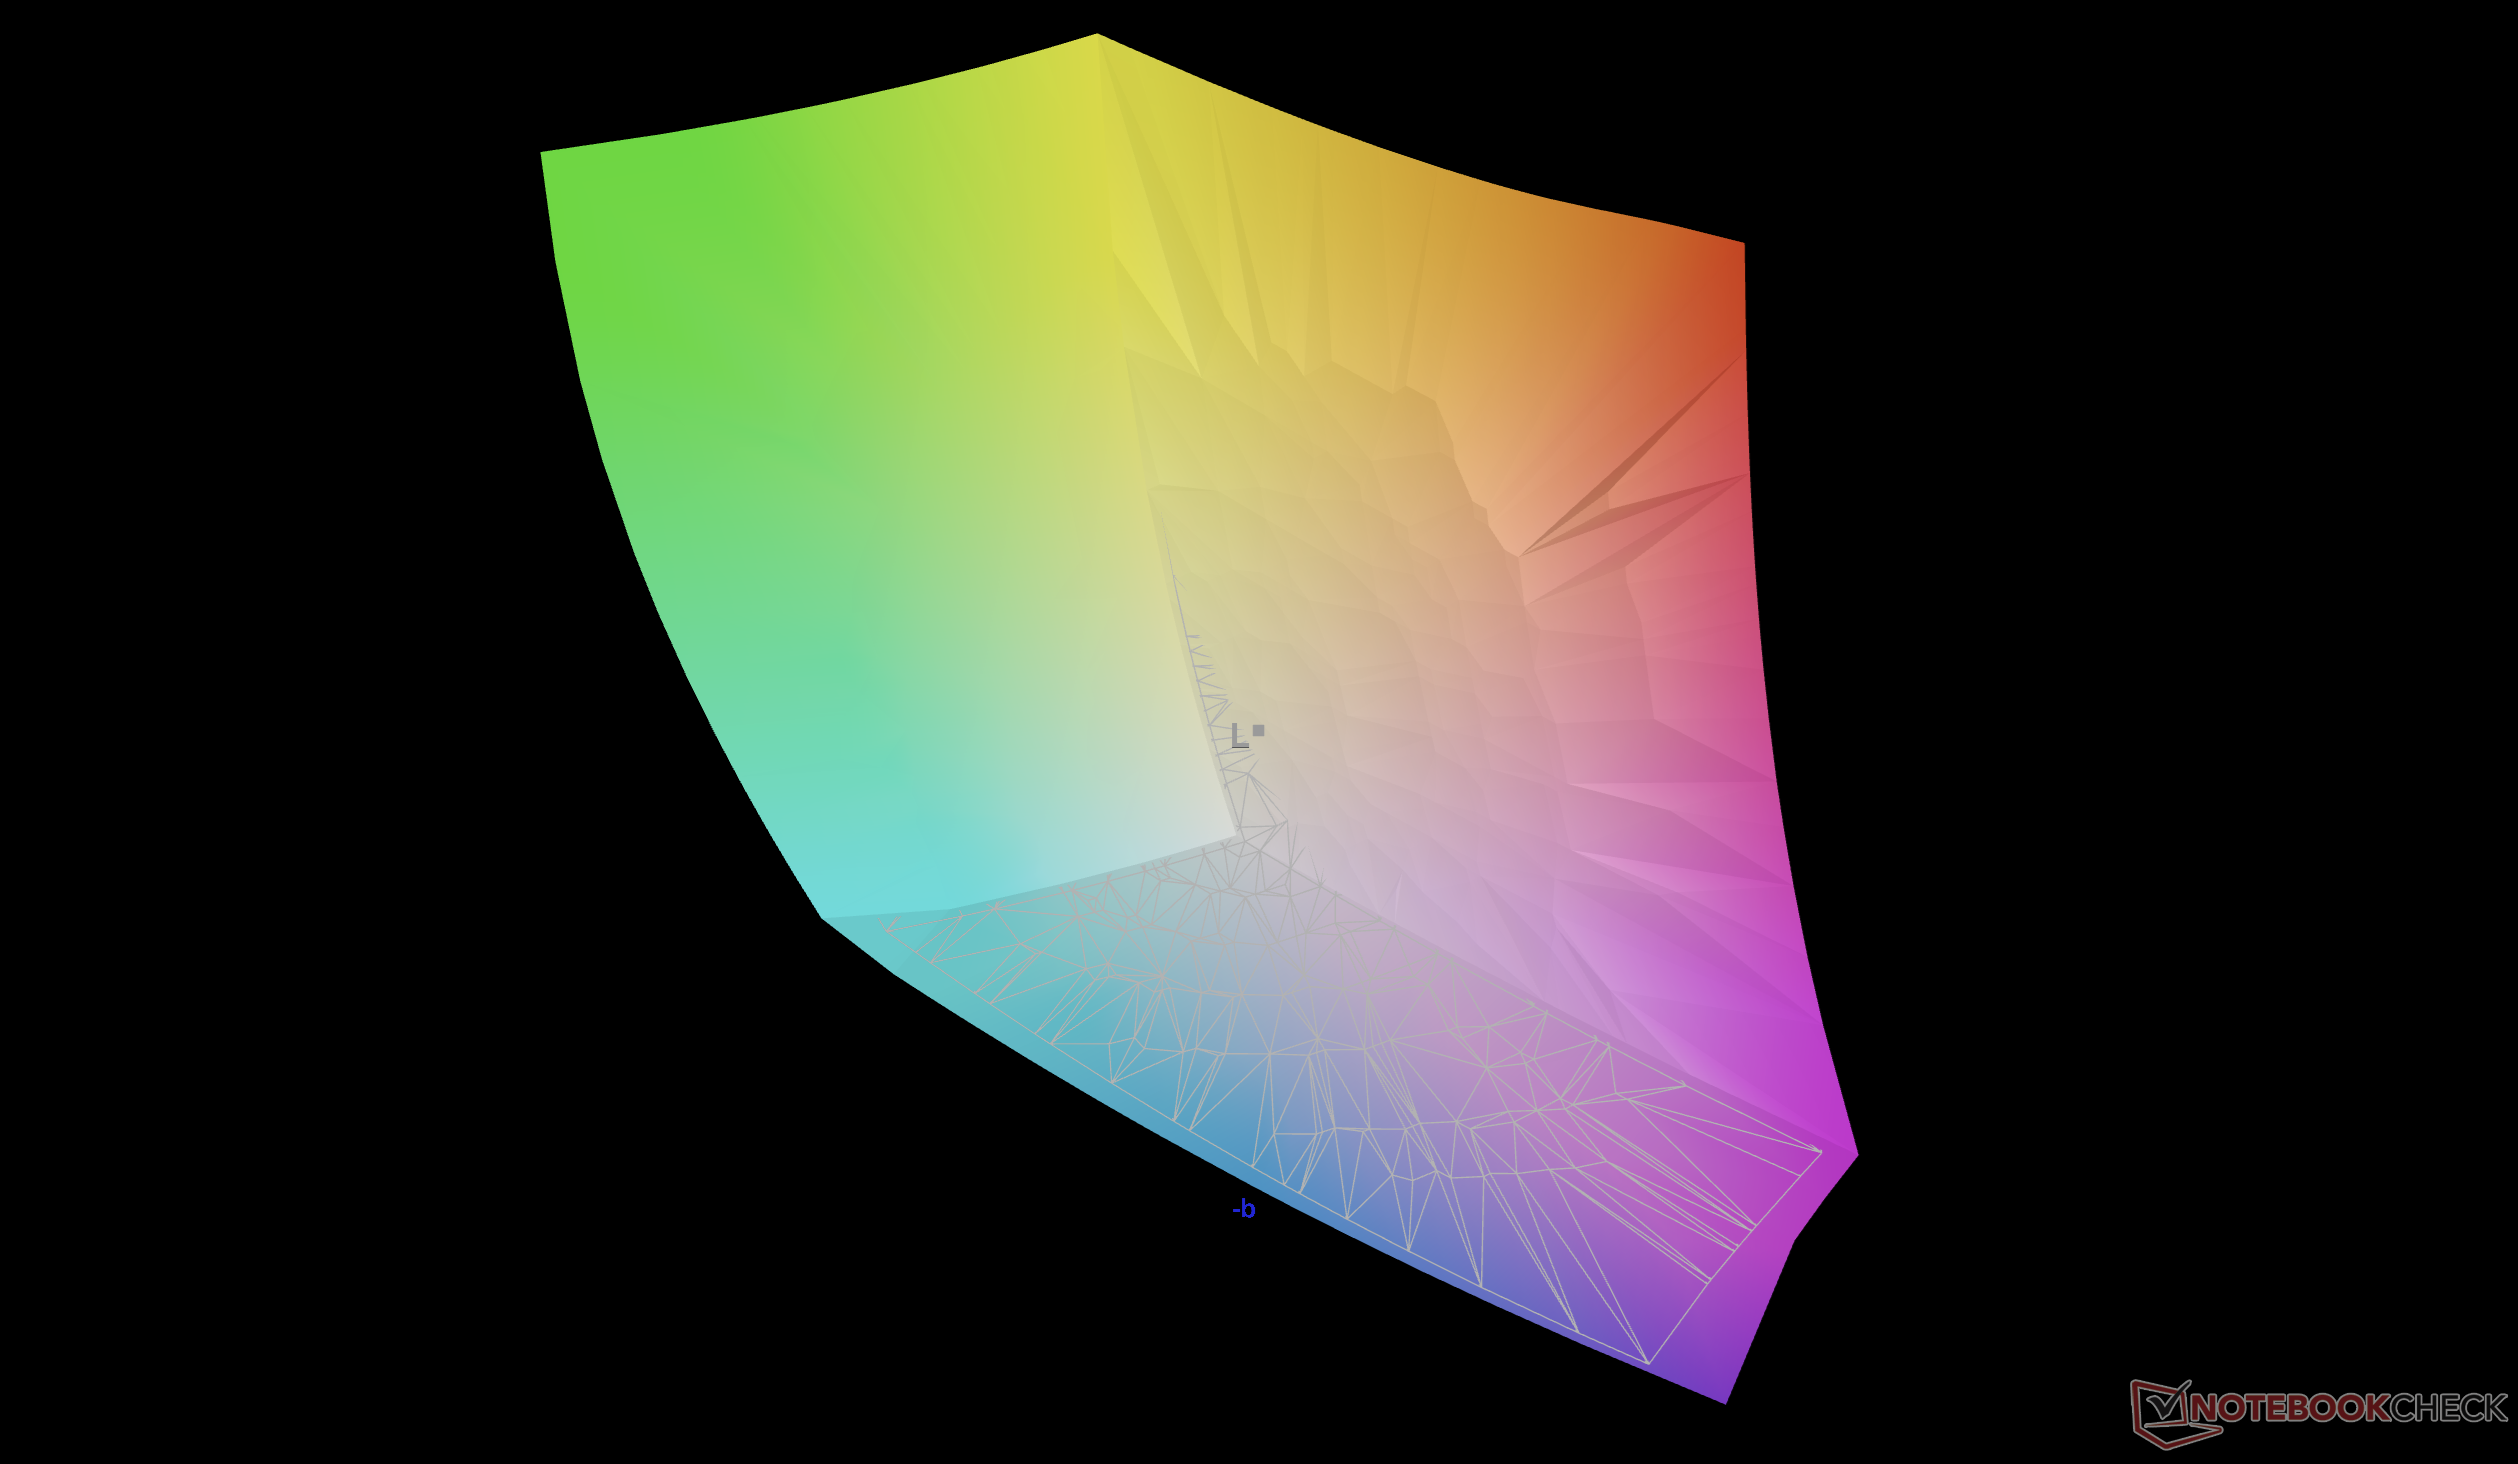
93.9% AdobeRGB 1998 (Argyll 3D)
100% sRGB (Argyll 3D)
99.6% Display P3 (Argyll 3D)
Gamma: 2.23
CCT: 6410 K
| Alienware 16X Aurora Core Ultra 9 290HX Plus Samsung 160HU05, OLED, 2560x1600, 16", 240 Hz | Alienware 16X Aurora, RTX 5070 LG Philips 160WQG, IPS, 2560x1600, 16", 240 Hz | Acer Predator Helios Neo 16S AI PHN16S-71-94L9 Samsung ATNA60DL03-0, OLED, 2560x1600, 16", 240 Hz | Lenovo Legion Pro 5 16IAX10, RTX 5070 ATNA60HS01-0 (Samsung SDC420A), OLED, 2650x1600, 16", 165 Hz | MSI Vector 16 HX AI A2XWHG B160QAN02.3 (AUO7DB2), IPS, 2560x1600, 16", 240 Hz | Asus ROG Zephyrus G16 GU605CW Samsung ATNA60DL01-0, OLED, 2560x1600, 16", 240 Hz | |
|---|---|---|---|---|---|---|
| Display | -2% | 1% | 0% | -4% | -1% | |
| APL18 Peak Brightness (cd/m²) | 609 | |||||
| HDR Peak Brightness (cd/m²) | 609 | |||||
| Display P3 Coverage (%) | 99.6 | 96.9 -3% | 99.9 0% | 99.3 0% | 96.6 -3% | 96.5 -3% |
| sRGB Coverage (%) | 100 | 99.8 0% | 100 0% | 100 0% | 99.8 0% | 99.2 -1% |
| AdobeRGB 1998 Coverage (%) | 93.9 | 89.7 -4% | 96.5 3% | 93.9 0% | 84.4 -10% | 94.5 1% |
| Response Times | -1608% | 1% | -253% | -1308% | -404% | |
| Response Time Grey 50% / Grey 80% * (ms) | 0.29 ? | 4.3 ? -1383% | 0.2 ? 31% | 2 ? -590% | 4.3 ? -1383% | 0.32 ? -10% |
| Response Time Black / White * (ms) | 0.45 ? | 8.7 ? -1833% | 0.25 ? 44% | 1.4 ? -211% | 6 ? -1233% | 6 ? -1233% |
| PWM Frequency (Hz) | 1439.8 ? | 960 | 1300 | 960 | ||
| PWM Amplitude * (%) | 29 | 50 -72% | 16.7 42% | 20 31% | ||
| Screen | -29% | 5% | -32% | -33% | -14% | |
| Brightness middle (cd/m²) | 380.5 | 493.2 30% | 390 2% | 521 37% | 473 24% | 394 4% |
| Brightness (cd/m²) | 384 | 477 24% | 394 3% | 519 35% | 426 11% | 398 4% |
| Brightness Distribution (%) | 98 | 93 -5% | 98 0% | 98 0% | 85 -13% | 98 0% |
| Black Level * (cd/m²) | 0.5 | 0.04 | 0.075 | 0.42 | 0.0084 | |
| Colorchecker dE 2000 * | 3.27 | 3.57 -9% | 1.61 51% | 2.5 24% | 3.47 -6% | 2.41 26% |
| Colorchecker dE 2000 max. * | 6.31 | 7.03 -11% | 3.49 45% | 4.85 23% | 7.24 -15% | 3.82 39% |
| Colorchecker dE 2000 calibrated * | 1.1 | 0.68 38% | 1.59 -45% | 2.5 -127% | 1.36 -24% | 1.41 -28% |
| Greyscale dE 2000 * | 1 | 3.7 -270% | 1.2 -20% | 3.17 -217% | 3.1 -210% | 2.4 -140% |
| Gamma | 2.23 99% | 2.16 102% | 2.235 98% | 2.35 94% | 2.486 88% | 2.16 102% |
| CCT | 6410 101% | 5876 111% | 6580 99% | 6454 101% | 6832 95% | 6544 99% |
| Contrast (:1) | 986 | 9750 | 6947 | 1126 | 46905 | |
| Total Average (Program / Settings) | -546% /
-286% | 2% /
3% | -95% /
-76% | -448% /
-239% | -140% /
-101% |
* ... smaller is better


Display Response Times
| ↔ Response Time Black to White | ||
|---|---|---|
| 0.45 ms ... rise ↗ and fall ↘ combined | ↗ 0.23 ms rise | 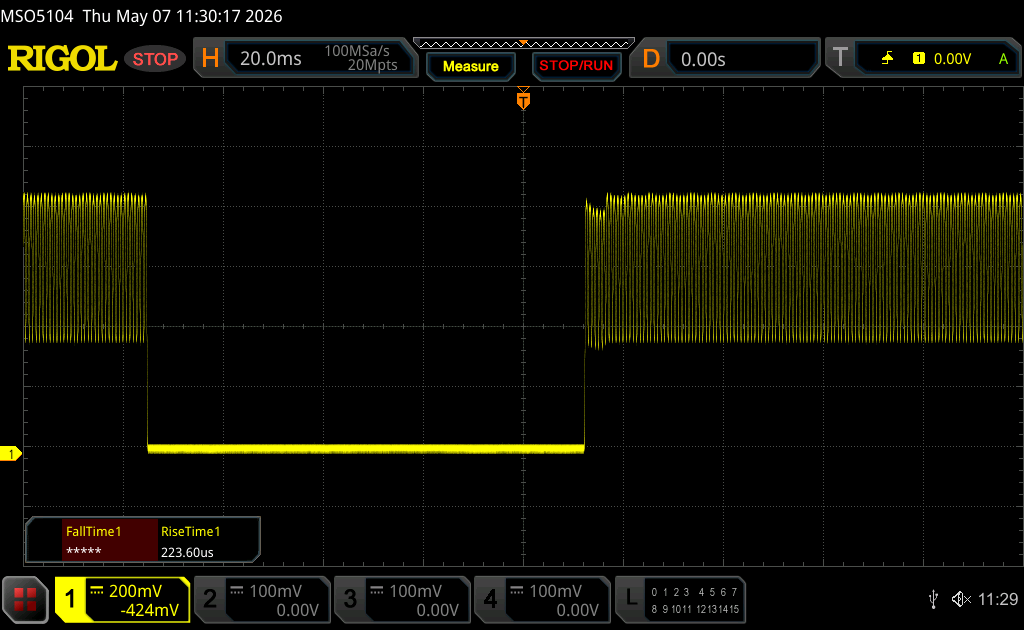 |
| ↘ 0.22 ms fall | ||
| The screen shows very fast response rates in our tests and should be very well suited for fast-paced gaming. In comparison, all tested devices range from 0.1 (minimum) to 240 (maximum) ms. » 1 % of all devices are better. This means that the measured response time is better than the average of all tested devices (19.9 ms). | ||
| ↔ Response Time 50% Grey to 80% Grey | ||
| 0.29 ms ... rise ↗ and fall ↘ combined | ↗ 0.15 ms rise | 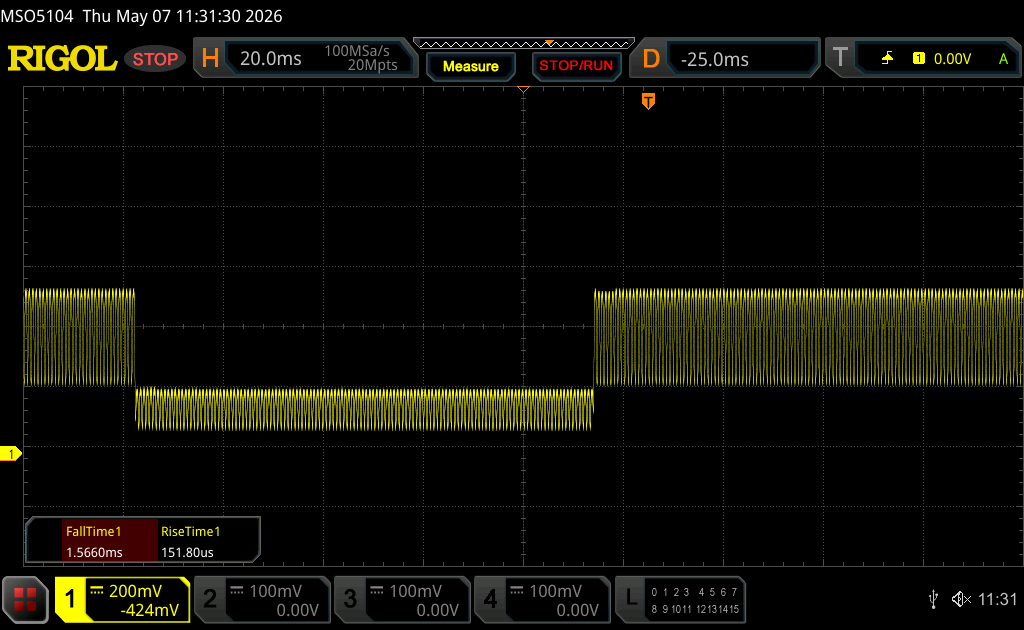 |
| ↘ 0.14 ms fall | ||
| The screen shows very fast response rates in our tests and should be very well suited for fast-paced gaming. In comparison, all tested devices range from 0.165 (minimum) to 636 (maximum) ms. » 0 % of all devices are better. This means that the measured response time is better than the average of all tested devices (31.1 ms). | ||
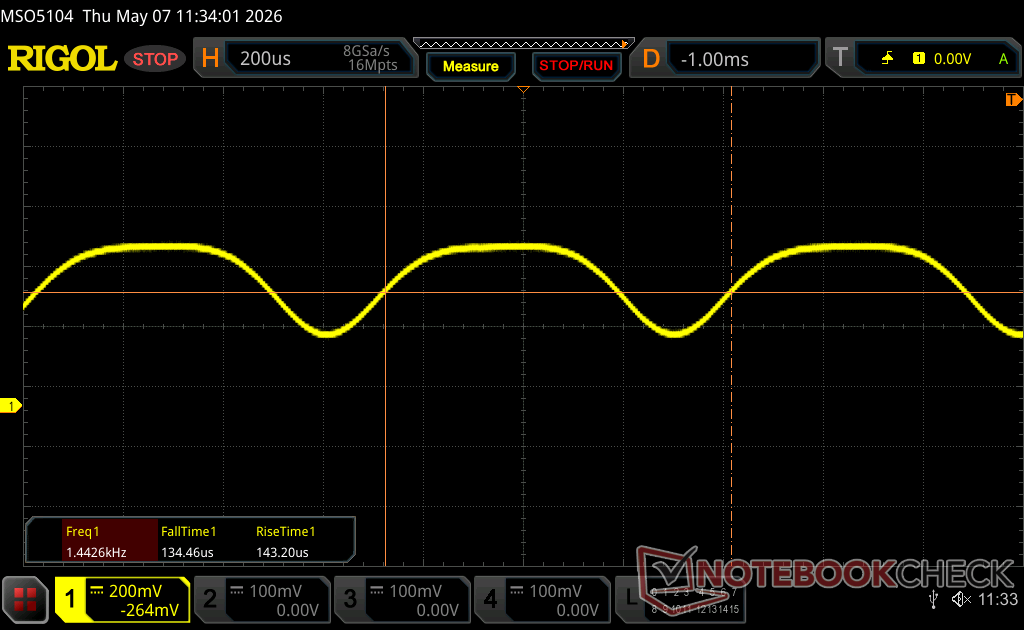
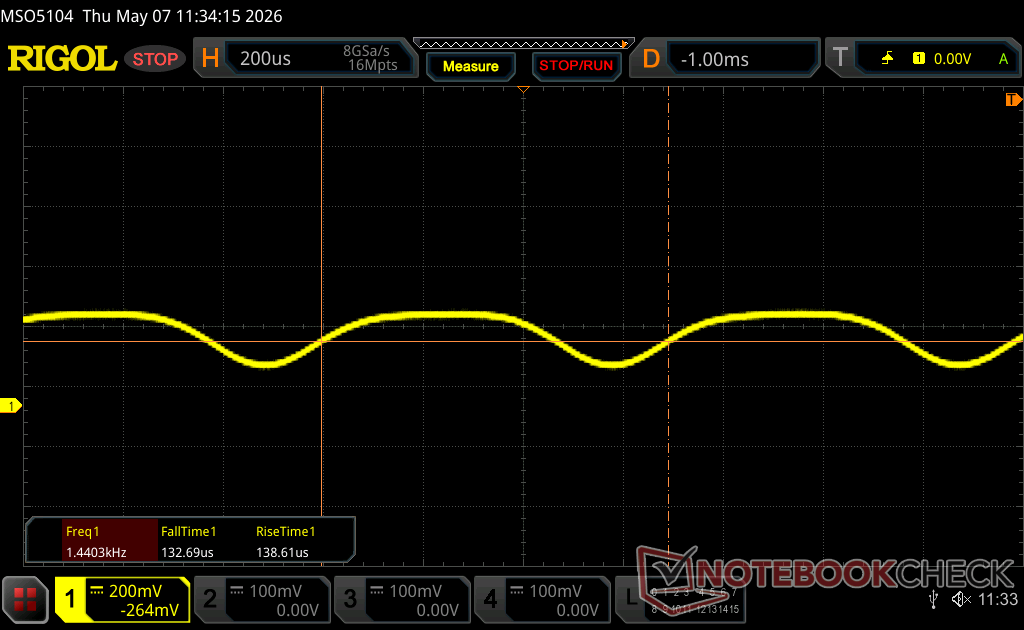
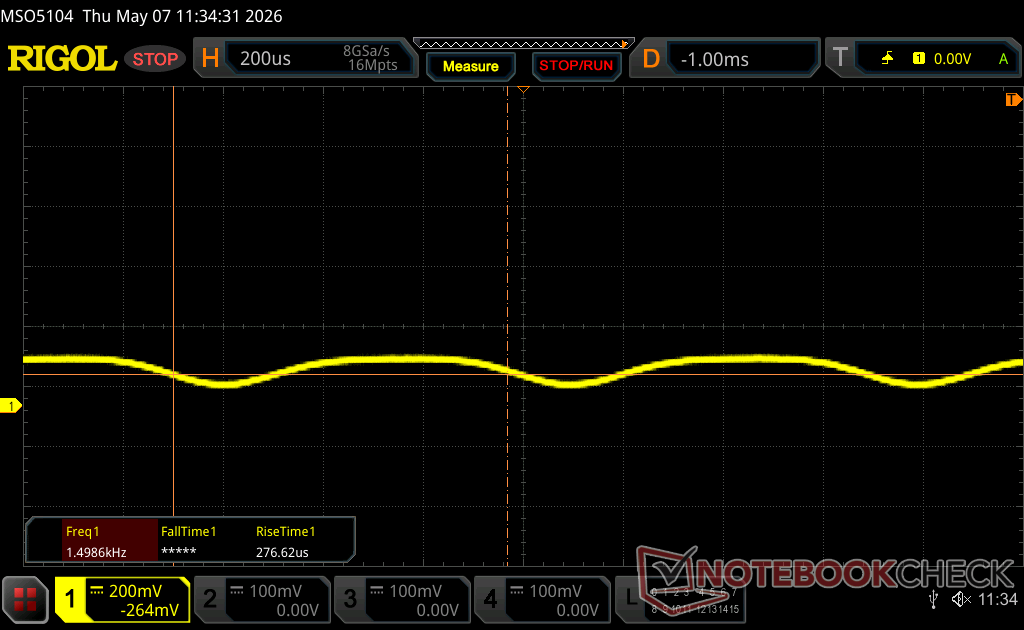
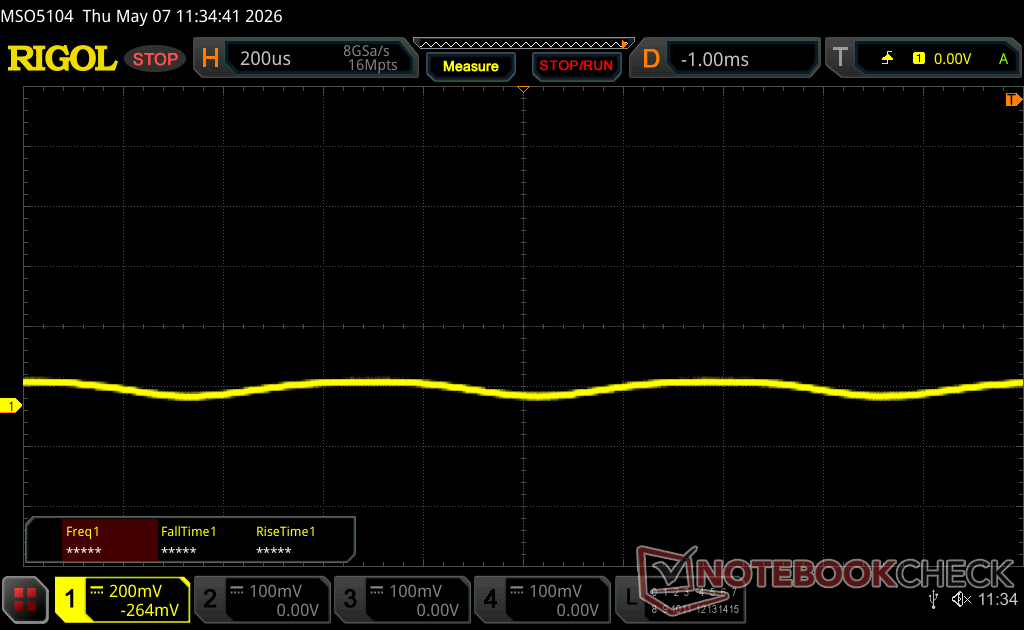
Screen Flickering / PWM (Pulse-Width Modulation)
| Screen flickering / PWM detected | 1439.8 Hz Amplitude: 29 % | ≤ 100 % brightness setting | 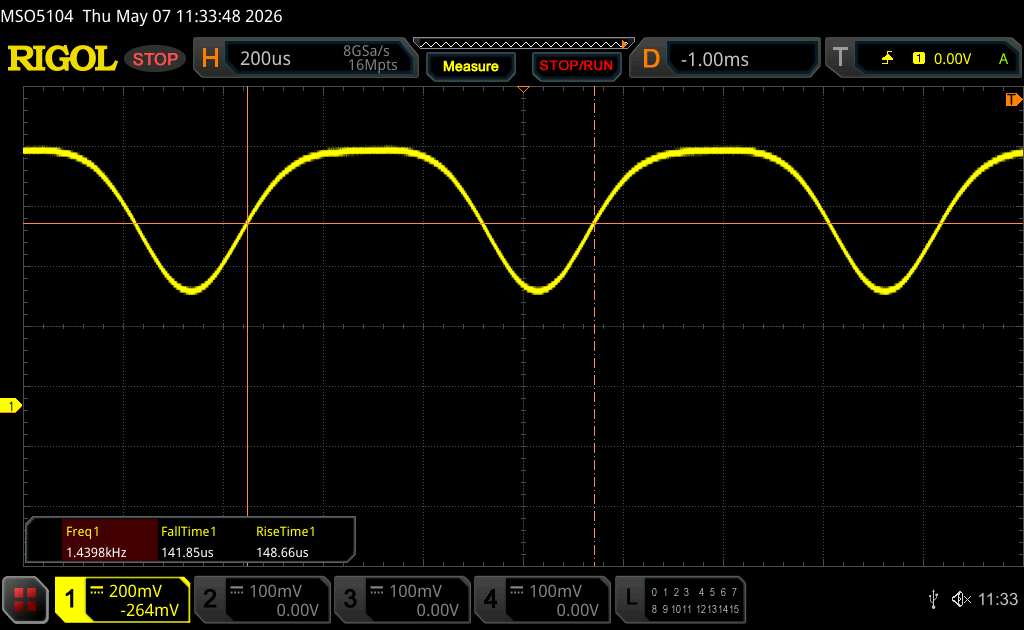 |
The display backlight flickers at 1439.8 Hz (worst case, e.g., utilizing PWM) Flickering detected at a brightness setting of 100 % and below. There should be no flickering or PWM above this brightness setting. The frequency of 1439.8 Hz is quite high, so most users sensitive to PWM should not notice any flickering. In comparison: 52 % of all tested devices do not use PWM to dim the display. If PWM was detected, an average of 7794 (minimum: 5 - maximum: 343500) Hz was measured. | |||


性能
测试条件
在运行下面的基准测试之前,我们将 Alienware Command Center 设为 "性能 "模式。还有一个 "超速模式 "可将风扇转速提高到最大值,但与性能模式相比,其性能优势微乎其微。
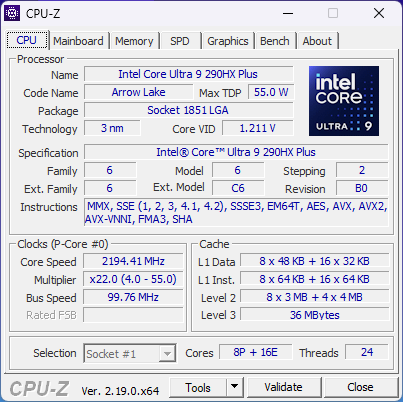
处理器
酷睿 Ultra 9 290HX Plus 酷睿至尊 9 290HX Plus仅比 酷睿至尊 9 275HX快 5 个百分点。在超频模式下运行也不会有更明显的提升。
Cinebench R15 多回路运行
Cinebench R23: Multi Core | Single Core
Cinebench R20: CPU (Multi Core) | CPU (Single Core)
Cinebench R15: CPU Multi 64Bit | CPU Single 64Bit
Blender: v2.79 BMW27 CPU
7-Zip 18.03: 7z b 4 | 7z b 4 -mmt1
Geekbench 6.7: Multi-Core | Single-Core
Geekbench 5.5: Multi-Core | Single-Core
HWBOT x265 Benchmark v2.2: 4k Preset
LibreOffice : 20 Documents To PDF
R Benchmark 2.5: Overall mean
* ... smaller is better
AIDA64: FP32 Ray-Trace | FPU Julia | CPU SHA3 | CPU Queen | FPU SinJulia | FPU Mandel | CPU AES | CPU ZLib | FP64 Ray-Trace | CPU PhotoWorxx | CPU CheckMate
| Performance rating | |
| Average Intel Core Ultra 9 290HX Plus -1! | |
| Alienware 16X Aurora Core Ultra 9 290HX Plus -1! | |
| Lenovo Legion Pro 5 16IAX10, RTX 5070 -1! | |
| Alienware 16X Aurora, RTX 5070 -1! | |
| Acer Predator Helios Neo 16S AI PHN16S-71-94L9 -1! | |
| MSI Vector 16 HX AI A2XWHG -1! | |
| Asus ROG Zephyrus G16 GU605CW -1! | |
| AIDA64 / FP32 Ray-Trace | |
| Average Intel Core Ultra 9 290HX Plus (34761 - 40761, n=3) | |
| Alienware 16X Aurora Core Ultra 9 290HX Plus (v8.20.8100) | |
| Lenovo Legion Pro 5 16IAX10, RTX 5070 (v6.92.6600) | |
| Alienware 16X Aurora, RTX 5070 (v6.92.6600) | |
| Acer Predator Helios Neo 16S AI PHN16S-71-94L9 (v6.92.6600) | |
| MSI Vector 16 HX AI A2XWHG (v6.92.6600) | |
| Asus ROG Zephyrus G16 GU605CW (v6.92.6600) | |
| AIDA64 / FPU Julia | |
| Average Intel Core Ultra 9 290HX Plus (174665 - 208083, n=3) | |
| Alienware 16X Aurora Core Ultra 9 290HX Plus (v8.20.8100) | |
| Lenovo Legion Pro 5 16IAX10, RTX 5070 (v6.92.6600) | |
| Alienware 16X Aurora, RTX 5070 (v6.92.6600) | |
| Acer Predator Helios Neo 16S AI PHN16S-71-94L9 (v6.92.6600) | |
| MSI Vector 16 HX AI A2XWHG (v6.92.6600) | |
| Asus ROG Zephyrus G16 GU605CW (v6.92.6600) | |
| AIDA64 / CPU SHA3 | |
| Average Intel Core Ultra 9 290HX Plus (8352 - 9784, n=3) | |
| Alienware 16X Aurora Core Ultra 9 290HX Plus (v8.20.8100) | |
| Alienware 16X Aurora, RTX 5070 (v6.92.6600) | |
| Lenovo Legion Pro 5 16IAX10, RTX 5070 (v6.92.6600) | |
| Acer Predator Helios Neo 16S AI PHN16S-71-94L9 (v6.92.6600) | |
| MSI Vector 16 HX AI A2XWHG (v6.92.6600) | |
| Asus ROG Zephyrus G16 GU605CW (v6.92.6600) | |
| AIDA64 / CPU Queen | |
| Lenovo Legion Pro 5 16IAX10, RTX 5070 (v6.92.6600) | |
| Alienware 16X Aurora, RTX 5070 (v6.92.6600) | |
| Acer Predator Helios Neo 16S AI PHN16S-71-94L9 (v6.92.6600) | |
| MSI Vector 16 HX AI A2XWHG (v6.92.6600) | |
| Asus ROG Zephyrus G16 GU605CW (v6.92.6600) | |
| AIDA64 / FPU SinJulia | |
| Average Intel Core Ultra 9 290HX Plus (13612 - 14461, n=3) | |
| Alienware 16X Aurora Core Ultra 9 290HX Plus (v8.20.8100) | |
| Alienware 16X Aurora, RTX 5070 (v6.92.6600) | |
| Lenovo Legion Pro 5 16IAX10, RTX 5070 (v6.92.6600) | |
| Acer Predator Helios Neo 16S AI PHN16S-71-94L9 (v6.92.6600) | |
| MSI Vector 16 HX AI A2XWHG (v6.92.6600) | |
| Asus ROG Zephyrus G16 GU605CW (v6.92.6600) | |
| AIDA64 / FPU Mandel | |
| Average Intel Core Ultra 9 290HX Plus (91215 - 108275, n=3) | |
| Alienware 16X Aurora Core Ultra 9 290HX Plus (v8.20.8100) | |
| Lenovo Legion Pro 5 16IAX10, RTX 5070 (v6.92.6600) | |
| Alienware 16X Aurora, RTX 5070 (v6.92.6600) | |
| Acer Predator Helios Neo 16S AI PHN16S-71-94L9 (v6.92.6600) | |
| MSI Vector 16 HX AI A2XWHG (v6.92.6600) | |
| Asus ROG Zephyrus G16 GU605CW (v6.92.6600) | |
| AIDA64 / CPU AES | |
| Average Intel Core Ultra 9 290HX Plus (127585 - 136781, n=3) | |
| Alienware 16X Aurora Core Ultra 9 290HX Plus (v8.20.8100) | |
| Alienware 16X Aurora, RTX 5070 (v6.92.6600) | |
| Lenovo Legion Pro 5 16IAX10, RTX 5070 (v6.92.6600) | |
| Acer Predator Helios Neo 16S AI PHN16S-71-94L9 (v6.92.6600) | |
| MSI Vector 16 HX AI A2XWHG (v6.92.6600) | |
| Asus ROG Zephyrus G16 GU605CW (v6.92.6600) | |
| AIDA64 / CPU ZLib | |
| Average Intel Core Ultra 9 290HX Plus (1967 - 2206, n=3) | |
| Alienware 16X Aurora Core Ultra 9 290HX Plus (v8.20.8100) | |
| Alienware 16X Aurora, RTX 5070 (v6.92.6600) | |
| Lenovo Legion Pro 5 16IAX10, RTX 5070 (v6.92.6600) | |
| Acer Predator Helios Neo 16S AI PHN16S-71-94L9 (v6.92.6600) | |
| MSI Vector 16 HX AI A2XWHG (v6.92.6600) | |
| Asus ROG Zephyrus G16 GU605CW (v6.92.6600) | |
| AIDA64 / FP64 Ray-Trace | |
| Average Intel Core Ultra 9 290HX Plus (18611 - 21949, n=3) | |
| Alienware 16X Aurora Core Ultra 9 290HX Plus (v8.20.8100) | |
| Lenovo Legion Pro 5 16IAX10, RTX 5070 (v6.92.6600) | |
| Alienware 16X Aurora, RTX 5070 (v6.92.6600) | |
| Acer Predator Helios Neo 16S AI PHN16S-71-94L9 (v6.92.6600) | |
| MSI Vector 16 HX AI A2XWHG (v6.92.6600) | |
| Asus ROG Zephyrus G16 GU605CW (v6.92.6600) | |
| AIDA64 / CPU PhotoWorxx | |
| Asus ROG Zephyrus G16 GU605CW (v6.92.6600) | |
| Lenovo Legion Pro 5 16IAX10, RTX 5070 (v6.92.6600) | |
| Acer Predator Helios Neo 16S AI PHN16S-71-94L9 (v6.92.6600) | |
| Average Intel Core Ultra 9 290HX Plus (51134 - 55731, n=3) | |
| Alienware 16X Aurora Core Ultra 9 290HX Plus (v8.20.8100) | |
| Alienware 16X Aurora, RTX 5070 (v6.92.6600) | |
| MSI Vector 16 HX AI A2XWHG (v6.92.6600) | |
| AIDA64 / CPU CheckMate | |
| Average Intel Core Ultra 9 290HX Plus (7624 - 8322, n=3) | |
| Alienware 16X Aurora Core Ultra 9 290HX Plus (v8.20.8100) | |
系统性能
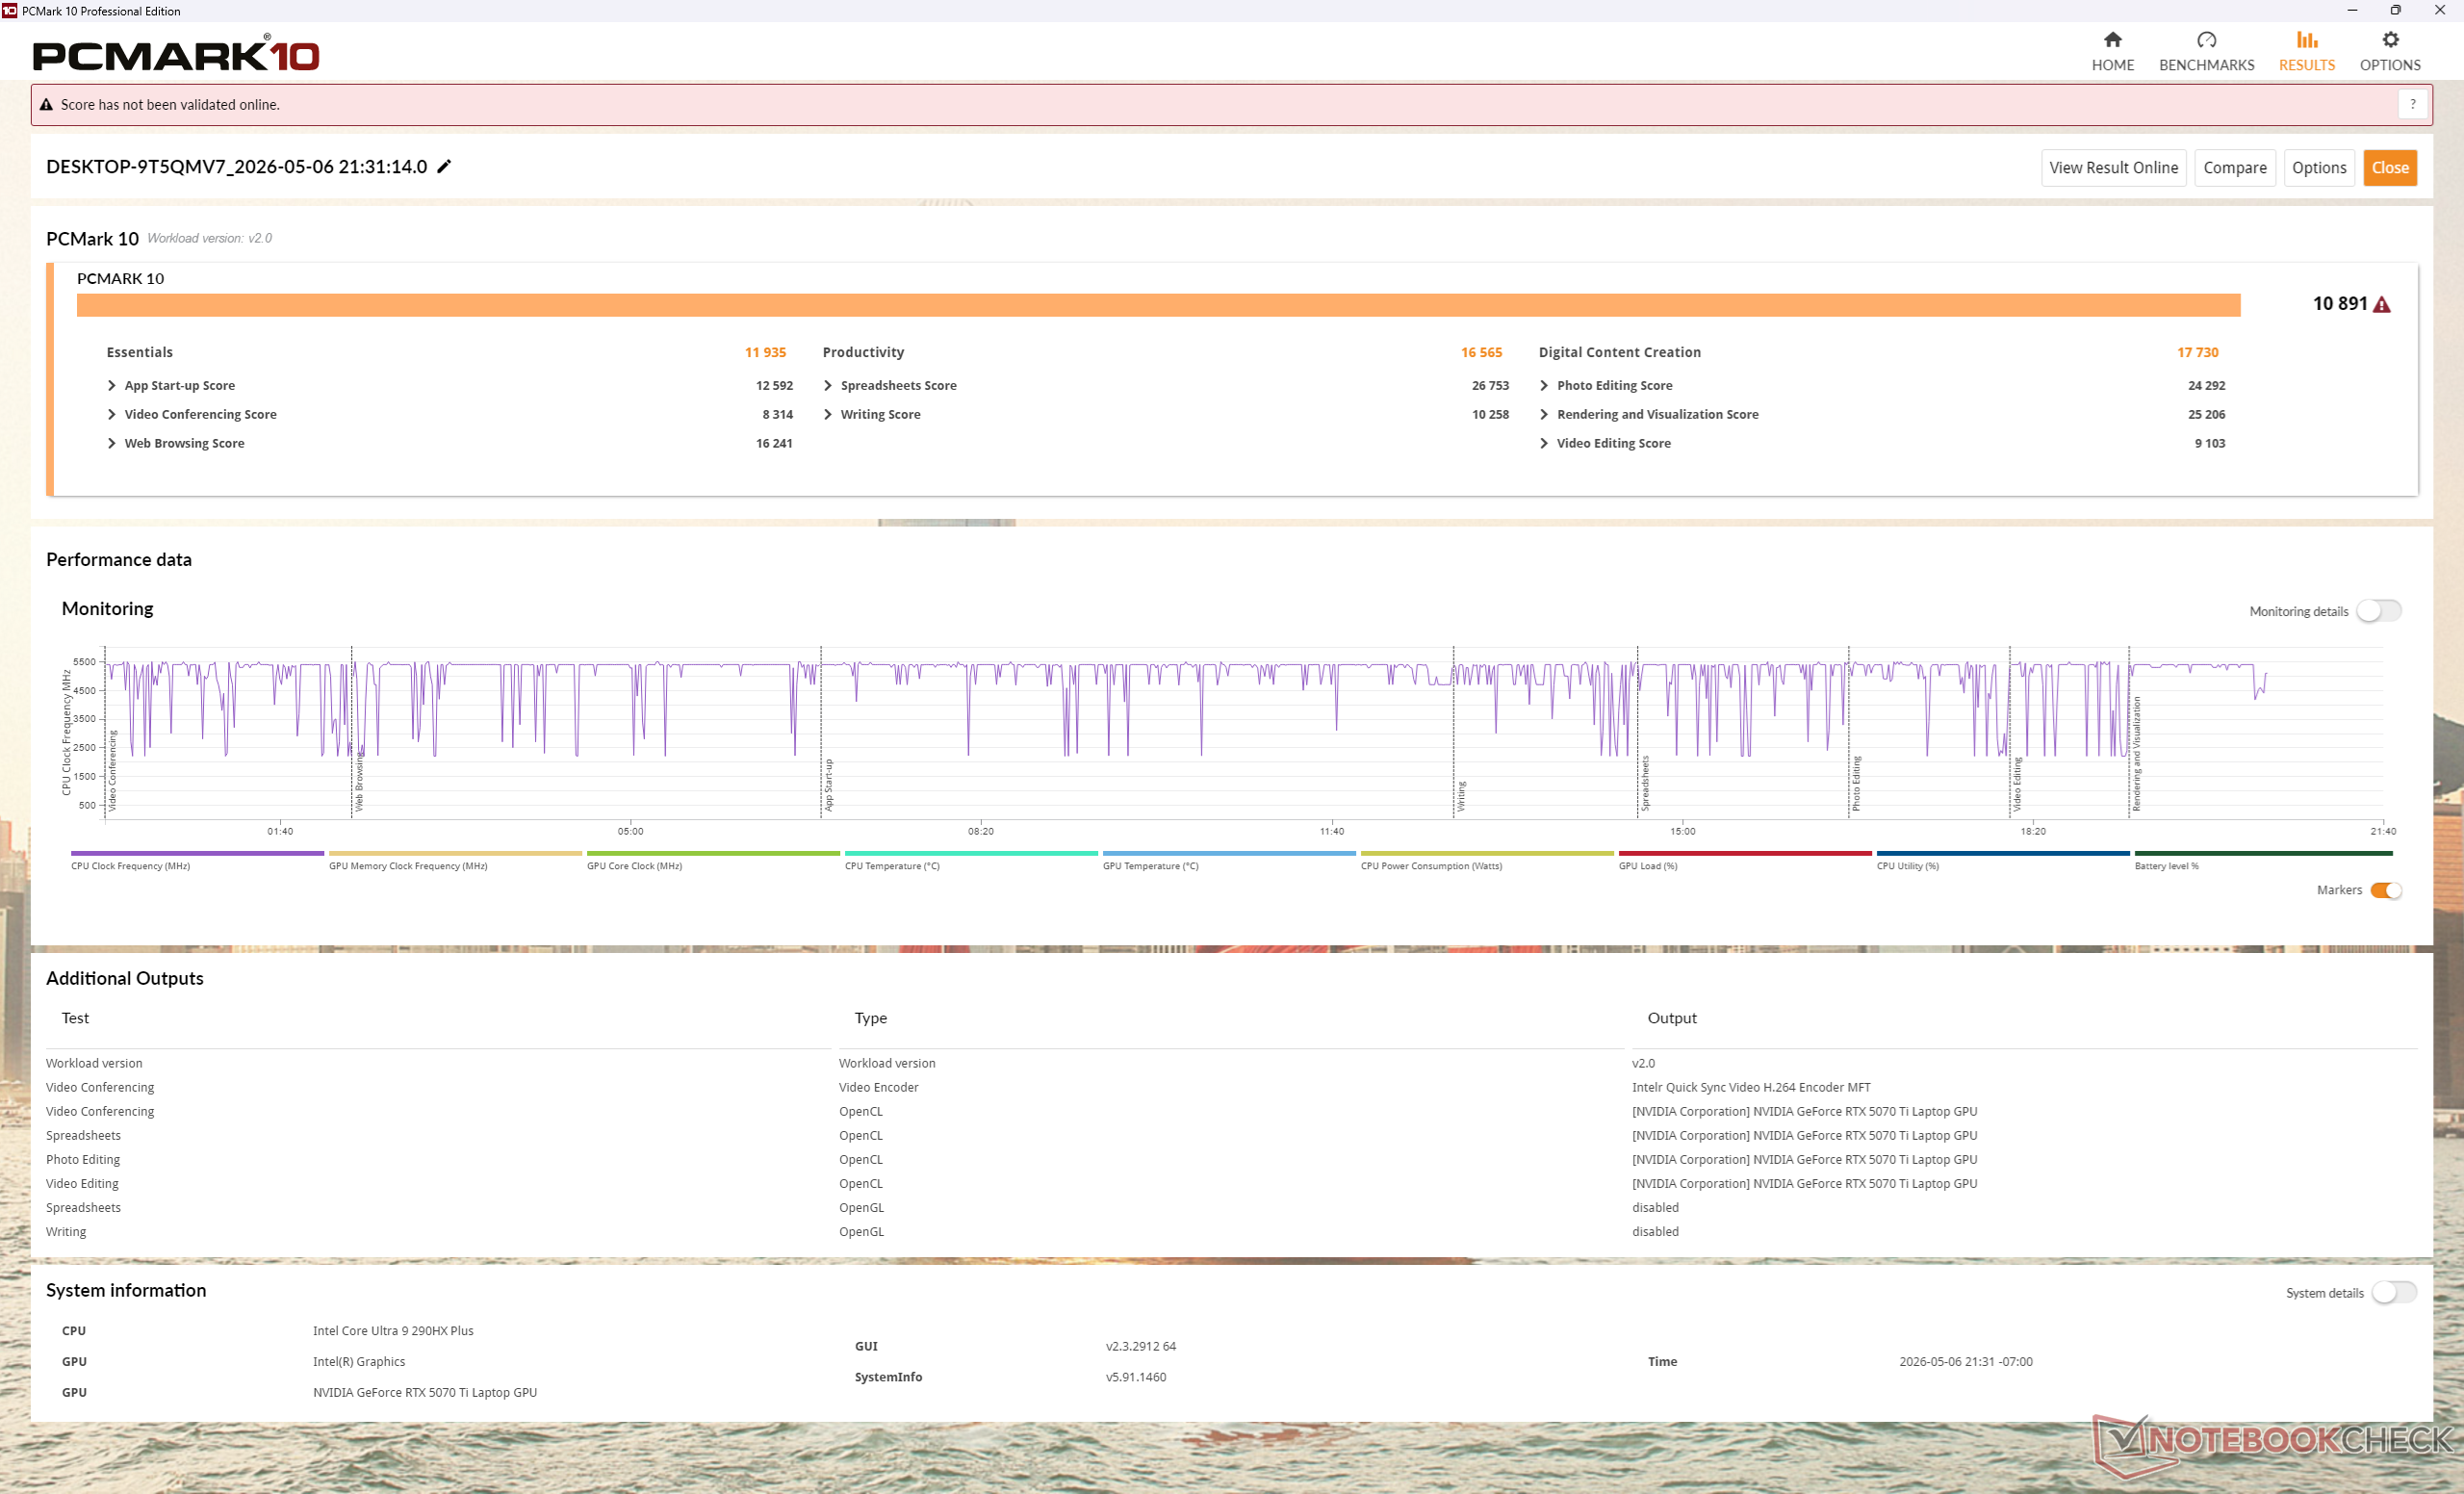
PCMark 10: Score | Essentials | Productivity | Digital Content Creation
CrossMark: Overall | Productivity | Creativity | Responsiveness
WebXPRT 3: Overall
WebXPRT 4: Overall
Mozilla Kraken 1.1: Total
Geekbench AI: Quantized GPU 1.7 | Half Precision GPU 1.7 | Single Precision GPU 1.7
| Performance rating | |
| Alienware 16X Aurora Core Ultra 9 290HX Plus | |
| Average Intel Core Ultra 9 290HX Plus, NVIDIA GeForce RTX 5070 Ti Laptop | |
| Alienware 16X Aurora, RTX 5070 -4! | |
| Lenovo Legion Pro 5 16IAX10, RTX 5070 | |
| Acer Predator Helios Neo 16S AI PHN16S-71-94L9 -3! | |
| MSI Vector 16 HX AI A2XWHG -3! | |
| Asus ROG Zephyrus G16 GU605CW -3! | |
| PCMark 10 / Score | |
| Alienware 16X Aurora Core Ultra 9 290HX Plus | |
| Average Intel Core Ultra 9 290HX Plus, NVIDIA GeForce RTX 5070 Ti Laptop (n=1) | |
| Lenovo Legion Pro 5 16IAX10, RTX 5070 | |
| Acer Predator Helios Neo 16S AI PHN16S-71-94L9 | |
| MSI Vector 16 HX AI A2XWHG | |
| Asus ROG Zephyrus G16 GU605CW | |
| PCMark 10 / Essentials | |
| Alienware 16X Aurora Core Ultra 9 290HX Plus | |
| Average Intel Core Ultra 9 290HX Plus, NVIDIA GeForce RTX 5070 Ti Laptop (n=1) | |
| Lenovo Legion Pro 5 16IAX10, RTX 5070 | |
| Acer Predator Helios Neo 16S AI PHN16S-71-94L9 | |
| MSI Vector 16 HX AI A2XWHG | |
| Asus ROG Zephyrus G16 GU605CW | |
| PCMark 10 / Productivity | |
| Alienware 16X Aurora Core Ultra 9 290HX Plus | |
| Average Intel Core Ultra 9 290HX Plus, NVIDIA GeForce RTX 5070 Ti Laptop (n=1) | |
| Lenovo Legion Pro 5 16IAX10, RTX 5070 | |
| Acer Predator Helios Neo 16S AI PHN16S-71-94L9 | |
| MSI Vector 16 HX AI A2XWHG | |
| Asus ROG Zephyrus G16 GU605CW | |
| PCMark 10 / Digital Content Creation | |
| Alienware 16X Aurora Core Ultra 9 290HX Plus | |
| Average Intel Core Ultra 9 290HX Plus, NVIDIA GeForce RTX 5070 Ti Laptop (n=1) | |
| Lenovo Legion Pro 5 16IAX10, RTX 5070 | |
| Acer Predator Helios Neo 16S AI PHN16S-71-94L9 | |
| Asus ROG Zephyrus G16 GU605CW | |
| MSI Vector 16 HX AI A2XWHG | |
| CrossMark / Overall | |
| Alienware 16X Aurora Core Ultra 9 290HX Plus | |
| Average Intel Core Ultra 9 290HX Plus, NVIDIA GeForce RTX 5070 Ti Laptop (n=1) | |
| Alienware 16X Aurora, RTX 5070 | |
| Acer Predator Helios Neo 16S AI PHN16S-71-94L9 | |
| Lenovo Legion Pro 5 16IAX10, RTX 5070 | |
| MSI Vector 16 HX AI A2XWHG | |
| Asus ROG Zephyrus G16 GU605CW | |
| CrossMark / Productivity | |
| Alienware 16X Aurora Core Ultra 9 290HX Plus | |
| Average Intel Core Ultra 9 290HX Plus, NVIDIA GeForce RTX 5070 Ti Laptop (n=1) | |
| Alienware 16X Aurora, RTX 5070 | |
| Acer Predator Helios Neo 16S AI PHN16S-71-94L9 | |
| Lenovo Legion Pro 5 16IAX10, RTX 5070 | |
| MSI Vector 16 HX AI A2XWHG | |
| Asus ROG Zephyrus G16 GU605CW | |
| CrossMark / Creativity | |
| Alienware 16X Aurora Core Ultra 9 290HX Plus | |
| Average Intel Core Ultra 9 290HX Plus, NVIDIA GeForce RTX 5070 Ti Laptop (n=1) | |
| Acer Predator Helios Neo 16S AI PHN16S-71-94L9 | |
| Alienware 16X Aurora, RTX 5070 | |
| Lenovo Legion Pro 5 16IAX10, RTX 5070 | |
| MSI Vector 16 HX AI A2XWHG | |
| Asus ROG Zephyrus G16 GU605CW | |
| CrossMark / Responsiveness | |
| Alienware 16X Aurora Core Ultra 9 290HX Plus | |
| Average Intel Core Ultra 9 290HX Plus, NVIDIA GeForce RTX 5070 Ti Laptop (n=1) | |
| Alienware 16X Aurora, RTX 5070 | |
| Lenovo Legion Pro 5 16IAX10, RTX 5070 | |
| Acer Predator Helios Neo 16S AI PHN16S-71-94L9 | |
| MSI Vector 16 HX AI A2XWHG | |
| Asus ROG Zephyrus G16 GU605CW | |
| WebXPRT 3 / Overall | |
| Alienware 16X Aurora Core Ultra 9 290HX Plus | |
| Average Intel Core Ultra 9 290HX Plus, NVIDIA GeForce RTX 5070 Ti Laptop (n=1) | |
| Alienware 16X Aurora, RTX 5070 | |
| Lenovo Legion Pro 5 16IAX10, RTX 5070 | |
| Acer Predator Helios Neo 16S AI PHN16S-71-94L9 | |
| MSI Vector 16 HX AI A2XWHG | |
| Asus ROG Zephyrus G16 GU605CW | |
| WebXPRT 4 / Overall | |
| Alienware 16X Aurora Core Ultra 9 290HX Plus | |
| Average Intel Core Ultra 9 290HX Plus, NVIDIA GeForce RTX 5070 Ti Laptop (n=1) | |
| Alienware 16X Aurora, RTX 5070 | |
| Lenovo Legion Pro 5 16IAX10, RTX 5070 | |
| Acer Predator Helios Neo 16S AI PHN16S-71-94L9 | |
| MSI Vector 16 HX AI A2XWHG | |
| Asus ROG Zephyrus G16 GU605CW | |
| Mozilla Kraken 1.1 / Total | |
| Asus ROG Zephyrus G16 GU605CW | |
| Lenovo Legion Pro 5 16IAX10, RTX 5070 | |
| MSI Vector 16 HX AI A2XWHG | |
| Alienware 16X Aurora, RTX 5070 | |
| Acer Predator Helios Neo 16S AI PHN16S-71-94L9 | |
| Alienware 16X Aurora Core Ultra 9 290HX Plus | |
| Average Intel Core Ultra 9 290HX Plus, NVIDIA GeForce RTX 5070 Ti Laptop (n=1) | |
| Geekbench AI / Quantized GPU 1.7 | |
| Alienware 16X Aurora Core Ultra 9 290HX Plus | |
| Average Intel Core Ultra 9 290HX Plus, NVIDIA GeForce RTX 5070 Ti Laptop (n=1) | |
| Alienware 16X Aurora, RTX 5070 | |
| Lenovo Legion Pro 5 16IAX10, RTX 5070 | |
| Geekbench AI / Half Precision GPU 1.7 | |
| Alienware 16X Aurora Core Ultra 9 290HX Plus | |
| Average Intel Core Ultra 9 290HX Plus, NVIDIA GeForce RTX 5070 Ti Laptop (n=1) | |
| Alienware 16X Aurora, RTX 5070 | |
| Lenovo Legion Pro 5 16IAX10, RTX 5070 | |
| Geekbench AI / Single Precision GPU 1.7 | |
| Alienware 16X Aurora Core Ultra 9 290HX Plus | |
| Average Intel Core Ultra 9 290HX Plus, NVIDIA GeForce RTX 5070 Ti Laptop (n=1) | |
| Alienware 16X Aurora, RTX 5070 | |
| Lenovo Legion Pro 5 16IAX10, RTX 5070 | |
* ... smaller is better
| PCMark 10 Score | 10891 points | |
Help | ||
| AIDA64 / Memory Copy | |
| Asus ROG Zephyrus G16 GU605CW | |
| Acer Predator Helios Neo 16S AI PHN16S-71-94L9 | |
| Lenovo Legion Pro 5 16IAX10, RTX 5070 | |
| Average Intel Core Ultra 9 290HX Plus (76912 - 85698, n=3) | |
| Alienware 16X Aurora, RTX 5070 | |
| Alienware 16X Aurora Core Ultra 9 290HX Plus | |
| MSI Vector 16 HX AI A2XWHG | |
| AIDA64 / Memory Read | |
| Acer Predator Helios Neo 16S AI PHN16S-71-94L9 | |
| Lenovo Legion Pro 5 16IAX10, RTX 5070 | |
| Average Intel Core Ultra 9 290HX Plus (84638 - 93496, n=3) | |
| Alienware 16X Aurora, RTX 5070 | |
| Alienware 16X Aurora Core Ultra 9 290HX Plus | |
| MSI Vector 16 HX AI A2XWHG | |
| Asus ROG Zephyrus G16 GU605CW | |
| AIDA64 / Memory Write | |
| Acer Predator Helios Neo 16S AI PHN16S-71-94L9 | |
| Lenovo Legion Pro 5 16IAX10, RTX 5070 | |
| Alienware 16X Aurora, RTX 5070 | |
| Average Intel Core Ultra 9 290HX Plus (76094 - 81688, n=3) | |
| Alienware 16X Aurora Core Ultra 9 290HX Plus | |
| Asus ROG Zephyrus G16 GU605CW | |
| MSI Vector 16 HX AI A2XWHG | |
| AIDA64 / Memory Latency | |
| Asus ROG Zephyrus G16 GU605CW | |
| Alienware 16X Aurora, RTX 5070 | |
| Acer Predator Helios Neo 16S AI PHN16S-71-94L9 | |
| Alienware 16X Aurora Core Ultra 9 290HX Plus | |
| MSI Vector 16 HX AI A2XWHG | |
| Average Intel Core Ultra 9 290HX Plus (105.3 - 108.4, n=3) | |
| Lenovo Legion Pro 5 16IAX10, RTX 5070 | |
* ... smaller is better
DPC 延迟
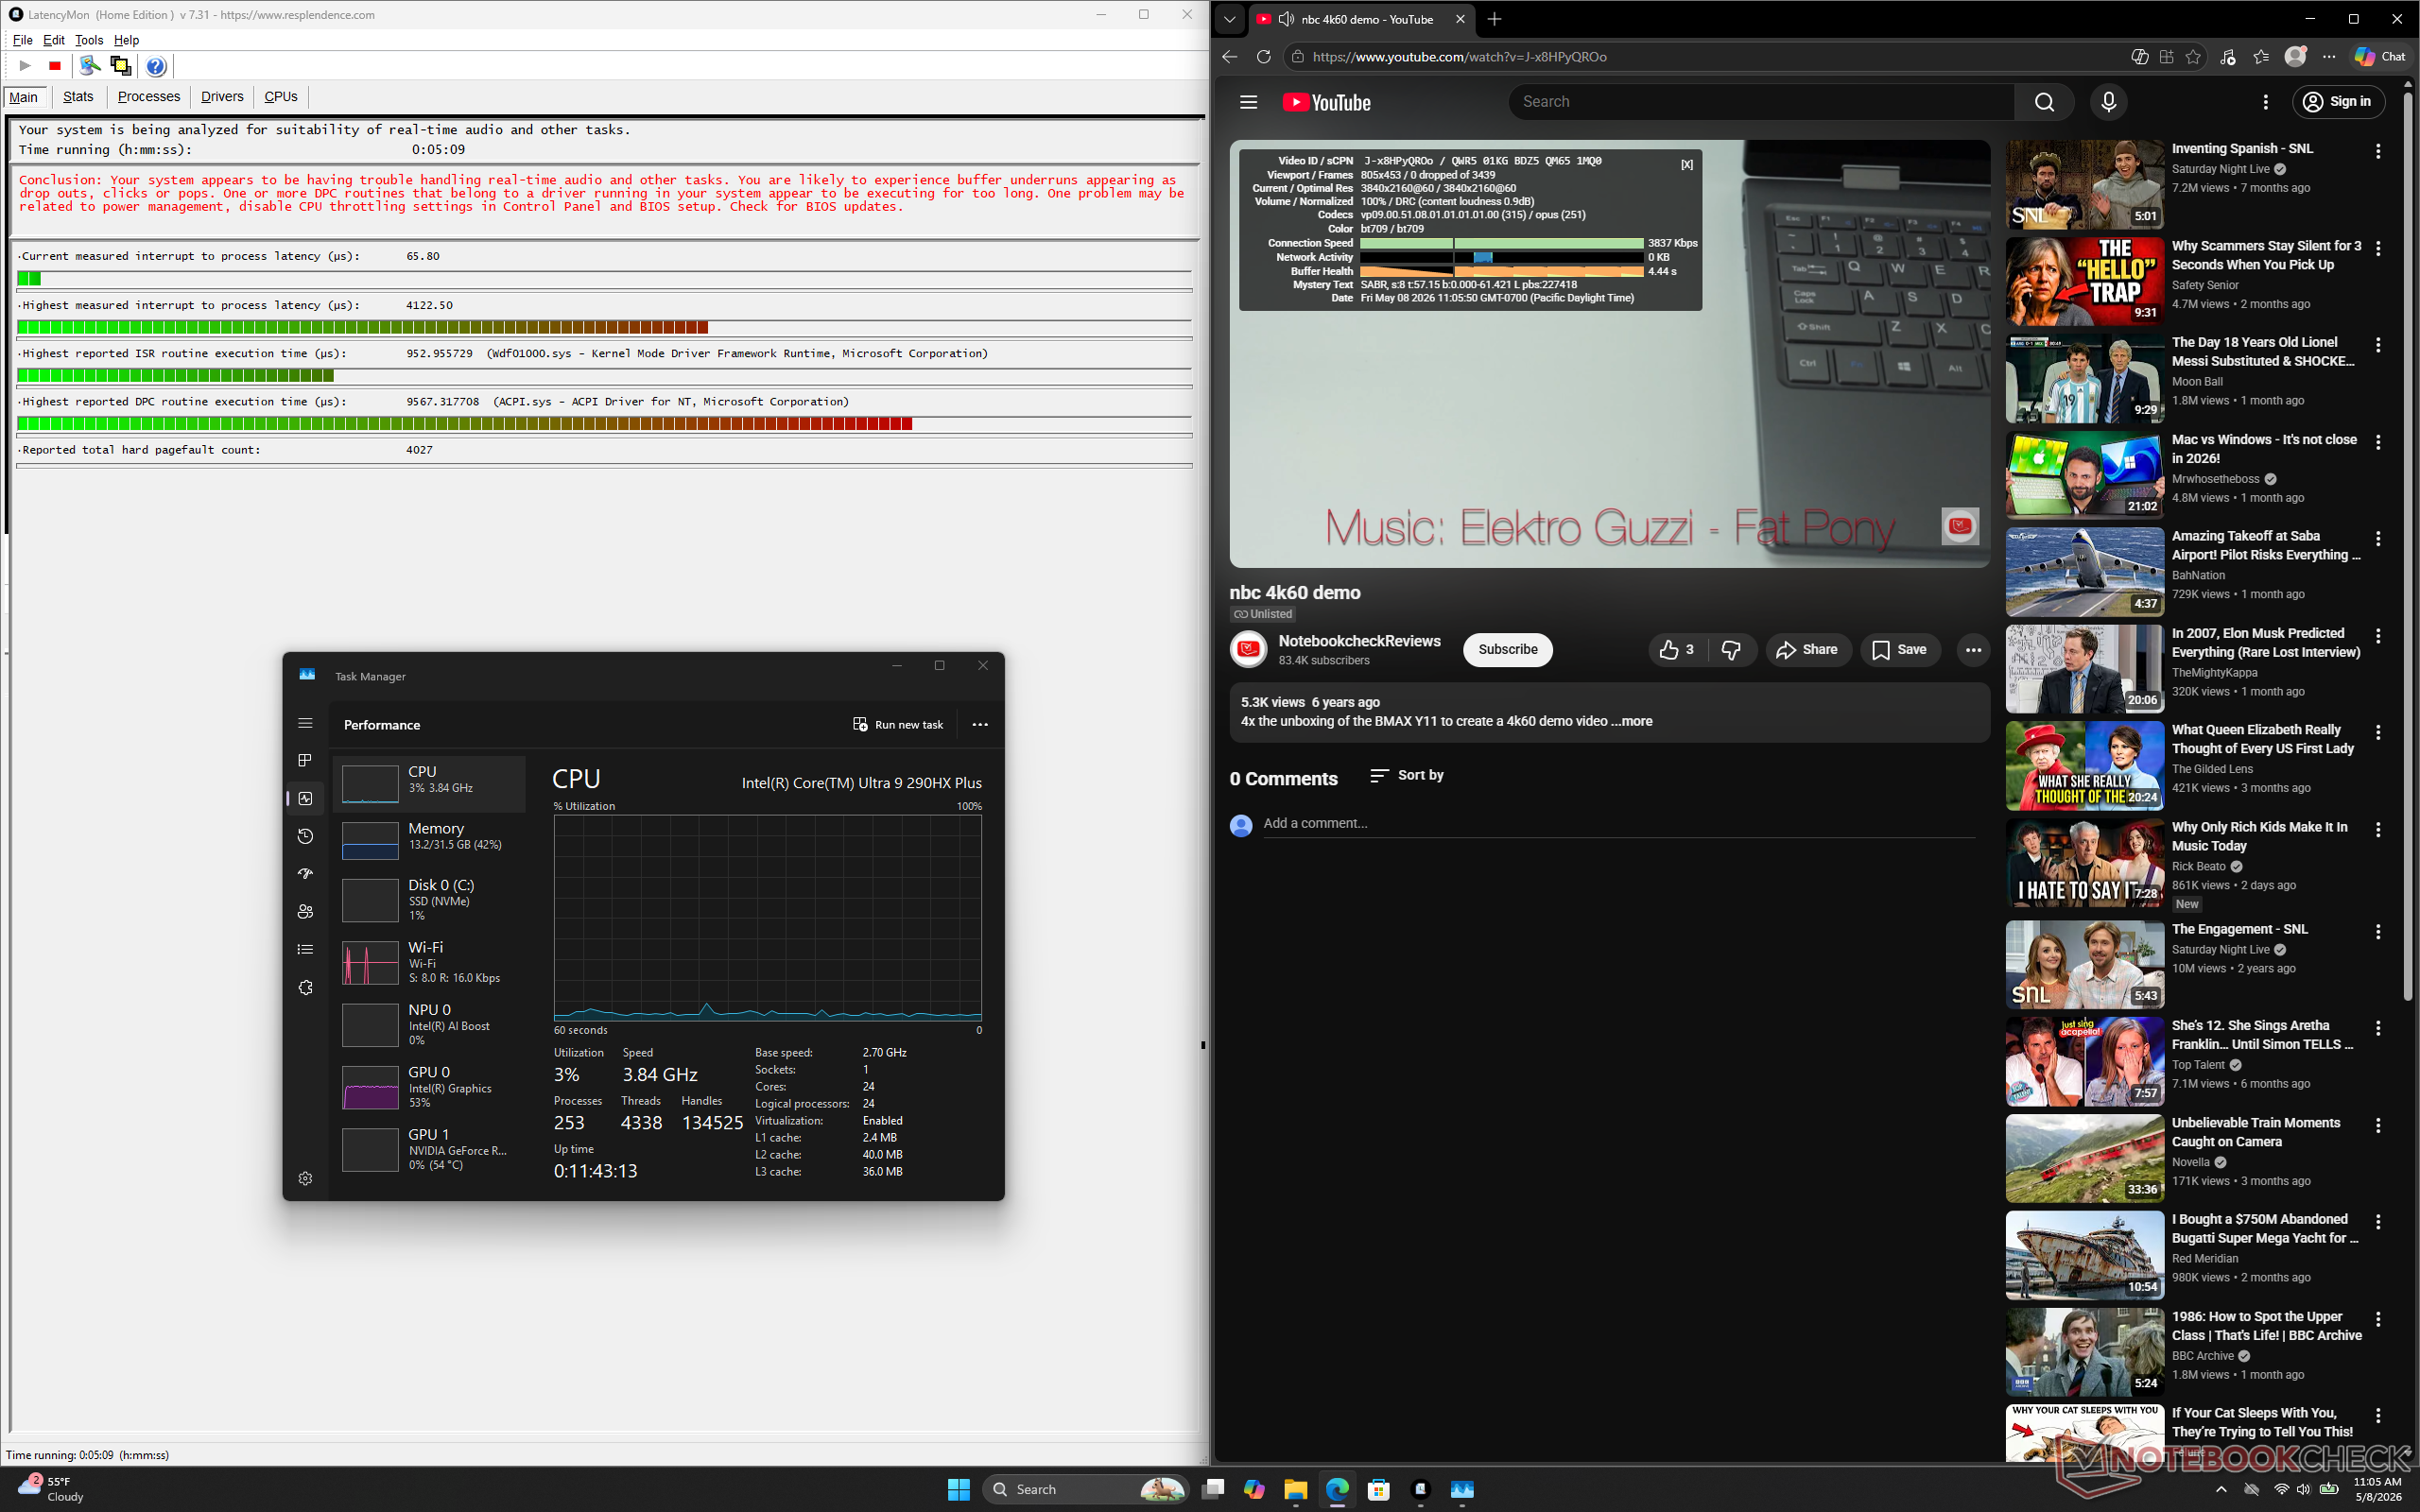
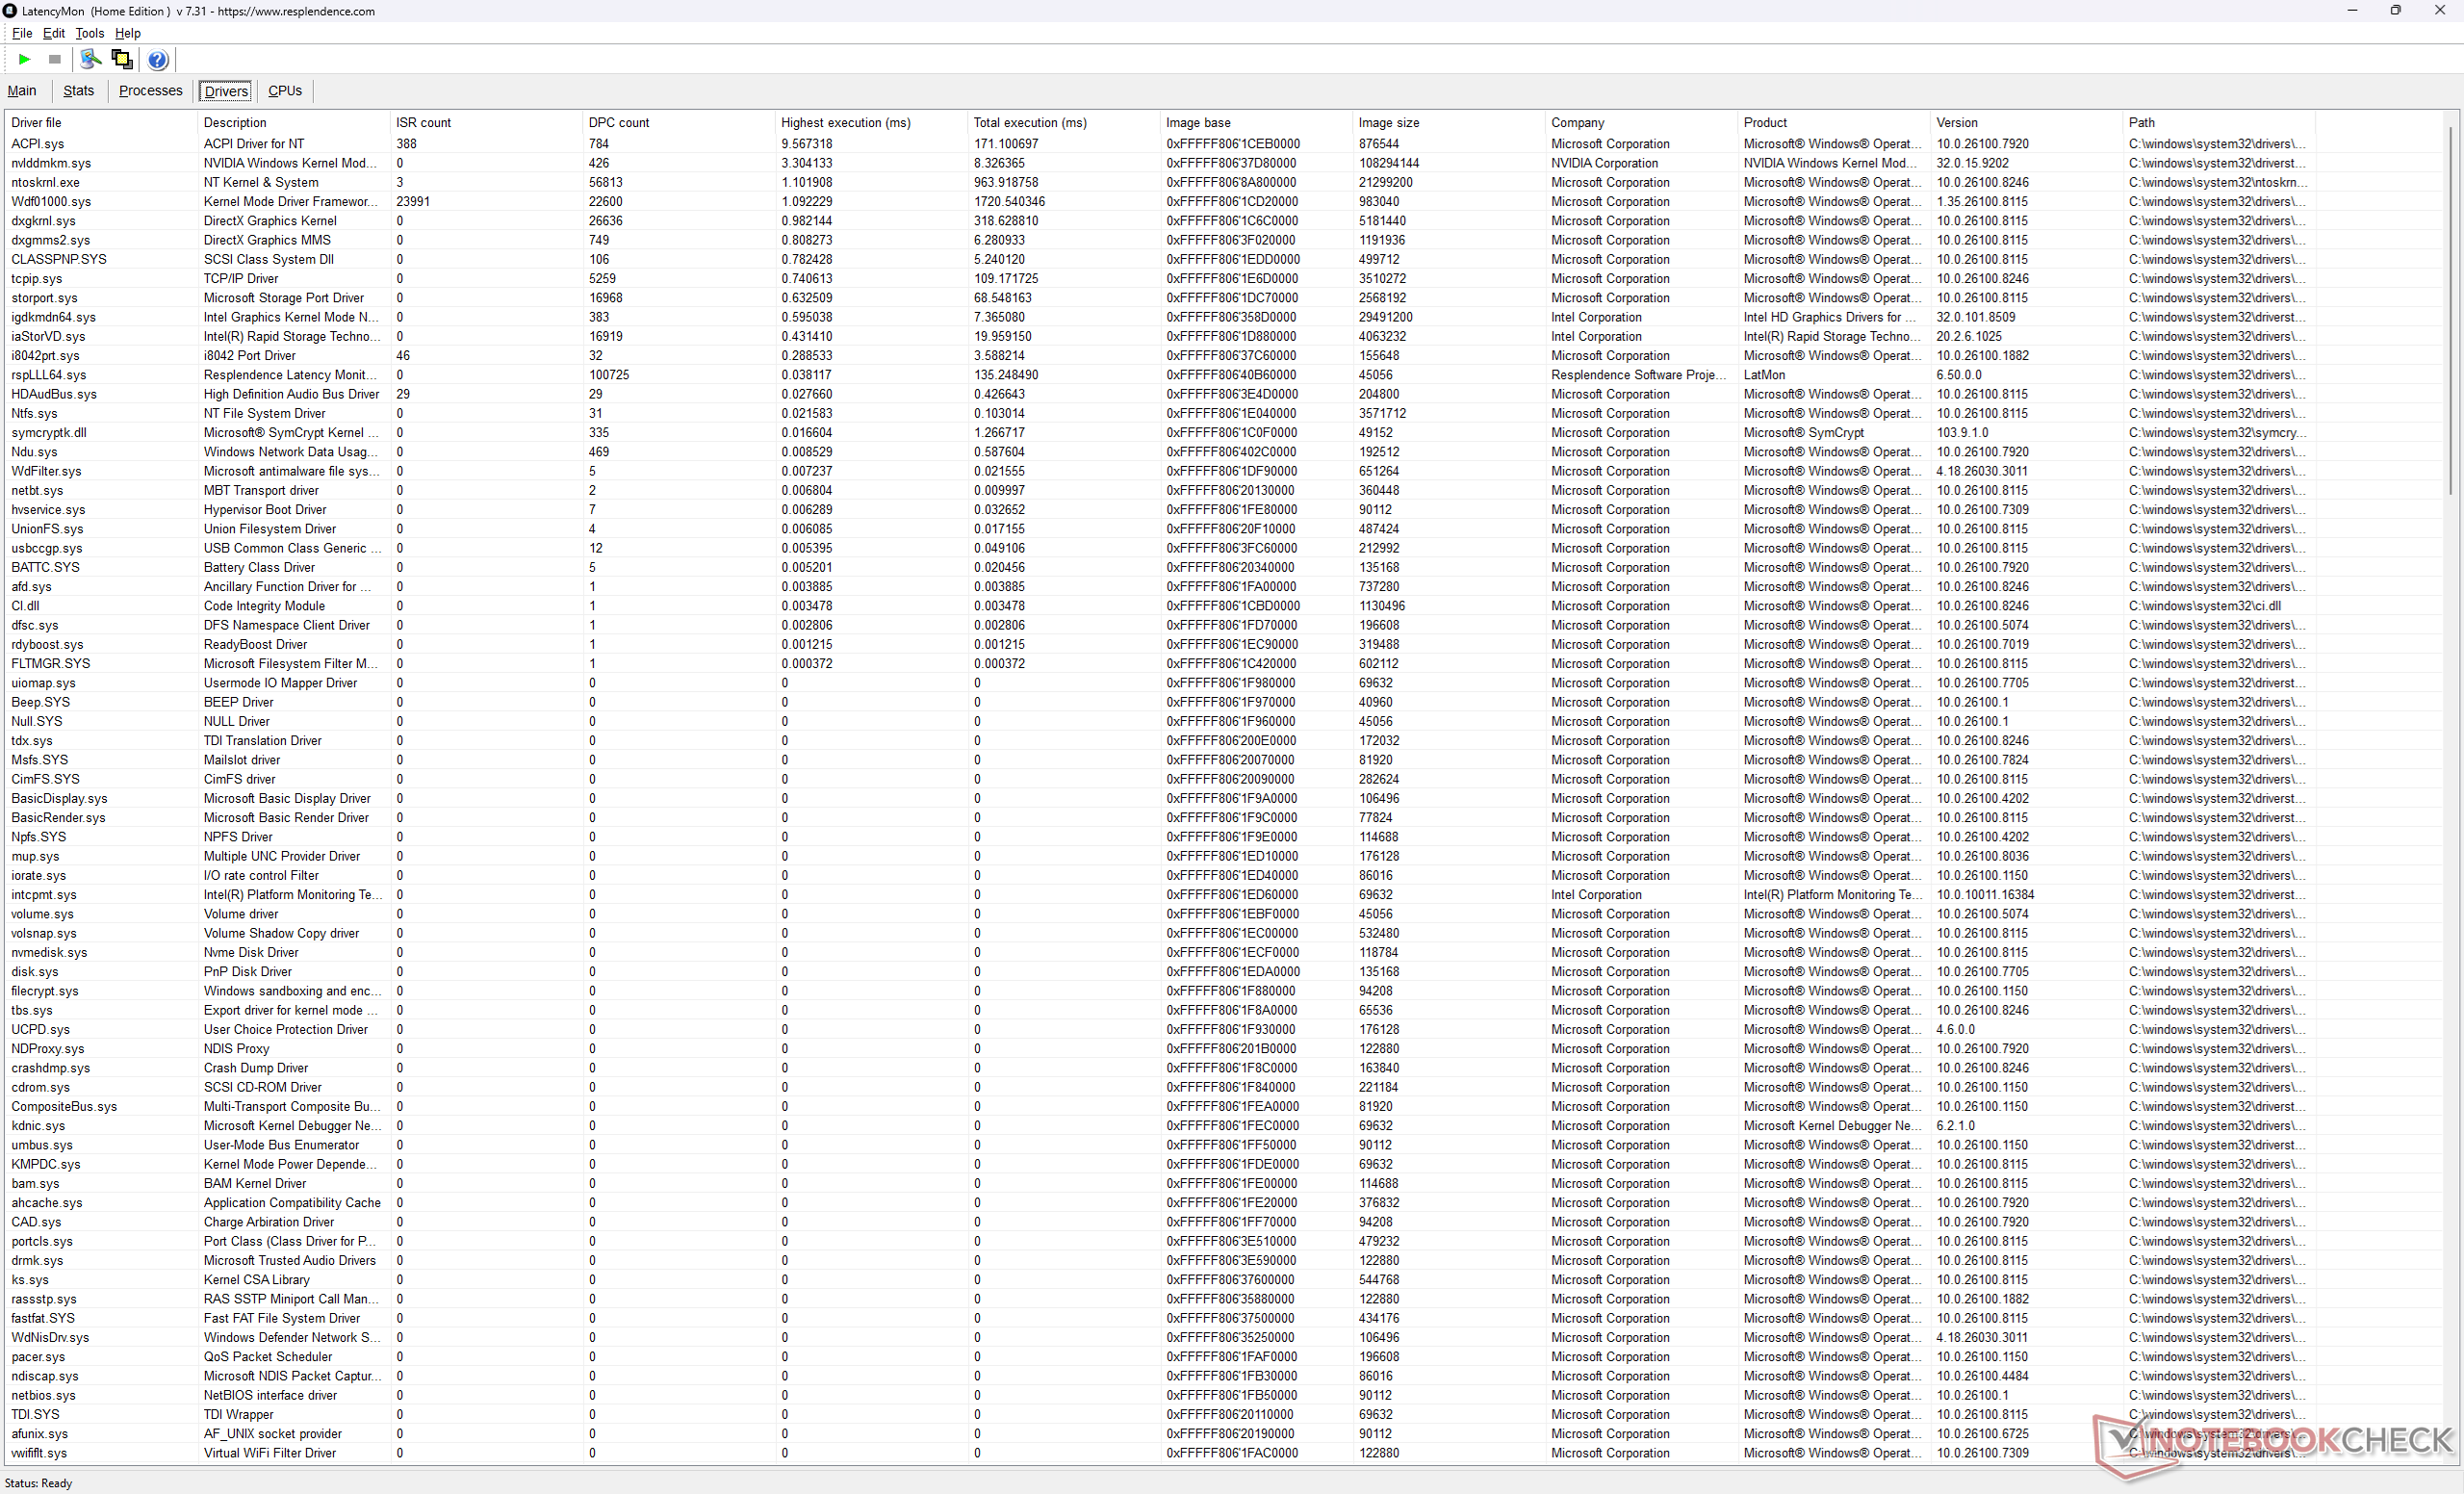
| DPC Latencies / LatencyMon - interrupt to process latency (max), Web, Youtube, Prime95 | |
| MSI Vector 16 HX AI A2XWHG | |
| Alienware 16X Aurora Core Ultra 9 290HX Plus | |
| Acer Predator Helios Neo 16S AI PHN16S-71-94L9 | |
| Alienware 16X Aurora, RTX 5070 | |
| Asus ROG Zephyrus G16 GU605CW | |
| Lenovo Legion Pro 5 16IAX10, RTX 5070 | |
* ... smaller is better
存储设备
去年的机型配备的是 Micron 2650,而我们的 2026 机型配备的是 Kioxia BG7取代。这款 M.2 2242 PCIe4 x4 NVMe 固态硬盘提供稳定的 ~7000 MB/s 传输速率,没有节流问题,是美光固态硬盘的改进版。
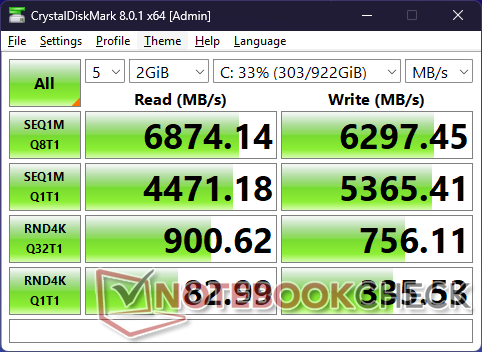
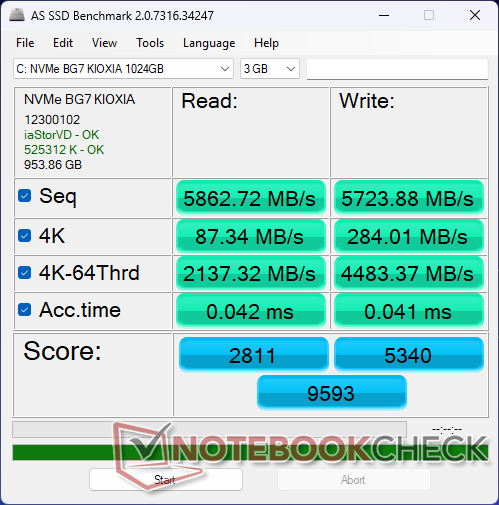

* ... smaller is better
磁盘节流DiskSpd 读取循环,队列深度 8
图形处理器性能
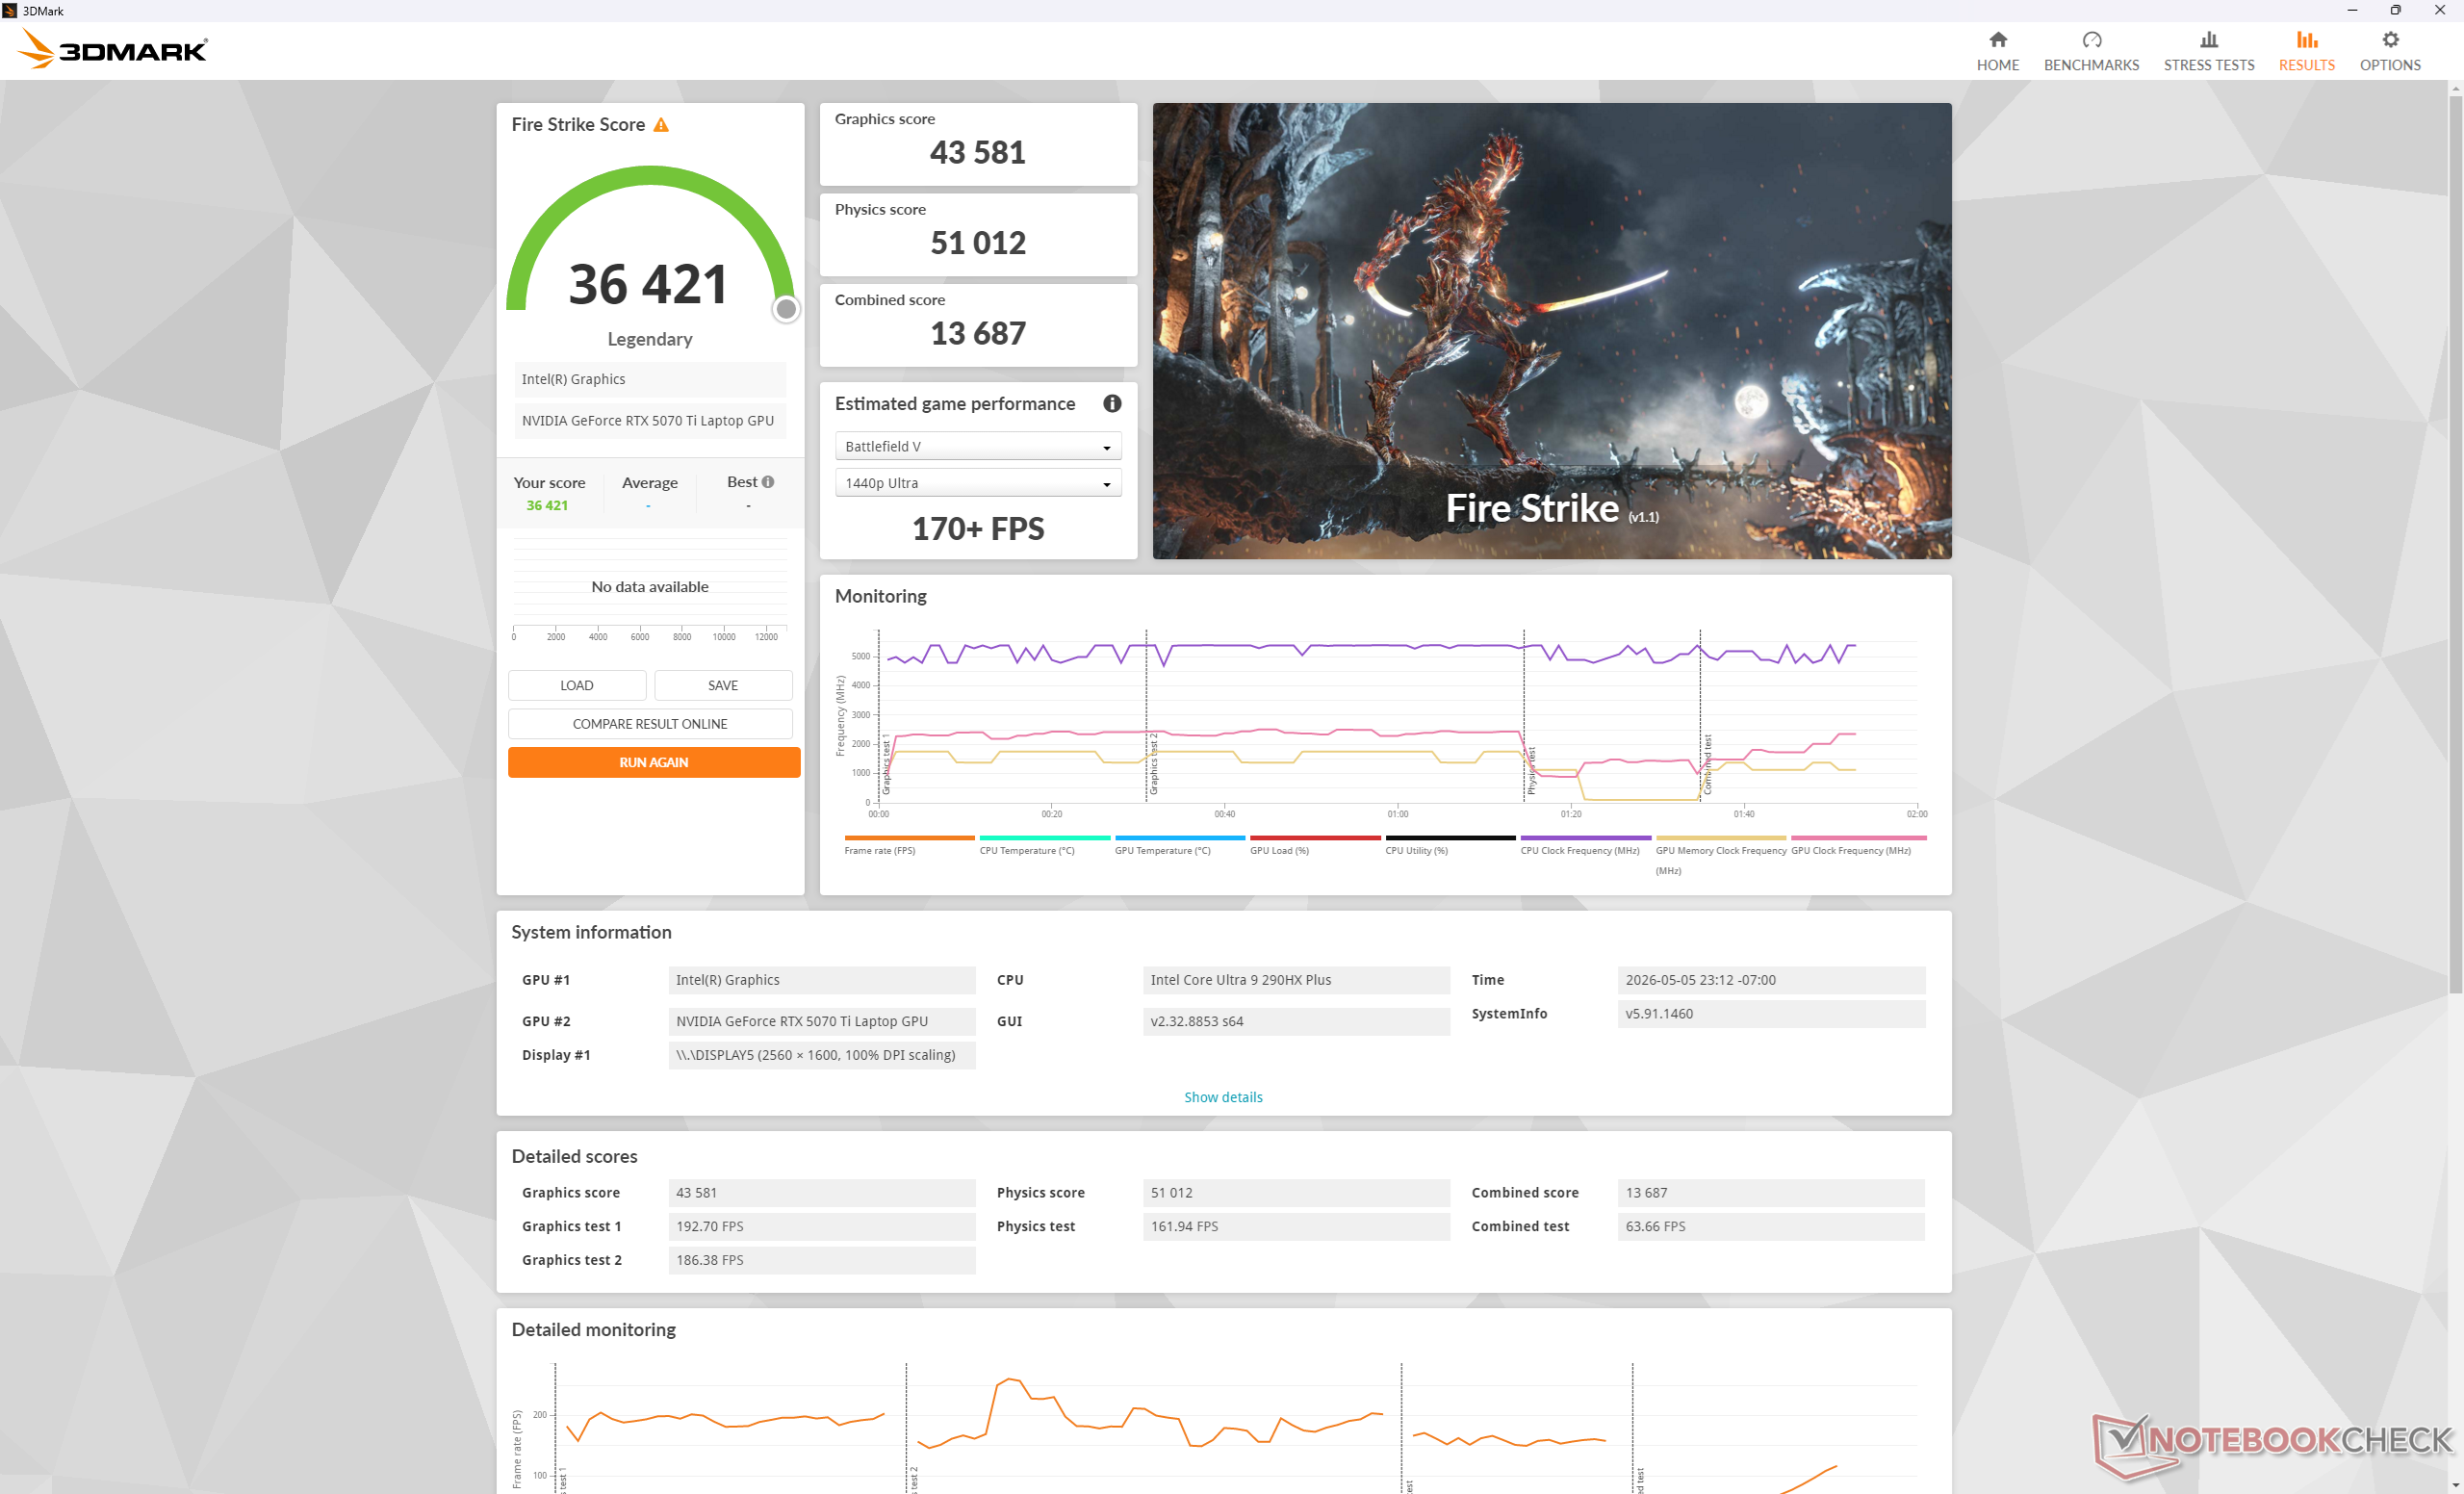
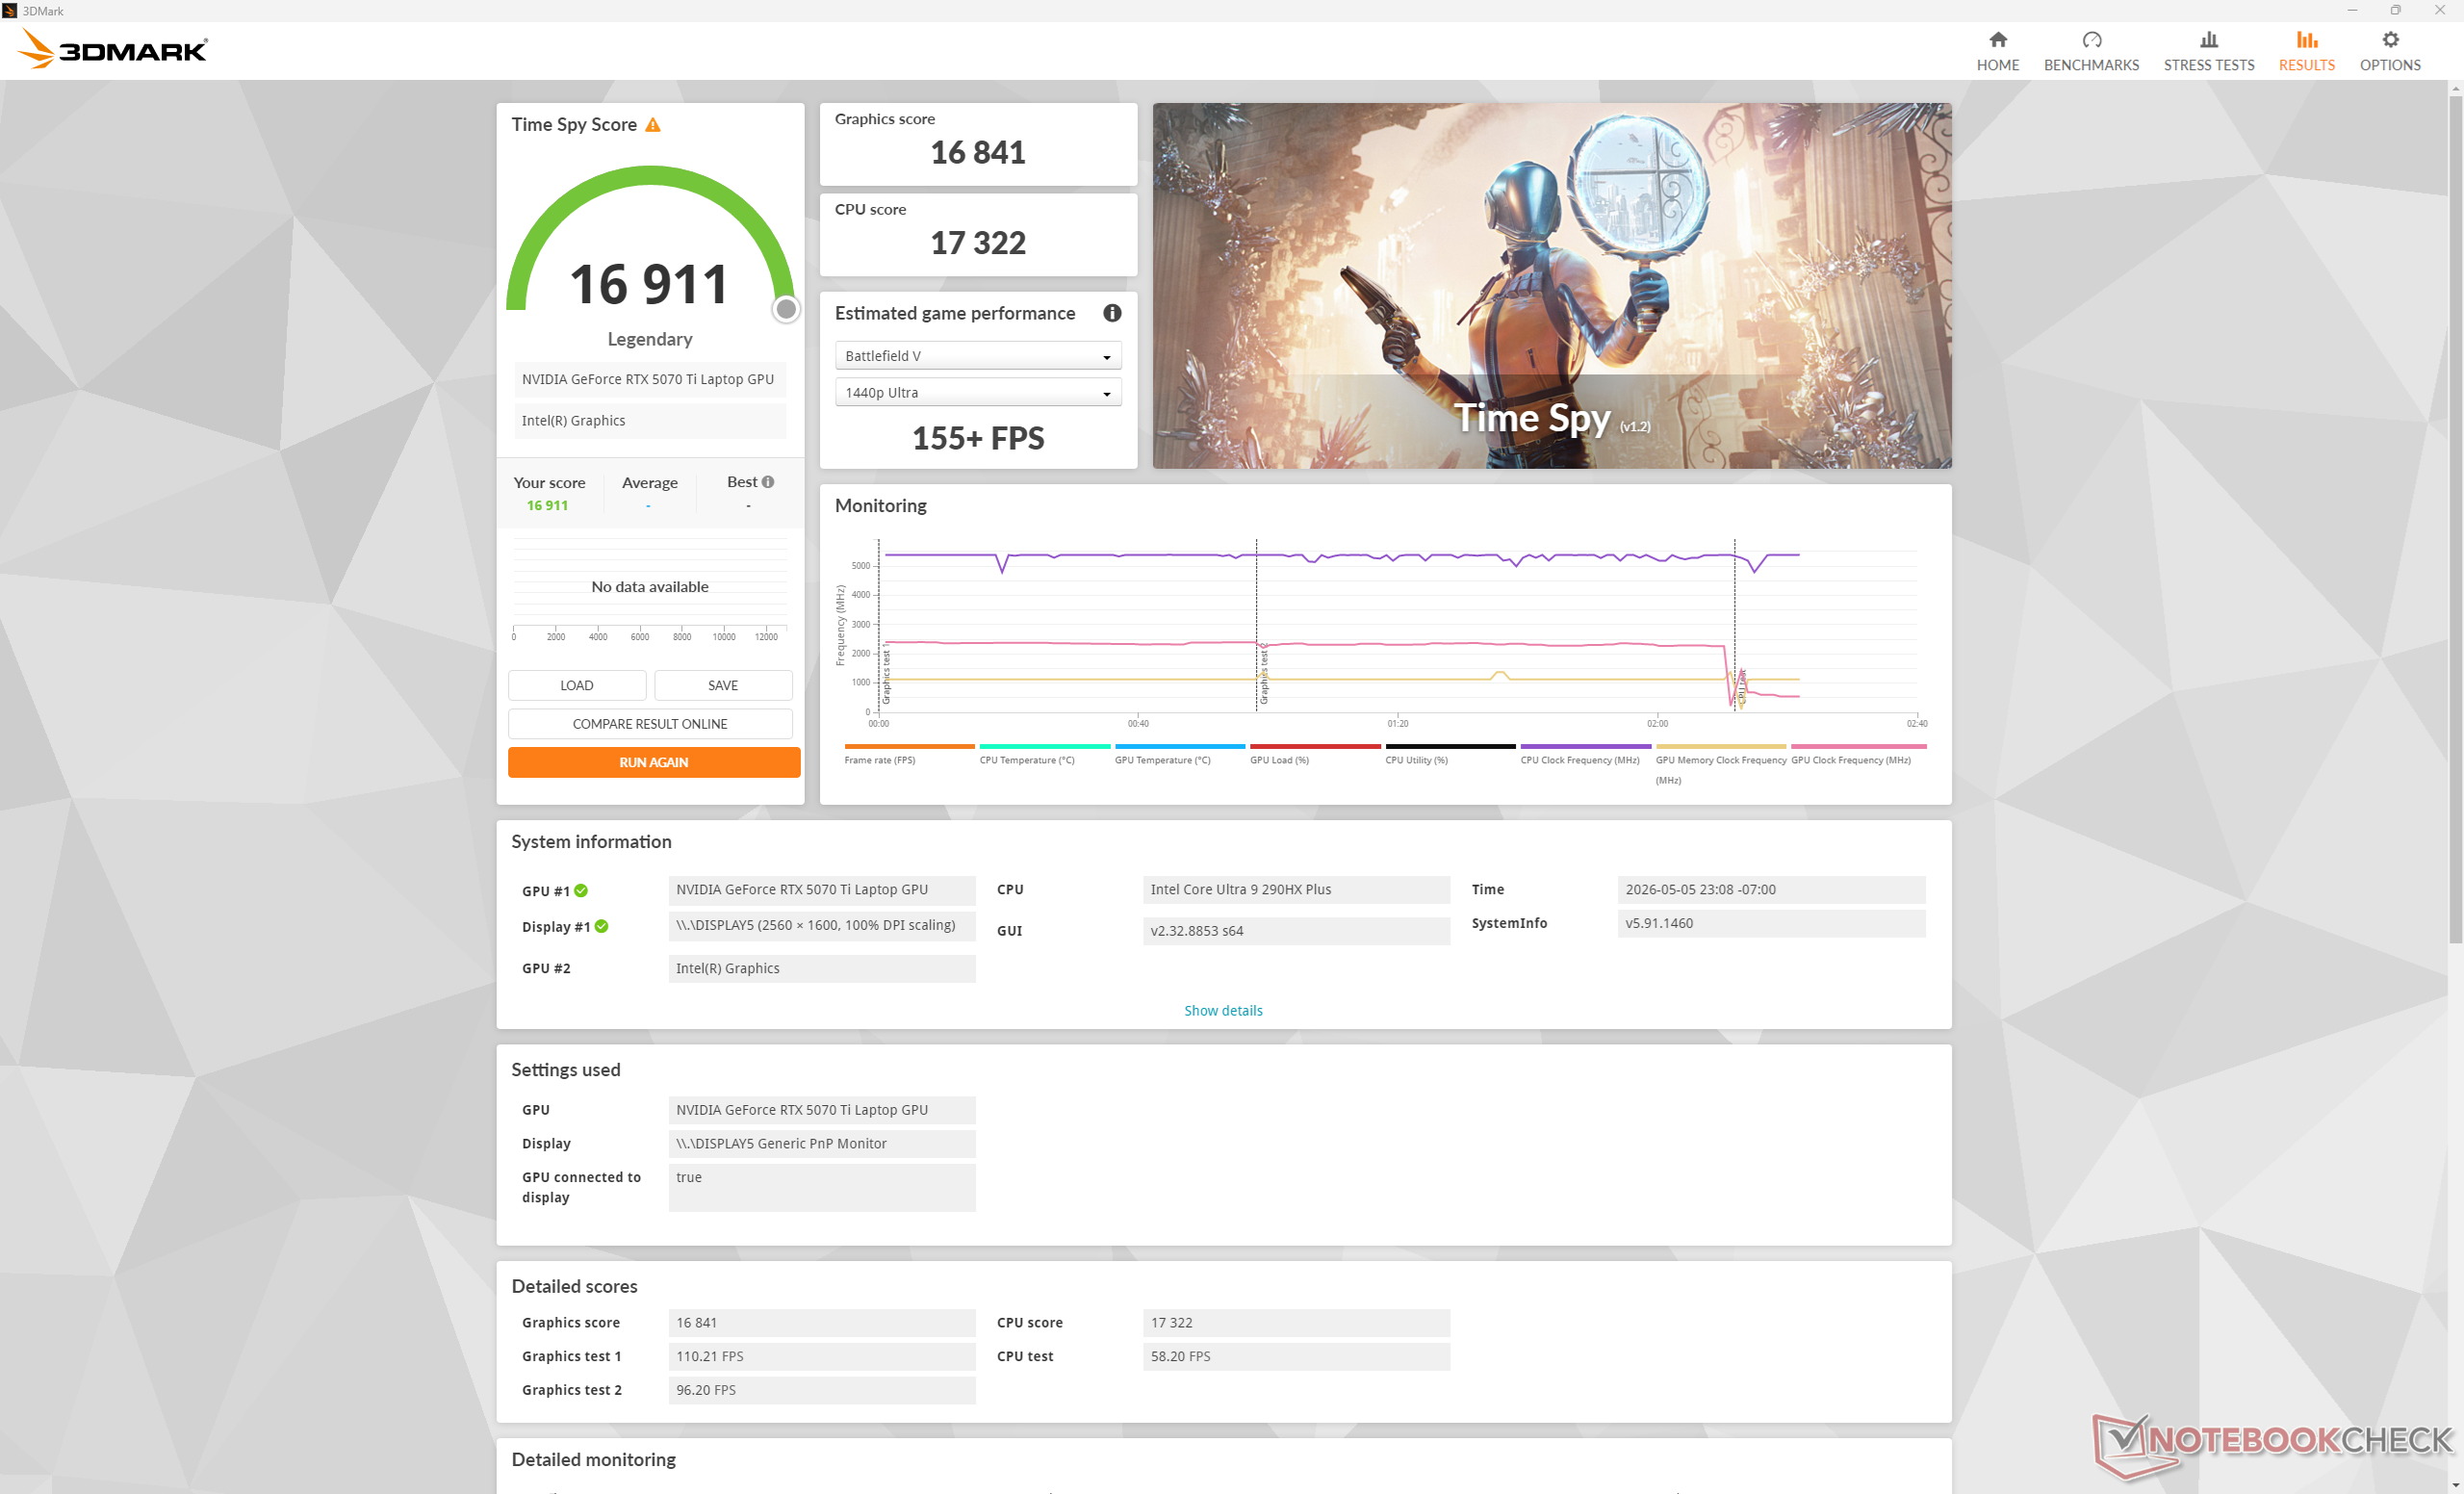
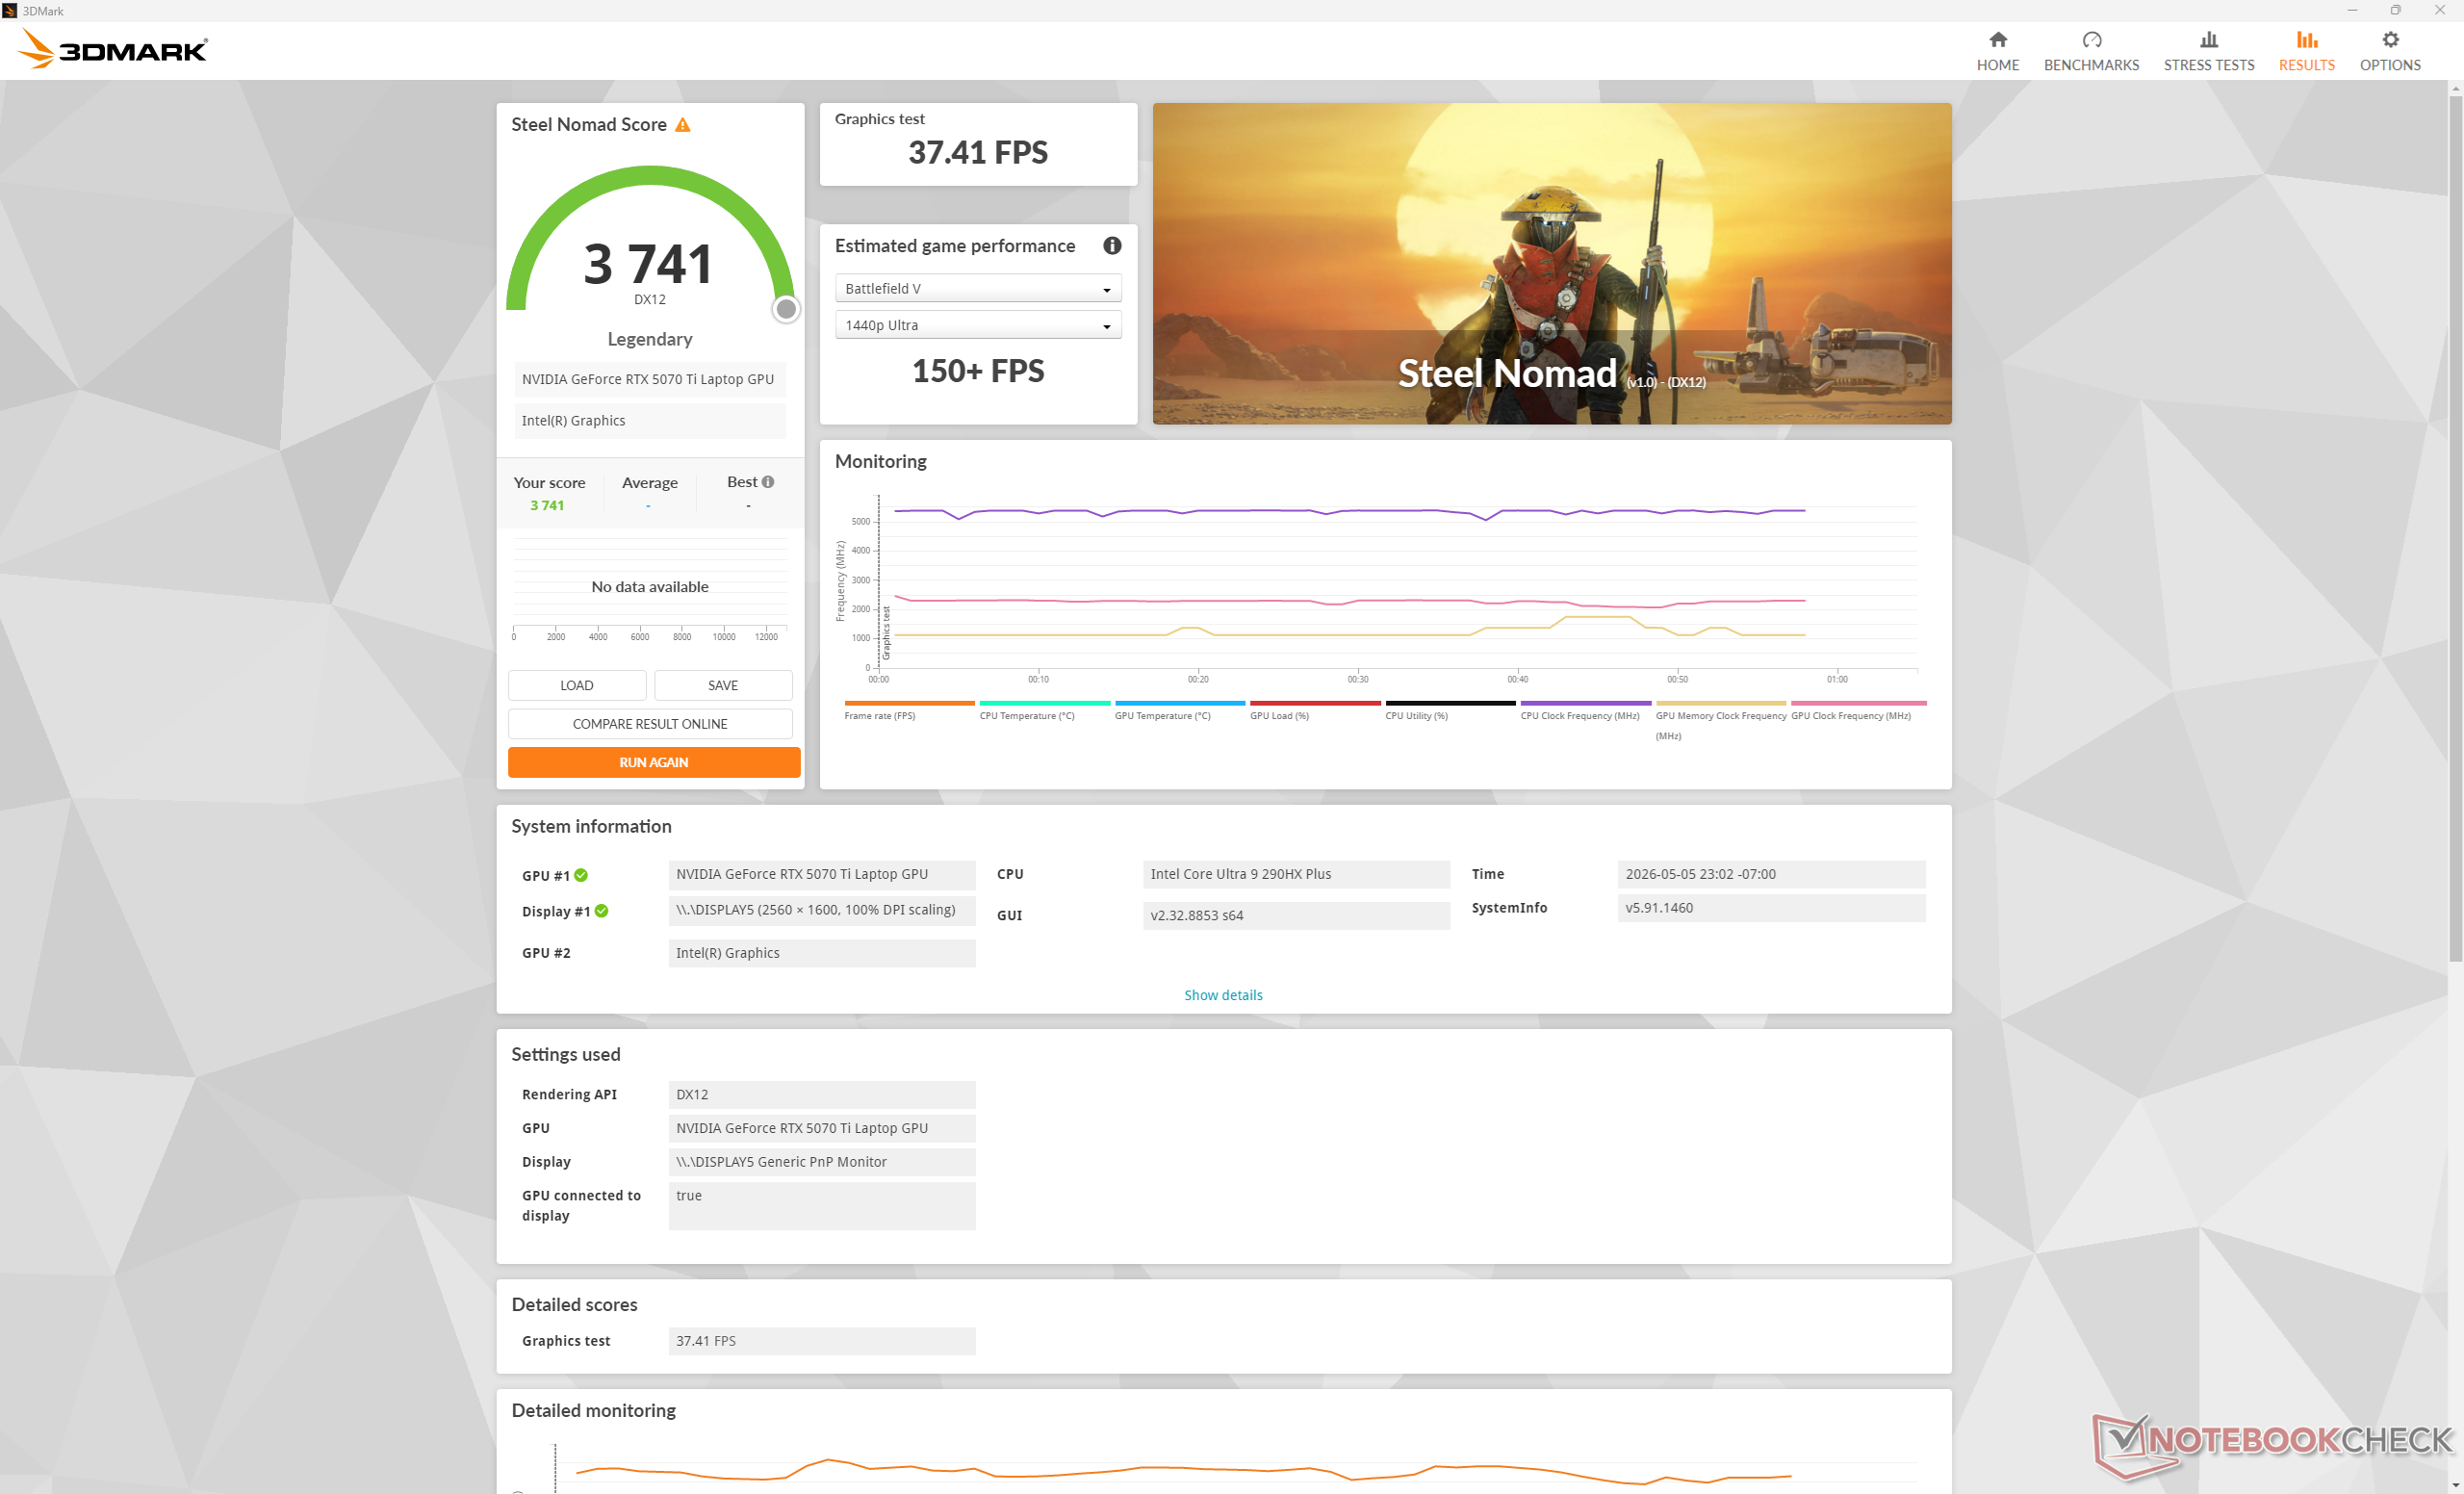
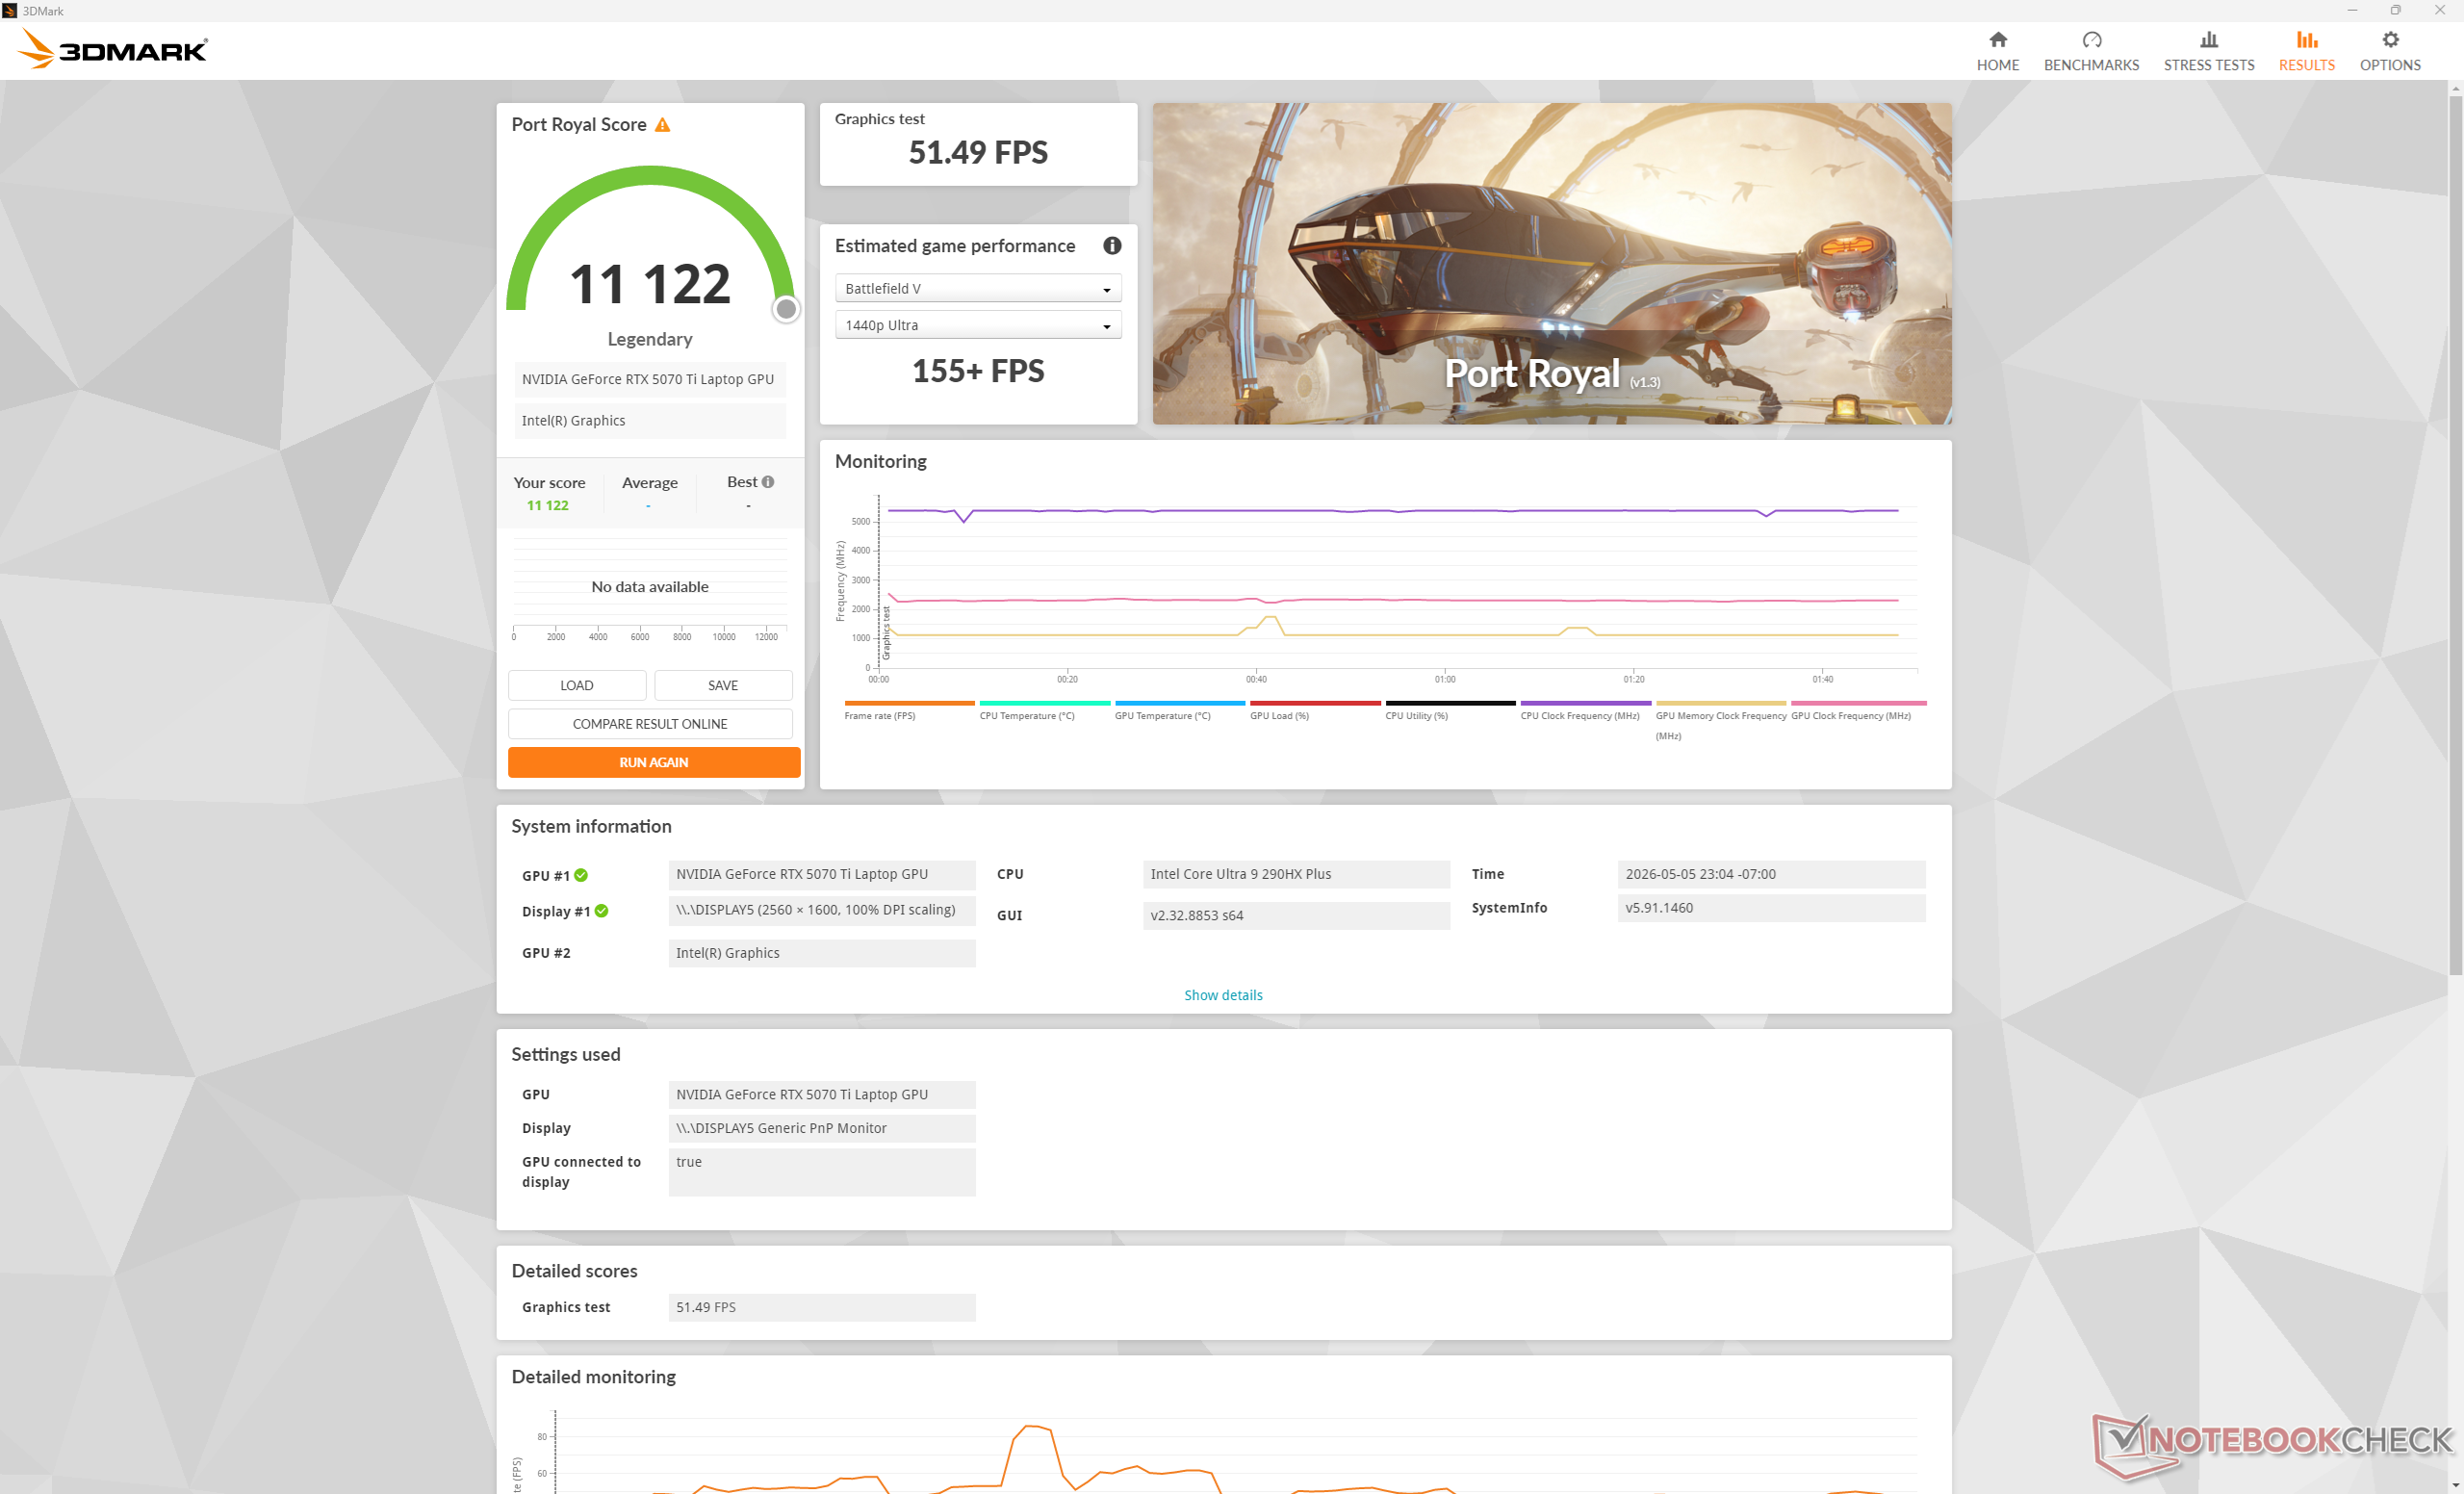
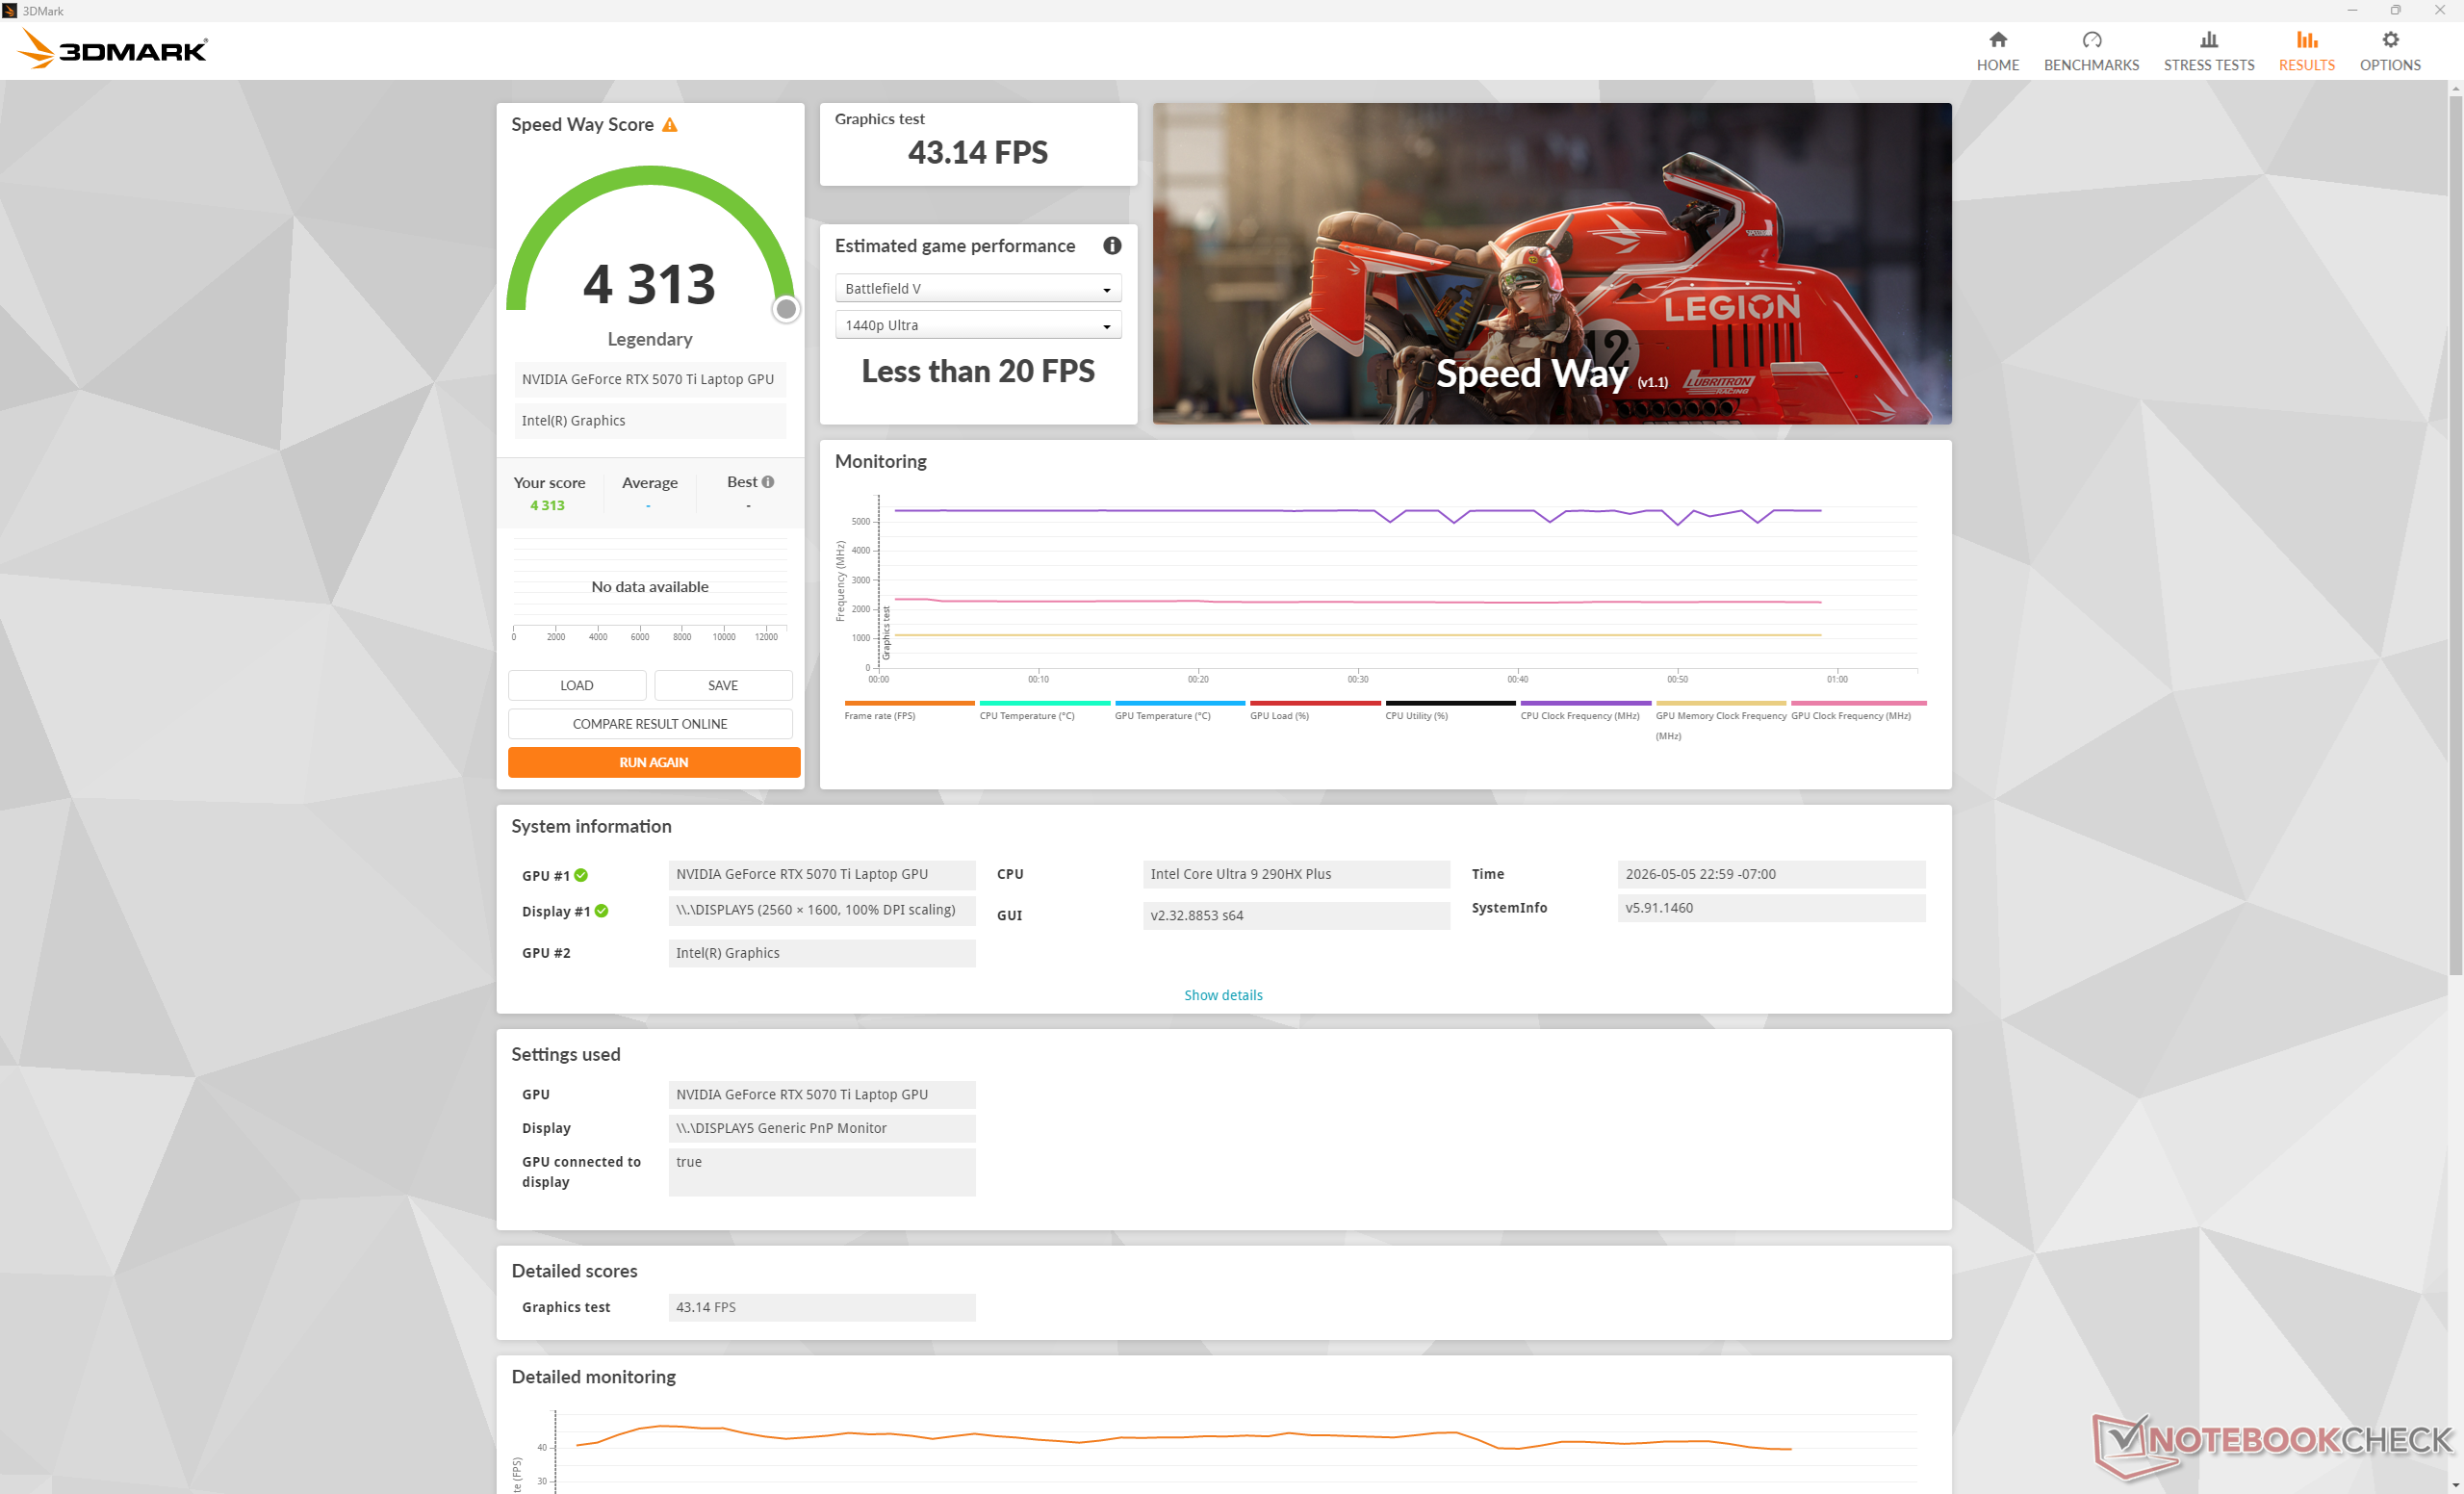
手机 GeForce RTX 5070 Ti比 移动 RTX 5070快 20%。最值得注意的是,移动 RTX 5070 Ti 的 VRAM 比移动 RTX 5070 Ti 的 移动 RTX 5070或更低。
请注意,运行在性能模式而非超频模式下几乎不会影响性能,如下图Time Spy 结果所示。直到进一步降至平衡模式,游戏性能才会明显受到影响。
| 电源配置文件 | 图形分数 | 物理得分 | 综合得分 |
| 超速模式 | 16841 | 17322 | 16911 |
| 性能模式 | 16458 (-2%) | 17318 (-0%) | 16581 (-2%) |
| 平衡模式 | 15234 (-10%) | 17079 (-1%) | 15484 (-8%) |
| 电池电量 | 11934 (-29%) | 14833 (-14%) | 12294 (-27%) |
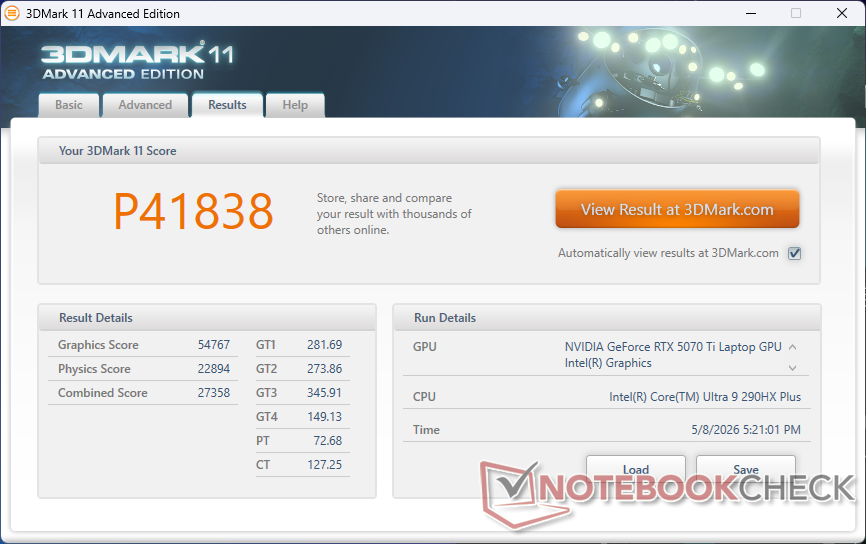
| 3DMark 11 Performance | 41838 points | |
| 3DMark Cloud Gate Standard Score | 72346 points | |
| 3DMark Fire Strike Score | 36421 points | |
| 3DMark Time Spy Score | 16581 points | |
| 3DMark Steel Nomad Score | 3741 points | |
Help | ||
* ... smaller is better
游戏性能
游戏性能比配备GeForce RTX 5070 的 2025 16X Aurora 平均快约 15%。
| GTA V - 1920x1080 Highest AA:4xMSAA + FX AF:16x | |
| Alienware 16X Aurora Core Ultra 9 290HX Plus | |
| Alienware 16X Aurora, RTX 5070 | |
| Lenovo Legion Pro 5 16IAX10, RTX 5070 | |
| Acer Predator Helios Neo 16S AI PHN16S-71-94L9 | |
| MSI Vector 16 HX AI A2XWHG | |
| Final Fantasy XV Benchmark - 1920x1080 High Quality | |
| MSI Vector 16 HX AI A2XWHG | |
| Alienware 16X Aurora Core Ultra 9 290HX Plus | |
| Alienware 16X Aurora, RTX 5070 | |
| Lenovo Legion Pro 5 16IAX10, RTX 5070 | |
| Asus ROG Zephyrus G16 2025 5070 Ti | |
| Strange Brigade - 1920x1080 ultra AA:ultra AF:16 | |
| Alienware 16X Aurora Core Ultra 9 290HX Plus | |
| Asus ROG Zephyrus G16 2025 5070 Ti | |
| Alienware 16X Aurora, RTX 5070 | |
| Lenovo Legion Pro 5 16IAX10, RTX 5070 | |
赛博朋克 2077》超 FPS 图表
| low | med. | high | ultra | QHD DLSS | QHD | |
|---|---|---|---|---|---|---|
| GTA V (2015) | 187.6 | 187.2 | 184.9 | 159.2 | 134.4 | |
| Dota 2 Reborn (2015) | 236 | 207 | 199.9 | 184.7 | ||
| Final Fantasy XV Benchmark (2018) | 233 | 209 | 161.1 | 120.3 | ||
| X-Plane 11.11 (2018) | 154.1 | 137.3 | 110.4 | |||
| Strange Brigade (2018) | 572 | 337 | 281 | 314 | 210 | |
| Baldur's Gate 3 (2023) | 181.6 | 162.4 | 159.3 | 157.7 | 109.5 | |
| Cyberpunk 2077 (2023) | 171.3 | 146.5 | 126.1 | 114.9 | 86.9 | 75.1 |
| F1 24 (2024) | 324 | 318 | 268 | 97.7 | 99 | 62.8 |
| Black Myth: Wukong (2024) | 126 | 94 | 73 | 42 | 47 | 31 |
| Assassin's Creed Shadows (2025) | 89 | 83 | 71 | 52 | 54 | 44 |
排放量
系统噪音
即使设置为 Optimus 和平衡功率配置文件,当引入较高负载时,风扇转速也会发生快速而突然的变化。在其他方面,风扇噪音上限读数与 2025 型号几乎完全相同,因此 2026 型号在游戏时的噪音并不大或更小。
在平衡、性能和超频模式下运行《赛博朋克 2077》时,风扇噪音分别稳定在 48.7 dB(A)、51.5 dB(A) 和 59.8 dB(A) 左右。由于超频模式下的性能提升非常小,我们建议改用性能模式进行游戏,因为风扇噪音会明显降低。
Noise level
| Idle |
| 23.8 / 23.8 / 31.4 dB(A) |
| Load |
| 48.7 / 59.8 dB(A) |
 | ||
30 dB silent 40 dB(A) audible 50 dB(A) loud |
||
min: | ||
| Alienware 16X Aurora Core Ultra 9 290HX Plus Ultra 9 290HX Plus, GeForce RTX 5070 Ti Laptop | Alienware 16X Aurora, RTX 5070 Ultra 9 275HX, GeForce RTX 5070 Laptop | Acer Predator Helios Neo 16S AI PHN16S-71-94L9 Ultra 9 275HX, GeForce RTX 5070 Ti Laptop | Lenovo Legion Pro 5 16IAX10, RTX 5070 Ultra 7 255HX, GeForce RTX 5070 Laptop | MSI Vector 16 HX AI A2XWHG Ultra 7 255HX, GeForce RTX 5070 Ti Laptop | Asus ROG Zephyrus G16 GU605CW Ultra 9 285H, GeForce RTX 5080 Laptop | |
|---|---|---|---|---|---|---|
| Noise | 9% | -6% | 8% | -11% | -9% | |
| off / environment * (dB) | 23.4 | 23.7 -1% | 24 -3% | 23 2% | 25 -7% | 25.56 -9% |
| Idle Minimum * (dB) | 23.8 | 23.9 -0% | 24 -1% | 23 3% | 33 -39% | 30 -26% |
| Idle Average * (dB) | 23.8 | 23.9 -0% | 30 -26% | 23 3% | 34 -43% | 30 -26% |
| Idle Maximum * (dB) | 31.4 | 26.1 17% | 35 -11% | 23 27% | 38 -21% | 30 4% |
| Load Average * (dB) | 48.7 | 26.8 45% | 53 -9% | 43.85 10% | 46 6% | 53.55 -10% |
| Cyberpunk 2077 ultra * (dB) | 51.5 | 51.8 -1% | 52 -1% | 50.27 2% | 47 9% | 53.5 -4% |
| Load Maximum * (dB) | 59.8 | 58 3% | 54 10% | 52.9 12% | 49 18% | 54.02 10% |
* ... smaller is better
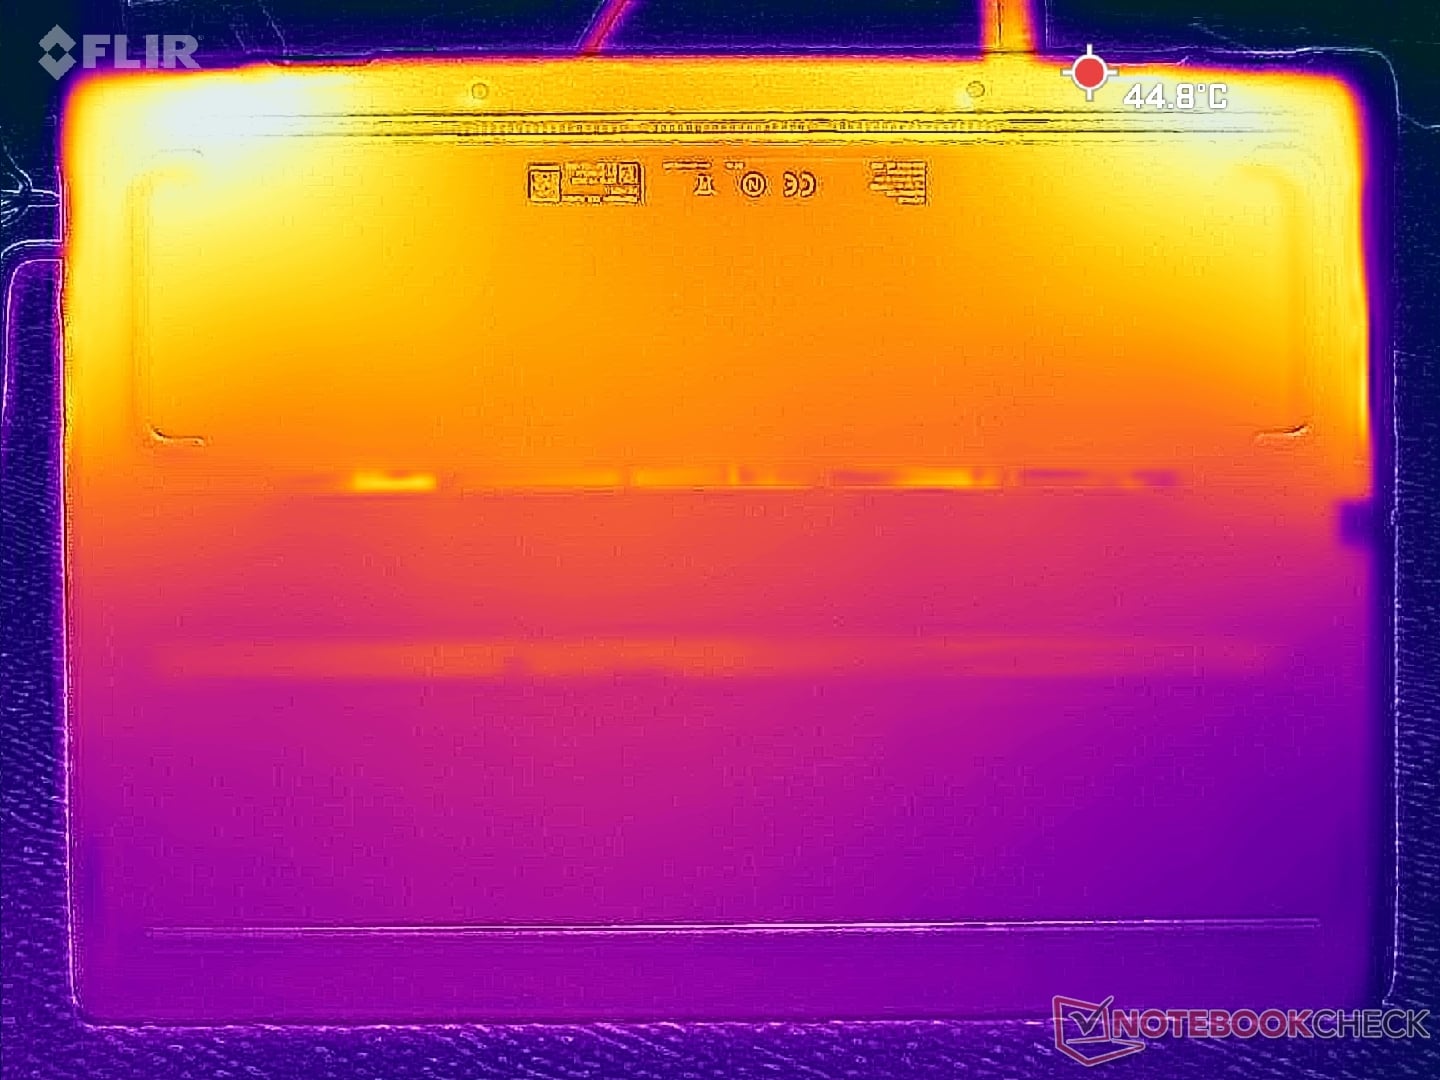
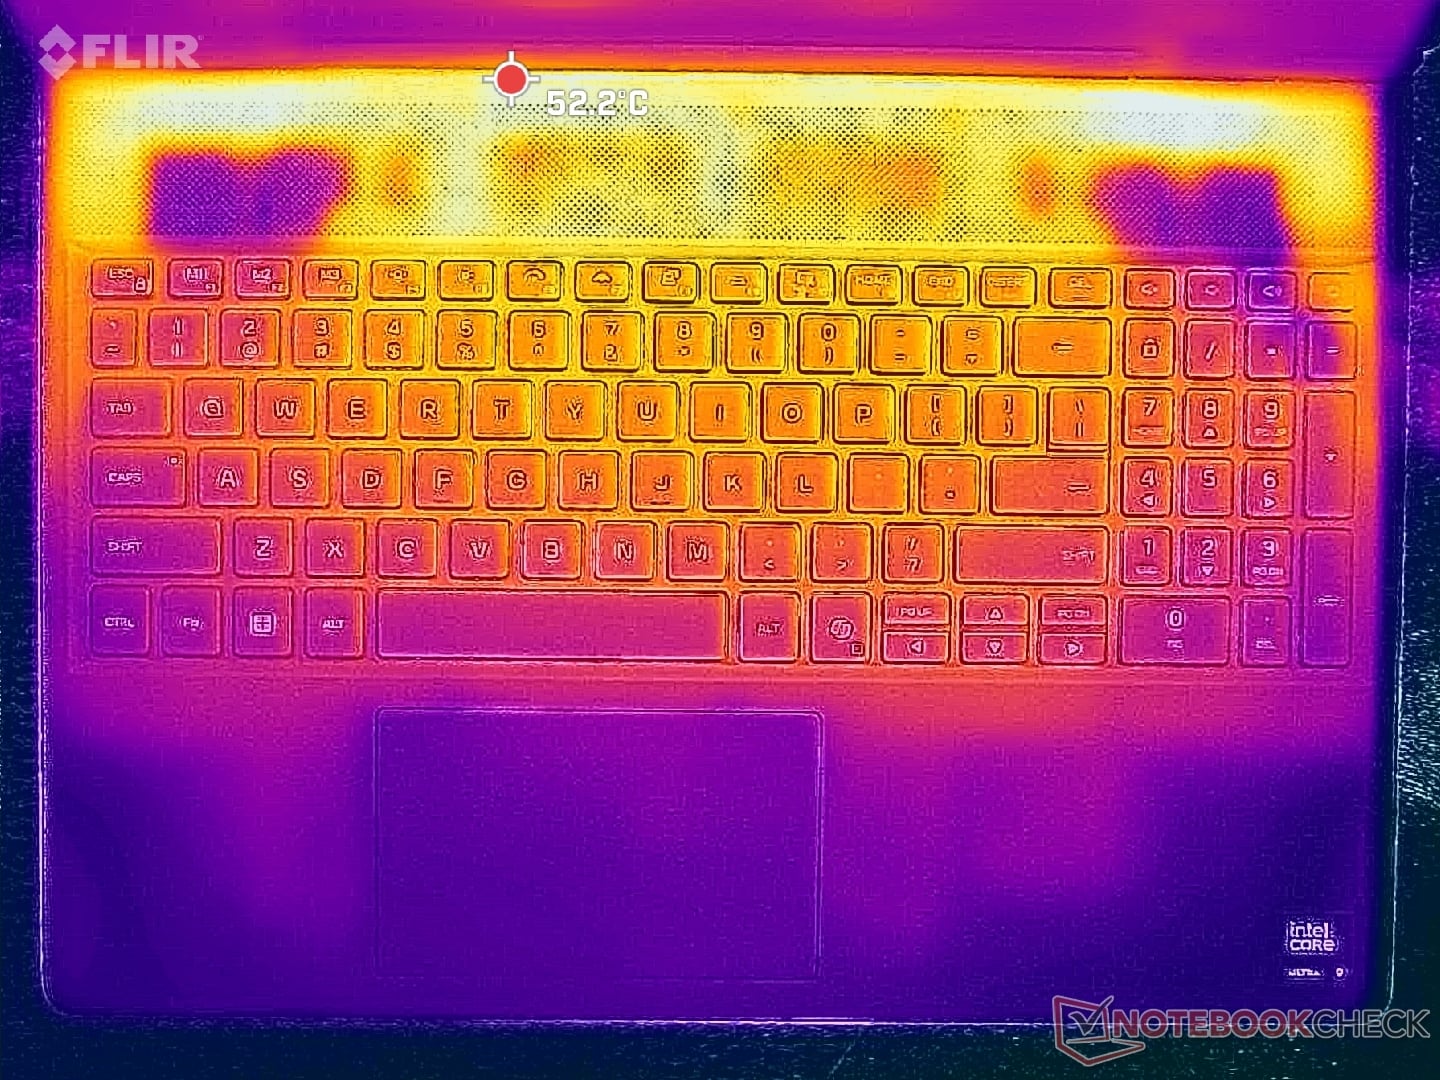
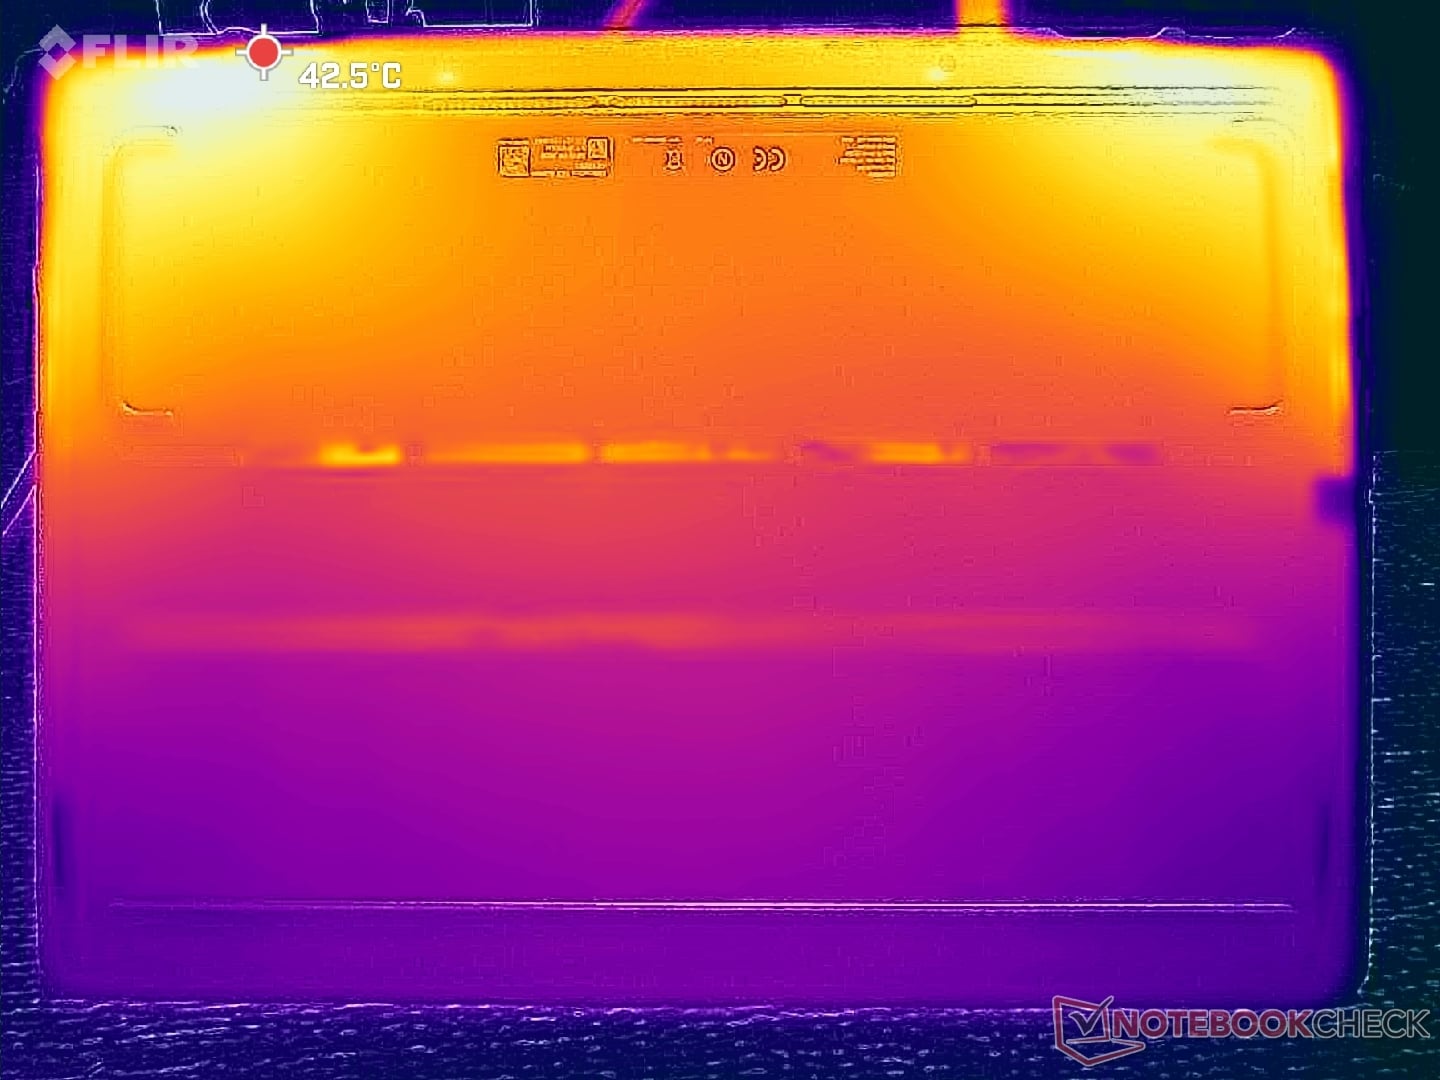
温度
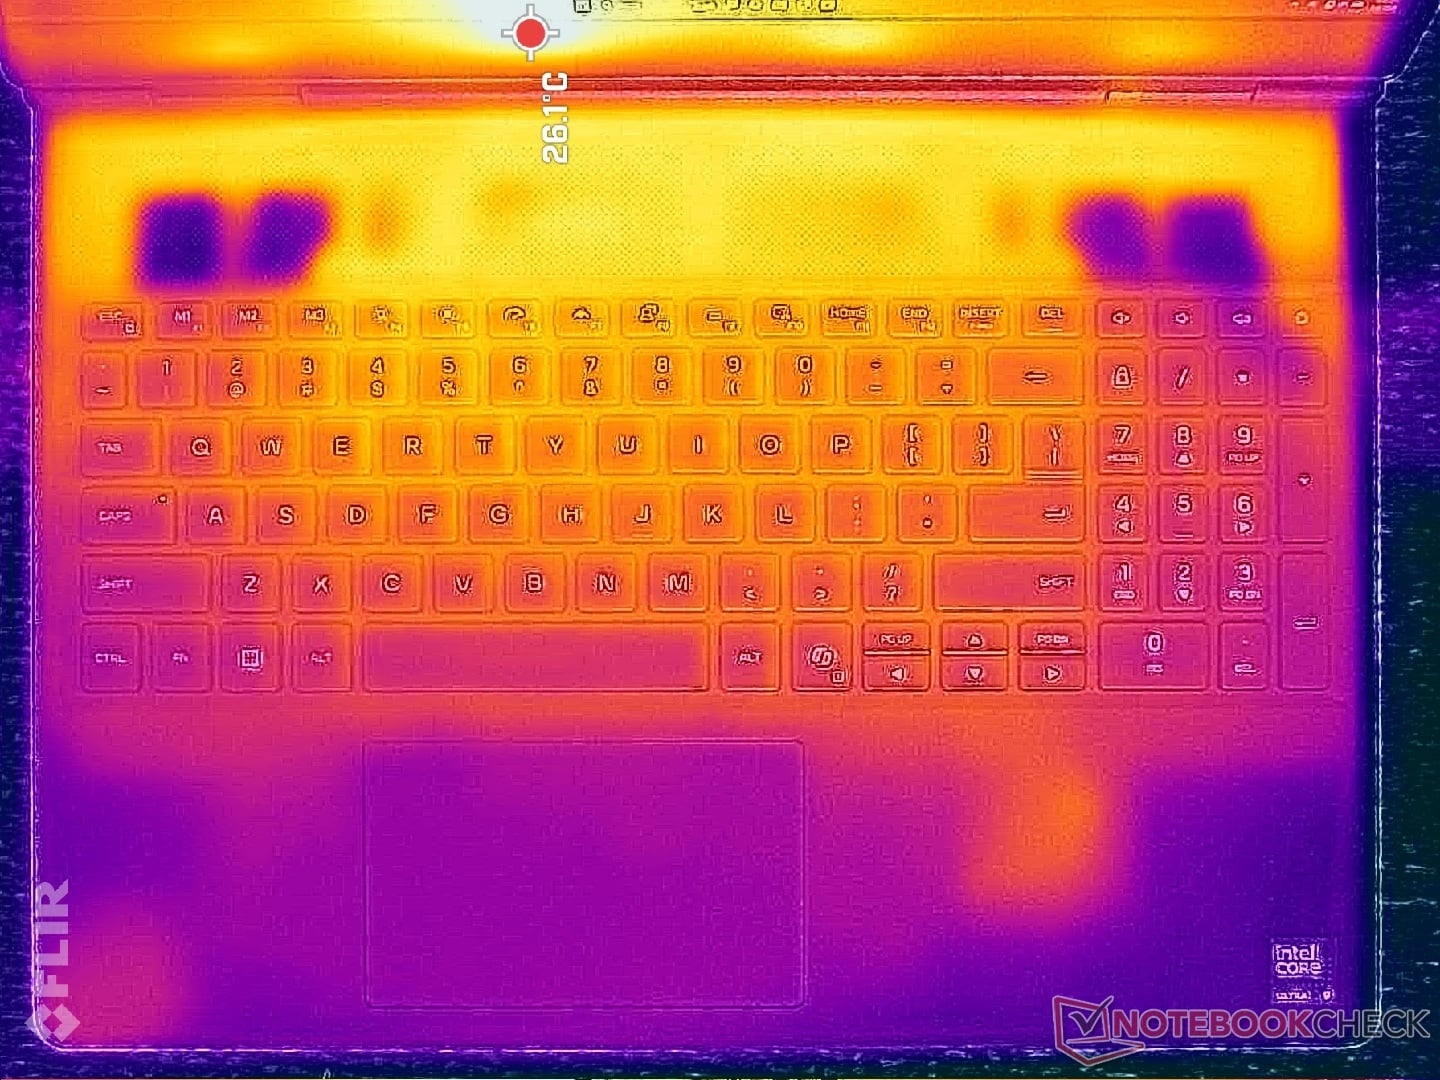
与去年的配置相比,地表温度平均略低几摄氏度。这些结果与我们在下文压力测试部分的分析相吻合。
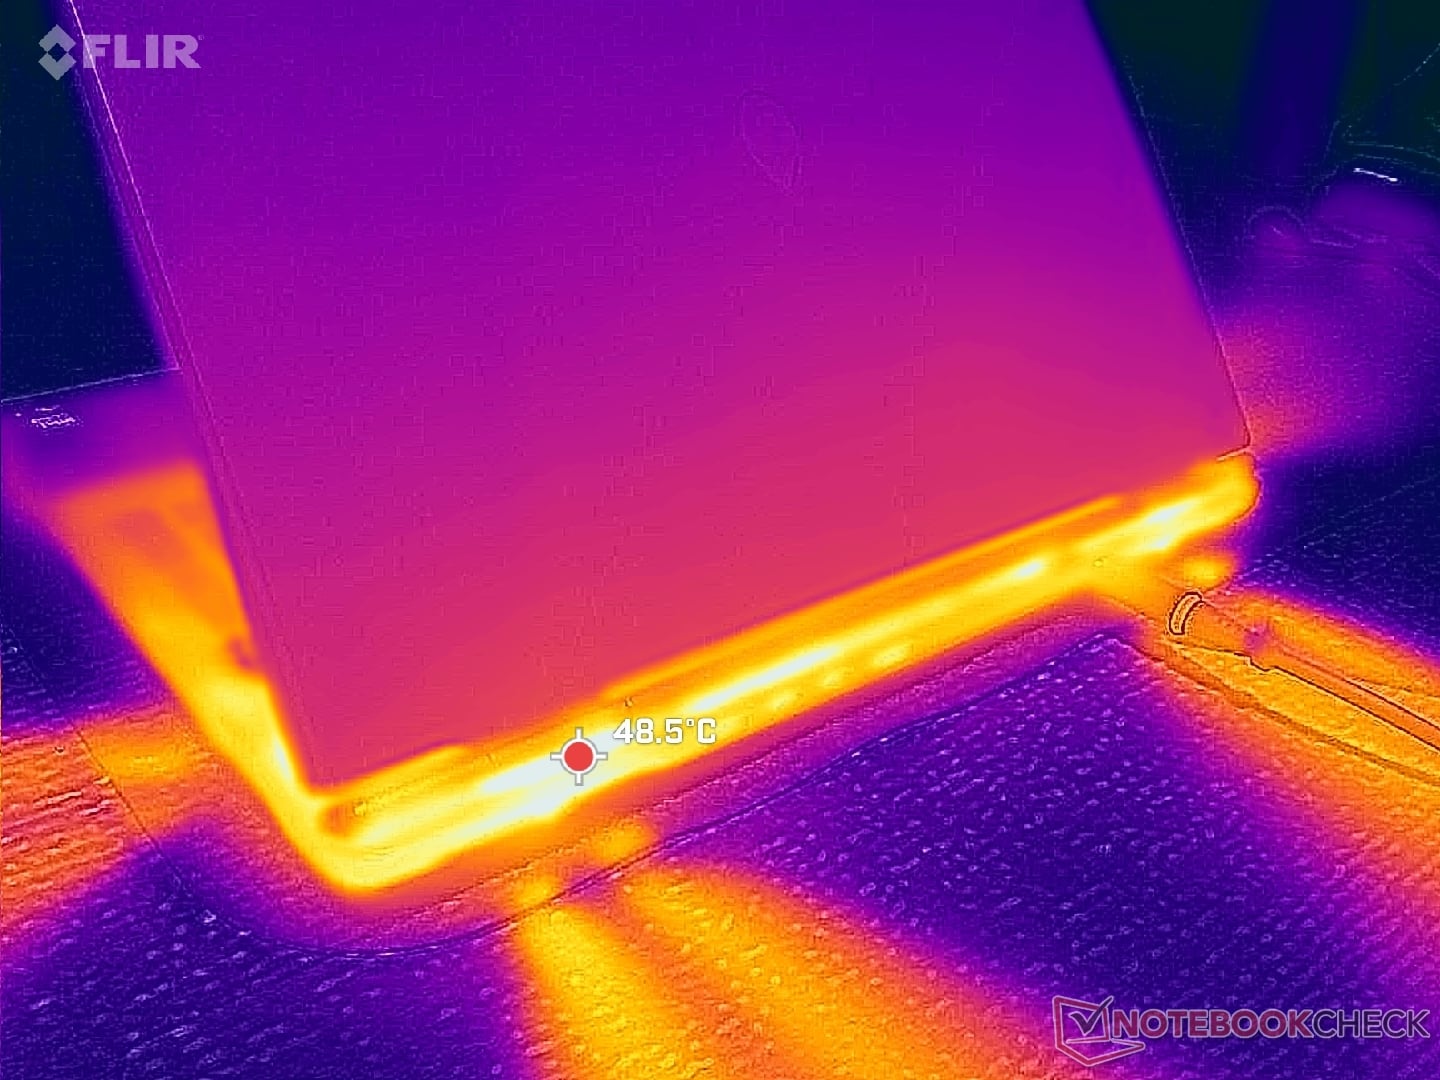
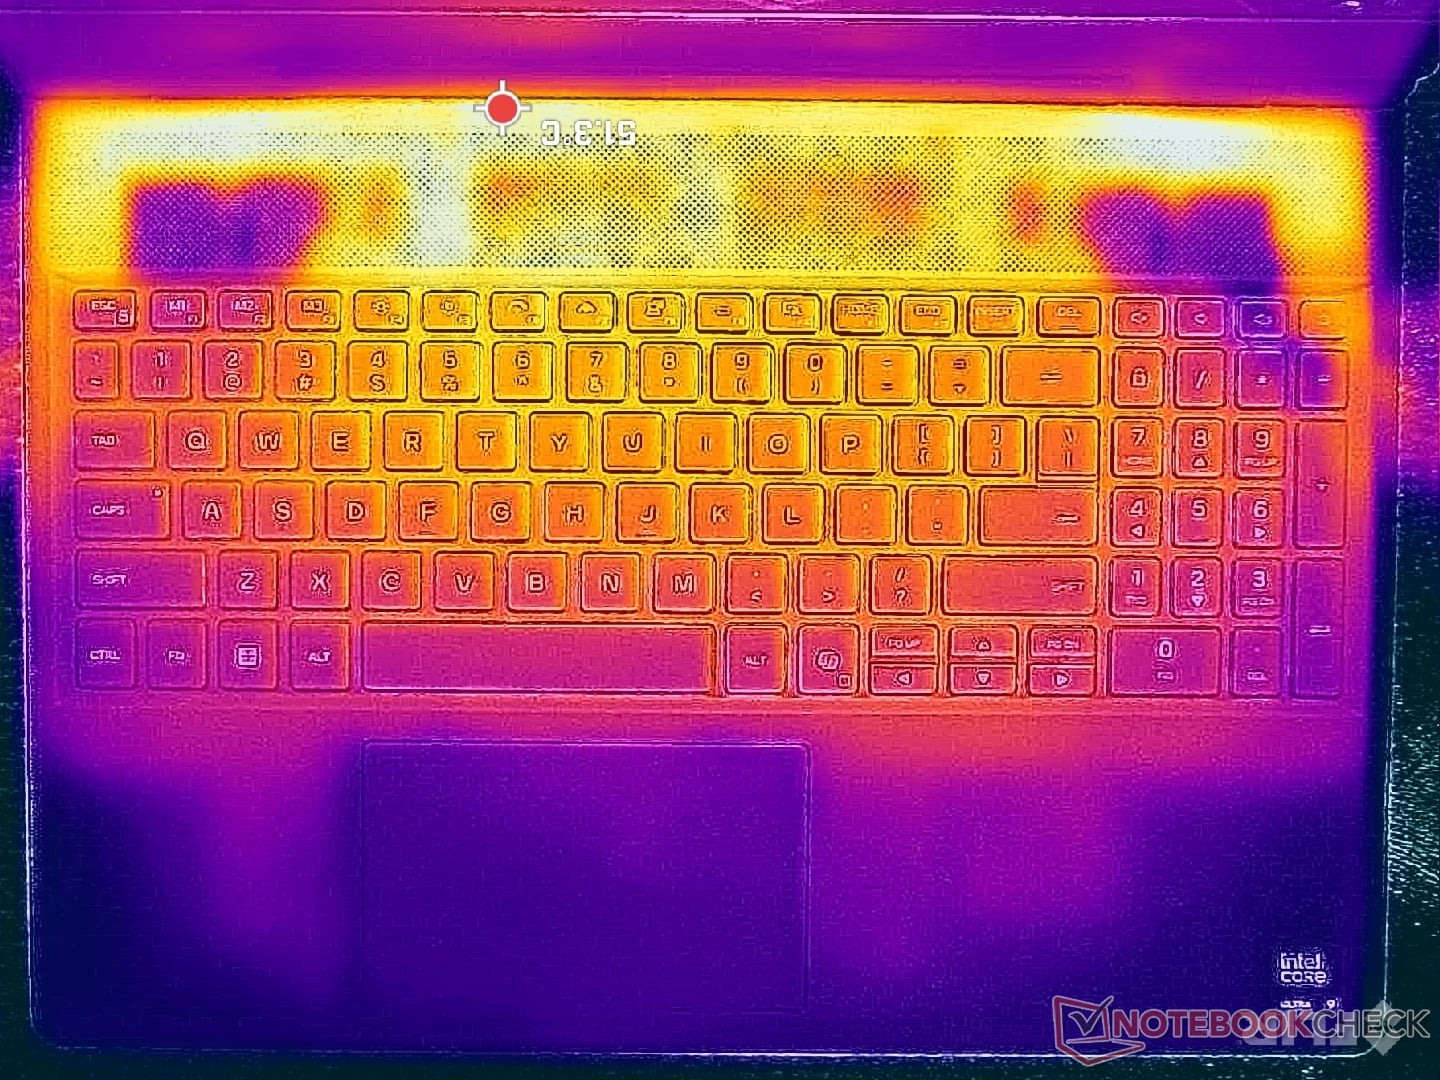
(-) The maximum temperature on the upper side is 48.2 °C / 119 F, compared to the average of 40.4 °C / 105 F, ranging from 21.2 to 68.8 °C for the class Gaming.
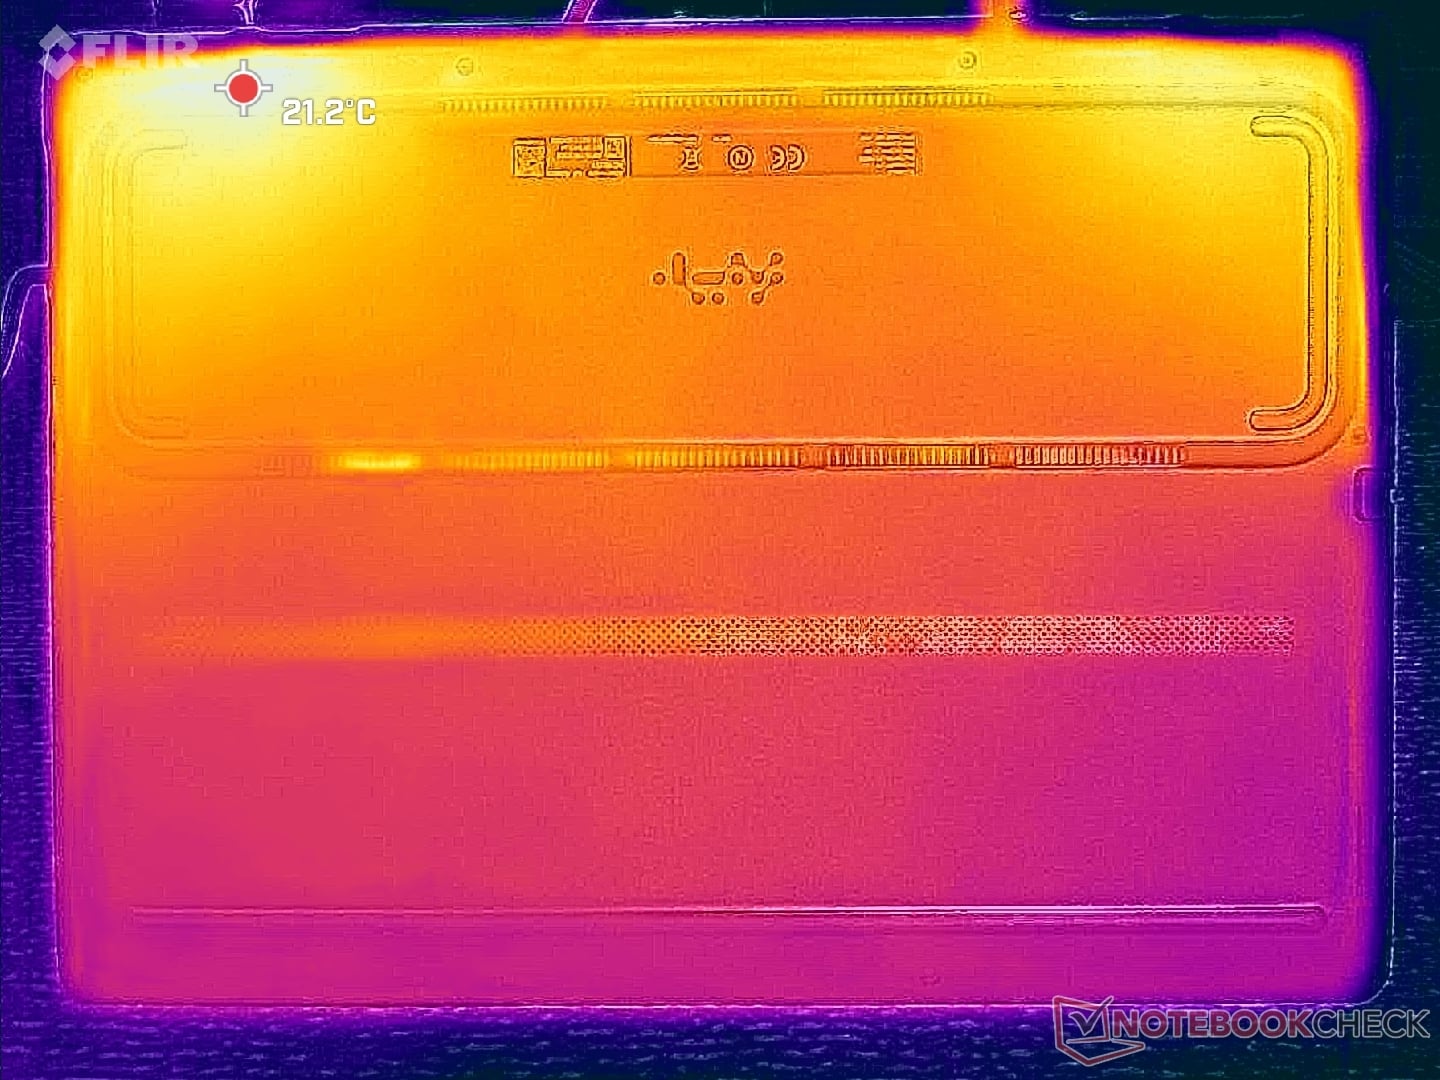
(±) The bottom heats up to a maximum of 41 °C / 106 F, compared to the average of 43.2 °C / 110 F
(+) In idle usage, the average temperature for the upper side is 26 °C / 79 F, compared to the device average of 33.9 °C / 93 F.
(-) 3: The average temperature for the upper side is 39.4 °C / 103 F, compared to the average of 33.9 °C / 93 F for the class Gaming.
(+) The palmrests and touchpad are cooler than skin temperature with a maximum of 31 °C / 87.8 F and are therefore cool to the touch.
(-) The average temperature of the palmrest area of similar devices was 28.8 °C / 83.8 F (-2.2 °C / -4 F).
| Alienware 16X Aurora Core Ultra 9 290HX Plus Ultra 9 290HX Plus, GeForce RTX 5070 Ti Laptop | Alienware 16X Aurora, RTX 5070 Ultra 9 275HX, GeForce RTX 5070 Laptop | Acer Predator Helios Neo 16S AI PHN16S-71-94L9 Ultra 9 275HX, GeForce RTX 5070 Ti Laptop | Lenovo Legion Pro 5 16IAX10, RTX 5070 Ultra 7 255HX, GeForce RTX 5070 Laptop | MSI Vector 16 HX AI A2XWHG Ultra 7 255HX, GeForce RTX 5070 Ti Laptop | Asus ROG Zephyrus G16 GU605CW Ultra 9 285H, GeForce RTX 5080 Laptop | |
|---|---|---|---|---|---|---|
| Heat | -7% | -11% | -10% | -16% | -25% | |
| Maximum Upper Side * (°C) | 48.2 | 51 -6% | 47 2% | 42 13% | 53 -10% | 49.2 -2% |
| Maximum Bottom * (°C) | 41 | 45.6 -11% | 55 -34% | 44 -7% | 52 -27% | 50.2 -22% |
| Idle Upper Side * (°C) | 28.2 | 29.8 -6% | 28 1% | 33 -17% | 33 -17% | 37.2 -32% |
| Idle Bottom * (°C) | 26.2 | 27.4 -5% | 29 -11% | 34 -30% | 29 -11% | 37.4 -43% |
* ... smaller is better
压力测试
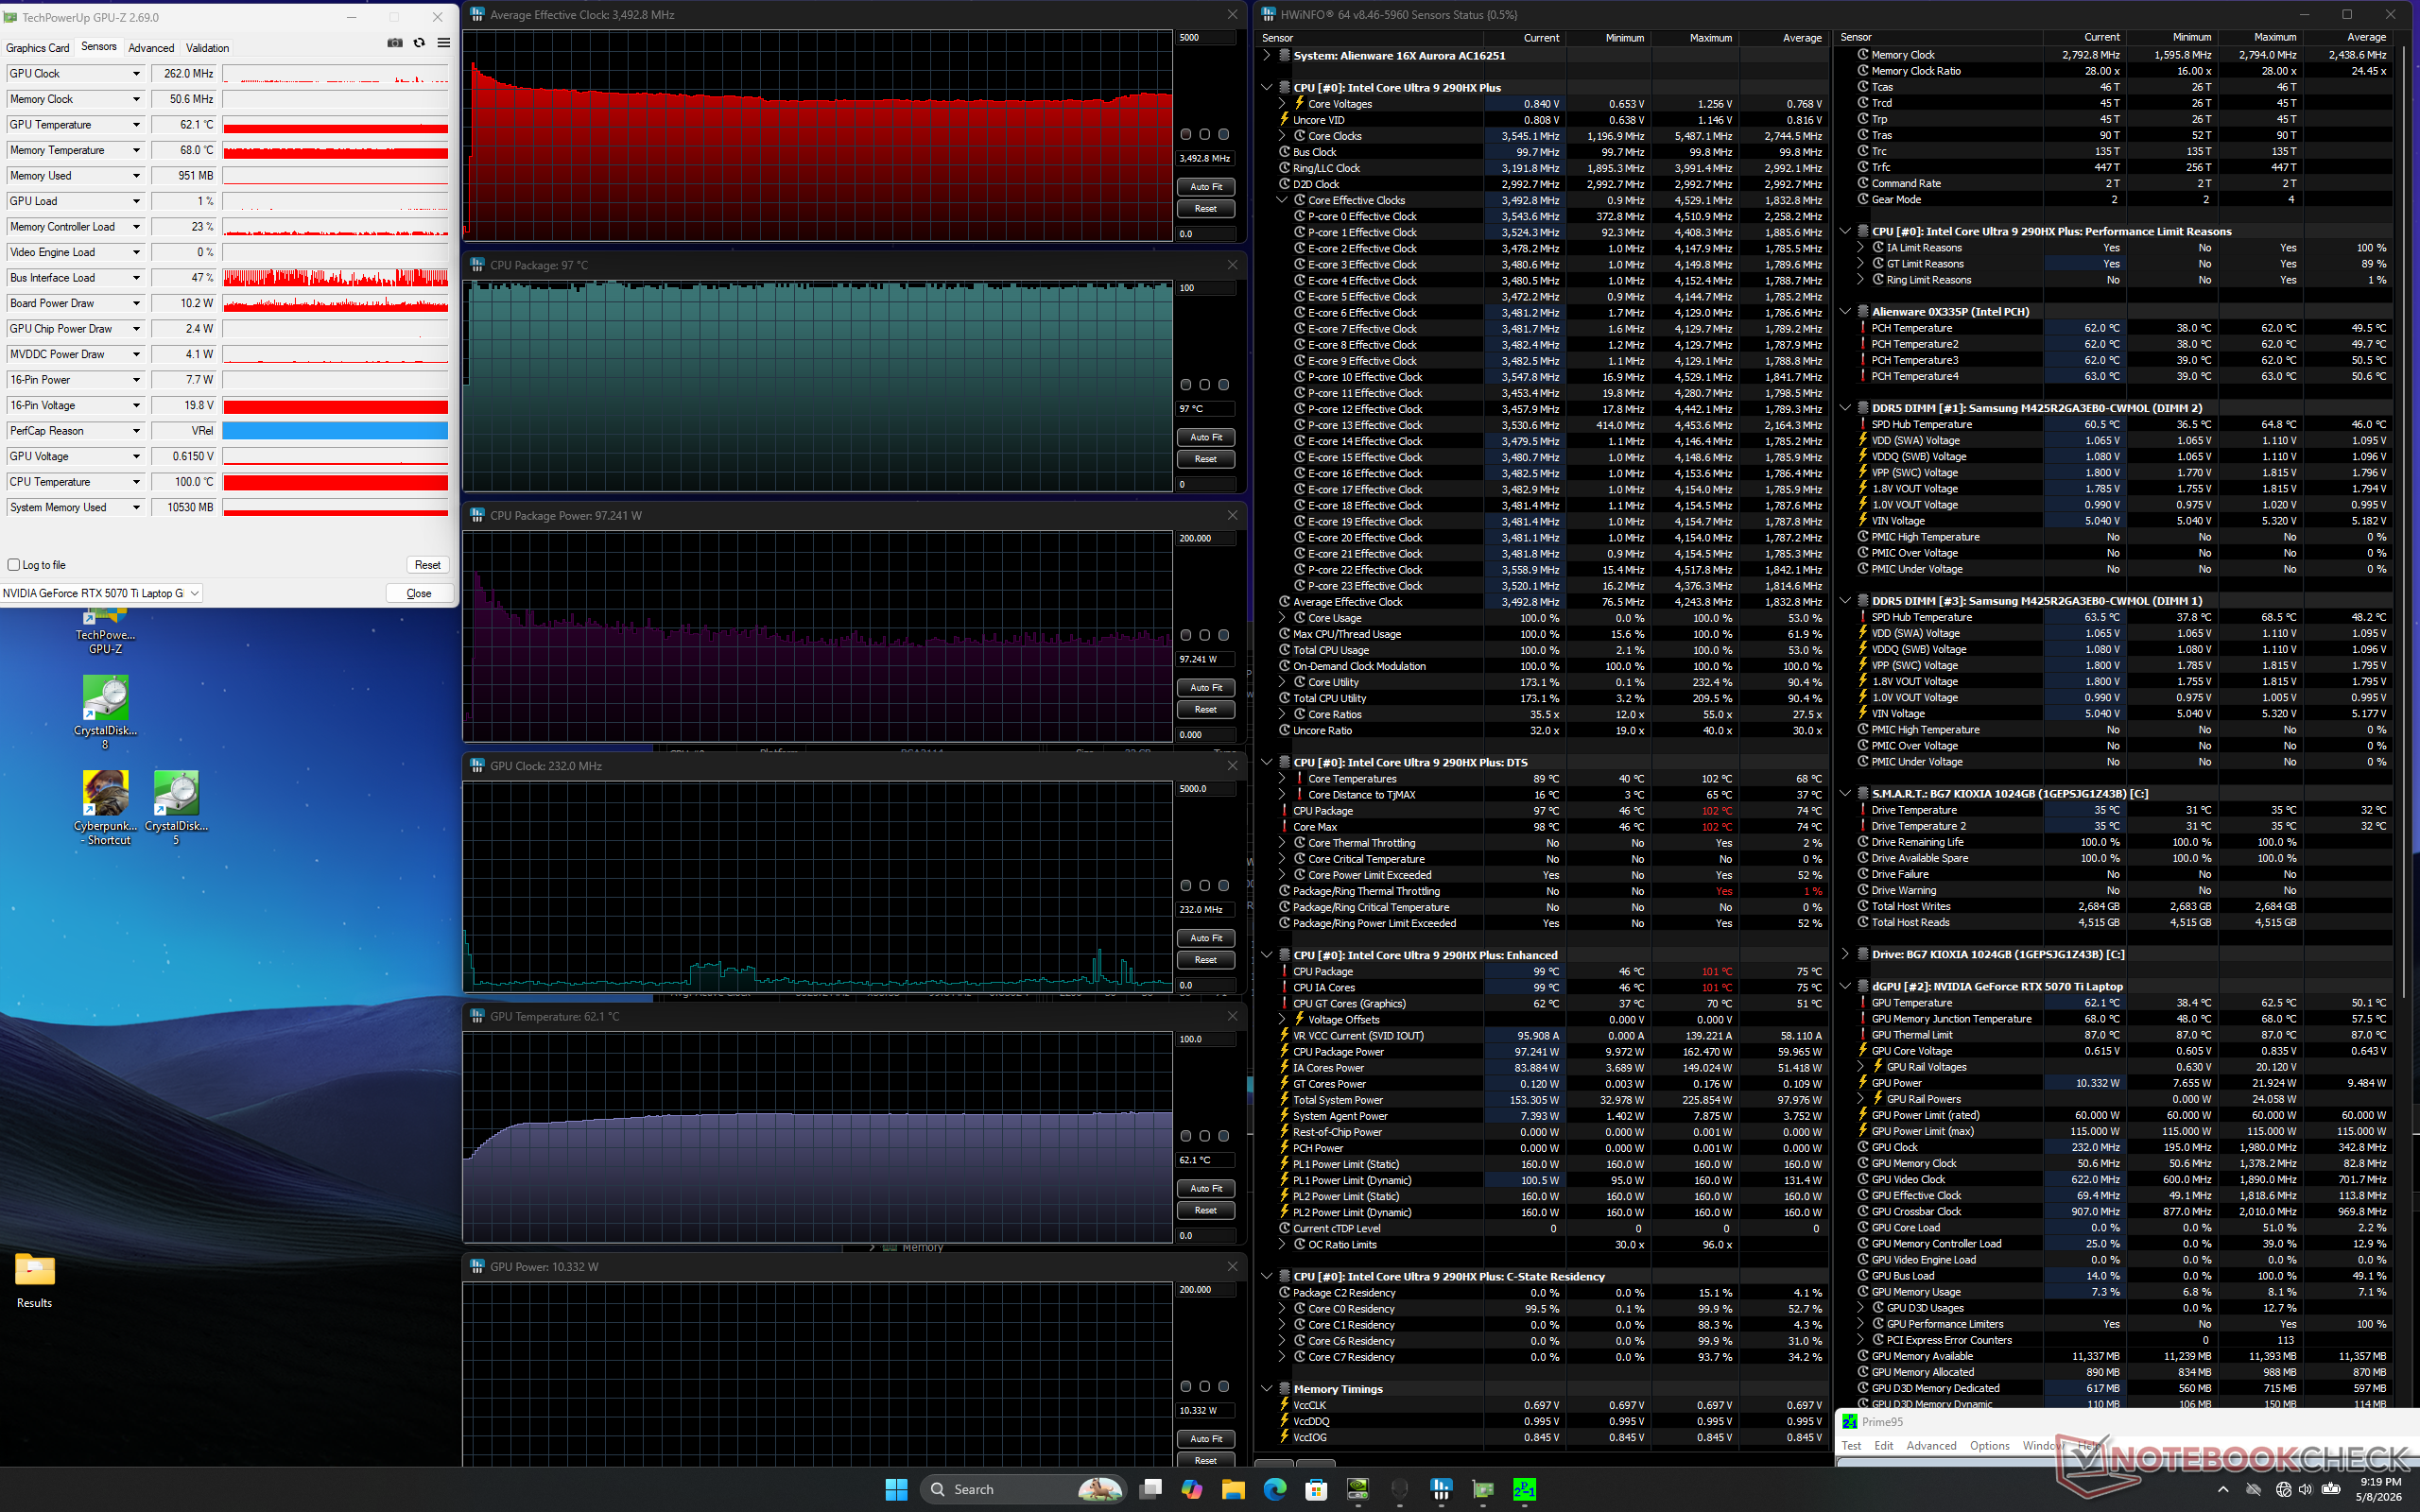
在去年的 16X 极光2026 16X Aurora 中的 Core Ultra 9 290HX Plus 采用了更高的时钟频率,运行 Prime95 时的温度也将近 100 摄氏度,这一点不足为奇。如果笔记本电脑的散热解决方案更有效,CPU 的性能可能会更好。例如,CPU 会在一两秒内将频率提升至 4.3 GHz 和 163 W,然后稳步降至 3.4 GHz 和 97 W,这表明 Turbo Boost 的潜力有限。
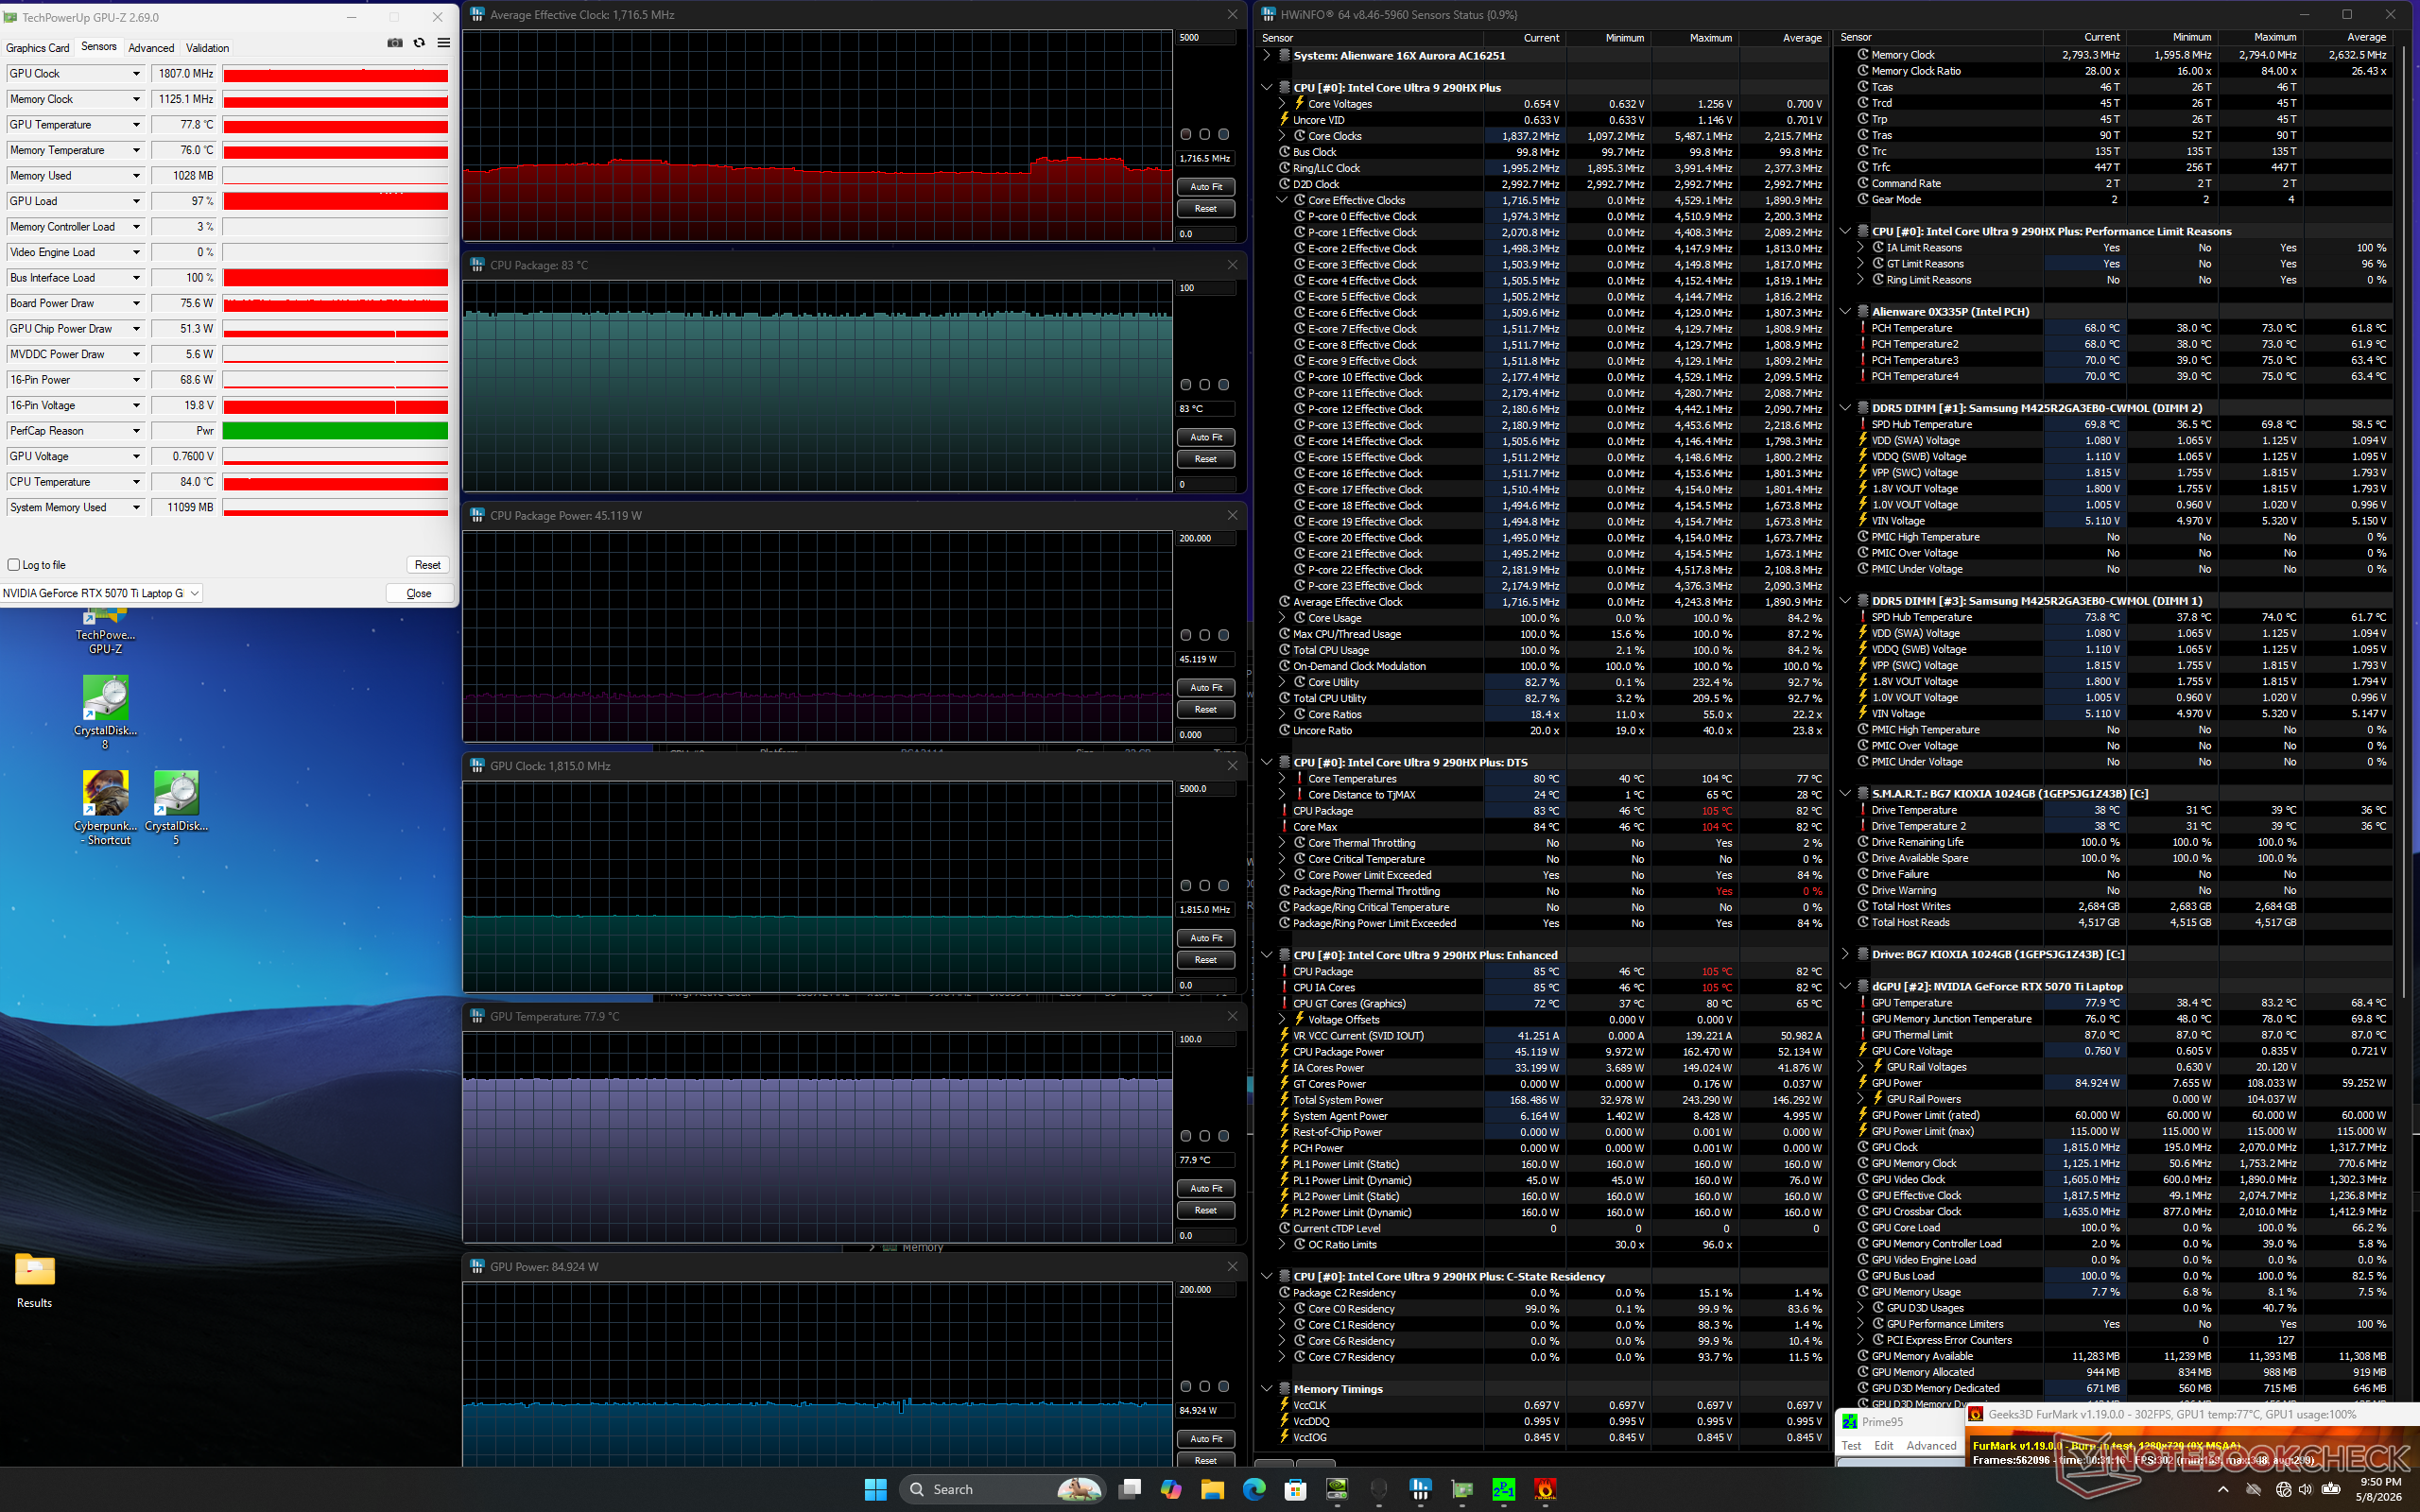
由于配置不同,今年的机型在游戏时的核心温度要比上一年低。更具体地说,RTX 5070 Ti 的时钟频率比 RTX 5070 低,运行温度持续降低几摄氏度。在超频模式、性能模式和平衡模式下,GPU 功耗分别稳定在 114 W、97 W 和 84 W。
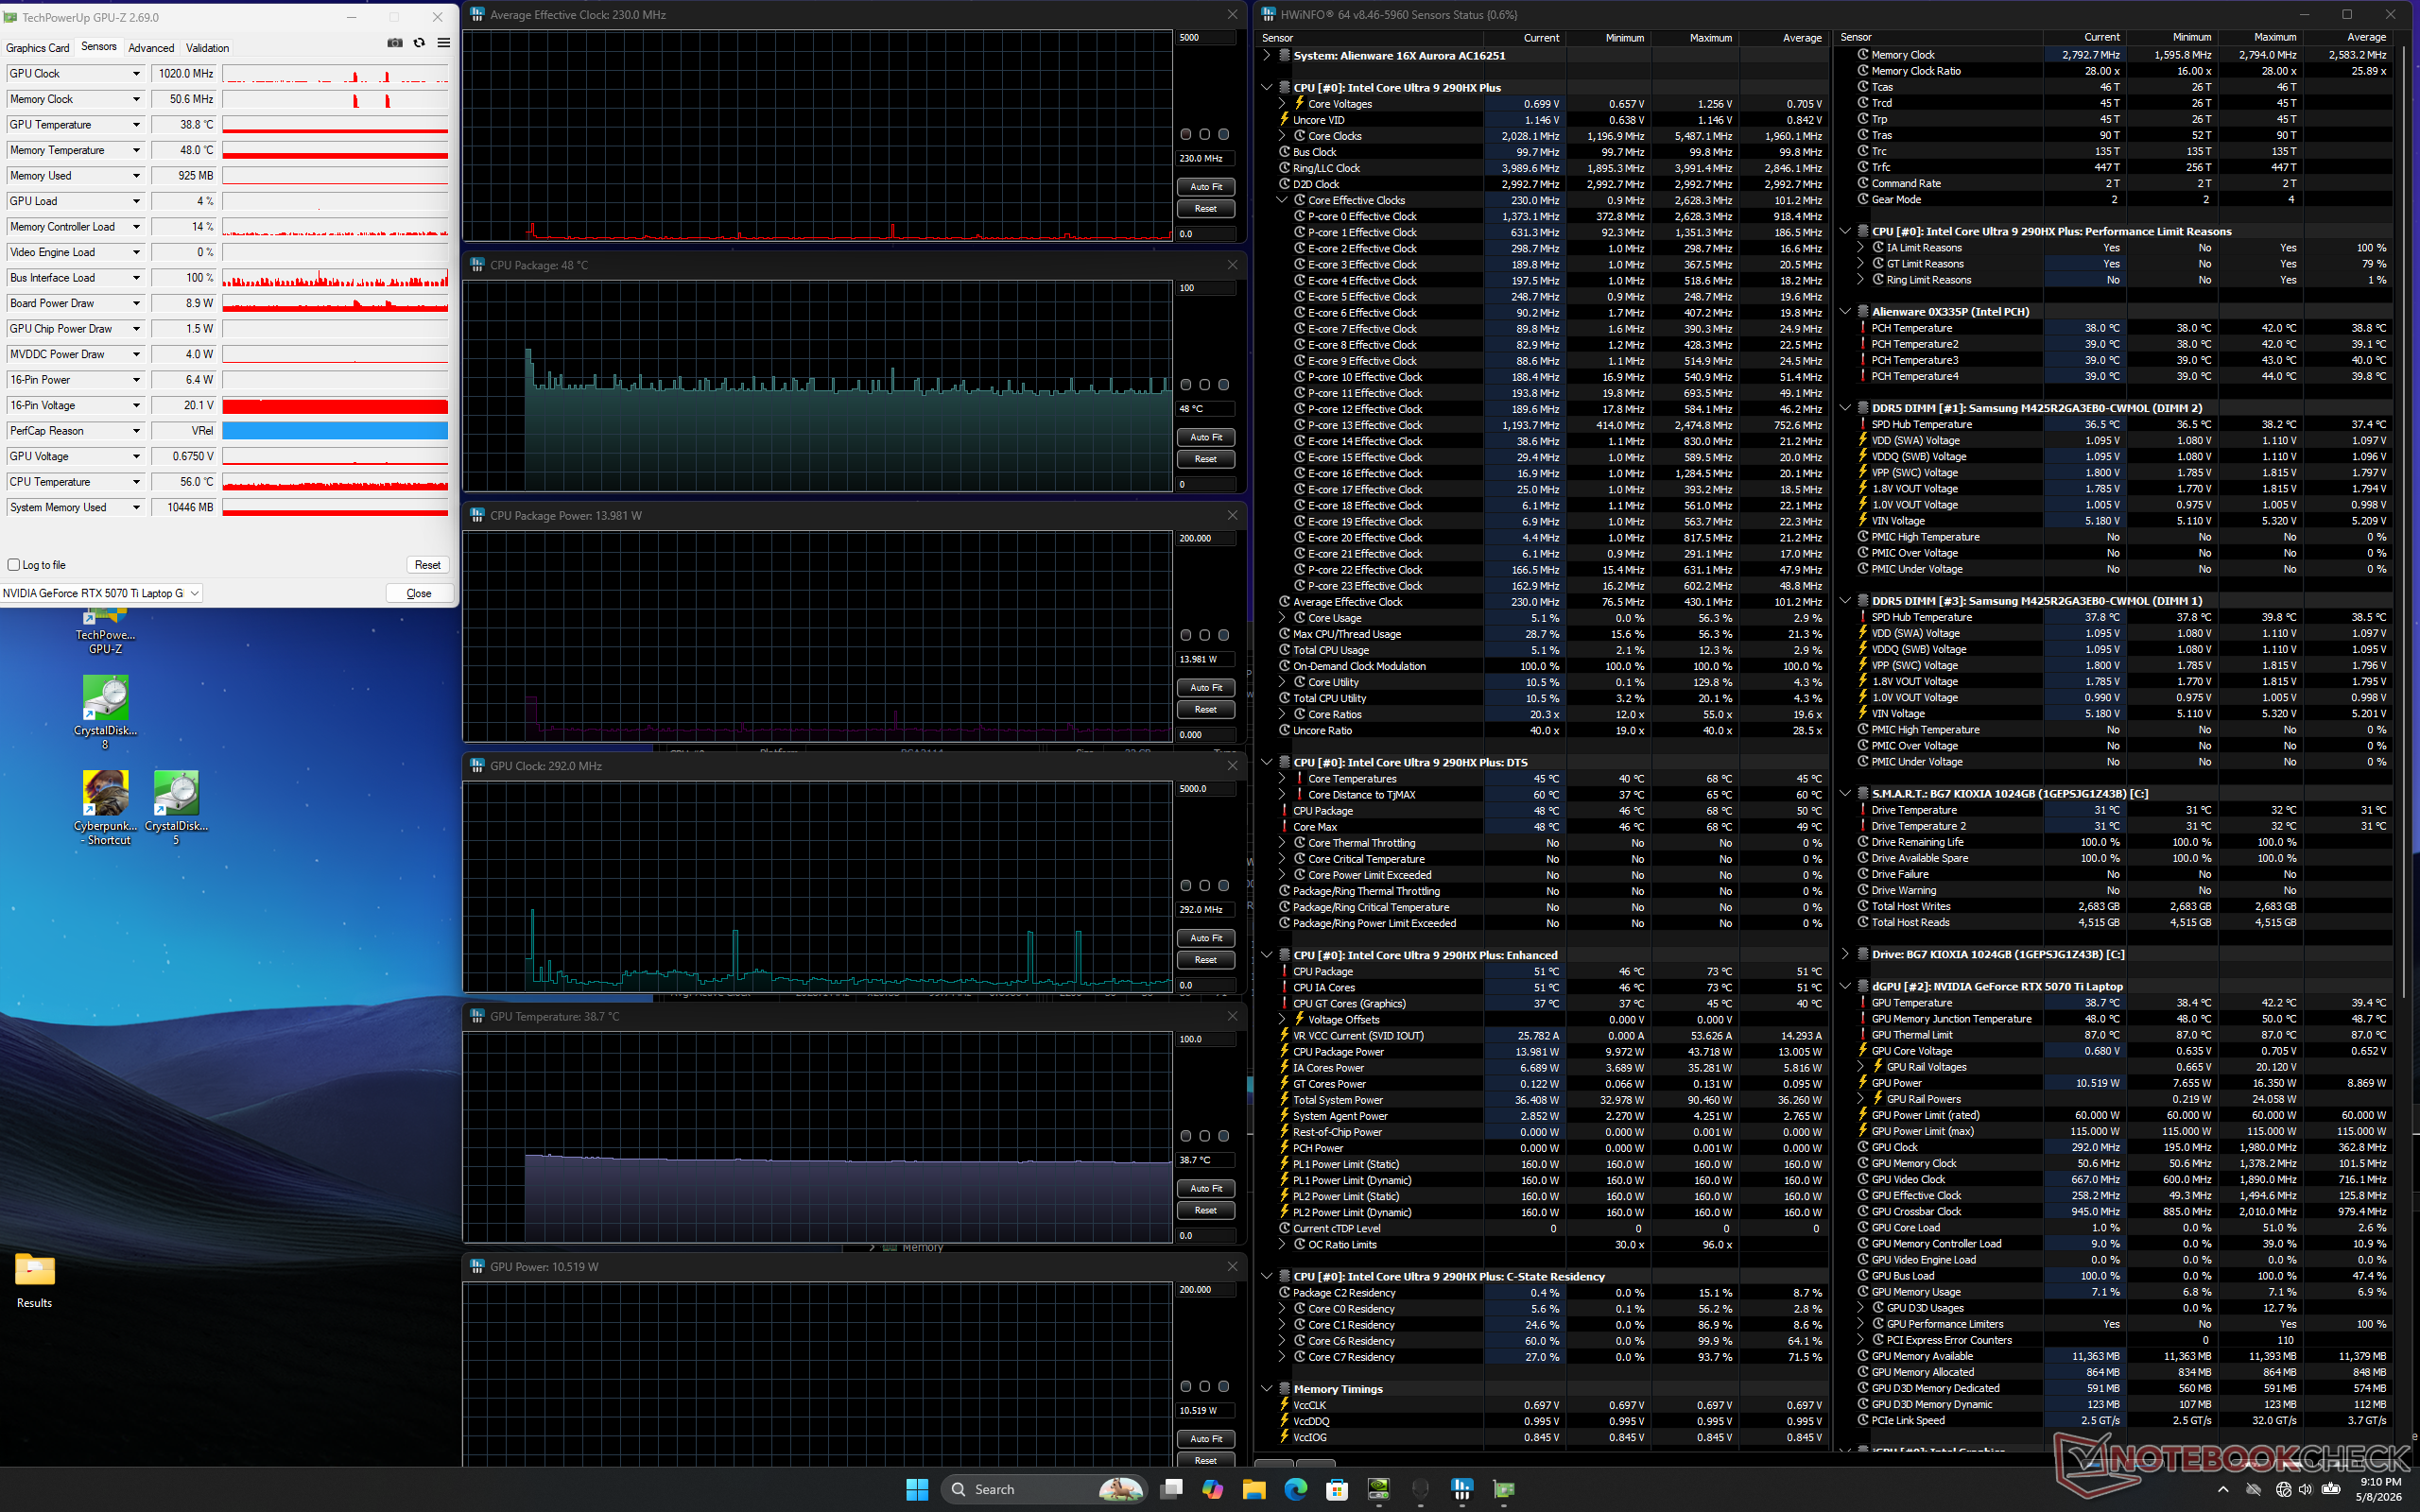
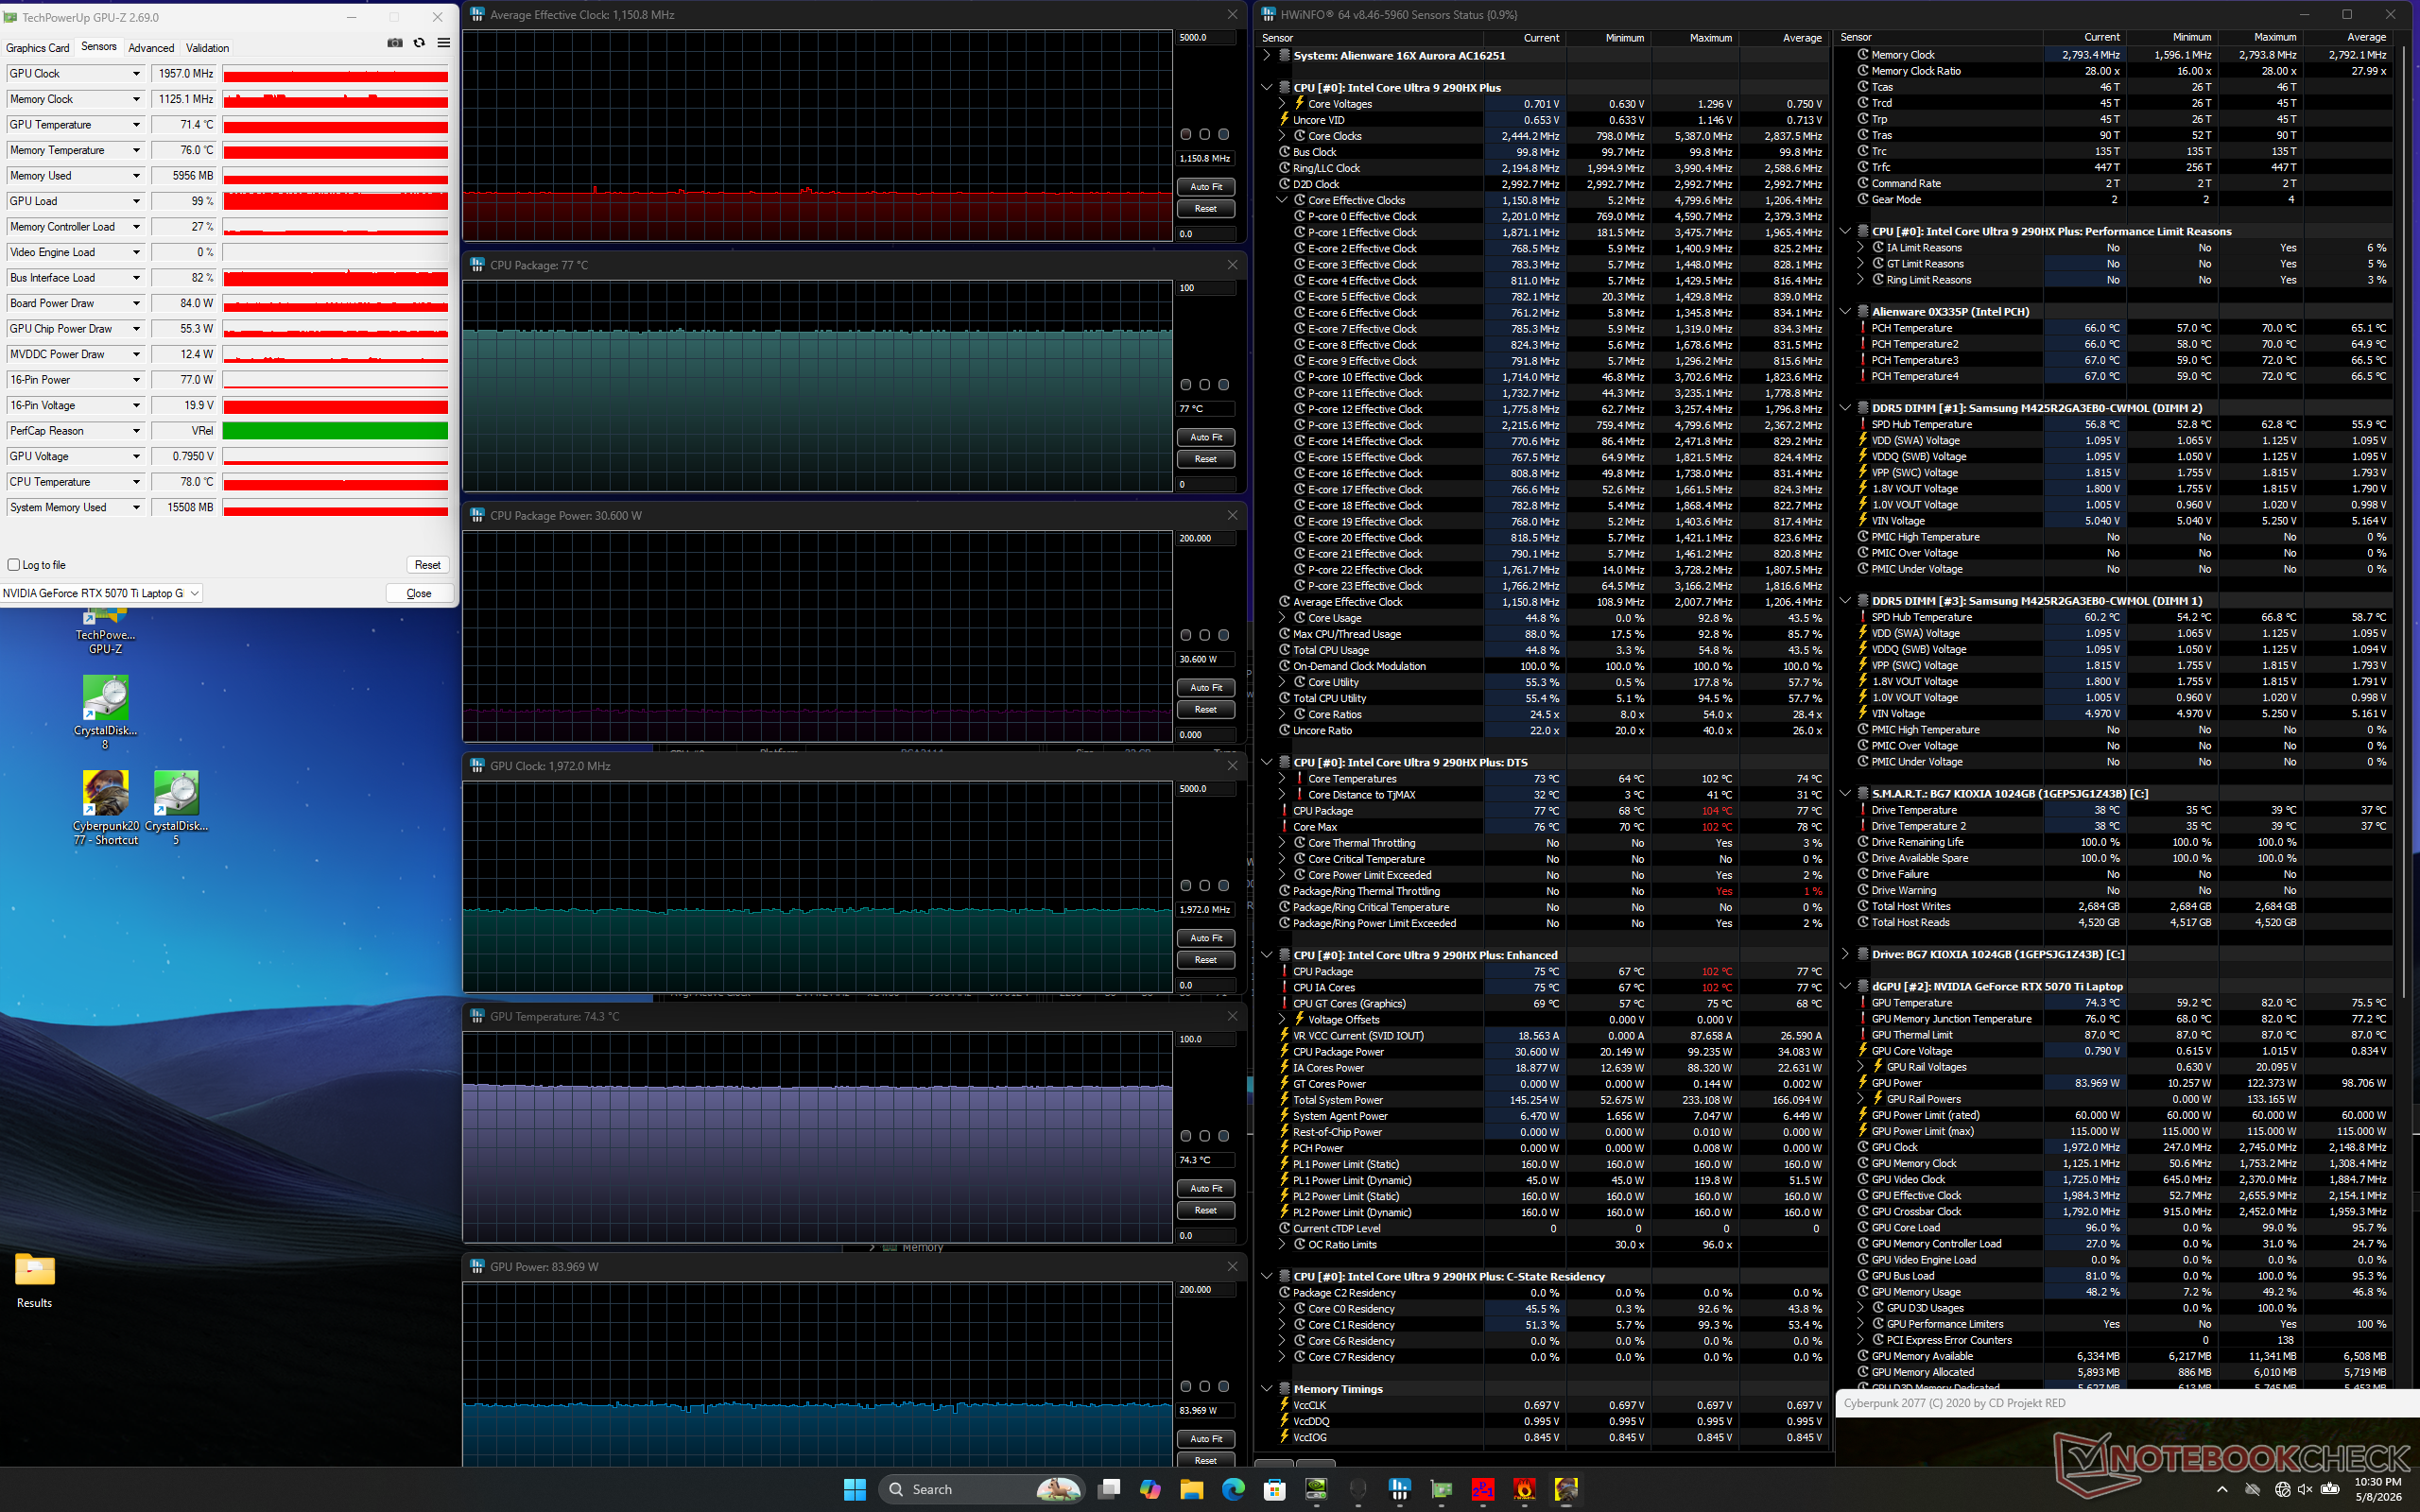
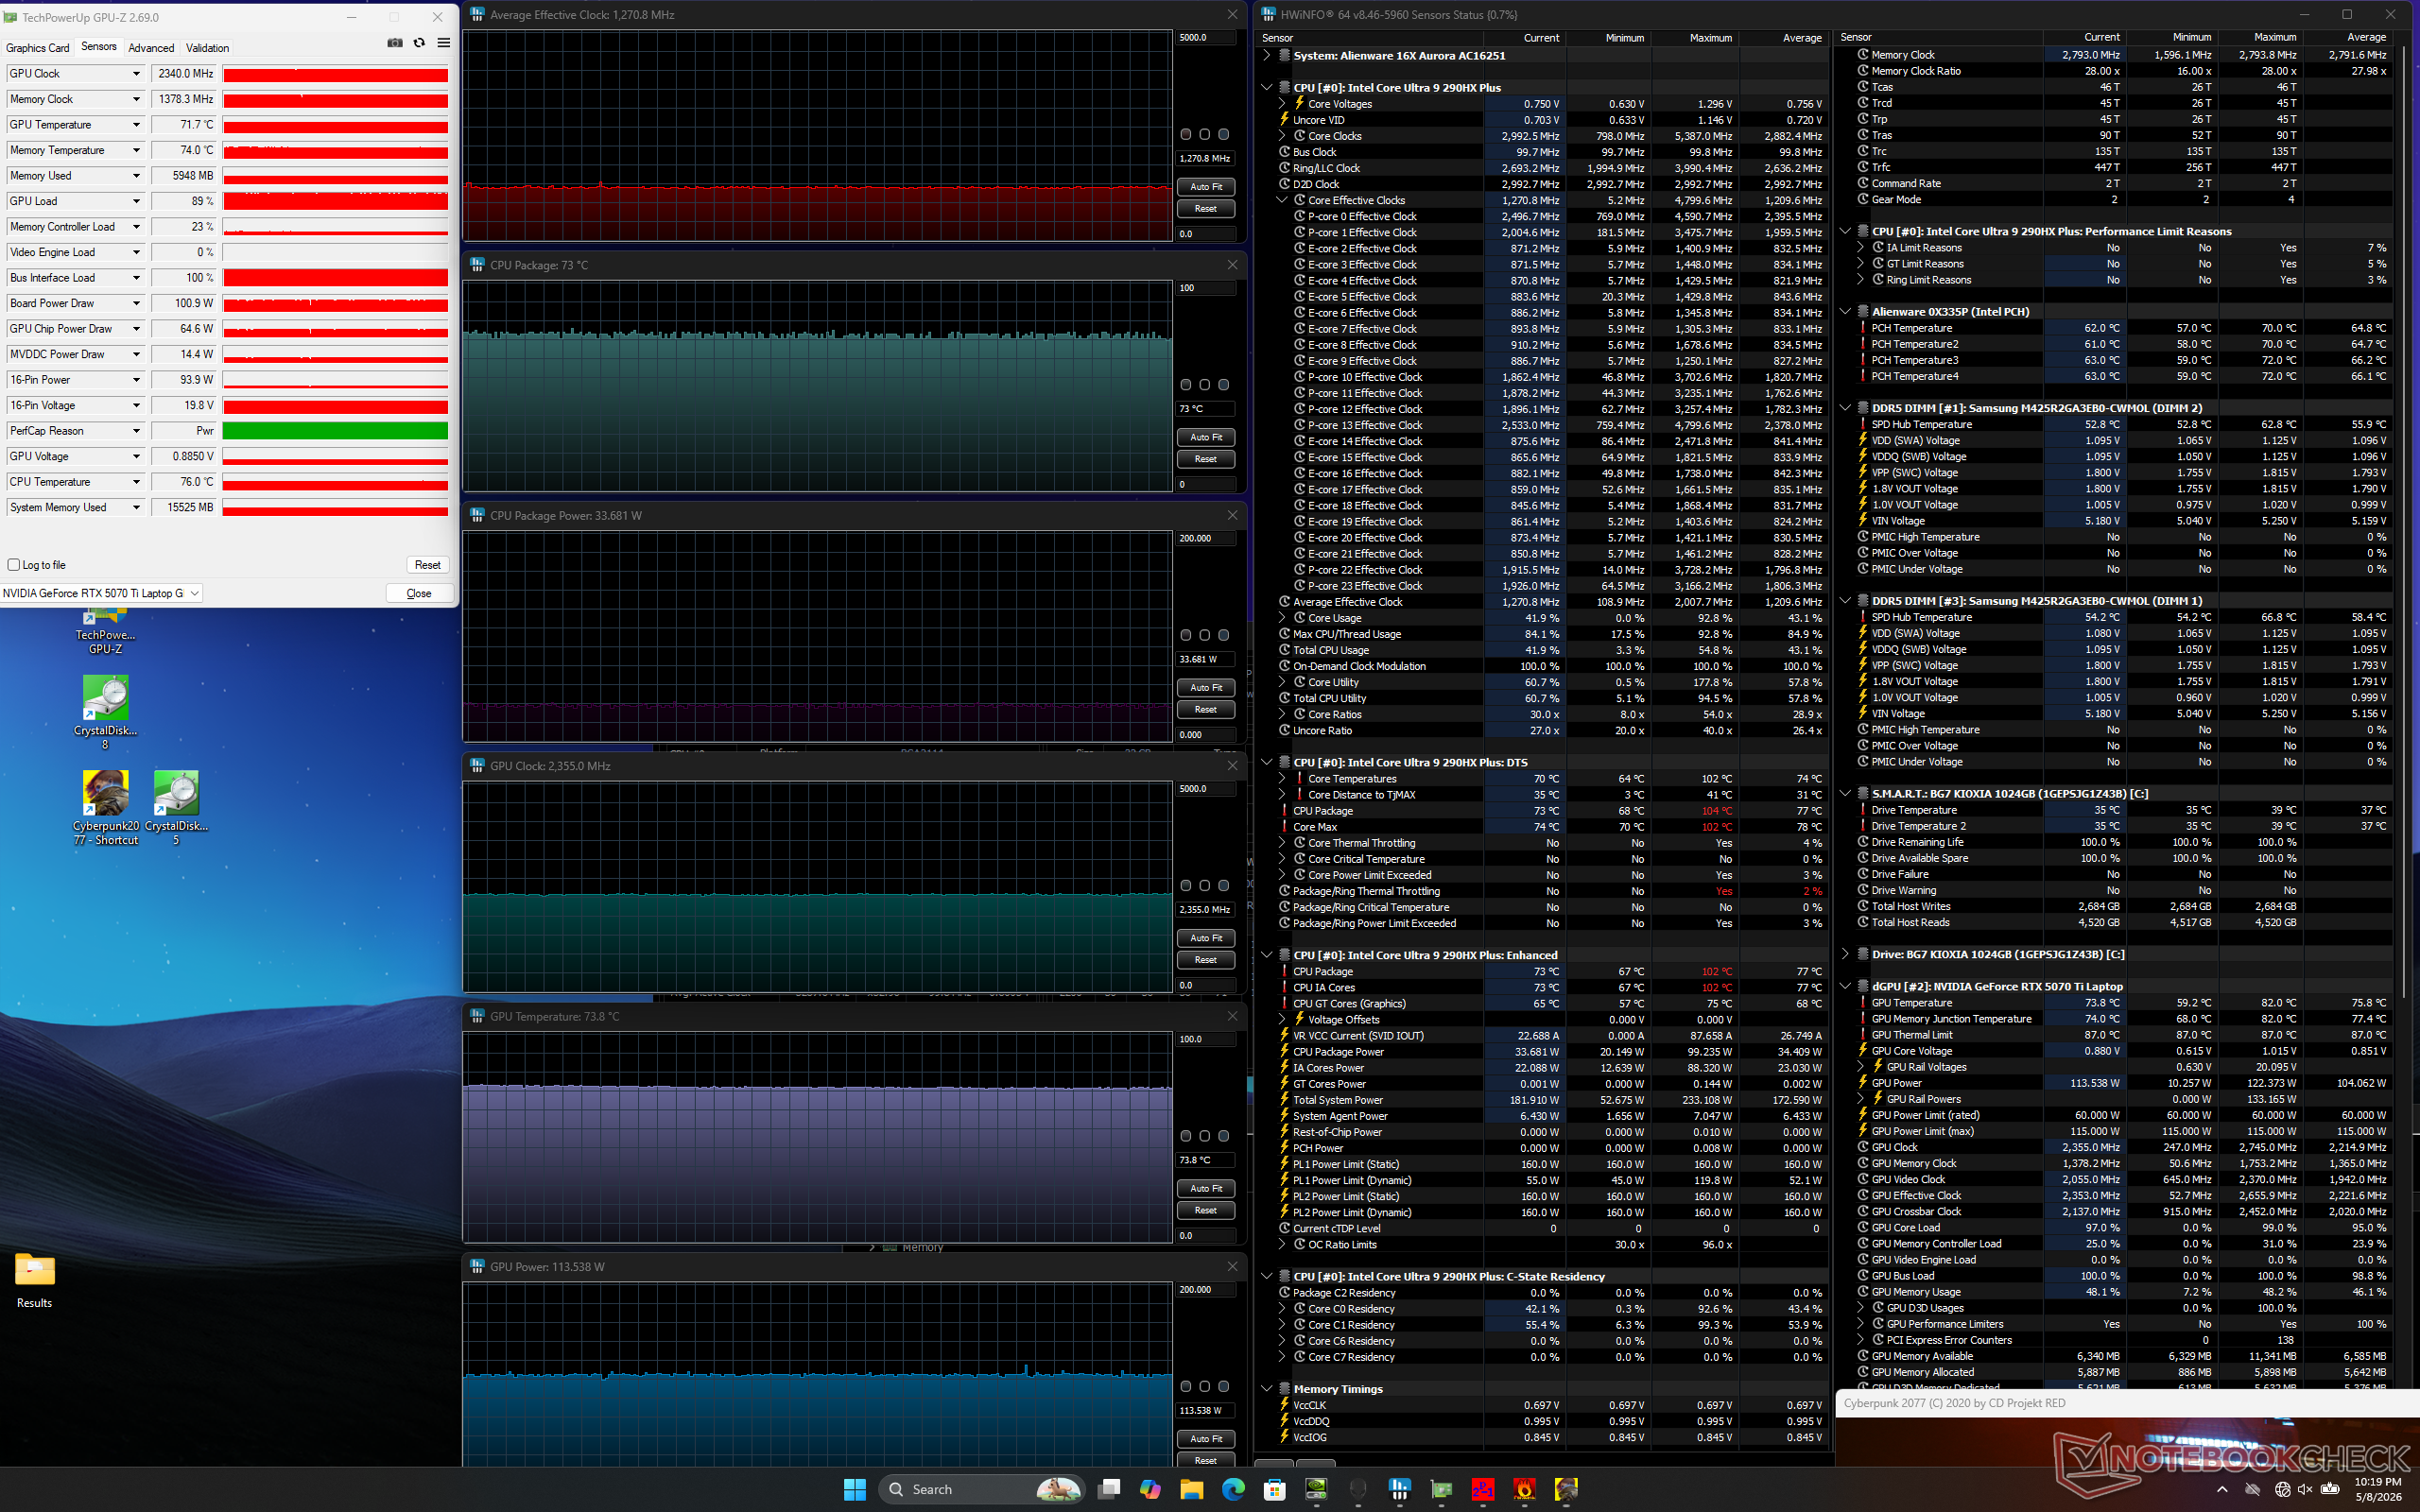
| 平均 CPU 时钟 (GHz) | GPU 时钟 (MHz) | 平均 CPU 温度 (°C) | 平均 GPU 温度 (°C) | |
| 系统闲置 | -- | -- | 48 | 39 |
| Prime95 压力 | 3.5 | -- | 97 | 62 |
| Prime95 + FurMark 压力 | 1.7 | 1815 | 83 | 78 |
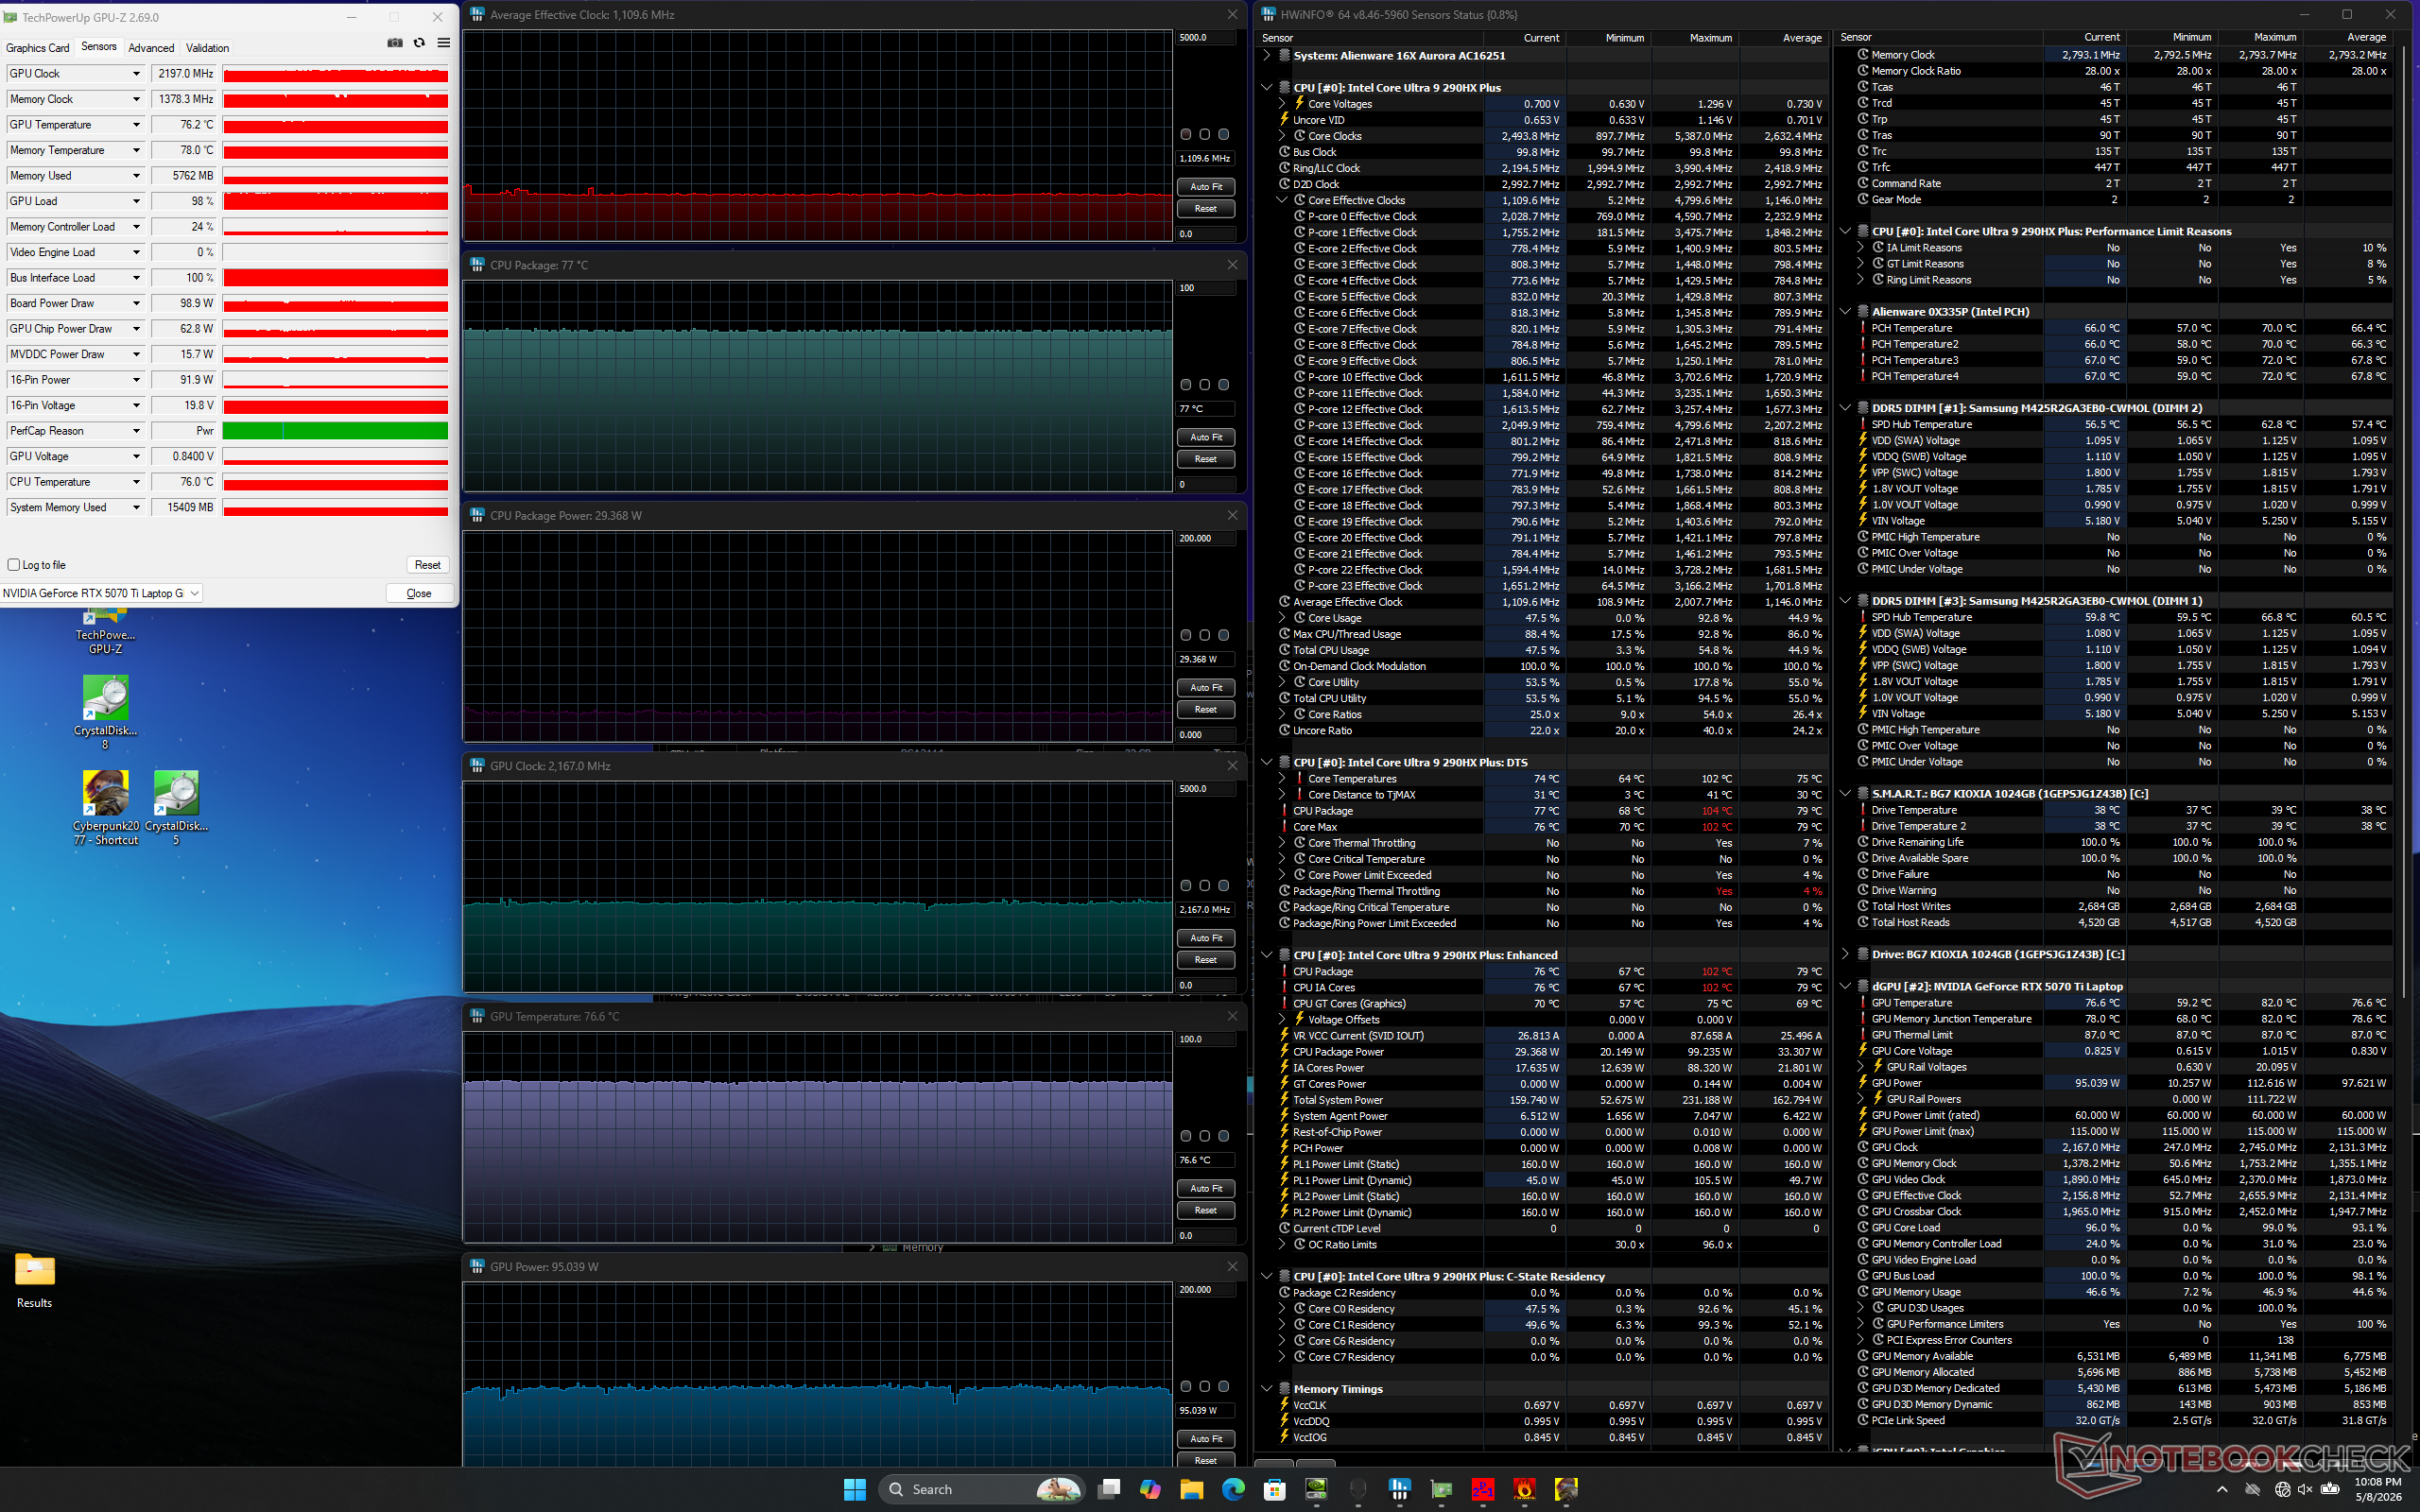
| 赛博朋克 2077》压力(平衡模式) | 1.2 | 1972 | 77 | 74 |
| 赛博朋克2077压力(性能模式) | 1.1 | 2167 | 77 | 77 |
| 赛博朋克2077压力(超速模式) | 1.3 | 2355 | 73 | 74 |
发言人
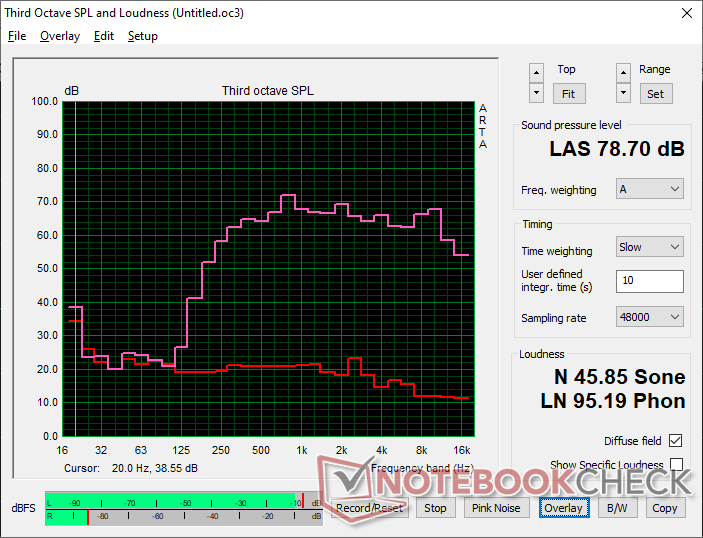
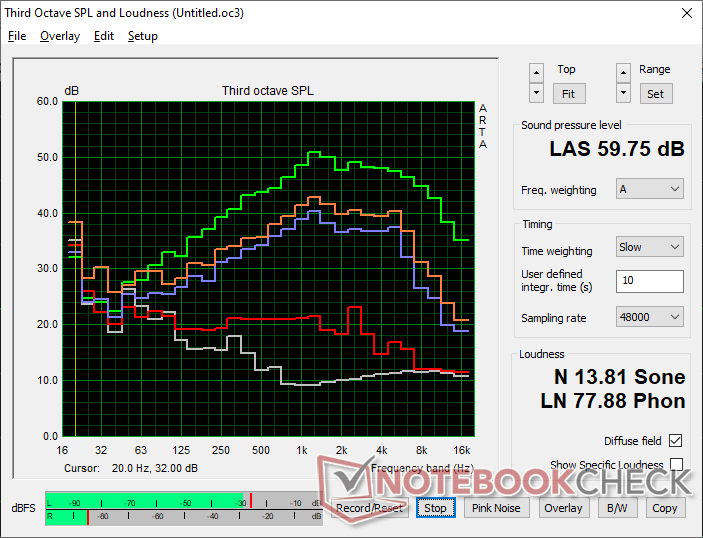
Alienware 16X Aurora Core Ultra 9 290HX Plus audio analysis
(±) | speaker loudness is average but good (78.7 dB)
Bass 100 - 315 Hz
(-) | nearly no bass - on average 20.8% lower than median
(-) | bass is not linear (16% delta to prev. frequency)
Mids 400 - 2000 Hz
(+) | balanced mids - only 3% away from median
(+) | mids are linear (5.1% delta to prev. frequency)
Highs 2 - 16 kHz
(+) | balanced highs - only 1.7% away from median
(+) | highs are linear (4.9% delta to prev. frequency)
Overall 100 - 16.000 Hz
(±) | linearity of overall sound is average (18.5% difference to median)
Compared to same class
» 60% of all tested devices in this class were better, 8% similar, 32% worse
» The best had a delta of 6%, average was 18%, worst was 132%
Compared to all devices tested
» 41% of all tested devices were better, 8% similar, 51% worse
» The best had a delta of 4%, average was 24%, worst was 134%
Apple MacBook Pro 16 2021 M1 Pro audio analysis
(+) | speakers can play relatively loud (84.7 dB)
Bass 100 - 315 Hz
(+) | good bass - only 3.8% away from median
(+) | bass is linear (5.2% delta to prev. frequency)
Mids 400 - 2000 Hz
(+) | balanced mids - only 1.3% away from median
(+) | mids are linear (2.1% delta to prev. frequency)
Highs 2 - 16 kHz
(+) | balanced highs - only 1.9% away from median
(+) | highs are linear (2.7% delta to prev. frequency)
Overall 100 - 16.000 Hz
(+) | overall sound is linear (4.6% difference to median)
Compared to same class
» 0% of all tested devices in this class were better, 0% similar, 100% worse
» The best had a delta of 5%, average was 17%, worst was 45%
Compared to all devices tested
» 0% of all tested devices were better, 0% similar, 100% worse
» The best had a delta of 4%, average was 24%, worst was 134%
能源管理
耗电量
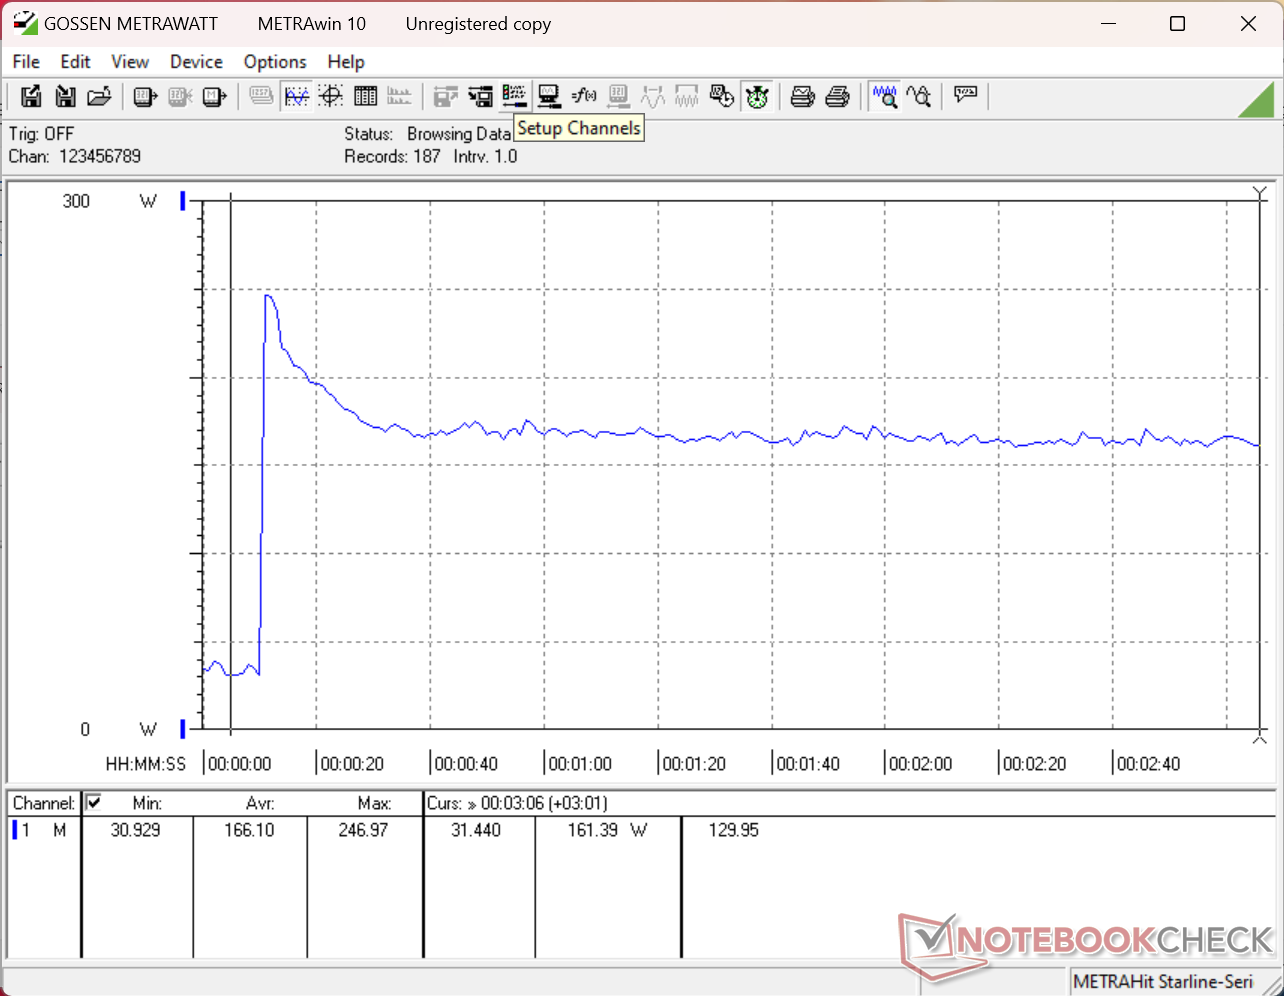
空转时的耗电量仅为个位数,远低于我们在 2025 机型上记录的耗电量。除此之外,当引入更高负荷时,两款机型的结果几乎相同,包括在 Prime95 和/或 FurMark 模式下的峰值和逐渐降低的速度。
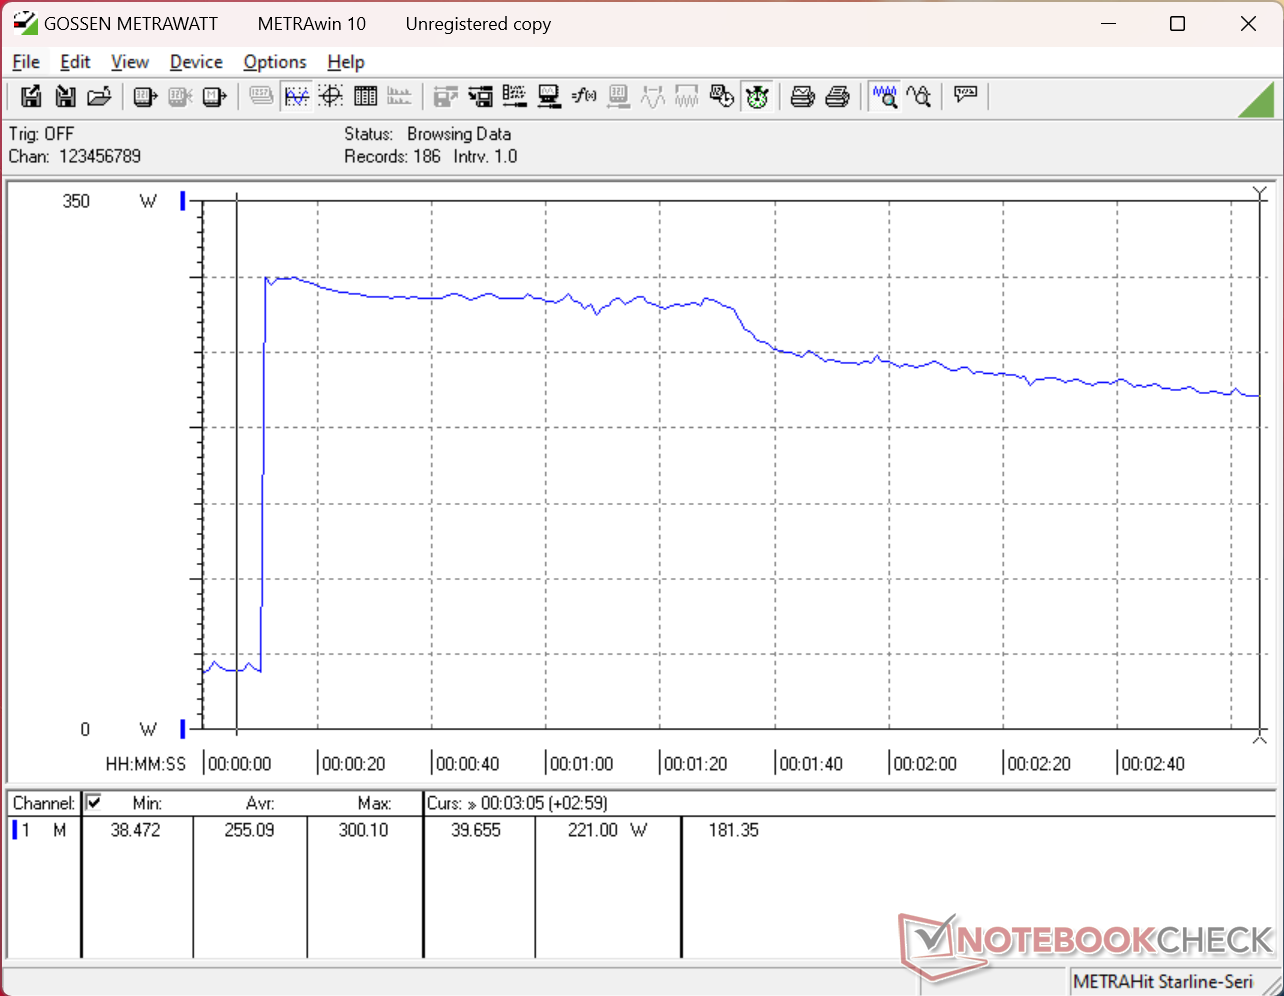
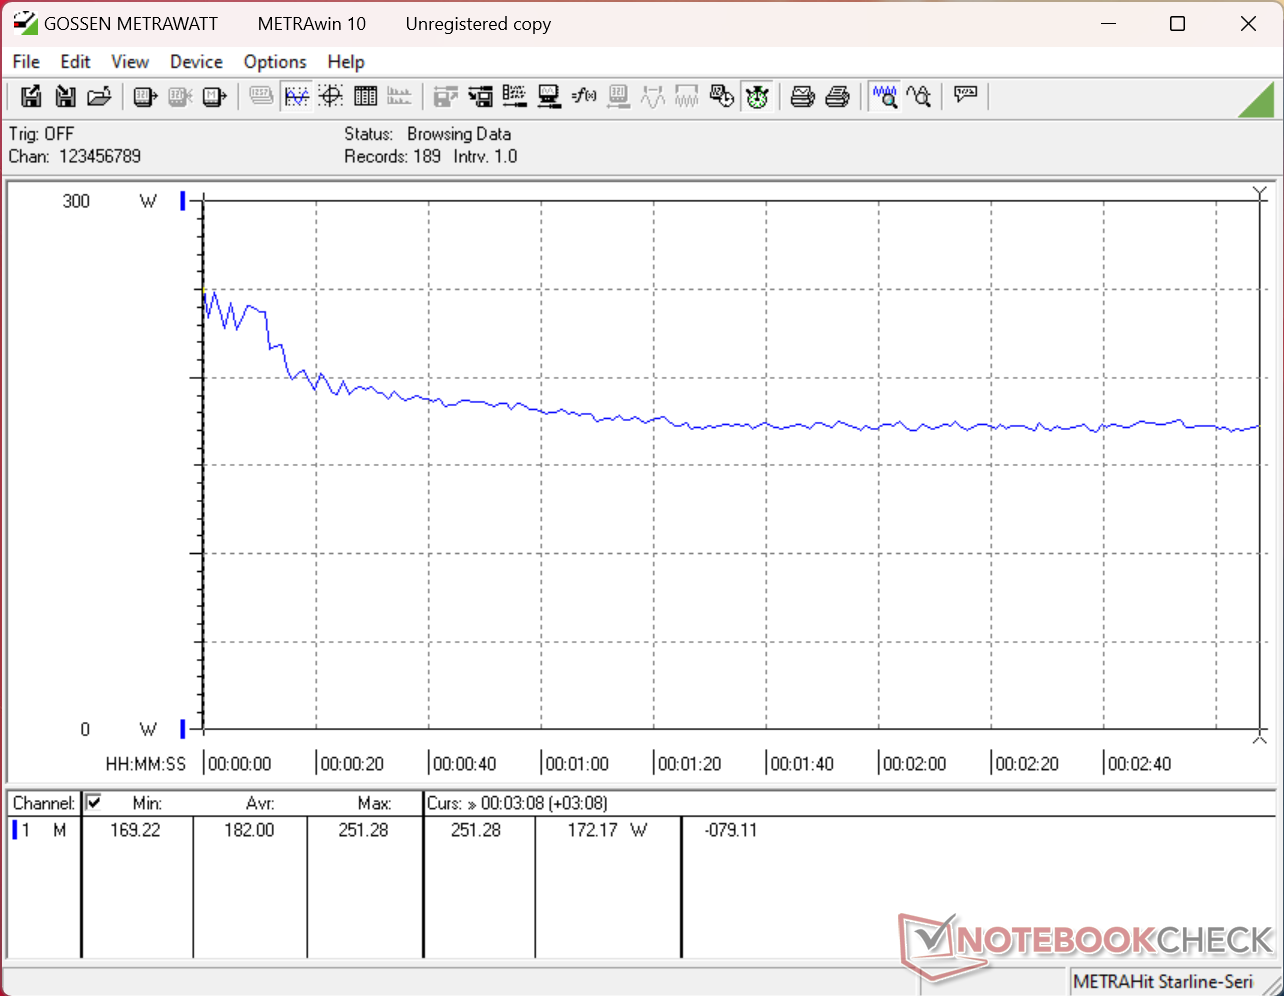
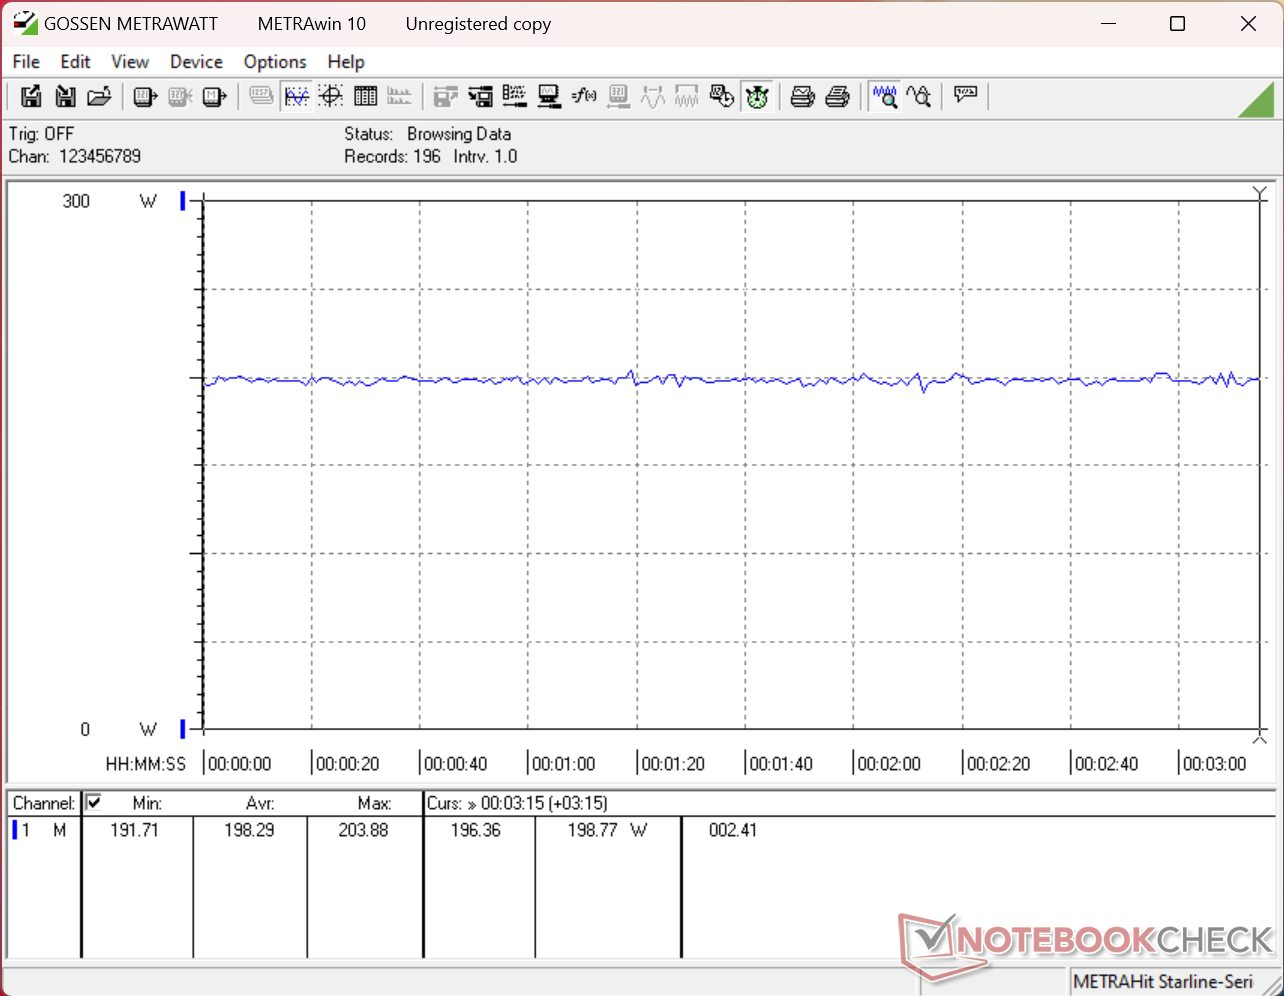
运行《赛博朋克 2077》时,在性能模式和超频模式下的平均耗电量分别为 172 瓦和 199 瓦,比我们在去年的机型上记录的耗电量高出几瓦。不过,这 4% 的微小功耗增长与 20% 的帧率增长相比,可以说是物有所值。
| Off / Standby | |
| Idle | |
| Load |
|
Key:
min: | |
| Alienware 16X Aurora Core Ultra 9 290HX Plus Ultra 9 290HX Plus, GeForce RTX 5070 Ti Laptop, , OLED, 2560x1600, 16" | Alienware 16X Aurora, RTX 5070 Ultra 9 275HX, GeForce RTX 5070 Laptop, , IPS, 2560x1600, 16" | Acer Predator Helios Neo 16S AI PHN16S-71-94L9 Ultra 9 275HX, GeForce RTX 5070 Ti Laptop, Micron 3500 1TB MTFDKBA1T0TGD, OLED, 2560x1600, 16" | Lenovo Legion Pro 5 16IAX10, RTX 5070 Ultra 7 255HX, GeForce RTX 5070 Laptop, SK Hynix HFS001TEJ9X115N, OLED, 2650x1600, 16" | MSI Vector 16 HX AI A2XWHG Ultra 7 255HX, GeForce RTX 5070 Ti Laptop, Micron 2400 MTFDKBA512QFM, IPS, 2560x1600, 16" | Asus ROG Zephyrus G16 GU605CW Ultra 9 285H, GeForce RTX 5080 Laptop, Micron 2500 2TB MTFDKBA2T0QGN-1BN1AABGA, OLED, 2560x1600, 16" | |
|---|---|---|---|---|---|---|
| Power Consumption | -62% | 17% | -11% | -20% | -3% | |
| Idle Minimum * (Watt) | 6.9 | 20.1 -191% | 3.9 43% | 10.6 -54% | 7.1 -3% | 12.6 -83% |
| Idle Average * (Watt) | 8.1 | 27.6 -241% | 11 -36% | 12.3 -52% | 15.9 -96% | 13.4 -65% |
| Idle Maximum * (Watt) | 31 | 31.8 -3% | 16.9 45% | 18.6 40% | 29.5 5% | 15.1 51% |
| Load Average * (Watt) | 131.6 | 102.7 22% | 123 7% | 104 21% | 124 6% | 116.3 12% |
| Cyberpunk 2077 ultra * (Watt) | 198.3 | 217 -9% | 152.7 23% | 231 -16% | 222 -12% | 156.4 21% |
| Cyberpunk 2077 ultra external monitor * (Watt) | 172.1 | 192.3 -12% | 144.9 16% | 227 -32% | 217 -26% | 157.9 8% |
| Load Maximum * (Watt) | 300.1 | 292 3% | 229 24% | 248 17% | 336 -12% | 199 34% |
* ... smaller is better
功耗 赛博朋克/压力测试
外部显示器功耗
电池寿命
尽管从 IPS 转向了 OLED,但上述较低的空载功耗使电池续航时间比去年的机型更长。不过,请务必将 GPU 设置为 "自动",将显示屏设置为 60 Hz,将电源配置文件设置为 "平衡 "或更低,这样 WLAN 运行时间才能超过 7 小时。
| Alienware 16X Aurora Core Ultra 9 290HX Plus Ultra 9 290HX Plus, GeForce RTX 5070 Ti Laptop, 96 Wh | Alienware 16X Aurora, RTX 5070 Ultra 9 275HX, GeForce RTX 5070 Laptop, 96 Wh | Acer Predator Helios Neo 16S AI PHN16S-71-94L9 Ultra 9 275HX, GeForce RTX 5070 Ti Laptop, 76 Wh | Lenovo Legion Pro 5 16IAX10, RTX 5070 Ultra 7 255HX, GeForce RTX 5070 Laptop, 80 Wh | MSI Vector 16 HX AI A2XWHG Ultra 7 255HX, GeForce RTX 5070 Ti Laptop, 90 Wh | Asus ROG Zephyrus G16 GA605WV Ryzen AI 9 HX 370, GeForce RTX 4060 Laptop GPU, 90 Wh | |
|---|---|---|---|---|---|---|
| Battery runtime | -42% | -32% | -16% | -5% | 8% | |
| WiFi v1.3 (h) | 7.4 | 4.3 -42% | 5 -32% | 6.2 -16% | 7 -5% | 8 8% |
| H.264 (h) | 6.1 | 13.7 | ||||
| Load (h) | 1.8 | 1.7 |
笔记本检查评级
2026 年的 Alienware 16X Aurora 提供了比上一年更先进的配置,但遗憾的是,某些选件与其他选件捆绑或捆绑后价格虚高。
Alienware 16X Aurora Core Ultra 9 290HX Plus
- 05/14/2026 v8
Allen Ngo
 Total Sustainability Score:
 潜在竞争对手比较
Image | Model / Review | Price | Weight | Height | Display |
|---|---|---|---|---|---|
1. 85.9%  | Alienware 16X Aurora Core Ultra 9 290HX Plus Intel Core Ultra 9 290HX Plus ⎘ NVIDIA GeForce RTX 5070 Ti Laptop ⎘ 32 GB Memory | Amazon: List Price: 3000 USD | 2.6 kg | 23.4 mm | 16.00" 2560x1600 189 PPI OLED |
2. 84.9%  | Alienware 16X Aurora, RTX 5070 Intel Core Ultra 9 275HX ⎘ NVIDIA GeForce RTX 5070 Laptop ⎘ 32 GB Memory | Amazon: List Price: 1800 USD | 2.5 kg | 23.4 mm | 16.00" 2560x1600 189 PPI IPS |
3. 82%  | Acer Predator Helios Neo 16S AI PHN16S-71-94L9 Intel Core Ultra 9 275HX ⎘ NVIDIA GeForce RTX 5070 Ti Laptop ⎘ 32 GB Memory, 1024 GB SSD | Amazon: List Price: 2400 EUR | 2.2 kg | 19.9 mm | 16.00" 2560x1600 189 PPI OLED |
4. 86.2%  | Lenovo Legion Pro 5 16IAX10, RTX 5070 Intel Core Ultra 7 255HX ⎘ NVIDIA GeForce RTX 5070 Laptop ⎘ 32 GB Memory, 1024 GB SSD | Amazon: List Price: 1800 Euro | 2.3 kg | 25.95 mm | 16.00" 2650x1600 189 PPI OLED |
5. 84%  | MSI Vector 16 HX AI A2XWHG Intel Core Ultra 7 255HX ⎘ NVIDIA GeForce RTX 5070 Ti Laptop ⎘ 16 GB Memory, 512 GB SSD | Amazon: List Price: 2000 EUR | 2.6 kg | 28.6 mm | 16.00" 2560x1600 189 PPI IPS |
6.  | Asus ROG Zephyrus G16 GU605CW Intel Core Ultra 9 285H ⎘ NVIDIA GeForce RTX 5080 Laptop ⎘ 32 GB Memory, 2048 GB SSD | Amazon: List Price: 3800€ | 2 kg | 14.9 mm | 16.00" 2560x1600 189 PPI OLED |
Transparency
The selection of devices to be reviewed is made by our editorial team. The test sample was provided to the author as a loan by the manufacturer or retailer for the purpose of this review. The lender had no influence on this review, nor did the manufacturer receive a copy of this review before publication. There was no obligation to publish this review. As an independent media company, Notebookcheck is not subjected to the authority of manufacturers, retailers or publishers.
This is how Notebookcheck is testing
Every year, Notebookcheck independently reviews hundreds of laptops and smartphones using standardized procedures to ensure that all results are comparable. We have continuously developed our test methods for around 20 years and set industry standards in the process. In our test labs, high-quality measuring equipment is utilized by experienced technicians and editors. These tests involve a multi-stage validation process. Our complex rating system is based on hundreds of well-founded measurements and benchmarks, which maintains objectivity. Further information on our test methods can be found here.

