结论 - XMG Focus 17 性能卓越,但也有不足之处
XMG 推出新款 Focus 17 M25 的目的很明确,就是要以尽可能低的价格提供尽可能高的性能。为实现这一目标,全新 GeForce RTX 5070 Ti 笔记本电脑 GPU(12GB的VRAM)与老式的 酷睿 i9-13900HX.不过,其性能仍然足够,尤其是在游戏方面。这使得在原生 QHD 分辨率下玩游戏没有任何问题。在全功率运行时,风扇的声音确实很大,但这与竞争对手并无不同。尽管如此,散热装置在日常使用中仍然非常安静,而且广泛的能源配置文件允许您配置一个安静的系统,而不会对性能产生负面影响。
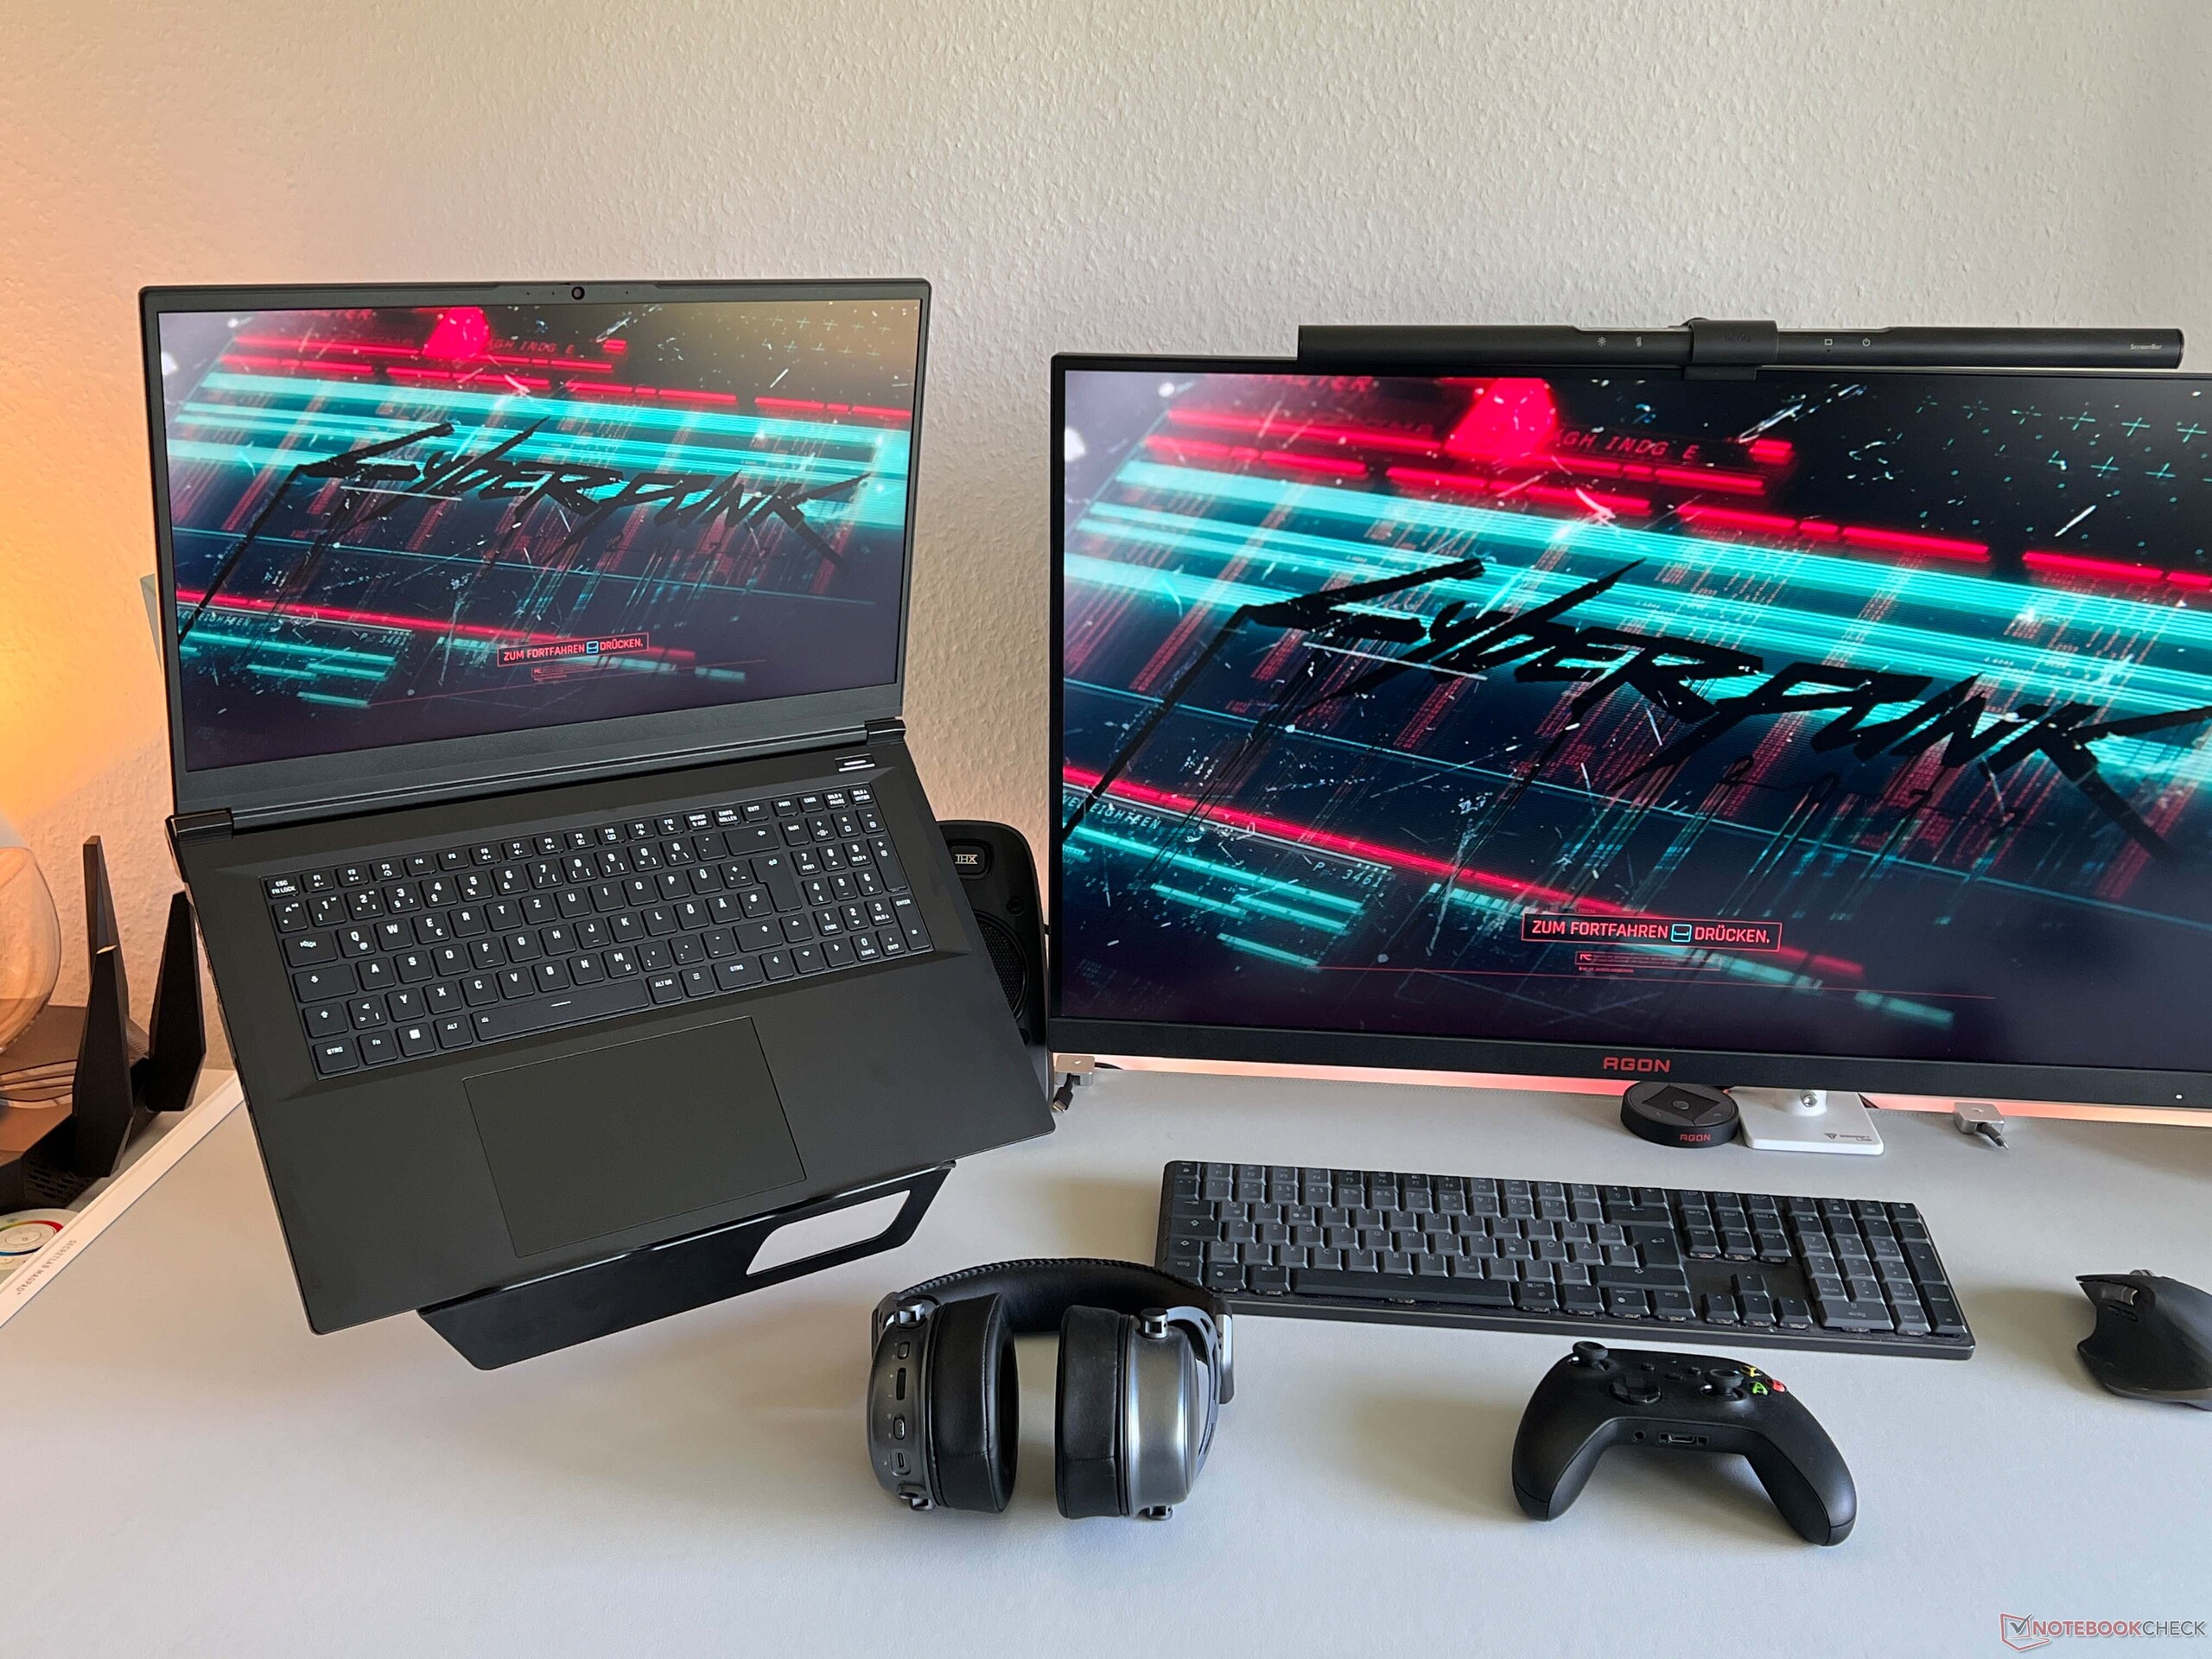
亚光 240 Hz IPS 显示屏也非常适合游戏。遗憾的是,它仍然是 16:9 屏幕,亮度难以与竞争对手相媲美。其他不足之处还包括缺少 Thunderbolt/USB 4.0 和高级擎天柱,但这些都是可以接受的。扬声器的音效也相当弱,230 瓦的电源也不够大。
总之,你能以优惠的价格买到一台快速的游戏机,12 GB 的 VRAM,GPU 也比标准的 RTX 5070 笔记本电脑 GPU 更加面向未来。
Pros
Cons
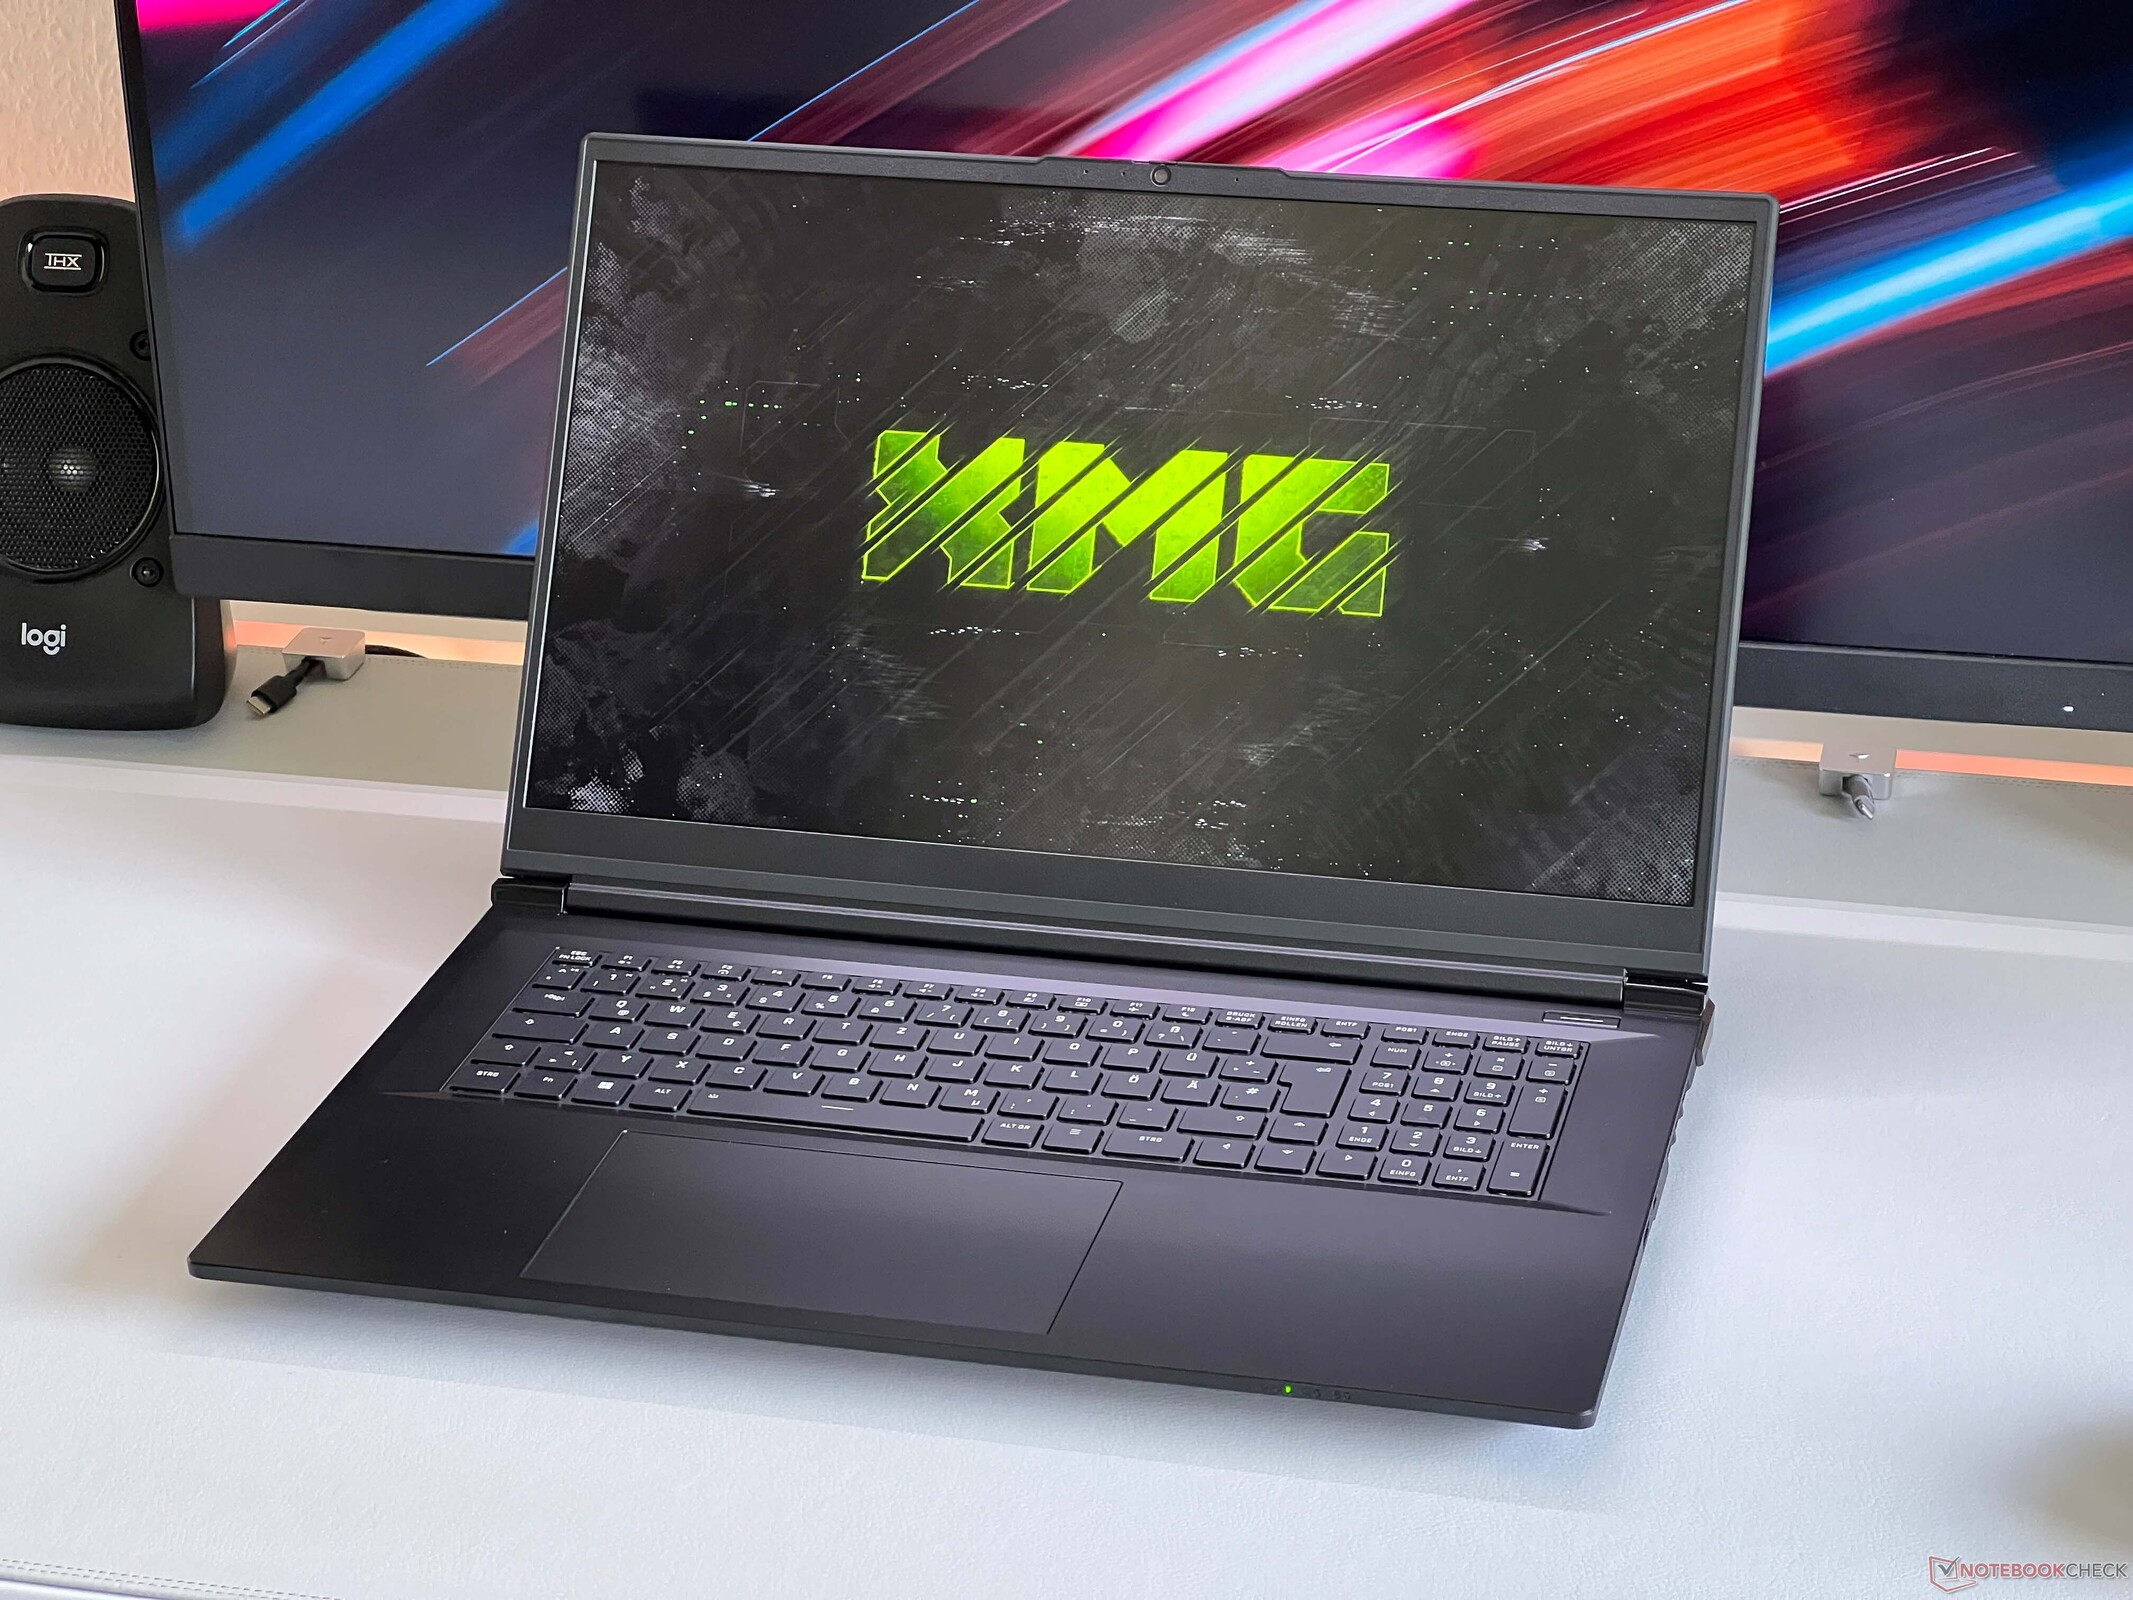
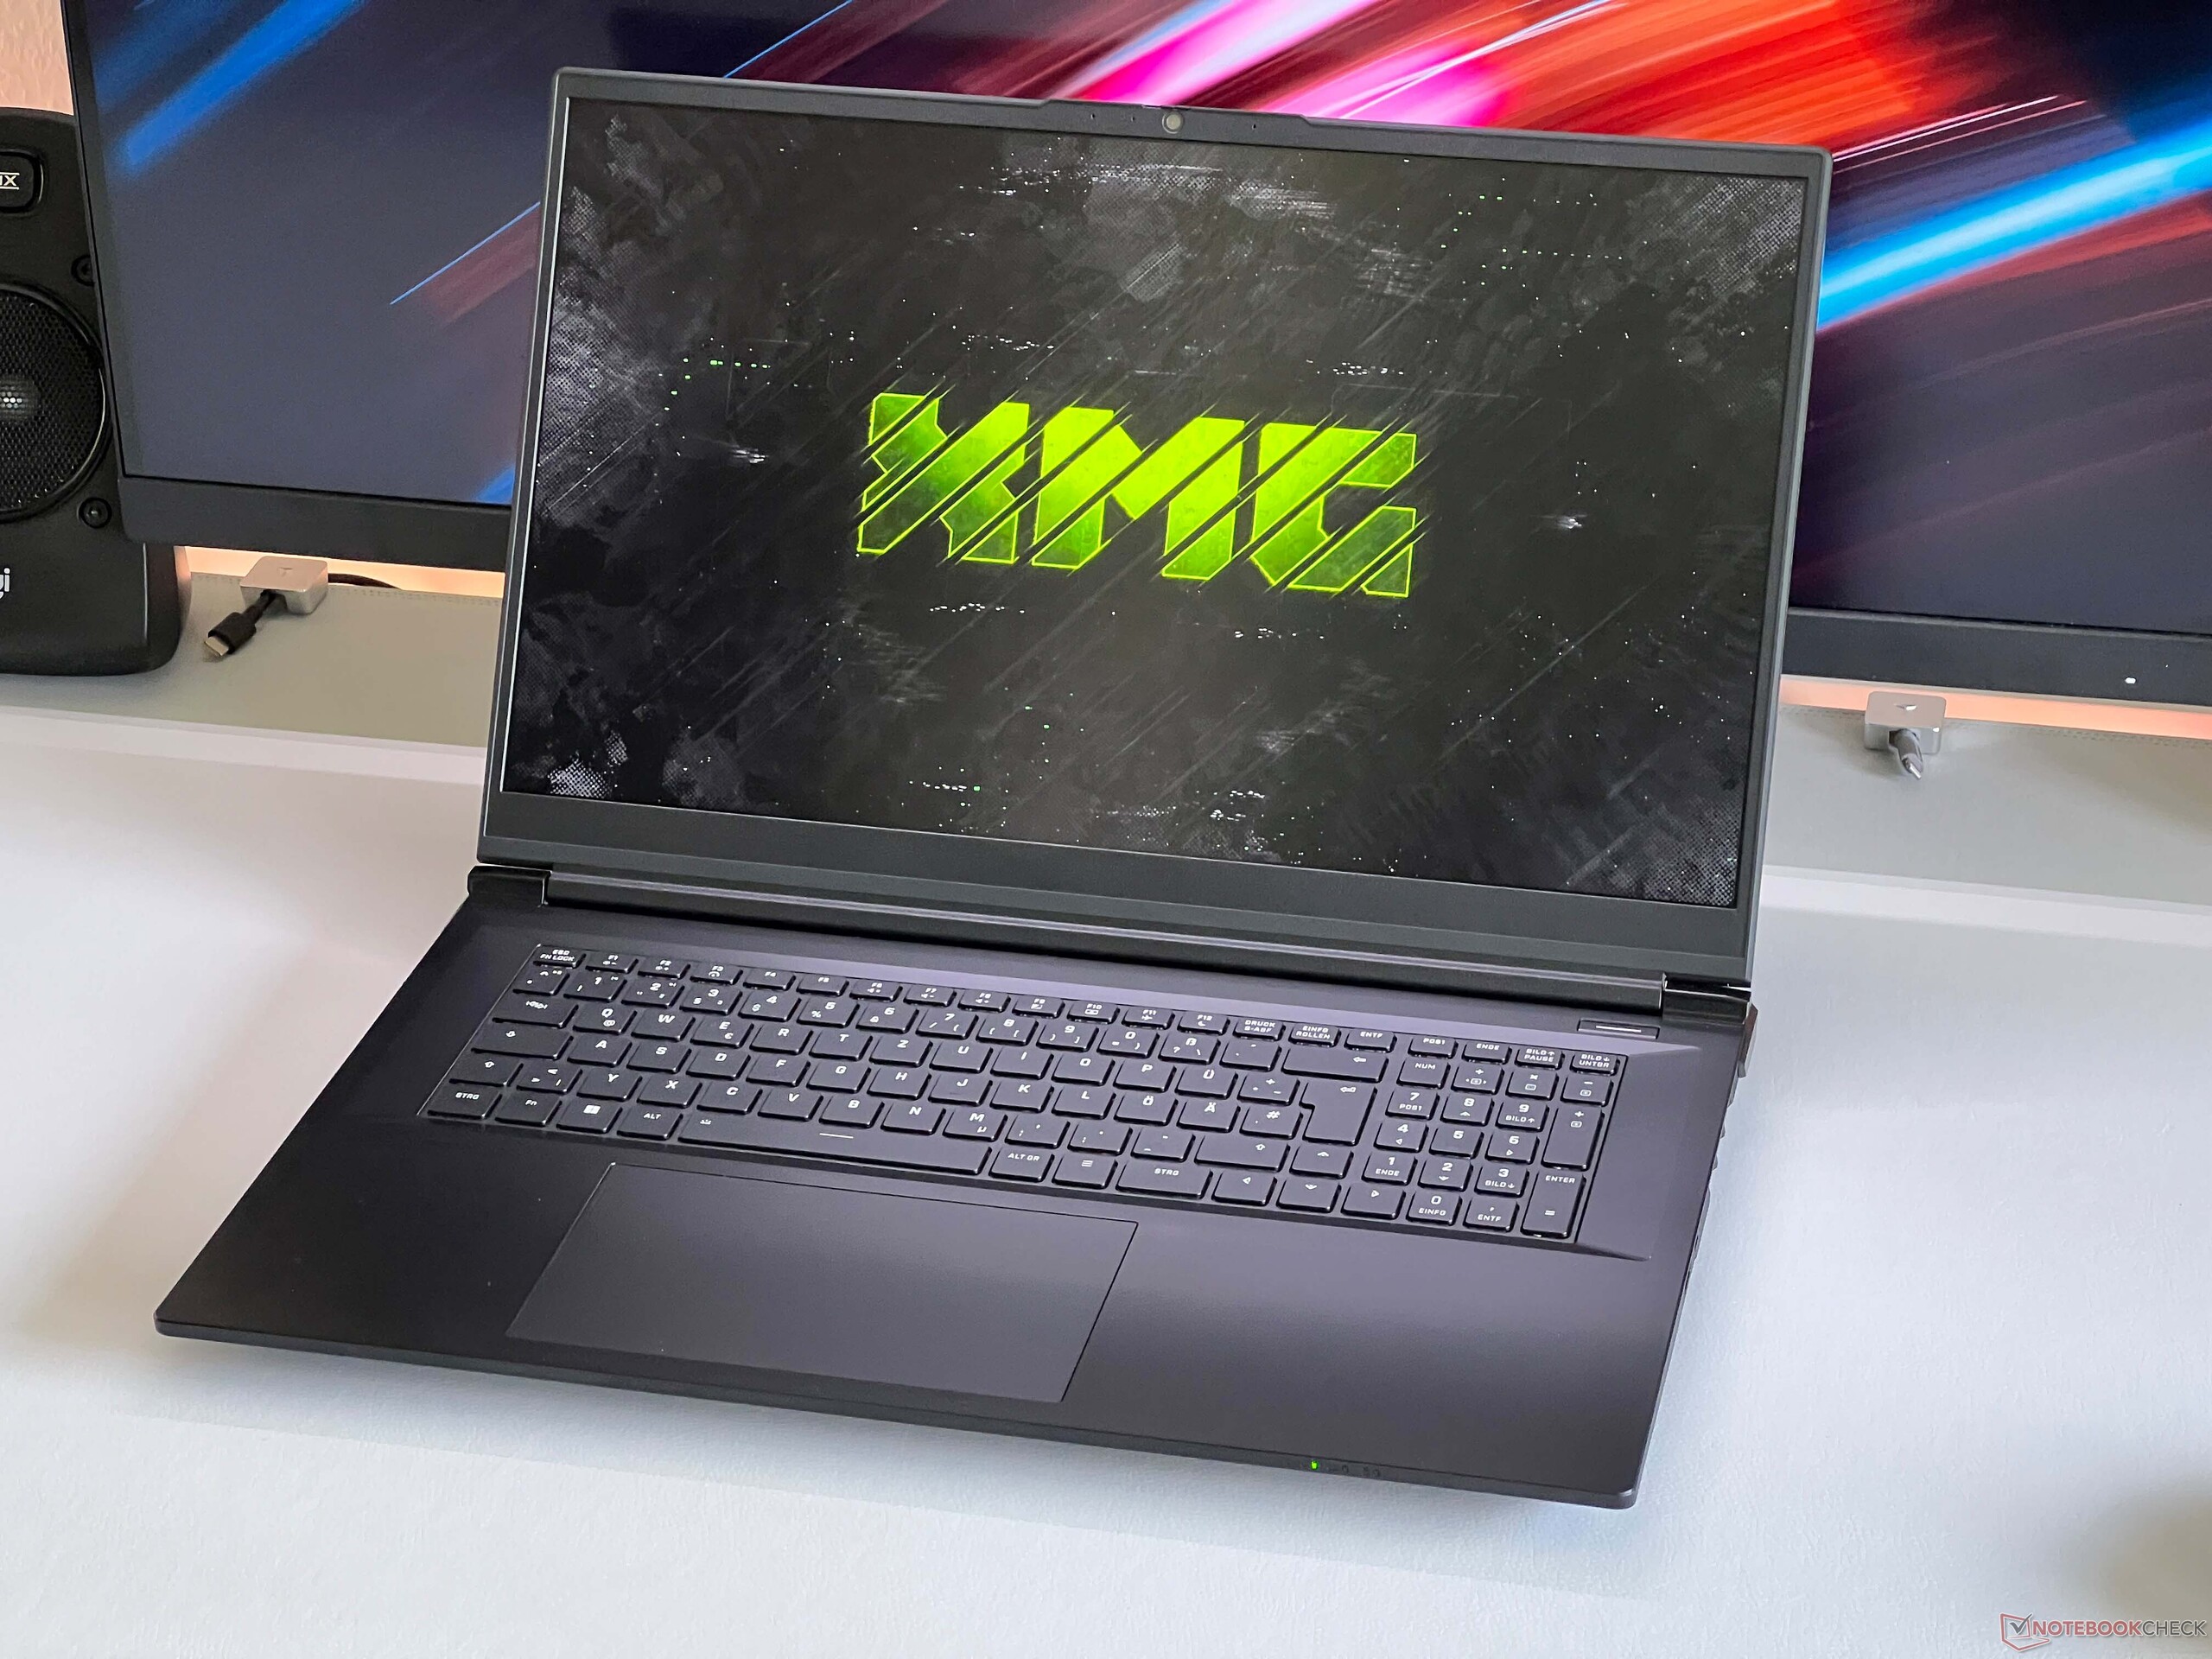
XMG 新推出的 Focus 17 M25 是一款 17 英寸游戏笔记本电脑,旨在以低价提供最高性能。起售价为酷睿 i9-13900HX、16 GB 内存、1 TB 固态硬盘和新的 GeForce RTX 5070 Ti 笔记本图形处理器(140 瓦)的起价为 1849 欧元(2100 美元),而我们的 32 GB 内存、Wi-Fi 7 和 Windows 11 Home 评测配置的起价为 1990 欧元(2300 美元)。
几乎没有真正的 17 英寸竞争对手,因为 微星 Vector 17 HX配备了 RTX 5070 Ti,目前的售价约为 3100 欧元(3600 美元)。16 英寸领域也有几款同类产品,但这也是 Focus 17 具有价格优势的领域。
规格
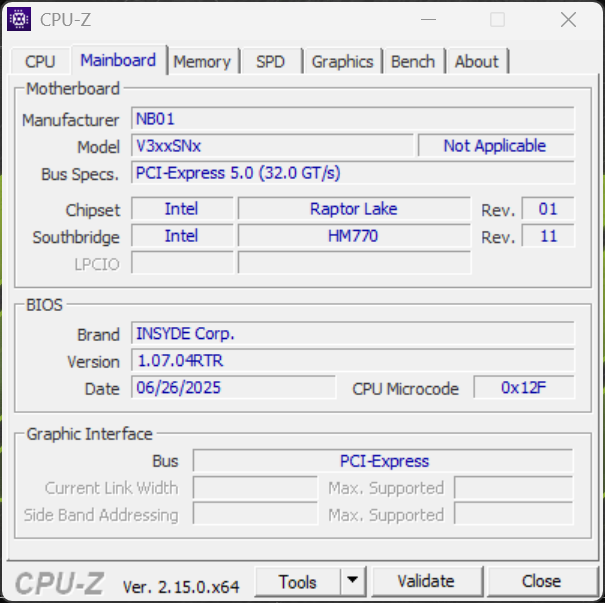
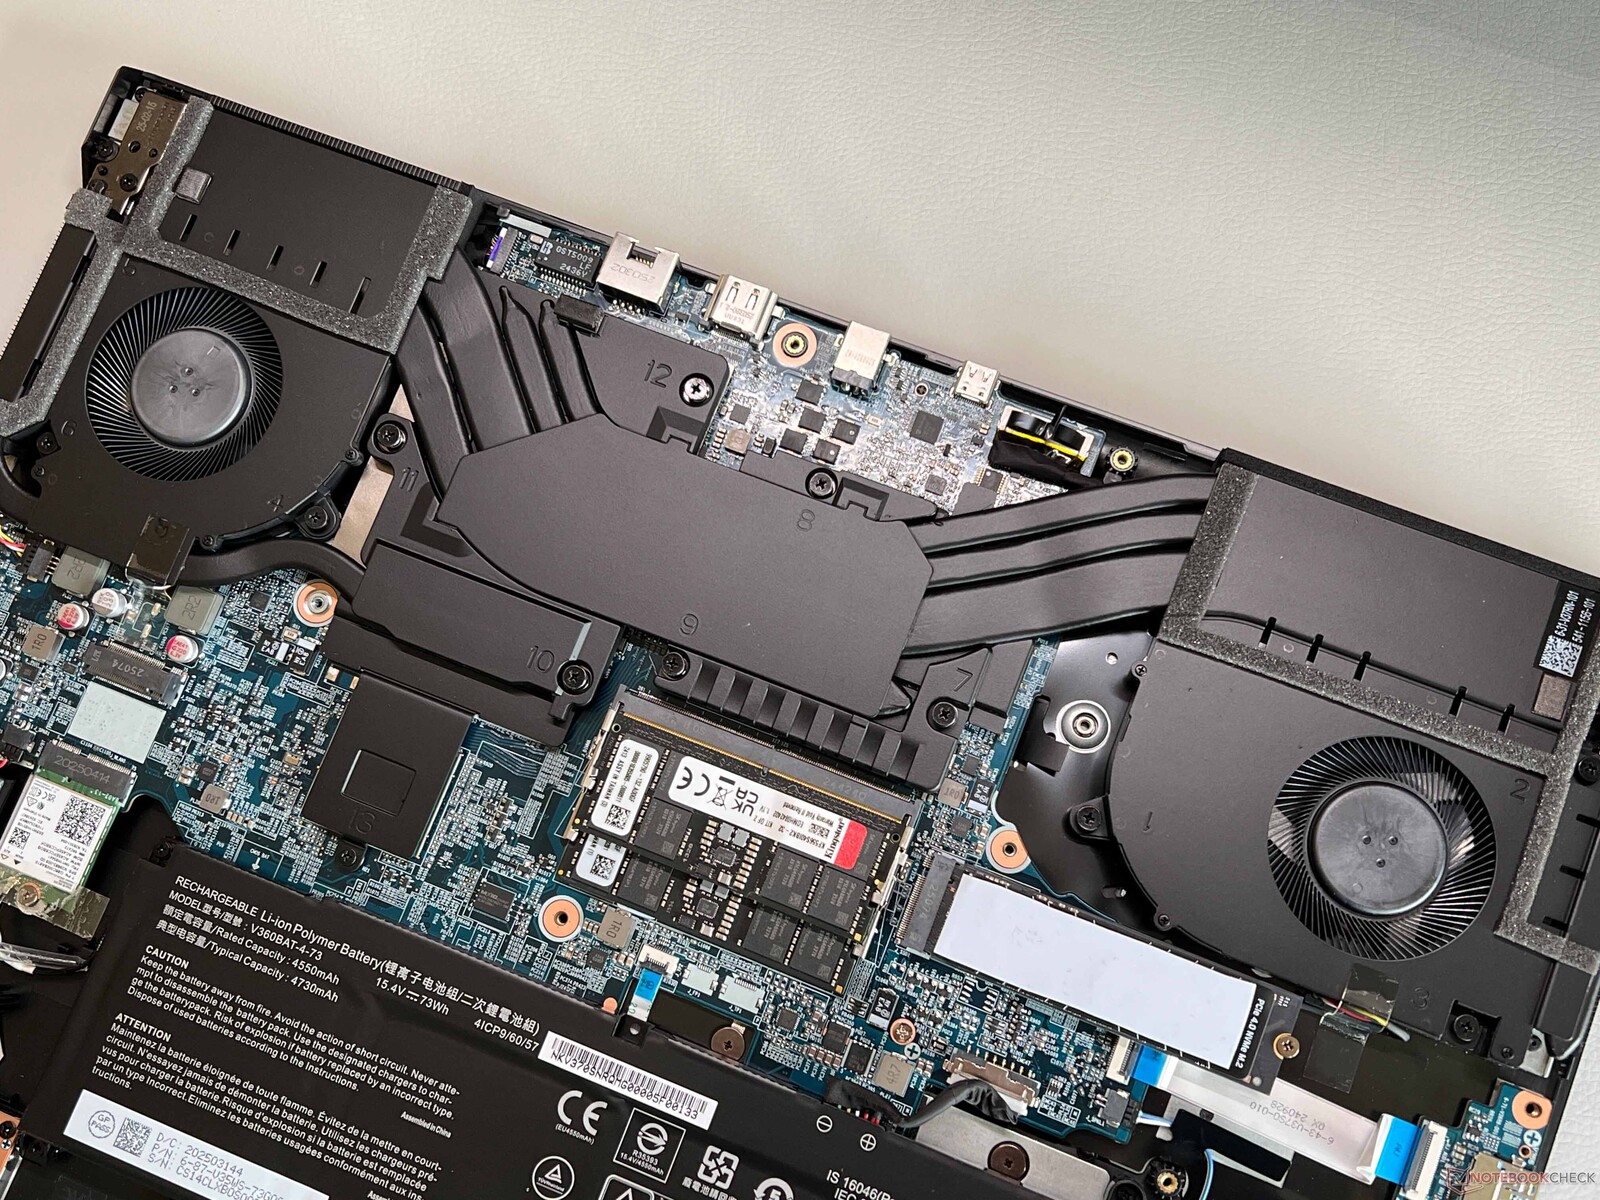
外壳和功能
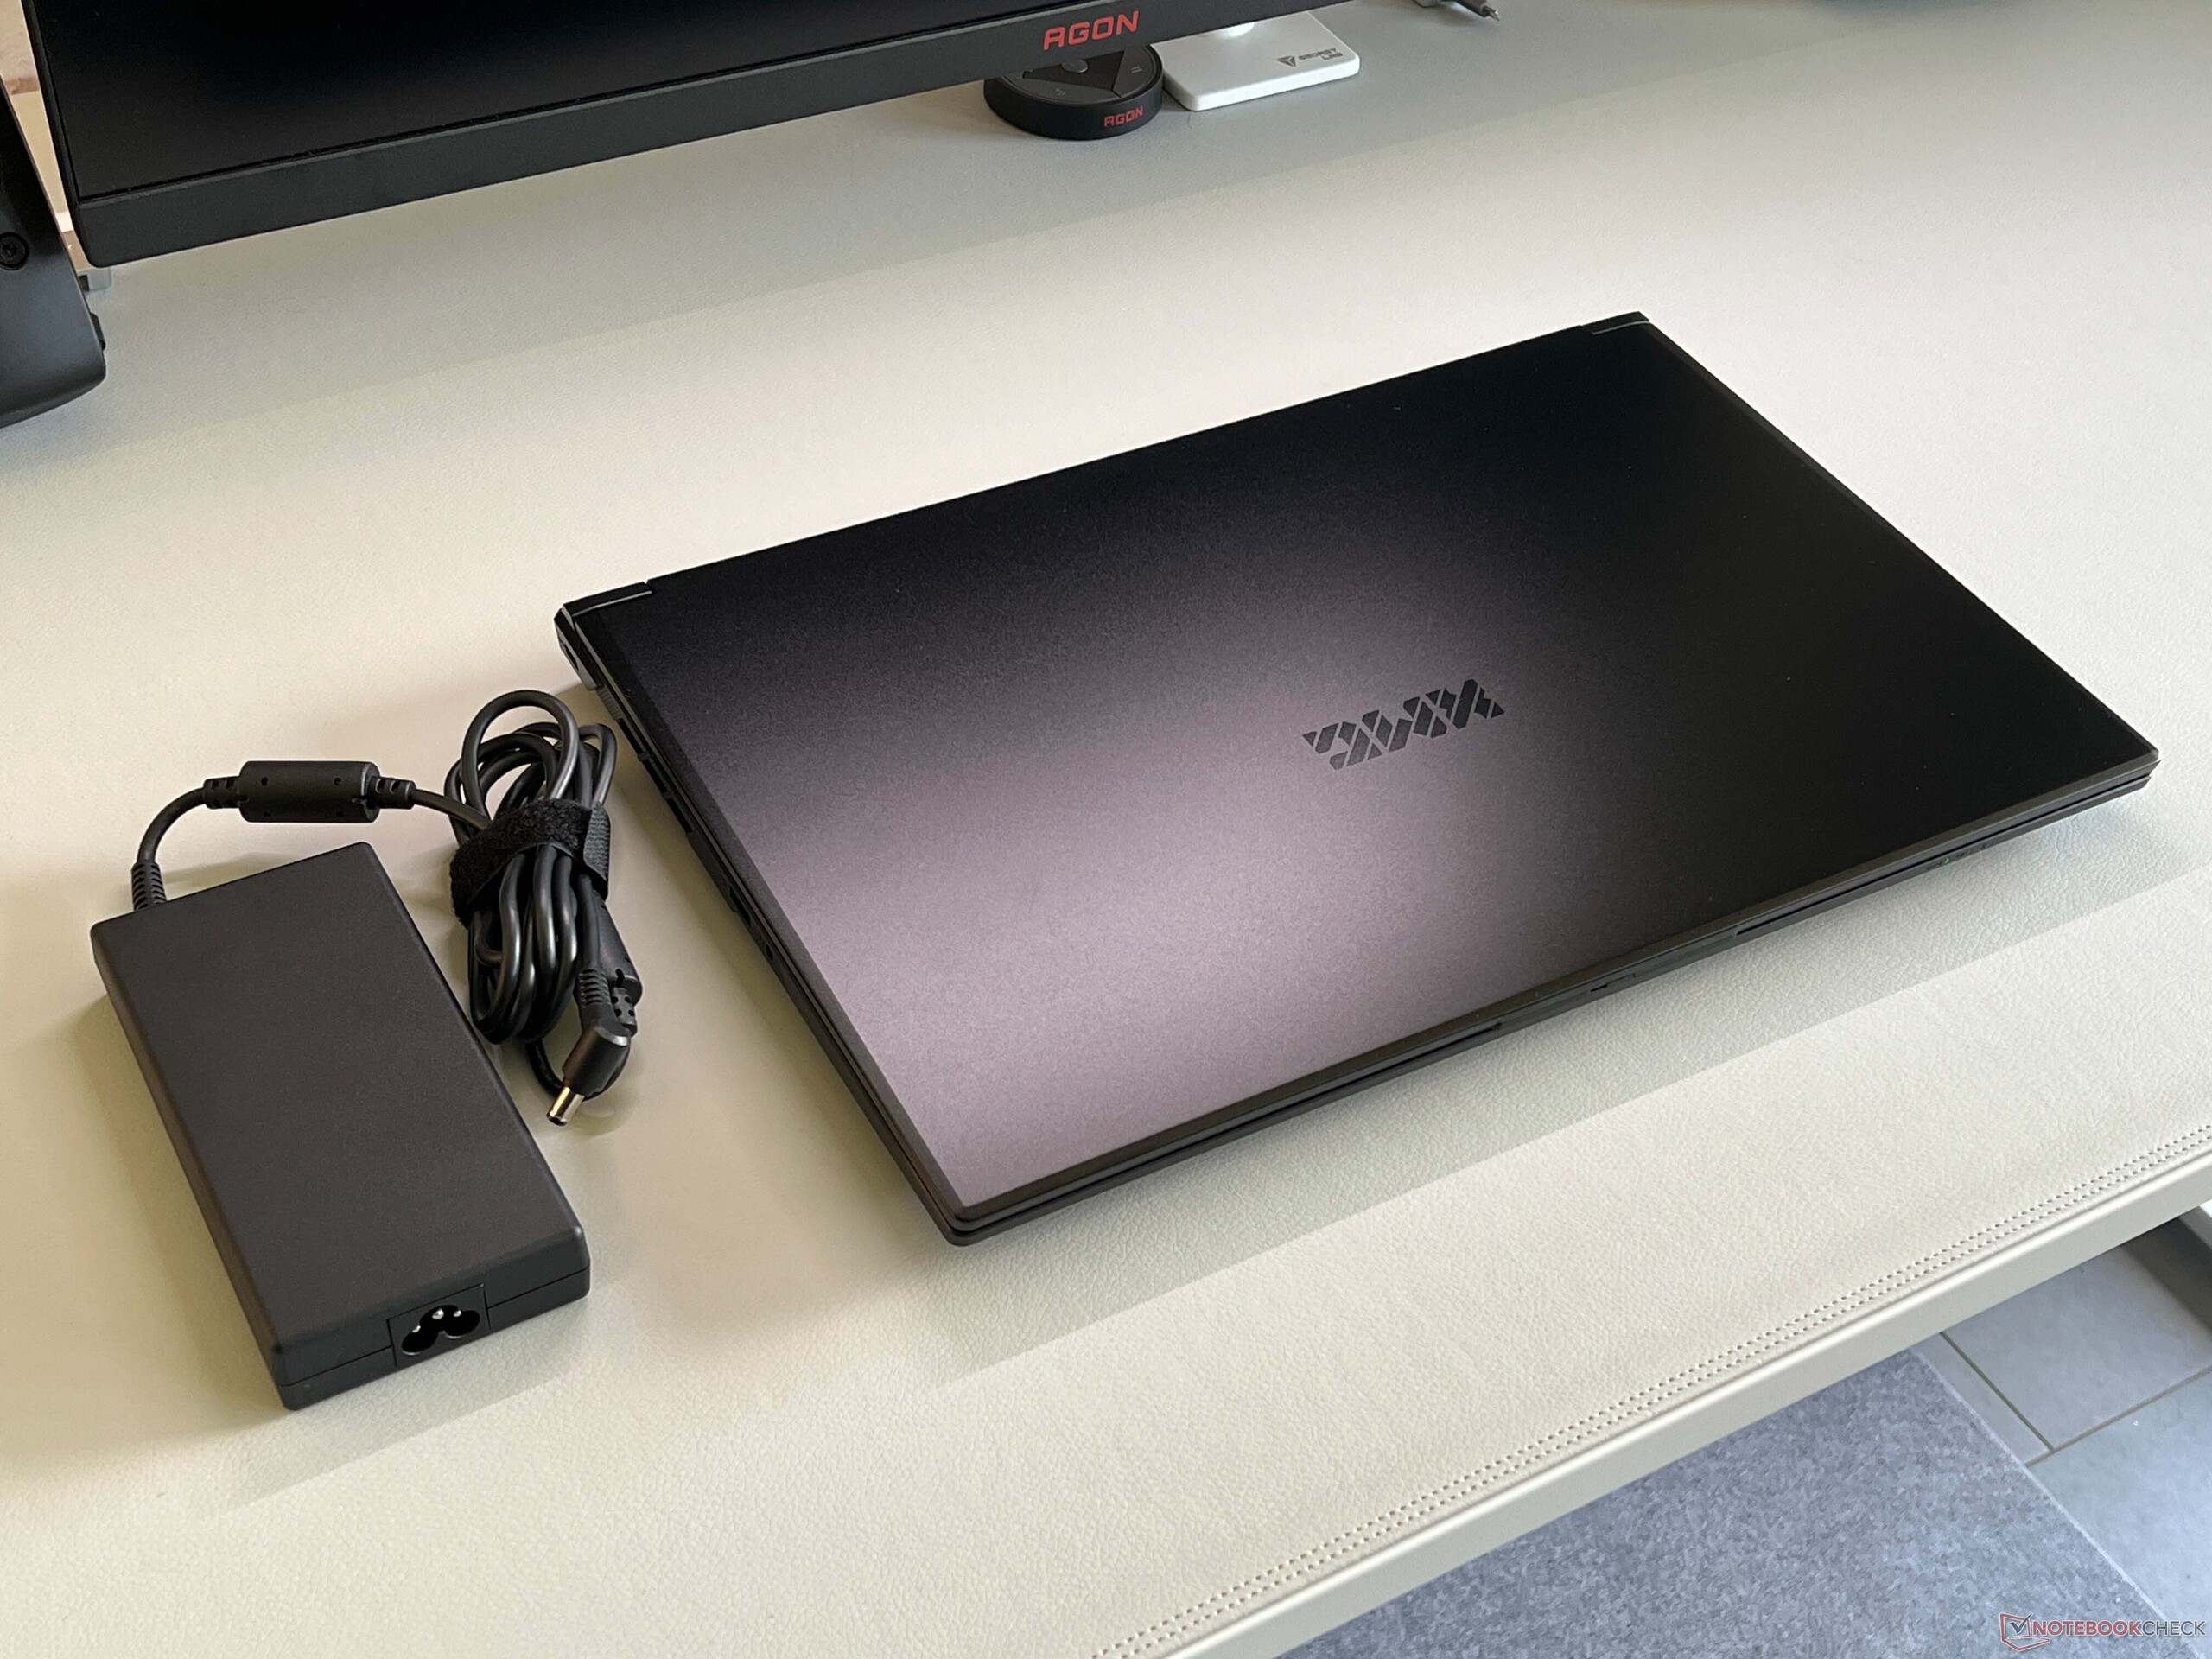
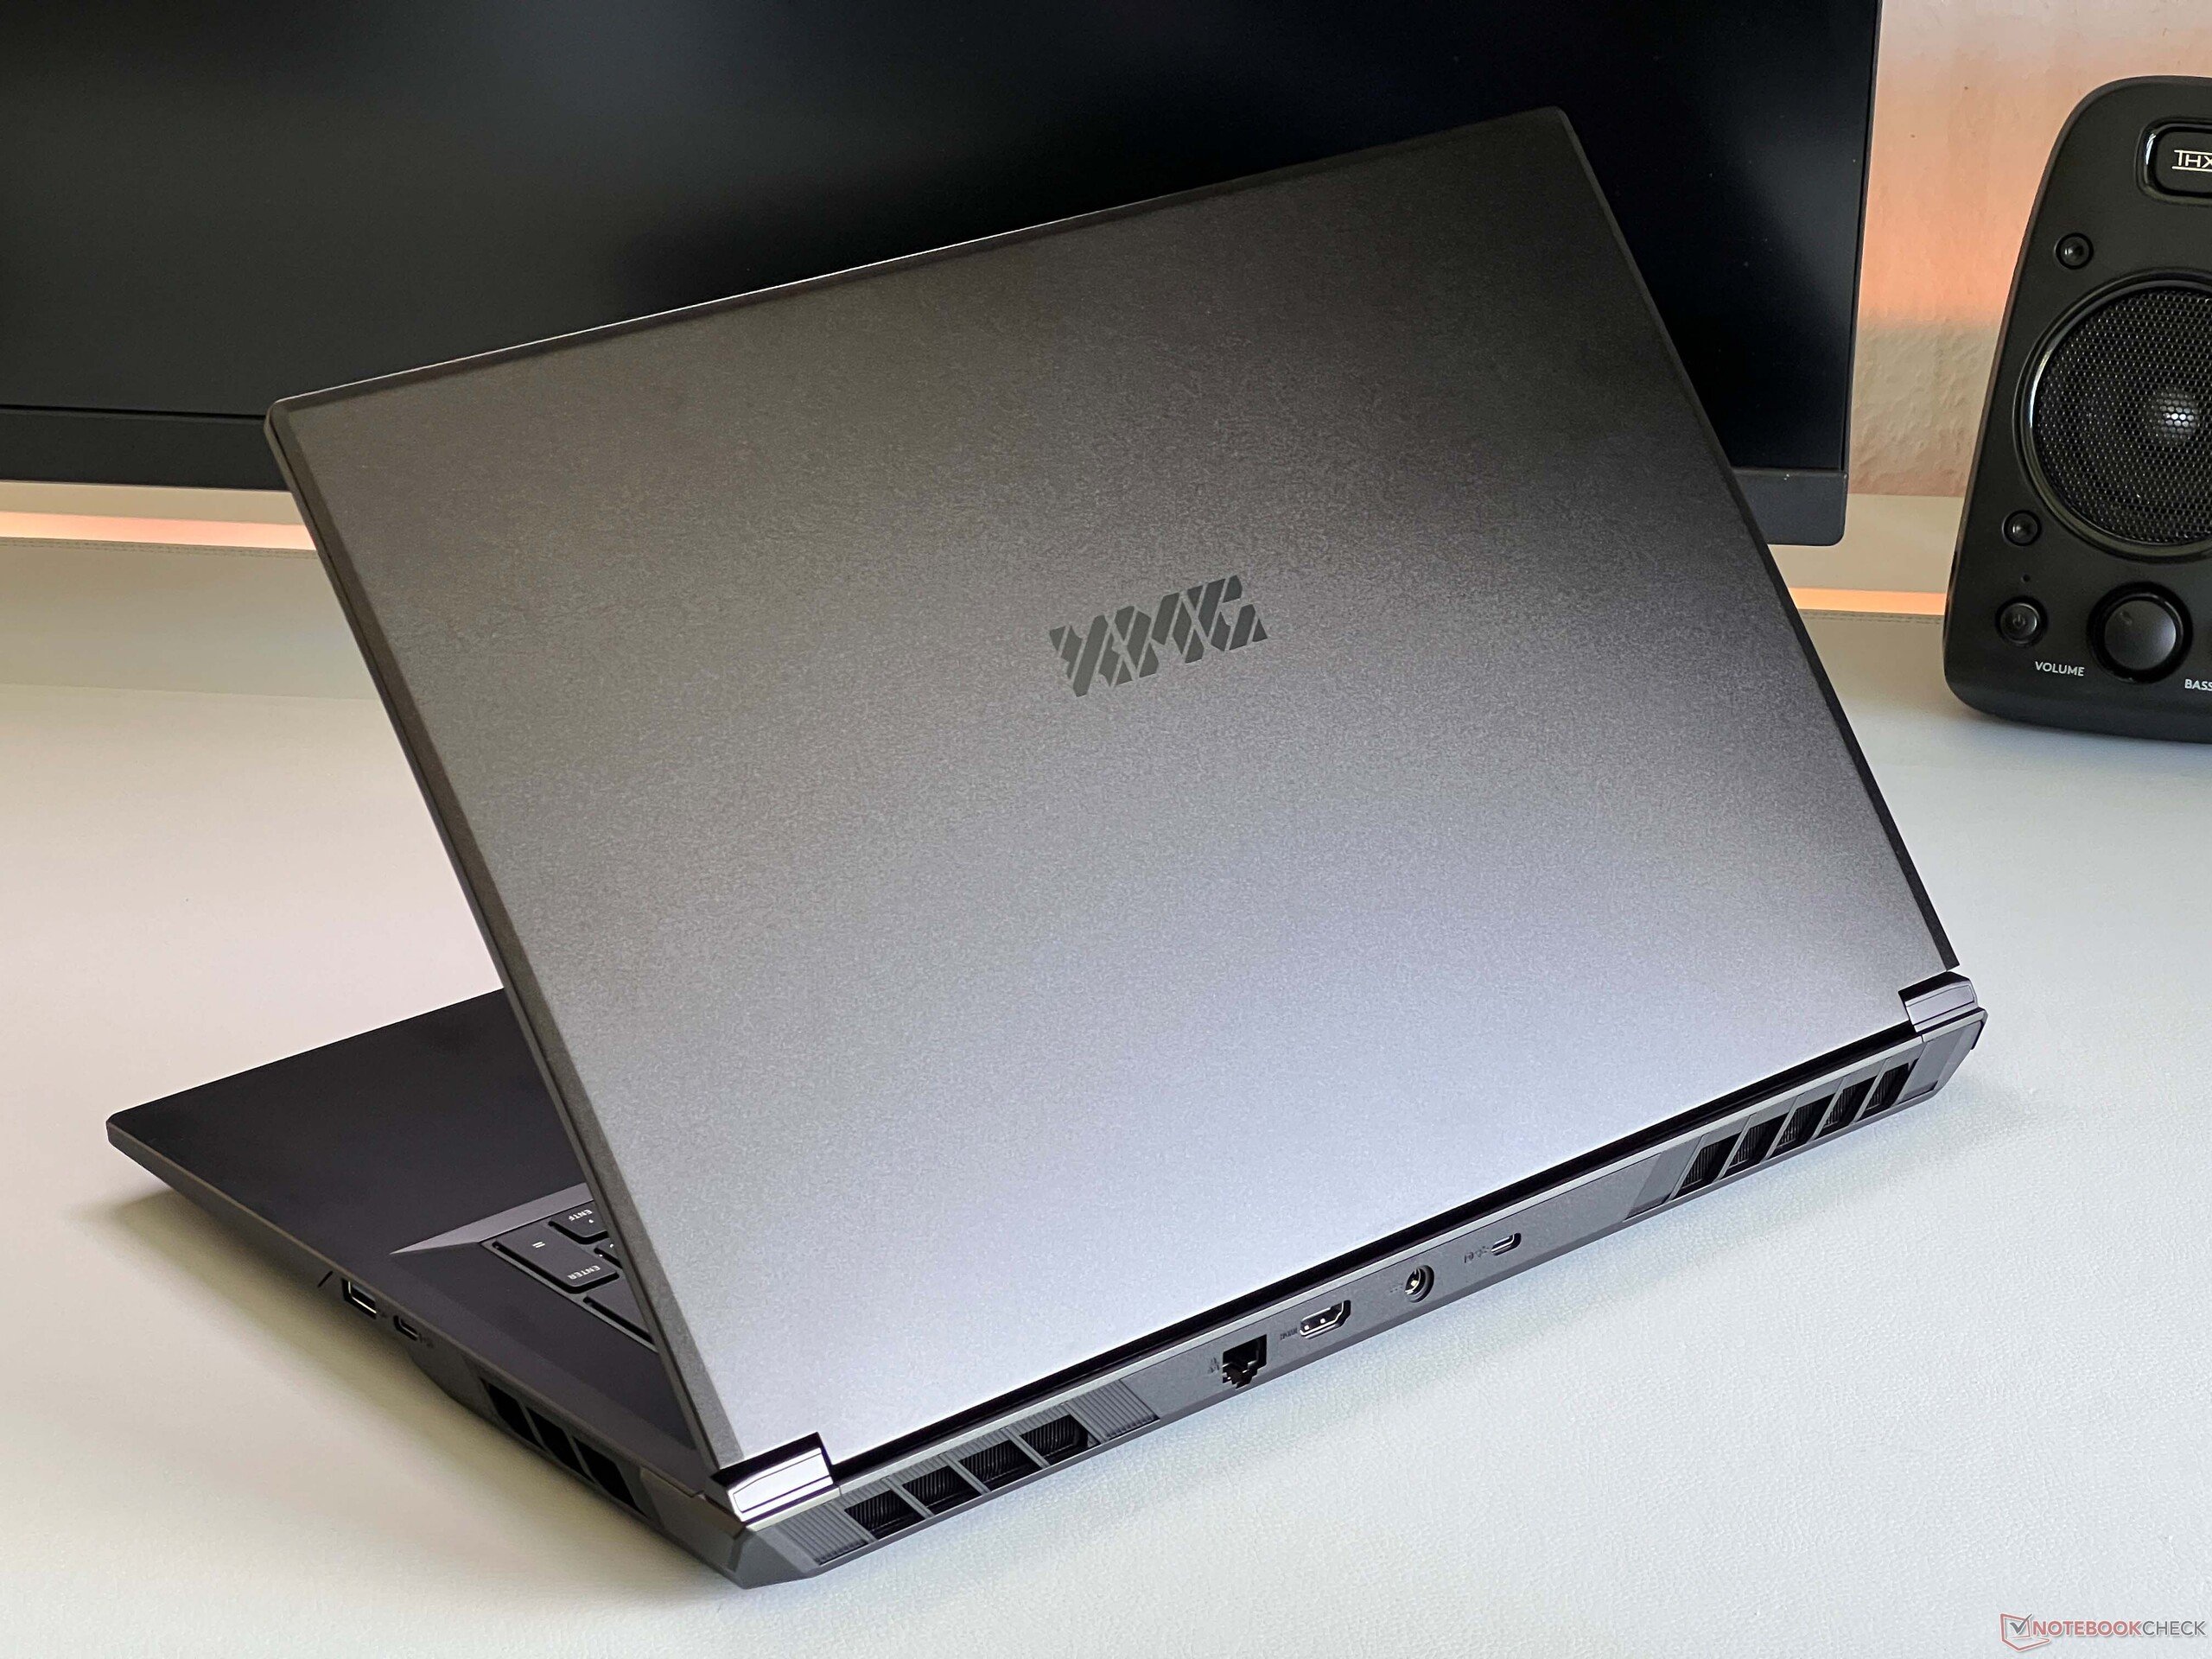
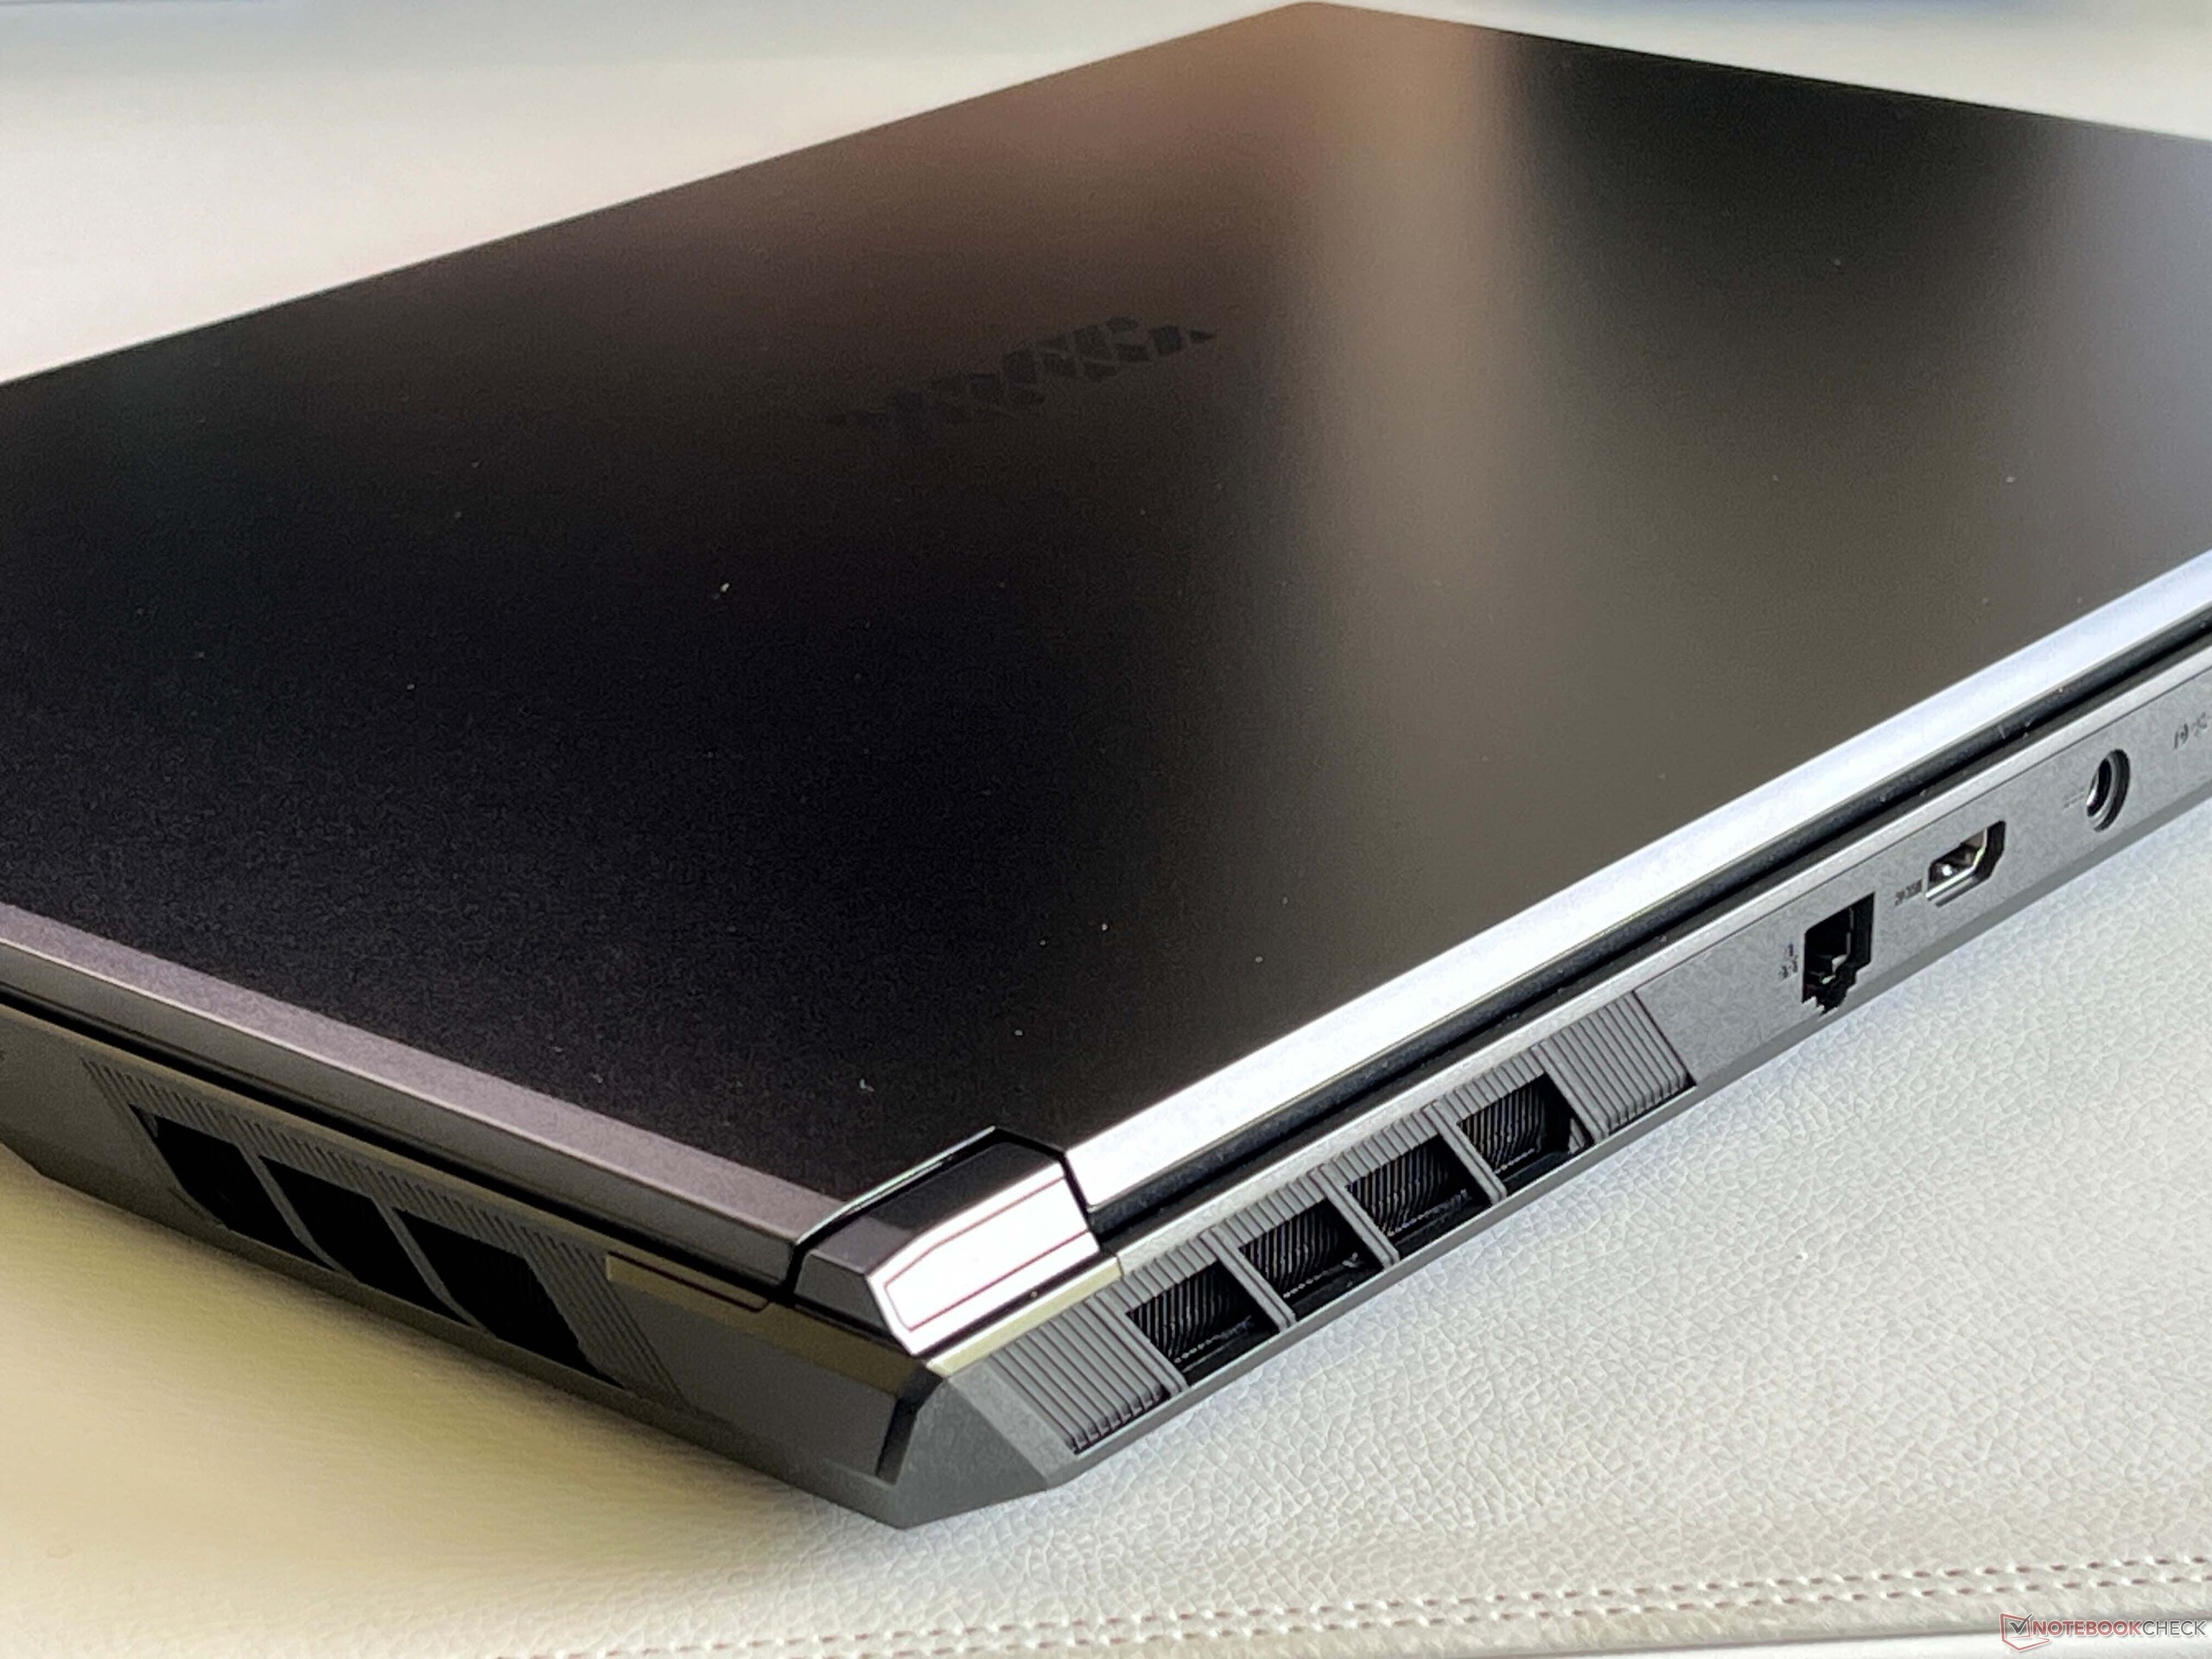
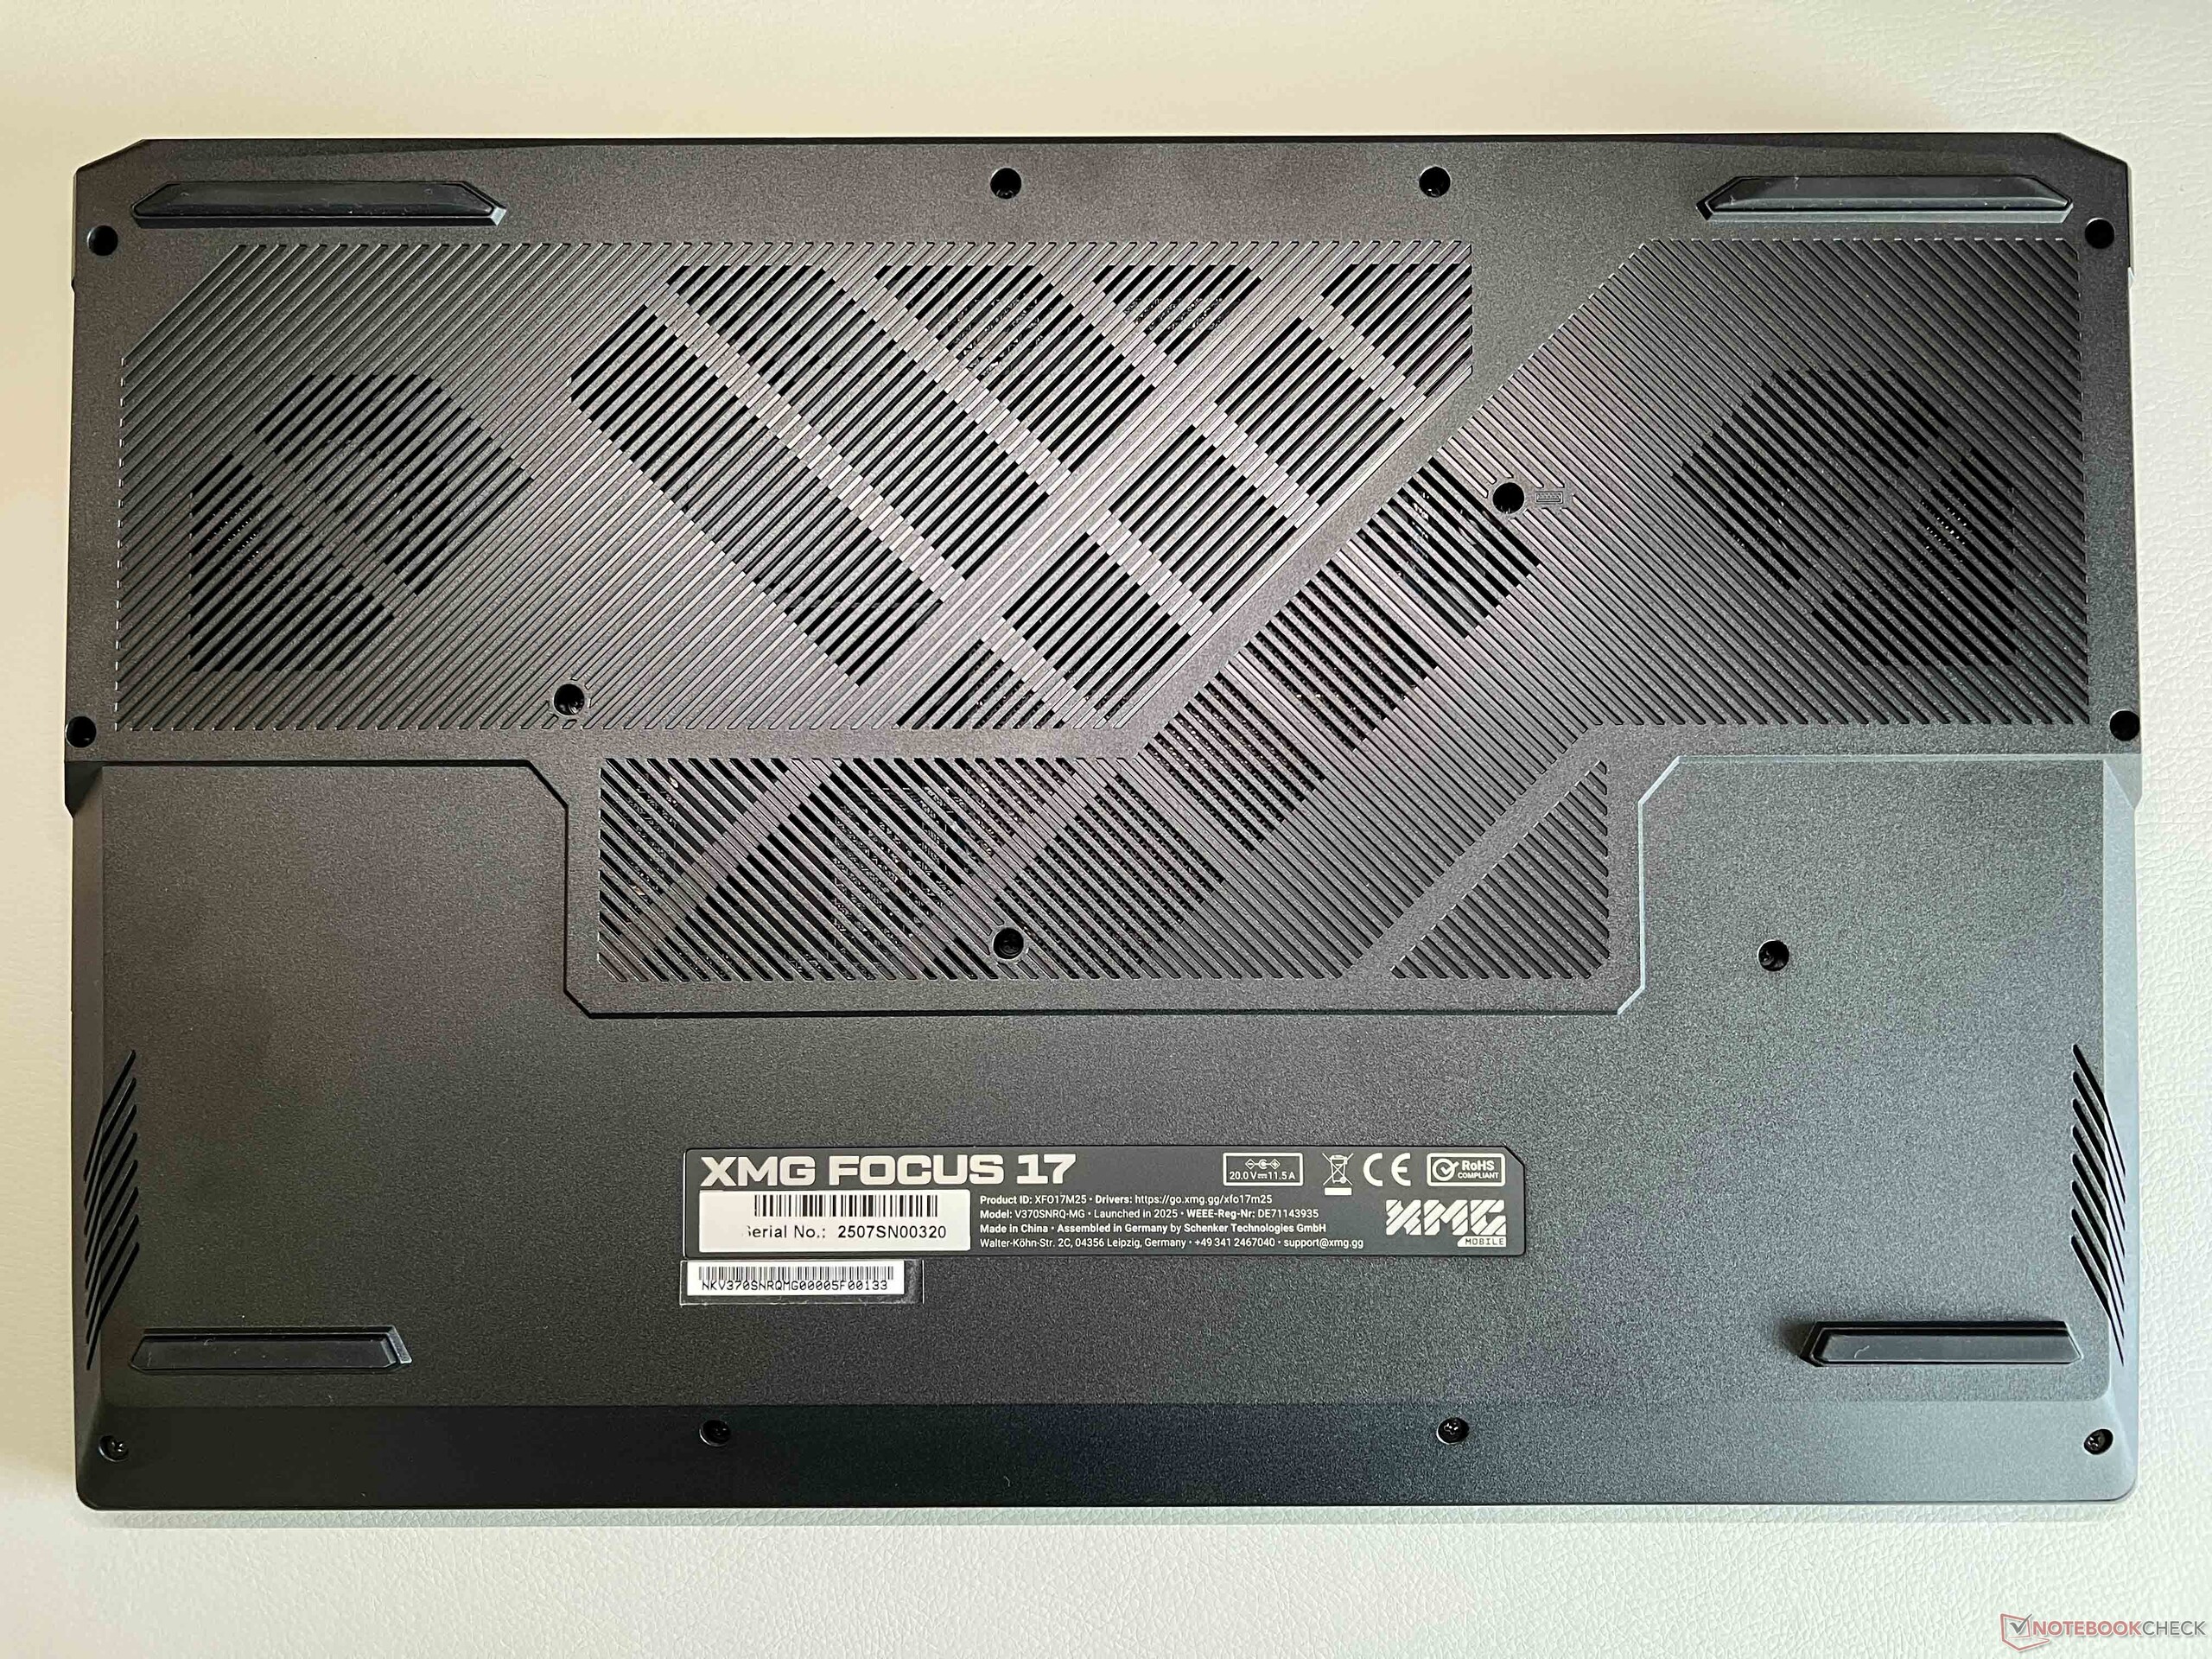
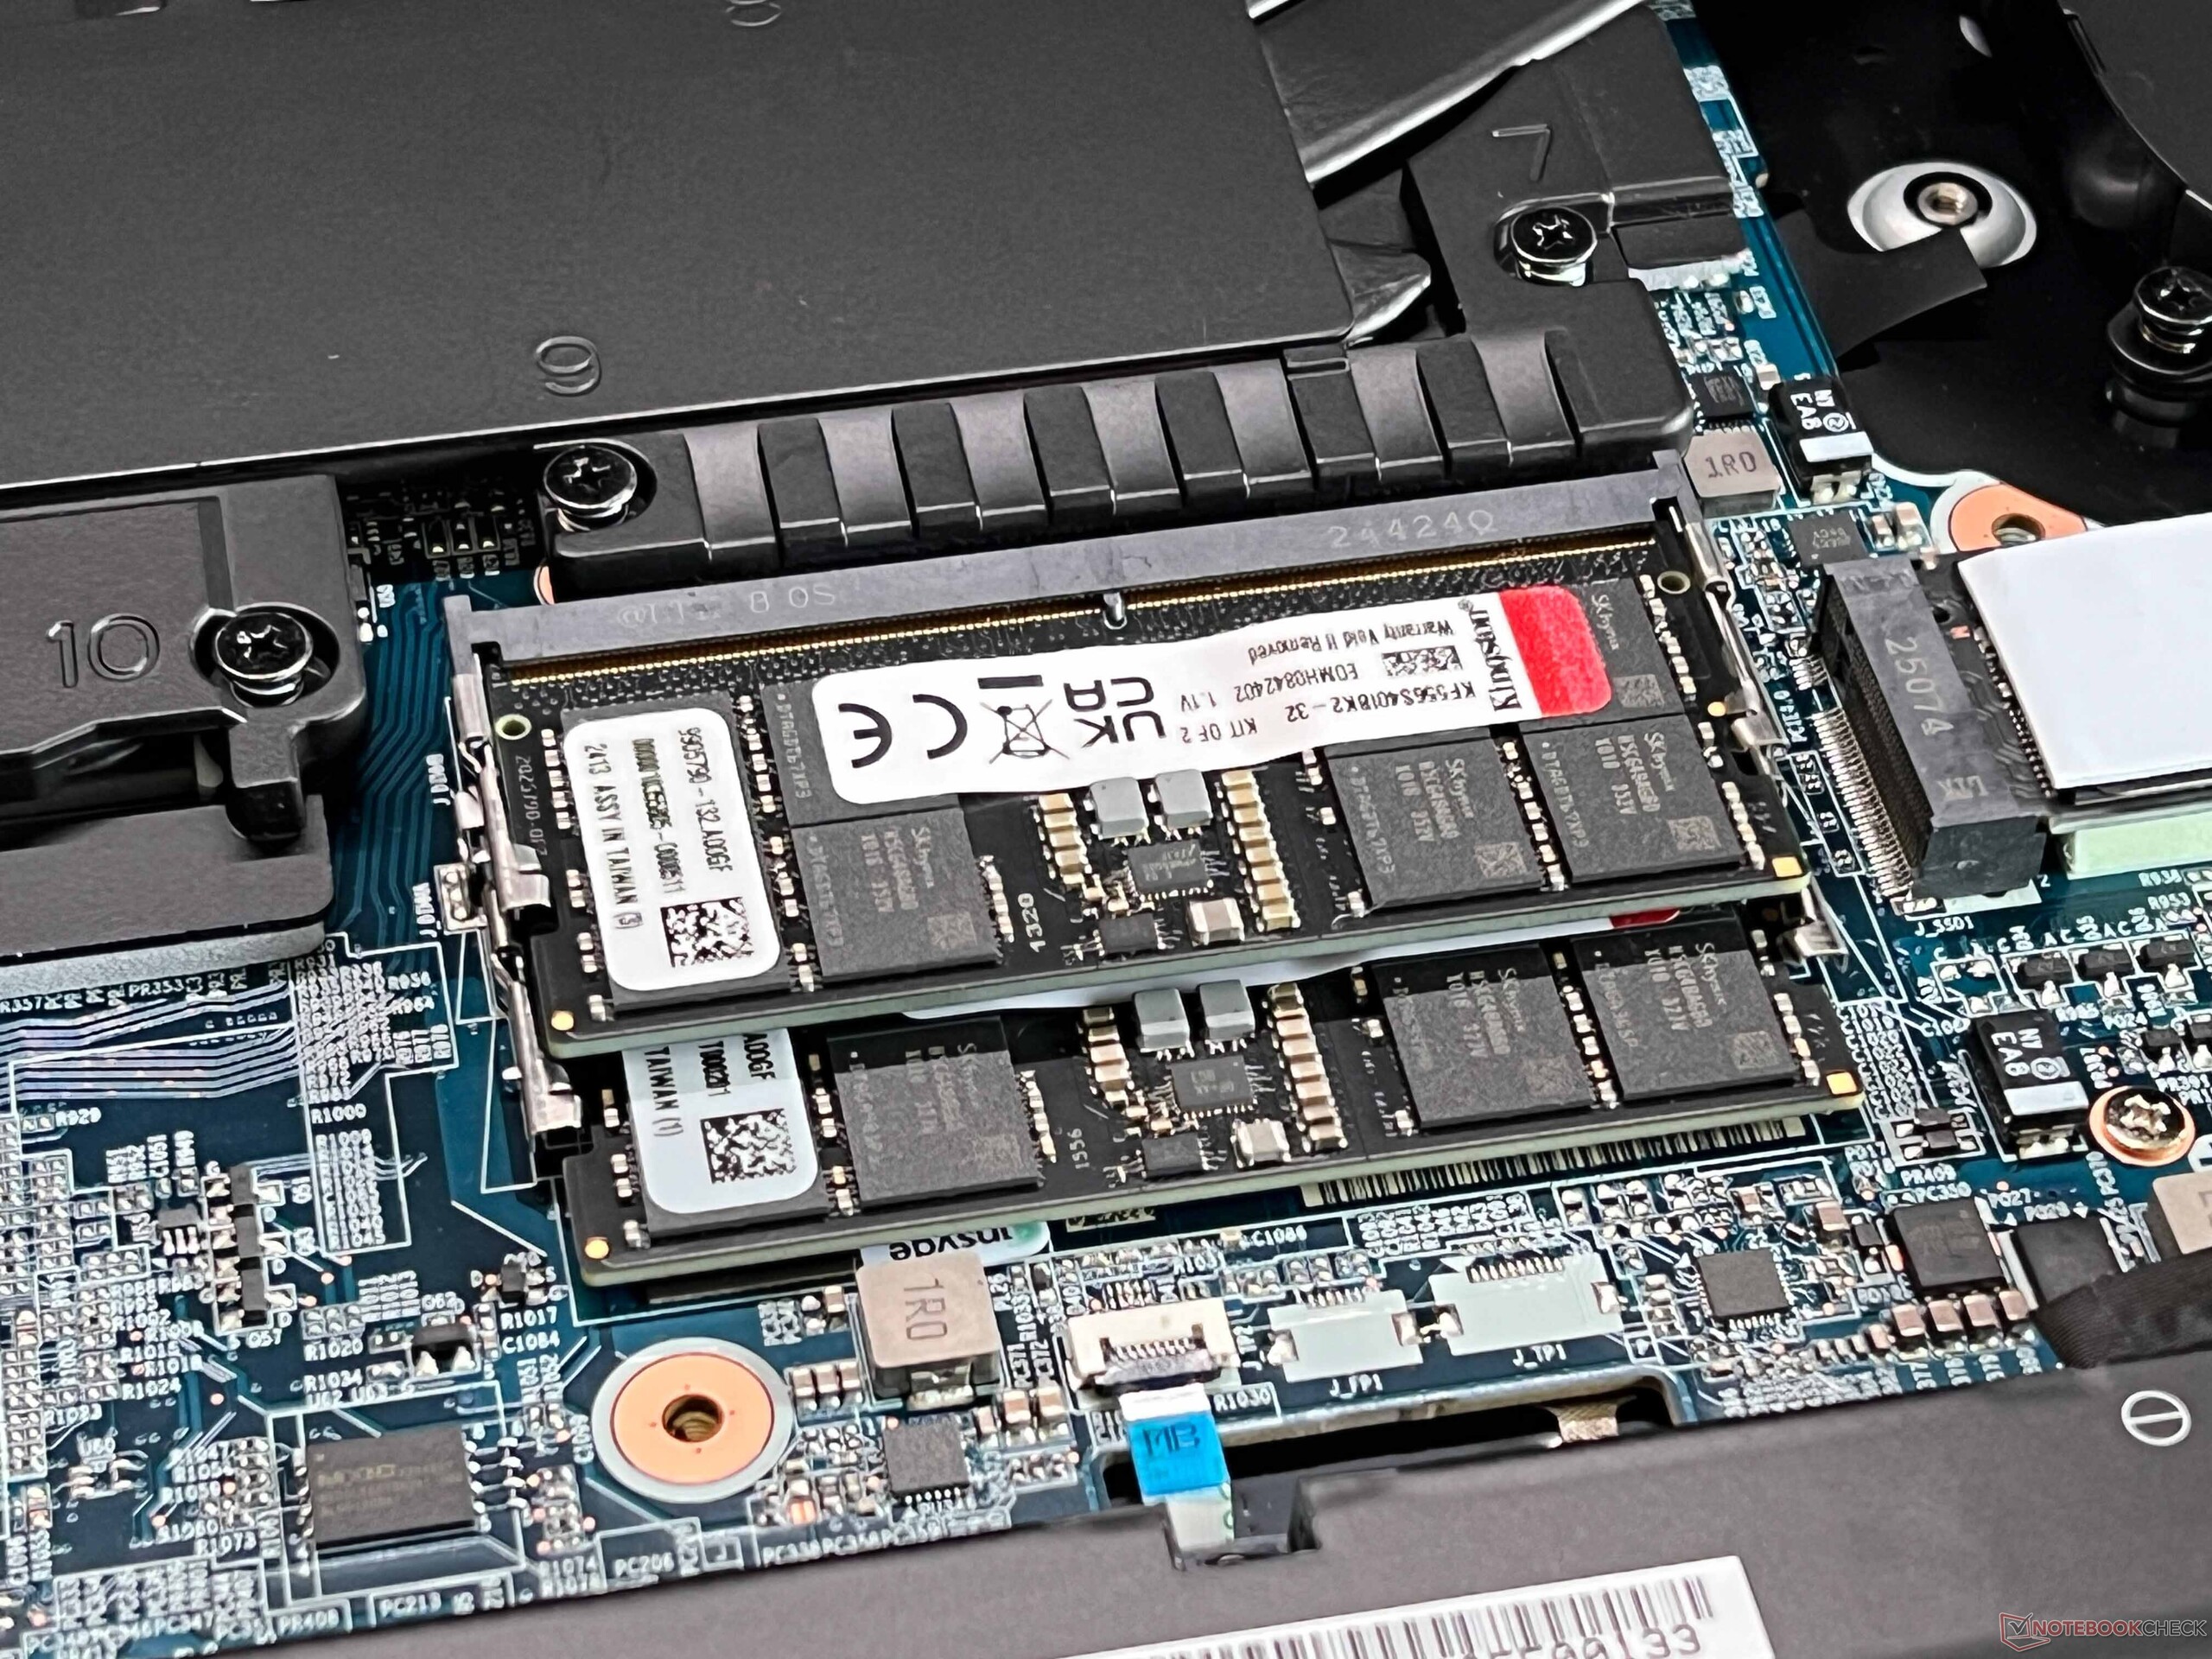
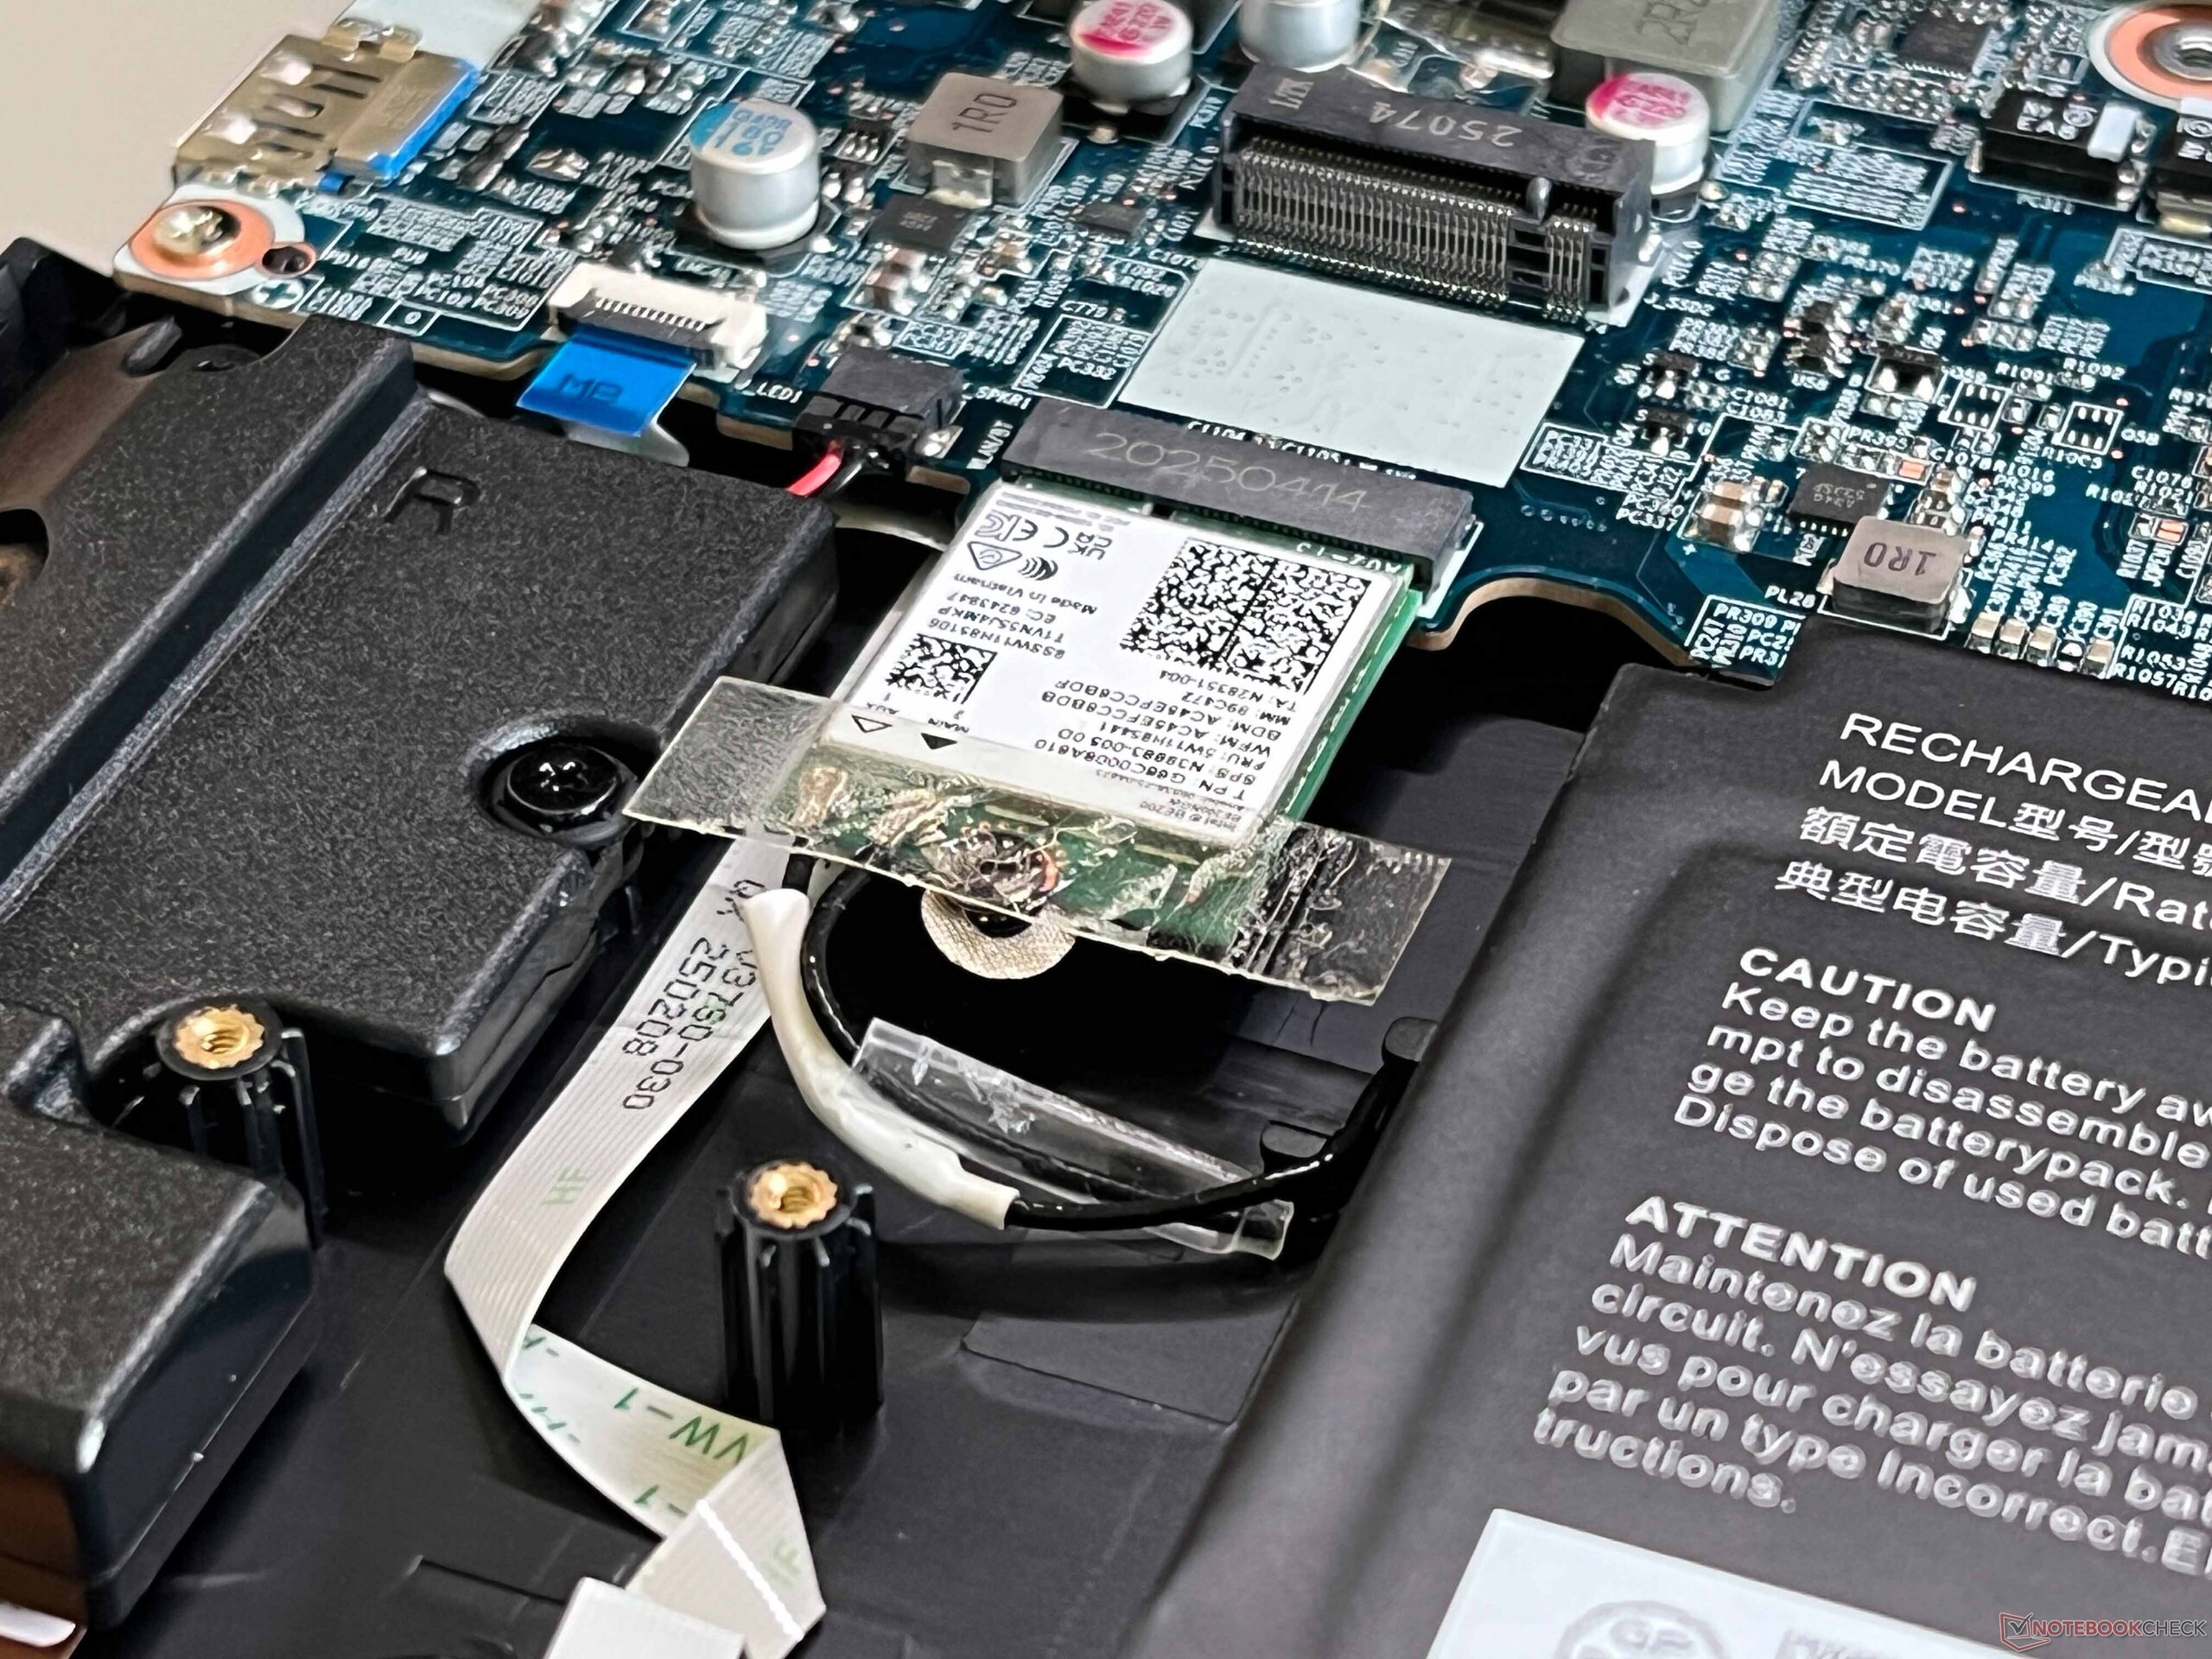
机箱采用黑色表面,设计非常简洁,除键盘外没有任何照明元素。盖子由铝合金制成,但机箱的其他部分则由塑料制成,表面一般很容易脏污。虽然底座在受压时会发出轻微的吱吱声,但无论是制造质量还是稳定性都没有大的问题。显示屏的最大开启角度为 130 度,但铰链会轻微晃动。由于内存和固态硬盘各有两个插槽,必要时可以更换 Wi-Fi 模块和电池,而且风扇也很容易清洁,因此维护选项总体上非常不错。
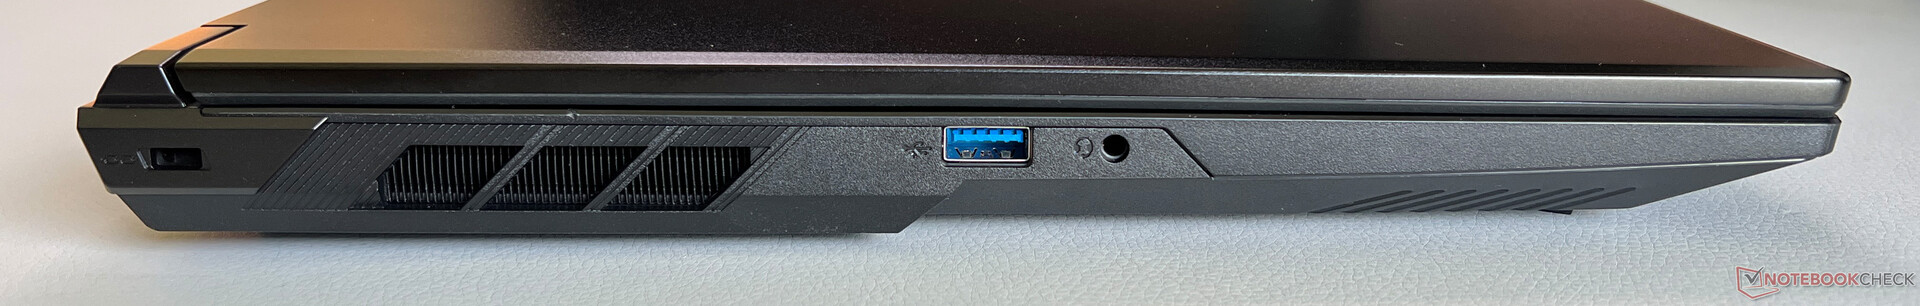
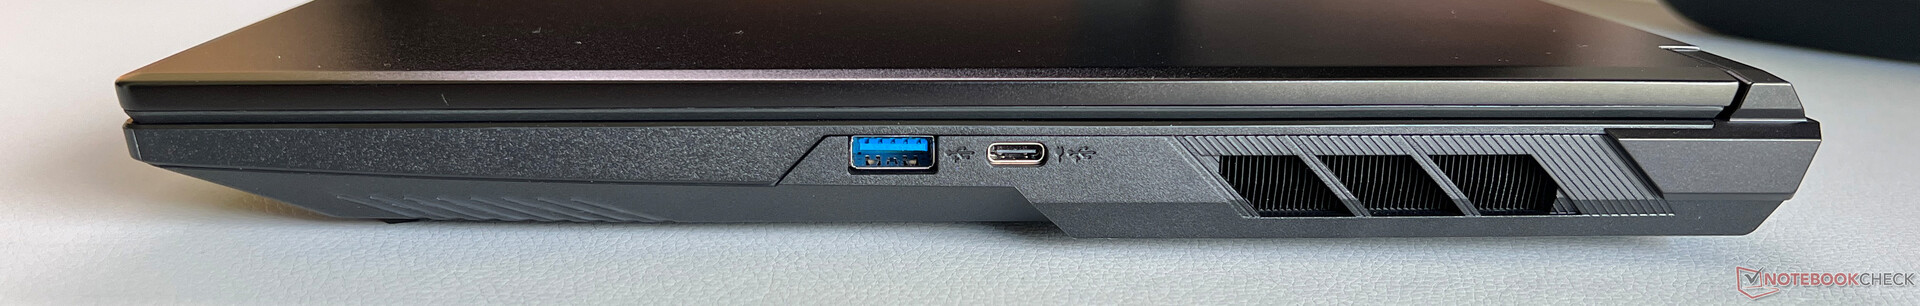
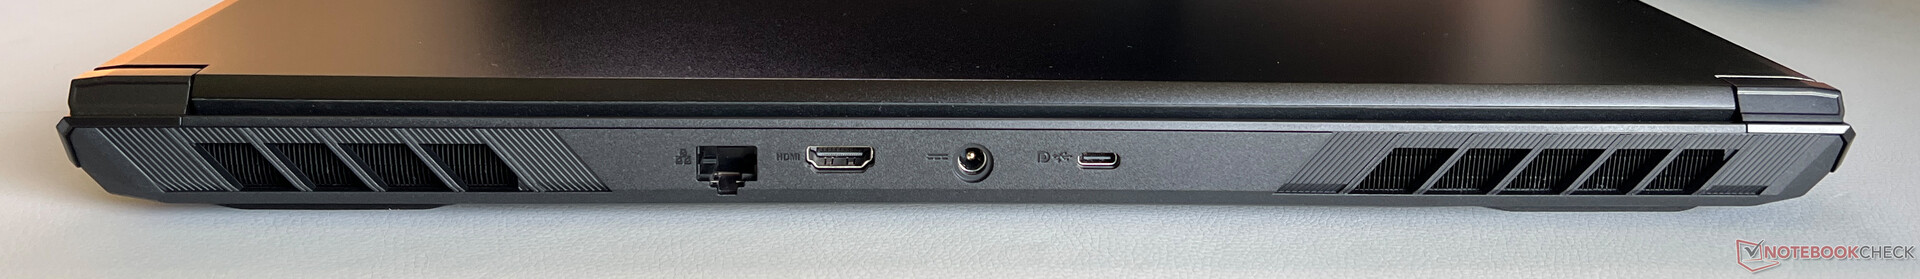
虽然没有 Thunderbolt 接口,但有足够的 USB 端口和英特尔 Wi-Fi 7 模块,其良好、稳定的传输速率令人印象深刻。1080p 网络摄像头(包括机械快门)只能拍摄一般的照片,而且没有红外模块。


| Networking | |
| Schenker XMG Focus 17 M25 | |
| iperf3 transmit AXE11000 | |
| iperf3 receive AXE11000 | |
| MSI Vector 17 HX AI A2XWIG | |
| iperf3 transmit AXE11000 | |
| iperf3 receive AXE11000 | |
| iperf3 transmit AXE11000 6GHz | |
| iperf3 receive AXE11000 6GHz | |
| Lenovo Legion 5 Pro 16IAX10H | |
| iperf3 transmit AXE11000 | |
| iperf3 receive AXE11000 | |
| MSI Vector 16 HX AI A2XWHG | |
| iperf3 transmit AXE11000 | |
| iperf3 receive AXE11000 | |
| Schenker XMG Pro 16 (E25) | |
| iperf3 transmit AXE11000 | |
| iperf3 receive AXE11000 | |


可持续性
制造商未就可持续发展发表声明。包装可完全回收。
输入设备
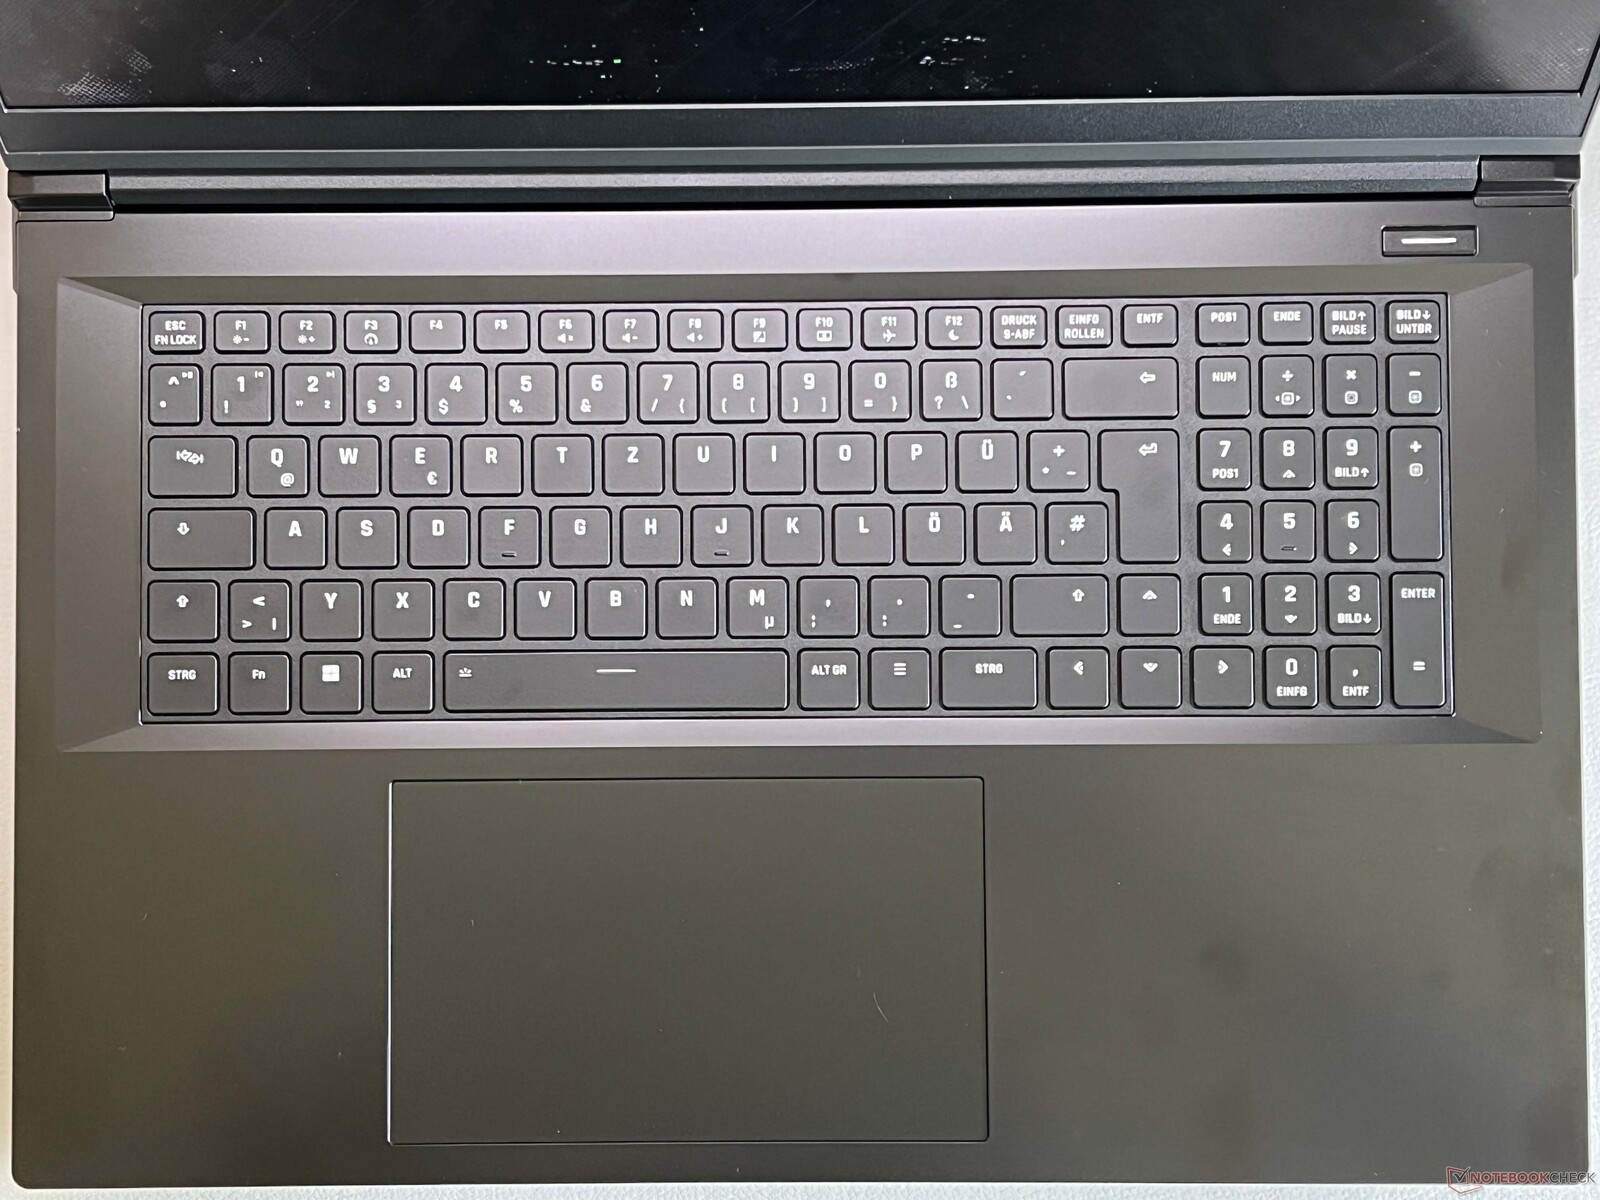
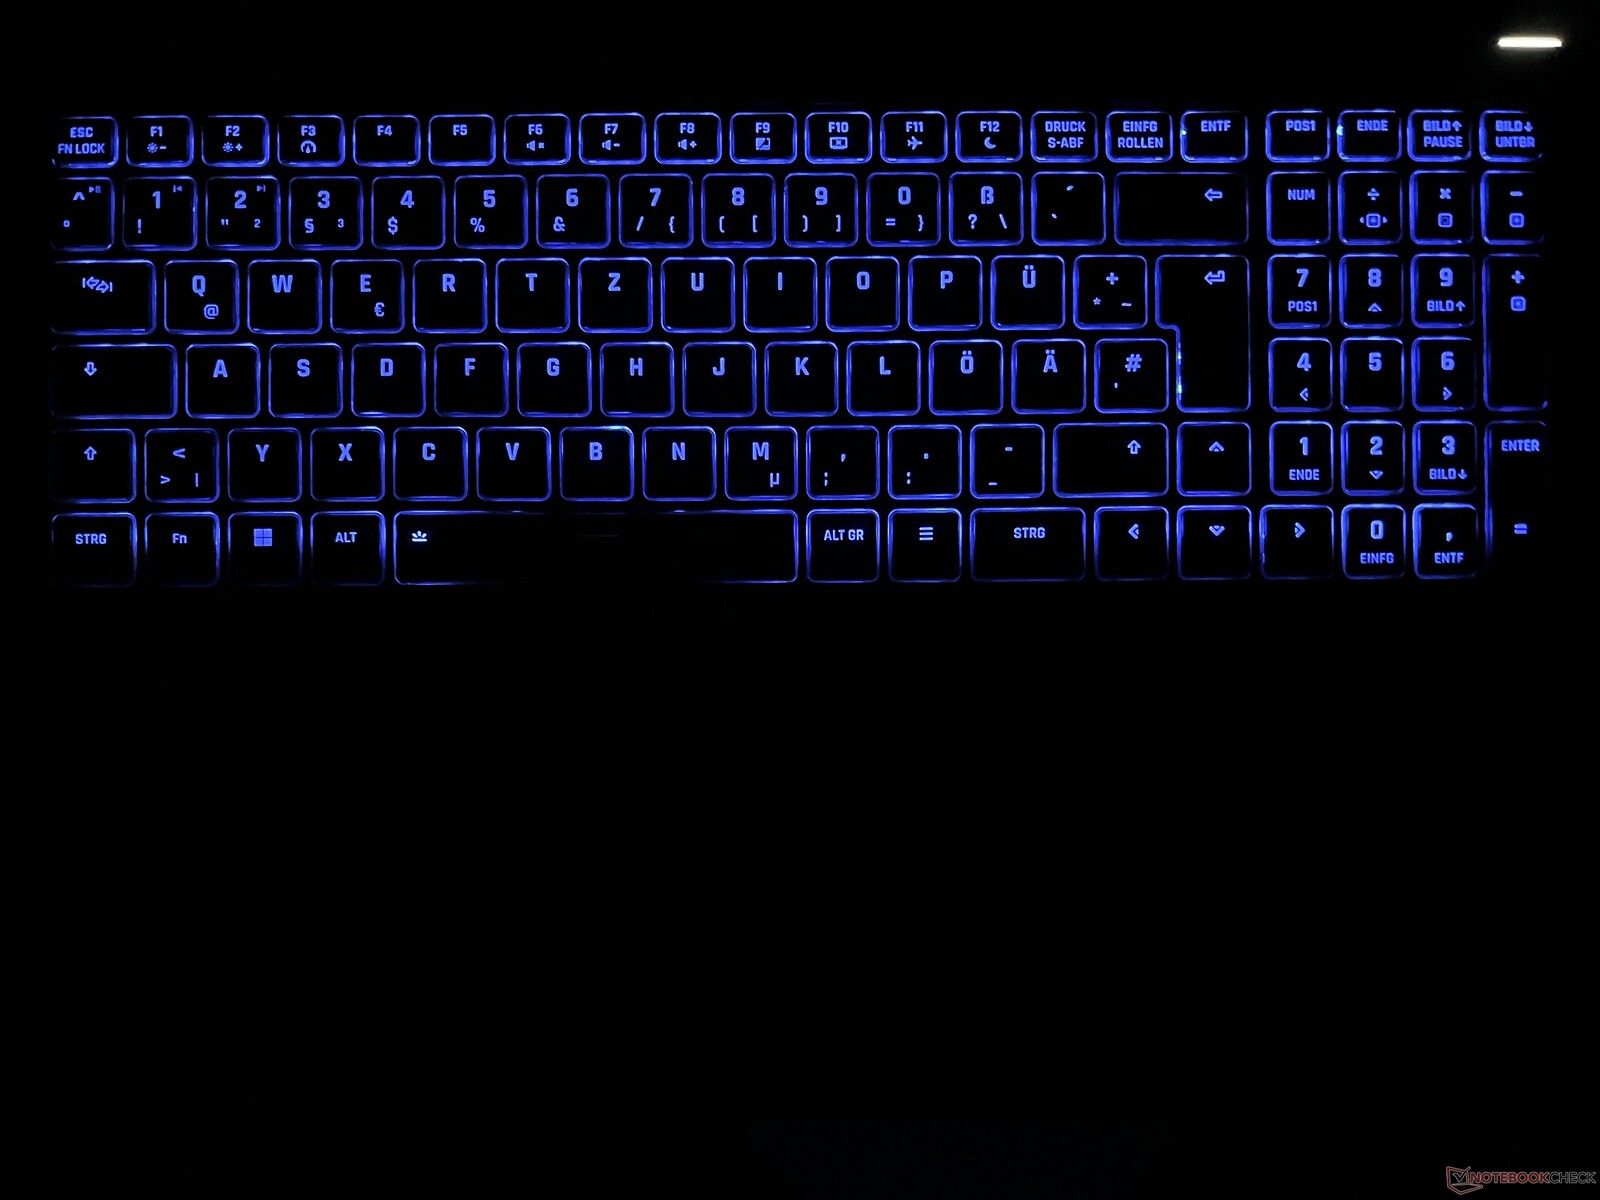
XMG 为键盘配备了专用数字键盘和单区 RGB 灯光。打字舒适,键程充足,反馈精确。此外,按键的声音也不大。宽大的点击板触感相对平滑。它足够大(15 x 9 厘米),而且衬垫非常好(不会发出嘎嘎声)。只有下方区域的机械点击声非常响亮。
显示屏 - 240 Hz IPS

Focus 采用 17.3 英寸 IPS 面板,宽高比为 16:9,QHD 分辨率为 2,560 x 1,440 像素。亚光面板的图像质量很好,明亮区域的颗粒感很小,但在日常使用中几乎看不出来。色彩鲜艳,由于采用了 240 Hz 刷新率,运动流畅。响应时间也很快,而且没有 PWM 闪烁。
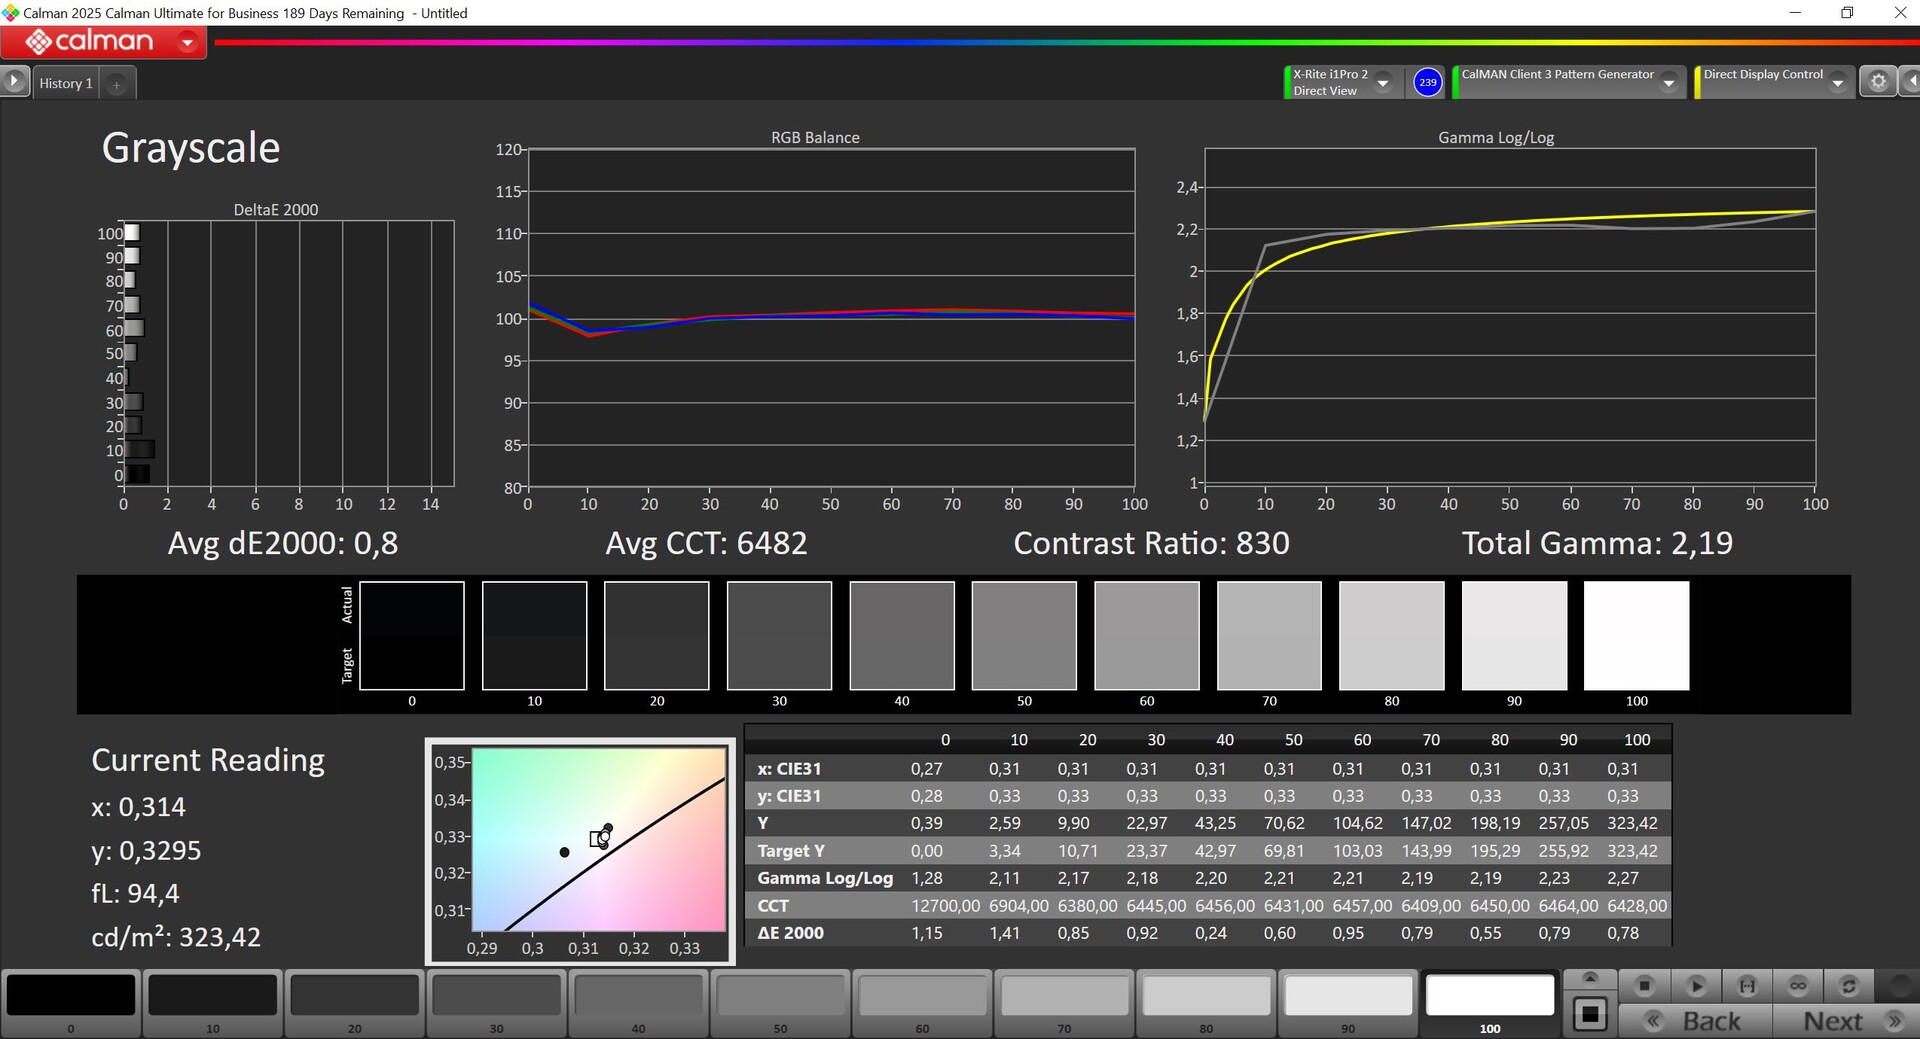
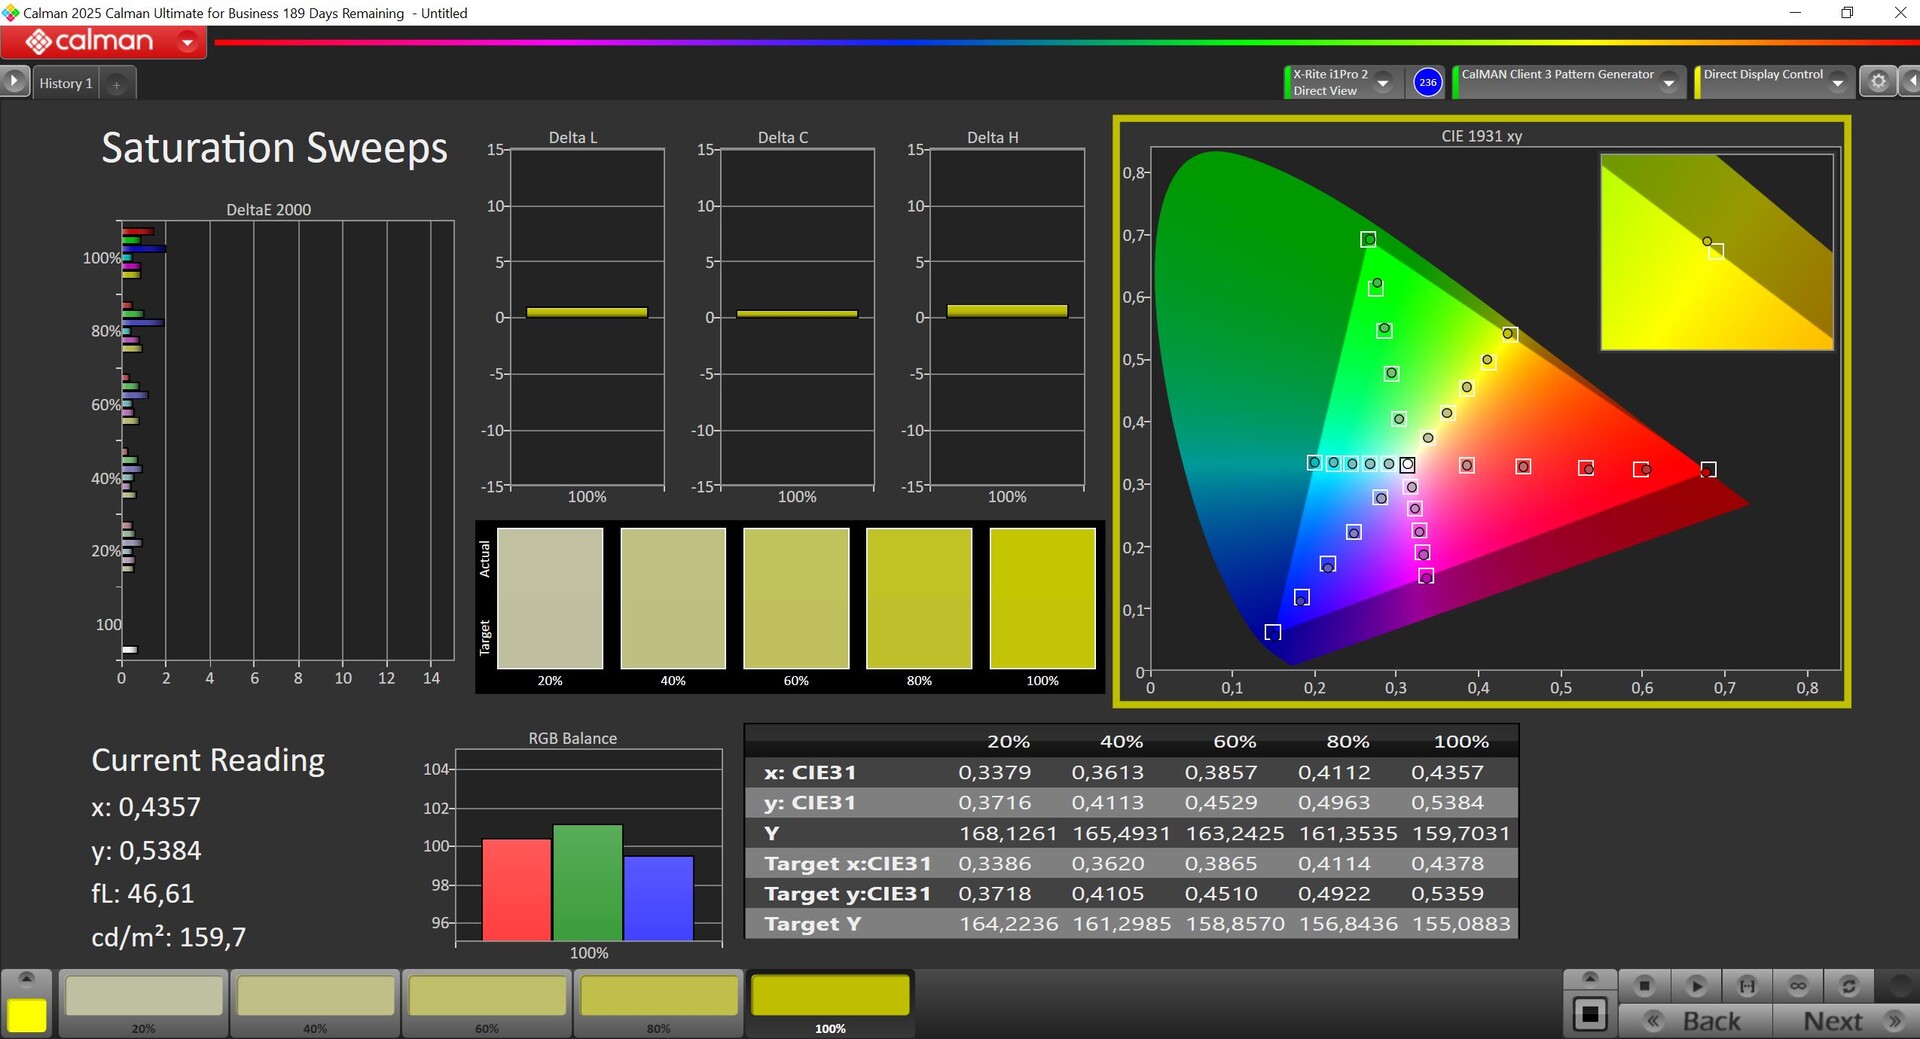
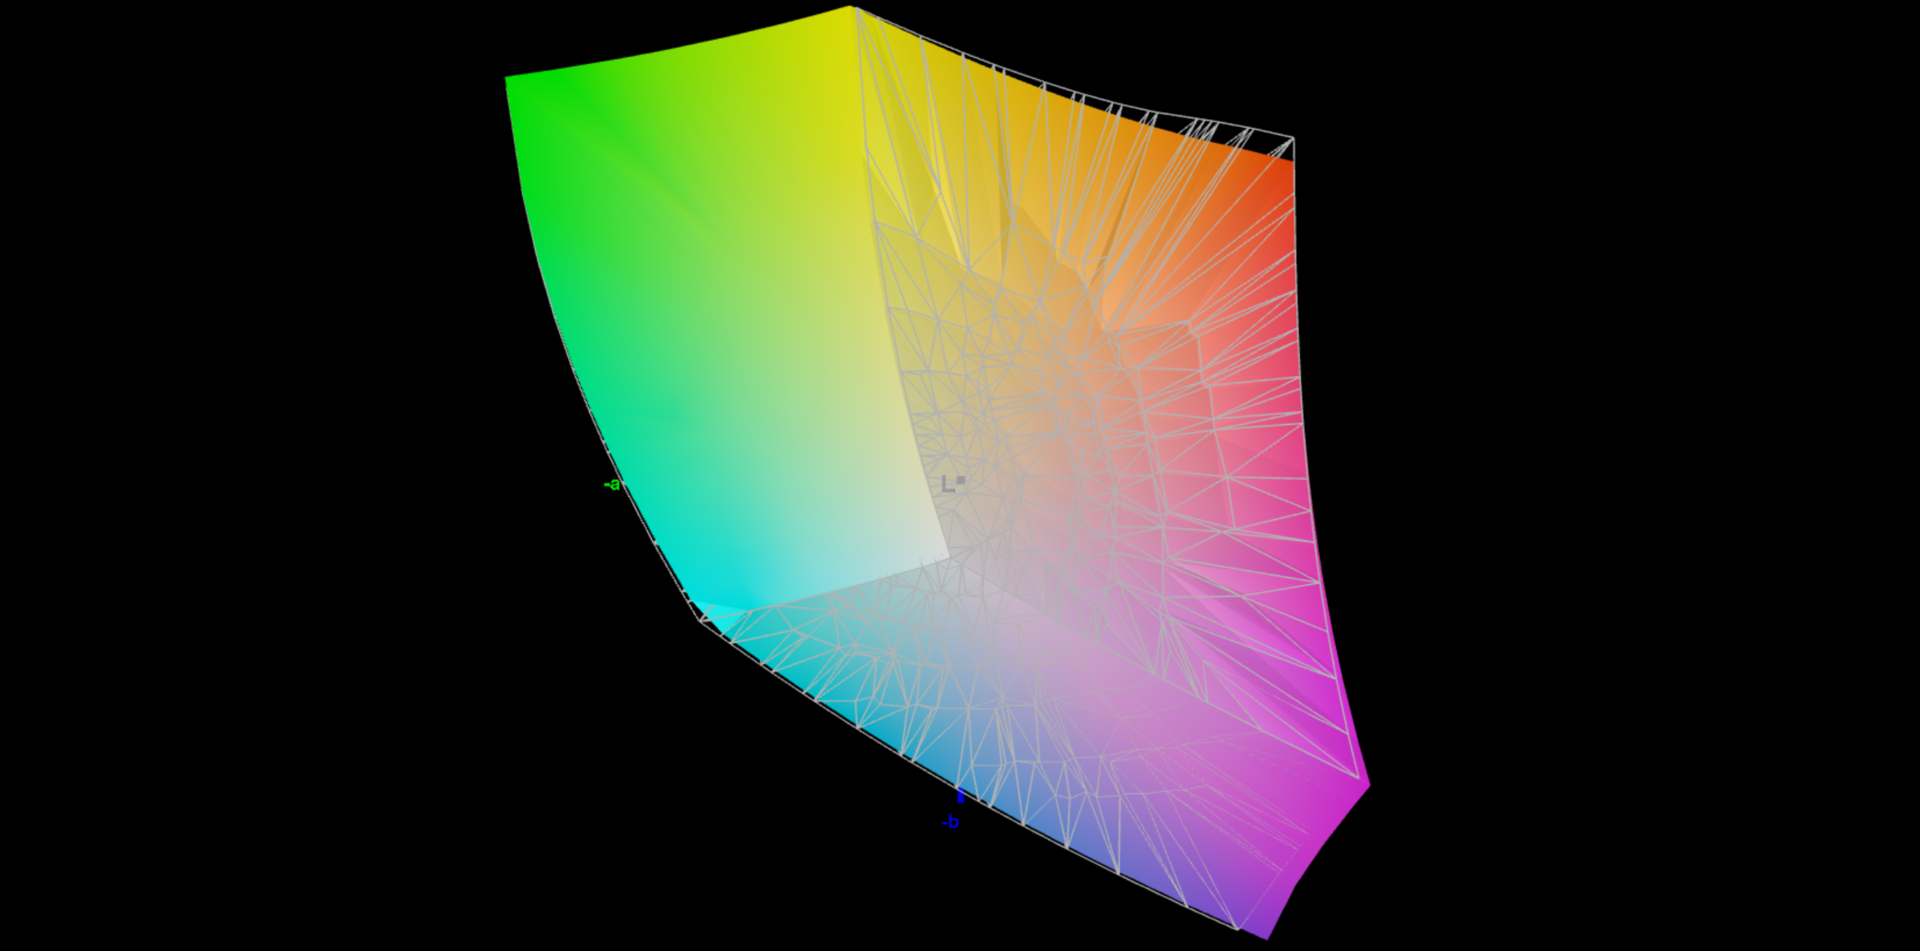
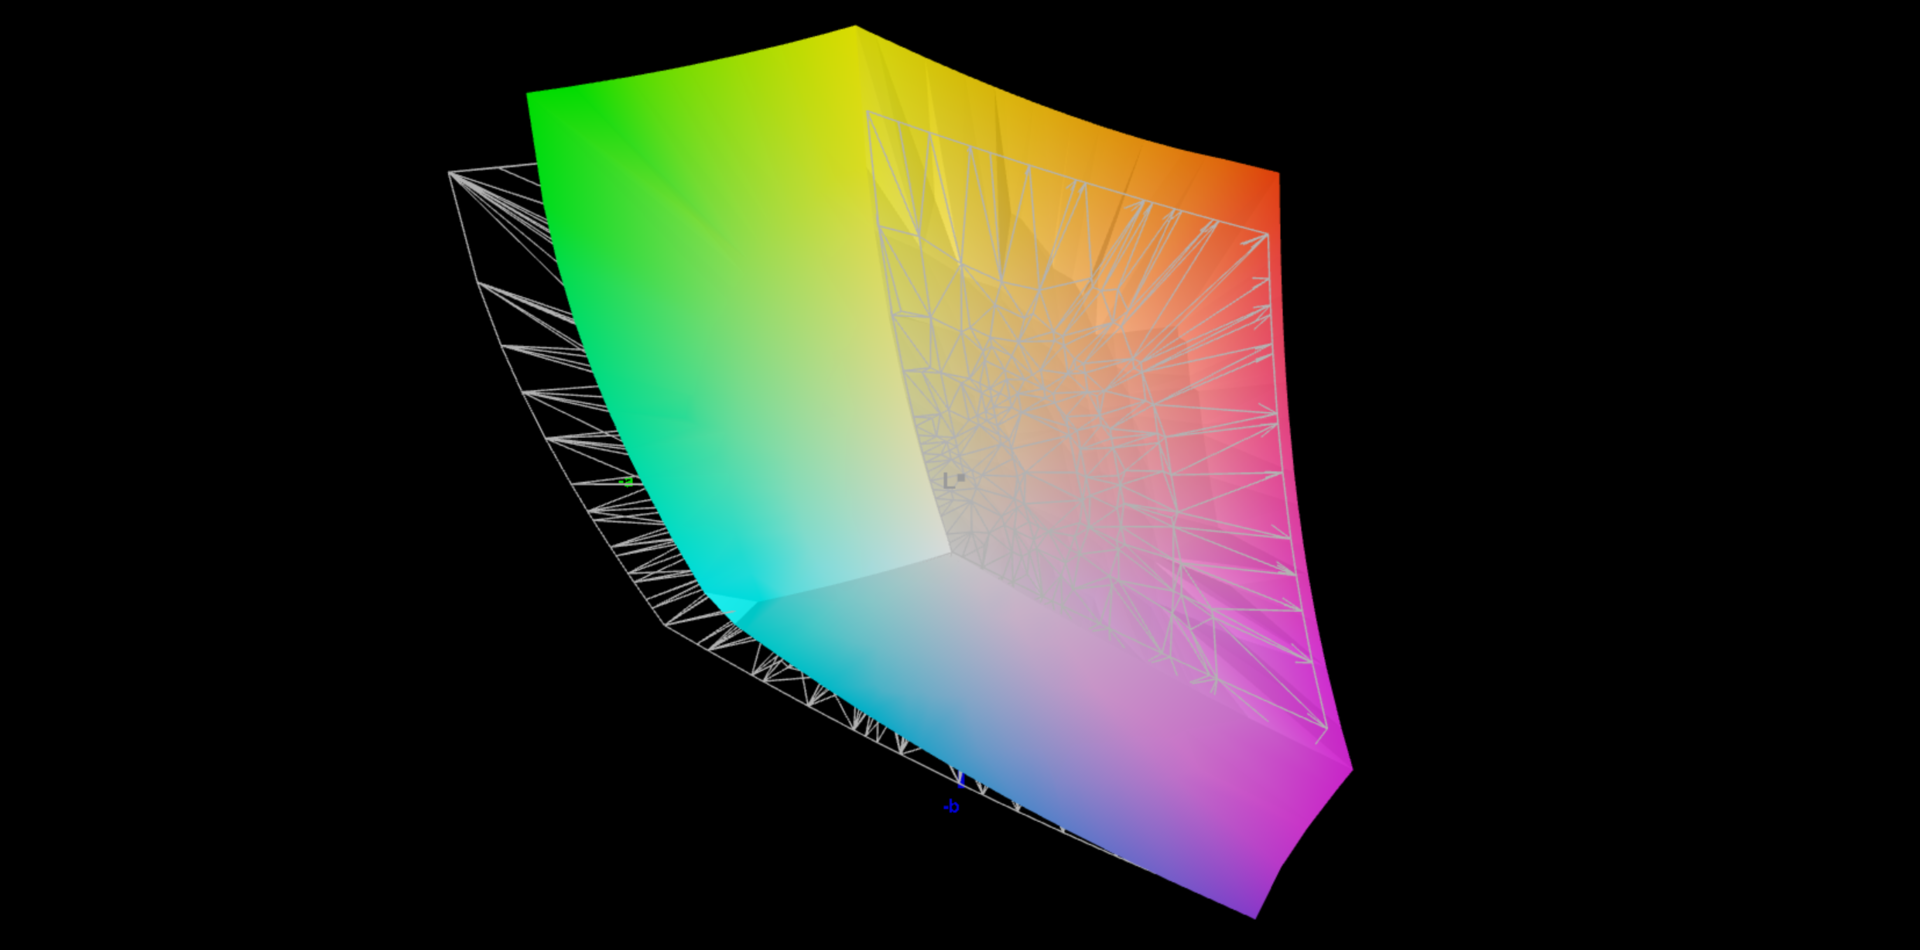
XMG 规定的亮度为 300 cd/m²,我们的测试机型最大亮度超过了 347 cd/m²(平均亮度为 325 cd/m²)。对比度最高可达 1,335:1,表现不错,但我们使用专业的 CalMAN 软件进行分析后发现,出厂设置中有明显的蓝色色调,而且色温过低。除此之外,色彩偏差也很大。通过校准(可在右侧框中免费下载配置文件),我们能够显著改善显示的图像。P3 和 sRGB 色彩空间均已完全覆盖,但没有 sRGB 配置文件。总的来说,这款面板非常适合游戏,但竞争对手更胜一筹,尤其是在亮度方面。
| |||||||||||||||||||||||||
Brightness Distribution: 84 %
Center on Battery: 347 cd/m²
Contrast: 1335:1 (Black: 0.26 cd/m²)
ΔE ColorChecker Calman: 3.3 | ∀{0.5-29.43 Ø4.73}
calibrated: 0.9
ΔE Greyscale Calman: 4.5 | ∀{0.09-98 Ø4.97}
86% AdobeRGB 1998 (Argyll 3D)
99.9% sRGB (Argyll 3D)
98.3% Display P3 (Argyll 3D)
Gamma: 2.05
CCT: 7365 K
| Schenker XMG Focus 17 M25 NE173QHM-NZ1, IPS, 2560x1440, 17.3", 240 Hz | MSI Vector 17 HX AI A2XWIG B170QAN01.2 (AUO84A6), IPS, 2560x1600, 17", 240 Hz | Lenovo Legion 5 Pro 16IAX10H ATNA60HS01-0 (Samsung SDC420A), OLED, 2560x1600, 16", 165 Hz | MSI Vector 16 HX AI A2XWHG B160QAN02.3 (AUO7DB2), IPS, 2560x1600, 16", 240 Hz | Schenker XMG Pro 16 (E25) NE160QDM-NZL, IPS, 2560x1600, 16", 300 Hz | |
|---|---|---|---|---|---|
| Display | 1% | 4% | -1% | -12% | |
| Display P3 Coverage (%) | 98.3 | 99.6 1% | 99.9 2% | 96.6 -2% | 74.7 -24% |
| sRGB Coverage (%) | 99.9 | 100 0% | 100 0% | 99.8 0% | 99.8 0% |
| AdobeRGB 1998 Coverage (%) | 86 | 87.4 2% | 94.1 9% | 84.4 -2% | 75.4 -12% |
| Response Times | 56% | 84% | 45% | 26% | |
| Response Time Grey 50% / Grey 80% * (ms) | 13.7 ? | 3.6 ? 74% | 2 ? 85% | 4.3 ? 69% | 10.5 ? 23% |
| Response Time Black / White * (ms) | 7.6 ? | 4.8 ? 37% | 1.4 ? 82% | 6 ? 21% | 5.4 ? 29% |
| PWM Frequency (Hz) | 1300 | ||||
| PWM Amplitude * (%) | 16.7 | ||||
| Screen | 4% | 12% | -2% | 19% | |
| Brightness middle (cd/m²) | 347 | 488 41% | 518 49% | 473 36% | 538 55% |
| Brightness (cd/m²) | 325 | 473 46% | 522 61% | 426 31% | 508 56% |
| Brightness Distribution (%) | 84 | 91 8% | 97 15% | 85 1% | 88 5% |
| Black Level * (cd/m²) | 0.26 | 0.74 -185% | 0.42 -62% | 0.47 -81% | |
| Contrast (:1) | 1335 | 659 -51% | 1126 -16% | 1145 -14% | |
| Colorchecker dE 2000 * | 3.3 | 1.67 49% | 2.49 25% | 3.47 -5% | 1.9 42% |
| Colorchecker dE 2000 max. * | 8.4 | 3.43 59% | 5.25 37% | 7.24 14% | 4 52% |
| Colorchecker dE 2000 calibrated * | 0.9 | 0.8 11% | 2.15 -139% | 1.36 -51% | |
| Greyscale dE 2000 * | 4.5 | 2.08 54% | 3.02 33% | 3.1 31% | 2.7 40% |
| Gamma | 2.05 107% | 2.55 86% | 2.37 93% | 2.486 88% | 2.24 98% |
| CCT | 7365 88% | 6240 104% | 6426 101% | 6832 95% | 7027 93% |
| Total Average (Program / Settings) | 20% /
10% | 33% /
22% | 14% /
5% | 11% /
13% |
* ... smaller is better


Display Response Times
| ↔ Response Time Black to White | ||
|---|---|---|
| 7.6 ms ... rise ↗ and fall ↘ combined | ↗ 3.1 ms rise | 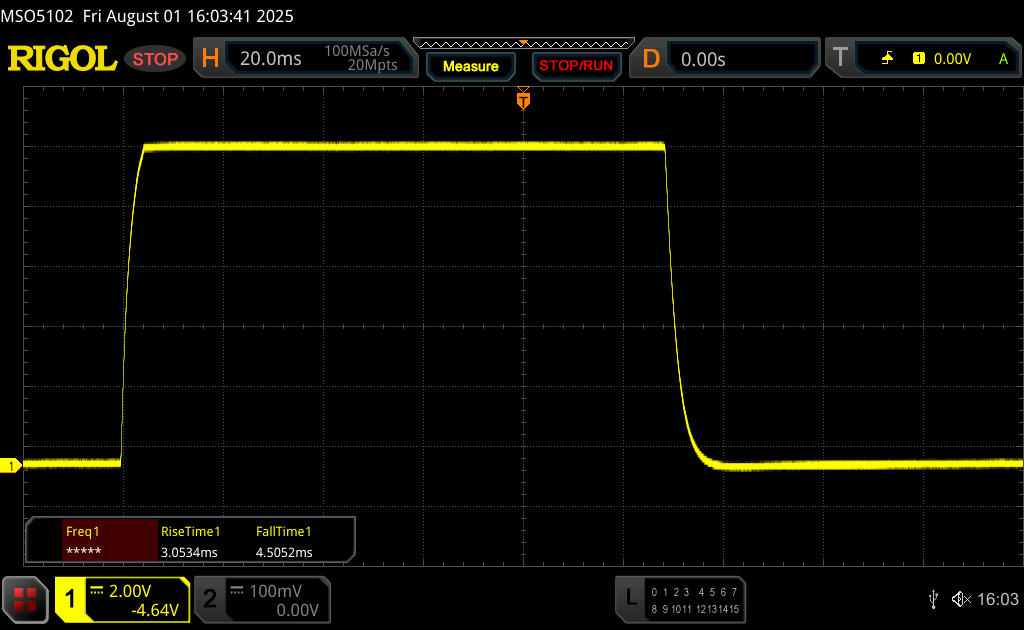 |
| ↘ 4.5 ms fall | ||
| The screen shows very fast response rates in our tests and should be very well suited for fast-paced gaming. In comparison, all tested devices range from 0.1 (minimum) to 240 (maximum) ms. » 22 % of all devices are better. This means that the measured response time is better than the average of all tested devices (19.9 ms). | ||
| ↔ Response Time 50% Grey to 80% Grey | ||
| 13.7 ms ... rise ↗ and fall ↘ combined | ↗ 6.5 ms rise | 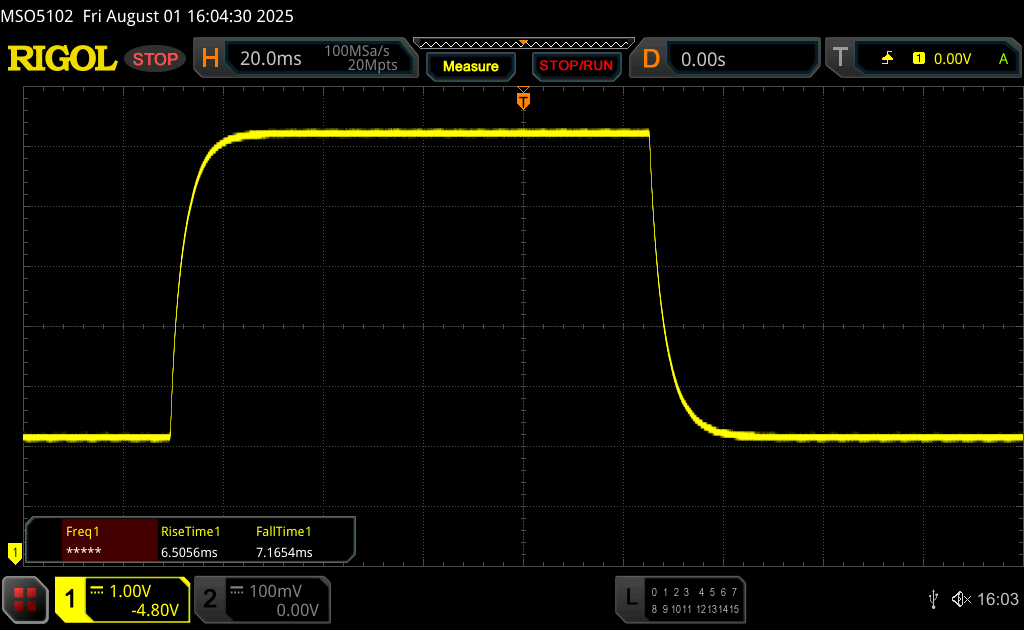 |
| ↘ 7.2 ms fall | ||
| The screen shows good response rates in our tests, but may be too slow for competitive gamers. In comparison, all tested devices range from 0.165 (minimum) to 636 (maximum) ms. » 27 % of all devices are better. This means that the measured response time is better than the average of all tested devices (31.1 ms). | ||
Screen Flickering / PWM (Pulse-Width Modulation)
| Screen flickering / PWM not detected | 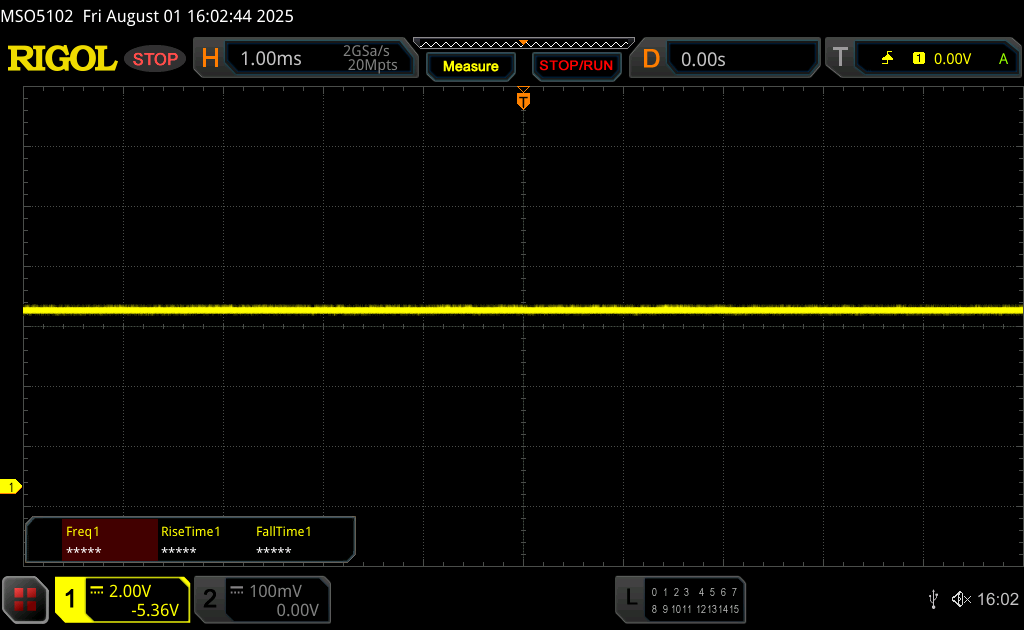 | ||
In comparison: 52 % of all tested devices do not use PWM to dim the display. If PWM was detected, an average of 7798 (minimum: 5 - maximum: 343500) Hz was measured. | |||


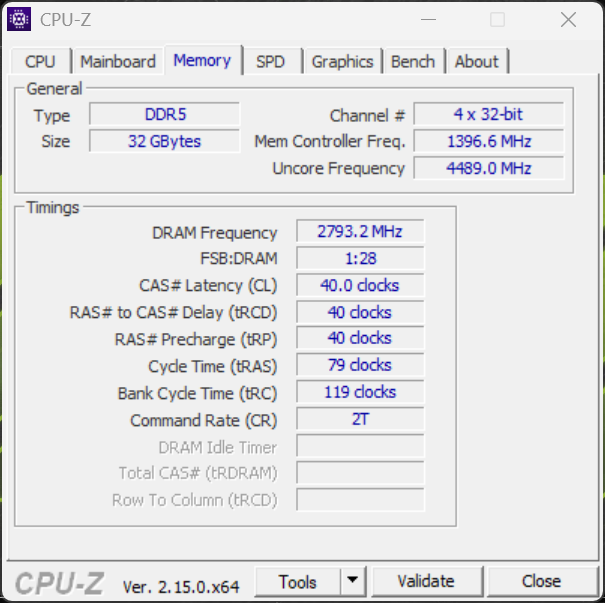
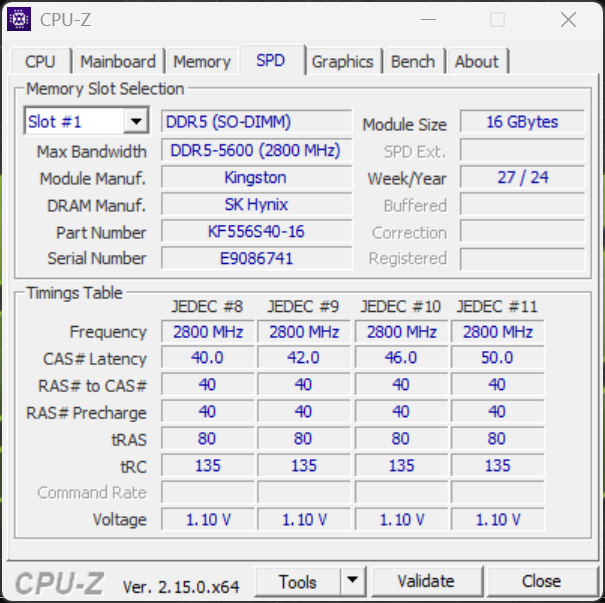
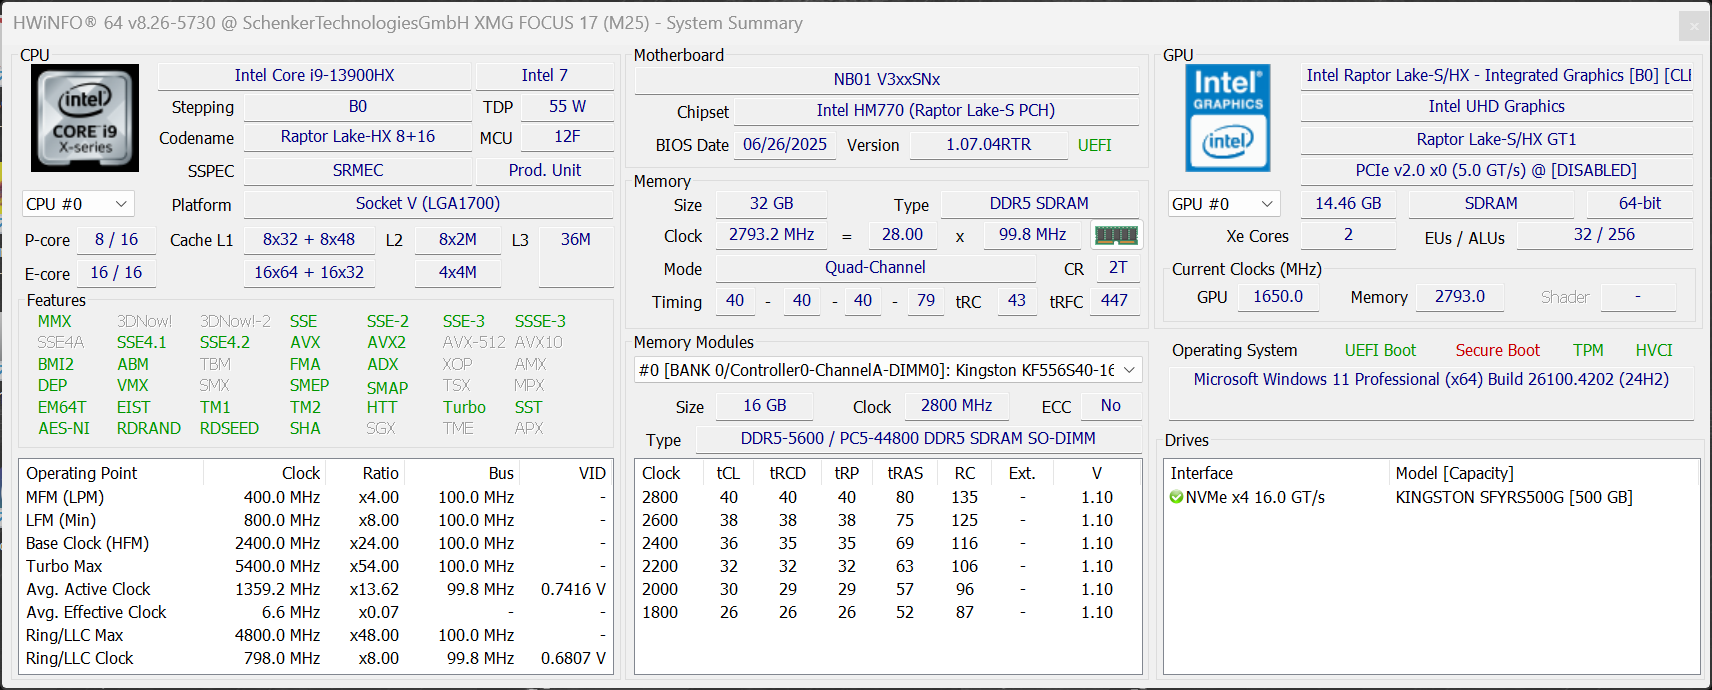
性能 - 5070 Ti 笔记本电脑图形处理器,最高 96 GB 内存
测试条件
控制中心提供各种电源配置文件,每种配置文件都有子文件。只有在 "性能/涡轮增压 "模式下才能获得最高游戏性能。虽然在 "性能/自动"模式下,GPU 通常可以达到最高性能,但在同时负载 CPU 的情况下,性能会有所不同(最大 TGP 为 100 瓦)。
| 能源概况 | CPU TDP | CB24 Multi | GPU TGP | Time Spy Graphics | CP2077 QHD Ultra | 最大风扇体积 |
|---|---|---|---|---|---|---|
| 静音 | 30/28 瓦 | 591 分 | 100 瓦 | 14,202 分 | 61.2fps | 37 dB(A) |
| 娱乐 | 115/45 瓦 | 1,013 分 | 100 瓦 | 14,463 分 | 68.1fps | 46.6 dB(A) |
| 性能(自动) | 150/120 瓦 | 1,624 分 | 140/100 瓦 | 14,833 分 | 69.8fps | 51.9 dB(A) |
| 性能(涡轮增压) | 150/135 瓦 | 1,675 分 | 140 瓦 | 17,211 分 | 81fps | 56.2 dB(A) |
| 电池 | 30 瓦 | 619 分 | 35 瓦 | 3,423 分 | 17.9fps | 33.6 dB(A) |
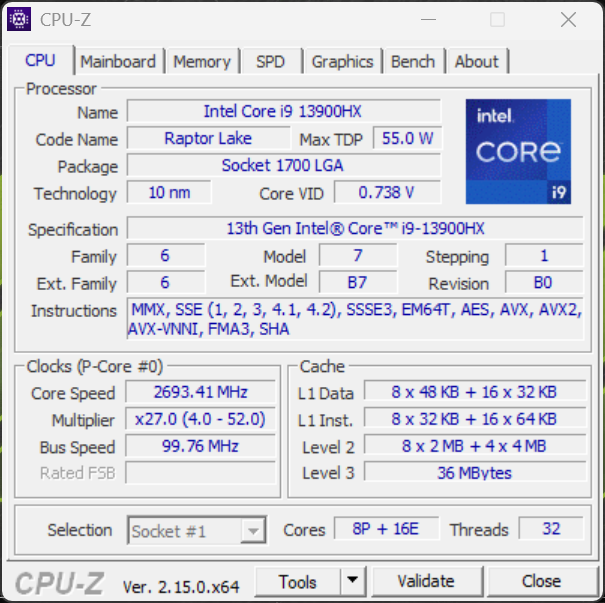
处理器 - 酷睿 i9-13900HX
Focus 17 M25 标配老式 酷睿 i9-13900HX.不过,也可选配酷睿 i9-14900HX。CPU 性能依然不错,但正如预期的那样,Raptor Lake 与 Core Ultra 9 275HX 相比仍有差距。 酷睿至尊 9 275HX.不过,更昂贵的 Vector 17由于功耗限制较低,配备 275HX 的更昂贵的 Vector 17 只比它快一点点。
Cinebench R15 Multi Sustained Test
Cinebench 2024: CPU Multi Core | CPU Single Core
Cinebench R23: Multi Core | Single Core
Cinebench R20: CPU (Multi Core) | CPU (Single Core)
Cinebench R15: CPU Multi 64Bit | CPU Single 64Bit
Blender: v2.79 BMW27 CPU
7-Zip 18.03: 7z b 4 | 7z b 4 -mmt1
Geekbench 6.7: Multi-Core | Single-Core
Geekbench 5.5: Multi-Core | Single-Core
HWBOT x265 Benchmark v2.2: 4k Preset
LibreOffice : 20 Documents To PDF
R Benchmark 2.5: Overall mean
| CPU Performance rating | |
| Schenker XMG Pro 16 (E25) | |
| Lenovo Legion 5 Pro 16IAX10H -2! | |
| MSI Vector 17 HX AI A2XWIG -2! | |
| Schenker XMG Focus 17 M25 | |
| Average Intel Core i9-13900HX | |
| MSI Vector 16 HX AI A2XWHG | |
| Average of class Gaming | |
| Cinebench 2024 / CPU Multi Core | |
| Schenker XMG Pro 16 (E25) | |
| Schenker XMG Focus 17 M25 | |
| Average Intel Core i9-13900HX (n=1) | |
| MSI Vector 16 HX AI A2XWHG | |
| Average of class Gaming (486 - 2298, n=92, last 2 years) | |
| Cinebench 2024 / CPU Single Core | |
| Schenker XMG Pro 16 (E25) | |
| MSI Vector 16 HX AI A2XWHG | |
| Schenker XMG Focus 17 M25 | |
| Average Intel Core i9-13900HX (n=1) | |
| Average of class Gaming (95 - 138.2, n=92, last 2 years) | |
| Cinebench R23 / Multi Core | |
| Lenovo Legion 5 Pro 16IAX10H | |
| Schenker XMG Pro 16 (E25) | |
| MSI Vector 17 HX AI A2XWIG | |
| Schenker XMG Focus 17 M25 | |
| Average Intel Core i9-13900HX (24270 - 32623, n=23) | |
| MSI Vector 16 HX AI A2XWHG | |
| Average of class Gaming (10488 - 40970, n=113, last 2 years) | |
| Cinebench R23 / Single Core | |
| Lenovo Legion 5 Pro 16IAX10H | |
| Schenker XMG Pro 16 (E25) | |
| MSI Vector 17 HX AI A2XWIG | |
| MSI Vector 16 HX AI A2XWHG | |
| Schenker XMG Focus 17 M25 | |
| Average Intel Core i9-13900HX (1867 - 2105, n=20) | |
| Average of class Gaming (1166 - 2356, n=113, last 2 years) | |
| Cinebench R20 / CPU (Multi Core) | |
| Lenovo Legion 5 Pro 16IAX10H | |
| Schenker XMG Pro 16 (E25) | |
| MSI Vector 17 HX AI A2XWIG | |
| Schenker XMG Focus 17 M25 | |
| Average Intel Core i9-13900HX (9152 - 12541, n=21) | |
| MSI Vector 16 HX AI A2XWHG | |
| Average of class Gaming (4029 - 16108, n=112, last 2 years) | |
| Cinebench R20 / CPU (Single Core) | |
| Lenovo Legion 5 Pro 16IAX10H | |
| Schenker XMG Pro 16 (E25) | |
| MSI Vector 17 HX AI A2XWIG | |
| MSI Vector 16 HX AI A2XWHG | |
| Schenker XMG Focus 17 M25 | |
| Average Intel Core i9-13900HX (722 - 810, n=21) | |
| Average of class Gaming (442 - 895, n=112, last 2 years) | |
| Cinebench R15 / CPU Multi 64Bit | |
| Lenovo Legion 5 Pro 16IAX10H | |
| Schenker XMG Pro 16 (E25) | |
| MSI Vector 17 HX AI A2XWIG | |
| Average Intel Core i9-13900HX (3913 - 4970, n=22) | |
| Schenker XMG Focus 17 M25 | |
| MSI Vector 16 HX AI A2XWHG | |
| Average of class Gaming (1578 - 6271, n=113, last 2 years) | |
| Cinebench R15 / CPU Single 64Bit | |
| MSI Vector 17 HX AI A2XWIG | |
| MSI Vector 17 HX AI A2XWIG | |
| Schenker XMG Pro 16 (E25) | |
| Lenovo Legion 5 Pro 16IAX10H | |
| MSI Vector 16 HX AI A2XWHG | |
| Schenker XMG Focus 17 M25 | |
| Average of class Gaming (188.8 - 343, n=112, last 2 years) | |
| Average Intel Core i9-13900HX (247 - 304, n=22) | |
| Blender / v2.79 BMW27 CPU | |
| Average of class Gaming (80 - 330, n=110, last 2 years) | |
| MSI Vector 16 HX AI A2XWHG | |
| Average Intel Core i9-13900HX (101 - 153, n=22) | |
| MSI Vector 17 HX AI A2XWIG | |
| Schenker XMG Focus 17 M25 | |
| Lenovo Legion 5 Pro 16IAX10H | |
| Schenker XMG Pro 16 (E25) | |
| 7-Zip 18.03 / 7z b 4 | |
| Schenker XMG Focus 17 M25 | |
| Schenker XMG Pro 16 (E25) | |
| Lenovo Legion 5 Pro 16IAX10H | |
| Average Intel Core i9-13900HX (90675 - 127283, n=21) | |
| MSI Vector 17 HX AI A2XWIG | |
| Average of class Gaming (33491 - 148086, n=111, last 2 years) | |
| MSI Vector 16 HX AI A2XWHG | |
| 7-Zip 18.03 / 7z b 4 -mmt1 | |
| Schenker XMG Focus 17 M25 | |
| Schenker XMG Pro 16 (E25) | |
| Average Intel Core i9-13900HX (6340 - 7177, n=21) | |
| Lenovo Legion 5 Pro 16IAX10H | |
| MSI Vector 17 HX AI A2XWIG | |
| MSI Vector 16 HX AI A2XWHG | |
| Average of class Gaming (4199 - 7436, n=111, last 2 years) | |
| Geekbench 6.7 / Multi-Core | |
| Schenker XMG Pro 16 (E25) | |
| Lenovo Legion 5 Pro 16IAX10H | |
| MSI Vector 17 HX AI A2XWIG | |
| MSI Vector 16 HX AI A2XWHG | |
| Schenker XMG Focus 17 M25 | |
| Average Intel Core i9-13900HX (15031 - 18014, n=3) | |
| Average of class Gaming (6625 - 22104, n=112, last 2 years) | |
| Geekbench 6.7 / Single-Core | |
| Schenker XMG Pro 16 (E25) | |
| MSI Vector 17 HX AI A2XWIG | |
| Lenovo Legion 5 Pro 16IAX10H | |
| MSI Vector 16 HX AI A2XWHG | |
| Schenker XMG Focus 17 M25 | |
| Average of class Gaming (1490 - 3259, n=112, last 2 years) | |
| Average Intel Core i9-13900HX (2548 - 2892, n=3) | |
| Geekbench 5.5 / Multi-Core | |
| Schenker XMG Pro 16 (E25) | |
| Lenovo Legion 5 Pro 16IAX10H | |
| MSI Vector 17 HX AI A2XWIG | |
| Schenker XMG Focus 17 M25 | |
| Average Intel Core i9-13900HX (17614 - 21075, n=22) | |
| MSI Vector 16 HX AI A2XWHG | |
| Average of class Gaming (6460 - 27010, n=111, last 2 years) | |
| Geekbench 5.5 / Single-Core | |
| Schenker XMG Pro 16 (E25) | |
| Lenovo Legion 5 Pro 16IAX10H | |
| MSI Vector 17 HX AI A2XWIG | |
| MSI Vector 16 HX AI A2XWHG | |
| Schenker XMG Focus 17 M25 | |
| Average of class Gaming (986 - 2474, n=111, last 2 years) | |
| Average Intel Core i9-13900HX (1345 - 2093, n=22) | |
| HWBOT x265 Benchmark v2.2 / 4k Preset | |
| Schenker XMG Pro 16 (E25) | |
| Lenovo Legion 5 Pro 16IAX10H | |
| MSI Vector 17 HX AI A2XWIG | |
| MSI Vector 16 HX AI A2XWHG | |
| Schenker XMG Focus 17 M25 | |
| Average Intel Core i9-13900HX (23.5 - 34.4, n=22) | |
| Average of class Gaming (11.5 - 44.3, n=111, last 2 years) | |
| LibreOffice / 20 Documents To PDF | |
| Average of class Gaming (19 - 88.8, n=111, last 2 years) | |
| Schenker XMG Pro 16 (E25) | |
| Schenker XMG Focus 17 M25 | |
| Average Intel Core i9-13900HX (32.8 - 51.1, n=21) | |
| MSI Vector 16 HX AI A2XWHG | |
| MSI Vector 17 HX AI A2XWIG | |
| Lenovo Legion 5 Pro 16IAX10H | |
| R Benchmark 2.5 / Overall mean | |
| Average of class Gaming (0.3439 - 0.759, n=112, last 2 years) | |
| MSI Vector 16 HX AI A2XWHG | |
| MSI Vector 17 HX AI A2XWIG | |
| Lenovo Legion 5 Pro 16IAX10H | |
| Schenker XMG Pro 16 (E25) | |
| Schenker XMG Focus 17 M25 | |
| Average Intel Core i9-13900HX (0.375 - 0.4564, n=22) | |
* ... smaller is better
AIDA64: FP32 Ray-Trace | FPU Julia | CPU SHA3 | CPU Queen | FPU SinJulia | FPU Mandel | CPU AES | CPU ZLib | FP64 Ray-Trace | CPU PhotoWorxx
| Performance rating | |
| Lenovo Legion 5 Pro 16IAX10H | |
| Schenker XMG Pro 16 (E25) | |
| Schenker XMG Focus 17 M25 | |
| MSI Vector 17 HX AI A2XWIG | |
| Average Intel Core i9-13900HX | |
| Average of class Gaming | |
| MSI Vector 16 HX AI A2XWHG | |
| AIDA64 / FP32 Ray-Trace | |
| Lenovo Legion 5 Pro 16IAX10H | |
| Schenker XMG Pro 16 (E25) | |
| Average of class Gaming (10227 - 85542, n=110, last 2 years) | |
| MSI Vector 17 HX AI A2XWIG | |
| MSI Vector 16 HX AI A2XWHG | |
| Schenker XMG Focus 17 M25 | |
| Average Intel Core i9-13900HX (17589 - 27615, n=22) | |
| AIDA64 / FPU Julia | |
| Lenovo Legion 5 Pro 16IAX10H | |
| Schenker XMG Pro 16 (E25) | |
| MSI Vector 17 HX AI A2XWIG | |
| MSI Vector 16 HX AI A2XWHG | |
| Average of class Gaming (51376 - 238426, n=110, last 2 years) | |
| Schenker XMG Focus 17 M25 | |
| Average Intel Core i9-13900HX (88686 - 137015, n=22) | |
| AIDA64 / CPU SHA3 | |
| Schenker XMG Pro 16 (E25) | |
| Lenovo Legion 5 Pro 16IAX10H | |
| MSI Vector 17 HX AI A2XWIG | |
| Schenker XMG Focus 17 M25 | |
| MSI Vector 16 HX AI A2XWHG | |
| Average of class Gaming (2180 - 9817, n=110, last 2 years) | |
| Average Intel Core i9-13900HX (4362 - 7029, n=22) | |
| AIDA64 / CPU Queen | |
| Lenovo Legion 5 Pro 16IAX10H | |
| Schenker XMG Focus 17 M25 | |
| Average Intel Core i9-13900HX (125644 - 141385, n=22) | |
| Schenker XMG Pro 16 (E25) | |
| MSI Vector 17 HX AI A2XWIG | |
| Average of class Gaming (49785 - 173351, n=101, last 2 years) | |
| MSI Vector 16 HX AI A2XWHG | |
| AIDA64 / FPU SinJulia | |
| Schenker XMG Focus 17 M25 | |
| Average Intel Core i9-13900HX (12334 - 17179, n=22) | |
| Average of class Gaming (4424 - 33636, n=110, last 2 years) | |
| Schenker XMG Pro 16 (E25) | |
| Lenovo Legion 5 Pro 16IAX10H | |
| MSI Vector 17 HX AI A2XWIG | |
| MSI Vector 16 HX AI A2XWHG | |
| AIDA64 / FPU Mandel | |
| Schenker XMG Pro 16 (E25) | |
| Lenovo Legion 5 Pro 16IAX10H | |
| MSI Vector 17 HX AI A2XWIG | |
| MSI Vector 16 HX AI A2XWHG | |
| Average of class Gaming (25115 - 128721, n=110, last 2 years) | |
| Schenker XMG Focus 17 M25 | |
| Average Intel Core i9-13900HX (43850 - 69202, n=22) | |
| AIDA64 / CPU AES | |
| Average Intel Core i9-13900HX (89413 - 237881, n=22) | |
| Lenovo Legion 5 Pro 16IAX10H | |
| Schenker XMG Pro 16 (E25) | |
| Schenker XMG Focus 17 M25 | |
| MSI Vector 17 HX AI A2XWIG | |
| Average of class Gaming (39258 - 247074, n=110, last 2 years) | |
| MSI Vector 16 HX AI A2XWHG | |
| AIDA64 / CPU ZLib | |
| Lenovo Legion 5 Pro 16IAX10H | |
| Schenker XMG Pro 16 (E25) | |
| Schenker XMG Focus 17 M25 | |
| Average Intel Core i9-13900HX (1284 - 1958, n=22) | |
| MSI Vector 17 HX AI A2XWIG | |
| Average of class Gaming (574 - 2531, n=110, last 2 years) | |
| MSI Vector 16 HX AI A2XWHG | |
| AIDA64 / FP64 Ray-Trace | |
| Lenovo Legion 5 Pro 16IAX10H | |
| Schenker XMG Pro 16 (E25) | |
| Average of class Gaming (5509 - 45446, n=110, last 2 years) | |
| MSI Vector 16 HX AI A2XWHG | |
| MSI Vector 17 HX AI A2XWIG | |
| Schenker XMG Focus 17 M25 | |
| Average Intel Core i9-13900HX (9481 - 15279, n=22) | |
| AIDA64 / CPU PhotoWorxx | |
| Schenker XMG Pro 16 (E25) | |
| Lenovo Legion 5 Pro 16IAX10H | |
| MSI Vector 17 HX AI A2XWIG | |
| Schenker XMG Focus 17 M25 | |
| Average Intel Core i9-13900HX (42994 - 51994, n=22) | |
| Average of class Gaming (12271 - 89891, n=110, last 2 years) | |
| MSI Vector 16 HX AI A2XWHG | |
系统性能
Focus 17 在日常使用中速度非常快,基准测试成绩也不错。在测试过程中,我们没有遇到任何系统稳定性问题。
PCMark 10: Score | Essentials | Productivity | Digital Content Creation
CrossMark: Overall | Productivity | Creativity | Responsiveness
WebXPRT 3: Overall
WebXPRT 4: Overall
Mozilla Kraken 1.1: Total
| Performance rating | |
| Lenovo Legion 5 Pro 16IAX10H | |
| Schenker XMG Pro 16 (E25) | |
| MSI Vector 17 HX AI A2XWIG | |
| Schenker XMG Focus 17 M25 | |
| Average Intel Core i9-13900HX, NVIDIA GeForce RTX 5070 Ti Laptop | |
| Average of class Gaming | |
| MSI Vector 16 HX AI A2XWHG | |
| PCMark 10 / Score | |
| Schenker XMG Pro 16 (E25) | |
| MSI Vector 17 HX AI A2XWIG | |
| Average of class Gaming (5828 - 11574, n=96, last 2 years) | |
| Lenovo Legion 5 Pro 16IAX10H | |
| MSI Vector 16 HX AI A2XWHG | |
| Schenker XMG Focus 17 M25 | |
| Average Intel Core i9-13900HX, NVIDIA GeForce RTX 5070 Ti Laptop (n=1) | |
| PCMark 10 / Essentials | |
| Schenker XMG Pro 16 (E25) | |
| Schenker XMG Focus 17 M25 | |
| Average Intel Core i9-13900HX, NVIDIA GeForce RTX 5070 Ti Laptop (n=1) | |
| MSI Vector 17 HX AI A2XWIG | |
| Lenovo Legion 5 Pro 16IAX10H | |
| MSI Vector 16 HX AI A2XWHG | |
| Average of class Gaming (8810 - 12600, n=100, last 2 years) | |
| PCMark 10 / Productivity | |
| Average of class Gaming (6845 - 18766, n=98, last 2 years) | |
| Lenovo Legion 5 Pro 16IAX10H | |
| Schenker XMG Pro 16 (E25) | |
| MSI Vector 16 HX AI A2XWHG | |
| MSI Vector 17 HX AI A2XWIG | |
| Schenker XMG Focus 17 M25 | |
| Average Intel Core i9-13900HX, NVIDIA GeForce RTX 5070 Ti Laptop (n=1) | |
| PCMark 10 / Digital Content Creation | |
| MSI Vector 17 HX AI A2XWIG | |
| Schenker XMG Pro 16 (E25) | |
| Lenovo Legion 5 Pro 16IAX10H | |
| Average of class Gaming (7602 - 19657, n=98, last 2 years) | |
| Schenker XMG Focus 17 M25 | |
| Average Intel Core i9-13900HX, NVIDIA GeForce RTX 5070 Ti Laptop (n=1) | |
| MSI Vector 16 HX AI A2XWHG | |
| CrossMark / Overall | |
| Schenker XMG Focus 17 M25 | |
| Average Intel Core i9-13900HX, NVIDIA GeForce RTX 5070 Ti Laptop (n=1) | |
| MSI Vector 17 HX AI A2XWIG | |
| Schenker XMG Pro 16 (E25) | |
| Lenovo Legion 5 Pro 16IAX10H | |
| Average of class Gaming (1366 - 2409, n=98, last 2 years) | |
| MSI Vector 16 HX AI A2XWHG | |
| CrossMark / Productivity | |
| MSI Vector 17 HX AI A2XWIG | |
| Lenovo Legion 5 Pro 16IAX10H | |
| Schenker XMG Focus 17 M25 | |
| Average Intel Core i9-13900HX, NVIDIA GeForce RTX 5070 Ti Laptop (n=1) | |
| Schenker XMG Pro 16 (E25) | |
| Average of class Gaming (1386 - 2254, n=98, last 2 years) | |
| MSI Vector 16 HX AI A2XWHG | |
| CrossMark / Creativity | |
| Schenker XMG Pro 16 (E25) | |
| Schenker XMG Focus 17 M25 | |
| Average Intel Core i9-13900HX, NVIDIA GeForce RTX 5070 Ti Laptop (n=1) | |
| Lenovo Legion 5 Pro 16IAX10H | |
| MSI Vector 17 HX AI A2XWIG | |
| MSI Vector 16 HX AI A2XWHG | |
| Average of class Gaming (1343 - 2729, n=98, last 2 years) | |
| CrossMark / Responsiveness | |
| Schenker XMG Focus 17 M25 | |
| Average Intel Core i9-13900HX, NVIDIA GeForce RTX 5070 Ti Laptop (n=1) | |
| MSI Vector 17 HX AI A2XWIG | |
| Lenovo Legion 5 Pro 16IAX10H | |
| Schenker XMG Pro 16 (E25) | |
| Average of class Gaming (1226 - 2334, n=98, last 2 years) | |
| MSI Vector 16 HX AI A2XWHG | |
| WebXPRT 3 / Overall | |
| Lenovo Legion 5 Pro 16IAX10H | |
| Schenker XMG Pro 16 (E25) | |
| MSI Vector 17 HX AI A2XWIG | |
| MSI Vector 16 HX AI A2XWHG | |
| Average of class Gaming (242 - 532, n=101, last 2 years) | |
| Average Intel Core i9-13900HX, NVIDIA GeForce RTX 5070 Ti Laptop (n=1) | |
| Schenker XMG Focus 17 M25 | |
| WebXPRT 4 / Overall | |
| Schenker XMG Pro 16 (E25) | |
| MSI Vector 17 HX AI A2XWIG | |
| Lenovo Legion 5 Pro 16IAX10H | |
| MSI Vector 16 HX AI A2XWHG | |
| Schenker XMG Focus 17 M25 | |
| Average Intel Core i9-13900HX, NVIDIA GeForce RTX 5070 Ti Laptop (n=1) | |
| Average of class Gaming (176.4 - 354, n=101, last 2 years) | |
| Mozilla Kraken 1.1 / Total | |
| Schenker XMG Focus 17 M25 | |
| Average Intel Core i9-13900HX, NVIDIA GeForce RTX 5070 Ti Laptop (n=1) | |
| Average of class Gaming (391 - 590, n=106, last 2 years) | |
| MSI Vector 16 HX AI A2XWHG | |
| MSI Vector 17 HX AI A2XWIG | |
| Lenovo Legion 5 Pro 16IAX10H | |
| Schenker XMG Pro 16 (E25) | |
* ... smaller is better
| PCMark 10 Score | 7560 points | |
Help | ||
| AIDA64 / Memory Copy | |
| Schenker XMG Pro 16 (E25) | |
| Schenker XMG Focus 17 M25 | |
| Lenovo Legion 5 Pro 16IAX10H | |
| MSI Vector 17 HX AI A2XWIG | |
| Average Intel Core i9-13900HX (67716 - 79193, n=22) | |
| Average of class Gaming (21750 - 129946, n=110, last 2 years) | |
| MSI Vector 16 HX AI A2XWHG | |
| AIDA64 / Memory Read | |
| Schenker XMG Pro 16 (E25) | |
| Schenker XMG Focus 17 M25 | |
| Lenovo Legion 5 Pro 16IAX10H | |
| MSI Vector 17 HX AI A2XWIG | |
| Average Intel Core i9-13900HX (73998 - 88462, n=22) | |
| MSI Vector 16 HX AI A2XWHG | |
| Average of class Gaming (22956 - 118858, n=110, last 2 years) | |
| AIDA64 / Memory Write | |
| Schenker XMG Pro 16 (E25) | |
| Lenovo Legion 5 Pro 16IAX10H | |
| MSI Vector 17 HX AI A2XWIG | |
| Average of class Gaming (22297 - 135096, n=110, last 2 years) | |
| Schenker XMG Focus 17 M25 | |
| Average Intel Core i9-13900HX (65472 - 77045, n=22) | |
| MSI Vector 16 HX AI A2XWHG | |
| AIDA64 / Memory Latency | |
| MSI Vector 17 HX AI A2XWIG | |
| Lenovo Legion 5 Pro 16IAX10H | |
| MSI Vector 16 HX AI A2XWHG | |
| Average of class Gaming (75.3 - 259, n=110, last 2 years) | |
| Schenker XMG Pro 16 (E25) | |
| Average Intel Core i9-13900HX (75.3 - 91.1, n=22) | |
| Schenker XMG Focus 17 M25 | |
* ... smaller is better
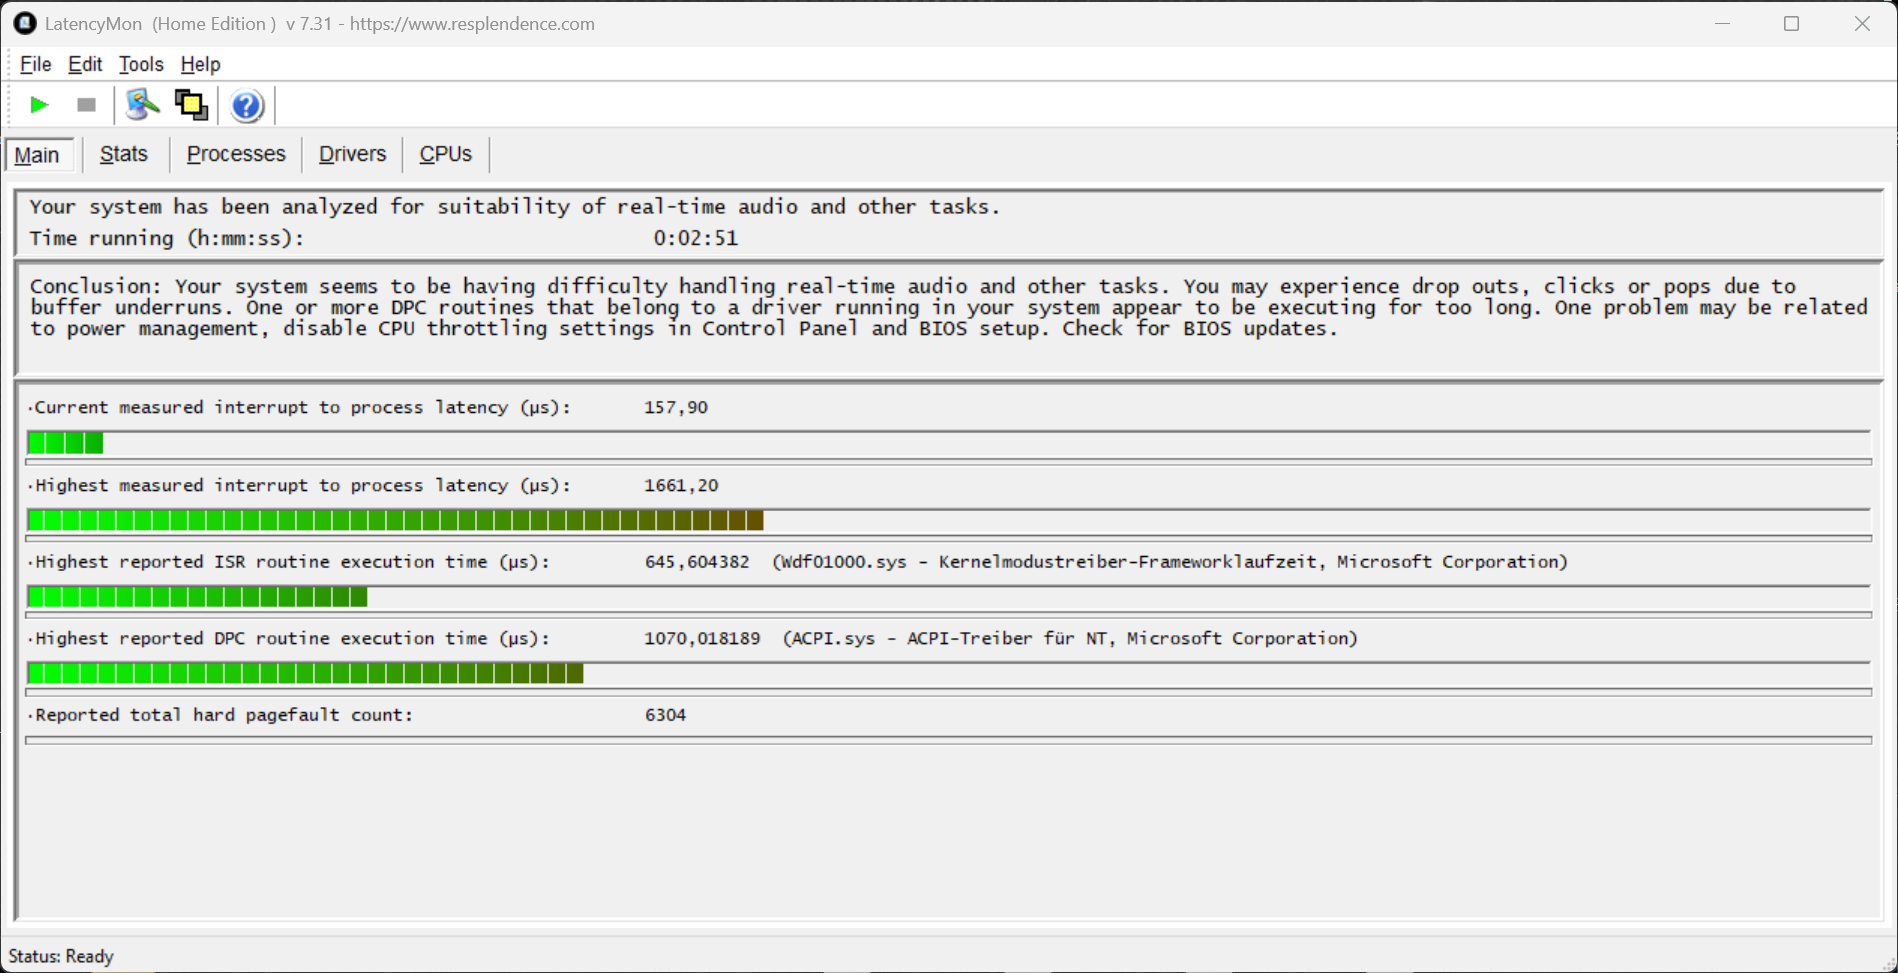
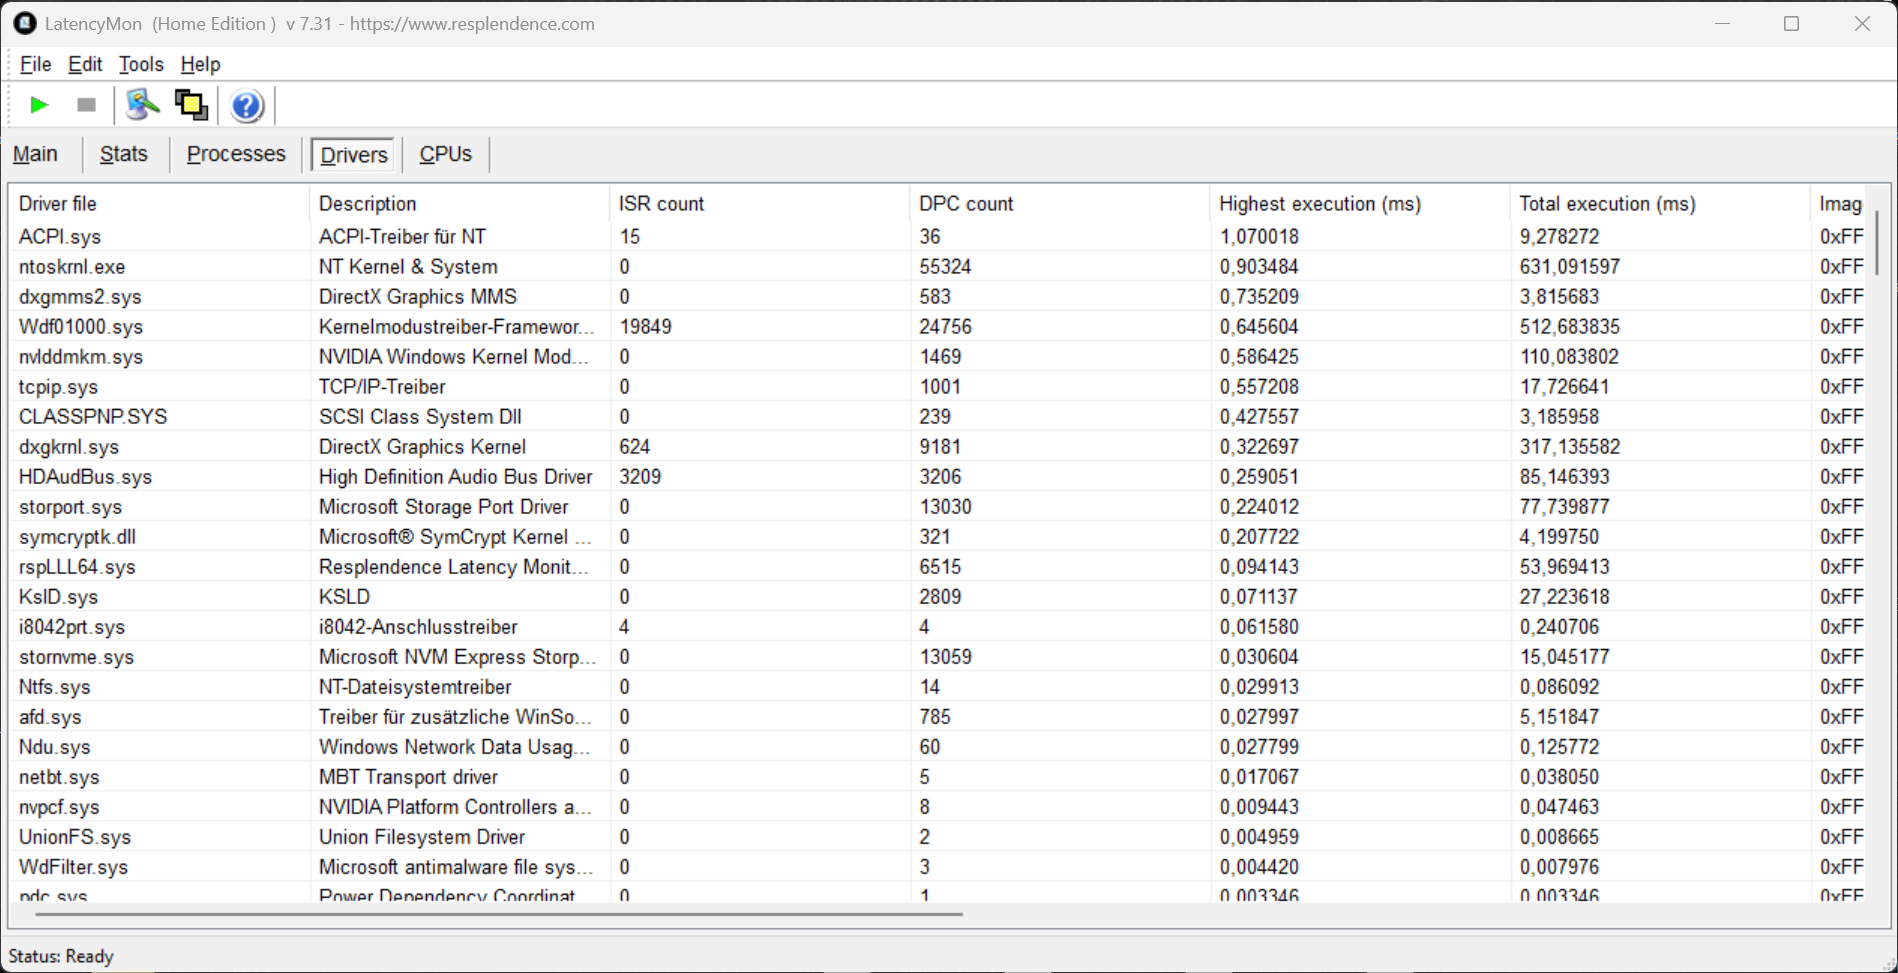
DPC 延迟
在我们的标准化延迟测试(网页浏览、4K YouTube 播放、CPU 负载)中,评测设备(当前 BIOS 版本)在使用实时音频应用程序时表现出轻微的局限性。
| DPC Latencies / LatencyMon - interrupt to process latency (max), Web, Youtube, Prime95 | |
| MSI Vector 16 HX AI A2XWHG | |
| Schenker XMG Pro 16 (E25) | |
| Schenker XMG Focus 17 M25 | |
| MSI Vector 17 HX AI A2XWIG | |
| Lenovo Legion 5 Pro 16IAX10H | |
* ... smaller is better
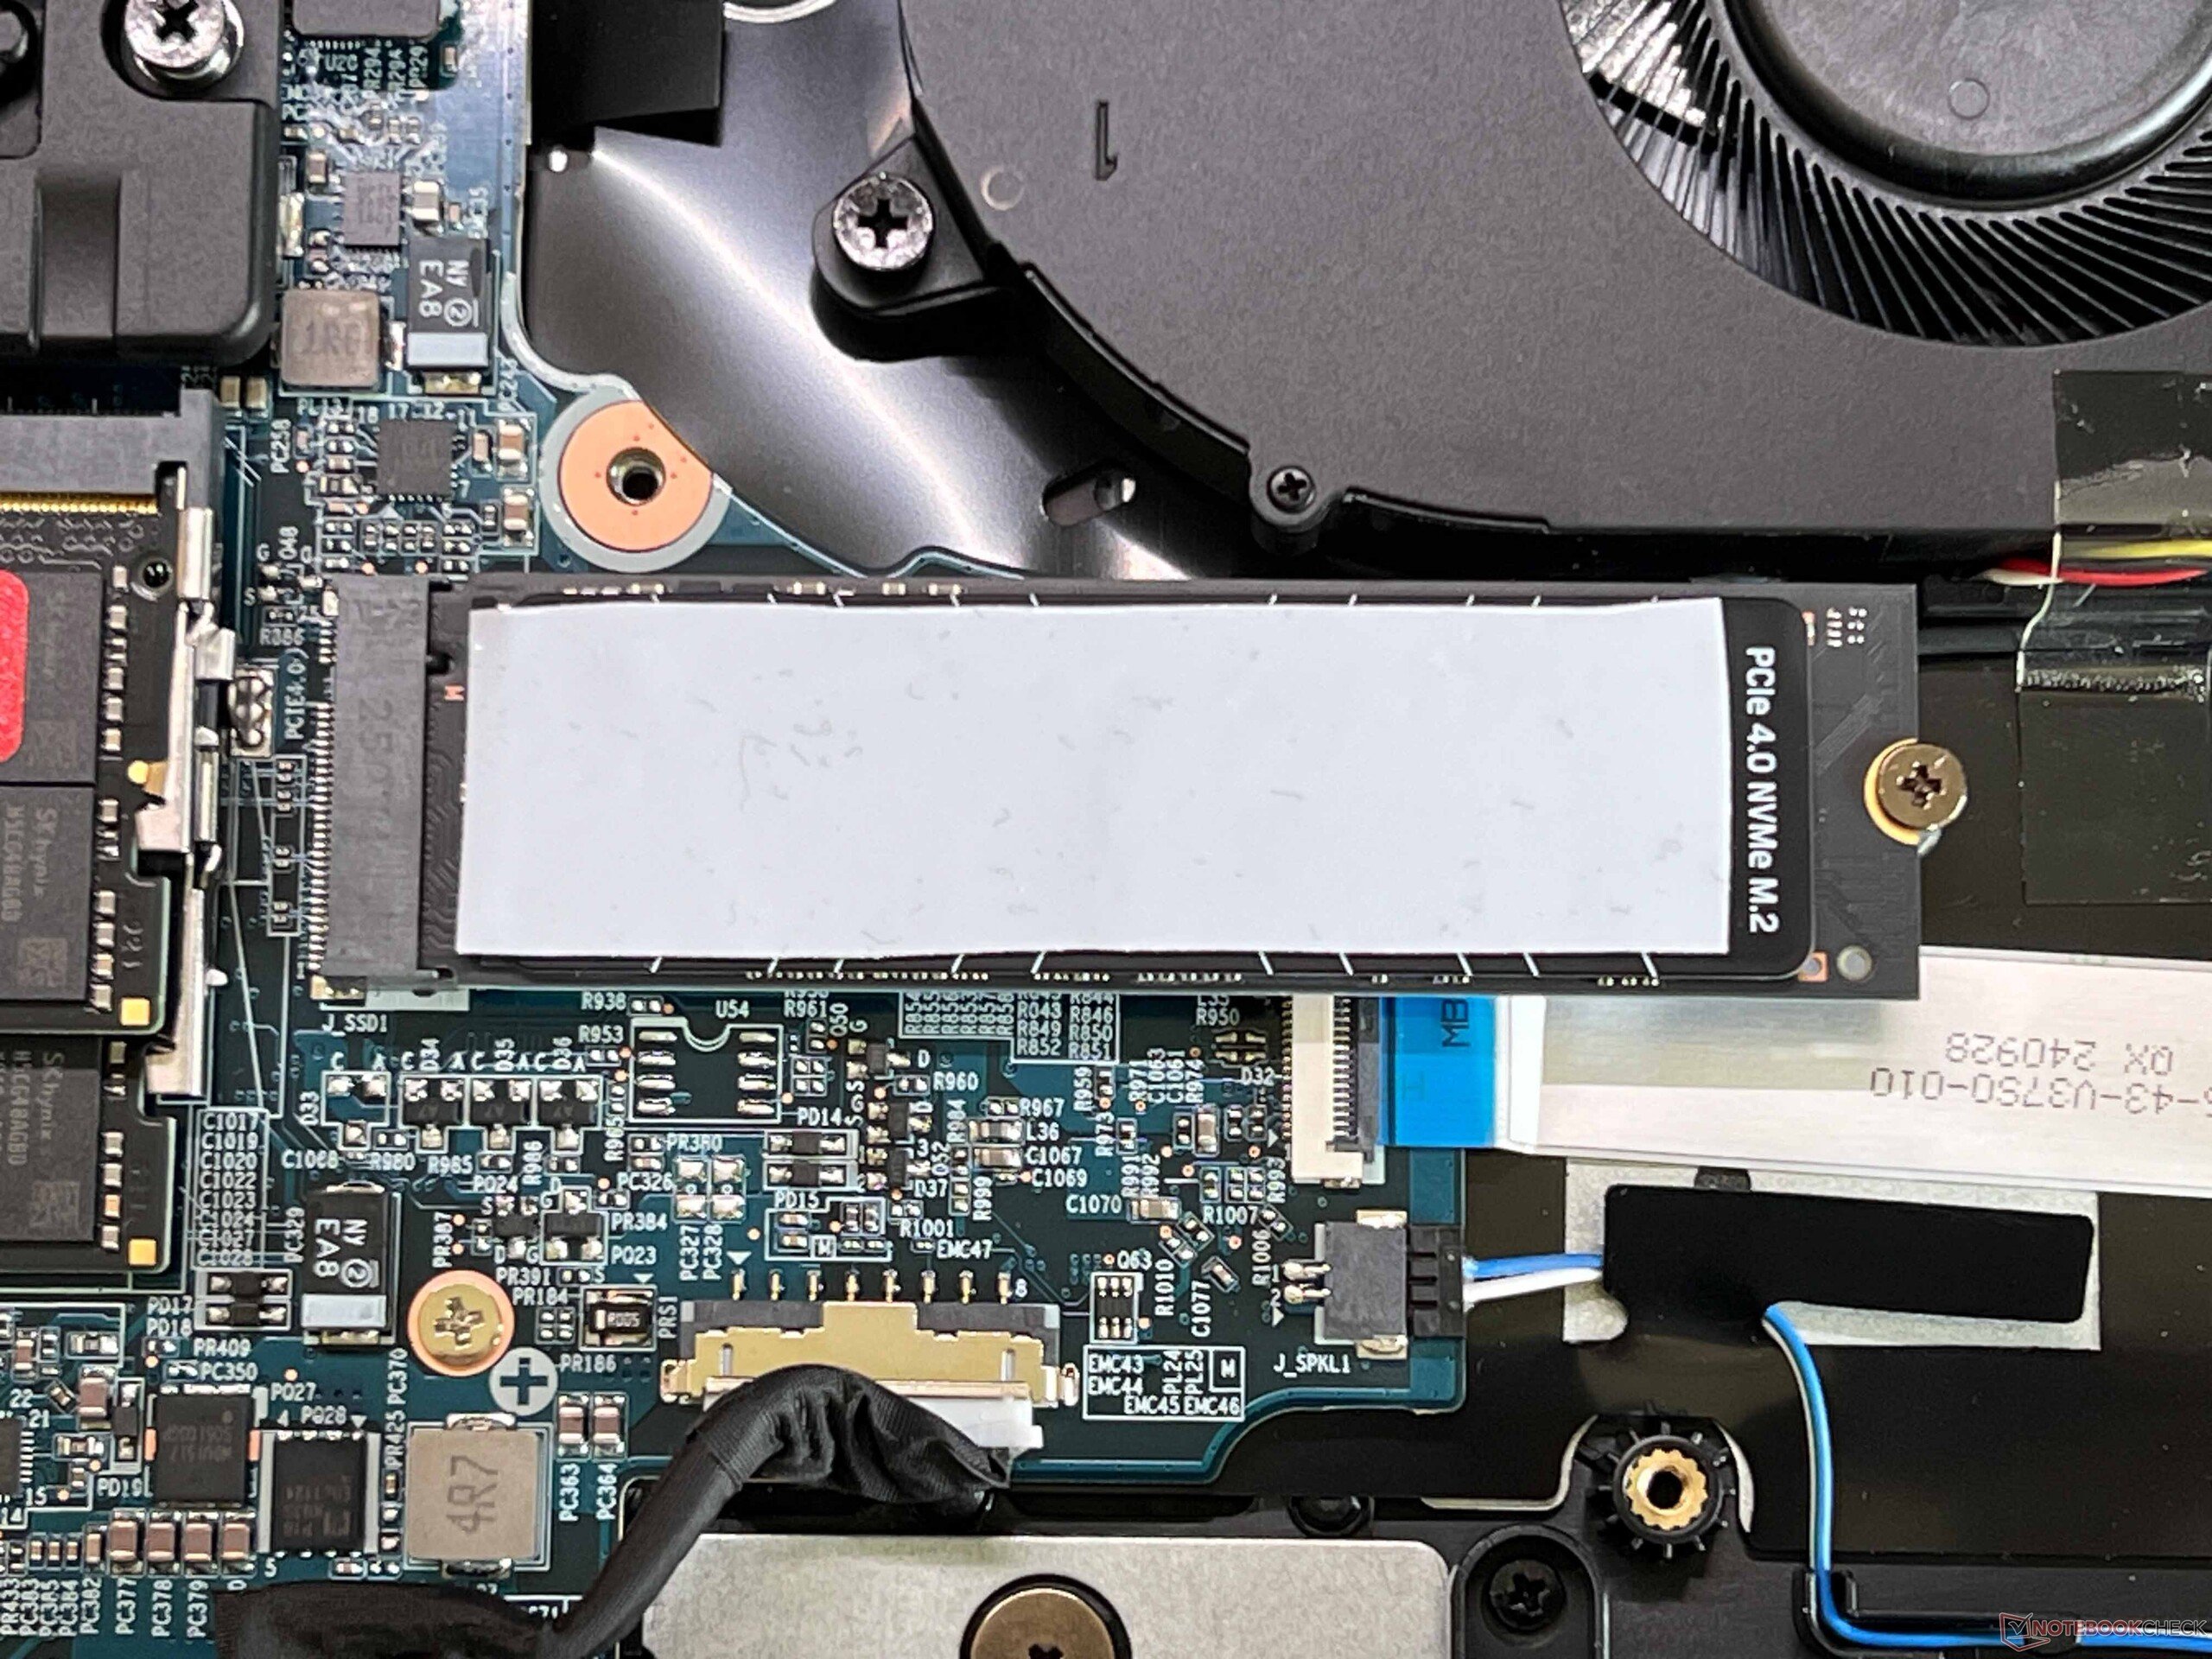
大容量存储器
Focus 为 M.2 2280 固态硬盘(PCIe 4.0)提供了两个插槽,我们的评测机配备了 500 GB 的金士顿硬盘(空闲 399 GB)。传输速度非常好,即使在长时间负载的情况下也能保持稳定。

* ... smaller is better
Sustained Performance Read: DiskSpd Read Loop, Queue Depth 8
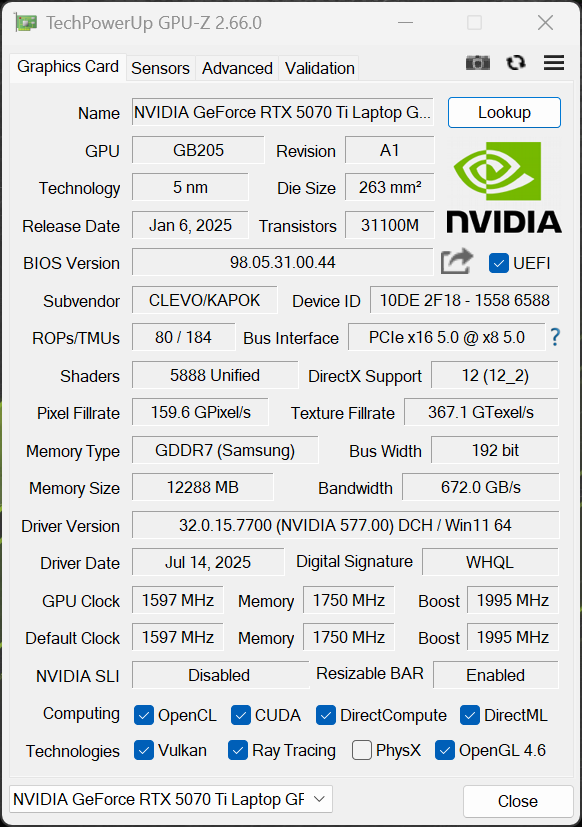
图形处理器性能
Das Focus 17 专门配备了全新的 GeForce RTX 5070 Ti 笔记本电脑 GPU(TGP 140 瓦,12 GB VRAM)。图形切换通过 Optimus 技术处理,并集成了多线程切换功能。合成基准测试中的图形性能非常出色。此外,GPU 性能在持续负载下也保持稳定。
游戏性能也非常出色,所有游戏都能在 QHD 分辨率下流畅运行。不过,性能并非完全稳定,CPU 性能在几分钟后略有下降。不同的游戏会略有不同。例如,在我们使用《赛博朋克 2077》进行的测试中,大约 5 分钟后性能下降了约 5%。
| 3DMark 11 Performance | 43731 points | |
| 3DMark Fire Strike Score | 33824 points | |
| 3DMark Time Spy Score | 17276 points | |
| 3DMark Steel Nomad Score | 3932 points | |
| 3DMark Steel Nomad Light Score | 17797 points | |
| 3DMark Steel Nomad Light Unlimited Score | 18318 points | |
Help | ||
| Blender / v3.3 Classroom OPTIX/RTX | |
| Average of class Gaming (9 - 32, n=112, last 2 years) | |
| MSI Vector 16 HX AI A2XWHG | |
| Average NVIDIA GeForce RTX 5070 Ti Laptop (13 - 19, n=14) | |
| Lenovo Legion 5 Pro 16IAX10H | |
| Schenker XMG Pro 16 (E25) | |
| MSI Vector 17 HX AI A2XWIG | |
| Schenker XMG Focus 17 M25 | |
| Blender / v3.3 Classroom CUDA | |
| Average of class Gaming (15 - 228, n=112, last 2 years) | |
| Schenker XMG Focus 17 M25 | |
| Average NVIDIA GeForce RTX 5070 Ti Laptop (24 - 33, n=14) | |
| Schenker XMG Pro 16 (E25) | |
| MSI Vector 16 HX AI A2XWHG | |
| Lenovo Legion 5 Pro 16IAX10H | |
| MSI Vector 17 HX AI A2XWIG | |
| Blender / v3.3 Classroom CPU | |
| Average of class Gaming (122 - 565, n=108, last 2 years) | |
| MSI Vector 16 HX AI A2XWHG | |
| Average NVIDIA GeForce RTX 5070 Ti Laptop (122 - 361, n=14) | |
| Schenker XMG Focus 17 M25 | |
| MSI Vector 17 HX AI A2XWIG | |
| Lenovo Legion 5 Pro 16IAX10H | |
| Schenker XMG Pro 16 (E25) | |
* ... smaller is better
| Performance rating - Percent | |
| MSI Vector 17 HX AI A2XWIG | |
| Lenovo Legion 5 Pro 16IAX10H | |
| Schenker XMG Focus 17 M25 | |
| MSI Vector 16 HX AI A2XWHG -1! | |
| Schenker XMG Pro 16 (E25) | |
| Average of class Gaming | |
| Cyberpunk 2077 - 1920x1080 Ultra Preset (FSR off) | |
| MSI Vector 17 HX AI A2XWIG | |
| Lenovo Legion 5 Pro 16IAX10H | |
| Schenker XMG Pro 16 (E25) | |
| MSI Vector 16 HX AI A2XWHG | |
| Schenker XMG Focus 17 M25 | |
| Average of class Gaming (17.7 - 169.9, n=121, last 2 years) | |
| Baldur's Gate 3 - 1920x1080 Ultra Preset AA:T | |
| MSI Vector 17 HX AI A2XWIG | |
| Schenker XMG Pro 16 (E25) | |
| Schenker XMG Focus 17 M25 | |
| MSI Vector 16 HX AI A2XWHG | |
| Lenovo Legion 5 Pro 16IAX10H | |
| Average of class Gaming (59.4 - 246, n=107, last 2 years) | |
| GTA V - 1920x1080 Highest AA:4xMSAA + FX AF:16x | |
| Schenker XMG Pro 16 (E25) | |
| MSI Vector 17 HX AI A2XWIG | |
| Schenker XMG Focus 17 M25 | |
| Lenovo Legion 5 Pro 16IAX10H | |
| MSI Vector 16 HX AI A2XWHG | |
| Average of class Gaming (48.3 - 186.9, n=103, last 2 years) | |
| Final Fantasy XV Benchmark - 1920x1080 High Quality | |
| MSI Vector 17 HX AI A2XWIG | |
| Lenovo Legion 5 Pro 16IAX10H | |
| MSI Vector 16 HX AI A2XWHG | |
| Schenker XMG Focus 17 M25 | |
| Schenker XMG Pro 16 (E25) | |
| Average of class Gaming (41 - 215, n=104, last 2 years) | |
| Strange Brigade - 1920x1080 ultra AA:ultra AF:16 | |
| MSI Vector 17 HX AI A2XWIG | |
| Lenovo Legion 5 Pro 16IAX10H | |
| Schenker XMG Focus 17 M25 | |
| Average of class Gaming (76.3 - 456, n=94, last 2 years) | |
| Schenker XMG Pro 16 (E25) | |
| Dota 2 Reborn - 1920x1080 ultra (3/3) best looking | |
| Schenker XMG Pro 16 (E25) | |
| Lenovo Legion 5 Pro 16IAX10H | |
| MSI Vector 17 HX AI A2XWIG | |
| Schenker XMG Focus 17 M25 | |
| MSI Vector 16 HX AI A2XWHG | |
| Average of class Gaming (84.8 - 248, n=113, last 2 years) | |
| X-Plane 11.11 - 1920x1080 high (fps_test=3) | |
| Schenker XMG Focus 17 M25 | |
| Schenker XMG Pro 16 (E25) | |
| Lenovo Legion 5 Pro 16IAX10H | |
| MSI Vector 17 HX AI A2XWIG | |
| MSI Vector 16 HX AI A2XWHG | |
| Average of class Gaming (52.1 - 143.5, n=116, last 2 years) | |
| F1 24 - 2560x1440 Ultra High Preset AA:T AF:16x | |
| Schenker XMG Pro 16 (E25) | |
| Average of class Gaming (29.8 - 106.9, n=60, last 2 years) | |
| Schenker XMG Focus 17 M25 | |
| Average NVIDIA GeForce RTX 5070 Ti Laptop (53.2 - 72.1, n=10) | |
| F1 25 - 2560x1440 Ultra Max Preset AA:T AF:16x | |
| Average NVIDIA GeForce RTX 5070 Ti Laptop (18 - 26, n=7) | |
| Average of class Gaming (5 - 37.5, n=24, last 2 years) | |
| Lenovo Legion 5 Pro 16IAX10H | |
| Assassin's Creed Shadows - 2560x1440 Ultra High | |
| Schenker XMG Focus 17 M25 | |
| Average of class Gaming (22 - 64, n=48, last 2 years) | |
| Lenovo Legion 5 Pro 16IAX10H | |
| Average NVIDIA GeForce RTX 5070 Ti Laptop (40 - 48, n=9) | |
Cyberpunk 2077 ultra FPS diagram
| low | med. | high | ultra | QHD DLSS | QHD | |
|---|---|---|---|---|---|---|
| GTA V (2015) | 152.9 | 139.1 | ||||
| Dota 2 Reborn (2015) | 223 | 192.9 | 178.8 | 165.4 | ||
| Final Fantasy XV Benchmark (2018) | 223 | 197.6 | 156.8 | 129.5 | ||
| X-Plane 11.11 (2018) | 165 | 142.2 | 124.6 | |||
| Strange Brigade (2018) | 438 | 362 | 328 | 303 | 229 | |
| Baldur's Gate 3 (2023) | 202.6 | 172.8 | 154.2 | 153.9 | 108.6 | |
| Cyberpunk 2077 (2023) | 149.4 | 139.8 | 126.4 | 115.7 | 93.9 | 81 |
| F1 24 (2024) | 247 | 236 | 232 | 98.7 | 98.4 | 66.4 |
| Assassin's Creed Shadows (2025) | 90 | 84 | 72 | 55 | 47 |
排放与能源
噪音排放
在日常使用中,即使使用快速电源配置文件,两个风扇通常也能保持非常安静,而且在负载阶段结束后,风扇转速也会迅速降低。在最快模式下进行游戏时,噪音会达到 56.2 dB(A),因此建议使用耳机。而静音模式则非常安静,最大噪音为 37 dB(A),游戏性能仍然可以接受。评测设备上没有检测到其他电子噪音。
Noise level
| Idle |
| 24.8 / 24.8 / 27.7 dB(A) |
| Load |
| 51 / 56.2 dB(A) |
 | ||
30 dB silent 40 dB(A) audible 50 dB(A) loud |
||
min: | ||
| Schenker XMG Focus 17 M25 GeForce RTX 5070 Ti Laptop, i9-13900HX, Kingston Fury Renegade SFYRS500G | MSI Vector 17 HX AI A2XWIG GeForce RTX 5080 Laptop, Ultra 9 275HX, Western Digital PC SN5000S SDEPNSJ-2T00-1032 | Lenovo Legion 5 Pro 16IAX10H GeForce RTX 5070 Ti Laptop, Ultra 9 275HX, Western Digital PC SN8000S SDEPNRK-1T00 | MSI Vector 16 HX AI A2XWHG GeForce RTX 5070 Ti Laptop, Ultra 7 255HX, Micron 2400 MTFDKBA512QFM | Schenker XMG Pro 16 (E25) GeForce RTX 5070 Ti Laptop, Ultra 9 275HX, Samsung 9100 Pro 1 TB | |
|---|---|---|---|---|---|
| Noise | -0% | -2% | -10% | 5% | |
| off / environment * (dB) | 24.8 | 24 3% | 24 3% | 25 -1% | 23.3 6% |
| Idle Minimum * (dB) | 24.8 | 24 3% | 24 3% | 33 -33% | 25 -1% |
| Idle Average * (dB) | 24.8 | 30.82 -24% | 24 3% | 34 -37% | 25 -1% |
| Idle Maximum * (dB) | 27.7 | 31.31 -13% | 30.9 -12% | 38 -37% | 25 10% |
| Load Average * (dB) | 51 | 31.12 39% | 55.9 -10% | 46 10% | 45.5 11% |
| Cyberpunk 2077 ultra * (dB) | 56.2 | 59.24 -5% | 56.72 -1% | 47 16% | 53.3 5% |
| Load Maximum * (dB) | 56.2 | 59.24 -5% | 56.72 -1% | 49 13% | 53.3 5% |
* ... smaller is better
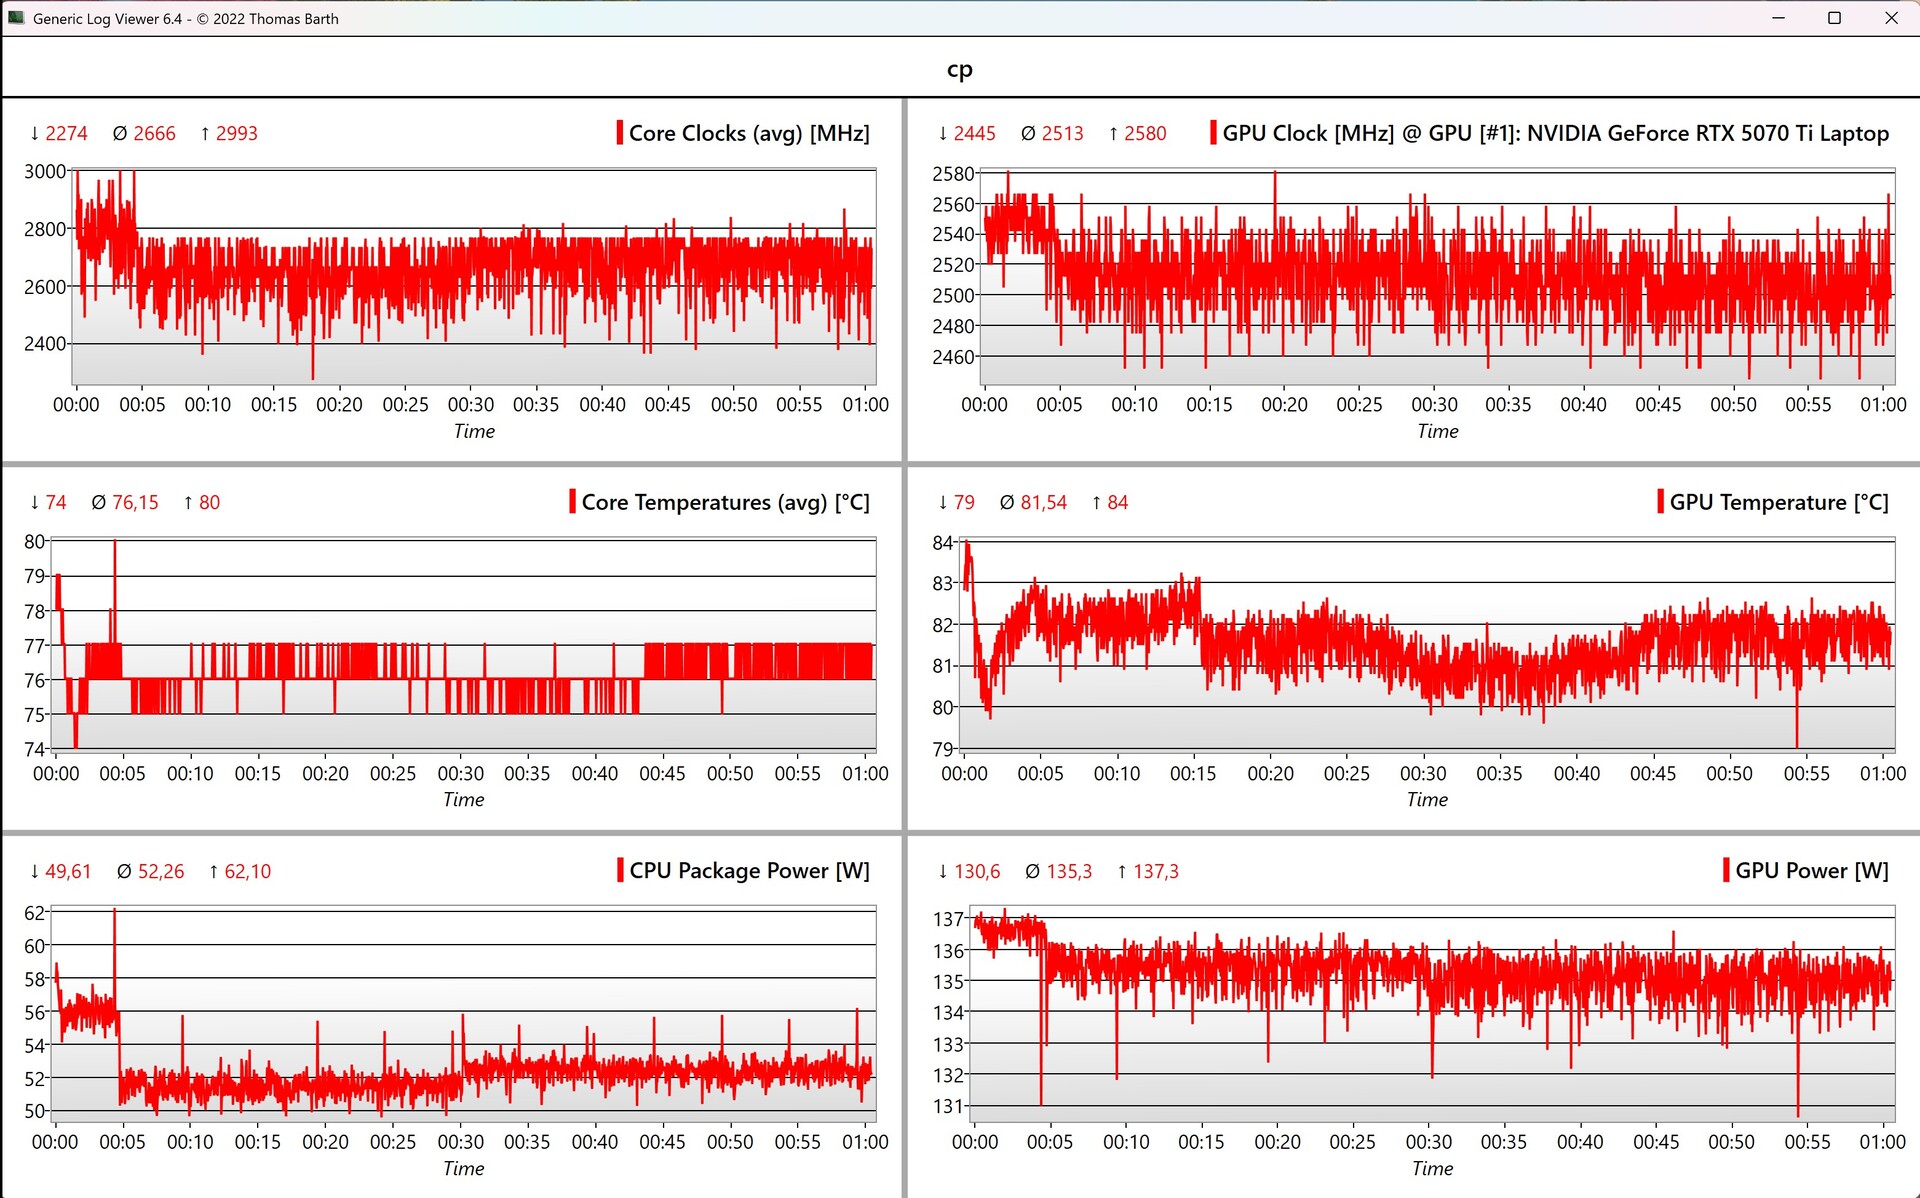
温度
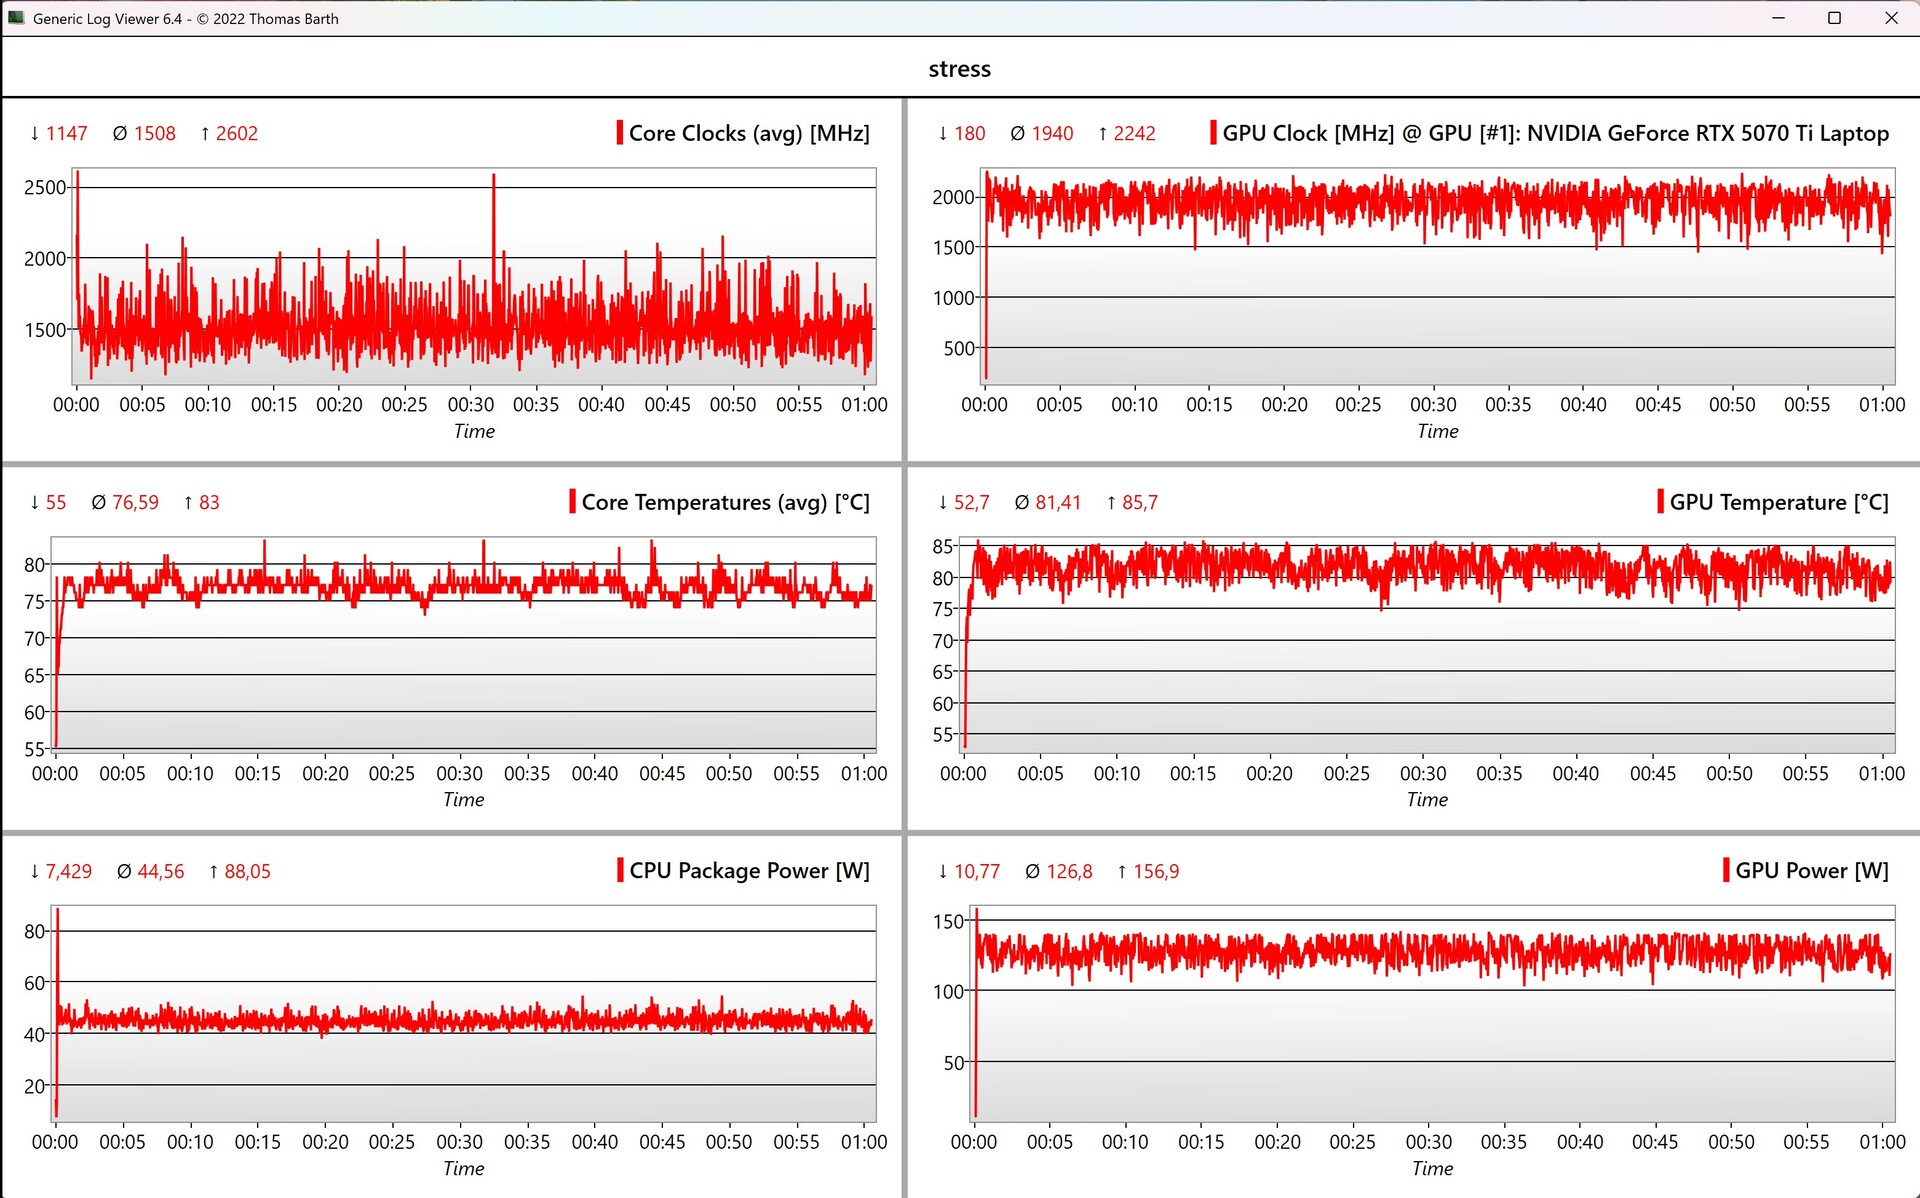
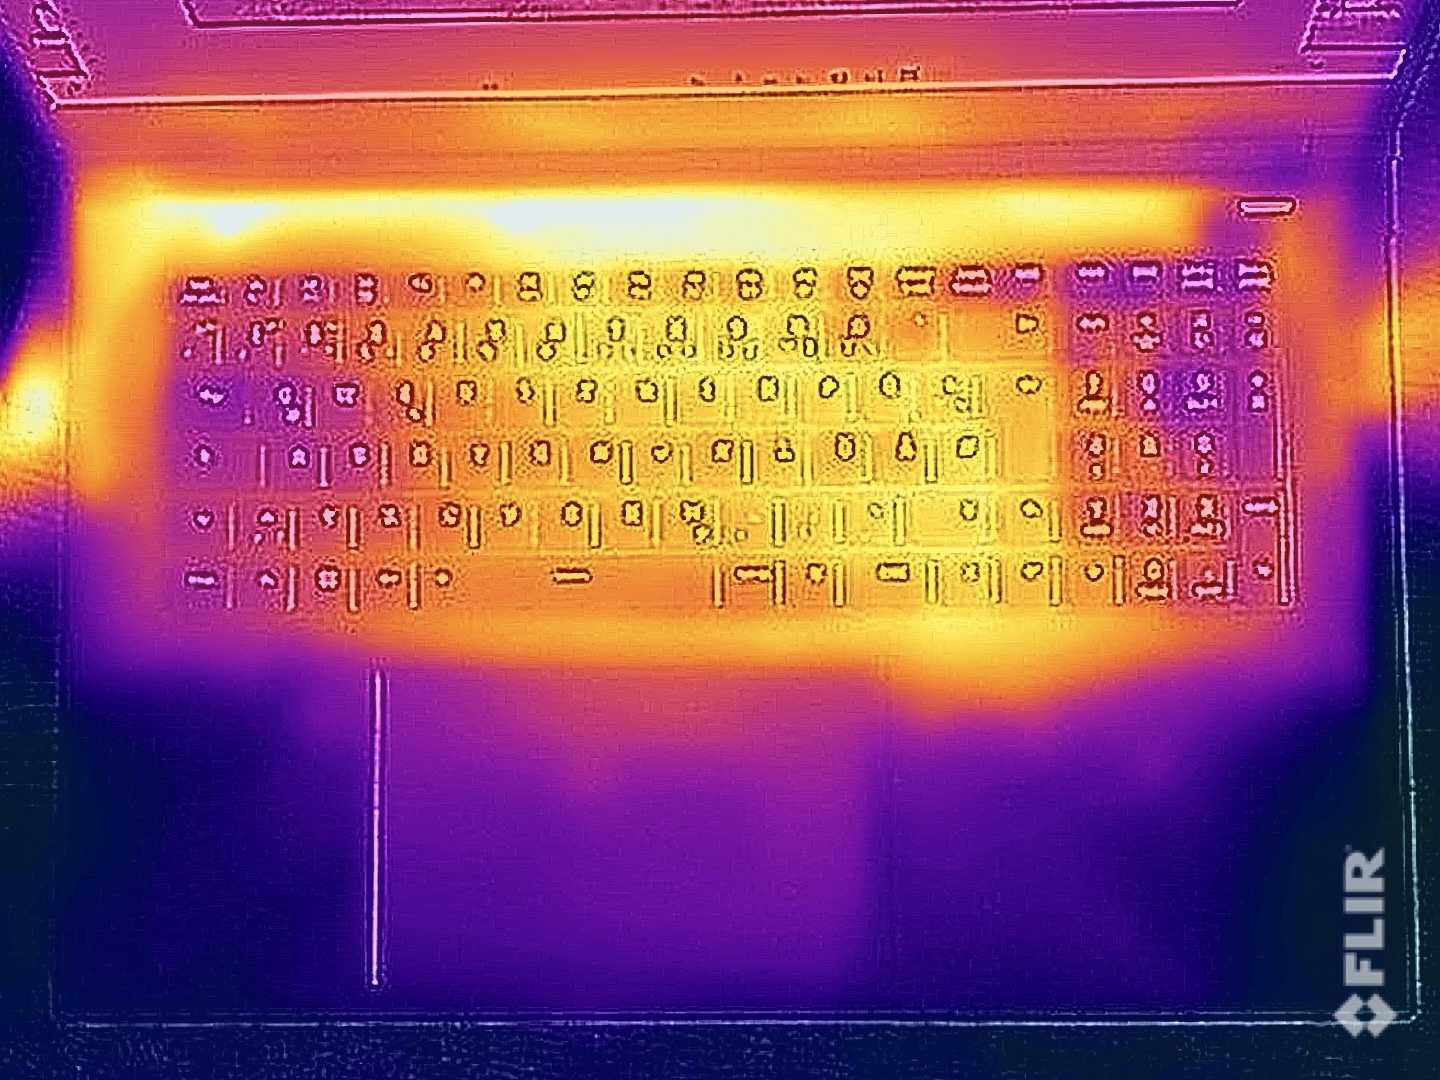
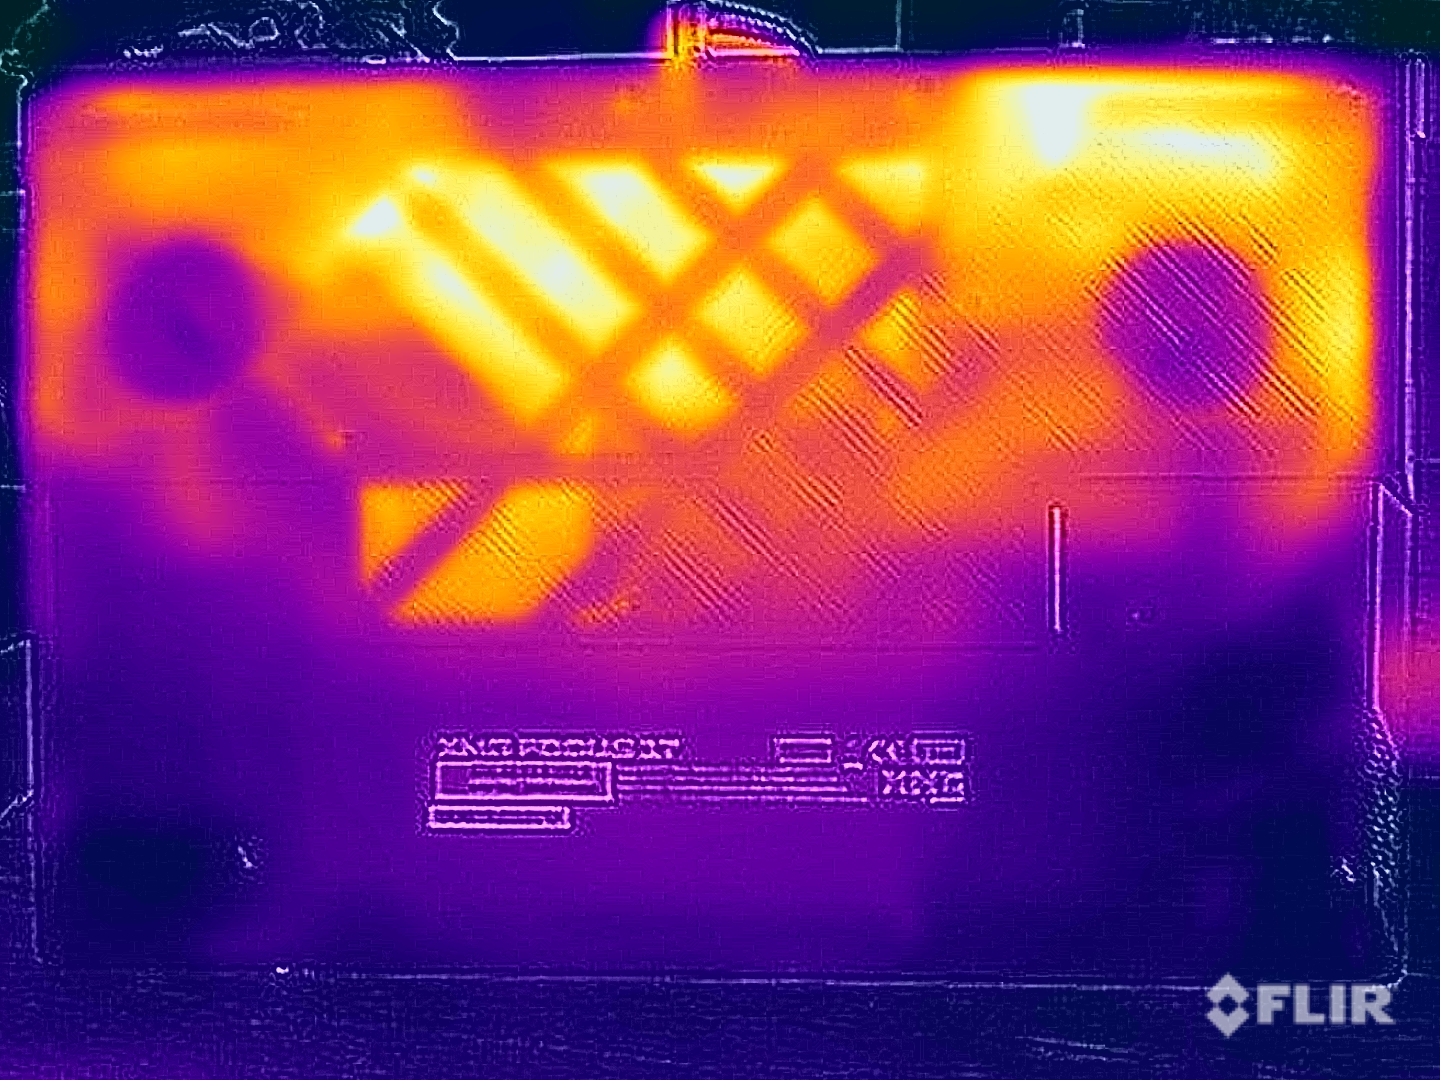
表面温度没有问题,尤其是键盘,即使在游戏时也不会太热。虽然底部面板的最高温度达到了 48°C,但考虑到它的尺寸,你可能无论如何都不会把 Focus 17 放在膝盖上。在压力测试中,GPU 的运行功率约为 130 瓦(81°C),CPU 为 45 瓦(77°C)。
(±) The maximum temperature on the upper side is 41.2 °C / 106 F, compared to the average of 40.4 °C / 105 F, ranging from 21.2 to 68.8 °C for the class Gaming.
(-) The bottom heats up to a maximum of 48.8 °C / 120 F, compared to the average of 43.2 °C / 110 F
(+) In idle usage, the average temperature for the upper side is 26.6 °C / 80 F, compared to the device average of 33.9 °C / 93 F.
(±) 3: The average temperature for the upper side is 35.6 °C / 96 F, compared to the average of 33.9 °C / 93 F for the class Gaming.
(+) The palmrests and touchpad are cooler than skin temperature with a maximum of 28 °C / 82.4 F and are therefore cool to the touch.
(±) The average temperature of the palmrest area of similar devices was 28.8 °C / 83.8 F (+0.8 °C / 1.4 F).
| Schenker XMG Focus 17 M25 Intel Core i9-13900HX, NVIDIA GeForce RTX 5070 Ti Laptop | MSI Vector 17 HX AI A2XWIG Intel Core Ultra 9 275HX, NVIDIA GeForce RTX 5080 Laptop | Lenovo Legion 5 Pro 16IAX10H Intel Core Ultra 9 275HX, NVIDIA GeForce RTX 5070 Ti Laptop | MSI Vector 16 HX AI A2XWHG Intel Core Ultra 7 255HX, NVIDIA GeForce RTX 5070 Ti Laptop | Schenker XMG Pro 16 (E25) Intel Core Ultra 9 275HX, NVIDIA GeForce RTX 5070 Ti Laptop | |
|---|---|---|---|---|---|
| Heat | -24% | -24% | -13% | -194% | |
| Maximum Upper Side * (°C) | 41.2 | 53 -29% | 48 -17% | 53 -29% | 43.2 -5% |
| Maximum Bottom * (°C) | 48.8 | 54 -11% | 50 -2% | 52 -7% | 46 6% |
| Idle Upper Side * (°C) | 27.6 | 39 -41% | 38 -38% | 33 -20% | 27.7 -0% |
| Idle Bottom * (°C) | 30.1 | 34 -13% | 42 -40% | 29 4% | 264 -777% |
* ... smaller is better
发言人
两个立体声扬声器没有给人留下深刻印象,声音显得非常单薄,最大音量也很低。
Schenker XMG Focus 17 M25 audio analysis
(±) | speaker loudness is average but good (78.5 dB)
Bass 100 - 315 Hz
(-) | nearly no bass - on average 21.9% lower than median
(±) | linearity of bass is average (13.4% delta to prev. frequency)
Mids 400 - 2000 Hz
(+) | balanced mids - only 2.8% away from median
(±) | linearity of mids is average (7.3% delta to prev. frequency)
Highs 2 - 16 kHz
(+) | balanced highs - only 3.9% away from median
(+) | highs are linear (5.8% delta to prev. frequency)
Overall 100 - 16.000 Hz
(±) | linearity of overall sound is average (18.8% difference to median)
Compared to same class
» 62% of all tested devices in this class were better, 8% similar, 30% worse
» The best had a delta of 6%, average was 18%, worst was 132%
Compared to all devices tested
» 43% of all tested devices were better, 8% similar, 49% worse
» The best had a delta of 4%, average was 24%, worst was 134%
MSI Vector 17 HX AI A2XWIG audio analysis
(±) | speaker loudness is average but good (80.39 dB)
Bass 100 - 315 Hz
(±) | reduced bass - on average 10.4% lower than median
(±) | linearity of bass is average (7.4% delta to prev. frequency)
Mids 400 - 2000 Hz
(±) | higher mids - on average 6.2% higher than median
(+) | mids are linear (4.7% delta to prev. frequency)
Highs 2 - 16 kHz
(+) | balanced highs - only 4.3% away from median
(±) | linearity of highs is average (8.7% delta to prev. frequency)
Overall 100 - 16.000 Hz
(±) | linearity of overall sound is average (15.6% difference to median)
Compared to same class
» 36% of all tested devices in this class were better, 6% similar, 58% worse
» The best had a delta of 6%, average was 18%, worst was 132%
Compared to all devices tested
» 23% of all tested devices were better, 5% similar, 72% worse
» The best had a delta of 4%, average was 24%, worst was 134%
Lenovo Legion 5 Pro 16IAX10H audio analysis
(±) | speaker loudness is average but good (78.2 dB)
Bass 100 - 315 Hz
(-) | nearly no bass - on average 21.1% lower than median
(±) | linearity of bass is average (8% delta to prev. frequency)
Mids 400 - 2000 Hz
(±) | higher mids - on average 6.3% higher than median
(+) | mids are linear (6.5% delta to prev. frequency)
Highs 2 - 16 kHz
(+) | balanced highs - only 1.6% away from median
(+) | highs are linear (4.9% delta to prev. frequency)
Overall 100 - 16.000 Hz
(±) | linearity of overall sound is average (18.3% difference to median)
Compared to same class
» 58% of all tested devices in this class were better, 9% similar, 33% worse
» The best had a delta of 6%, average was 18%, worst was 132%
Compared to all devices tested
» 40% of all tested devices were better, 8% similar, 52% worse
» The best had a delta of 4%, average was 24%, worst was 134%
MSI Vector 16 HX AI A2XWHG audio analysis
(+) | speakers can play relatively loud (86 dB)
Bass 100 - 315 Hz
(±) | reduced bass - on average 12.3% lower than median
(±) | linearity of bass is average (8.5% delta to prev. frequency)
Mids 400 - 2000 Hz
(±) | higher mids - on average 9.9% higher than median
(+) | mids are linear (6.8% delta to prev. frequency)
Highs 2 - 16 kHz
(+) | balanced highs - only 1.8% away from median
(+) | highs are linear (2.9% delta to prev. frequency)
Overall 100 - 16.000 Hz
(±) | linearity of overall sound is average (15.8% difference to median)
Compared to same class
» 37% of all tested devices in this class were better, 7% similar, 56% worse
» The best had a delta of 6%, average was 18%, worst was 132%
Compared to all devices tested
» 24% of all tested devices were better, 5% similar, 71% worse
» The best had a delta of 4%, average was 24%, worst was 134%
Schenker XMG Pro 16 (E25) audio analysis
(±) | speaker loudness is average but good (79.2 dB)
Bass 100 - 315 Hz
(±) | reduced bass - on average 14.2% lower than median
(±) | linearity of bass is average (10.6% delta to prev. frequency)
Mids 400 - 2000 Hz
(±) | higher mids - on average 8.2% higher than median
(±) | linearity of mids is average (9.9% delta to prev. frequency)
Highs 2 - 16 kHz
(+) | balanced highs - only 3.8% away from median
(+) | highs are linear (5.9% delta to prev. frequency)
Overall 100 - 16.000 Hz
(±) | linearity of overall sound is average (18.5% difference to median)
Compared to same class
» 60% of all tested devices in this class were better, 8% similar, 32% worse
» The best had a delta of 6%, average was 18%, worst was 132%
Compared to all devices tested
» 41% of all tested devices were better, 8% similar, 51% worse
» The best had a delta of 4%, average was 24%, worst was 134%
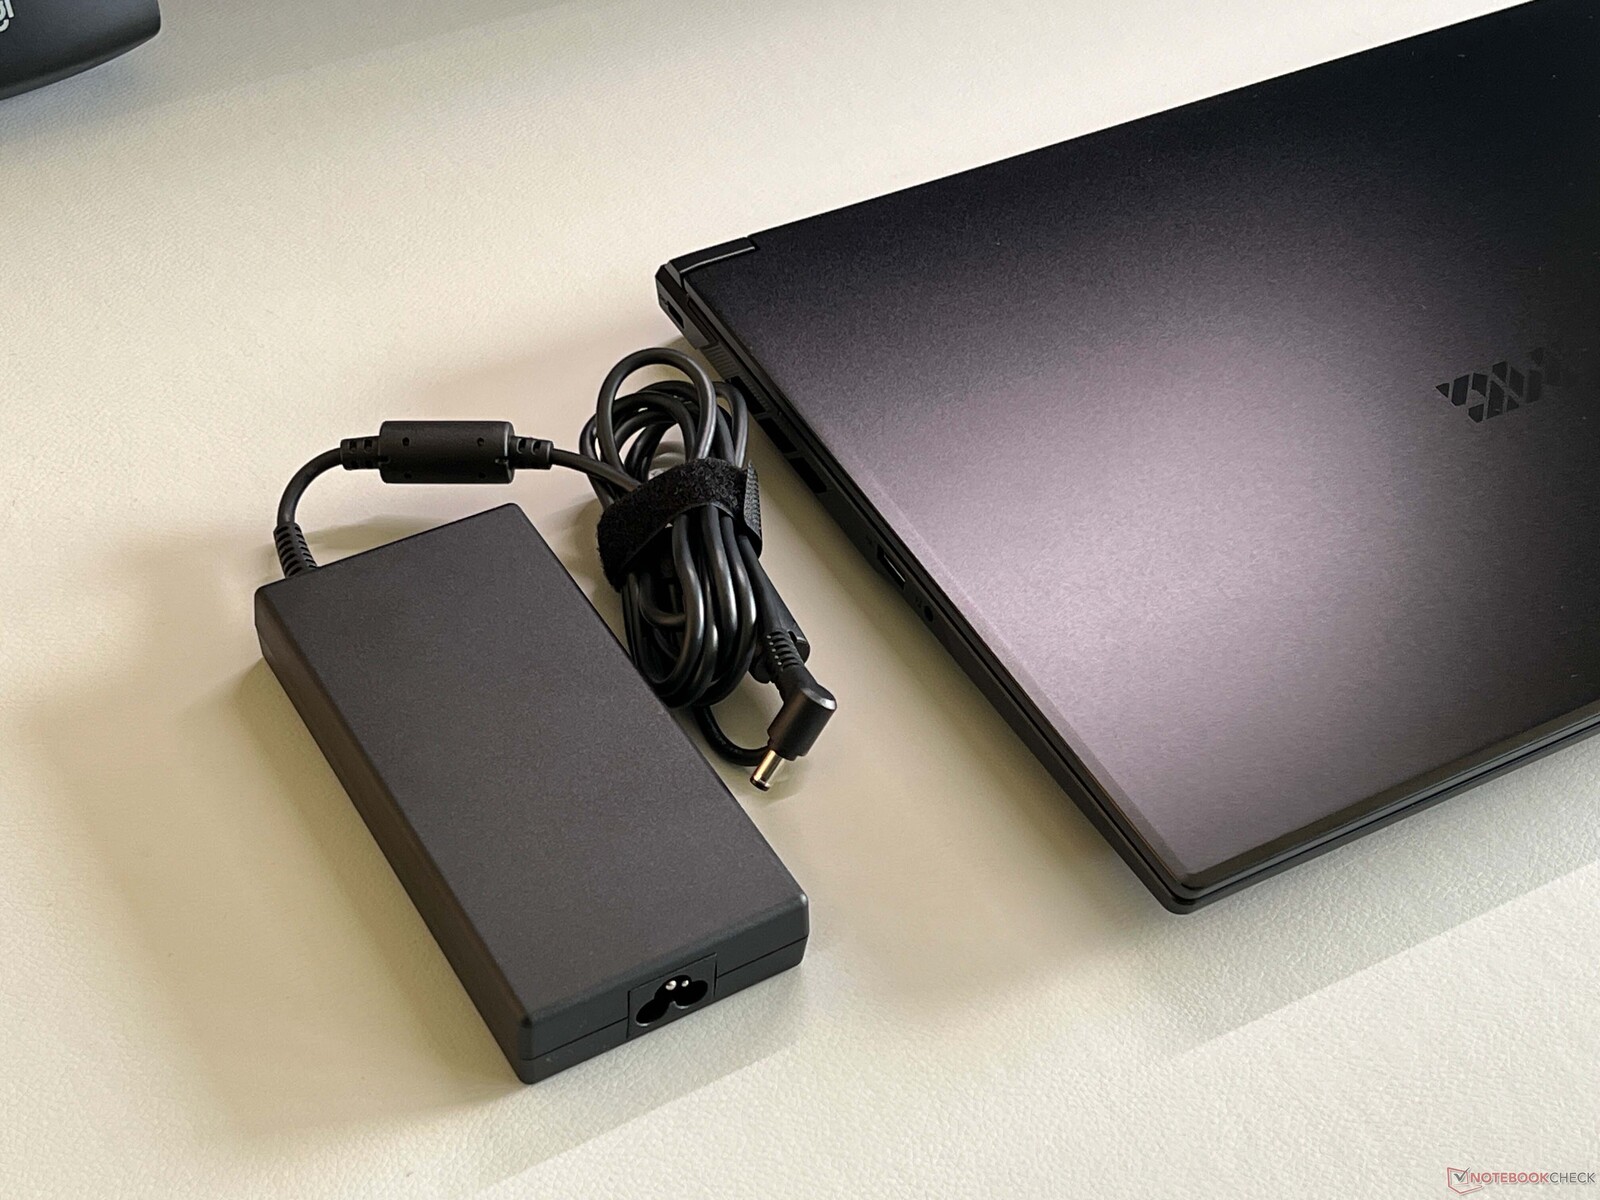
耗电量
怠速运行时,Focus 的最大功率为 18 瓦,仍然相当经济。不过,在满载情况下,我们测得的功率高达 290 瓦,随后稳定在 245 瓦左右。玩游戏时,功率甚至高达 255 瓦。这有点问题,因为包装中只包括一个 230 瓦的电源。虽然电池在负载情况下不会耗尽,但 280 瓦的电源仍然是更好的选择。
| Off / Standby | |
| Idle | |
| Load |
|
Key:
min: | |
| Schenker XMG Focus 17 M25 GeForce RTX 5070 Ti Laptop, i9-13900HX, Kingston Fury Renegade SFYRS500G | MSI Vector 17 HX AI A2XWIG GeForce RTX 5080 Laptop, Ultra 9 275HX, Western Digital PC SN5000S SDEPNSJ-2T00-1032 | Lenovo Legion 5 Pro 16IAX10H GeForce RTX 5070 Ti Laptop, Ultra 9 275HX, Western Digital PC SN8000S SDEPNRK-1T00 | MSI Vector 16 HX AI A2XWHG GeForce RTX 5070 Ti Laptop, Ultra 7 255HX, Micron 2400 MTFDKBA512QFM | Schenker XMG Pro 16 (E25) GeForce RTX 5070 Ti Laptop, Ultra 9 275HX, Samsung 9100 Pro 1 TB | |
|---|---|---|---|---|---|
| Power Consumption | -0% | -9% | -1% | 2% | |
| Idle Minimum * (Watt) | 12 | 10 17% | 14 -17% | 7.1 41% | 11.7 2% |
| Idle Average * (Watt) | 17.5 | 15.4 12% | 14.3 18% | 15.9 9% | 16.6 5% |
| Idle Maximum * (Watt) | 18.1 | 18.7 -3% | 20.1 -11% | 29.5 -63% | 17.1 6% |
| Load Average * (Watt) | 121.1 | 89.7 26% | 177 -46% | 124 -2% | 122.4 -1% |
| Cyberpunk 2077 ultra * (Watt) | 255 | 308 -21% | 255 -0% | 222 13% | 245 4% |
| Cyberpunk 2077 ultra external monitor * (Watt) | 244 | 300 -23% | 255 -5% | 217 11% | 241 1% |
| Load Maximum * (Watt) | 292.1 | 321 -10% | 294 -1% | 336 -15% | 291.5 -0% |
* ... smaller is better
Power consumption Cyberpunk / stress test
Power consumption with an external monitor
电池寿命
73 瓦时电池的续航时间只能说一般。在 150 cd/m²(最大亮度的 35%)条件下进行的 Wi-Fi 测试中,我们测得的续航时间略低于 6 小时,而在全亮度条件下,我们测得的续航时间为 4.5 小时。
Notebookcheck 总体评分
Schenker XMG Focus 17 M25
- 08/04/2025 v8
Andreas Osthoff
 Total Sustainability Score:
 可能的替代品比较
Transparency
The selection of devices to be reviewed is made by our editorial team. The test sample was provided to the author as a loan by the manufacturer or retailer for the purpose of this review. The lender had no influence on this review, nor did the manufacturer receive a copy of this review before publication. There was no obligation to publish this review. As an independent media company, Notebookcheck is not subjected to the authority of manufacturers, retailers or publishers.
This is how Notebookcheck is testing
Every year, Notebookcheck independently reviews hundreds of laptops and smartphones using standardized procedures to ensure that all results are comparable. We have continuously developed our test methods for around 20 years and set industry standards in the process. In our test labs, high-quality measuring equipment is utilized by experienced technicians and editors. These tests involve a multi-stage validation process. Our complex rating system is based on hundreds of well-founded measurements and benchmarks, which maintains objectivity. Further information on our test methods can be found here.

