Apple MacBook Air 13 2017 笔记本电脑 (1.8 GHz) 简短评测
| SD Card Reader | |
| average JPG Copy Test (av. of 3 runs) | |
| Dell XPS 13 9360 FHD i5 | |
| Apple MacBook Air 13.3" 1.8 GHz (2017) | |
| Asus Zenbook UX310UA-FC347T iGP | |
| maximum AS SSD Seq Read Test (1GB) | |
| Dell XPS 13 9360 FHD i5 | |
| Apple MacBook Air 13.3" 1.8 GHz (2017) | |
| Asus Zenbook UX310UA-FC347T iGP | |
| |||||||||||||||||||||||||
Brightness Distribution: 82 %
Center on Battery: 327 cd/m²
Contrast: 812:1 (Black: 0.405 cd/m²)
ΔE ColorChecker Calman: 3.96 | ∀{0.5-29.43 Ø4.71}
ΔE Greyscale Calman: 3.51 | ∀{0.09-98 Ø4.96}
59.8% sRGB (Argyll 1.6.3 3D)
38.4% AdobeRGB 1998 (Argyll 1.6.3 3D)
41.51% AdobeRGB 1998 (Argyll 3D)
59.8% sRGB (Argyll 3D)
40.1% Display P3 (Argyll 3D)
Gamma: 3.83
CCT: 6711 K
| Apple MacBook Air 13.3" 1.8 GHz (2017) 1440x900, 13.3" | Apple MacBook Air 13 inch 2015-03 Apple APP9CF0, , 1440x900, 13.3" | Apple MacBook 12 (Early 2016) 1.1 GHz APPA027, , 2304x1440, 12" | Apple MacBook Pro 13 2016 (2.9 GHz) APPA033, , 2560x1600, 13.3" | Dell XPS 13 9360 FHD i5 Sharp SHP1449 LQ133M1, , 1920x1080, 13.3" | Dell XPS 13 9360 QHD+ i7 Sharp SHP144A, , 3200x1800, 13.3" | |
|---|---|---|---|---|---|---|
| Display | ||||||
| Display P3 Coverage (%) | 40.1 | 66.8 | 99.2 | 48.94 | 62.8 | |
| sRGB Coverage (%) | 59.8 | 95.4 | 99.9 | 73.3 | 89.4 | |
| AdobeRGB 1998 Coverage (%) | 41.51 | 68 | 87.6 | 50.5 | 64.6 | |
| Response Times | 7% | -39% | 10% | 7% | ||
| Response Time Grey 50% / Grey 80% * (ms) | 52.4 ? | 41.2 ? 21% | 47.2 ? 10% | 32.8 ? 37% | 43.6 ? 17% | |
| Response Time Black / White * (ms) | 28.4 ? | 30.4 ? -7% | 53 ? -87% | 33.2 ? -17% | 29.2 ? -3% | |
| PWM Frequency (Hz) | 58000 | |||||
| Screen | ||||||
| Brightness middle (cd/m²) | 329 | 387 | 569 | 351.2 | 396.2 | |
| Black Level * (cd/m²) | 0.405 | 0.47 | 0.56 | 0.195 | 0.266 | |
| Brightness (cd/m²) | 310 | 358 | 542 | 325 | 357 | |
| Brightness Distribution (%) | 82 | 88 | 90 | 89 | 84 | |
| Contrast (:1) | 812 | 823 | 1016 | 1801 | 1489 | |
| Colorchecker dE 2000 * | 3.96 | 1.6 | 1.4 | 7.4 | 3.9 | |
| Colorchecker dE 2000 max. * | 7.51 | 4 | 2.9 | 9.08 | 7.58 | |
| Greyscale dE 2000 * | 3.51 | 1 | 1.8 | 6.71 | 4.16 | |
| Gamma | 3.83 57% | 2.26 97% | 2.16 102% | 2.74 80% | 2.31 95% | |
| CCT | 6711 97% | 6680 97% | 6877 95% | 7222 90% | 6514 100% | |
| Color Space (Percent of AdobeRGB 1998) (%) | 38.4 | 61.6 | 78.4 | 50.48 | 57.5 | |
| Color Space (Percent of sRGB) (%) | 59.8 | 82.2 | 99.3 | 73.31 | 88.7 | |
| Total Average (Program / Settings) | 7% /
7% | -39% /
-39% | 10% /
10% | 7% /
7% |
* ... smaller is better
Display Response Times
| ↔ Response Time Black to White | ||
|---|---|---|
| 28.4 ms ... rise ↗ and fall ↘ combined | ↗ 18.4 ms rise | 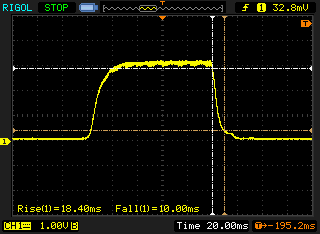 |
| ↘ 10 ms fall | ||
| The screen shows relatively slow response rates in our tests and may be too slow for gamers. In comparison, all tested devices range from 0.1 (minimum) to 240 (maximum) ms. » 75 % of all devices are better. This means that the measured response time is worse than the average of all tested devices (19.8 ms). | ||
| ↔ Response Time 50% Grey to 80% Grey | ||
| 52.4 ms ... rise ↗ and fall ↘ combined | ↗ 30.4 ms rise | 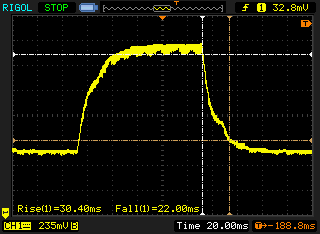 |
| ↘ 22 ms fall | ||
| The screen shows slow response rates in our tests and will be unsatisfactory for gamers. In comparison, all tested devices range from 0.165 (minimum) to 636 (maximum) ms. » 89 % of all devices are better. This means that the measured response time is worse than the average of all tested devices (31 ms). | ||
Screen Flickering / PWM (Pulse-Width Modulation)
| Screen flickering / PWM detected | 58000 Hz | 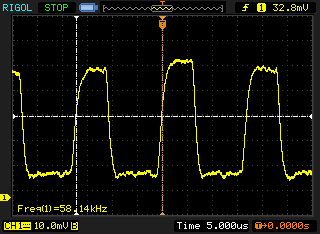 | |
The display backlight flickers at 58000 Hz (worst case, e.g., utilizing PWM) . The frequency of 58000 Hz is quite high, so most users sensitive to PWM should not notice any flickering. In comparison: 52 % of all tested devices do not use PWM to dim the display. If PWM was detected, an average of 7754 (minimum: 5 - maximum: 343500) Hz was measured. | |||
| Cinebench R15 | |
| CPU Single 64Bit | |
| Asus Zenbook UX310UA-FC347T iGP | |
| Apple MacBook Pro 13 2016 (2.9 GHz) | |
| Dell Inspiron 13 5378-0K46 | |
| Apple MacBook Air 13.3" 1.8 GHz (2017) | |
| Apple MacBook Air 13 inch 2015-03 | |
| Apple MacBook 12 (Early 2016) 1.3 GHz | |
| CPU Multi 64Bit | |
| Asus Zenbook UX310UA-FC347T iGP | |
| Apple MacBook Pro 13 2016 (2.9 GHz) | |
| Dell Inspiron 13 5378-0K46 | |
| Apple MacBook Air 13 inch 2015-03 | |
| Apple MacBook Air 13.3" 1.8 GHz (2017) | |
| Apple MacBook 12 (Early 2016) 1.3 GHz | |
| PCMark 8 | |
| Home Score Accelerated v2 | |
| Apple MacBook Pro 15 2017 (2.8 GHz, 555) | |
| Apple MacBook Air 13 inch 2015-03 | |
| Apple MacBook Air 13.3" 1.8 GHz (2017) | |
| Apple MacBook 12 2017 | |
| Work Score Accelerated v2 | |
| Apple MacBook Pro 15 2017 (2.8 GHz, 555) | |
| Apple MacBook Air 13.3" 1.8 GHz (2017) | |
| Apple MacBook Air 13 inch 2015-03 | |
| Apple MacBook 12 2017 | |
| PCMark 8 Home Score Accelerated v2 | 3396 points | |
| PCMark 8 Creative Score Accelerated v2 | 4264 points | |
| PCMark 8 Work Score Accelerated v2 | 4371 points | |
| PCMark 10 Score | 2523 points | |
Help | ||
| Apple MacBook Air 13.3" 1.8 GHz (2017) Apple SSD SM0128G | Apple MacBook Pro 13 2017 Touchbar i5 Apple SSD AP0256 | Apple MacBook Pro 15 2017 (2.8 GHz, 555) Apple SSD SM0256L | Apple MacBook 12 2017 Apple SSD AP0256 | Dell XPS 13 9360 FHD i7 Iris Toshiba XG4 NVMe (THNSN5512GPUK) | Asus Zenbook UX3430UQ-GV012T SanDisk SD8SN8U512G1002 | |
|---|---|---|---|---|---|---|
| CrystalDiskMark 3.0 | 19% | 35% | -5% | 73% | -3% | |
| Read Seq (MB/s) | 1390 | 1540 11% | 1557 12% | 955 -31% | 1314 -5% | 500 -64% |
| Write Seq (MB/s) | 731 | 1353 85% | 1505 106% | 899 23% | 617 -16% | 457.4 -37% |
| Read 512 (MB/s) | 899 | 926 3% | 968 8% | 658 -27% | 1058 18% | 345.6 -62% |
| Write 512 (MB/s) | 715 | 698 -2% | 1124 57% | 579 -19% | 502 -30% | 415 -42% |
| Read 4k (MB/s) | 16.29 | 9.92 -39% | 10.76 -34% | 9.721 -40% | 37.31 129% | 28.34 74% |
| Write 4k (MB/s) | 27.17 | 10.74 -60% | 12.87 -53% | 12.78 -53% | 133.6 392% | 56.8 109% |
| Read 4k QD32 (MB/s) | 300.9 | 618 105% | 631 110% | 521 73% | 425.1 41% | 311.3 3% |
| Write 4k QD32 (MB/s) | 273.7 | 403.8 48% | 468.4 71% | 370.1 35% | 431.3 58% | 251.1 -8% |

| 3DMark 11 - 1280x720 Performance GPU | |
| Apple MacBook Pro 15 2017 (2.8 GHz, 555) | |
| Apple MacBook Pro 13 2017 Touchbar i5 | |
| Dell XPS 13 9360 FHD i7 Iris | |
| Dell XPS 13 9360 FHD i5 | |
| Apple MacBook Air 13.3" 1.8 GHz (2017) | |
| Apple MacBook Air 13 inch 2015-03 | |
| Apple MacBook 12 2017 | |
| 3DMark | |
| 1280x720 Cloud Gate Standard Graphics | |
| Apple MacBook Pro 15 2017 (2.8 GHz, 555) | |
| Apple MacBook Pro 13 2017 Touchbar i5 | |
| Dell XPS 13 9360 FHD i7 Iris | |
| Dell XPS 13 9360 FHD i5 | |
| Apple MacBook Air 13.3" 1.8 GHz (2017) | |
| Apple MacBook Air 13 inch 2015-03 | |
| Apple MacBook 12 2017 | |
| 1920x1080 Fire Strike Graphics | |
| Apple MacBook Pro 15 2017 (2.8 GHz, 555) | |
| Apple MacBook Pro 13 2017 Touchbar i5 | |
| Dell XPS 13 9360 FHD i7 Iris | |
| Dell XPS 13 9360 FHD i5 | |
| Apple MacBook Air 13 inch 2015-03 | |
| 3DMark 11 Performance | 1591 points | |
| 3DMark Cloud Gate Standard Score | 5878 points | |
Help | ||
| BioShock Infinite | |
| 1280x720 Very Low Preset | |
| Apple MacBook Pro 13 2016 (2.9 GHz) | |
| Apple MacBook Pro 13 2017 Touchbar i5 | |
| Asus Zenbook UX310UA-FC347T iGP | |
| Dell XPS 13 9360 FHD i7 Iris | |
| Apple MacBook Air 13 inch 2015-03 | |
| Apple MacBook Air 13.3" 1.8 GHz (2017) | |
| Apple MacBook Air 13 inch 2013 MD760D/A | |
| Apple MacBook Air 11 inch 2013-06 1.7 GHz 256 GB | |
| 1366x768 Medium Preset | |
| Apple MacBook Pro 13 2016 (2.9 GHz) | |
| Apple MacBook Pro 13 2017 Touchbar i5 | |
| Dell XPS 13 9360 FHD i7 Iris | |
| Asus Zenbook UX310UA-FC347T iGP | |
| Apple MacBook Air 13 inch 2015-03 | |
| Apple MacBook Air 13.3" 1.8 GHz (2017) | |
| Apple MacBook Air 13 inch 2013 MD760D/A | |
| Apple MacBook Air 11 inch 2013-06 1.7 GHz 256 GB | |
| low | med. | high | ultra | |
|---|---|---|---|---|
| BioShock Infinite (2013) | 42.9 | 26.4 |
(±) The maximum temperature on the upper side is 42.8 °C / 109 F, compared to the average of 35.9 °C / 97 F, ranging from 21.4 to 59 °C for the class Subnotebook.
(±) The bottom heats up to a maximum of 41.5 °C / 107 F, compared to the average of 39.2 °C / 103 F
(+) In idle usage, the average temperature for the upper side is 26.3 °C / 79 F, compared to the device average of 30.8 °C / 87 F.
(+) The palmrests and touchpad are cooler than skin temperature with a maximum of 31.2 °C / 88.2 F and are therefore cool to the touch.
(-) The average temperature of the palmrest area of similar devices was 28.2 °C / 82.8 F (-3 °C / -5.4 F).
Apple MacBook Air 13.3" 1.8 GHz (2017) audio analysis
(±) | speaker loudness is average but good (77.7 dB)
Bass 100 - 315 Hz
(±) | reduced bass - on average 9.2% lower than median
(±) | linearity of bass is average (11% delta to prev. frequency)
Mids 400 - 2000 Hz
(+) | balanced mids - only 3.6% away from median
(±) | linearity of mids is average (9.7% delta to prev. frequency)
Highs 2 - 16 kHz
(±) | higher highs - on average 5.2% higher than median
(±) | linearity of highs is average (8.4% delta to prev. frequency)
Overall 100 - 16.000 Hz
(±) | linearity of overall sound is average (15.1% difference to median)
Compared to same class
» 33% of all tested devices in this class were better, 5% similar, 62% worse
» The best had a delta of 5%, average was 18%, worst was 53%
Compared to all devices tested
» 21% of all tested devices were better, 4% similar, 75% worse
» The best had a delta of 4%, average was 23%, worst was 134%
Apple MacBook 12 (Early 2016) 1.1 GHz audio analysis
(+) | speakers can play relatively loud (83.6 dB)
Bass 100 - 315 Hz
(±) | reduced bass - on average 11.3% lower than median
(±) | linearity of bass is average (14.2% delta to prev. frequency)
Mids 400 - 2000 Hz
(+) | balanced mids - only 2.4% away from median
(+) | mids are linear (5.5% delta to prev. frequency)
Highs 2 - 16 kHz
(+) | balanced highs - only 2% away from median
(+) | highs are linear (4.5% delta to prev. frequency)
Overall 100 - 16.000 Hz
(+) | overall sound is linear (10.2% difference to median)
Compared to same class
» 7% of all tested devices in this class were better, 2% similar, 90% worse
» The best had a delta of 5%, average was 18%, worst was 53%
Compared to all devices tested
» 5% of all tested devices were better, 1% similar, 94% worse
» The best had a delta of 4%, average was 23%, worst was 134%
| Off / Standby | |
| Idle | |
| Load |
|
Key:
min: | |
| Apple MacBook Air 13.3" 1.8 GHz (2017) 5350U, HD Graphics 6000, Apple SSD SM0128G, TN LED, 1440x900, 13.3" | Apple MacBook Pro 15 2017 (2.8 GHz, 555) i7-7700HQ, Radeon Pro 555, Apple SSD SM0256L, IPS, 2880x1800, 15.4" | Apple MacBook 12 (Early 2016) 1.1 GHz 6Y30, HD Graphics 515, Apple SSD AP0256, IPS, 2304x1440, 12" | Apple MacBook Air 13 inch 2015-03 5650U, HD Graphics 6000, Apple SSD SD0256F, TN LED, 1440x900, 13.3" | Apple MacBook 12 2017 m3-7Y32, HD Graphics 615, Apple SSD AP0256, LED IPS, 2304x1440, 12" | Apple MacBook 12 (Early 2016) 1.3 GHz 6Y75, HD Graphics 515, Apple SSD AP0256, IPS, 2304x1440, 12" | Apple MacBook Pro 13 2017 Touchbar i5 i5-7267U, Iris Plus Graphics 650, Apple SSD AP0256, IPS, 2560x1600, 13.3" | |
|---|---|---|---|---|---|---|---|
| Power Consumption | -100% | 32% | 12% | 29% | 36% | -45% | |
| Idle Minimum * (Watt) | 3.4 | 3.4 -0% | 2.7 21% | 2.7 21% | 2 41% | 2 41% | 2.8 18% |
| Idle Average * (Watt) | 6.3 | 13.9 -121% | 2.7 57% | 5.7 10% | 5.4 14% | 2.06 67% | 10.9 -73% |
| Idle Maximum * (Watt) | 7 | 17.6 -151% | 7.2 -3% | 6 14% | 6.6 6% | 6.94 1% | 11.4 -63% |
| Load Average * (Watt) | 34.5 | 71.1 -106% | 22 36% | 32.1 7% | 22 36% | 22.52 35% | 55.4 -61% |
| Load Maximum * (Watt) | 40 | 88.5 -121% | 20.5 49% | 36.2 9% | 20 50% | 24.87 38% | 57.5 -44% |
| Witcher 3 ultra * (Watt) | 57.9 |
* ... smaller is better
| Apple MacBook Air 13.3" 1.8 GHz (2017) 5350U, HD Graphics 6000, 54 Wh | Apple MacBook Pro 13 2017 Touchbar i5 i5-7267U, Iris Plus Graphics 650, 49.2 Wh | Apple MacBook 12 (Early 2016) 1.3 GHz 6Y75, HD Graphics 515, 41.4 Wh | Apple MacBook 12 2017 m3-7Y32, HD Graphics 615, 41.4 Wh | Apple MacBook Pro 13 2016 (2.9 GHz) 6267U, Iris Graphics 550, 49.2 Wh | Apple MacBook Air 13 inch 2015-03 5650U, HD Graphics 6000, 54 Wh | Apple MacBook Pro 15 2017 (2.8 GHz, 555) i7-7700HQ, Radeon Pro 555, 76 Wh | |
|---|---|---|---|---|---|---|---|
| Battery runtime | -18% | -13% | -15% | -11% | -3% | 1% | |
| WiFi v1.3 (h) | 10.6 | 8.7 -18% | 9.2 -13% | 9 -15% | 9.4 -11% | 10.3 -3% | 10.7 1% |
| H.264 (h) | 6.9 | 10.3 | 8.1 | 8.5 | |||
| Load (h) | 1.2 | 3.5 | 1.1 | 1.6 | 1 | ||
| Reader / Idle (h) | 26.2 | ||||||
| Witcher 3 ultra (h) | 1.5 |
Pros
Cons
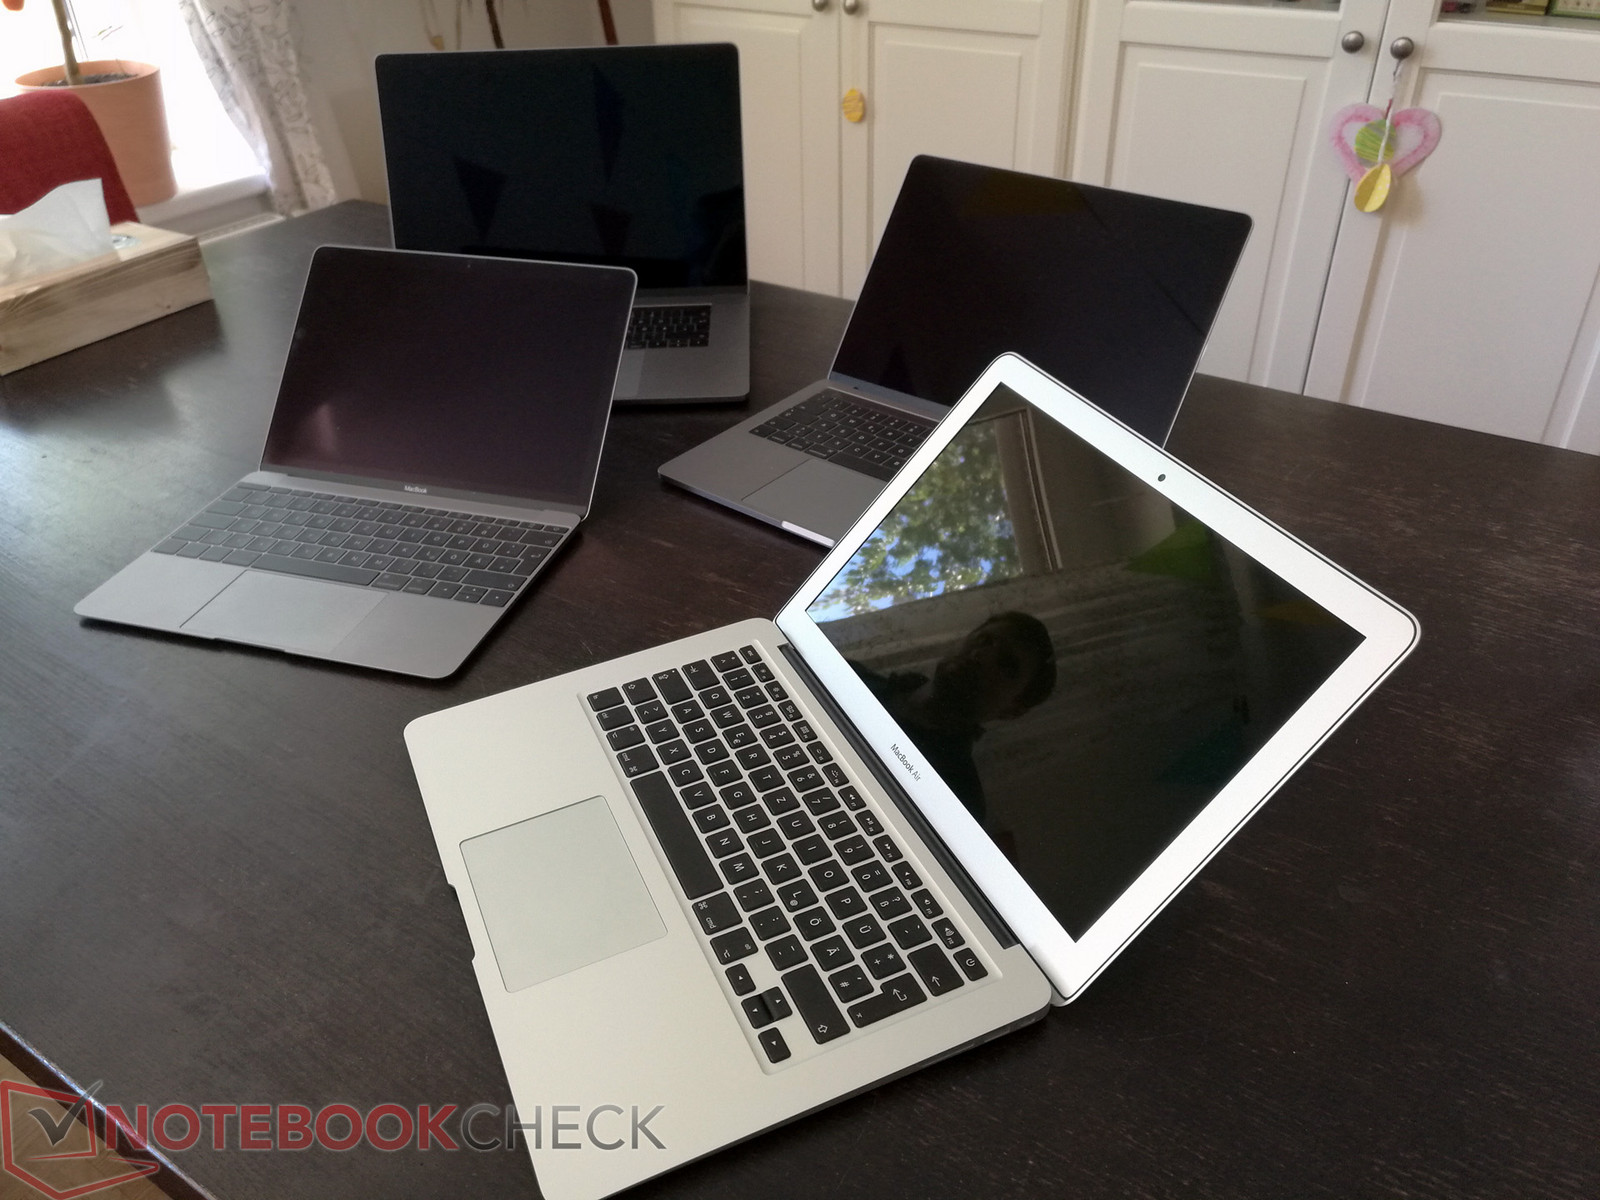
一年又一年,MacBook Air依然保持着不变的样貌。最近几年笔记本电脑设计的常见大幅改进,如更高的屏幕分辨率,更薄的屏幕边框,同尺寸机身搭配更大屏幕等等,都被Air视而不见。因此我们也并不吃惊它的更新并不像MacBook 12一样得到了聚光灯关注。很明显,MacBook Air不再是一台“拿得出手”的设备,也与目前的Apple产品线有些格格不入。
新MacBook Air 13的最大问题依然是屏幕。搭配低分辨率的TN屏幕,它给人一种明显过时的感受。在2017年,一台售价达到1000美元的笔记本电脑至少应该搭配全高清分辨率的IPS屏幕。它搭配128GB固态硬盘机型的999美元如果说性价比较低的话,那么搭配256GB硬盘机型贵出的200美元售价简直就是抢劫。
不论如何,在这么多年之后Air的基本理念仍然有其亮点。一个做工精良的高品质铝合金机身结合了不错的输入设备;优秀的无线模组速度;对于日常使用来说十分优秀的整体性能;超过10小时的续航时间;同时在运行中异常安静。甚至是在2017年做到所有这些方面仍然值得赞扬。
时间一年一年飞逝而过,Air的性价比也显得越来越低。不过考虑到各个方面,MacBook Air 13 2017依然是一款很不错的笔记本电脑。如果相比Windows你更喜欢MacOS的话,它是进入Apple世界的最低价门票。同时MacBook Air也不太可能在接下来的2018年再次得到更新,Apple已经给我们带来了不少的惊喜…
注:本文是基于完整评测的缩减版本,阅读完整的英文评测,请点击这里。
Apple MacBook Air 13.3" 1.8 GHz (2017)
- 06/20/2017 v6 (old)
J. Simon Leitner
Price comparison
