结论功能强大的联想ThinkPad主力机型,但也有不足之处
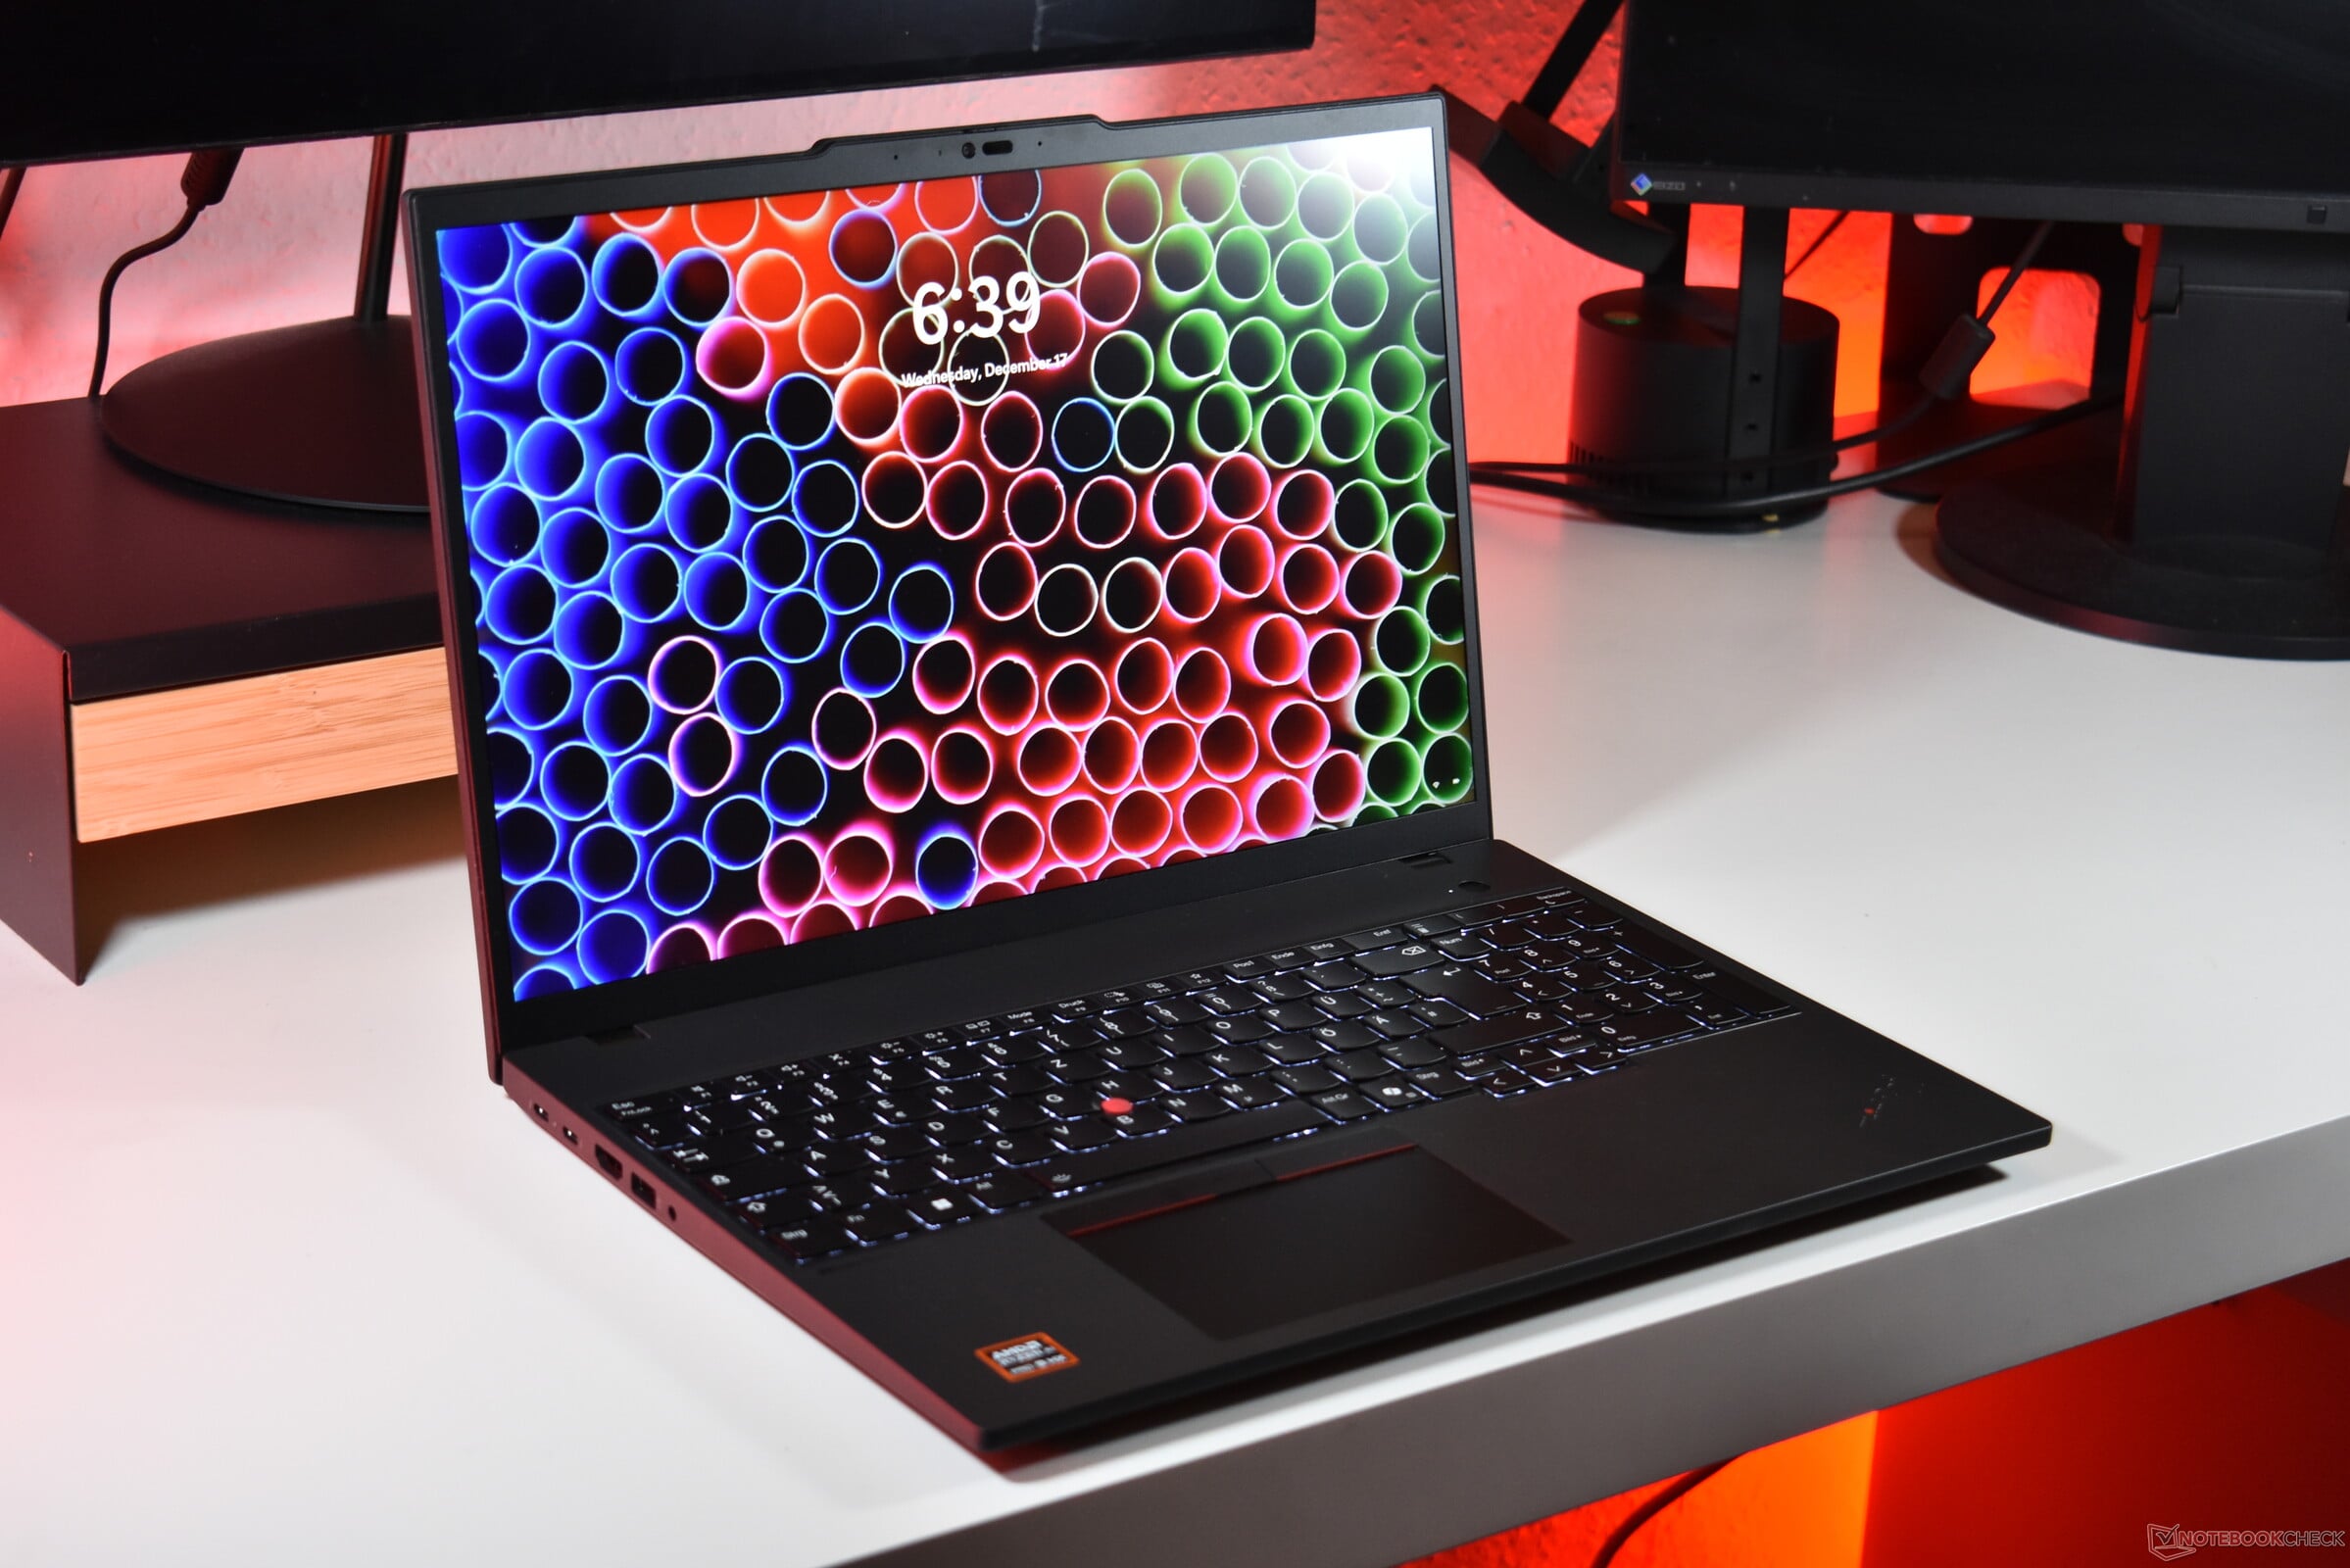
联想 ThinkPad P16s Gen 4 AMD 是联想 16 英寸屏幕笔记本电脑中功能最强大的一款,因为它是唯一一款配备 AMD Ryzen AI 9 HX CPU 的笔记本电脑。单凭这一点,就能让那些正在寻找基于红队 CPU 的大型工作主力的人对它产生兴趣。它有很多优点,如出色的键盘、可升级性、明亮的屏幕和强大的 CPU,以及良好的电池续航能力和可选的 5G LTE。仅从这些特点来看,联想笔记本电脑已经可以成为一个很好的推荐。
当然,它并不完美,也有一些明显的缺点。首先,该设备的噪音确实比较大,而且运行时温度很高。此外,对于工作站来说,GPU 性能较弱,这意味着该设备大多只能用于 CPU 或 RAM 较重的任务。最后,扬声器也不是最好的。另外,OLED 屏幕仅限于 Ryzen 5 和 Ryzen 7 配置,没有分辨率更高的 IPS 面板。如果你愿意接受这些妥协,ThinkPad P16s G4 AMD 仍不失为一款出色的工作笔记本电脑。
Pros
Cons
价格和供应情况
截至本次评测,联想 ThinkPad P16s 第 4 代 AMD 起价约为 1,250 美元。在联想网站上,配备 AMD Ryzen AI 9 Pro HX 370 的版本售价为 1,800 美元。
Table of Contents
2015 年推出时,联想 联想 ThinkPad W550s作为联想产品线中首款超极本类型的工作站,创造了一个永恒的传奇。十年后,W 系列变成了 P 系列,而 W550s 的最新继任者就是联想 ThinkPad P16s Gen 4。我们在此评测的是 AMD 版,其设计与 ThinkPad T16 Gen 4 - 英特尔版本的 P16s 使用的是不同的平台,因此尽管名称相同,但两者并不具有可比性。
联想 ThinkPad P16s G4 是少数配备 AMD Ryzen 9 HX CPU 的联想笔记本电脑之一,这无疑有助于该机型脱颖而出。
规格16 英寸 ThinkPad 中的 Ryzen AI 9 Pro HX 370
案例:ThinkPad P16s 第 4 代 AMD 带来经典 ThinkPad 风格
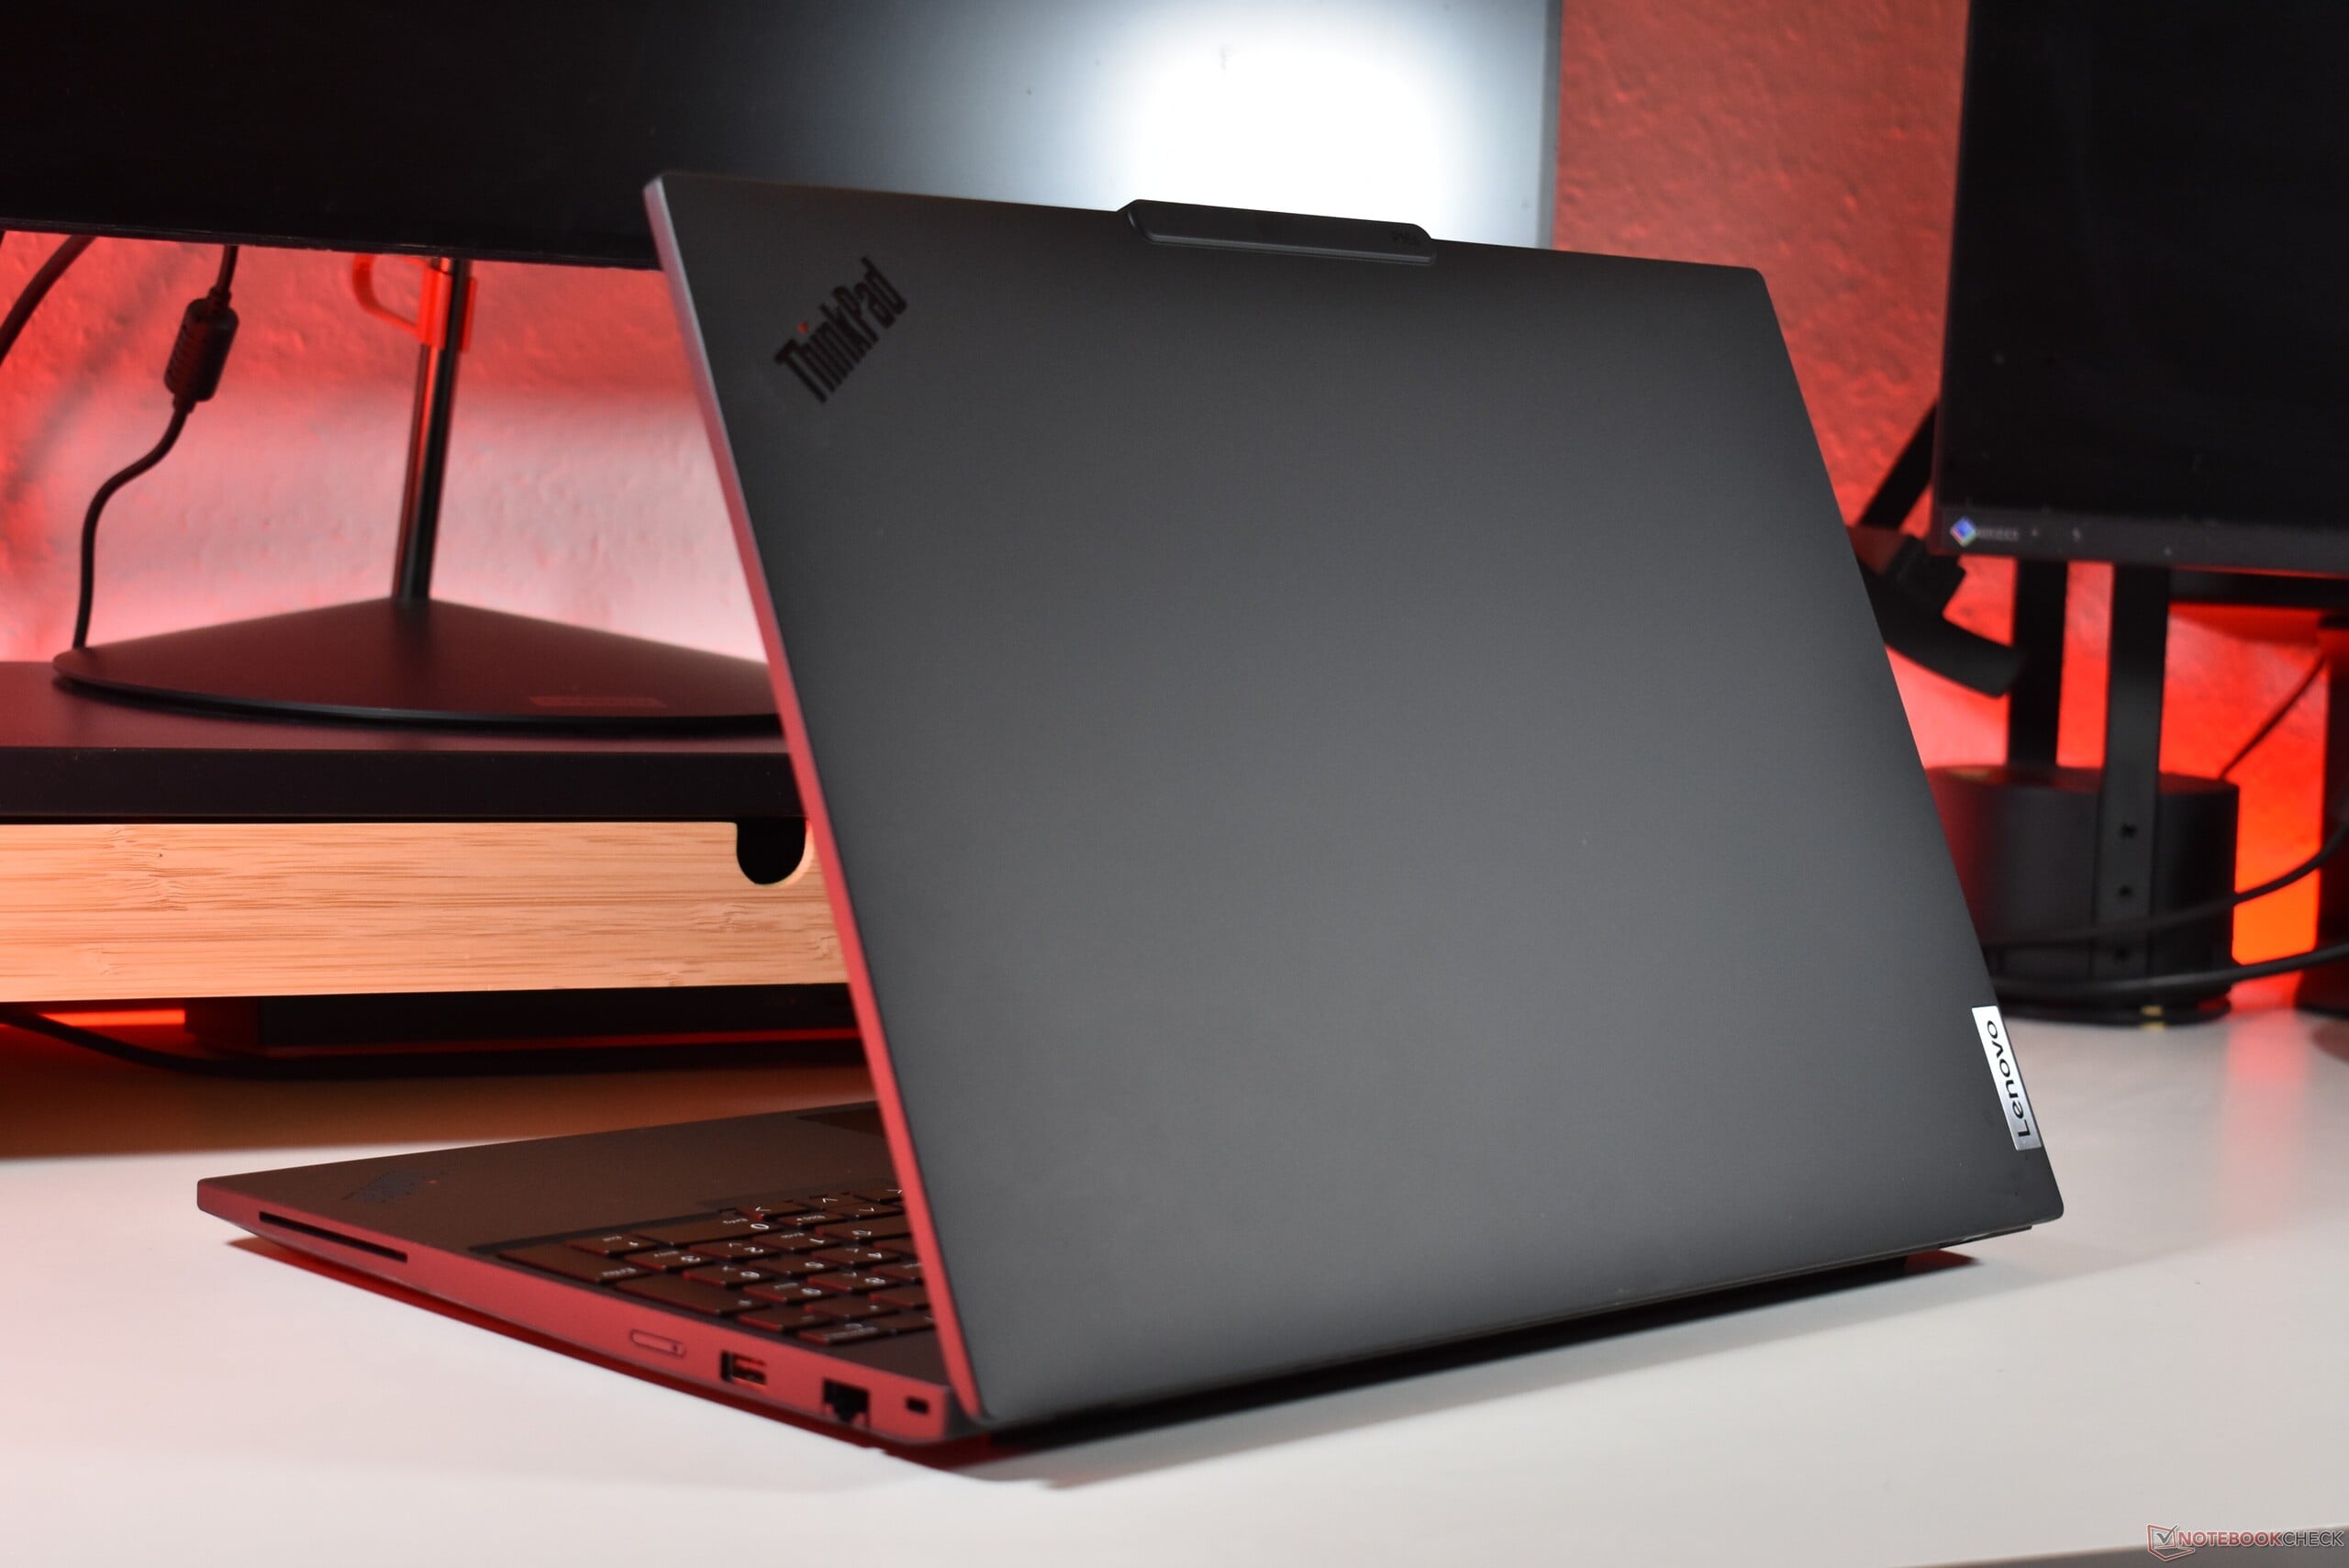
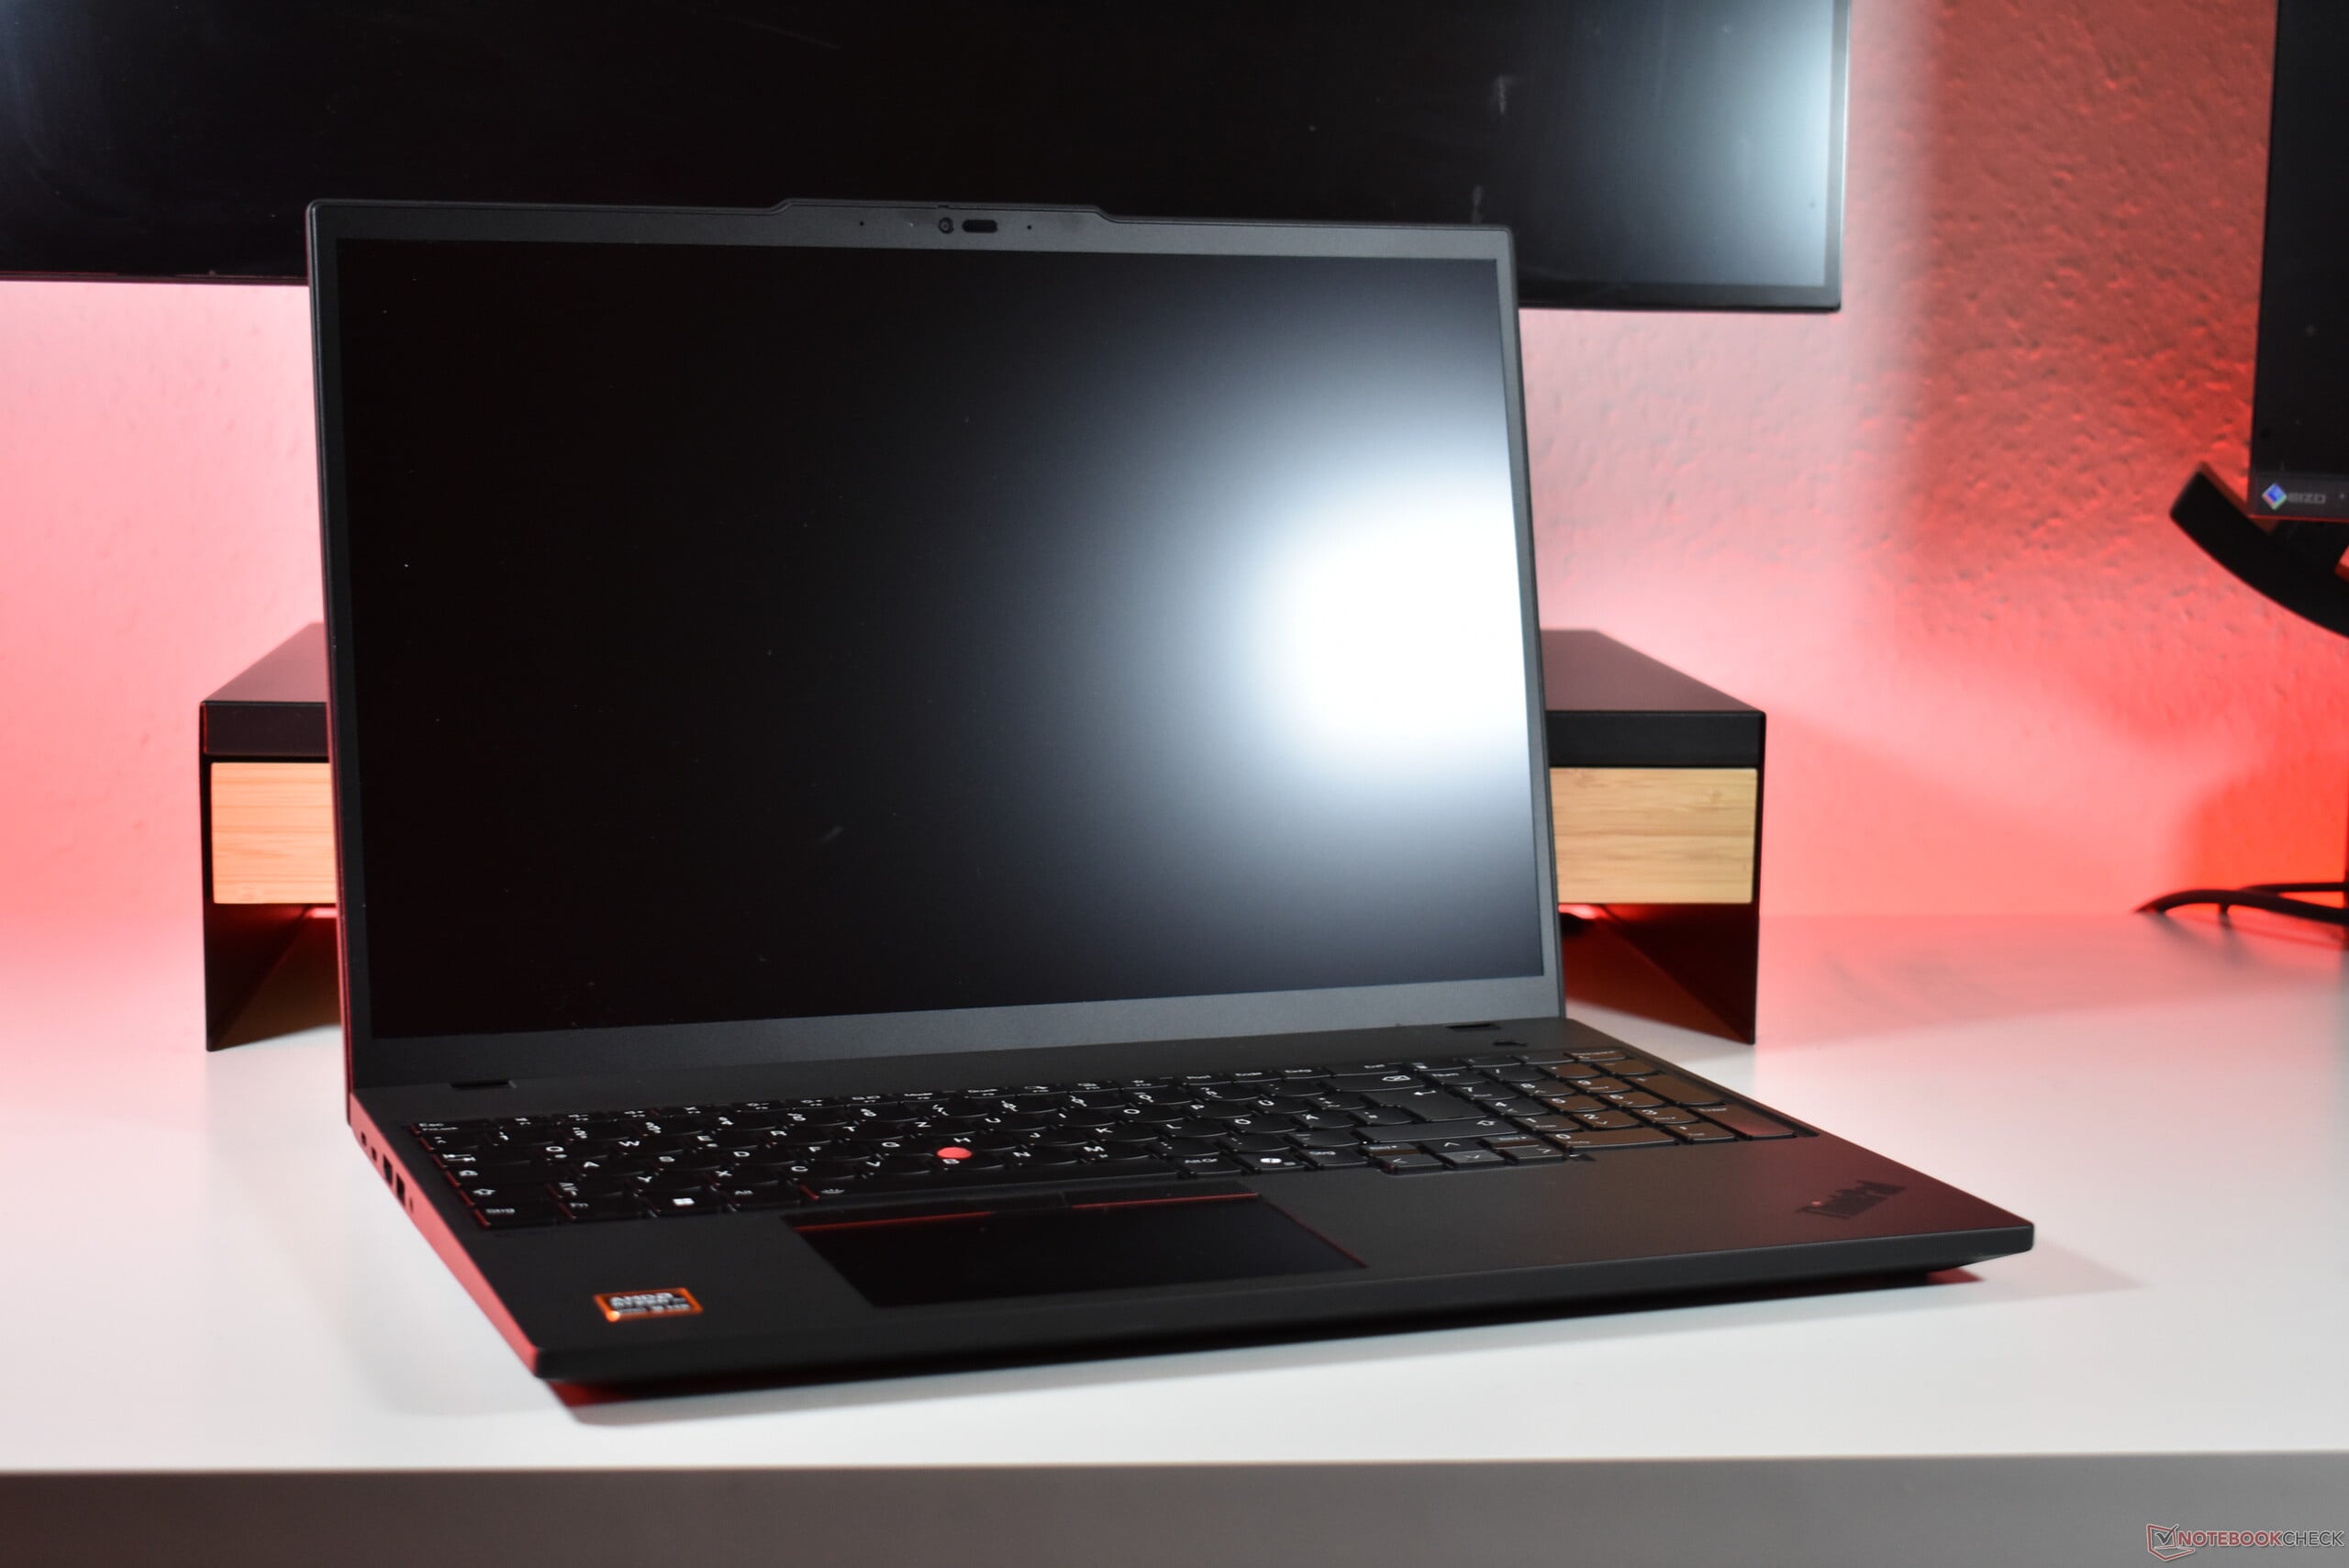
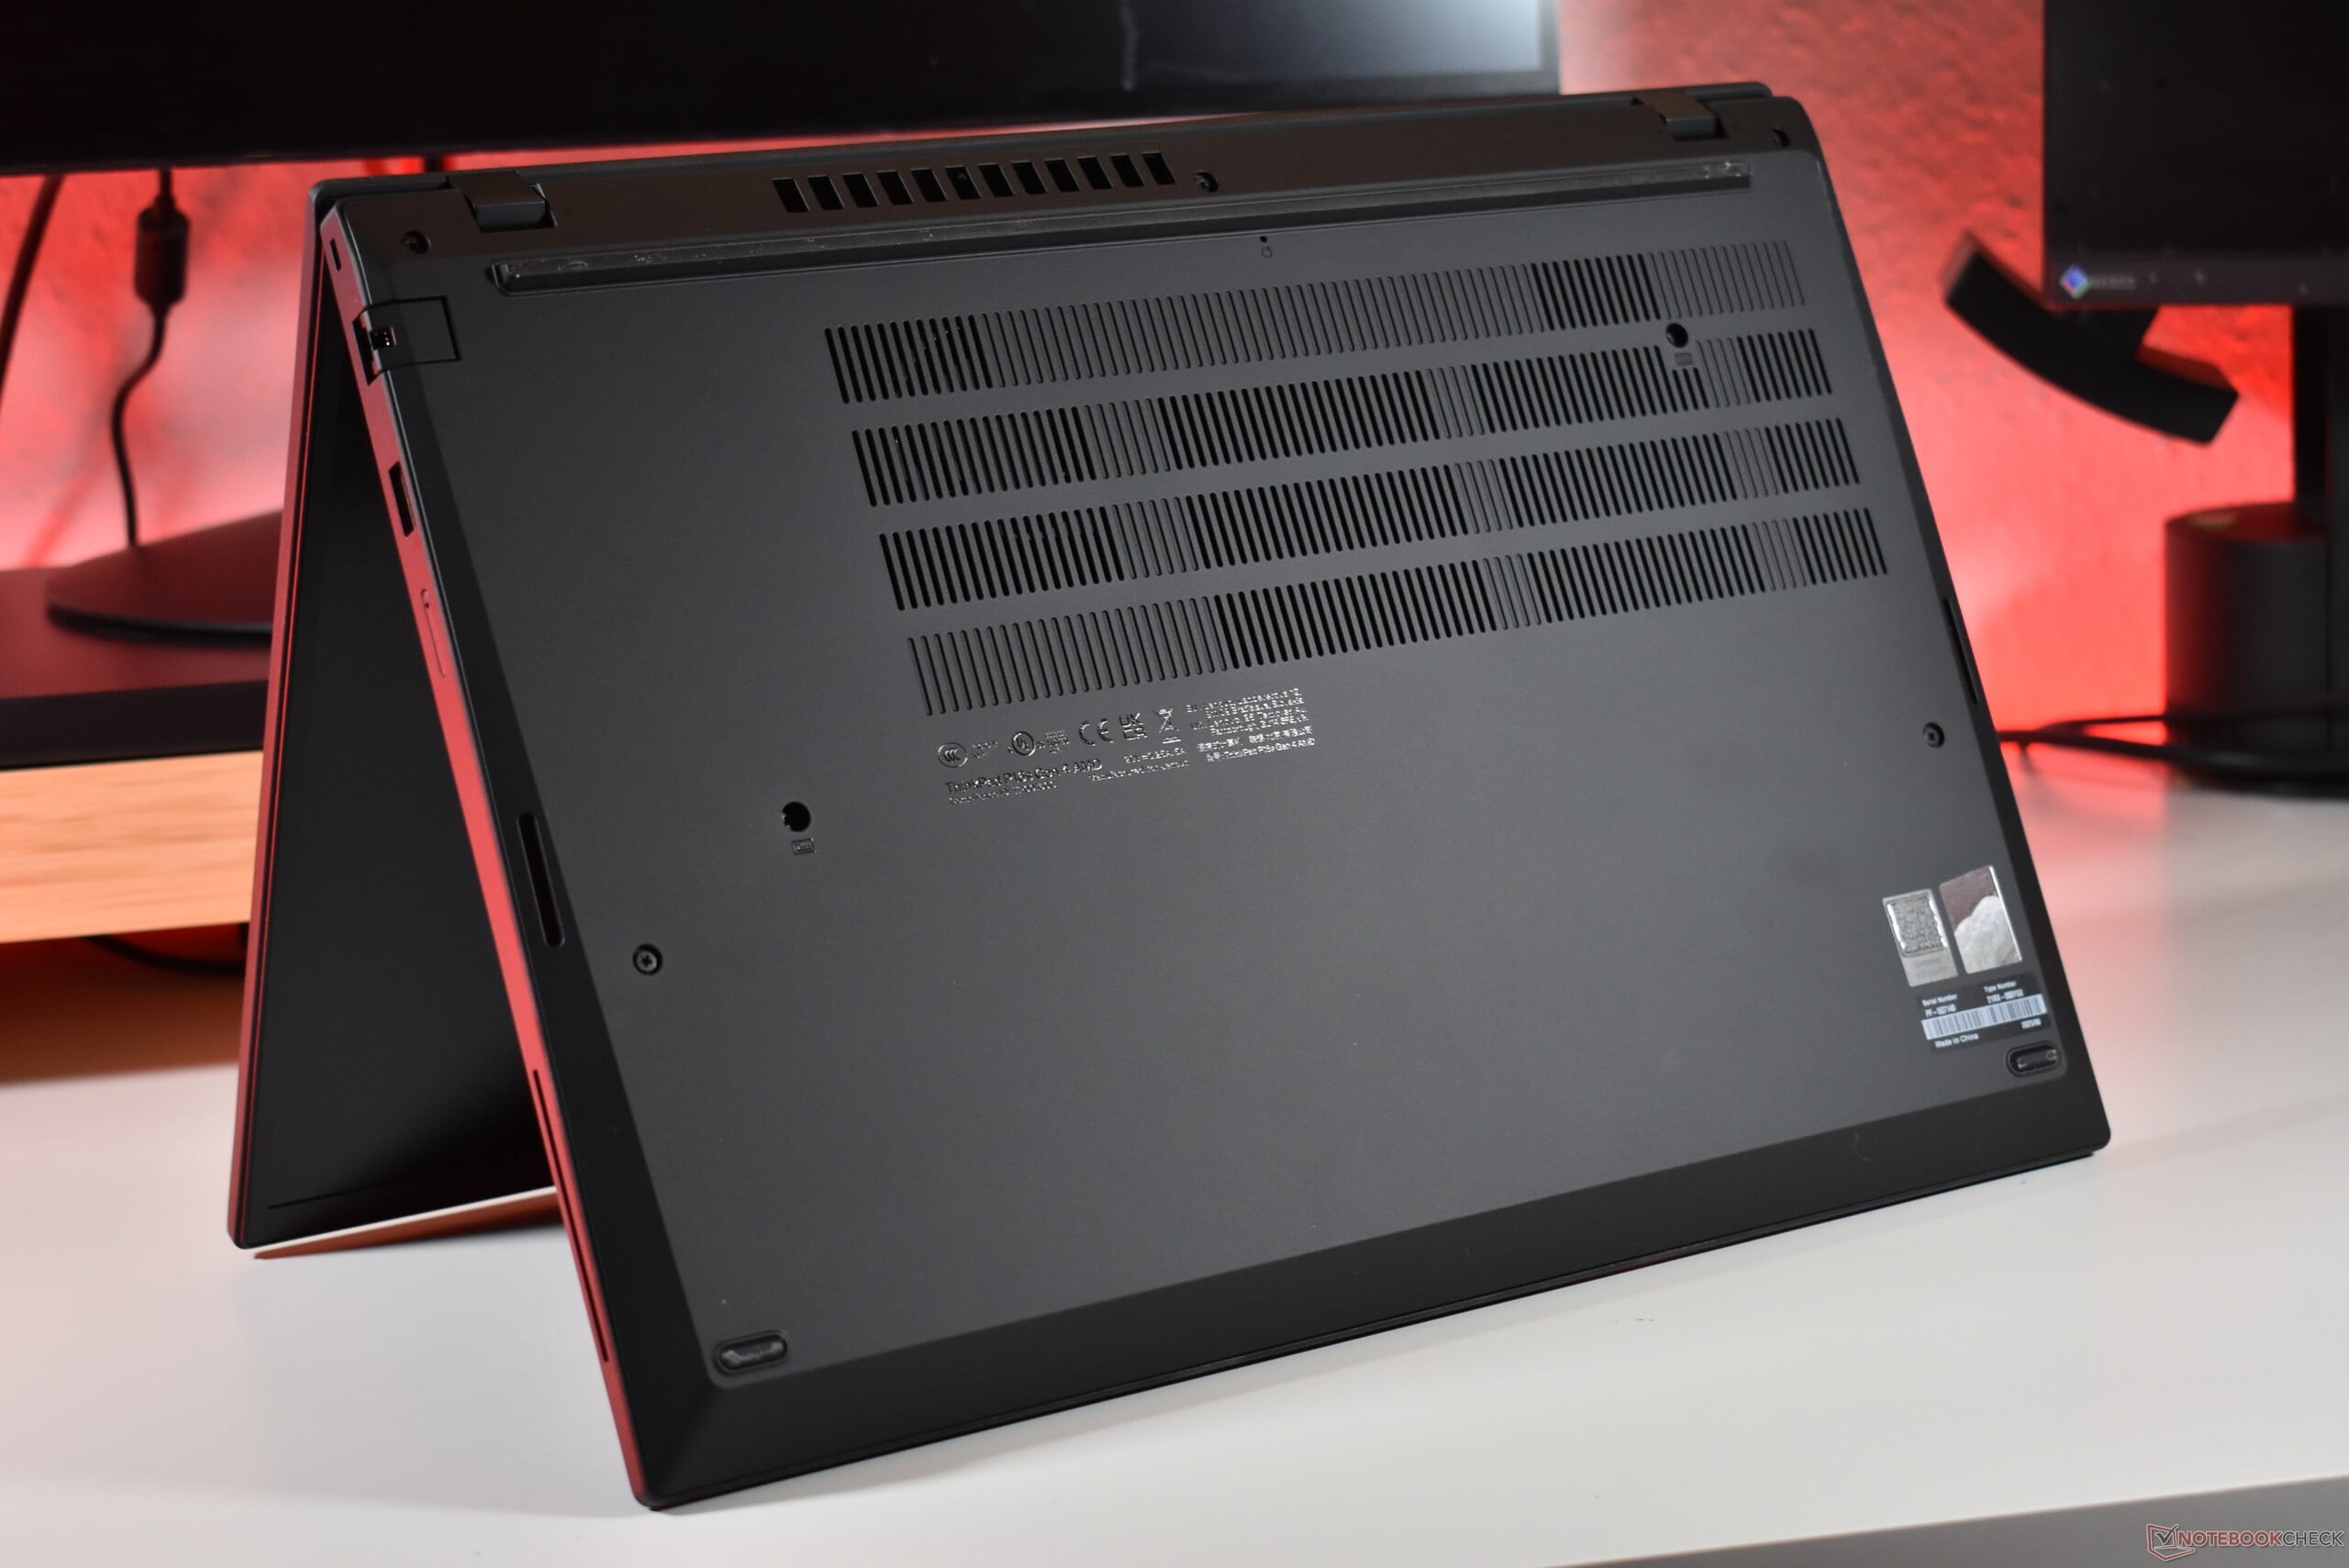
英特尔 P16s G4 主要采用铝合金打造,而联想 ThinkPad P16s G4 AMD 则押宝于 ThinkPad 的经典材质:塑料、镁合金和黑色软触涂层。它的结构坚固,没有任何巨大的弱点,铰链稳定,可 180 度打开,单手即可打开。该机并没有太多的视觉亮点,红色的设计元素以及盖子上银色的联想徽标和黑色亮面的 ThinkPad 徽标是黑色海洋中唯一的亮点。总的来说,这是一款不会让人眼前一亮,但却散发着严肃气息的设备。

我们选择进行比较的 16 英寸工作站在尺寸和重量上都差不多。值得注意的是,P16s 第 4 代 AMD 比 ThinkPad P16s 第 2 代 AMD 重约 200 克。 ThinkPad P16s 第 2 代 AMD.
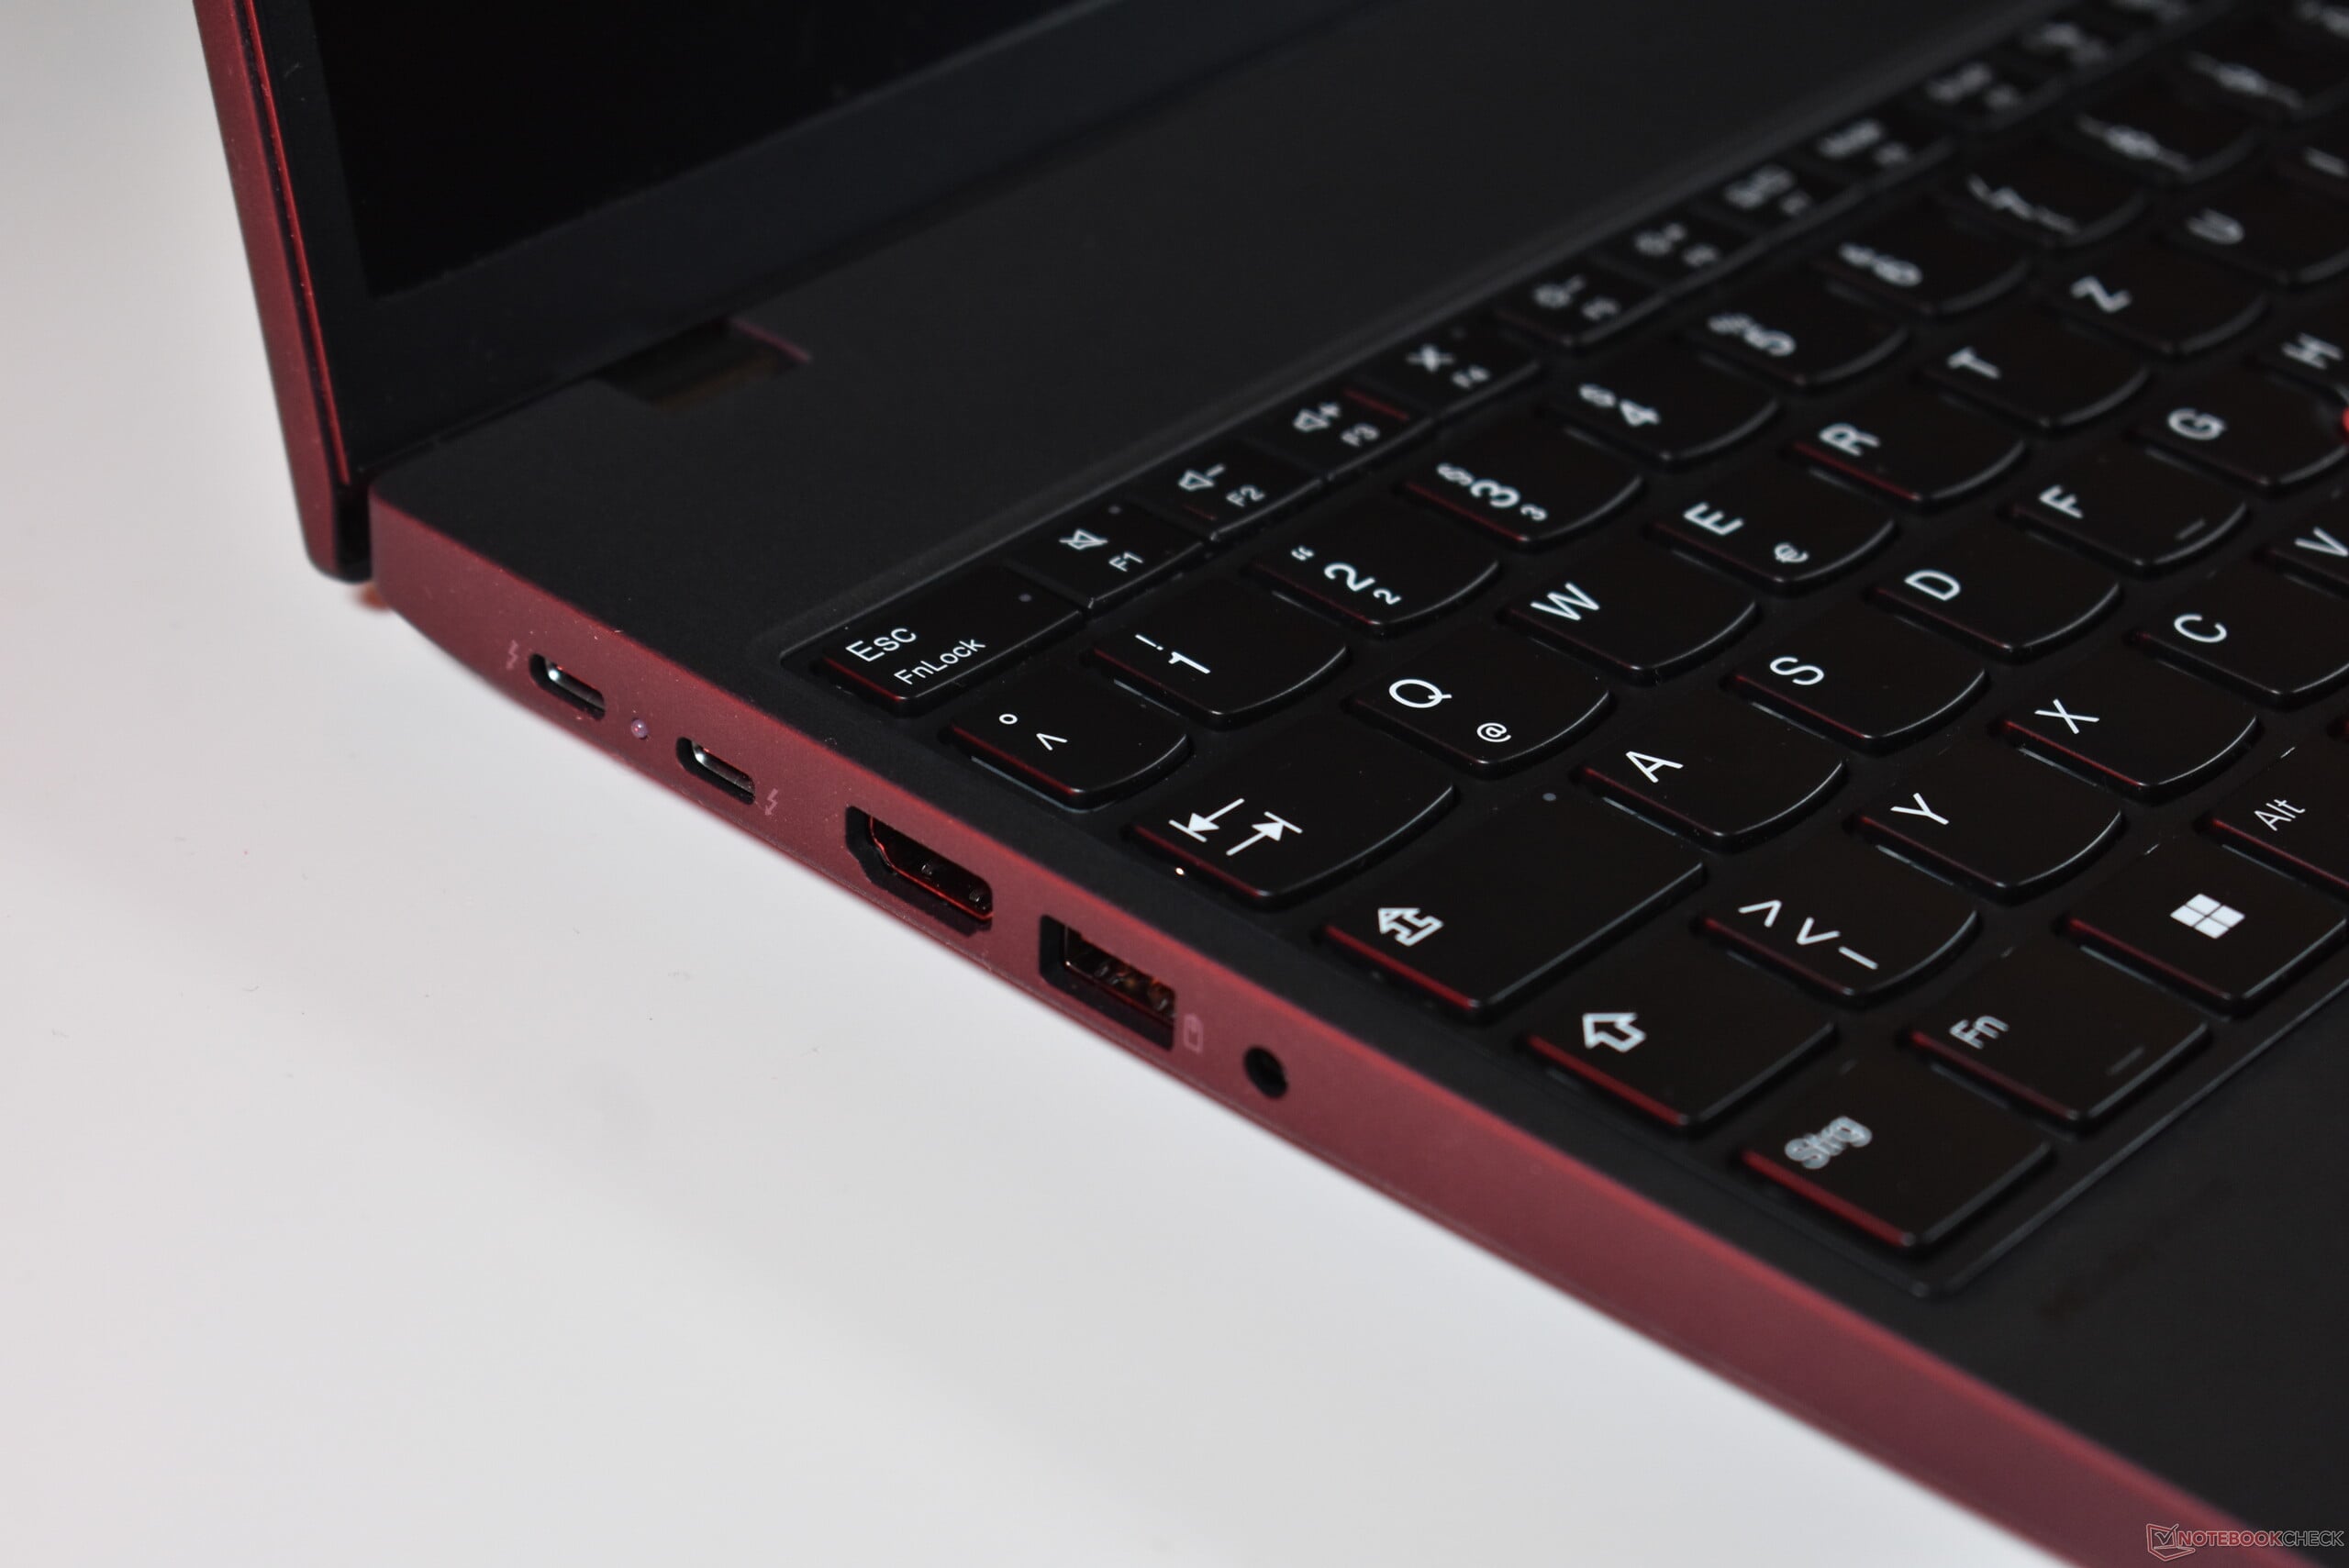
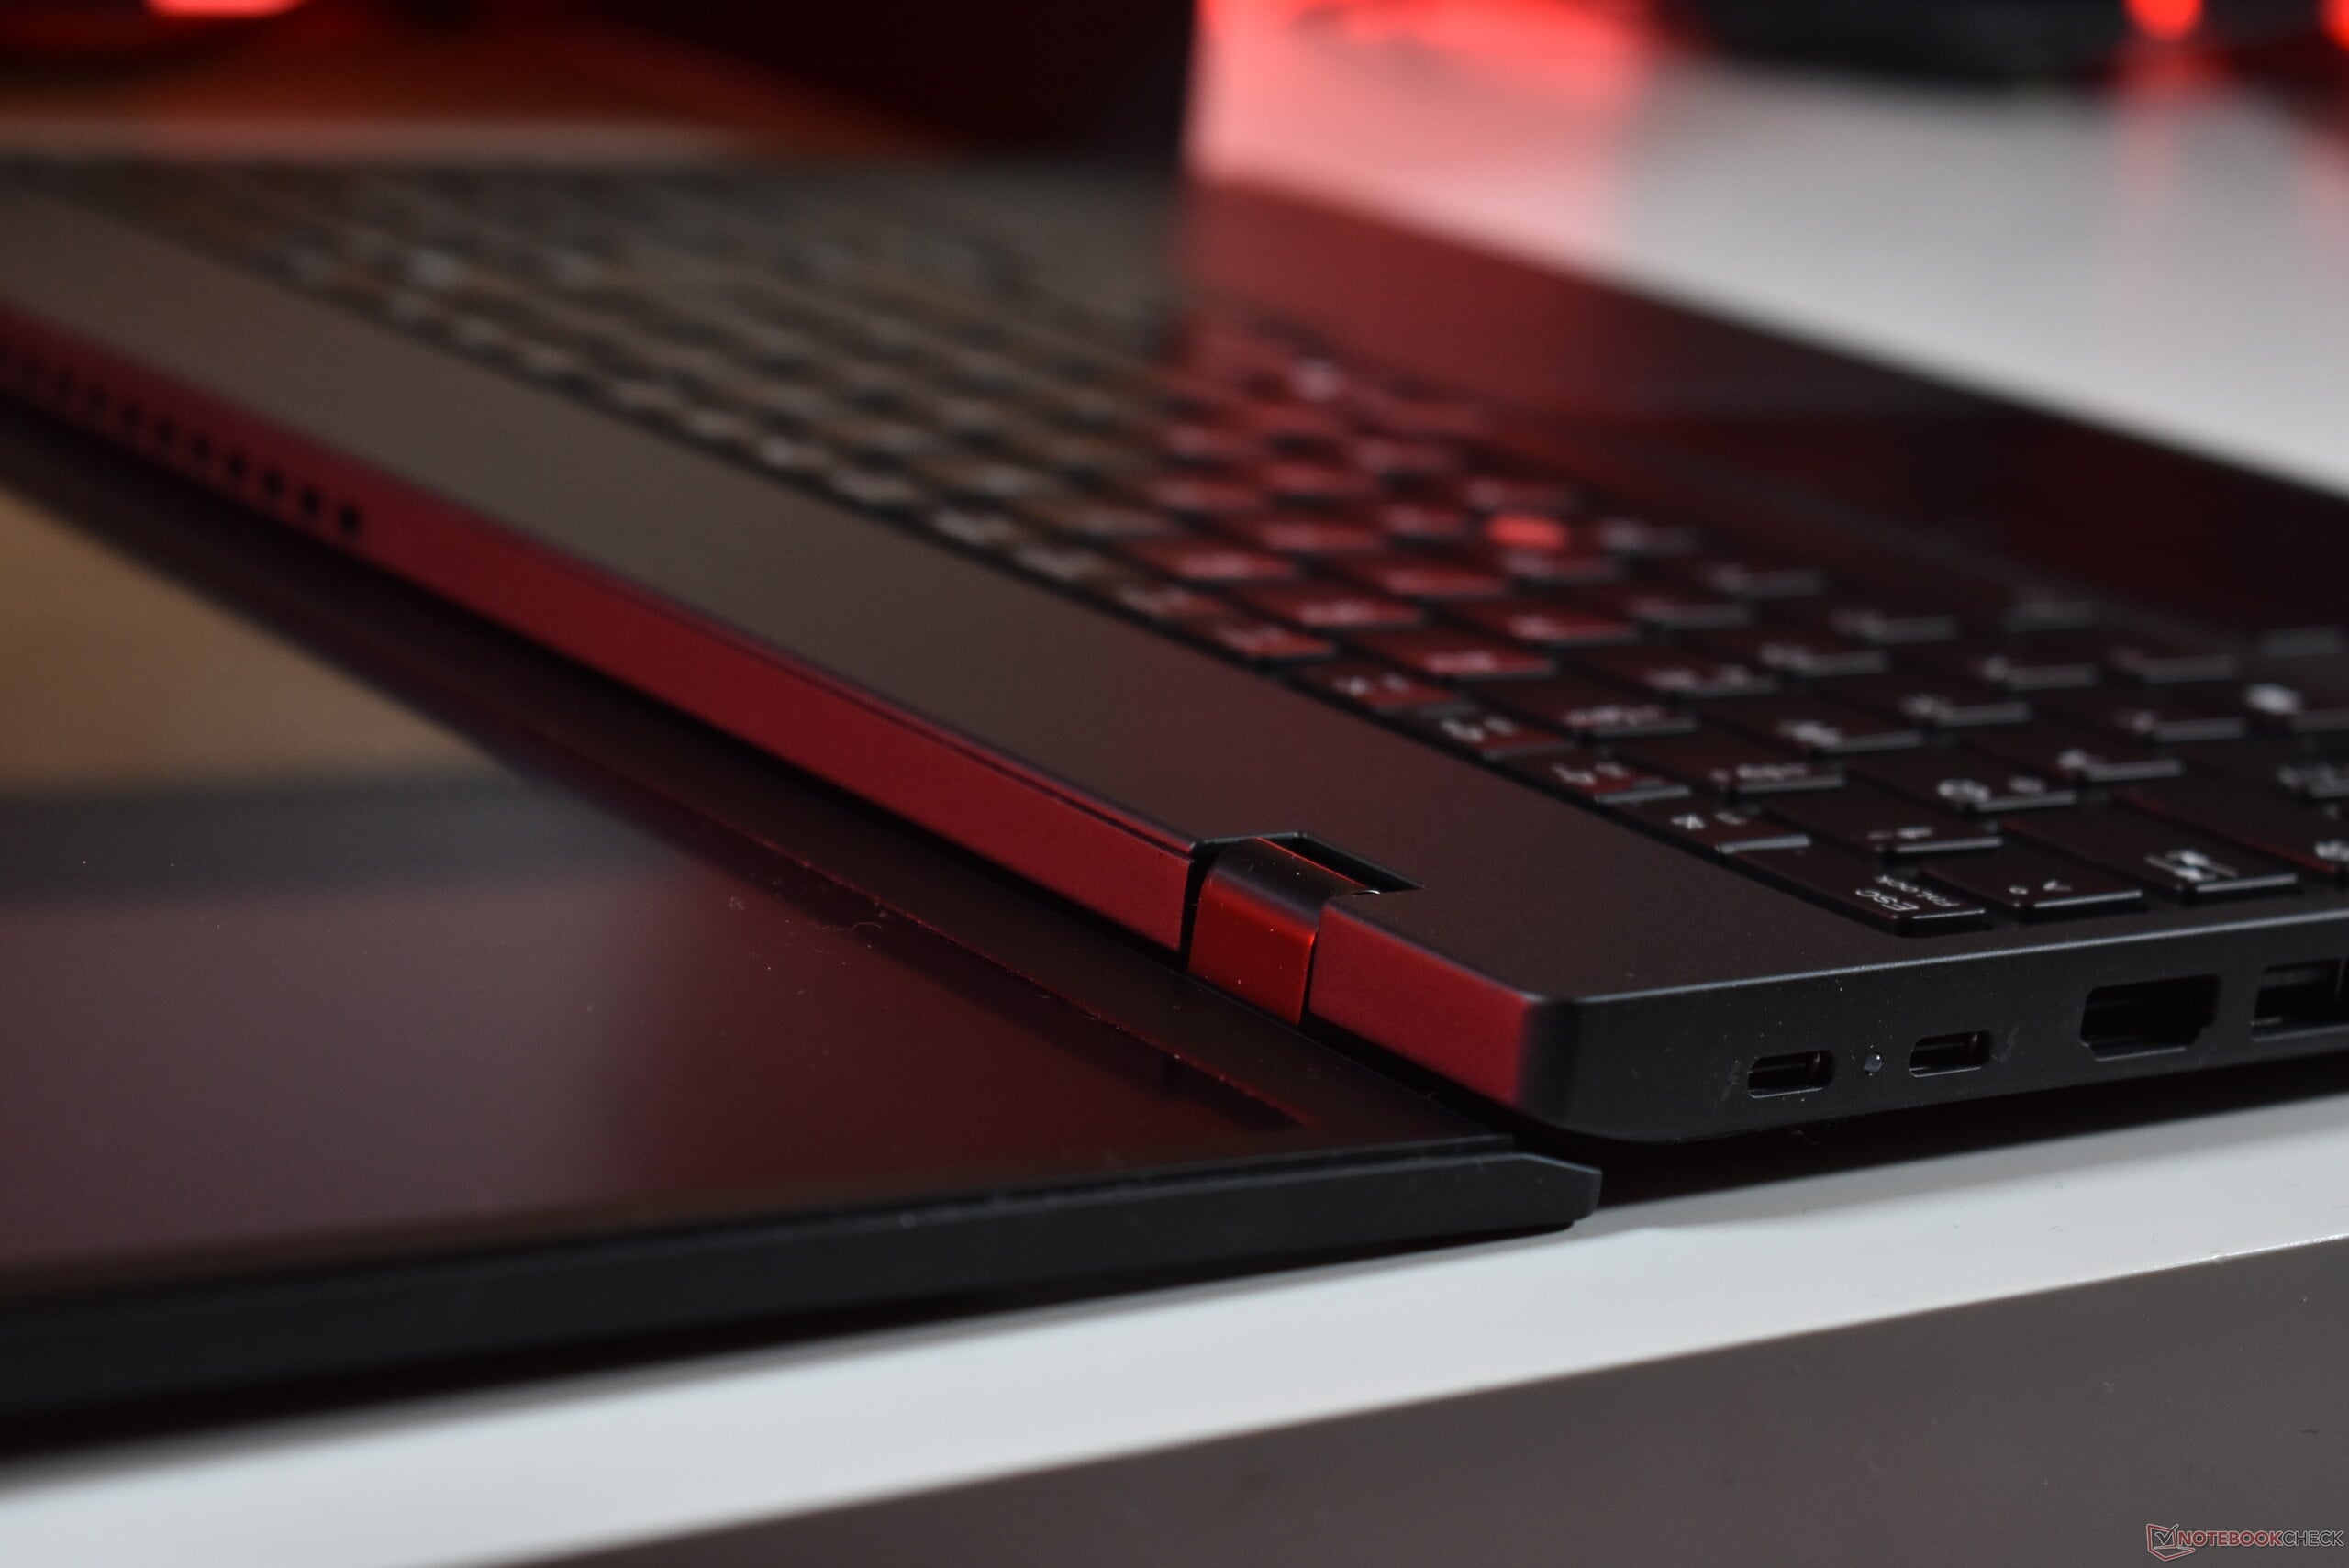
连接性:AMD ThinkPad 现配备 Thunderbolt 4
与 P16s G2 相比,端口选择几乎没有变化,只是较新的 P16s 现在有两个 Thunderbolt 4 端口(而不是一个 USB4 和一个普通 USB-C),RJ45 端口现在有一个铰链。对于这么大的工作站来说,缺少的是一个 SD 卡插槽。此外,如果右侧有另一个 USB-C 接口就更好了,这样就可以从两侧为设备充电。


交流
联想采用了联发科制造的快速 Wi-Fi 7 解决方案,同时还提供蓝牙 5.4。在传输速率方面,它能很好地实现高网络速度。
由于这款产品基于 ThinkPad T 系列的企业级产品线,联想提供了可选的 WWAN--这里指的是 5G/LTE。我们的评测机型配备了必要的天线、M.2 插槽和 nanoSIM 插槽。用户可以选择添加 5G Quectel RM520N-GL 卡。请注意,只有带有 FRU 编号的联想官方部件才能使用。
网络摄像头
500 万像素的网络摄像头足以满足视频通话的需要,图像清晰度相当高。


安全
作为一种商业模式,联想ThinkPad P16s Gen 4 AMD提供的功能对消费者来说比较陌生,比如Kensington锁插槽或智能卡读卡器。而指纹传感器和红外网络摄像头(可通过 Windows Hello 快速登录)以及机械式摄像头快门(可提高私密性)等功能则更为熟悉。
配件
除了必须的 65 W USB-C 充电器外,没有其他附件。
维护
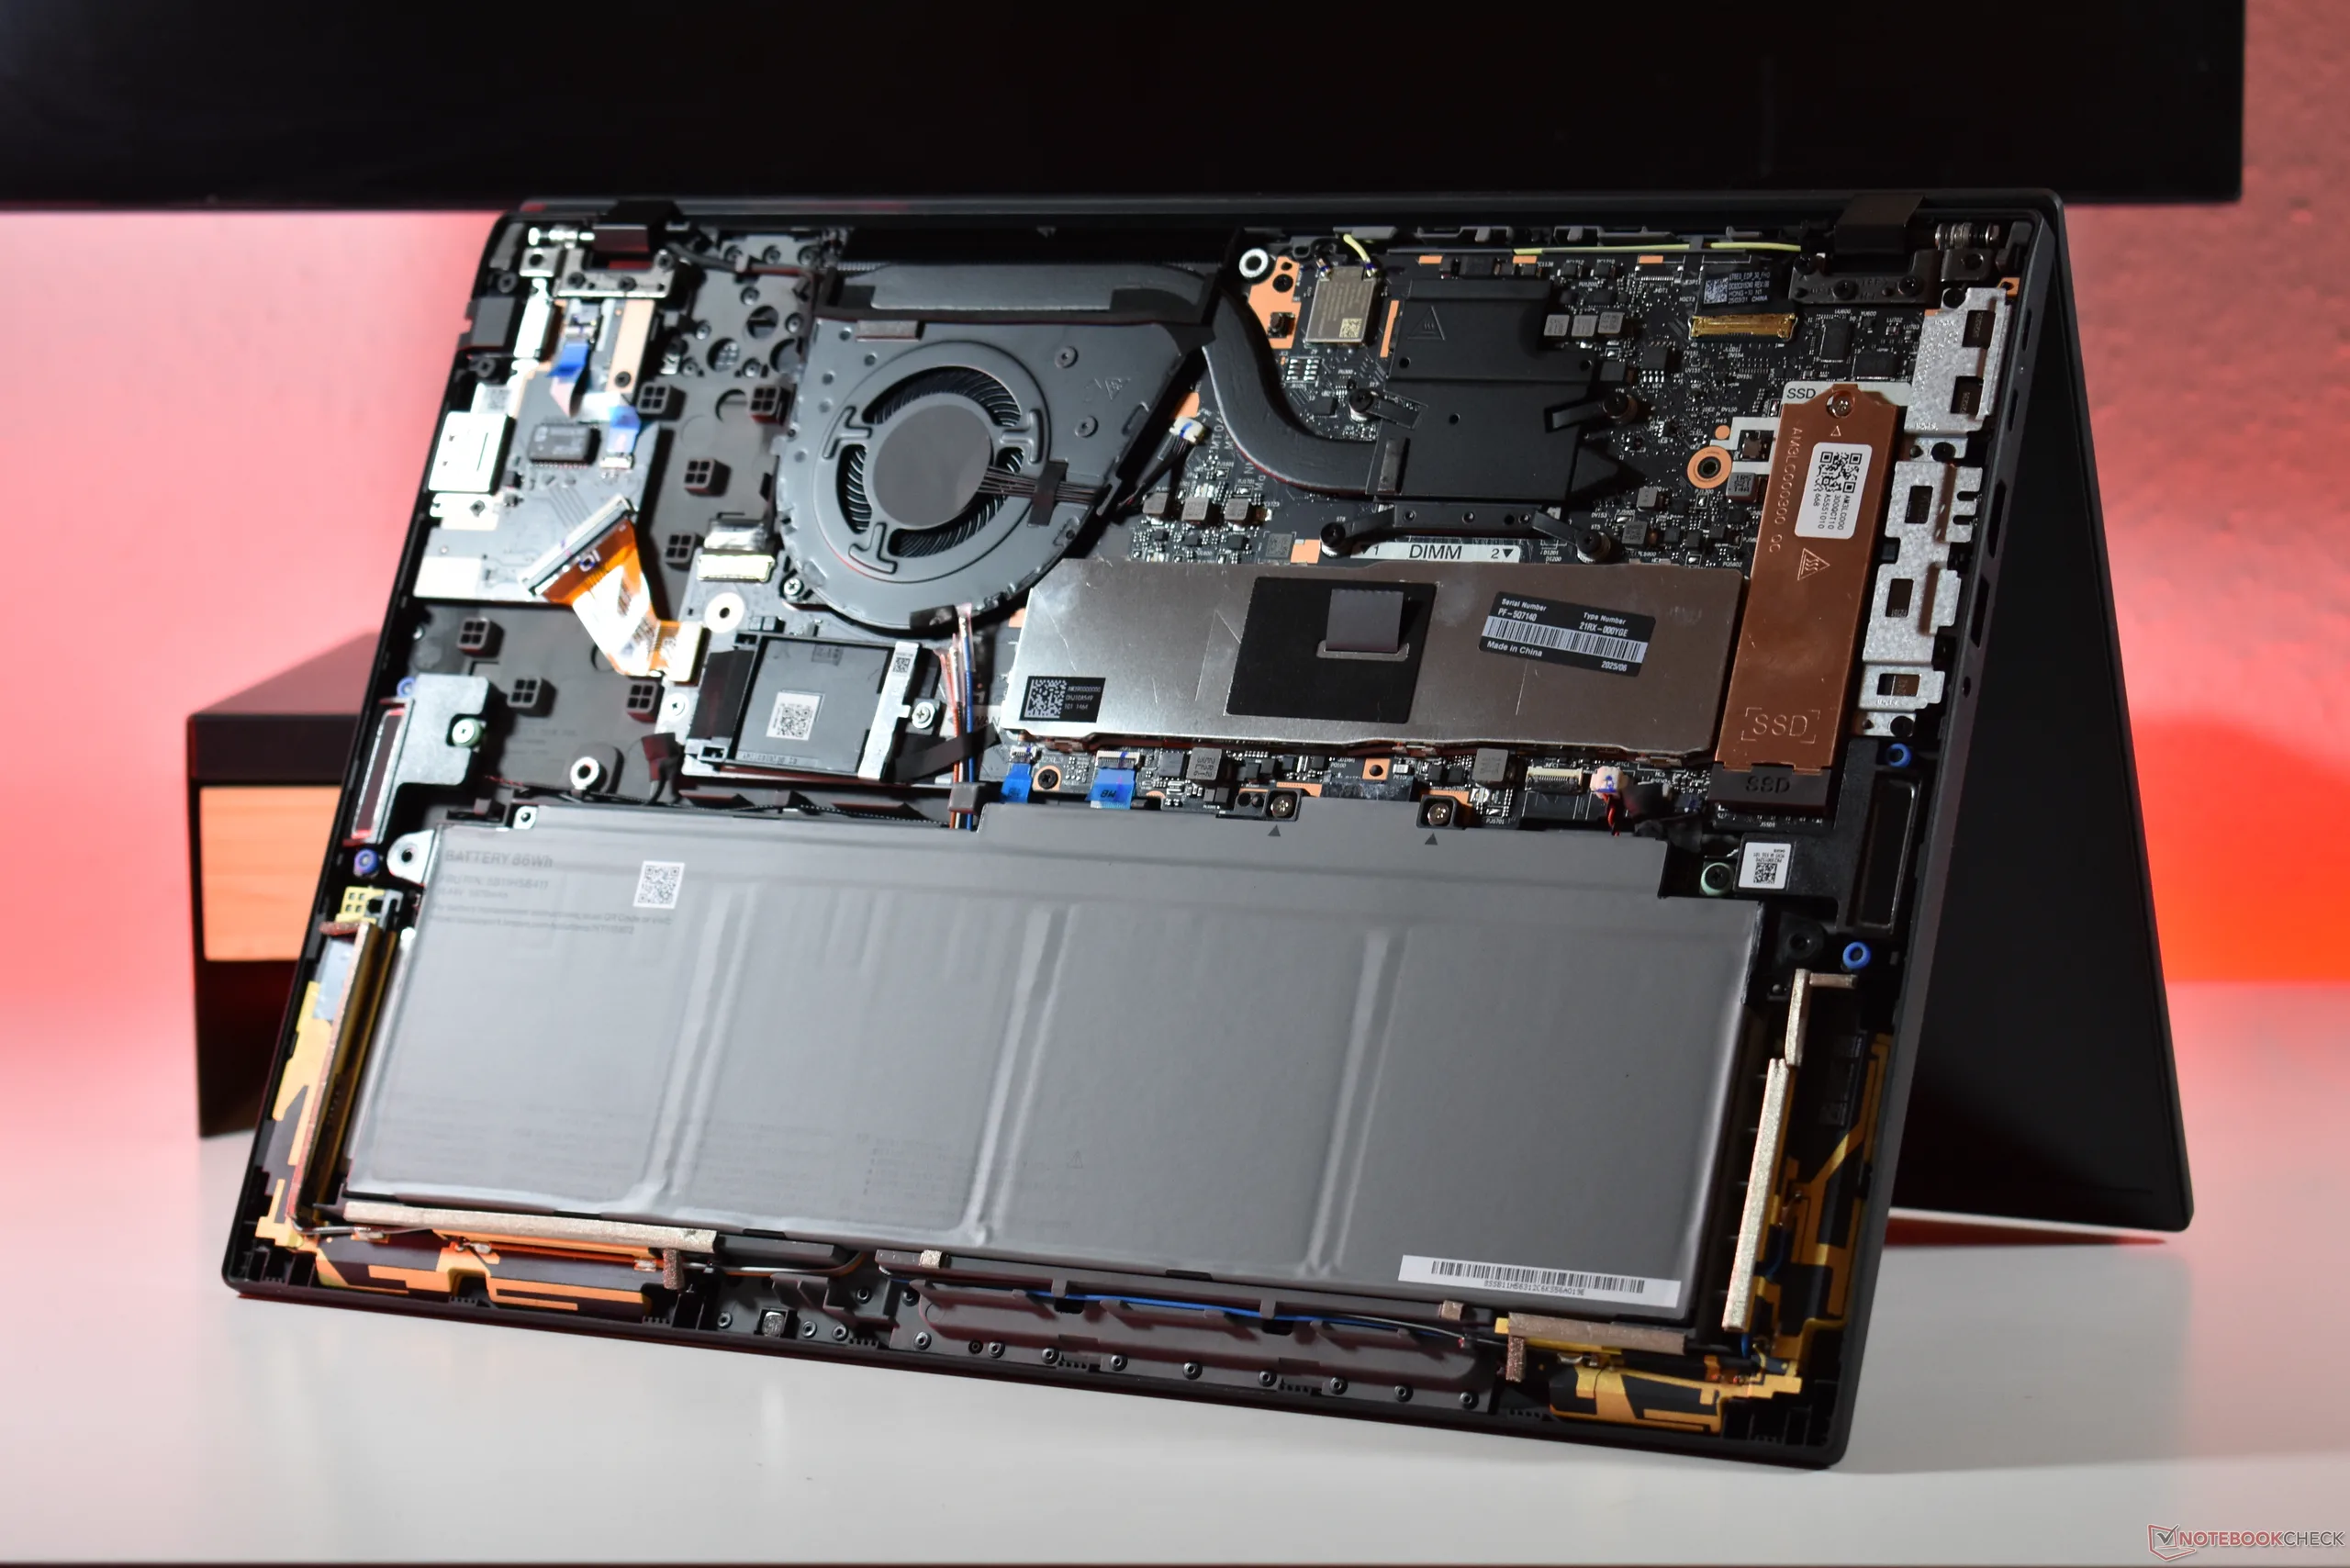
与老款联想 ThinkPad P16s Gen 2 相比,这款 P16s Gen 4 的升级性更强。松开底部的七颗飞利浦螺钉后,底盖就可以轻松取下,因为卡扣可以很好地分开。内部有两个 SO-DIMM 内存插槽和一个 M.2 2280 SSD 插槽。此外,还有一个用于 5G 模块的开放式 M.2 2242 插槽。中央处理器和 Wi-Fi 芯片焊接在一起。风扇和电池都很容易拆卸,更换起来也比以前的机型方便。
P16s Gen 4 AMD 的一个特别之处是:键盘是用户可更换的。键盘仅由底部的两颗螺丝固定。一旦拧松,键盘就可以向后滑动,然后从机箱上取下--这是一个很好的维修功能。

可持续性
虽然包装是 100% 可回收的,但设备本身的可持续发展性稍差,因为机箱材料本身并非由可回收材料制成。据联想估计,ThinkPad P16s Gen 4 AMD 的生命周期二氧化碳排放量约为 192 千克二氧化碳当量,比同类 14 英寸系统高出一些。作为一款 ThinkPad,联想提供长达 7 年的软件更新和零部件支持,同时还提供书面和视频形式的维护手册。
保修
该设备的保修期为三年,同样适用于国际市场,并涵盖基本的上门服务。如果电池出现故障,联想只会在保修期的第一年内更换电池,电池的保修延期是可选的。
输入设备:延续强大的 ThinkPad 传统
键盘
联想在 ThinkPad P16s Gen 4 AMD 中使用的键盘与 ThinkPad P16s Gen 2 AMD 的键盘没有太大区别。 ThinkPad P16s Gen 2 AMD.最基本的东西,比如略微凹陷的 Chiclet 键,1.5 毫米的行程和两段式背光,以及带数字键盘的全尺寸布局。变化虽小,但并非毫无意义:联想增加了必须的 Copilot 键,Ctrl 键和 FN 键也进行了切换。F 键的功能也有一些微小的变化。
总的来说,键盘非常出色。在这款 ThinkPad 笔记本电脑上打字是一种享受,由于打字手感非常舒适,书写较长的文字也非常轻松。

触摸板和 TrackPoint
联想在 ThinkPad 产品线上提供两种鼠标输入方式:触摸板集成了按钮,即所谓的点击板,还有一个指向杆,也称为 TrackPoint。触摸板大小适中(11.5 x 6.5 厘米),由塑料制成。虽然触感不如玻璃触摸板豪华,但它提供了相当令人满意的用户体验。TrackPoint 及其专用鼠标键也是如此。指点杆是通过压力而不是移动来工作的,在某些情况下,比如在飞机上,指点杆的作用会更好,而在工作站上,由于有了第三个鼠标键,指点杆的作用尤其明显。


显示屏屏幕明亮,但分辨率较低

联想 ThinkPad P16s 第 4 代 AMD 提供四种不同的 16 英寸 16:10 屏幕:
- WUXGA(1,920 x 1,200),IPS,400 cd/m²,45 % NTSC,哑光
- WUXGA(1,920 x 1,200),IPS,400 cd/m²,45 % NTSC,亚光,多点触控
- WUXGA(1,920 x 1,200),IPS,500 cd/m²,100 % sRGB,亚光,低功耗
- 4K-WQUXGA (3,840 x 2,400), OLED, 400 cd/m², 100 % DCI-P3, 半亚光, 多点触控
与较小的 ThinkPad P14s Gen 6 AMD 一样,最高端的面板(OLED 屏幕)不能配置 Ryzen AI 9 HX CPU,只能配置 Ryzen 5 和 Ryzen 7 CPU。
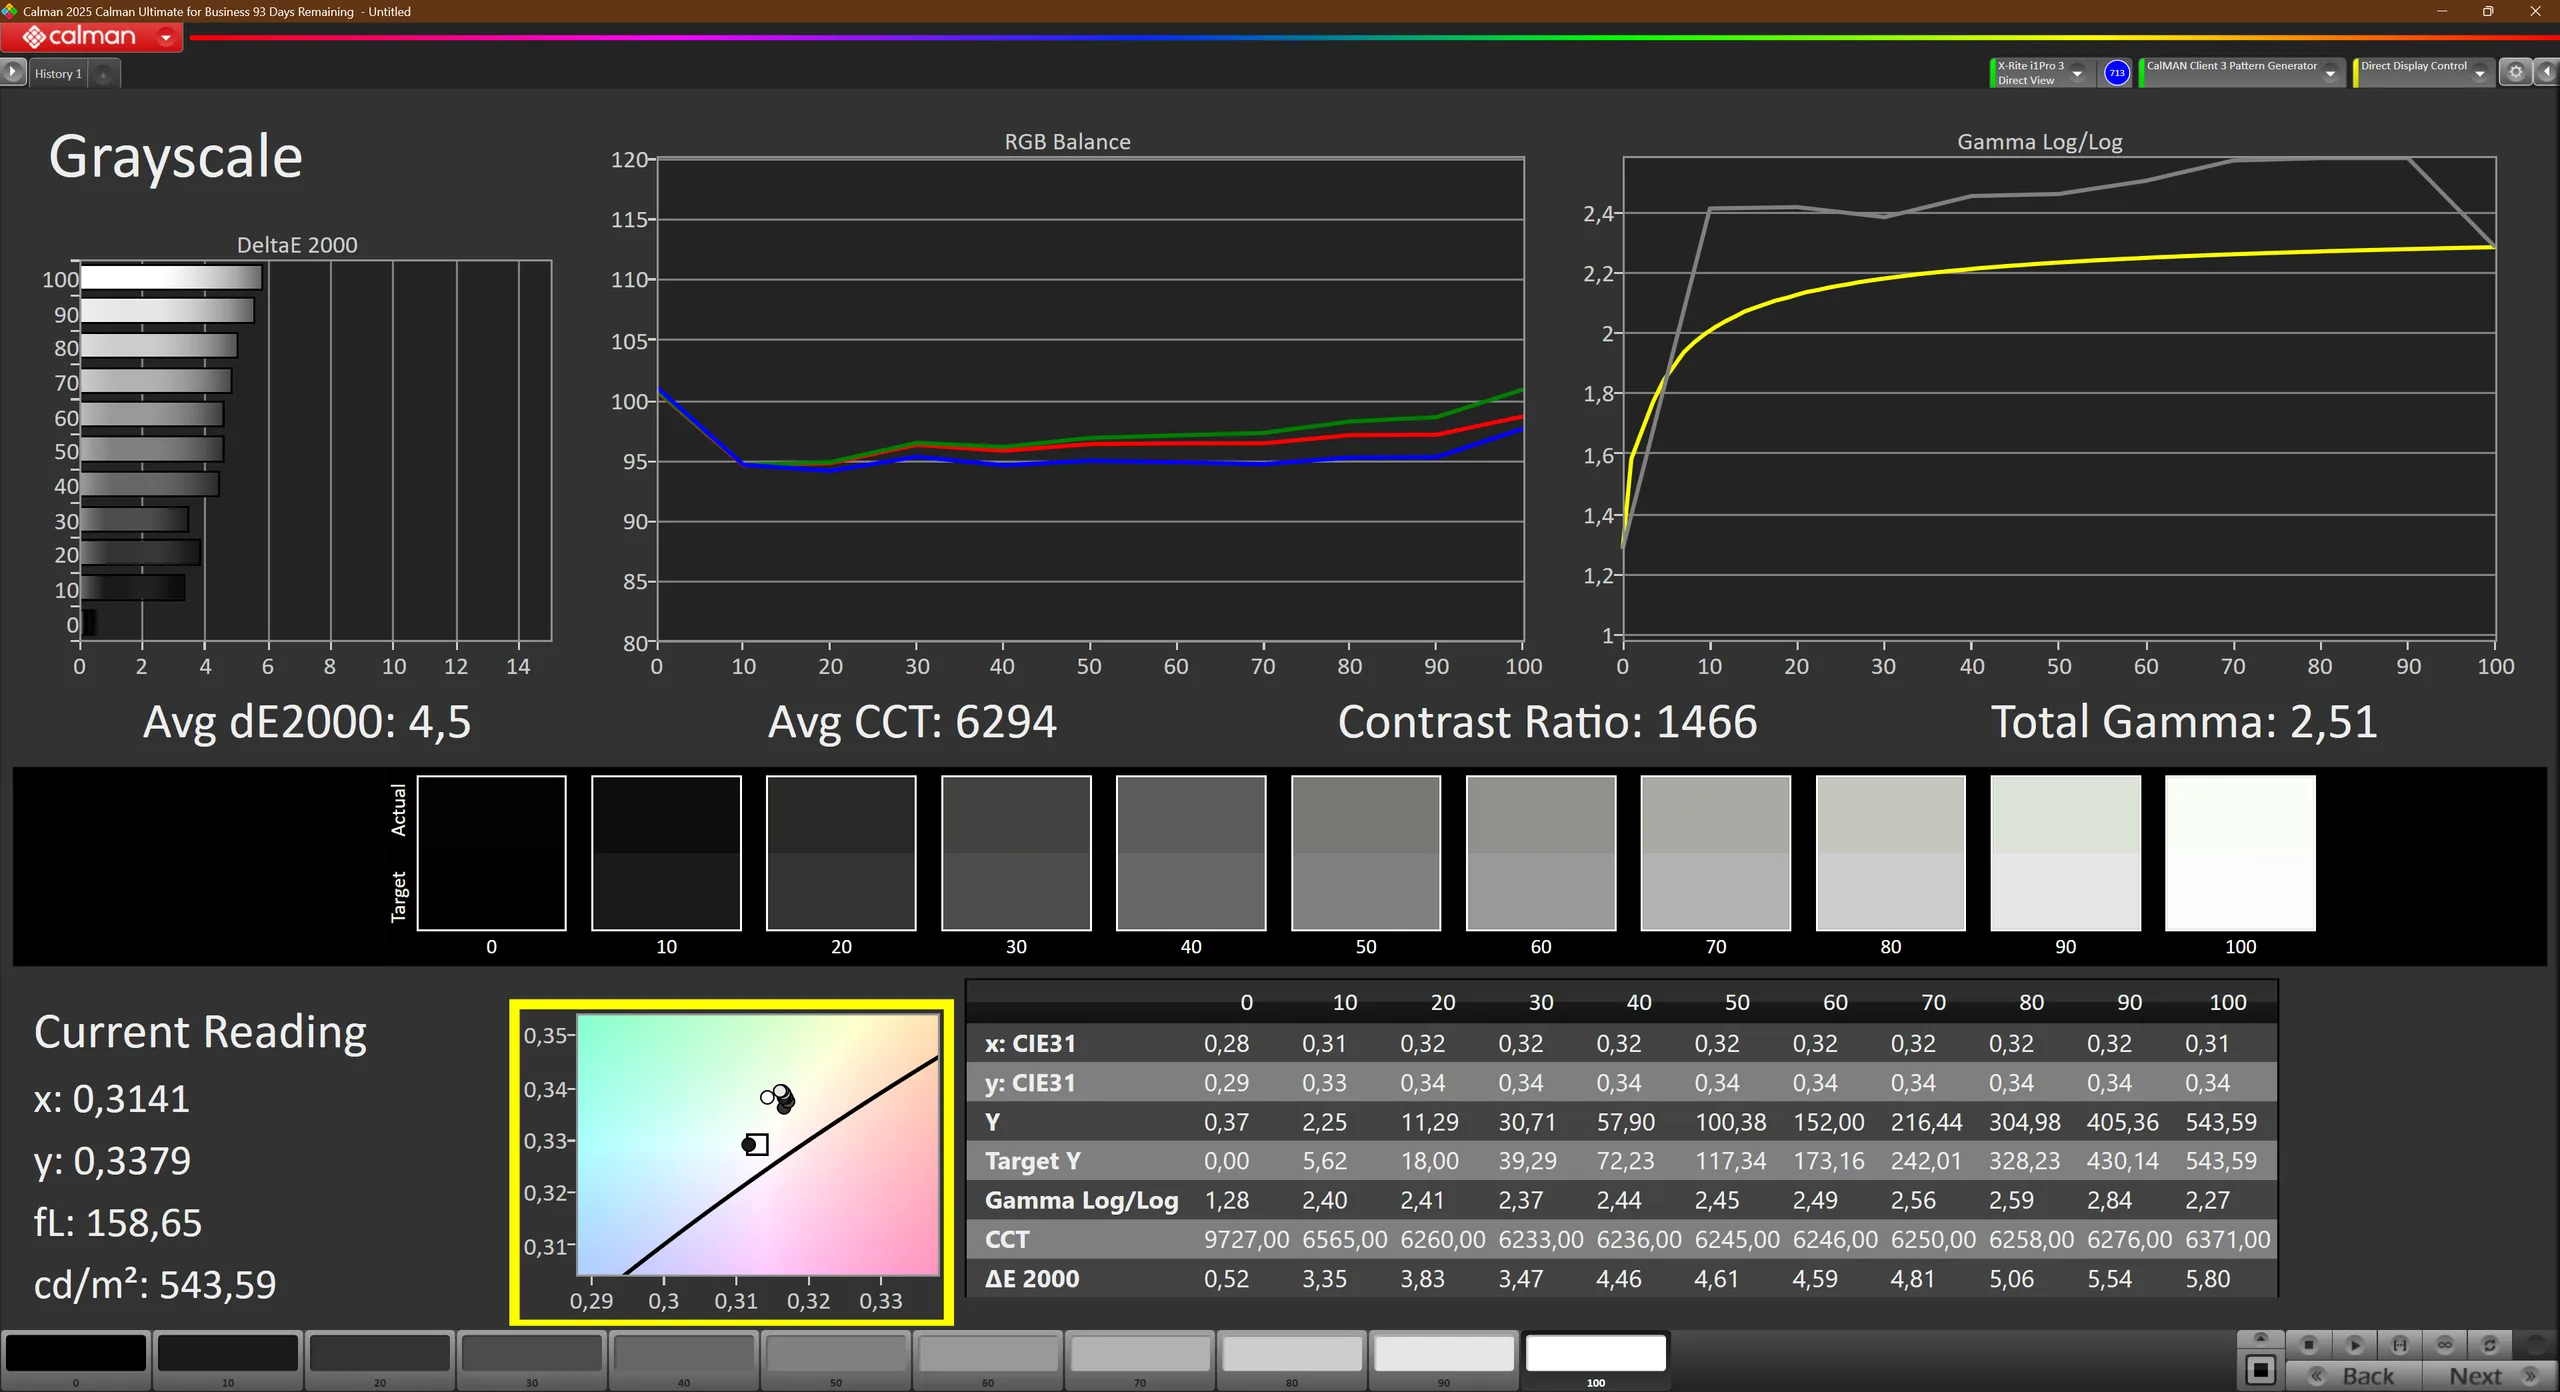
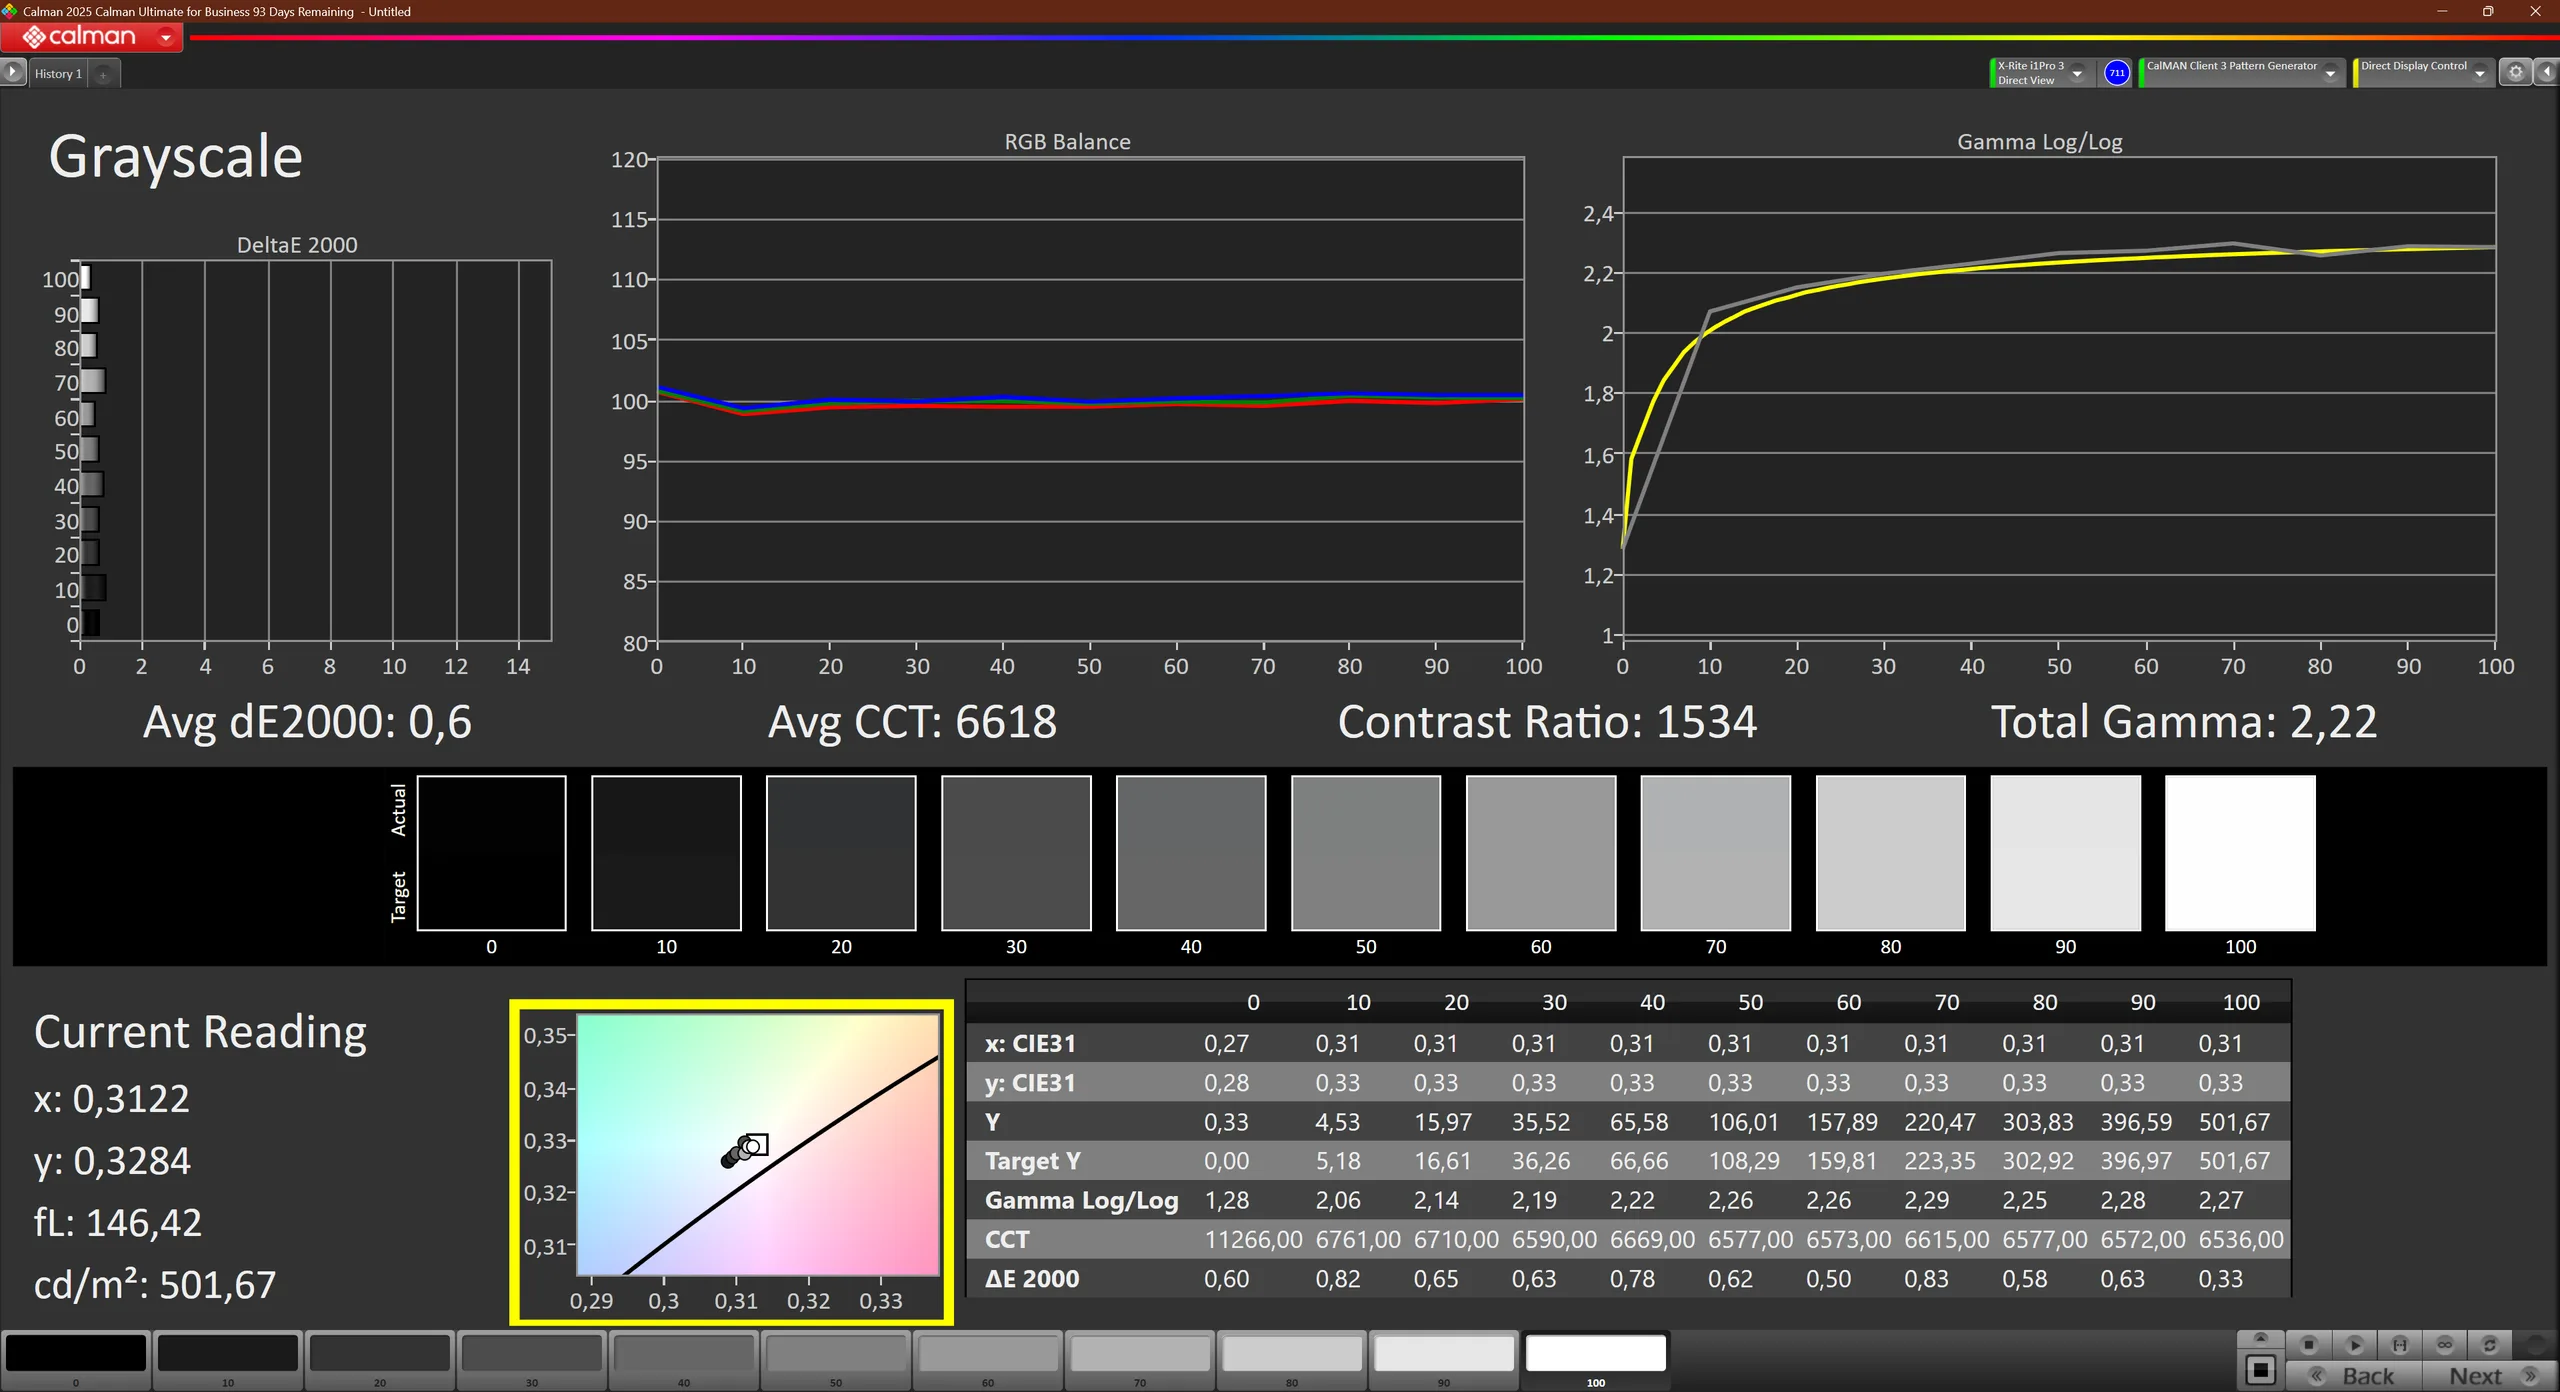
我们评测样品中的低功耗面板由 Innolux 生产。它达到了承诺的亮度,是我们对比中亮度较高的面板之一。不过,WUXGA 分辨率是 16 英寸工作站的最低要求,而且没有更高分辨率的 IPS 面板可供选择。
| |||||||||||||||||||||||||
Brightness Distribution: 93 %
Center on Battery: 540 cd/m²
Contrast: 1459:1 (Black: 0.37 cd/m²)
ΔE ColorChecker Calman: 3.4 | ∀{0.5-29.43 Ø4.71}
calibrated: 0.9
ΔE Greyscale Calman: 4.5 | ∀{0.09-98 Ø4.96}
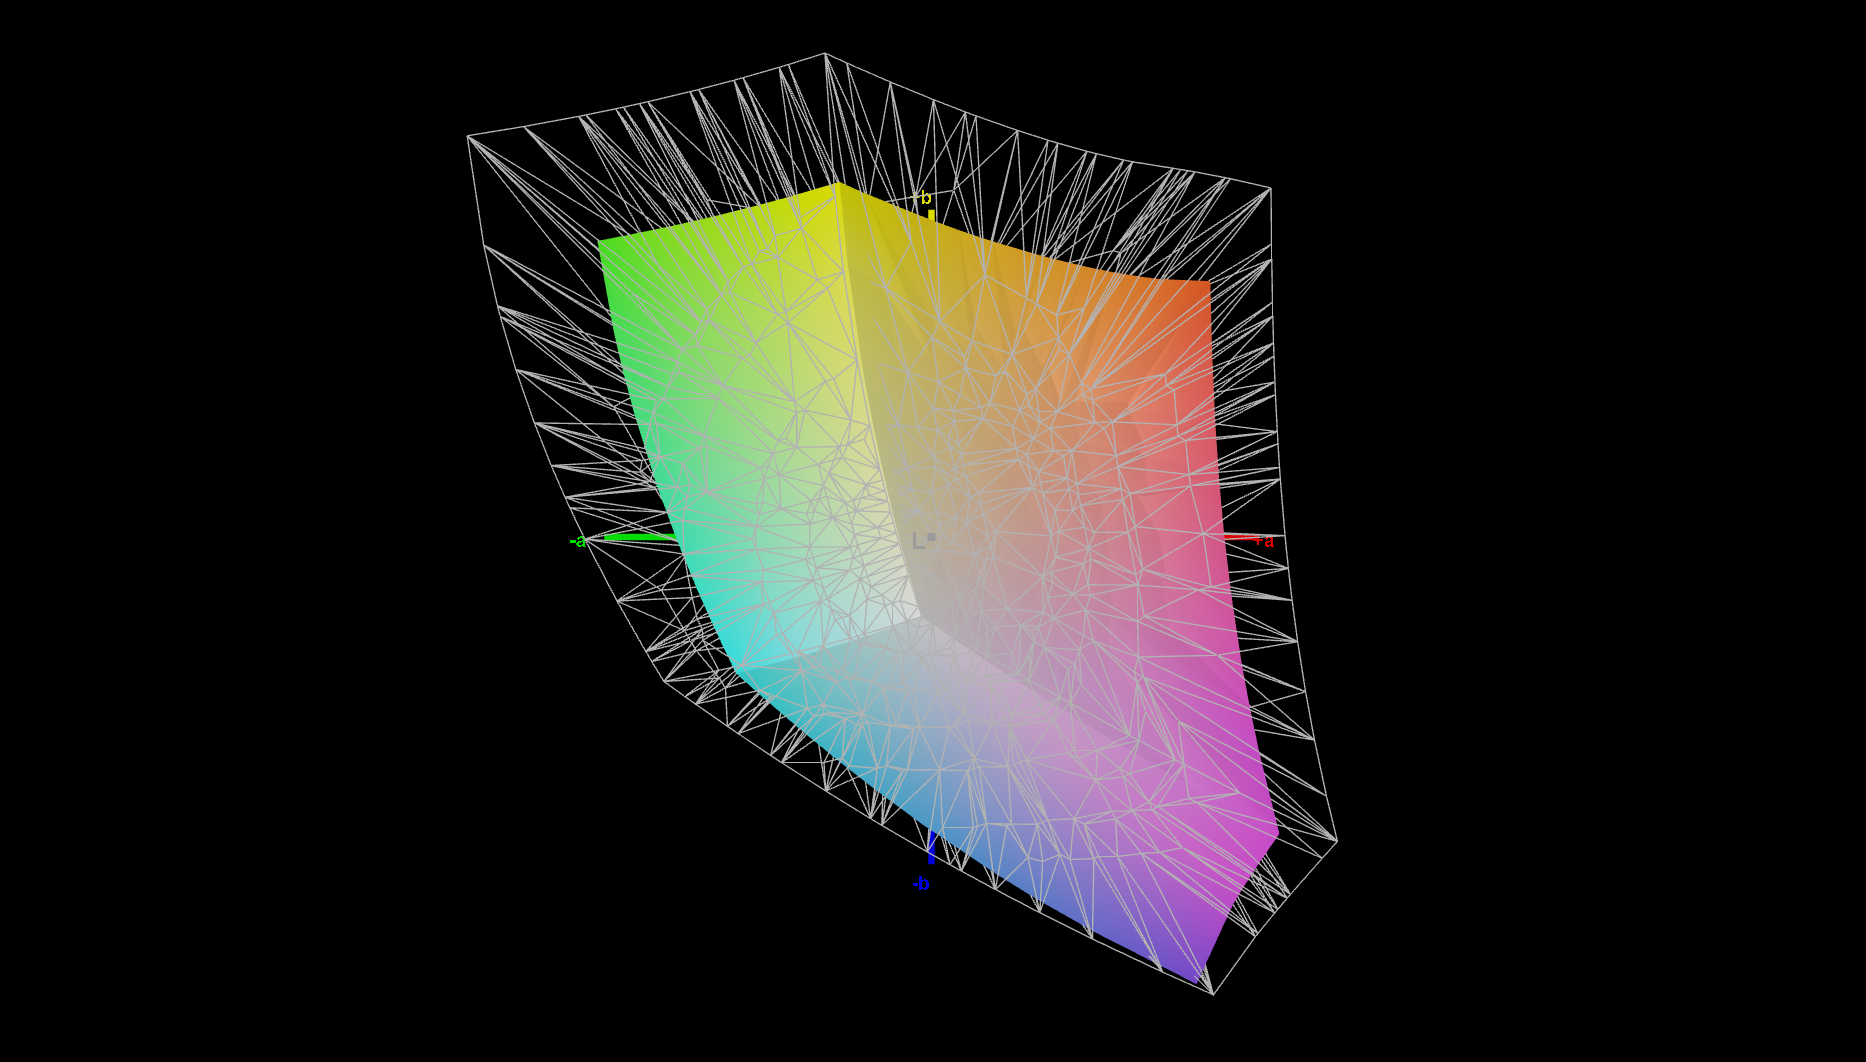
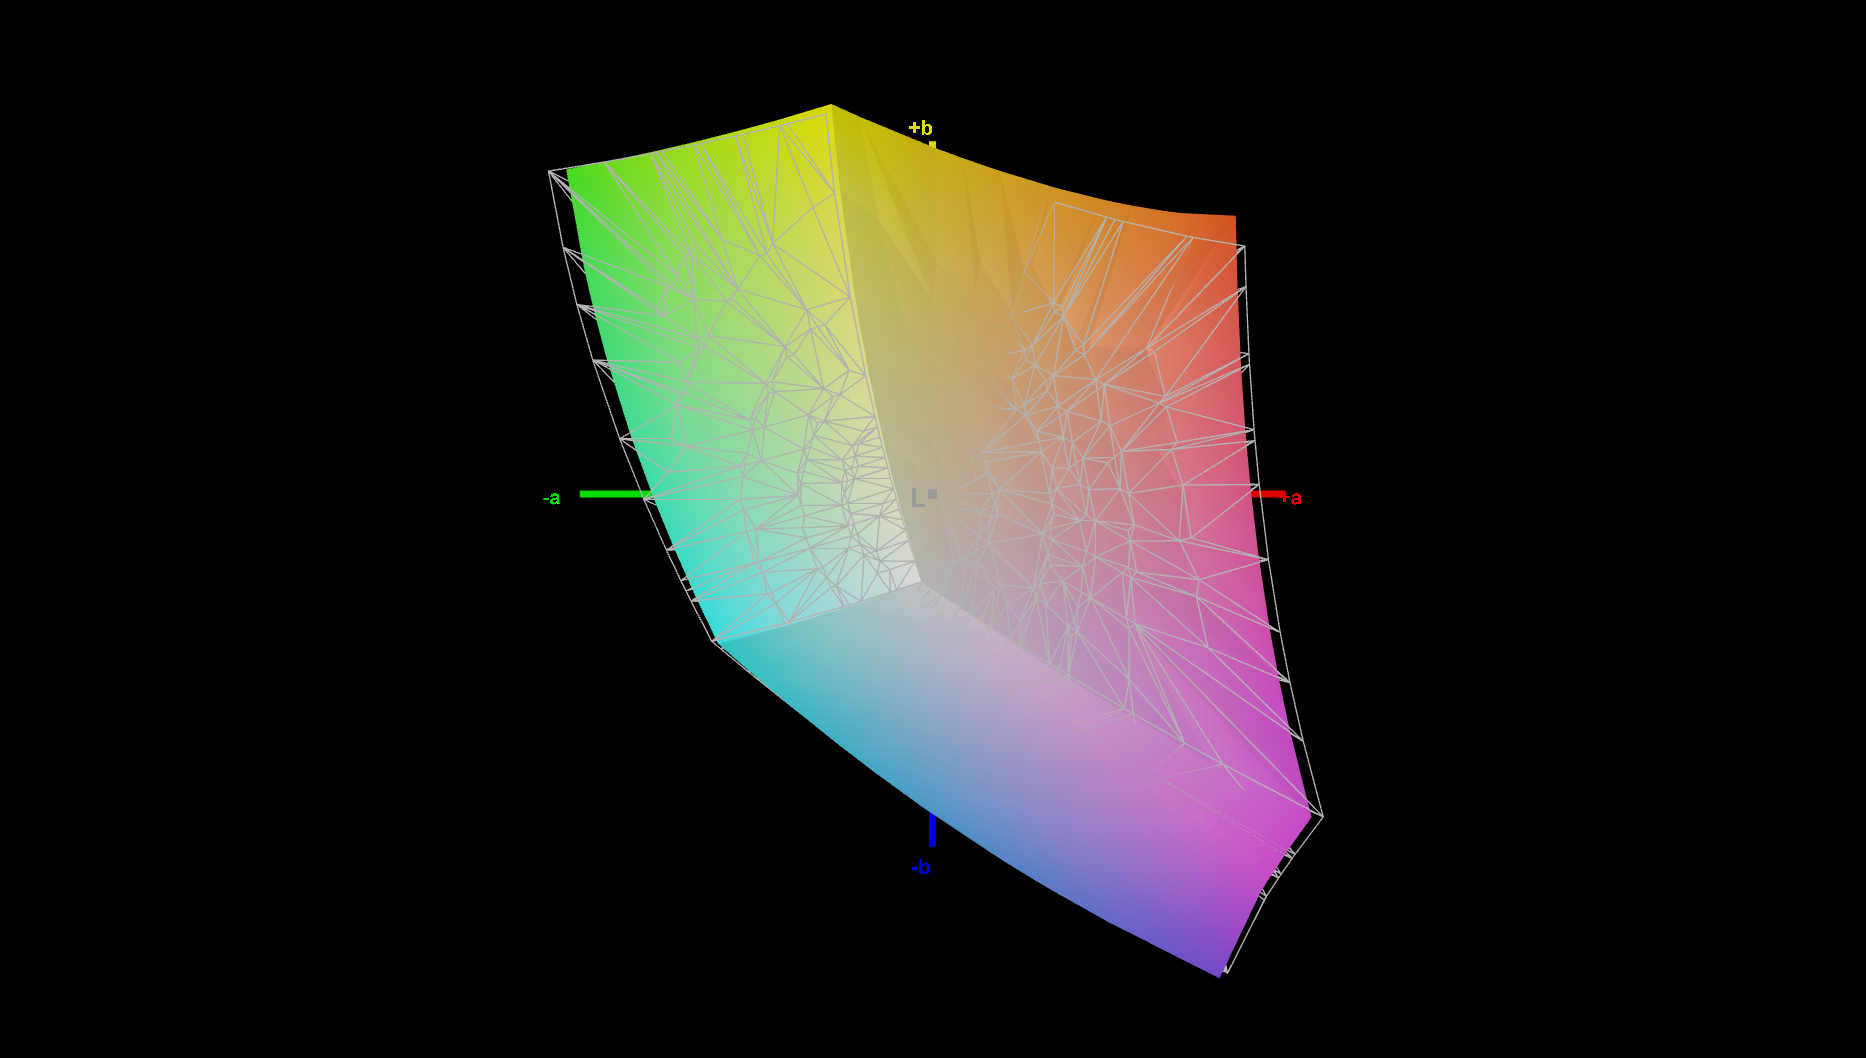
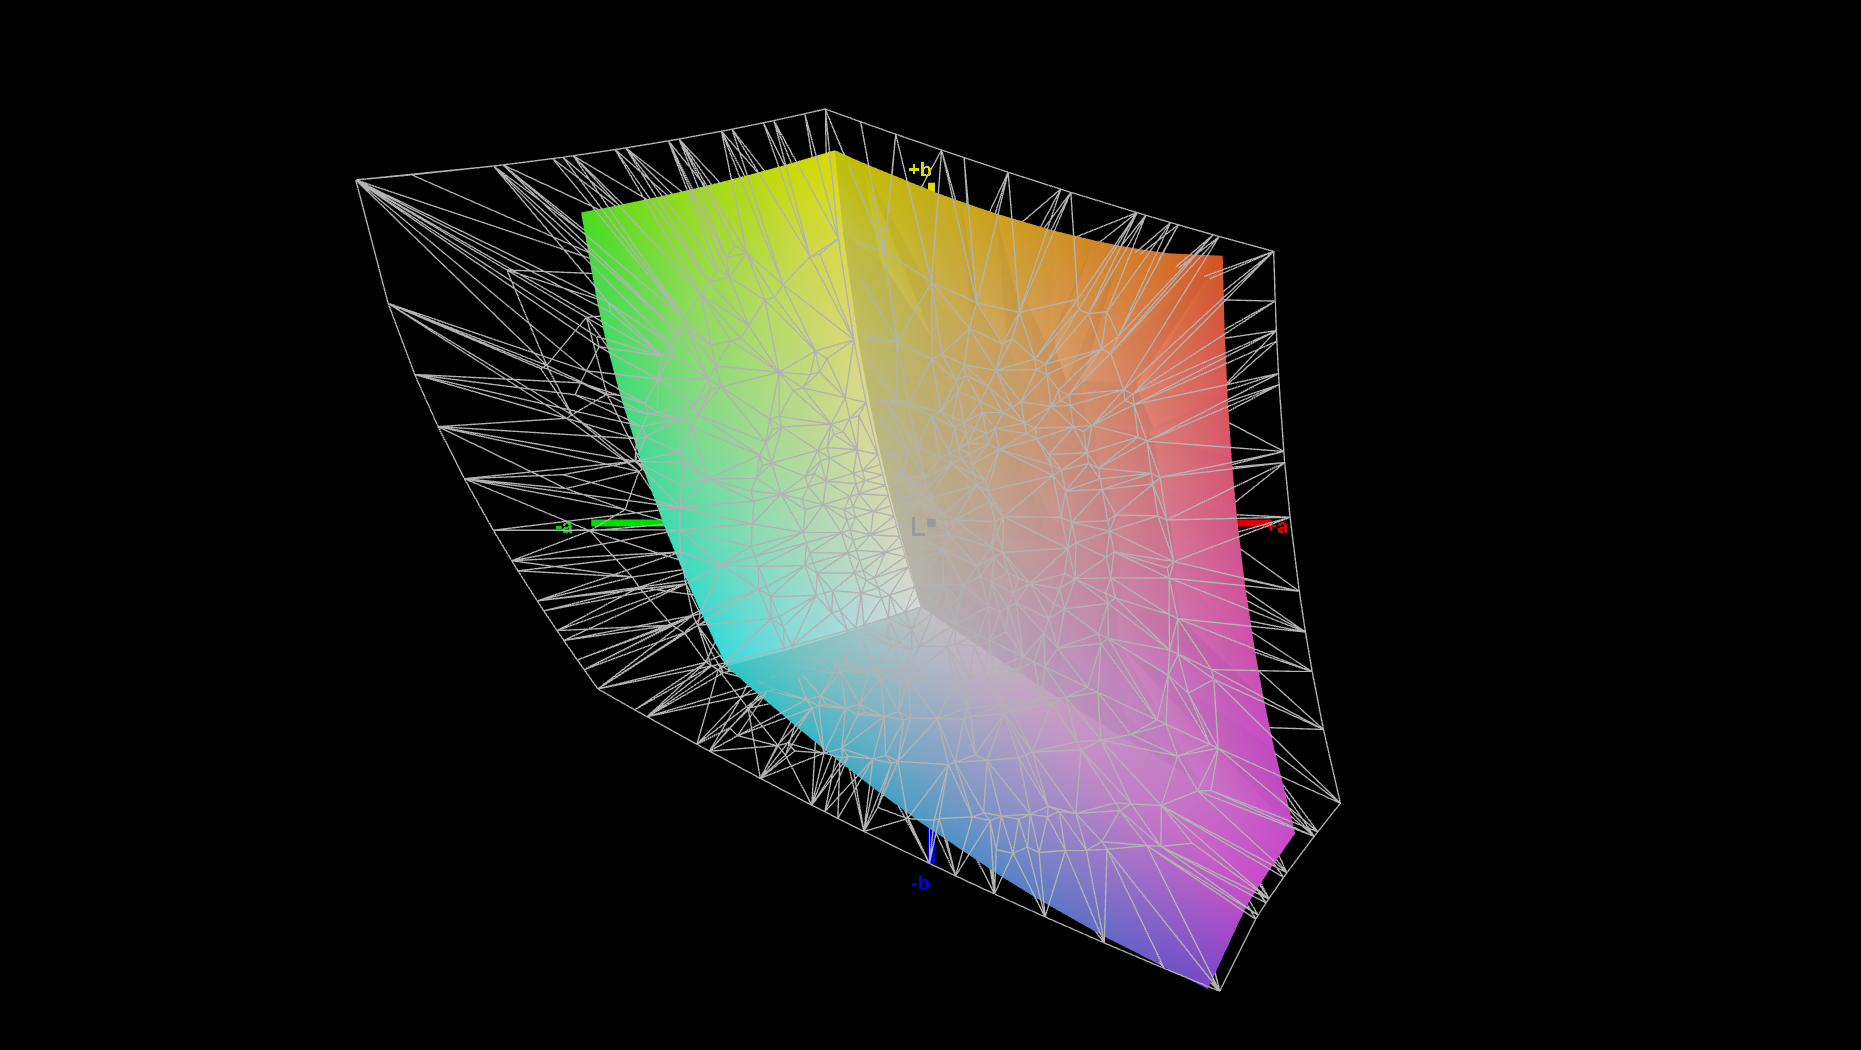
67.8% AdobeRGB 1998 (Argyll 3D)
96.8% sRGB (Argyll 3D)
65.8% Display P3 (Argyll 3D)
Gamma: 2.51
CCT: 6294 K
| Lenovo ThinkPad P16s Gen 4 21RX000YGE N160JCA-GT1, IPS LED, 1920x1200, 16", 60 Hz | Lenovo ThinkPad P16s G2 21K9000CGE ATNA60YV04-0, OLED, 3840x2400, 16", 60 Hz | HP ZBook X G1i 16 LG Philips LGD07B3, IPS, 2560x1600, 16", 120 Hz | Lenovo ThinkPad P1 Gen 8 Samsung ATNA60KA02-0, Tandem OLED, 3200x2000, 16", 120 Hz | Dell Precision 5690 Samsung 160YV03, OLED, 3840x2400, 16", 60 Hz | |
|---|---|---|---|---|---|
| Display | 33% | 33% | 32% | 32% | |
| Display P3 Coverage (%) | 65.8 | 99.9 52% | 97.2 48% | 98.8 50% | 99.8 52% |
| sRGB Coverage (%) | 96.8 | 100 3% | 100 3% | 100 3% | 100 3% |
| AdobeRGB 1998 Coverage (%) | 67.8 | 96.9 43% | 99.9 47% | 97.5 44% | 96.6 42% |
| Response Times | 95% | -36% | 98% | 93% | |
| Response Time Grey 50% / Grey 80% * (ms) | 29.4 ? | 1.5 ? 95% | 45.5 ? -55% | 0.57 ? 98% | 1.7 ? 94% |
| Response Time Black / White * (ms) | 22.4 ? | 1.3 ? 94% | 26.1 ? -17% | 0.73 ? 97% | 1.7 ? 92% |
| PWM Frequency (Hz) | 60 | 26536 ? | 1199 | 60 ? | |
| PWM Amplitude * (%) | 47 | 18 | |||
| Screen | -12% | -13% | 30% | -7% | |
| Brightness middle (cd/m²) | 540 | 416 -23% | 461.8 -14% | 561.8 4% | 348.1 -36% |
| Brightness (cd/m²) | 516 | 421 -18% | 427 -17% | 566 10% | 351 -32% |
| Brightness Distribution (%) | 93 | 98 5% | 88 -5% | 99 6% | 97 4% |
| Black Level * (cd/m²) | 0.37 | 0.46 -24% | |||
| Contrast (:1) | 1459 | 1004 -31% | |||
| Colorchecker dE 2000 * | 3.4 | 1.3 62% | 4.08 -20% | 1.29 62% | 4.18 -23% |
| Colorchecker dE 2000 max. * | 5.6 | 2.8 50% | 8.1 -45% | 2.96 47% | 6.68 -19% |
| Colorchecker dE 2000 calibrated * | 0.9 | 2.9 -222% | 0.75 17% | 0.81 10% | 0.97 -8% |
| Greyscale dE 2000 * | 4.5 | 1.8 60% | 3.5 22% | 1.4 69% | 1.7 62% |
| Gamma | 2.51 88% | 2.25 98% | 2.15 102% | 2.23 99% | 2.2 100% |
| CCT | 6294 103% | 6574 99% | 6715 97% | 6319 103% | 6198 105% |
| Total Average (Program / Settings) | 39% /
17% | -5% /
-7% | 53% /
42% | 39% /
19% |
* ... smaller is better
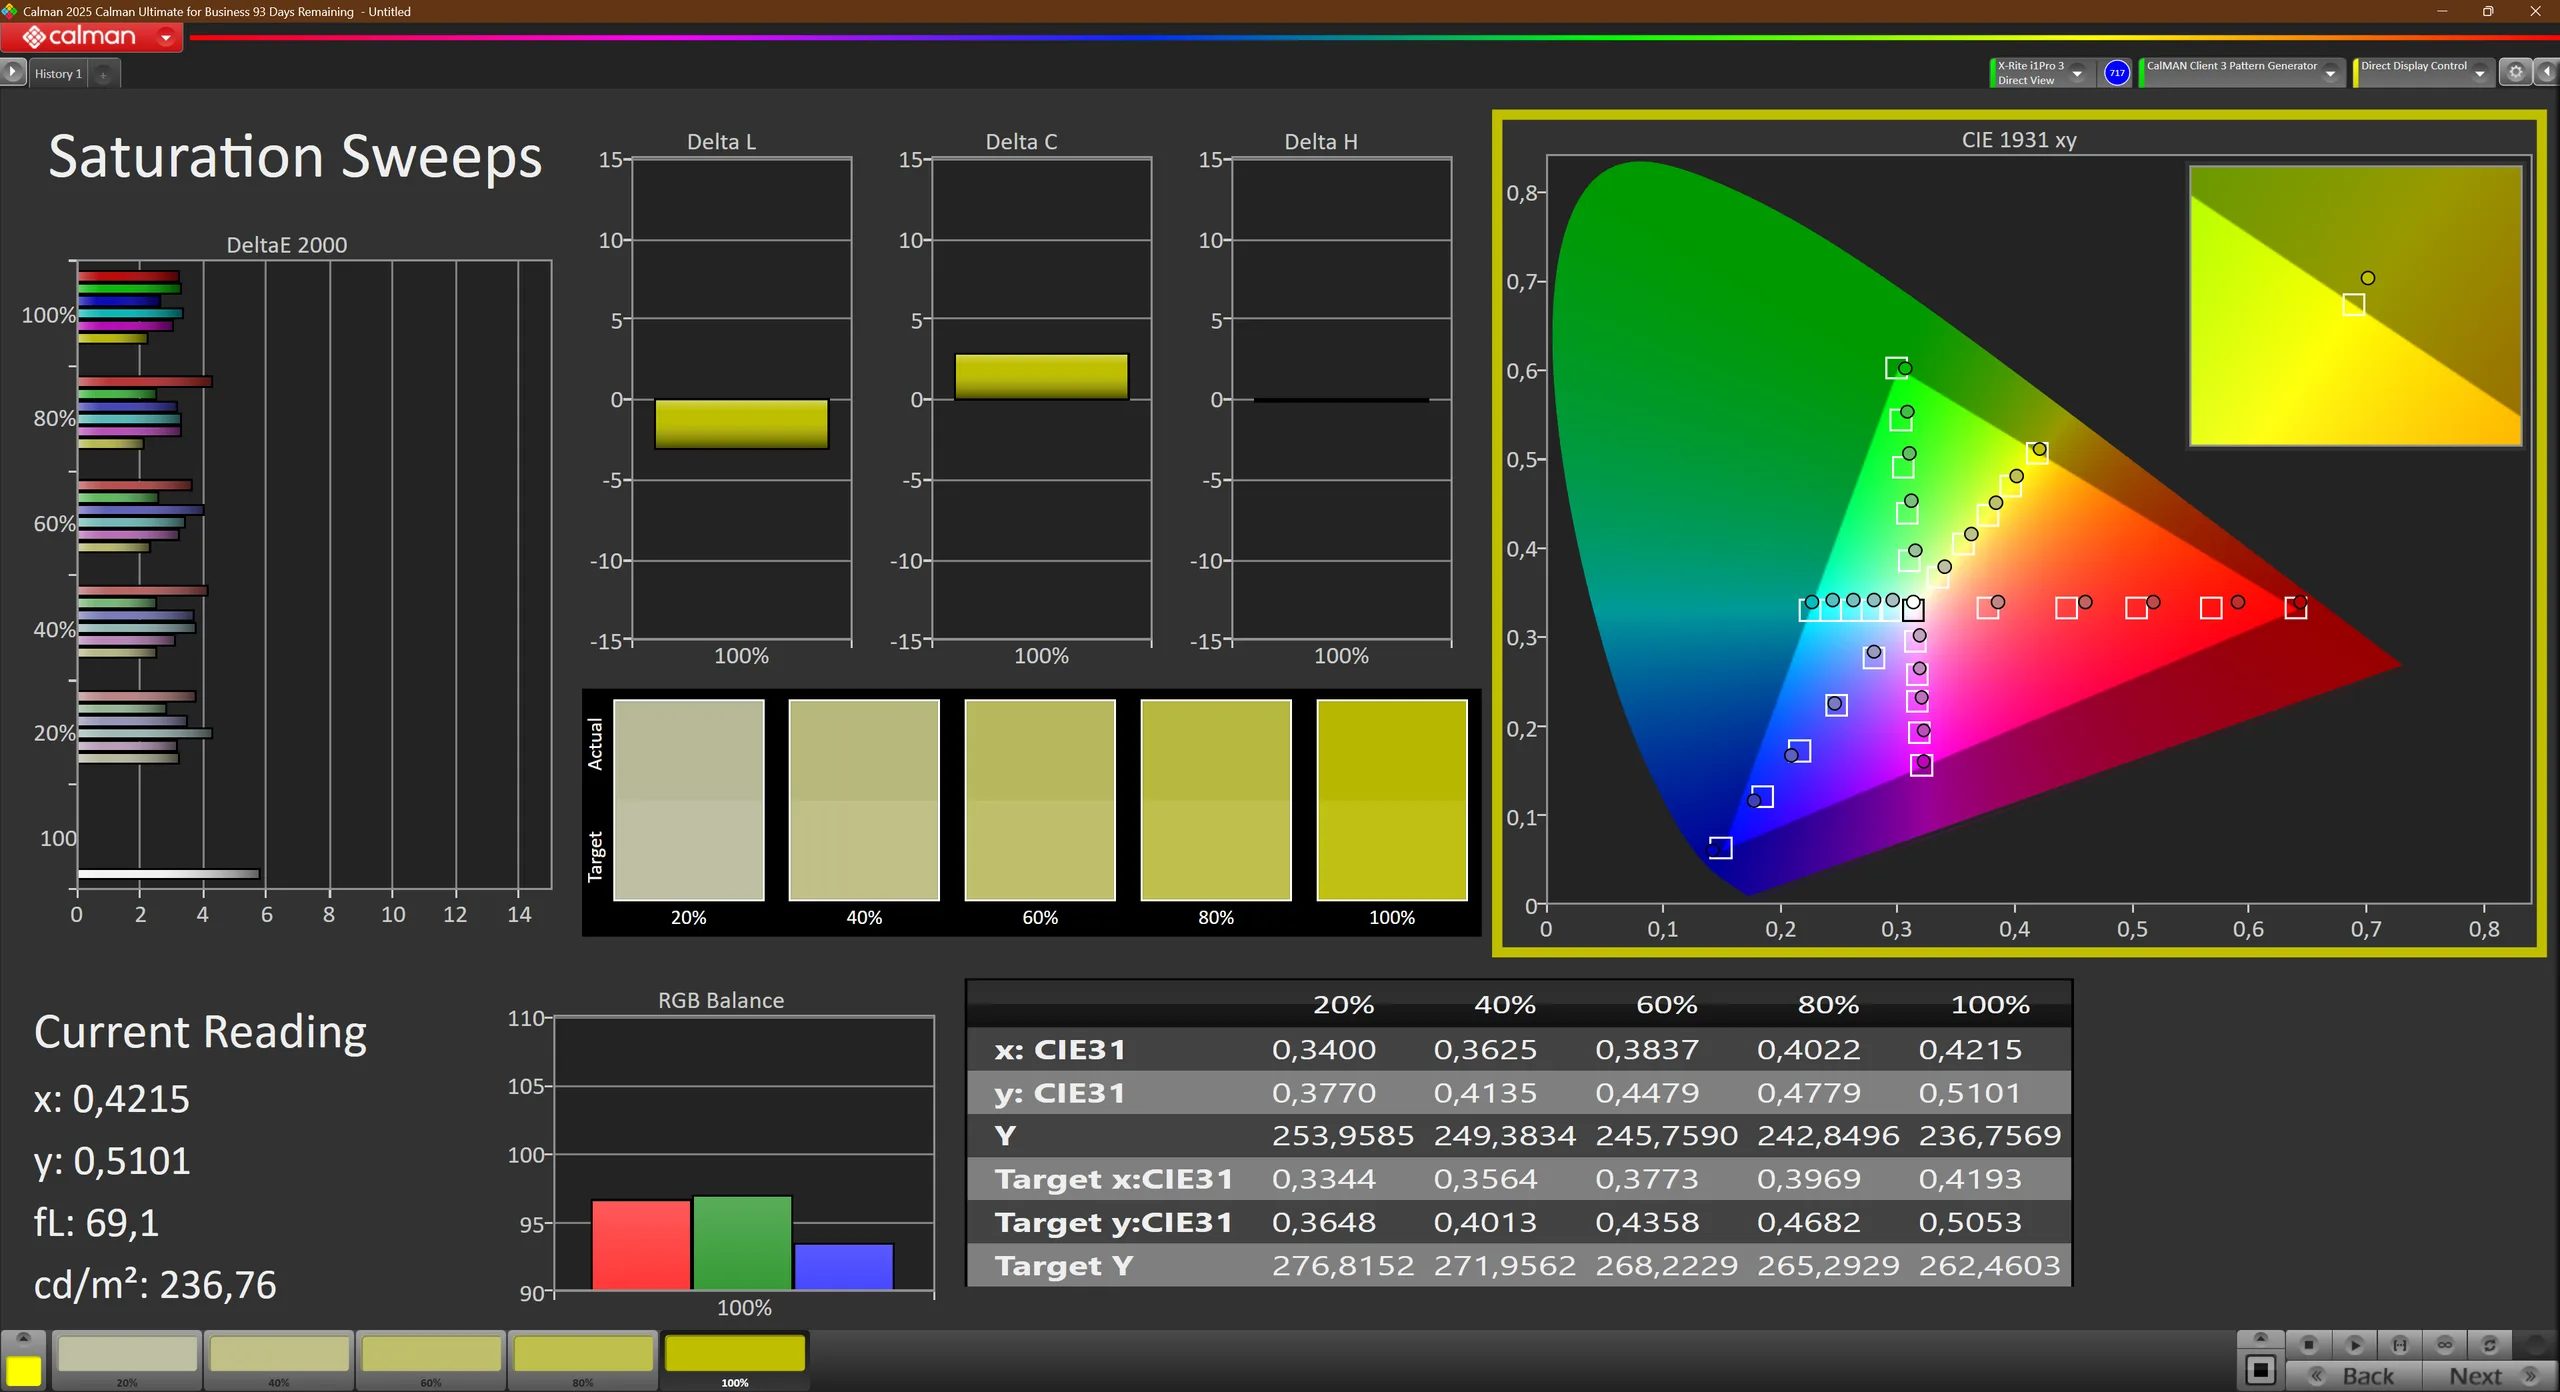

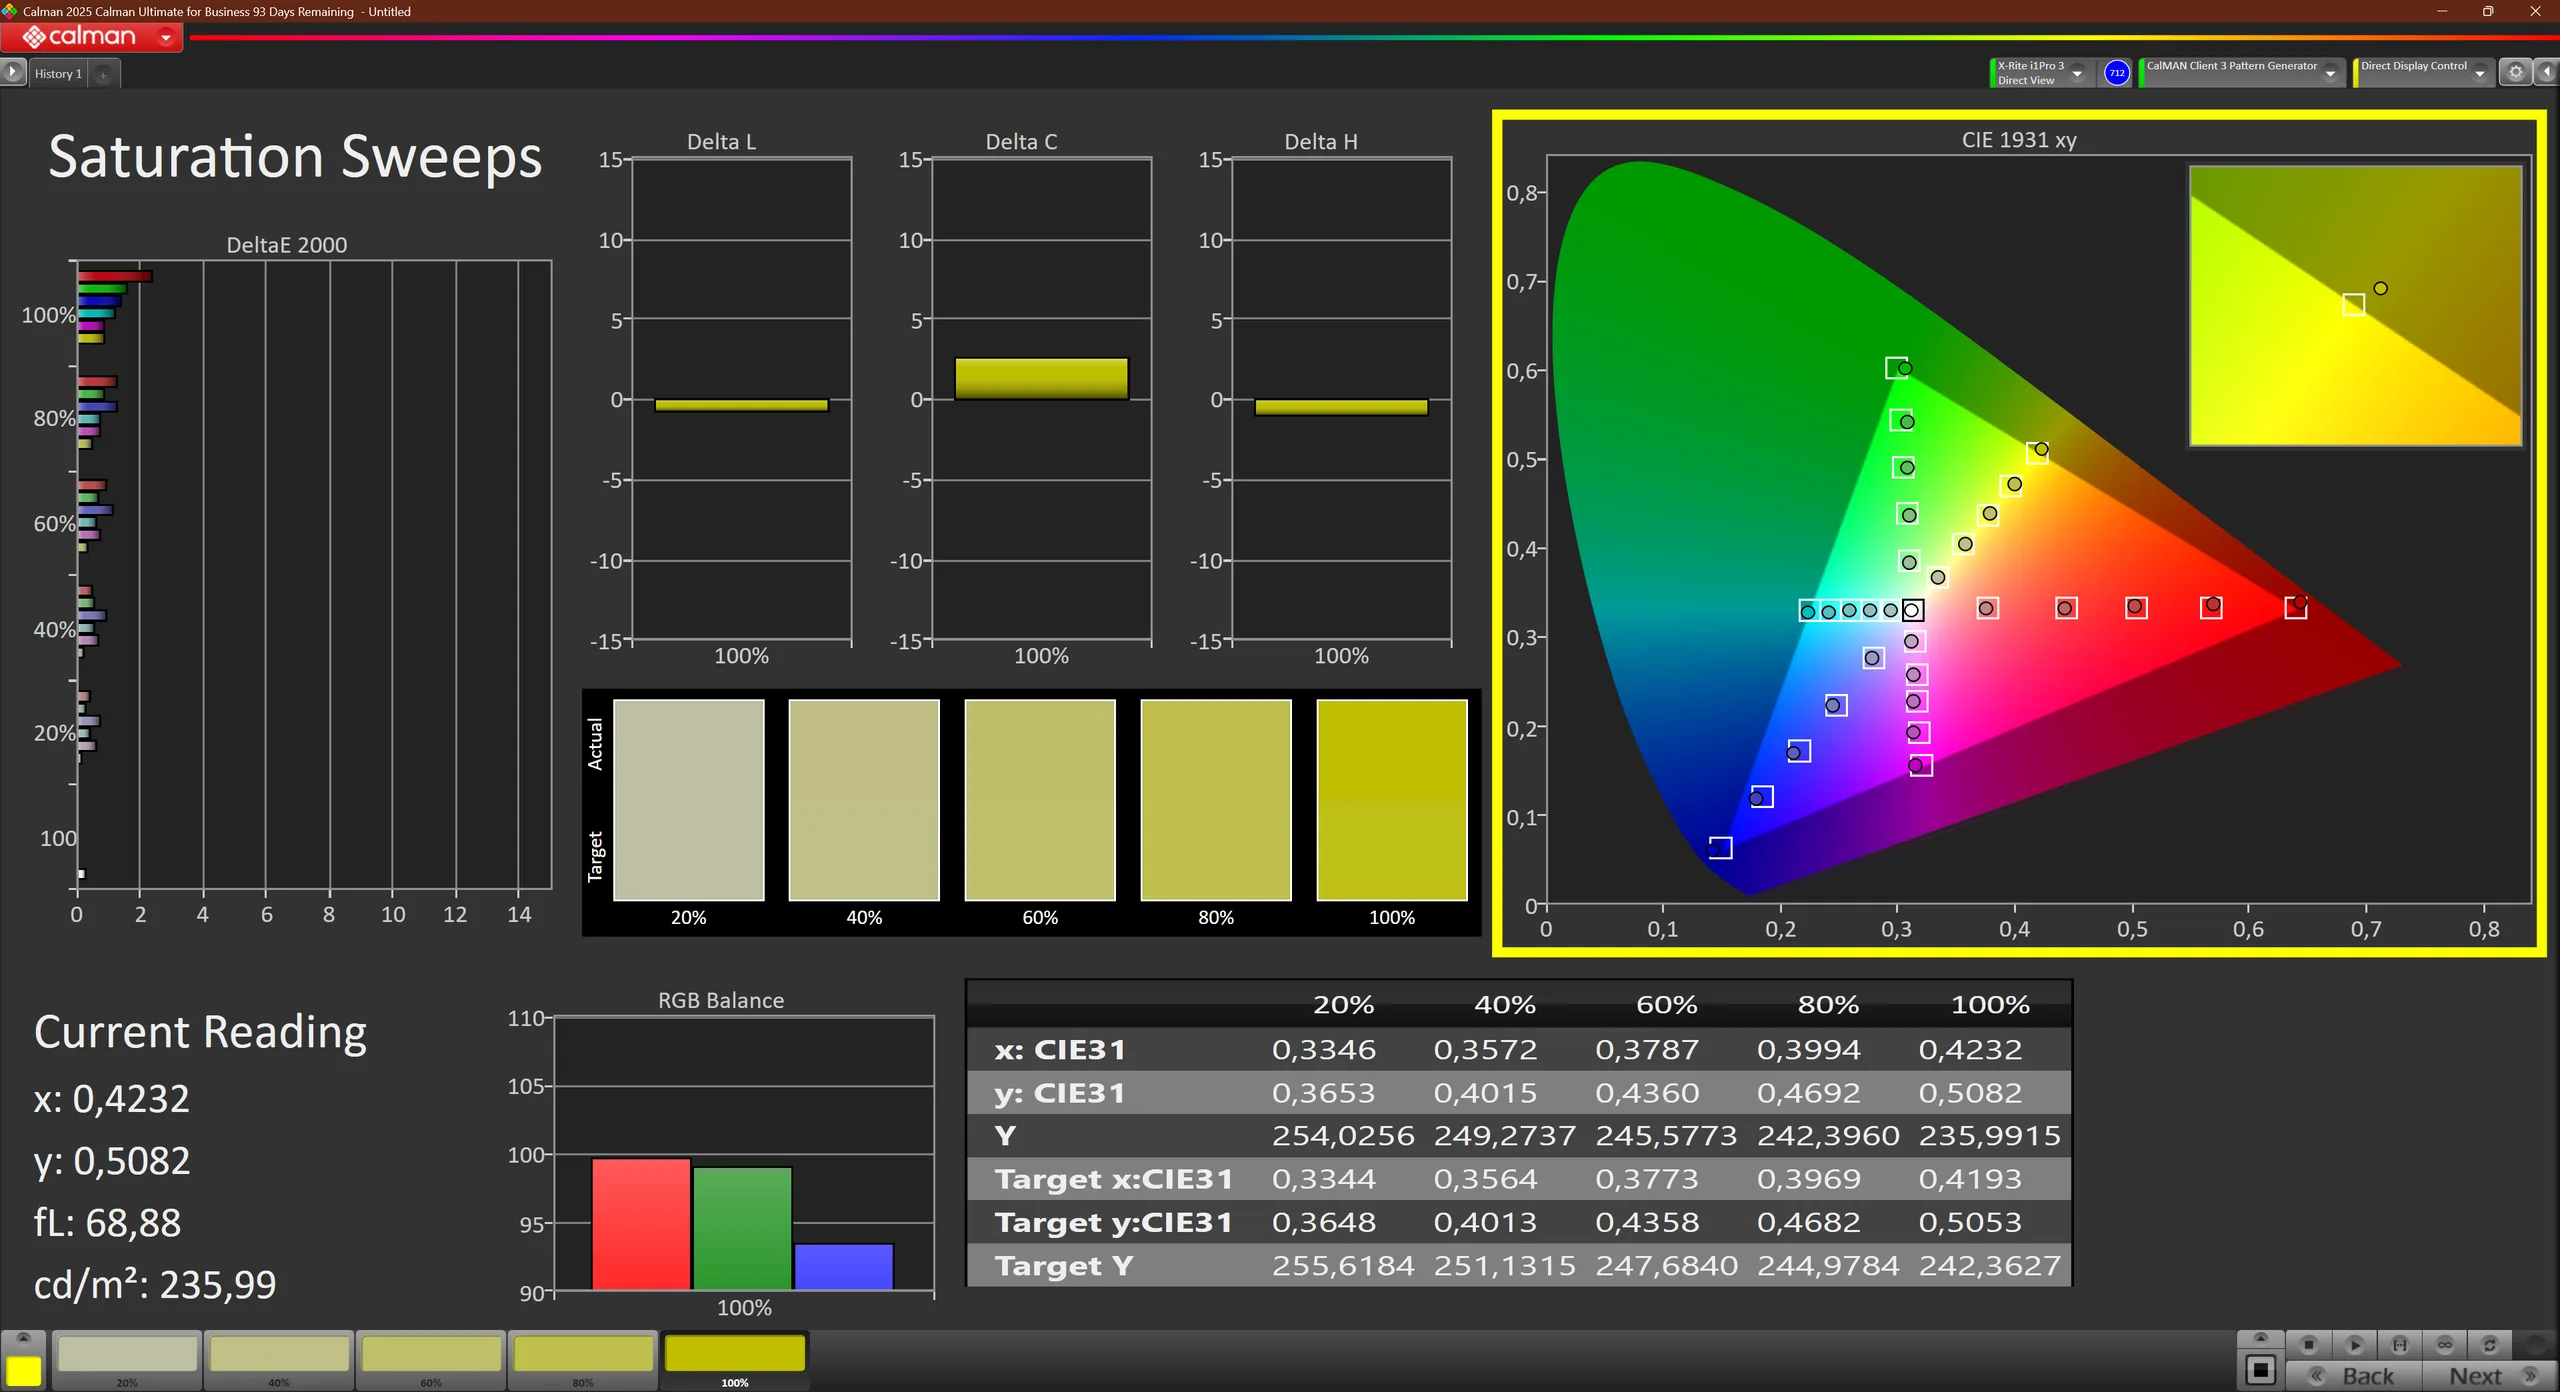

使用 X-Rite i1 Pro 3 和 i1Profiler 软件校准后,联想 ThinkPad P16s Gen 4 AMD 的色彩基本准确(Calman Colorchecker deltaE:0.9)。我们创建的配置文件可以一如既往地免费下载。
该面板略微偏离 100 % sRGB 目标,我们测量的 sRGB 覆盖率为 96.8%。该面板可用于简单的照片编辑。
得益于高亮度和哑光表面,联想 ThinkPad P16s Gen 4 可以在办公室外使用。即使是一些间接的阳光照射,该面板也能克服。

Display Response Times
| ↔ Response Time Black to White | ||
|---|---|---|
| 22.4 ms ... rise ↗ and fall ↘ combined | ↗ 12.8 ms rise | 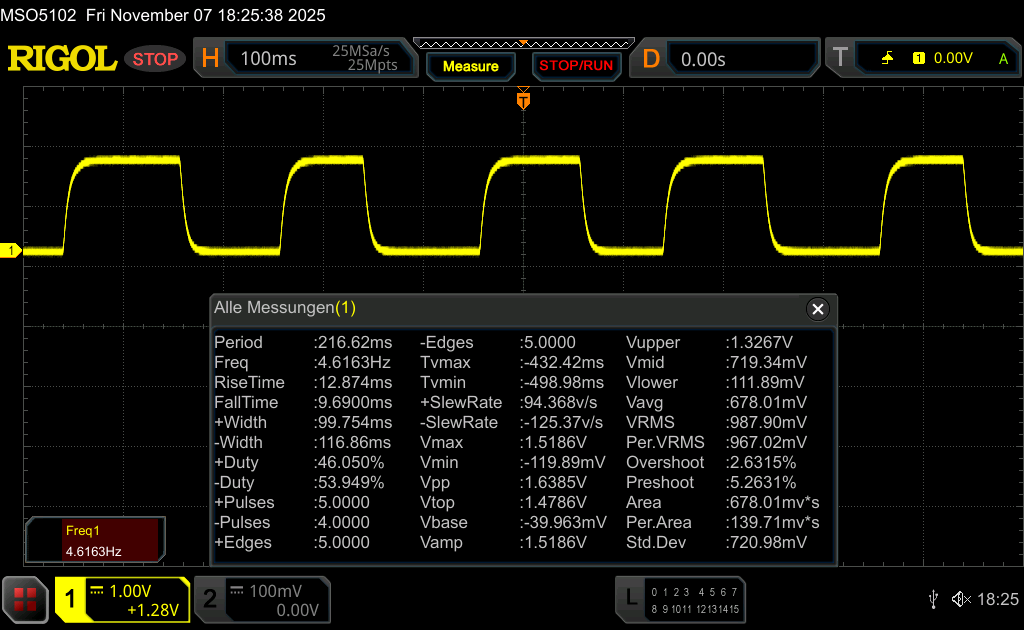 |
| ↘ 9.6 ms fall | ||
| The screen shows good response rates in our tests, but may be too slow for competitive gamers. In comparison, all tested devices range from 0.1 (minimum) to 240 (maximum) ms. » 51 % of all devices are better. This means that the measured response time is worse than the average of all tested devices (19.8 ms). | ||
| ↔ Response Time 50% Grey to 80% Grey | ||
| 29.4 ms ... rise ↗ and fall ↘ combined | ↗ 14.5 ms rise | 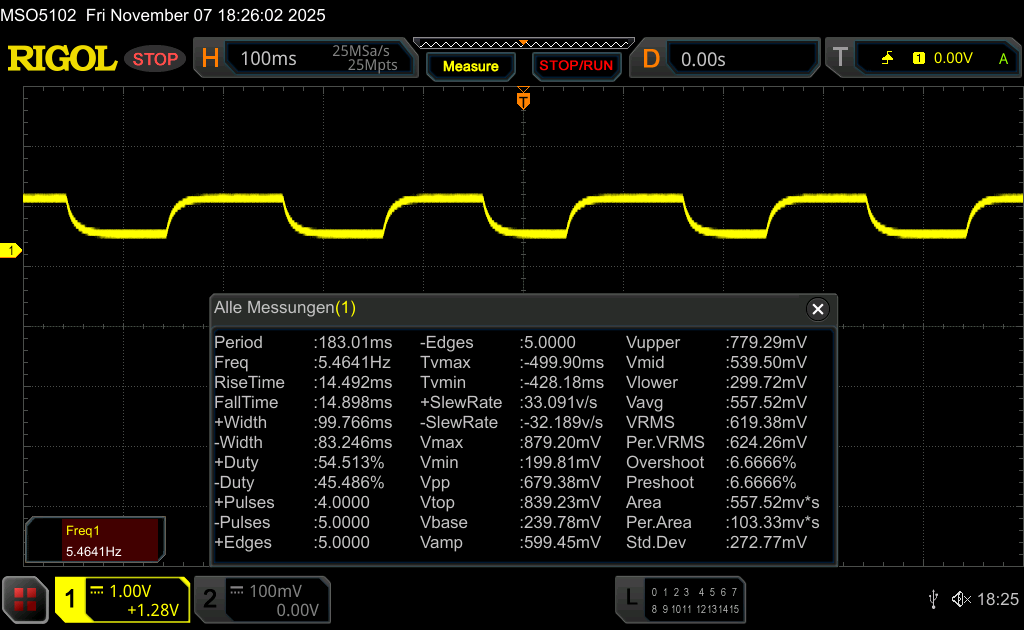 |
| ↘ 14.9 ms fall | ||
| The screen shows relatively slow response rates in our tests and may be too slow for gamers. In comparison, all tested devices range from 0.165 (minimum) to 636 (maximum) ms. » 40 % of all devices are better. This means that the measured response time is similar to the average of all tested devices (30.9 ms). | ||
Screen Flickering / PWM (Pulse-Width Modulation)
| Screen flickering / PWM not detected |  | ||
In comparison: 52 % of all tested devices do not use PWM to dim the display. If PWM was detected, an average of 7748 (minimum: 5 - maximum: 343500) Hz was measured. | |||


性能AMD Ryzen 笔记本电脑提供出色的 CPU 性能
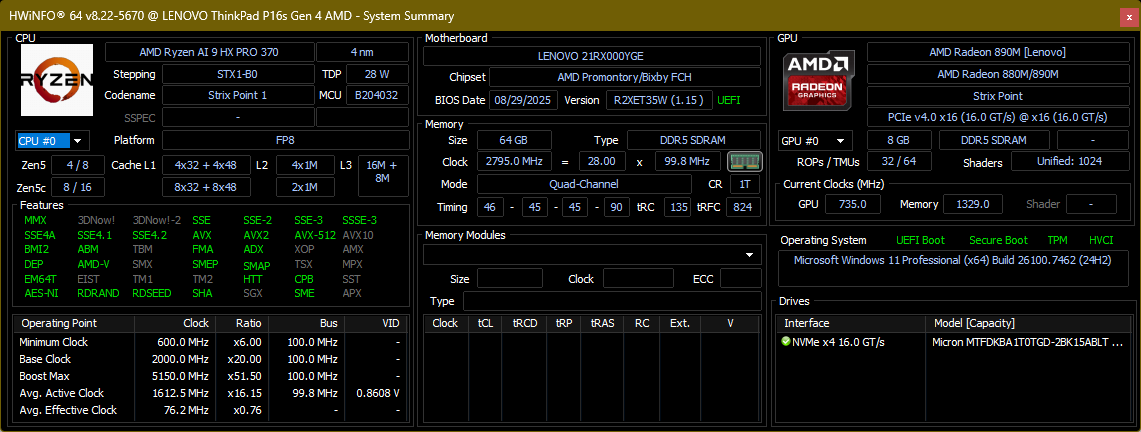
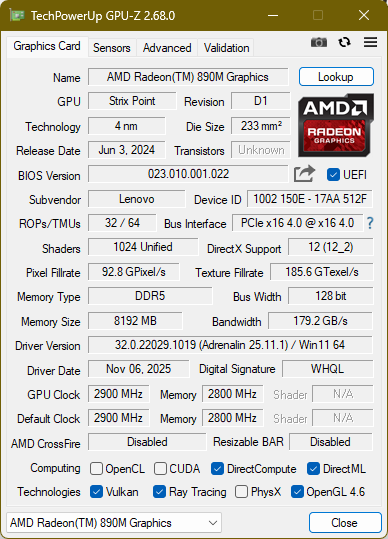
总共有三种不同的处理器 (AMD Ryzen AI 5 Pro 340, AMD Ryzen AI 7 Pro 350, AMD Ryzen AI 9 Pro HX 370)和集成 GPU (AMD Radeon 840M, Radeon 860M, Radeon 890M).
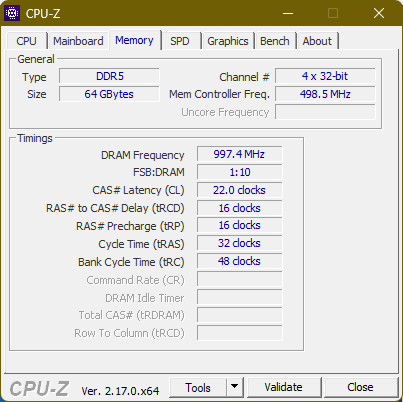
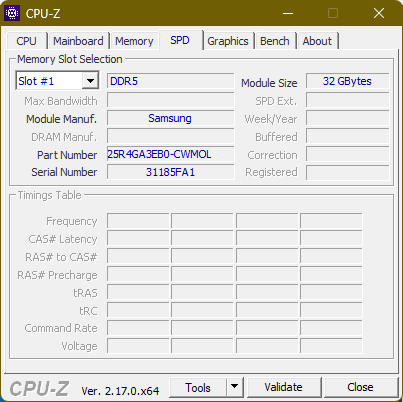
与旧款 P16s Gen 2 AMD 不同的是,内存不是焊接的。相反,联想 ThinkPad P16s G6 有两个 SO-DIMM,最多可容纳 96 GB DDR5-5600 内存。单个 M.2 2280 NVMe PCIe 4.0 固态硬盘用作存储,出厂容量高达 2 TB。
测试条件
一如既往,联想依靠 Windows 设置的电源模式来调节 ThinkPad P16s Gen 4 AMD 的性能。电源配置文件通过改变处理器的功耗限制(PL1 = 持续功耗,PL2 = 峰值功耗)来实现:
- 最佳电池寿命:PL1 26 W / PL2 30 W
- 平衡:PL1 32 W / PL2 35 W
- 最佳性能:PL1 36 瓦 / PL2 51 瓦
所有基准测试均使用 "最佳性能 "配置文件进行。
处理器
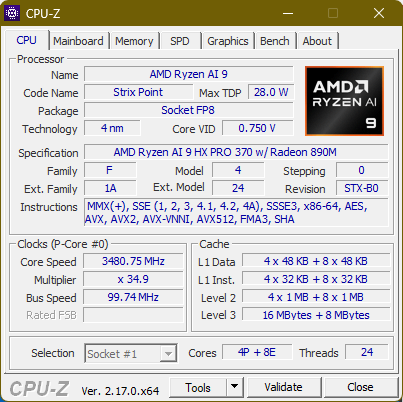
产品 AMD Ryzen AI 9 Pro HX 370 是 AMD 的一款高端处理器,拥有 12 个内核,典型功耗为 28 W。是 AMD 的一款高端处理器,拥有 12 个内核,典型功耗为 28 W。它有 4 个大型 Zen5 内核(最高 5.1 GHz)和 8 个 Zen5c 内核(最高 3.3 GHz)以及 24 个线程(得益于同步多线程技术 (SMT))。通过我们的 CPU 列表.
由于采用了 AMD CPU,联想 ThinkPad P16s Gen 4 AMD 在 CPU 性能方面远超同级产品。它轻松超越了自己的前代产品联想 ThinkPad P14s Gen 2 AMD(加 17%),与采用英特尔箭湖 H 处理器、价格昂贵得多的联想 ThinkPad P1 Gen 8 相比也不遑多让。
当设备使用电池供电时,CPU 不会出现节流现象。
Cinebench R15 多回路运行
Cinebench R23: Multi Core | Single Core
Cinebench R20: CPU (Multi Core) | CPU (Single Core)
Cinebench R15: CPU Multi 64Bit | CPU Single 64Bit
Blender: v2.79 BMW27 CPU
7-Zip 18.03: 7z b 4 | 7z b 4 -mmt1
Geekbench 6.7: Multi-Core | Single-Core
Geekbench 5.5: Multi-Core | Single-Core
HWBOT x265 Benchmark v2.2: 4k Preset
LibreOffice : 20 Documents To PDF
R Benchmark 2.5: Overall mean
| CPU Performance rating | |
| Average of class Workstation | |
| HP ZBook X G1i 16 | |
| Lenovo ThinkPad P1 Gen 8 | |
| Average AMD Ryzen AI 9 HX PRO 370 | |
| Lenovo ThinkPad P16s Gen 4 21RX000YGE | |
| Dell Precision 5690 | |
| Lenovo ThinkPad P16s G2 21K9000CGE | |
| Cinebench R23 / Multi Core | |
| Average of class Workstation (14621 - 38520, n=23, last 2 years) | |
| Lenovo ThinkPad P1 Gen 8 | |
| HP ZBook X G1i 16 | |
| Average AMD Ryzen AI 9 HX PRO 370 (18504 - 21474, n=3) | |
| Dell Precision 5690 | |
| Lenovo ThinkPad P16s Gen 4 21RX000YGE | |
| Lenovo ThinkPad P16s G2 21K9000CGE | |
| Cinebench R23 / Single Core | |
| Average of class Workstation (1712 - 2228, n=23, last 2 years) | |
| HP ZBook X G1i 16 | |
| Lenovo ThinkPad P1 Gen 8 | |
| Lenovo ThinkPad P16s Gen 4 21RX000YGE | |
| Average AMD Ryzen AI 9 HX PRO 370 (1939 - 2044, n=3) | |
| Dell Precision 5690 | |
| Lenovo ThinkPad P16s G2 21K9000CGE | |
| Cinebench R20 / CPU (Multi Core) | |
| Average of class Workstation (5760 - 15043, n=23, last 2 years) | |
| Lenovo ThinkPad P1 Gen 8 | |
| HP ZBook X G1i 16 | |
| Dell Precision 5690 | |
| Average AMD Ryzen AI 9 HX PRO 370 (6518 - 8414, n=3) | |
| Lenovo ThinkPad P16s Gen 4 21RX000YGE | |
| Lenovo ThinkPad P16s G2 21K9000CGE | |
| Cinebench R20 / CPU (Single Core) | |
| Lenovo ThinkPad P16s Gen 4 21RX000YGE | |
| Average AMD Ryzen AI 9 HX PRO 370 (757 - 796, n=3) | |
| Average of class Workstation (671 - 857, n=23, last 2 years) | |
| HP ZBook X G1i 16 | |
| Lenovo ThinkPad P1 Gen 8 | |
| Dell Precision 5690 | |
| Lenovo ThinkPad P16s G2 21K9000CGE | |
| Cinebench R15 / CPU Multi 64Bit | |
| Average of class Workstation (2489 - 5810, n=23, last 2 years) | |
| HP ZBook X G1i 16 | |
| Lenovo ThinkPad P1 Gen 8 | |
| Lenovo ThinkPad P16s Gen 4 21RX000YGE | |
| Average AMD Ryzen AI 9 HX PRO 370 (3082 - 3248, n=3) | |
| Dell Precision 5690 | |
| Lenovo ThinkPad P16s G2 21K9000CGE | |
| Cinebench R15 / CPU Single 64Bit | |
| Lenovo ThinkPad P16s Gen 4 21RX000YGE | |
| HP ZBook X G1i 16 | |
| Lenovo ThinkPad P1 Gen 8 | |
| Average of class Workstation (191.4 - 328, n=23, last 2 years) | |
| Average AMD Ryzen AI 9 HX PRO 370 (191.4 - 312, n=3) | |
| Dell Precision 5690 | |
| Lenovo ThinkPad P16s G2 21K9000CGE | |
| Blender / v2.79 BMW27 CPU | |
| Lenovo ThinkPad P16s G2 21K9000CGE | |
| Dell Precision 5690 | |
| Lenovo ThinkPad P16s Gen 4 21RX000YGE | |
| Lenovo ThinkPad P1 Gen 8 | |
| HP ZBook X G1i 16 | |
| Average AMD Ryzen AI 9 HX PRO 370 (152 - 171, n=3) | |
| Average of class Workstation (91 - 222, n=23, last 2 years) | |
| 7-Zip 18.03 / 7z b 4 | |
| Average of class Workstation (60489 - 116969, n=23, last 2 years) | |
| Average AMD Ryzen AI 9 HX PRO 370 (73642 - 79217, n=3) | |
| Dell Precision 5690 | |
| Lenovo ThinkPad P16s Gen 4 21RX000YGE | |
| HP ZBook X G1i 16 | |
| Lenovo ThinkPad P1 Gen 8 | |
| Lenovo ThinkPad P16s G2 21K9000CGE | |
| 7-Zip 18.03 / 7z b 4 -mmt1 | |
| Lenovo ThinkPad P16s Gen 4 21RX000YGE | |
| Average of class Workstation (5126 - 6960, n=23, last 2 years) | |
| Average AMD Ryzen AI 9 HX PRO 370 (6054 - 6344, n=3) | |
| HP ZBook X G1i 16 | |
| Lenovo ThinkPad P16s G2 21K9000CGE | |
| Lenovo ThinkPad P1 Gen 8 | |
| Dell Precision 5690 | |
| Geekbench 6.7 / Multi-Core | |
| HP ZBook X G1i 16 | |
| Lenovo ThinkPad P1 Gen 8 | |
| Average of class Workstation (12721 - 20887, n=23, last 2 years) | |
| Lenovo ThinkPad P16s Gen 4 21RX000YGE | |
| Average AMD Ryzen AI 9 HX PRO 370 (14066 - 15197, n=4) | |
| Dell Precision 5690 | |
| Lenovo ThinkPad P16s G2 21K9000CGE | |
| Geekbench 6.7 / Single-Core | |
| Lenovo ThinkPad P16s Gen 4 21RX000YGE | |
| HP ZBook X G1i 16 | |
| Average AMD Ryzen AI 9 HX PRO 370 (2864 - 2939, n=4) | |
| Average of class Workstation (2389 - 3065, n=23, last 2 years) | |
| Lenovo ThinkPad P1 Gen 8 | |
| Dell Precision 5690 | |
| Lenovo ThinkPad P16s G2 21K9000CGE | |
| Geekbench 5.5 / Multi-Core | |
| Average of class Workstation (11542 - 25554, n=23, last 2 years) | |
| Lenovo ThinkPad P1 Gen 8 | |
| HP ZBook X G1i 16 | |
| Lenovo ThinkPad P16s Gen 4 21RX000YGE | |
| Average AMD Ryzen AI 9 HX PRO 370 (14518 - 14791, n=3) | |
| Dell Precision 5690 | |
| Lenovo ThinkPad P16s G2 21K9000CGE | |
| Geekbench 5.5 / Single-Core | |
| Lenovo ThinkPad P16s Gen 4 21RX000YGE | |
| Average AMD Ryzen AI 9 HX PRO 370 (2097 - 2130, n=3) | |
| HP ZBook X G1i 16 | |
| Average of class Workstation (1783 - 2183, n=23, last 2 years) | |
| Lenovo ThinkPad P1 Gen 8 | |
| Dell Precision 5690 | |
| Lenovo ThinkPad P16s G2 21K9000CGE | |
| HWBOT x265 Benchmark v2.2 / 4k Preset | |
| Average of class Workstation (17.8 - 40.5, n=23, last 2 years) | |
| Lenovo ThinkPad P1 Gen 8 | |
| HP ZBook X G1i 16 | |
| Average AMD Ryzen AI 9 HX PRO 370 (23 - 25.1, n=3) | |
| Lenovo ThinkPad P16s Gen 4 21RX000YGE | |
| Dell Precision 5690 | |
| Lenovo ThinkPad P16s G2 21K9000CGE | |
| LibreOffice / 20 Documents To PDF | |
| Lenovo ThinkPad P16s Gen 4 21RX000YGE | |
| Average AMD Ryzen AI 9 HX PRO 370 (51.5 - 72.6, n=3) | |
| Lenovo ThinkPad P16s G2 21K9000CGE | |
| Average of class Workstation (37.1 - 74.7, n=23, last 2 years) | |
| HP ZBook X G1i 16 | |
| Dell Precision 5690 | |
| Lenovo ThinkPad P1 Gen 8 | |
| R Benchmark 2.5 / Overall mean | |
| Lenovo ThinkPad P16s Gen 4 21RX000YGE | |
| Average AMD Ryzen AI 9 HX PRO 370 (0.413 - 0.603, n=3) | |
| Lenovo ThinkPad P16s G2 21K9000CGE | |
| Dell Precision 5690 | |
| Lenovo ThinkPad P1 Gen 8 | |
| Average of class Workstation (0.3825 - 0.603, n=23, last 2 years) | |
| HP ZBook X G1i 16 | |
* ... smaller is better
AIDA64: FP32 Ray-Trace | FPU Julia | CPU SHA3 | CPU Queen | FPU SinJulia | FPU Mandel | CPU AES | CPU ZLib | FP64 Ray-Trace | CPU PhotoWorxx
| Performance rating | |
| Average of class Workstation | |
| Average AMD Ryzen AI 9 HX PRO 370 | |
| Lenovo ThinkPad P16s Gen 4 21RX000YGE | |
| Lenovo ThinkPad P1 Gen 8 | |
| Lenovo ThinkPad P16s G2 21K9000CGE | |
| Dell Precision 5690 | |
| AIDA64 / FP32 Ray-Trace | |
| Average AMD Ryzen AI 9 HX PRO 370 (29194 - 33973, n=3) | |
| Lenovo ThinkPad P16s Gen 4 21RX000YGE | |
| Average of class Workstation (16730 - 61611, n=23, last 2 years) | |
| Lenovo ThinkPad P1 Gen 8 | |
| Lenovo ThinkPad P16s G2 21K9000CGE | |
| Dell Precision 5690 | |
| AIDA64 / FPU Julia | |
| Average of class Workstation (89597 - 186971, n=23, last 2 years) | |
| Lenovo ThinkPad P1 Gen 8 | |
| Average AMD Ryzen AI 9 HX PRO 370 (109627 - 128877, n=3) | |
| Lenovo ThinkPad P16s Gen 4 21RX000YGE | |
| Lenovo ThinkPad P16s G2 21K9000CGE | |
| Dell Precision 5690 | |
| AIDA64 / CPU SHA3 | |
| Average of class Workstation (4178 - 8975, n=23, last 2 years) | |
| Lenovo ThinkPad P1 Gen 8 | |
| Average AMD Ryzen AI 9 HX PRO 370 (5088 - 5560, n=3) | |
| Lenovo ThinkPad P16s Gen 4 21RX000YGE | |
| Lenovo ThinkPad P16s G2 21K9000CGE | |
| Dell Precision 5690 | |
| AIDA64 / CPU Queen | |
| Average of class Workstation (60778 - 144411, n=23, last 2 years) | |
| Lenovo ThinkPad P16s G2 21K9000CGE | |
| Dell Precision 5690 | |
| Lenovo ThinkPad P16s Gen 4 21RX000YGE | |
| Average AMD Ryzen AI 9 HX PRO 370 (88754 - 92656, n=3) | |
| Lenovo ThinkPad P1 Gen 8 | |
| AIDA64 / FPU SinJulia | |
| Average AMD Ryzen AI 9 HX PRO 370 (17800 - 18684, n=3) | |
| Lenovo ThinkPad P16s Gen 4 21RX000YGE | |
| Lenovo ThinkPad P16s G2 21K9000CGE | |
| Average of class Workstation (8165 - 29343, n=23, last 2 years) | |
| Dell Precision 5690 | |
| Lenovo ThinkPad P1 Gen 8 | |
| AIDA64 / FPU Mandel | |
| Average of class Workstation (44497 - 98153, n=23, last 2 years) | |
| Average AMD Ryzen AI 9 HX PRO 370 (59117 - 68633, n=3) | |
| Lenovo ThinkPad P1 Gen 8 | |
| Lenovo ThinkPad P16s Gen 4 21RX000YGE | |
| Lenovo ThinkPad P16s G2 21K9000CGE | |
| Dell Precision 5690 | |
| AIDA64 / CPU AES | |
| Average of class Workstation (73133 - 187841, n=23, last 2 years) | |
| Lenovo ThinkPad P16s Gen 4 21RX000YGE | |
| Average AMD Ryzen AI 9 HX PRO 370 (79496 - 104163, n=3) | |
| Dell Precision 5690 | |
| Lenovo ThinkPad P1 Gen 8 | |
| Lenovo ThinkPad P16s G2 21K9000CGE | |
| AIDA64 / CPU ZLib | |
| Average of class Workstation (929 - 2148, n=23, last 2 years) | |
| Dell Precision 5690 | |
| Lenovo ThinkPad P1 Gen 8 | |
| Average AMD Ryzen AI 9 HX PRO 370 (1222 - 1416, n=3) | |
| Lenovo ThinkPad P16s Gen 4 21RX000YGE | |
| Lenovo ThinkPad P16s G2 21K9000CGE | |
| AIDA64 / FP64 Ray-Trace | |
| Average AMD Ryzen AI 9 HX PRO 370 (15751 - 18241, n=3) | |
| Lenovo ThinkPad P16s Gen 4 21RX000YGE | |
| Average of class Workstation (8545 - 32891, n=23, last 2 years) | |
| Lenovo ThinkPad P1 Gen 8 | |
| Lenovo ThinkPad P16s G2 21K9000CGE | |
| Dell Precision 5690 | |
| AIDA64 / CPU PhotoWorxx | |
| Lenovo ThinkPad P1 Gen 8 | |
| Dell Precision 5690 | |
| Average of class Workstation (37151 - 93684, n=23, last 2 years) | |
| Lenovo ThinkPad P16s Gen 4 21RX000YGE | |
| Average AMD Ryzen AI 9 HX PRO 370 (47197 - 50943, n=3) | |
| Lenovo ThinkPad P16s G2 21K9000CGE | |
系统性能
联想 ThinkPad P16s 第 4 代 AMD 处理器在日常使用中的性能并不吃力,在我们的基准测试中也表现出色。当然,更厚、更大、拥有更强散热系统和处理器的工作站在这方面更胜一筹。
PCMark 10: Score | Essentials | Productivity | Digital Content Creation
CrossMark: Overall | Productivity | Creativity | Responsiveness
WebXPRT 3: Overall
WebXPRT 4: Overall
Mozilla Kraken 1.1: Total
| Performance rating | |
| Lenovo ThinkPad P1 Gen 8 | |
| HP ZBook X G1i 16 -4! | |
| Average of class Workstation | |
| Dell Precision 5690 | |
| Average AMD Ryzen AI 9 HX PRO 370, AMD Radeon 890M | |
| Lenovo ThinkPad P16s Gen 4 21RX000YGE | |
| Lenovo ThinkPad P16s G2 21K9000CGE -1! | |
| PCMark 10 / Score | |
| Lenovo ThinkPad P1 Gen 8 | |
| Average of class Workstation (6563 - 10409, n=19, last 2 years) | |
| Dell Precision 5690 | |
| Lenovo ThinkPad P16s Gen 4 21RX000YGE | |
| Average AMD Ryzen AI 9 HX PRO 370, AMD Radeon 890M (7368 - 7478, n=3) | |
| Lenovo ThinkPad P16s G2 21K9000CGE | |
| PCMark 10 / Essentials | |
| Dell Precision 5690 | |
| Lenovo ThinkPad P16s Gen 4 21RX000YGE | |
| Average AMD Ryzen AI 9 HX PRO 370, AMD Radeon 890M (10509 - 10950, n=3) | |
| Lenovo ThinkPad P1 Gen 8 | |
| Average of class Workstation (9622 - 11157, n=19, last 2 years) | |
| Lenovo ThinkPad P16s G2 21K9000CGE | |
| PCMark 10 / Productivity | |
| Lenovo ThinkPad P1 Gen 8 | |
| Average of class Workstation (8789 - 20616, n=19, last 2 years) | |
| Dell Precision 5690 | |
| Lenovo ThinkPad P16s Gen 4 21RX000YGE | |
| Average AMD Ryzen AI 9 HX PRO 370, AMD Radeon 890M (9733 - 10069, n=3) | |
| Lenovo ThinkPad P16s G2 21K9000CGE | |
| PCMark 10 / Digital Content Creation | |
| Average of class Workstation (8108 - 15631, n=19, last 2 years) | |
| Lenovo ThinkPad P1 Gen 8 | |
| Dell Precision 5690 | |
| Lenovo ThinkPad P16s Gen 4 21RX000YGE | |
| Average AMD Ryzen AI 9 HX PRO 370, AMD Radeon 890M (10226 - 10614, n=3) | |
| Lenovo ThinkPad P16s G2 21K9000CGE | |
| CrossMark / Overall | |
| HP ZBook X G1i 16 | |
| Lenovo ThinkPad P1 Gen 8 | |
| Average of class Workstation (1307 - 2267, n=22, last 2 years) | |
| Dell Precision 5690 | |
| Average AMD Ryzen AI 9 HX PRO 370, AMD Radeon 890M (1307 - 1835, n=3) | |
| Lenovo ThinkPad P16s G2 21K9000CGE | |
| Lenovo ThinkPad P16s Gen 4 21RX000YGE | |
| CrossMark / Productivity | |
| HP ZBook X G1i 16 | |
| Lenovo ThinkPad P1 Gen 8 | |
| Average of class Workstation (1130 - 2122, n=22, last 2 years) | |
| Dell Precision 5690 | |
| Lenovo ThinkPad P16s G2 21K9000CGE | |
| Average AMD Ryzen AI 9 HX PRO 370, AMD Radeon 890M (1130 - 1720, n=3) | |
| Lenovo ThinkPad P16s Gen 4 21RX000YGE | |
| CrossMark / Creativity | |
| HP ZBook X G1i 16 | |
| Average of class Workstation (1657 - 2725, n=22, last 2 years) | |
| Lenovo ThinkPad P1 Gen 8 | |
| Dell Precision 5690 | |
| Average AMD Ryzen AI 9 HX PRO 370, AMD Radeon 890M (1657 - 2139, n=3) | |
| Lenovo ThinkPad P16s G2 21K9000CGE | |
| Lenovo ThinkPad P16s Gen 4 21RX000YGE | |
| CrossMark / Responsiveness | |
| Lenovo ThinkPad P1 Gen 8 | |
| Average of class Workstation (993 - 2096, n=22, last 2 years) | |
| Dell Precision 5690 | |
| HP ZBook X G1i 16 | |
| Average AMD Ryzen AI 9 HX PRO 370, AMD Radeon 890M (993 - 1650, n=3) | |
| Lenovo ThinkPad P16s G2 21K9000CGE | |
| Lenovo ThinkPad P16s Gen 4 21RX000YGE | |
| WebXPRT 3 / Overall | |
| Lenovo ThinkPad P1 Gen 8 | |
| HP ZBook X G1i 16 | |
| Average of class Workstation (260 - 360, n=23, last 2 years) | |
| Lenovo ThinkPad P16s Gen 4 21RX000YGE | |
| Average AMD Ryzen AI 9 HX PRO 370, AMD Radeon 890M (285 - 331, n=3) | |
| Dell Precision 5690 | |
| Lenovo ThinkPad P16s G2 21K9000CGE | |
| WebXPRT 4 / Overall | |
| HP ZBook X G1i 16 | |
| Lenovo ThinkPad P1 Gen 8 | |
| Average of class Workstation (189.2 - 326, n=23, last 2 years) | |
| Dell Precision 5690 | |
| Average AMD Ryzen AI 9 HX PRO 370, AMD Radeon 890M (189.2 - 280, n=3) | |
| Lenovo ThinkPad P16s Gen 4 21RX000YGE | |
| Mozilla Kraken 1.1 / Total | |
| Lenovo ThinkPad P16s G2 21K9000CGE | |
| Dell Precision 5690 | |
| Lenovo ThinkPad P16s Gen 4 21RX000YGE | |
| Lenovo ThinkPad P1 Gen 8 | |
| Average AMD Ryzen AI 9 HX PRO 370, AMD Radeon 890M (443 - 473, n=3) | |
| HP ZBook X G1i 16 | |
| Average of class Workstation (411 - 538, n=23, last 2 years) | |
* ... smaller is better
| PCMark 10 Score | 7478 points | |
Help | ||
| AIDA64 / Memory Copy | |
| Lenovo ThinkPad P1 Gen 8 | |
| Dell Precision 5690 | |
| Average of class Workstation (56003 - 164795, n=23, last 2 years) | |
| Lenovo ThinkPad P16s Gen 4 21RX000YGE | |
| Average AMD Ryzen AI 9 HX PRO 370 (72322 - 73385, n=3) | |
| Lenovo ThinkPad P16s G2 21K9000CGE | |
| AIDA64 / Memory Read | |
| Dell Precision 5690 | |
| Average AMD Ryzen AI 9 HX PRO 370 (83486 - 86229, n=3) | |
| Lenovo ThinkPad P16s Gen 4 21RX000YGE | |
| Average of class Workstation (55795 - 121563, n=23, last 2 years) | |
| Lenovo ThinkPad P1 Gen 8 | |
| Lenovo ThinkPad P16s G2 21K9000CGE | |
| AIDA64 / Memory Write | |
| Lenovo ThinkPad P16s G2 21K9000CGE | |
| Average of class Workstation (55663 - 214520, n=23, last 2 years) | |
| Average AMD Ryzen AI 9 HX PRO 370 (80783 - 85195, n=3) | |
| Lenovo ThinkPad P16s Gen 4 21RX000YGE | |
| Dell Precision 5690 | |
| Lenovo ThinkPad P1 Gen 8 | |
| AIDA64 / Memory Latency | |
| Dell Precision 5690 | |
| Lenovo ThinkPad P1 Gen 8 | |
| Lenovo ThinkPad P16s G2 21K9000CGE | |
| Average of class Workstation (84.5 - 165.2, n=23, last 2 years) | |
| Average AMD Ryzen AI 9 HX PRO 370 (100.1 - 103.4, n=3) | |
| Lenovo ThinkPad P16s Gen 4 21RX000YGE | |
* ... smaller is better
DPC 延迟
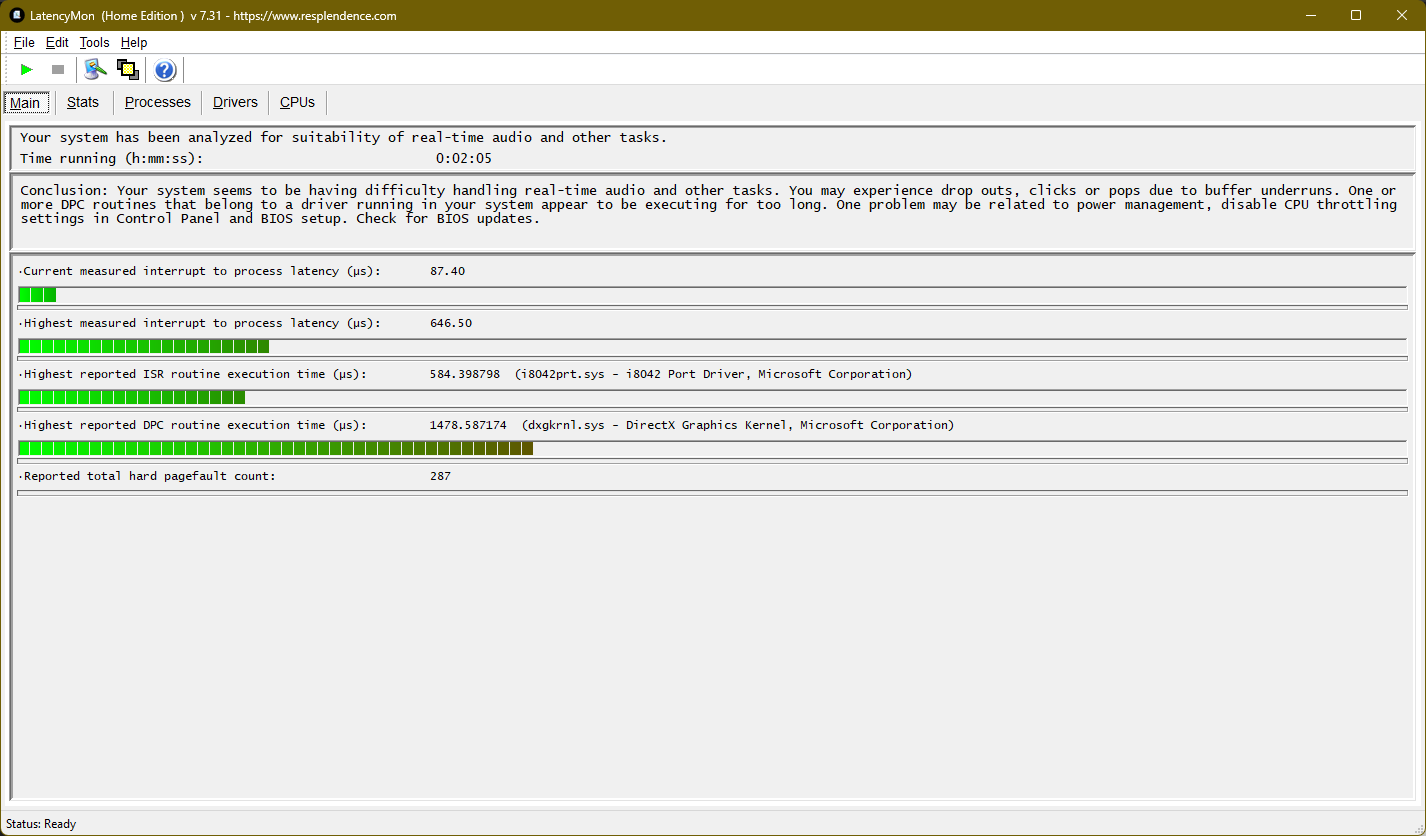
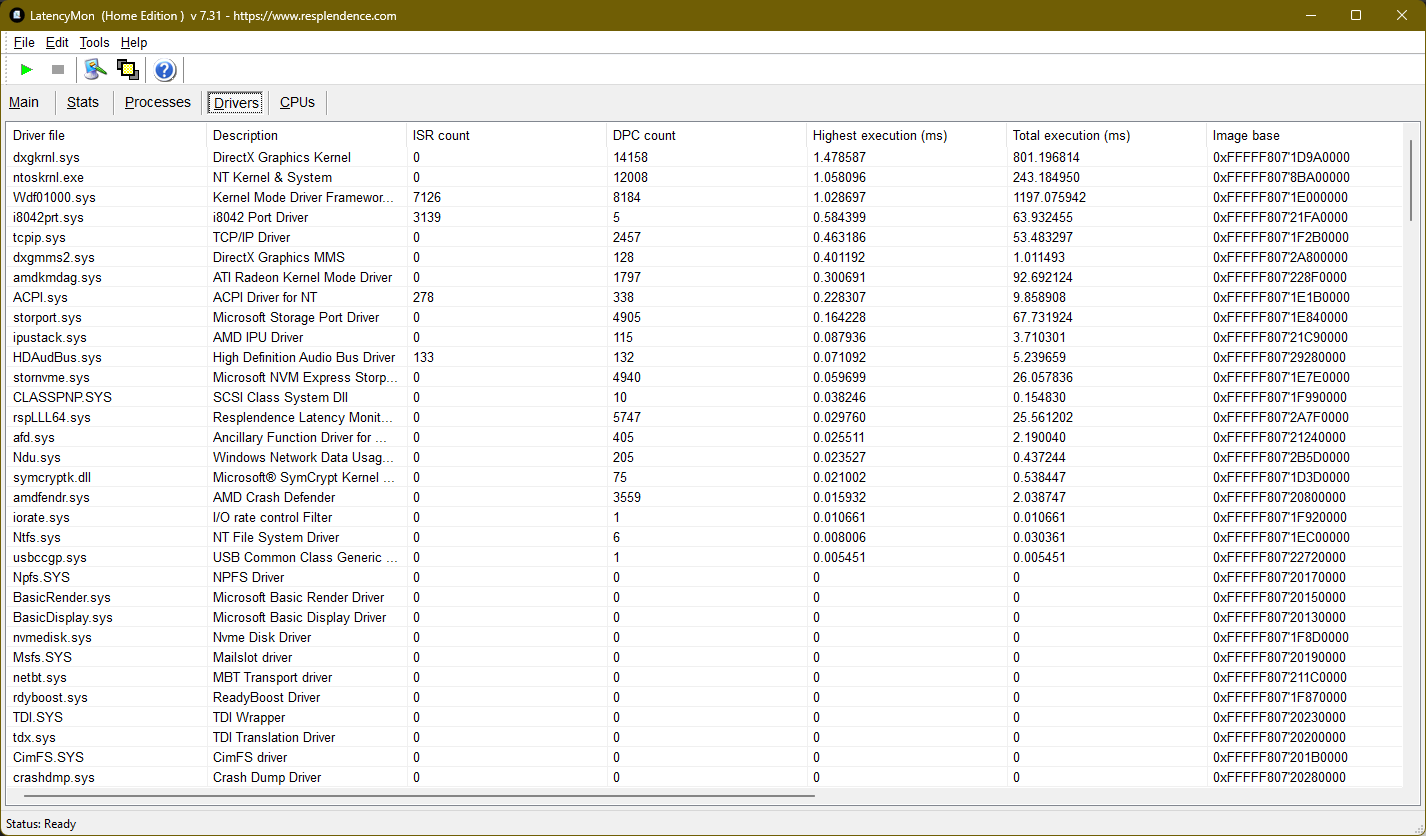
| DPC Latencies / LatencyMon - interrupt to process latency (max), Web, Youtube, Prime95 | |
| Lenovo ThinkPad P1 Gen 8 | |
| Lenovo ThinkPad P16s G2 21K9000CGE | |
| Lenovo ThinkPad P16s Gen 4 21RX000YGE | |
| HP ZBook X G1i 16 | |
| Dell Precision 5690 | |
* ... smaller is better
存储设备
联想使用的是 M.2 2280 SSD,对于 NVMe PCIe 4.0 驱动器来说速度一般。不过,容量为 1 TB 的美光固态硬盘在日常使用中速度仍然很快,而且在持续负载下也不会出现节流现象。

* ... smaller is better
磁盘节流DiskSpd 读取循环,队列深度 8
图形处理器性能
图形性能仍然是联想 ThinkPad P16s Gen 4 AMD 的一个弱点。没有专用图形芯片,它根本无法与之抗衡。至少,与老款联想 ThinkPad P16s 第 2 代 AMD 相比,GPU 性能还有所提升,这要归功于 AMD Radeon 890M,根据不同的应用,大约可提升 10% 至 15%。对于非常简单的 CAD 工作,P16s Gen 4 应该没问题。
| 3DMark 11 Performance | 13499 points | |
| 3DMark Fire Strike Score | 8001 points | |
| 3DMark Time Spy Score | 3583 points | |
Help | ||
* ... smaller is better
| Performance rating - Percent | |
| Dell Precision 5690 -1! | |
| Lenovo ThinkPad P1 Gen 8 | |
| HP ZBook X G1i 16 | |
| Average of class Workstation | |
| Lenovo ThinkPad P16s Gen 4 21RX000YGE | |
| Lenovo ThinkPad P16s G2 21K9000CGE -2! | |
| Cyberpunk 2077 - 1920x1080 Ultra Preset (FSR off) | |
| Dell Precision 5690 | |
| Average of class Workstation (21.5 - 152.4, n=23, last 2 years) | |
| Lenovo ThinkPad P1 Gen 8 | |
| HP ZBook X G1i 16 | |
| Lenovo ThinkPad P16s Gen 4 21RX000YGE | |
| Baldur's Gate 3 - 1920x1080 Ultra Preset AA:T | |
| Dell Precision 5690 | |
| Lenovo ThinkPad P1 Gen 8 | |
| Average of class Workstation (23.7 - 205, n=24, last 2 years) | |
| HP ZBook X G1i 16 | |
| Lenovo ThinkPad P16s Gen 4 21RX000YGE | |
| GTA V - 1920x1080 Highest AA:4xMSAA + FX AF:16x | |
| Lenovo ThinkPad P1 Gen 8 | |
| HP ZBook X G1i 16 | |
| Average of class Workstation (18.1 - 156.1, n=23, last 2 years) | |
| Lenovo ThinkPad P16s Gen 4 21RX000YGE | |
| Lenovo ThinkPad P16s G2 21K9000CGE | |
| Final Fantasy XV Benchmark - 1920x1080 High Quality | |
| Dell Precision 5690 | |
| Lenovo ThinkPad P1 Gen 8 | |
| Average of class Workstation (26.4 - 197.6, n=23, last 2 years) | |
| HP ZBook X G1i 16 | |
| Lenovo ThinkPad P16s Gen 4 21RX000YGE | |
| Lenovo ThinkPad P16s G2 21K9000CGE | |
| Dota 2 Reborn - 1920x1080 ultra (3/3) best looking | |
| HP ZBook X G1i 16 | |
| Dell Precision 5690 | |
| Average of class Workstation (50.7 - 178.4, n=23, last 2 years) | |
| Lenovo ThinkPad P1 Gen 8 | |
| Lenovo ThinkPad P16s Gen 4 21RX000YGE | |
| Lenovo ThinkPad P16s G2 21K9000CGE | |
赛博朋克 2077》超 FPS 图表
| low | med. | high | ultra | |
|---|---|---|---|---|
| GTA V (2015) | 168.7 | 158.7 | 71.7 | 30.6 |
| Dota 2 Reborn (2015) | 143.7 | 111.6 | 85.7 | 77.6 |
| Final Fantasy XV Benchmark (2018) | 82.1 | 41.5 | 30.2 | |
| X-Plane 11.11 (2018) | 78.2 | 61.7 | 49.9 | |
| Baldur's Gate 3 (2023) | 48.6 | 38.2 | 32.1 | 31.3 |
| Cyberpunk 2077 (2023) | 46.8 | 38 | 30.1 | 26.2 |
| F1 25 (2025) | 88.7 | 70 | 52.9 |
排放:联想 ThinkPad P16s 第 4 代 AMD 是个急性子
系统噪音
ThinkPad P16s Gen 4 只有一个风扇,CPU 的持续散热功率为 36 W,因此它的散热非常困难。因此,我们在这款联想笔记本电脑上记录到的风扇噪音是本次对比的 16 英寸工作站中最高的。
虽然没有线圈啸叫,但在整体风扇噪音较低的情况下,风扇的运行频率确实相当高。
Noise level
| Idle |
| 25.9 / 25.9 / 28.5 dB(A) |
| Load |
| 42.9 / 48.5 dB(A) |
 | ||
30 dB silent 40 dB(A) audible 50 dB(A) loud |
||
min: | ||
| Lenovo ThinkPad P16s Gen 4 21RX000YGE Radeon 890M, Ryzen AI 9 HX PRO 370, Micron 3500 1TB MTFDKBA1T0TGD | Lenovo ThinkPad P16s G2 21K9000CGE Radeon 780M, R7 PRO 7840U, SK hynix PC801 HFS001TEJ9X162N | HP ZBook X G1i 16 RTX PRO 2000 Blackwell Generation Laptop, Ultra 7 265H, Samsung PM9A1 MZVL22T0HBLB | Lenovo ThinkPad P1 Gen 8 RTX PRO 2000 Blackwell Generation Laptop, Ultra 7 255H, Samsung PM9E1 1 TB MZVLC1T0HFLU | Dell Precision 5690 RTX 5000 Ada Generation Laptop, Ultra 9 185H, 2x Samsung PM9A1 1TB (RAID 0) | |
|---|---|---|---|---|---|
| Noise | 15% | 9% | 15% | 2% | |
| off / environment * (dB) | 25.9 | 22.6 13% | 23.7 8% | 23.1 11% | 23.4 10% |
| Idle Minimum * (dB) | 25.9 | 22.6 13% | 23.7 8% | 23.1 11% | 23.6 9% |
| Idle Average * (dB) | 25.9 | 22.6 13% | 23.7 8% | 23.1 11% | 24.9 4% |
| Idle Maximum * (dB) | 28.5 | 22.6 21% | 23.7 17% | 23.1 19% | 30.9 -8% |
| Load Average * (dB) | 42.9 | 37.8 12% | 32.7 24% | 27.3 36% | 40.4 6% |
| Cyberpunk 2077 ultra * (dB) | 48.7 | 50.9 -5% | |||
| Load Maximum * (dB) | 48.5 | 40.5 16% | 48 1% | 47.9 1% | 51.9 -7% |
| Witcher 3 ultra * (dB) | 40.3 | 48.3 |
* ... smaller is better
温度
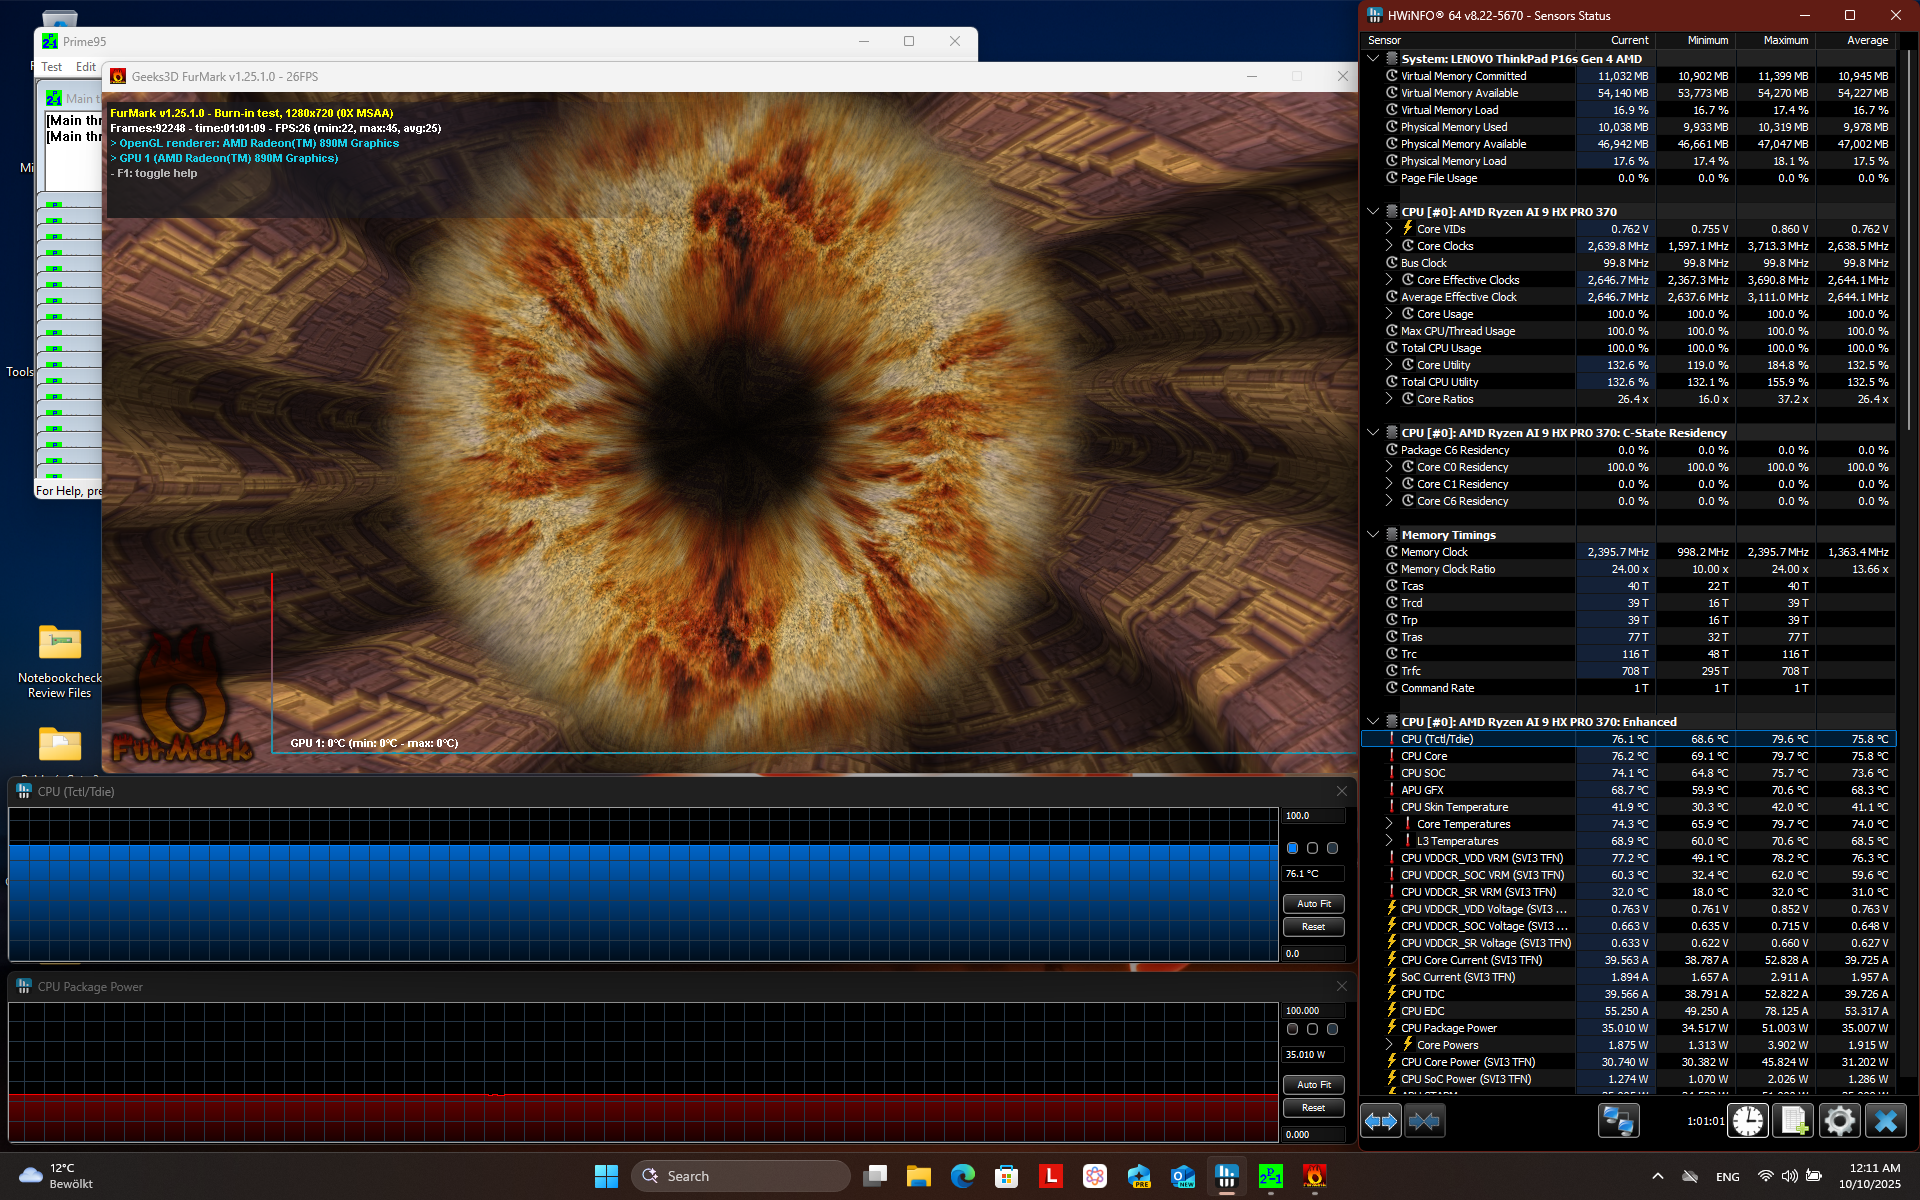
尽管性能低于大多数其他工作站,ThinkPad P16s G4 AMD 的外部温度确实很高,最高达 54.3 摄氏度或 130 华氏度。总体而言,这并不令人惊讶,因为该机只有一个散热风扇,其散热能力不及其他 16 英寸工作站。
在压力测试中没有出现节流现象,这意味着联想优先考虑的是稳定的性能而不是较低的温度。
(-) The maximum temperature on the upper side is 50.6 °C / 123 F, compared to the average of 38.2 °C / 101 F, ranging from 22.2 to 69.8 °C for the class Workstation.
(-) The bottom heats up to a maximum of 54.3 °C / 130 F, compared to the average of 41.1 °C / 106 F
(+) In idle usage, the average temperature for the upper side is 28.5 °C / 83 F, compared to the device average of 32 °C / 90 F.
(+) 3: The average temperature for the upper side is 30.3 °C / 87 F, compared to the average of 32 °C / 90 F for the class Workstation.
(+) The palmrests and touchpad are cooler than skin temperature with a maximum of 26.5 °C / 79.7 F and are therefore cool to the touch.
(±) The average temperature of the palmrest area of similar devices was 27.8 °C / 82 F (+1.3 °C / 2.3 F).
| Lenovo ThinkPad P16s Gen 4 21RX000YGE AMD Ryzen AI 9 HX PRO 370, AMD Radeon 890M | Lenovo ThinkPad P16s G2 21K9000CGE AMD Ryzen 7 PRO 7840U, AMD Radeon 780M | HP ZBook X G1i 16 Intel Core Ultra 7 265H, NVIDIA RTX PRO 2000 Blackwell Generation Laptop | Lenovo ThinkPad P1 Gen 8 Intel Core Ultra 7 255H, NVIDIA RTX PRO 2000 Blackwell Generation Laptop | Dell Precision 5690 Intel Core Ultra 9 185H, NVIDIA RTX 5000 Ada Generation Laptop | |
|---|---|---|---|---|---|
| Heat | 19% | 22% | 20% | 20% | |
| Maximum Upper Side * (°C) | 50.6 | 42.7 16% | 36 29% | 45 11% | 46.6 8% |
| Maximum Bottom * (°C) | 54.3 | 47.2 13% | 39.4 27% | 33 39% | 33 39% |
| Idle Upper Side * (°C) | 35.3 | 27.8 21% | 30.4 14% | 30.6 13% | 32.4 8% |
| Idle Bottom * (°C) | 38.5 | 28.4 26% | 31.8 17% | 31.6 18% | 29.4 24% |
* ... smaller is better
发言人
音频不是联想工作站的强项。总体而言,ThinkPad P14s G4 的向下发射扬声器只能提供中等音量,而且缺乏低音。
Lenovo ThinkPad P16s Gen 4 21RX000YGE audio analysis
(±) | speaker loudness is average but good (79.6 dB)
Bass 100 - 315 Hz
(-) | nearly no bass - on average 15.7% lower than median
(±) | linearity of bass is average (11.9% delta to prev. frequency)
Mids 400 - 2000 Hz
(±) | higher mids - on average 5.8% higher than median
(+) | mids are linear (5.9% delta to prev. frequency)
Highs 2 - 16 kHz
(+) | balanced highs - only 1.5% away from median
(+) | highs are linear (4.6% delta to prev. frequency)
Overall 100 - 16.000 Hz
(±) | linearity of overall sound is average (16.2% difference to median)
Compared to same class
» 43% of all tested devices in this class were better, 7% similar, 50% worse
» The best had a delta of 7%, average was 17%, worst was 35%
Compared to all devices tested
» 26% of all tested devices were better, 6% similar, 68% worse
» The best had a delta of 4%, average was 23%, worst was 134%
Lenovo ThinkPad P1 Gen 8 audio analysis
(+) | speakers can play relatively loud (87.5 dB)
Bass 100 - 315 Hz
(±) | reduced bass - on average 9.8% lower than median
(±) | linearity of bass is average (11.2% delta to prev. frequency)
Mids 400 - 2000 Hz
(+) | balanced mids - only 2.9% away from median
(+) | mids are linear (2.8% delta to prev. frequency)
Highs 2 - 16 kHz
(+) | balanced highs - only 3% away from median
(+) | highs are linear (4.7% delta to prev. frequency)
Overall 100 - 16.000 Hz
(+) | overall sound is linear (8.3% difference to median)
Compared to same class
» 1% of all tested devices in this class were better, 1% similar, 97% worse
» The best had a delta of 7%, average was 17%, worst was 35%
Compared to all devices tested
» 2% of all tested devices were better, 1% similar, 97% worse
» The best had a delta of 4%, average was 23%, worst was 134%
能源管理:AMD 新机型的电池续航时间大有改善
耗电量
联想 ThinkPad P16s Gen 4 AMD 的耗电量远低于其他工作站笔记本电脑。它甚至没有达到 65 W,而这正是 ThinkPad 笔记本电脑充电器为设备提供的功率。
| Off / Standby | |
| Idle | |
| Load |
|
Key:
min: | |
| Lenovo ThinkPad P16s Gen 4 21RX000YGE Ryzen AI 9 HX PRO 370, Radeon 890M, Micron 3500 1TB MTFDKBA1T0TGD, IPS LED, 1920x1200, 16" | Lenovo ThinkPad P16s G2 21K9000CGE R7 PRO 7840U, Radeon 780M, SK hynix PC801 HFS001TEJ9X162N, OLED, 3840x2400, 16" | HP ZBook X G1i 16 Ultra 7 265H, RTX PRO 2000 Blackwell Generation Laptop, Samsung PM9A1 MZVL22T0HBLB, IPS, 2560x1600, 16" | Lenovo ThinkPad P1 Gen 8 Ultra 7 255H, RTX PRO 2000 Blackwell Generation Laptop, Samsung PM9E1 1 TB MZVLC1T0HFLU, Tandem OLED, 3200x2000, 16" | Dell Precision 5690 Ultra 9 185H, RTX 5000 Ada Generation Laptop, 2x Samsung PM9A1 1TB (RAID 0), OLED, 3840x2400, 16" | Average AMD Radeon 890M | Average of class Workstation | |
|---|---|---|---|---|---|---|---|
| Power Consumption | -6% | -58% | -143% | -128% | -19% | -115% | |
| Idle Minimum * (Watt) | 3.9 | 6.1 -56% | 4.1 -5% | 15.4 -295% | 7.9 -103% | 5.56 ? -43% | 9.11 ? -134% |
| Idle Average * (Watt) | 8.3 | 6.5 22% | 9 -8% | 16.5 -99% | 12 -45% | 7.81 ? 6% | 13.8 ? -66% |
| Idle Maximum * (Watt) | 8.7 | 7 20% | 9.4 -8% | 23.1 -166% | 28.6 -229% | 9.28 ? -7% | 17.9 ? -106% |
| Load Average * (Watt) | 51.6 | 56.6 -10% | 86.7 -68% | 86.6 -68% | 98.8 -91% | 63.9 ? -24% | 96 ? -86% |
| Cyberpunk 2077 ultra * (Watt) | 55.4 | 106.1 -92% | 123.1 -122% | ||||
| Cyberpunk 2077 ultra external monitor * (Watt) | 54.6 | 102 -87% | 121.8 -123% | ||||
| Load Maximum * (Watt) | 63.7 | 68.3 -7% | 152.9 -140% | 143.6 -125% | 174.8 -174% | 79.5 ? -25% | 180.3 ? -183% |
| Witcher 3 ultra * (Watt) | 61.2 | 144.5 |
* ... smaller is better
功耗 赛博朋克/压力测试
外部显示器功耗
电池寿命
电池续航时间显然是联想 ThinkPad P16s Gen 4 AMD 的强项。在我们的 Wi-Fi 上网冲浪测试中(屏幕亮度为 150 cd/m²),电池续航时间长达近 14 个小时,这是我们比较过的其他 16 英寸工作站笔记本电脑无法比拟的。ThinkPad 笔记本电脑之所以能取得这样的成绩,得益于 86 Wh 的大容量电池和低功耗。
| Lenovo ThinkPad P16s Gen 4 21RX000YGE Ryzen AI 9 HX PRO 370, Radeon 890M, 86 Wh | Lenovo ThinkPad P16s G2 21K9000CGE R7 PRO 7840U, Radeon 780M, 84 Wh | HP ZBook X G1i 16 Ultra 7 265H, RTX PRO 2000 Blackwell Generation Laptop, 83 Wh | Lenovo ThinkPad P1 Gen 8 Ultra 7 255H, RTX PRO 2000 Blackwell Generation Laptop, 90 Wh | Dell Precision 5690 Ultra 9 185H, RTX 5000 Ada Generation Laptop, 98 Wh | Average of class Workstation | |
|---|---|---|---|---|---|---|
| Battery runtime | 6% | -10% | -60% | -34% | -4% | |
| WiFi v1.3 (h) | 13.9 | 10.6 -24% | 12.5 -10% | 5.5 -60% | 9.2 -34% | 8.55 ? -38% |
| Load (h) | 1.1 | 1.5 36% | 1.441 ? 31% | |||
| H.264 (h) | 13.3 | 10.1 ? |
笔记本检查评级
虽然联想 ThinkPad P16s 第 4 代 AMD 有一些明显的弱点,尤其是发热和噪音方面,但它是一款出色的主力机型,拥有明亮的屏幕、出色的 CPU 性能和非常舒适的键盘,以及多种可升级选项。
Lenovo ThinkPad P16s Gen 4 21RX000YGE
- 12/17/2025 v8
Benjamin Herzig
 Total Sustainability Score:
 潜在竞争对手比较
Image | Model / Review | Price | Weight | Height | Display |
|---|---|---|---|---|---|
1. 82%  | Lenovo ThinkPad P16s Gen 4 21RX000YGE AMD Ryzen AI 9 HX PRO 370 ⎘ AMD Radeon 890M ⎘ 64 GB Memory, 1024 GB SSD | Amazon: List Price: 2440 Euro | 2 kg | 23 mm | 16.00" 1920x1200 142 PPI IPS LED |
2. 88.6% v7 (old)  | Lenovo ThinkPad P16s G2 21K9000CGE AMD Ryzen 7 PRO 7840U ⎘ AMD Radeon 780M ⎘ 32 GB Memory, 1024 GB SSD | Amazon: List Price: 2150€ | 1.8 kg | 24.4 mm | 16.00" 3840x2400 283 PPI OLED |
3. 87.4%  | HP ZBook X G1i 16 Intel Core Ultra 7 265H ⎘ NVIDIA RTX PRO 2000 Blackwell Generation Laptop ⎘ 64 GB Memory, 2048 GB SSD | Amazon: List Price: 2700 USD | 2.2 kg | 23 mm | 16.00" 2560x1600 189 PPI IPS |
4. 91.6%  | Lenovo ThinkPad P1 Gen 8 Intel Core Ultra 7 255H ⎘ NVIDIA RTX PRO 2000 Blackwell Generation Laptop ⎘ 32 GB Memory, 1024 GB SSD | Amazon: List Price: 2000 USD | 1.9 kg | 20.6 mm | 16.00" 3200x2000 236 PPI Tandem OLED |
5. 88.3% v7 (old)  | Dell Precision 5690 Intel Core Ultra 9 185H ⎘ NVIDIA RTX 5000 Ada Generation Laptop ⎘ 32 GB Memory, 2048 GB SSD | Amazon: List Price: 5900 USD | 2.3 kg | 22.17 mm | 16.00" 3840x2400 283 PPI OLED |
Transparency
The selection of devices to be reviewed is made by our editorial team. The test sample was provided to the author as a loan by the manufacturer or retailer for the purpose of this review. The lender had no influence on this review, nor did the manufacturer receive a copy of this review before publication. There was no obligation to publish this review. As an independent media company, Notebookcheck is not subjected to the authority of manufacturers, retailers or publishers.
This is how Notebookcheck is testing
Every year, Notebookcheck independently reviews hundreds of laptops and smartphones using standardized procedures to ensure that all results are comparable. We have continuously developed our test methods for around 20 years and set industry standards in the process. In our test labs, high-quality measuring equipment is utilized by experienced technicians and editors. These tests involve a multi-stage validation process. Our complex rating system is based on hundreds of well-founded measurements and benchmarks, which maintains objectivity. Further information on our test methods can be found here.

