联想 ThinkPad P51s (酷睿 i7, 4k) 工作站简短评测
| SD Card Reader | |
| average JPG Copy Test (av. of 3 runs) | |
| Dell Precision 5520 UHD | |
| HP ZBook Studio G3 | |
| Lenovo ThinkPad P51s 20HB000SGE | |
| Lenovo ThinkPad T570-20HAS01E00 | |
| Lenovo ThinkPad P50s-20FKS00400 | |
| maximum AS SSD Seq Read Test (1GB) | |
| Dell Precision 5520 UHD | |
| HP ZBook Studio G3 | |
| Lenovo ThinkPad T570-20HAS01E00 | |
| Lenovo ThinkPad P50s-20FKS00400 | |
| Lenovo ThinkPad P51s 20HB000SGE | |
| Networking | |
| iperf3 transmit AX12 | |
| Lenovo ThinkPad P51s 20HB000SGE | |
| Dell Precision 5520 UHD | |
| Lenovo ThinkPad T570-20HAS01E00 | |
| iperf3 receive AX12 | |
| Lenovo ThinkPad P51s 20HB000SGE | |
| Lenovo ThinkPad T570-20HAS01E00 | |
| Dell Precision 5520 UHD | |
| |||||||||||||||||||||||||
Brightness Distribution: 85 %
Center on Battery: 318 cd/m²
Contrast: 991:1 (Black: 0.32 cd/m²)
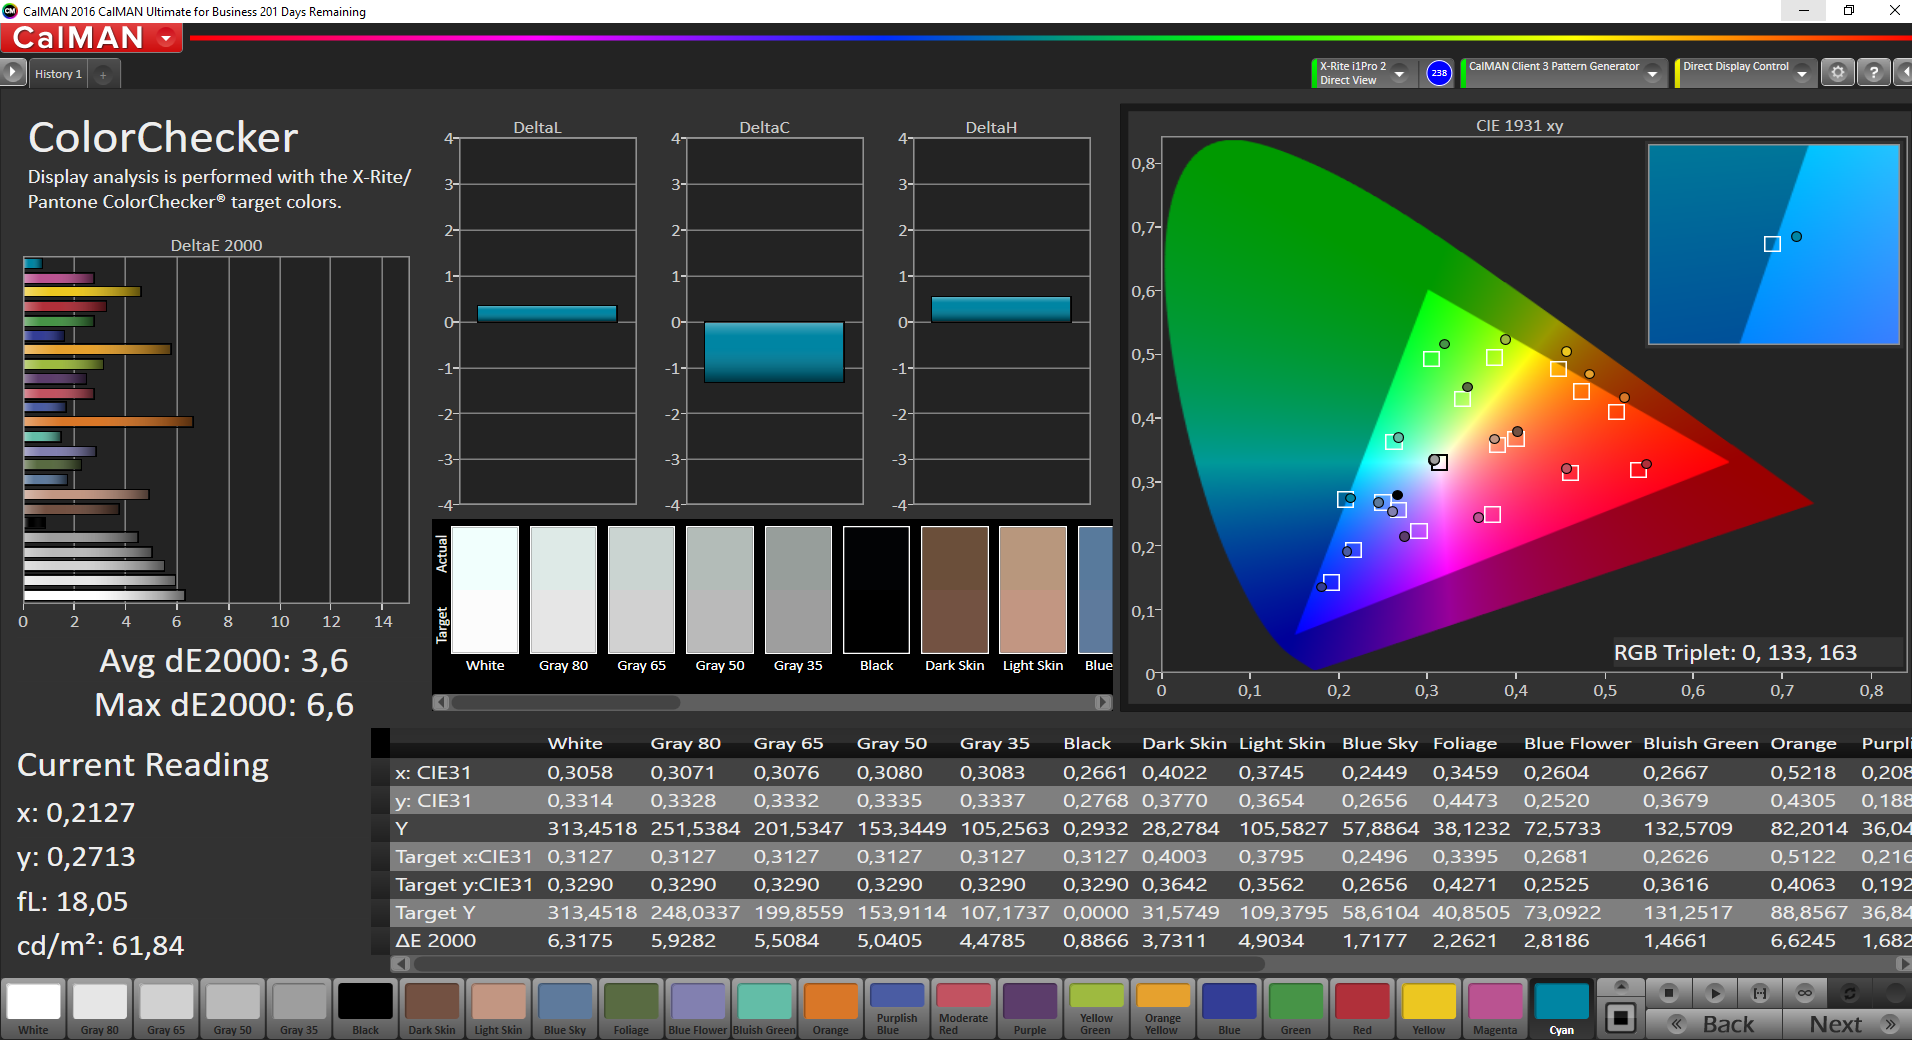
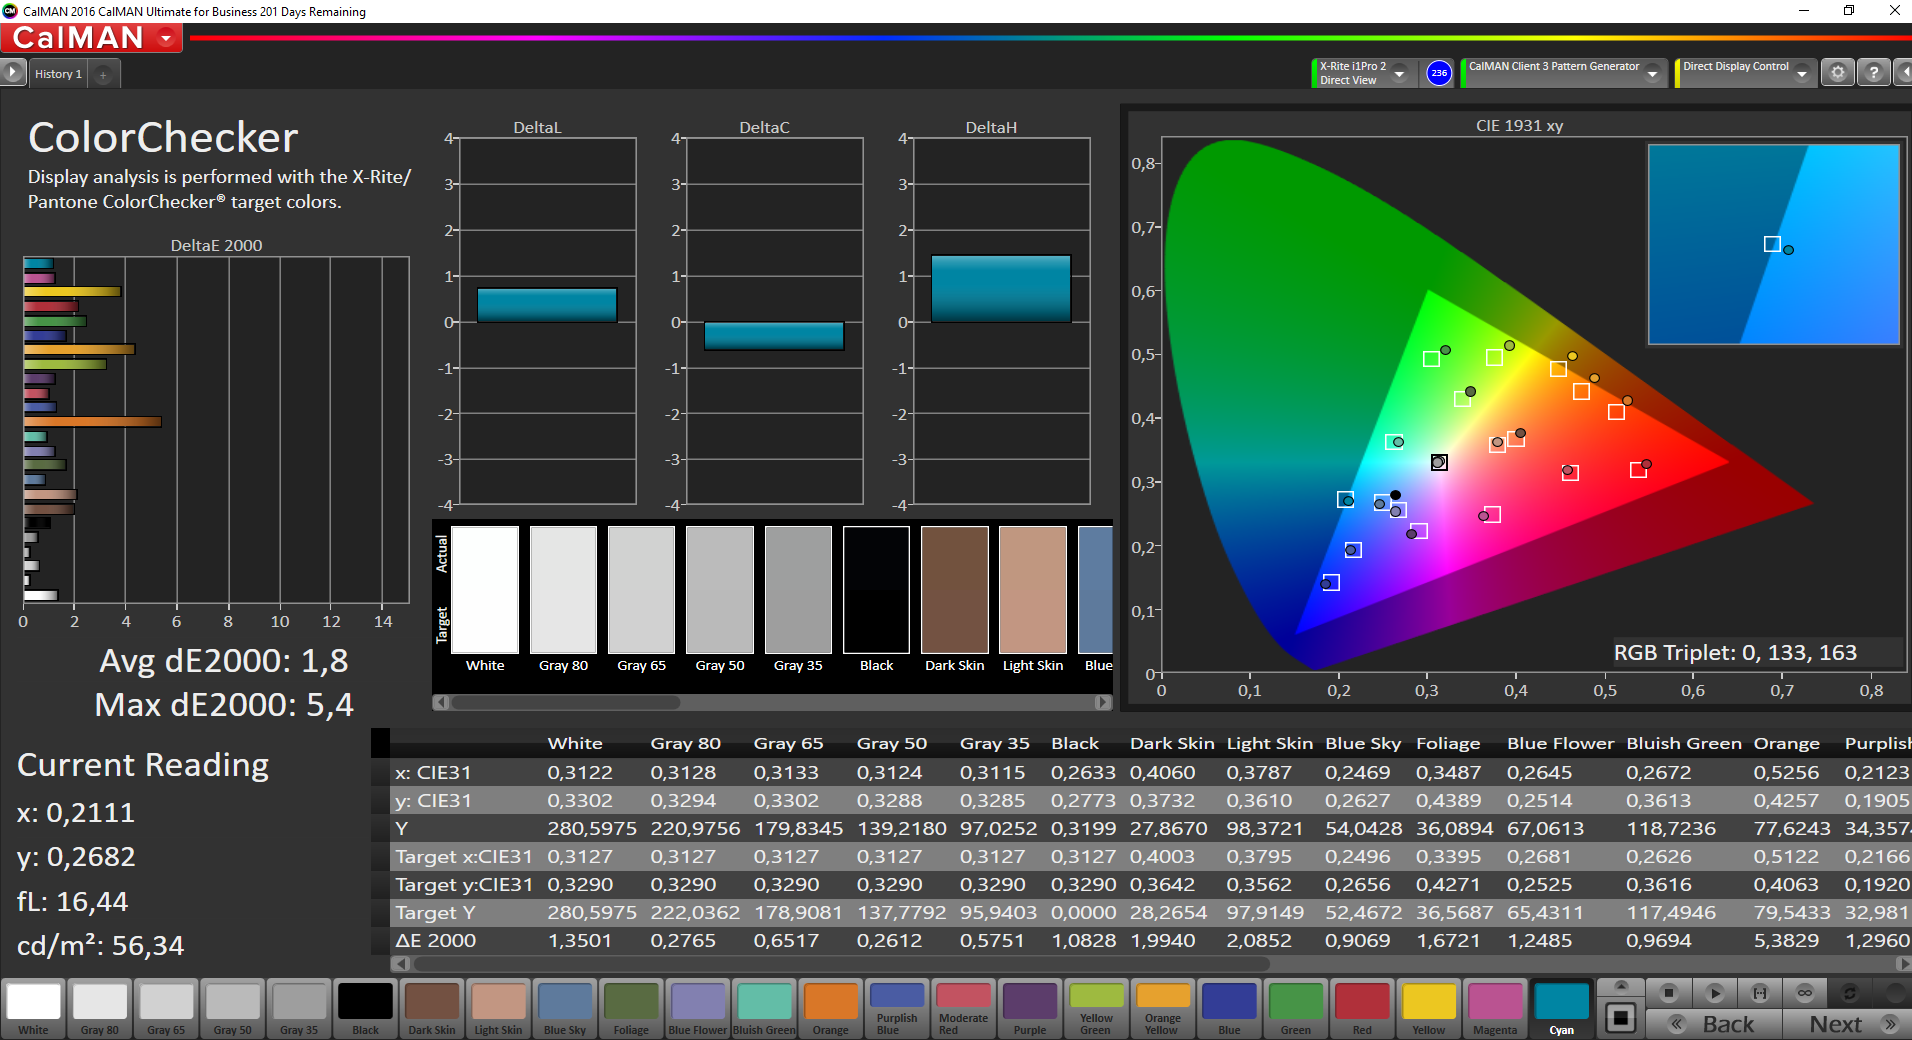
ΔE ColorChecker Calman: 3.6 | ∀{0.5-29.43 Ø4.72}
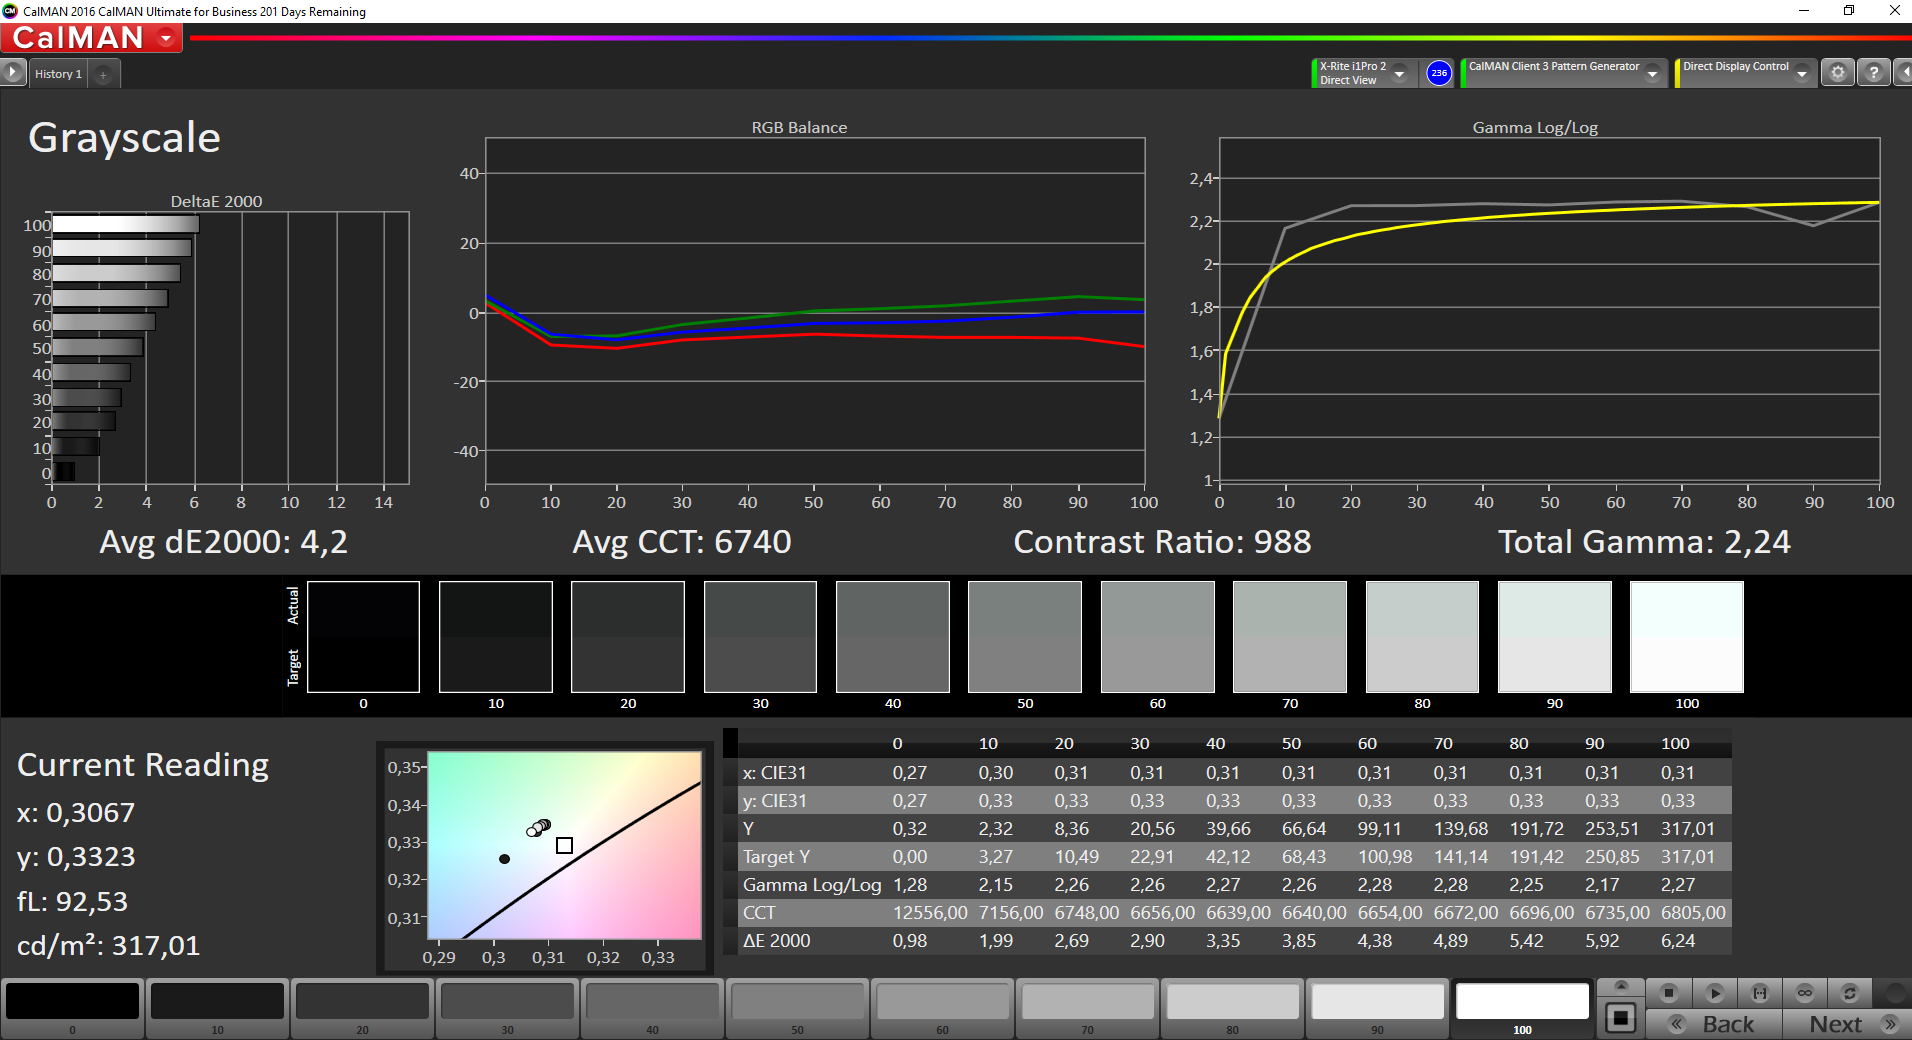
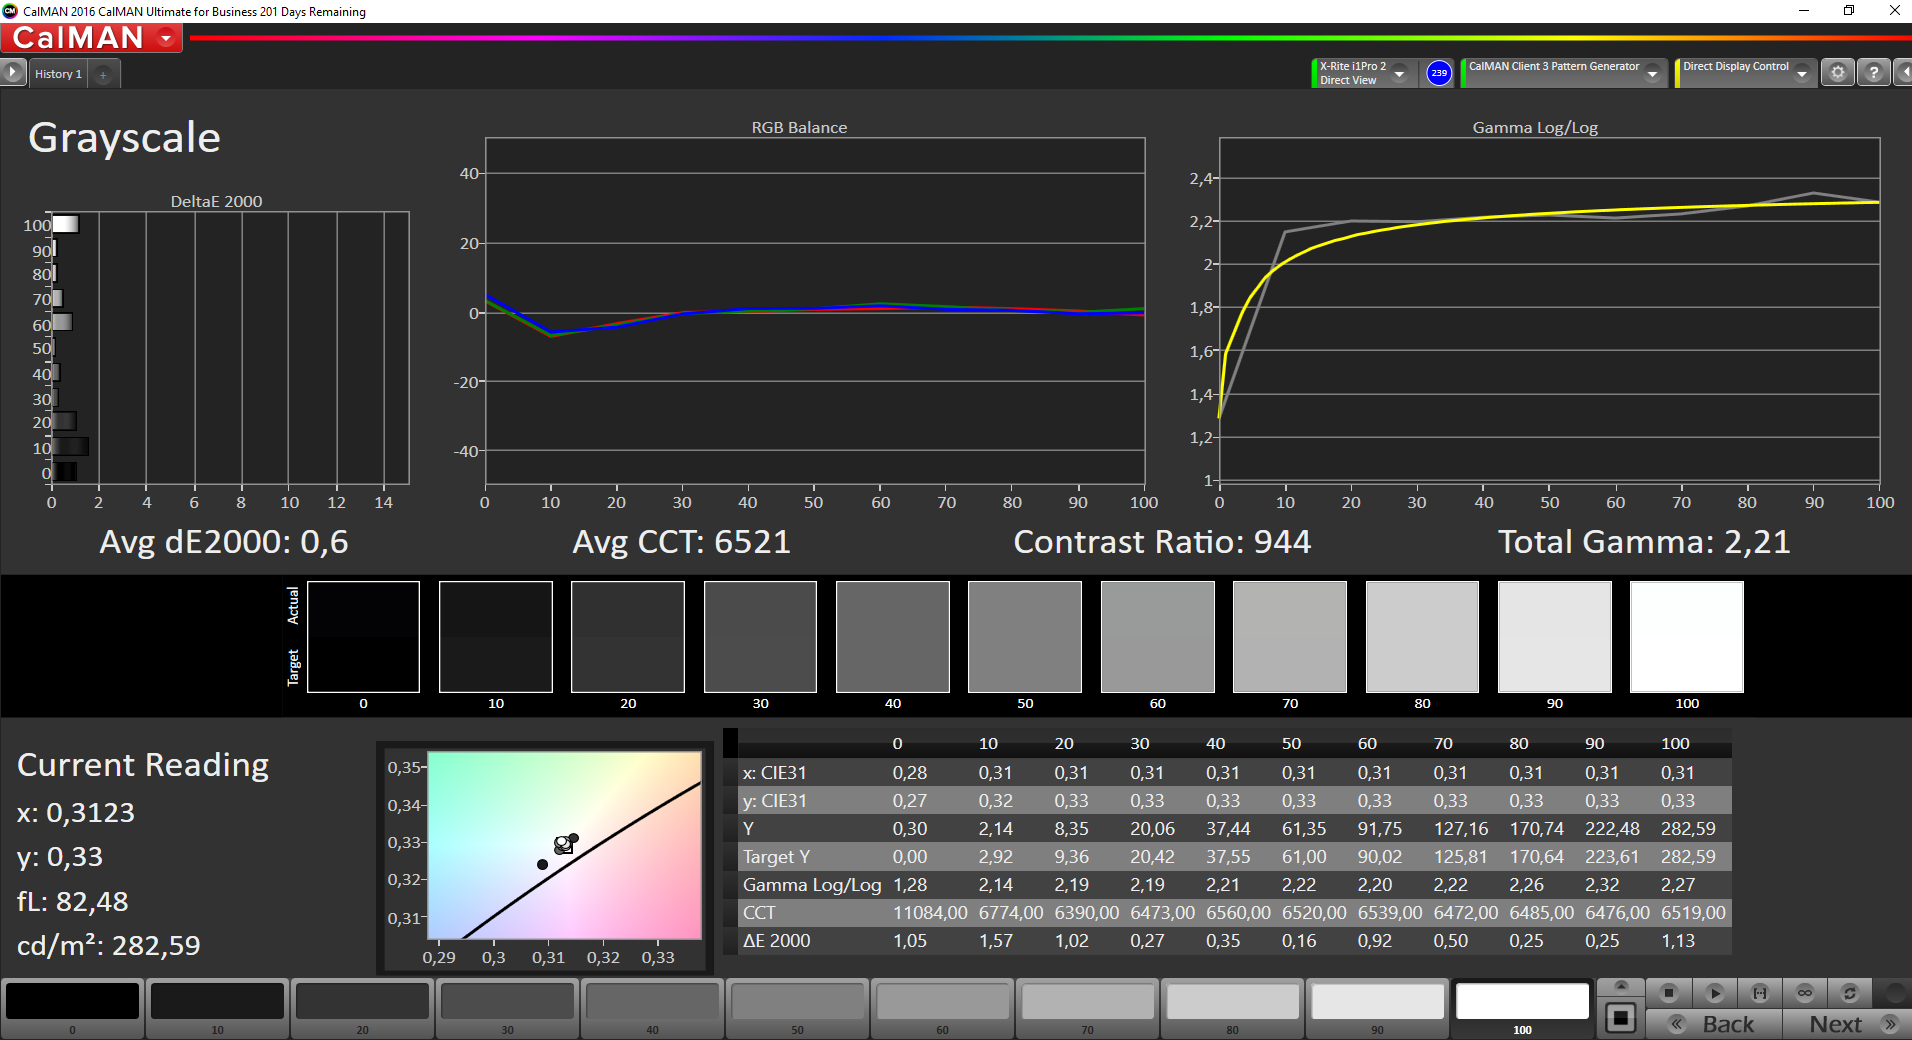
ΔE Greyscale Calman: 4.2 | ∀{0.09-98 Ø4.97}
91.1% sRGB (Argyll 1.6.3 3D)
59.5% AdobeRGB 1998 (Argyll 1.6.3 3D)
66.8% AdobeRGB 1998 (Argyll 3D)
91.2% sRGB (Argyll 3D)
69.7% Display P3 (Argyll 3D)
Gamma: 2.24
CCT: 6740 K
| Lenovo ThinkPad P51s 20HB000SGE IPS, 3840x2160, 15.6", BOE NV156QUM-N44 | Lenovo ThinkPad P50s-20FKS00400 IPS, 2880x1620, 15.5", WX16T028J00, LEN40B5 | Lenovo ThinkPad T570-20HAS01E00 IPS, 3840x2160, 15.6", BOE NV156QUM-N44 | Dell Precision 5520 UHD IPS, 3840x2160, 15.6", SHP1476 | HP ZBook Studio G3 IPS, 3840x2160, 15.6", Sharp SPH1445 | |
|---|---|---|---|---|---|
| Display | -6% | 0% | 3% | 26% | |
| Display P3 Coverage (%) | 69.7 | 63.7 -9% | 70 0% | 67.4 -3% | 86 23% |
| sRGB Coverage (%) | 91.2 | 87.6 -4% | 91.1 0% | 98.5 8% | 98.9 8% |
| AdobeRGB 1998 Coverage (%) | 66.8 | 63.8 -4% | 66.7 0% | 68.9 3% | 98 47% |
| Response Times | -8% | 16% | -61% | -5% | |
| Response Time Grey 50% / Grey 80% * (ms) | 38.4 ? | 38 ? 1% | 41.6 ? -8% | 59.2 ? -54% | 44 ? -15% |
| Response Time Black / White * (ms) | 24.8 ? | 28.8 ? -16% | 15.2 ? 39% | 41.6 ? -68% | 23.2 ? 6% |
| PWM Frequency (Hz) | 980 ? | 219 ? | 926 ? | 200 ? | |
| Screen | -9% | -5% | 5% | -9% | |
| Brightness middle (cd/m²) | 317 | 319 1% | 339 7% | 372.4 17% | 310 -2% |
| Brightness (cd/m²) | 290 | 290 0% | 314 8% | 368 27% | 299 3% |
| Brightness Distribution (%) | 85 | 82 -4% | 89 5% | 90 6% | 86 1% |
| Black Level * (cd/m²) | 0.32 | 0.31 3% | 0.36 -13% | 0.48 -50% | 0.29 9% |
| Contrast (:1) | 991 | 1029 4% | 942 -5% | 776 -22% | 1069 8% |
| Colorchecker dE 2000 * | 3.6 | 4.8 -33% | 4.2 -17% | 2.6 28% | 5.9 -64% |
| Colorchecker dE 2000 max. * | 6.6 | 7.8 -18% | 7.8 -18% | 5.6 15% | 10.7 -62% |
| Greyscale dE 2000 * | 4.2 | 5.7 -36% | 5.1 -21% | 3.7 12% | 5.5 -31% |
| Gamma | 2.24 98% | 2.07 106% | 2.16 102% | 2.14 103% | 2.09 105% |
| CCT | 6740 96% | 6260 104% | 6569 99% | 7096 92% | 5980 109% |
| Color Space (Percent of AdobeRGB 1998) (%) | 59.5 | 56.9 -4% | 59.4 0% | 63 6% | 85 43% |
| Color Space (Percent of sRGB) (%) | 91.1 | 87.4 -4% | 91 0% | 99 9% | 99 9% |
| Total Average (Program / Settings) | -8% /
-8% | 4% /
-2% | -18% /
-4% | 4% /
-1% |
* ... smaller is better
Screen Flickering / PWM (Pulse-Width Modulation)
| Screen flickering / PWM detected | 980 Hz | ≤ 90 % brightness setting | 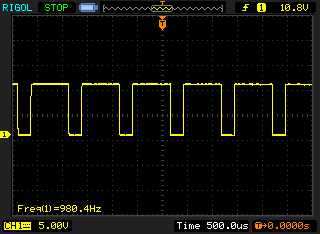 |
The display backlight flickers at 980 Hz (worst case, e.g., utilizing PWM) Flickering detected at a brightness setting of 90 % and below. There should be no flickering or PWM above this brightness setting. The frequency of 980 Hz is quite high, so most users sensitive to PWM should not notice any flickering. In comparison: 52 % of all tested devices do not use PWM to dim the display. If PWM was detected, an average of 7784 (minimum: 5 - maximum: 343500) Hz was measured. | |||
Display Response Times
| ↔ Response Time Black to White | ||
|---|---|---|
| 24.8 ms ... rise ↗ and fall ↘ combined | ↗ 13.6 ms rise | 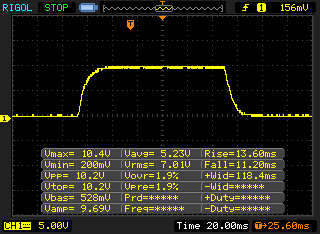 |
| ↘ 11.2 ms fall | ||
| The screen shows good response rates in our tests, but may be too slow for competitive gamers. In comparison, all tested devices range from 0.1 (minimum) to 240 (maximum) ms. » 58 % of all devices are better. This means that the measured response time is worse than the average of all tested devices (19.9 ms). | ||
| ↔ Response Time 50% Grey to 80% Grey | ||
| 38.4 ms ... rise ↗ and fall ↘ combined | ↗ 20.4 ms rise | 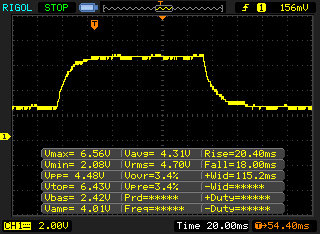 |
| ↘ 18 ms fall | ||
| The screen shows slow response rates in our tests and will be unsatisfactory for gamers. In comparison, all tested devices range from 0.165 (minimum) to 636 (maximum) ms. » 57 % of all devices are better. This means that the measured response time is worse than the average of all tested devices (31.1 ms). | ||
| Cinebench R15 | |
| CPU Single 64Bit | |
| Lenovo ThinkPad P51 20HH0016GE | |
| Dell Precision 5520 UHD | |
| Lenovo ThinkPad P51s 20HB000SGE | |
| HP ZBook Studio G3 | |
| Lenovo ThinkPad T570-20HAS01E00 | |
| Lenovo ThinkPad P50s-20FKS00400 | |
| CPU Multi 64Bit | |
| Lenovo ThinkPad P51 20HH0016GE | |
| HP ZBook Studio G3 | |
| Dell Precision 5520 UHD | |
| Lenovo ThinkPad P51s 20HB000SGE | |
| Lenovo ThinkPad T570-20HAS01E00 | |
| Lenovo ThinkPad P50s-20FKS00400 | |
| Cinebench R11.5 | |
| CPU Single 64Bit | |
| Dell Precision 5520 UHD | |
| Lenovo ThinkPad P51 20HH0016GE | |
| Lenovo ThinkPad P51s 20HB000SGE | |
| HP ZBook Studio G3 | |
| Lenovo ThinkPad P50s-20FKS00400 | |
| CPU Multi 64Bit | |
| Lenovo ThinkPad P51 20HH0016GE | |
| Dell Precision 5520 UHD | |
| HP ZBook Studio G3 | |
| Lenovo ThinkPad P51s 20HB000SGE | |
| Lenovo ThinkPad P50s-20FKS00400 | |
| Cinebench R10 | |
| Rendering Single 32Bit | |
| Lenovo ThinkPad P51 20HH0016GE | |
| Lenovo ThinkPad P51s 20HB000SGE | |
| HP ZBook Studio G3 | |
| Lenovo ThinkPad P50s-20FKS00400 | |
| Rendering Multiple CPUs 32Bit | |
| Lenovo ThinkPad P51 20HH0016GE | |
| HP ZBook Studio G3 | |
| Lenovo ThinkPad P51s 20HB000SGE | |
| Lenovo ThinkPad P50s-20FKS00400 | |
| Geekbench 3 | |
| 32 Bit Multi-Core Score | |
| Lenovo ThinkPad P51 20HH0016GE | |
| Lenovo ThinkPad P51s 20HB000SGE | |
| 32 Bit Single-Core Score | |
| Lenovo ThinkPad P51 20HH0016GE | |
| Lenovo ThinkPad P51s 20HB000SGE | |
| Geekbench 4.0 | |
| 64 Bit Multi-Core Score | |
| Lenovo ThinkPad P51s 20HB000SGE | |
| 64 Bit Single-Core Score | |
| Lenovo ThinkPad P51s 20HB000SGE | |
| Geekbench 4.4 | |
| 64 Bit Multi-Core Score | |
| Lenovo ThinkPad P51s 20HB000SGE | |
| 64 Bit Single-Core Score | |
| Lenovo ThinkPad P51s 20HB000SGE | |
| JetStream 1.1 - 1.1 Total | |
| Lenovo ThinkPad P51 20HH0016GE | |
| Dell Precision 5520 UHD | |
| Lenovo ThinkPad P51s 20HB000SGE | |
| PCMark 7 Score | 5568 points | |
| PCMark 8 Home Score Accelerated v2 | 3232 points | |
| PCMark 8 Creative Score Accelerated v2 | 4640 points | |
| PCMark 8 Work Score Accelerated v2 | 4193 points | |
Help | ||
| PCMark 8 | |
| Home Score Accelerated v2 | |
| Lenovo ThinkPad P51 20HH0016GE | |
| Dell Precision 5520 UHD | |
| HP ZBook Studio G3 | |
| Lenovo ThinkPad P51s 20HB000SGE | |
| Lenovo ThinkPad T570-20HAS01E00 | |
| Lenovo ThinkPad P50s-20FKS00400 | |
| Work Score Accelerated v2 | |
| HP ZBook Studio G3 | |
| Dell Precision 5520 UHD | |
| Lenovo ThinkPad P51 20HH0016GE | |
| Lenovo ThinkPad P51s 20HB000SGE | |
| Lenovo ThinkPad T570-20HAS01E00 | |
| Lenovo ThinkPad P50s-20FKS00400 | |

| Lenovo ThinkPad P51s 20HB000SGE Samsung SSD PM961 1TB M.2 PCIe 3.0 x4 NVMe (MZVLW1T0) | Lenovo ThinkPad P50s-20FKS00400 Samsung PM871 MZYLN256HCHP | Dell Precision 5520 UHD Samsung SM961 MZVKW512HMJP m.2 PCI-e | HP ZBook Studio G3 Samsung SM951 MZVPV512HDGL m.2 PCI-e | Lenovo ThinkPad T570-20HAS01E00 Samsung PM961 NVMe MZVLW512HMJP | Lenovo ThinkPad P51 20HH0016GE Samsung PM961 NVMe MZVLW512HMJP | |
|---|---|---|---|---|---|---|
| CrystalDiskMark 3.0 | -54% | 20% | 29% | -4% | 20% | |
| Read Seq (MB/s) | 1189 | 475.5 -60% | 2253 89% | 1578 33% | 1210 2% | 1705 43% |
| Write Seq (MB/s) | 1138 | 304.7 -73% | 1662 46% | 1557 37% | 1134 0% | 1541 35% |
| Read 512 (MB/s) | 782 | 379.3 -51% | 459.1 -41% | 1234 58% | 789 1% | 1038 33% |
| Write 512 (MB/s) | 959 | 303.4 -68% | 1611 68% | 1391 45% | 903 -6% | 1157 21% |
| Read 4k (MB/s) | 54.8 | 34.31 -37% | 56.1 2% | 59.9 9% | 58.4 7% | 61.3 12% |
| Write 4k (MB/s) | 161.4 | 89.4 -45% | 169.4 5% | 225.6 40% | 144.1 -11% | 176 9% |
| Read 4k QD32 (MB/s) | 642 | 319.9 -50% | 633 -1% | 946 47% | 559 -13% | 664 3% |
| Write 4k QD32 (MB/s) | 549 | 279.4 -49% | 506 -8% | 359 -35% | 474.4 -14% | 560 2% |
| 3DMark 06 Standard Score | 17305 points | |
| 3DMark Vantage P Result | 11278 points | |
| 3DMark 11 Performance | 2884 points | |
| 3DMark Ice Storm Standard Score | 32374 points | |
| 3DMark Cloud Gate Standard Score | 8544 points | |
| 3DMark Fire Strike Score | 2139 points | |
| 3DMark Fire Strike Extreme Score | 1058 points | |
| 3DMark Time Spy Score | 684 points | |
Help | ||
| 3DMark 11 - 1280x720 Performance GPU | |
| Lenovo ThinkPad P51 20HH0016GE | |
| Dell Precision 5520 UHD | |
| HP ZBook Studio G3 | |
| Lenovo ThinkPad T570-20HAS01E00 | |
| Lenovo ThinkPad P51s 20HB000SGE | |
| Lenovo ThinkPad P50s-20FKS00400 | |
| 3DMark | |
| 1280x720 Cloud Gate Standard Graphics | |
| Lenovo ThinkPad P51 20HH0016GE | |
| Dell Precision 5520 UHD | |
| HP ZBook Studio G3 | |
| Lenovo ThinkPad P51s 20HB000SGE | |
| Lenovo ThinkPad T570-20HAS01E00 | |
| Lenovo ThinkPad P50s-20FKS00400 | |
| 1920x1080 Fire Strike Graphics | |
| Lenovo ThinkPad P51 20HH0016GE | |
| Dell Precision 5520 UHD | |
| HP ZBook Studio G3 | |
| Lenovo ThinkPad P51s 20HB000SGE | |
| Lenovo ThinkPad T570-20HAS01E00 | |
| Lenovo ThinkPad P50s-20FKS00400 | |
| Geekbench 4.0 - Compute OpenCL Score | |
| Lenovo ThinkPad P51s 20HB000SGE | |
| Geekbench 4.4 - Compute OpenCL Score | |
| Lenovo ThinkPad P51s 20HB000SGE | |
| GFXBench (DX / GLBenchmark) 2.7 | |
| 1920x1080 T-Rex Offscreen | |
| Lenovo ThinkPad P51s 20HB000SGE | |
| Lenovo ThinkPad P50s-20FKS00400 | |
| T-Rex Onscreen | |
| Lenovo ThinkPad P51s 20HB000SGE | |
| Lenovo ThinkPad P50s-20FKS00400 | |
| GFXBench 3.0 | |
| 1920x1080 1080p Manhattan Offscreen | |
| Lenovo ThinkPad P51s 20HB000SGE | |
| Lenovo ThinkPad P50s-20FKS00400 | |
| on screen Manhattan Onscreen OGL | |
| Lenovo ThinkPad P50s-20FKS00400 | |
| Lenovo ThinkPad P51s 20HB000SGE | |
| GFXBench 3.1 | |
| 1920x1080 Manhattan ES 3.1 Offscreen | |
| Lenovo ThinkPad P51s 20HB000SGE | |
| Lenovo ThinkPad P50s-20FKS00400 | |
| on screen Manhattan ES 3.1 Onscreen | |
| Lenovo ThinkPad P50s-20FKS00400 | |
| Lenovo ThinkPad P51s 20HB000SGE | |
| GFXBench | |
| 1920x1080 Car Chase Offscreen | |
| Lenovo ThinkPad P51s 20HB000SGE | |
| Lenovo ThinkPad P50s-20FKS00400 | |
| on screen Car Chase Onscreen | |
| Lenovo ThinkPad P50s-20FKS00400 | |
| Lenovo ThinkPad P51s 20HB000SGE | |
| LuxMark v2.0 64Bit | |
| Room GPUs-only | |
| Lenovo ThinkPad P51 20HH0016GE | |
| Dell Precision 5520 UHD | |
| HP ZBook Studio G3 | |
| Lenovo ThinkPad P51s 20HB000SGE | |
| Lenovo ThinkPad P50s-20FKS00400 | |
| Sala GPUs-only | |
| Lenovo ThinkPad P51 20HH0016GE | |
| Dell Precision 5520 UHD | |
| HP ZBook Studio G3 | |
| Lenovo ThinkPad P50s-20FKS00400 | |
| Lenovo ThinkPad P51s 20HB000SGE | |
| ComputeMark v2.1 - 1024x600 Normal, Score | |
| Lenovo ThinkPad P51s 20HB000SGE | |
| Lenovo ThinkPad P50s-20FKS00400 | |
| Dell Precision 5520 UHD | |
| Unigine Heaven 2.1 - 1280x1024 high, Tesselation (normal), DirectX11 AA:off AF:1x | |
| HP ZBook Studio G3 | |
| Lenovo ThinkPad P51s 20HB000SGE | |
| Lenovo ThinkPad P50s-20FKS00400 | |
| Unigine Heaven 3.0 | |
| 1920x1080 OpenGL, Normal Tessellation, High Shaders AA:Off AF:Off | |
| HP ZBook Studio G3 | |
| Lenovo ThinkPad P51s 20HB000SGE | |
| Lenovo ThinkPad P50s-20FKS00400 | |
| 1920x1080 DX 11, Normal Tessellation, High Shaders AA:Off AF:Off | |
| HP ZBook Studio G3 | |
| Lenovo ThinkPad P51s 20HB000SGE | |
| Lenovo ThinkPad P50s-20FKS00400 | |
| Unigine Heaven 4.0 | |
| Extreme Preset OpenGL | |
| Lenovo ThinkPad P51 20HH0016GE | |
| Lenovo ThinkPad P51s 20HB000SGE | |
| Extreme Preset DX11 | |
| Lenovo ThinkPad P51 20HH0016GE | |
| Lenovo ThinkPad P51s 20HB000SGE | |
| Unigine Valley 1.0 | |
| 1920x1080 Extreme HD DirectX AA:x8 | |
| Lenovo ThinkPad P51 20HH0016GE | |
| HP ZBook Studio G3 | |
| Lenovo ThinkPad P51s 20HB000SGE | |
| Lenovo ThinkPad P50s-20FKS00400 | |
| 1920x1080 Extreme HD Preset OpenGL AA:x8 | |
| Lenovo ThinkPad P51 20HH0016GE | |
| HP ZBook Studio G3 | |
| Lenovo ThinkPad P51s 20HB000SGE | |
| Lenovo ThinkPad P50s-20FKS00400 | |
| SiSoft Sandra 2016 | |
| GP Financial Analysis (FP High/Double Precision) | |
| Lenovo ThinkPad P51 20HH0016GE | |
| HP ZBook Studio G3 | |
| Lenovo ThinkPad P51s 20HB000SGE | |
| Lenovo ThinkPad P50s-20FKS00400 | |
| GP Cryptography (Higher Security AES256+SHA2-512) | |
| Lenovo ThinkPad P51 20HH0016GE | |
| HP ZBook Studio G3 | |
| Lenovo ThinkPad P50s-20FKS00400 | |
| Lenovo ThinkPad P51s 20HB000SGE | |
| Image Processing | |
| Lenovo ThinkPad P51 20HH0016GE | |
| HP ZBook Studio G3 | |
| Lenovo ThinkPad P51s 20HB000SGE | |
| Lenovo ThinkPad P50s-20FKS00400 | |
| low | med. | high | ultra | 4K | |
|---|---|---|---|---|---|
| Tomb Raider (2013) | 188.1 | 97.9 | 59.5 | 28.8 | |
| BioShock Infinite (2013) | 138.2 | 76.9 | 64.1 | 24.2 | |
| Middle-earth: Shadow of Mordor (2014) | 54.6 | 32.9 | 22.8 | 16.2 | |
| Dragon Age: Inquisition (2014) | 68.2 | 51.7 | 18.3 | 12.2 | |
| Battlefield Hardline (2015) | 81.1 | 74.2 | 30.4 | 19.6 | |
| Dirt Rally (2015) | 145.6 | 75.1 | 40.5 | 18.7 | 14.7 |
| World of Warships (2015) | 135.6 | 108.1 | 54 | 36.7 | 11 |
| Anno 2205 (2015) | 60.1 | 36.2 | 17.7 | 7.4 | |
| Star Wars Battlefront (2015) | 78.2 | 48.9 | 22.3 | 19.1 | |
| Rainbow Six Siege (2015) | 94.5 | 60.1 | 31.8 | 22.8 | 8.1 |
| Rise of the Tomb Raider (2016) | 30 | 21.5 | 13.3 | 11.7 | |
| Far Cry Primal (2016) | 46 | 20 | 18 | 12 | |
| The Division (2016) | 52.2 | 31.8 | 14.8 | 11.2 | |
| Ashes of the Singularity (2016) | 23.6 | 14.3 | 12 | ||
| Deus Ex Mankind Divided (2016) | 27.2 | 21 | 11.6 | 5.3 | |
| Battlefield 1 (2016) | 56.4 | 43.9 | 33 | 28.2 | |
| Civilization 6 (2016) | 50.8 | 30.4 | 15.2 | 11.7 | |
| Farming Simulator 17 (2016) | 183.1 | 120.6 | 49.8 | 32.1 | 13.7 |
| Titanfall 2 (2016) | 72.2 | 52.5 | 21.3 | 17.3 | |
| Resident Evil 7 (2017) | 84 | 40 | 22.1 | 6.6 | |
| For Honor (2017) | 64.6 | 23 | 21.9 | 15.9 | |
| Ghost Recon Wildlands (2017) | 38.1 | 14.3 | 12 | 3.6 | |
| Prey (2017) | 85.4 | 32.8 | 26.7 | 22 |
| BioShock Infinite - 1366x768 High Preset | |
| Dell Precision 5520 UHD | |
| HP ZBook Studio G3 | |
| Lenovo ThinkPad T570-20HAS01E00 | |
| Lenovo ThinkPad P51s 20HB000SGE | |
| Lenovo ThinkPad P50s-20FKS00400 | |
Noise level
| Idle |
| 29.2 / 29.2 / 31.1 dB(A) |
| Load |
| 36.7 / 39.4 dB(A) |
 | ||
30 dB silent 40 dB(A) audible 50 dB(A) loud |
||
min: | ||
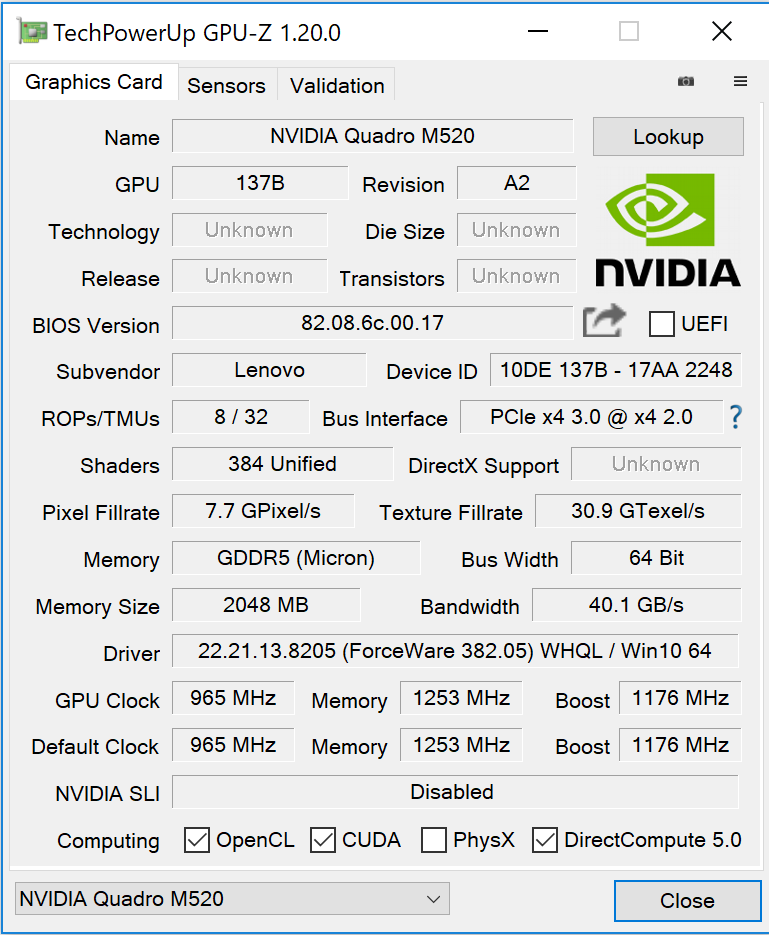
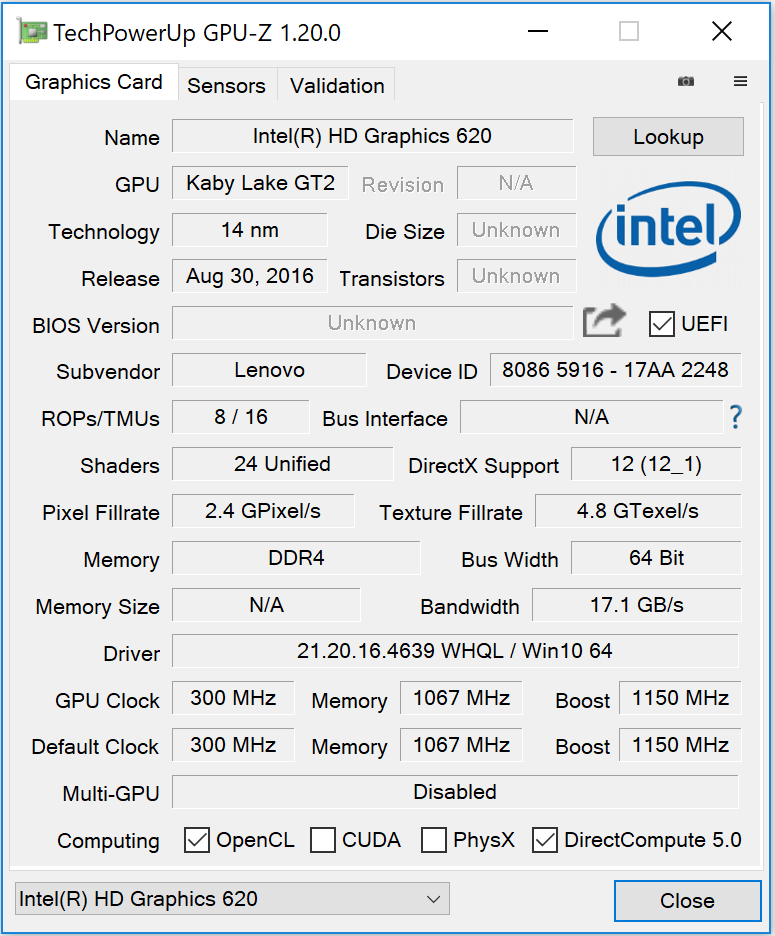
| Lenovo ThinkPad P51s 20HB000SGE i7-7600U, Quadro M520 | Lenovo ThinkPad P50s-20FKS00400 6500U, Quadro M500M | Dell Precision 5520 UHD E3-1505M v6, Quadro M1200 | HP ZBook Studio G3 6820HQ, Quadro M1000M | Lenovo ThinkPad T570-20HAS01E00 i7-7500U, GeForce 940MX | |
|---|---|---|---|---|---|
| Noise | 0% | -6% | -13% | -0% | |
| off / environment * (dB) | 29.2 | 28.7 2% | 30 -3% | 29.3 -0% | |
| Idle Minimum * (dB) | 29.2 | 30 -3% | 28.7 2% | 30 -3% | 29.3 -0% |
| Idle Average * (dB) | 29.2 | 30 -3% | 32.1 -10% | 30 -3% | 29.3 -0% |
| Idle Maximum * (dB) | 31.1 | 30 4% | 32.1 -3% | 30 4% | 31.1 -0% |
| Load Average * (dB) | 36.7 | 33.5 9% | 41.3 -13% | 51 -39% | 35.2 4% |
| Load Maximum * (dB) | 39.4 | 41.9 -6% | 45.5 -15% | 52.8 -34% | 41.3 -5% |
| Witcher 3 ultra * (dB) | 45.5 |
* ... smaller is better
(±) The maximum temperature on the upper side is 43.6 °C / 110 F, compared to the average of 38.2 °C / 101 F, ranging from 22.2 to 69.8 °C for the class Workstation.
(-) The bottom heats up to a maximum of 60.8 °C / 141 F, compared to the average of 41.1 °C / 106 F
(+) In idle usage, the average temperature for the upper side is 26.5 °C / 80 F, compared to the device average of 32 °C / 90 F.
(±) The palmrests and touchpad can get very hot to the touch with a maximum of 39 °C / 102.2 F.
(-) The average temperature of the palmrest area of similar devices was 27.8 °C / 82 F (-11.2 °C / -20.2 F).
| Lenovo ThinkPad P51s 20HB000SGE i7-7600U, Quadro M520 | Lenovo ThinkPad P50s-20FKS00400 6500U, Quadro M500M | Dell Precision 5520 UHD E3-1505M v6, Quadro M1200 | HP ZBook Studio G3 6820HQ, Quadro M1000M | Lenovo ThinkPad T570-20HAS01E00 i7-7500U, GeForce 940MX | |
|---|---|---|---|---|---|
| Heat | 3% | 6% | -33% | 9% | |
| Maximum Upper Side * (°C) | 43.6 | 44.2 -1% | 51.6 -18% | 69.8 -60% | 43.1 1% |
| Maximum Bottom * (°C) | 60.8 | 57.8 5% | 43.6 28% | 77.3 -27% | 55.4 9% |
| Idle Upper Side * (°C) | 27.3 | 26.4 3% | 26.6 3% | 37.8 -38% | 24.3 11% |
| Idle Bottom * (°C) | 29 | 28.1 3% | 26.2 10% | 31.4 -8% | 25 14% |
* ... smaller is better
Lenovo ThinkPad P51s 20HB000SGE audio analysis
(±) | speaker loudness is average but good (75.2 dB)
Bass 100 - 315 Hz
(±) | reduced bass - on average 10.7% lower than median
(±) | linearity of bass is average (11% delta to prev. frequency)
Mids 400 - 2000 Hz
(+) | balanced mids - only 3.9% away from median
(±) | linearity of mids is average (10.5% delta to prev. frequency)
Highs 2 - 16 kHz
(+) | balanced highs - only 3.1% away from median
(±) | linearity of highs is average (7.1% delta to prev. frequency)
Overall 100 - 16.000 Hz
(±) | linearity of overall sound is average (15.6% difference to median)
Compared to same class
» 35% of all tested devices in this class were better, 11% similar, 54% worse
» The best had a delta of 7%, average was 17%, worst was 35%
Compared to all devices tested
» 23% of all tested devices were better, 5% similar, 72% worse
» The best had a delta of 4%, average was 24%, worst was 134%
Dell Precision 5520 UHD audio analysis
(±) | speaker loudness is average but good (79.6 dB)
Bass 100 - 315 Hz
(±) | reduced bass - on average 12.8% lower than median
(±) | linearity of bass is average (14.2% delta to prev. frequency)
Mids 400 - 2000 Hz
(+) | balanced mids - only 4% away from median
(±) | linearity of mids is average (9.9% delta to prev. frequency)
Highs 2 - 16 kHz
(+) | balanced highs - only 3.3% away from median
(±) | linearity of highs is average (12% delta to prev. frequency)
Overall 100 - 16.000 Hz
(±) | linearity of overall sound is average (16.7% difference to median)
Compared to same class
» 46% of all tested devices in this class were better, 9% similar, 45% worse
» The best had a delta of 7%, average was 17%, worst was 35%
Compared to all devices tested
» 29% of all tested devices were better, 7% similar, 64% worse
» The best had a delta of 4%, average was 24%, worst was 134%
| Off / Standby | |
| Idle | |
| Load |
|
Key:
min: | |
| Lenovo ThinkPad P51s 20HB000SGE i7-7600U, Quadro M520 | Lenovo ThinkPad P50s-20FKS00400 6500U, Quadro M500M | Dell Precision 5520 UHD E3-1505M v6, Quadro M1200 | HP ZBook Studio G3 6820HQ, Quadro M1000M | Lenovo ThinkPad T570-20HAS01E00 i7-7500U, GeForce 940MX | |
|---|---|---|---|---|---|
| Power Consumption | 22% | -44% | -42% | 10% | |
| Idle Minimum * (Watt) | 5.8 | 4.3 26% | 8.9 -53% | 8.7 -50% | 4.7 19% |
| Idle Average * (Watt) | 10.4 | 9.7 7% | 13.6 -31% | 14.2 -37% | 9.9 5% |
| Idle Maximum * (Watt) | 13.5 | 10.2 24% | 14.1 -4% | 14.4 -7% | 10.9 19% |
| Load Average * (Watt) | 62.4 | 45.7 27% | 100.3 -61% | 85.6 -37% | 56.1 10% |
| Load Maximum * (Watt) | 73.1 | 55.8 24% | 126.3 -73% | 129.7 -77% | 75 -3% |
| Witcher 3 ultra * (Watt) | 100.2 |
* ... smaller is better
| Lenovo ThinkPad P51s 20HB000SGE i7-7600U, Quadro M520, 104 Wh | Lenovo ThinkPad P50s-20FKS00400 6500U, Quadro M500M, 67 Wh | Dell Precision 5520 UHD E3-1505M v6, Quadro M1200, 97 Wh | HP ZBook Studio G3 6820HQ, Quadro M1000M, 64 Wh | Lenovo ThinkPad T570-20HAS01E00 i7-7500U, GeForce 940MX, 56 Wh | |
|---|---|---|---|---|---|
| Battery runtime | -39% | -67% | -72% | -42% | |
| Reader / Idle (h) | 26.4 | 18.5 -30% | 12.1 -54% | 8.5 -68% | 13.3 -50% |
| H.264 (h) | 11.7 | 9 -23% | 3.8 -68% | 8.1 -31% | |
| WiFi v1.3 (h) | 11.9 | 6.8 -43% | 4.2 -65% | 3.5 -71% | 6.9 -42% |
| Load (h) | 5.4 | 2.2 -59% | 1 -81% | 1.1 -80% | 2.9 -46% |
Pros
Cons
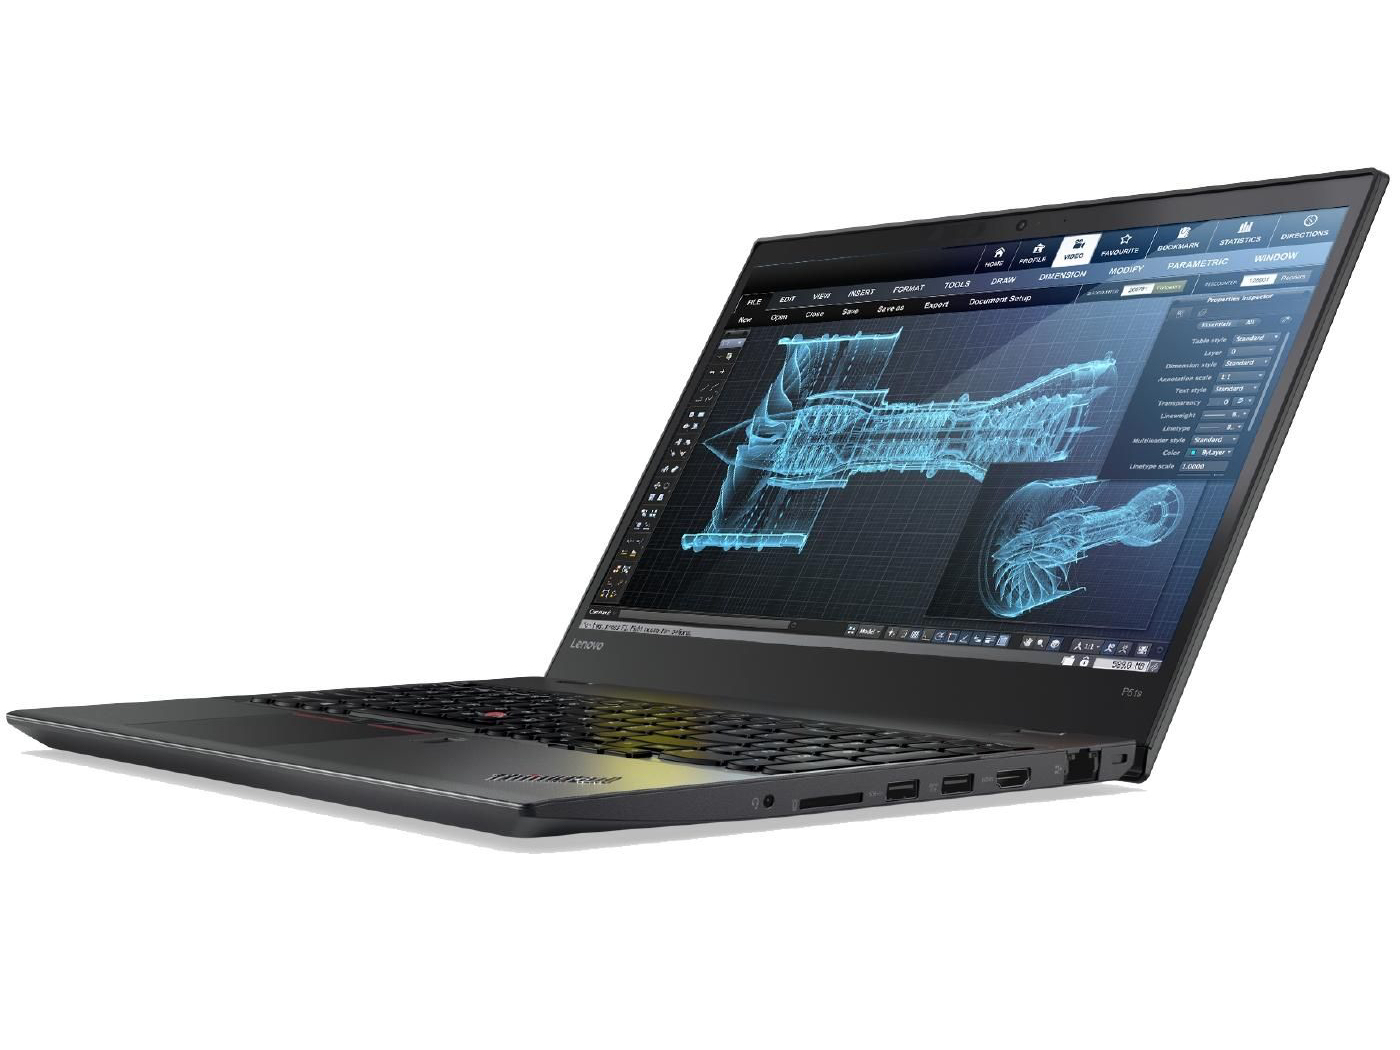
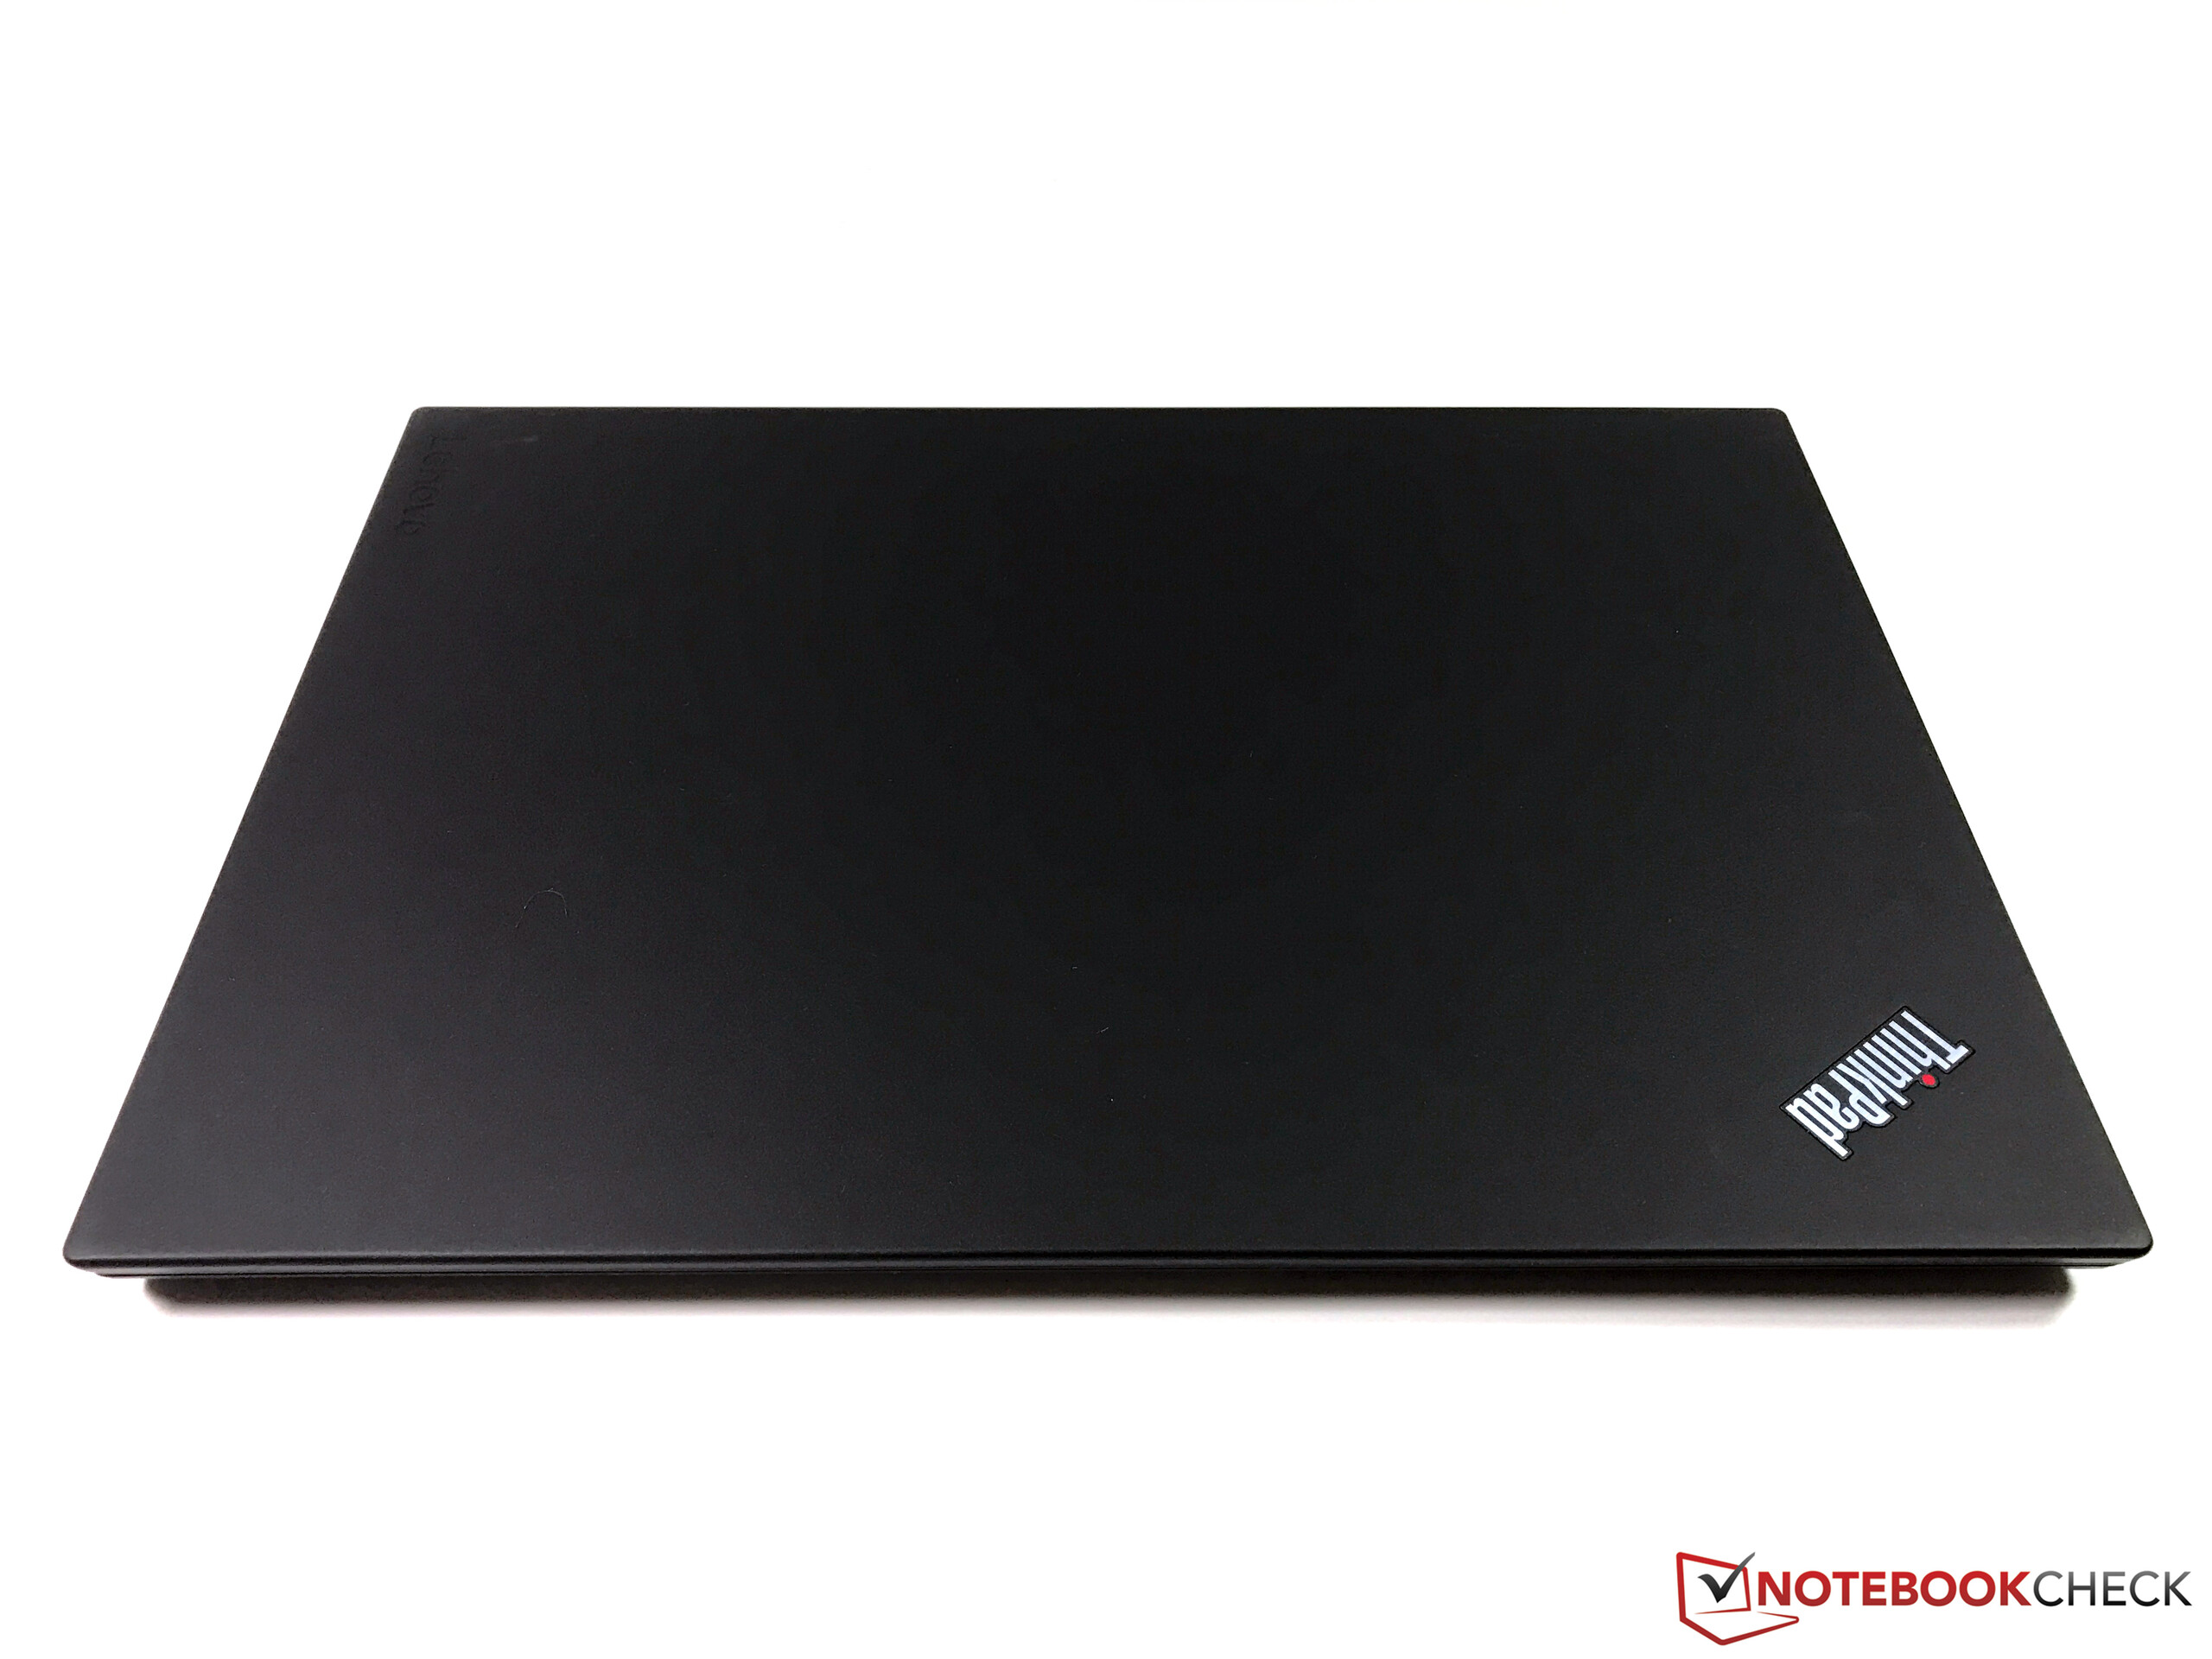
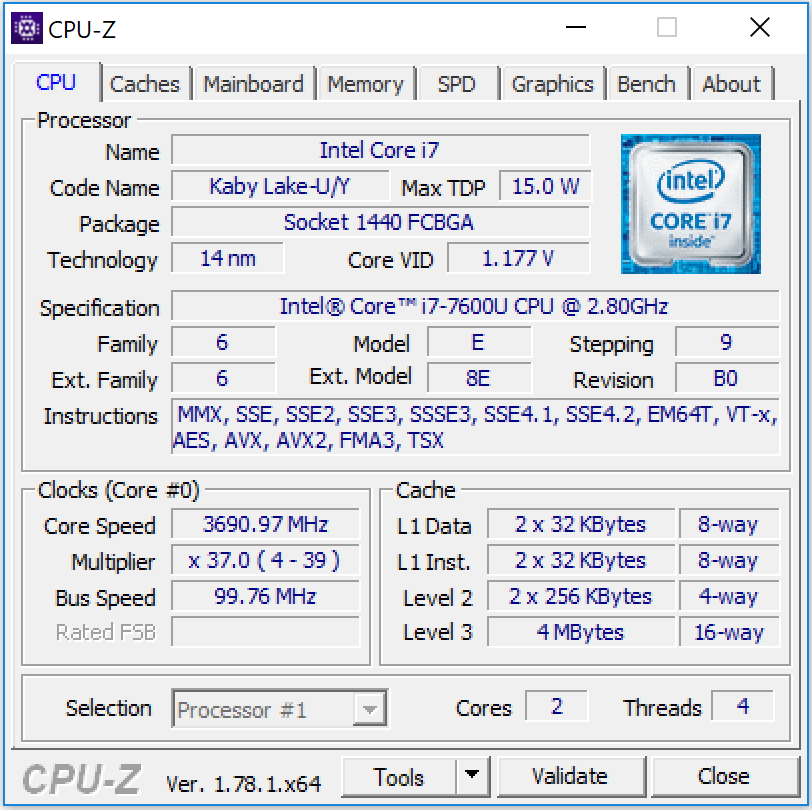
联想提供了一个紧凑的15.6英寸移动工作站ThinkPad P51。然而,买家应该意识到,由于采用ULV处理器,工作站的性能受到限制。具有四核处理器的工作站将被要求更高的性能 ——例如ThinkPad P51。
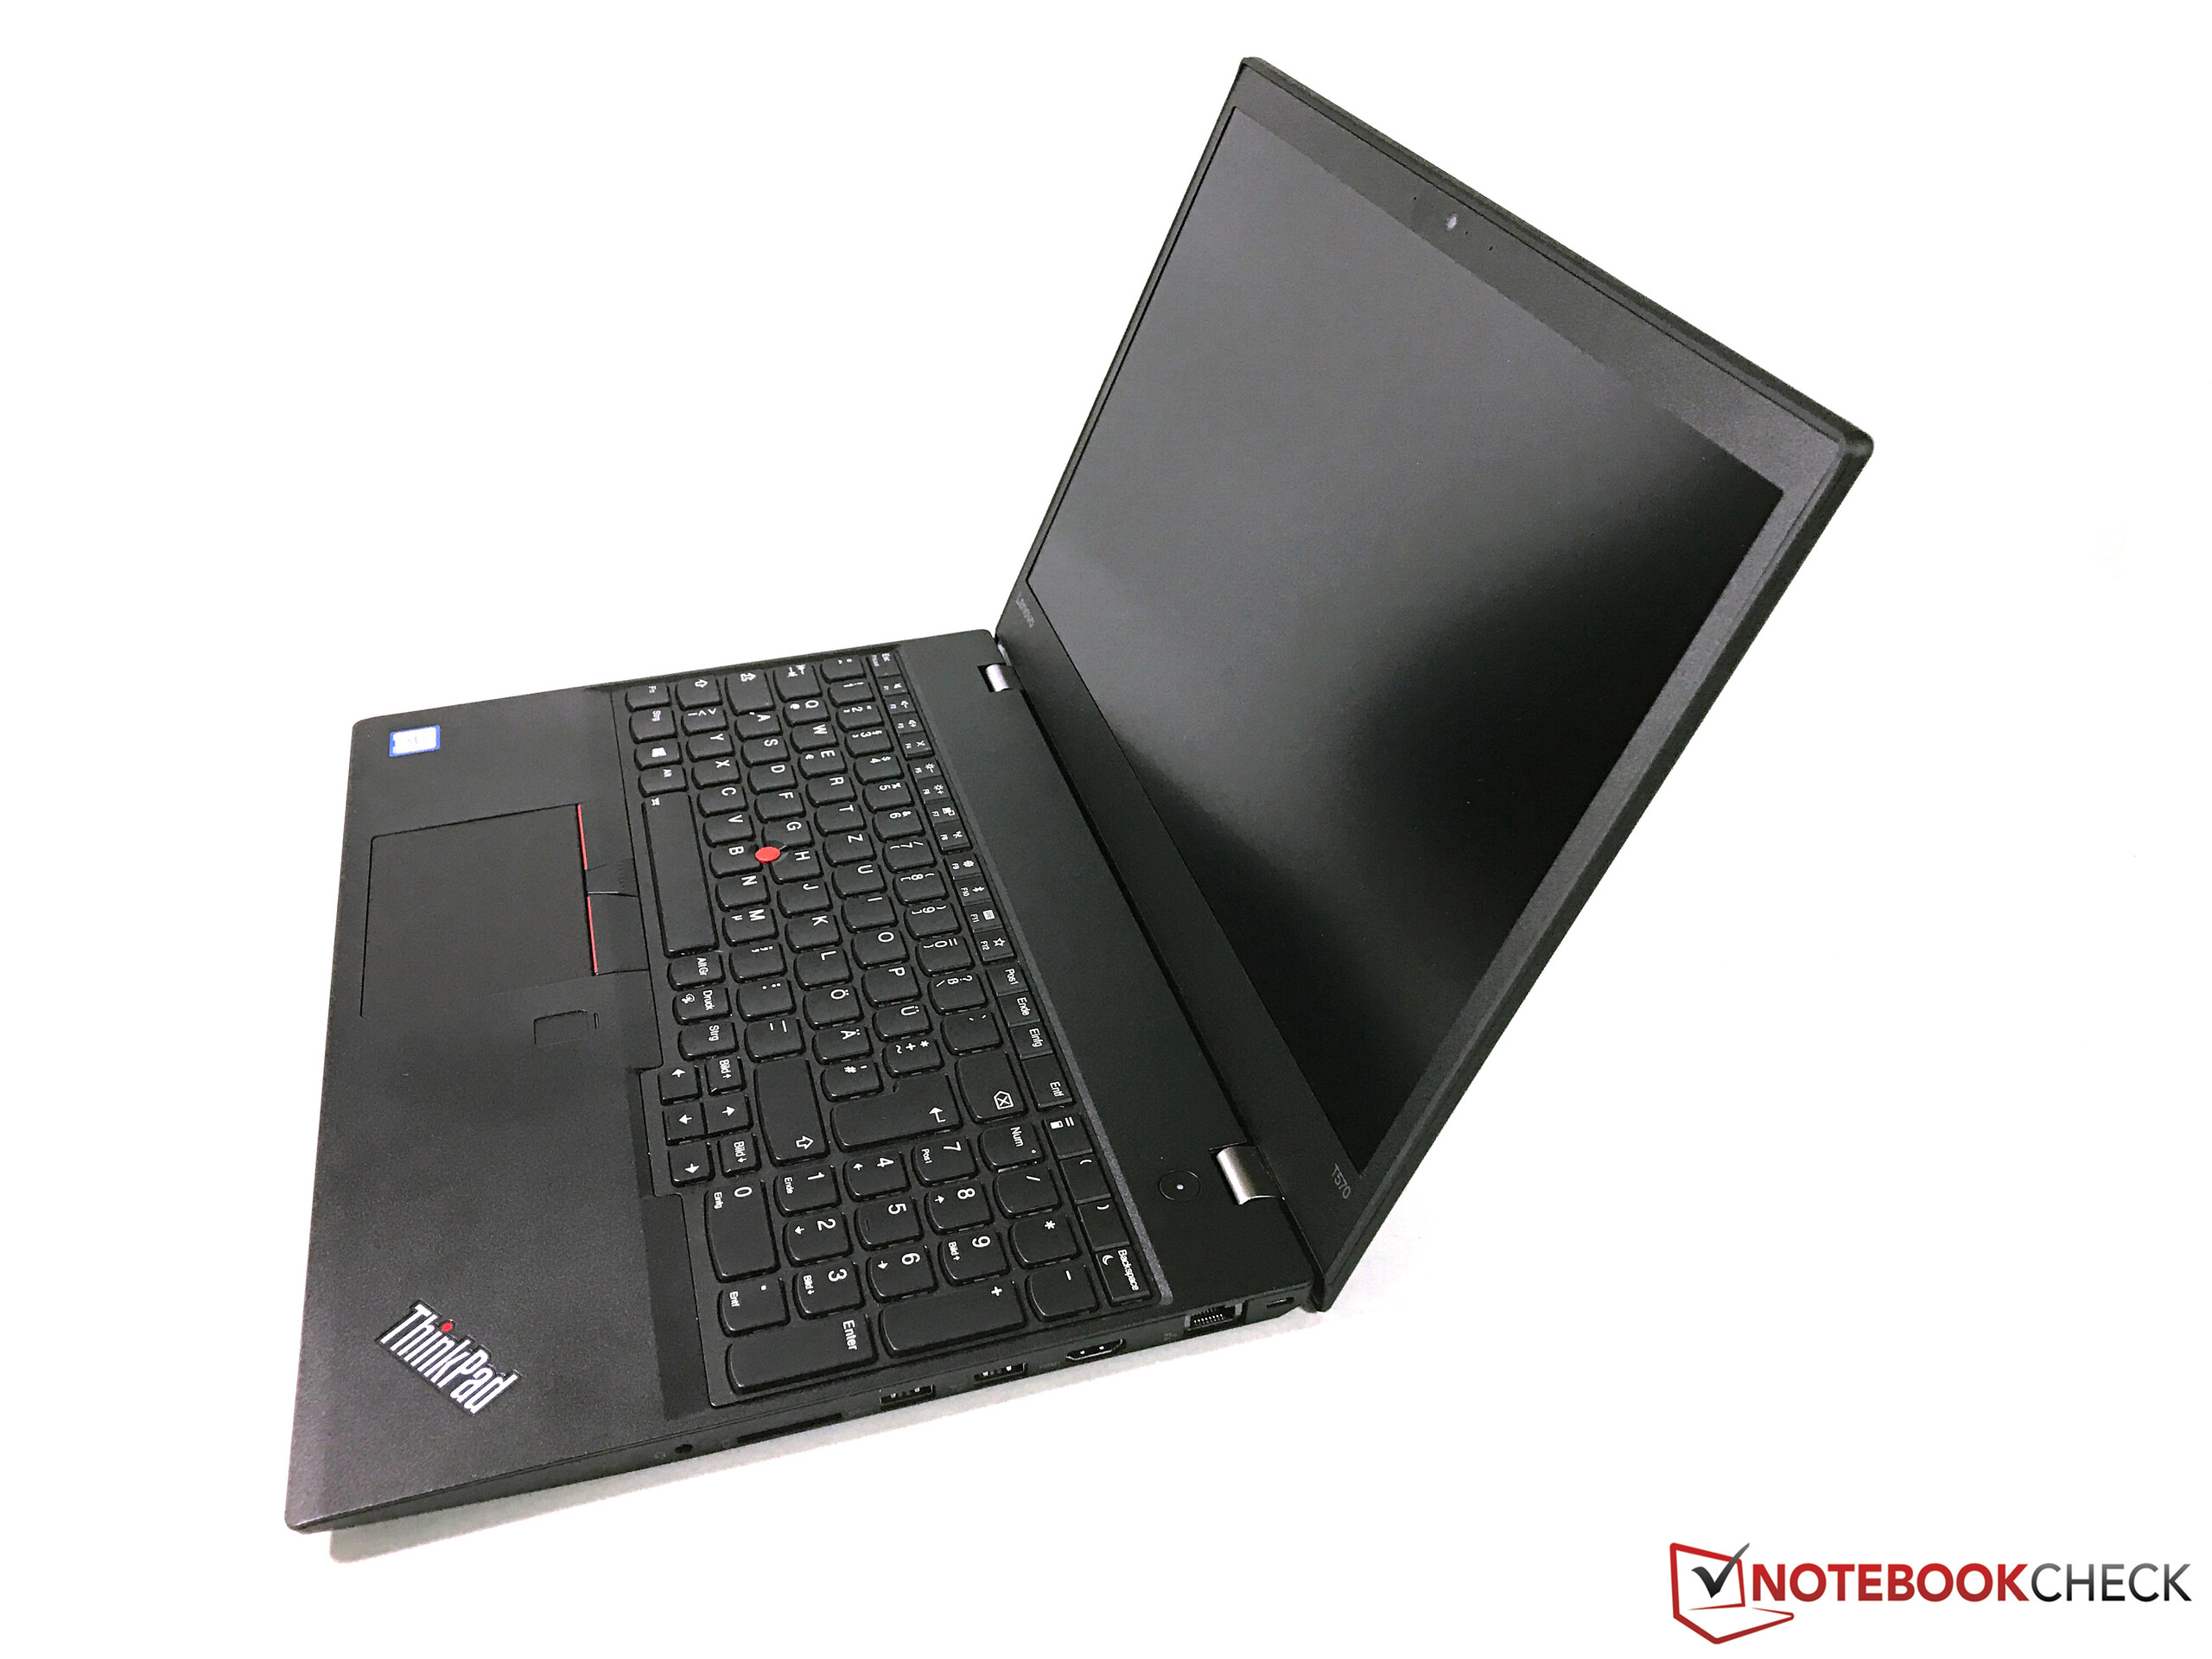
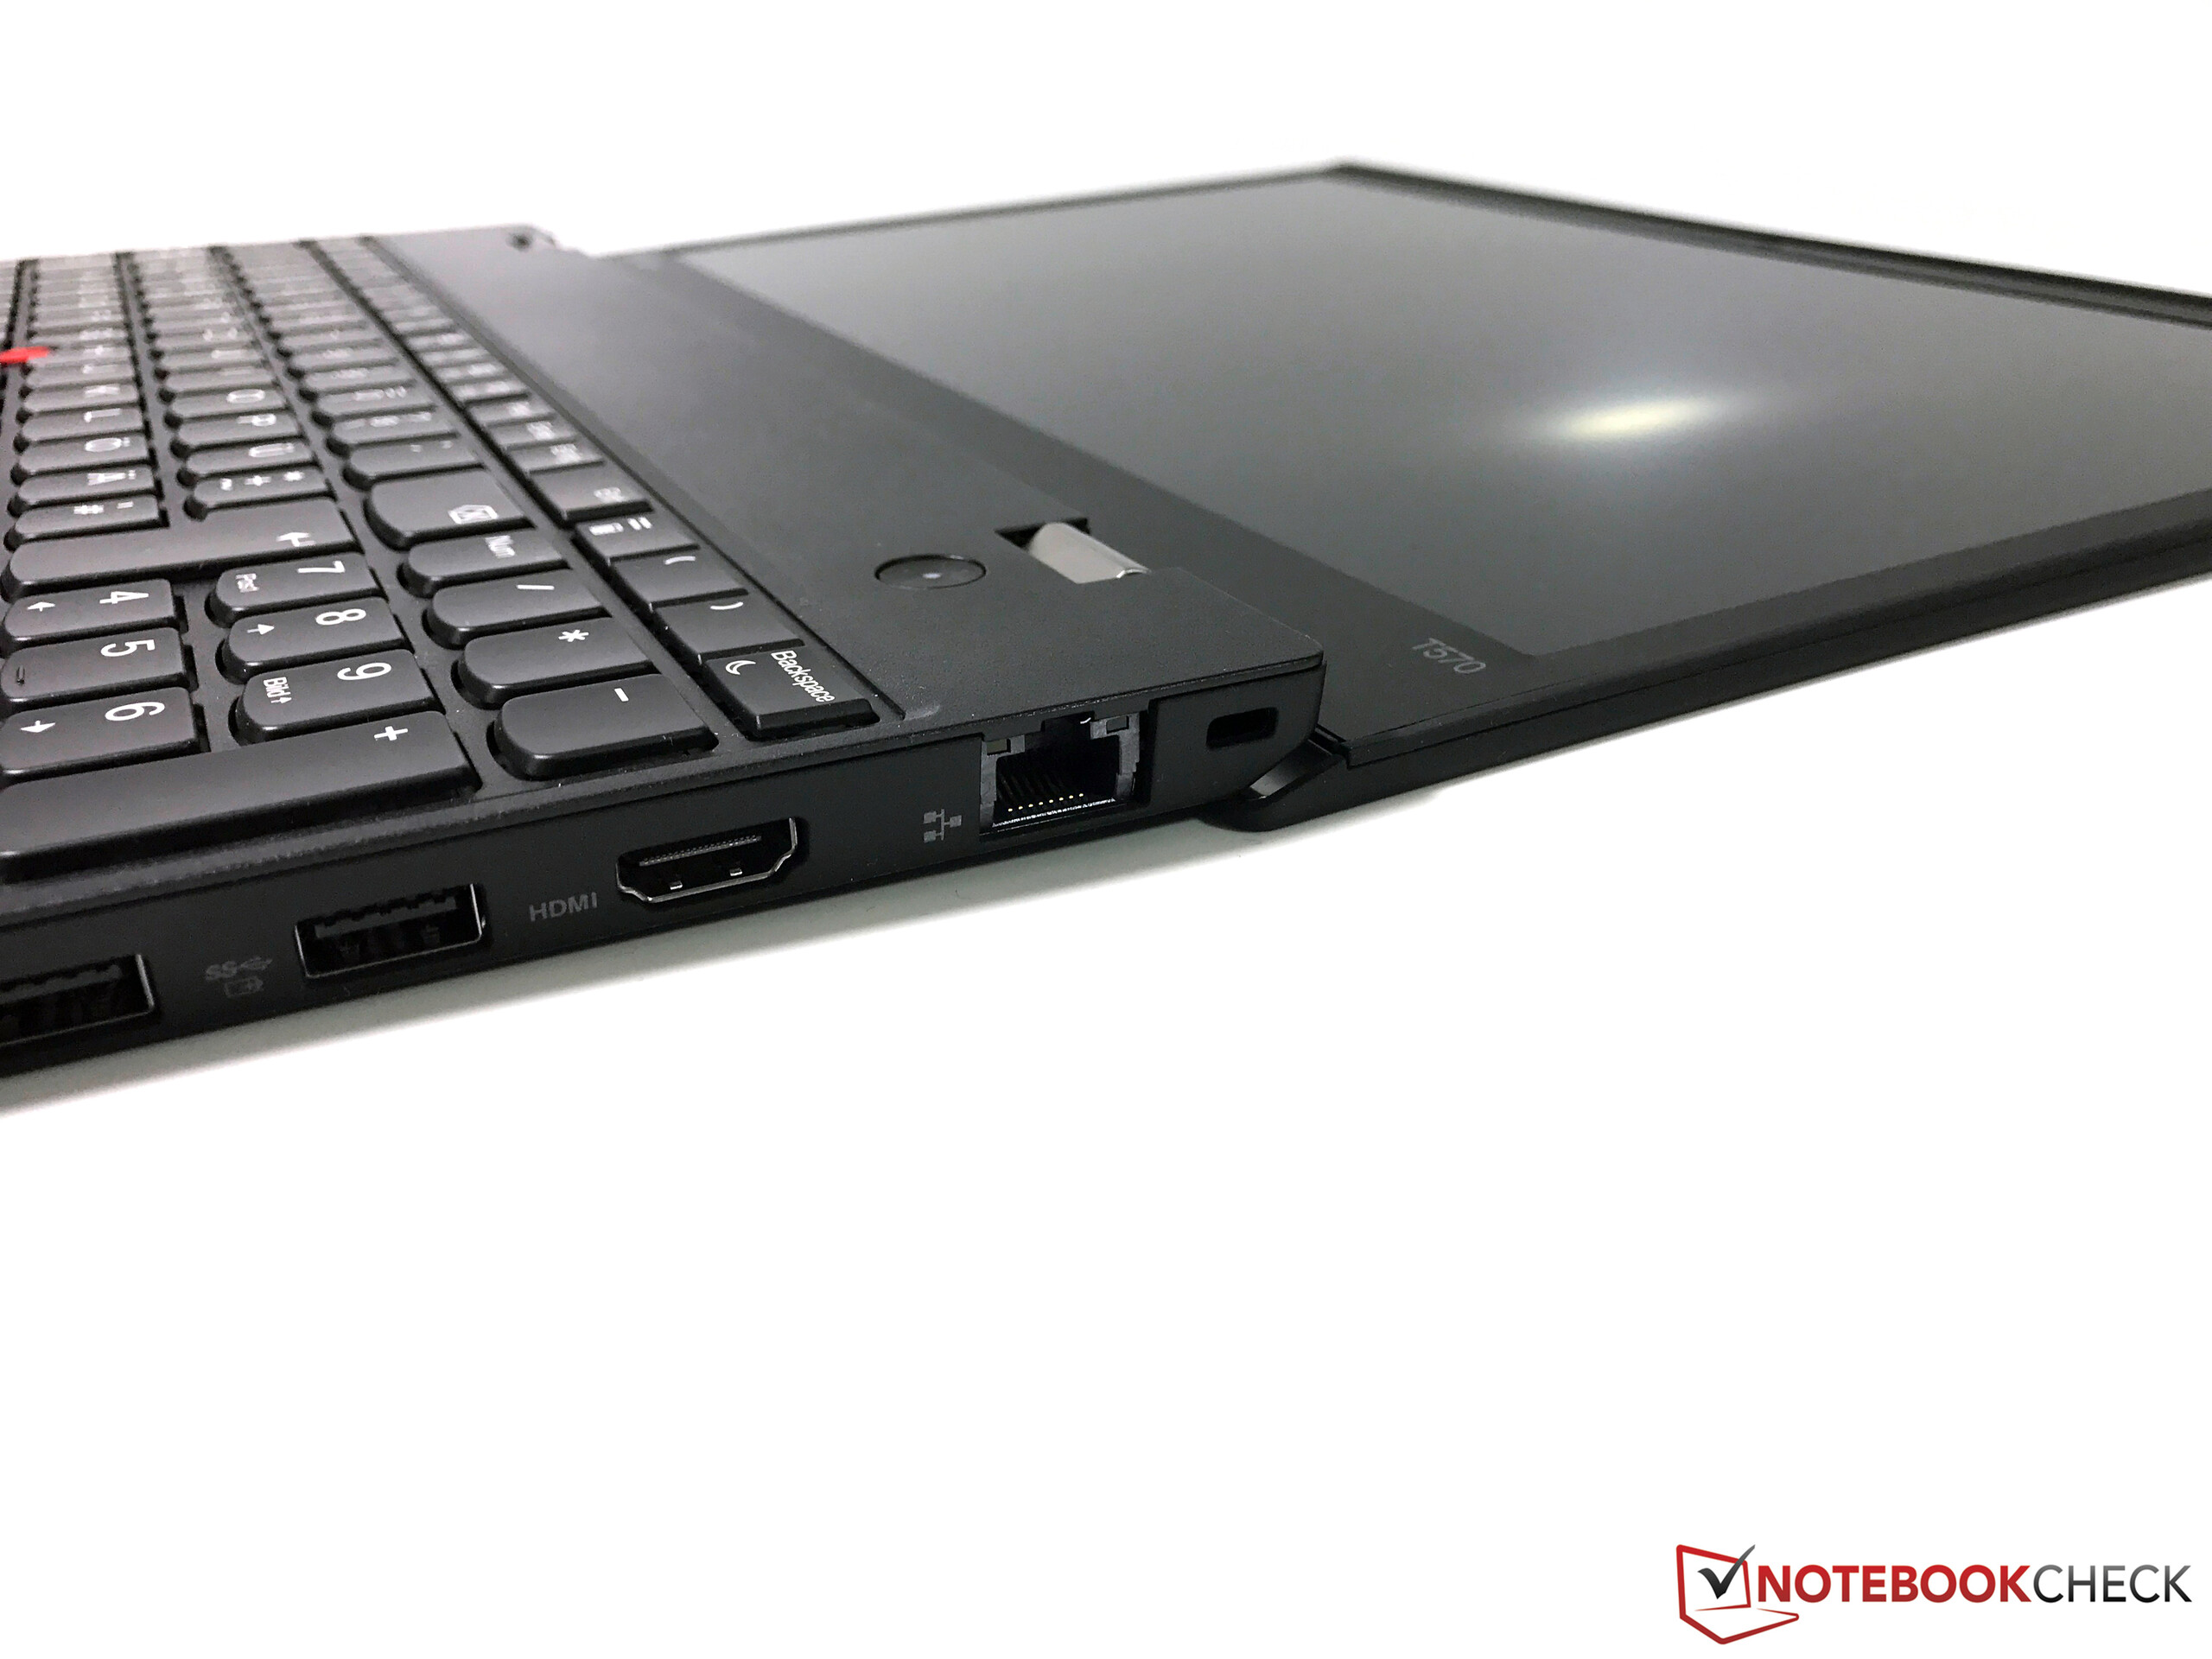
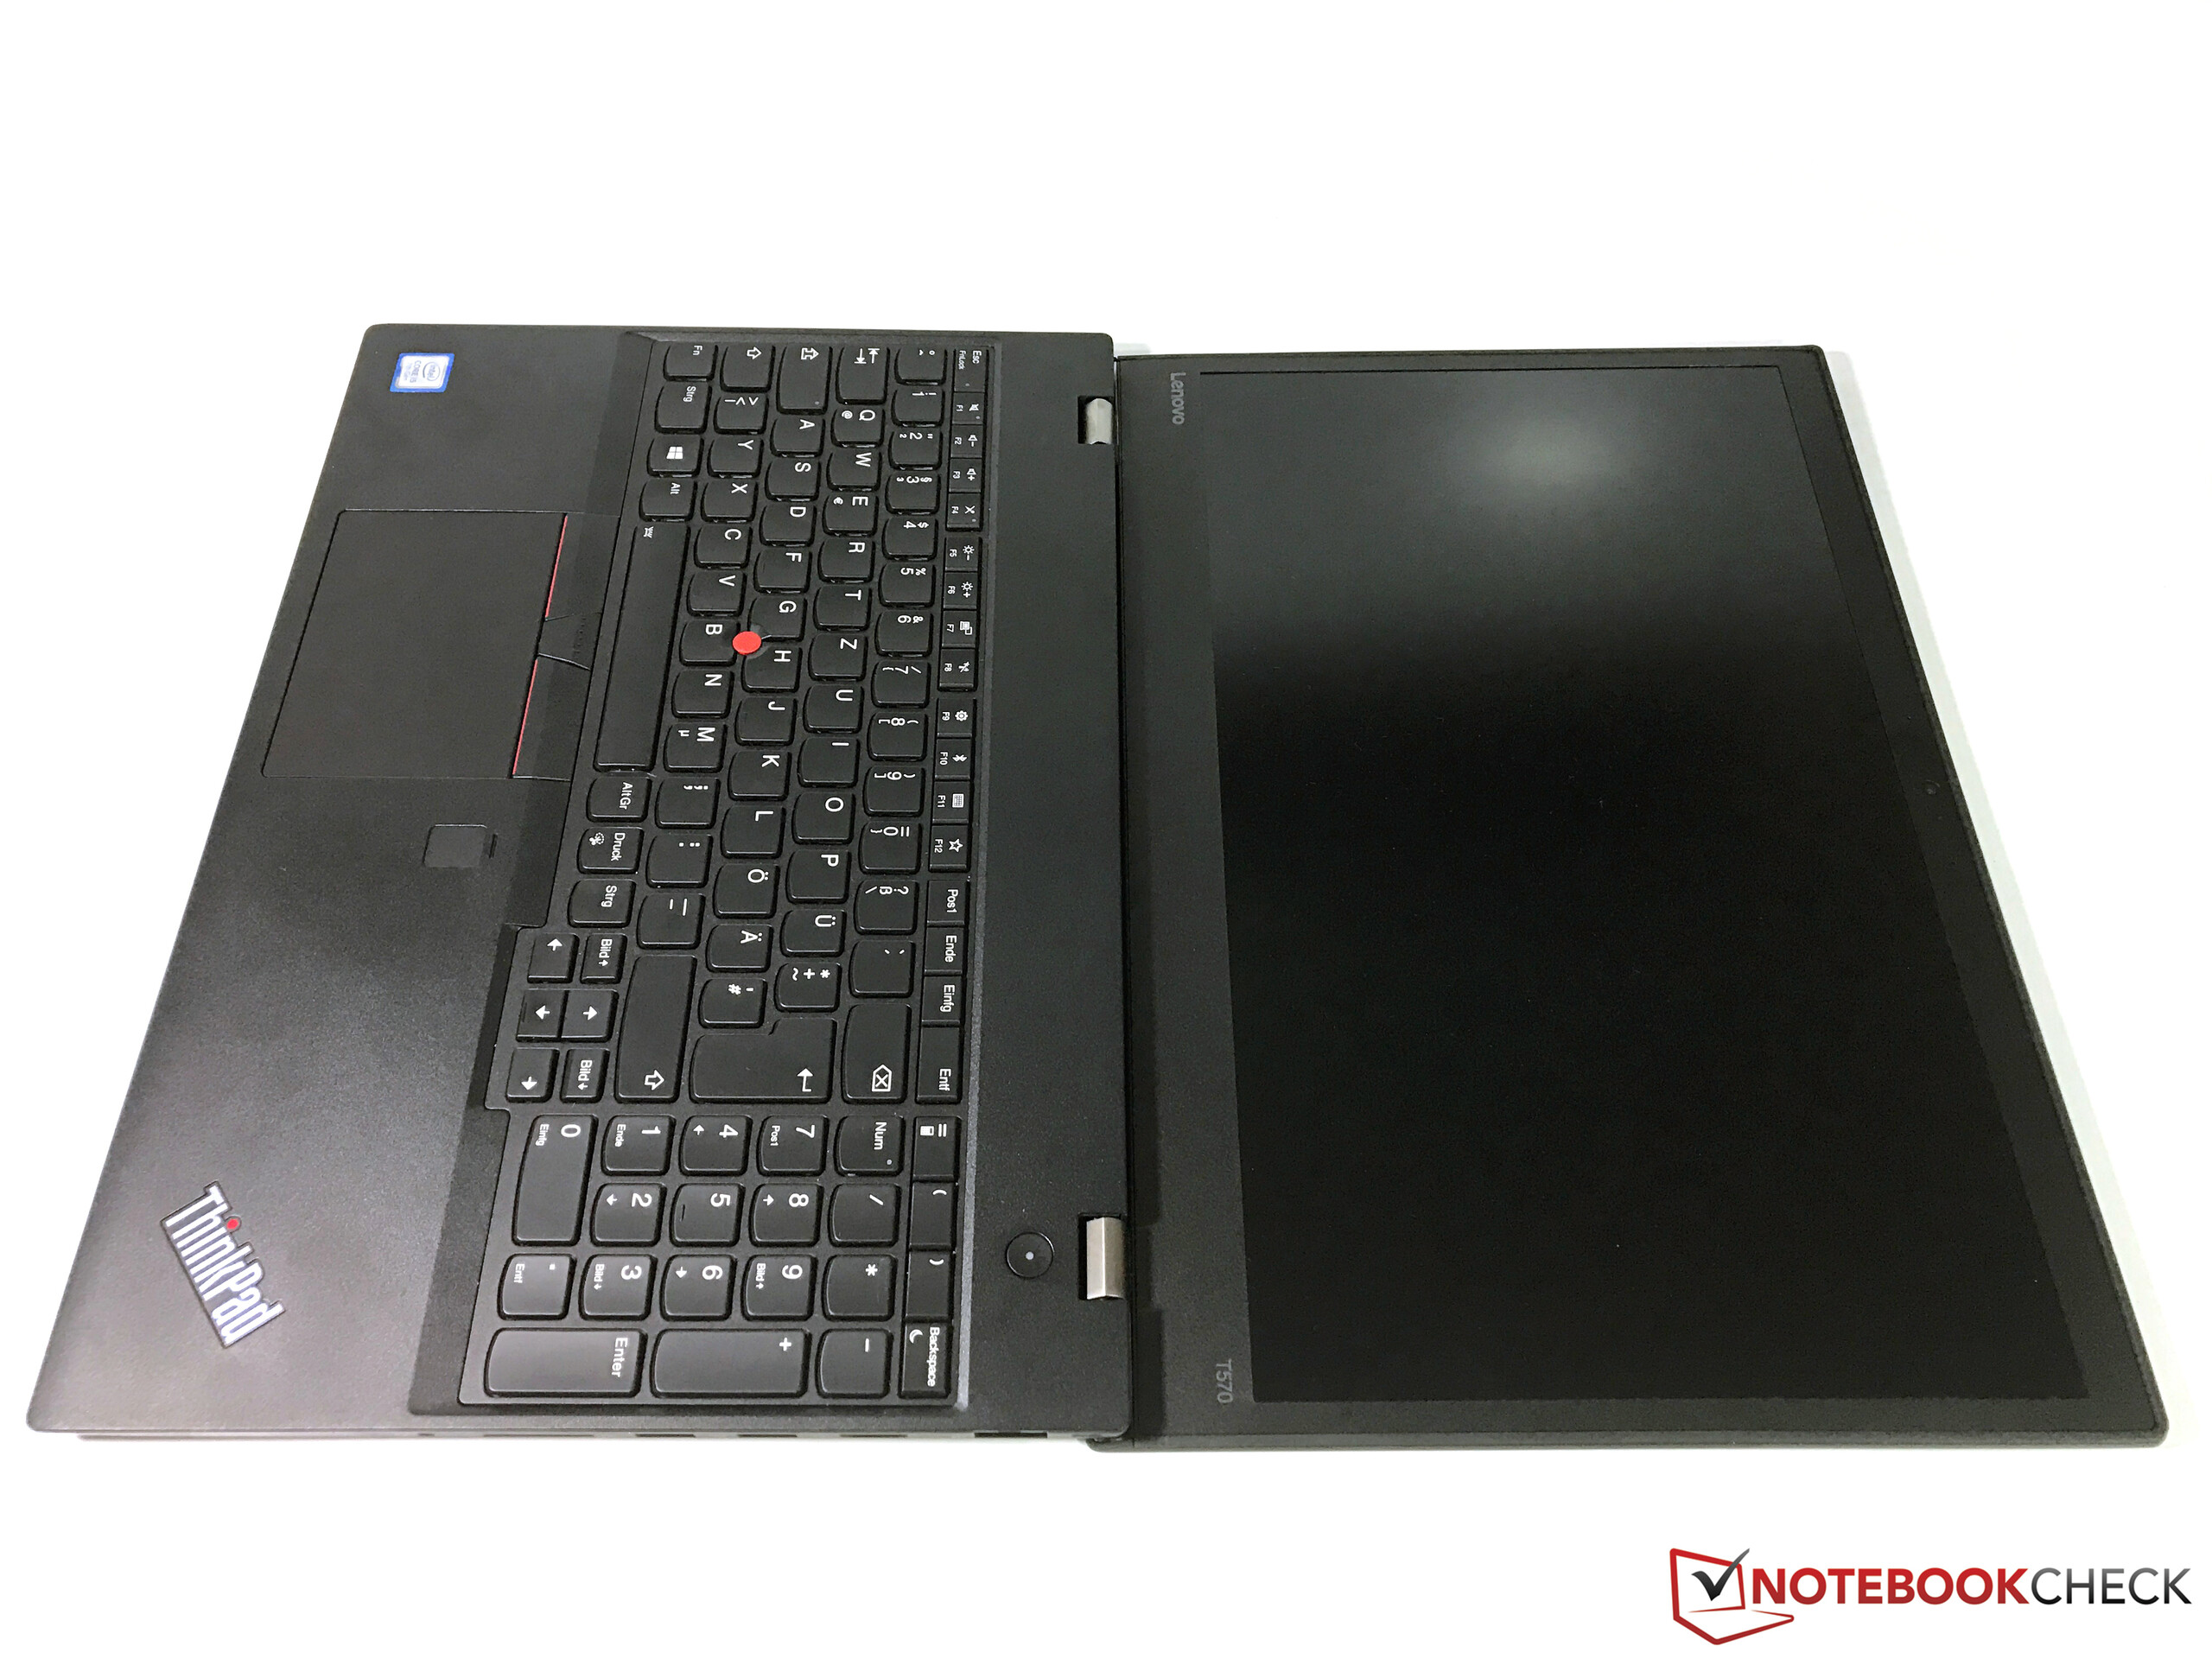
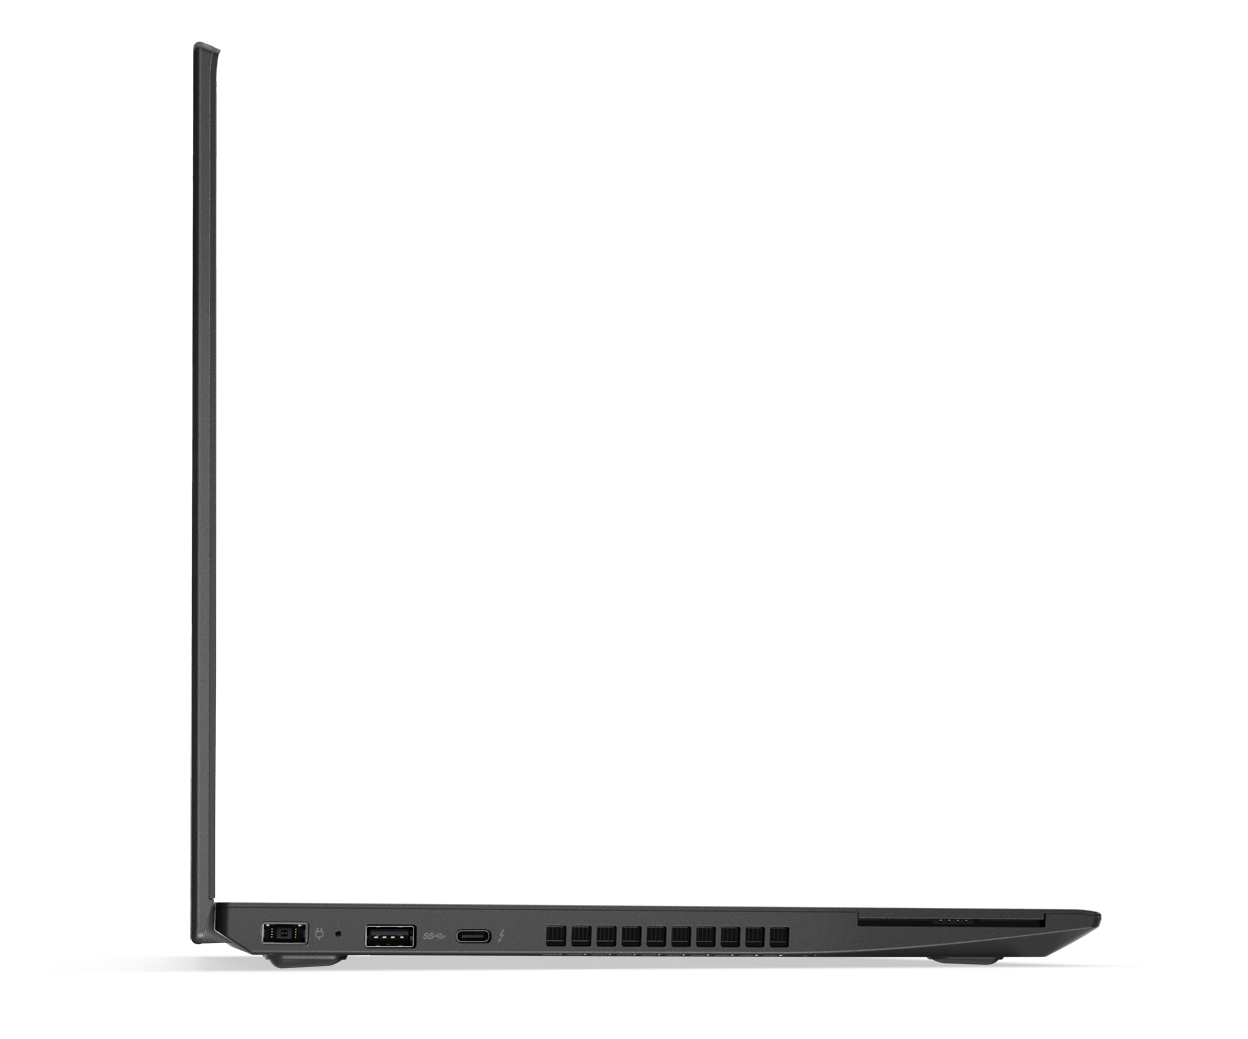
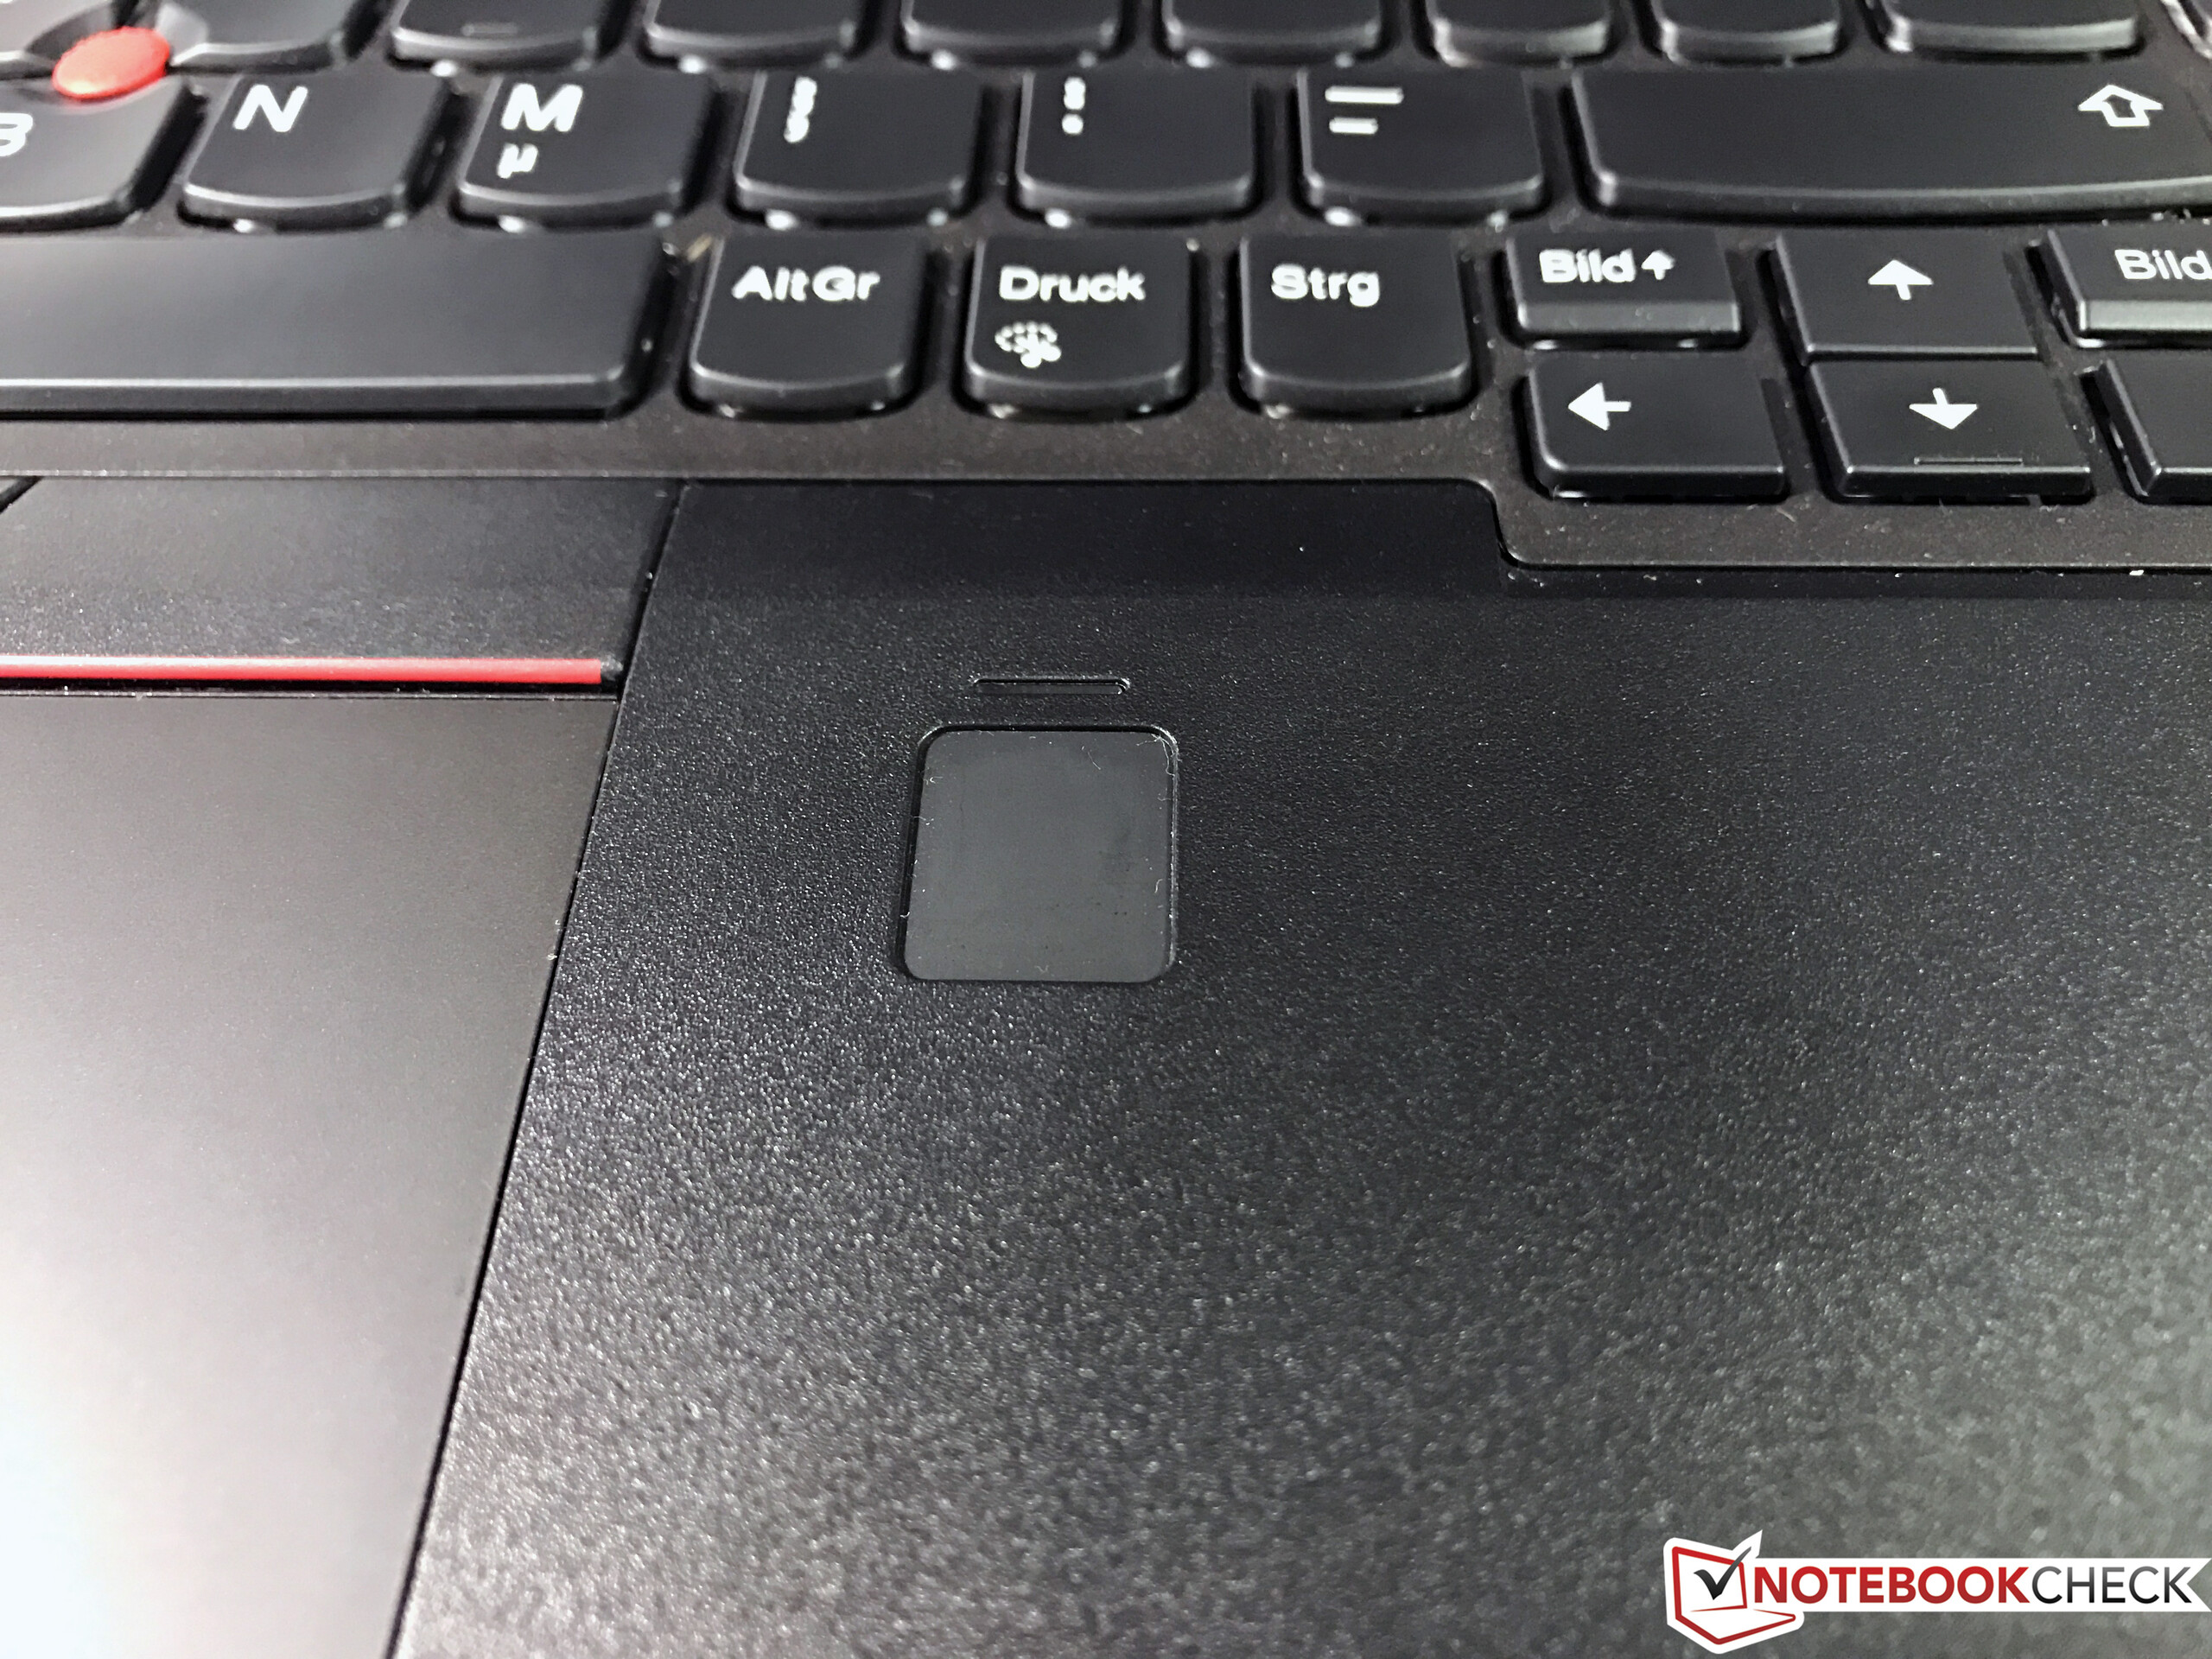
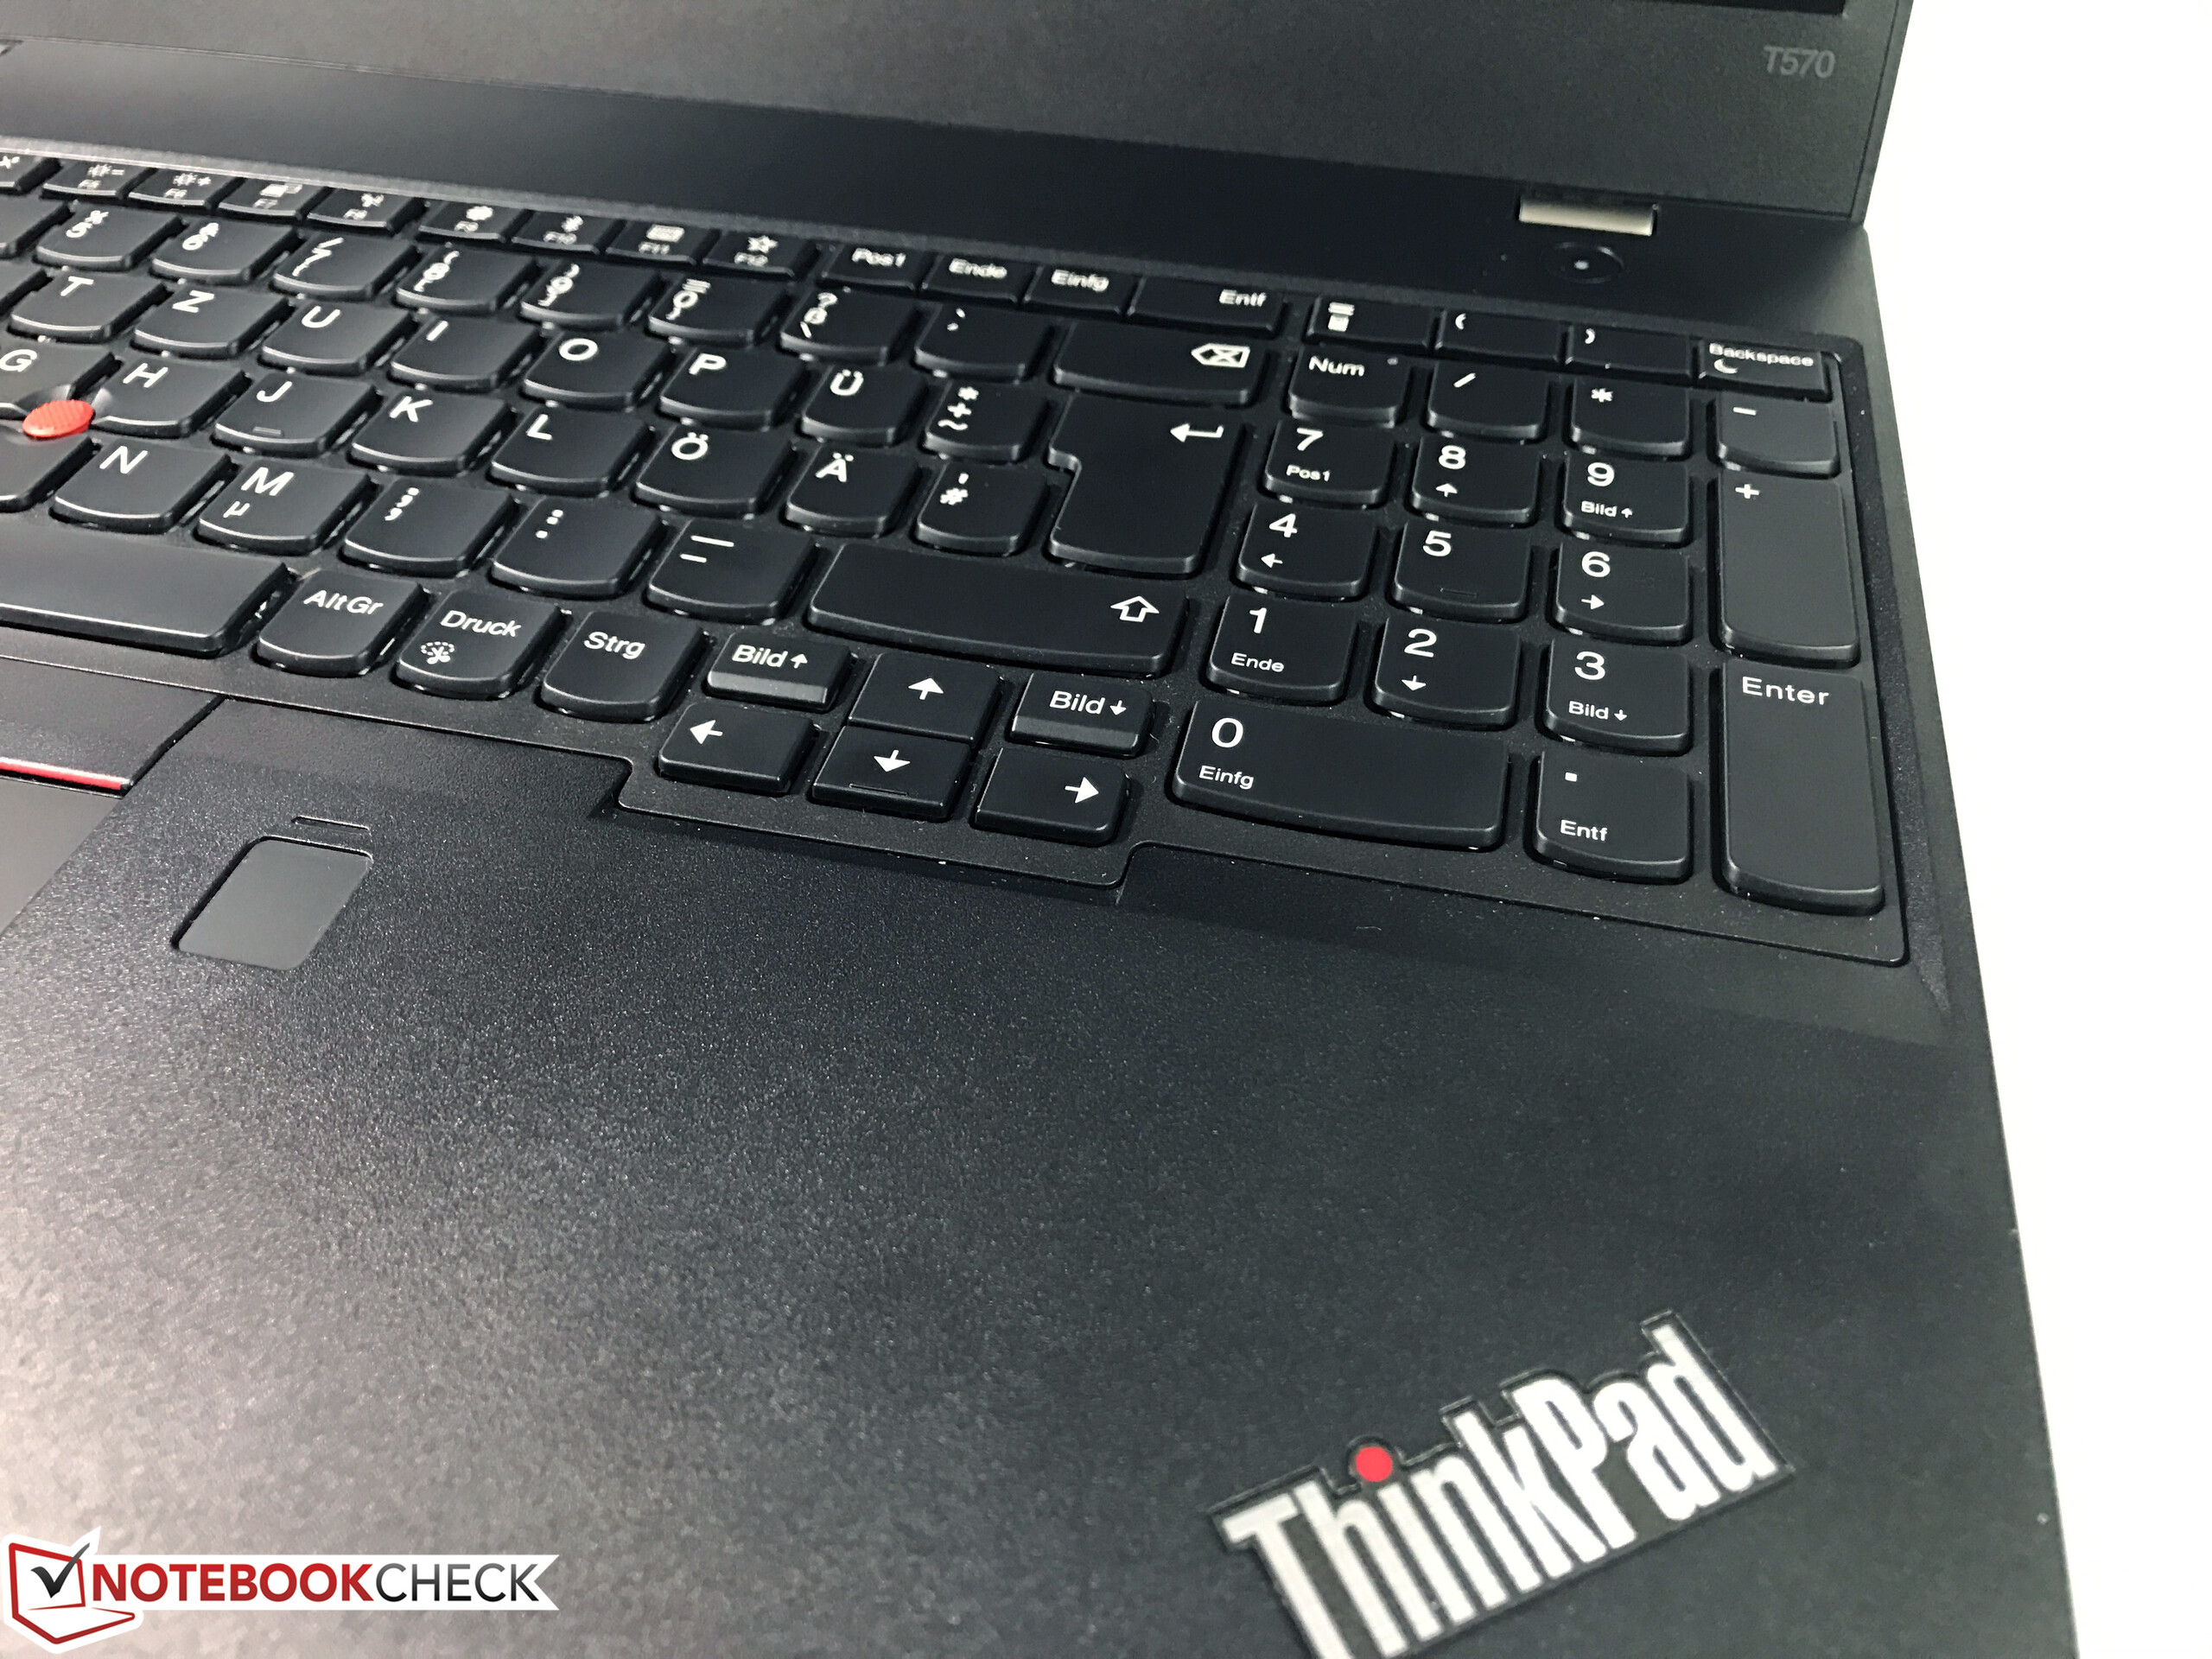
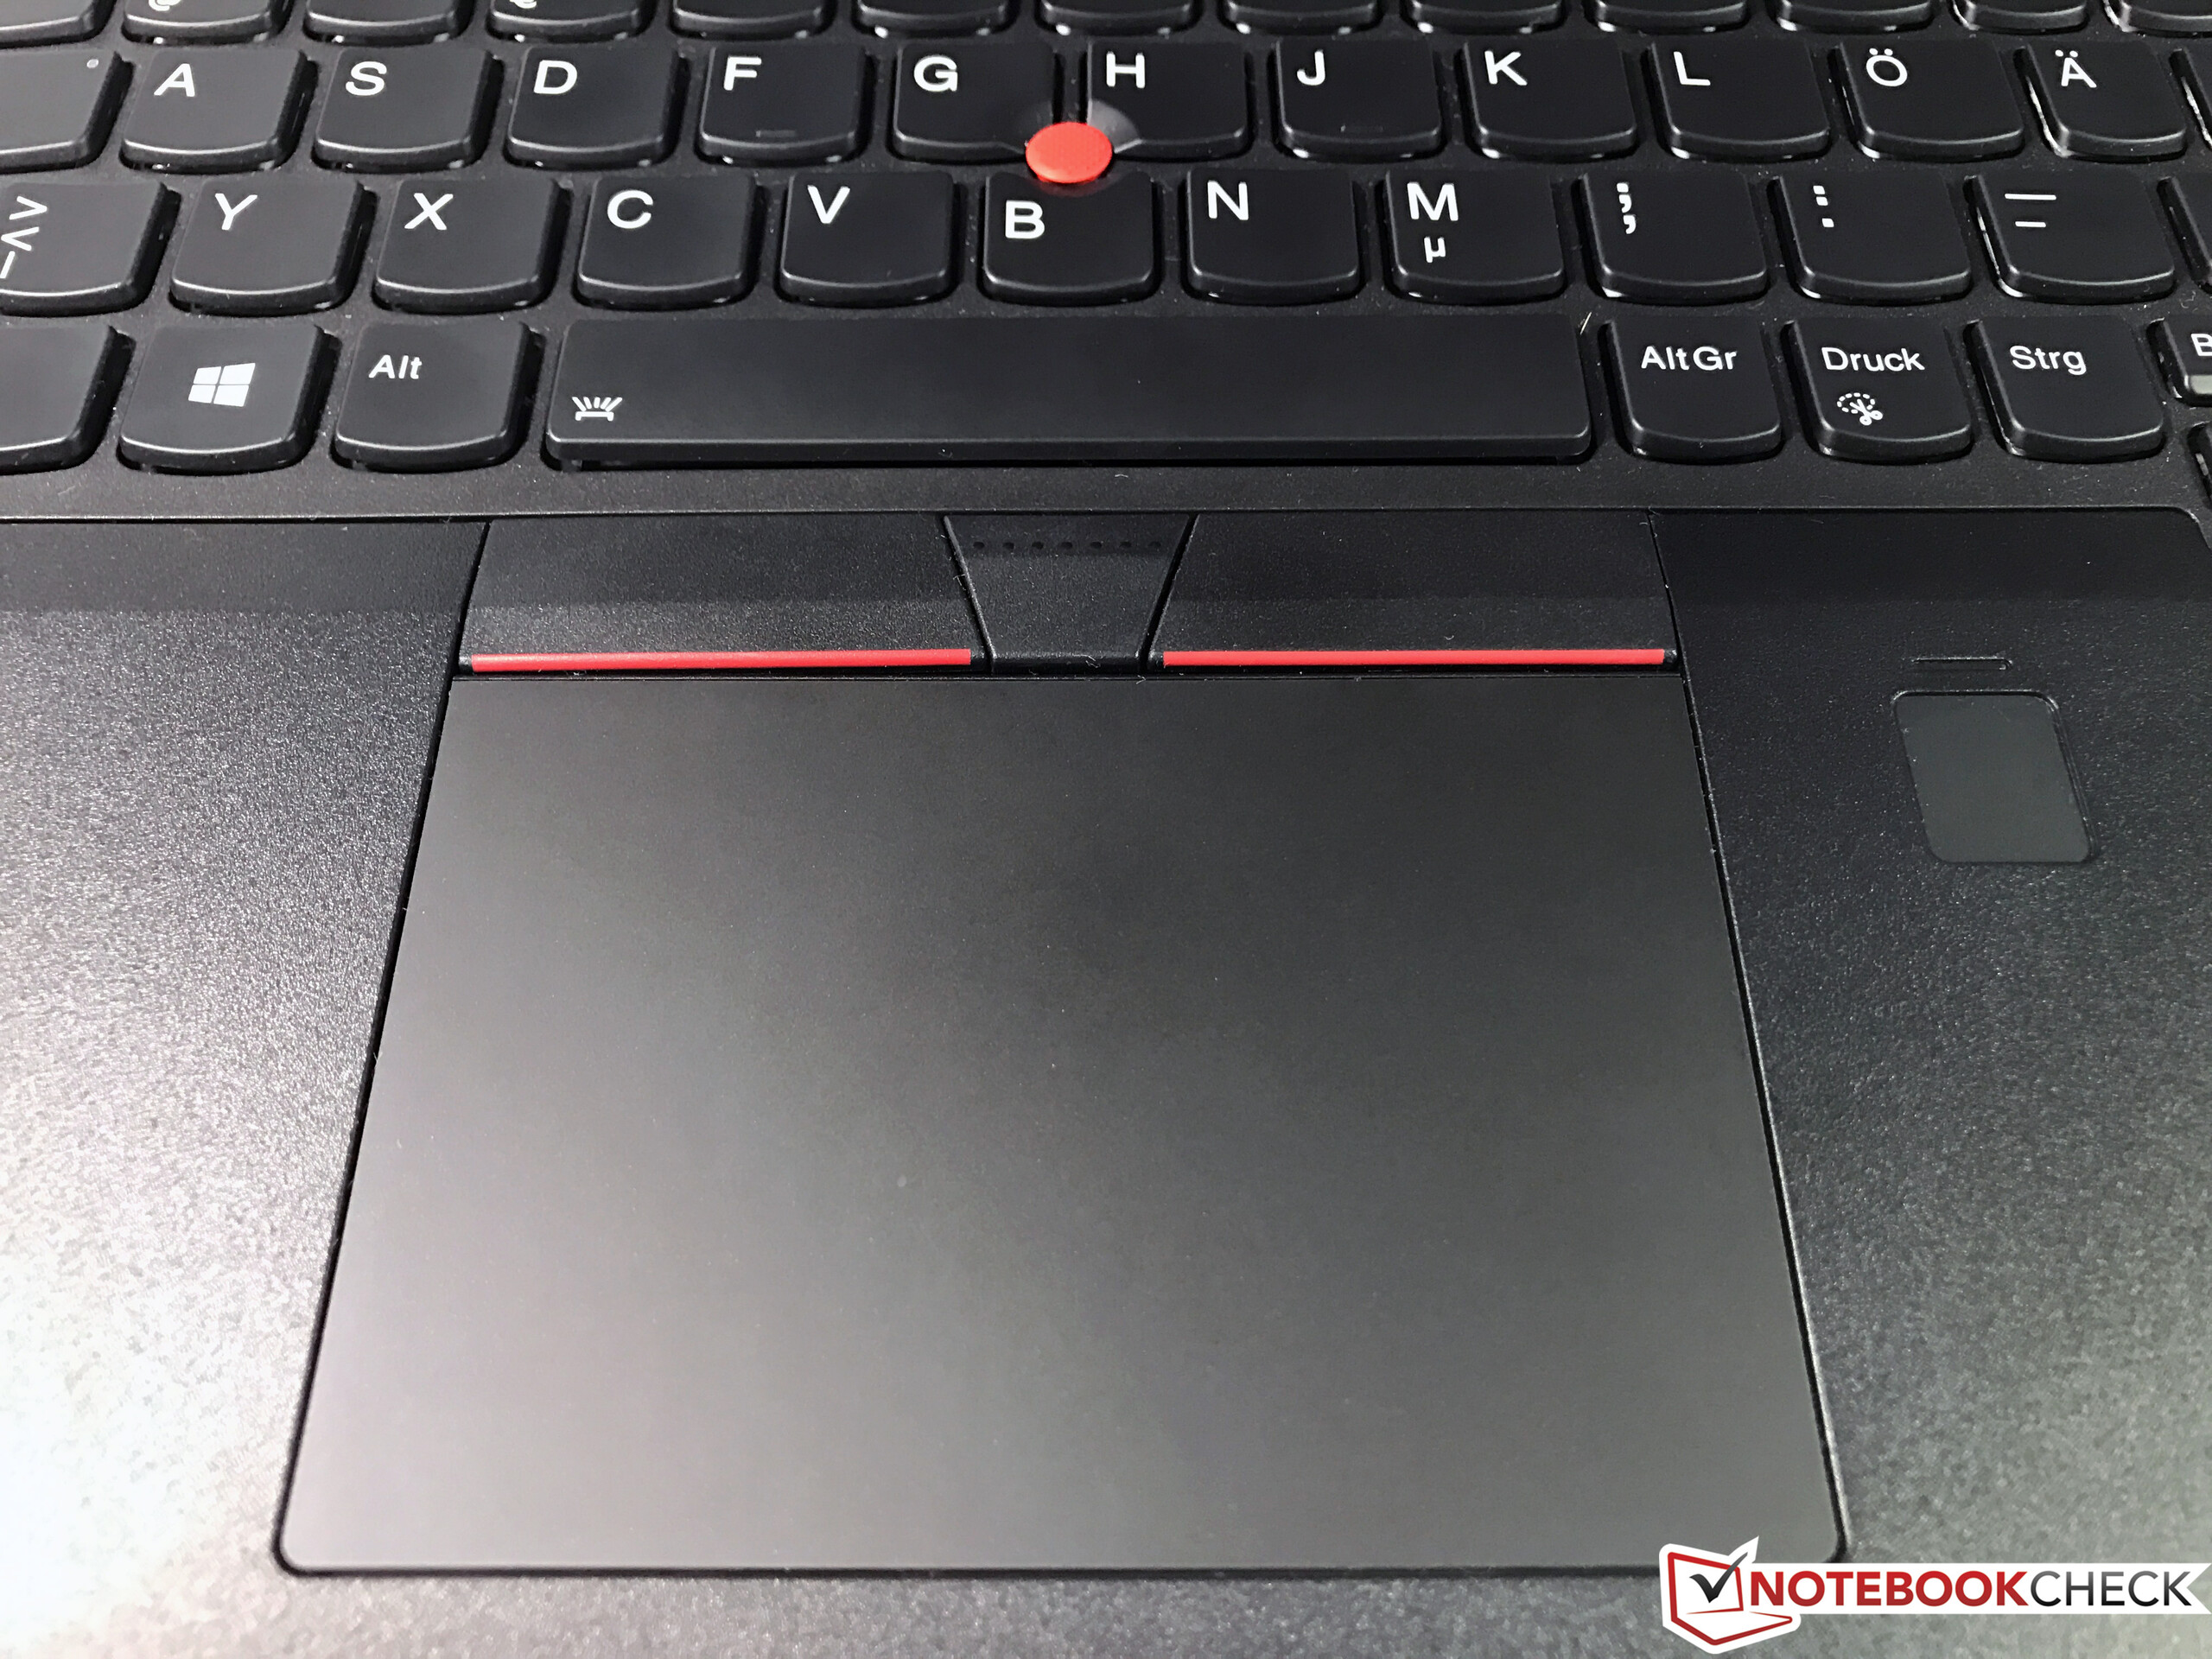
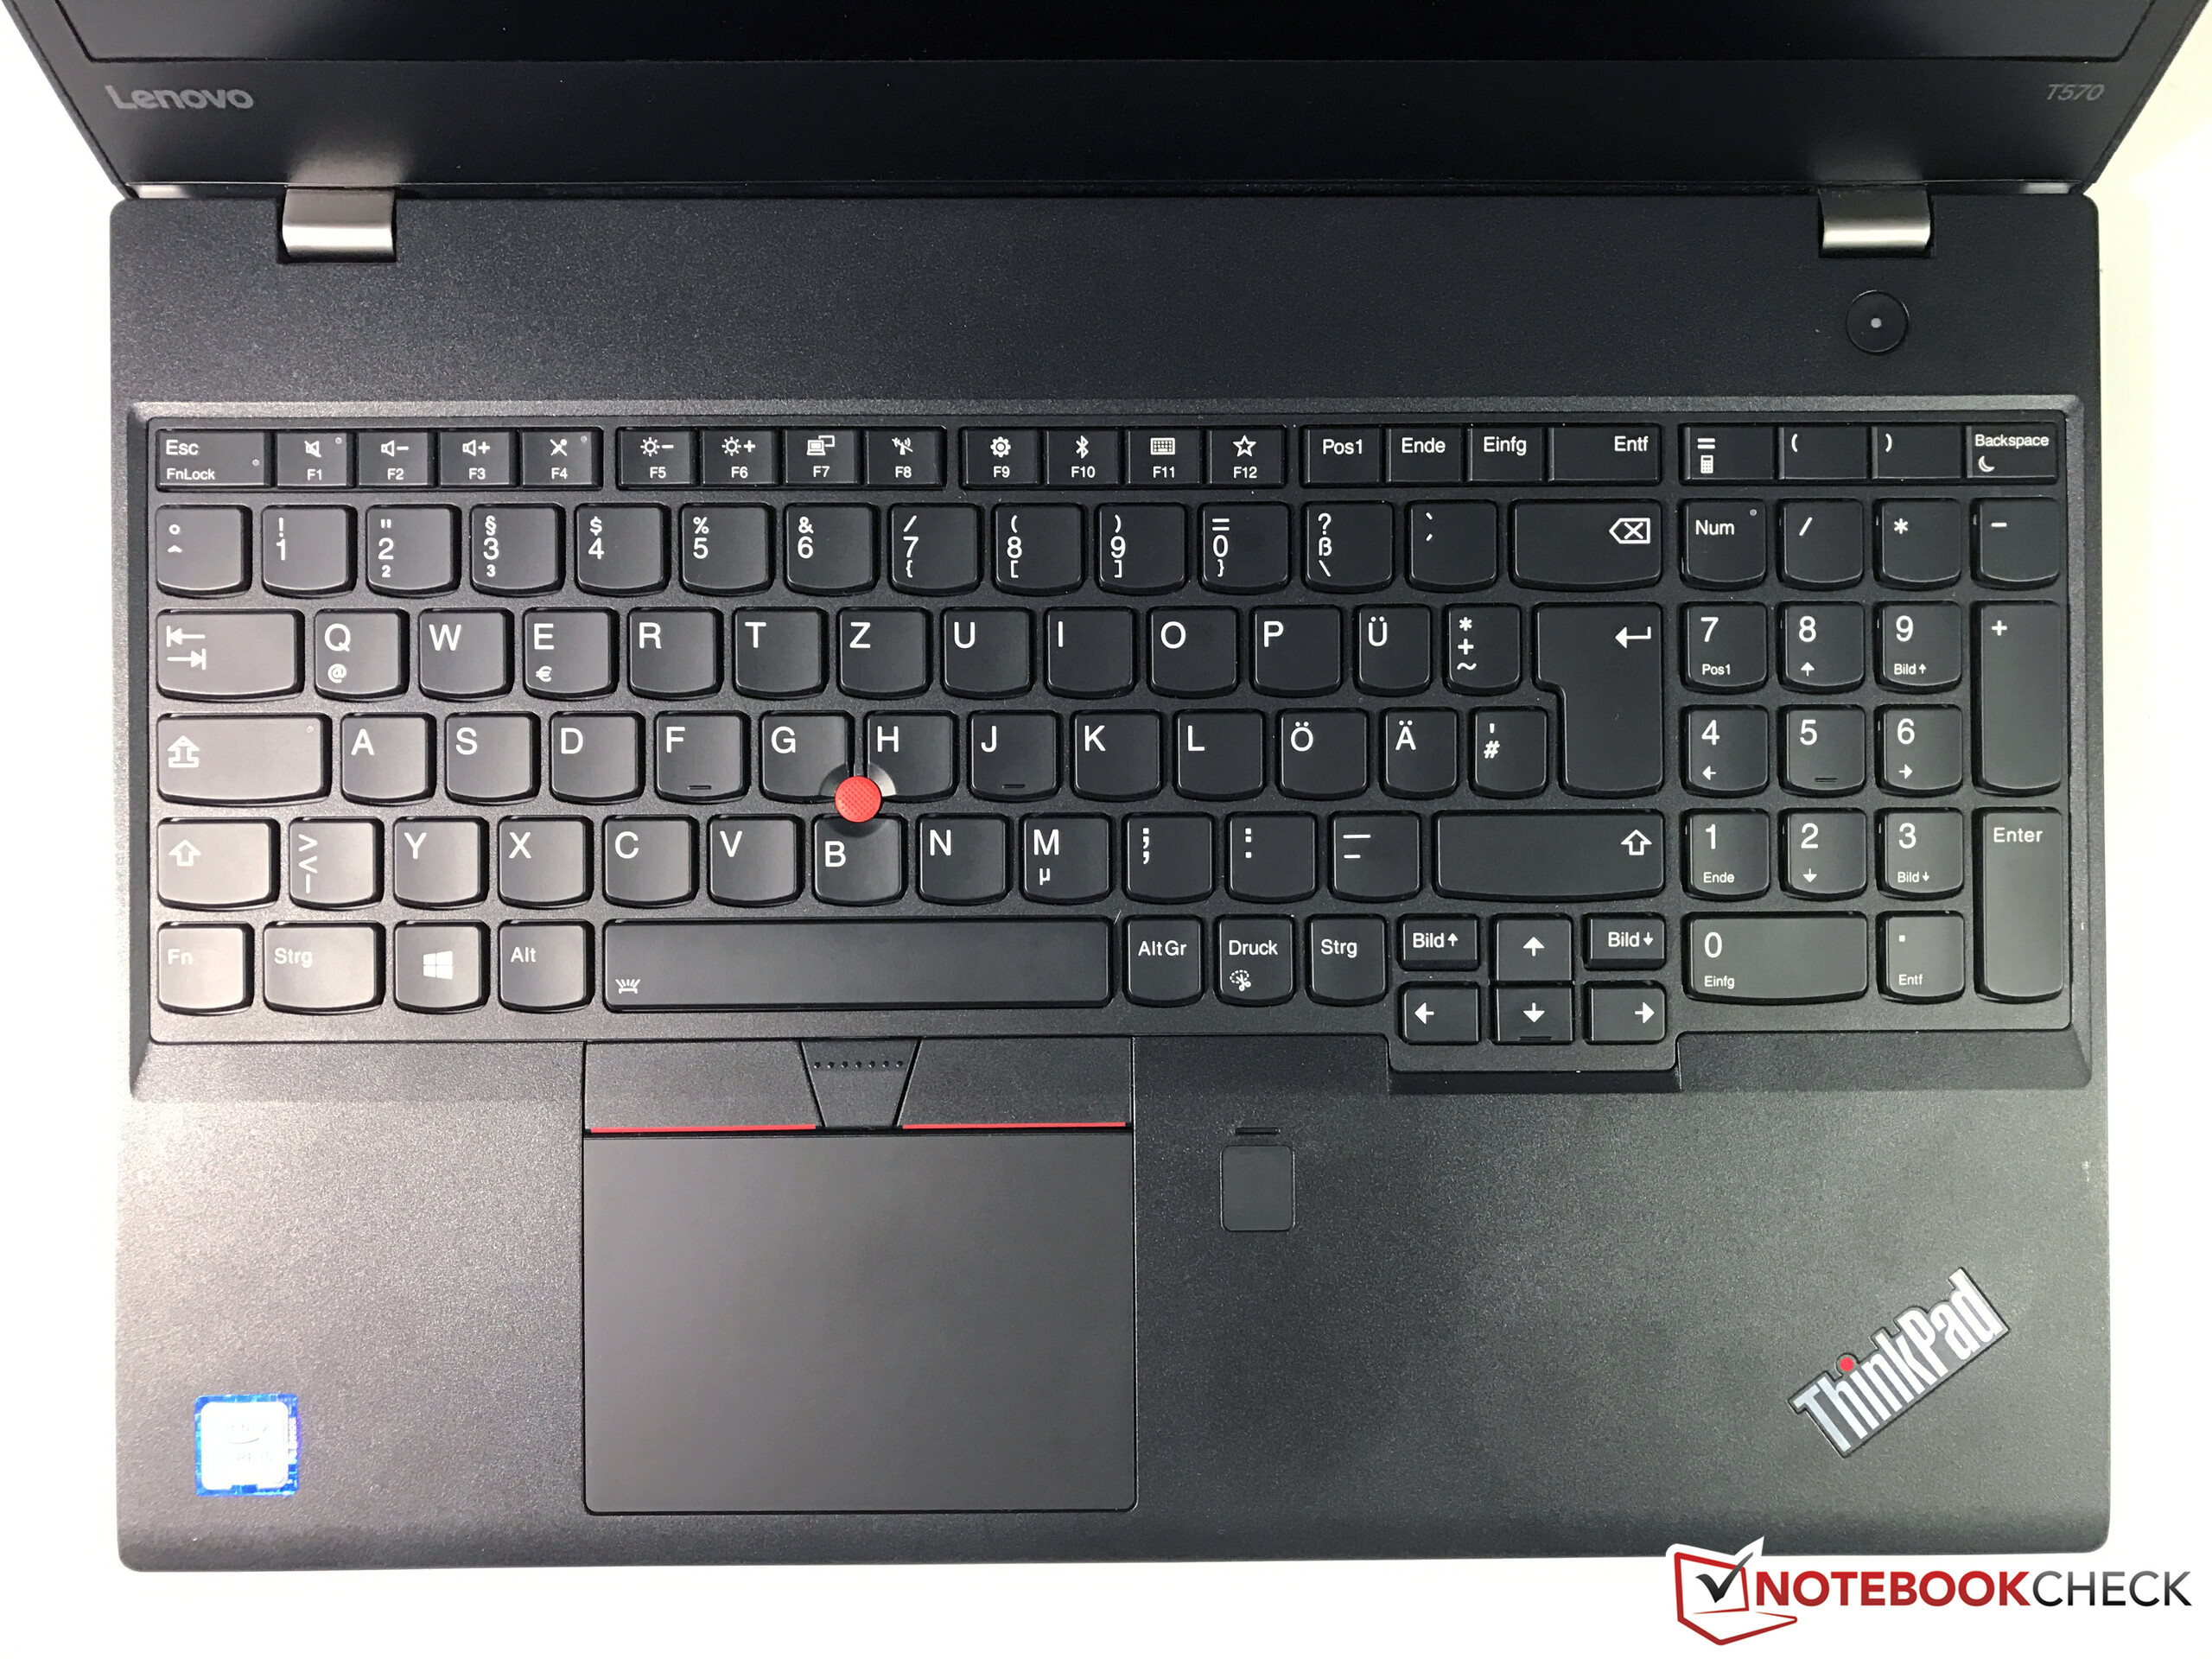
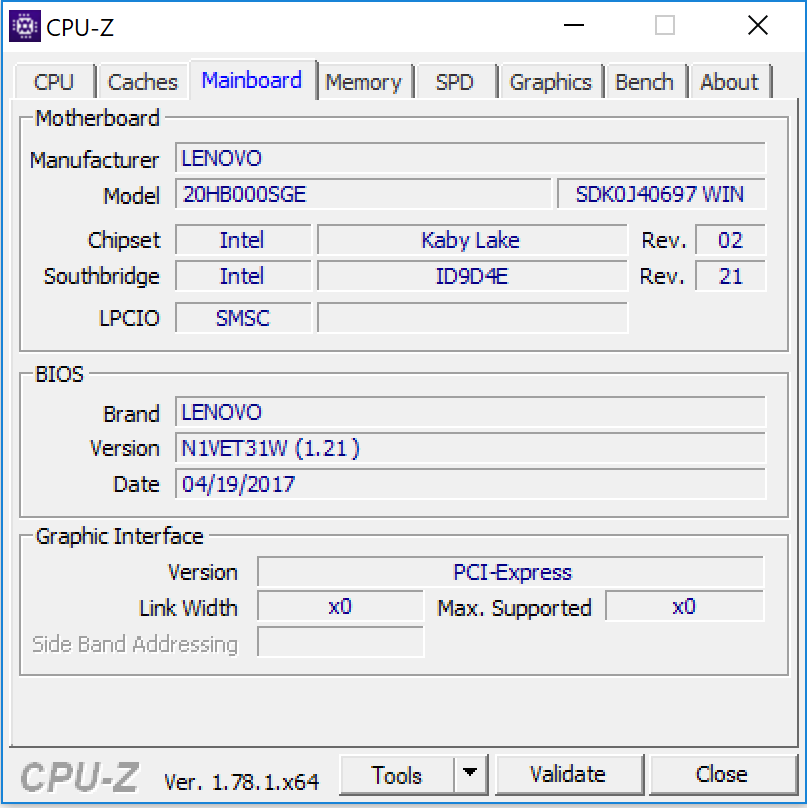
该ThinkPad是 Thinkpad T570的兄弟机型。因此,P51具有同样的固体外壳,良好的输入设备和T570那样的多种端口。还安装了红外摄像机。
不幸的是,P51还继承了T570的缺点。例如,以电池模式运行时候,处理器会进行节流。我们测量了大约1.8到2.4 GHz的主频。 因为节流而下降。此外,在我们的压力测试中,笔记本电脑的太烫了。我们在一个测量点记录了60.8摄氏度的温度—— 对于超低电压笔记本电脑来说太高了。噪音方面看起来好些,ThinkPad在属于正常水平。
出众的续航能力是该机的亮点。
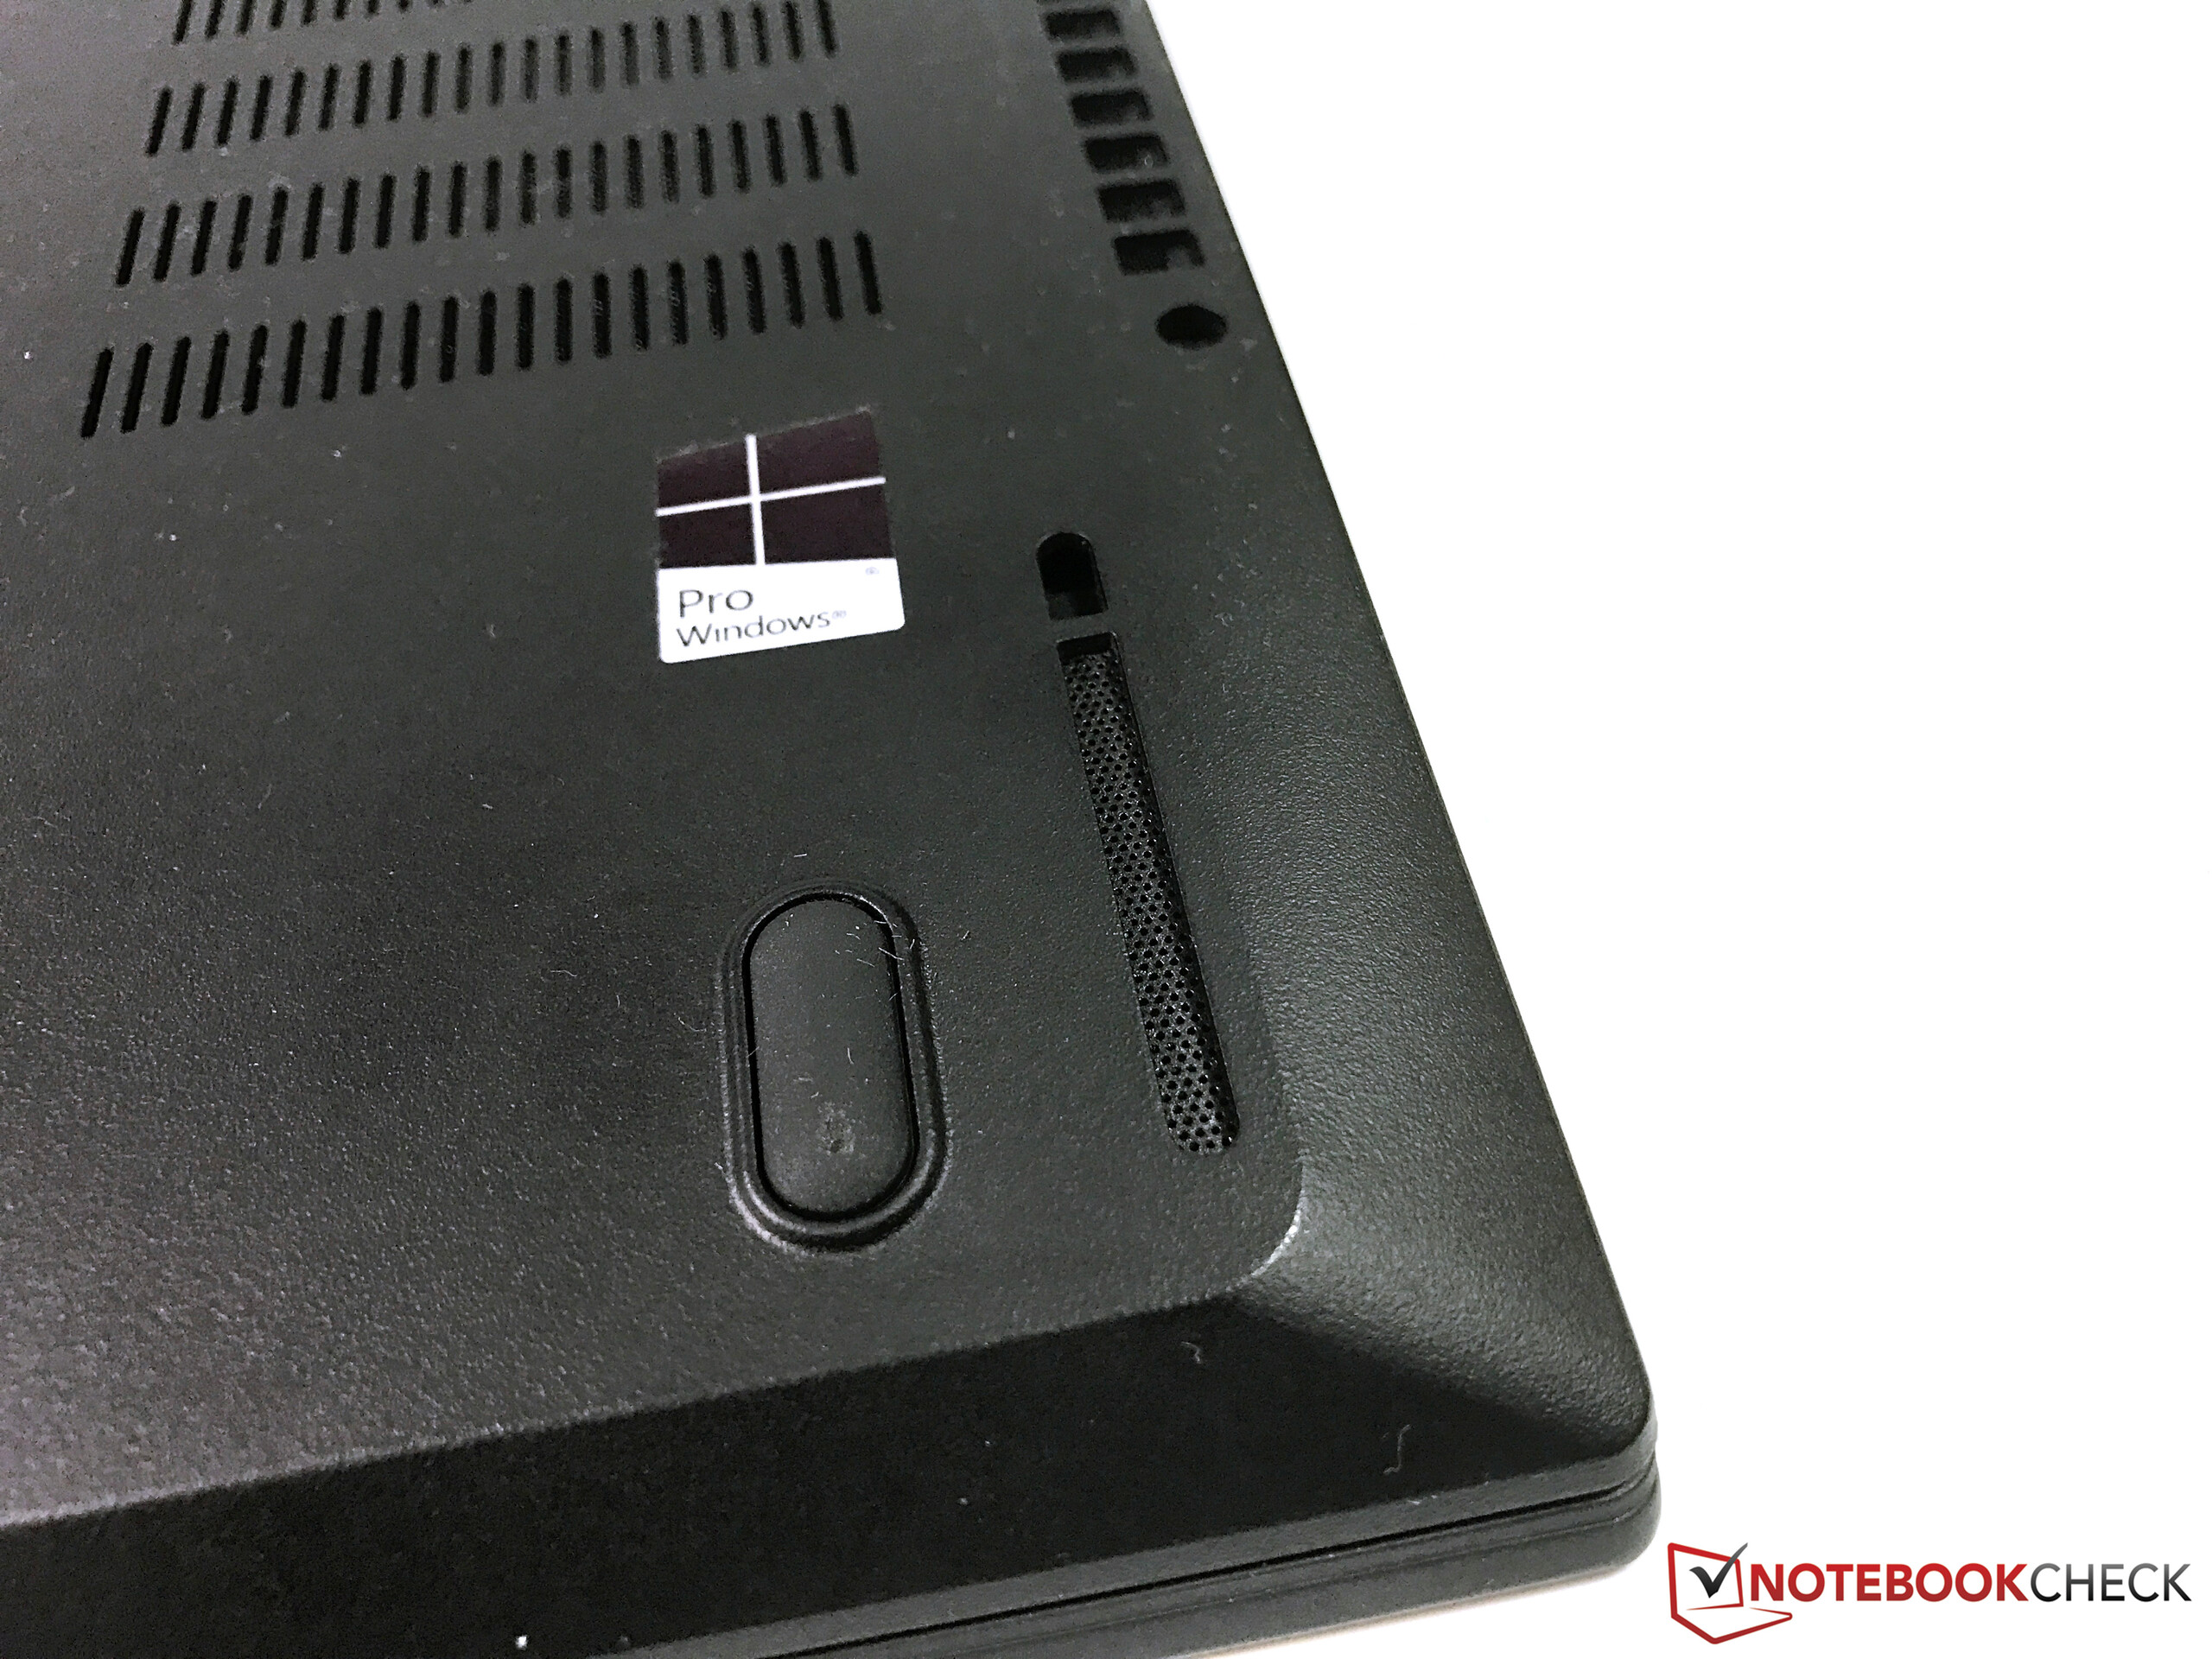
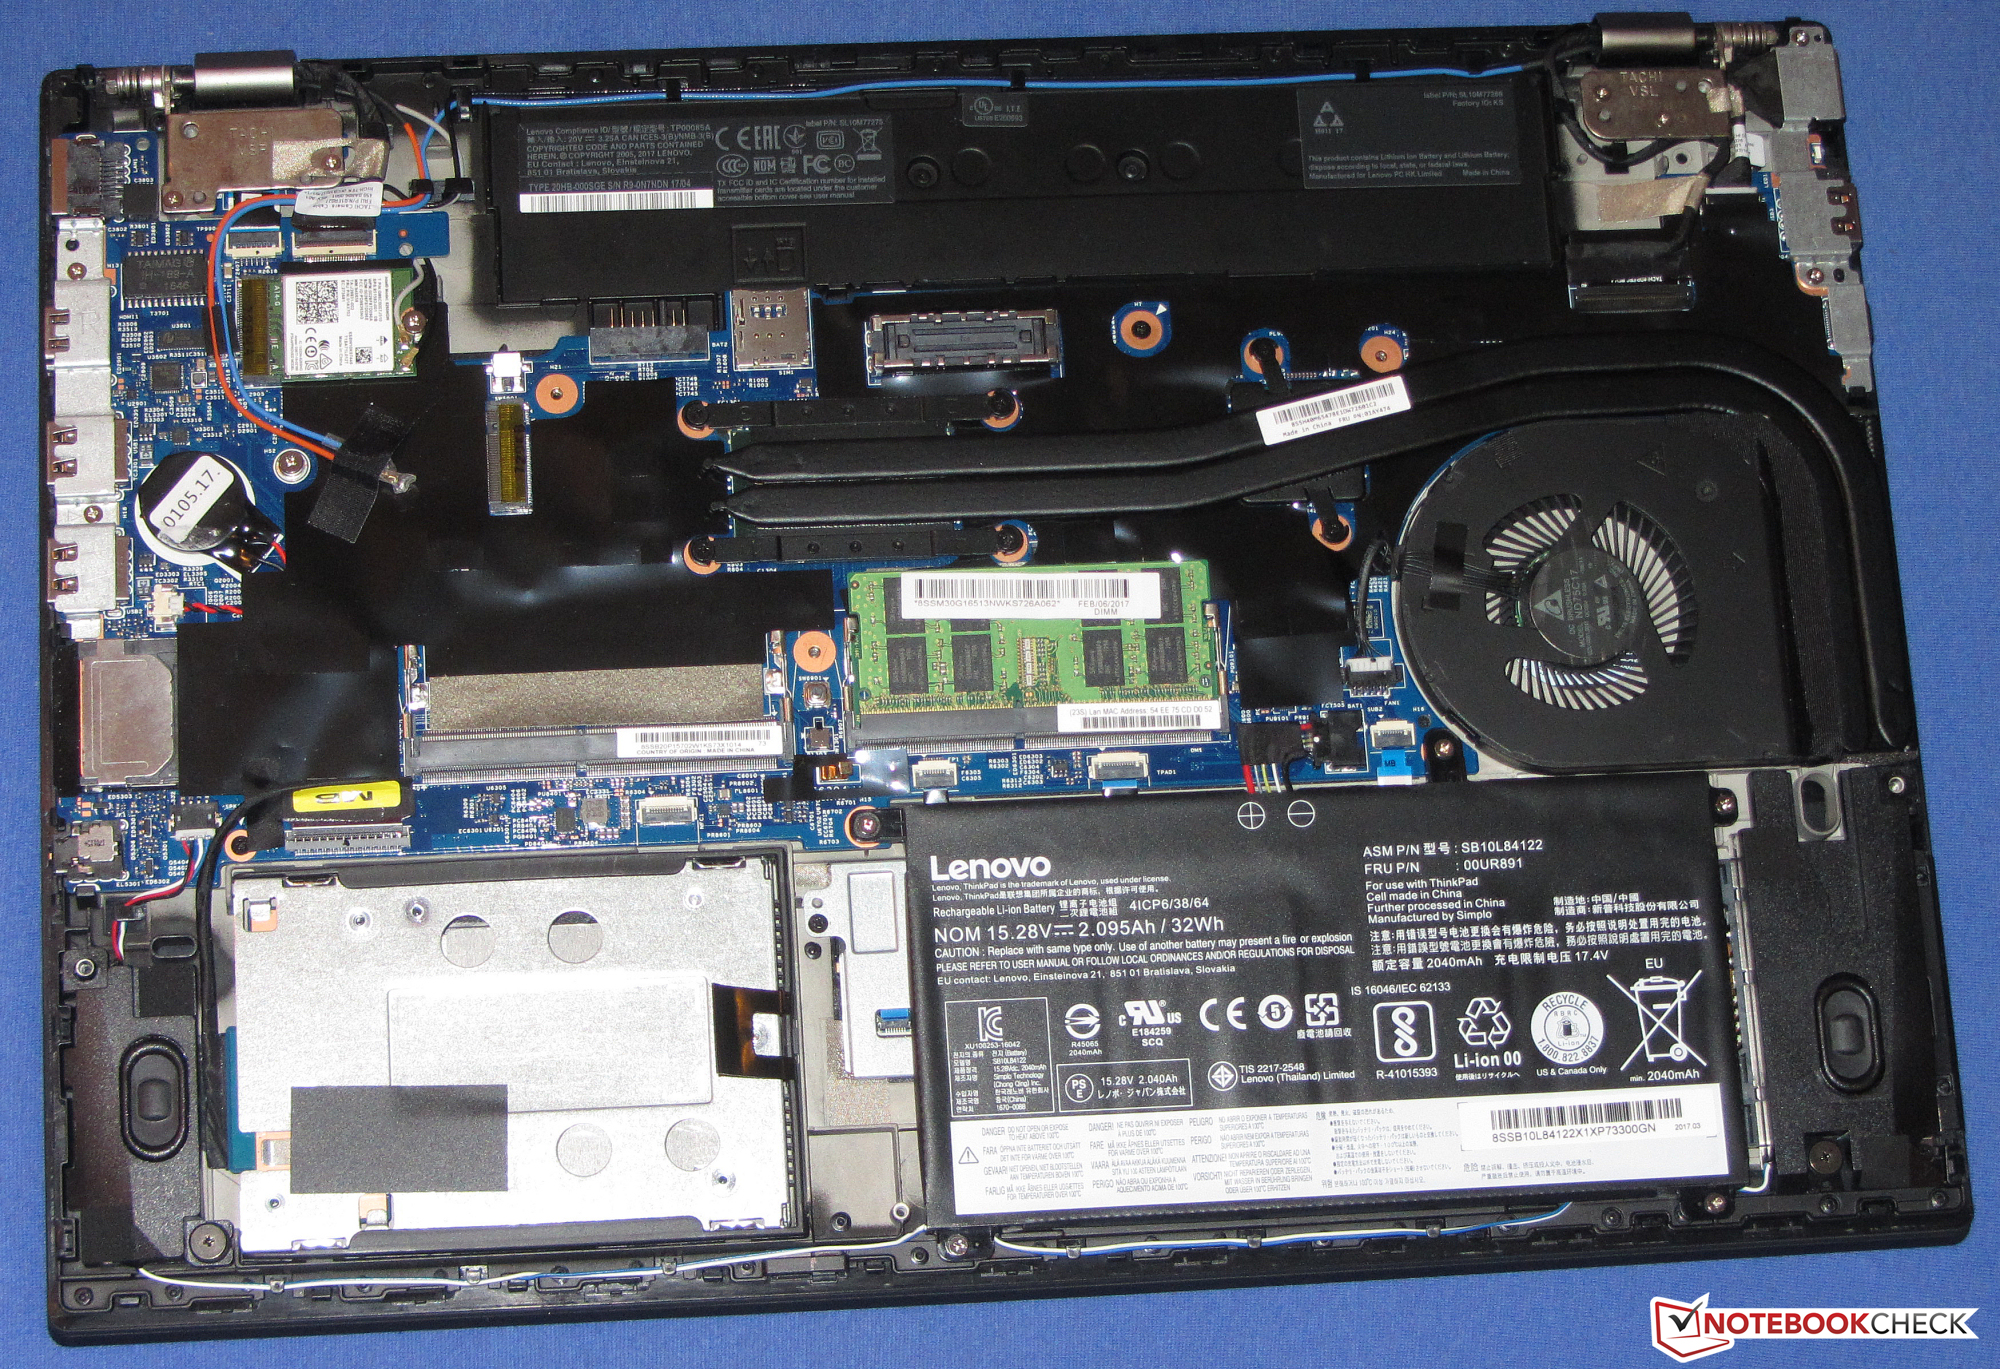
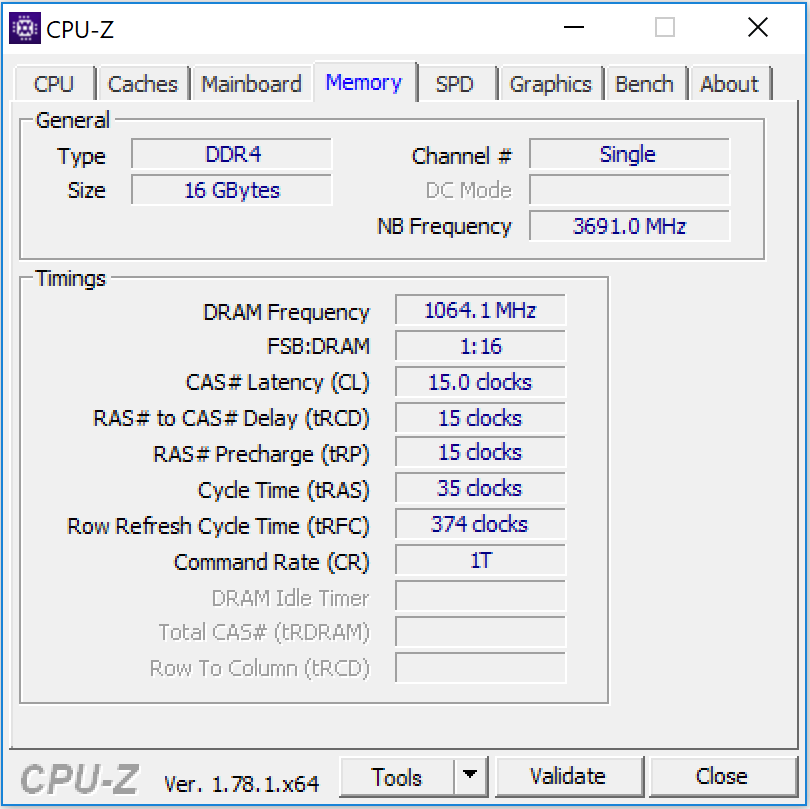
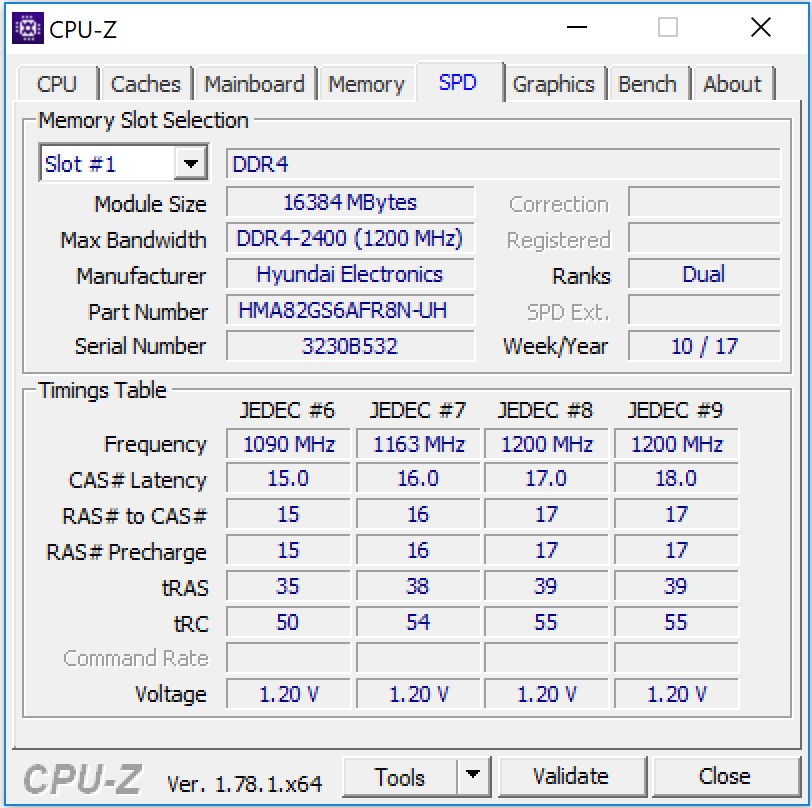
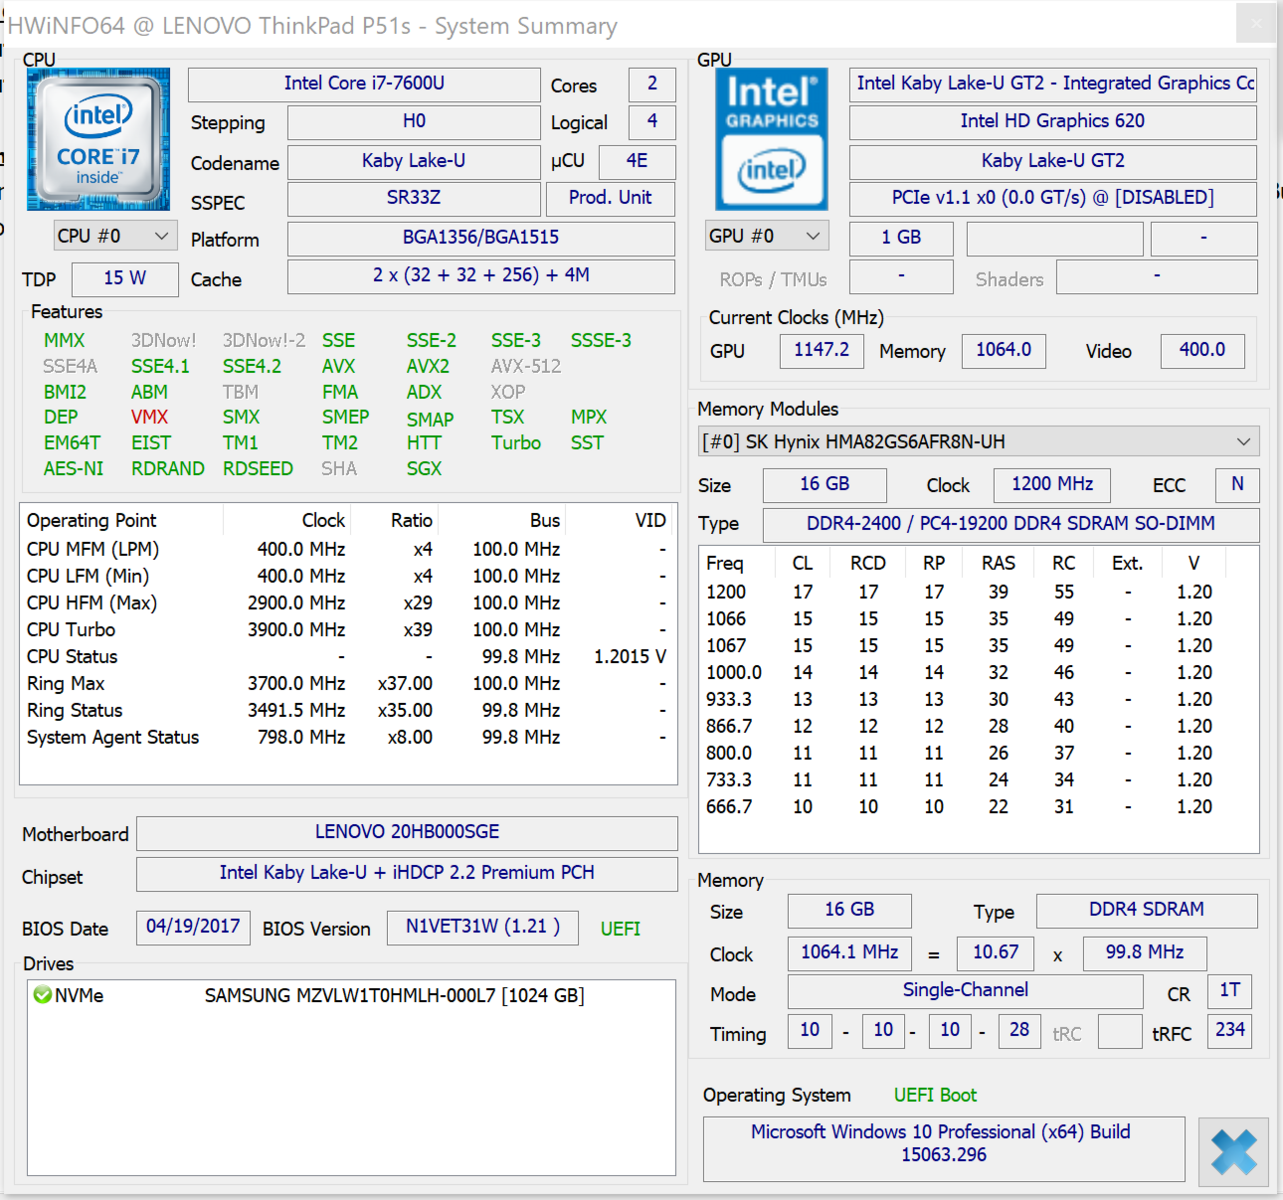
P51s 的电池容量为104 Wh(内部为32 Wh,外部为72 Wh)。这足以支持4K笔记本电脑长时间运行。快速NVMe 固态硬盘可确保系统运作。该机也可以配备2.5英寸硬盘,而不是M.2 NVMe 固态硬盘。LTE调制解调器也可以进行改装;我们的样机有一个空插槽和相应的天线。
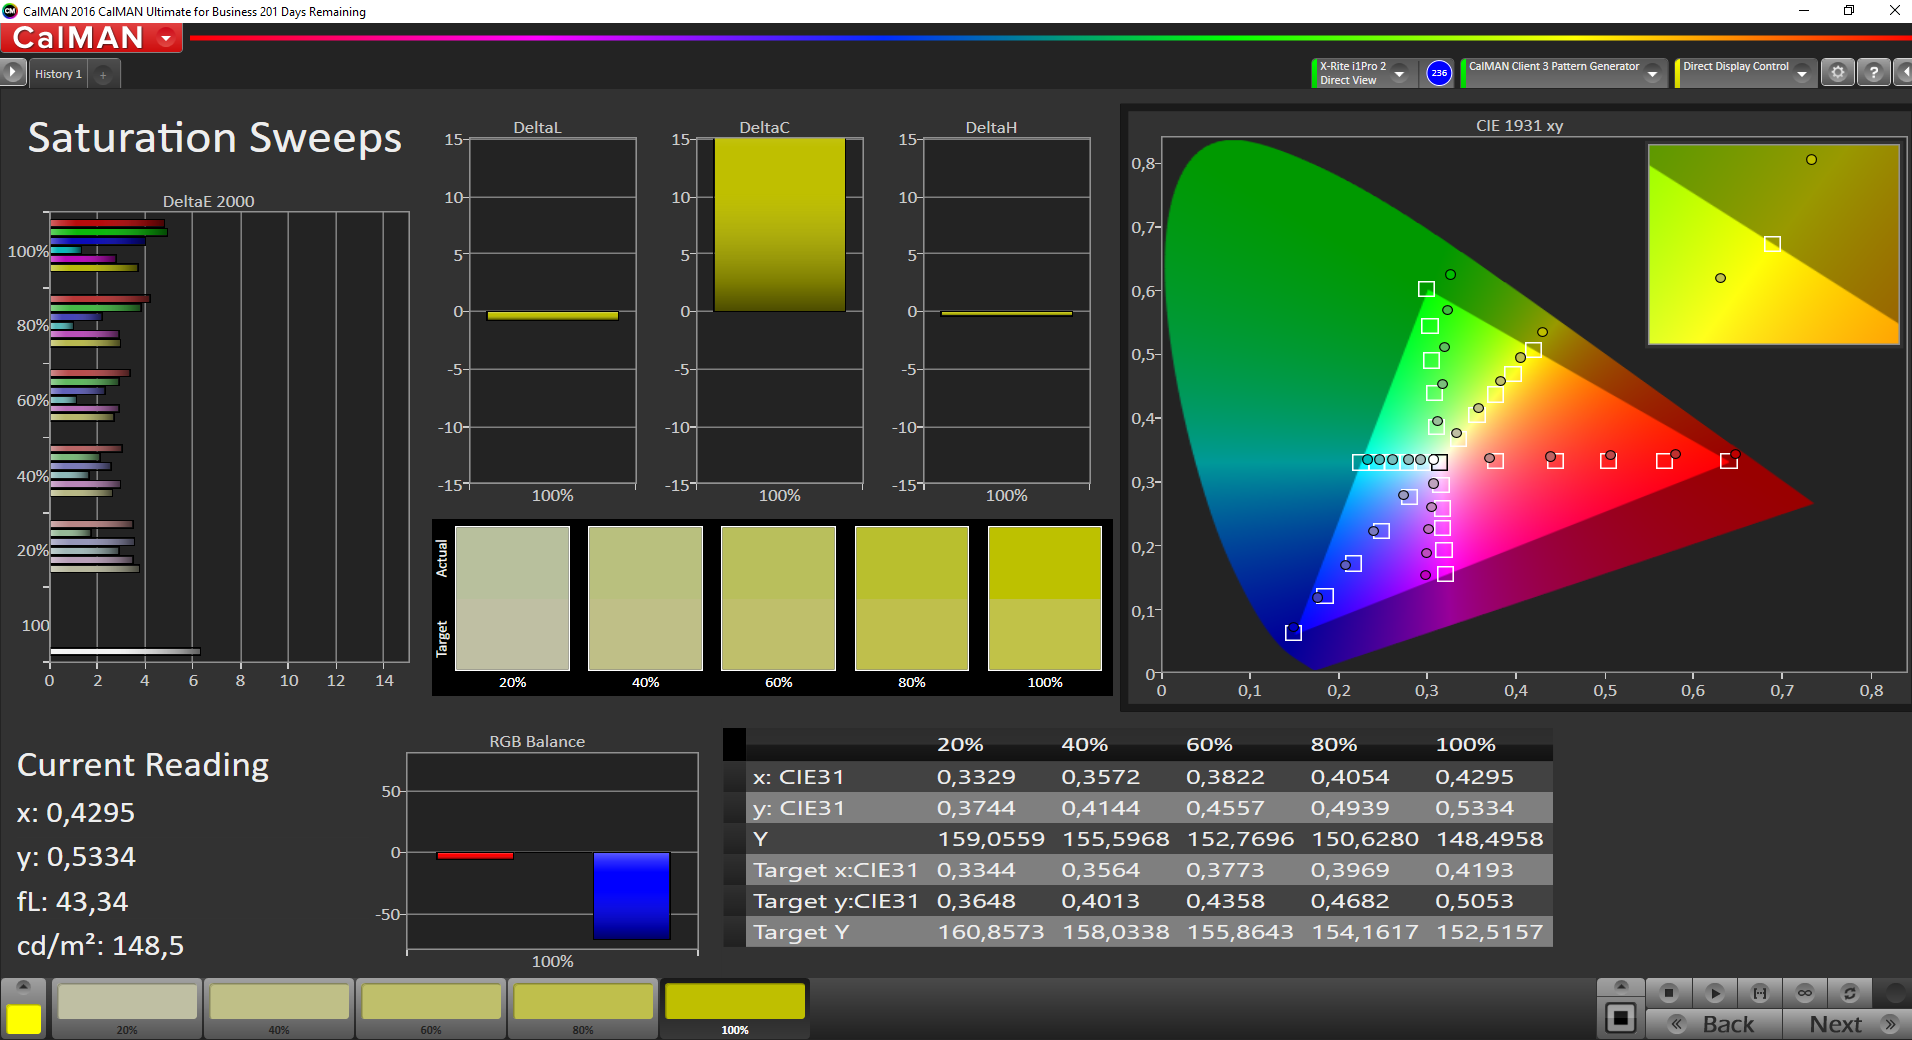
P51s的哑光4K屏幕是与ThinkPad T570一样。两台笔记本电脑都配有相同的面板。IPS屏幕具有稳定的视角和良好的对比度。亮度虽然可以更高,但是依然令人满意。不幸的是,当屏幕显示亮度为90%以下时存在闪烁。
注:本文是基于完整评测的缩减版本,阅读完整的英文评测,请点击这里。
Lenovo ThinkPad P51s 20HB000SGE
- 06/03/2017 v6 (old)
Sascha Mölck