惠普 Envy 13-ad006ng (i7-7500U, MX150) 笔记本电脑简短评测
| SD Card Reader | |
| average JPG Copy Test (av. of 3 runs) | |
| Dell XPS 13 i7-8550U | |
| HP Envy 13-ad006ng (Toshiba Exceria Pro SDXC 64 GB UHS-II) | |
| Lenovo IdeaPad 710S Plus-13IKB | |
| maximum AS SSD Seq Read Test (1GB) | |
| Dell XPS 13 i7-8550U | |
| Lenovo IdeaPad 710S Plus-13IKB | |
| HP Envy 13-ad006ng (Toshiba Exceria Pro SDXC 64 GB UHS-II) | |
| Networking | |
| iperf3 transmit AX12 | |
| HP Envy 13-ad006ng | |
| Lenovo IdeaPad 710S Plus-13IKB | |
| Dell XPS 13 i7-8550U | |
| iperf3 receive AX12 | |
| Dell XPS 13 i7-8550U | |
| Lenovo IdeaPad 710S Plus-13IKB | |
| HP Envy 13-ad006ng | |
| |||||||||||||||||||||||||
Brightness Distribution: 83 %
Center on Battery: 281 cd/m²
Contrast: 1222:1 (Black: 0.23 cd/m²)
ΔE ColorChecker Calman: 4.83 | ∀{0.5-29.43 Ø4.72}
ΔE Greyscale Calman: 6.63 | ∀{0.09-98 Ø4.97}
86% sRGB (Argyll 1.6.3 3D)
56% AdobeRGB 1998 (Argyll 1.6.3 3D)
63.1% AdobeRGB 1998 (Argyll 3D)
86.3% sRGB (Argyll 3D)
66.8% Display P3 (Argyll 3D)
Gamma: 1.85
CCT: 6794 K
| HP Envy 13-ad006ng BOE070E, , 1920x1080, 13.3" | HP Envy 13-ad065nr LG Philips LGD0576, , 1920x1080, 13.3" | Dell XPS 13 9360 FHD i5 Sharp SHP1449 LQ133M1, , 1920x1080, 13.3" | Lenovo IdeaPad 710S Plus-13IKB LG Philips LP133WF4-SPB1 (LGD04EF), , 1920x1080, 13.3" | Asus Zenbook UX310UA-FC347T iGP AU Optronics AUO272D, , 1920x1080, 13.3" | Xiaomi Mi Notebook Air 13.3 2016 Samsung LTN133HL09-M01, , 1920x1080, 13.3" | |
|---|---|---|---|---|---|---|
| Display | -3% | -21% | -3% | -8% | 6% | |
| Display P3 Coverage (%) | 66.8 | 65.5 -2% | 48.94 -27% | 65.3 -2% | 64.2 -4% | 66 -1% |
| sRGB Coverage (%) | 86.3 | 83.8 -3% | 73.3 -15% | 82.9 -4% | 65.3 -24% | 95.5 11% |
| AdobeRGB 1998 Coverage (%) | 63.1 | 61.3 -3% | 50.5 -20% | 60.6 -4% | 65.3 3% | 67.8 7% |
| Response Times | 36% | 14% | 8% | 24% | 7% | |
| Response Time Grey 50% / Grey 80% * (ms) | 48 ? | 28 ? 42% | 32.8 ? 32% | 45 ? 6% | 40 ? 17% | 49 ? -2% |
| Response Time Black / White * (ms) | 32 ? | 22.4 ? 30% | 33.2 ? -4% | 29 ? 9% | 22 ? 31% | 27 ? 16% |
| PWM Frequency (Hz) | 1000 ? | 10200 ? | 200 ? | 50 ? | ||
| Screen | -4% | 4% | 4% | 6% | 18% | |
| Brightness middle (cd/m²) | 281 | 290 3% | 351.2 25% | 343 22% | 358 27% | 347 23% |
| Brightness (cd/m²) | 264 | 270 2% | 325 23% | 306 16% | 347 31% | 334 27% |
| Brightness Distribution (%) | 83 | 78 -6% | 89 7% | 81 -2% | 87 5% | 80 -4% |
| Black Level * (cd/m²) | 0.23 | 0.32 -39% | 0.195 15% | 0.3 -30% | 0.26 -13% | 0.27 -17% |
| Contrast (:1) | 1222 | 906 -26% | 1801 47% | 1143 -6% | 1377 13% | 1285 5% |
| Colorchecker dE 2000 * | 4.83 | 4.8 1% | 7.4 -53% | 4.73 2% | 5.22 -8% | 3.29 32% |
| Colorchecker dE 2000 max. * | 8.89 | 11.2 -26% | 9.08 -2% | 9.05 -2% | 9.19 -3% | 4.69 47% |
| Greyscale dE 2000 * | 6.63 | 2.8 58% | 6.71 -1% | 3.29 50% | 6.69 -1% | 3.62 45% |
| Gamma | 1.85 119% | 2.19 100% | 2.74 80% | 2.36 93% | 2.35 94% | 2.23 99% |
| CCT | 6794 96% | 6382 102% | 7222 90% | 6437 101% | 6745 96% | 7307 89% |
| Color Space (Percent of AdobeRGB 1998) (%) | 56 | 54.9 -2% | 50.48 -10% | 54 -4% | 59 5% | 62 11% |
| Color Space (Percent of sRGB) (%) | 86 | 83.5 -3% | 73.31 -15% | 83 -3% | 91 6% | 95 10% |
| Total Average (Program / Settings) | 10% /
2% | -1% /
0% | 3% /
3% | 7% /
6% | 10% /
14% |
* ... smaller is better
Display Response Times
| ↔ Response Time Black to White | ||
|---|---|---|
| 32 ms ... rise ↗ and fall ↘ combined | ↗ 17 ms rise | 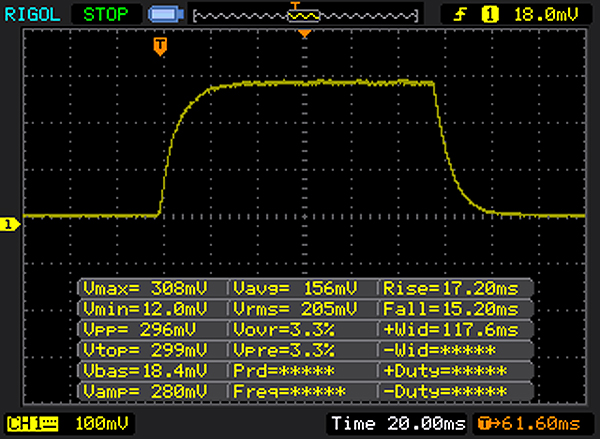 |
| ↘ 15 ms fall | ||
| The screen shows slow response rates in our tests and will be unsatisfactory for gamers. In comparison, all tested devices range from 0.1 (minimum) to 240 (maximum) ms. » 86 % of all devices are better. This means that the measured response time is worse than the average of all tested devices (19.8 ms). | ||
| ↔ Response Time 50% Grey to 80% Grey | ||
| 48 ms ... rise ↗ and fall ↘ combined | ↗ 23 ms rise | 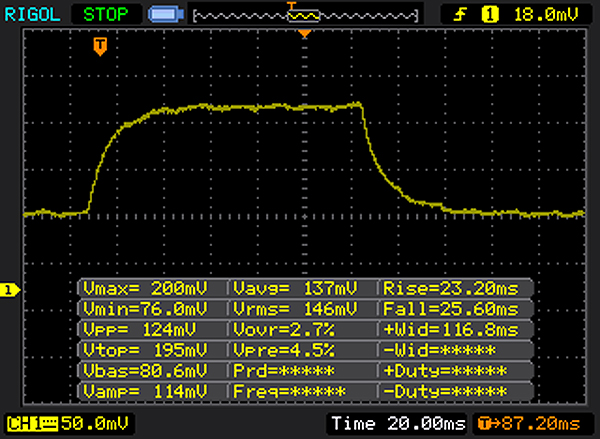 |
| ↘ 25 ms fall | ||
| The screen shows slow response rates in our tests and will be unsatisfactory for gamers. In comparison, all tested devices range from 0.165 (minimum) to 636 (maximum) ms. » 82 % of all devices are better. This means that the measured response time is worse than the average of all tested devices (31 ms). | ||
Screen Flickering / PWM (Pulse-Width Modulation)
| Screen flickering / PWM detected | 1000 Hz | ≤ 90 % brightness setting | 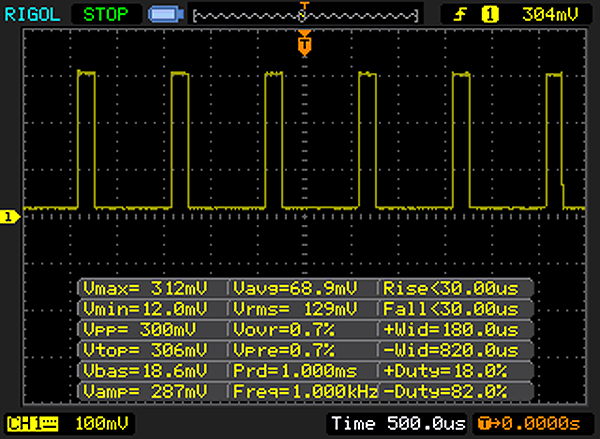 |
The display backlight flickers at 1000 Hz (worst case, e.g., utilizing PWM) Flickering detected at a brightness setting of 90 % and below. There should be no flickering or PWM above this brightness setting. The frequency of 1000 Hz is quite high, so most users sensitive to PWM should not notice any flickering. In comparison: 52 % of all tested devices do not use PWM to dim the display. If PWM was detected, an average of 7772 (minimum: 5 - maximum: 343500) Hz was measured. | |||
| Cinebench R15 | |
| CPU Single 64Bit | |
| Dell XPS 13 i7-8550U | |
| Asus Zenbook UX310UA-FC347T iGP | |
| HP Envy 13-ad006ng | |
| HP Envy 13-ad065nr | |
| Xiaomi Mi Notebook Air 13.3 2016 | |
| Lenovo IdeaPad 710S Plus-13IKB | |
| CPU Multi 64Bit | |
| Dell XPS 13 i7-8550U | |
| HP Envy 13-ad006ng | |
| Asus Zenbook UX310UA-FC347T iGP | |
| HP Envy 13-ad065nr | |
| Xiaomi Mi Notebook Air 13.3 2016 | |
| Lenovo IdeaPad 710S Plus-13IKB | |
| PCMark 8 | |
| Home Score Accelerated v2 | |
| Asus Zenbook UX310UA-FC347T iGP | |
| HP Envy 13-ad006ng | |
| HP Envy 13-ad065nr | |
| Dell XPS 13 i7-8550U | |
| Lenovo IdeaPad 710S Plus-13IKB | |
| Xiaomi Mi Notebook Air 13.3 2016 | |
| Work Score Accelerated v2 | |
| Asus Zenbook UX310UA-FC347T iGP | |
| HP Envy 13-ad006ng | |
| HP Envy 13-ad065nr | |
| Dell XPS 13 i7-8550U | |
| Xiaomi Mi Notebook Air 13.3 2016 | |
| Lenovo IdeaPad 710S Plus-13IKB | |
| PCMark 10 - Score | |
| HP Envy 13-ad006ng | |
| HP Envy 13-ad065nr | |
| PCMark 8 Home Score Accelerated v2 | 3773 points | |
| PCMark 8 Work Score Accelerated v2 | 4900 points | |
| PCMark 10 Score | 3282 points | |
Help | ||
| HP Envy 13-ad006ng Toshiba NVMe THNSN5256GPUK | Lenovo IdeaPad 710S Plus-13IKB Samsung PM961 NVMe MZVLW512HMJP | Xiaomi Mi Notebook Air 13.3 2016 Samsung PM951 NVMe MZVLV256 | Asus Zenbook UX310UA-FC347T iGP Micron SSD 1100 (MTFDDAV256TBN) | HP Envy 13-ad065nr SanDisk X400 SD8SN8U-128G-1006 | Dell XPS 13 i7-8550U Toshiba XG5 KXG50ZNV256G | |
|---|---|---|---|---|---|---|
| CrystalDiskMark 3.0 | 193% | 40% | 14% | |||
| Read Seq (MB/s) | 1019 | 1577 55% | 1209 19% | 489.4 -52% | ||
| Write Seq (MB/s) | 195.4 | 1472 653% | 314 61% | 431.6 121% | ||
| Read 512 (MB/s) | 735 | 1165 59% | 356.7 -51% | |||
| Write 512 (MB/s) | 172.3 | 1244 622% | 389.1 126% | |||
| Read 4k (MB/s) | 34.5 | 54.8 59% | 43.4 26% | 26.68 -23% | ||
| Write 4k (MB/s) | 109.4 | 121.5 11% | 153.4 40% | 88.7 -19% | ||
| Read 4k QD32 (MB/s) | 494.6 | 407.5 -18% | 487.6 -1% | 246.3 -50% | ||
| Write 4k QD32 (MB/s) | 161.3 | 321.4 99% | 312.2 94% | 251.5 56% | ||
| CrystalDiskMark 5.2 / 6 | -26% | 12% | ||||
| Write 4K (MB/s) | 155.7 | 57.5 -63% | 121.5 -22% | |||
| Read 4K (MB/s) | 26.5 | 29.34 11% | 24.92 -6% | |||
| Write Seq (MB/s) | 312.3 | 342.5 10% | 345 10% | |||
| Read Seq (MB/s) | 928 | 503 -46% | 1313 41% | |||
| Write 4K Q32T1 (MB/s) | 208.7 | 160.3 -23% | 346.1 66% | |||
| Read 4K Q32T1 (MB/s) | 478.8 | 285.7 -40% | 389.4 -19% | |||
| Write Seq Q32T1 (MB/s) | 305.1 | 330.8 8% | 334.7 10% | |||
| Read Seq Q32T1 (MB/s) | 1601 | 552 -66% | 1840 15% | |||
| Total Average (Program / Settings) | 193% /
193% | 40% /
40% | 14% /
14% | -26% /
-26% | 12% /
12% |

| 3DMark 11 - 1280x720 Performance GPU | |
| HP Envy 13-ad006ng | |
| Lenovo IdeaPad 710S Plus-13IKB | |
| Xiaomi Mi Notebook Air 13.3 2016 | |
| Dell XPS 13 i7-8550U | |
| Asus Zenbook UX310UA-FC347T iGP | |
| HP Envy 13-ad065nr | |
| 3DMark | |
| 1280x720 Cloud Gate Standard Graphics | |
| HP Envy 13-ad006ng | |
| Lenovo IdeaPad 710S Plus-13IKB | |
| Xiaomi Mi Notebook Air 13.3 2016 | |
| Dell XPS 13 i7-8550U | |
| Asus Zenbook UX310UA-FC347T iGP | |
| HP Envy 13-ad065nr | |
| 1920x1080 Fire Strike Graphics | |
| HP Envy 13-ad006ng | |
| Xiaomi Mi Notebook Air 13.3 2016 | |
| Lenovo IdeaPad 710S Plus-13IKB | |
| Dell XPS 13 i7-8550U | |
| Asus Zenbook UX310UA-FC347T iGP | |
| HP Envy 13-ad065nr | |
| 3DMark 11 Performance | 3588 points | |
| 3DMark Cloud Gate Standard Score | 9800 points | |
| 3DMark Fire Strike Score | 2528 points | |
Help | ||
| The Witcher 3 - 1366x768 Medium Graphics & Postprocessing | |
| Dell XPS 15 2017 9560 (7300HQ, Full-HD) | |
| HP Envy 13-ad006ng | |
| Lenovo IdeaPad 710S Plus-13IKB | |
| Asus Zenbook UX310UA-FC347T iGP | |
| BioShock Infinite - 1366x768 High Preset | |
| HP Envy 13-ad006ng | |
| Xiaomi Mi Notebook Air 13.3 2016 | |
| Dell XPS 13 i7-8550U | |
| Asus Zenbook UX310UA-FC347T iGP | |
| HP Envy 13-ad065nr | |
| low | med. | high | ultra | |
|---|---|---|---|---|
| BioShock Infinite (2013) | 173.9 | 94 | 79 | 29.72 |
| Company of Heroes 2 (2013) | 46.46 | 38.73 | 27.87 | 9.9 |
| The Witcher 3 (2015) | 45.13 | 27.64 | 14.47 | 9 |
| Rise of the Tomb Raider (2016) | 60 | 34.06 | 17 |
Noise level
| Idle |
| 30.5 / 30.5 / 30.5 dB(A) |
| Load |
| 37.3 / 34.2 dB(A) |
 | ||
30 dB silent 40 dB(A) audible 50 dB(A) loud |
||
min: | ||
(±) The maximum temperature on the upper side is 41.6 °C / 107 F, compared to the average of 35.9 °C / 97 F, ranging from 21.4 to 59 °C for the class Subnotebook.
(+) The bottom heats up to a maximum of 33.4 °C / 92 F, compared to the average of 39.2 °C / 103 F
(+) In idle usage, the average temperature for the upper side is 22.4 °C / 72 F, compared to the device average of 30.8 °C / 87 F.
(±) Playing The Witcher 3, the average temperature for the upper side is 35 °C / 95 F, compared to the device average of 30.8 °C / 87 F.
(+) The palmrests and touchpad are cooler than skin temperature with a maximum of 30.6 °C / 87.1 F and are therefore cool to the touch.
(-) The average temperature of the palmrest area of similar devices was 28.2 °C / 82.8 F (-2.4 °C / -4.3 F).
HP Envy 13-ad006ng audio analysis
(-) | not very loud speakers (70.1 dB)
Bass 100 - 315 Hz
(-) | nearly no bass - on average 27.6% lower than median
(±) | linearity of bass is average (9.8% delta to prev. frequency)
Mids 400 - 2000 Hz
(+) | balanced mids - only 2.2% away from median
(+) | mids are linear (6.1% delta to prev. frequency)
Highs 2 - 16 kHz
(+) | balanced highs - only 2% away from median
(+) | highs are linear (3.7% delta to prev. frequency)
Overall 100 - 16.000 Hz
(±) | linearity of overall sound is average (20.2% difference to median)
Compared to same class
» 64% of all tested devices in this class were better, 9% similar, 27% worse
» The best had a delta of 5%, average was 18%, worst was 53%
Compared to all devices tested
» 52% of all tested devices were better, 8% similar, 39% worse
» The best had a delta of 4%, average was 24%, worst was 134%
Dell XPS 13 i7-8550U audio analysis
(-) | not very loud speakers (66.8 dB)
Bass 100 - 315 Hz
(+) | good bass - only 4.5% away from median
(±) | linearity of bass is average (8.2% delta to prev. frequency)
Mids 400 - 2000 Hz
(±) | higher mids - on average 5% higher than median
(+) | mids are linear (5.8% delta to prev. frequency)
Highs 2 - 16 kHz
(+) | balanced highs - only 3% away from median
(±) | linearity of highs is average (14.5% delta to prev. frequency)
Overall 100 - 16.000 Hz
(±) | linearity of overall sound is average (17.2% difference to median)
Compared to same class
» 44% of all tested devices in this class were better, 9% similar, 47% worse
» The best had a delta of 5%, average was 18%, worst was 53%
Compared to all devices tested
» 32% of all tested devices were better, 8% similar, 60% worse
» The best had a delta of 4%, average was 24%, worst was 134%
| Off / Standby | |
| Idle | |
| Load |
|
Key:
min: | |
| HP Envy 13-ad006ng i7-7500U, GeForce MX150, Toshiba NVMe THNSN5256GPUK, IPS LED, 1920x1080, 13.3" | HP Envy 13-ad065nr i5-7200U, HD Graphics 620, SanDisk X400 SD8SN8U-128G-1006, IPS, 1920x1080, 13.3" | Lenovo IdeaPad 710S Plus-13IKB i7-7500U, GeForce 940MX, Samsung PM961 NVMe MZVLW512HMJP, IPS, 1920x1080, 13.3" | Asus Zenbook UX310UA-FC347T iGP i7-7500U, HD Graphics 620, Micron SSD 1100 (MTFDDAV256TBN), IPS, LED, 1920x1080, 13.3" | Dell XPS 13 i7-8550U i5-8550U, UHD Graphics 620, Toshiba XG5 KXG50ZNV256G, IGZO IPS, 3200x1800, 13.3" | Xiaomi Mi Notebook Air 13.3 2016 6200U, GeForce 940MX, Samsung PM951 NVMe MZVLV256, IPS, 1920x1080, 13.3" | |
|---|---|---|---|---|---|---|
| Power Consumption | 17% | -10% | 2% | 0% | -10% | |
| Idle Minimum * (Watt) | 2.8 | 2.8 -0% | 3.6 -29% | 3.5 -25% | 4.1 -46% | 4 -43% |
| Idle Average * (Watt) | 5.8 | 5.8 -0% | 7.4 -28% | 6.6 -14% | 5.8 -0% | 6.6 -14% |
| Idle Maximum * (Watt) | 7.7 | 6.4 17% | 8.7 -13% | 7.5 3% | 6 22% | 7.4 4% |
| Load Average * (Watt) | 48 | 31.3 35% | 43 10% | 34.7 28% | 42.5 11% | 41.7 13% |
| Witcher 3 ultra * (Watt) | 35 | |||||
| Load Maximum * (Watt) | 48 | 31.7 34% | 42 12% | 39.6 17% | 41.4 14% | 52.4 -9% |
* ... smaller is better
| HP Envy 13-ad006ng i7-7500U, GeForce MX150, 51 Wh | HP Envy 13-ad065nr i5-7200U, HD Graphics 620, 53.6 Wh | Lenovo IdeaPad 710S Plus-13IKB i7-7500U, GeForce 940MX, 46 Wh | Asus Zenbook UX310UA-FC347T iGP i7-7500U, HD Graphics 620, 48 Wh | Dell XPS 13 i7-8550U i5-8550U, UHD Graphics 620, 60 Wh | Xiaomi Mi Notebook Air 13.3 2016 6200U, GeForce 940MX, 40 Wh | |
|---|---|---|---|---|---|---|
| Battery runtime | 21% | -36% | -1% | 17% | -22% | |
| Reader / Idle (h) | 20 | 24.8 24% | 7.8 -61% | 16.1 -19% | 18.5 -7% | 12 -40% |
| H.264 (h) | 7.9 | 6.9 -13% | 7.1 -10% | |||
| WiFi v1.3 (h) | 7.1 | 9.5 34% | 5.6 -21% | 9.6 35% | 9.8 38% | 6.5 -8% |
| Load (h) | 2 | 2.1 5% | 1.5 -25% | 1.9 -5% | 2.4 20% | 1.4 -30% |
Pros
Cons
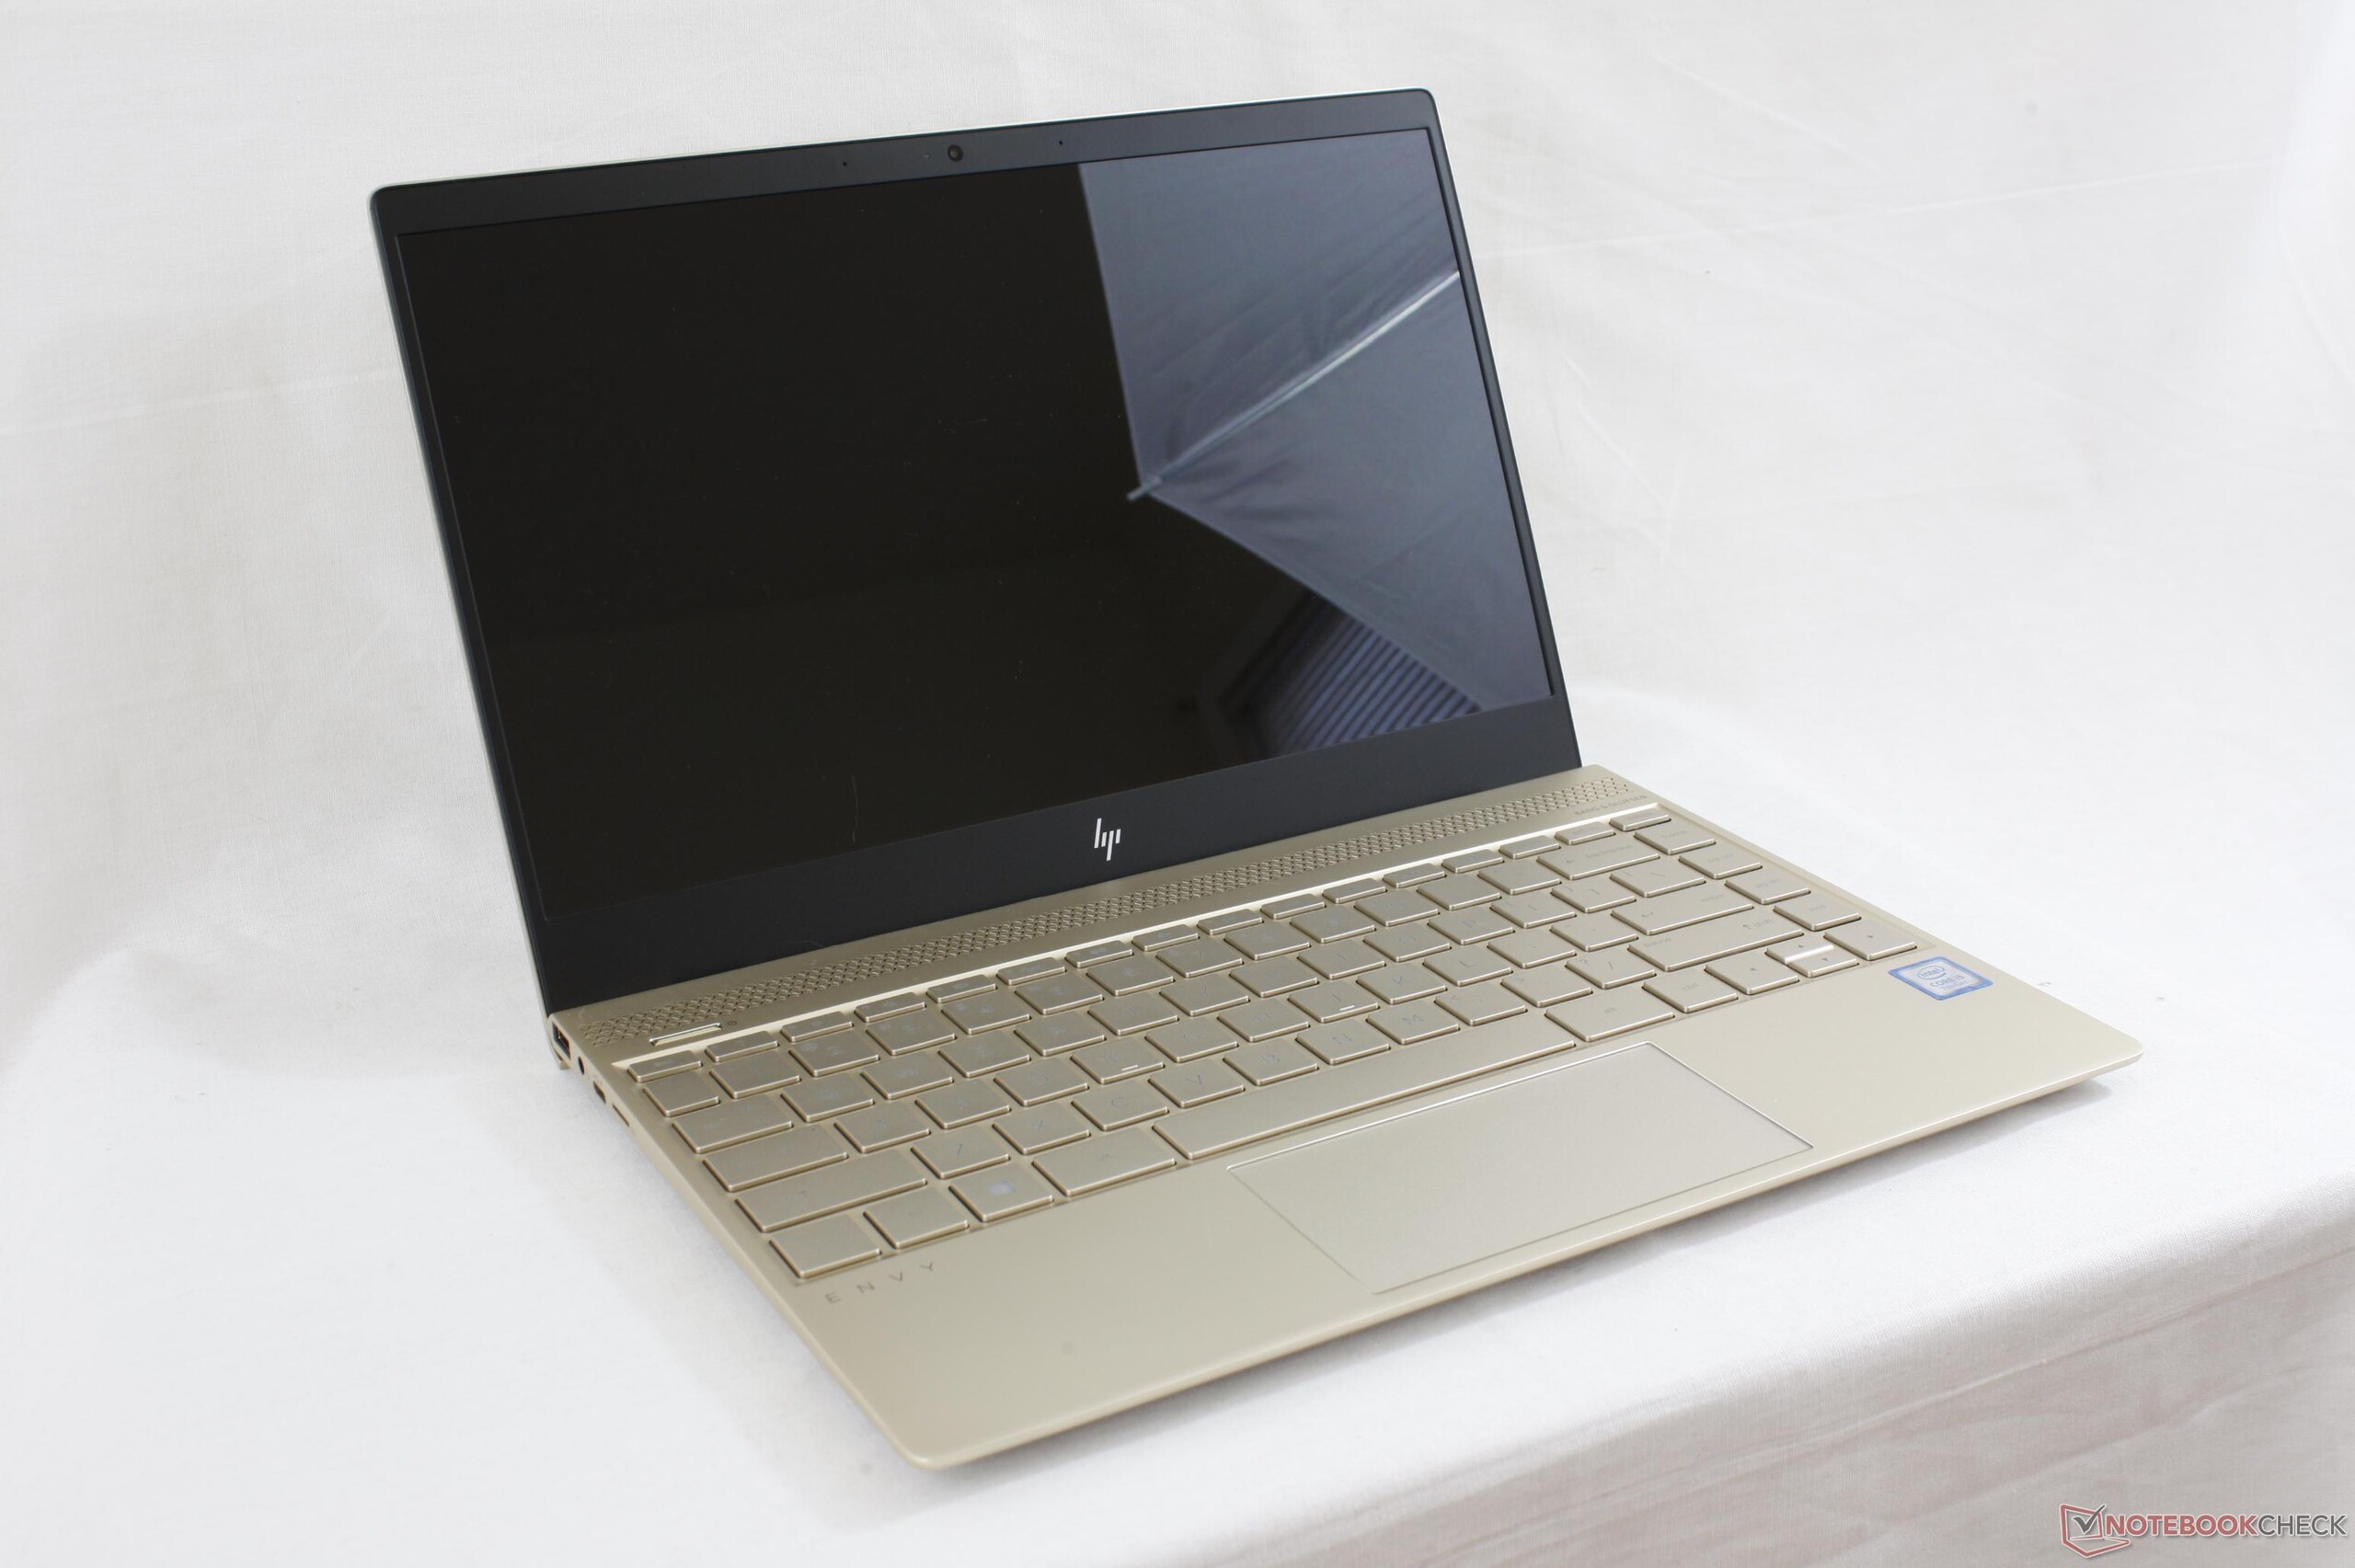
惠普 Envy 13的设计目标是:能和惠普 XPS 13 匹敌,且具有吸引力的13.3英寸主流超极本——价格也是。但从这一点上来说,Envy略显失色。
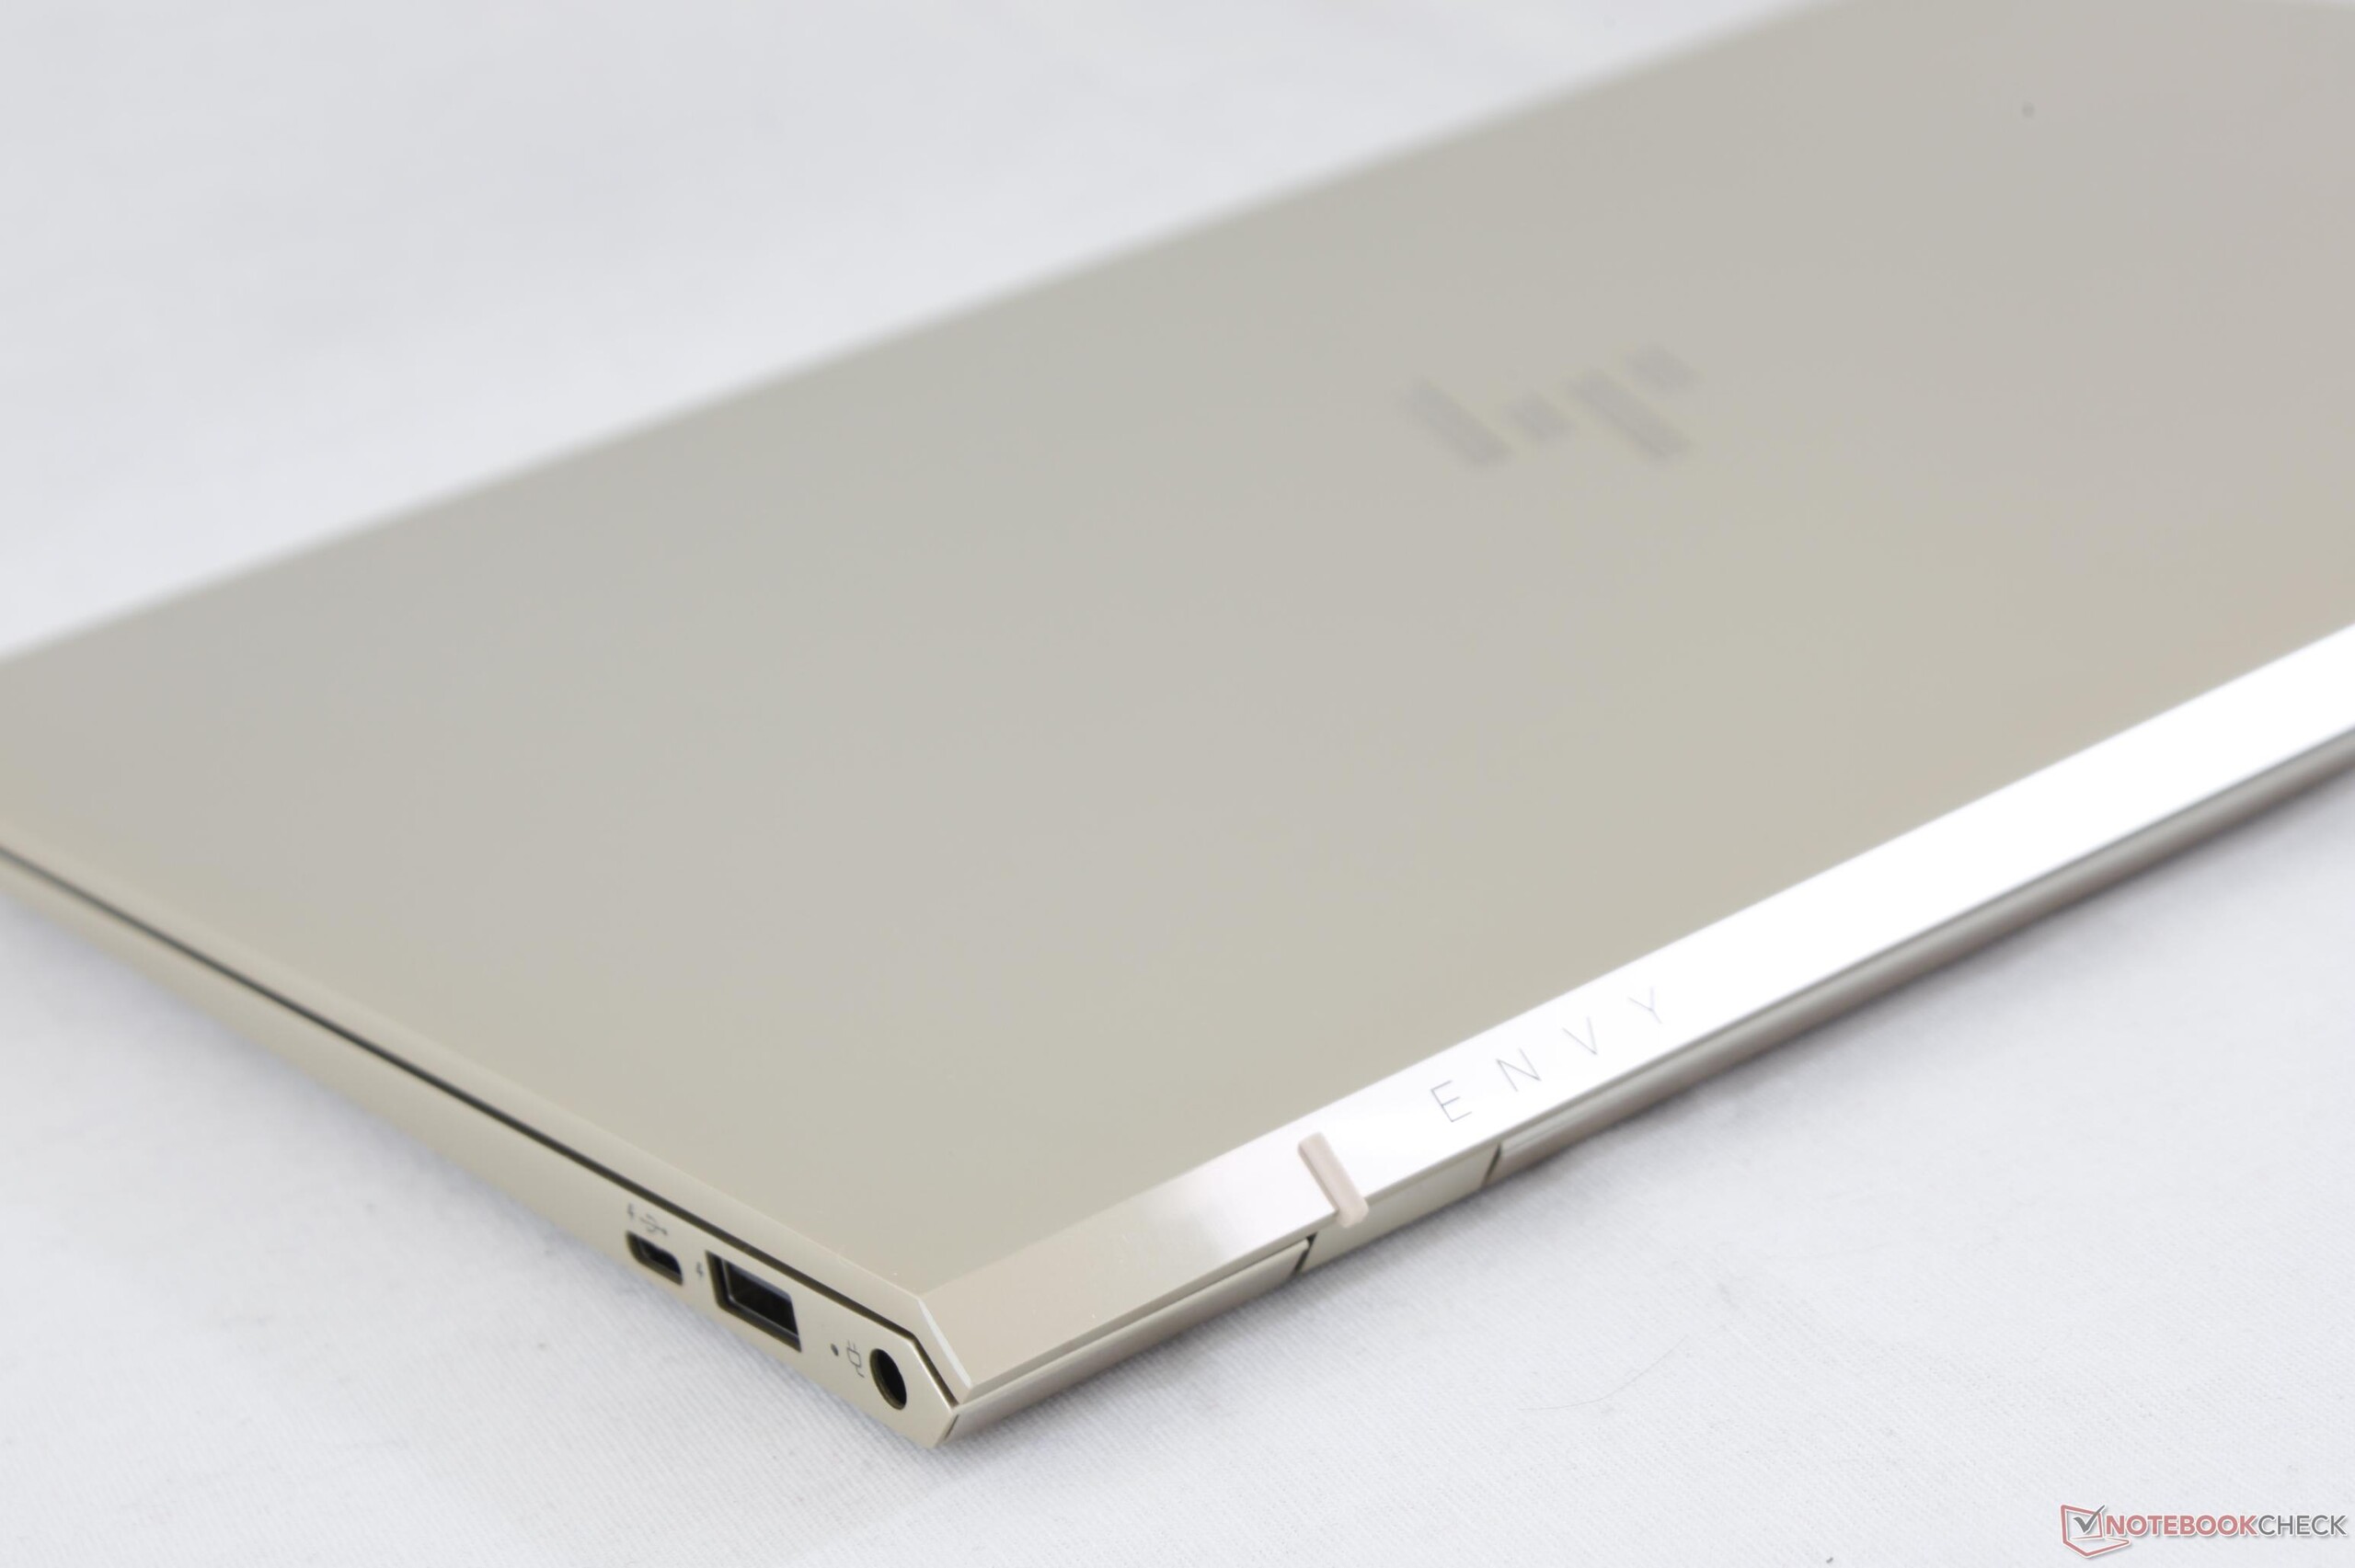
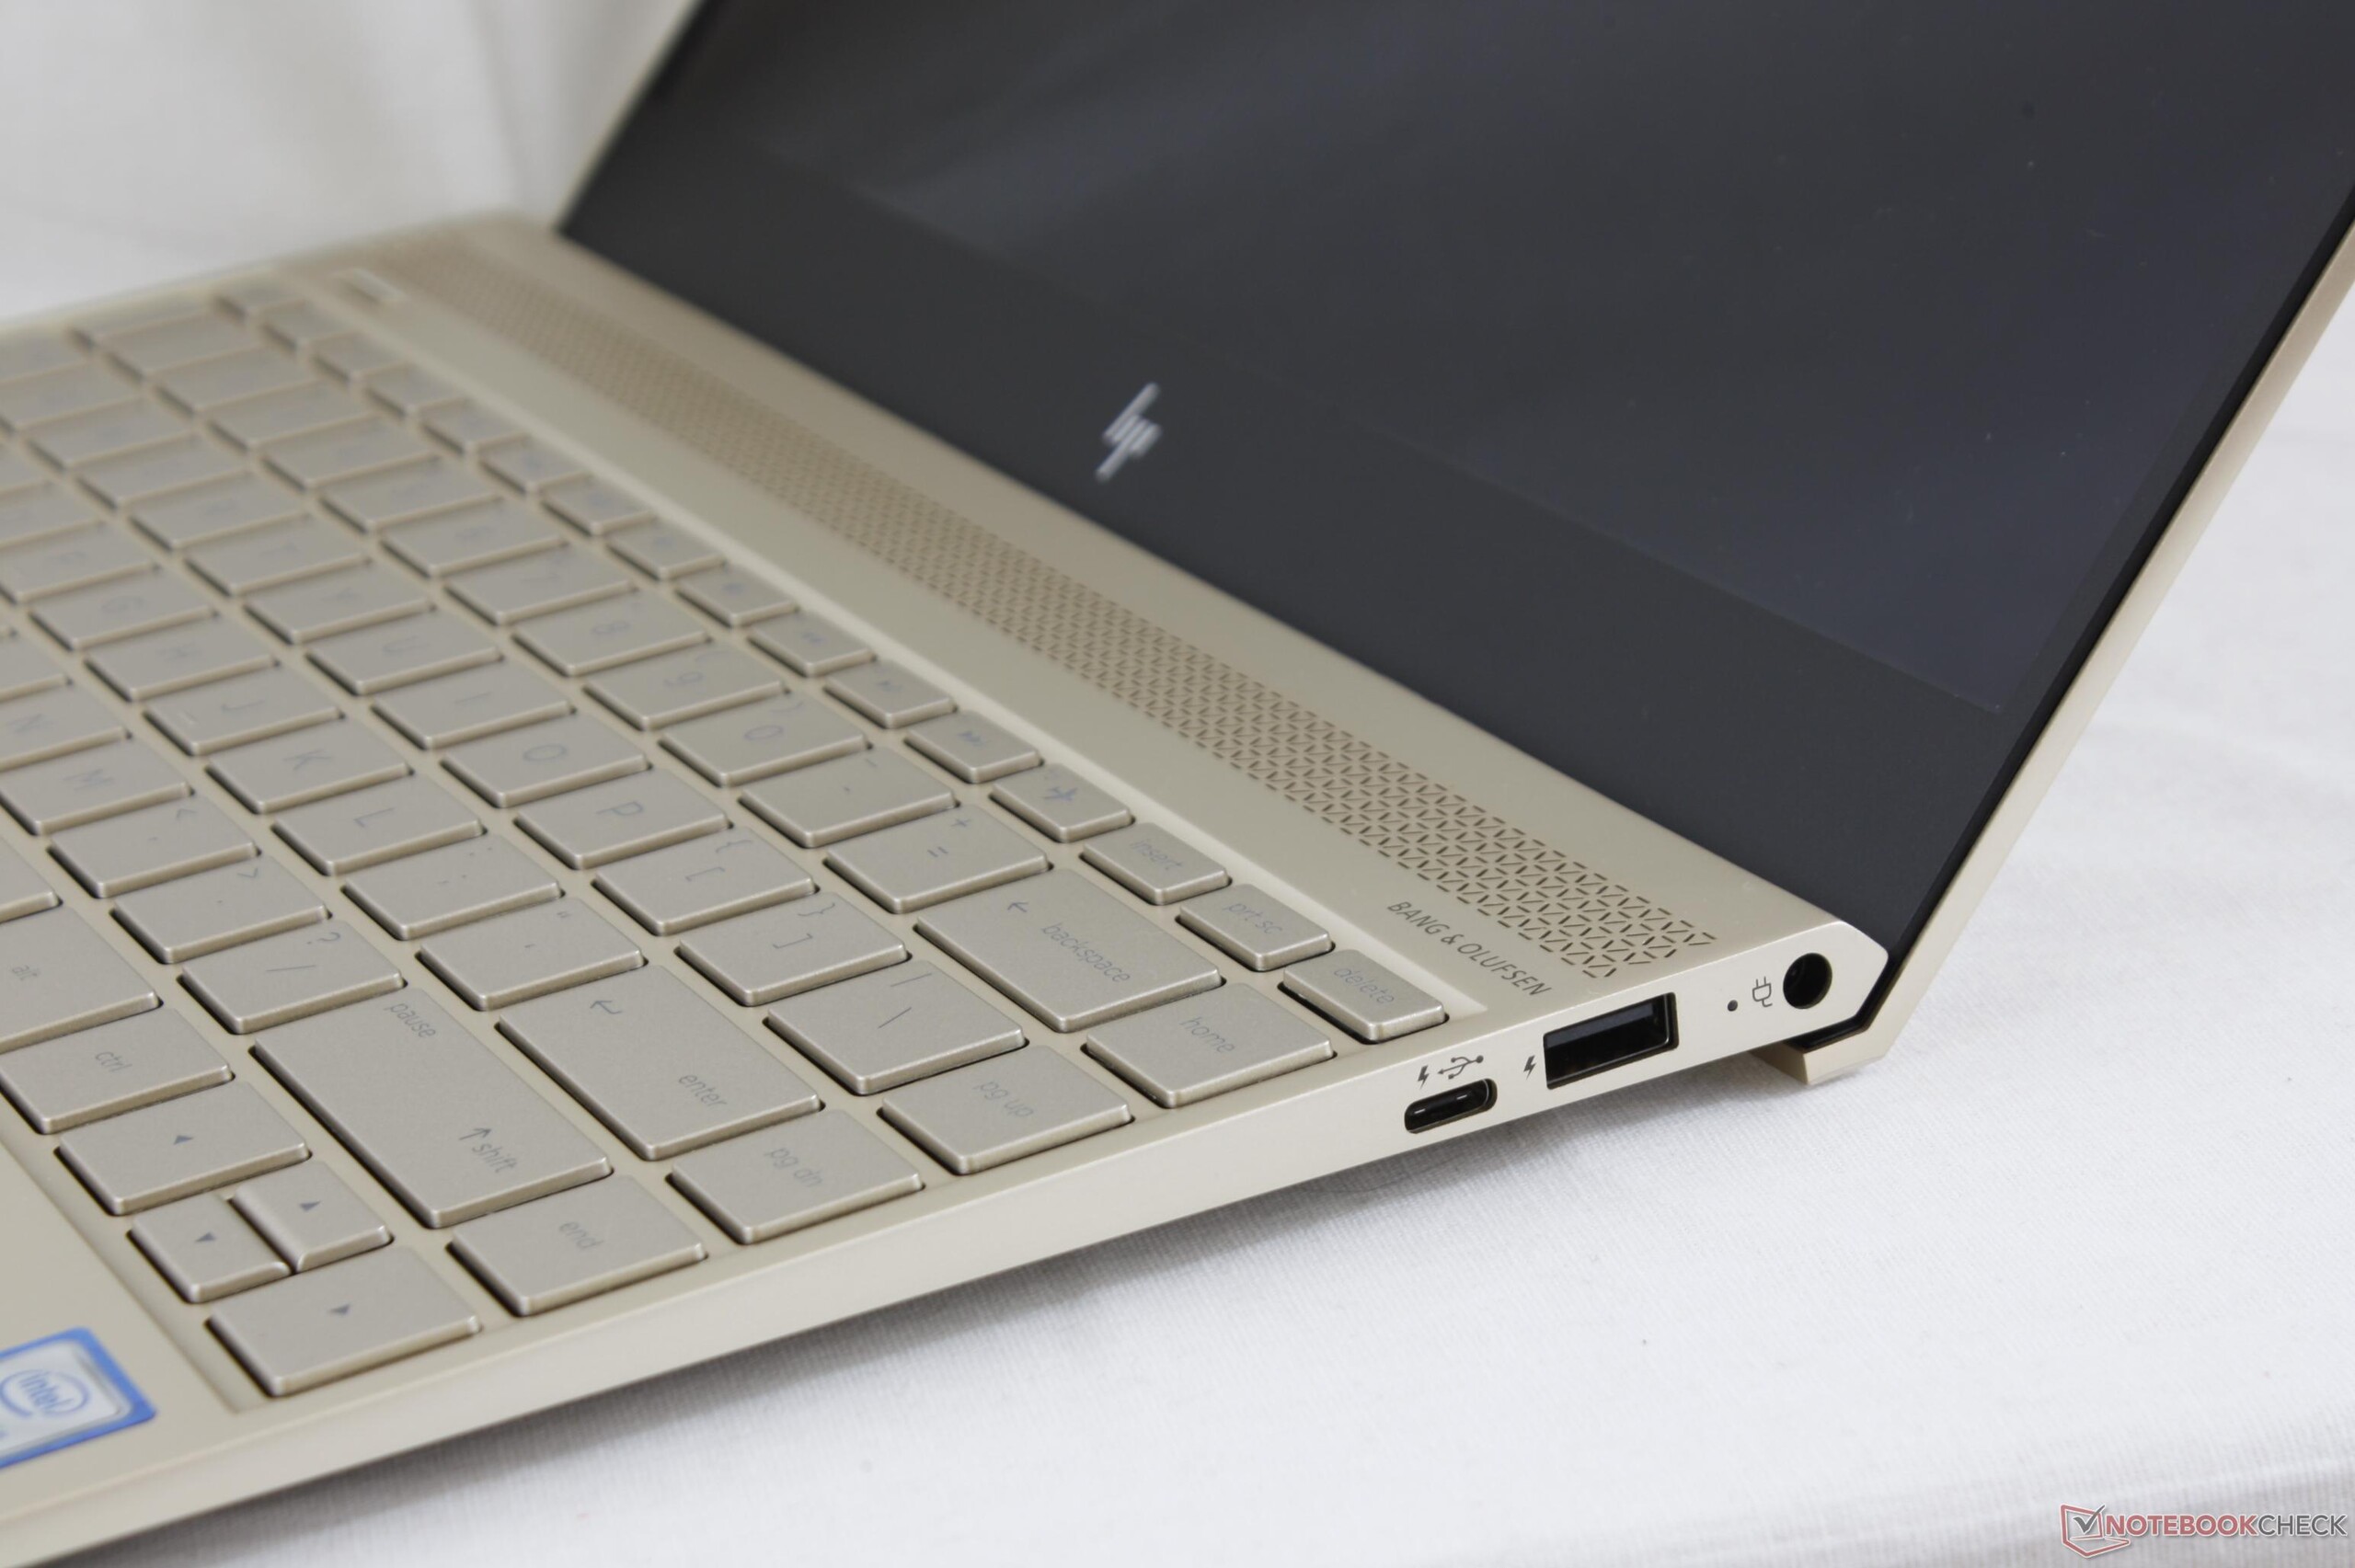
有一点是 XPS 13 所没有的:专用显卡。这是惠普的明显优点。毕竟 MX150 会是用户购买该机的一大理由。Envy在很多方面都做的很好: 产品质量很好,得益于窄边框设计,外观紧凑而具有吸引力。冷却系统非常强劲,特别是在达到一定的发热和噪声水平时候。显示屏有它的缺点,但是,客观上,它看起来非常棒,显示锐利,对比清晰。
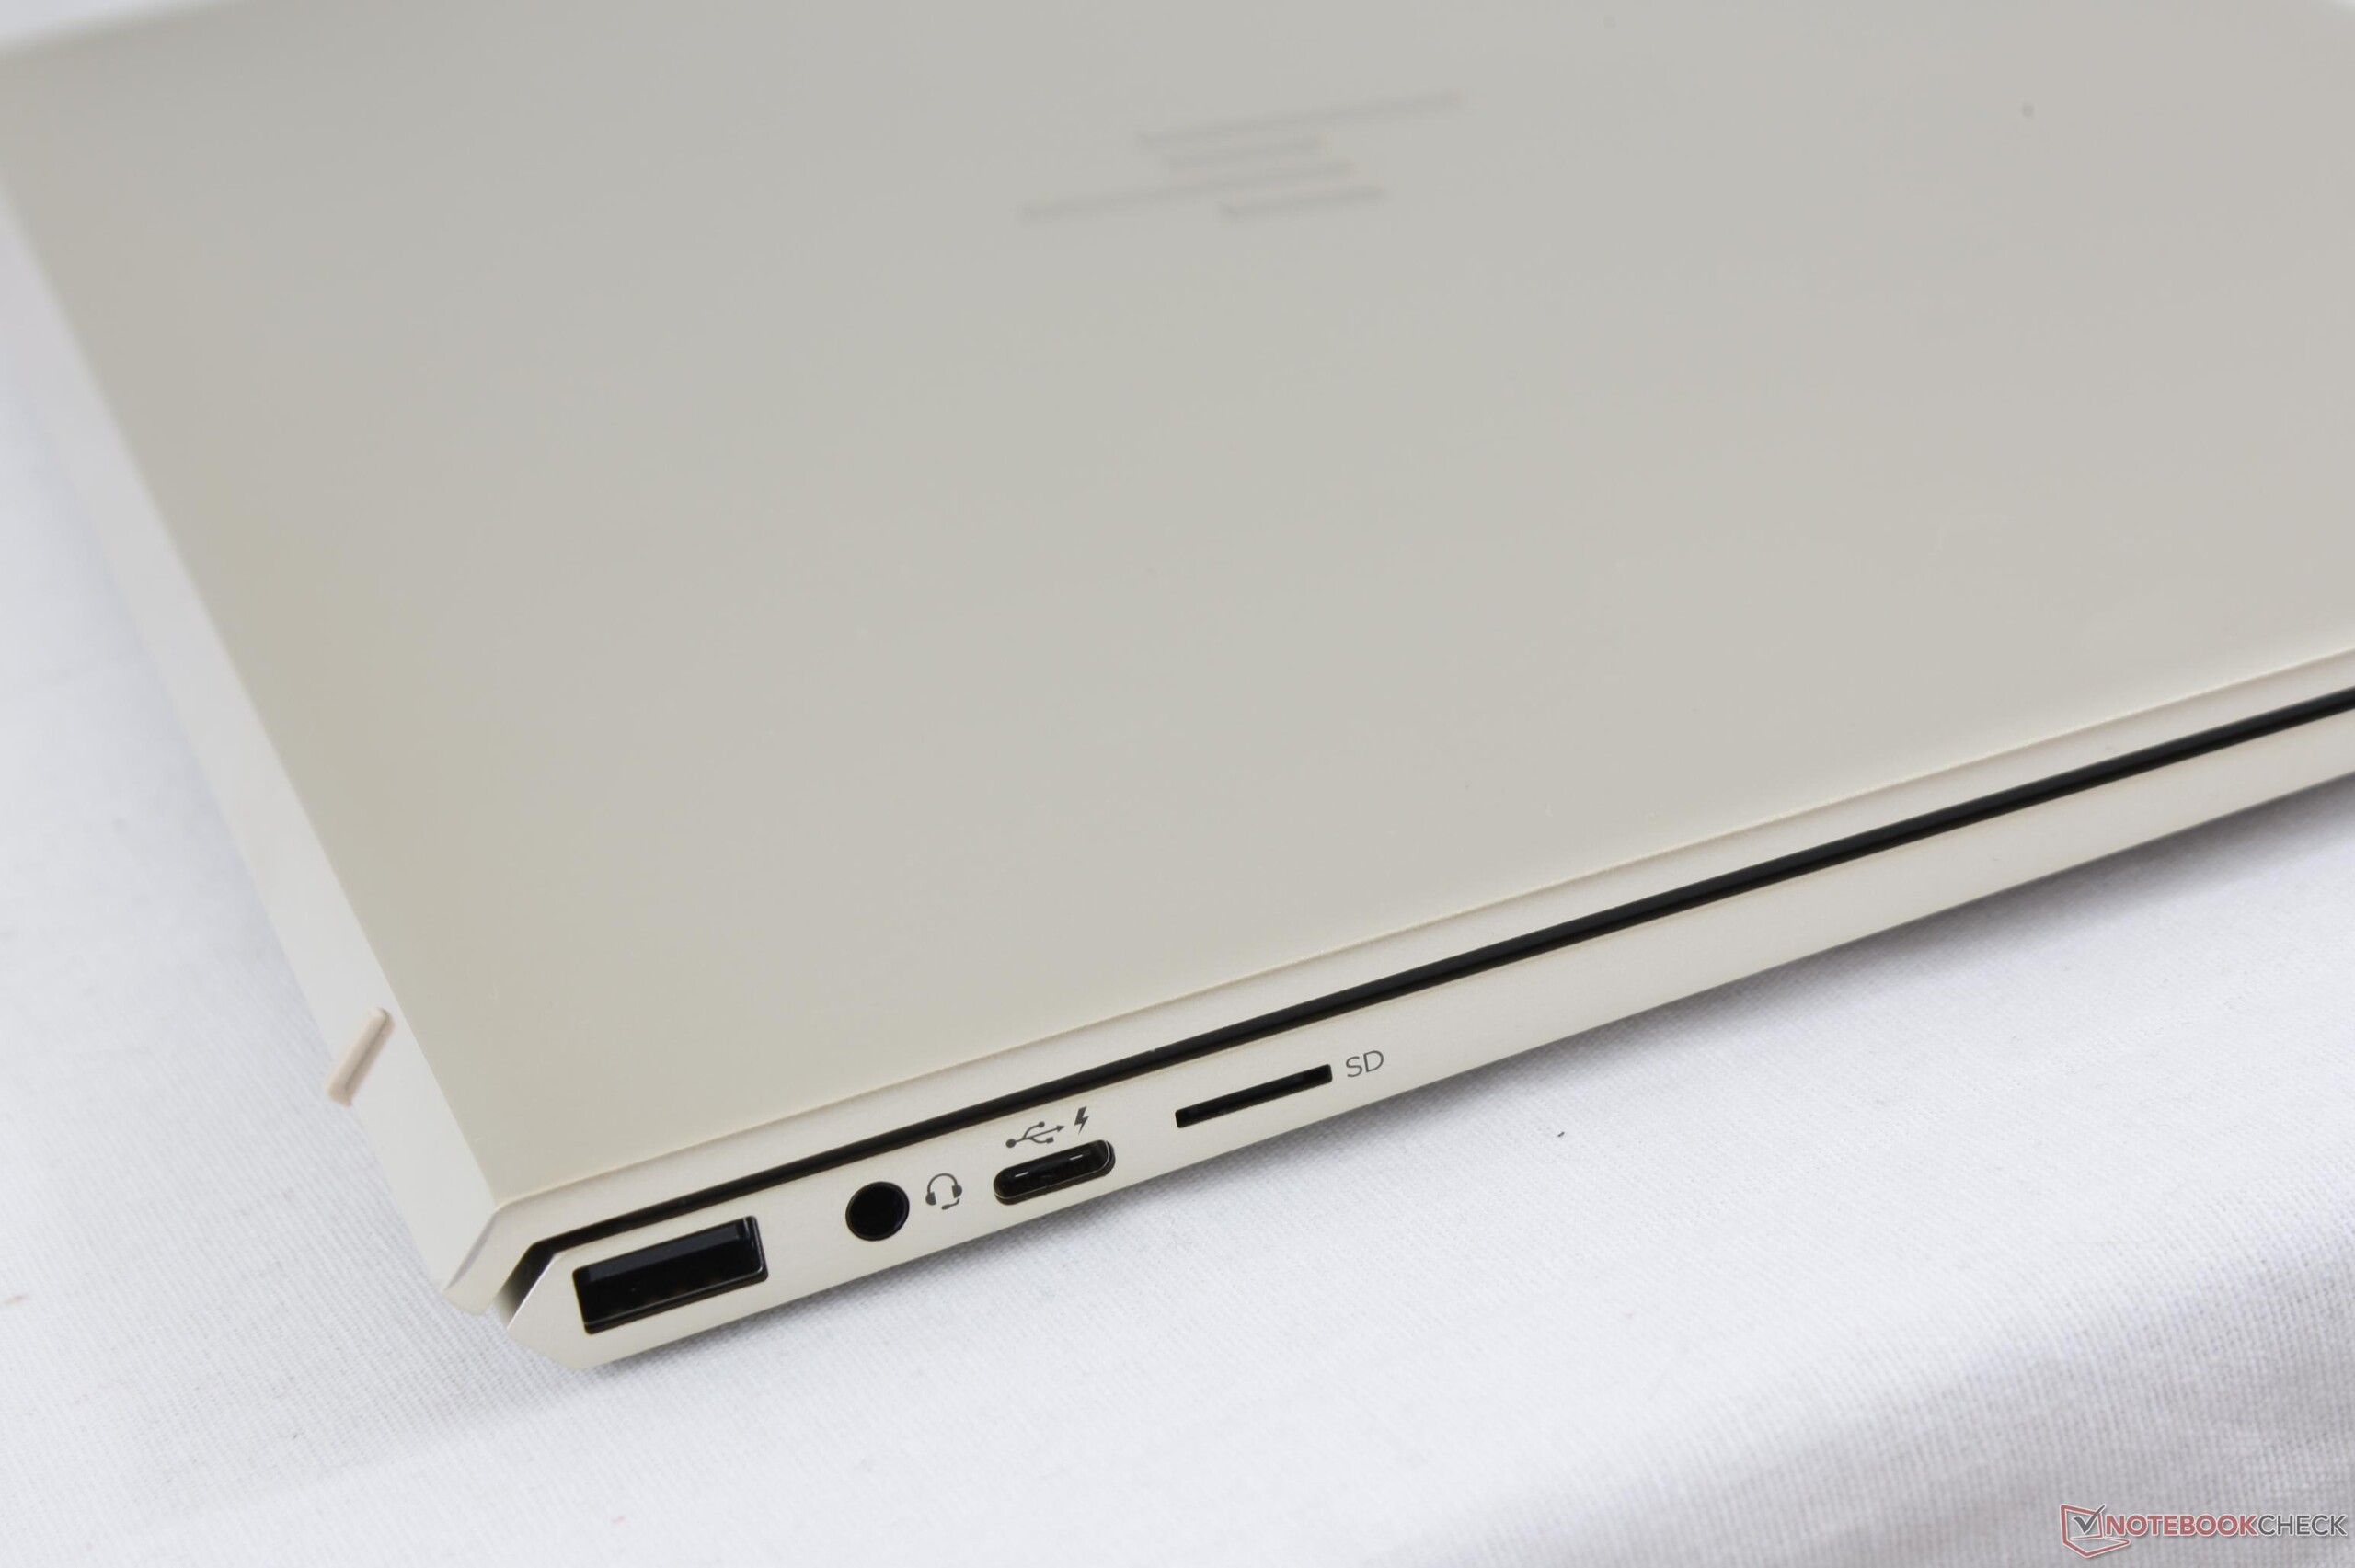
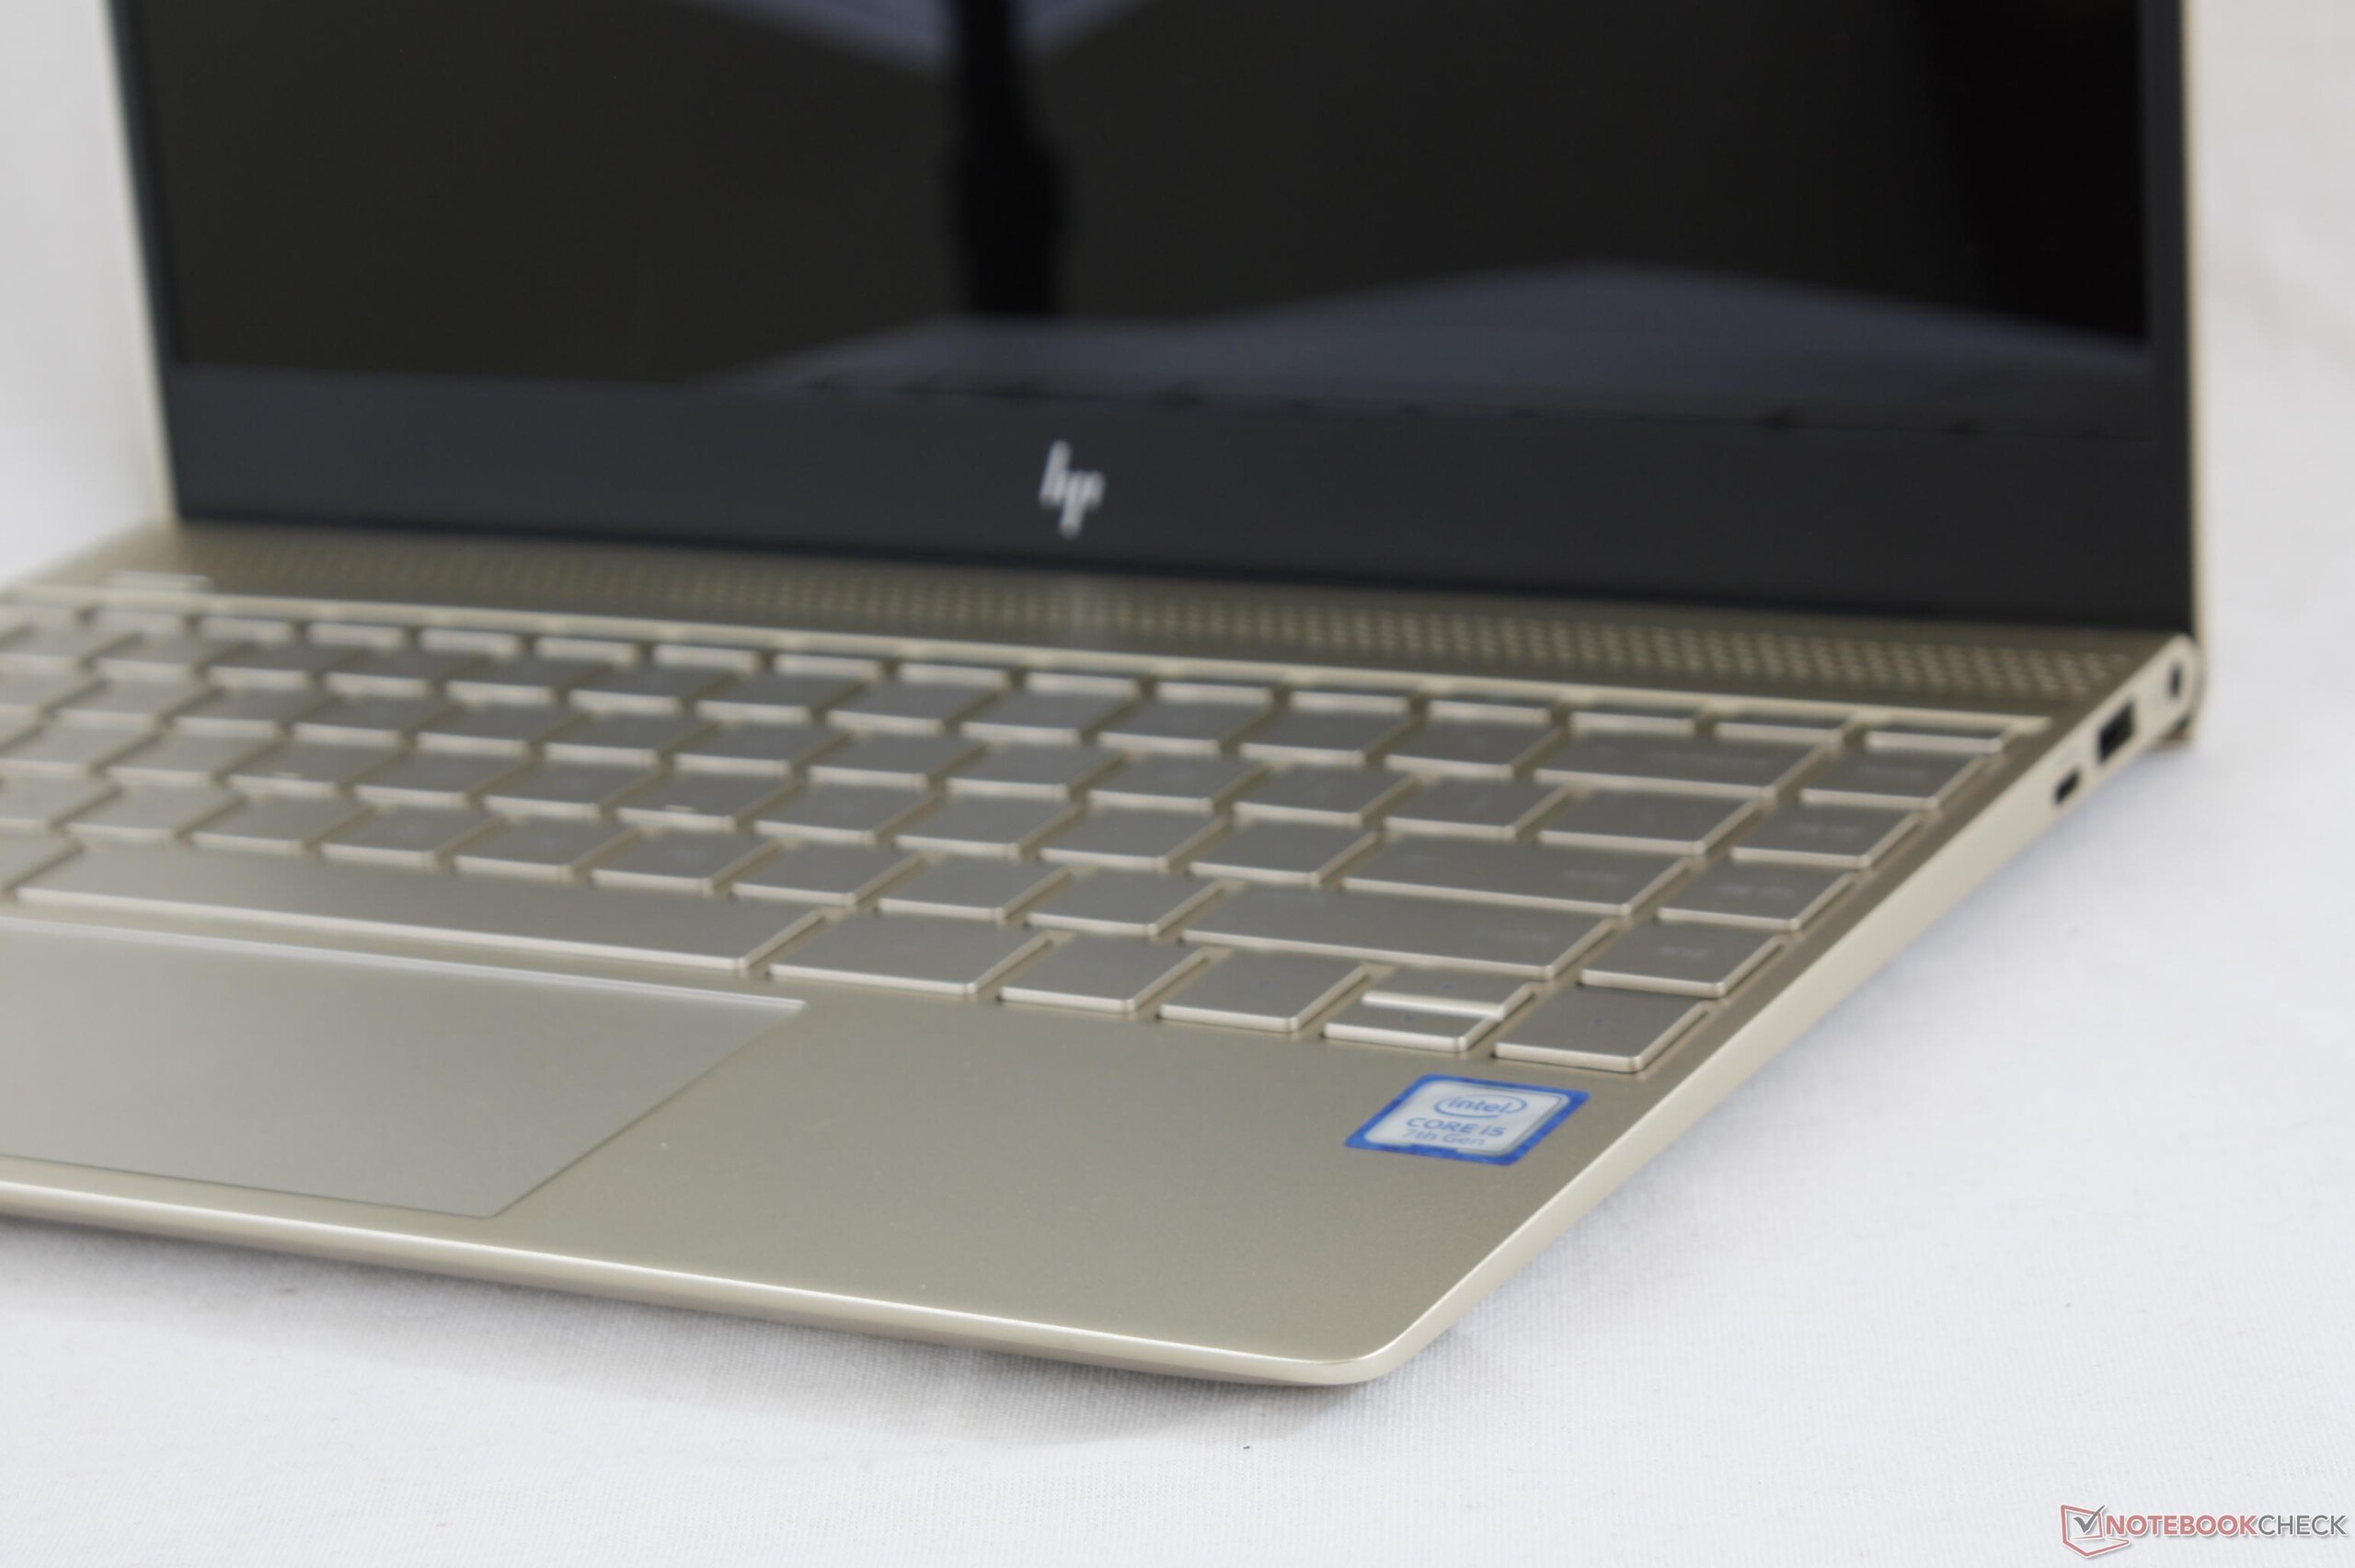
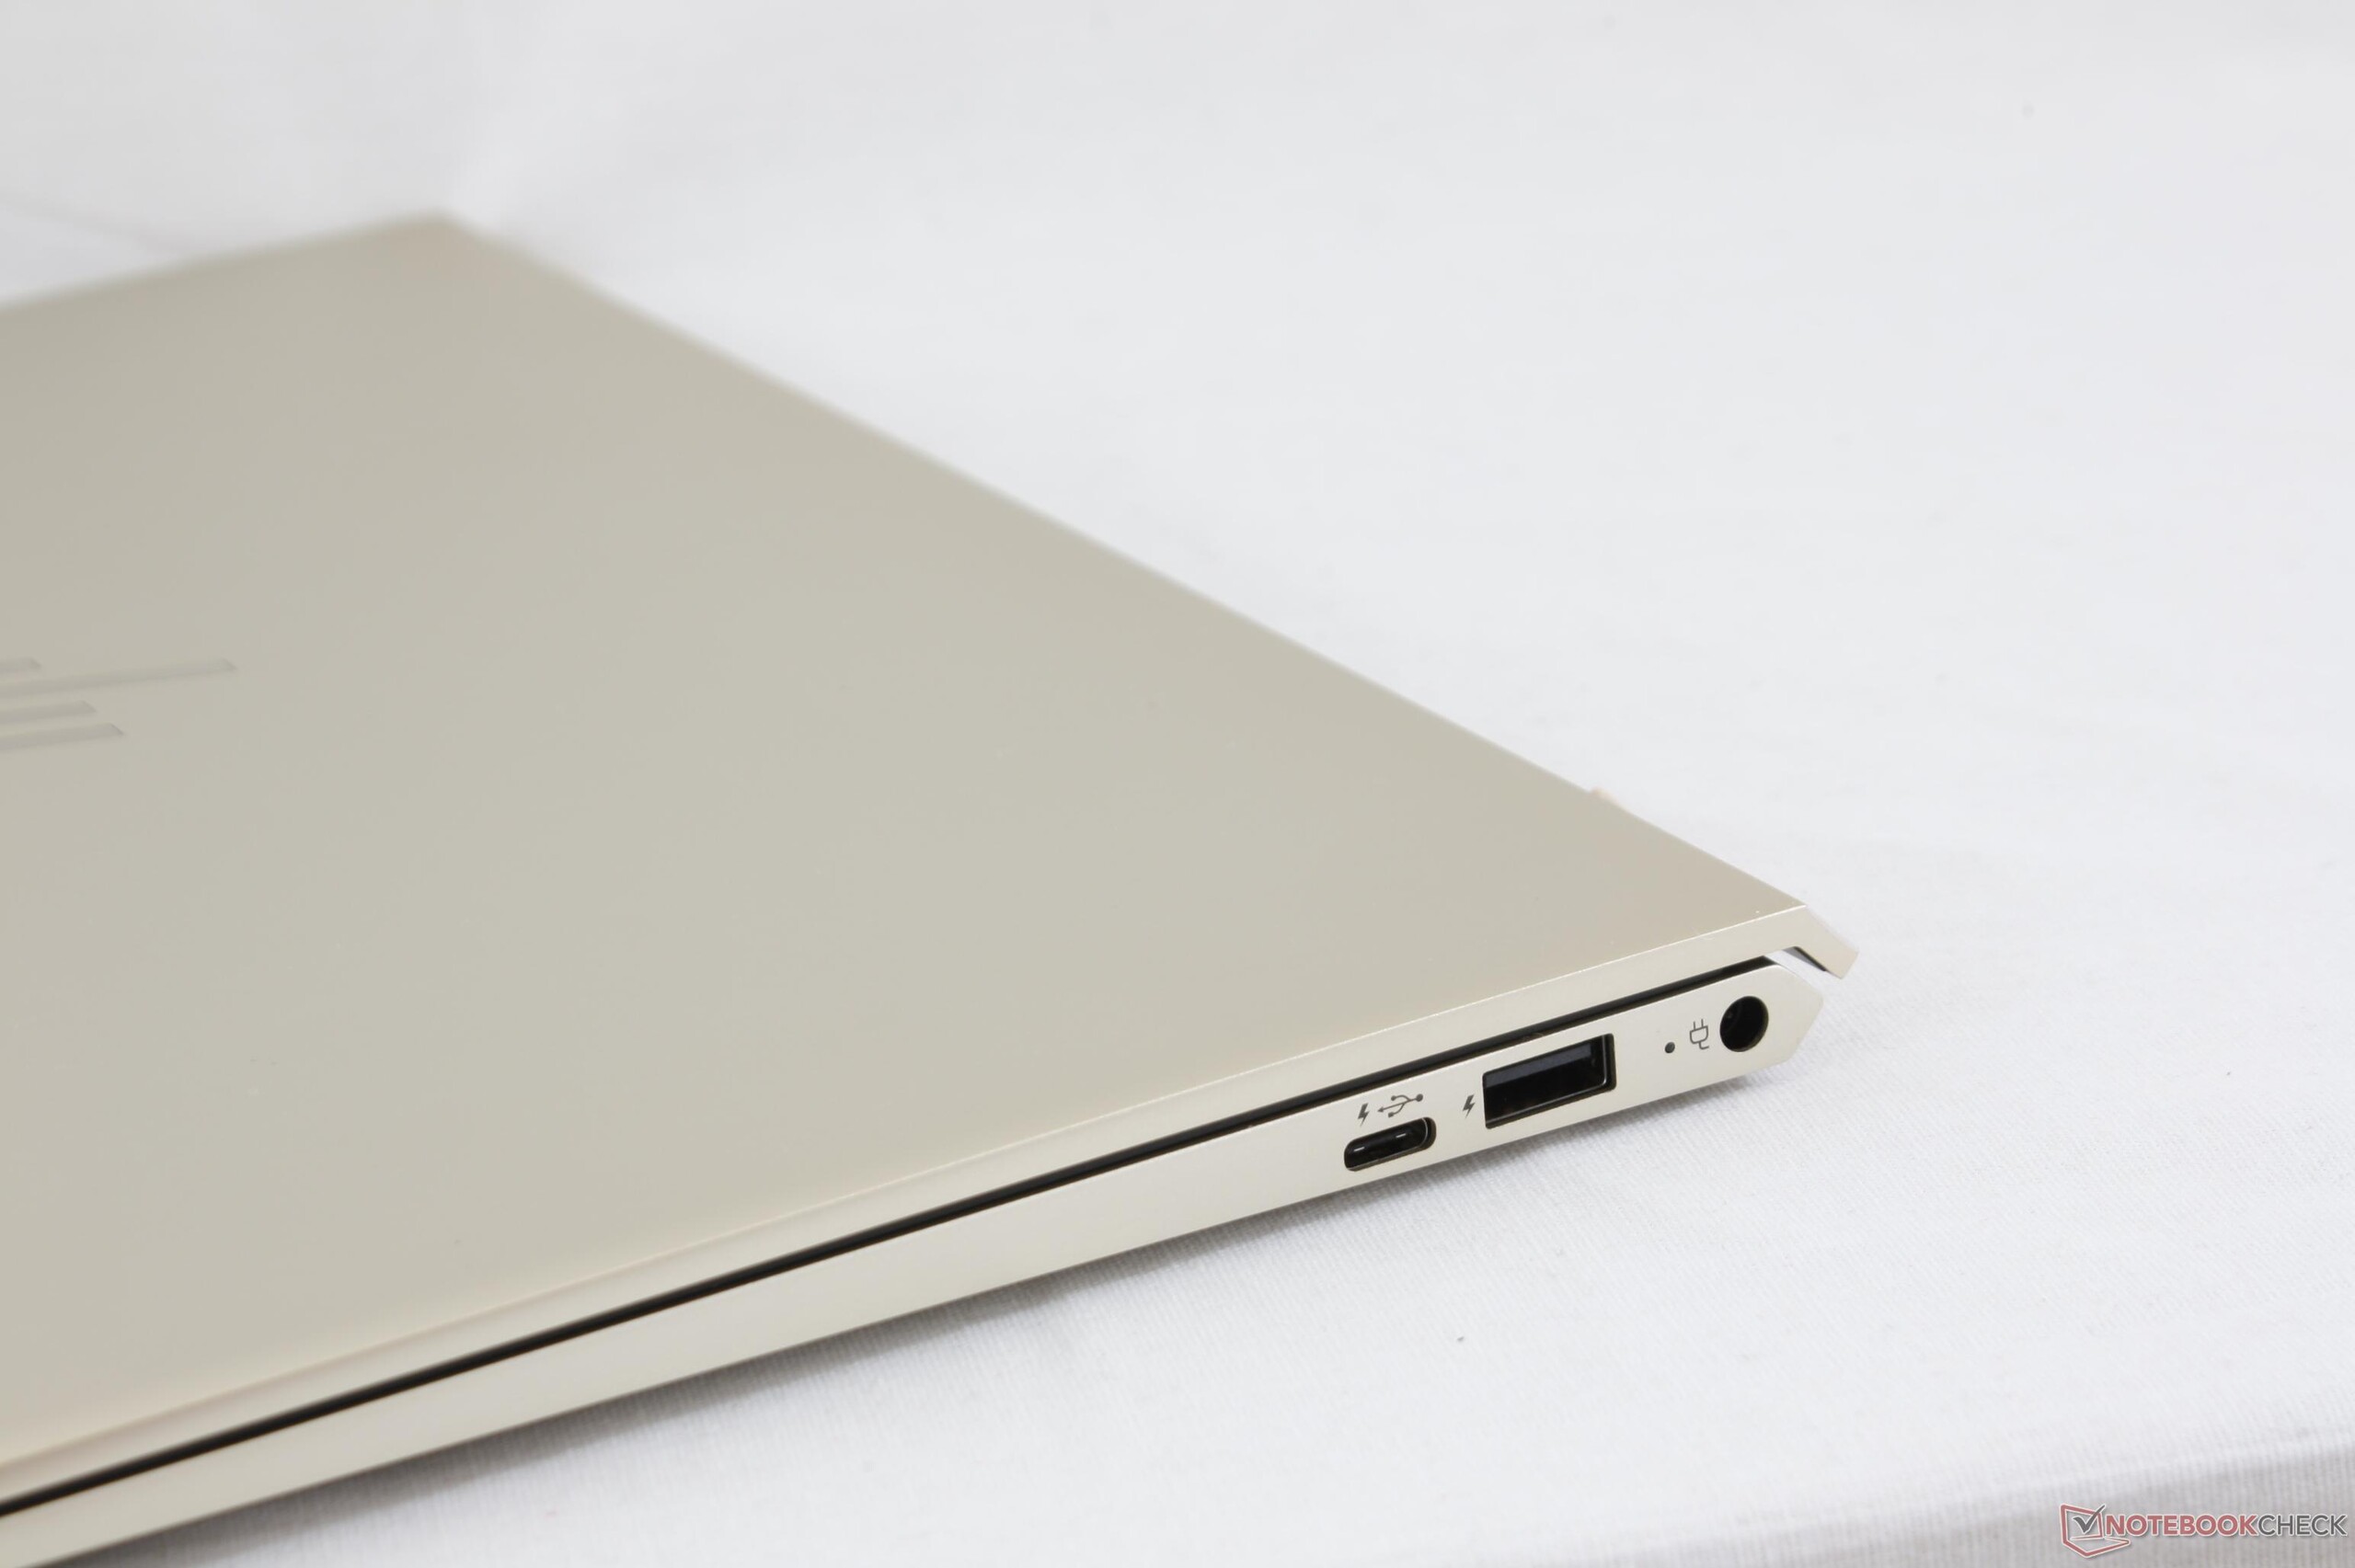
与其他极品对比,它的屏幕亮度不算出众。更可惜的是,它不配备哑光屏幕选择。这将影响户外的使用。作为一个小型笔记本,这实在是个问题。儿接口的选择上,该机也欠佳:我们会希望它支持HDMI,全尺寸SD卡插槽,和雷电3。惠普 13-ad065nr的触控板不是很让人满意,因为玻璃质感的鼠标键,会有咔咔声。而高性能系统的另一个潜在缺点,是在压力测试过程中发生热节流。当然,在正常使用的情况下,节流也可能发生。
有时候,原本的会更好:我们没有足够的理由推荐用户购买惠普 Envy 13,而不是戴尔 XPS13.
即便有些缺点,Envy 13不能说是一个差的笔电。除了略便宜的价格,和人专用的显卡,我们没有发现它更多的闪光点。当考虑物理接口、很显示屏亮度以及电池续航能力时,戴尔 XPS更为高端而且表现更好。而且它也拥有 酷睿 i7-8550U 处理器。因此,我们不推荐购买Envy 13。那些喜欢Envy 13的用户,应该寻找拥有最新硬件配置的机器。
注:本文是基于完整评测的缩减版本,阅读完整的英文评测,请点击这里。
HP Envy 13-ad006ng
- 10/17/2017 v6 (old)
Benjamin Herzig
Price comparison
