戴尔灵越15翻转本 Black Edition(i7-8565U,MX150)二合一笔记本评测


| SD Card Reader | |
| average JPG Copy Test (av. of 3 runs) | |
| HP Spectre x360 15-ch011nr (Toshiba Exceria Pro SDXC 64 GB UHS-II) | |
| Average of class Multimedia (23 - 531, n=37, last 2 years) | |
| Samsung Notebook 9 NP900X5T-X01US (Toshiba Exceria Pro M501 UHS-II) | |
| Acer Aspire 5 A515-52G-53PU (Toshiba Exceria Pro SDXC 64 GB UHS-II) | |
| Dell Inspiron 15 7000 2-in-1 Black Edition (Toshiba Exceria Pro SDXC 64 GB UHS-II) | |
| MSI PL62 MX150 7300HQ (Toshiba Exceria Pro SDXC 64 GB UHS-II) | |
| maximum AS SSD Seq Read Test (1GB) | |
| HP Spectre x360 15-ch011nr (Toshiba Exceria Pro SDXC 64 GB UHS-II) | |
| Average of class Multimedia (37.3 - 1455, n=36, last 2 years) | |
| Samsung Notebook 9 NP900X5T-X01US (Toshiba Exceria Pro M501 UHS-II) | |
| Acer Aspire 5 A515-52G-53PU (Toshiba Exceria Pro SDXC 64 GB UHS-II) | |
| Dell Inspiron 15 7000 2-in-1 Black Edition (Toshiba Exceria Pro SDXC 64 GB UHS-II) | |
| MSI PL62 MX150 7300HQ (Toshiba Exceria Pro SDXC 64 GB UHS-II) | |
| Networking | |
| iperf3 transmit AX12 | |
| Acer Aspire 5 A515-52G-53PU | |
| Dell Inspiron 15 7000 2-in-1 Black Edition | |
| Samsung Notebook 9 NP900X5T-X01US | |
| HP Spectre x360 15-ch011nr | |
| MSI PL62 MX150 7300HQ | |
| iperf3 receive AX12 | |
| Samsung Notebook 9 NP900X5T-X01US | |
| HP Spectre x360 15-ch011nr | |
| Dell Inspiron 15 7000 2-in-1 Black Edition | |
| Acer Aspire 5 A515-52G-53PU | |
| MSI PL62 MX150 7300HQ | |
| |||||||||||||||||||||||||
Brightness Distribution: 95 %
Center on Battery: 321.1 cd/m²
Contrast: 892:1 (Black: 0.36 cd/m²)
ΔE ColorChecker Calman: 5.45 | ∀{0.5-29.43 Ø4.71}
calibrated: 2.08
ΔE Greyscale Calman: 8.1 | ∀{0.09-98 Ø4.96}
99.3% sRGB (Argyll 1.6.3 3D)
67.3% AdobeRGB 1998 (Argyll 1.6.3 3D)
75.7% AdobeRGB 1998 (Argyll 3D)
99.3% sRGB (Argyll 3D)
75.7% Display P3 (Argyll 3D)
Gamma: 2.207
CCT: 6845 K
| Dell Inspiron 15 7000 2-in-1 Black Edition AUO34EB, IPS, 15.6", 3840x2160 | Acer Aspire 5 A515-52G-53PU BOE CQ NV156FHM-N48, IPS, 15.6", 1920x1080 | HP Spectre x360 15-ch011nr BOE0730, IPS, 15.6", 3840x2160 | Samsung Notebook 9 NP900X5T-X01US ID: BOE06E8, Name: BOE HF NV150FHB-N31, IPS, 15", 1920x1080 | MSI PL62 MX150 7300HQ Chi Mei CMN15D6, TN LED, 15.6", 1920x1080 | |
|---|---|---|---|---|---|
| Display | -45% | -10% | -9% | 8% | |
| Display P3 Coverage (%) | 75.7 | 39.85 -47% | 68.5 -10% | 65.2 -14% | 85.4 13% |
| sRGB Coverage (%) | 99.3 | 58.7 -41% | 90.7 -9% | 97.4 -2% | 99.6 0% |
| AdobeRGB 1998 Coverage (%) | 75.7 | 41.17 -46% | 66.3 -12% | 66.8 -12% | 82.9 10% |
| Response Times | -9% | 12% | 0% | 30% | |
| Response Time Grey 50% / Grey 80% * (ms) | 48 ? | 45 ? 6% | 38 ? 21% | 46 ? 4% | 44 ? 8% |
| Response Time Black / White * (ms) | 28.4 ? | 35 ? -23% | 27.6 ? 3% | 29.6 ? -4% | 14 ? 51% |
| PWM Frequency (Hz) | 20000 ? | 943 ? | 2976 ? | 250 ? | |
| Screen | -4% | -4% | 19% | -38% | |
| Brightness middle (cd/m²) | 321.1 | 296 -8% | 329.3 3% | 558.2 74% | 227 -29% |
| Brightness (cd/m²) | 315 | 268 -15% | 316 0% | 528 68% | 200 -37% |
| Brightness Distribution (%) | 95 | 81 -15% | 84 -12% | 92 -3% | 82 -14% |
| Black Level * (cd/m²) | 0.36 | 0.3 17% | 0.31 14% | 0.46 -28% | 0.46 -28% |
| Contrast (:1) | 892 | 987 11% | 1062 19% | 1213 36% | 493 -45% |
| Colorchecker dE 2000 * | 5.45 | 4.01 26% | 4.78 12% | 4.41 19% | 10.88 -100% |
| Colorchecker dE 2000 max. * | 12.6 | 8.7 31% | 11.75 7% | 10.91 13% | 18.36 -46% |
| Colorchecker dE 2000 calibrated * | 2.08 | 4 -92% | 3.51 -69% | ||
| Greyscale dE 2000 * | 8.1 | 0.98 88% | 7.9 2% | 6.6 19% | 12.18 -50% |
| Gamma | 2.207 100% | 2.35 94% | 2.24 98% | 2.19 100% | 2.58 85% |
| CCT | 6845 95% | 6408 101% | 8323 78% | 7615 85% | 14446 45% |
| Color Space (Percent of AdobeRGB 1998) (%) | 67.3 | 38 -44% | 58.8 -13% | 61.3 -9% | 74 10% |
| Color Space (Percent of sRGB) (%) | 99.3 | 58 -42% | 90.4 -9% | 97.2 -2% | 63 -37% |
| Total Average (Program / Settings) | -19% /
-12% | -1% /
-3% | 3% /
11% | 0% /
-20% |
* ... smaller is better
Display Response Times
| ↔ Response Time Black to White | ||
|---|---|---|
| 28.4 ms ... rise ↗ and fall ↘ combined | ↗ 12.8 ms rise | 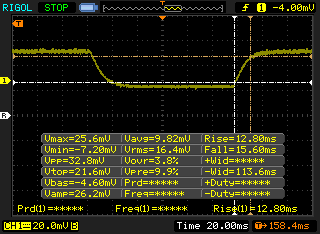 |
| ↘ 15.6 ms fall | ||
| The screen shows relatively slow response rates in our tests and may be too slow for gamers. In comparison, all tested devices range from 0.1 (minimum) to 240 (maximum) ms. » 75 % of all devices are better. This means that the measured response time is worse than the average of all tested devices (19.8 ms). | ||
| ↔ Response Time 50% Grey to 80% Grey | ||
| 48 ms ... rise ↗ and fall ↘ combined | ↗ 25.2 ms rise | 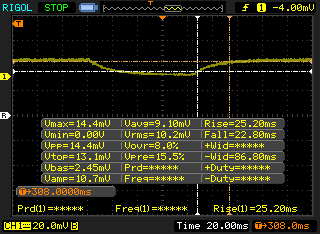 |
| ↘ 22.8 ms fall | ||
| The screen shows slow response rates in our tests and will be unsatisfactory for gamers. In comparison, all tested devices range from 0.165 (minimum) to 636 (maximum) ms. » 82 % of all devices are better. This means that the measured response time is worse than the average of all tested devices (31 ms). | ||
Screen Flickering / PWM (Pulse-Width Modulation)
| Screen flickering / PWM not detected | 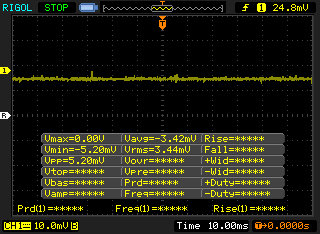 | ||
In comparison: 52 % of all tested devices do not use PWM to dim the display. If PWM was detected, an average of 7754 (minimum: 5 - maximum: 343500) Hz was measured. | |||
| Cinebench R15 | |
| CPU Single 64Bit | |
| Average of class Multimedia (184.8 - 326, n=59, last 2 years) | |
| Dell XPS 15 9570 Core i9 UHD | |
| Dell Inspiron 15 7000 2-in-1 Black Edition | |
| Average Intel Core i7-8565U (138.3 - 193, n=51) | |
| Acer Aspire 5 A515-52G-53PU | |
| Samsung Notebook 9 NP900X5T-X01US | |
| HP Spectre x360 15-ch011nr | |
| MSI PL62 MX150 7300HQ | |
| CPU Multi 64Bit | |
| Average of class Multimedia (856 - 5224, n=61, last 2 years) | |
| Dell XPS 15 9570 Core i9 UHD | |
| Dell Inspiron 15 7000 2-in-1 Black Edition | |
| Average Intel Core i7-8565U (452 - 815, n=52) | |
| Samsung Notebook 9 NP900X5T-X01US | |
| HP Spectre x360 15-ch011nr | |
| Acer Aspire 5 A515-52G-53PU | |
| MSI PL62 MX150 7300HQ | |
| wPrime 2.10 - 1024m | |
| Acer Aspire 5 A515-52G-53PU | |
| Average Intel Core i7-8565U (263 - 420, n=7) | |
| Average of class Multimedia (227 - 340, n=6, last 2 years) | |
| Samsung Notebook 9 NP900X5T-X01US | |
* ... smaller is better
| PCMark 8 | |
| Home Score Accelerated v2 | |
| Average of class Multimedia (n=1last 2 years) | |
| Samsung Notebook 9 NP900X5T-X01US | |
| Dell XPS 15 9570 Core i9 UHD | |
| Acer Aspire 5 A515-52G-53PU | |
| Average Intel Core i7-8565U, NVIDIA GeForce MX150 (3141 - 4092, n=6) | |
| HP Spectre x360 15-ch011nr | |
| MSI PL62 MX150 7300HQ | |
| Dell Inspiron 15 7000 2-in-1 Black Edition | |
| Work Score Accelerated v2 | |
| Samsung Notebook 9 NP900X5T-X01US | |
| Acer Aspire 5 A515-52G-53PU | |
| Average Intel Core i7-8565U, NVIDIA GeForce MX150 (4240 - 5254, n=6) | |
| Dell XPS 15 9570 Core i9 UHD | |
| HP Spectre x360 15-ch011nr | |
| Dell Inspiron 15 7000 2-in-1 Black Edition | |
| Creative Score Accelerated v2 | |
| Samsung Notebook 9 NP900X5T-X01US | |
| Average Intel Core i7-8565U, NVIDIA GeForce MX150 (4805 - 5840, n=2) | |
| Acer Aspire 5 A515-52G-53PU | |
| PCMark 8 Home Score Accelerated v2 | 3141 points | |
| PCMark 8 Work Score Accelerated v2 | 4240 points | |
| PCMark 10 Score | 3719 points | |
Help | ||
| Dell Inspiron 15 7000 2-in-1 Black Edition Toshiba BG3 KBG30ZMS256G | Acer Aspire 5 A515-52G-53PU Micron 1100 MTFDDAV256TBN | HP Spectre x360 15-ch011nr SK hynix PC401 NVMe 500 GB | Samsung Notebook 9 NP900X5T-X01US Samsung PM961 MZVLW256HEHP | Dell XPS 15 9570 Core i9 UHD Samsung SSD PM981 MZVLB1T0HALR | |
|---|---|---|---|---|---|
| AS SSD | |||||
| Seq Read (MB/s) | 1123 | 490.6 -56% | 1739 55% | 2337 108% | 1320 18% |
| Seq Write (MB/s) | 208.9 | 390.2 87% | 1189 469% | 1206 477% | 1500 618% |
| 4K Read (MB/s) | 27.36 | 19.47 -29% | 38.76 42% | 48.71 78% | 30.73 12% |
| 4K Write (MB/s) | 65 | 72.2 11% | 93.2 43% | 115 77% | 94.4 45% |
| 4K-64 Read (MB/s) | 313.2 | 236.2 -25% | 646 106% | 1085 246% | 1453 364% |
| 4K-64 Write (MB/s) | 111.2 | 276.7 149% | 545 390% | 392.6 253% | 1815 1532% |
| Access Time Read * (ms) | 0.684 | 0.054 92% | 0.054 92% | 0.061 91% | |
| Access Time Write * (ms) | 0.344 | 0.063 82% | 0.051 85% | 0.032 91% | 0.044 87% |
| Score Read (Points) | 453 | 305 -33% | 859 90% | 1367 202% | 1616 257% |
| Score Write (Points) | 197 | 388 97% | 757 284% | 628 219% | 2059 945% |
| Score Total (Points) | 844 | 850 1% | 2037 141% | 2646 214% | 4507 434% |
| Copy ISO MB/s (MB/s) | 927 | 321.3 -65% | 1668 80% | 1751 89% | 2577 178% |
| Copy Program MB/s (MB/s) | 206.4 | 141.7 -31% | 486.8 136% | 479.5 132% | 515 150% |
| Copy Game MB/s (MB/s) | 360.4 | 239.4 -34% | 1042 189% | 1058 194% | 1120 211% |
| CrystalDiskMark 5.2 / 6 | |||||
| Write 4K (MB/s) | 83.4 | 78.4 -6% | 108.5 30% | 162.7 95% | 103 24% |
| Read 4K (MB/s) | 32.22 | 25.99 -19% | 37.67 17% | 47.06 46% | 52.6 63% |
| Write Seq (MB/s) | 171.7 | 390.9 128% | 1120 552% | 1075 526% | 2216 1191% |
| Read Seq (MB/s) | 924 | 482.6 -48% | 1300 41% | 1023 11% | 1599 73% |
| Write 4K Q32T1 (MB/s) | 161.5 | 205.5 27% | 243.9 51% | 435.4 170% | 603 273% |
| Read 4K Q32T1 (MB/s) | 301.1 | 227.9 -24% | 311.6 3% | 517 72% | 321.4 7% |
| Write Seq Q32T1 (MB/s) | 222.3 | 502 126% | 1395 528% | 1276 474% | 2395 977% |
| Read Seq Q32T1 (MB/s) | 1300 | 526 -60% | 2667 105% | 3418 163% | 2251 73% |
* ... smaller is better

| 3DMark 11 | |
| 1280x720 Performance GPU | |
| Average of class Multimedia (3749 - 60002, n=55, last 2 years) | |
| Dell XPS 15 9570 Core i9 UHD | |
| MSI PL62 MX150 7300HQ | |
| HP Spectre x360 15-ch011nr | |
| Acer Aspire 5 A515-52G-53PU | |
| Samsung Notebook 9 NP900X5T-X01US | |
| Dell Inspiron 15 7000 2-in-1 Black Edition | |
| Average NVIDIA GeForce MX150 (2796 - 4905, n=47) | |
| Lenovo IdeaPad Flex-1570 81CA000RUS | |
| 1280x720 Performance Combined | |
| Average of class Multimedia (2326 - 26308, n=55, last 2 years) | |
| Dell XPS 15 9570 Core i9 UHD | |
| MSI PL62 MX150 7300HQ | |
| HP Spectre x360 15-ch011nr | |
| Acer Aspire 5 A515-52G-53PU | |
| Samsung Notebook 9 NP900X5T-X01US | |
| Average NVIDIA GeForce MX150 (2820 - 4421, n=46) | |
| Dell Inspiron 15 7000 2-in-1 Black Edition | |
| Lenovo IdeaPad Flex-1570 81CA000RUS | |
| 3DMark | |
| 1280x720 Cloud Gate Standard Graphics | |
| Average of class Multimedia (16765 - 143501, n=32, last 2 years) | |
| Dell XPS 15 9570 Core i9 UHD | |
| Acer Aspire 5 A515-52G-53PU | |
| HP Spectre x360 15-ch011nr | |
| Samsung Notebook 9 NP900X5T-X01US | |
| Average NVIDIA GeForce MX150 (16227 - 22183, n=43) | |
| Dell Inspiron 15 7000 2-in-1 Black Edition | |
| Lenovo IdeaPad Flex-1570 81CA000RUS | |
| LG Gram 15Z980-B.AA78B | |
| 1920x1080 Fire Strike Graphics | |
| Average of class Multimedia (2328 - 48907, n=58, last 2 years) | |
| Dell XPS 15 9570 Core i9 UHD | |
| HP Spectre x360 15-ch011nr | |
| Acer Aspire 5 A515-52G-53PU | |
| Dell Inspiron 15 7000 2-in-1 Black Edition | |
| Samsung Notebook 9 NP900X5T-X01US | |
| Average NVIDIA GeForce MX150 (2323 - 3739, n=44) | |
| Lenovo IdeaPad Flex-1570 81CA000RUS | |
| LG Gram 15Z980-B.AA78B | |
| 3DMark 11 Performance | 4567 points | |
| 3DMark Cloud Gate Standard Score | 13170 points | |
| 3DMark Fire Strike Score | 3102 points | |
Help | ||
| Thief | |
| 1920x1080 Very High Preset AA:FXAA & High SS AF:8x | |
| Dell Inspiron 15 7000 2-in-1 Black Edition | |
| Samsung Notebook 9 NP900X5T-X01US | |
| Average NVIDIA GeForce MX150 (16 - 23.2, n=6) | |
| 1366x768 High Preset AA:FXAA & Low SS AF:4x | |
| Average NVIDIA GeForce MX150 (30.2 - 44.1, n=6) | |
| Dell Inspiron 15 7000 2-in-1 Black Edition | |
| Samsung Notebook 9 NP900X5T-X01US | |
| 1366x768 Normal Preset AA:FX | |
| Average NVIDIA GeForce MX150 (32.5 - 51.9, n=6) | |
| Dell Inspiron 15 7000 2-in-1 Black Edition | |
| Samsung Notebook 9 NP900X5T-X01US | |
| 1024x768 Very Low Preset | |
| Average NVIDIA GeForce MX150 (41.5 - 79.2, n=6) | |
| Samsung Notebook 9 NP900X5T-X01US | |
| Dell Inspiron 15 7000 2-in-1 Black Edition | |
| Batman: Arkham Knight | |
| 3840x2160 High / On (Interactive Smoke & Paper Debris Off) AA:SM AF:8x | |
| Dell Inspiron 15 7000 2-in-1 Black Edition | |
| Average NVIDIA GeForce MX150 (n=1) | |
| 1920x1080 High / On AA:SM AF:16x | |
| Dell Inspiron 15 7000 2-in-1 Black Edition | |
| Average NVIDIA GeForce MX150 (8 - 23, n=3) | |
| 1920x1080 High / On (Interactive Smoke & Paper Debris Off) AA:SM AF:8x | |
| Dell Inspiron 15 7000 2-in-1 Black Edition | |
| Average NVIDIA GeForce MX150 (16 - 23, n=7) | |
| Samsung Notebook 9 NP900X5T-X01US | |
| HP Spectre x360 15-ch011nr | |
| 1366x768 Normal / Off AF:4x | |
| HP Spectre x360 15-ch011nr | |
| Dell Inspiron 15 7000 2-in-1 Black Edition | |
| Average NVIDIA GeForce MX150 (36 - 51, n=7) | |
| Samsung Notebook 9 NP900X5T-X01US | |
| 1280x720 Low / Off AF:Trilinear | |
| HP Spectre x360 15-ch011nr | |
| Average NVIDIA GeForce MX150 (41 - 60, n=7) | |
| Dell Inspiron 15 7000 2-in-1 Black Edition | |
| Samsung Notebook 9 NP900X5T-X01US | |
| low | med. | high | ultra | 4K | |
|---|---|---|---|---|---|
| BioShock Infinite (2013) | 175 | 109 | 93 | 34 | |
| Metro: Last Light (2013) | 86 | ||||
| Thief (2014) | 41.5 | 38 | 33.6 | 19.4 | |
| The Witcher 3 (2015) | 12 | ||||
| Batman: Arkham Knight (2015) | 48 | 45 | 23 | 23 | 5 |
| Dell Inspiron 15 7000 2-in-1 Black Edition GeForce MX150, i7-8565U, Toshiba BG3 KBG30ZMS256G | Acer Aspire 5 A515-52G-53PU GeForce MX150, i5-8265U, Micron 1100 MTFDDAV256TBN | HP Spectre x360 15-ch011nr GeForce MX150, i5-8550U, SK hynix PC401 NVMe 500 GB | Samsung Notebook 9 NP900X5T-X01US GeForce MX150, i5-8550U, Samsung PM961 MZVLW256HEHP | MSI PL62 MX150 7300HQ GeForce MX150, i5-7300HQ | Dell XPS 15 9570 Core i9 UHD GeForce GTX 1050 Ti Max-Q, i9-8950HK, Samsung SSD PM981 MZVLB1T0HALR | |
|---|---|---|---|---|---|---|
| Noise | -1% | 8% | 4% | -5% | 3% | |
| off / environment * (dB) | 28 | 30.5 -9% | 28.6 -2% | 29.6 -6% | 30.4 -9% | 28.2 -1% |
| Idle Minimum * (dB) | 28 | 30.5 -9% | 29.2 -4% | 29.6 -6% | 32 -14% | 28.5 -2% |
| Idle Average * (dB) | 28 | 30.5 -9% | 29.2 -4% | 29.6 -6% | 32 -14% | 28.6 -2% |
| Idle Maximum * (dB) | 28.4 | 30.9 -9% | 29.2 -3% | 30.3 -7% | 32 -13% | 28.8 -1% |
| Load Average * (dB) | 48.6 | 41.2 15% | 29.2 40% | 40 18% | 38.7 20% | 36.2 26% |
| Witcher 3 ultra * (dB) | 47.9 | 38.4 20% | 40 16% | 47.6 1% | ||
| Load Maximum * (dB) | 49.2 | 41.9 15% | 45.7 7% | 40 19% | 48.7 1% | 47.6 3% |
* ... smaller is better
Noise level
| Idle |
| 28 / 28 / 28.4 dB(A) |
| Load |
| 48.6 / 49.2 dB(A) |
 | ||
30 dB silent 40 dB(A) audible 50 dB(A) loud |
||
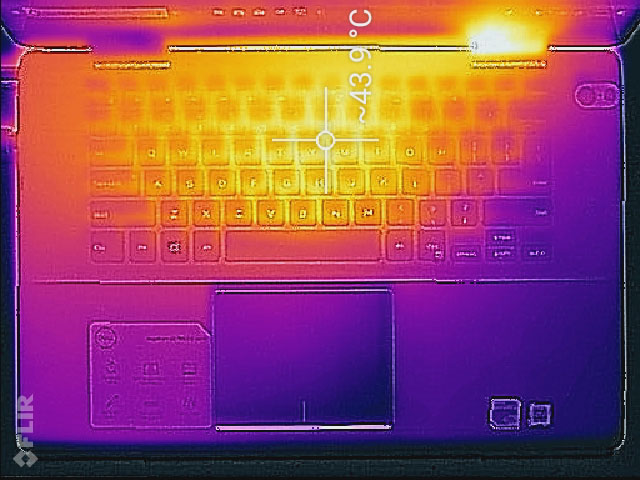
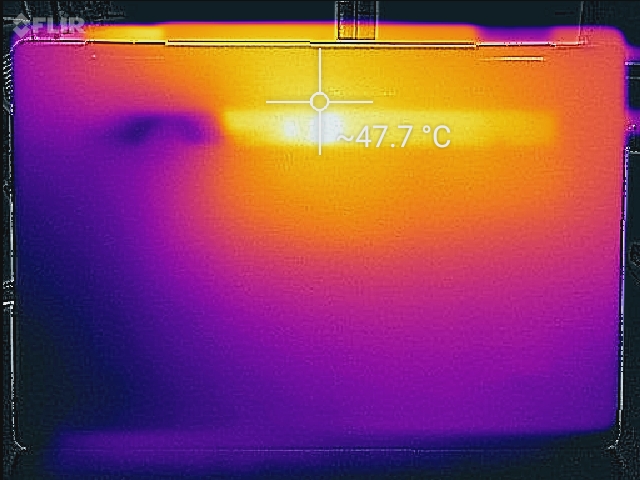
min: | ||
(±) The maximum temperature on the upper side is 43.4 °C / 110 F, compared to the average of 36.8 °C / 98 F, ranging from 21 to 71 °C for the class Multimedia.
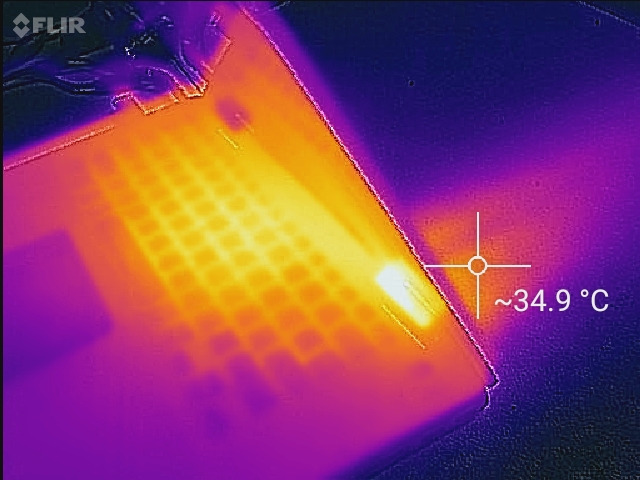
(-) The bottom heats up to a maximum of 47.4 °C / 117 F, compared to the average of 39.1 °C / 102 F
(+) In idle usage, the average temperature for the upper side is 20.1 °C / 68 F, compared to the device average of 31.3 °C / 88 F.
(+) Playing The Witcher 3, the average temperature for the upper side is 31.4 °C / 89 F, compared to the device average of 31.3 °C / 88 F.
(+) The palmrests and touchpad are cooler than skin temperature with a maximum of 27 °C / 80.6 F and are therefore cool to the touch.
(±) The average temperature of the palmrest area of similar devices was 28.7 °C / 83.7 F (+1.7 °C / 3.1 F).
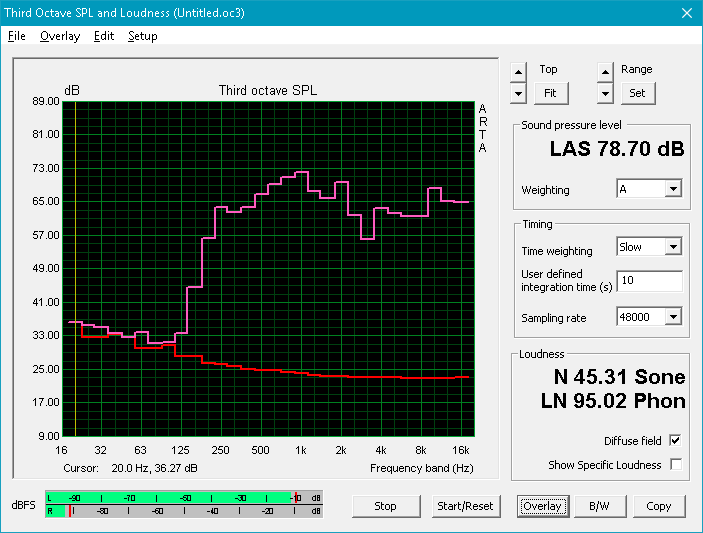
Dell Inspiron 15 7000 2-in-1 Black Edition audio analysis
(±) | speaker loudness is average but good (78.7 dB)
Bass 100 - 315 Hz
(-) | nearly no bass - on average 15% lower than median
(±) | linearity of bass is average (14% delta to prev. frequency)
Mids 400 - 2000 Hz
(+) | balanced mids - only 4.5% away from median
(+) | mids are linear (6% delta to prev. frequency)
Highs 2 - 16 kHz
(+) | balanced highs - only 2.9% away from median
(±) | linearity of highs is average (10.6% delta to prev. frequency)
Overall 100 - 16.000 Hz
(±) | linearity of overall sound is average (18.1% difference to median)
Compared to same class
» 54% of all tested devices in this class were better, 8% similar, 38% worse
» The best had a delta of 5%, average was 17%, worst was 45%
Compared to all devices tested
» 39% of all tested devices were better, 8% similar, 54% worse
» The best had a delta of 4%, average was 23%, worst was 134%
HP Spectre x360 15-ch011nr audio analysis
(±) | speaker loudness is average but good (79.9 dB)
Bass 100 - 315 Hz
(-) | nearly no bass - on average 22.3% lower than median
(±) | linearity of bass is average (11.5% delta to prev. frequency)
Mids 400 - 2000 Hz
(+) | balanced mids - only 2.4% away from median
(±) | linearity of mids is average (7.5% delta to prev. frequency)
Highs 2 - 16 kHz
(+) | balanced highs - only 4% away from median
(+) | highs are linear (6.2% delta to prev. frequency)
Overall 100 - 16.000 Hz
(±) | linearity of overall sound is average (17.7% difference to median)
Compared to same class
» 51% of all tested devices in this class were better, 7% similar, 42% worse
» The best had a delta of 5%, average was 17%, worst was 45%
Compared to all devices tested
» 35% of all tested devices were better, 8% similar, 57% worse
» The best had a delta of 4%, average was 23%, worst was 134%
| Off / Standby | |
| Idle | |
| Load |
|
Key:
min: | |
| Dell Inspiron 15 7000 2-in-1 Black Edition i7-8565U, GeForce MX150, Toshiba BG3 KBG30ZMS256G, IPS, 3840x2160, 15.6" | Acer Aspire 5 A515-52G-53PU i5-8265U, GeForce MX150, Micron 1100 MTFDDAV256TBN, IPS, 1920x1080, 15.6" | HP Spectre x360 15-ch011nr i5-8550U, GeForce MX150, SK hynix PC401 NVMe 500 GB, IPS, 3840x2160, 15.6" | Samsung Notebook 9 NP900X5T-X01US i5-8550U, GeForce MX150, Samsung PM961 MZVLW256HEHP, IPS, 1920x1080, 15" | MSI PL62 MX150 7300HQ i5-7300HQ, GeForce MX150, , TN LED, 1920x1080, 15.6" | Dell XPS 15 9570 Core i9 UHD i9-8950HK, GeForce GTX 1050 Ti Max-Q, Samsung SSD PM981 MZVLB1T0HALR, IPS, 3840x2160, 15.6" | |
|---|---|---|---|---|---|---|
| Power Consumption | 3% | -27% | -10% | -62% | -77% | |
| Idle Minimum * (Watt) | 4.2 | 3.8 10% | 5.3 -26% | 3.5 17% | 9.2 -119% | 7.1 -69% |
| Idle Average * (Watt) | 7.8 | 6.3 19% | 9.8 -26% | 11.3 -45% | 13.6 -74% | 13.6 -74% |
| Idle Maximum * (Watt) | 8.5 | 9.6 -13% | 12.6 -48% | 14.2 -67% | 14.7 -73% | 14.1 -66% |
| Load Average * (Watt) | 57 | 59.5 -4% | 73 -28% | 53.3 6% | 64 -12% | 103.9 -82% |
| Witcher 3 ultra * (Watt) | 57.3 | 67.6 -18% | 50.6 12% | 103 -80% | ||
| Load Maximum * (Watt) | 68 | 64.4 5% | 80 -18% | 56.2 17% | 89.2 -31% | 130.9 -93% |
* ... smaller is better
| Dell Inspiron 15 7000 2-in-1 Black Edition i7-8565U, GeForce MX150, 56 Wh | Acer Aspire 5 A515-52G-53PU i5-8265U, GeForce MX150, 48 Wh | HP Spectre x360 15-ch011nr i5-8550U, GeForce MX150, 84 Wh | Samsung Notebook 9 NP900X5T-X01US i5-8550U, GeForce MX150, 75 Wh | MSI PL62 MX150 7300HQ i5-7300HQ, GeForce MX150, 41.4 Wh | Dell XPS 15 9570 Core i9 UHD i9-8950HK, GeForce GTX 1050 Ti Max-Q, 97 Wh | |
|---|---|---|---|---|---|---|
| Battery runtime | 14% | 58% | 61% | -33% | 30% | |
| WiFi v1.3 (h) | 6.6 | 7.5 14% | 10.4 58% | 10.6 61% | 4.4 -33% | 8.6 30% |
| Reader / Idle (h) | 14.1 | 15.5 | 30.2 | 15 | ||
| Load (h) | 1.7 | 2.3 | 2.1 | 1 |
Pros
Cons
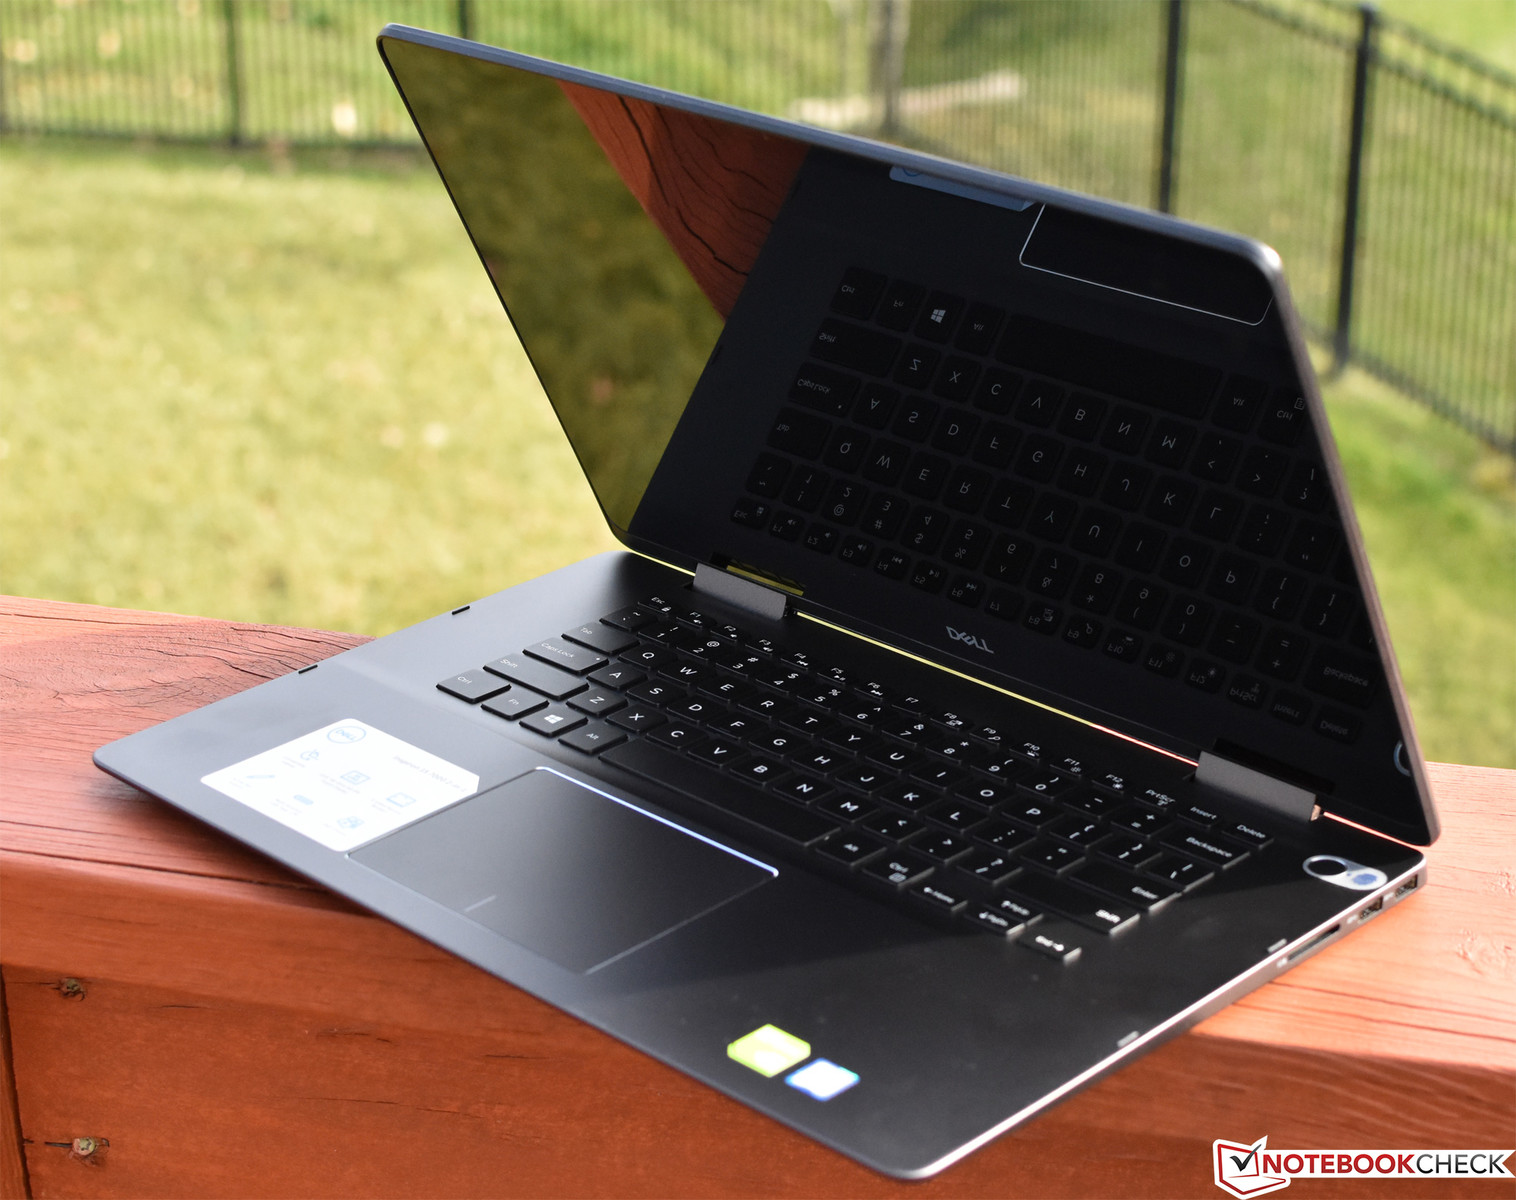
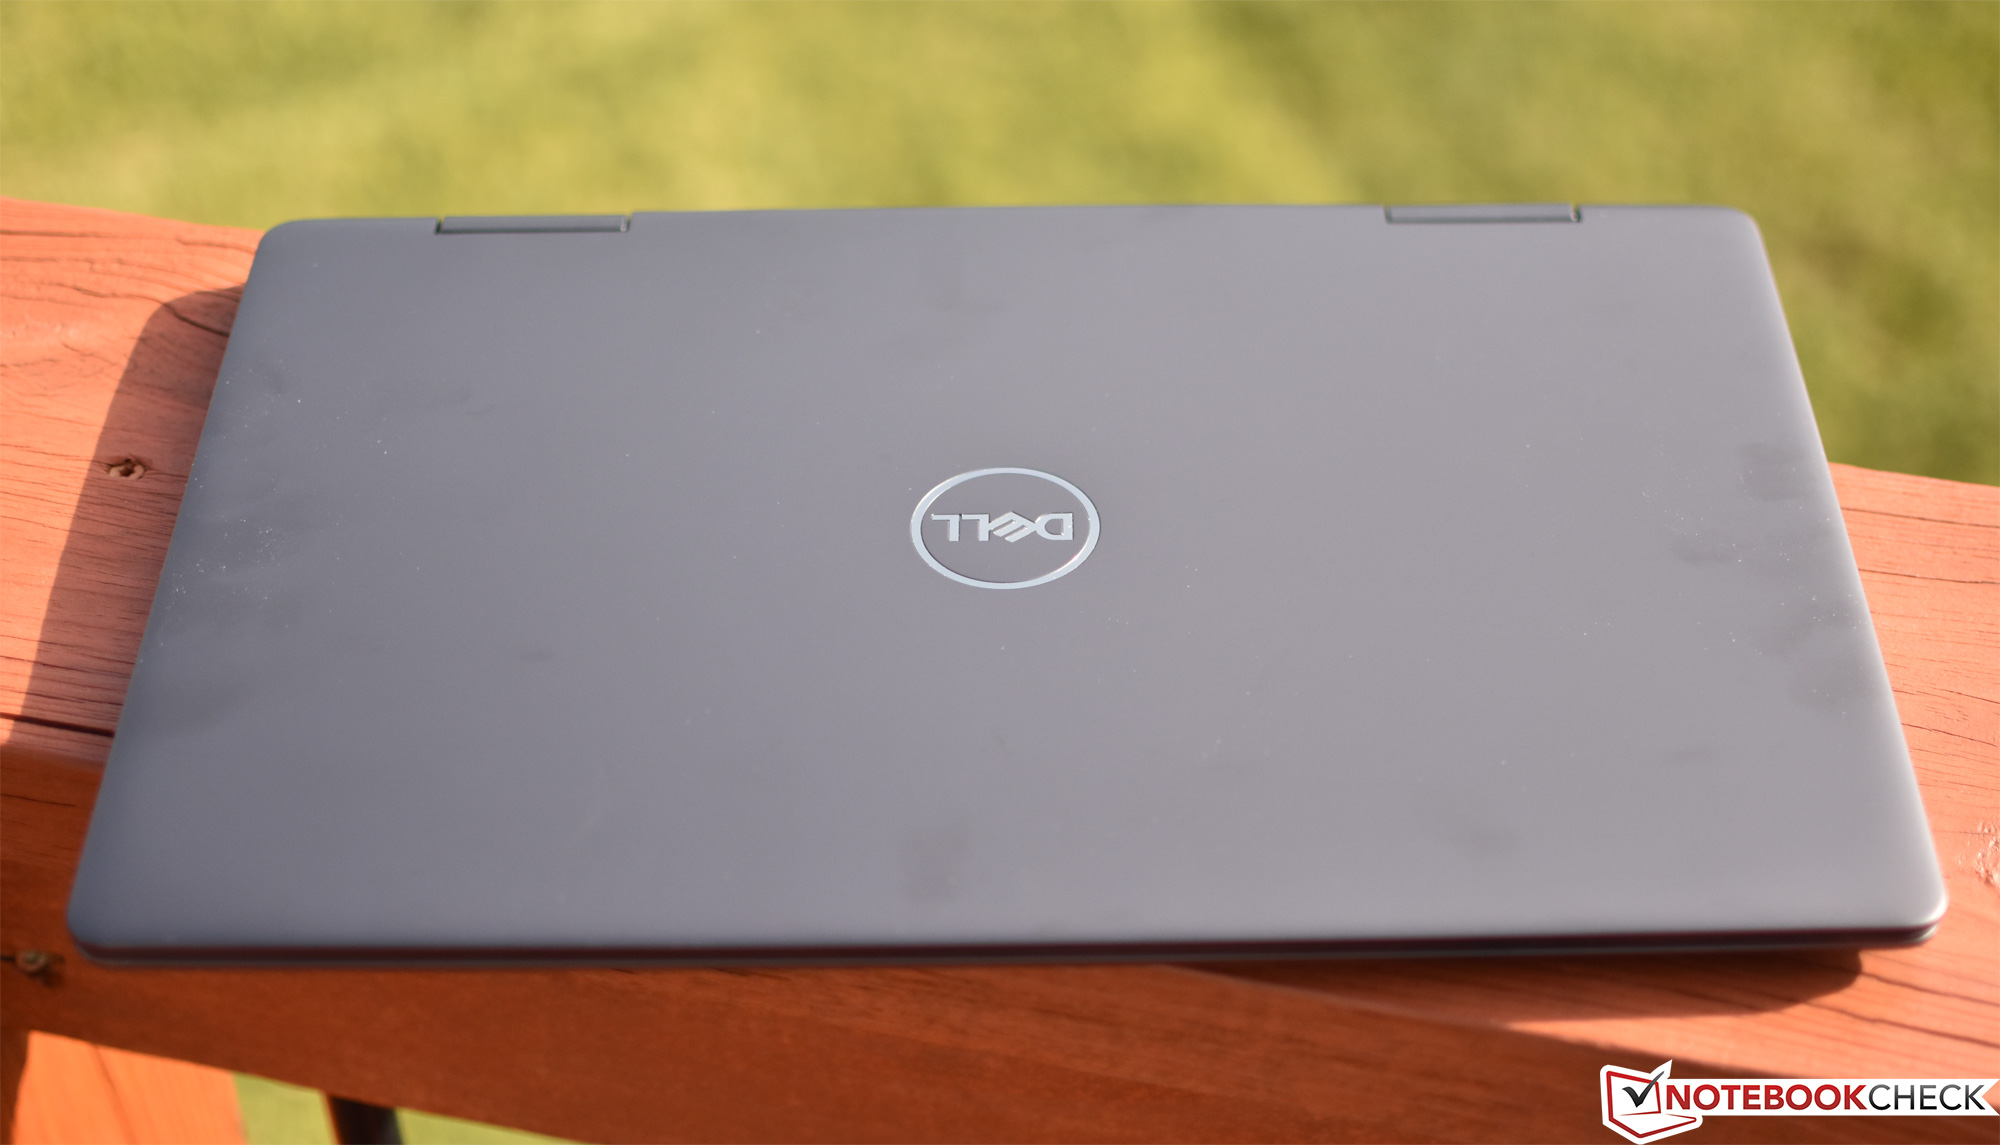
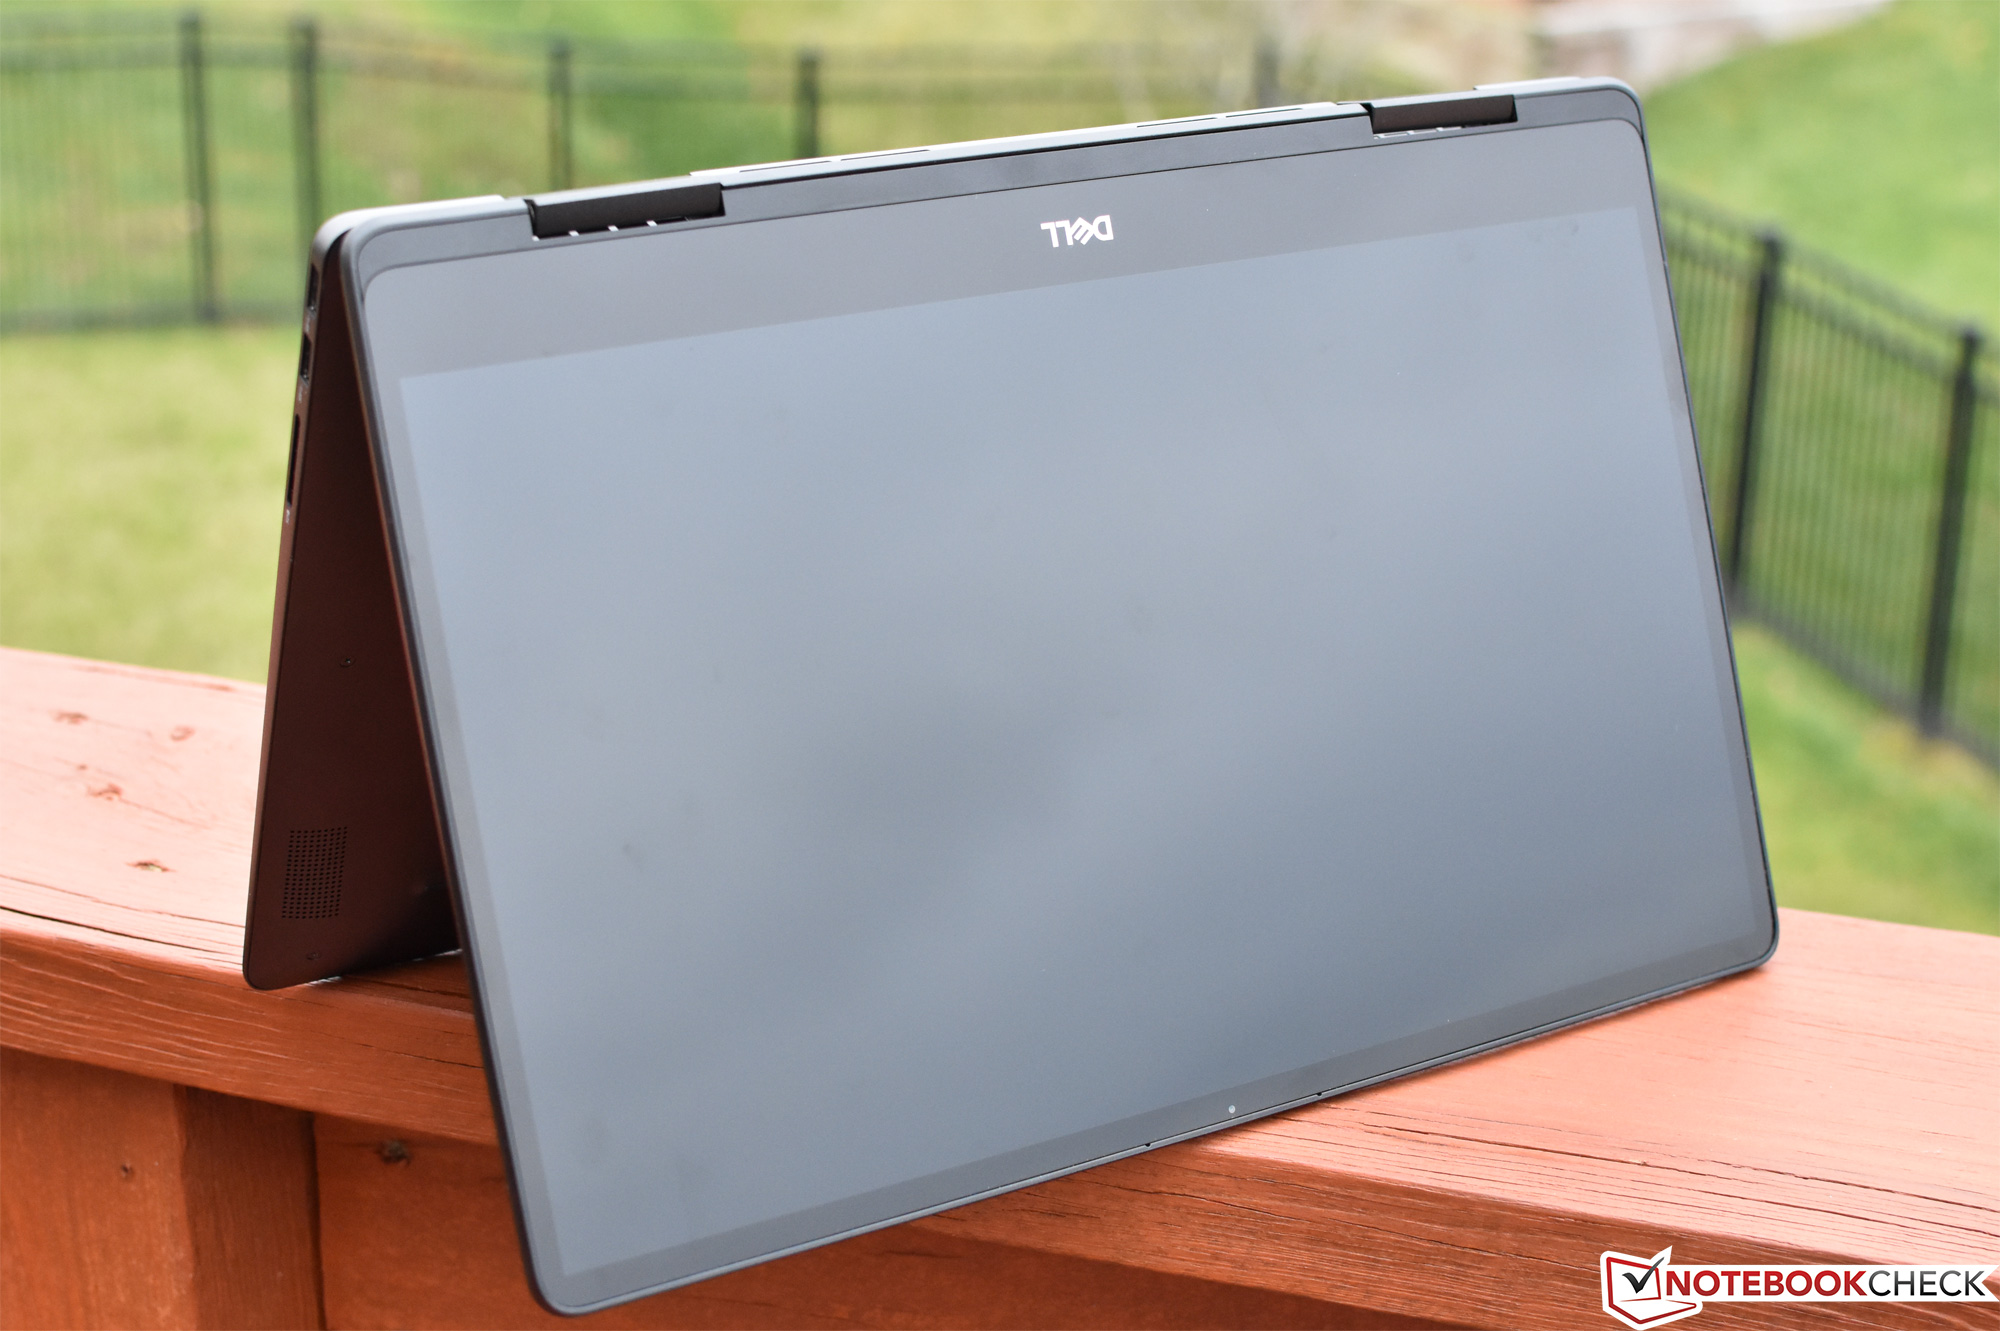
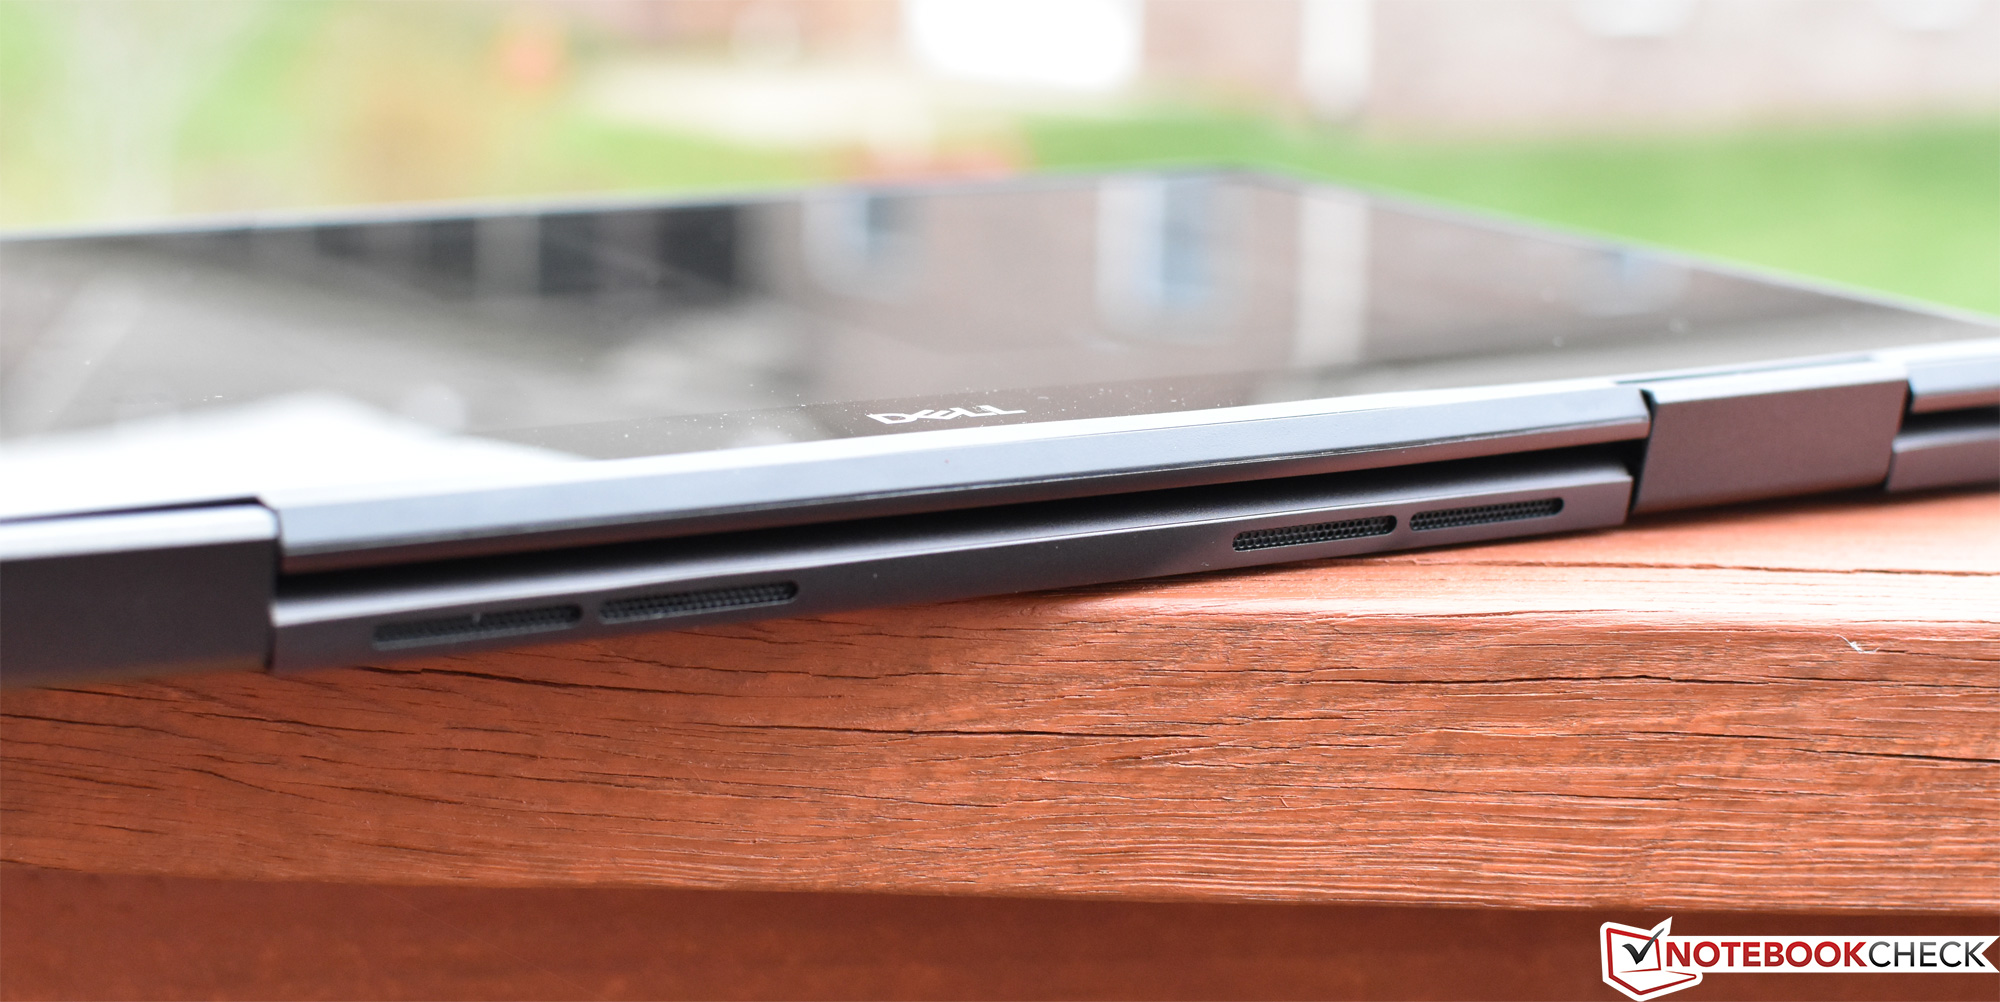
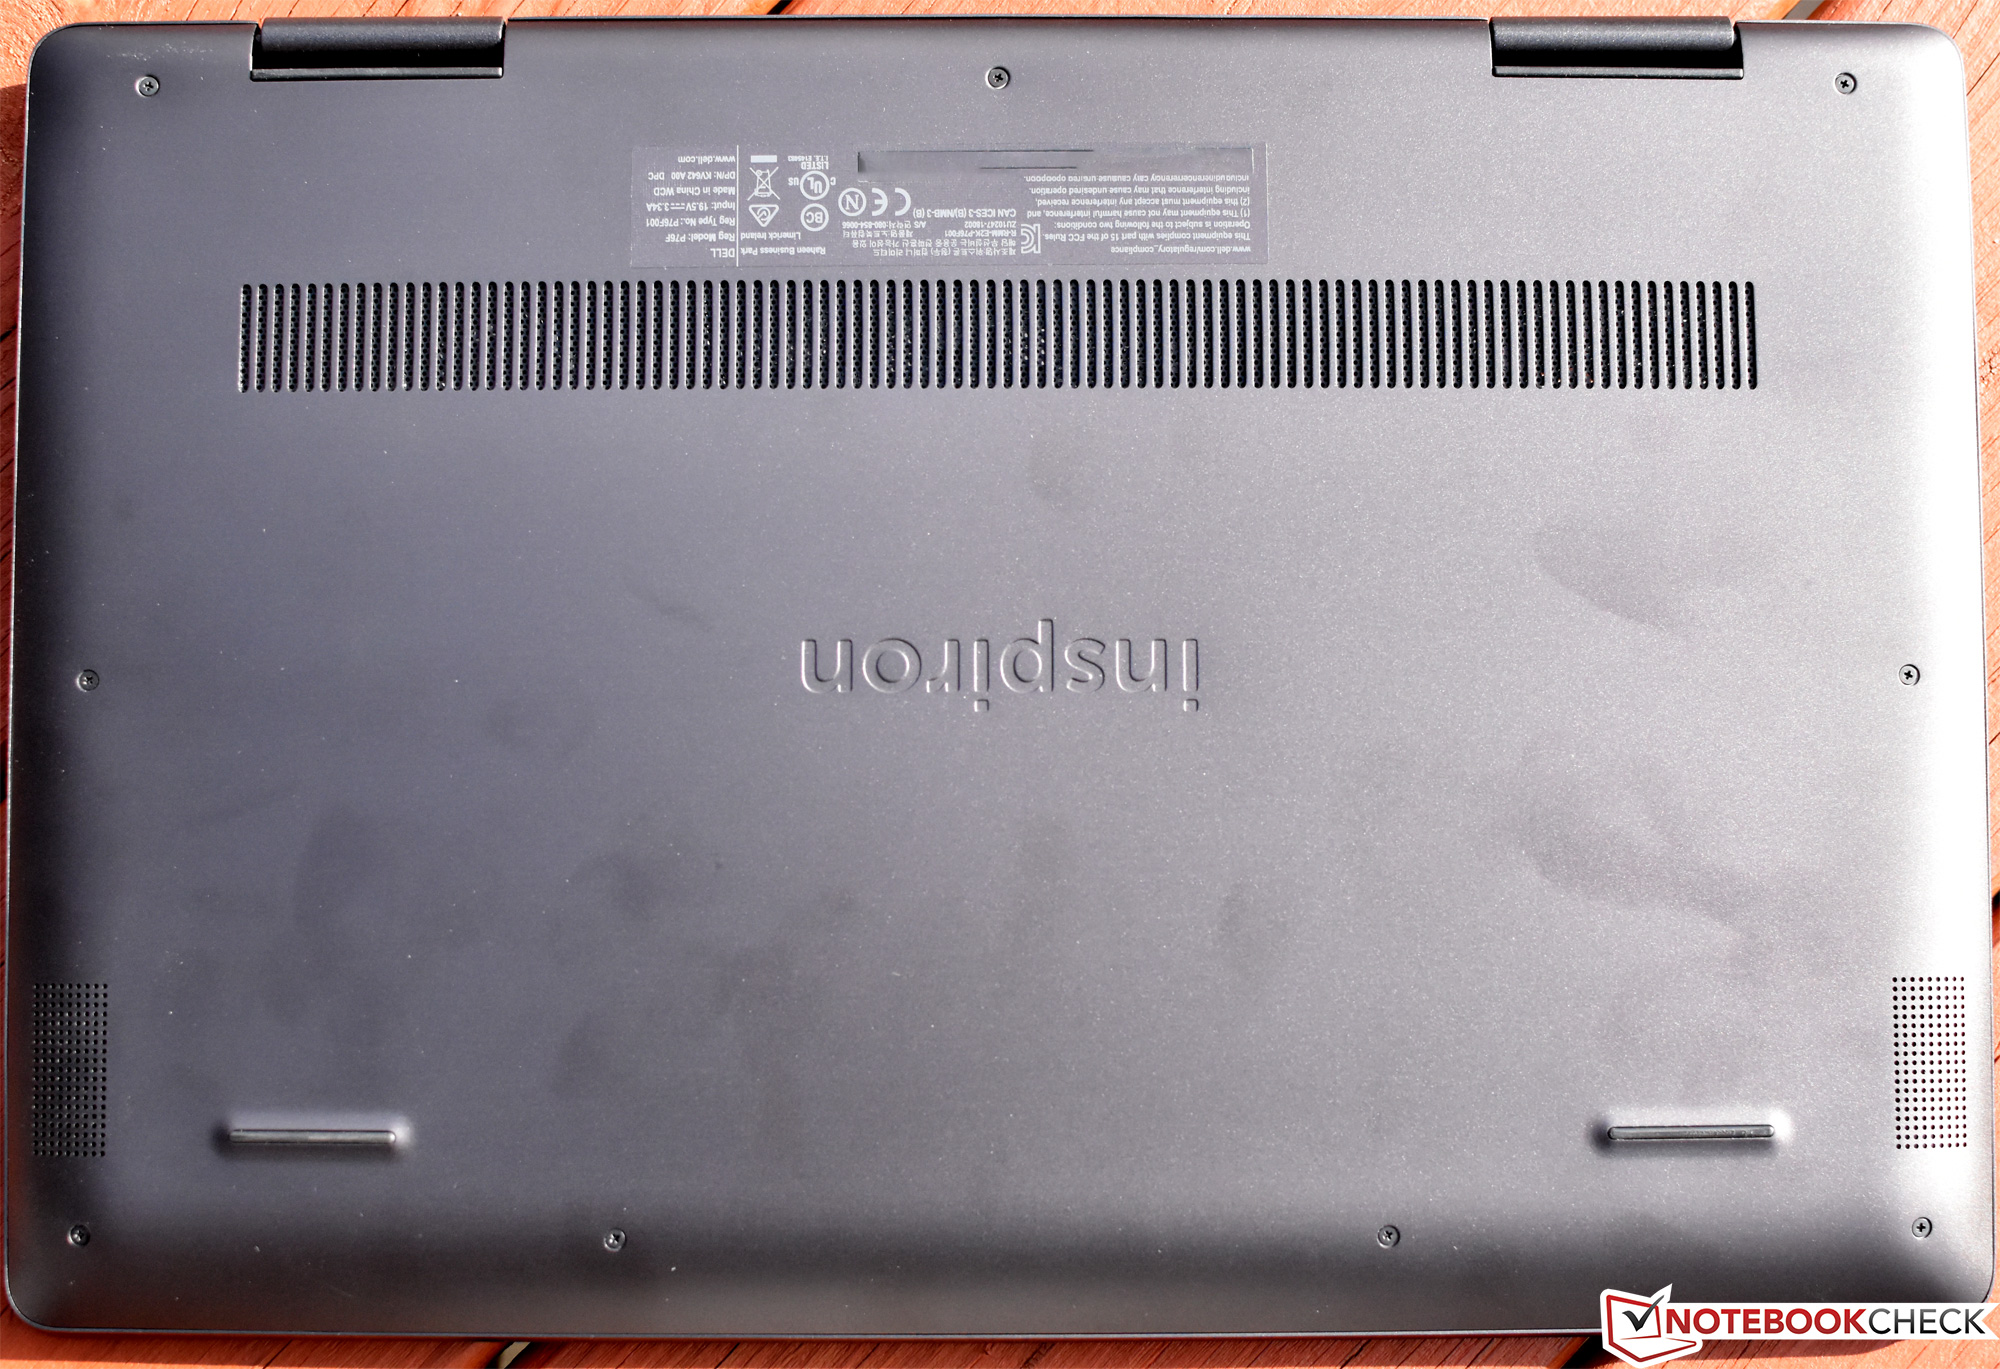
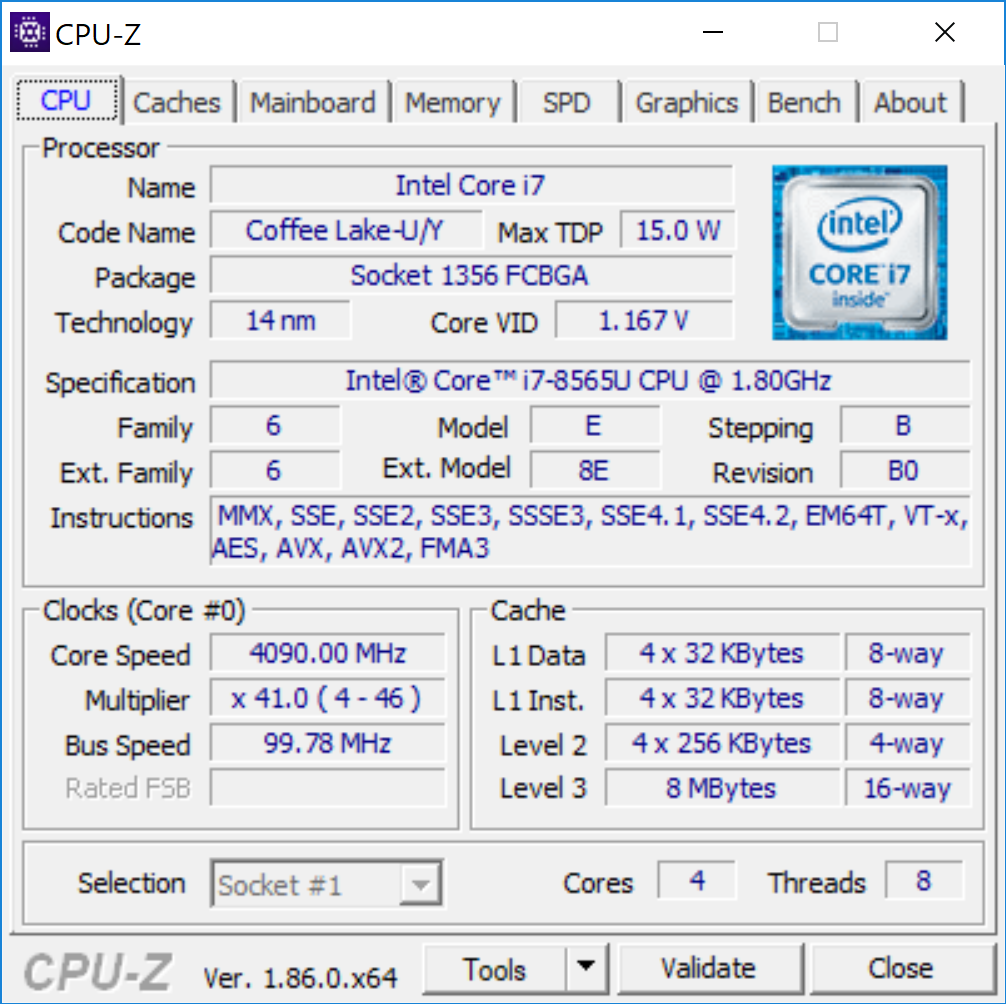
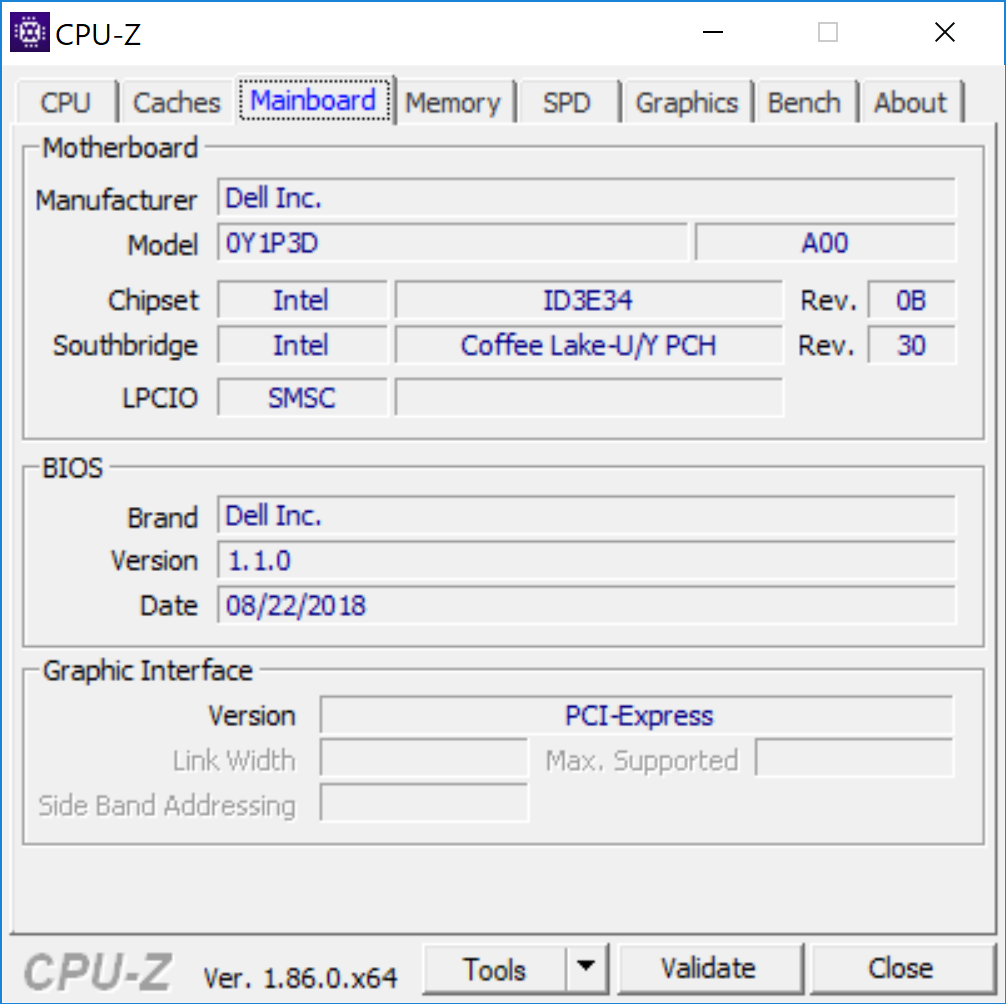
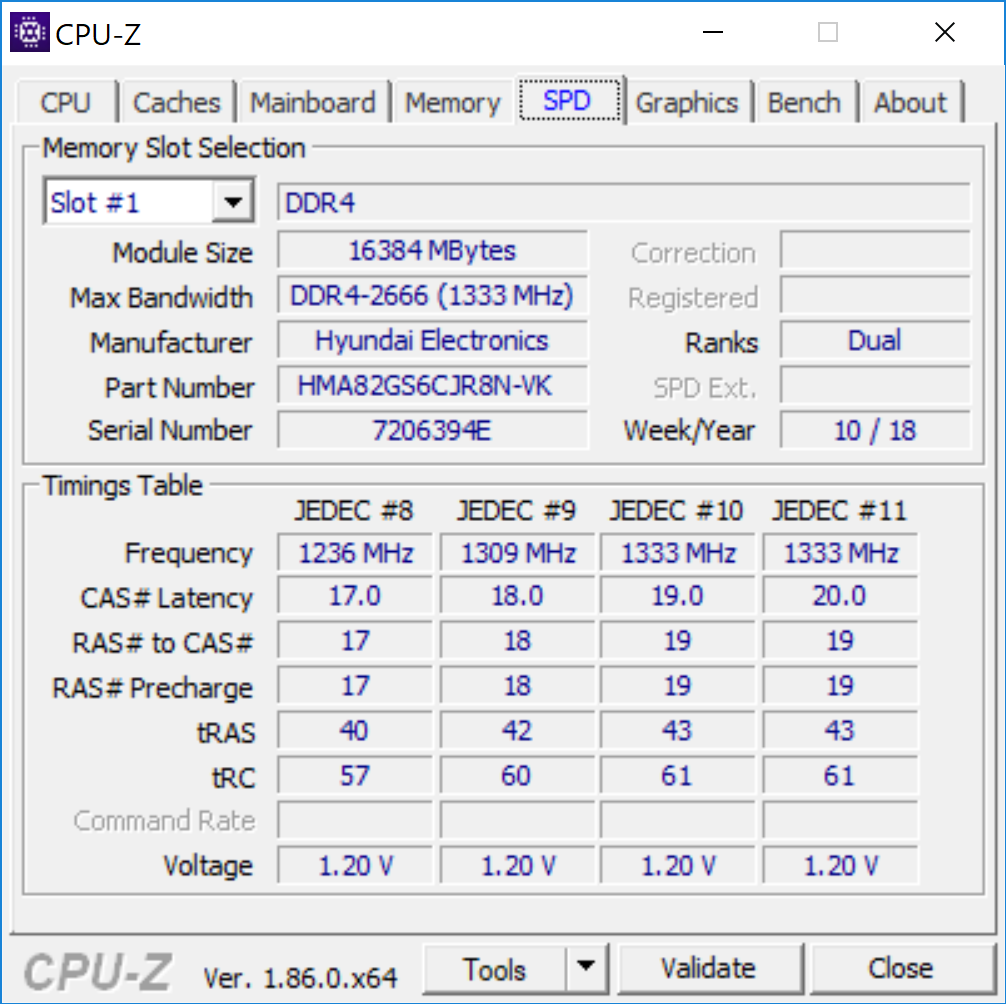
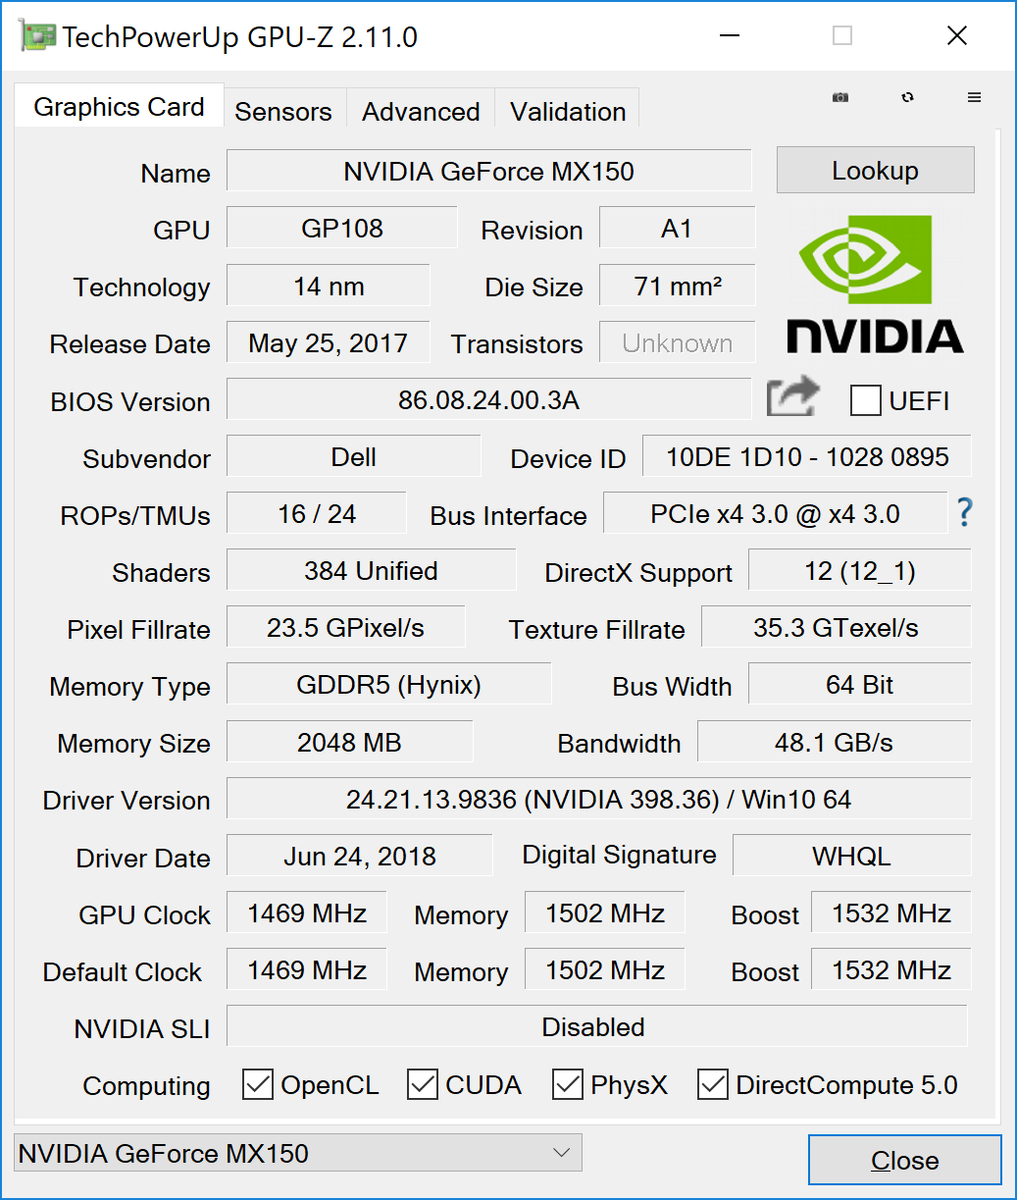
一点点灵越,一点点XPS,灵越15 7000二合一黑色版向其高端同行靠近,这不是我们通常从该品牌期望看到的。这在很大程度上是一个利好:在整体设计方面,从美学和实际角度来讲,升级后的全金属铝外壳尽管仍然和XPS不在同一个高度,但确实有所改观。该笔记本电脑还拥有相当强大的硬件配置,有着高端Core i7-8565U CPU,NVIDIA GeForce MX150入门级独显,16 GB DDR4 RAM和SSD。对于一台偶尔需要作为平板电脑使用的二合一笔记本,它有点大,但它作为标准笔记本电脑非常不错,所以多一个选择也无伤大雅。它也很容易维护和升级。
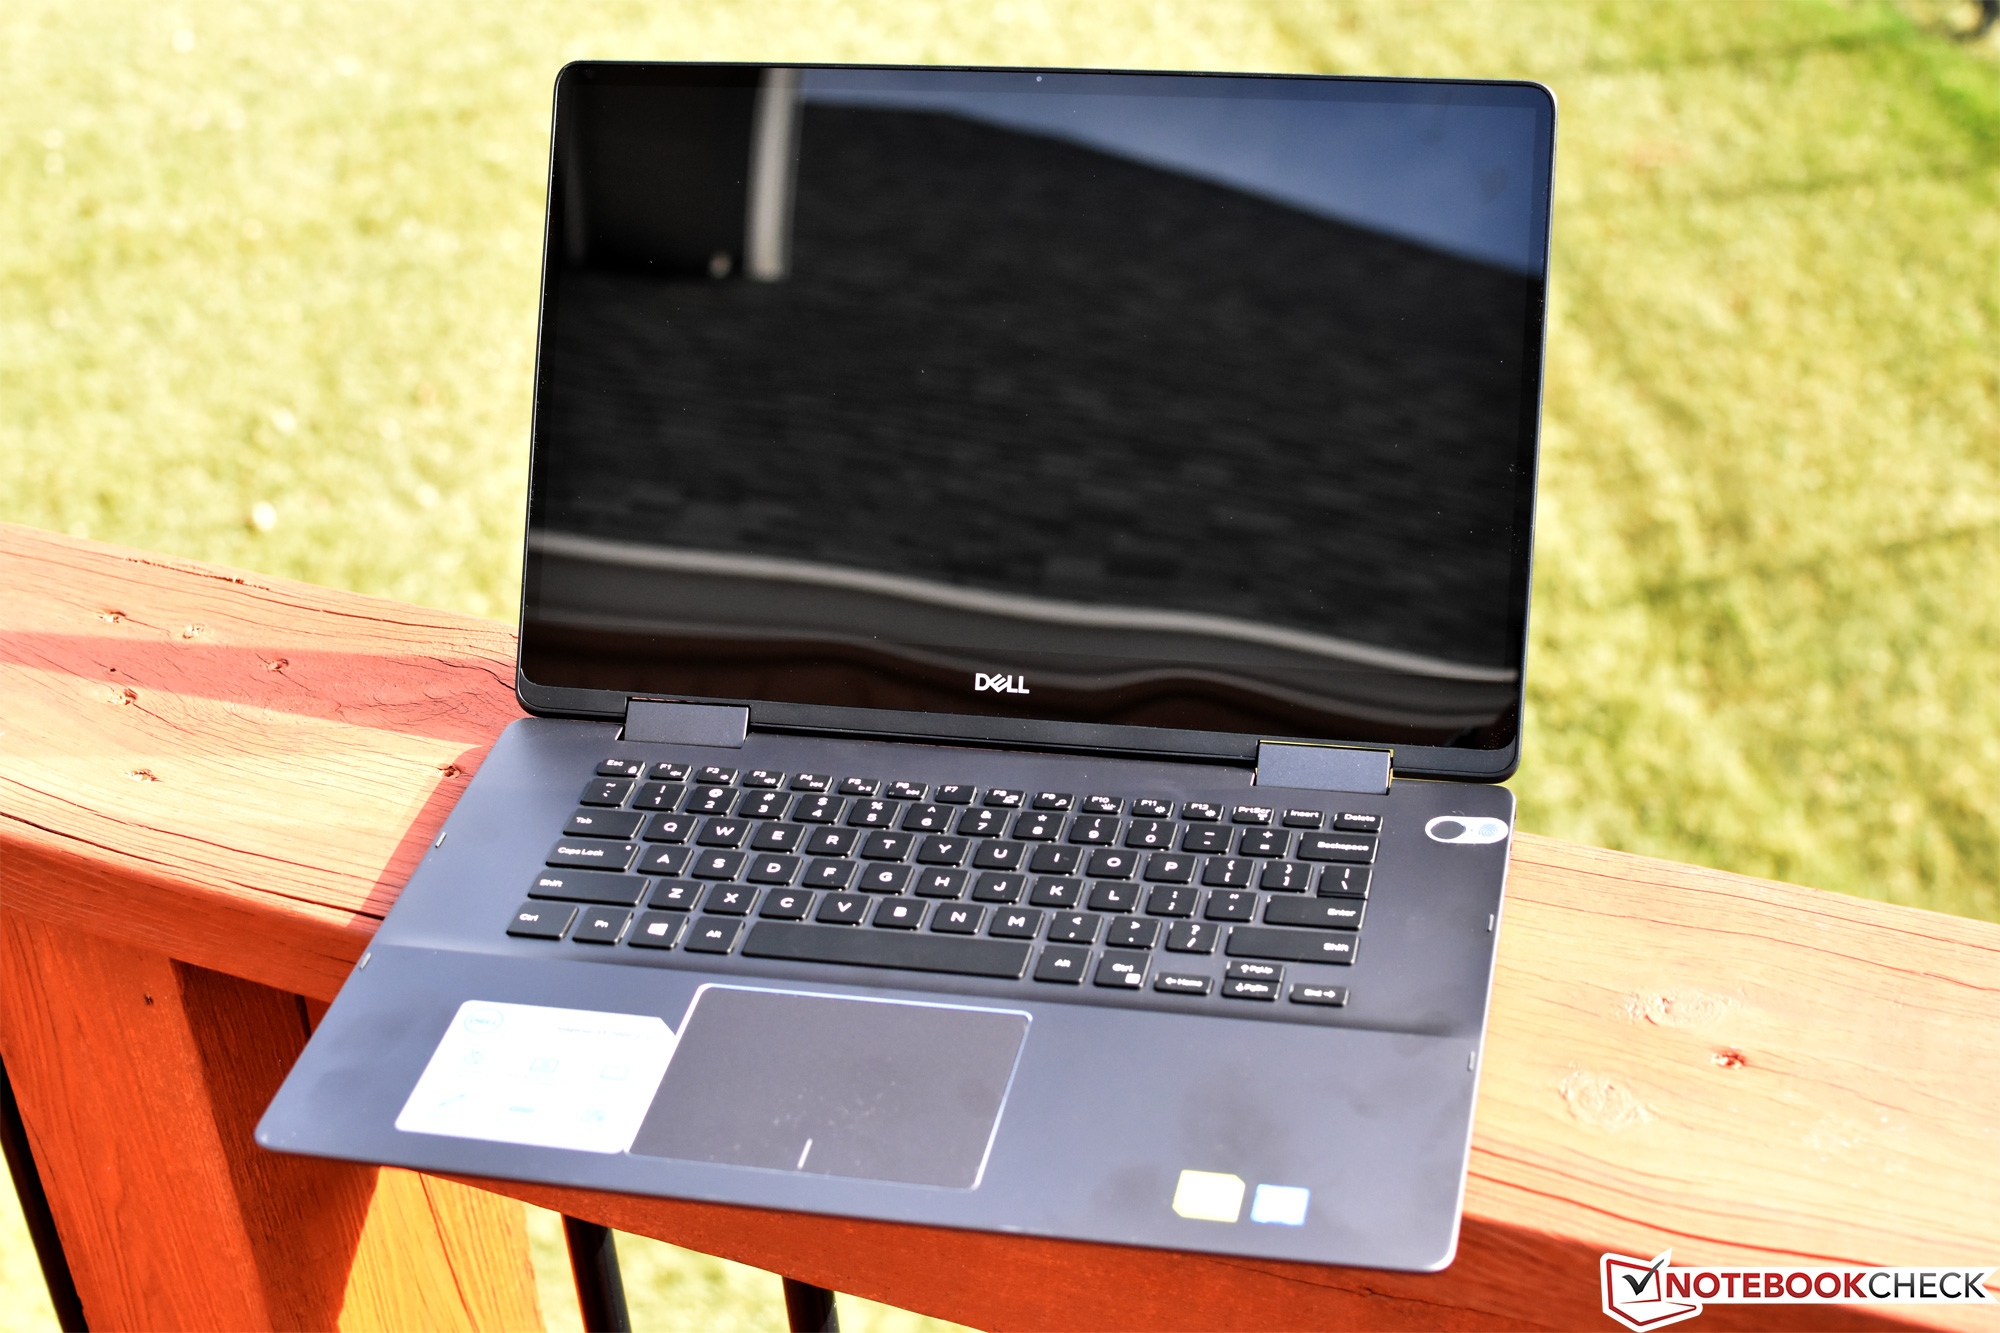
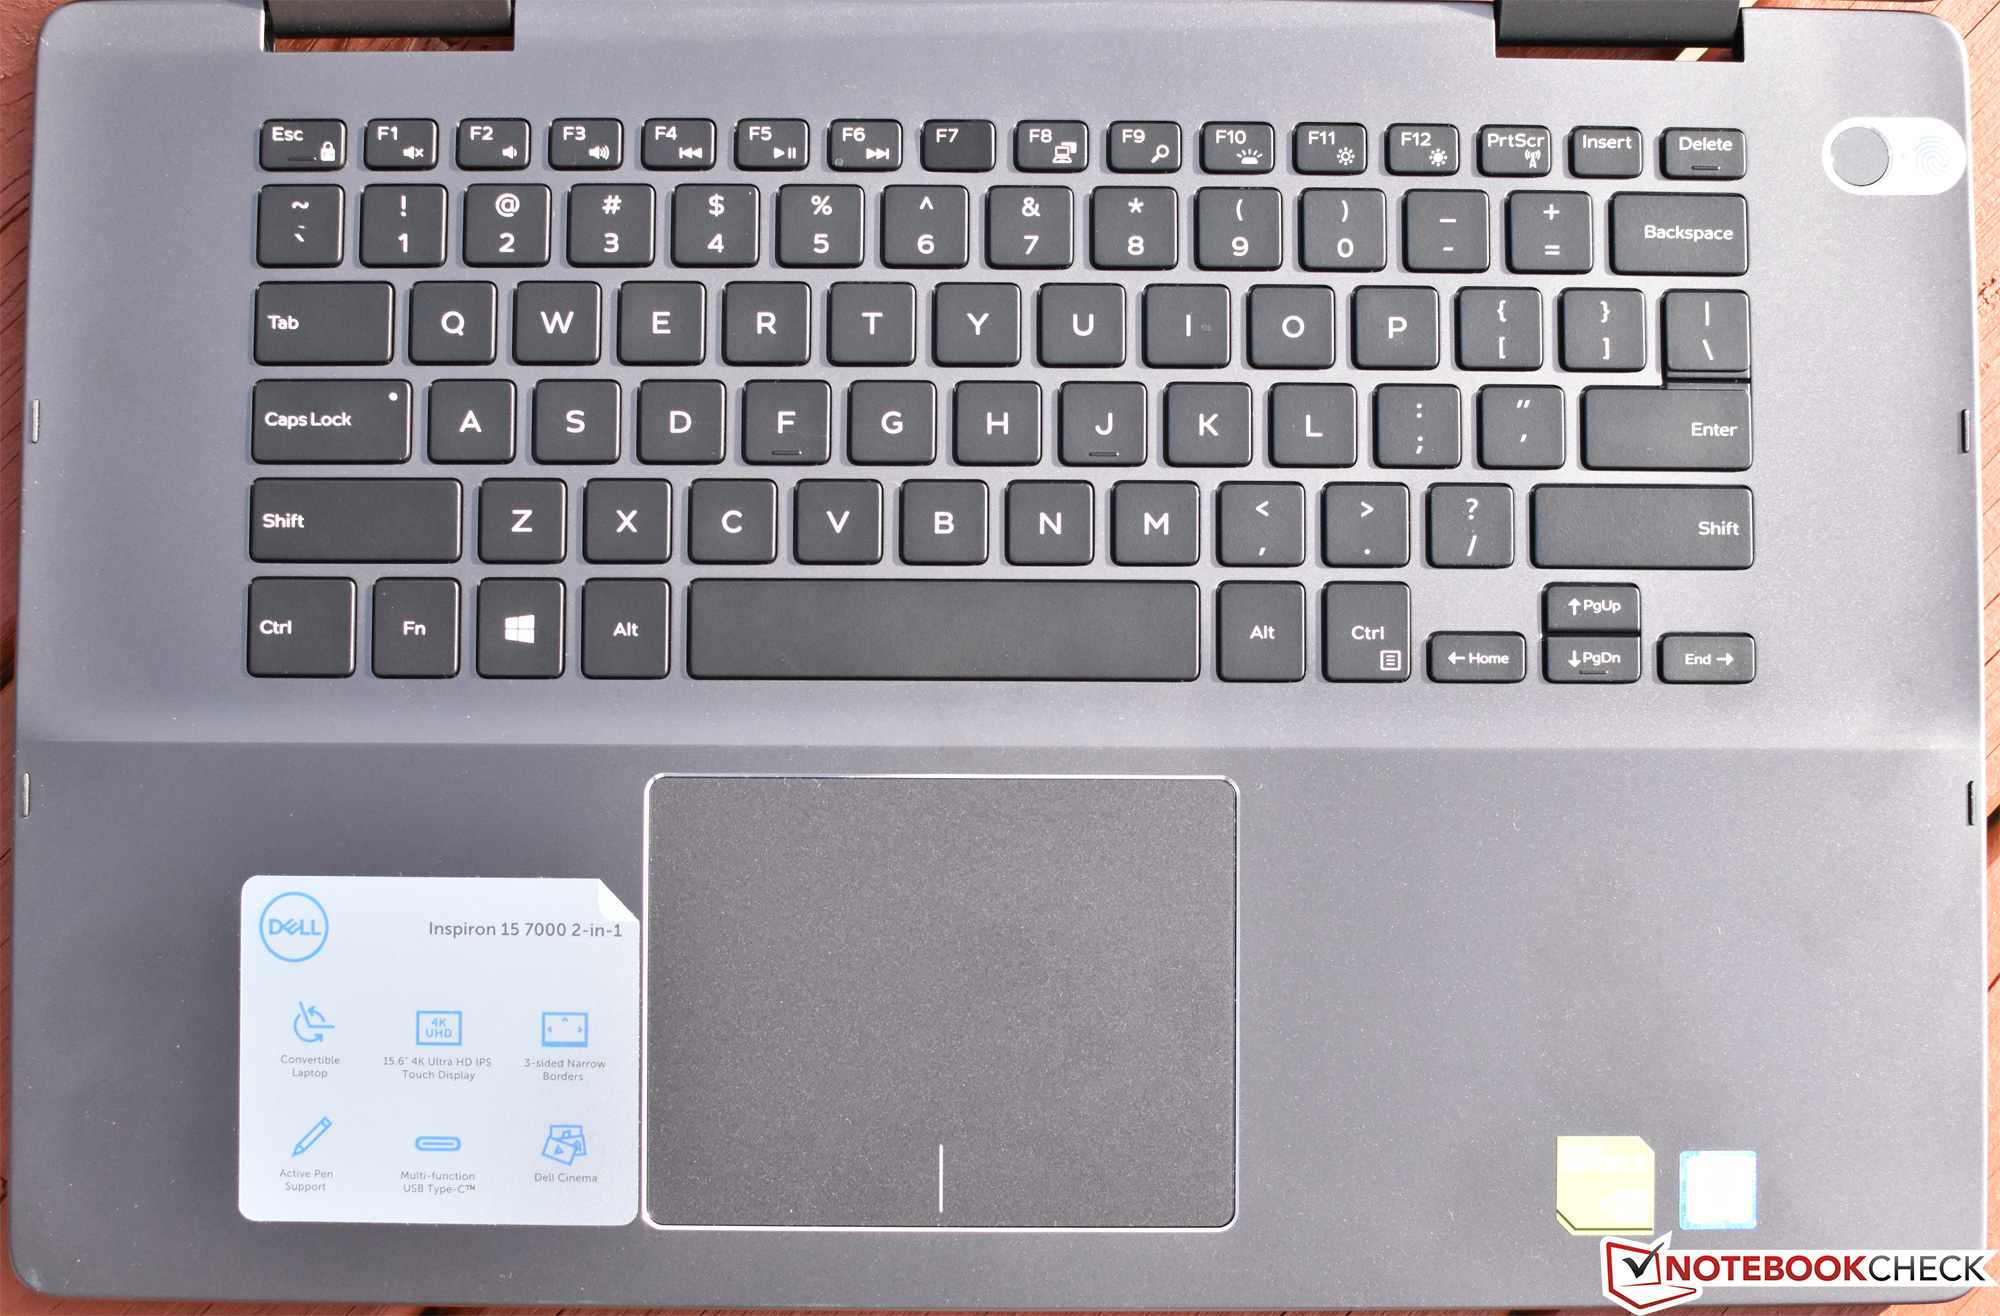
然而,尽管看起来很奢侈,但如果我们更加深入研究,确实会发现它与其高端兄弟的一些明显区别。对于入门玩家来说,输入设备与Dell XPS 15或HP Spectre x360没有可比性;键盘只是马马虎虎,触摸板尽管指向舒适,但是集成按键还是有些恼人。CPU性能适用于一般用途,但在持续负载下,我们的这台Core i7-8565U性能水平有明显下降。 MX150的GPU性能略高于平均水平,但当然,它与XPS 15没有可比性,XPS 15有着更强大的GTX 1050 Ti Max-Q。 NVMe SSD与大多数其他NVMe硬盘实际上并不是同一个级别,写入速度较慢。续航相对较短,主要是因为电池尺寸不够大。最后,虽然这个问题不仅仅灵越有,在安静的房间里电噪声仍然明显。
“是的,9000元人民币,这个价格对于主流娱乐电脑来说有点贵,但是虽然价格较高,质量水平也是如此,无可争议且有形。”
在其他地方,这台机器非常平衡。 对于配备这些部件的笔记本电脑来说,功耗非常低,温度几乎在可控范围内,扬声器非常不错,而且即使屏幕的亮度和对比度仅仅是平均左右,色彩却很鲜艳且极具吸引力。这个价格,高端型号也值得考虑,例如戴尔XPS 15或HP Spectre x360,所以在你做出决定之前先看看这两款机型。但就大多数情况而言,灵越虽然在输入设备,电池寿命和最佳性能预期方面都有一些粗糙,它仍然是日常家用电脑的理想选择。
Dell Inspiron 15 7000 2-in-1 Black Edition
- 12/05/2018 v6 (old)
Steve Schardein
Price comparison

