荣耀Magicbook (英特尔 i5-8250U版 对比 AMD Ryzen 5 2500U版)笔记本电脑评测

| Networking | |
| iperf3 transmit AX12 | |
| Acer Swift 3 SF314-52G-89SL | |
| Honor Magicbook | |
| HP ProBook 440 G5-3KX87ES | |
| Honor Magicbook | |
| Lenovo ThinkPad E480-20KQS00000 | |
| Dell Latitude 3490 | |
| Lenovo IdeaPad 530s-14IKB | |
| HP Pavilion 14-ce0002ng | |
| HP 14-ma0312ng | |
| iperf3 receive AX12 | |
| Lenovo ThinkPad E480-20KQS00000 | |
| HP ProBook 440 G5-3KX87ES | |
| Dell Latitude 3490 | |
| Honor Magicbook | |
| Honor Magicbook | |
| Lenovo IdeaPad 530s-14IKB | |
| HP Pavilion 14-ce0002ng | |
| Acer Swift 3 SF314-52G-89SL | |
| HP 14-ma0312ng | |
Magicbook (Intel i5-8250U)
| |||||||||||||||||||||||||
Brightness Distribution: 86 %
Center on Battery: 287 cd/m²
Contrast: 1367:1 (Black: 0.21 cd/m²)
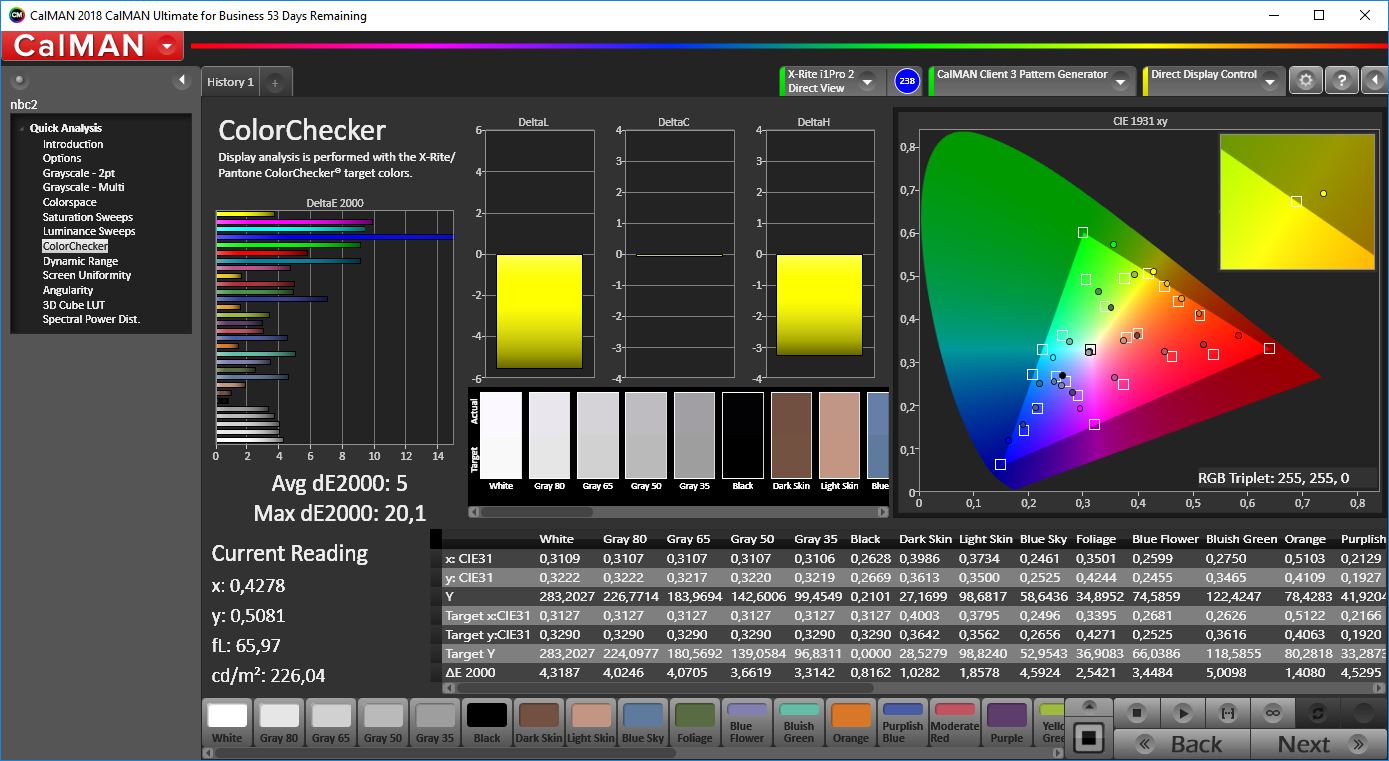
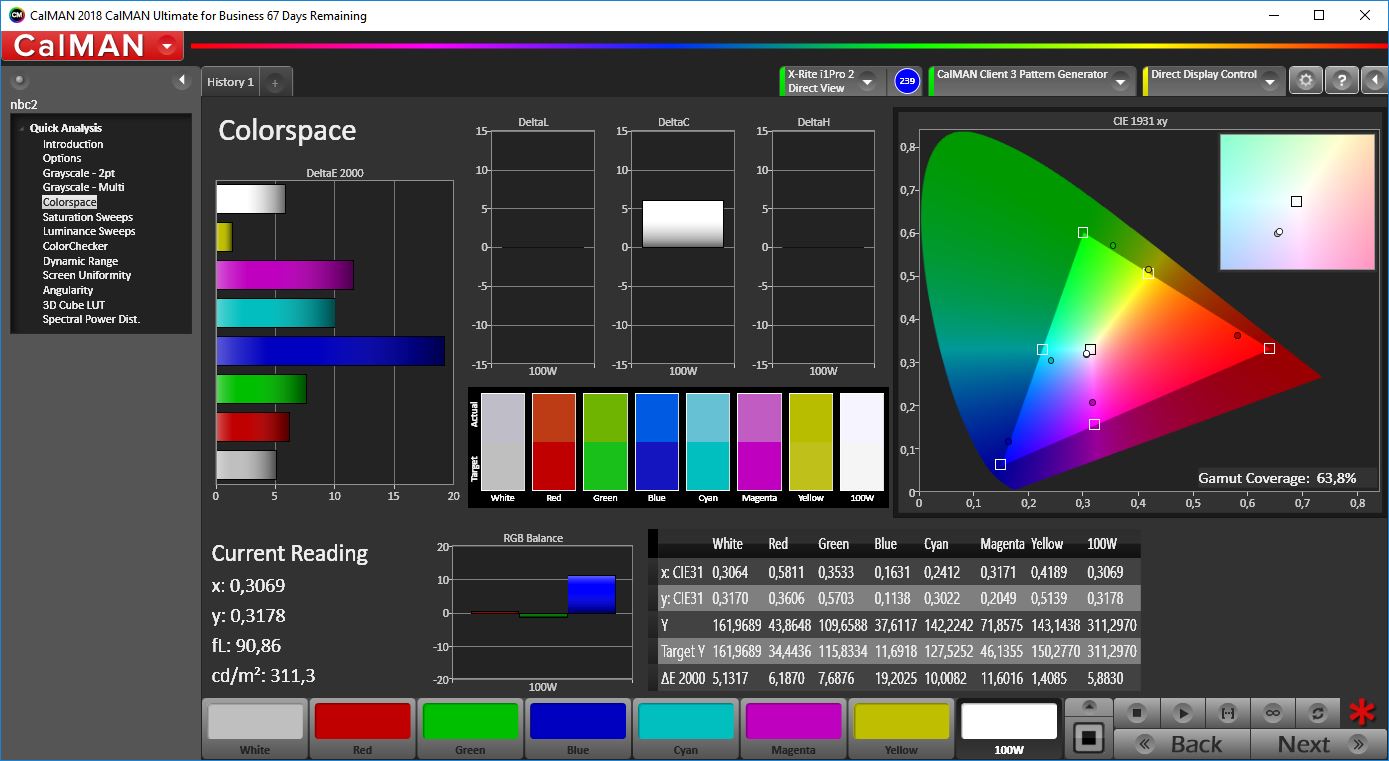
ΔE ColorChecker Calman: 5 | ∀{0.5-29.43 Ø4.71}
calibrated: 4.5
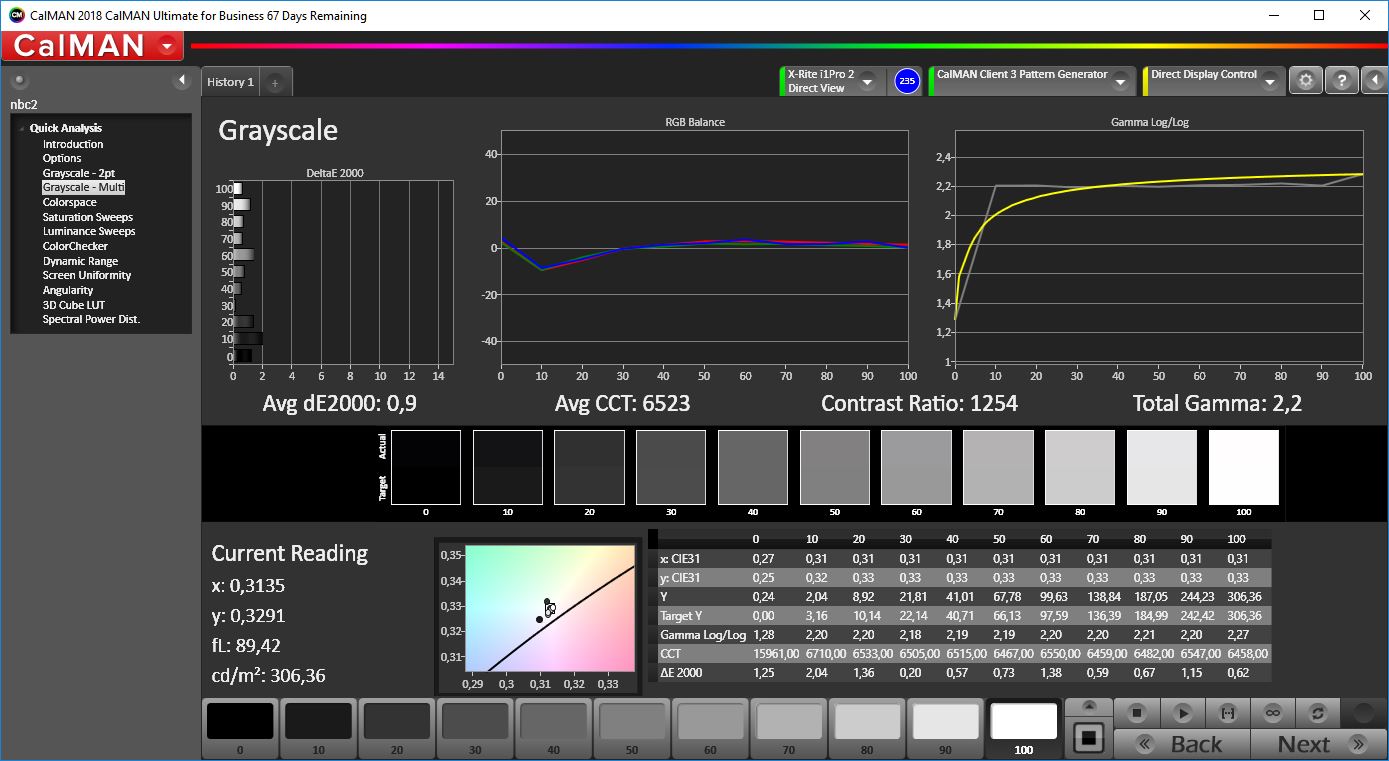
ΔE Greyscale Calman: 2.7 | ∀{0.09-98 Ø4.96}
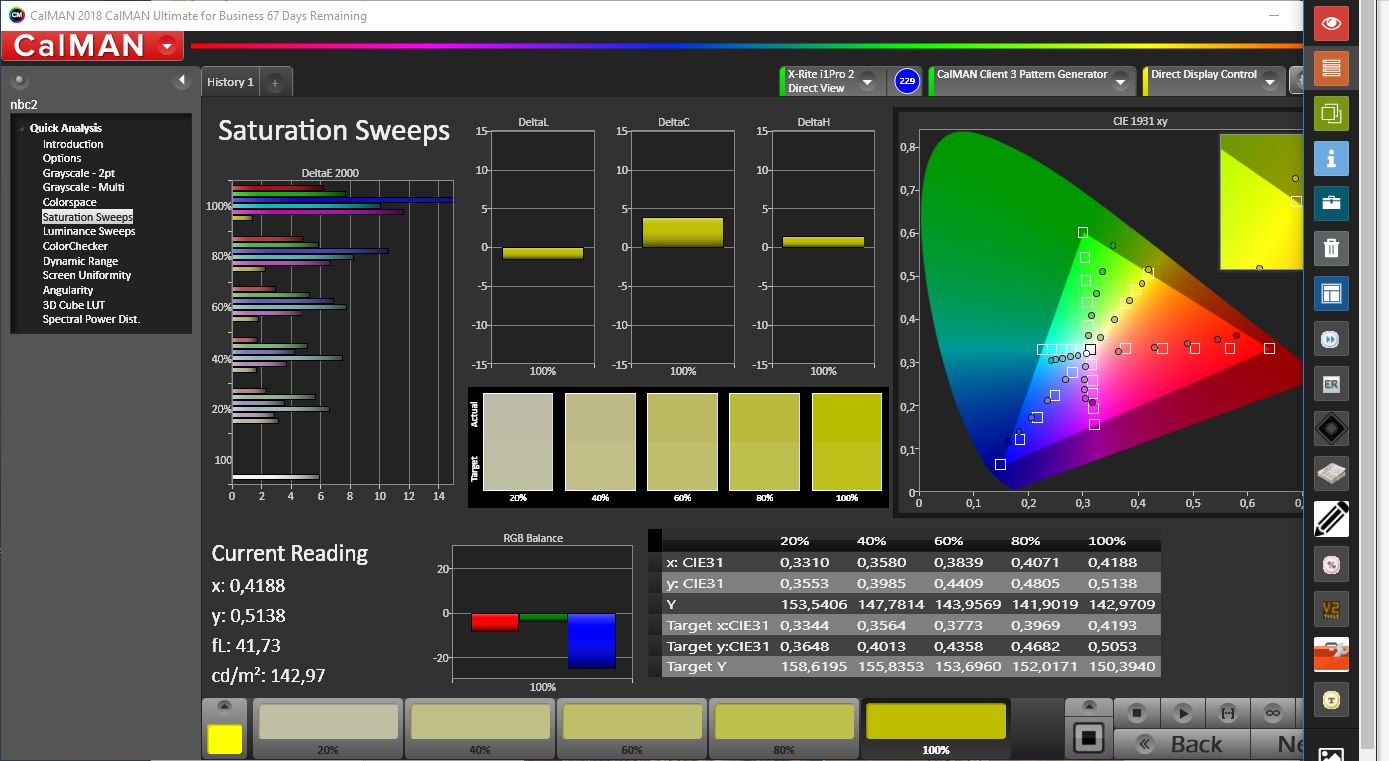
63.2% sRGB (Calman 2D)
62.66% sRGB (Argyll 1.6.3 3D)
40.59% AdobeRGB 1998 (Argyll 1.6.3 3D)
44.52% AdobeRGB 1998 (Argyll 3D)
63.1% sRGB (Argyll 3D)
43.09% Display P3 (Argyll 3D)
Gamma: 2.18
CCT: 6653 K
Magicbook (AMD 2500U)
| |||||||||||||||||||||||||
Brightness Distribution: 90 %
Center on Battery: 318 cd/m²
Contrast: 1223:1 (Black: 0.26 cd/m²)
ΔE ColorChecker Calman: 5.3 | ∀{0.5-29.43 Ø4.71}
calibrated: 4.2
ΔE Greyscale Calman: 4 | ∀{0.09-98 Ø4.96}
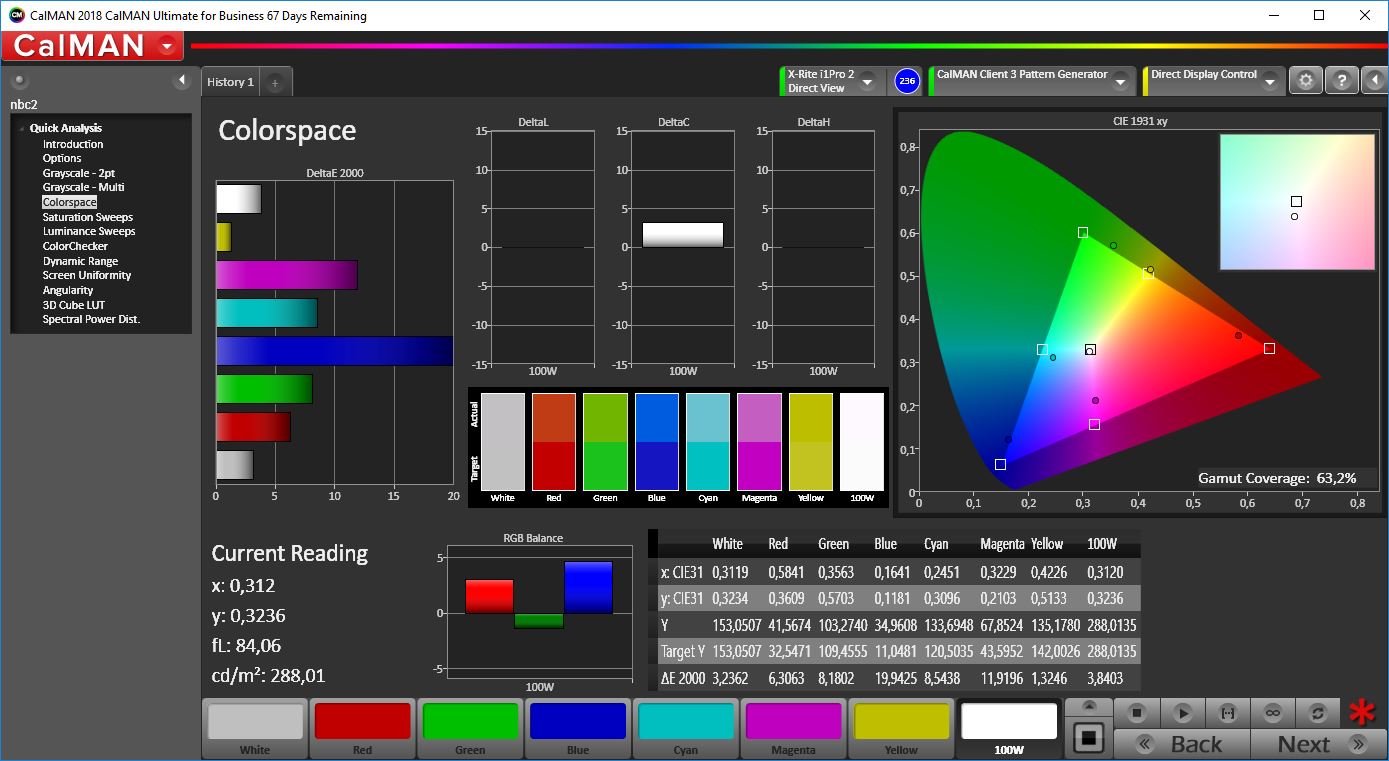
63.8% sRGB (Calman 2D)
65.31% sRGB (Argyll 1.6.3 3D)
42.23% AdobeRGB 1998 (Argyll 1.6.3 3D)
46.07% AdobeRGB 1998 (Argyll 3D)
65.7% sRGB (Argyll 3D)
44.59% Display P3 (Argyll 3D)
Gamma: 2.23
CCT: 6991 K
| Honor Magicbook i5-8250U, BEO0764 (TV140FHM-NH0), IPS LED, 1920x1080, 14" | Honor Magicbook R5 2500U, BOE0764 (TV140FHM-NH0), , 1920x1080, 14" | HP 14-ma0312ng i5-8250U, AU Optronics B140XTN07.2, TN LED, 1366x768, 14" | Acer Swift 3 SF314-52G-89SL i5-8550U, AU Optronics B140HAN02.1, IPS, 1920x1080, 14" | HP Pavilion 14-ce0002ng i5-8550U, BOE072C, IPS, 1920x1080, 14" | Dell Latitude 3490 i5-8250U, LP140WF6 / LGD059D, IPS LED, 1920x1080, 14" | Lenovo IdeaPad 530s-14IKB i5-8550U, AUO B140QAN02.3, IPS, 2560x1440, 14" | HP ProBook 440 G5-3KX87ES i5-8250U, LGD04B2, IPS LED, 1920x1080, 14" | Lenovo ThinkPad E480-20KQS00000 i5-8250U, Innolux N140HCA-EAC, IPS LED, 1920x1080, 14" | |
|---|---|---|---|---|---|---|---|---|---|
| Display | 3% | -8% | -15% | -7% | -7% | 51% | -7% | -2% | |
| Display P3 Coverage (%) | 43.09 | 44.59 3% | 39.31 -9% | 36.09 -16% | 39.64 -8% | 39.81 -8% | 65.5 52% | 39.56 -8% | 41.88 -3% |
| sRGB Coverage (%) | 63.1 | 65.7 4% | 59.2 -6% | 54.2 -14% | 59.3 -6% | 59.6 -6% | 96.2 52% | 59.3 -6% | 62.8 0% |
| AdobeRGB 1998 Coverage (%) | 44.52 | 46.07 3% | 40.61 -9% | 37.28 -16% | 40.96 -8% | 41.16 -8% | 66.1 48% | 40.88 -8% | 43.29 -3% |
| Response Times | -1% | 31% | 16% | 8% | 23% | -14% | 11% | 3% | |
| Response Time Grey 50% / Grey 80% * (ms) | 44.4 ? | 44.8 ? -1% | 40 ? 10% | 41 ? 8% | 40 ? 10% | 36.4 ? 18% | 58.4 ? -32% | 40 ? 10% | 44 ? 1% |
| Response Time Black / White * (ms) | 32.8 ? | 32.8 ? -0% | 16 ? 51% | 25 ? 24% | 31 ? 5% | 24 ? 27% | 31.2 ? 5% | 28.8 ? 12% | 31.2 ? 5% |
| PWM Frequency (Hz) | 200 ? | 200 ? | 200 ? | 24880 ? | |||||
| Screen | -4% | -99% | -19% | -15% | -14% | 0% | -17% | -5% | |
| Brightness middle (cd/m²) | 287 | 318 11% | 240 -16% | 233 -19% | 239 -17% | 250 -13% | 311 8% | 236 -18% | 251 -13% |
| Brightness (cd/m²) | 273 | 308 13% | 216 -21% | 217 -21% | 223 -18% | 241 -12% | 293 7% | 221 -19% | 231 -15% |
| Brightness Distribution (%) | 86 | 90 5% | 84 -2% | 88 2% | 88 2% | 81 -6% | 85 -1% | 88 2% | 80 -7% |
| Black Level * (cd/m²) | 0.21 | 0.26 -24% | 0.56 -167% | 0.27 -29% | 0.27 -29% | 0.25 -19% | 0.2 5% | 0.26 -24% | 0.19 10% |
| Contrast (:1) | 1367 | 1223 -11% | 429 -69% | 863 -37% | 885 -35% | 1000 -27% | 1555 14% | 908 -34% | 1321 -3% |
| Colorchecker dE 2000 * | 5 | 5.3 -6% | 13.14 -163% | 5.85 -17% | 5.3 -6% | 5.5 -10% | 6 -20% | 5.7 -14% | 5.1 -2% |
| Colorchecker dE 2000 max. * | 20.1 | 19.3 4% | 21.06 -5% | 11.51 43% | 10.03 50% | 23.5 -17% | 11.6 42% | 22 -9% | 10.6 47% |
| Colorchecker dE 2000 calibrated * | 4.5 | 4.2 7% | 12.71 -182% | 3.64 19% | 4.8 -7% | 1.6 64% | |||
| Greyscale dE 2000 * | 2.7 | 4 -48% | 14.89 -451% | 4.87 -80% | 5.85 -117% | 3.5 -30% | 8.7 -222% | 3.8 -41% | 4.5 -67% |
| Gamma | 2.18 101% | 2.23 99% | 2.62 84% | 2.47 89% | 2.45 90% | 2.27 97% | 2.19 100% | 2.1 105% | 2.18 101% |
| CCT | 6653 98% | 6991 93% | 19625 33% | 6908 94% | 7169 91% | 7049 92% | 8426 77% | 7318 89% | 6146 106% |
| Color Space (Percent of AdobeRGB 1998) (%) | 40.59 | 42.23 4% | 38 -6% | 34 -16% | 38 -6% | 37.9 -7% | 60.9 50% | 37.7 -7% | 39.8 -2% |
| Color Space (Percent of sRGB) (%) | 62.66 | 65.31 4% | 59 -6% | 54 -14% | 59 -6% | 59.4 -5% | 96 53% | 59.2 -6% | 62.5 0% |
| Total Average (Program / Settings) | -1% /
-2% | -25% /
-66% | -6% /
-13% | -5% /
-11% | 1% /
-8% | 12% /
8% | -4% /
-11% | -1% /
-3% |
* ... smaller is better
Magicbook (Intel i5-8250U)


Magicbook (AMD 2500U)

Magicbook (Intel i5-8250U)
Display Response Times
| ↔ Response Time Black to White | ||
|---|---|---|
| 32.8 ms ... rise ↗ and fall ↘ combined | ↗ 18 ms rise |  |
| ↘ 14.8 ms fall | ||
| The screen shows slow response rates in our tests and will be unsatisfactory for gamers. In comparison, all tested devices range from 0.1 (minimum) to 240 (maximum) ms. » 88 % of all devices are better. This means that the measured response time is worse than the average of all tested devices (19.8 ms). | ||
| ↔ Response Time 50% Grey to 80% Grey | ||
| 44.4 ms ... rise ↗ and fall ↘ combined | ↗ 23.2 ms rise | 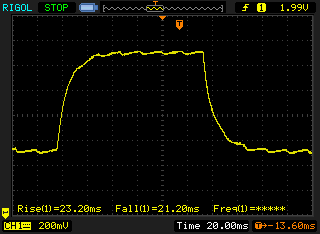 |
| ↘ 21.2 ms fall | ||
| The screen shows slow response rates in our tests and will be unsatisfactory for gamers. In comparison, all tested devices range from 0.165 (minimum) to 636 (maximum) ms. » 76 % of all devices are better. This means that the measured response time is worse than the average of all tested devices (30.9 ms). | ||
Screen Flickering / PWM (Pulse-Width Modulation)
| Screen flickering / PWM detected | 200 Hz | ≤ 100 % brightness setting | 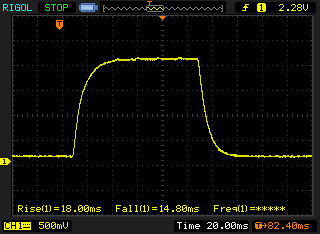 |
The display backlight flickers at 200 Hz (worst case, e.g., utilizing PWM) Flickering detected at a brightness setting of 100 % and below. There should be no flickering or PWM above this brightness setting. The frequency of 200 Hz is relatively low, so sensitive users will likely notice flickering and experience eyestrain at the stated brightness setting and below. In comparison: 52 % of all tested devices do not use PWM to dim the display. If PWM was detected, an average of 7744 (minimum: 5 - maximum: 343500) Hz was measured. | |||
Magicbook (AMD 2500U)
Display Response Times
| ↔ Response Time Black to White | ||
|---|---|---|
| 32.8 ms ... rise ↗ and fall ↘ combined | ↗ 18.8 ms rise | 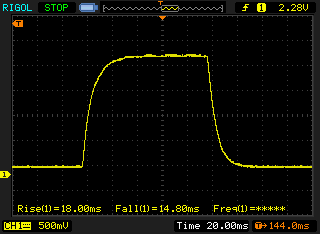 |
| ↘ 14 ms fall | ||
| The screen shows slow response rates in our tests and will be unsatisfactory for gamers. In comparison, all tested devices range from 0.1 (minimum) to 240 (maximum) ms. » 88 % of all devices are better. This means that the measured response time is worse than the average of all tested devices (19.8 ms). | ||
| ↔ Response Time 50% Grey to 80% Grey | ||
| 44.8 ms ... rise ↗ and fall ↘ combined | ↗ 22 ms rise | 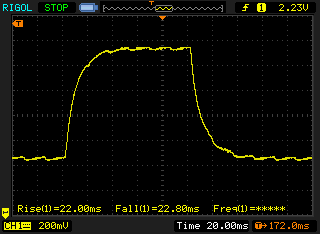 |
| ↘ 22.8 ms fall | ||
| The screen shows slow response rates in our tests and will be unsatisfactory for gamers. In comparison, all tested devices range from 0.165 (minimum) to 636 (maximum) ms. » 76 % of all devices are better. This means that the measured response time is worse than the average of all tested devices (30.9 ms). | ||
Screen Flickering / PWM (Pulse-Width Modulation)
| Screen flickering / PWM detected | 200 Hz | ≤ 90 % brightness setting | 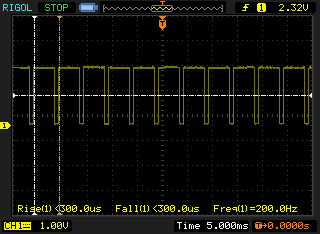 |
The display backlight flickers at 200 Hz (worst case, e.g., utilizing PWM) Flickering detected at a brightness setting of 90 % and below. There should be no flickering or PWM above this brightness setting. The frequency of 200 Hz is relatively low, so sensitive users will likely notice flickering and experience eyestrain at the stated brightness setting and below. In comparison: 52 % of all tested devices do not use PWM to dim the display. If PWM was detected, an average of 7744 (minimum: 5 - maximum: 343500) Hz was measured. | |||
| Cinebench R15 | |
| CPU Single 64Bit | |
| Average of class Subnotebook (72.4 - 322, n=56, last 2 years) | |
| Acer Swift 3 SF314-52G-89SL | |
| HP Pavilion 14-ce0002ng | |
| Lenovo IdeaPad 530s-14IKB | |
| HP ProBook 440 G5-3KX87ES | |
| Lenovo ThinkPad E480-20KQS00000 | |
| Honor Magicbook | |
| Dell Latitude 3490 | |
| HP 14-ma0312ng | |
| Average Intel Core i5-8250U (81 - 147, n=97) | |
| Honor Magicbook | |
| CPU Multi 64Bit | |
| Average of class Subnotebook (327 - 3345, n=56, last 2 years) | |
| Dell Latitude 3490 | |
| HP ProBook 440 G5-3KX87ES | |
| Honor Magicbook | |
| Honor Magicbook | |
| Average Intel Core i5-8250U (320 - 730, n=101) | |
| Acer Swift 3 SF314-52G-89SL | |
| Lenovo ThinkPad E480-20KQS00000 | |
| HP Pavilion 14-ce0002ng | |
| Lenovo IdeaPad 530s-14IKB | |
| HP 14-ma0312ng | |
| PCMark 8 - Home Score Accelerated v2 | |
| Dell Latitude 3490 | |
| Lenovo ThinkPad E480-20KQS00000 | |
| Acer Swift 3 SF314-52G-89SL | |
| HP ProBook 440 G5-3KX87ES | |
| Honor Magicbook | |
| HP 14-ma0312ng | |
| Average Intel Core i5-8250U, NVIDIA GeForce MX150 (3274 - 3935, n=10) | |
| Lenovo IdeaPad 530s-14IKB | |
| HP Pavilion 14-ce0002ng | |
| Honor Magicbook | |
| Average of class Subnotebook (1739 - 1828, n=2, last 2 years) | |
| PCMark 10 - Score | |
| Average of class Subnotebook (4920 - 9939, n=46, last 2 years) | |
| Lenovo ThinkPad E480-20KQS00000 | |
| Acer Swift 3 SF314-52G-89SL | |
| Honor Magicbook | |
| Dell Latitude 3490 | |
| HP ProBook 440 G5-3KX87ES | |
| Average Intel Core i5-8250U, NVIDIA GeForce MX150 (3007 - 3904, n=10) | |
| HP 14-ma0312ng | |
| Lenovo IdeaPad 530s-14IKB | |
| Honor Magicbook | |
| PCMark 8 Home Score Accelerated v2 | 3741 points | |
| PCMark 8 Work Score Accelerated v2 | 4852 points | |
| PCMark 10 Score | 3740 points | |
Help | ||
| Honor Magicbook Samsung SSD PM871b MZNLN256HAJQ | Honor Magicbook Samsung SSD PM871b MZNLN256HAJQ | HP 14-ma0312ng Intel Optane 16 GB MEMPEK1J016GAH + HGST HTS541010B7E610 1 TB HDD | HP Pavilion 14-ce0002ng SanDisk X600 SD9SN8W-128G | Acer Swift 3 SF314-52G-89SL Intel SSD 600p SSDPEKKW512G7 | Lenovo IdeaPad 530s-14IKB SK Hynix PC401 512GB M.2 (HFS512GD9TNG) | Dell Latitude 3490 SK hynix SC311 M.2 | HP ProBook 440 G5-3KX87ES Intel SSD 600p SSDPEKKW256G7 | Lenovo ThinkPad E480-20KQS00000 Lenovo LENSE20256GMSP34MEAT2TA | Average Samsung SSD PM871b MZNLN256HAJQ | |
|---|---|---|---|---|---|---|---|---|---|---|
| CrystalDiskMark 5.2 / 6 | 2% | 97% | -12% | 156% | 4% | 72% | 110% | 2% | ||
| Write 4K (MB/s) | 82.1 | 76.5 -7% | 88.2 7% | 69.5 -15% | 136.1 66% | 71.7 -13% | 135.3 65% | 120.3 47% | 78.1 ? -5% | |
| Read 4K (MB/s) | 21.11 | 30.02 42% | 166.4 688% | 34.71 64% | 44.52 111% | 28.66 36% | 34.35 63% | 43.48 106% | 26.8 ? 27% | |
| Write Seq (MB/s) | 451.7 | 461.2 2% | 158.4 -65% | 382.1 -15% | 1279 183% | 415.9 -8% | 601 33% | 986 118% | 439 ? -3% | |
| Read Seq (MB/s) | 477.7 | 508 6% | 895 87% | 435.3 -9% | 1665 249% | 500 5% | 1175 146% | 1395 192% | 479 ? 0% | |
| Write 4K Q32T1 (MB/s) | 242.2 | 212.3 -12% | 162.1 -33% | 158.1 -35% | 327.5 35% | 278 15% | 377.6 56% | 250 3% | 244 ? 1% | |
| Read 4K Q32T1 (MB/s) | 257.4 | 239.7 -7% | 496.8 93% | 200.6 -22% | 391.8 52% | 252.9 -2% | 288.3 12% | 491.5 91% | 245 ? -5% | |
| Write Seq Q32T1 (MB/s) | 526 | 482.7 -8% | 159.9 -70% | 205.4 -61% | 1387 164% | 502 -5% | 591 12% | 1047 99% | 521 ? -1% | |
| Read Seq Q32T1 (MB/s) | 550 | 535 -3% | 933 70% | 541 -2% | 2693 390% | 553 1% | 1574 186% | 1781 224% | 545 ? -1% | |
| AS SSD | -25% | -414% | -216% | 59% | 119% | -1% | 28% | 13% | -1% | |
| Score Total (Points) | 1114 | 759 -32% | 588 -47% | 570 -49% | 1703 53% | 2621 135% | 1006 -10% | 1264 13% | 1200 8% | 1017 ? -9% |
| Score Write (Points) | 410 | 287 -30% | 205 -50% | 120 -71% | 695 70% | 1221 198% | 387 -6% | 634 55% | 325 -21% | 369 ? -10% |
| Score Read (Points) | 459 | 305 -34% | 242 -47% | 301 -34% | 697 52% | 965 110% | 409 -11% | 438 -5% | 602 31% | 425 ? -7% |
| Access Time Write * (ms) | 0.04 | 0.069 -73% | 0.041 -2% | 0.845 -2013% | 0.031 22% | 0.051 -27% | 0.052 -30% | 0.032 20% | 0.138 -245% | 0.05 ? -25% |
| Access Time Read * (ms) | 0.07 | 0.083 -19% | 3.697 -5181% | 0.394 -463% | 0.07 -0% | 0.051 27% | 0.097 -39% | 0.119 -70% | 0.095 -36% | 0.1037 ? -48% |
| 4K-64 Write (MB/s) | 279.8 | 191.6 -32% | 125.3 -55% | 46.82 -83% | 521 86% | 1019 264% | 286.1 2% | 485 73% | 164 -41% | 260 ? -7% |
| 4K-64 Read (MB/s) | 378.6 | 224.4 -41% | 44.76 -88% | 221.8 -41% | 506 34% | 690 82% | 332.7 -12% | 277.5 -27% | 417.1 10% | 352 ? -7% |
| 4K Write (MB/s) | 84.5 | 50.9 -40% | 66 -22% | 62.6 -26% | 117.5 39% | 103.5 22% | 68.9 -18% | 106.5 26% | 98 16% | 70.6 ? -16% |
| 4K Read (MB/s) | 32.46 | 31.78 -2% | 111.7 244% | 31.49 -3% | 29.55 -9% | 41.15 27% | 27.67 -15% | 31.9 -2% | 32.07 -1% | 26.8 ? -17% |
| Seq Write (MB/s) | 458.5 | 447.7 -2% | 141.7 -69% | 110.1 -76% | 567 24% | 982 114% | 318.8 -30% | 430 -6% | 633 38% | 393 ? -14% |
| Seq Read (MB/s) | 481.6 | 489.2 2% | 852 77% | 481.4 0% | 1609 234% | 2340 386% | 484.7 1% | 1282 166% | 1531 218% | 465 ? -3% |
| Copy Game MB/s (MB/s) | 259.6 | 236.4 -9% | 55.6 -79% | 111.5 -57% | 421.5 62% | 361.8 39% | 306.2 18% | 395.8 52% | 96.2 -63% | 324 ? 25% |
| Copy Program MB/s (MB/s) | 163.8 | 137.2 -16% | 52 -68% | 80.7 -51% | 290.2 77% | 332.8 103% | 315.9 93% | 229.6 40% | 115.4 -30% | 280 ? 71% |
| Copy ISO MB/s (MB/s) | 333 | 284.7 -15% | 135.2 -59% | 620 86% | 961 189% | 476.7 43% | 522 57% | 1321 297% | 497 ? 49% | |
| Total Average (Program / Settings) | -12% /
-15% | -159% /
-220% | -114% /
-142% | 59% /
59% | 138% /
133% | 2% /
1% | 50% /
44% | 62% /
48% | 1% /
-0% |
* ... smaller is better

| 3DMark 11 - 1280x720 Performance GPU | |
| Average of class Subnotebook (995 - 18489, n=54, last 2 years) | |
| Acer Swift 3 SF314-52G-89SL | |
| Honor Magicbook | |
| Average NVIDIA GeForce MX150 (2796 - 4905, n=47) | |
| Lenovo IdeaPad 530s-14IKB | |
| Honor Magicbook | |
| HP Pavilion 14-ce0002ng | |
| HP 14-ma0312ng | |
| Dell Latitude 3490 | |
| HP ProBook 440 G5-3KX87ES | |
| 3DMark | |
| 1280x720 Cloud Gate Standard Graphics | |
| Average of class Subnotebook (5577 - 61591, n=28, last 2 years) | |
| Honor Magicbook | |
| HP Pavilion 14-ce0002ng | |
| Average NVIDIA GeForce MX150 (16227 - 22183, n=43) | |
| Lenovo IdeaPad 530s-14IKB | |
| Honor Magicbook | |
| HP 14-ma0312ng | |
| Dell Latitude 3490 | |
| HP ProBook 440 G5-3KX87ES | |
| 1920x1080 Fire Strike Graphics | |
| Average of class Subnotebook (832 - 32931, n=56, last 2 years) | |
| HP Pavilion 14-ce0002ng | |
| Honor Magicbook | |
| Average NVIDIA GeForce MX150 (2323 - 3739, n=44) | |
| Honor Magicbook | |
| Lenovo IdeaPad 530s-14IKB | |
| HP 14-ma0312ng | |
| Dell Latitude 3490 | |
| HP ProBook 440 G5-3KX87ES | |
| 3DMark 2001SE Standard | 34443 points | |
| 3DMark 11 Performance | 4760 points | |
| 3DMark Cloud Gate Standard Score | 15124 points | |
| 3DMark Fire Strike Score | 3154 points | |
Help | ||
| Fortnite | |
| 1280x720 Low Preset | |
| Xiaomi Mi Notebook Pro i7 | |
| Average NVIDIA GeForce MX150 (61.7 - 225, n=5) | |
| Honor Magicbook | |
| HP 15-da0405ng | |
| Honor Magicbook | |
| HP Envy 13-ah0003ng | |
| Xiaomi Mi Notebook Pro i7 | |
| Fujitsu Lifebook A357-A3570MPH06DE | |
| HP 14-ma0312ng | |
| 1920x1080 Medium Preset | |
| Xiaomi Mi Notebook Pro i7 | |
| Average NVIDIA GeForce MX150 (33.7 - 86.7, n=5) | |
| Honor Magicbook | |
| HP Envy 13-ah0003ng | |
| Honor Magicbook | |
| Xiaomi Mi Notebook Pro i7 | |
| HP 15-da0405ng | |
| Fujitsu Lifebook A357-A3570MPH06DE | |
| 1920x1080 High Preset | |
| Honor Magicbook | |
| Xiaomi Mi Notebook Pro i7 | |
| Average NVIDIA GeForce MX150 (22.1 - 36.7, n=5) | |
| HP Envy 13-ah0003ng | |
| Honor Magicbook | |
| HP 15-da0405ng | |
| Xiaomi Mi Notebook Pro i7 | |
| 1920x1080 Epic Preset | |
| Honor Magicbook | |
| Xiaomi Mi Notebook Pro i7 | |
| Average NVIDIA GeForce MX150 (16.2 - 25, n=5) | |
| HP Envy 13-ah0003ng | |
| HP 15-da0405ng | |
| Honor Magicbook | |
| FIFA 19 | |
| 1280x720 Low Preset | |
| Honor Magicbook | |
| Average NVIDIA GeForce MX150 (84.5 - 144.6, n=4) | |
| HP Envy 13-ah0003ng | |
| Honor Magicbook | |
| Fujitsu Lifebook A357-A3570MPH06DE | |
| Xiaomi Mi Notebook Pro i7 | |
| MSI PL62 | |
| 1920x1080 Medium Preset | |
| Average NVIDIA GeForce MX150 (51.7 - 114.3, n=4) | |
| Honor Magicbook | |
| HP Envy 13-ah0003ng | |
| Honor Magicbook | |
| Fujitsu Lifebook A357-A3570MPH06DE | |
| Xiaomi Mi Notebook Pro i7 | |
| MSI PL62 | |
| 1920x1080 High Preset AA:2x MS | |
| Average NVIDIA GeForce MX150 (44.9 - 108.2, n=4) | |
| Honor Magicbook | |
| HP Envy 13-ah0003ng | |
| Honor Magicbook | |
| Xiaomi Mi Notebook Pro i7 | |
| MSI PL62 | |
| 1920x1080 Ultra Preset AA:4x MS | |
| Honor Magicbook | |
| Average NVIDIA GeForce MX150 (43.2 - 97.2, n=5) | |
| Xiaomi Mi Notebook Pro i7 | |
| HP Envy 13-ah0003ng | |
| Honor Magicbook | |
| Xiaomi Mi Notebook Pro i7 | |
| low | med. | high | ultra | QHD | 4K | |
|---|---|---|---|---|---|---|
| Trackmania Nations Forever (2008) | 133 | 110 | ||||
| Counter-Strike: GO (2012) | 80 | 55 | 30.3 | |||
| The Witcher 3 (2015) | 60.4 | 36.2 | 19.8 | |||
| Dota 2 Reborn (2015) | 103.6 | 95.6 | 68.4 | 60.2 | ||
| Rocket League (2017) | 59.8 | 42.5 | 20.8 | |||
| Fortnite (2018) | 113.2 | 58.9 | 36.1 | 24.1 | ||
| Final Fantasy XV Benchmark (2018) | 36.9 | 17.4 | 10.9 | 6.68 | 2.52 | |
| X-Plane 11.11 (2018) | 57.6 | 47 | 42.1 | 20.6 | ||
| World of Tanks enCore (2018) | 299 | 70.6 | 26.4 | |||
| Strange Brigade (2018) | 75.3 | 26.8 | 20.9 | 16.1 | ||
| FIFA 19 (2018) | 144.6 | 78.8 | 70.5 | 70.2 | ||
| Anno 1800 (2019) | 55.5 | 24 | 14.5 | |||
| Rage 2 (2019) | 29.7 | 13.1 | ||||
| Total War: Three Kingdoms (2019) | 73.4 | 21.5 | 9.2 | 6.1 | ||
| F1 2019 (2019) | 84.9 | 36.2 | 30.4 | 23.9 | ||
| Control (2019) | 40 | 12.8 | 9.3 | |||
| Borderlands 3 (2019) | 41.5 | 18 | 11.5 | 8.4 | ||
| FIFA 20 (2019) | 124 | 78.6 | 76.4 | 63.7 | 48.2 | 25 |
| Ghost Recon Breakpoint (2019) | 35 | 21 | ||||
| GRID 2019 (2019) | 60.3 | 24.1 | 15.4 | |||
| Call of Duty Modern Warfare 2019 (2019) | 40.9 | 21.9 | 14.7 | |||
| Need for Speed Heat (2019) | 39.7 | 19.8 | ||||
| Star Wars Jedi Fallen Order (2019) | 26.7 | 19.8 | ||||
| Red Dead Redemption 2 (2019) | 14.4 | |||||
| Fall Guys (2020) | 57.8 | 39.4 | 23 | |||
| Hearthstone (2020) | 58.2 | 40.5 | ||||
| Escape from Tarkov (2020) | 65.9 | 23.5 | ||||
| Hunt Showdown (2020) | 53.8 | 21.2 | 16.6 | |||
| Doom Eternal (2020) | 45.2 | 24 | 18.9 | 0 | ||
| Gears Tactics (2020) | 102 | 30.9 | 17.8 | 14.3 | ||
| Valorant (2020) | 121 | 99.8 | 99.9 | 65.6 | 32.5 | |
| F1 2020 (2020) | 77.6 | 34.7 | 25.7 | 16.2 | ||
| Horizon Zero Dawn (2020) | 26 | 12 | ||||
| Flight Simulator 2020 (2020) | 27.4 | 10.4 | ||||
| Serious Sam 4 (2020) | 0 game wont start | |||||
| Mafia Definitive Edition (2020) | 36.8 | 16.1 | ||||
| Star Wars Squadrons (2020) | 103 | 47.4 | 37.7 | 21.7 | ||
| FIFA 21 (2020) | 56.1 | |||||
| Watch Dogs Legion (2020) | 26.9 | 14.1 | 11.1 | |||
| Dirt 5 (2020) | 35.3 | 10.9 | ||||
| Assassin´s Creed Valhalla (2020) | 15 | |||||
| Immortals Fenyx Rising (2020) | 32 | 14 | ||||
| Cyberpunk 2077 1.0 (2020) | 18.3 | 7.78 | ||||
| Hitman 3 (2021) | 42 | 9 () | ||||
| Outriders (2021) | 43.1 | 25 | 15.8 | 12.8 | 11.3 | |
| Resident Evil Village (2021) | 23.8 | |||||
| Days Gone (2021) | 32.1 | 19.1 | ||||
| F1 2021 (2021) | 59.9 | 27.5 | 21.8 | |||
| Deathloop (2021) | 0 game wont start | |||||
| Farming Simulator 22 (2021) | 31.6 | 7.79 | 1.855 | |||
| God of War (2022) | 11.8 | 1.907 | ||||
| Rainbow Six Extraction (2022) | 20 | 16 | 15 | 8 | 5 | |
| Dying Light 2 (2022) | ||||||
| GRID Legends (2022) | 41.5 | |||||
| Elden Ring (2022) | 23.2 | |||||
| Cyberpunk 2077 1.6 (2022) | 10.9 | 6.68 | ||||
| Elex 2 (2022) | 16.7 | |||||
| Ghostwire Tokyo (2022) | 13.2 | |||||
| Tiny Tina's Wonderlands (2022) | 18.7 | |||||
| F1 22 (2022) | 27.4 | 19.3 | ||||
| FIFA 23 (2022) | 14.5 | 9.07 | 6.66 |
Emissions - Intel Magicbook Stays Quieter, AMD is Cooler
Noise level
| Idle |
| 30.3 / 30.3 / 30 dB(A) |
| Load |
| 40.4 / 43.8 dB(A) |
 | ||
30 dB silent 40 dB(A) audible 50 dB(A) loud |
||
min: | ||
Magicbook (Intel i5-8250U)
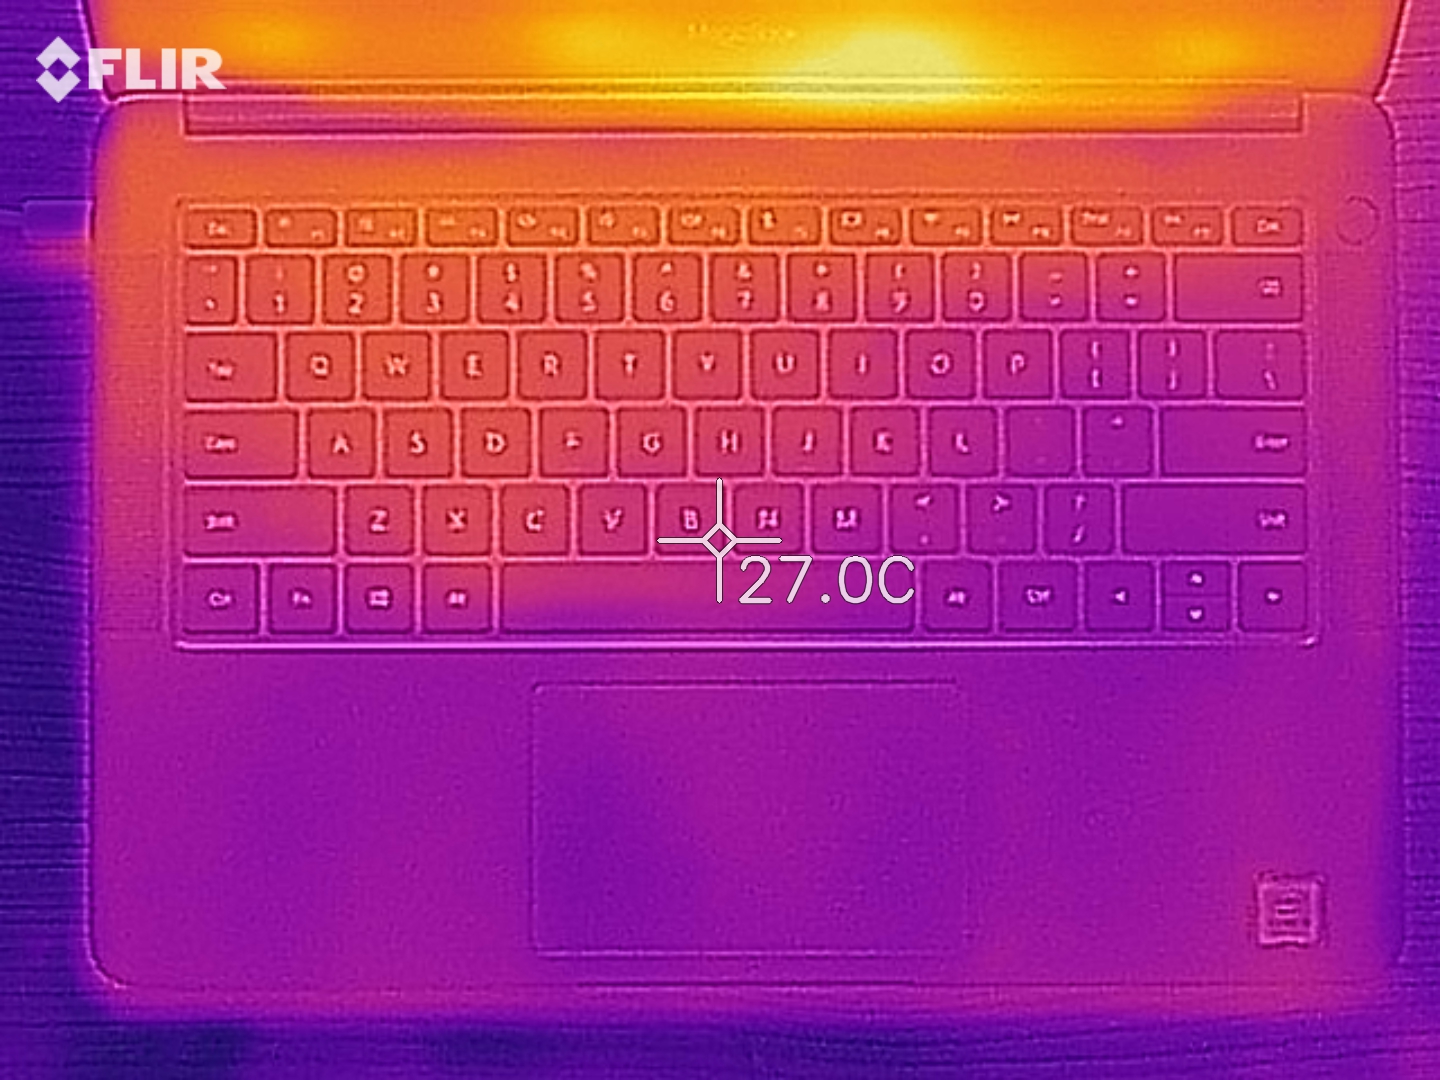
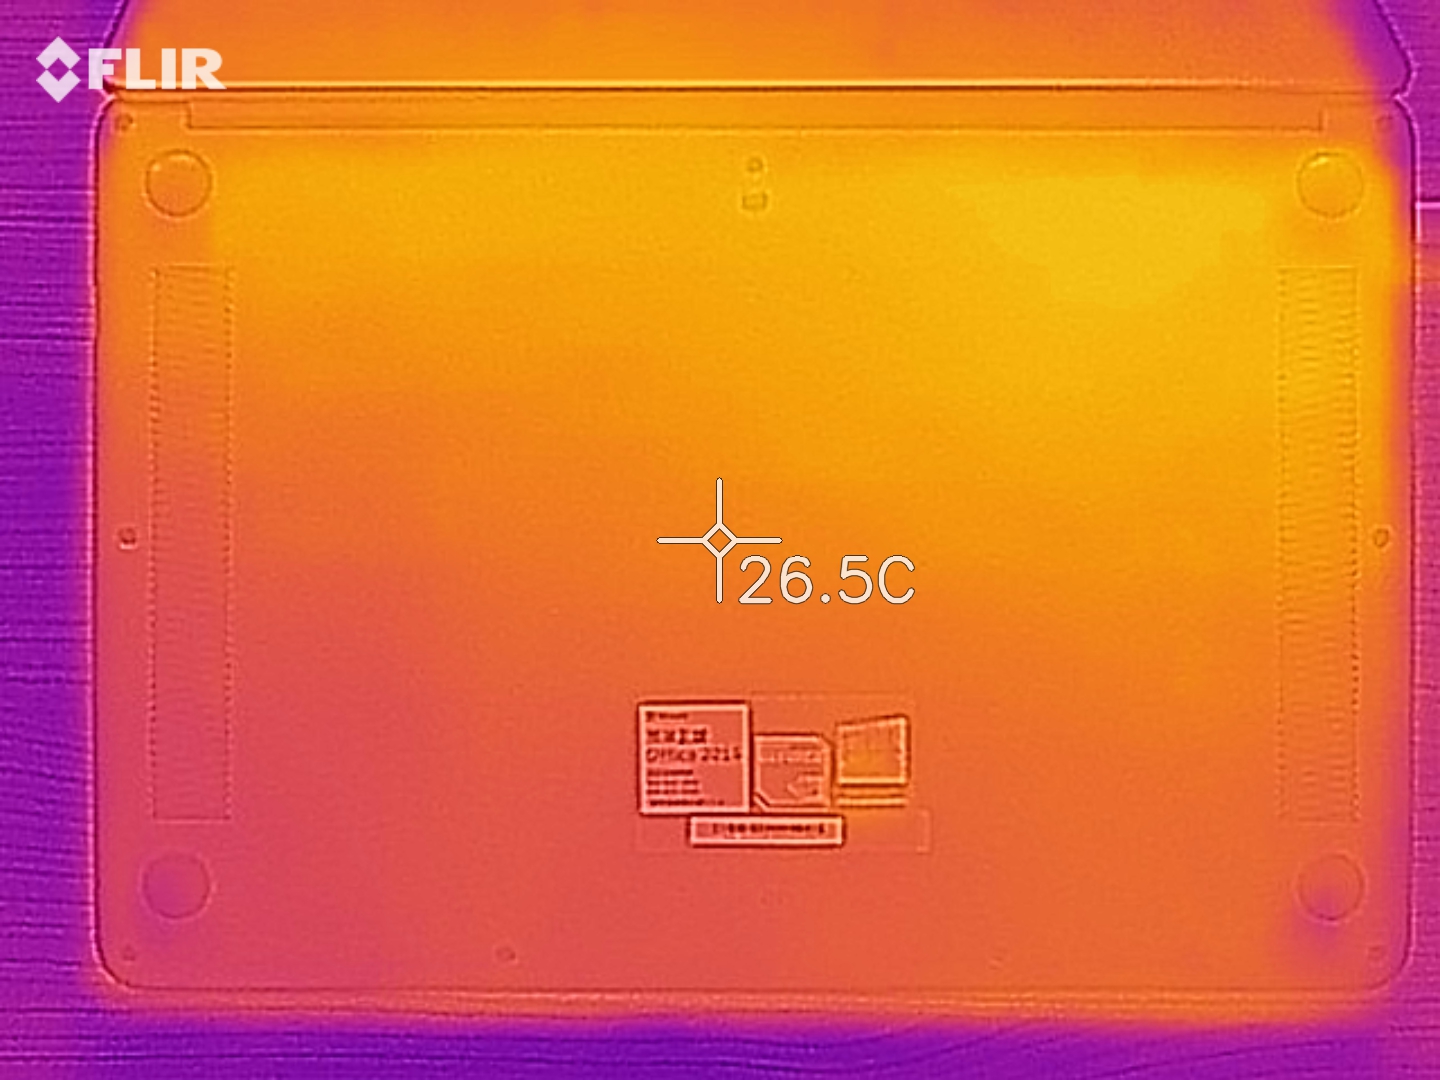
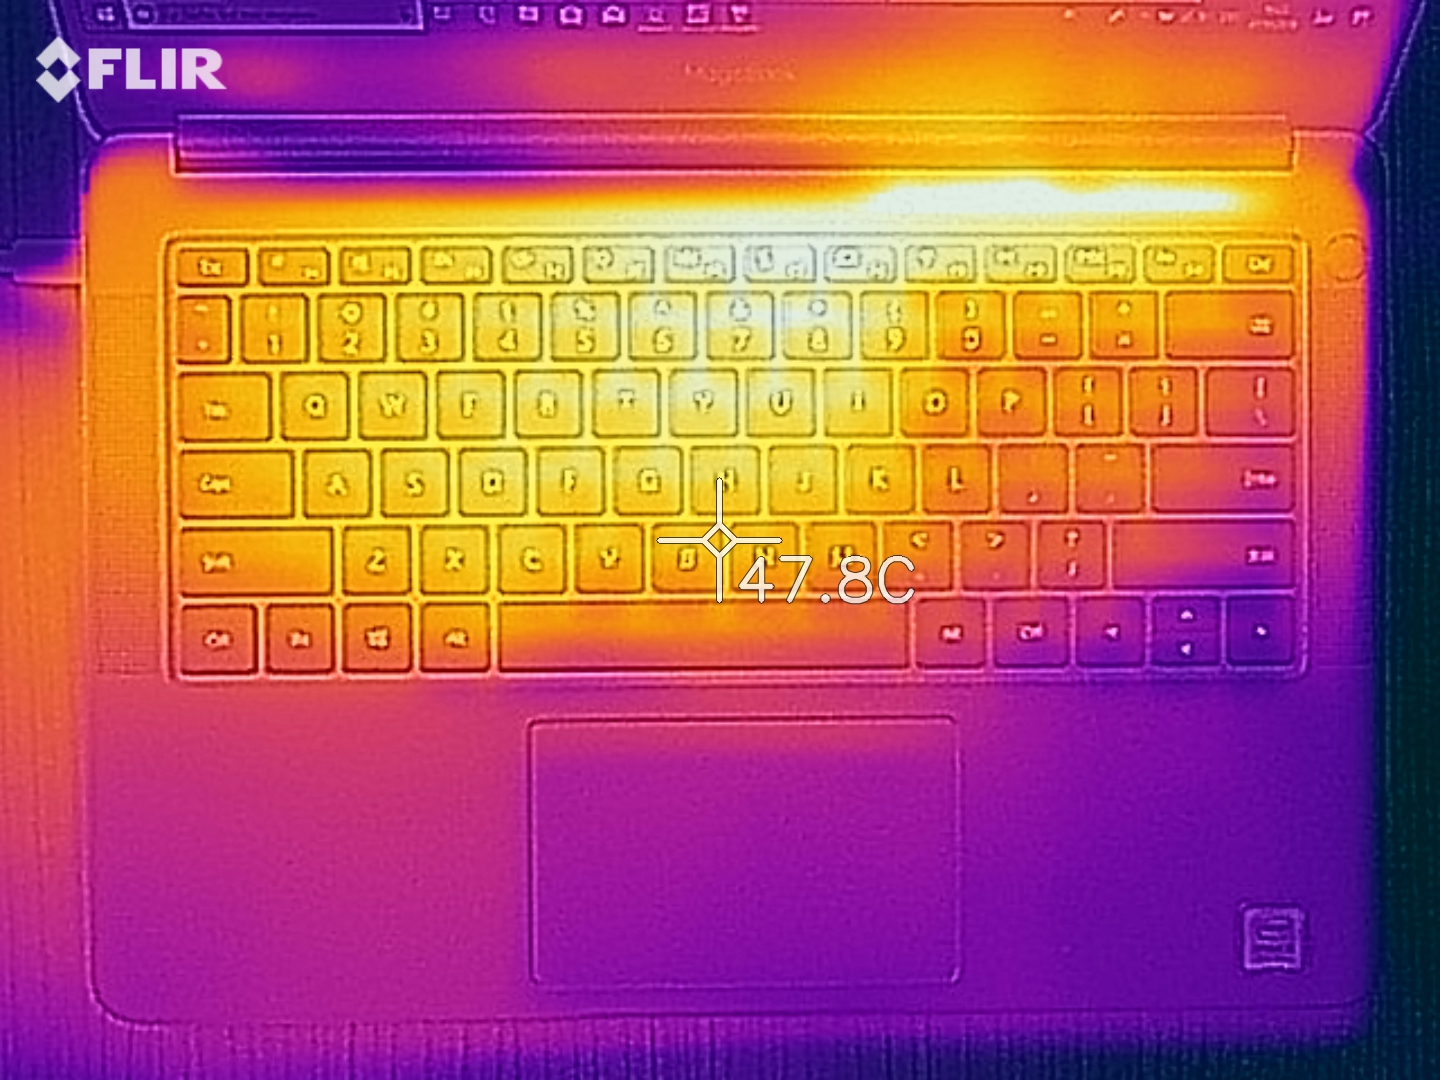
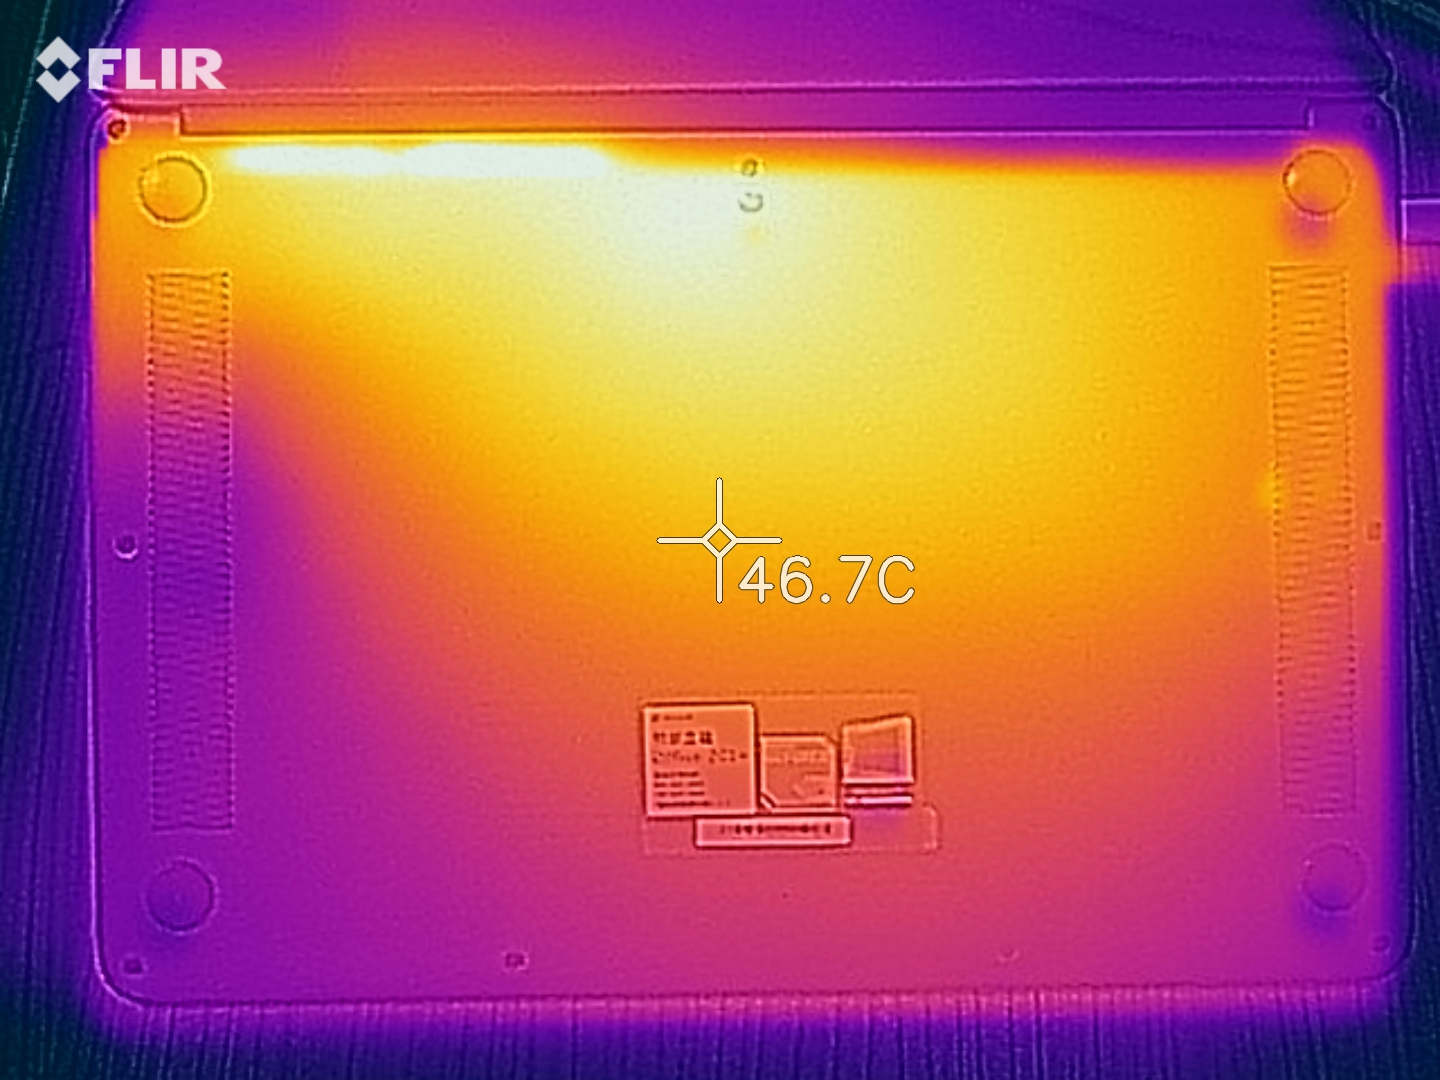
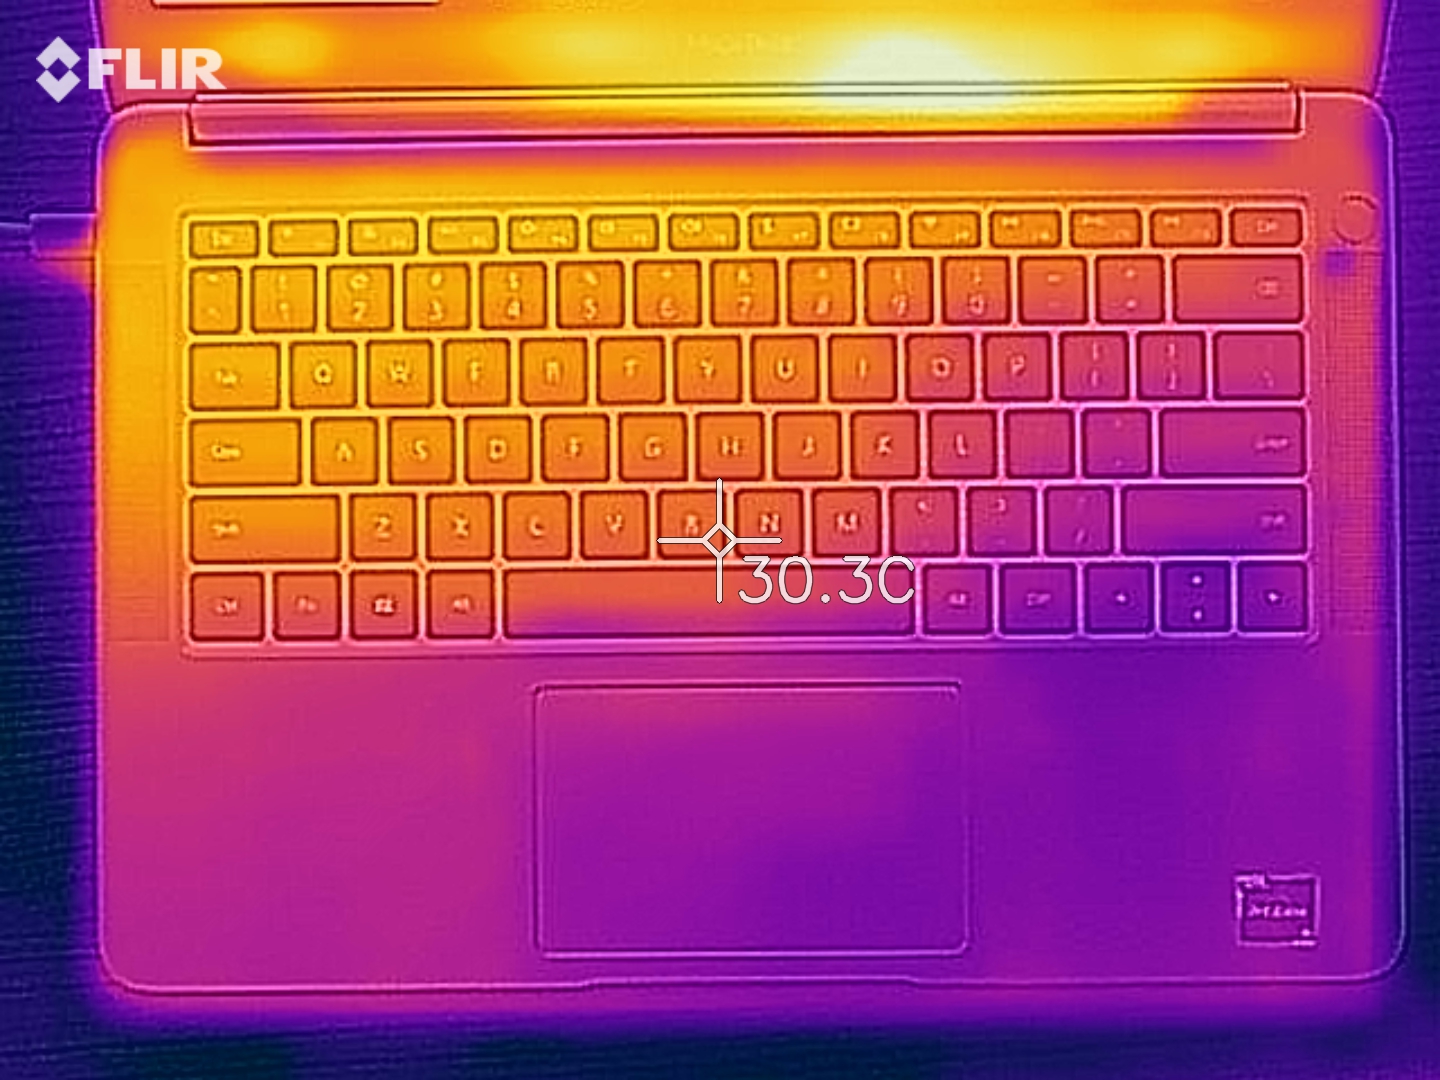
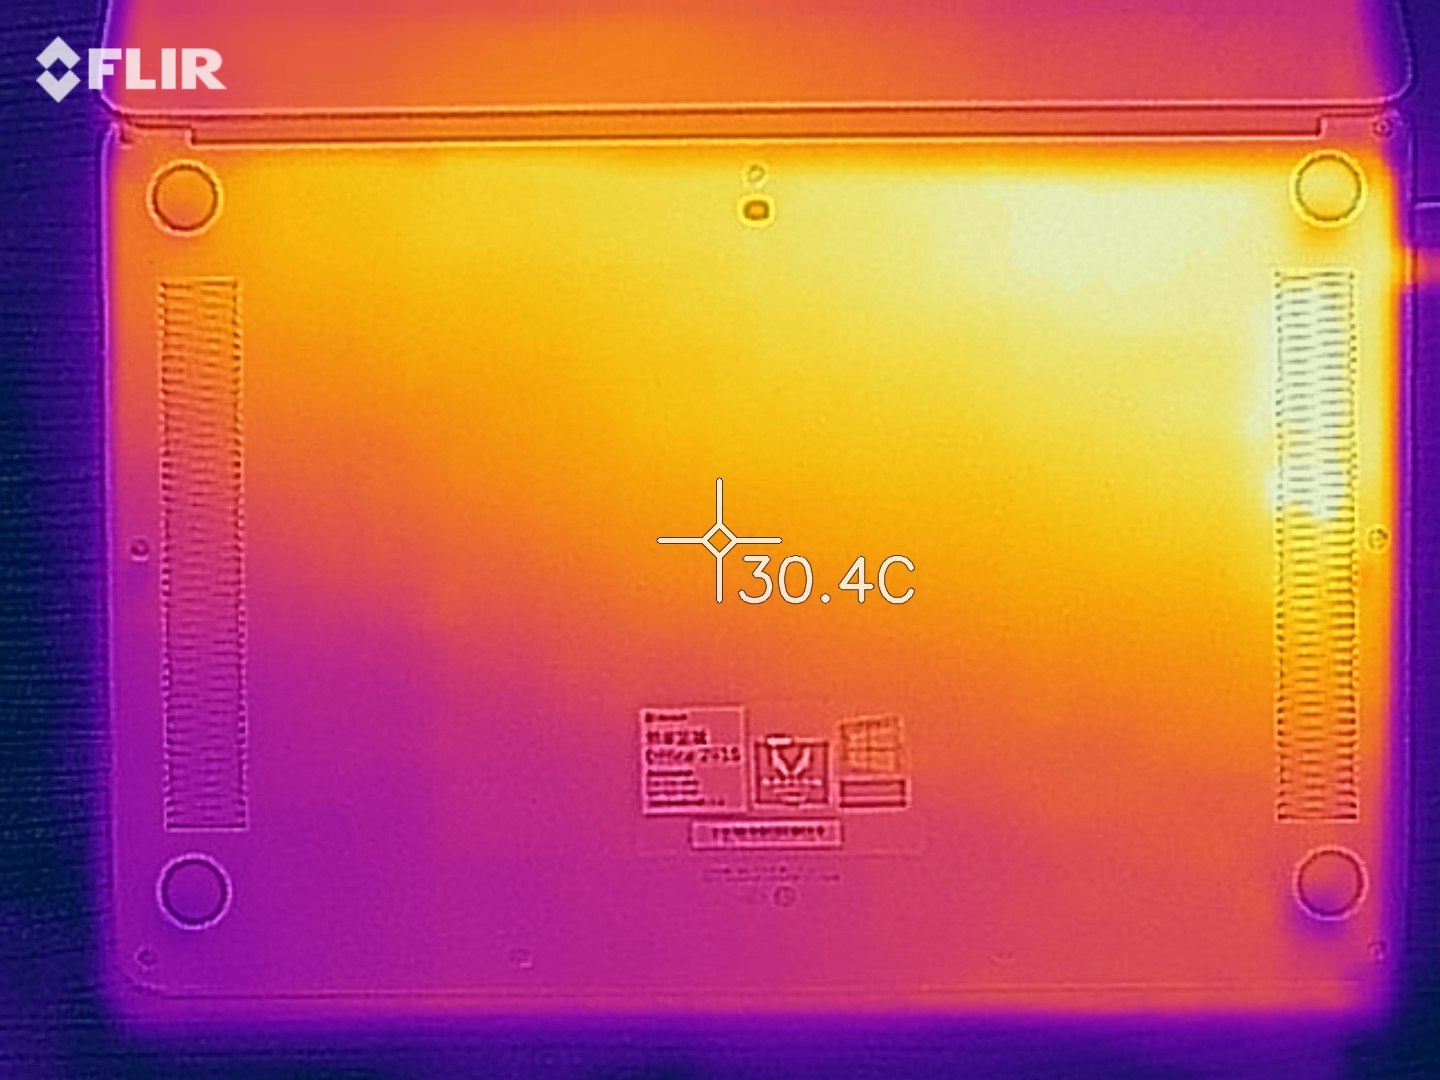
(-) The maximum temperature on the upper side is 52.3 °C / 126 F, compared to the average of 35.9 °C / 97 F, ranging from 21.4 to 59 °C for the class Subnotebook.
(-) The bottom heats up to a maximum of 56.1 °C / 133 F, compared to the average of 39.2 °C / 103 F
(+) In idle usage, the average temperature for the upper side is 24.3 °C / 76 F, compared to the device average of 30.8 °C / 87 F.
(+) The palmrests and touchpad are reaching skin temperature as a maximum (32.9 °C / 91.2 F) and are therefore not hot.
(-) The average temperature of the palmrest area of similar devices was 28.2 °C / 82.8 F (-4.7 °C / -8.4 F).
Magicbook (AMD 2500U)
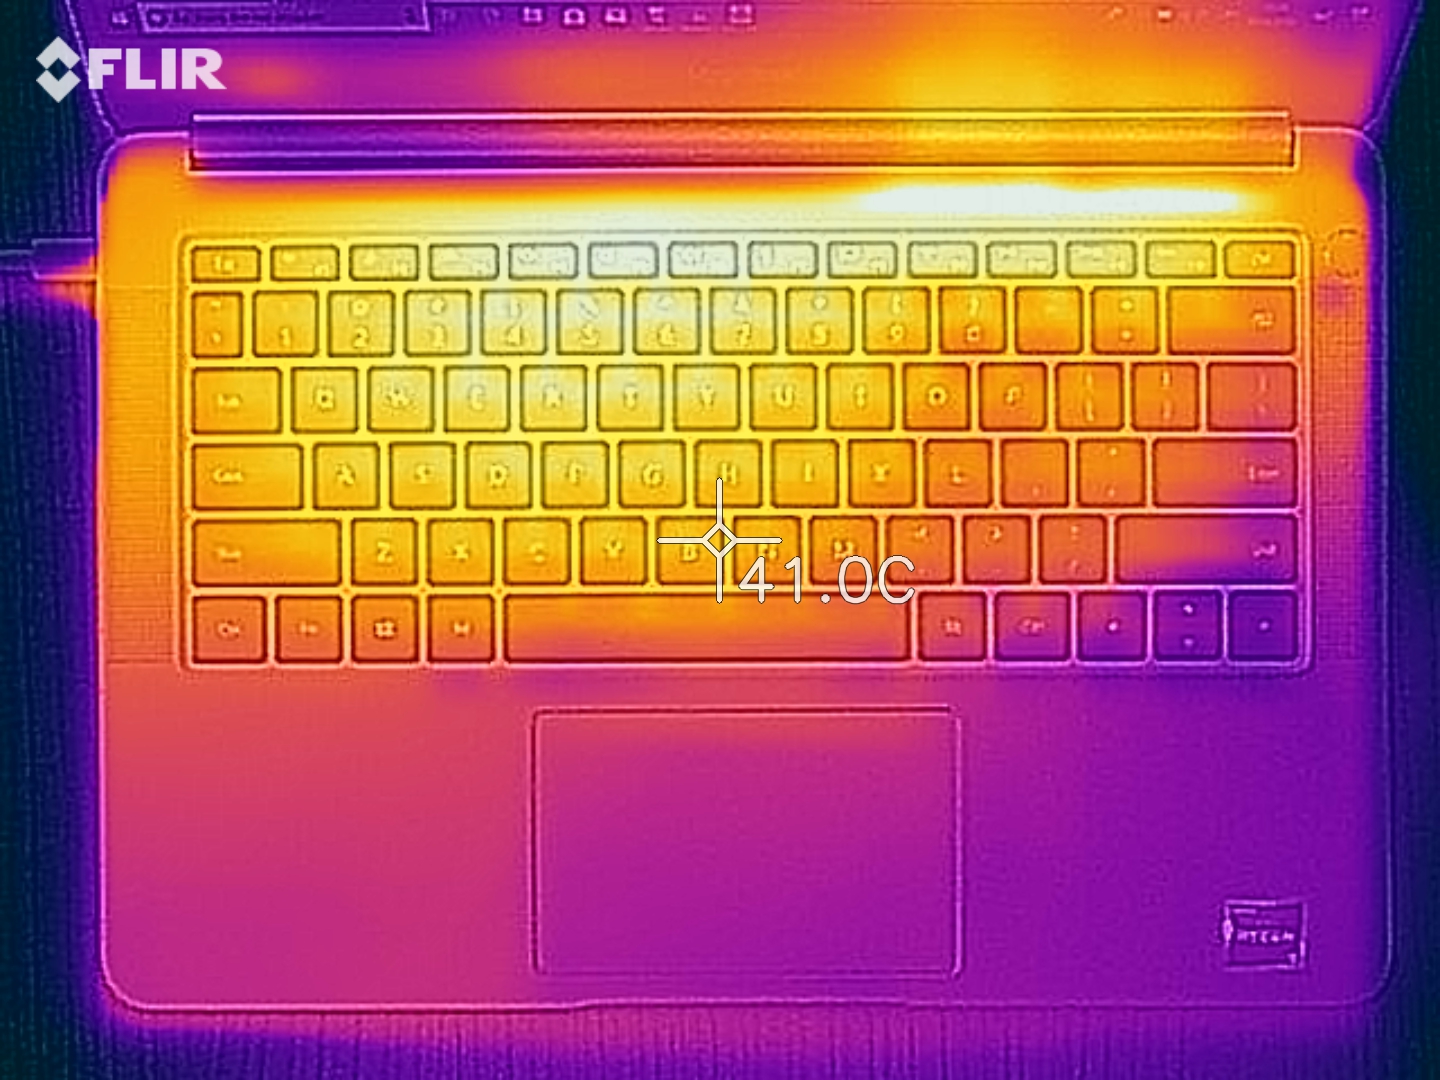
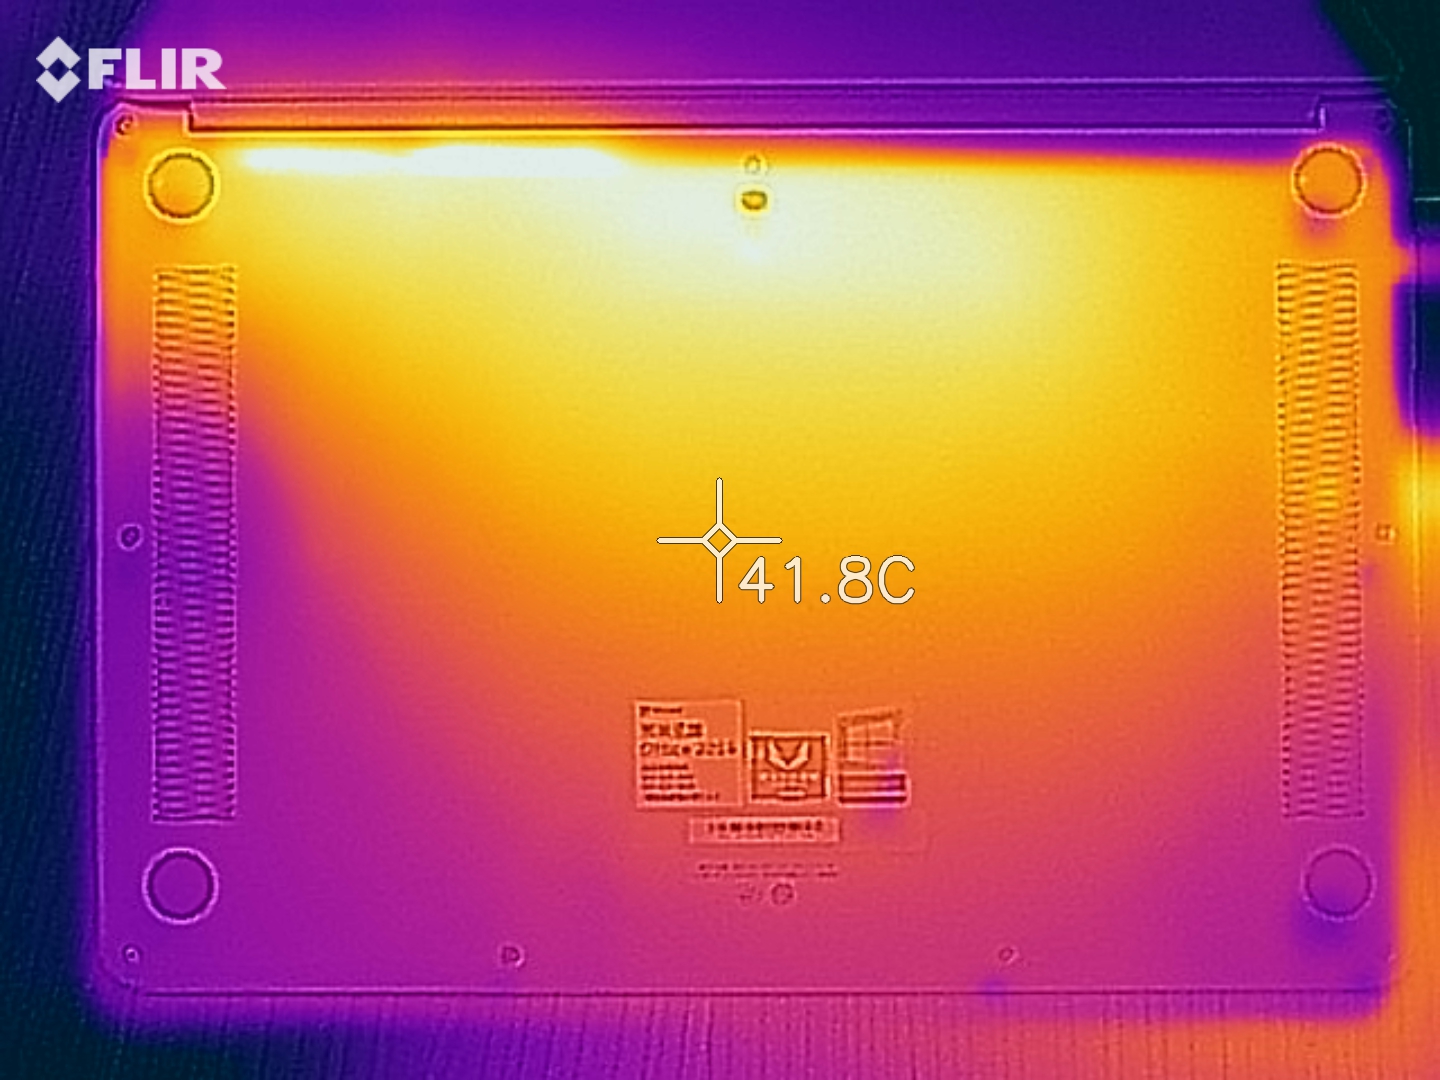
(-) The maximum temperature on the upper side is 45.6 °C / 114 F, compared to the average of 35.9 °C / 97 F, ranging from 21.4 to 59 °C for the class Subnotebook.
(-) The bottom heats up to a maximum of 47.6 °C / 118 F, compared to the average of 39.2 °C / 103 F
(+) In idle usage, the average temperature for the upper side is 27.6 °C / 82 F, compared to the device average of 30.8 °C / 87 F.
(+) The palmrests and touchpad are cooler than skin temperature with a maximum of 31.3 °C / 88.3 F and are therefore cool to the touch.
(-) The average temperature of the palmrest area of similar devices was 28.2 °C / 82.8 F (-3.1 °C / -5.5 F).
Honor Magicbook audio analysis
(±) | speaker loudness is average but good (77.8 dB)
Bass 100 - 315 Hz
(±) | reduced bass - on average 13.4% lower than median
(±) | linearity of bass is average (11.9% delta to prev. frequency)
Mids 400 - 2000 Hz
(±) | higher mids - on average 5.9% higher than median
(±) | linearity of mids is average (9% delta to prev. frequency)
Highs 2 - 16 kHz
(+) | balanced highs - only 2% away from median
(±) | linearity of highs is average (8.4% delta to prev. frequency)
Overall 100 - 16.000 Hz
(±) | linearity of overall sound is average (19.2% difference to median)
Compared to same class
» 60% of all tested devices in this class were better, 5% similar, 35% worse
» The best had a delta of 5%, average was 18%, worst was 53%
Compared to all devices tested
» 46% of all tested devices were better, 7% similar, 46% worse
» The best had a delta of 4%, average was 23%, worst was 134%
Honor Magicbook audio analysis
(±) | speaker loudness is average but good (77.3 dB)
Bass 100 - 315 Hz
(±) | reduced bass - on average 12% lower than median
(±) | linearity of bass is average (11.8% delta to prev. frequency)
Mids 400 - 2000 Hz
(±) | higher mids - on average 7.3% higher than median
(±) | linearity of mids is average (9% delta to prev. frequency)
Highs 2 - 16 kHz
(+) | balanced highs - only 3.2% away from median
(+) | highs are linear (6.4% delta to prev. frequency)
Overall 100 - 16.000 Hz
(±) | linearity of overall sound is average (21.2% difference to median)
Compared to same class
» 72% of all tested devices in this class were better, 5% similar, 23% worse
» The best had a delta of 5%, average was 18%, worst was 53%
Compared to all devices tested
» 59% of all tested devices were better, 7% similar, 34% worse
» The best had a delta of 4%, average was 23%, worst was 134%
Apple MacBook 12 (Early 2016) 1.1 GHz audio analysis
(+) | speakers can play relatively loud (83.6 dB)
Bass 100 - 315 Hz
(±) | reduced bass - on average 11.3% lower than median
(±) | linearity of bass is average (14.2% delta to prev. frequency)
Mids 400 - 2000 Hz
(+) | balanced mids - only 2.4% away from median
(+) | mids are linear (5.5% delta to prev. frequency)
Highs 2 - 16 kHz
(+) | balanced highs - only 2% away from median
(+) | highs are linear (4.5% delta to prev. frequency)
Overall 100 - 16.000 Hz
(+) | overall sound is linear (10.2% difference to median)
Compared to same class
» 7% of all tested devices in this class were better, 2% similar, 90% worse
» The best had a delta of 5%, average was 18%, worst was 53%
Compared to all devices tested
» 5% of all tested devices were better, 1% similar, 94% worse
» The best had a delta of 4%, average was 23%, worst was 134%
Xiaomi Mi Notebook 15.6 (E58514D1D) audio analysis
(±) | speaker loudness is average but good (76.6 dB)
Bass 100 - 315 Hz
(±) | reduced bass - on average 10.4% lower than median
(±) | linearity of bass is average (12.9% delta to prev. frequency)
Mids 400 - 2000 Hz
(±) | higher mids - on average 6.7% higher than median
(+) | mids are linear (6.3% delta to prev. frequency)
Highs 2 - 16 kHz
(+) | balanced highs - only 3.6% away from median
(±) | linearity of highs is average (8.9% delta to prev. frequency)
Overall 100 - 16.000 Hz
(±) | linearity of overall sound is average (20.3% difference to median)
Compared to same class
» 45% of all tested devices in this class were better, 10% similar, 45% worse
» The best had a delta of 7%, average was 21%, worst was 53%
Compared to all devices tested
» 53% of all tested devices were better, 8% similar, 39% worse
» The best had a delta of 4%, average was 23%, worst was 134%
Power Management - All Magicbooks have good Battery Life
Magicbook (Intel i5-8250U)
| Off / Standby | |
| Idle | |
| Load |
|
Key:
min: | |
Magicbook (AMD 2500U)
| Off / Standby | |
| Idle | |
| Load |
|
Key:
min: | |
| Honor Magicbook i5-8250U, GeForce MX150, Samsung SSD PM871b MZNLN256HAJQ, IPS LED, 1920x1080, 14" | Honor Magicbook R5 2500U, Vega 8, Samsung SSD PM871b MZNLN256HAJQ, , 1920x1080, 14" | Lenovo ThinkPad E480-20KQS00000 i5-8250U, Radeon RX 550 (Laptop), Lenovo LENSE20256GMSP34MEAT2TA, IPS LED, 1920x1080, 14" | Dell Latitude 3490 i5-8250U, UHD Graphics 620, SK hynix SC311 M.2, IPS LED, 1920x1080, 14" | Lenovo IdeaPad 530s-14IKB i5-8550U, GeForce MX150, SK Hynix PC401 512GB M.2 (HFS512GD9TNG), IPS, 2560x1440, 14" | HP ProBook 440 G5-3KX87ES i5-8250U, UHD Graphics 620, Intel SSD 600p SSDPEKKW256G7, IPS LED, 1920x1080, 14" | Acer Swift 3 SF314-52G-89SL i5-8550U, GeForce MX150, Intel SSD 600p SSDPEKKW512G7, IPS, 1920x1080, 14" | HP Pavilion 14-ce0002ng i5-8550U, GeForce MX150, SanDisk X600 SD9SN8W-128G, IPS, 1920x1080, 14" | HP 14-ma0312ng i5-8250U, UHD Graphics 620, Intel Optane 16 GB MEMPEK1J016GAH + HGST HTS541010B7E610 1 TB HDD, TN LED, 1366x768, 14" | Average NVIDIA GeForce MX150 | Average of class Subnotebook | |
|---|---|---|---|---|---|---|---|---|---|---|---|
| Power Consumption | 6% | 4% | 12% | 7% | 4% | 1% | -23% | 27% | -9% | 7% | |
| Idle Minimum * (Watt) | 3.9 | 4.7 -21% | 4.1 -5% | 3.2 18% | 3.9 -0% | 4.4 -13% | 4.4 -13% | 6.3 -62% | 4.7 -21% | 4.48 ? -15% | 3.73 ? 4% |
| Idle Average * (Watt) | 7.3 | 7.6 -4% | 6.3 14% | 5.5 25% | 5.76 21% | 7.1 3% | 6.6 10% | 8.4 -15% | 6.3 14% | 7.88 ? -8% | 6.57 ? 10% |
| Idle Maximum * (Watt) | 8 | 8.1 -1% | 7.1 11% | 8.1 -1% | 7.14 11% | 10.2 -27% | 9.2 -15% | 10.2 -27% | 6.8 15% | 9.76 ? -22% | 7.93 ? 1% |
| Load Average * (Watt) | 55.4 | 38 31% | 54.8 1% | 40.8 26% | 50.8 8% | 36.5 34% | 61 -10% | 59 -6% | 15 73% | 54.7 ? 1% | 42.1 ? 24% |
| Witcher 3 ultra * (Watt) | 45.6 | 39.6 13% | 43.8 4% | 40 12% | |||||||
| Load Maximum * (Watt) | 63.6 | 51 20% | 66.4 -4% | 68.1 -7% | 65.8 -3% | 48.7 23% | 50 21% | 66.3 -4% | 30.4 52% | 63.5 ? -0% | 65.1 ? -2% |
* ... smaller is better
Furthermore, we took a look at the efficiency of the two solutions, which is to say how many frames per watt they are able to provide. The entire energy consumption test was performed with an external display (int. display off). At 3.4 watts per FPS, the 8250U and MX150 combination claimed first place, followed by the AMD configuration that reached 4.49 W/FPS. Requiring almost 6 watts per FPS, the system with the UHD Graphics 620 active came in last.
| 2500U/Vega 8/ext. display | 8250U/UHD 620/ext. display | 8250U/MX150/ext. display | |
|---|---|---|---|
| Frame rate | 8 FPS | 4 FPS | 11 FPS |
| Energy consumption | 35.9 W | 23.9 W | 37.4 W |
| Efficiency | 4.49 W/FPS | 5.98 W/FPS | 3.40 W/FPS |
Magicbook (Intel i5-8250U)
Magicbook (AMD 2500U)
| Honor Magicbook i5-8250U, GeForce MX150, 56 Wh | Honor Magicbook R5 2500U, Vega 8, Wh | Lenovo ThinkPad E480-20KQS00000 i5-8250U, Radeon RX 550 (Laptop), 48 Wh | Dell Latitude 3490 i5-8250U, UHD Graphics 620, 56 Wh | Lenovo IdeaPad 530s-14IKB i5-8550U, GeForce MX150, 45 Wh | HP ProBook 440 G5-3KX87ES i5-8250U, UHD Graphics 620, 48 Wh | Acer Swift 3 SF314-52G-89SL i5-8550U, GeForce MX150, 48 Wh | HP Pavilion 14-ce0002ng i5-8550U, GeForce MX150, 41 Wh | HP 14-ma0312ng i5-8250U, UHD Graphics 620, 41.7 Wh | Average of class Subnotebook | |
|---|---|---|---|---|---|---|---|---|---|---|
| Battery runtime | -32% | -35% | 14% | -35% | -52% | -24% | -46% | -39% | 17% | |
| Reader / Idle (h) | 29 | 15.2 -48% | 19.4 -33% | 14.7 -49% | 13.7 -53% | 13.3 -54% | 15.6 -46% | 26.4 ? -9% | ||
| H.264 (h) | 12.2 | 8 -34% | 8.9 -27% | 7.1 -42% | 3.7 -70% | 5.8 -52% | 6.7 -45% | 15.3 ? 25% | ||
| WiFi v1.3 (h) | 10.2 | 8.9 -13% | 5.7 -44% | 11.6 14% | 8.7 -15% | 6.9 -32% | 7.8 -24% | 6.9 -32% | 7.4 -27% | 13.9 ? 36% |
| Load (h) | 1.5 | 1.4 | 3.1 | 2.4 | 2.5 | 2.04 ? |
结论-配备AMD APU的荣耀Magicbook给我们带来了惊喜:
Pros
Cons
结论-配备AMD APU的荣耀Magicbook给我们带来了惊喜:
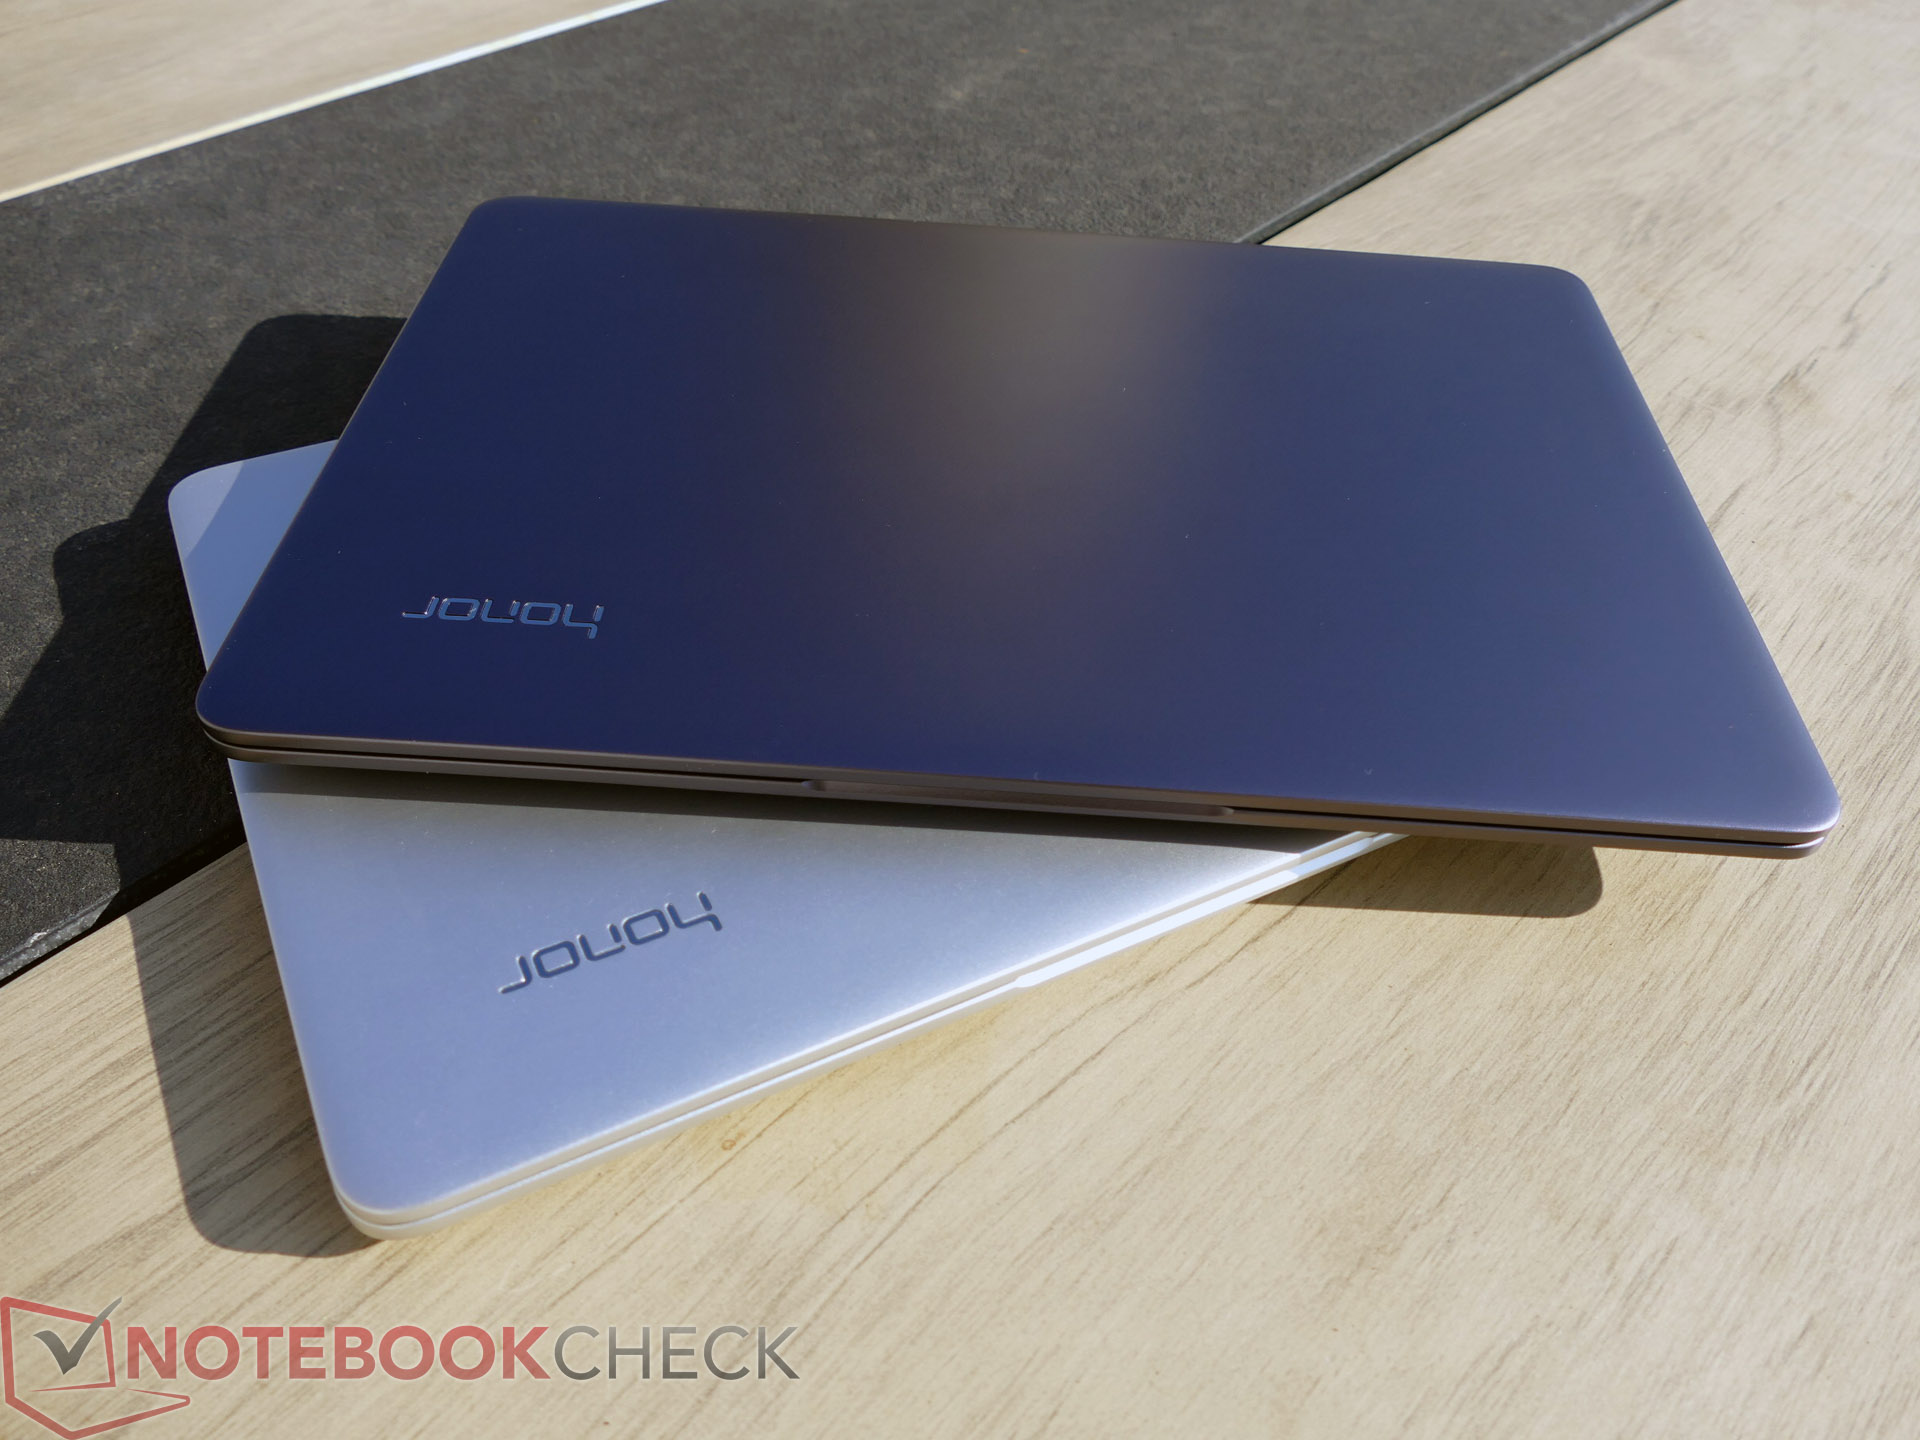
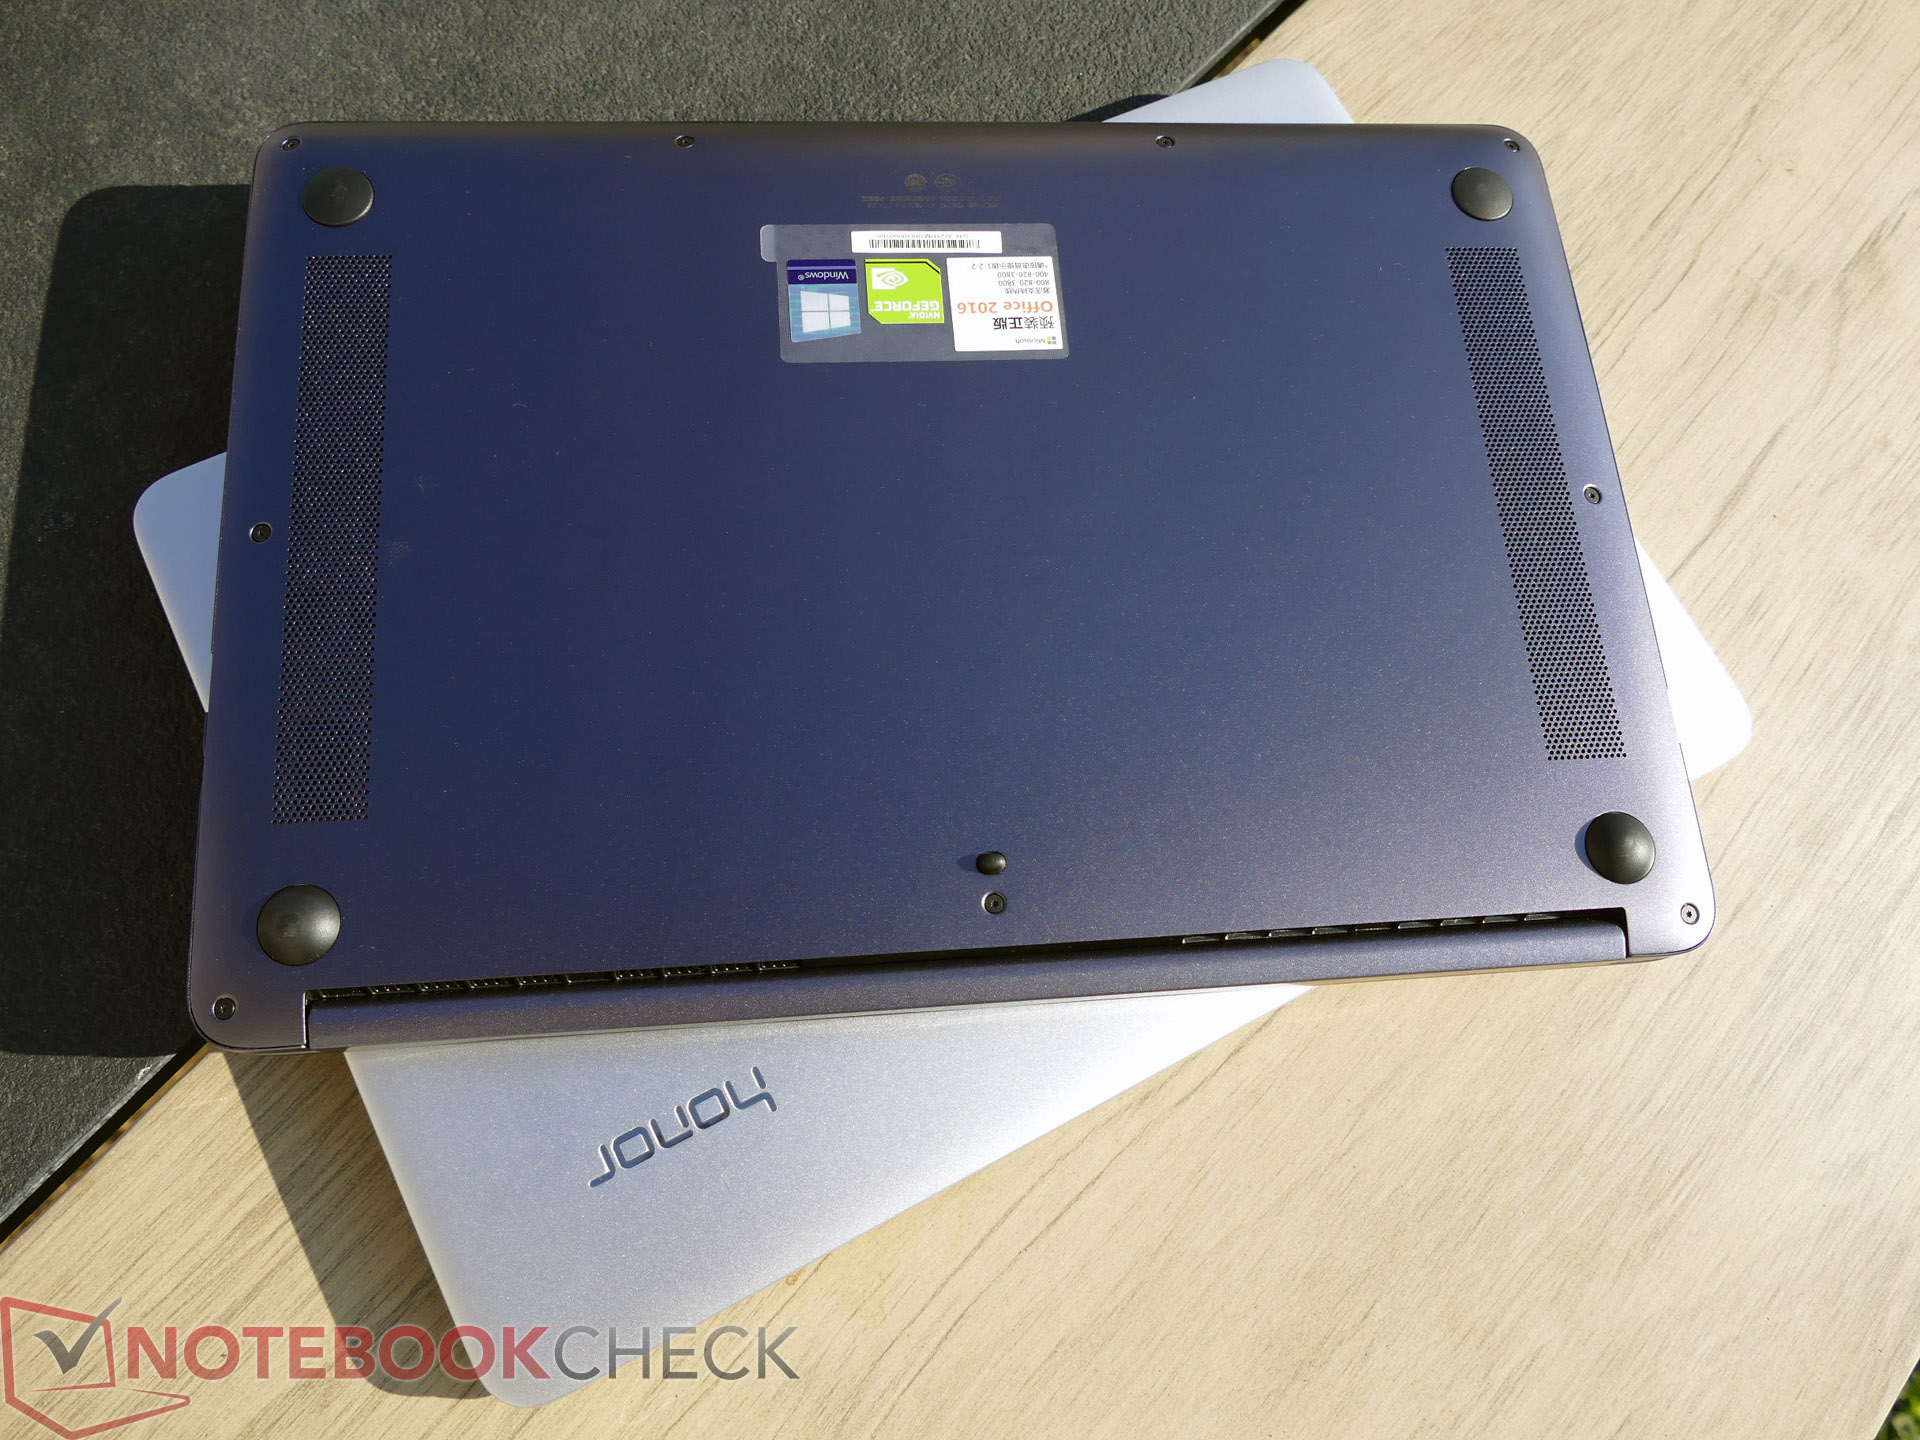
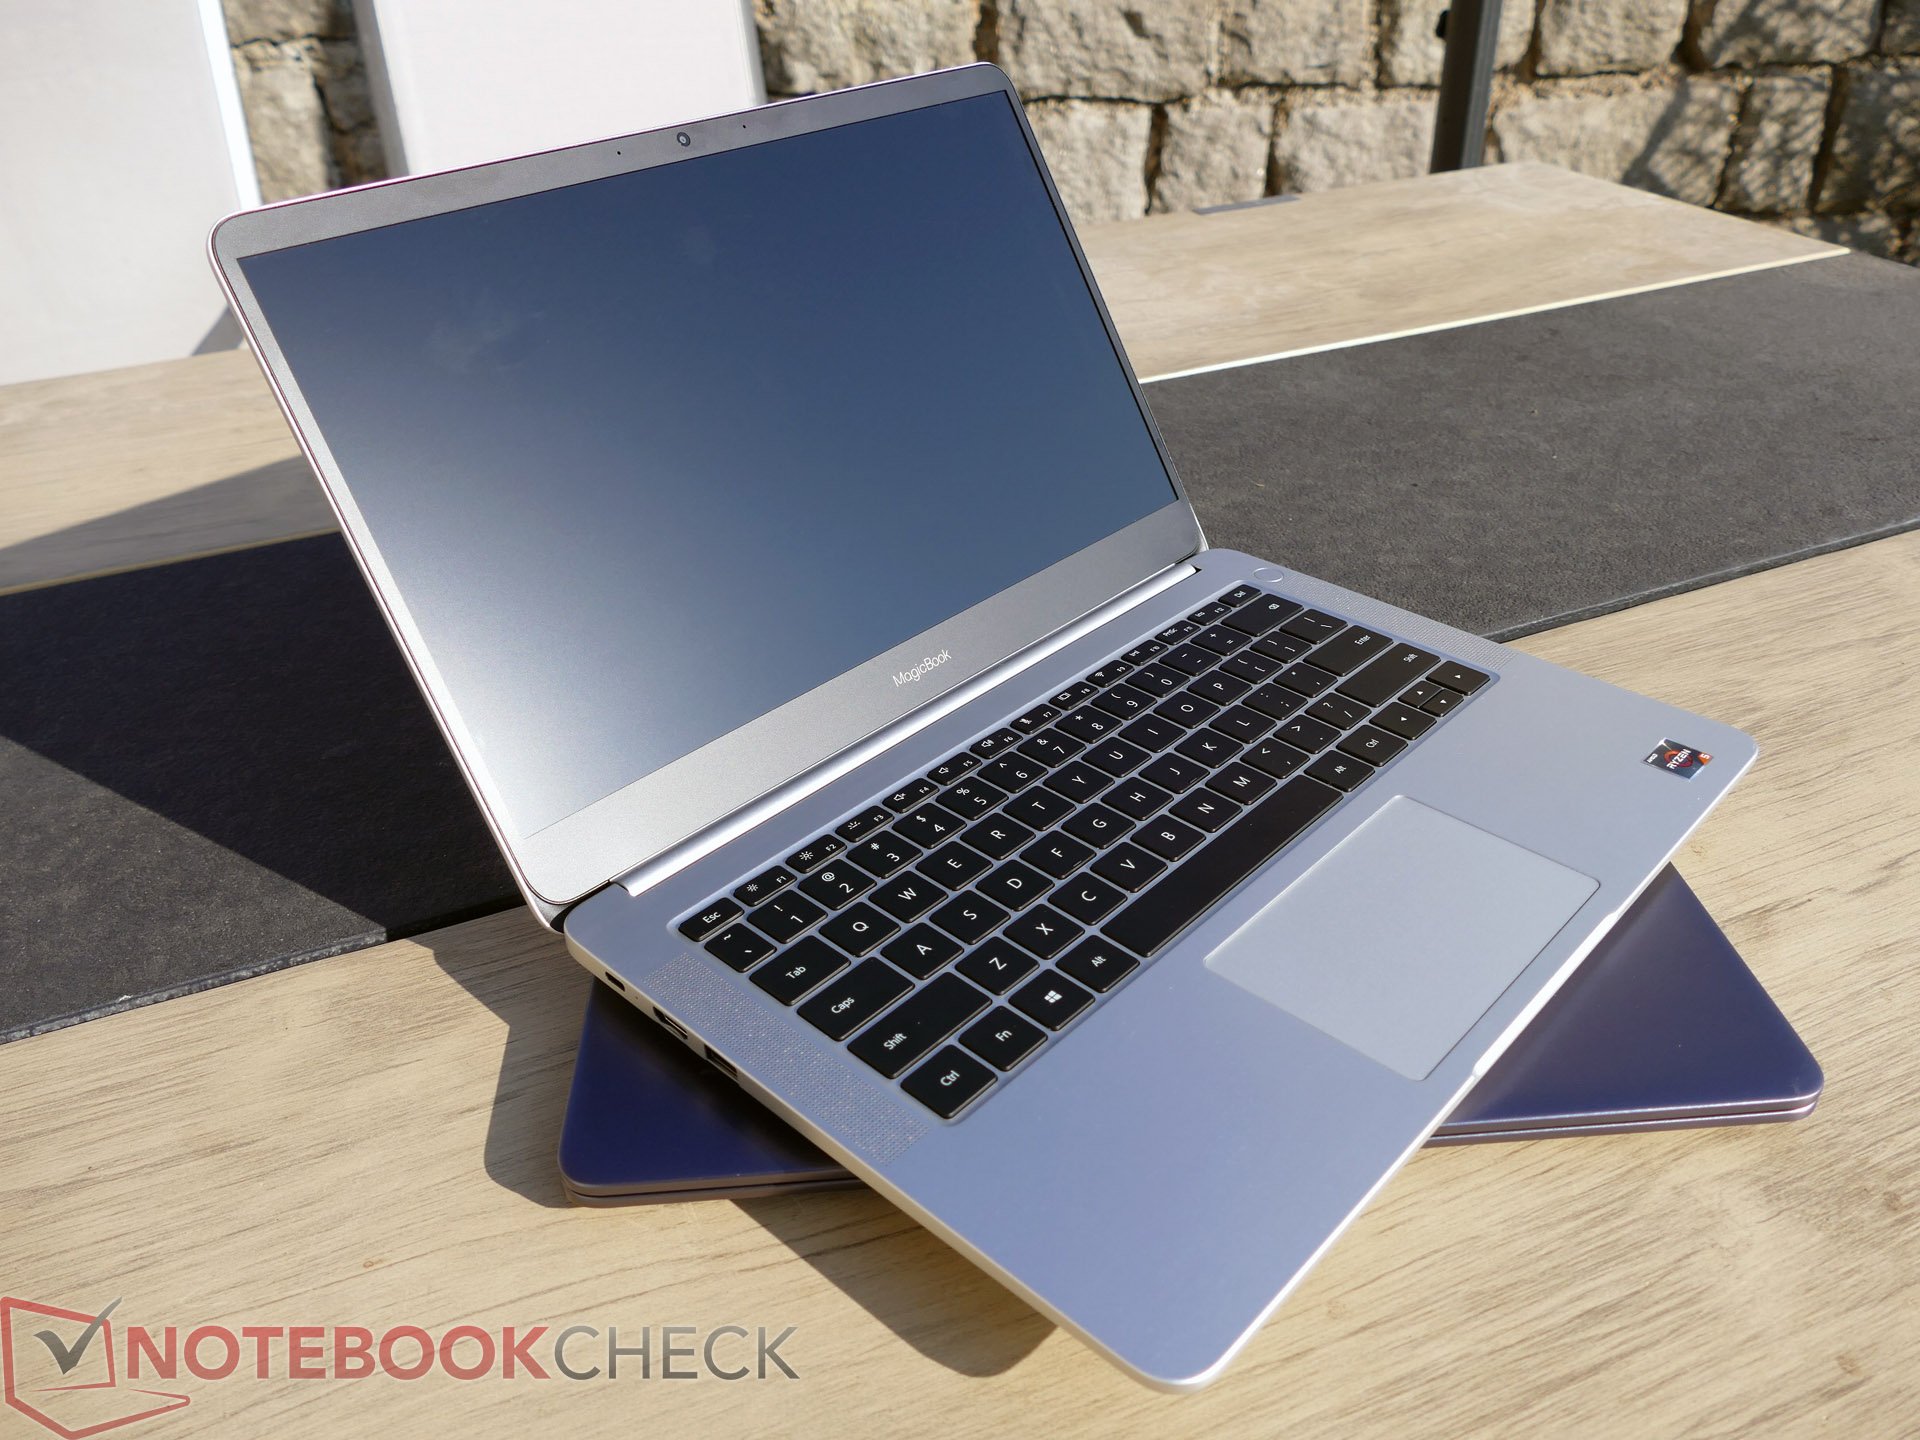
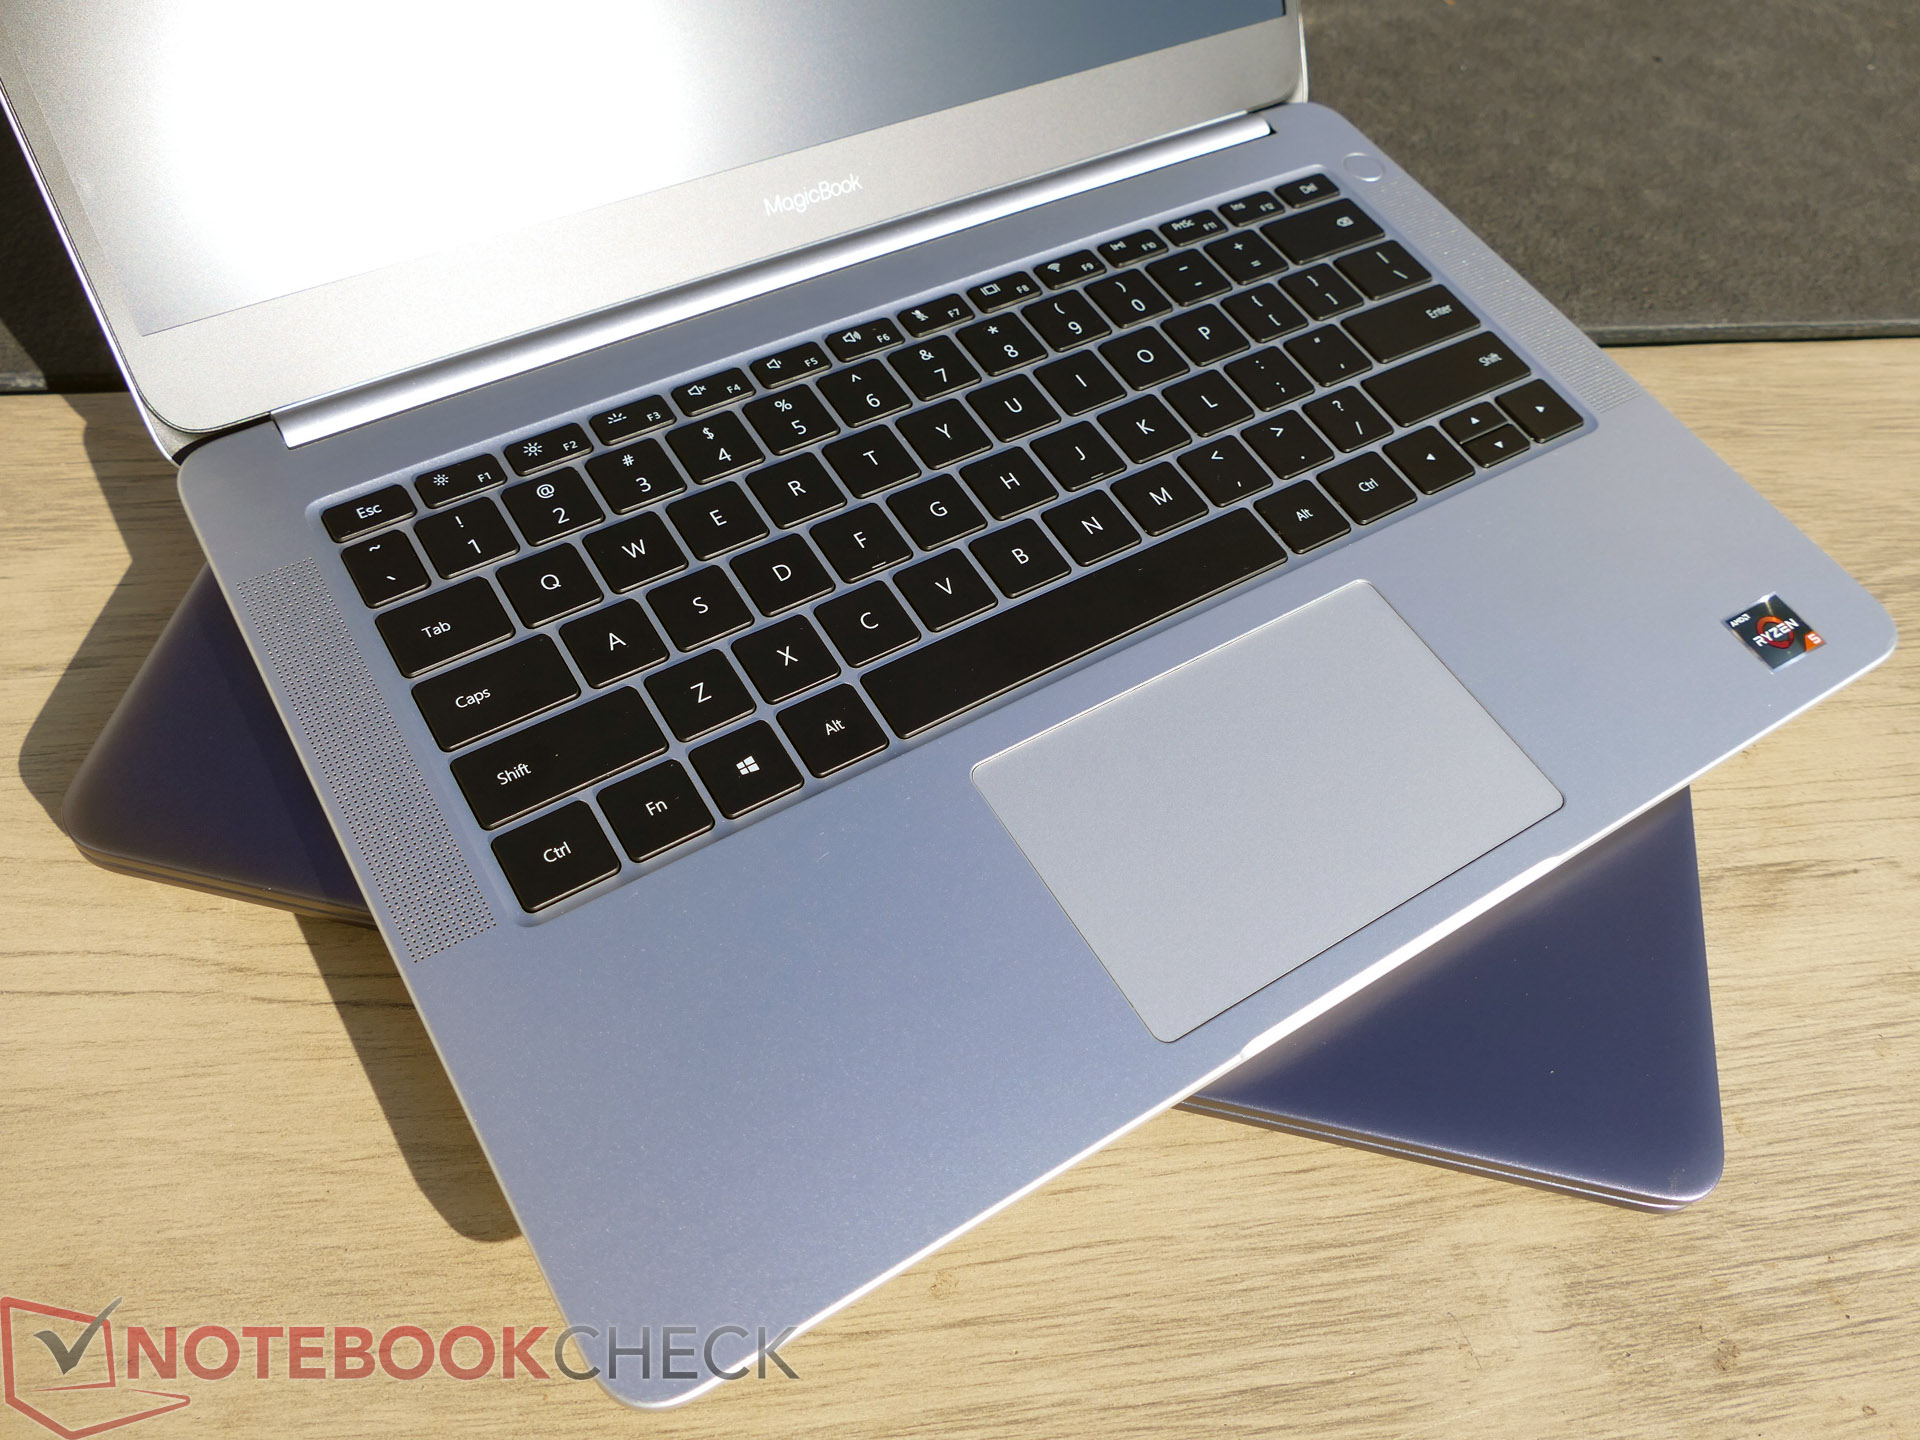
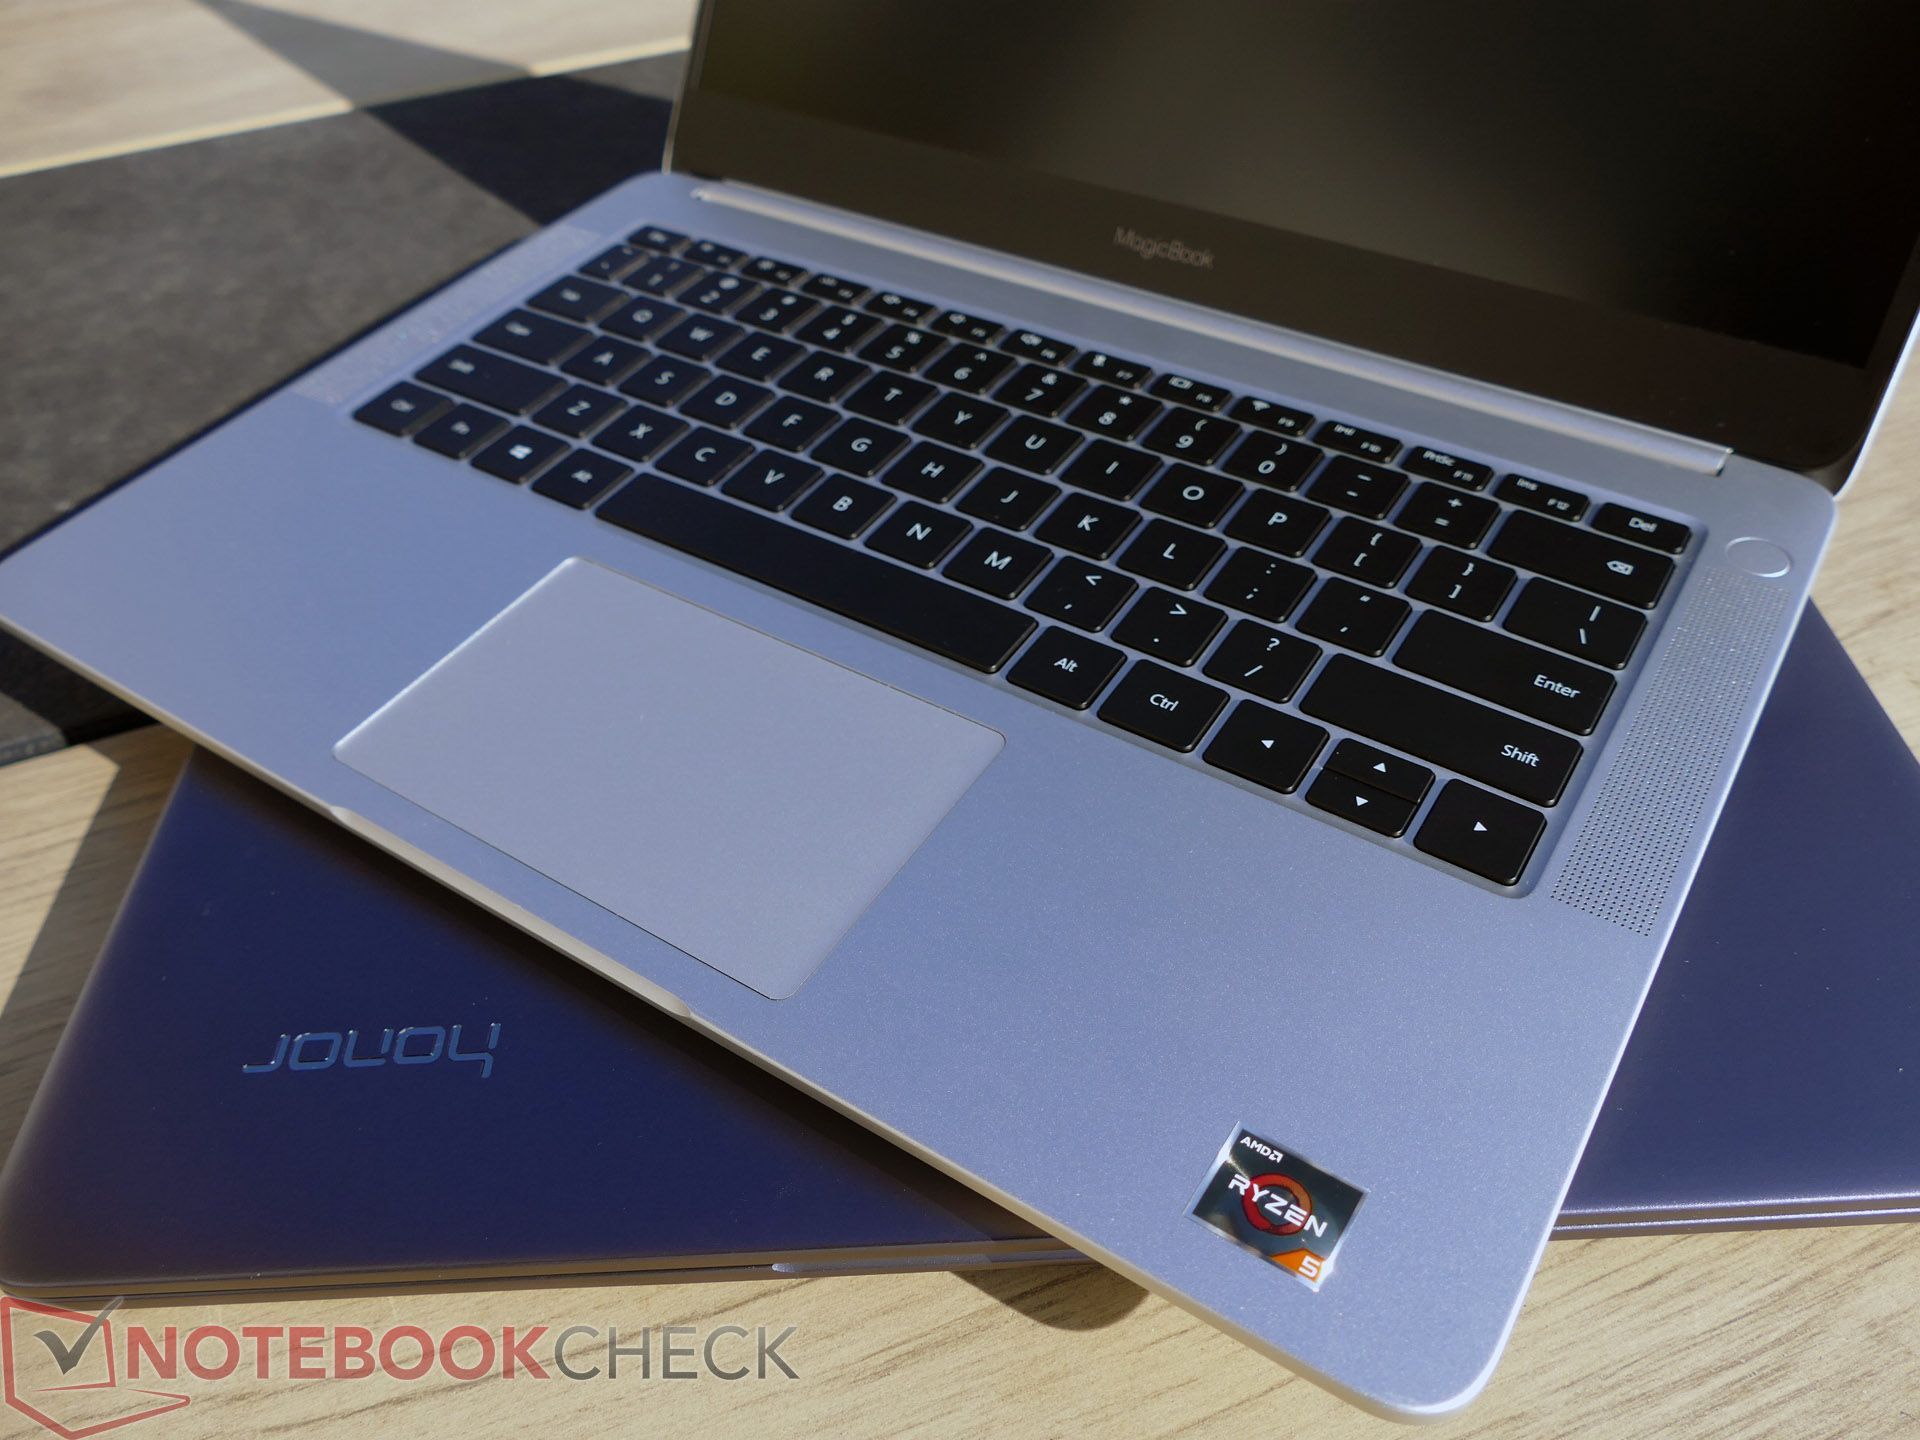
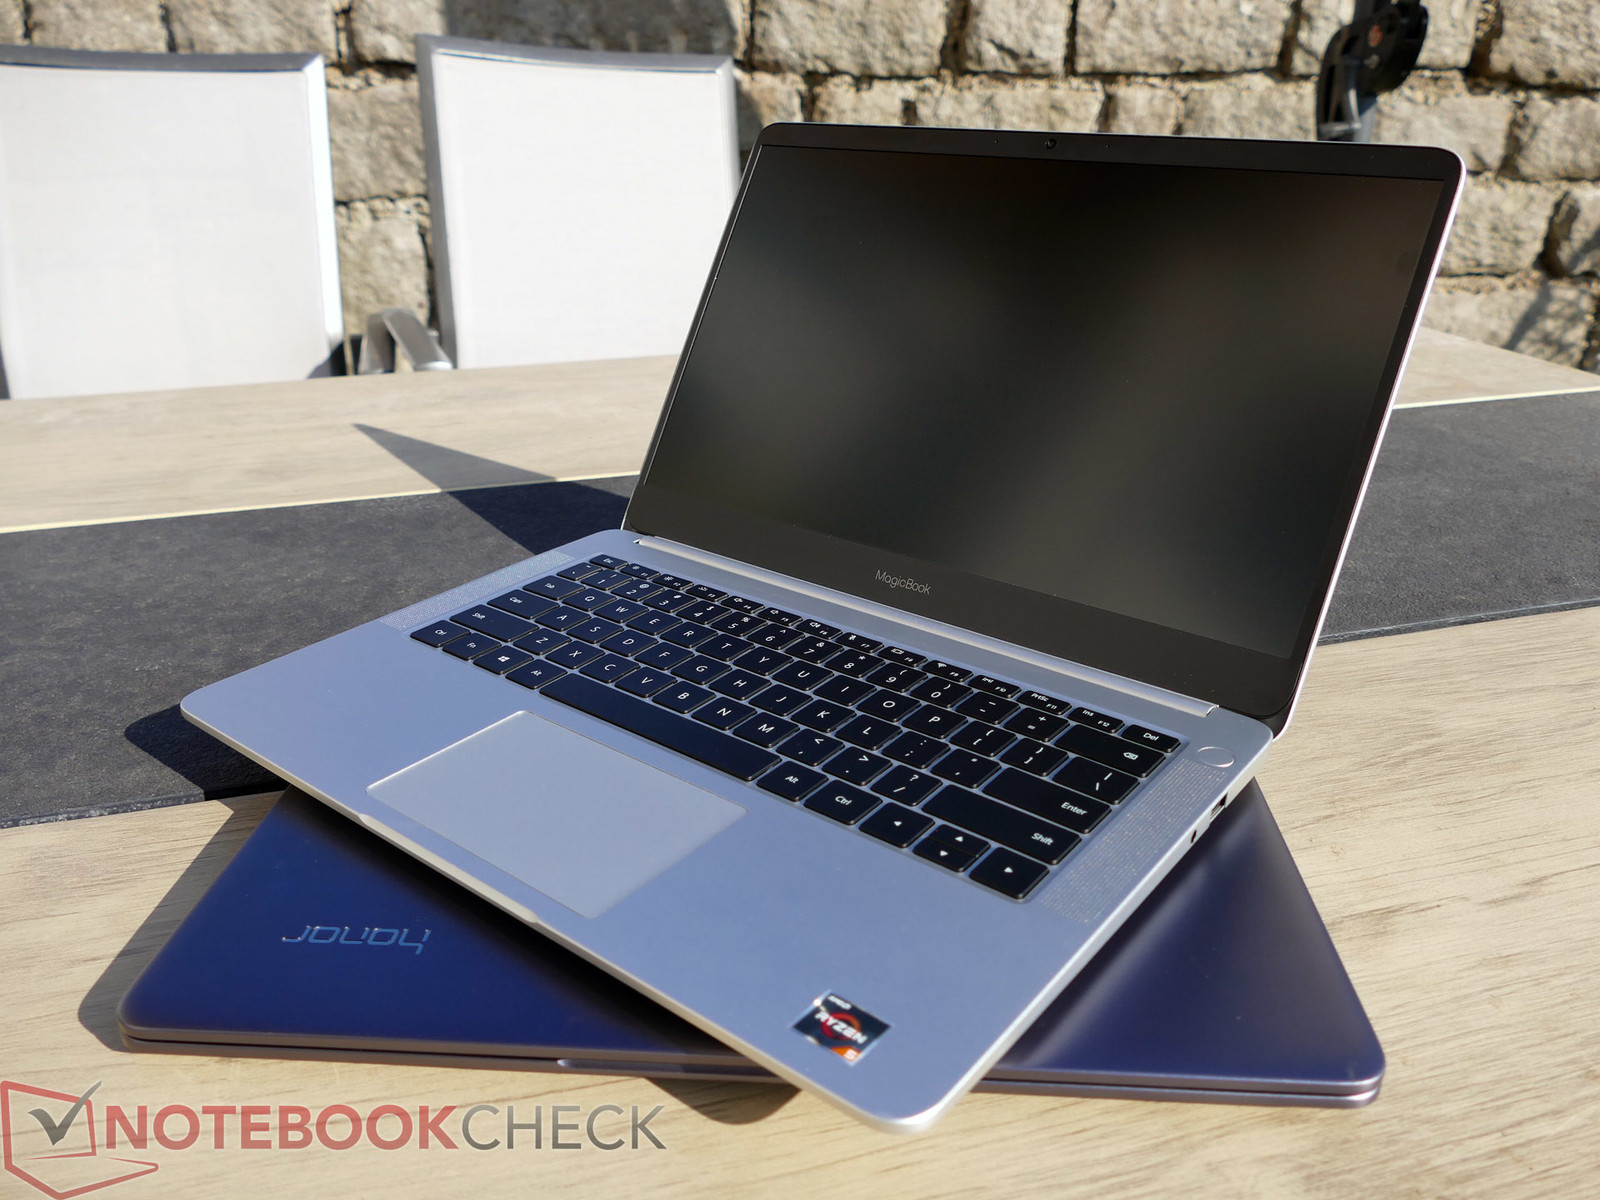
荣耀Magicbook是一台小巧紧凑的14英寸笔记本电脑,它的定位在办公本和多媒体笔记本之间。3999-4999元的售价使得它非常具有性价比。
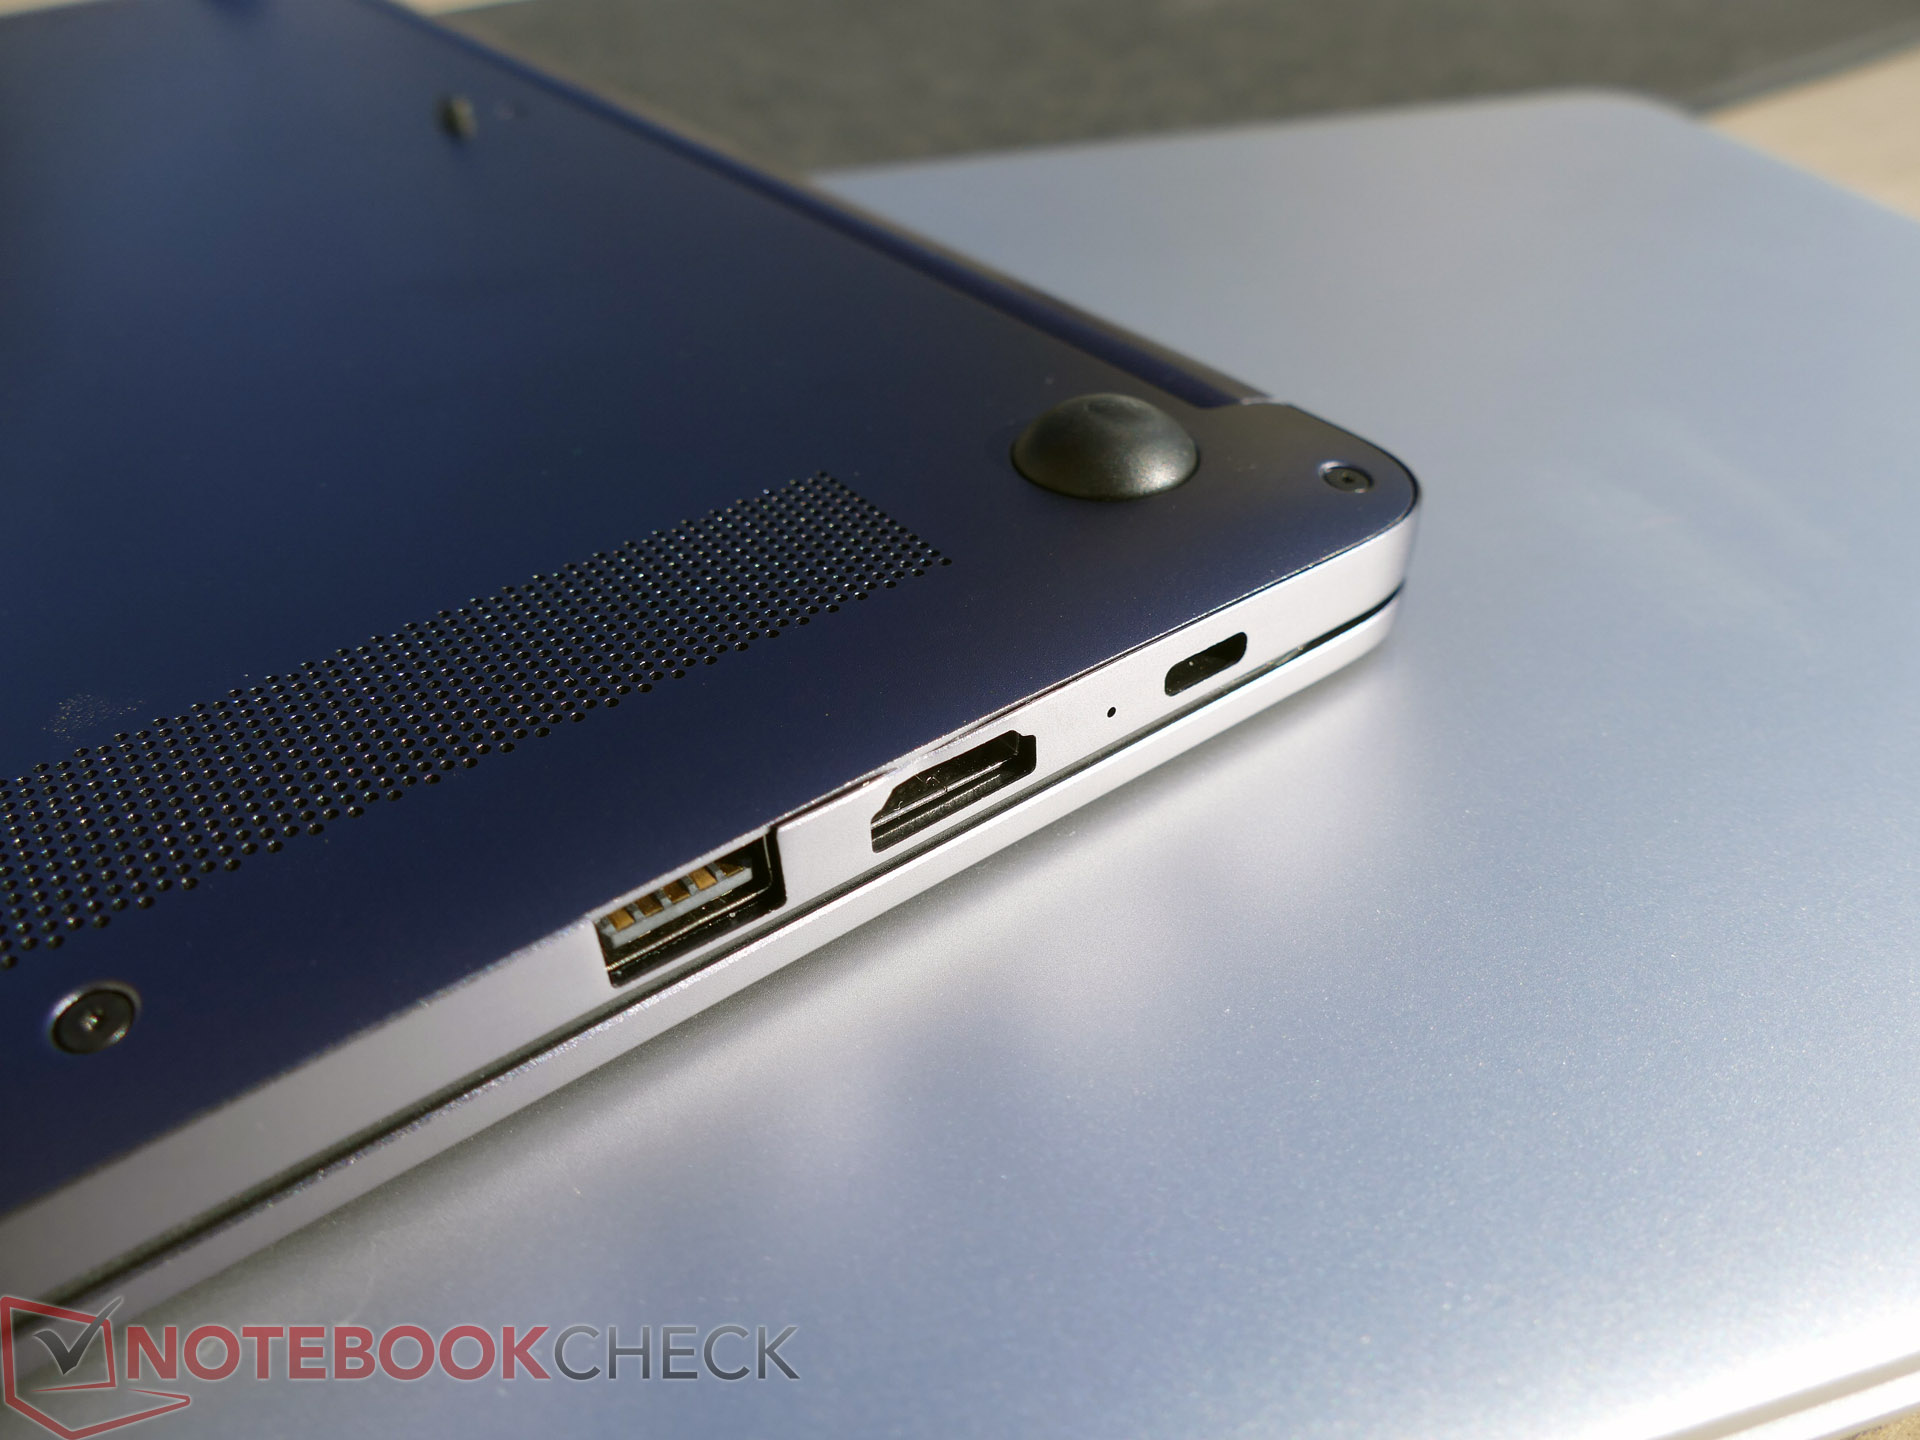
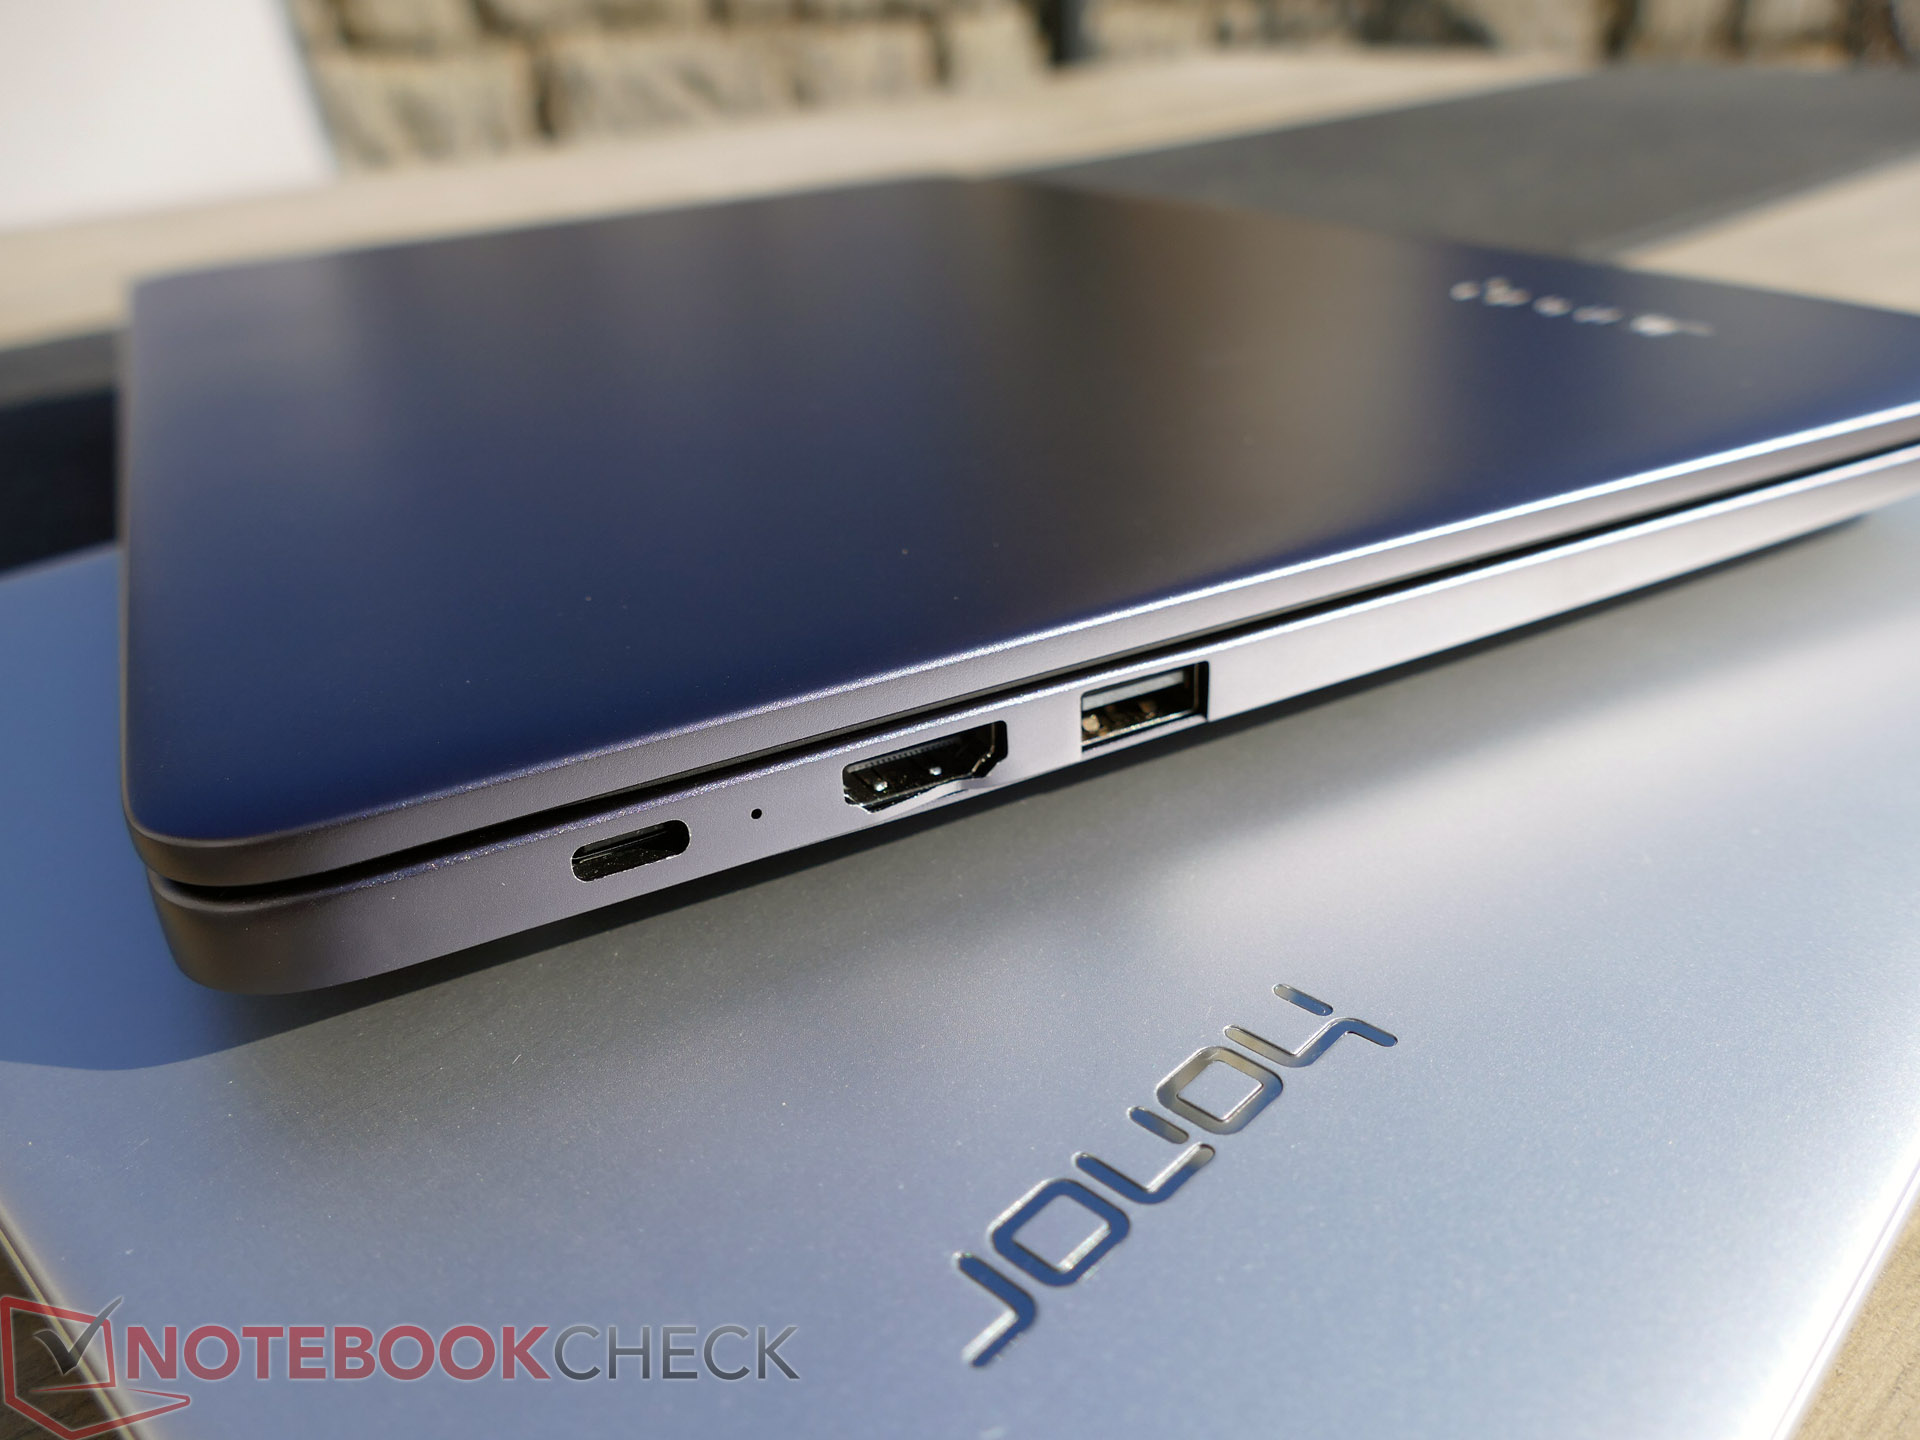
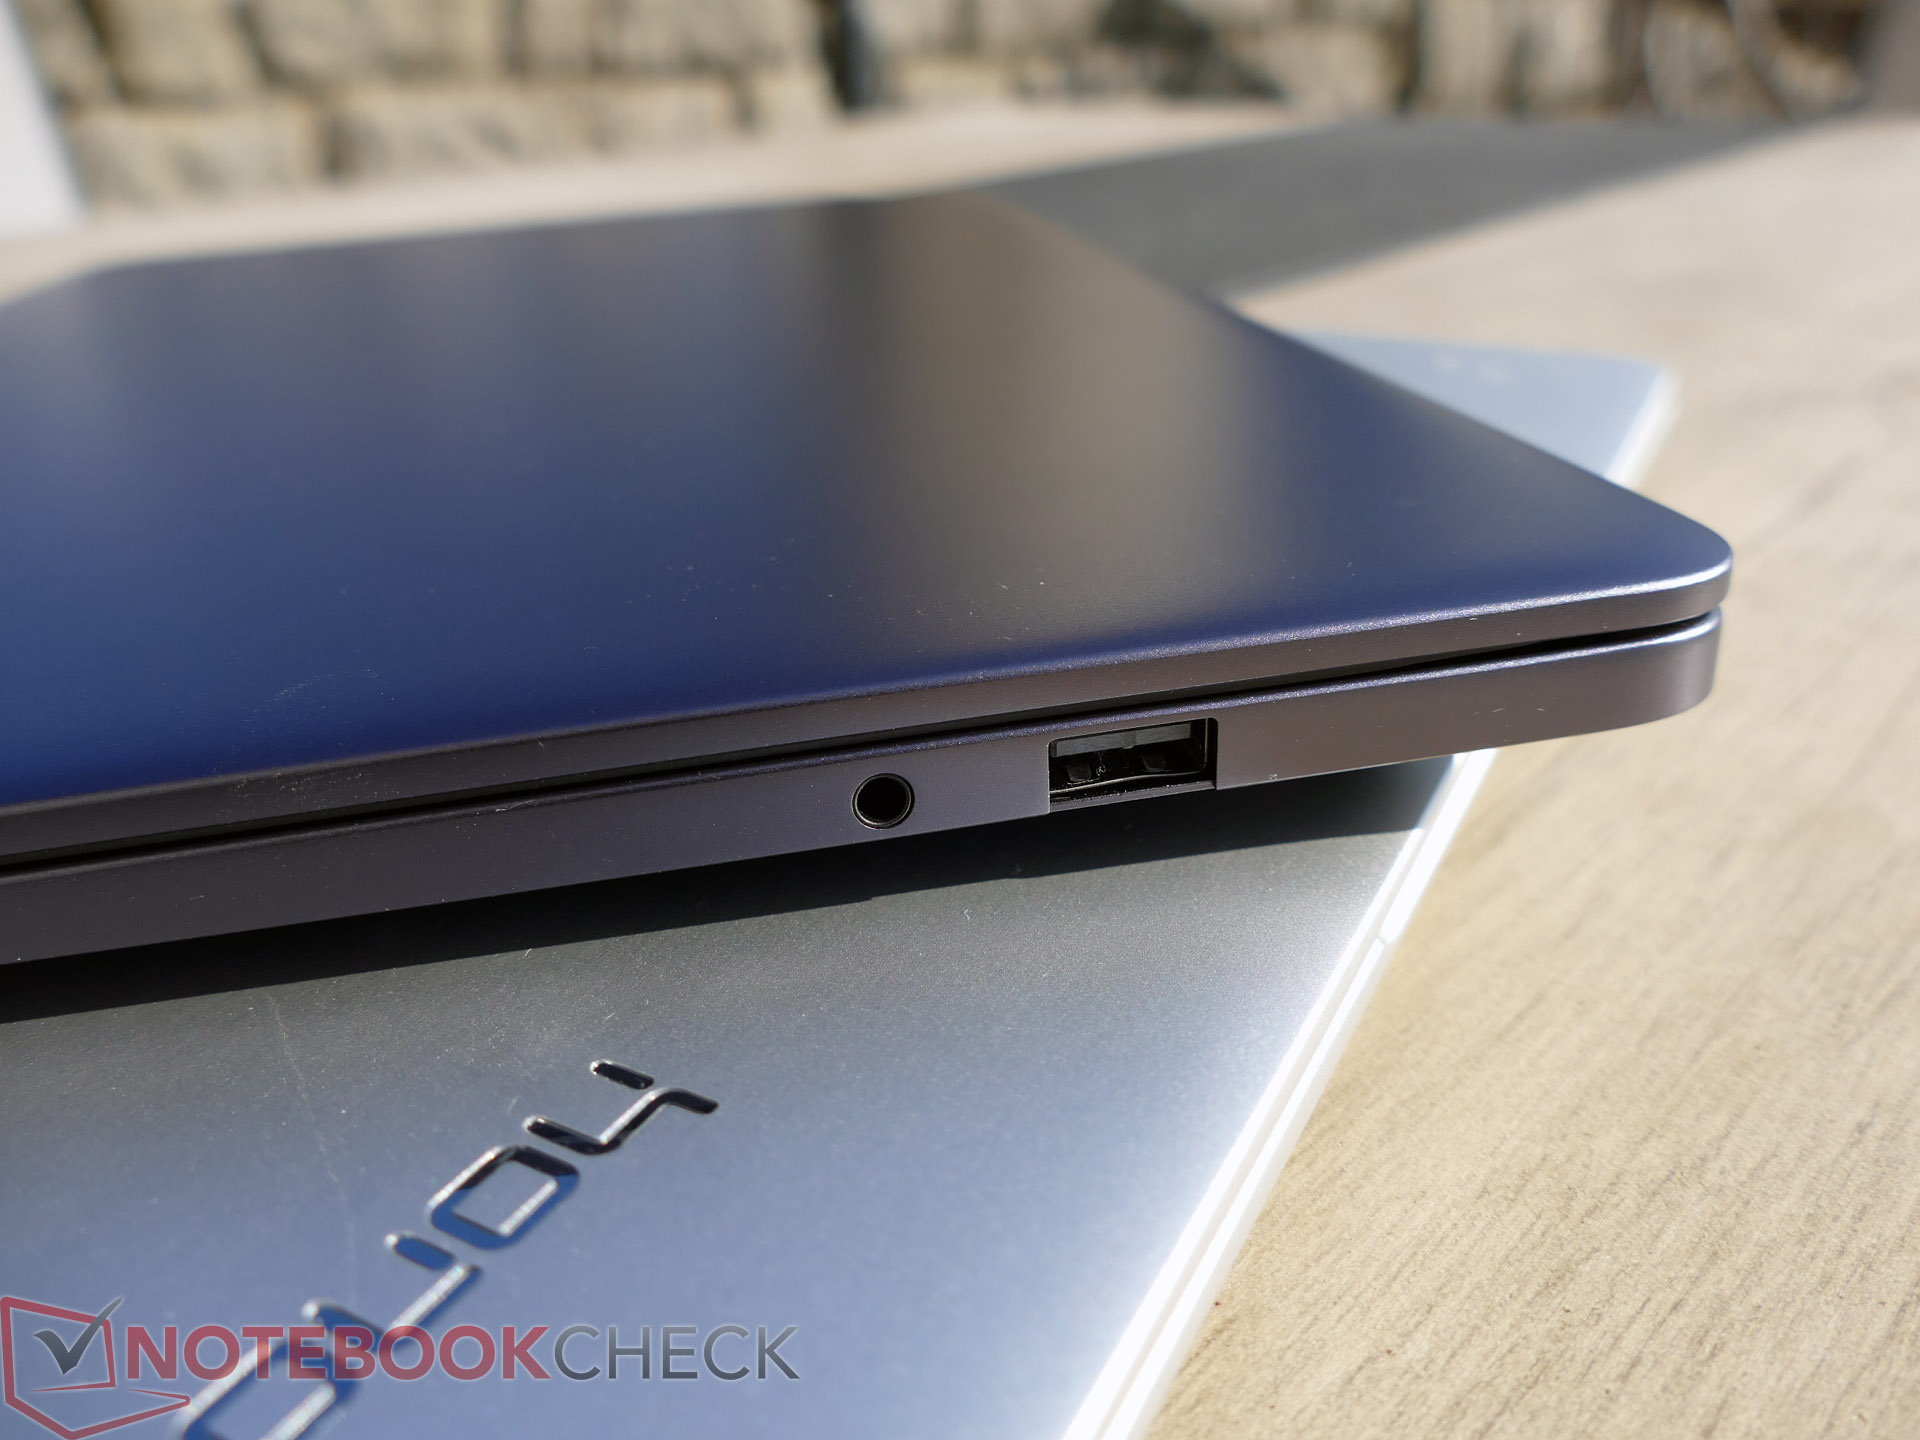
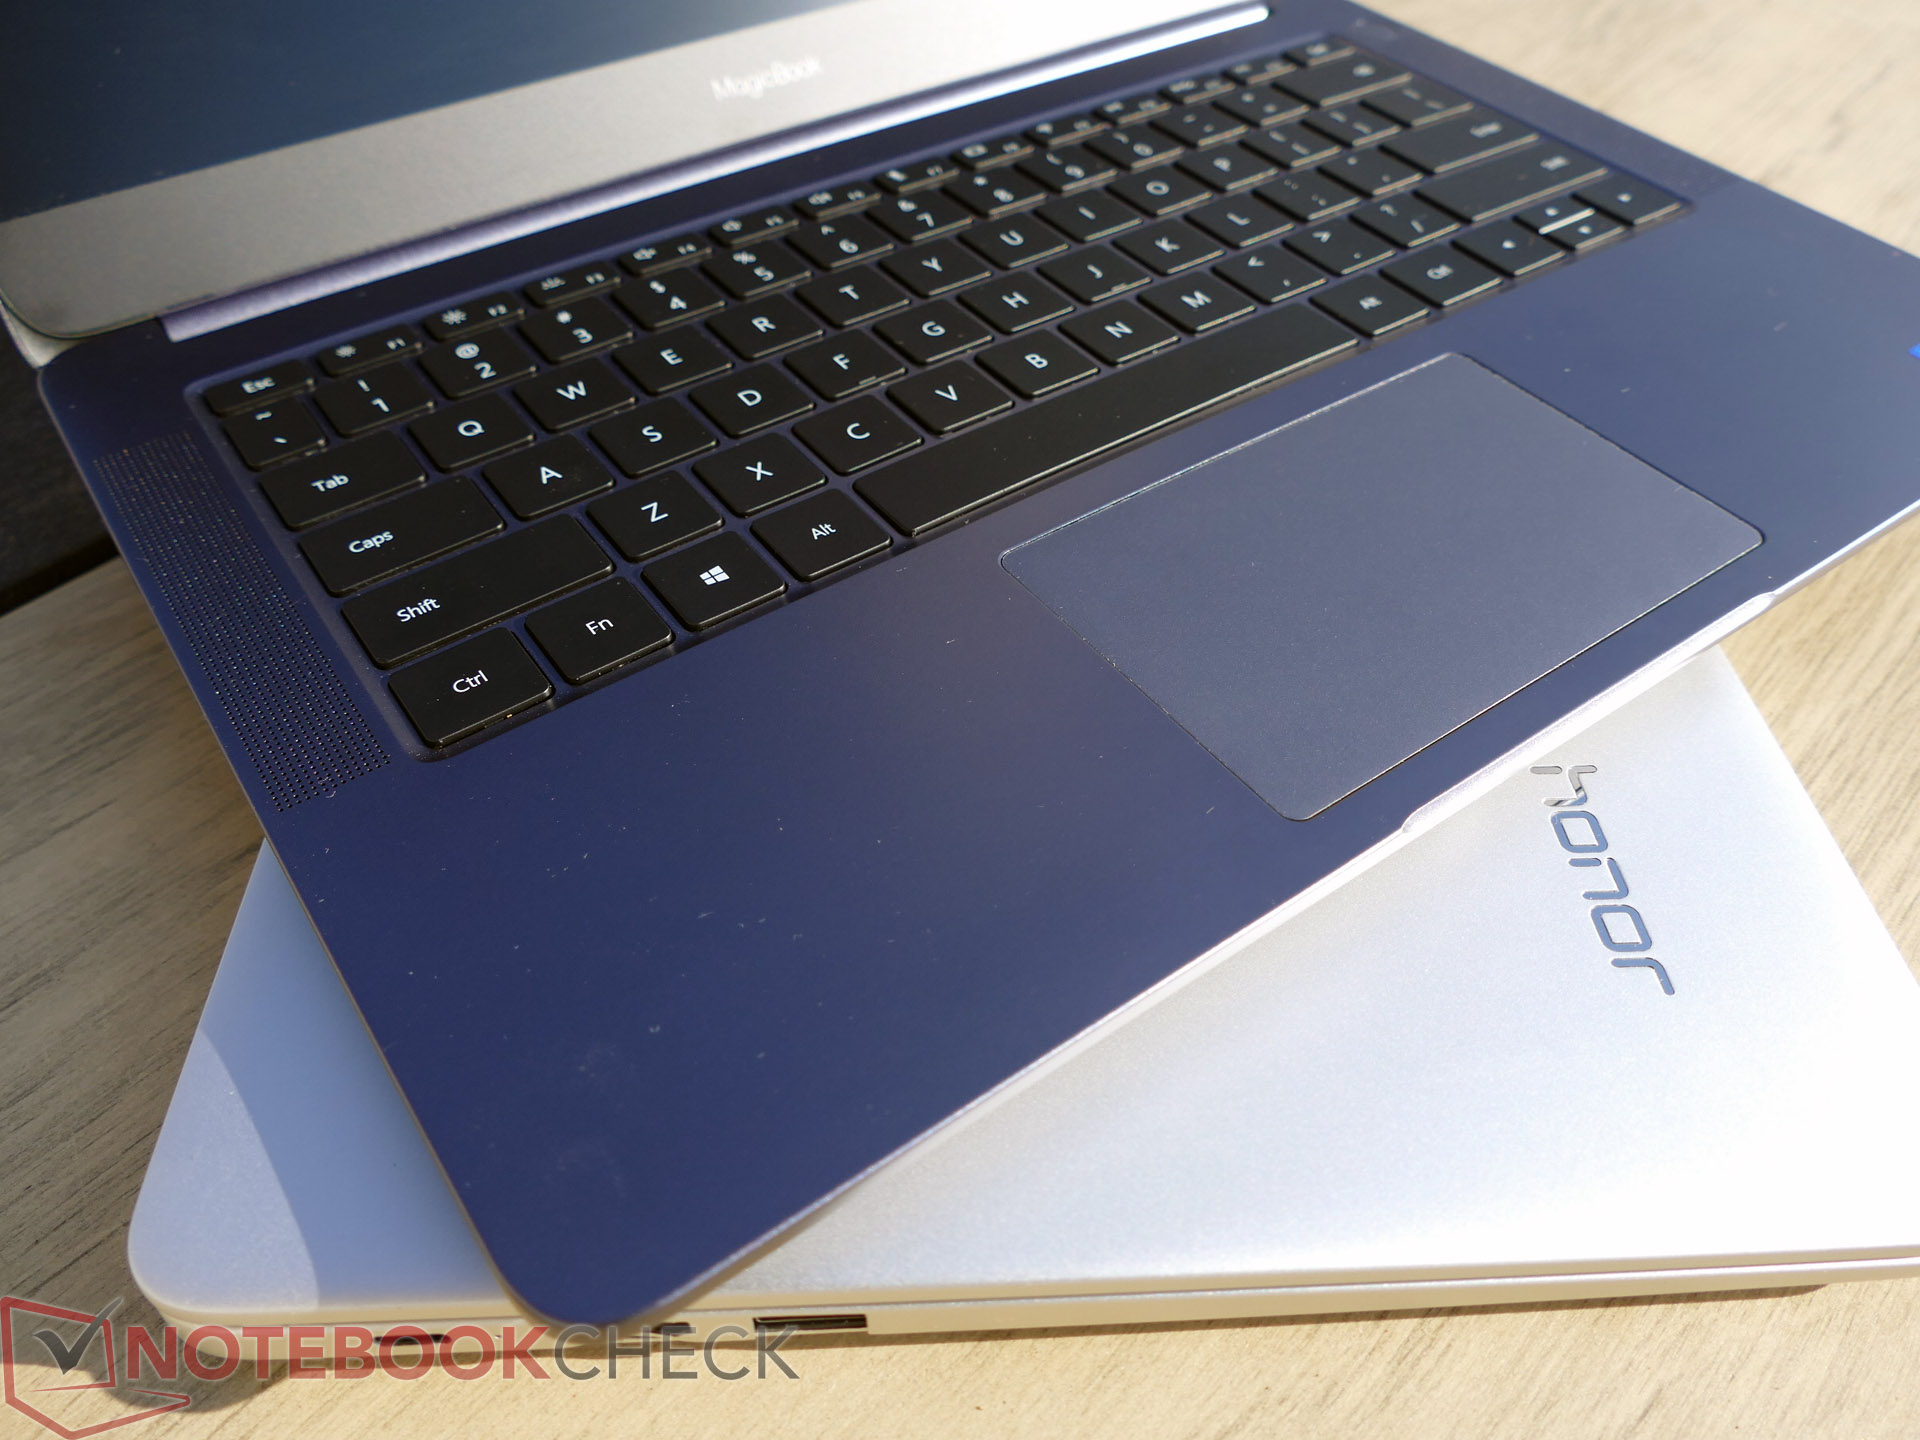
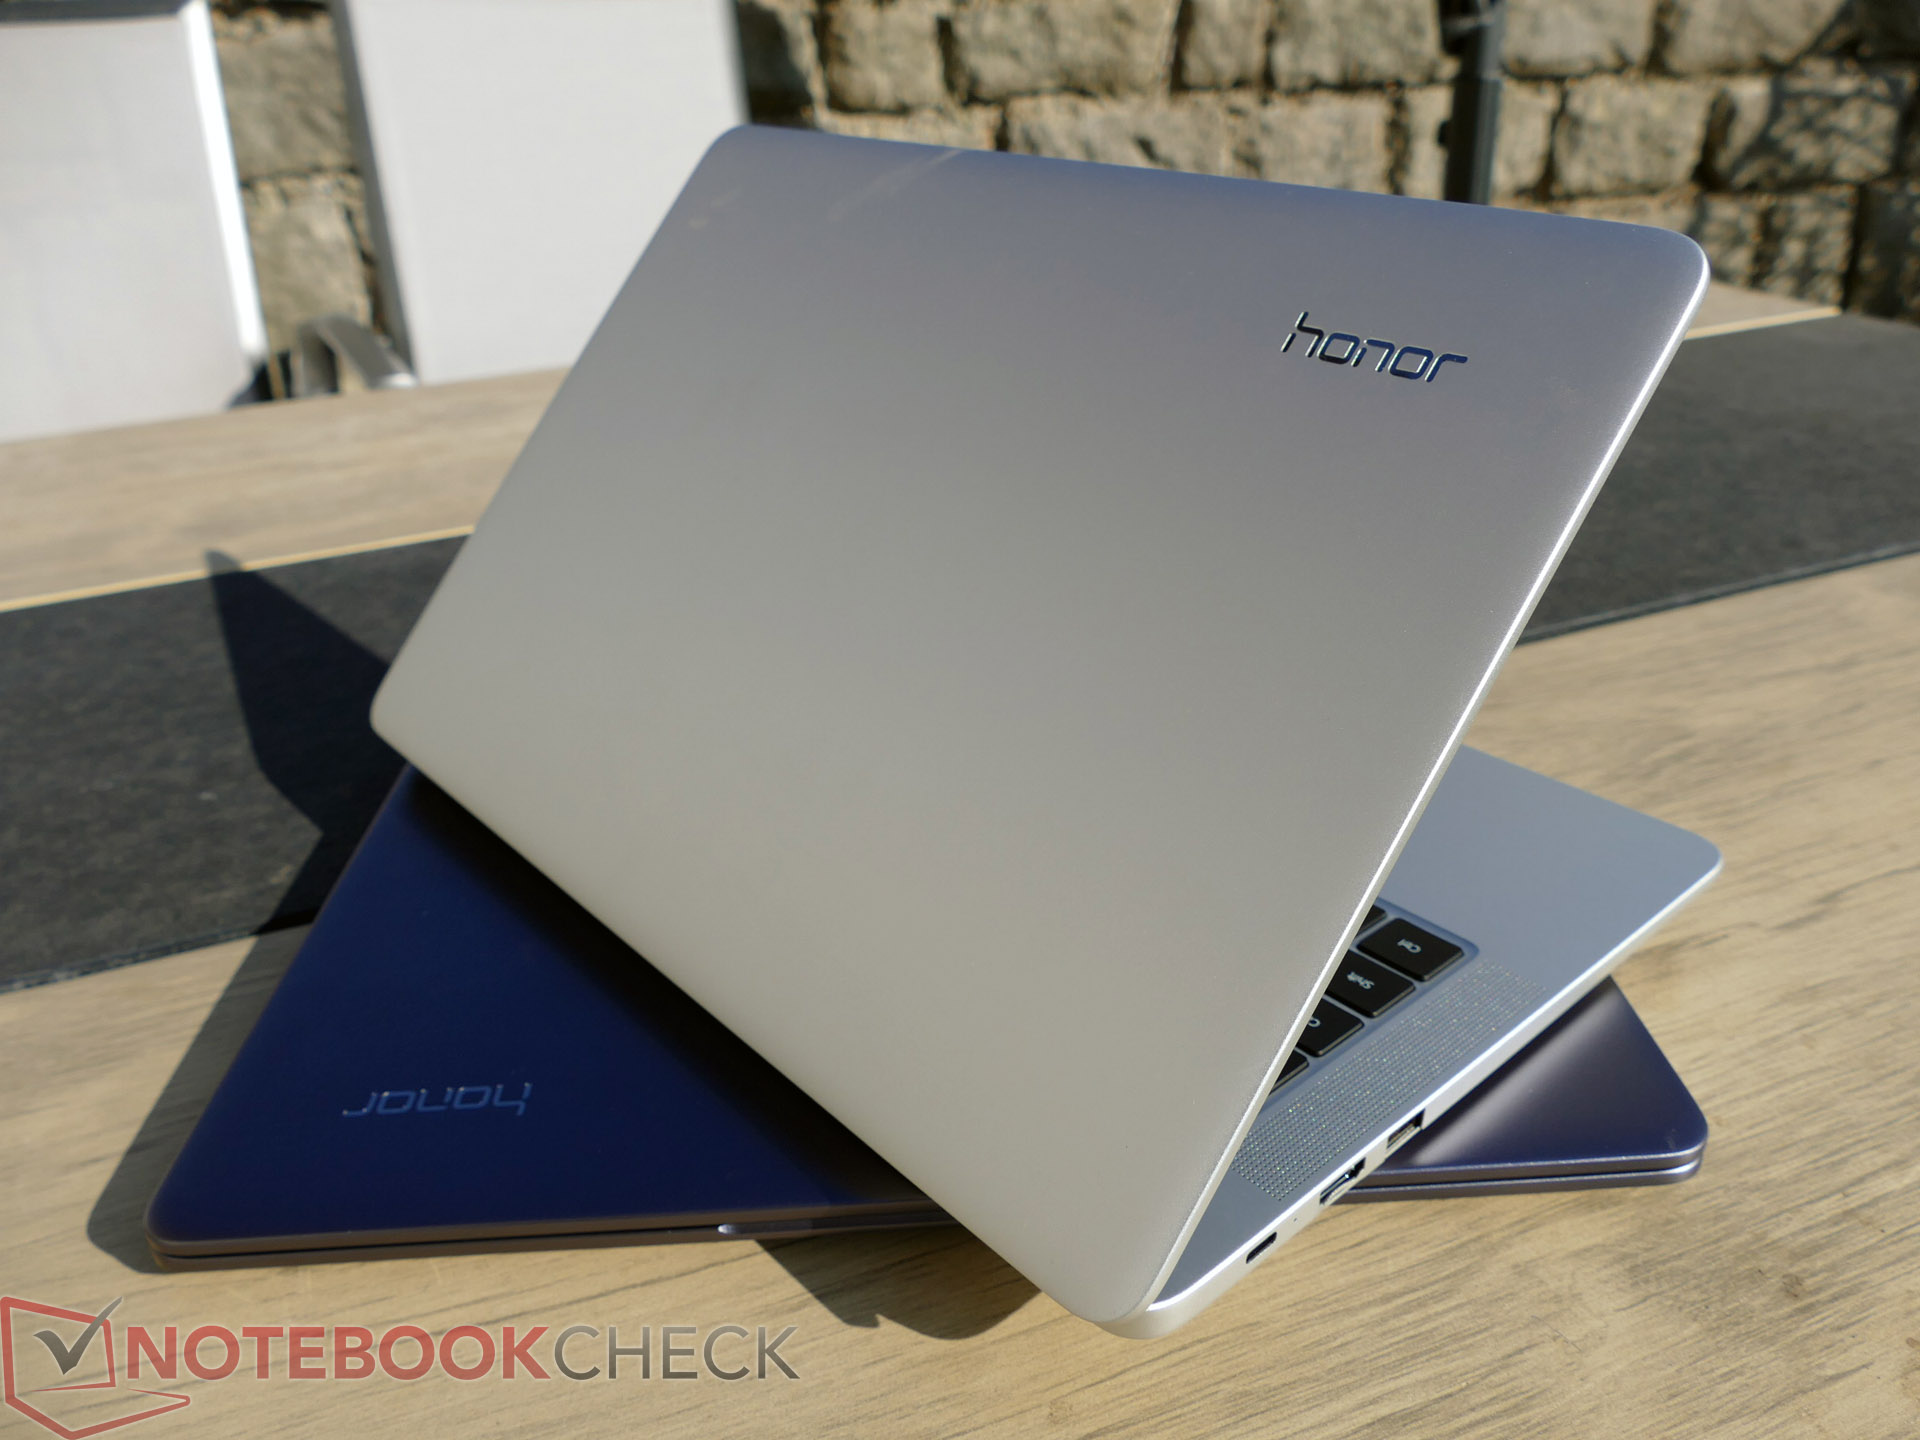
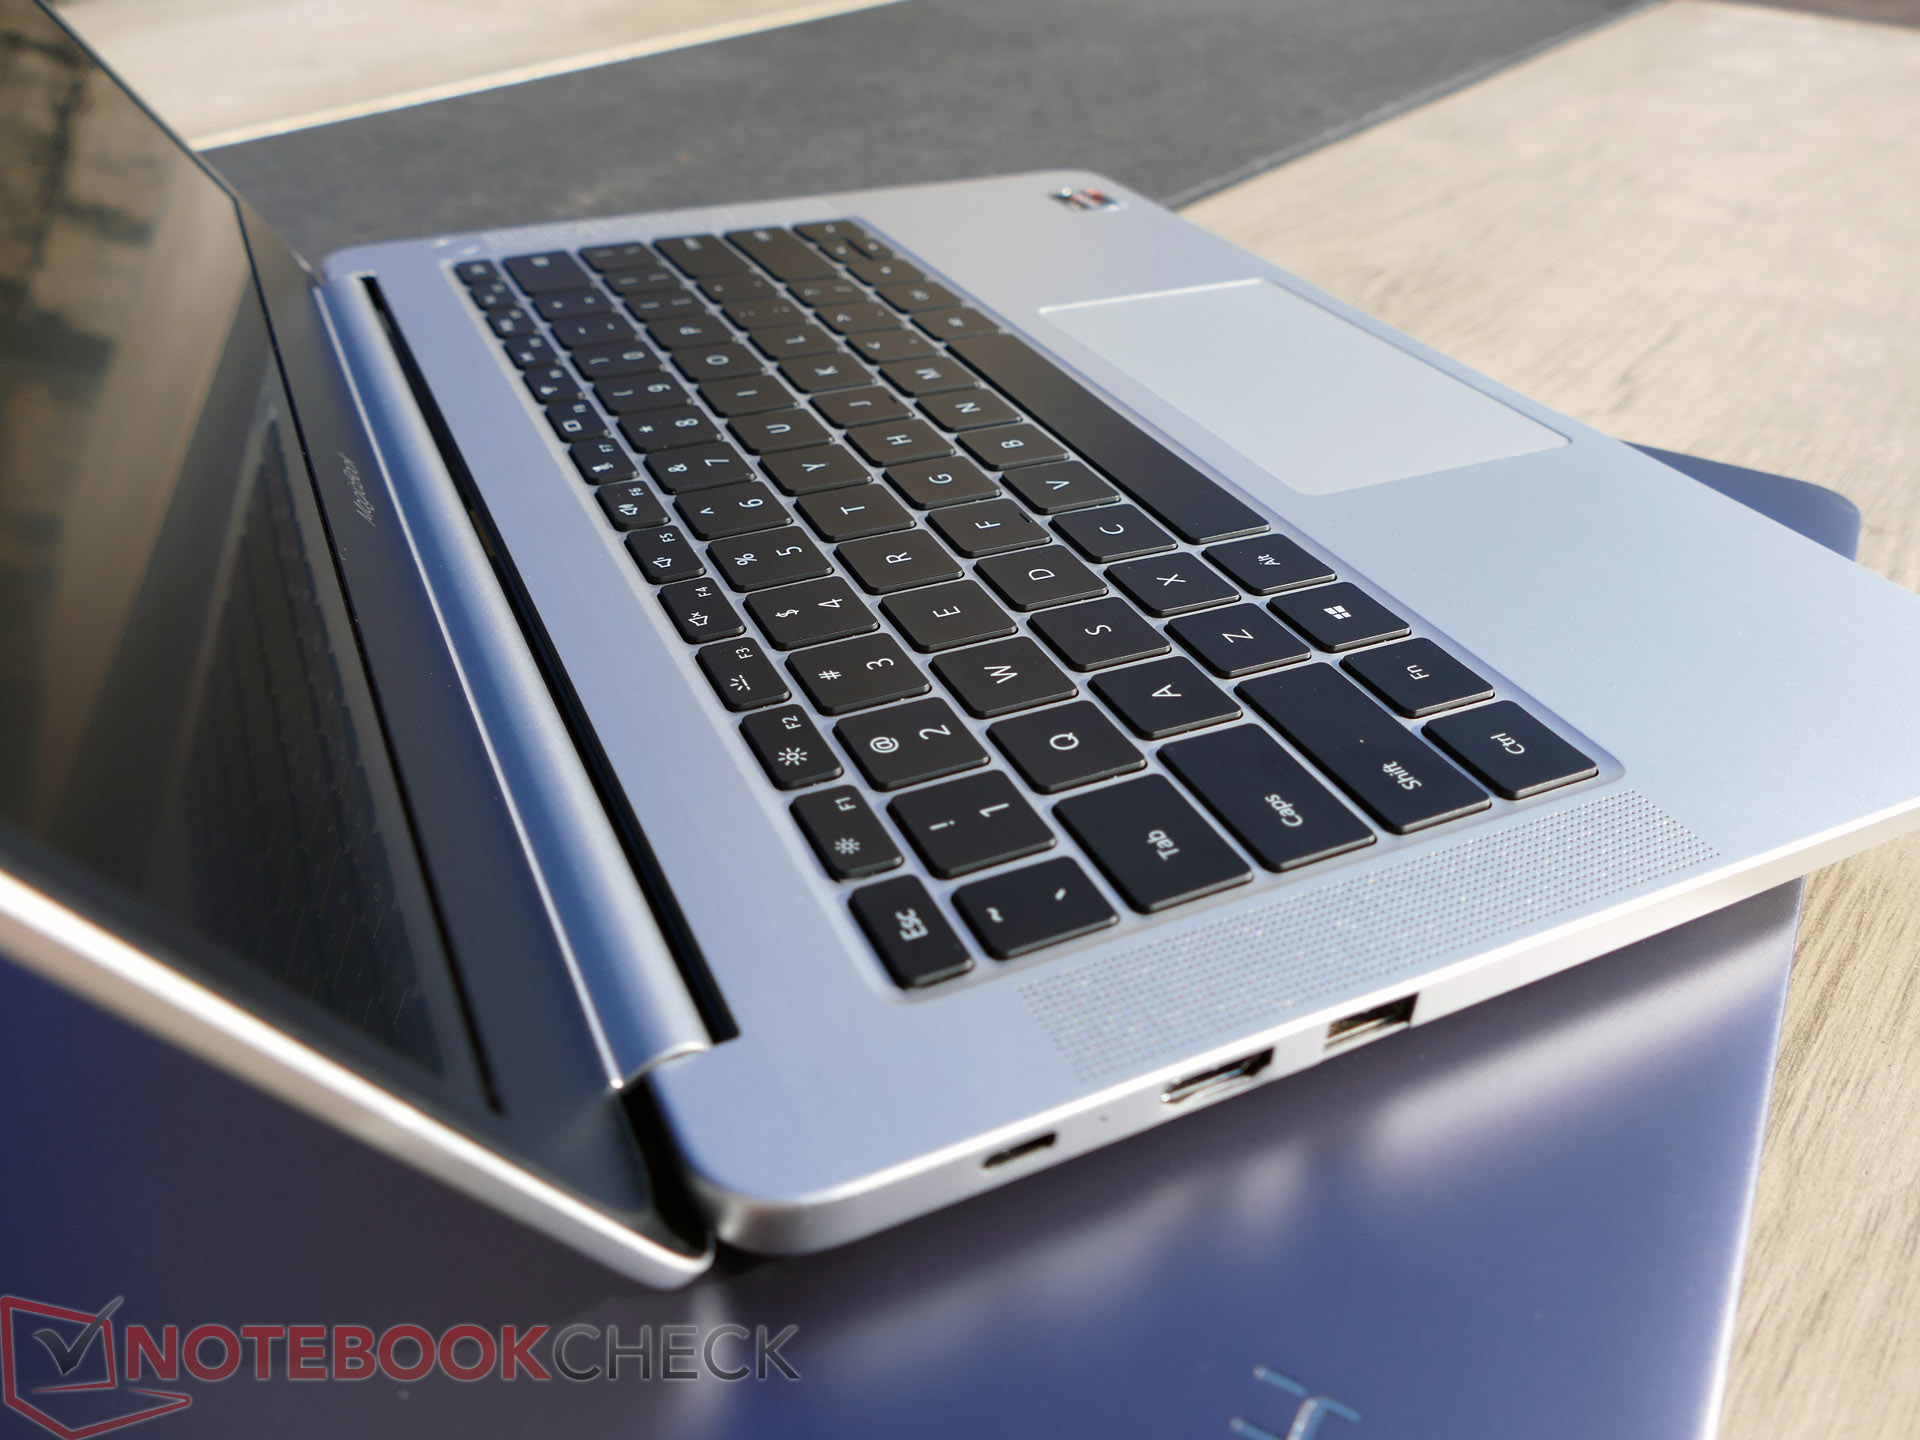
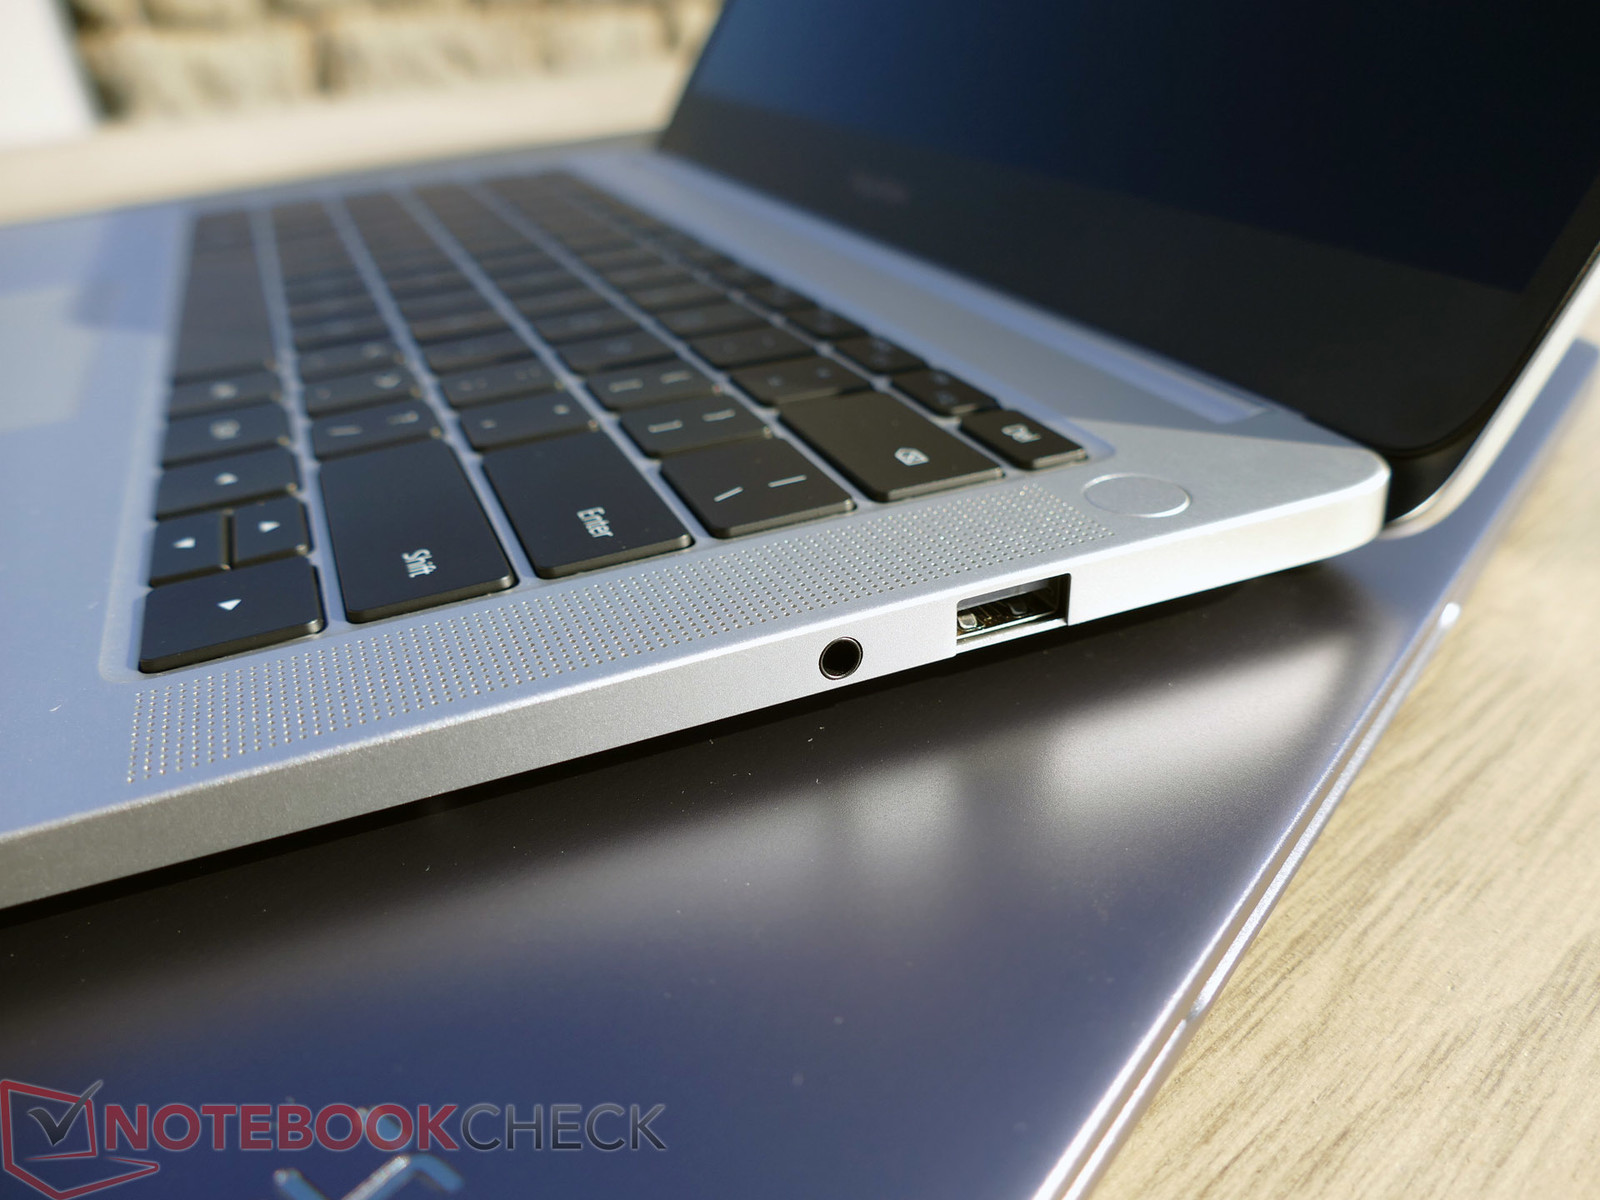
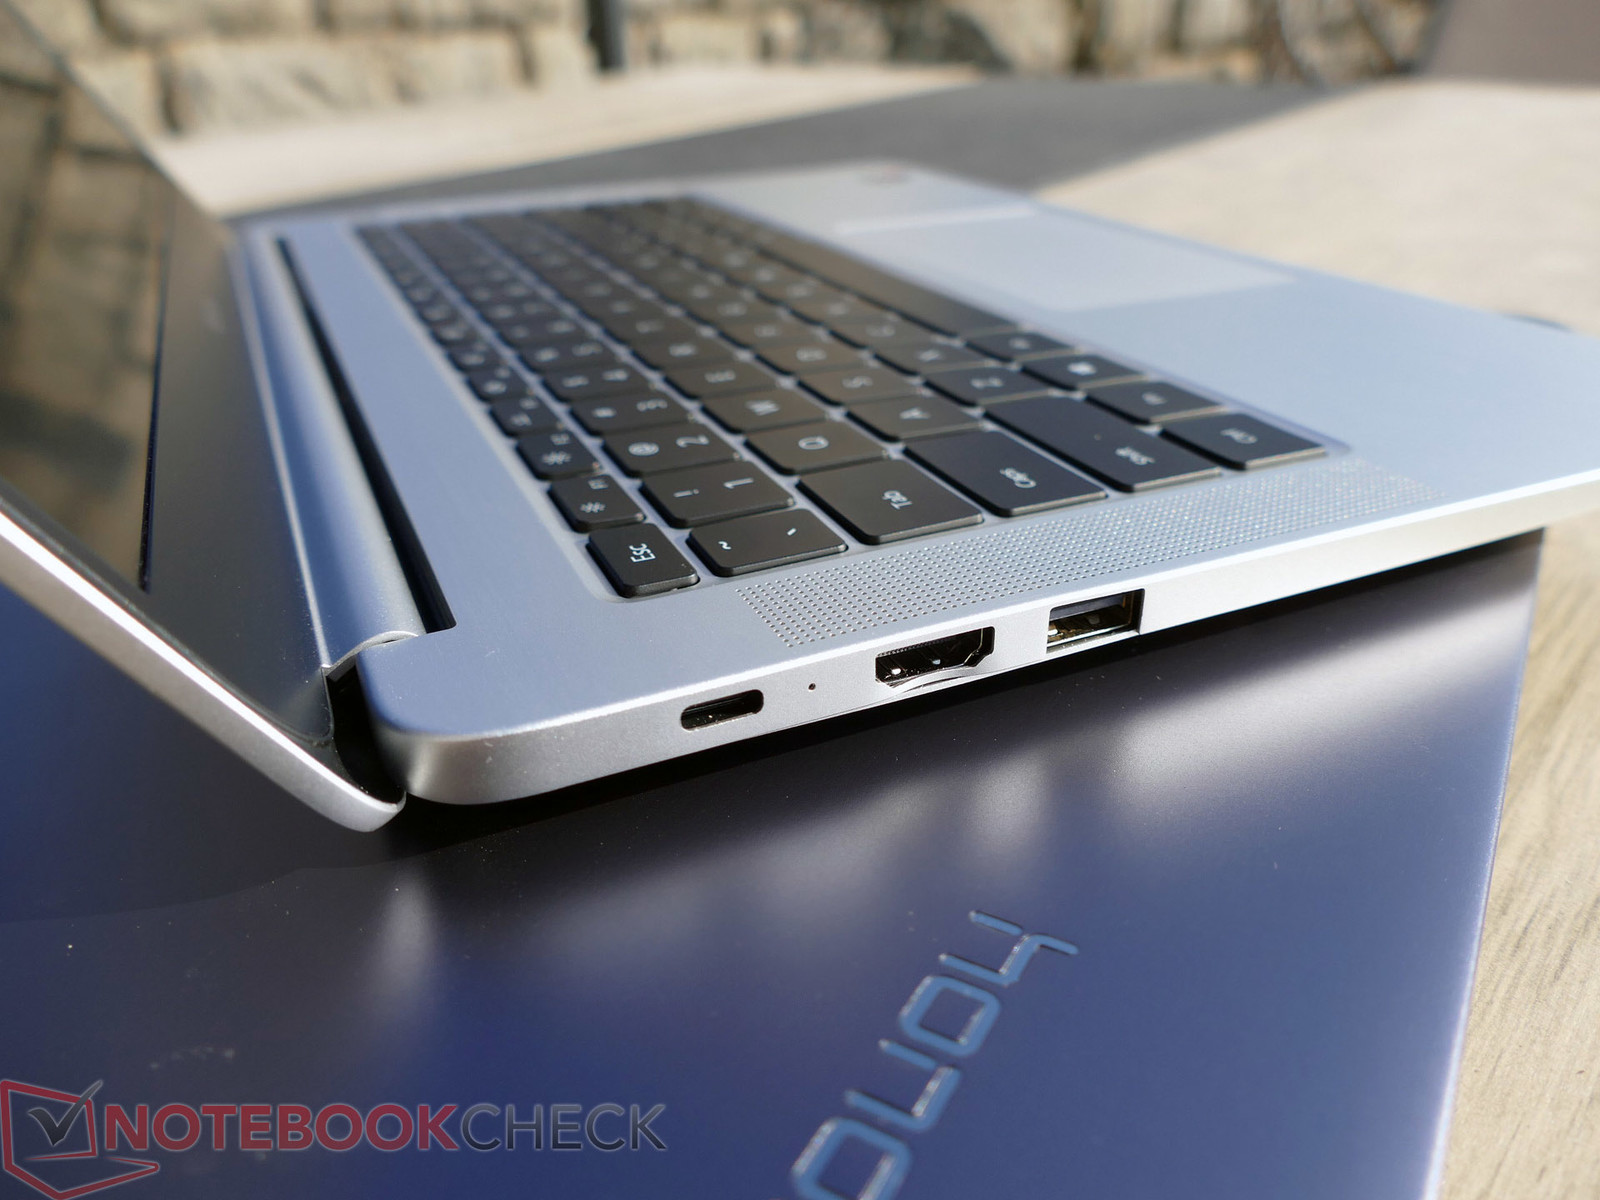
虽然全金属外壳有着高品质的外观,但它也有一些小的做工缺陷。与竞争产品相比,荣耀Magicbook更薄更轻,而在接口方面,Type-C的存在值得一提,同时这个接口还支持充电。Magicbook在我们的Wi-Fi测试中同样表现不俗。
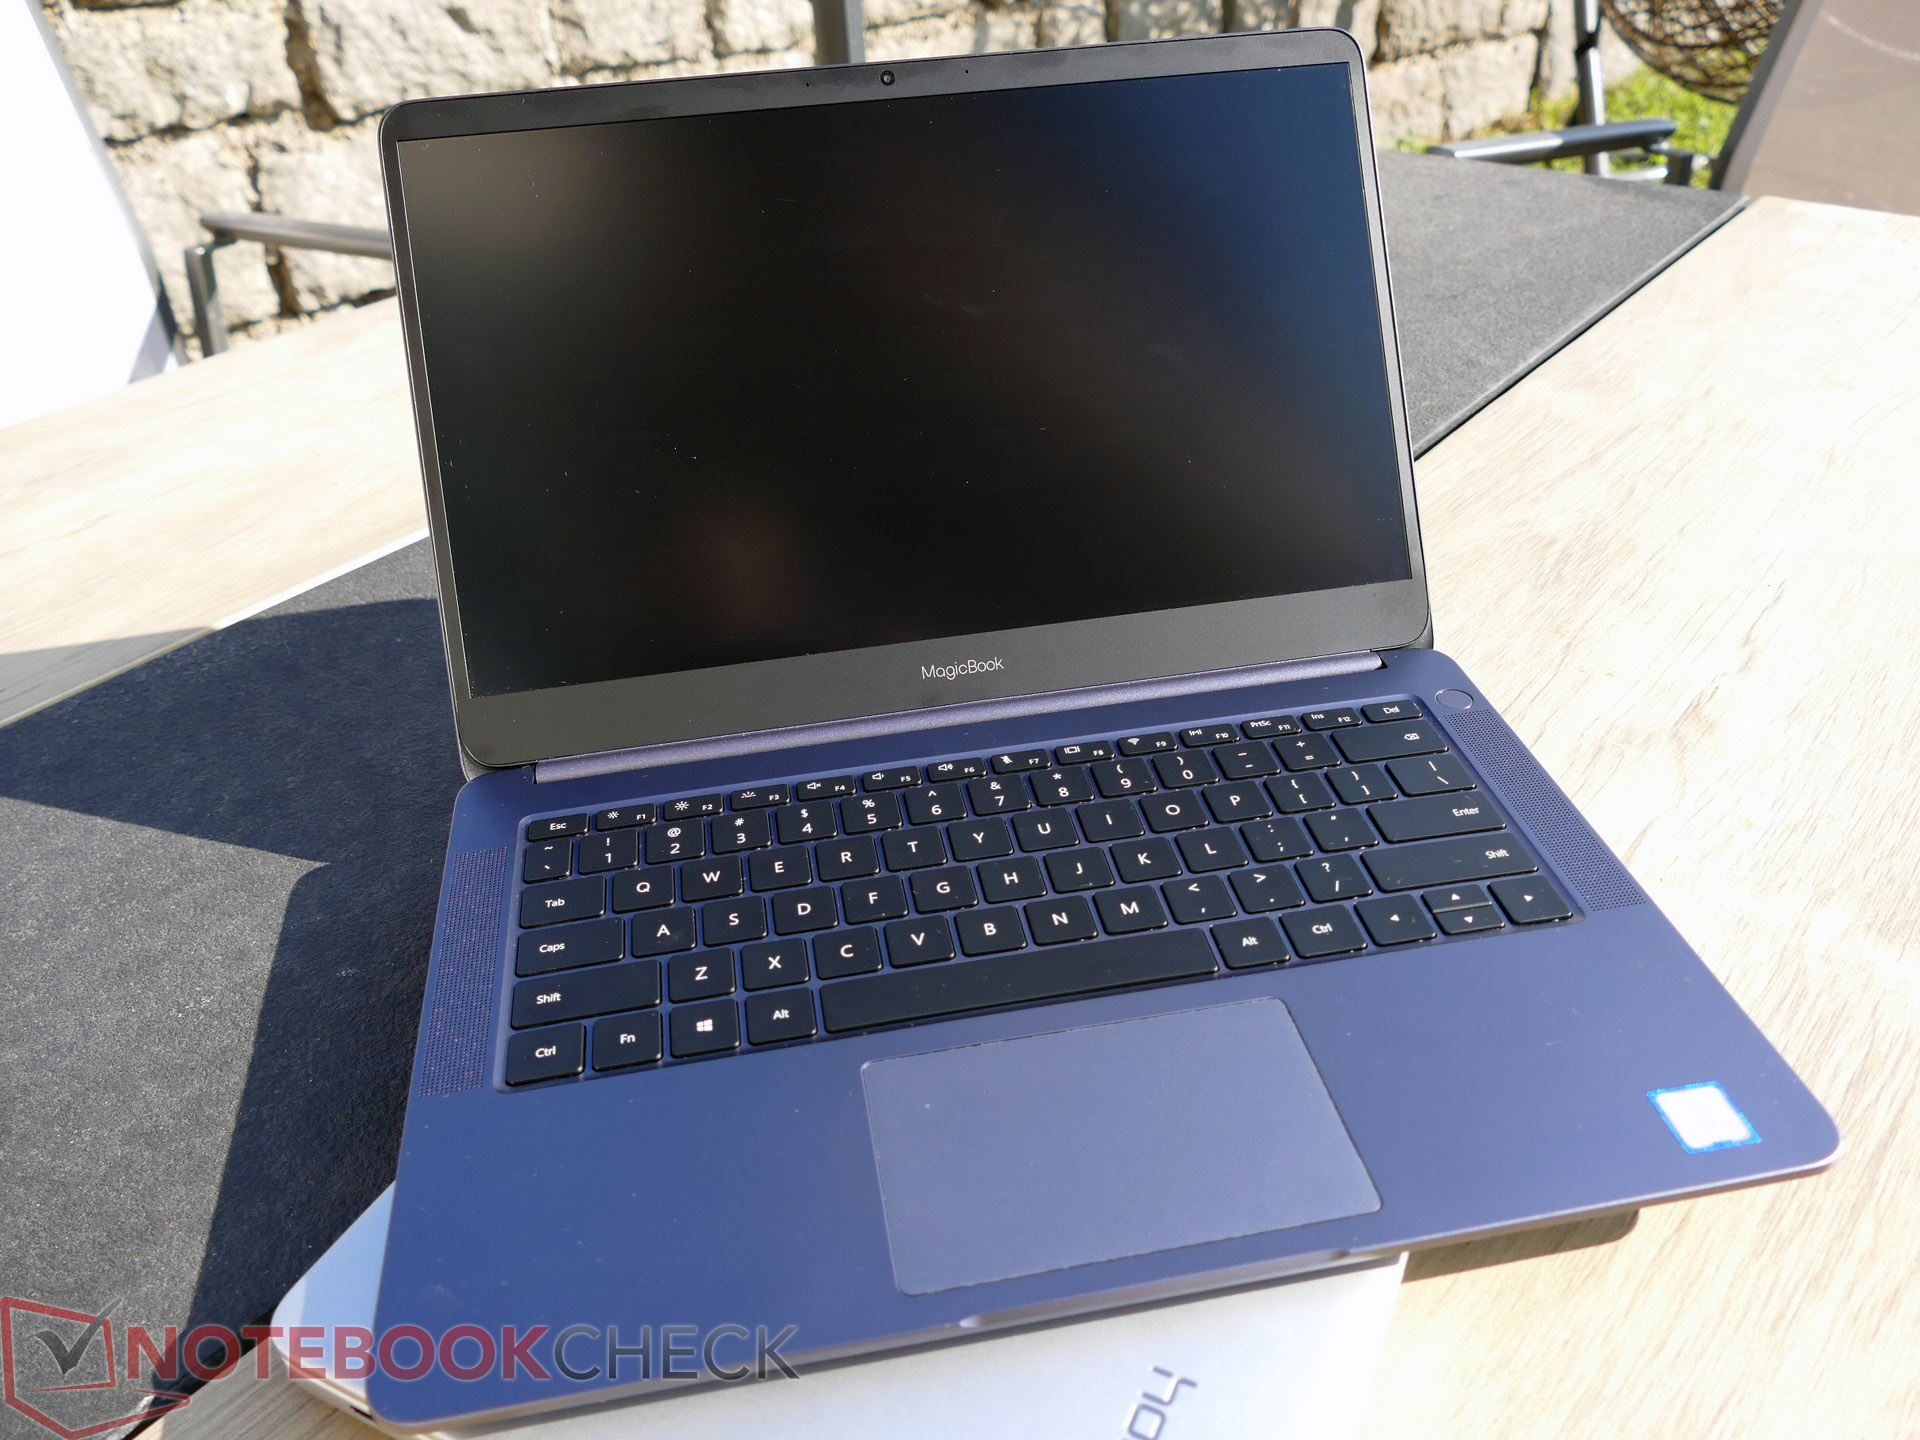
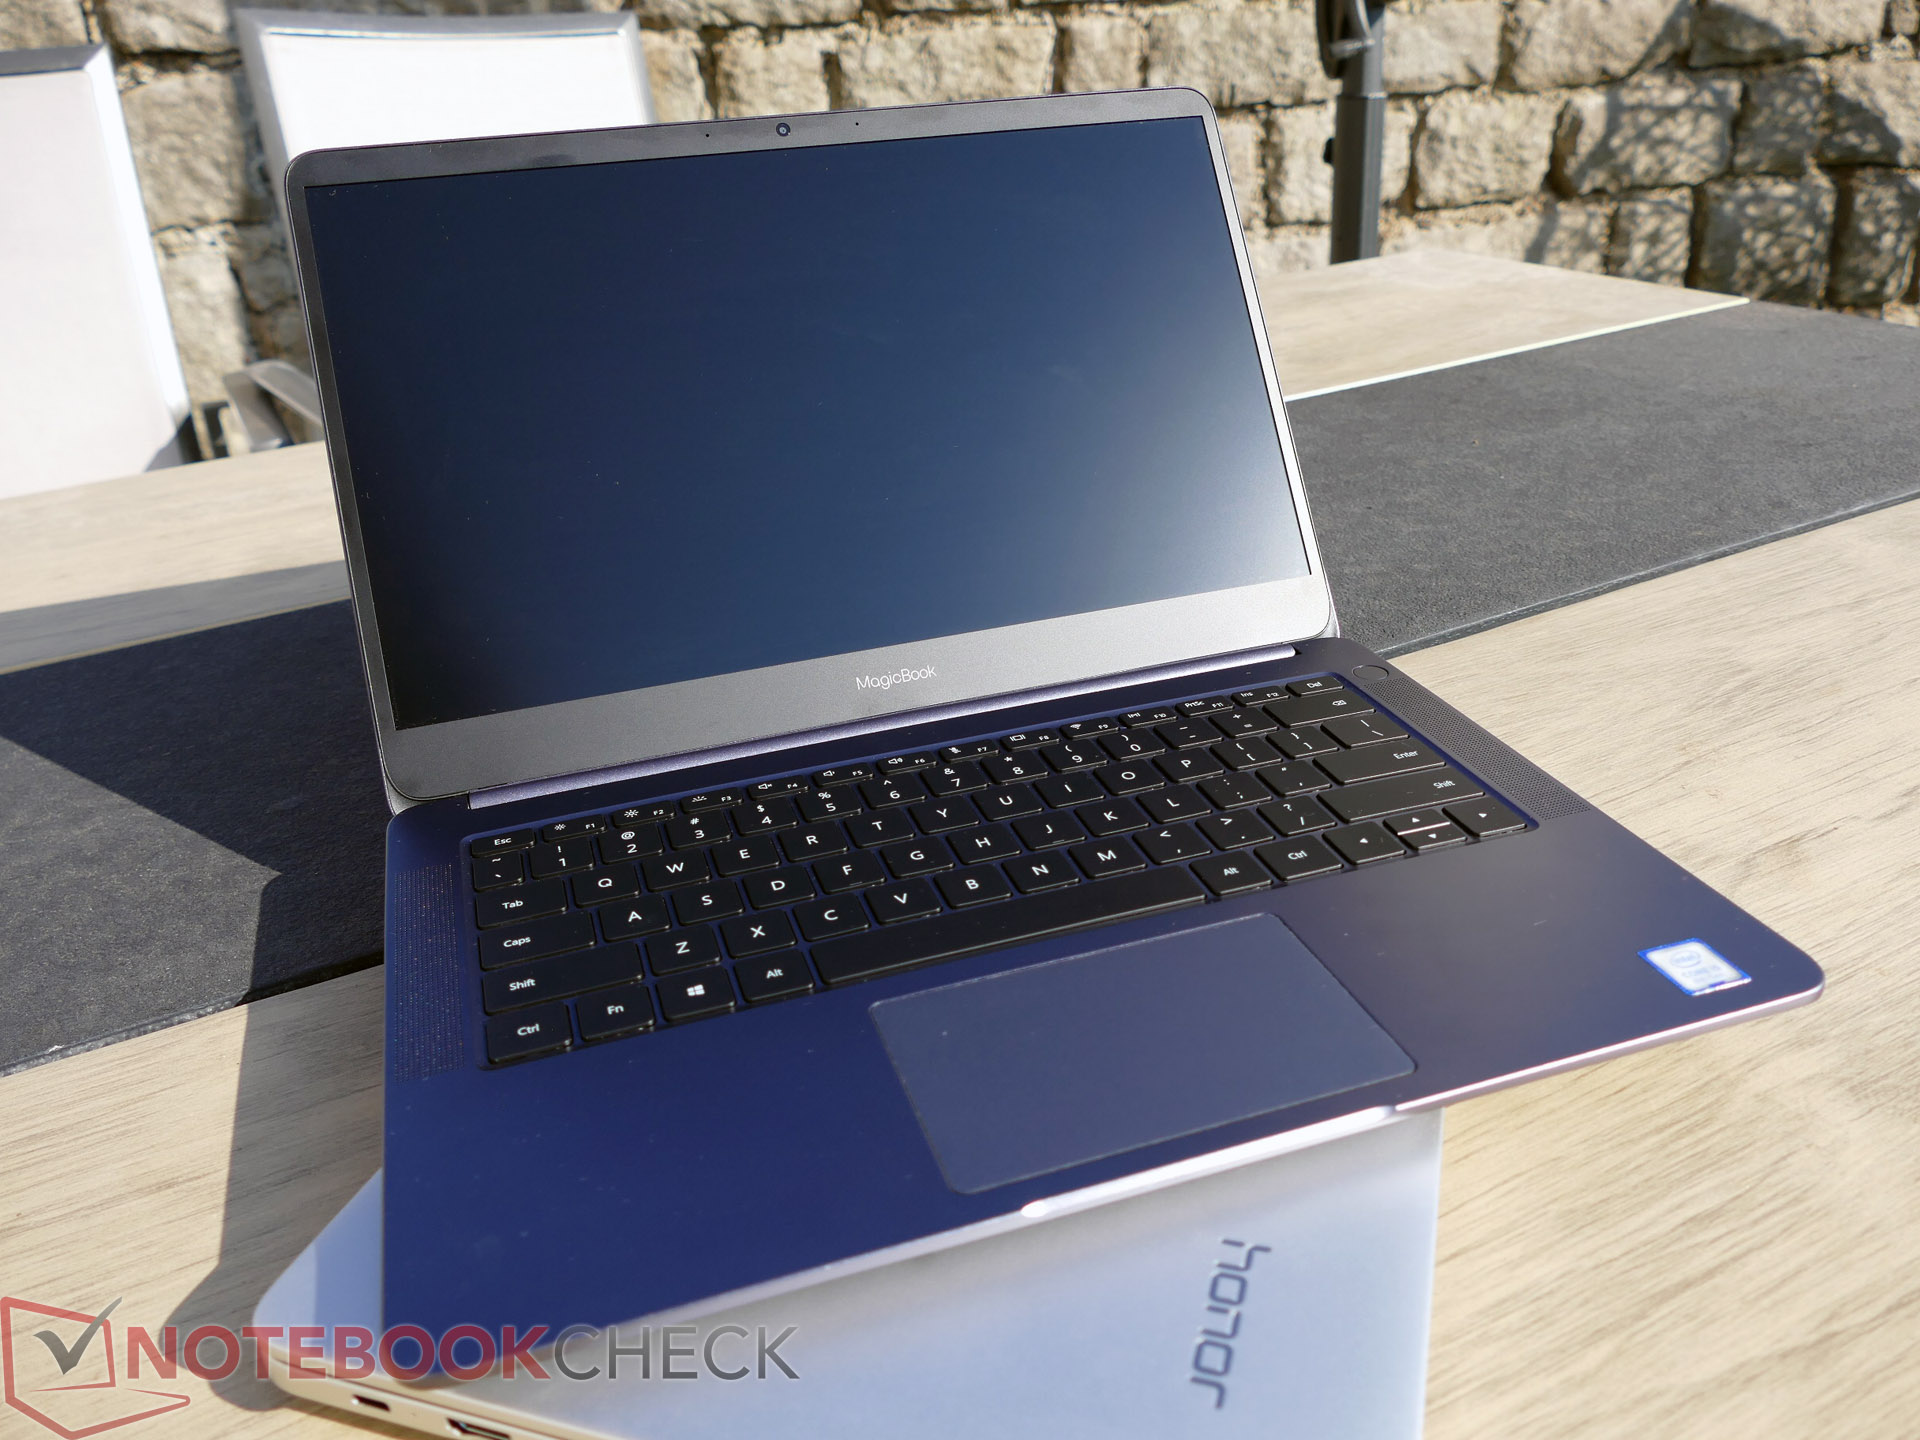
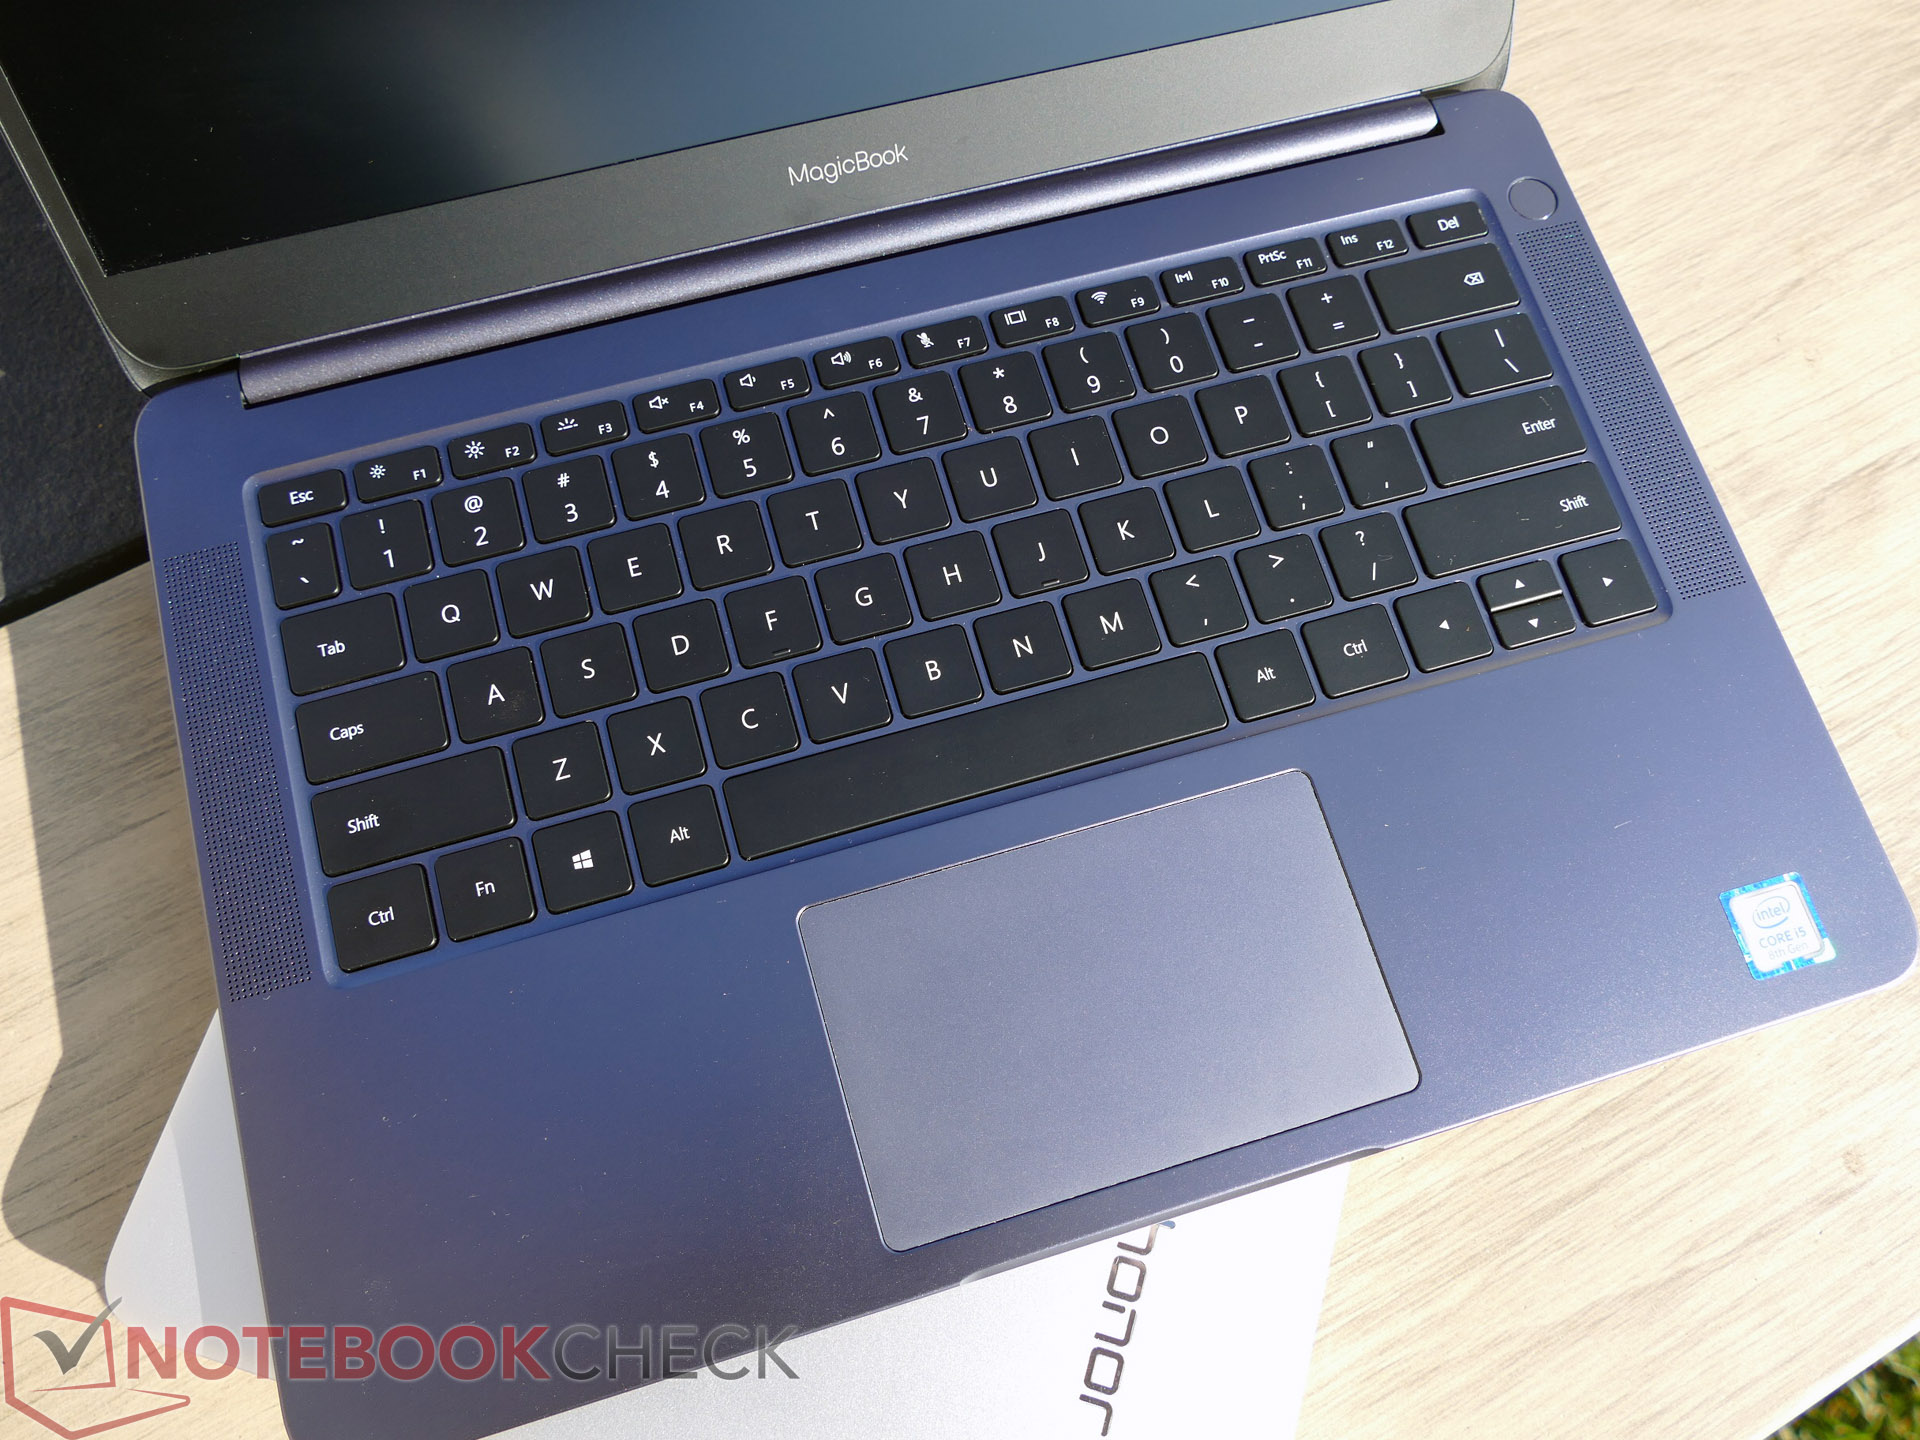
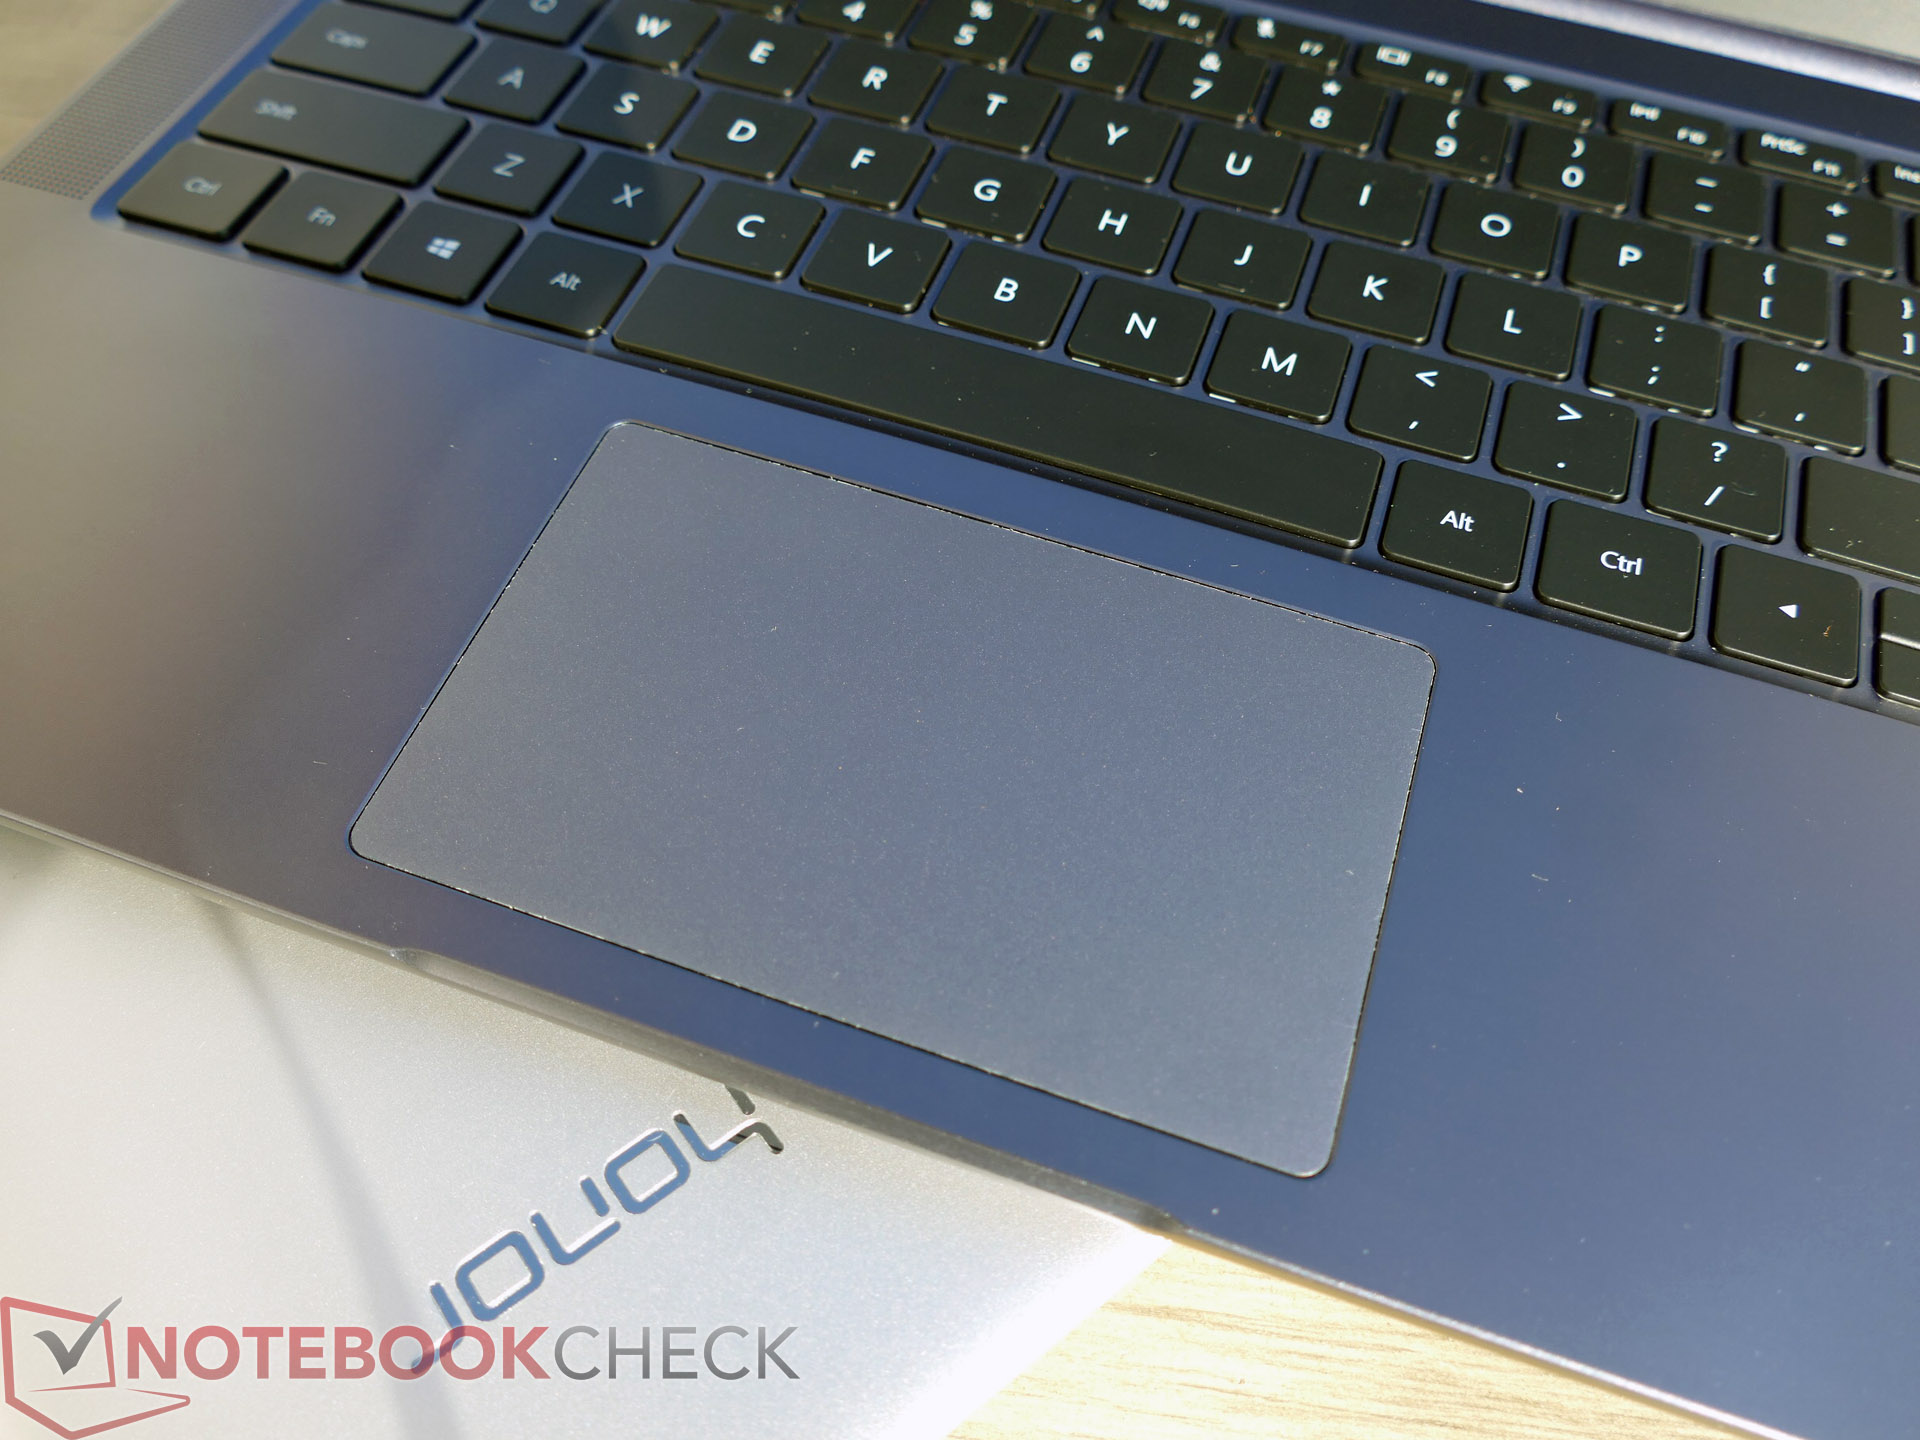
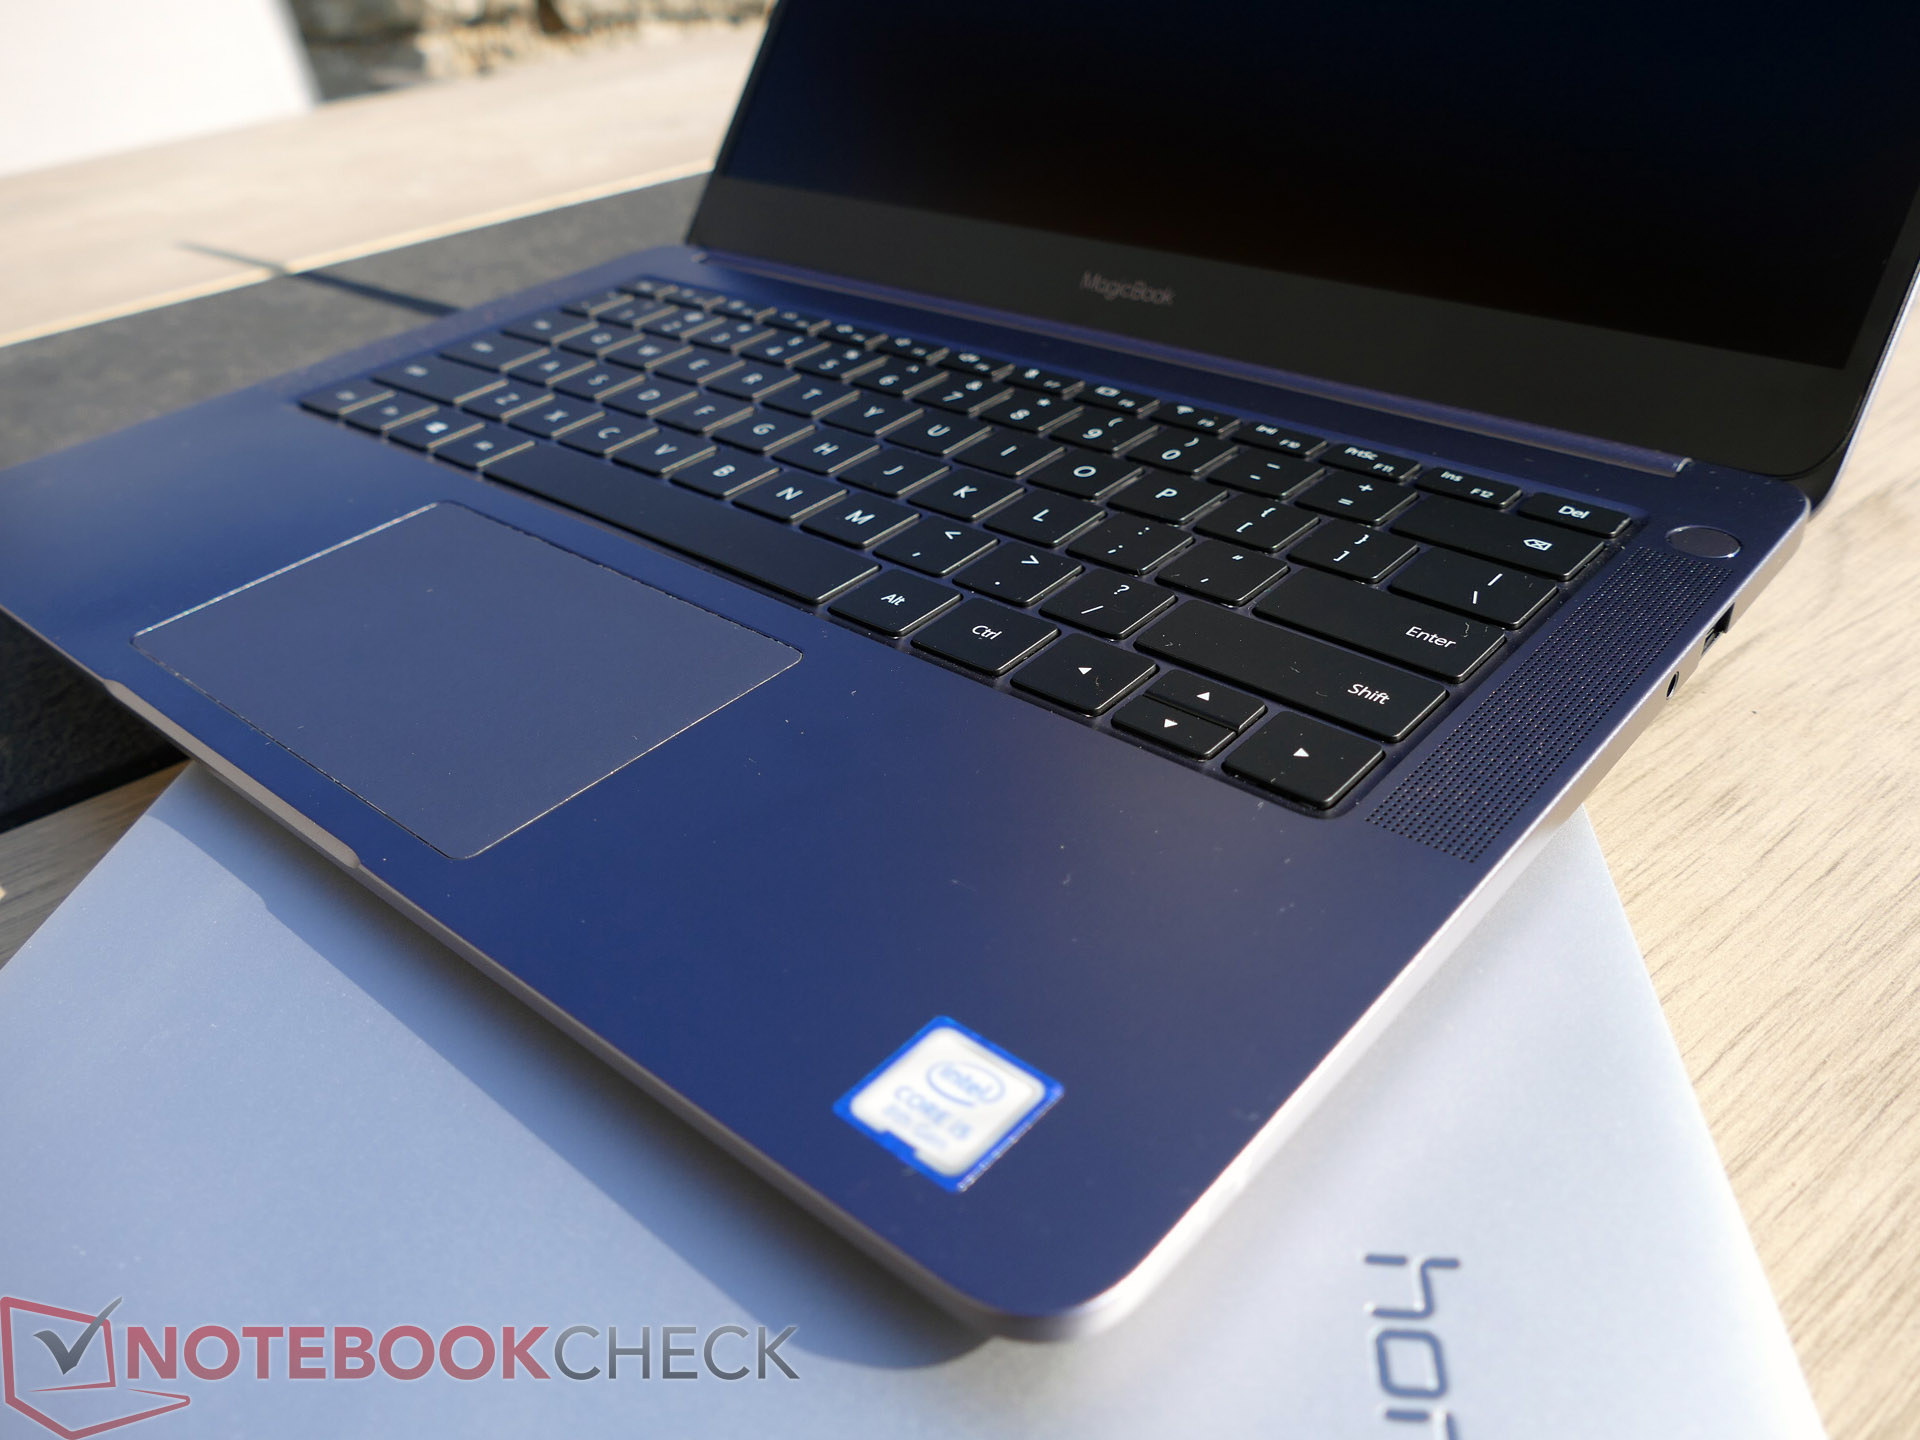
笔记本的触摸板和键盘还不错,尽管有些用户可能不太习惯QWERTY布局。
屏幕亮度高达300cd,对比度也非常合适,但是,因为屏幕的色域较差(约65%sRGB覆盖)我们不建议用它来进行专业的图像编辑任务。在测试中,我们还发现了一个有趣的细节,我们在英特尔型号上监测到了PWM调光,但在AMD型号上,只有90%亮度以下才能监测到。
“在性价比方面,AMD版本是绝对的赢家”
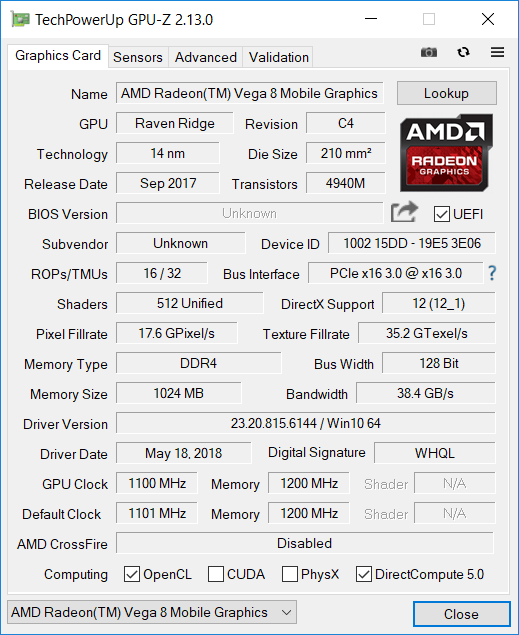
在CPU性能方面, i5版本仅比AMD版本高出5%。GPU方面,在有需要3D工作的任务中,英特尔/英伟达的组合要明显优于AMD,但后者只配备了Vega 8的集成显卡。尽管如此,Vega 8集成显卡的性能还是要远优于英特尔的UHD 620集成显卡,但它在高分辨率和高细节下的游戏表现仍然十分有限。
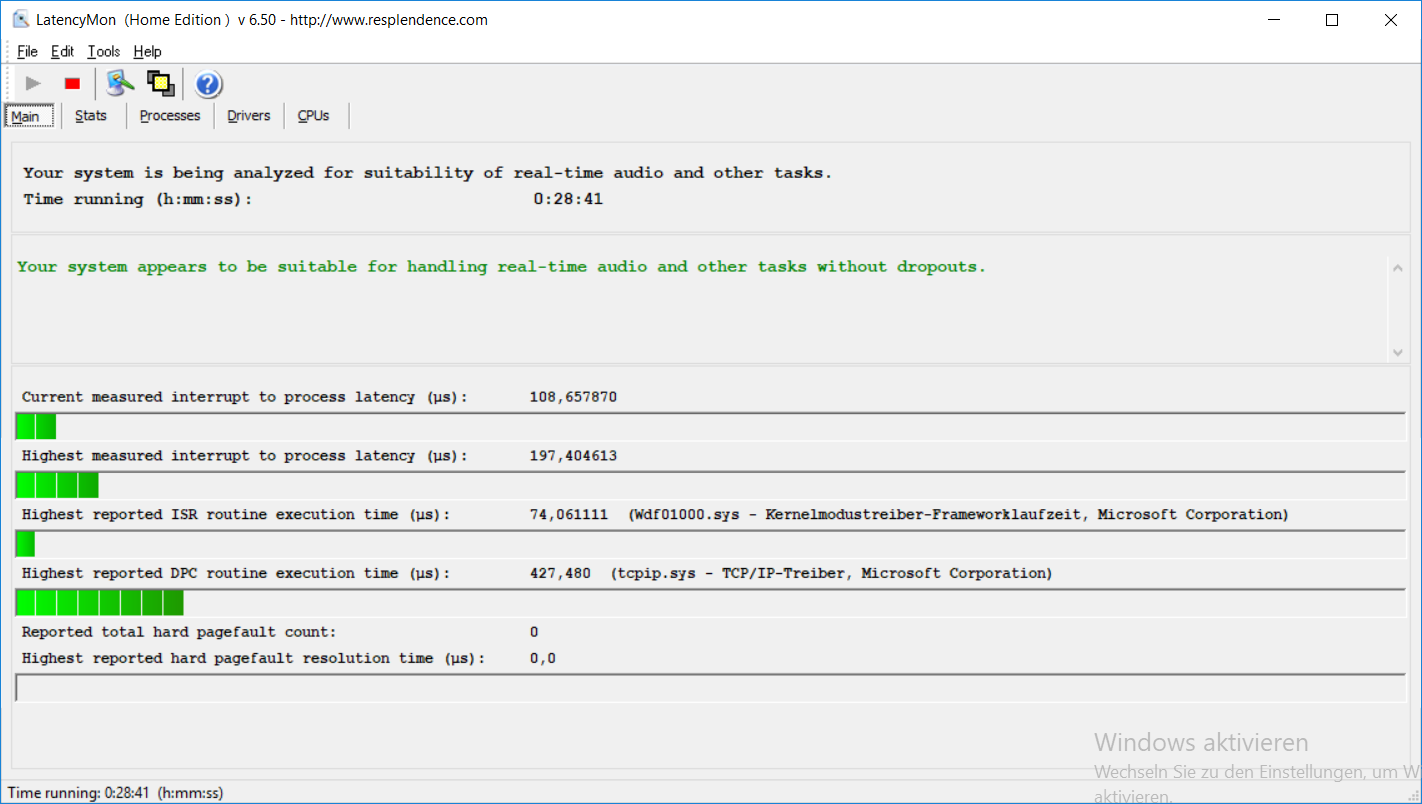
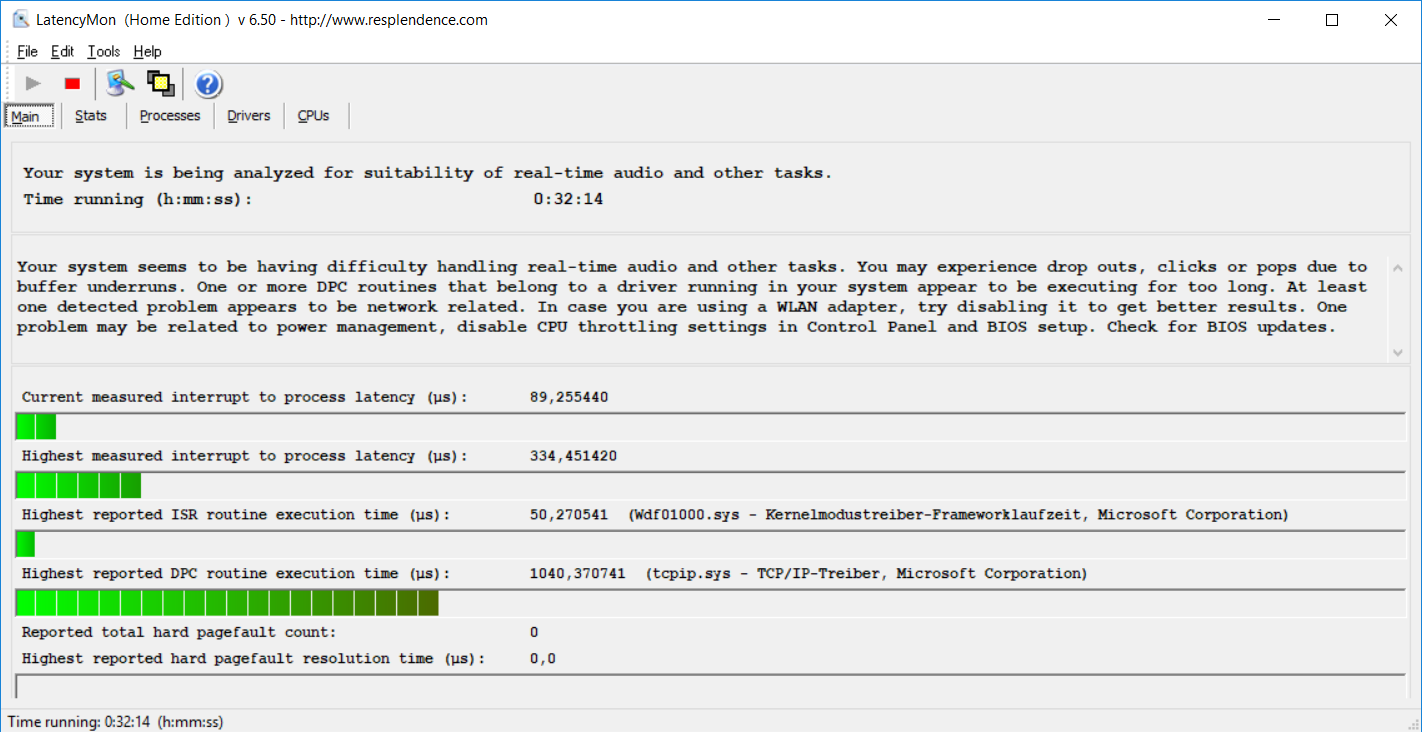
两种型号在办公使用时都很安静,尽管AMD版本的风扇偶尔会在轻负载情况下发出声音。但就温度而言,AMD版本在负载时温度只会微微升高,而英特尔/英伟达的配置在负载下温度会变得很高。
最后值得一提的是,Magicbook的AMD版本在我们的拟真Wi-Fi续航测试中达到了9小时,这是一个很好的成绩。不过英特尔版本的使用时间比AMD版还要多上一个小时,并且无论哪种电池测试都表明英特尔版本有着更好的续航。
我们的结论相当直截了当:价格敏感型用户,尤其是日常主要是办公使用的,应该选择AMD版本的 Magicbook,3999元的售价,你能得到很多,即 使必须在一些地方做出妥协。而英特尔配合英伟达独显的配置更适合那些有多媒体娱乐和游戏需求的用户。不过,英特尔的型号售价要高出不少(1000元左右),AMD版本在性价比方面具有明显的优势。
Honor Magicbook (8250U)
Honor Magicbook
- 11/06/2020 v6 (old)
J. Simon Leitner
Honor Magicbook (2500U)
Honor Magicbook
- 10/24/2018 v6 (old)
J. Simon Leitner
Price comparison
