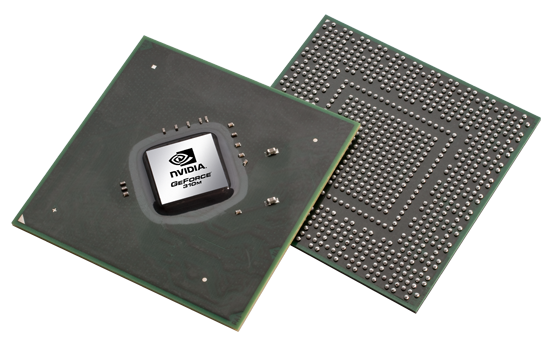
Notebookcheck Logo

NVIDIA GeForce 310M

NVIDIA GeForce 310M

NVIDIA Geforce 310M独立是一款入门级笔记本电脑的图形卡和G 210M的继任者,因此,基于相同的GT218核心非常相似的时钟速率(着色器速度+30 MHz)的。但是,也有在606兆赫的时钟,因此速度稍慢的较新的版本。 Nvidia公司的原始性能为73亿次至72亿次的G210M相比。因此,310M是一款入门级小型笔记本电脑专用的图形卡。是类似的GeForce G 210M的310M的性能,因此定位在入门级类。现代的3D游戏,如COD现代战争2只运行在低细节和决议流利。一些要求苛刻的游戏如NFS Shift或GTA4不会运行在所有流利。要求不高的游戏,如模拟人生3运行中的细节和决议流利。因此,不能被推荐的显卡为游戏玩家。该卡支持DirectX 10.1和G 210M(因为它应该是基于相同的GT218核心)的所有功能。因此,PureVideo高清解码高清视频的显卡支持。所使用的视频处理器(VP4)是能够完全硬件解码H.264,VC-1,MPEG-2,MPEG-4 ASP(DivX或XviD),以尽量减少CPU的负荷。不支持MPEG-1,但可以很容易地处理每一个现代CPU。由于310M,支持DirectX10.1计算,CUDA和OpenCL的图形处理器,着色器可用于其他任务,不是渲染图像(例如更快的视频编码)。 GT218核心的使用是在40nm工艺制造,并根据在桌面上GTX 200架构。因此,在着色器已被重新设计,相比老的GeForce®(精视™)G110M提供更好的性能和电池的运行时间。

GeForce 300M Series

GeForce 320M 32 @ 0.45 GHz
GeForce 310M 16 @ 0.61 GHz64 Bit @ 800 MHz
GeForce 315M 16 @ 0.61 GHz64 Bit @ 790 MHz
GeForce 305M 16 @ 0.53 GHz64 Bit @ 700 MHz
CodenameN11M-GE1
ArchitectureGT2xx
Pipelines16 - unified
Core Speed606 / 625 MHz
Shader Speed1212 / 1530 MHz
Memory Speed800 MHz
Memory Bus Width64 Bit
Memory TypeGDDR3, DDR3
Max. Amount of Memory512 MB
Shared Memoryno
APIDirectX 10.1, Shader 4.1
Transistor Count260 Million
Man. Technology40 nm
FeaturesDirectX Compute Support (Windows 7), CUDA, OpenCL, OpenGL 2.1, HybridPower
Date of Announcement10.01.2010
Information73 Gigaflops
Link to Manufacturer Pagewww.nvidia.com

Benchmarks

3DMark Vantage
3DM Vant. Perf. total +
3DMark Vantage - 3DM Vant. Perf. total
min: 1012     avg: 1106     median: 1123 (0%)     max: 1177 Points
3DM Vant. Perf. GPU no PhysX +
3DMark Vantage - 3DM Vant. Perf. GPU no PhysX
min: 787     avg: 868     median: 882 (0%)     max: 920 Points
ATI Radeon HD 3200
62 -93%
...
739 -15%
750 -14%
769 -11%
782 -10%
ATI Mobility FireGL V5700
803 -7%
806 -7%
NVIDIA GeForce 8600M GT
843 -3%
ATI Mobility Radeon HD 4570
853 -2%
865 0%
NVIDIA GeForce 310M
868
NVIDIA GeForce 9600M GS
905 4%
AMD Radeon HD 8210
918 6%
920 6%
ATI Mobility Radeon HD 2600 XT
933 7%
NVIDIA GeForce G210M
942 9%
945 9%
962 11%
972 12%
997 15%
...
132443 15158%
max:
173912 19936%
0%
100%
Restrict / Search: Model: Max. age: years
3DMark 2001SE - 3DMark 2001 - Standard
min: 9678     avg: 16667     median: 15456.5 (16%)     max: 23157 Points
3DMark 03 - 3DMark 03 - Standard
min: 8643     avg: 9628     median: 9403 (5%)     max: 10702 Points
3DMark 05 - 3DMark 05 - Standard
min: 5909     avg: 6662     median: 6706 (7%)     max: 7207 Points
Intel Graphics Media Accelerator (GMA) 500
133.4 -98%
...
AMD Radeon HD 8400
6397 -4%
6421 -4%
6443 -3%
6469 -3%
AMD Radeon HD 8450G + Radeon HD 8570M Dual Graphics
6475 -3%
6555 -2%
6580 -1%
NVIDIA GeForce Go 7800 GTX
6600 -1%
6627 -1%
NVIDIA GeForce 310M
6662
NVIDIA Quadro FX 1500M
6666 0%
NVIDIA GeForce 9500M GS
6669 0%
NVIDIA GeForce G210M
6720 1%
ATI Mobility Radeon HD 2700
6729 1%
ATI Mobility Radeon HD 4570
6755 1%
AMD Radeon R2 (Stoney Ridge)
6853 3%
6928 4%
6991 5%
7024 5%
...
68868 934%
max:
87172 1208%
0%
100%
Restrict / Search: Model: Max. age: years
3DMark 06 3DMark 06 - Score Unknown Settings +
3DMark 06
min: 3400     avg: 3708     median: 3768.5 (5%)     max: 3895 points
3DMark 06 - Standard 1280x1024 +
3DMark 06
min: 2907     avg: 3184     median: 3206 (4%)     max: 3622 Points
3DMark 06 - Standard 1280x768 +
3DMark 06
min: 3212     avg: 3465     median: 3469 (5%)     max: 3746 Points
3DMark 06 - Standard 1280x720 +
3DMark 06
3826 Points (5%)
Unigine Heaven 2.1 - Heaven 2.1 high
7 fps (1%)
0.6 -91%
...
5.4 -23%
5.45 -22%
5.5 -21%
Intel HD Graphics (Cherry Trail)
5.7 -19%
5.7 -19%
6.2 -11%
6.7 -4%
6.85 -2%
6.85 -2%
NVIDIA GeForce 310M
7
7.4 6%
7.45 6%
7.617 9%
7.675 10%
7.7 10%
AMD Radeon R2 (Stoney Ridge)
7.8 11%
8.1 16%
AMD Radeon R4 (Stoney Ridge)
8.35 19%
8.7 24%
...
532 7500%
0%
100%
Restrict / Search: Model: Max. age: years
SPECviewperf 11
specvp11 snx-01 +
SPECviewperf 11 - specvp11 snx-01
3.4 fps (2%)
specvp11 tcvis-02 +
SPECviewperf 11 - specvp11 tcvis-02
1 fps (1%)
specvp11 sw-02 +
SPECviewperf 11 - specvp11 sw-02
6.5 fps (5%)
specvp11 proe-05 +
SPECviewperf 11 - specvp11 proe-05
1.1 fps (1%)
specvp11 maya-03 +
SPECviewperf 11 - specvp11 maya-03
5.1 fps (4%)
specvp11 lightwave-01 +
SPECviewperf 11 - specvp11 lightwave-01
8 fps (9%)
specvp11 ensight-04 +
SPECviewperf 11 - specvp11 ensight-04
6.5 fps (3%)
specvp11 catia-03 +
SPECviewperf 11 - specvp11 catia-03
3.3 fps (2%)
Windows 7 Experience Index - Win7 Gaming graphics
min: 5.2     avg: 5.7     median: 5.7 (72%)     max: 6.1 Points
Windows 7 Experience Index - Win7 Graphics
min: 3.3     avg: 4.4     median: 4.6 (58%)     max: 5 Points
Cinebench R10 Cinebench R10 Shading (32bit) +
Cinebench R10 - Cinebench R10 Shading (32bit)
min: 967     avg: 3019     median: 3175 (2%)     max: 4428 points
Cinebench R11.5 Cinebench R11.5 OpenGL 64 Bit +
Cinebench R11.5 - Cinebench R11.5 OpenGL 64 Bit
min: 7.46     avg: 8.1     median: 8.2 (3%)     max: 8.6 fps
- Range of benchmark values
red legend - Average benchmark values
* Smaller numbers mean a higher performance

Game Benchmarks

The following benchmarks stem from our benchmarks of review laptops. The performance depends on the used graphics memory, clock rate, processor, system settings, drivers, and operating systems. So the results don't have to be representative for all laptops with this GPU. For detailed information on the benchmark results, click on the fps number.

low 800x600
31.6  fps    + Compare
med. 1024x768
22.1  fps    + Compare
high 1360x768
20  fps    + Compare
» The benchmarks indicate that the game is not playable in the tested settings.
Fifa 11

Fifa 11

2010
low 800x600
158  fps    + Compare
med. 1024x768
71.5  fps    + Compare
high 1360x768
53.4  fps    + Compare
» With all tested laptops playable in detail settings high.
low 1024x768
55 67.1 77 102.5 109.7 ~ 82 fps    + Compare + 📈 Graph
med. 1360x768
15 18 19.1 19.2 26 ~ 19 fps    + Compare + 📈 Graph
high 1360x768
10 12.1 12.6 12.7 ~ 12 fps    + Compare + 📈 Graph
» With all tested laptops playable in detail settings low.
low 800x600
48.3  fps    + Compare + 📈 Graph
med. 1024x768
17.7  fps    + Compare + 📈 Graph
high 1366x768
14.6  fps    + Compare + 📈 Graph
» With all tested laptops playable in detail settings low.
Risen

Risen

2009
low 800x600
25.9 25.9 31.2 ~ 28 fps    + Compare
med. 1024x768
14.3 14.8 14.8 ~ 15 fps    + Compare
high 1366x768
8.9 8.9 9.8 ~ 9 fps    + Compare
» The benchmarks indicate that the game is not playable in the tested settings.
Resident Evil 5

Resident Evil 5

2009
high 1360x768
22  fps    + Compare
» The benchmarks indicate that the game is not playable in the tested settings.
Need for Speed Shift

Need for Speed Shift

2009
low 800x600
22.4 23.8 ~ 23 fps    + Compare
med. 1024x768
13.7 15.7 ~ 15 fps    + Compare
high 1366x768
8.3 12.1 ~ 10 fps    + Compare
» The benchmarks indicate that the game is not playable in the tested settings.
Colin McRae: DIRT 2

Colin McRae: DIRT 2

2009
low 800x600
24.8 25.2 29 ~ 26 fps    + Compare
med. 1024x768
17.4 17.7 25 ~ 20 fps    + Compare
high 1360x768
12.5 12.5 ~ 13 fps    + Compare
» The benchmarks indicate that the game is not playable in the tested settings.
Anno 1404

Anno 1404

2009
low 1024x768
52 89.4 ~ 71 fps    + Compare
ultra 1280x1024
10.6 10.8 ~ 11 fps    + Compare
» With all tested laptops playable in detail settings low.
Sims 3

Sims 3

2009
low 800x600
78.1  fps    + Compare + 📈 Graph
med. 1024x768
33  fps    + Compare + 📈 Graph
high 1280x1024
17.3  fps    + Compare + 📈 Graph
» With all tested laptops playable in detail settings low.
Left 4 Dead

Left 4 Dead

2008
low 640x480
60.1  fps    + Compare + 📈 Graph
high 1024x768
40.5 44.2 ~ 42 fps    + Compare + 📈 Graph
» With all tested laptops playable in detail settings high.
Far Cry 2

Far Cry 2

2008
low 640x480
58.8 62 ~ 60 fps    + Compare
high 1024x768
19.9 20.3 ~ 20 fps    + Compare
» With all tested laptops playable in detail settings low.
Crysis Warhead

Crysis Warhead

2008
low 800x600
48  fps    + Compare
ultra 1024x768
6  fps    + Compare
» With all tested laptops playable in detail settings low.
Call of Duty 4 - Modern Warfare

Call of Duty 4 - Modern Warfare

2007
low 800x600
38.7 40.4 ~ 40 fps    + Compare
med. 1024x768
29.3 31.1 ~ 30 fps    + Compare
» With all tested laptops playable in detail settings low.
World in Conflict - Benchmark

World in Conflict - Benchmark

2007
low 800x600
82  fps    + Compare + 📈 Graph
med. 1024x768
28 29 ~ 29 fps    + Compare + 📈 Graph
high 1024x768
16 16 ~ 16 fps    + Compare + 📈 Graph
» With all tested laptops playable in detail settings low.
Call of Juarez Benchmark

Call of Juarez Benchmark

2006
high 1024x768
7.7 8.3 ~ 8 fps    + Compare
» The benchmarks indicate that the game is not playable in the tested settings.
lowmed.highultraQHD4K
Call of Duty: Black Ops31.622.120
Fifa 1115871.553.4
StarCraft 2821912
CoD Modern Warfare 248.317.714.6
Risen28159
Resident Evil 522
Need for Speed Shift231510
Colin McRae: DIRT 2262013
Anno 14047111
Sims 378.13317.27
Left 4 Dead60.142
Far Cry 26020
Crysis Warhead486
Call of Duty 4 - Modern Warfare4030
World in Conflict - Benchmark822916
Call of Juarez Benchmark8
lowmed.highultraQHD4K
< 30 fps
< 60 fps
< 120 fps
≥ 120 fps
3
4
6
1
7
2
1
11
2

2


For more games that might be playable and a list of all games and graphics cards visit our Gaming List

Amazon Logo
  • $685.00
    HP Victus 15.6" Full HD 144Hz Gaming Laptop, Intel Core i5-12450H, NVIDIA GeForce RTX 3050,16GB RAM, 512GB PCIe SSD, Wi-Fi 6, Backlit Keyboard,Windows 11 Pro, Performance Blue
  • $551.37
    HP - Victus 15.6" Gaming Laptop - Intel Core i5-12450H - 8GB Memory - NVIDIA GeForce GTX 1650-512GB SSD - Mica Silver - Model 15-fa0031dx
  • $659.00
    msi Thin 15 15.6” 144Hz FHD Gaming Laptop: Intel Core i5-13420H, NVIDIA Geforce RTX 2050, 16GB DDR5, 512GB NVMe SSD, Cooler Boost 5, Win 11: Black B13UCX-2040US
  • $775.07
    HP Pavilion Gaming 15.6-Inch Micro-EDGE Laptop, Intel Core i5-9300H Processor, NVIDIA GeForce GTX 1650 (4 GB), 8 GB SDRAM, 256 GB SSD, Windows 10 Home (15-dk0020nr, Shadow Black/Acid Green)
  • $1,499.99
    acer Nitro V Gaming Laptop | Intel Core 9 Processor 270H | NVIDIA GeForce RTX 5070 Laptop GPU | 16" WUXGA IPS 180Hz Display | 32GB DDR5 | 1TB Gen 4 SSD | Wi-Fi 6 | Backlit KB | ANV16-72-933F

v1.35
log 12. 21:31:59

#0 ran 0s before starting gpusingle class +0s ... 0s

#1 no ids found in url (should be separated by "_") +0s ... 0s

#2 not redirecting to Ajax server +0s ... 0s

#3 did not recreate cache, as it is less than 5 days old! Created at Tue, 10 Mar 2026 11:04:42 +0100 +0.002s ... 0.002s

#4 no comparison url found in template nbc.compare_page_1 needed +0.014s ... 0.017s

#5 no comparison url found in template nbc.compare_page_1 needed +0s ... 0.017s

#6 no comparison url found in template nbc.compare_page_1 needed +0s ... 0.017s

#7 composed specs +0s ... 0.017s

#8 did output specs +0s ... 0.017s

#9 start showIntegratedCPUs +0s ... 0.017s

#10 getting avg benchmarks for device 1531 +0.016s ... 0.033s

#11 got single benchmarks 1531 +0.1s ... 0.133s

#12 got avg benchmarks for devices +0s ... 0.133s

#13 min, max, avg, median took s +0.532s ... 0.665s

#14 before gaming benchmark output +0s ... 0.666s

#15 Got 74 rows for game benchmarks. +0.006s ... 0.671s

#16 composed SQL query for gamebenchmarks +0s ... 0.671s

#17 got data and put it in $dataArray +0.008s ... 0.68s

#18 benchmarks composed for output. +0.13s ... 0.809s

#19 no comparison url found in template nbc.compare_page_1 needed +0.582s ... 1.391s

#20 return log +0s ... 1.391s

No reviews found.

Please share our article, every link counts!
Mail Logo

» Comparison of GPUs
Detailed list of all laptop GPUs sorted by class and performance.

» Benchmark List
Sort and restrict laptop GPUs based on performance in synthetic benchmarks.

» Notebook Gaming List
Playable games for each graphics card and their average FPS results.

Class 1

Class 2

GeForce RTX 2080 Super Mobile
RTX PRO 2000 Blackwell Generation Laptop
M5 Max 32-Core GPU *
M1 Max 32-Core GPU *
M1 Max 24-Core GPU *
GeForce RTX 2070 Super Mobile
Radeon 8050S
Quadro RTX 5000 Max-Q
Radeon RX 5700M *
Quadro RTX 4000 (Laptop)
GeForce GTX 1080 Mobile
M1 Pro 16-Core GPU *
Radeon PRO W6600M *
GeForce RTX 2070 Super Max-Q
RTX PRO 1000 Blackwell Generation Laptop *
M1 Pro 14-Core GPU *
Quadro RTX 4000 Max-Q
Quadro P5200
Quadro RTX 3000 Max-Q
Quadro P4200
Radeon 8040S *
Pro A60M *

Class 3

Quadro P5000 Max-Q *
Quadro P4000
Arc 140T
Quadro P4000 Max-Q
Quadro P3200
Radeon RX 580X (Laptop) *
Radeon RX 580 (Laptop)
Pro A30M
Radeon Pro 5300M
Radeon RX 5300M
Quadro P3000 Max-Q *
Quadro T2000 Max-Q
Radeon RX 570X (Laptop) *
Radeon RX 570 (Laptop) *
Quadro T1000 Max-Q *
Vega M GH
GeForce GTX 1050 Ti Mobile
GeForce GTX 1050 Ti Max-Q
Radeon 680M
Quadro P2000
Quadro P2000 Max-Q
T500 Laptop GPU
Arc 130T
Radeon Pro Vega 16
WX Vega M GL
GeForce GTX 1050 Max-Q
Radeon 660M
Radeon Pro WX 4150 *
Radeon RX 560X (Laptop)
Radeon RX 560 (Laptop)
Quadro P1000
Xe MAX
Radeon Pro 560X
Radeon Pro 560
Quadro P620
Radeon RX 550X (Laptop)
Radeon Pro WX 3200 *
Radeon Pro 555X
Radeon Pro 555
Quadro P600
Graphics 3-Core iGPU (Arrow Lake) *
Radeon Pro WX 2100 *
Radeon Pro WX 3100 *
Graphics 2-Core iGPU (Arrow Lake) *
Radeon 630
Quadro P520
Radeon RX 540X *
Radeon 540X *
Quadro P500 *
Vega 10
Vega 9
Iris Plus Graphics G7 (Ice Lake 64 EU) *
UHD Graphics 32EUs
UHD Graphics 750
Vega 7
UHD Graphics Xe 32EUs (Tiger Lake-H)
UHD Graphics Xe G4 48EUs
Vega 8
UHD Graphics 730
Iris Plus Graphics G4 (Ice Lake 48 EU)
Iris Plus Graphics 650
Radeon 625
Vega 6 *
Iris Plus Graphics 640
UHD Graphics 24EUs (Alder Lake-N) *
GeForce 920M
Radeon 620
Radeon 610
Radeon 610M *
Vega 6 *
UHD Graphics Xe 16EUs (Tiger Lake-H) *
UHD Graphics G1 (Ice Lake 32 EU)
Adreno 690 *
Adreno 685 *
Adreno 680 *
GeForce 910M

Class 4

Class 5

* Approximate position of the graphics adapter