华硕 Zenbook UX303LN-R4141H 亚笔记本电脑简短评测
| |||||||||||||||||||||||||
Chi Mei CMN N133HSE-EA3 / CMN1361 tested with X-Rite i1Pro 2
Maximum: 357 cd/m² (Nits) Average: 338.8 cd/m²Brightness Distribution: 88 %
Center on Battery: 344 cd/m²
Contrast: 625:1 (Black: 0.55 cd/m²)
ΔE ColorChecker Calman: 5.45 | ∀{0.5-29.43 Ø4.72}
ΔE Greyscale Calman: 4.53 | ∀{0.09-98 Ø4.97}
97.4% sRGB (Argyll 1.6.3 3D)
64% AdobeRGB 1998 (Argyll 1.6.3 3D)
71.4% AdobeRGB 1998 (Argyll 3D)
97.5% sRGB (Argyll 3D)
72.7% Display P3 (Argyll 3D)
Gamma: 2.27
CCT: 7458 K
| Asus Zenbook UX303LN-R4141H GeForce 840M, 4510U, SanDisk SD6SB1M256G1002 | Lenovo IdeaPad U430 Touch 59372369 GeForce GT 730M, 4200U, Seagate ST500LX005-1CW162 500 GB + 16 GB Flash | Apple MacBook Pro Retina 13 inch 2013-10 Iris Graphics 5100, 4258U, Apple SSD SM0256F | Dell XPS 13-9333 HD Graphics 4400, 4200U, Liteonit LMT-128M6M | |
|---|---|---|---|---|
| Display | -43% | -12% | ||
| Display P3 Coverage (%) | 72.7 | 39.34 -46% | 65.1 -10% | |
| sRGB Coverage (%) | 97.5 | 57.5 -41% | 84.7 -13% | |
| AdobeRGB 1998 Coverage (%) | 71.4 | 40.52 -43% | 61.5 -14% | |
| Response Times | ||||
| Response Time Grey 50% / Grey 80% * (ms) | 33 ? | |||
| Response Time Black / White * (ms) | 26.2 ? | |||
| PWM Frequency (Hz) | ||||
| Screen | -50% | 5% | 6% | |
| Brightness middle (cd/m²) | 344 | 213 -38% | 327 -5% | 450.1 31% |
| Brightness (cd/m²) | 339 | 196 -42% | 300 -12% | 441 30% |
| Brightness Distribution (%) | 88 | 85 -3% | 84 -5% | 92 5% |
| Black Level * (cd/m²) | 0.55 | 0.5 9% | 0.42 24% | 0.655 -19% |
| Contrast (:1) | 625 | 426 -32% | 779 25% | 687 10% |
| Colorchecker dE 2000 * | 5.45 | 10.84 -99% | 4.53 17% | |
| Greyscale dE 2000 * | 4.53 | 11.39 -151% | 5.32 -17% | |
| Gamma | 2.27 97% | 2.23 99% | 2.35 94% | |
| CCT | 7458 87% | 14005 46% | 6224 104% | |
| Color Space (Percent of AdobeRGB 1998) (%) | 64 | 36 -44% | 55.66 -13% | |
| Color Space (Percent of sRGB) (%) | 97.4 | |||
| Total Average (Program / Settings) | -47% /
-48% | 5% /
5% | -3% /
1% |
* ... smaller is better
| Cinebench R11.5 | |
| CPU Single 64Bit (sort by value) | |
| Asus Zenbook UX303LN-R4141H | |
| Lenovo IdeaPad U430 Touch 59372369 | |
| Apple MacBook Pro Retina 13 inch 2013-10 | |
| Dell XPS 13-9333 | |
| Toshiba Portege Z30-A-12U | |
| Samsung ATIV Book 9 Plus | |
| HP Spectre 13-3010eg | |
| Gigabyte P34G v2 | |
| CPU Multi 64Bit (sort by value) | |
| Asus Zenbook UX303LN-R4141H | |
| Lenovo IdeaPad U430 Touch 59372369 | |
| Apple MacBook Pro Retina 13 inch 2013-10 | |
| Dell XPS 13-9333 | |
| Toshiba Portege Z30-A-12U | |
| Samsung ATIV Book 9 Plus | |
| HP Spectre 13-3010eg | |
| Gigabyte P34G v2 | |
| PCMark 8 | |
| Creative Score Accelerated (sort by value) | |
| Asus Zenbook UX303LN-R4141H | |
| Toshiba Portege Z30-A-12U | |
| Samsung ATIV Book 9 Plus | |
| HP Spectre 13-3010eg | |
| Creative Score Accelerated v2 (sort by value) | |
| Asus Zenbook UX303LN-R4141H | |
| Apple MacBook Pro Retina 13 inch 2013-10 | |
| Gigabyte P34G v2 | |
| Work Score Accelerated (sort by value) | |
| Asus Zenbook UX303LN-R4141H | |
| Toshiba Portege Z30-A-12U | |
| Samsung ATIV Book 9 Plus | |
| HP Spectre 13-3010eg | |
| Work Score Accelerated v2 (sort by value) | |
| Asus Zenbook UX303LN-R4141H | |
| Apple MacBook Pro Retina 13 inch 2013-10 | |
| Gigabyte P34G v2 | |
| PCMark 7 Score | 5068 points | |
| PCMark 8 Home Score Accelerated | 2039 points | |
| PCMark 8 Home Score Accelerated v2 | 2927 points | |
| PCMark 8 Creative Score Accelerated | 1713 points | |
| PCMark 8 Creative Score Accelerated v2 | 3177 points | |
| PCMark 8 Work Score Accelerated | 2482 points | |
| PCMark 8 Work Score Accelerated v2 | 3559 points | |
Help | ||
| Asus Zenbook UX303LN-R4141H | Lenovo IdeaPad U430 Touch 59372369 | Dell XPS 13 | Samsung ATIV Book 9 Plus | HP Spectre 13-3010eg | Gigabyte P34G v2 | |
|---|---|---|---|---|---|---|
| PCMark 8 | ||||||
| Storage Score (Points) | 4895 | 4898 0% | 4871 0% | 4930 1% | ||
| AS SSD | -6% | -12% | -17% | -6% | ||
| Score Read (Points) | 399 | 373 -7% | 386 -3% | 361 -10% | 374 -6% | |
| Score Write (Points) | 289 | 337 17% | 205 -29% | 274 -5% | 345 19% | |
| 4K Read (MB/s) | 29.76 | 29.32 -1% | 27.17 -9% | 24.94 -16% | 27.9 -6% | |
| 4K Write (MB/s) | 83.2 | 57.6 -31% | 78.5 -6% | 51.7 -38% | 58 -30% | |
| CrystalDiskMark 3.0 | -88% | -9% | -15% | -14% | -13% | |
| Read Seq (MB/s) | 409 | 75.9 -81% | 510 25% | 525 28% | 464 13% | 500 22% |
| Write Seq (MB/s) | 436.6 | 117 -73% | 318.7 -27% | 135 -69% | 380.1 -13% | 321.3 -26% |
| Read 4k (MB/s) | 34.64 | 0.372 -99% | 32.27 -7% | 30.44 -12% | 29.02 -16% | 29.92 -14% |
| Write 4k (MB/s) | 100.7 | 0.679 -99% | 74.9 -26% | 94.1 -7% | 61.6 -39% | 65.8 -35% |
| Total Average (Program / Settings) | -88% /
-88% | -8% /
-7% | -9% /
-12% | -10% /
-14% | -6% /
-8% |

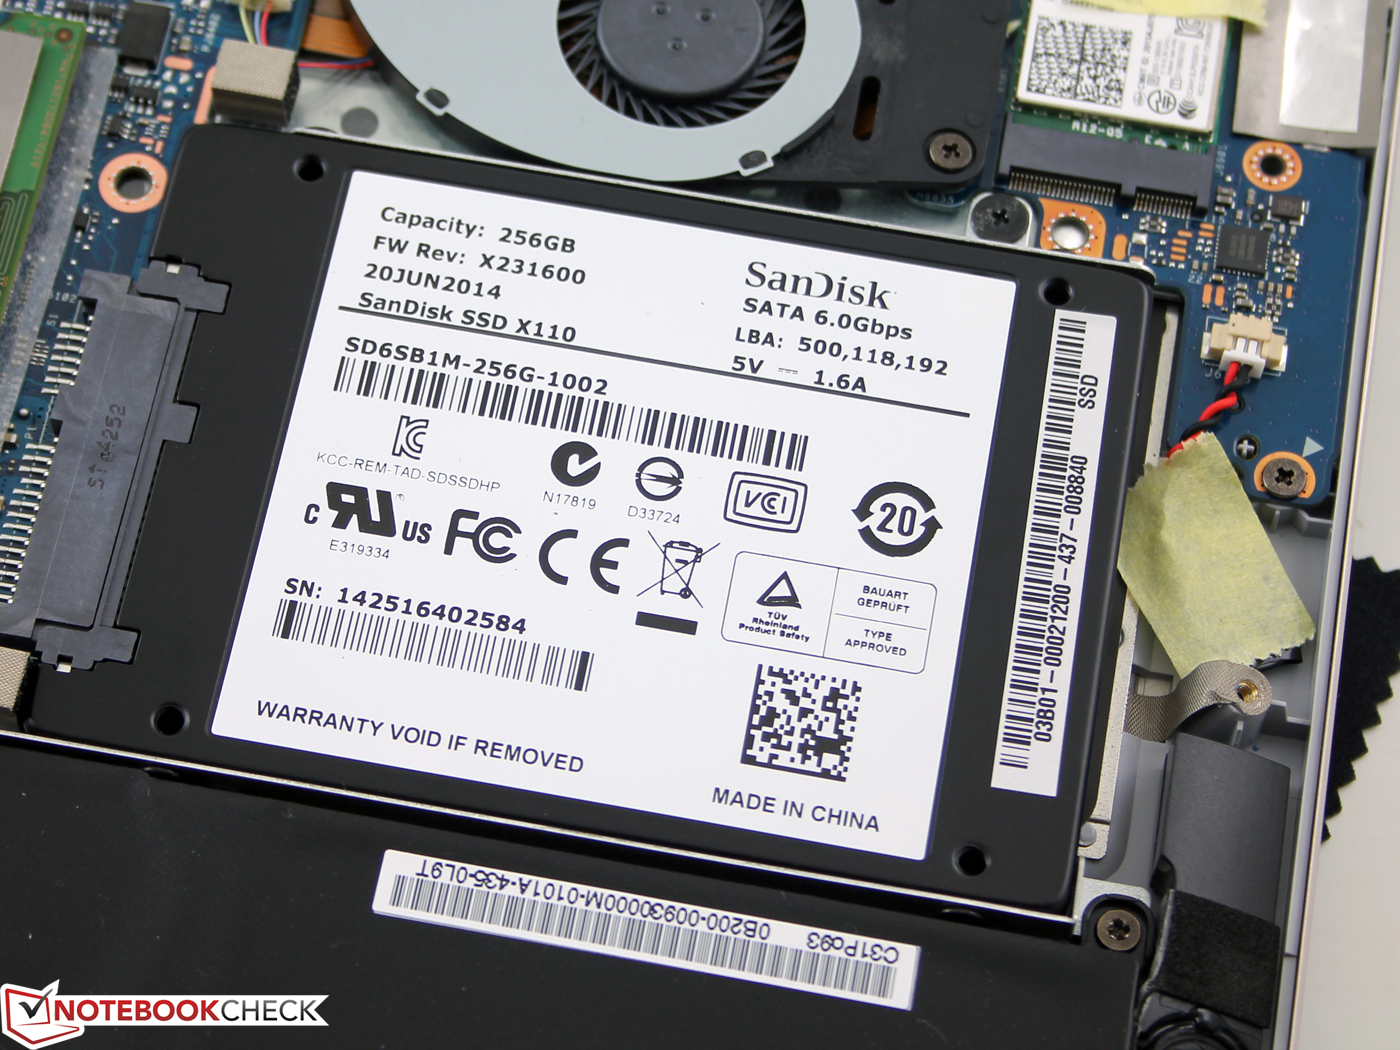
SanDisk SD6SB1M256G1002
Transfer Rate Minimum:
397.7 MB/s
Transfer Rate Maximum:
421.5 MB/s
Transfer Rate Average:
412.1 MB/s
Access Time:
0.1 ms
Burst Rate:
92.1 MB/s
CPU Usage:
2.3 %
| 3DMark 11 - 1280x720 Performance GPU (sort by value) | |
| Asus Zenbook UX303LN-R4141H | |
| Dell XPS 13-9333 | |
| Toshiba Portege Z30-A-12U | |
| Samsung ATIV Book 9 Plus | |
| HP Spectre 13-3010eg | |
| Gigabyte P34G v2 | |
| 3DMark - 1280x720 Cloud Gate Standard Graphics (sort by value) | |
| Asus Zenbook UX303LN-R4141H | |
| Toshiba Portege Z30-A-12U | |
| Samsung ATIV Book 9 Plus | |
| HP Spectre 13-3010eg | |
| Gigabyte P34G v2 | |
| 3DMark 11 Performance | 2378 points | |
| 3DMark Ice Storm Standard Score | 51903 points | |
| 3DMark Cloud Gate Standard Score | 5919 points | |
| 3DMark Fire Strike Score | 1317 points | |
Help | ||
| Thief | |
| 1366x768 Normal Preset AA:FX (sort by value) | |
| Asus Zenbook UX303LN-R4141H | |
| Gigabyte P34G v2 | |
| Asus Zenbook UX32LN-R4029H | |
| Acer Aspire S3-392G | |
| 1366x768 High Preset AA:FXAA & Low SS AF:4x (sort by value) | |
| Asus Zenbook UX303LN-R4141H | |
| Gigabyte P34G v2 | |
| Asus Zenbook UX32LN-R4029H | |
| Acer Aspire S3-392G | |
| low | med. | high | ultra | |
|---|---|---|---|---|
| Dead Space 3 (2013) | 129 | 64 | 52 | 30.7 |
| Thief (2014) | 33.8 | 21.4 | 17.3 | 8.5 |
| Sims 4 (2014) | 105 | 58.7 | 31 | 22.2 |
| Fifa 15 (2014) | 89.8 | 67.3 | 42.6 | |
| Middle-earth: Shadow of Mordor (2014) | 37.27 | 21.7 | 13.12 |
| Asus Zenbook UX303LN-R4141H | Lenovo IdeaPad U430 Touch 59372369 | Apple MacBook Pro Retina 13 inch 2013-10 | Dell XPS 13-9333 | Gigabyte P34G v2 | Asus Zenbook UX32LN-R4029H | |
|---|---|---|---|---|---|---|
| Noise | -4% | -4% | -1% | -22% | -5% | |
| Idle Minimum * (dB) | 29.5 | 31.2 -6% | 27.4 7% | 29.1 1% | 29 2% | 29.3 1% |
| Idle Average * (dB) | 29.5 | 31.2 -6% | 27.4 7% | 29.2 1% | 34.8 -18% | 29.3 1% |
| Idle Maximum * (dB) | 29.5 | 32.7 -11% | 27.4 7% | 29.3 1% | 38.6 -31% | 29.3 1% |
| Load Average * (dB) | 34.3 | 34.3 -0% | 42.5 -24% | 31.6 8% | 45 -31% | 39.5 -15% |
| Load Maximum * (dB) | 38.2 | 36.6 4% | 44.7 -17% | 44.6 -17% | 50 -31% | 42.8 -12% |
* ... smaller is better
Noise level
| Idle |
| 29.5 / 29.5 / 29.5 dB(A) |
| Load |
| 34.3 / 38.2 dB(A) |
 | ||
30 dB silent 40 dB(A) audible 50 dB(A) loud |
||
min: | ||
| Asus Zenbook UX303LN-R4141H | Lenovo IdeaPad U430 Touch 59372369 | Apple MacBook Pro Retina 13 inch 2013-10 | Dell XPS 13-9333 | Gigabyte P34G v2 | Asus Zenbook UX32LN-R4029H | |
|---|---|---|---|---|---|---|
| Heat | -15% | 7% | -9% | -38% | 0% | |
| Maximum Upper Side * (°C) | 55.7 | 49.4 11% | 43 23% | 44.2 21% | 50 10% | 48.2 13% |
| Maximum Bottom * (°C) | 51 | 53.2 -4% | 40 22% | 48.4 5% | 58.5 -15% | 41.6 18% |
| Idle Upper Side * (°C) | 26.6 | 35.2 -32% | 29 -9% | 32.6 -23% | 42.6 -60% | 31.1 -17% |
| Idle Bottom * (°C) | 26.2 | 35.3 -35% | 28 -7% | 35.8 -37% | 49.3 -88% | 29.5 -13% |
* ... smaller is better
(-) The average temperature for the upper side under maximal load is 42.1 °C / 108 F, compared to the average of 30.8 °C / 87 F for the devices in the class Subnotebook.
(-) The maximum temperature on the upper side is 55.7 °C / 132 F, compared to the average of 35.9 °C / 97 F, ranging from 21.4 to 59 °C for the class Subnotebook.
(-) The bottom heats up to a maximum of 51 °C / 124 F, compared to the average of 39.2 °C / 103 F
(+) In idle usage, the average temperature for the upper side is 25.7 °C / 78 F, compared to the device average of 30.8 °C / 87 F.
(+) The palmrests and touchpad are reaching skin temperature as a maximum (33.2 °C / 91.8 F) and are therefore not hot.
(-) The average temperature of the palmrest area of similar devices was 28.2 °C / 82.8 F (-5 °C / -9 F).
| Asus Zenbook UX303LN-R4141H | Lenovo IdeaPad U430 Touch 59372369 | Apple MacBook Pro Retina 13 inch 2013-10 | Dell XPS 13-9333 | Gigabyte P34G v2 | Asus Zenbook UX32LN-R4029H | |
|---|---|---|---|---|---|---|
| Power Consumption | -26% | -12% | -130% | -2% | ||
| Idle Minimum * (Watt) | 3.8 | 6.7 -76% | 2.8 26% | 8.8 -132% | 3.4 11% | |
| Idle Average * (Watt) | 7.2 | 10.3 -43% | 8.8 -22% | 13.6 -89% | 7.4 -3% | |
| Idle Maximum * (Watt) | 8.4 | 10.6 -26% | 9 -7% | 21.6 -157% | 8.9 -6% | |
| Load Average * (Watt) | 41.6 | 40.7 2% | 58 -39% | 83.8 -101% | 39.7 5% | |
| Load Maximum * (Watt) | 51.9 | 45.5 12% | 60.6 -17% | 141.5 -173% | 59.6 -15% |
* ... smaller is better
Power Consumption
| Off / Standby | |
| Idle | |
| Load |
|
Key:
min: | |
| Asus Zenbook UX32LN | ||||||
|---|---|---|---|---|---|---|
| Battery runtime | -14% | 20% | 29% | -30% | -36% | |
| Reader / Idle (h) | 13 | 11.7 -10% | 25.6 97% | 16.5 27% | 7.8 -40% | |
| H.264 (h) | 7.8 | 7.8 0% | ||||
| WiFi (h) | 9.7 | 5.5 -43% | 9.5 -2% | 7.8 -20% | 4.5 -54% | 6.2 -36% |
| Load (h) | 2 | 2.2 10% | 1.7 -15% | 3.6 80% | 2.1 5% |
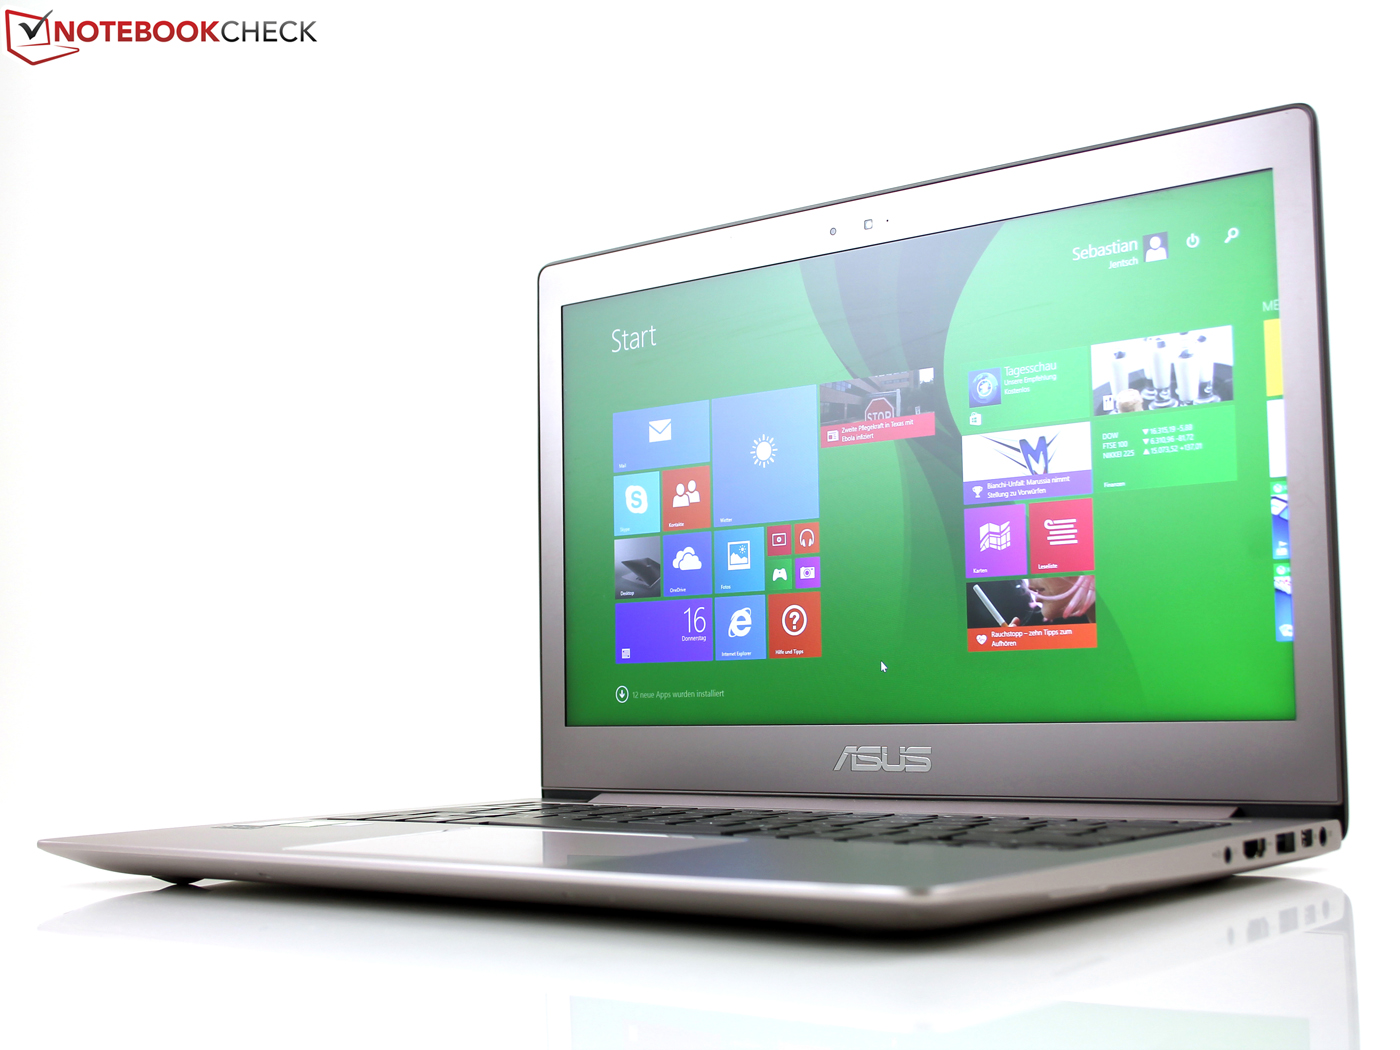
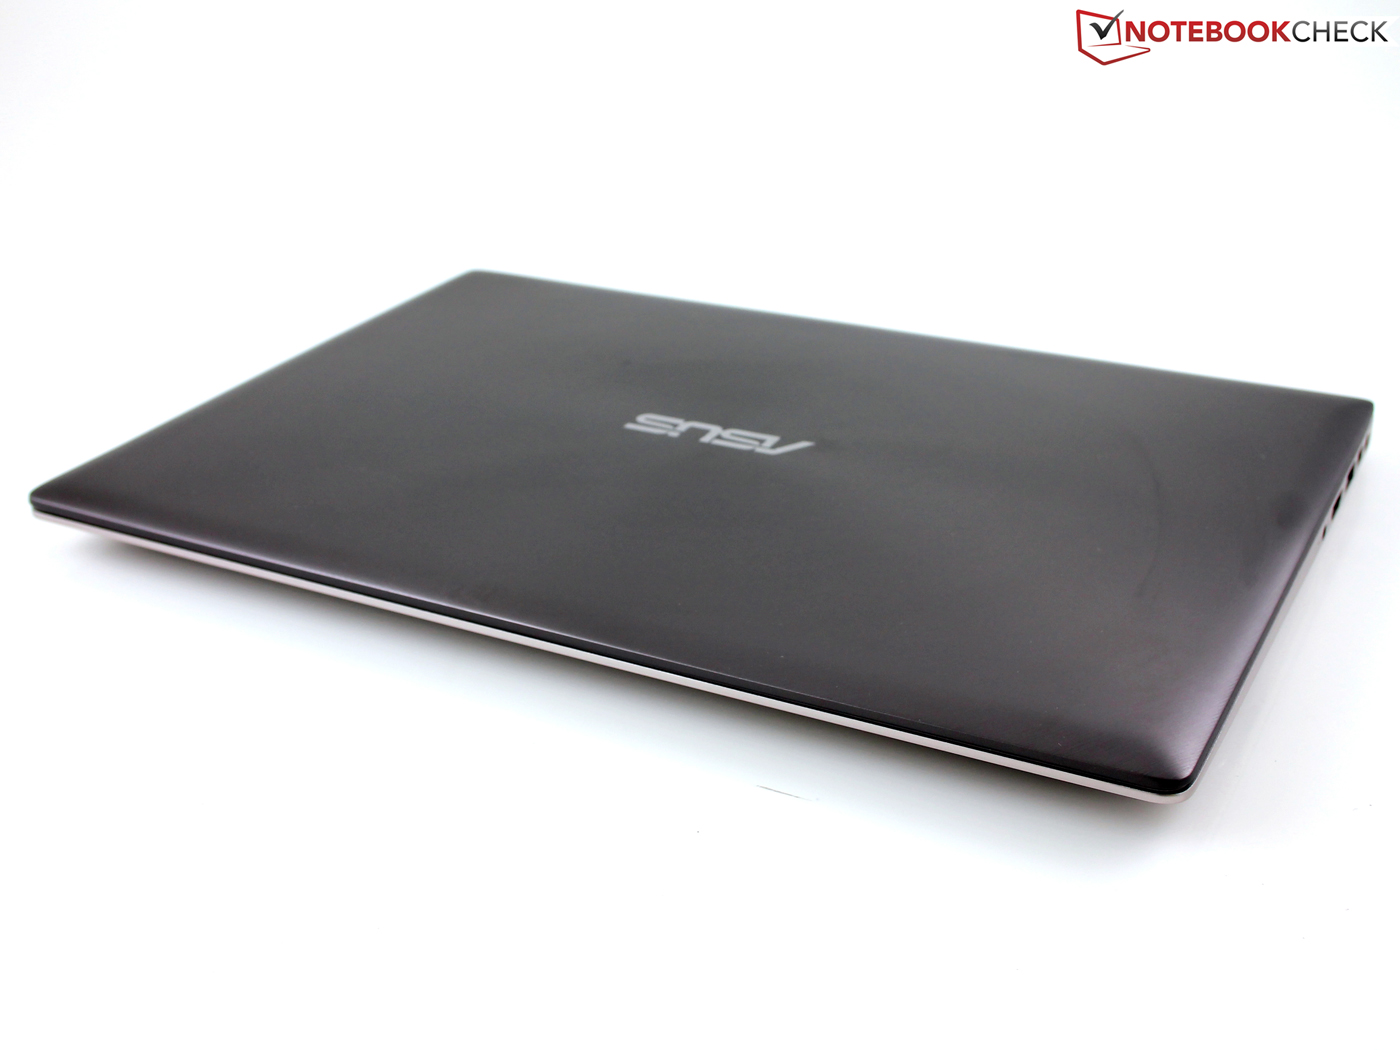
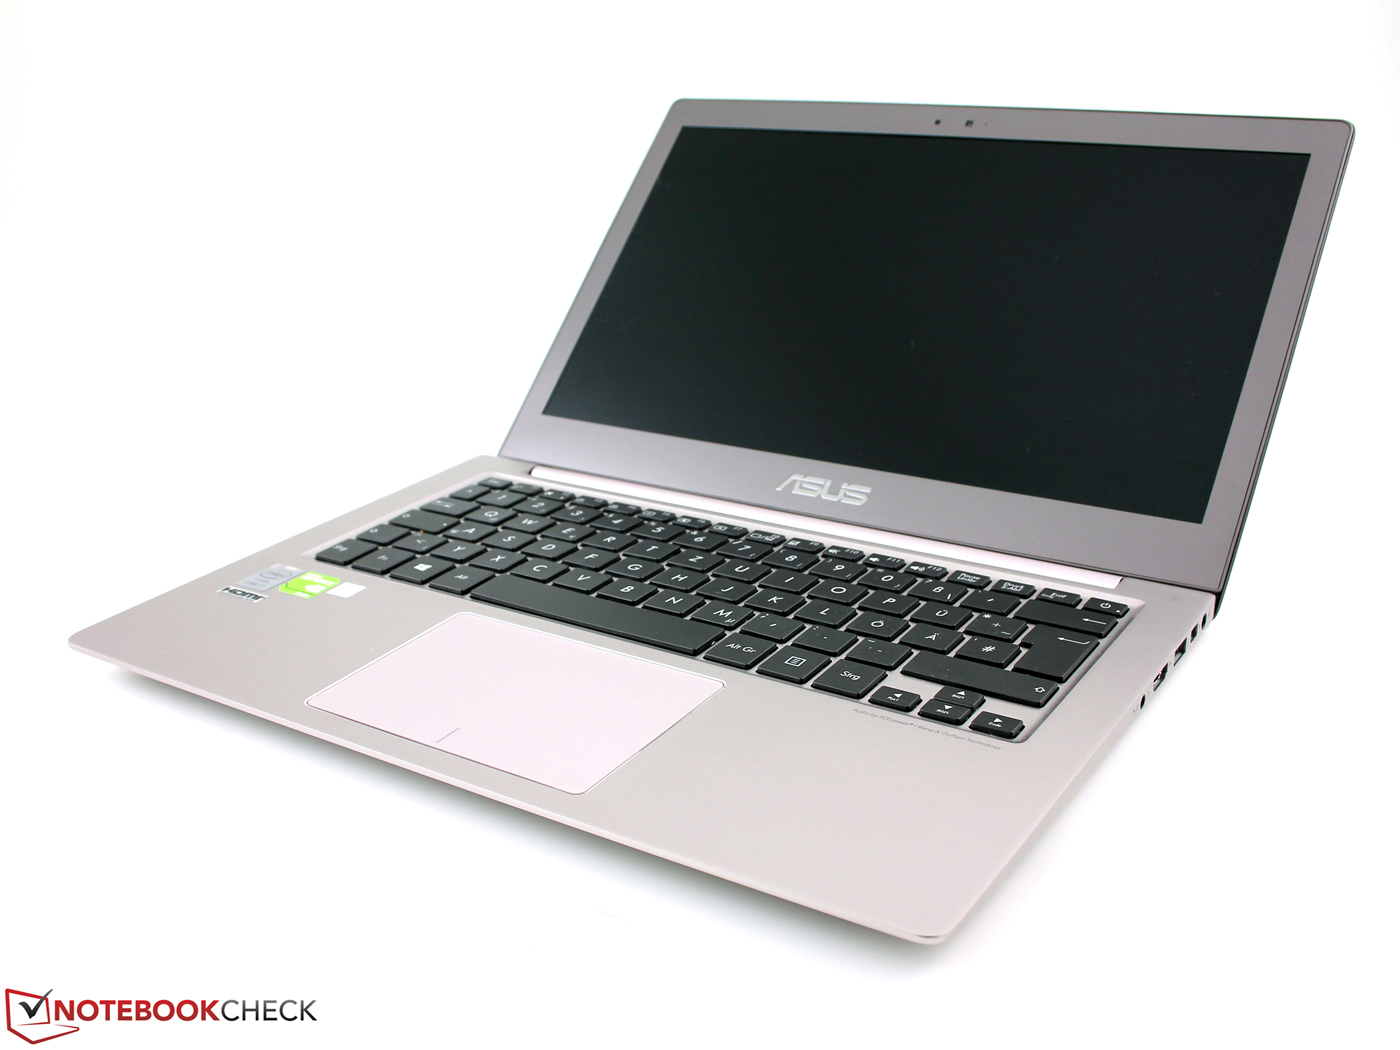
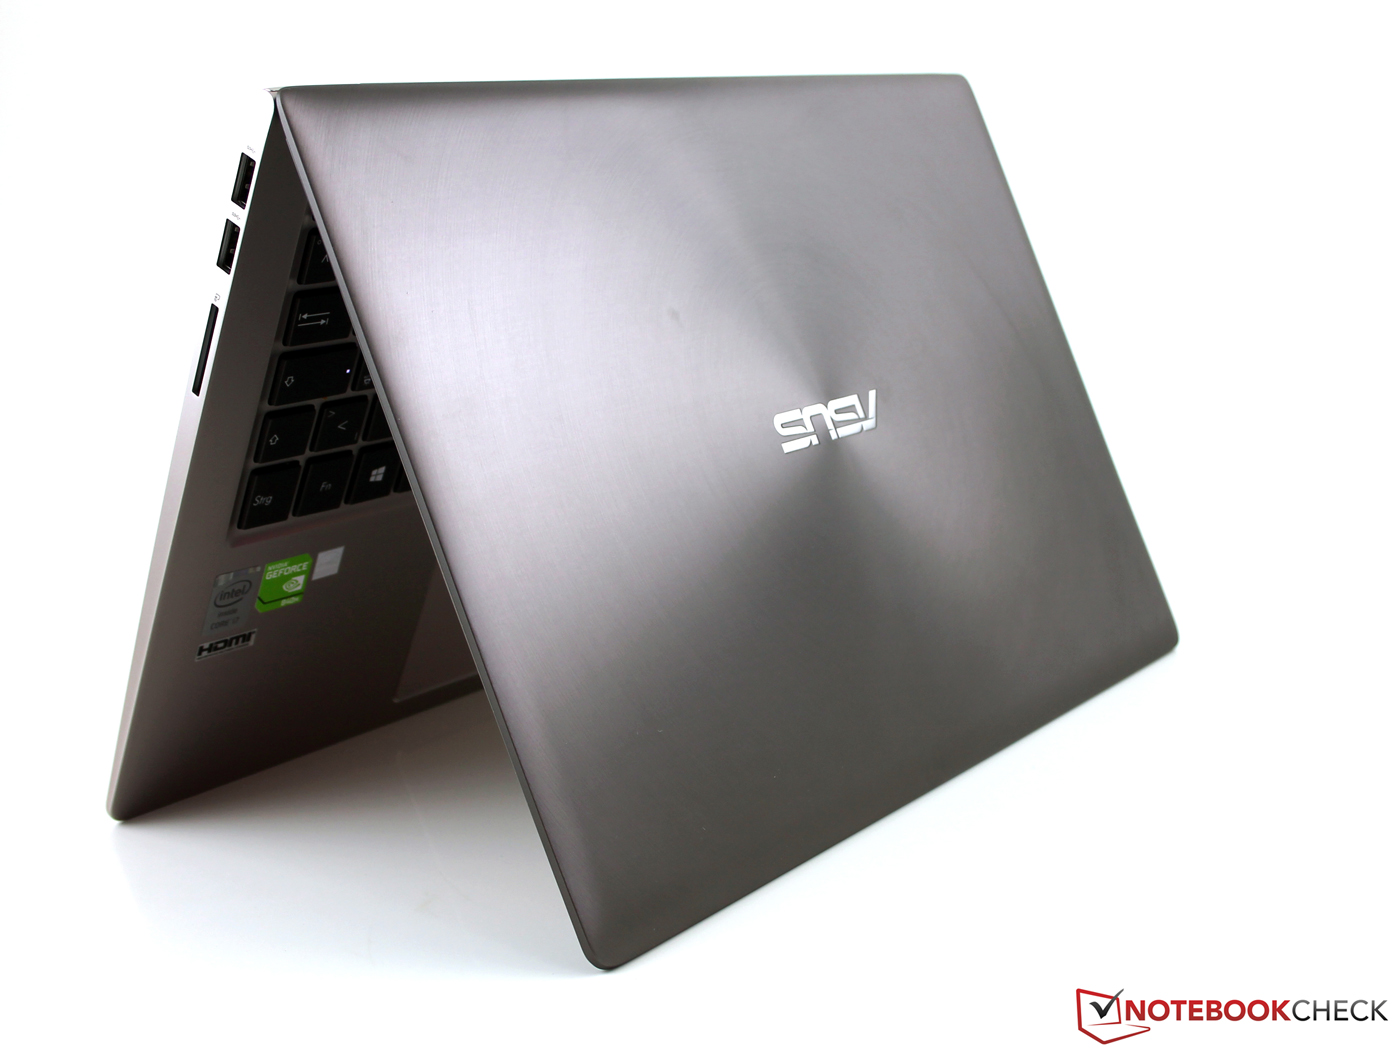
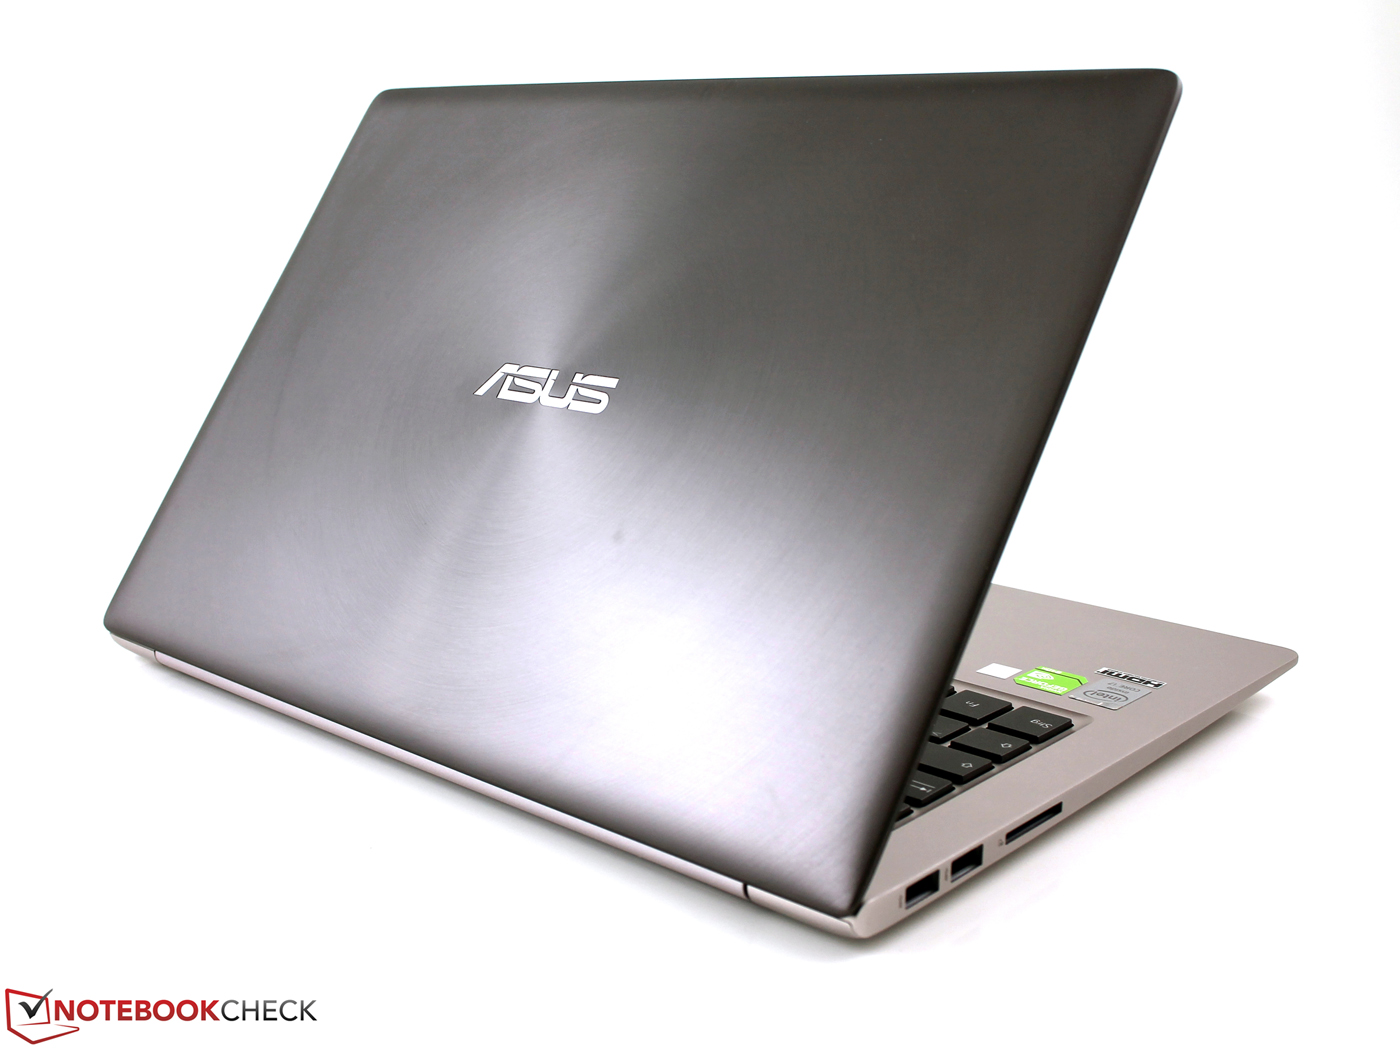
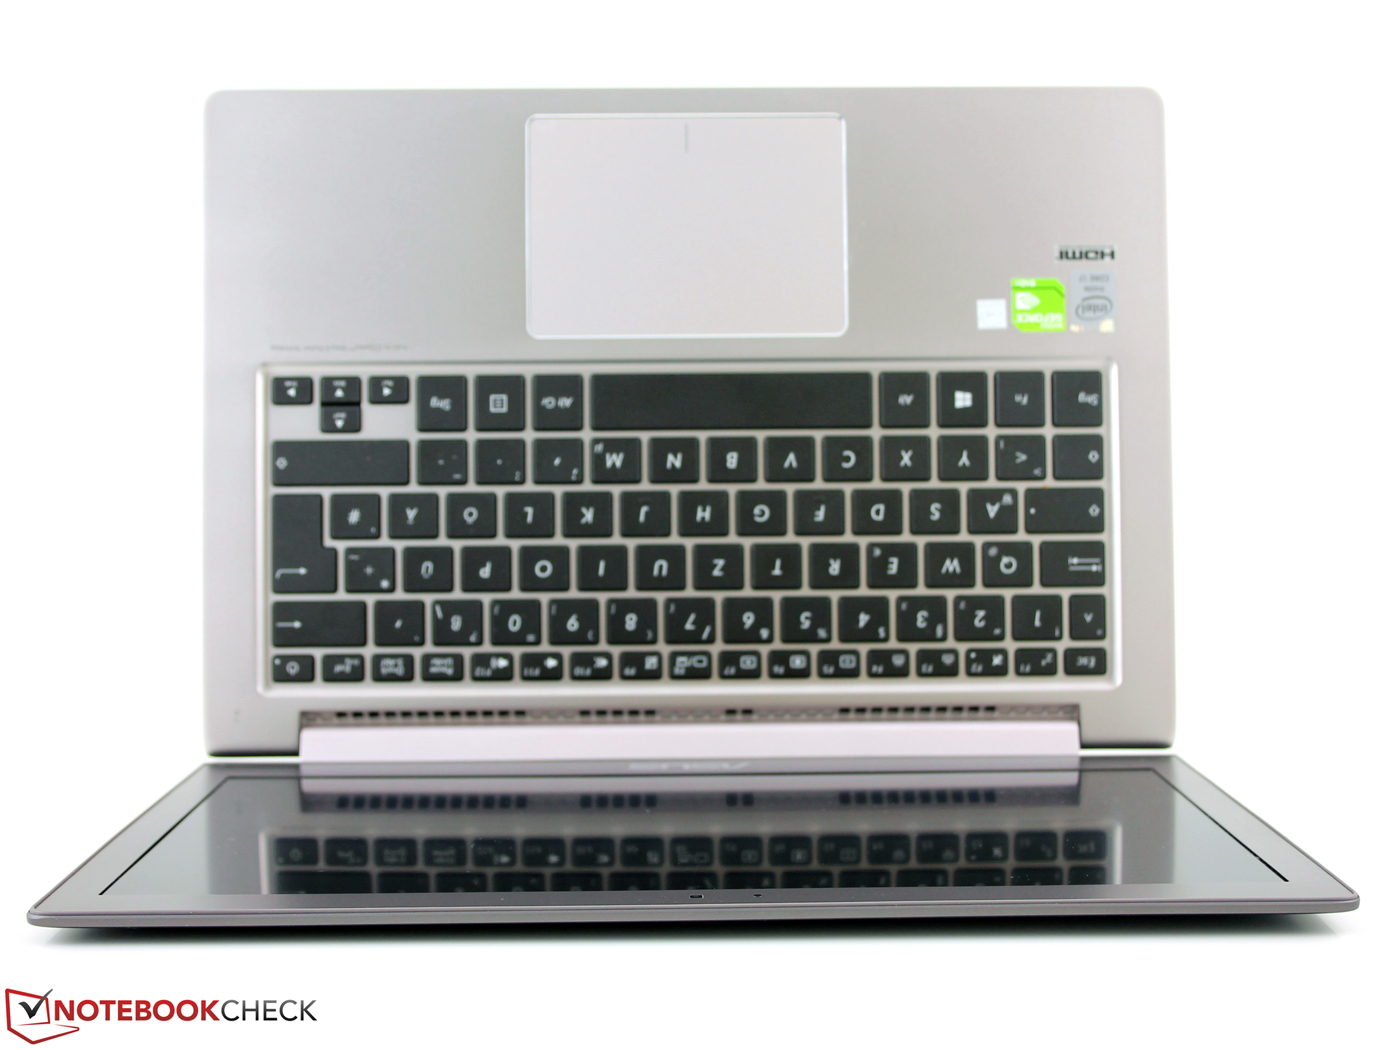
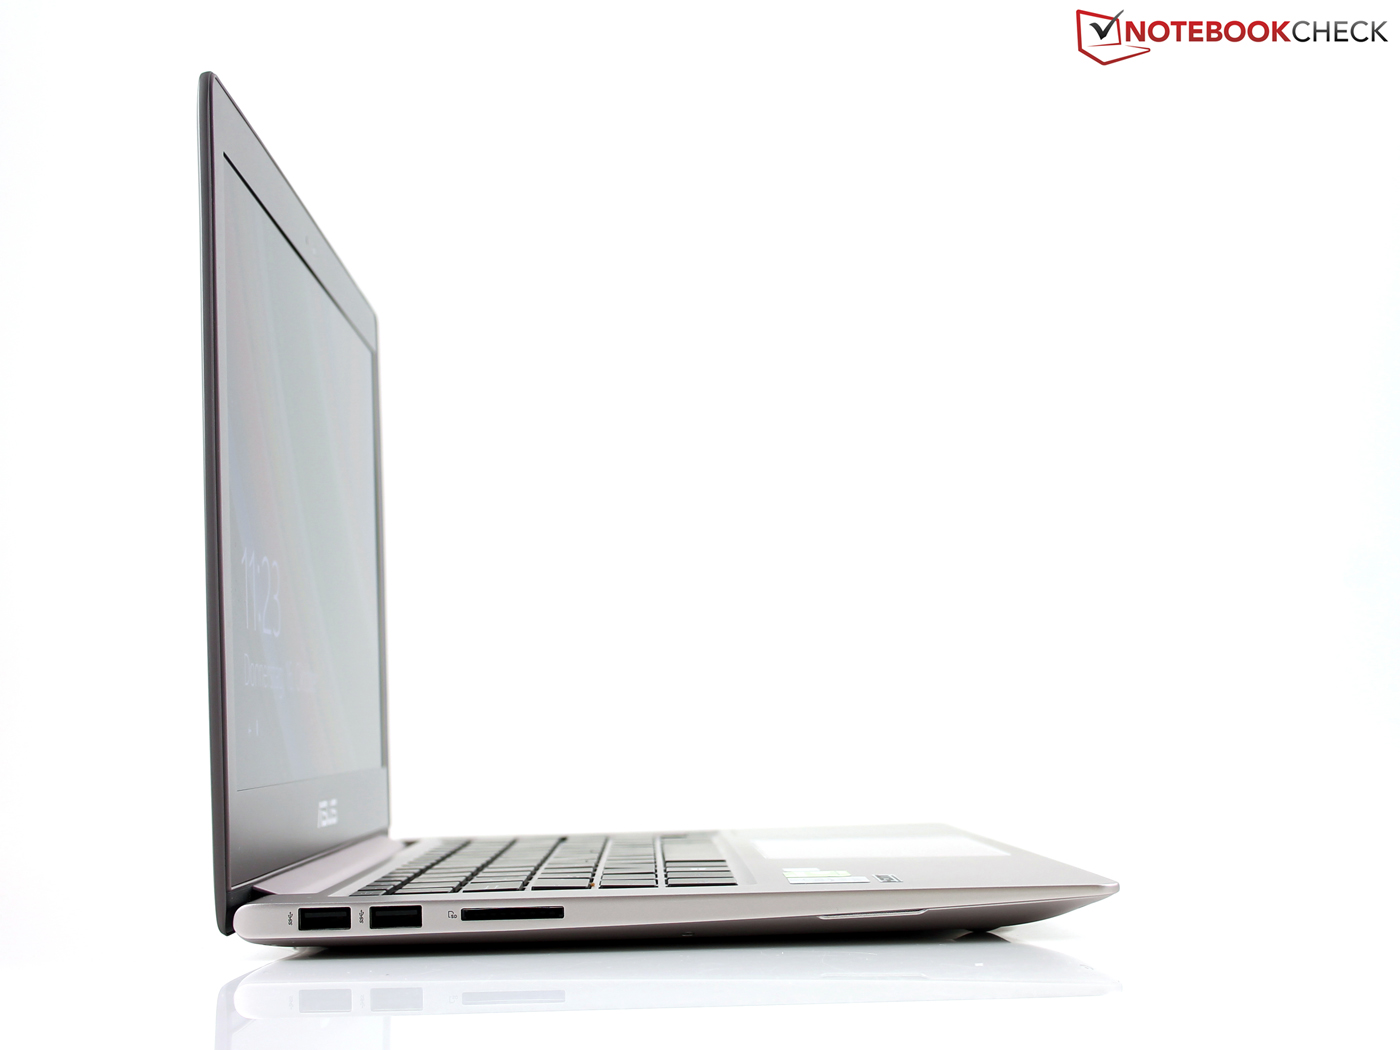
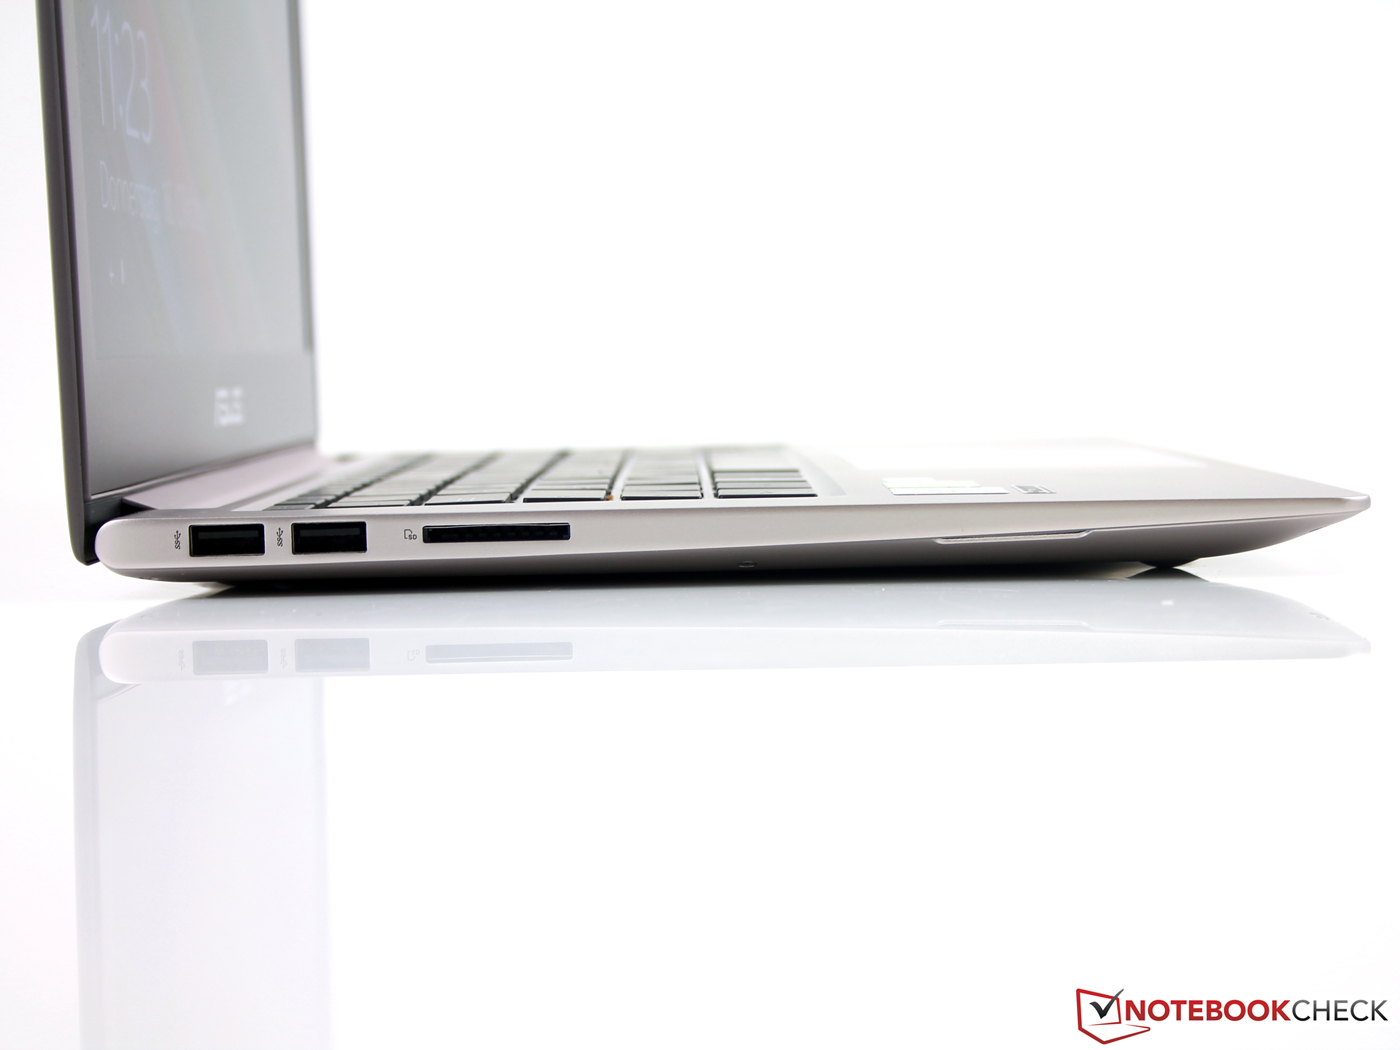
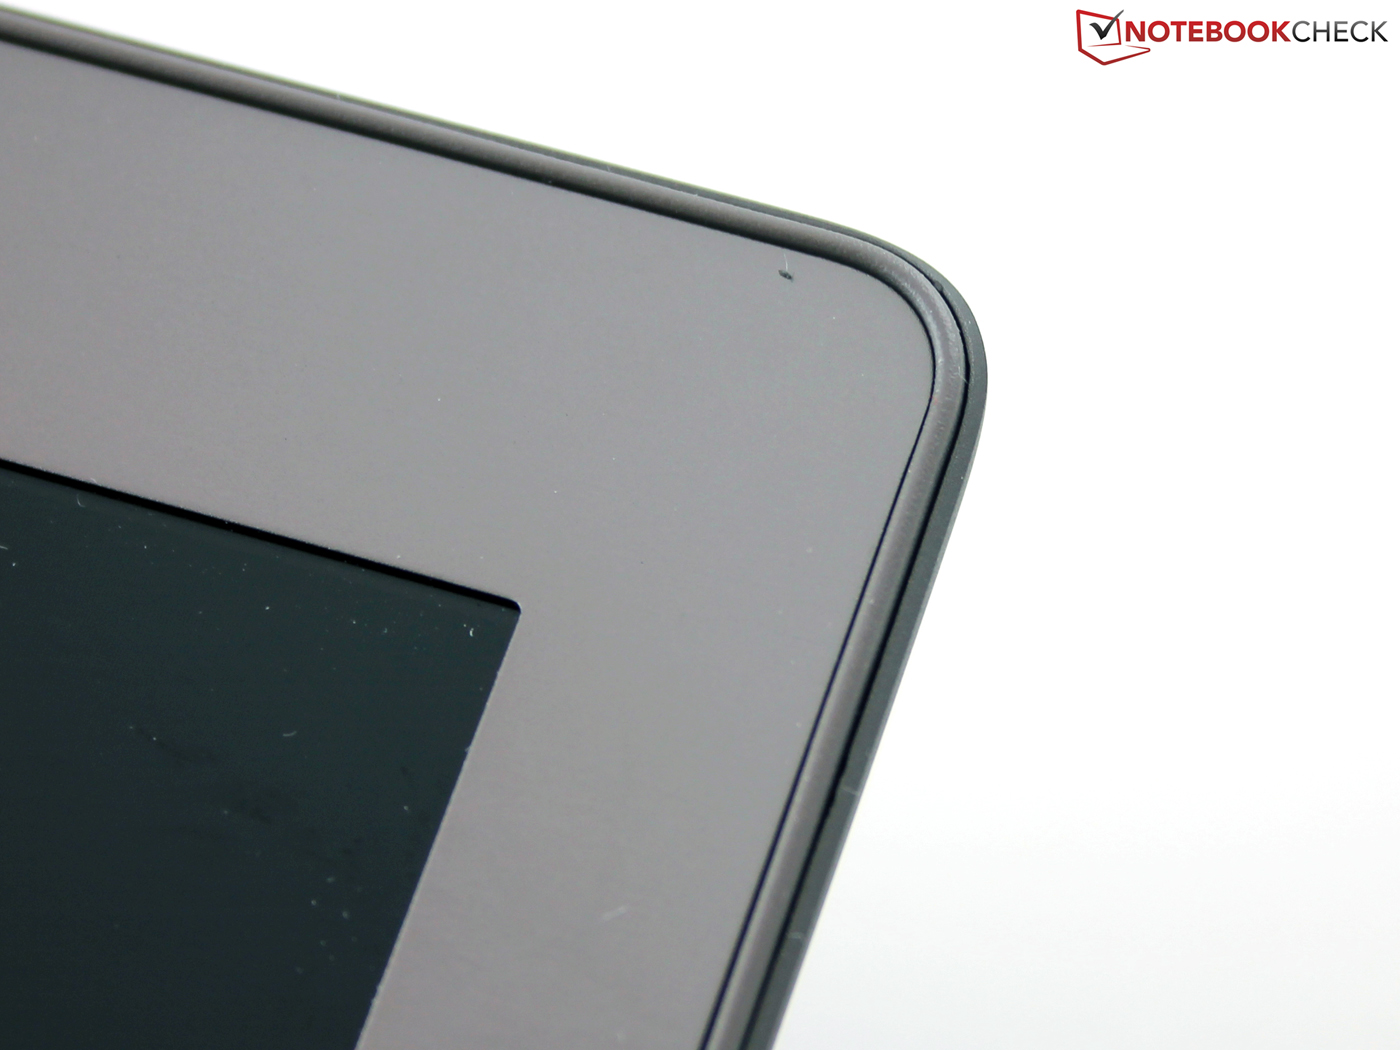
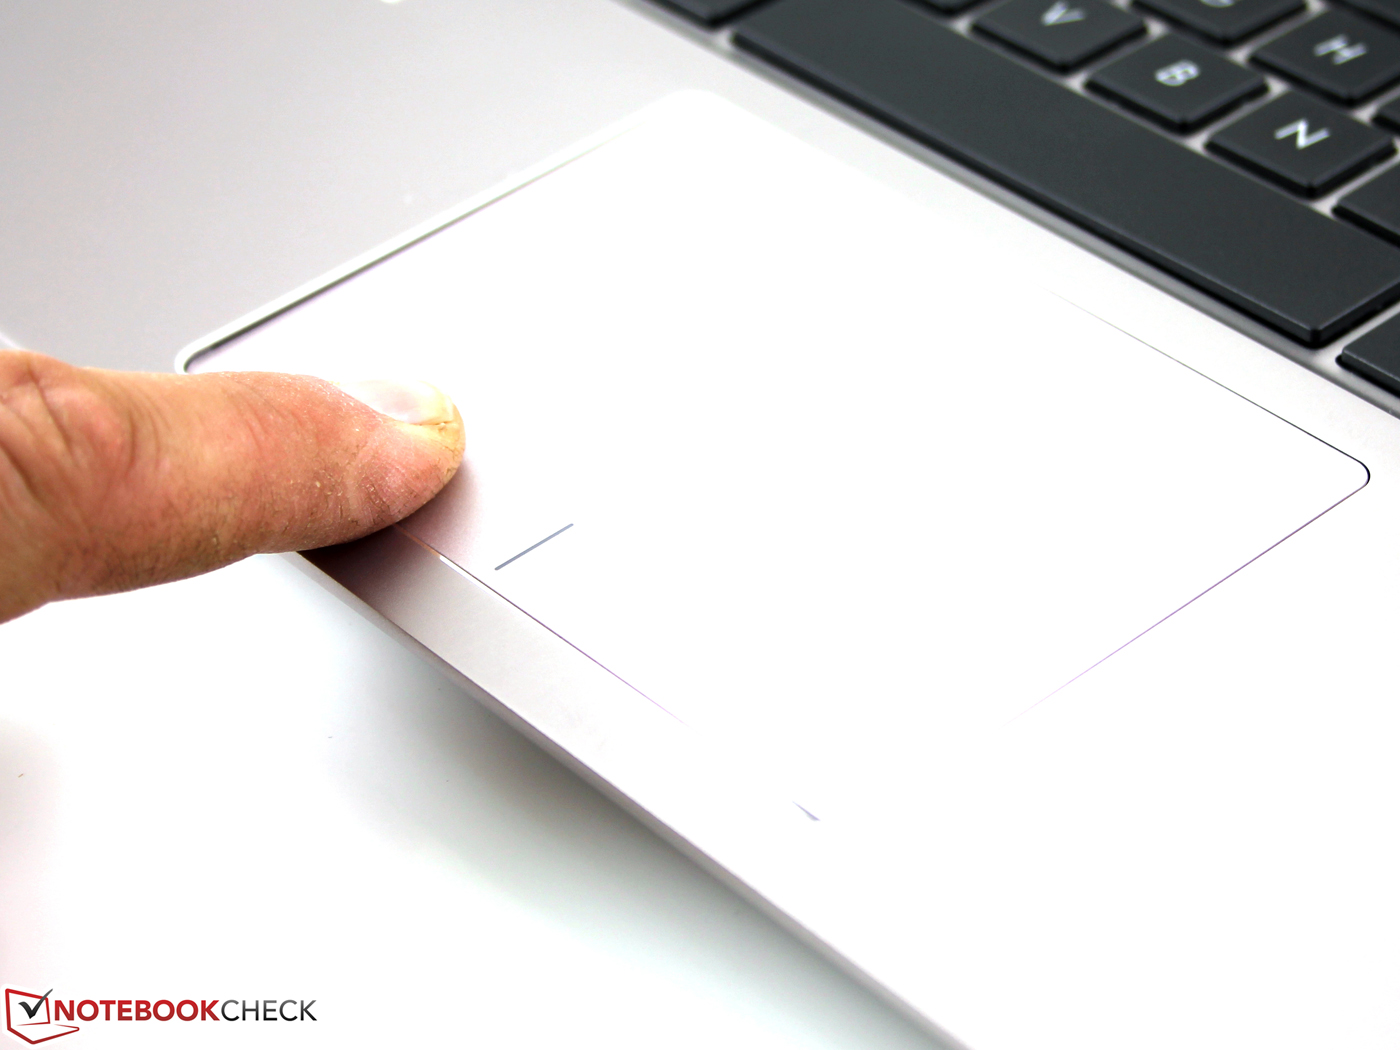
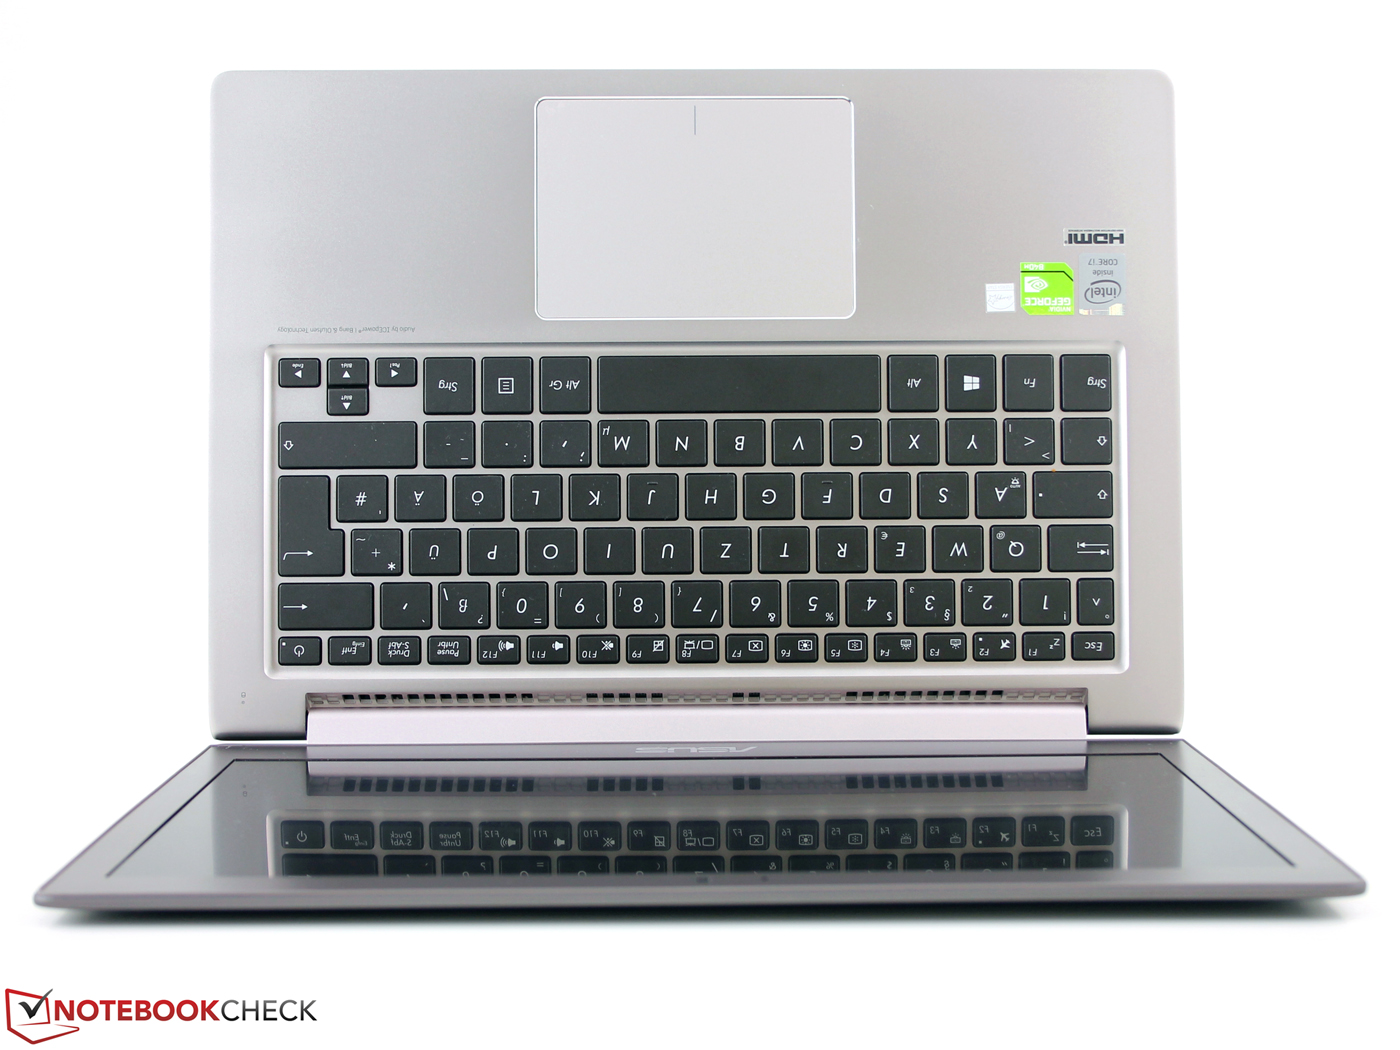
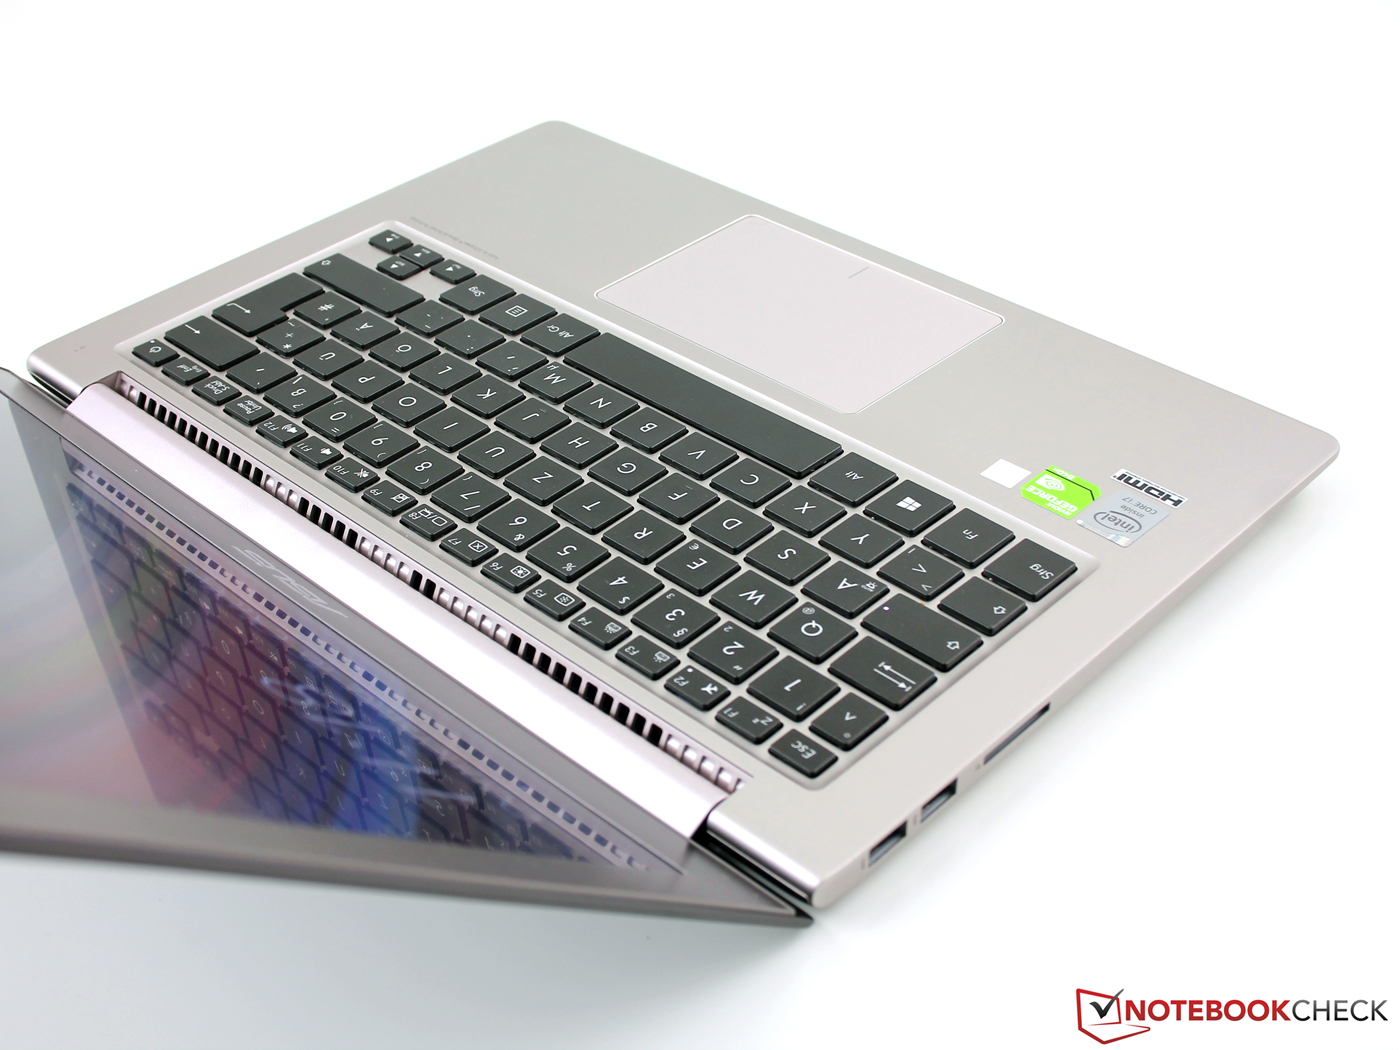
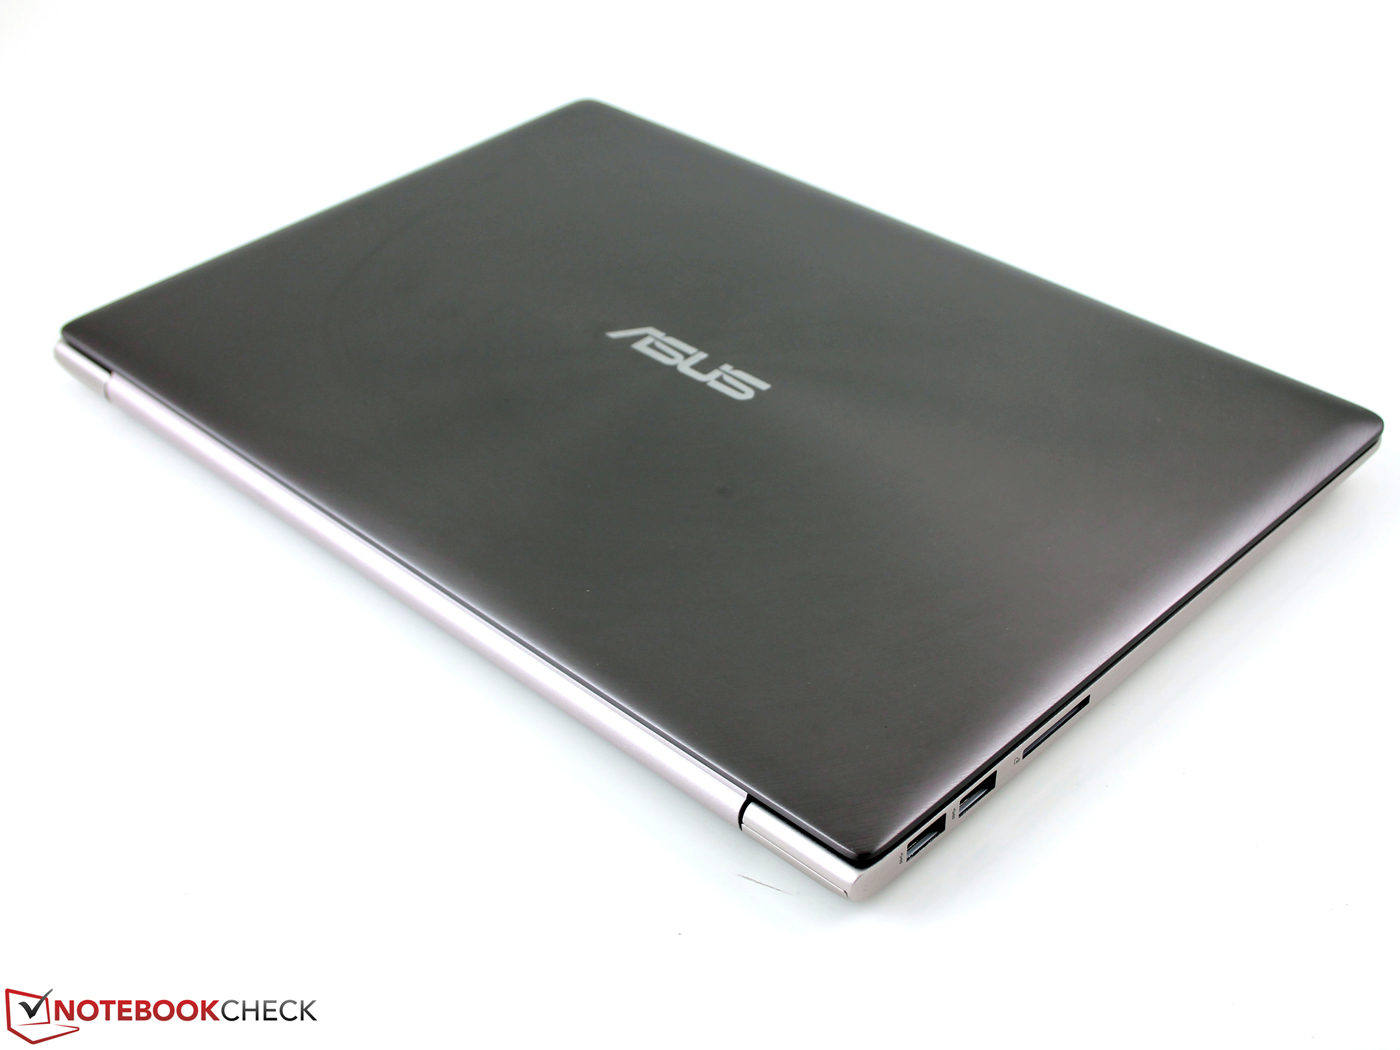
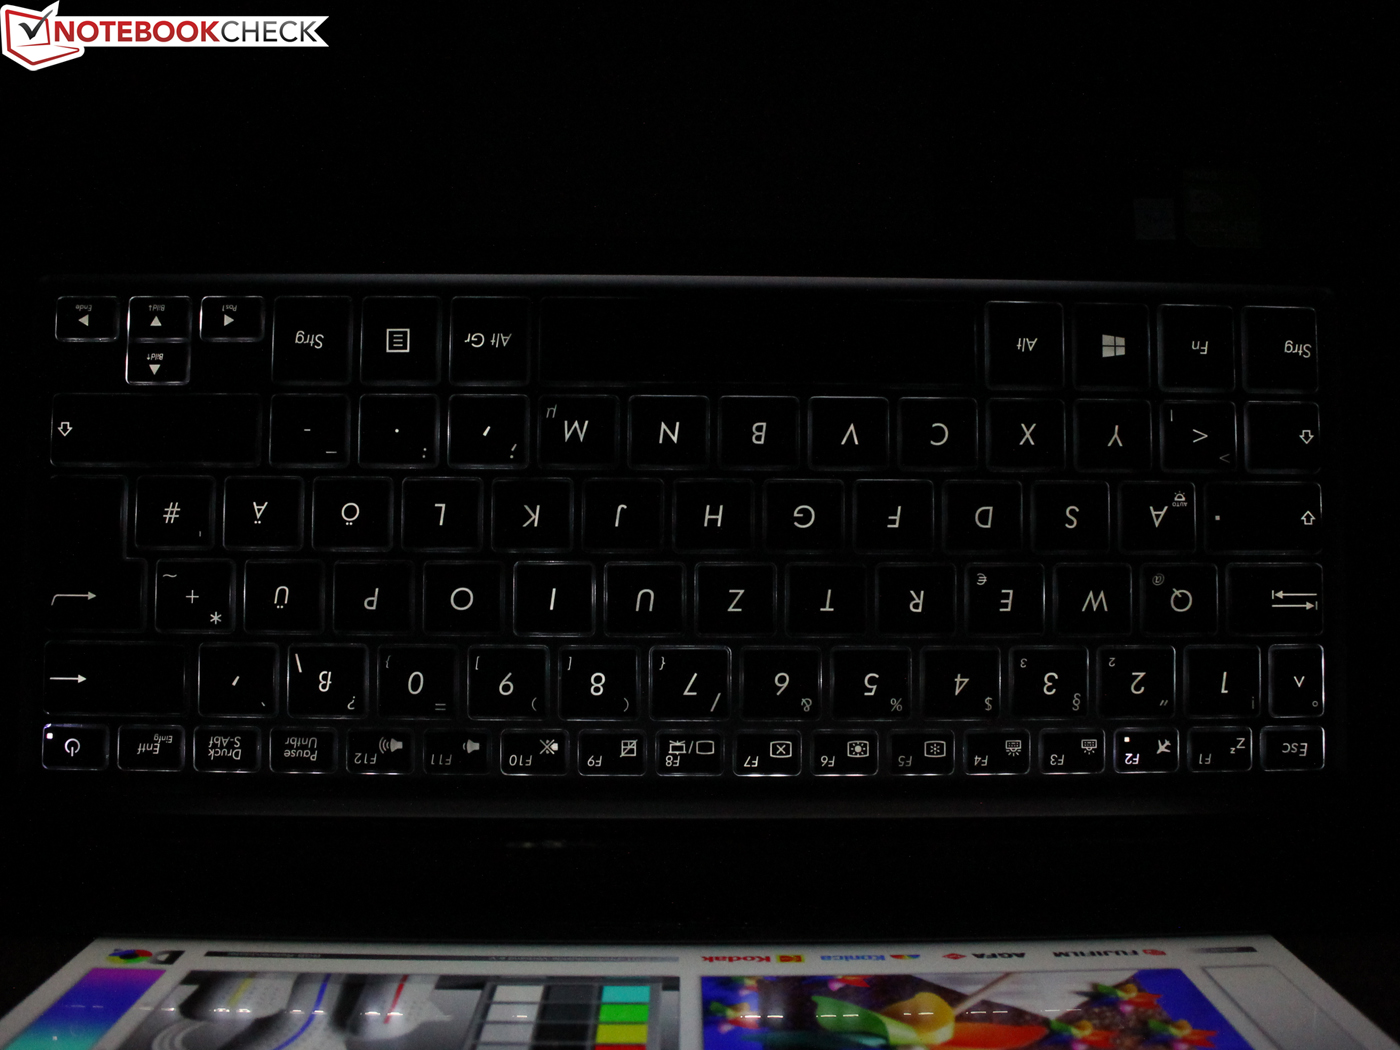
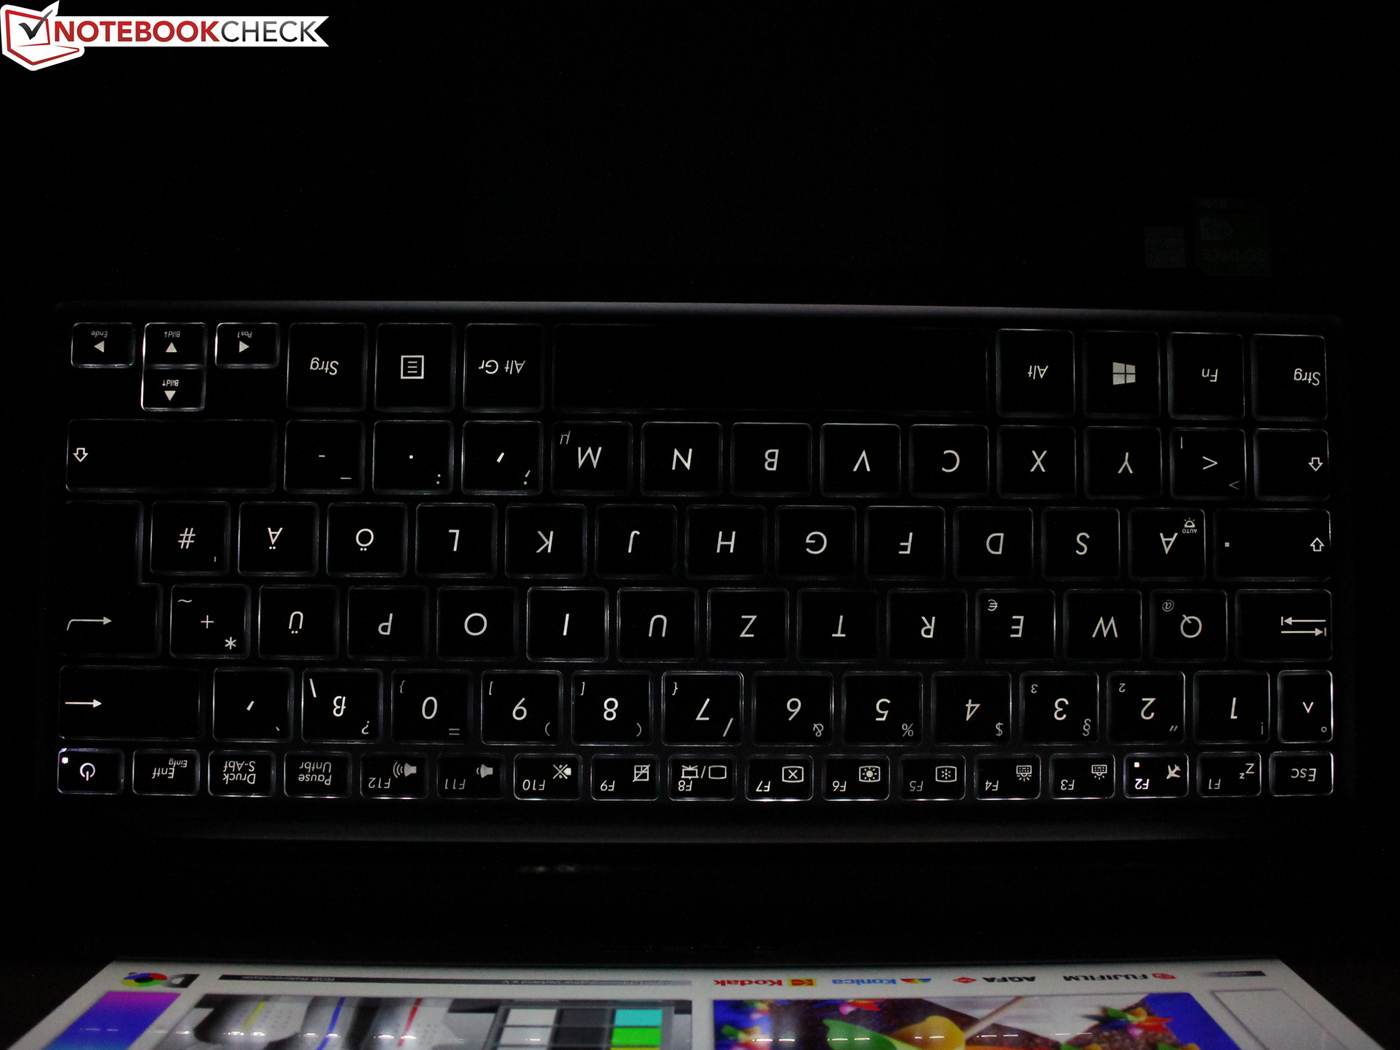
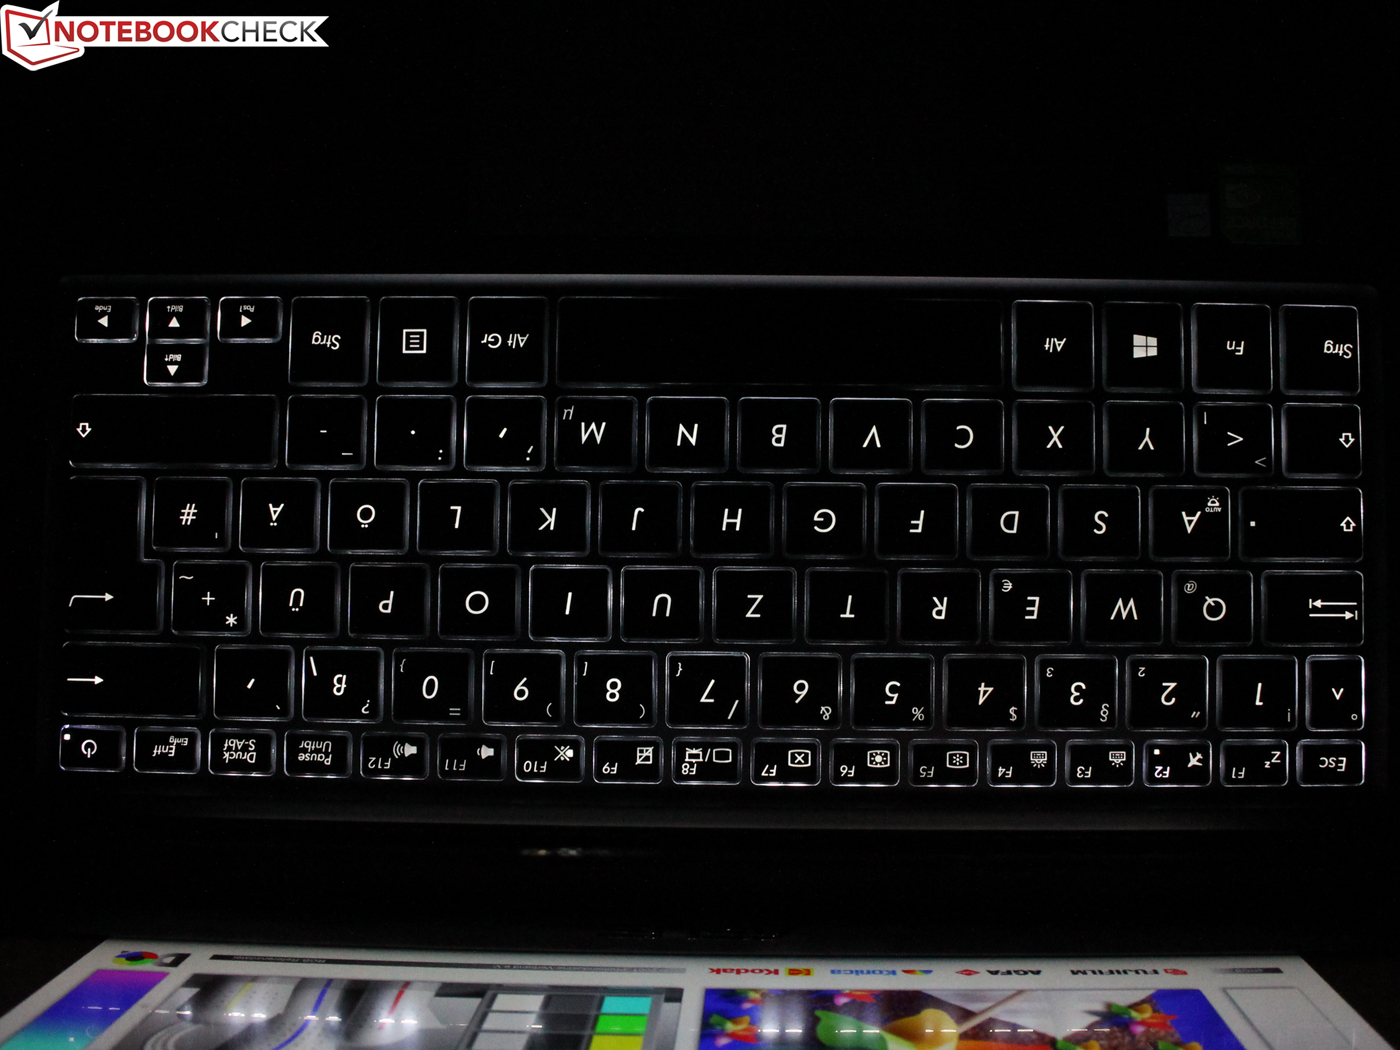
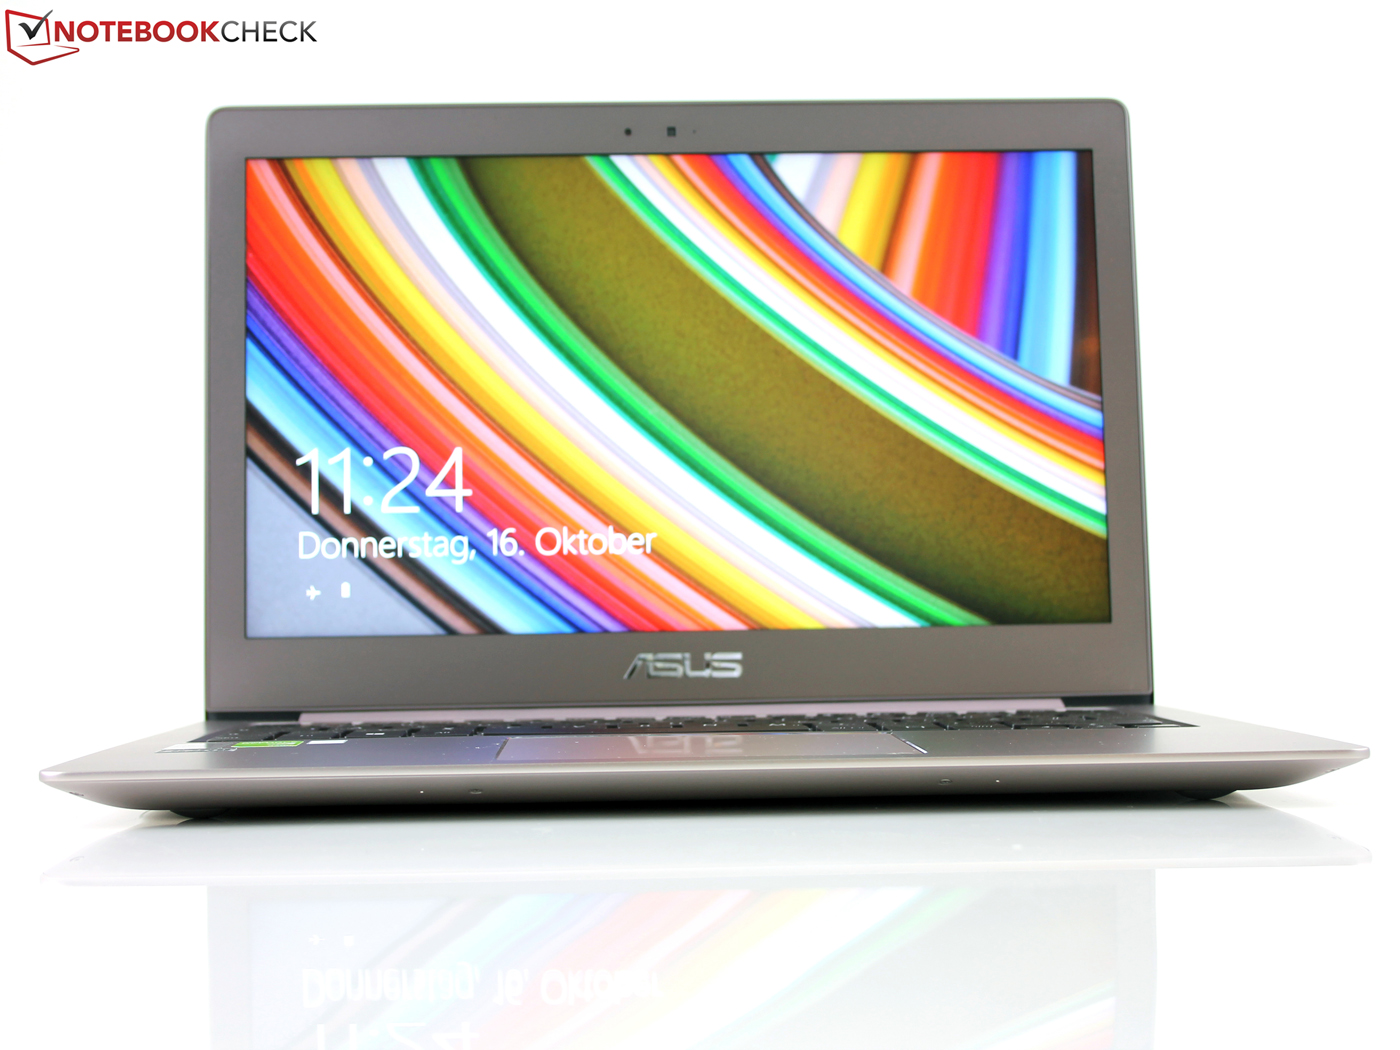
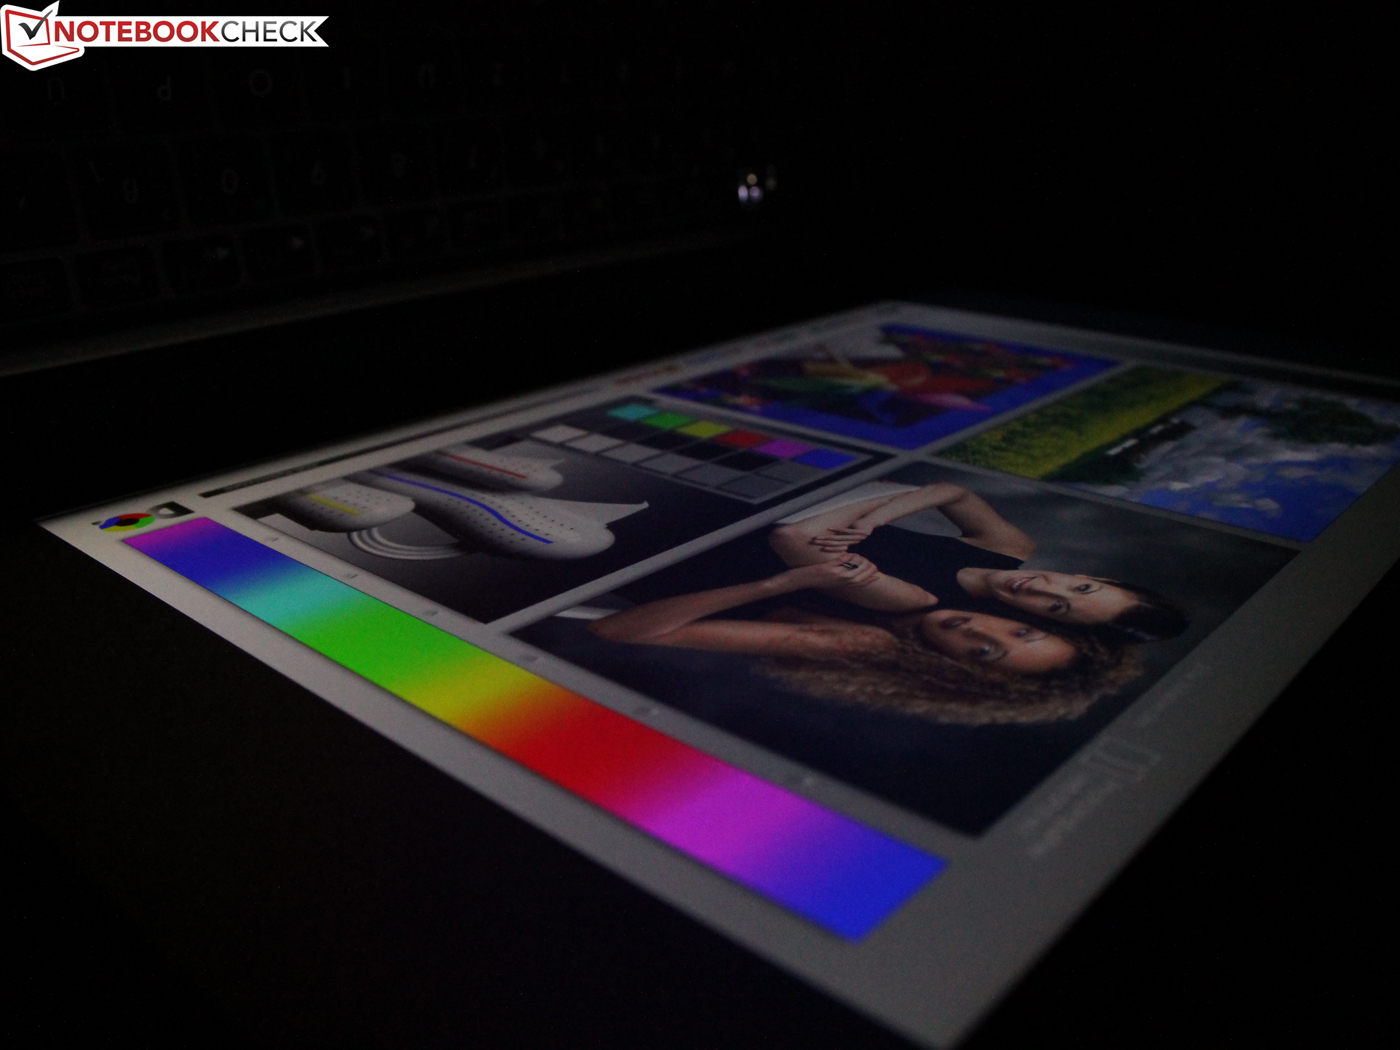
华硕再一次推出了一款可以让亚笔记本爱好者惊叹的全面产品。它的机身由一整块轻薄金属制成,质感十足,而仅1.43千克的重量让它也十分便于携带。尽管磨砂的全高清屏幕没能提供出色的对比度,但它的亮度很高,色彩准确度(校准后)十分优秀。
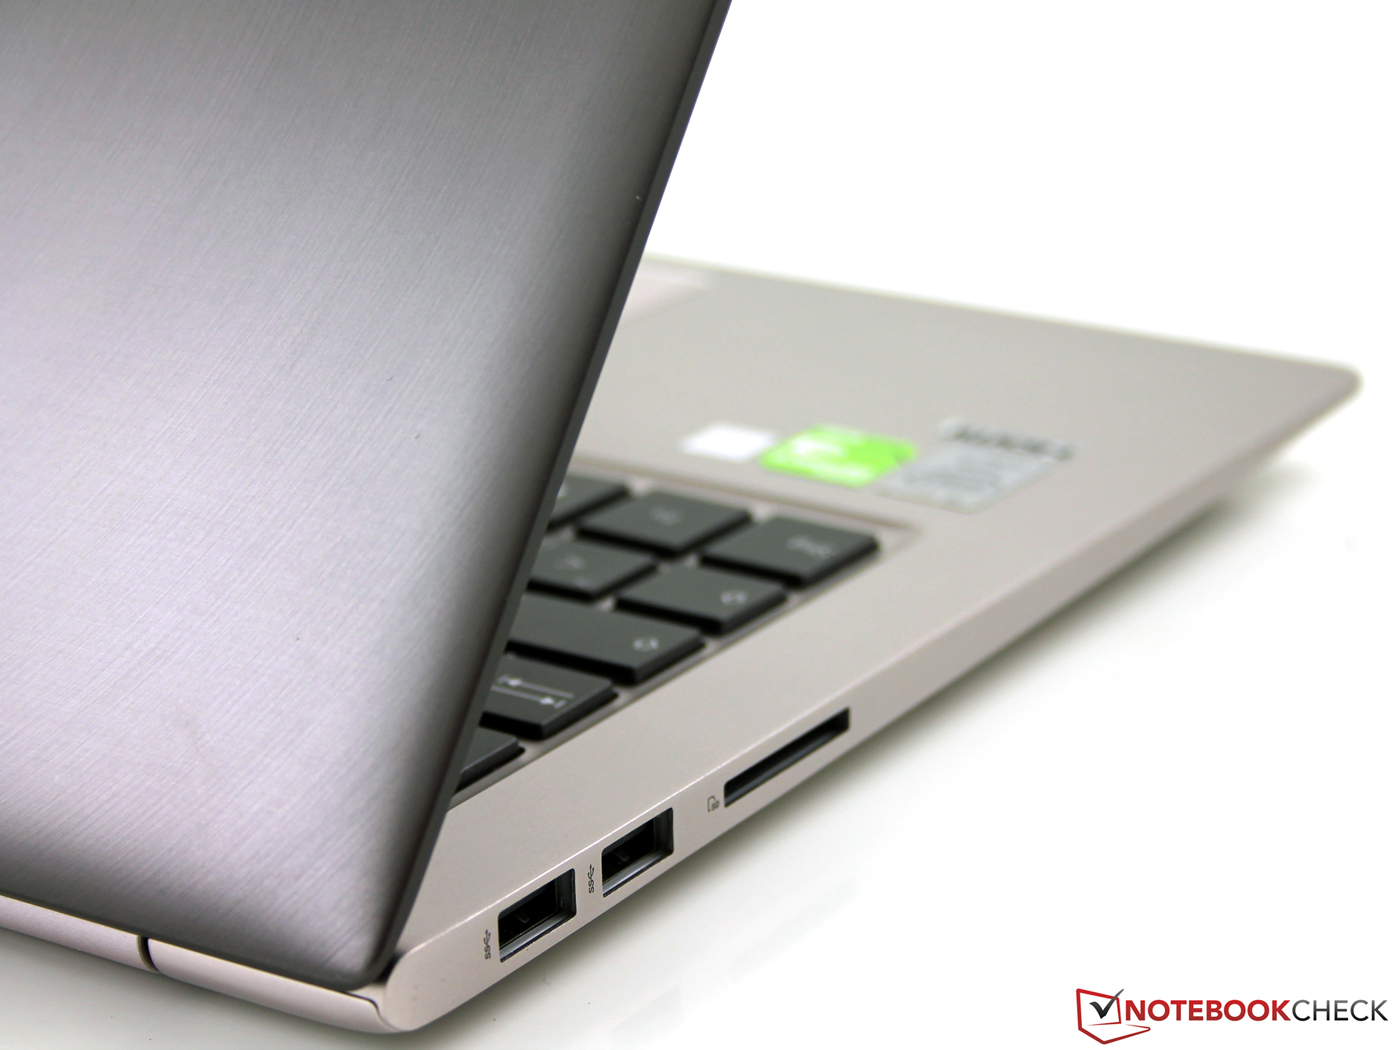
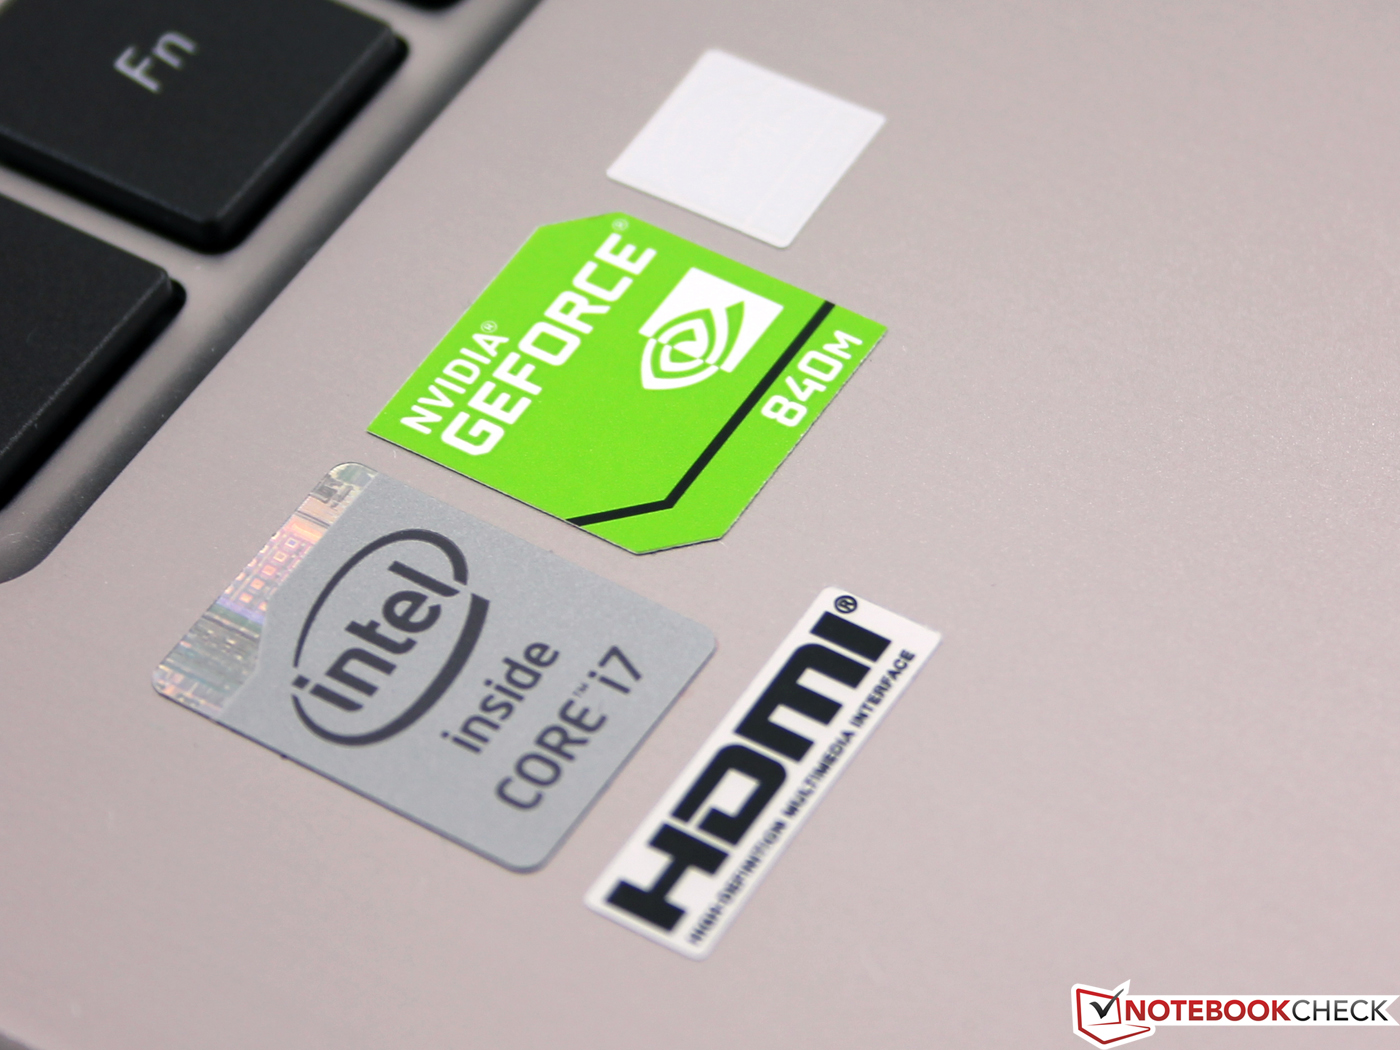
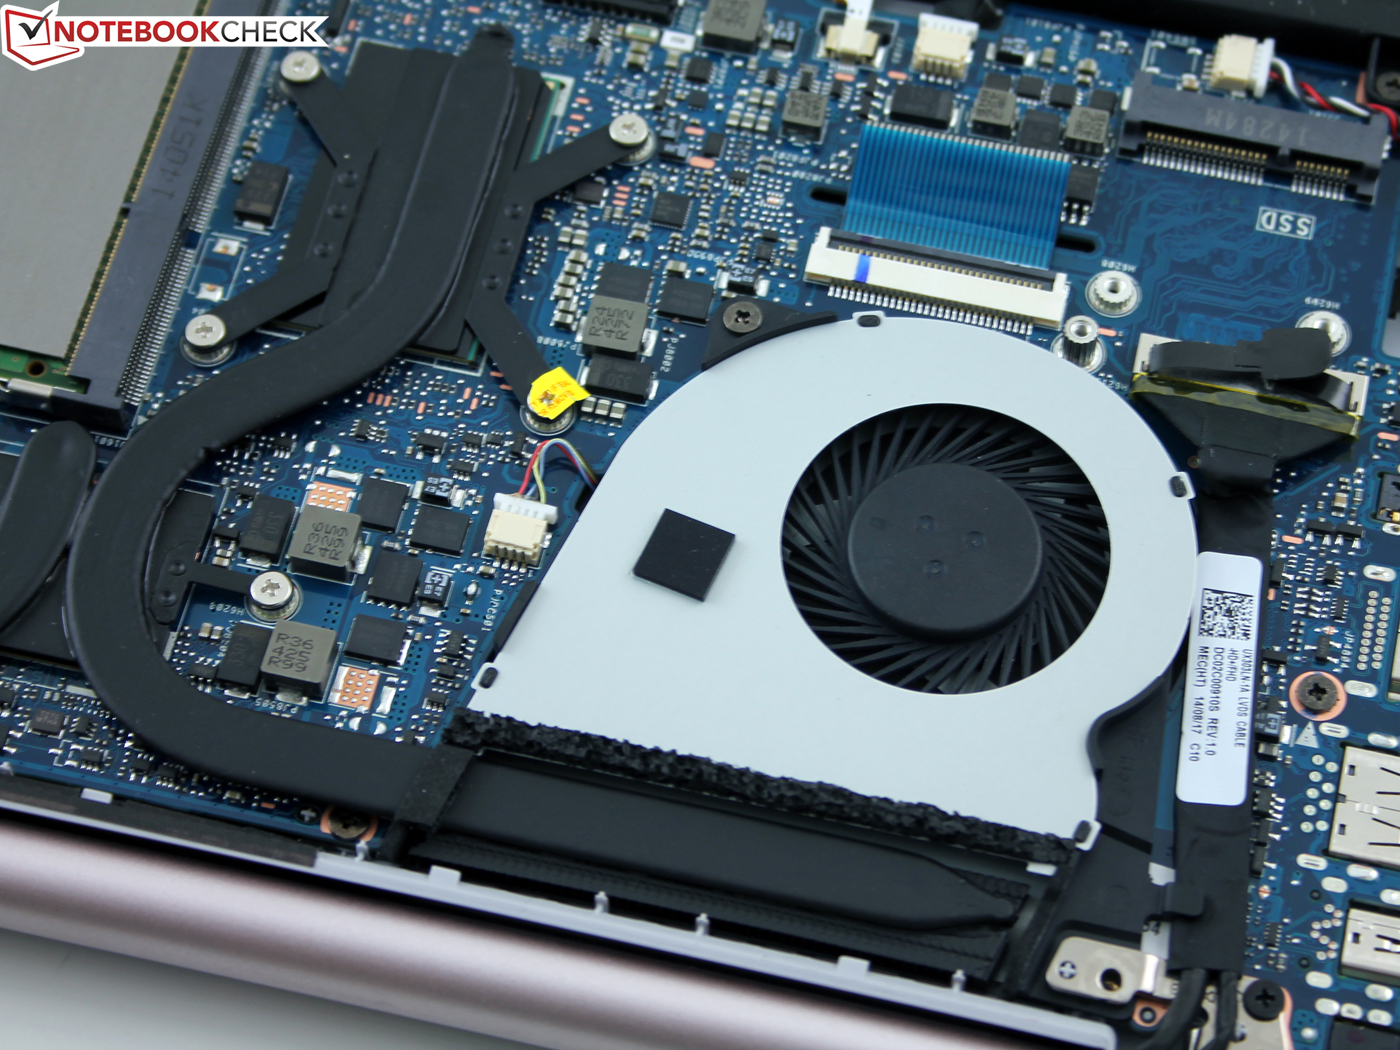
UX303的一个重要特点是它配备的GeForce 840M显卡,这让它甚至可以运行最新的游戏。尽管有显卡这第二个发热大户,它的散热系统仍然让机身保持了较低的温度,系统的噪音也十分有限,在这方面它的表现甚至优于一些没有配备独立显卡的竞争对手。非游戏玩家可以选择UX303LA机型,这个型号采用了集成显卡。
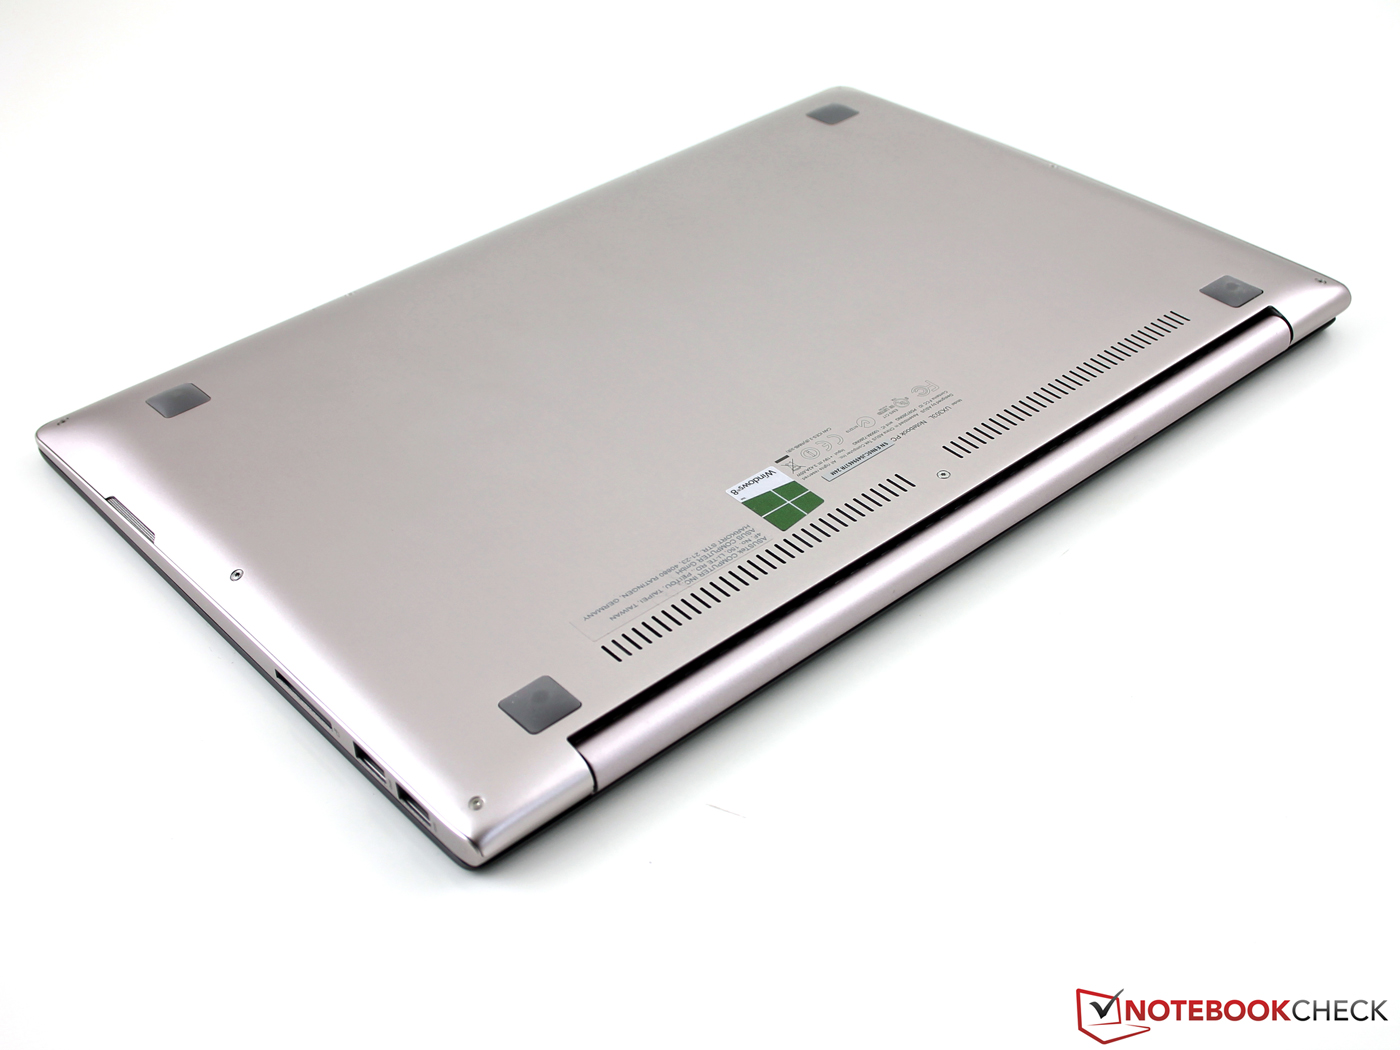
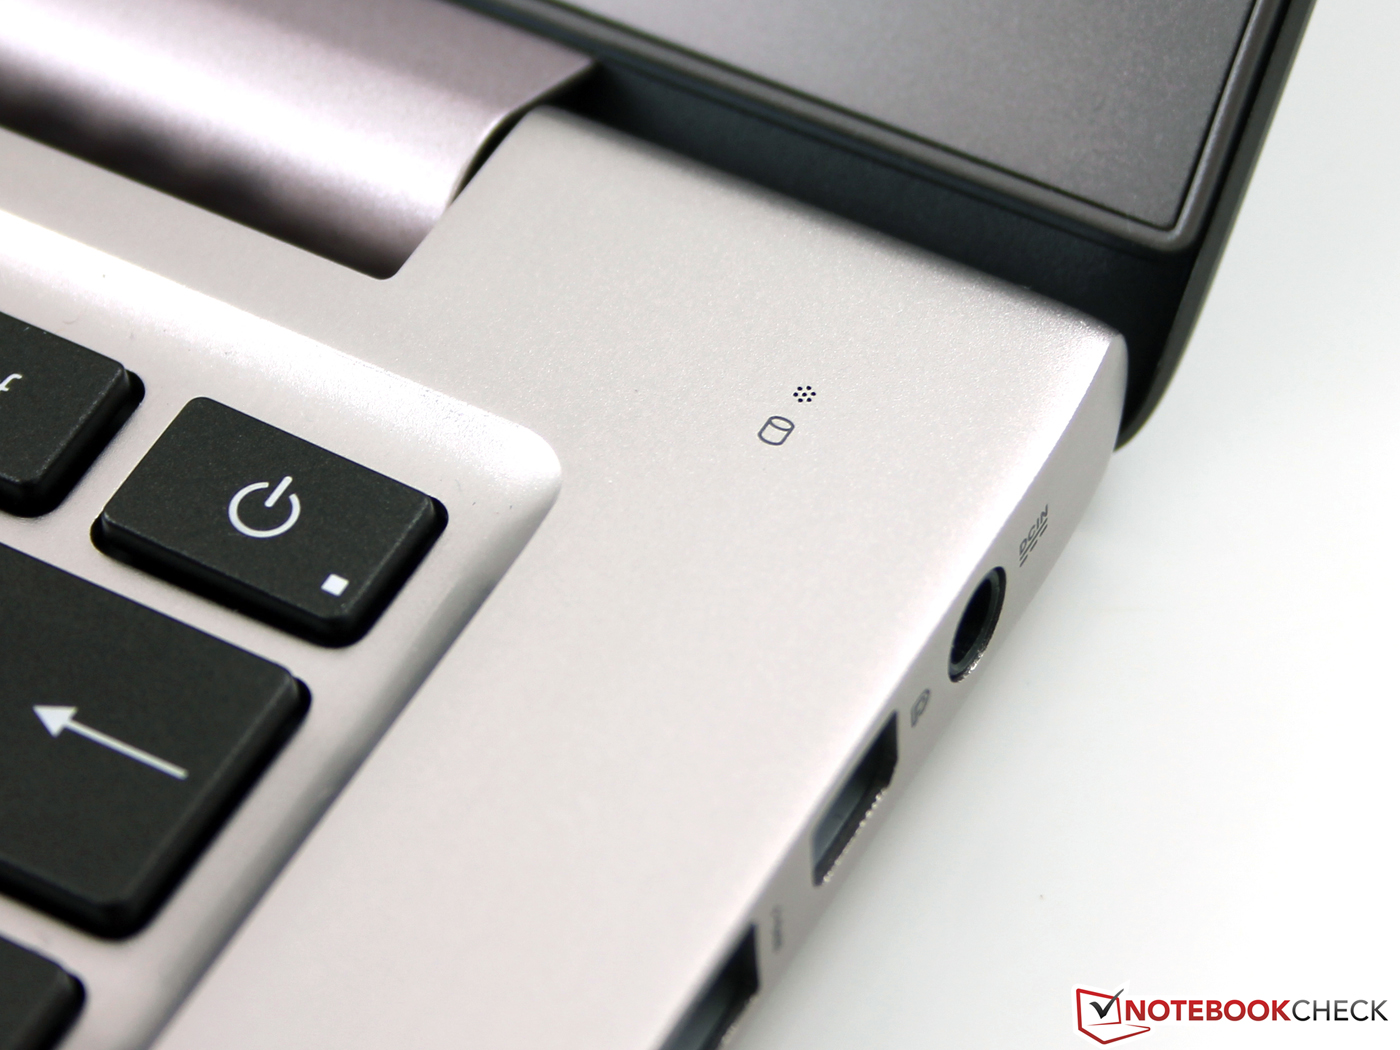
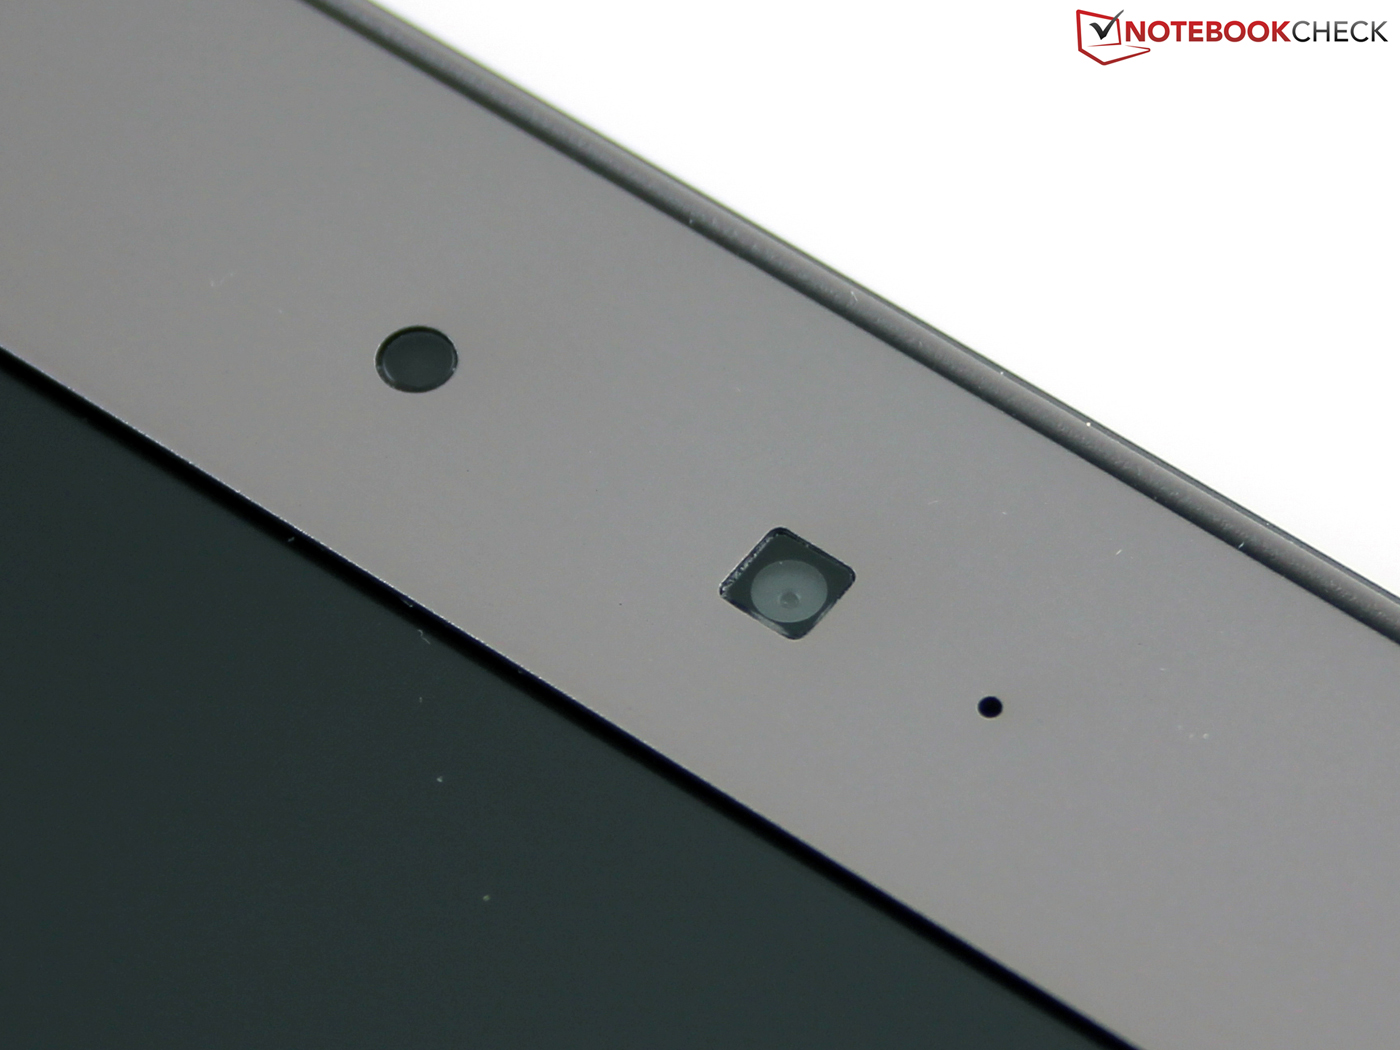
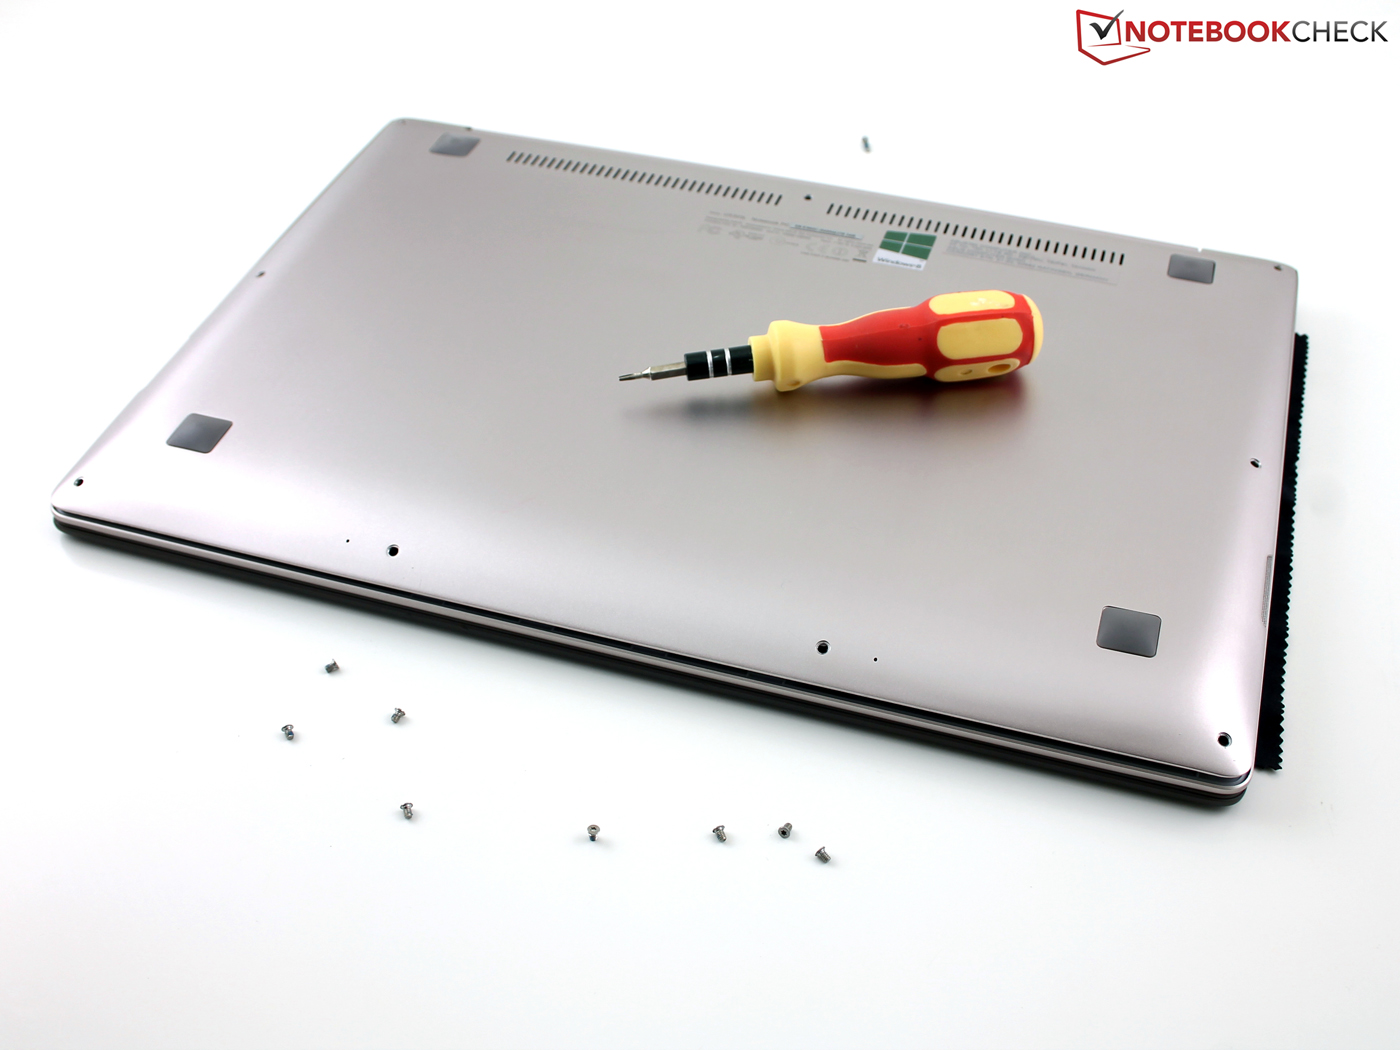
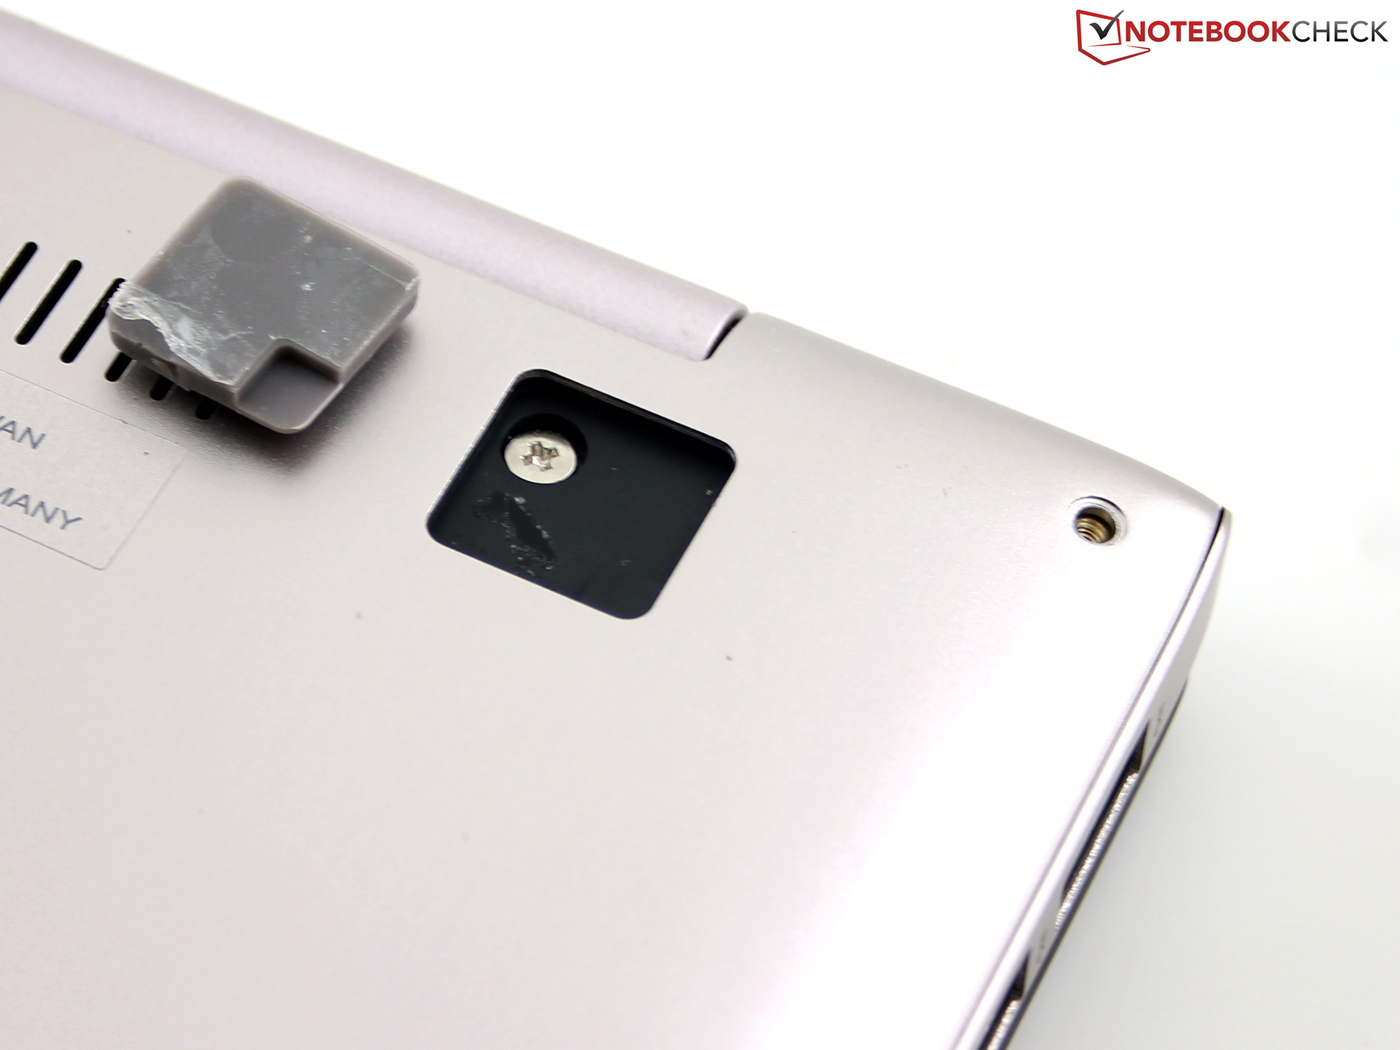
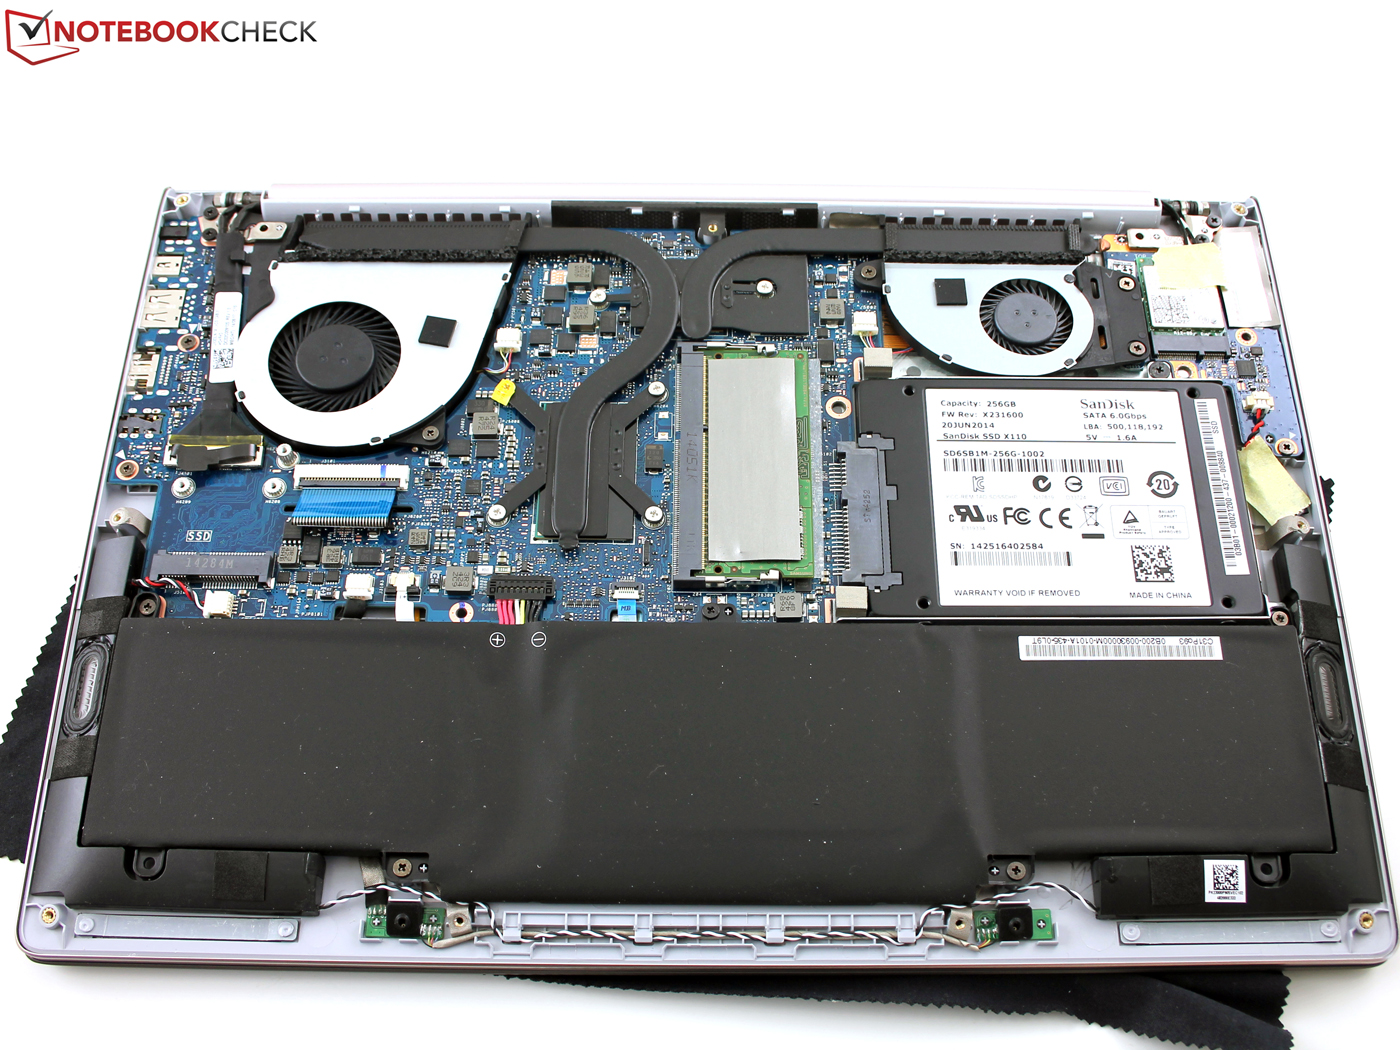
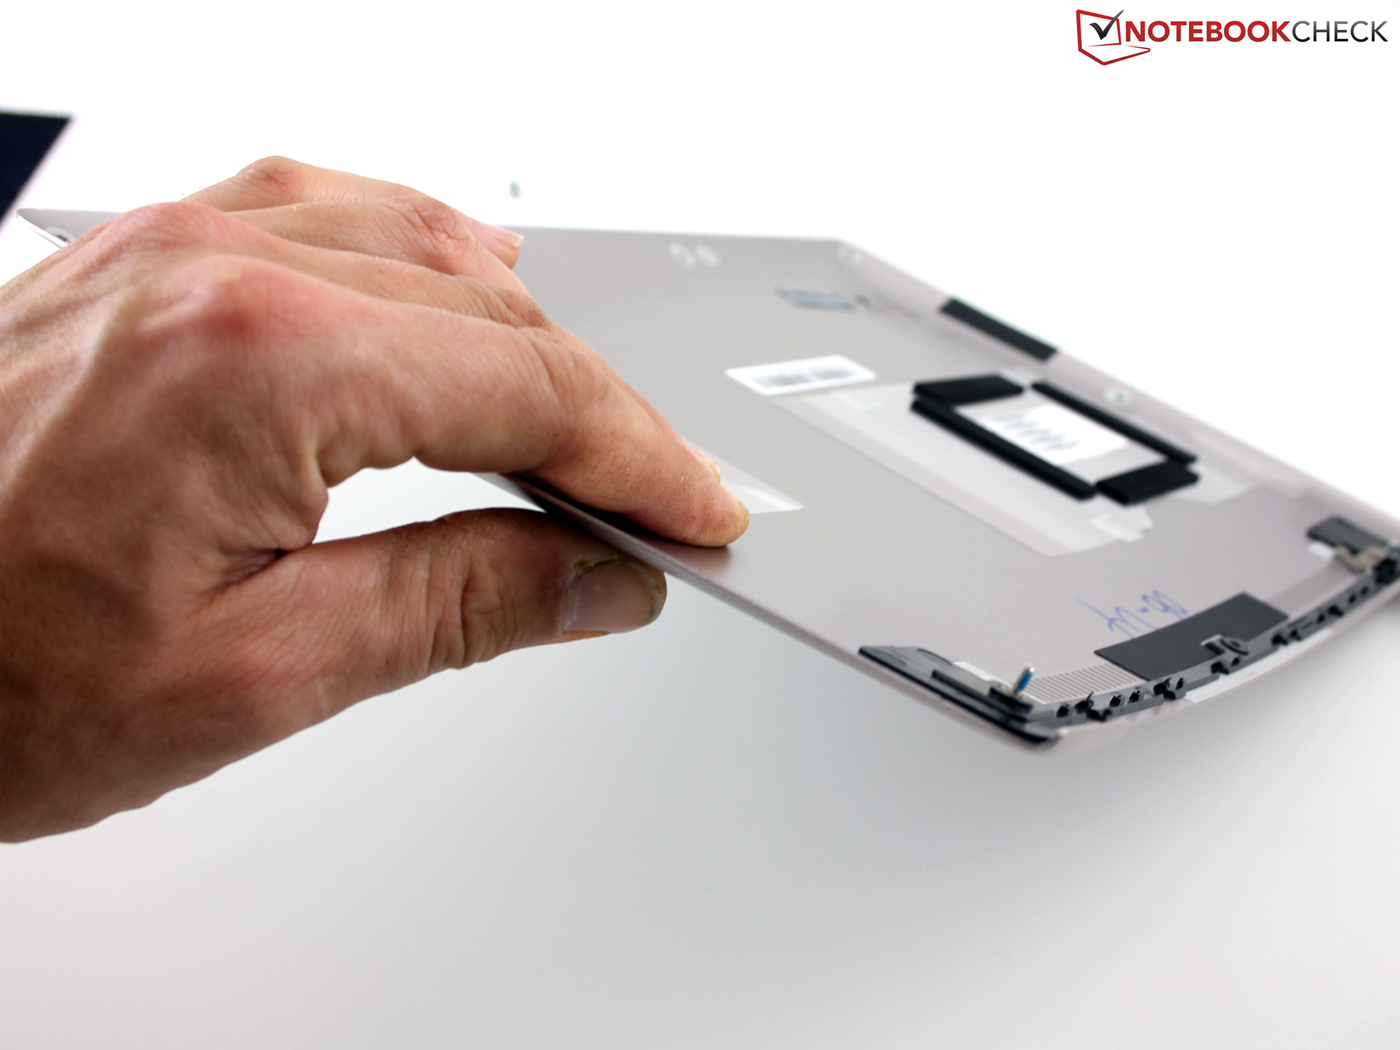
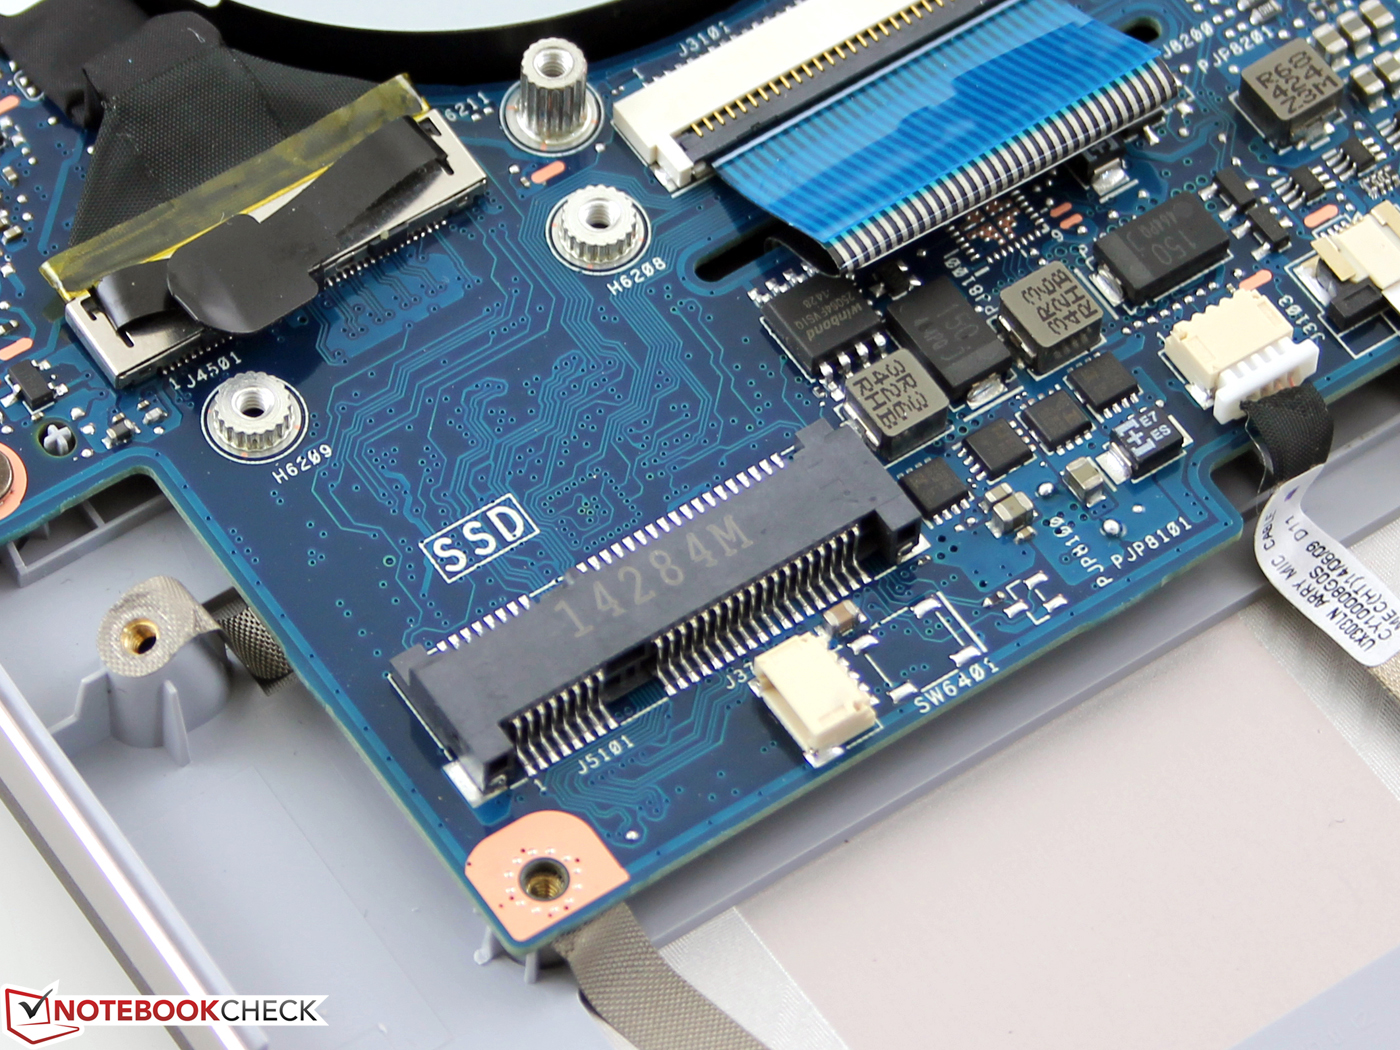
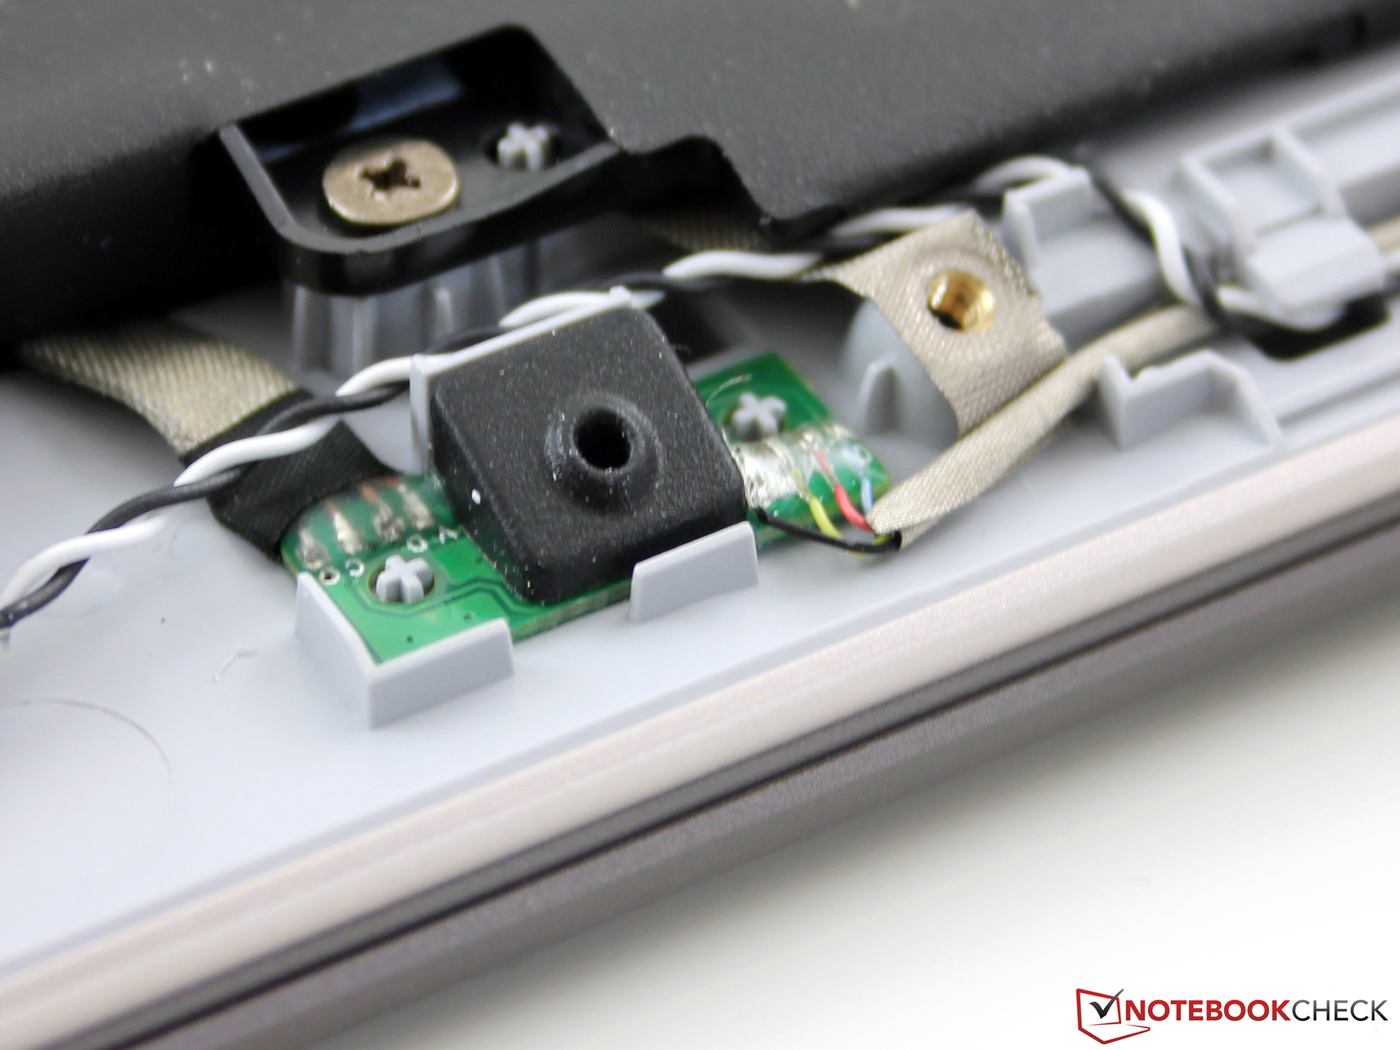
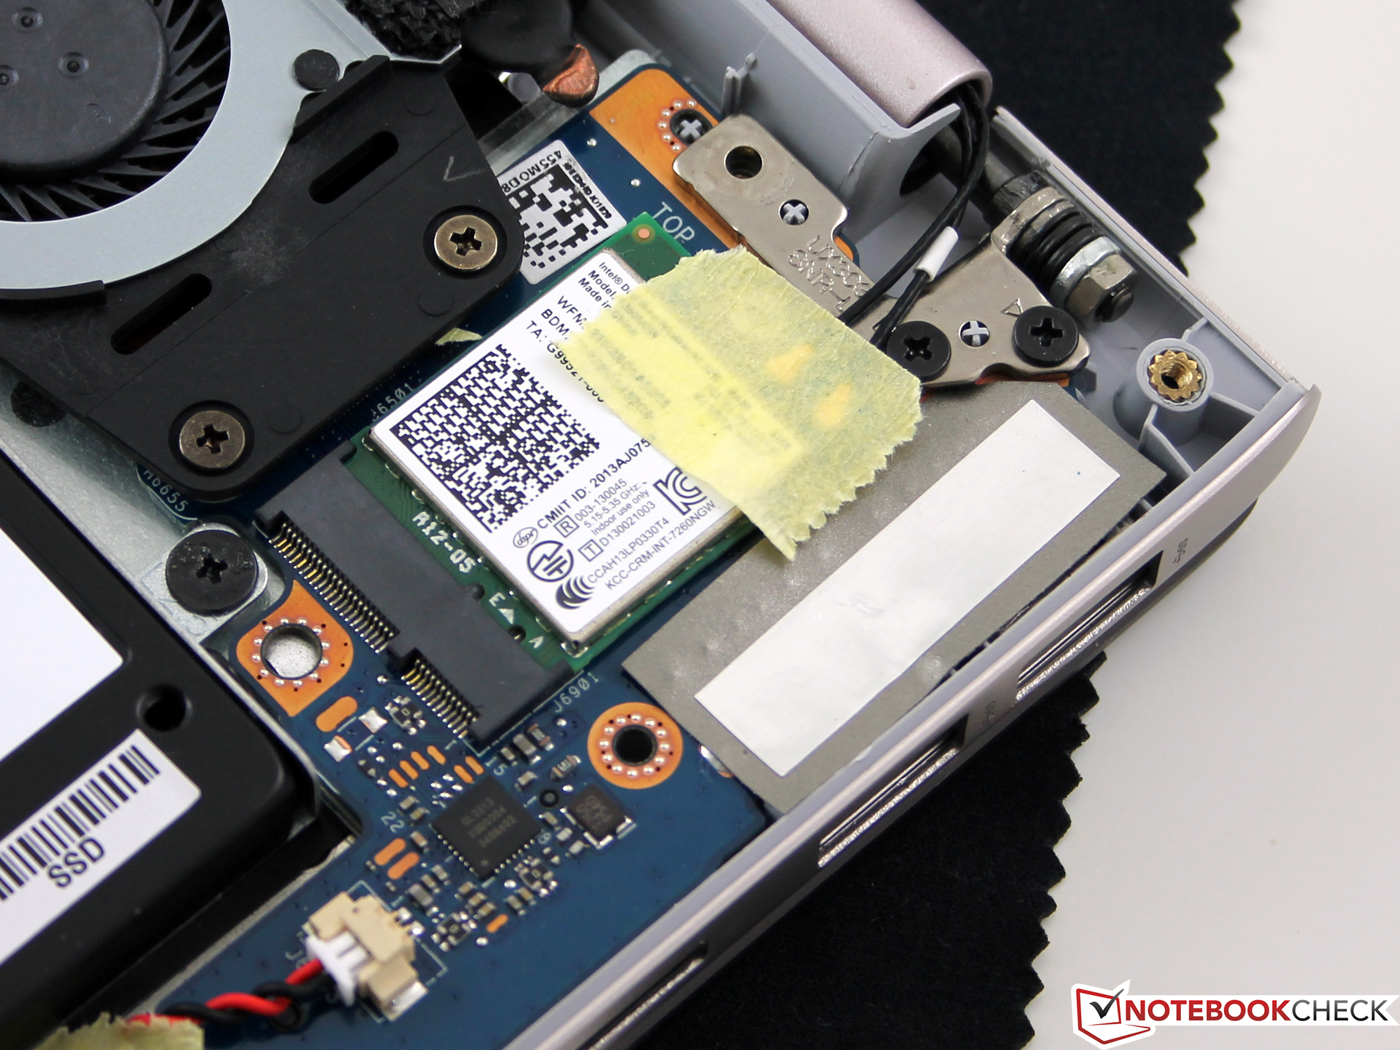
UX303LN在电池续航方面可以达到接近10小时,主要得力于它超低的待机功耗,这让它可以轻松战胜很多处于900到1200欧元(6889到9186人民币)间的产品。它在可维护性方面也做得很好,底部的维护窗口可以很方便地在卸下几颗螺丝后打开——没有滑杆或按键。它的一个小缺点是较差的摄像头质量,不过,低噪音的麦克风可以稍稍弥补这个不足。
对于预算较少的用户也有一个好消息,它的基本配置型号(传统硬盘,i5处理器,HD+分辨率屏幕)也有同样的高质量机身和不错的输入设备。不过,这个型号的1600x900屏幕分辨率并没有达到同样的标准。
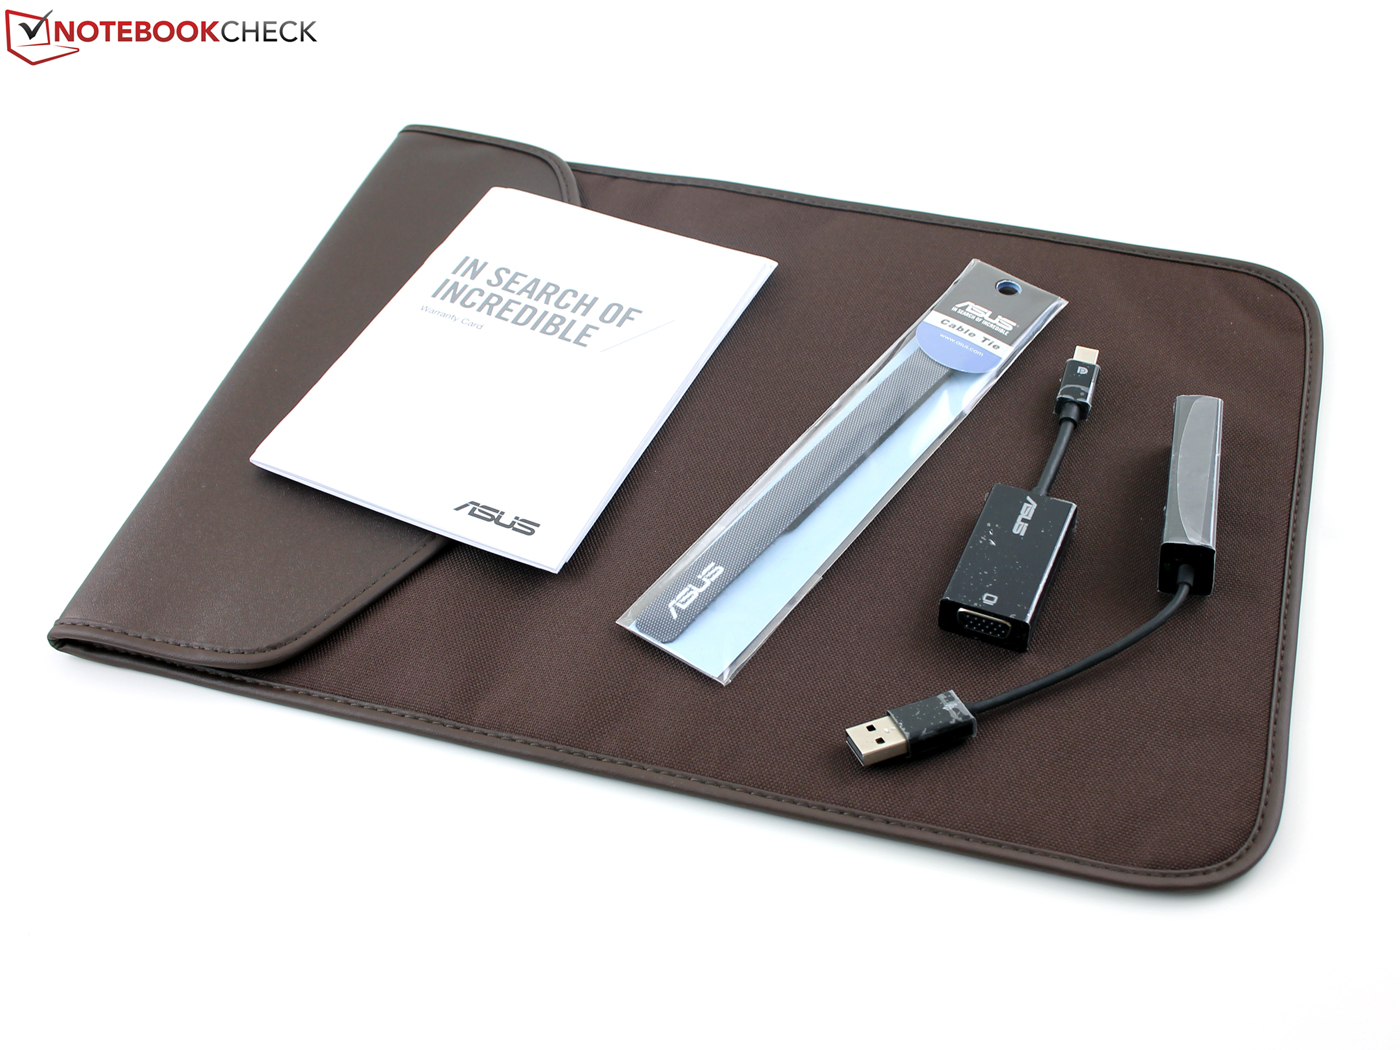
注:本文是基于完整评测的缩减版本,阅读完整的英文评测,请点击这里。