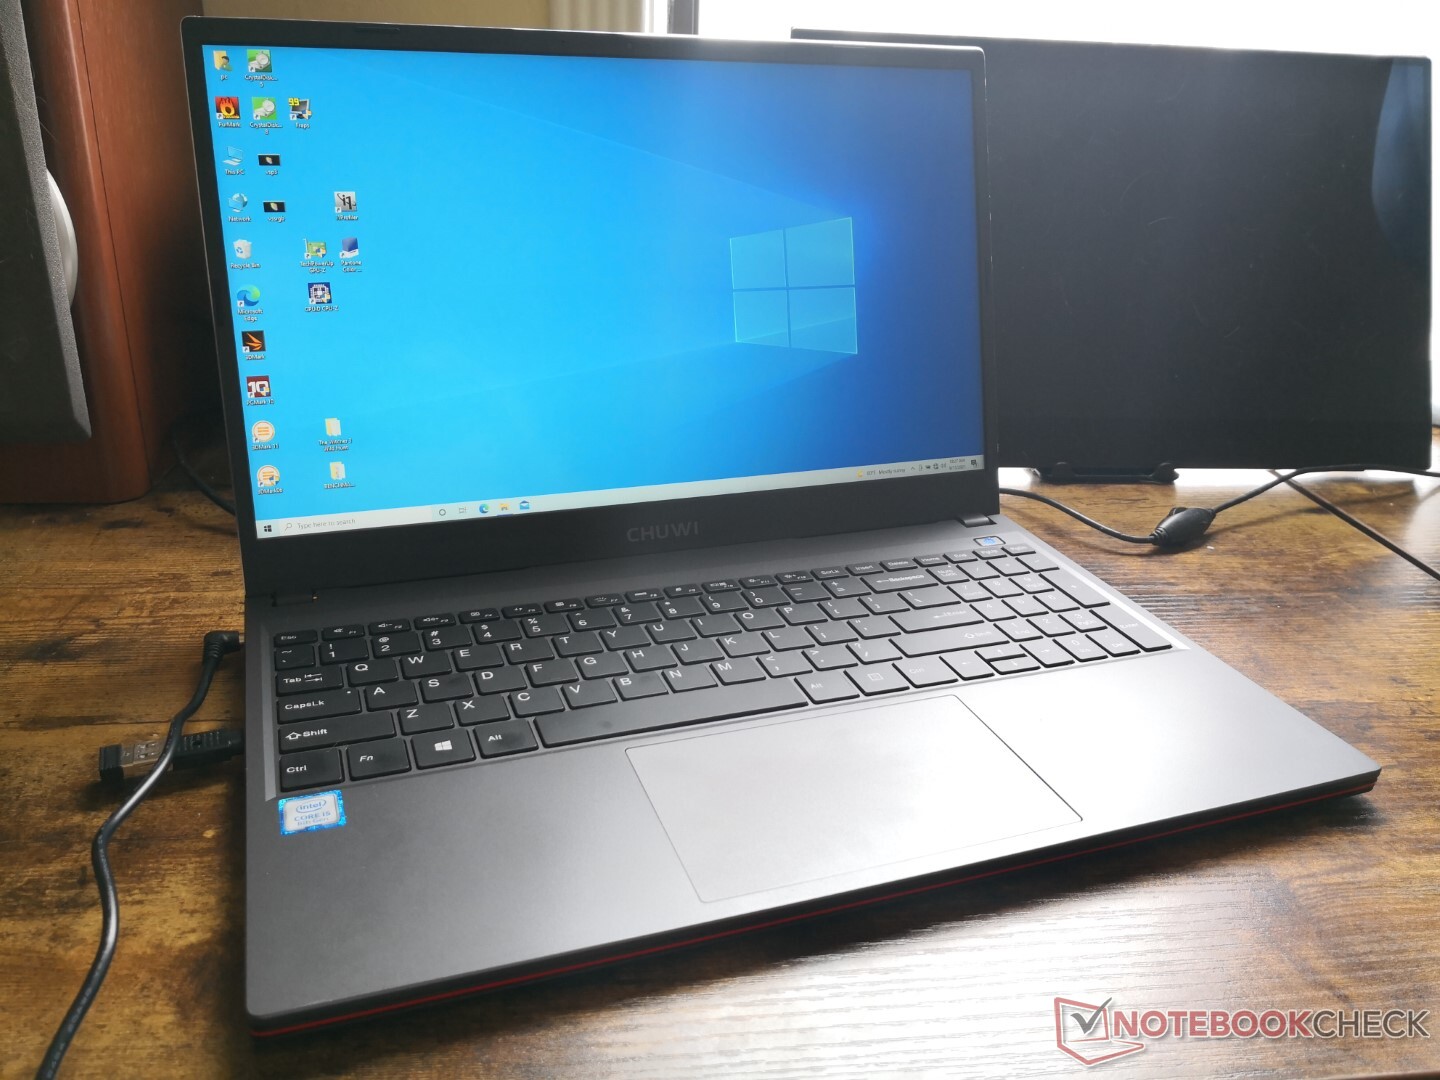
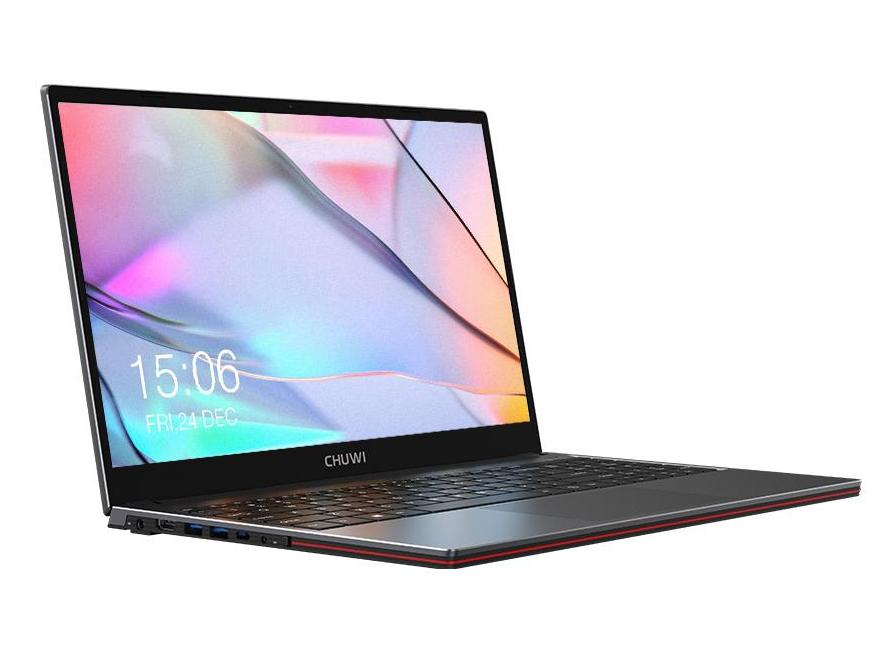
Chuwi CoreBook X Pro笔记本电脑评论。廉价的120赫兹显示器

在几个月前刚刚回顾了14英寸的CoreBook X之后,Chuwi现在准备推出CoreBook X Pro,它使用相同的英特尔第八代酷睿i5-8259U处理器,但采用更大的15.6英寸外形尺寸。与14英寸机型相比,这个较大的版本在功能、显示屏和视觉设计方面是一个完全不同的野兽。
CoreBook X Pro的竞争对手包括其他预算的15.6英寸多媒体笔记本电脑,如 惠普Pavilion 15, 联想IdeaPad 3系列, 戴尔Inspiron系列, 或 Acer Aspire 3系列.Chuwi是,现在销售该模型通过其官方在线商店以559美元的价格出售。
更多关于Chuwi的评论。
potential competitors in comparison
Rating | Date | Model | Weight | Height | Size | Resolution | Price |
|---|---|---|---|---|---|---|---|
| 74.8 % v7 (old) | 09 / 2021 | Chuwi CoreBook X Pro i5-8259U, Iris Plus Graphics 655 | 1.8 kg | 17.9 mm | 15.60" | 1920x1080 | |
| 77 % v7 (old) | 09 / 2021 | Teclast TBOLT F15 Pro i3-1005G1, UHD Graphics G1 (Ice Lake 32 EU) | 1.9 kg | 20.5 mm | 15.60" | 1920x1080 | |
| 82.1 % v7 (old) | Asus VivoBook S15 D533UA R7 5700U, Vega 8 | 1.8 kg | 16.1 mm | 15.60" | 1920x1080 | ||
| 83.3 % v7 (old) | Tuxedo Aura 15 Gen1 R7 4700U, Vega 7 | 1.7 kg | 19.9 mm | 15.60" | 1920x1080 | ||
| 82.8 % v7 (old) | 07 / 2020 | Honor MagicBook 15 R5 3500U, Vega 8 | 1.5 kg | 16.9 mm | 15.60" | 1920x1080 | |
| 86.8 % v7 (old) | 07 / 2020 | Dell XPS 15 9500 Core i5 i5-10300H, UHD Graphics 630 | 1.8 kg | 18 mm | 15.60" | 1920x1200 |
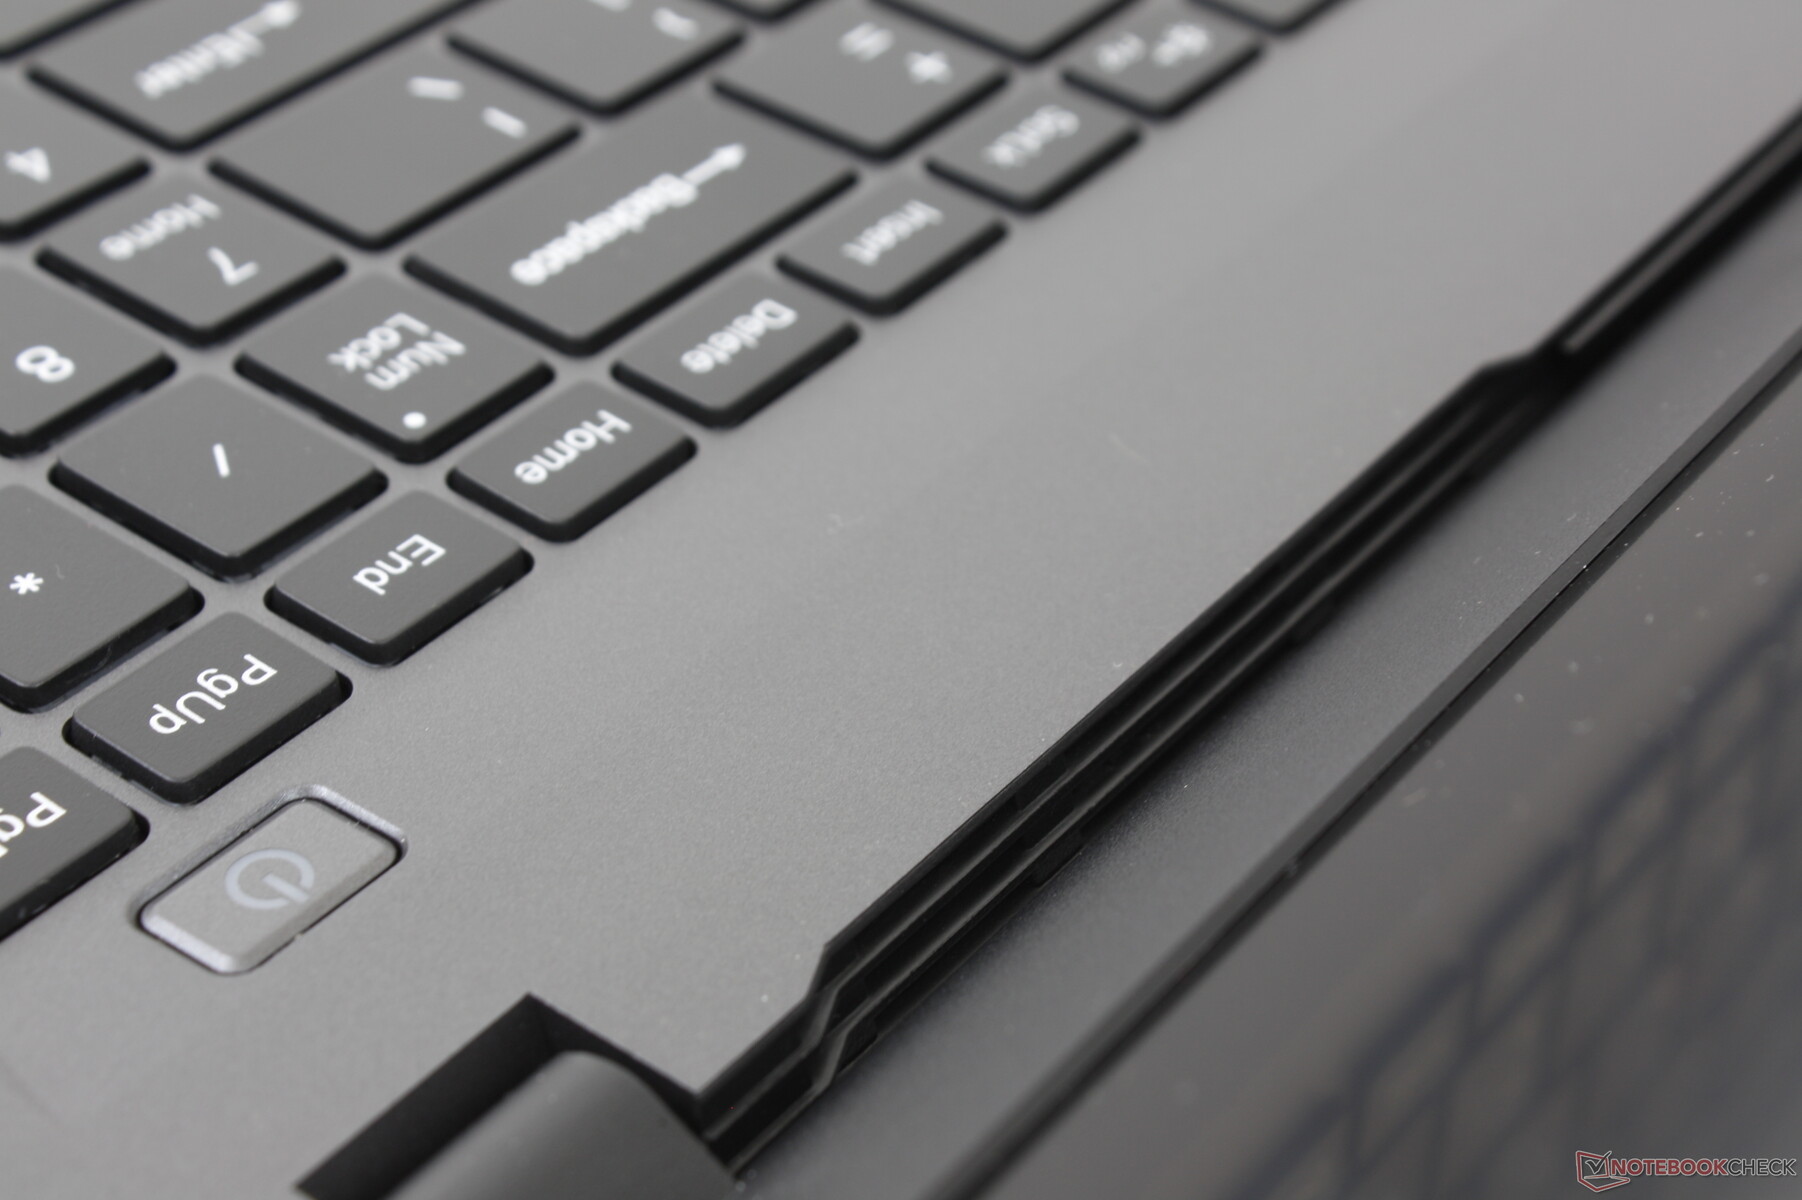
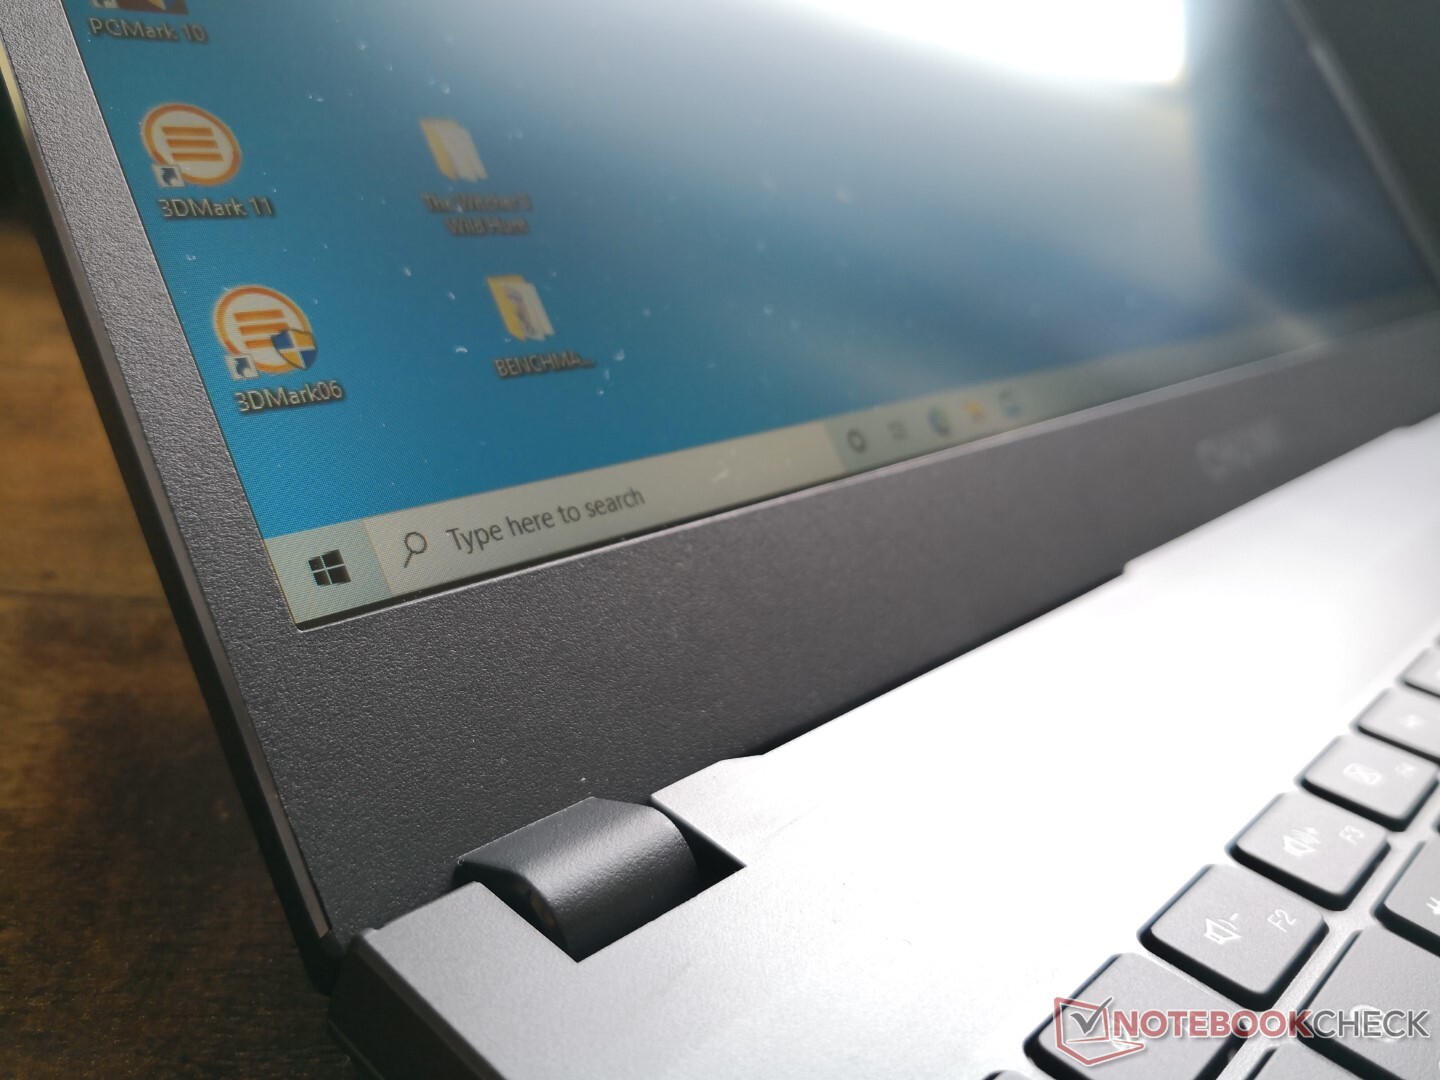
案例 - 看起来不错,感觉很糟
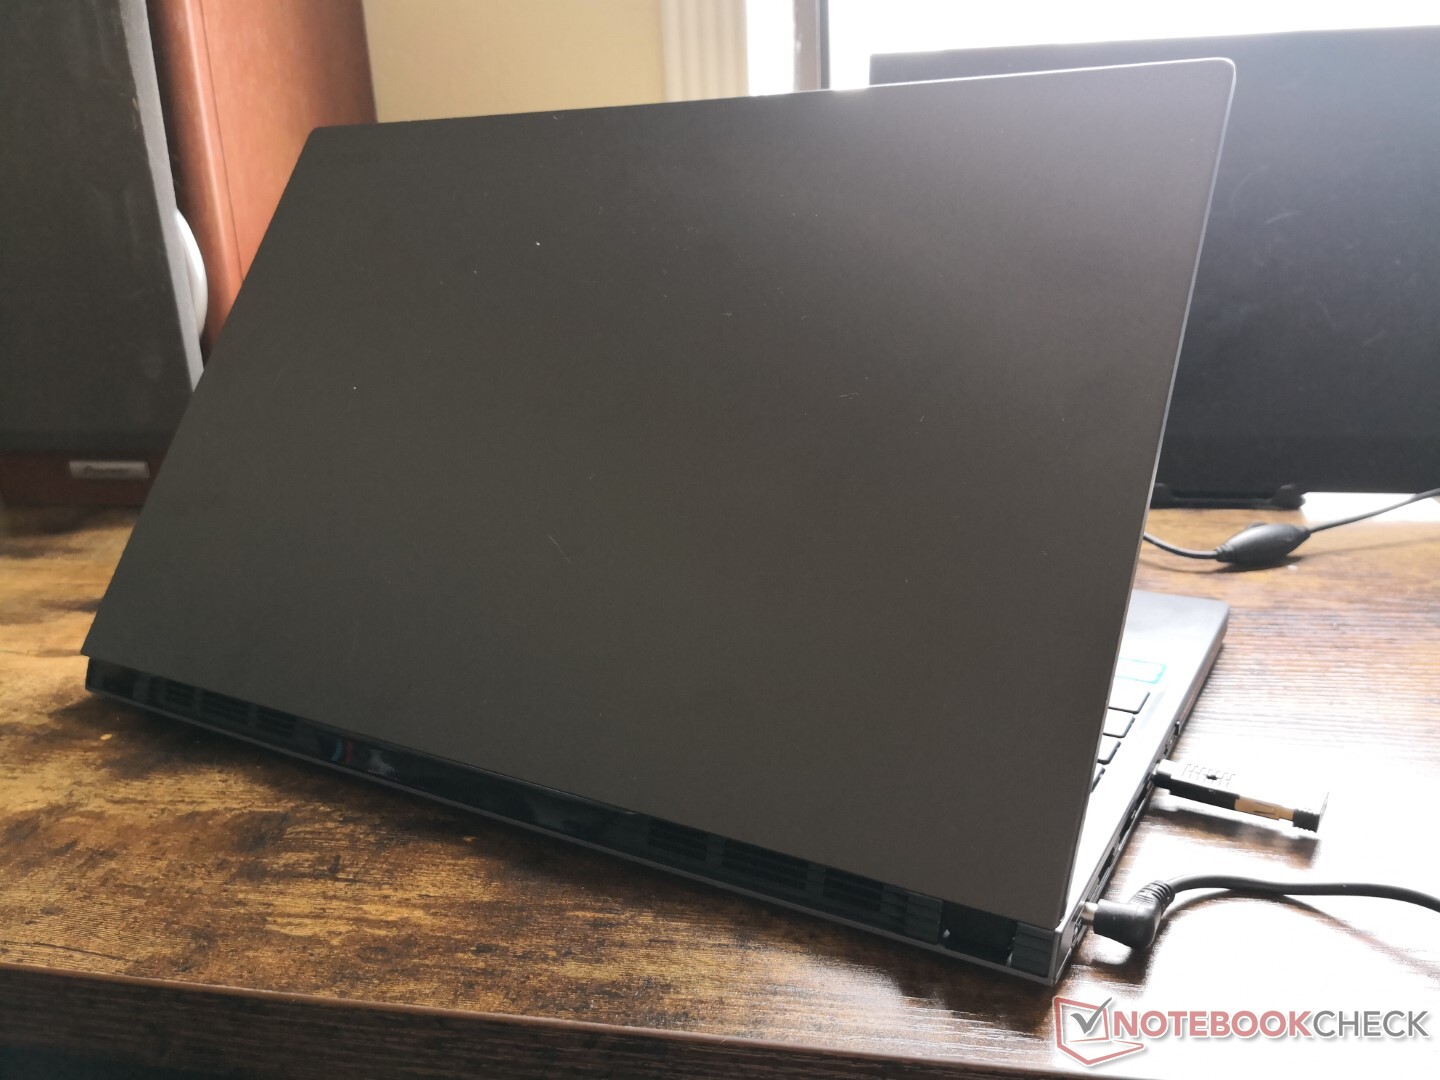
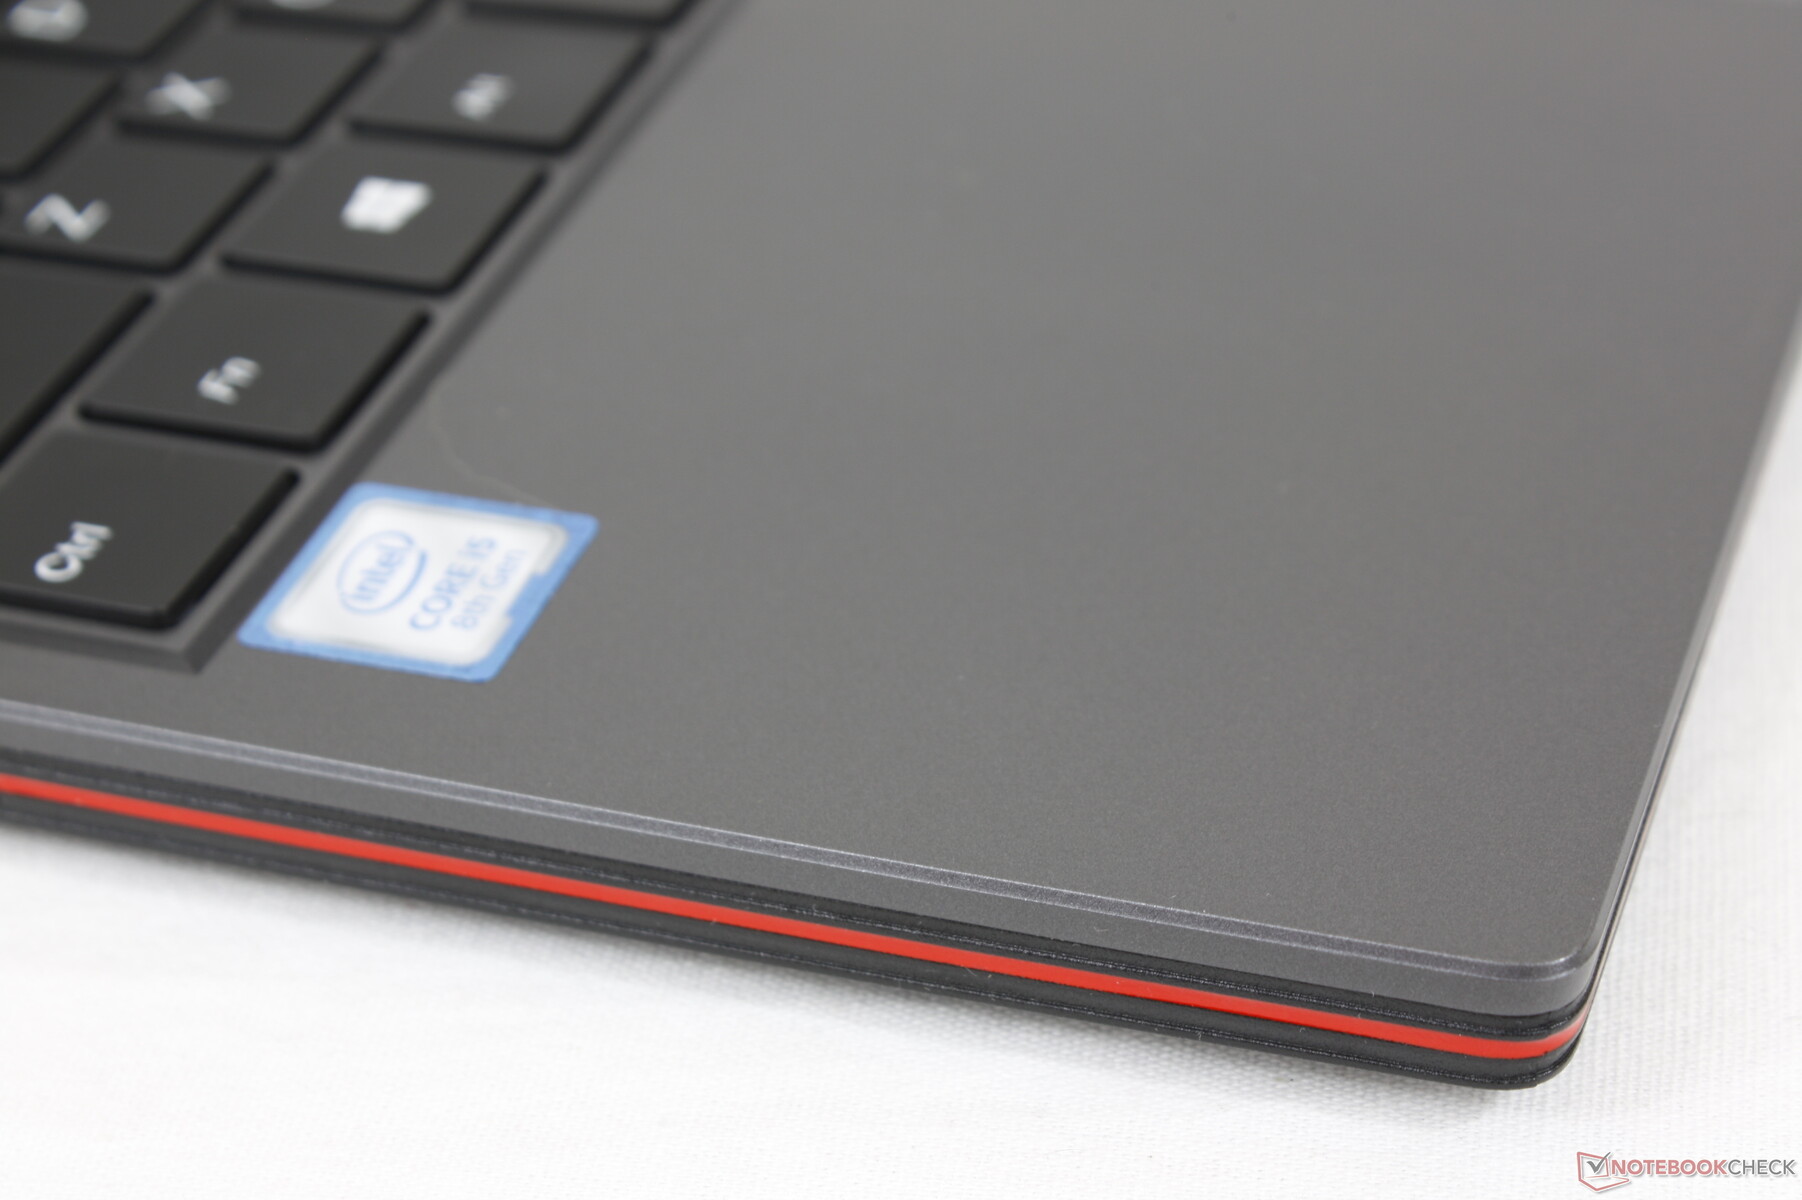
Chuwi笔记本电脑一直看起来很有吸引力,特别是在价格方面,CoreBook X Pro延续了这种趋势。制造商甚至推出了新的机箱设计,与Apple ,与旧的Chuwi型号的外观相比,在视觉上更加独特。不幸的是,机箱的刚性并没有真正改善,因为系统的吱吱作响和弯曲比我们希望的更多,当扭曲它的角落。它当然不会像它看起来那么坚固。
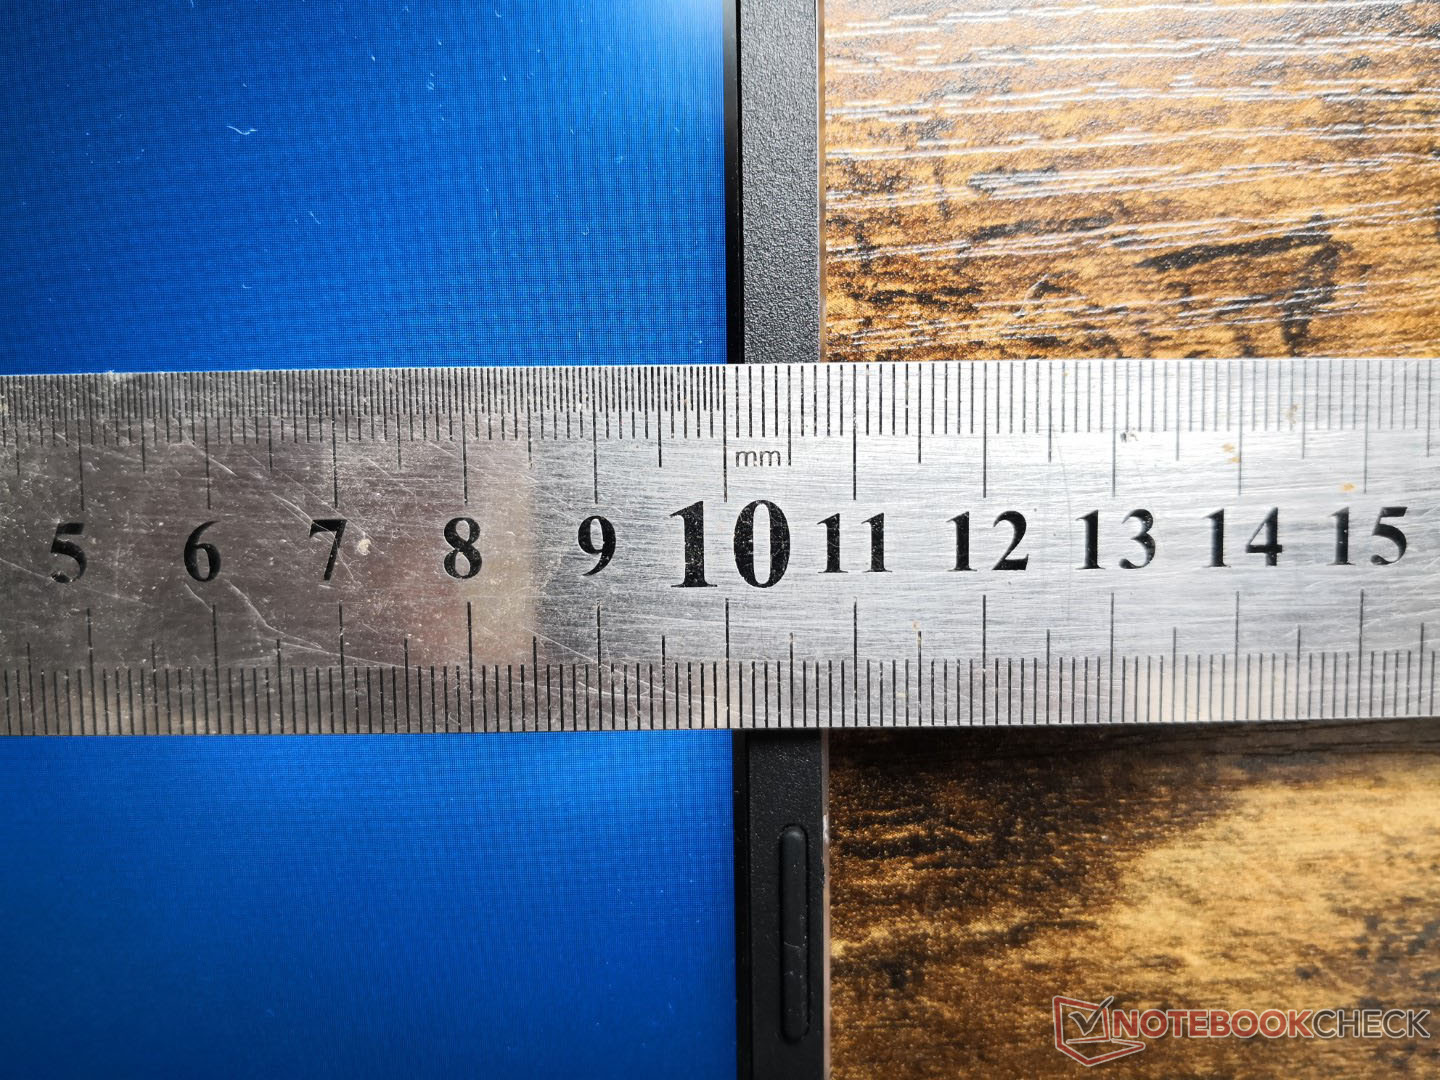
由于CoreBook X Pro厚厚的底边框,整体尺寸比大多数其他15.6英寸笔记本电脑略大且重。该系统的重量大约与 XPS 15 9500尽管Chuwi的体积更大。
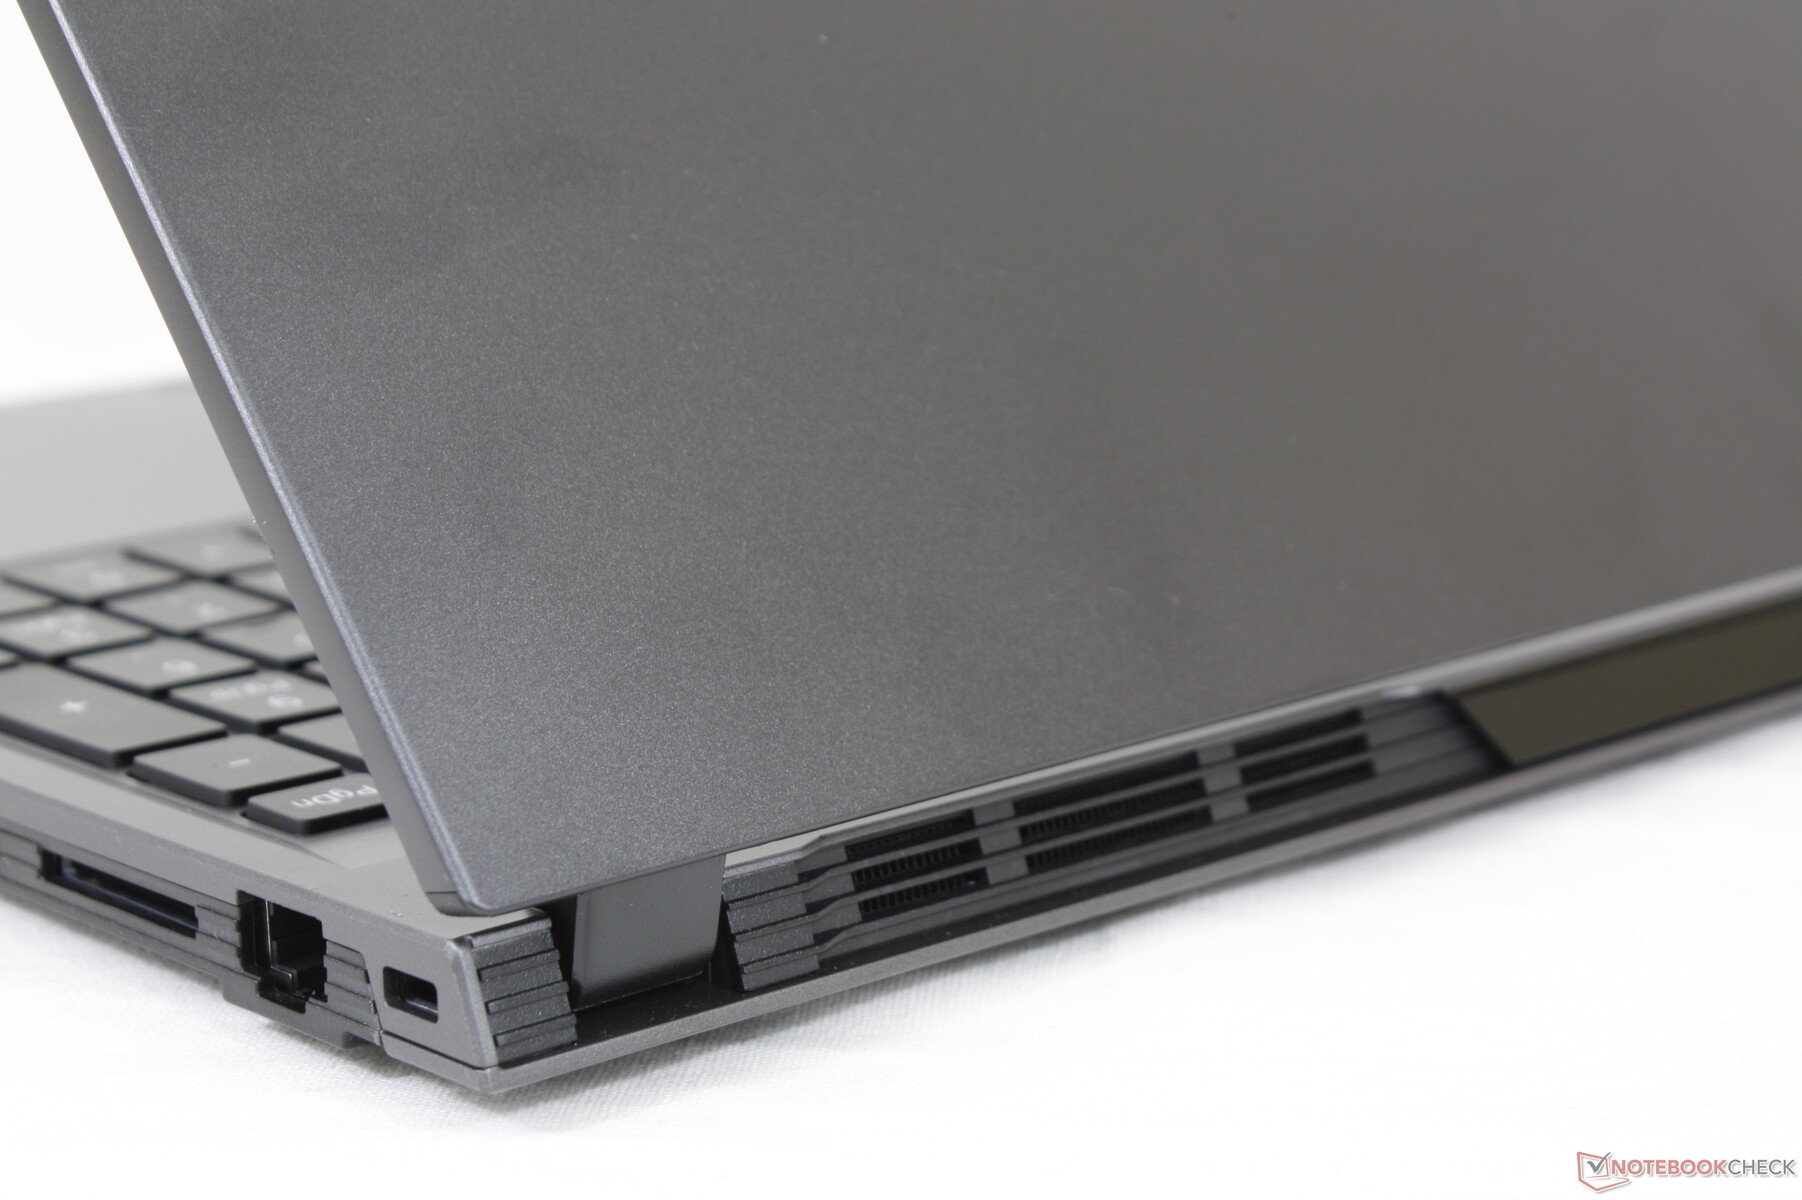
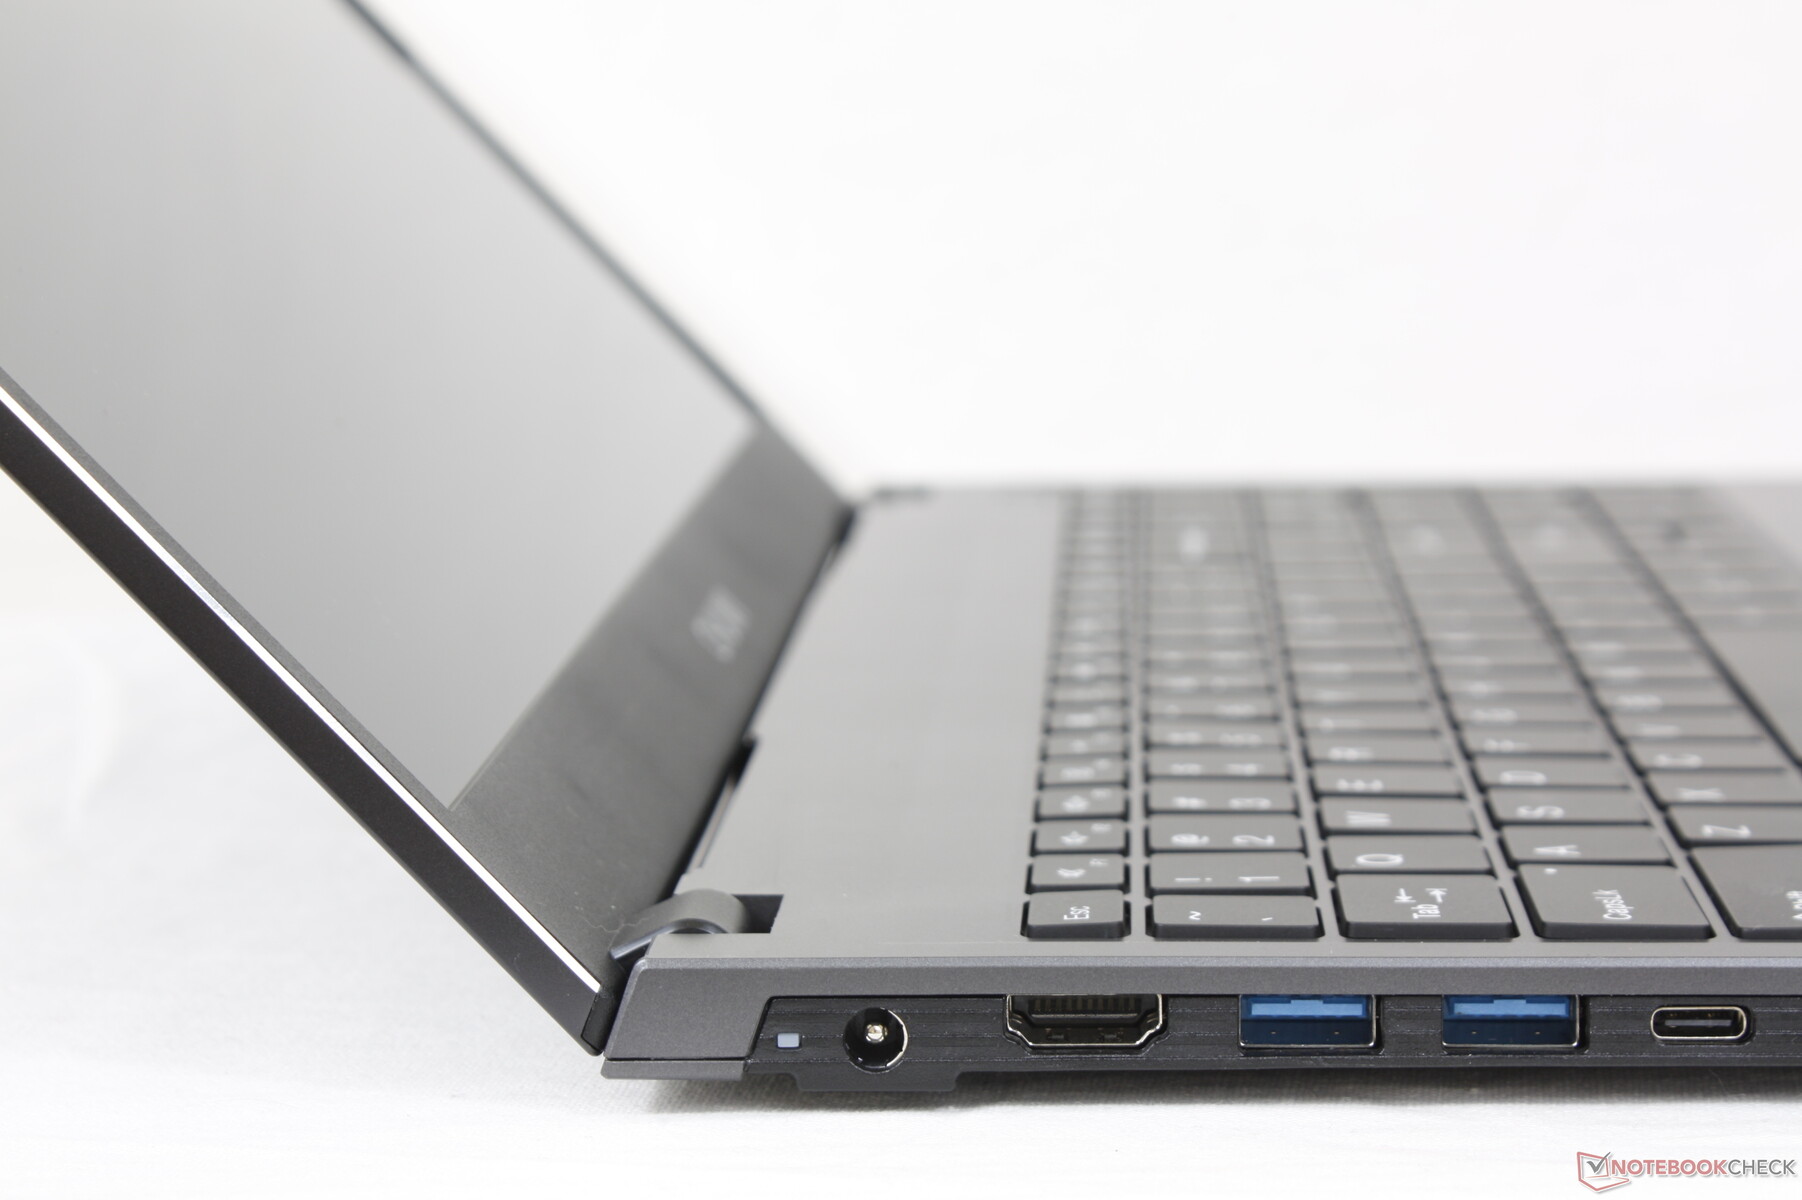
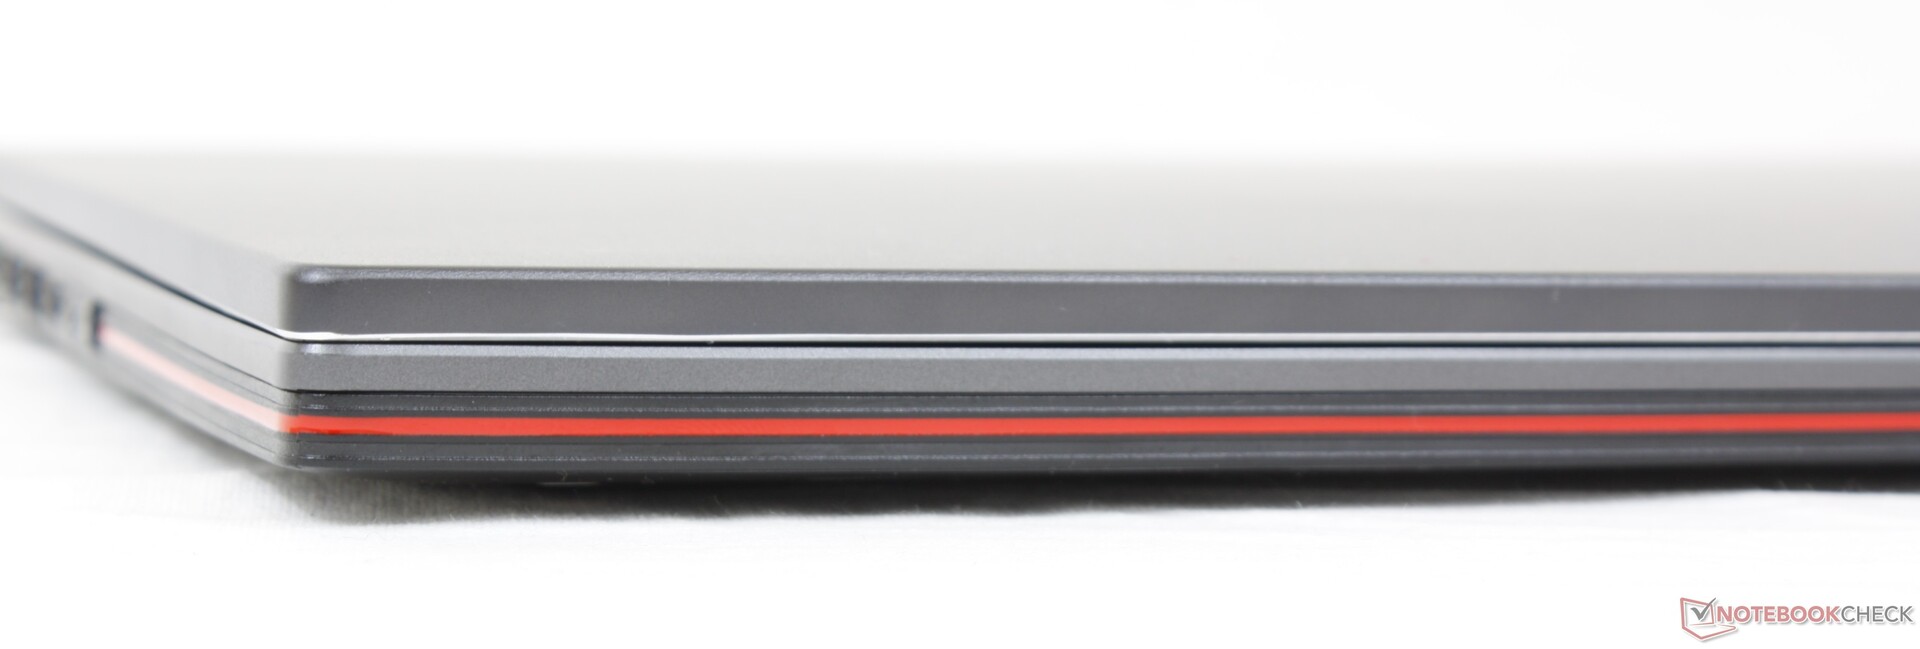
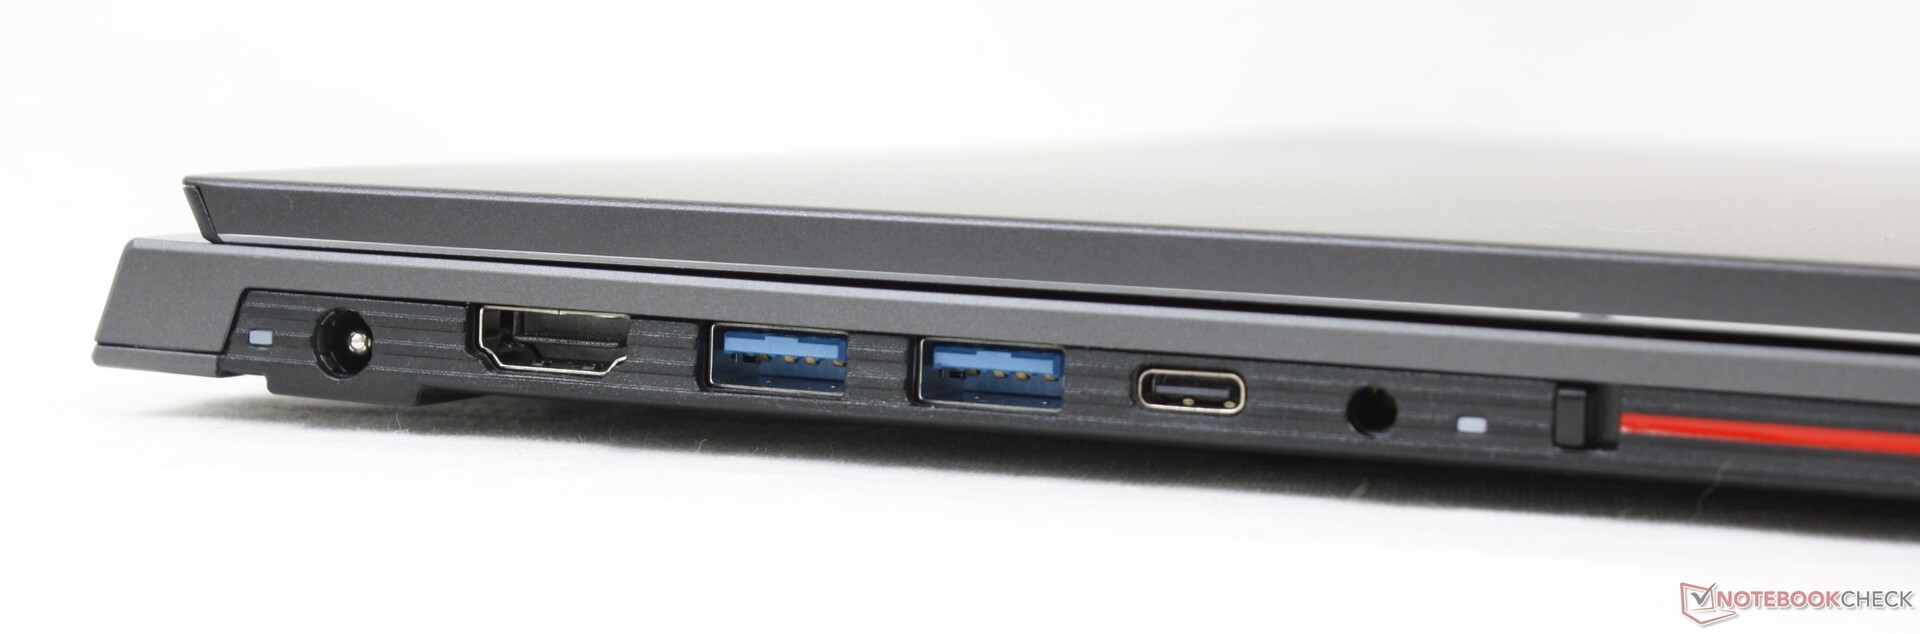
连接性 - 没有电源传输或显示端口
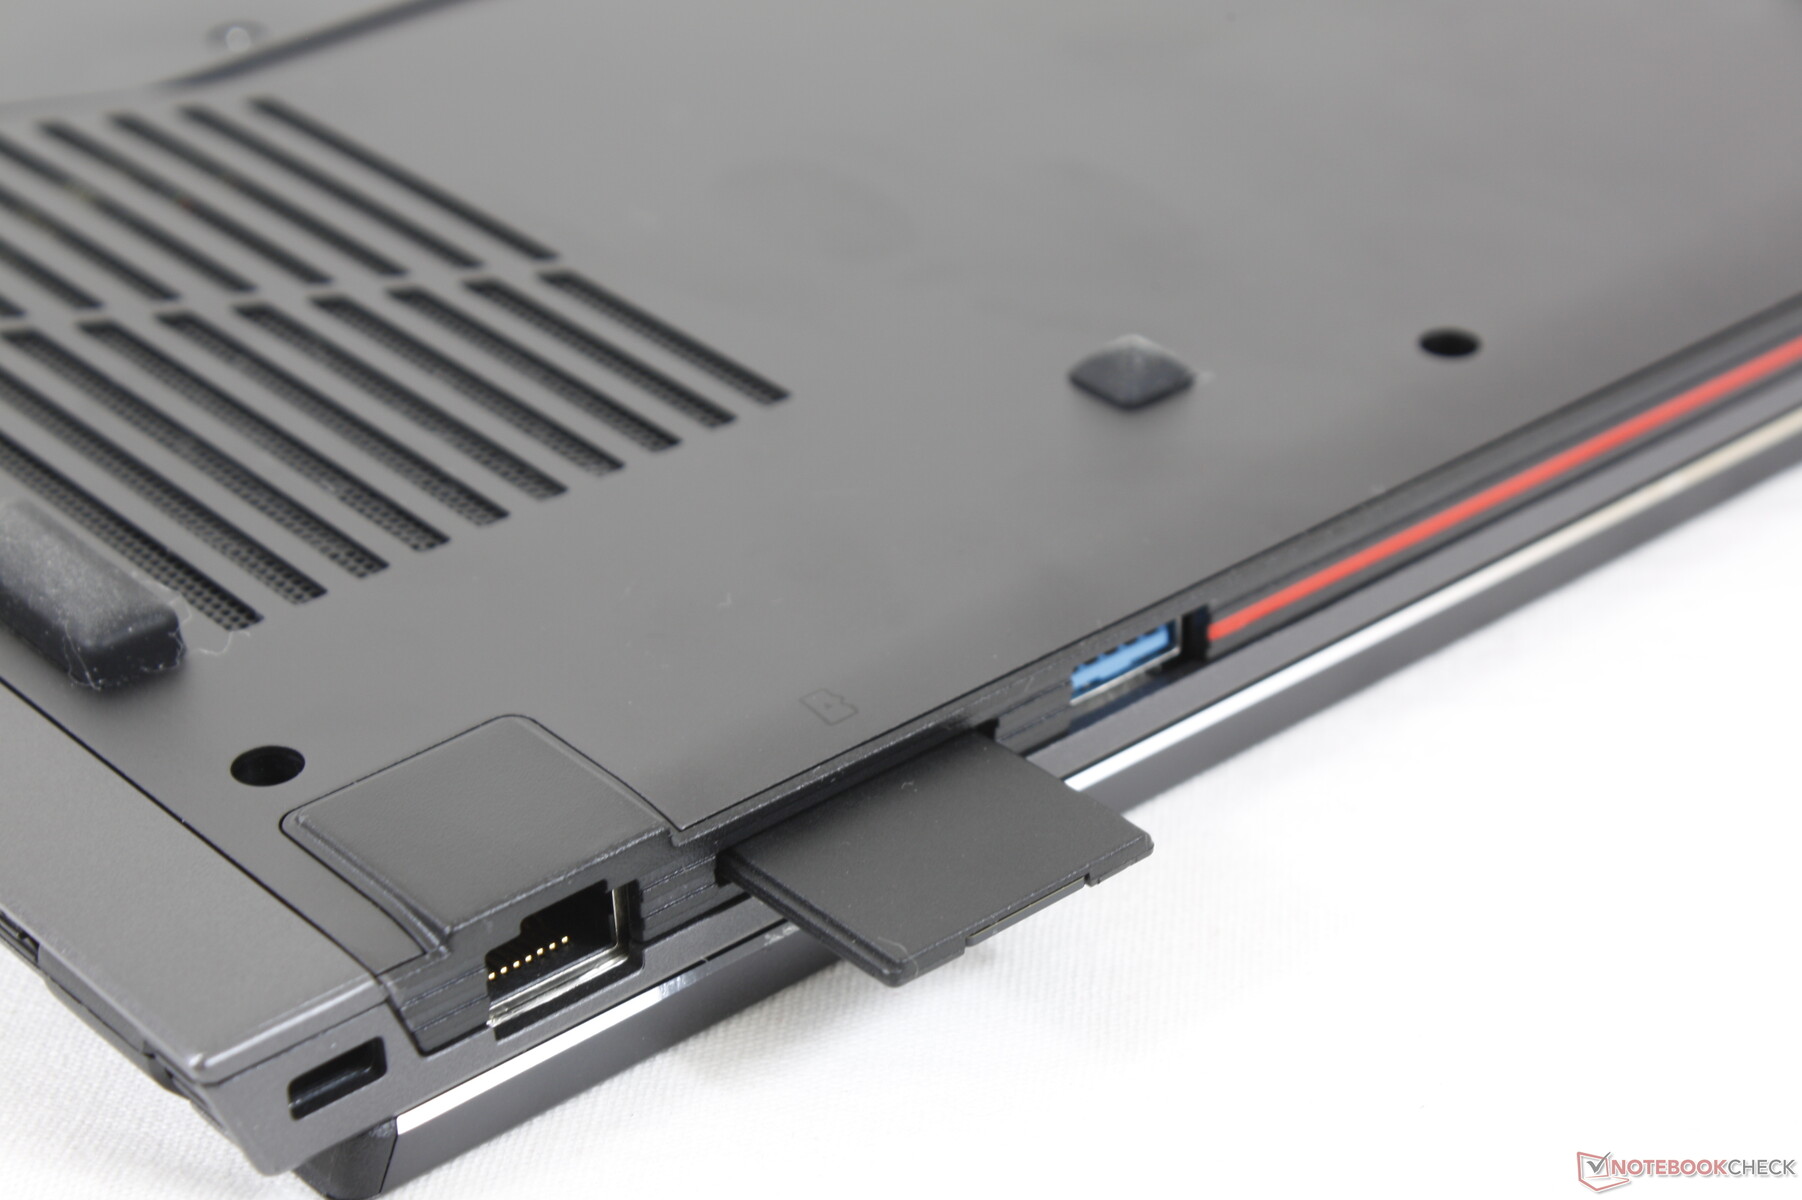
对于一台15.6英寸的多媒体笔记本电脑来说,端口选项还算不错,有大量的USB端口,甚至还有千兆以太网。不幸的是,USB-C端口不支持DisplayPort或Power Delivery,这意味着用户必须使用HDMI为任何外部显示器和专有的桶形充电器充电。
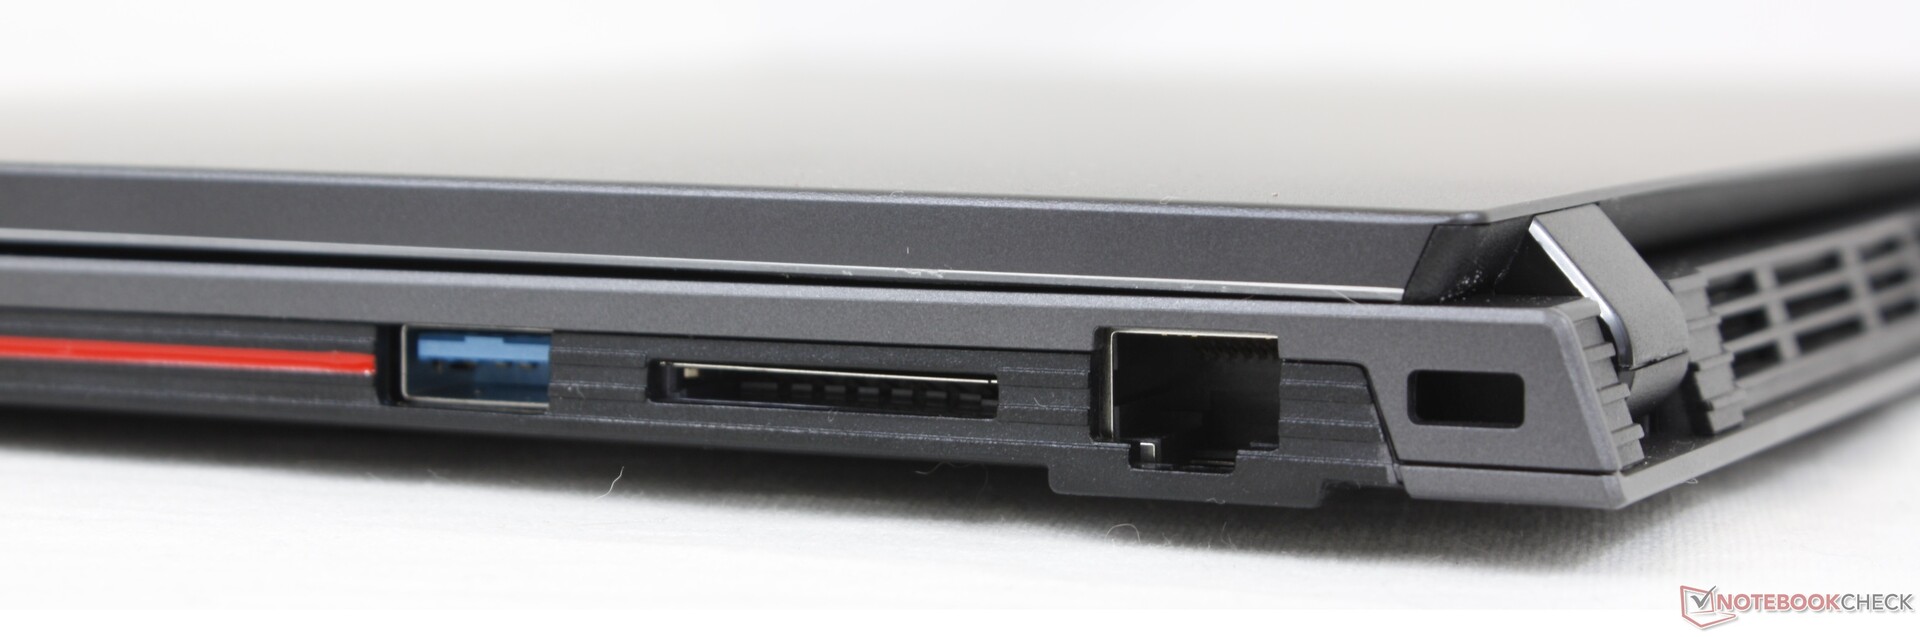
SD卡阅读器
从我们的UHS-II SD卡向桌面传输1GB照片的速度很慢,约为55秒,而在戴尔XPS 15上仅为6或7秒。
| SD Card Reader | |
| average JPG Copy Test (av. of 3 runs) | |
| Dell XPS 15 9500 Core i5 (Toshiba Exceria Pro SDXC 64 GB UHS-II) | |
| Tuxedo Aura 15 Gen1 (AV Pro V60) | |
| Asus VivoBook S15 D533UA (AV PRO microSD 128 GB V60) | |
| Teclast TBOLT F15 Pro (AV Pro v60) | |
| Chuwi CoreBook X Pro (AV Pro V60) | |
| maximum AS SSD Seq Read Test (1GB) | |
| Dell XPS 15 9500 Core i5 (Toshiba Exceria Pro SDXC 64 GB UHS-II) | |
| Tuxedo Aura 15 Gen1 (AV Pro V60) | |
| Asus VivoBook S15 D533UA (AV PRO microSD 128 GB V60) | |
| Teclast TBOLT F15 Pro (AV Pro v60) | |
| Chuwi CoreBook X Pro (AV Pro V60) | |
沟通
对于集成的1x1英特尔3165模块,无线性能低于平均水平。虽然对于浏览和流媒体来说已经足够好了,但传输率可以更稳定,如下图所示,当与我们的Netgear RAX200测试路由器配对时。
| Networking | |
| iperf3 transmit AX12 | |
| Tuxedo Aura 15 Gen1 | |
| Asus VivoBook S15 D533UA | |
| Dell XPS 15 9500 Core i5 | |
| Honor MagicBook 15 | |
| Chuwi CoreBook X Pro | |
| Teclast TBOLT F15 Pro | |
| iperf3 receive AX12 | |
| Dell XPS 15 9500 Core i5 | |
| Asus VivoBook S15 D533UA | |
| Tuxedo Aura 15 Gen1 | |
| Honor MagicBook 15 | |
| Teclast TBOLT F15 Pro | |
| Chuwi CoreBook X Pro | |
网络摄像头
即使以笔记本电脑网络摄像头已经很低的标准来看,摄像头质量也很差。色温太暖,颜色很不协调,尽管我们的环境照明很亮,但整体画面很浑浊。


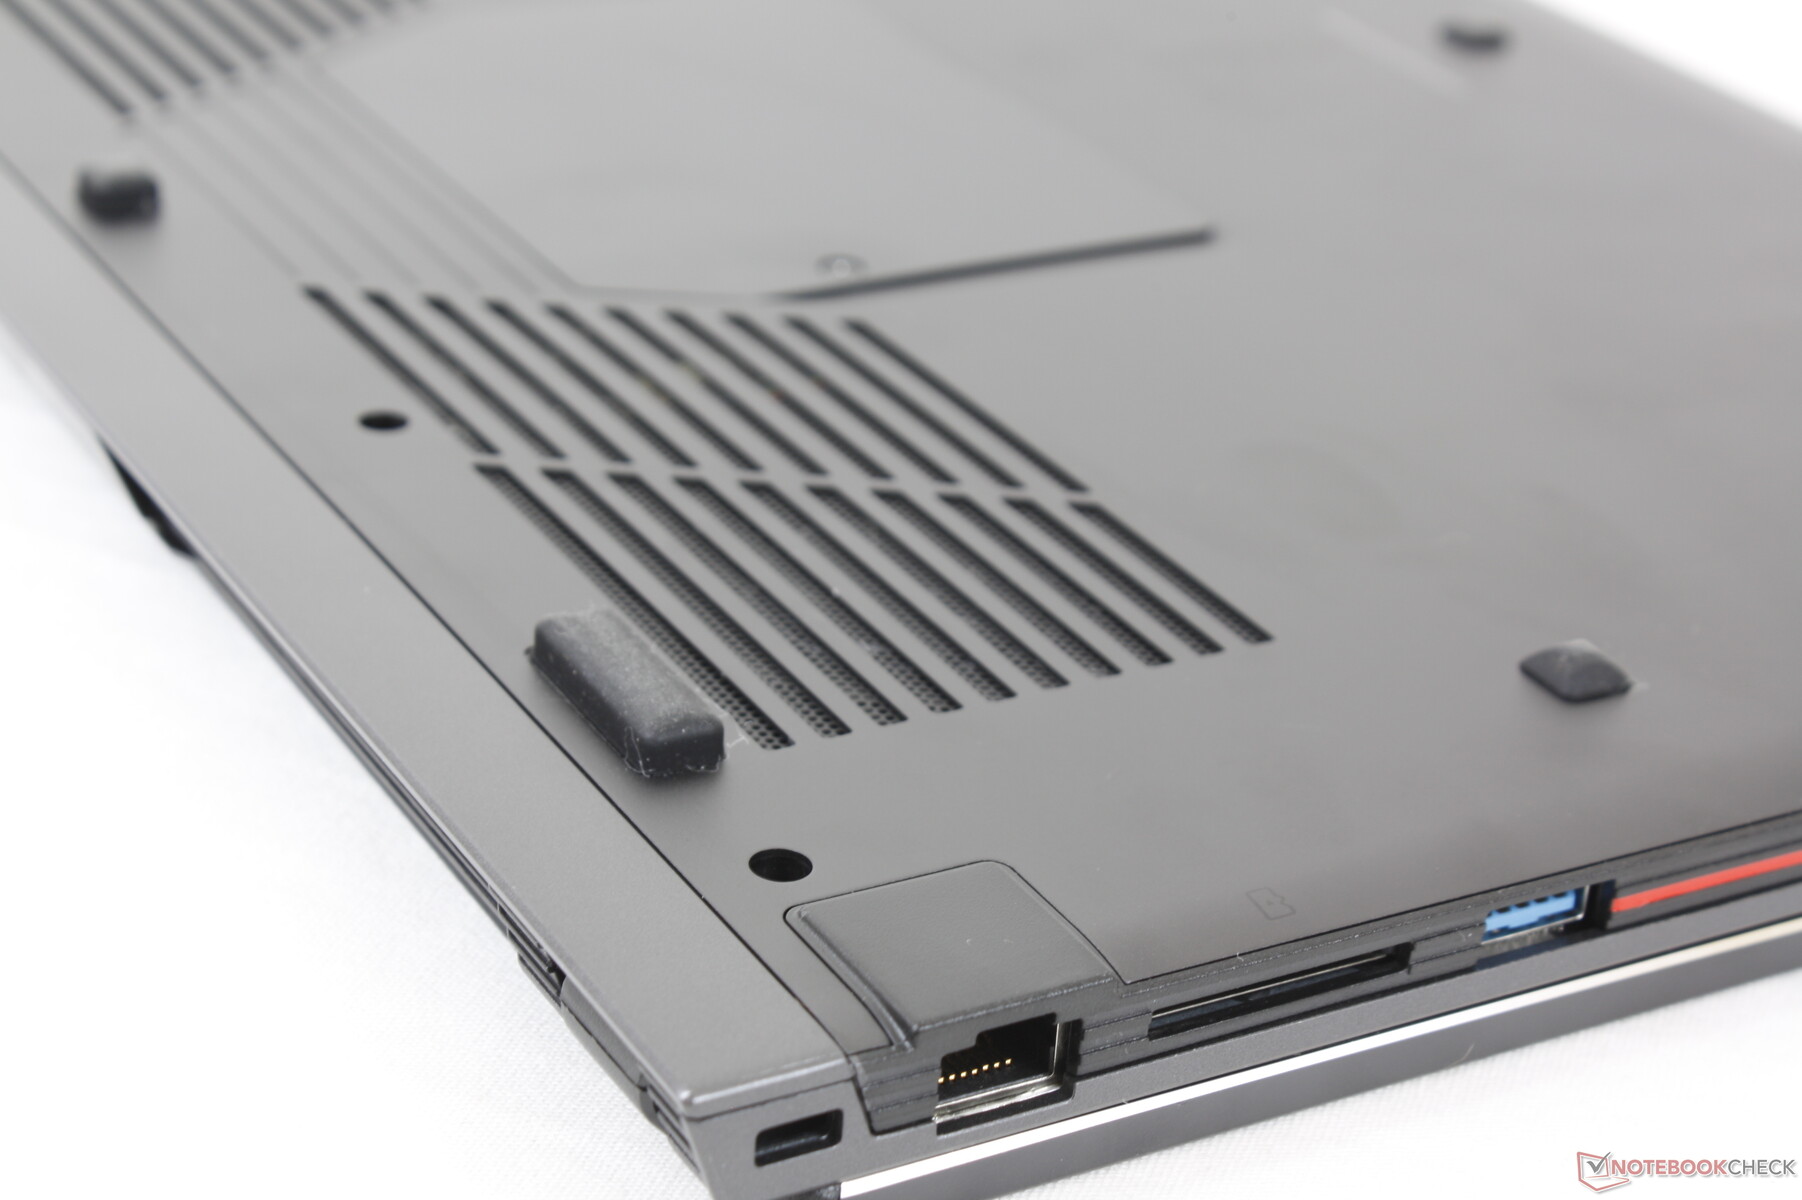
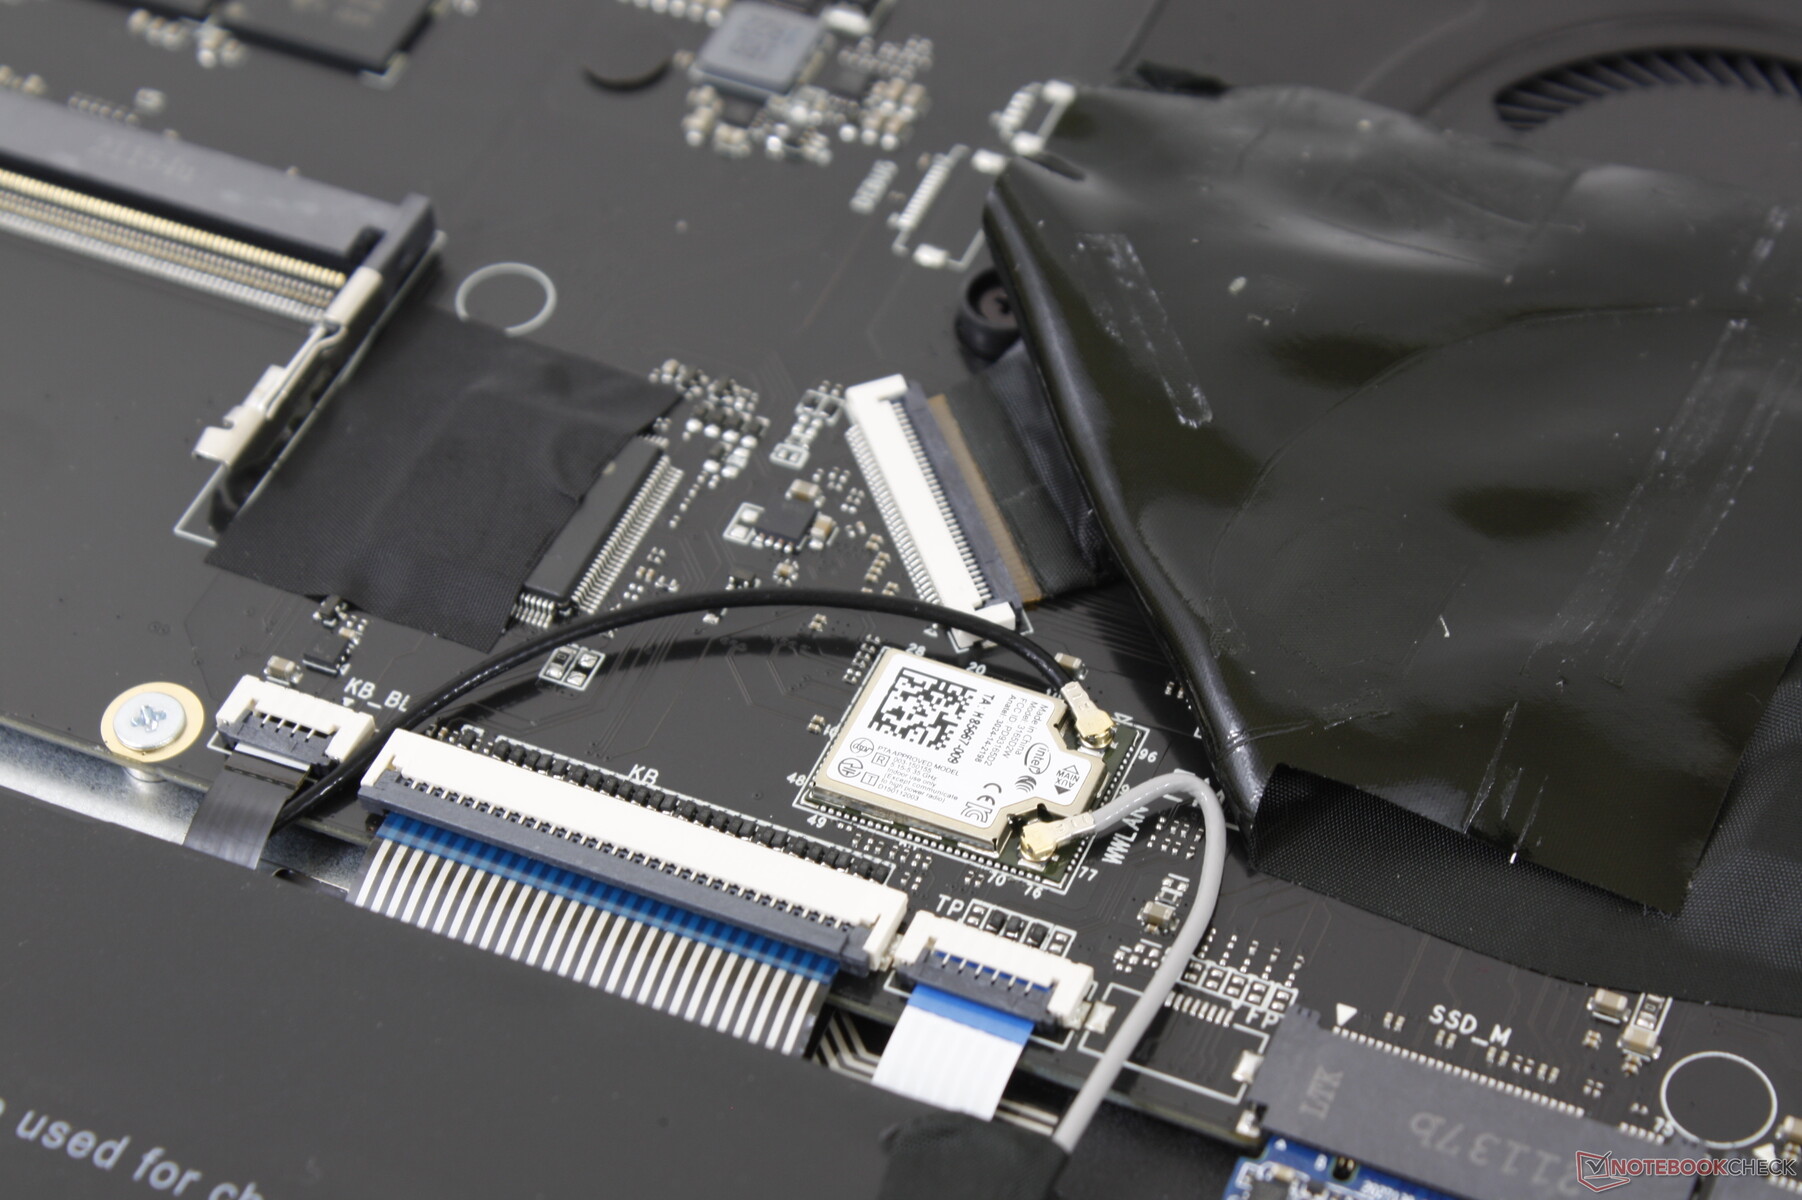
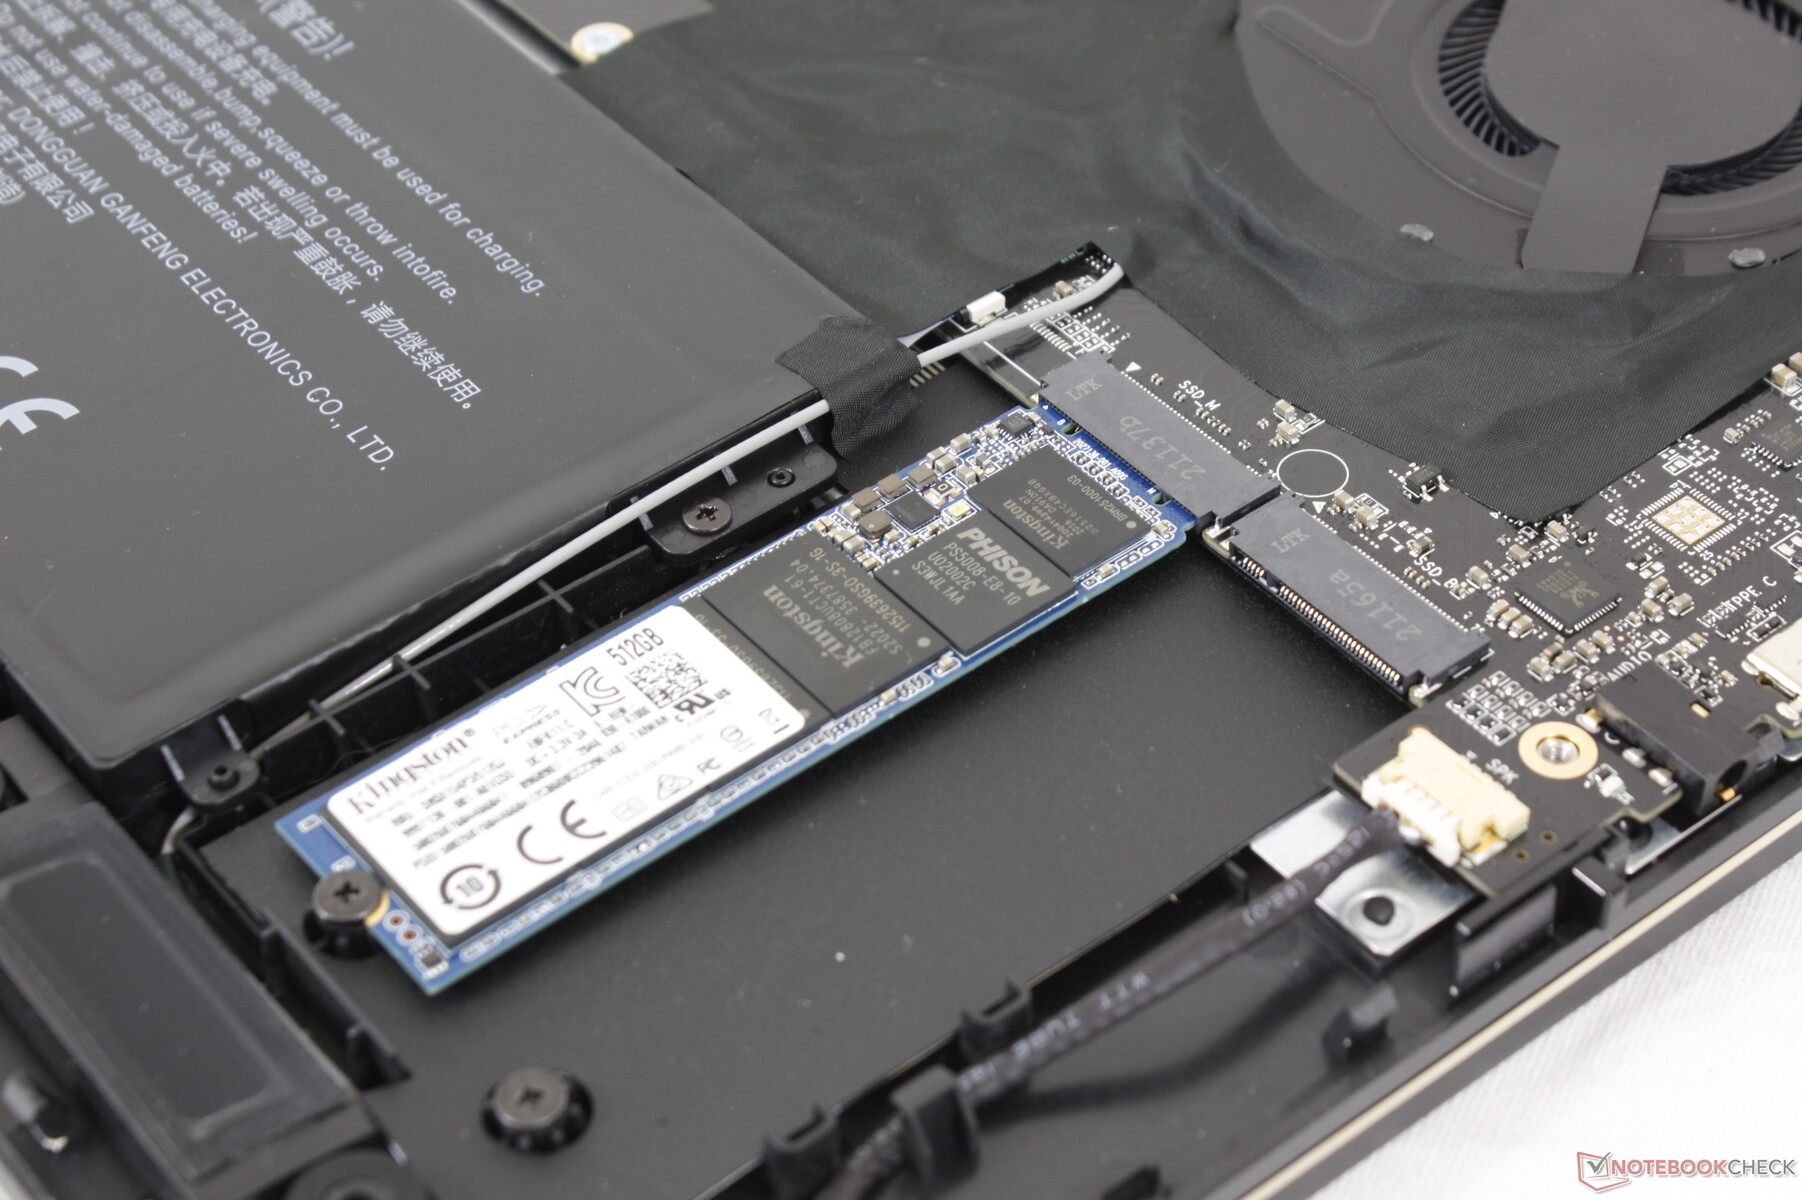
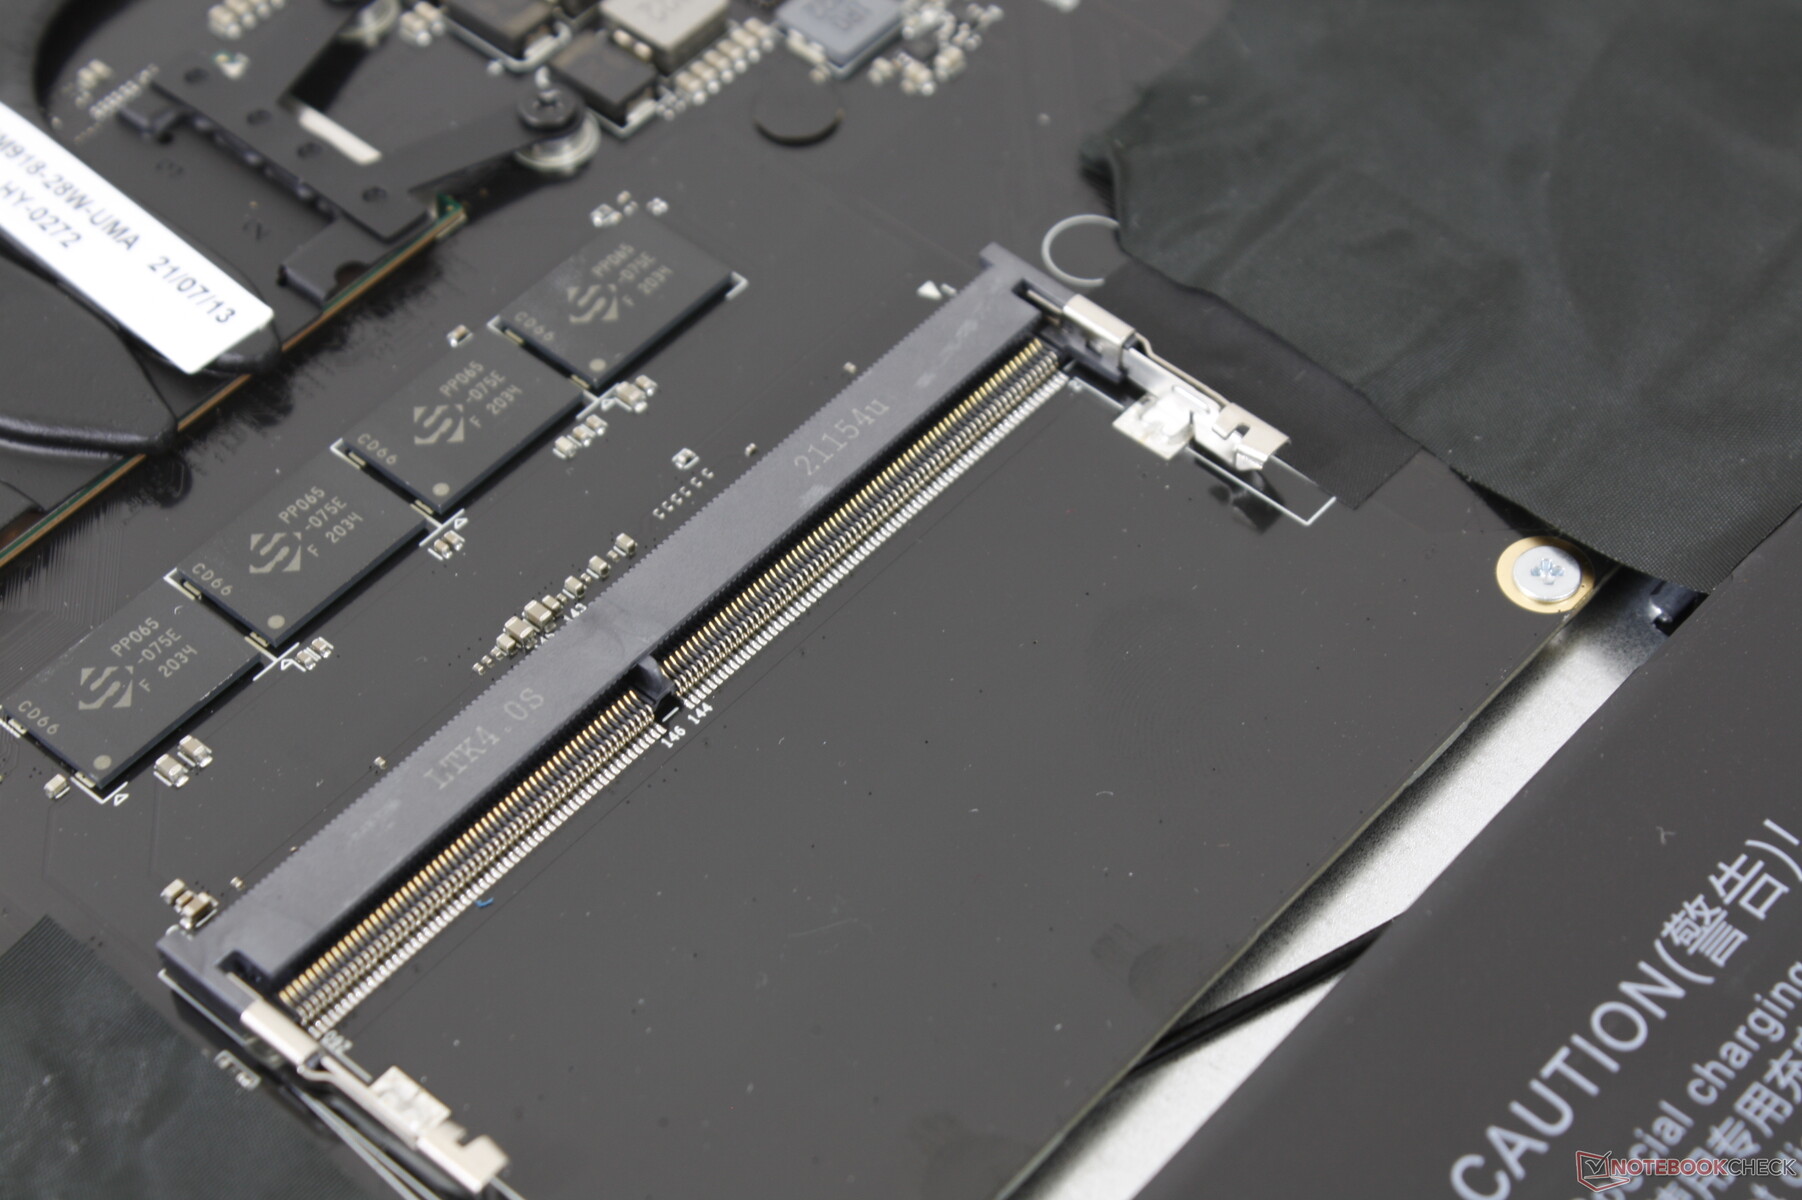
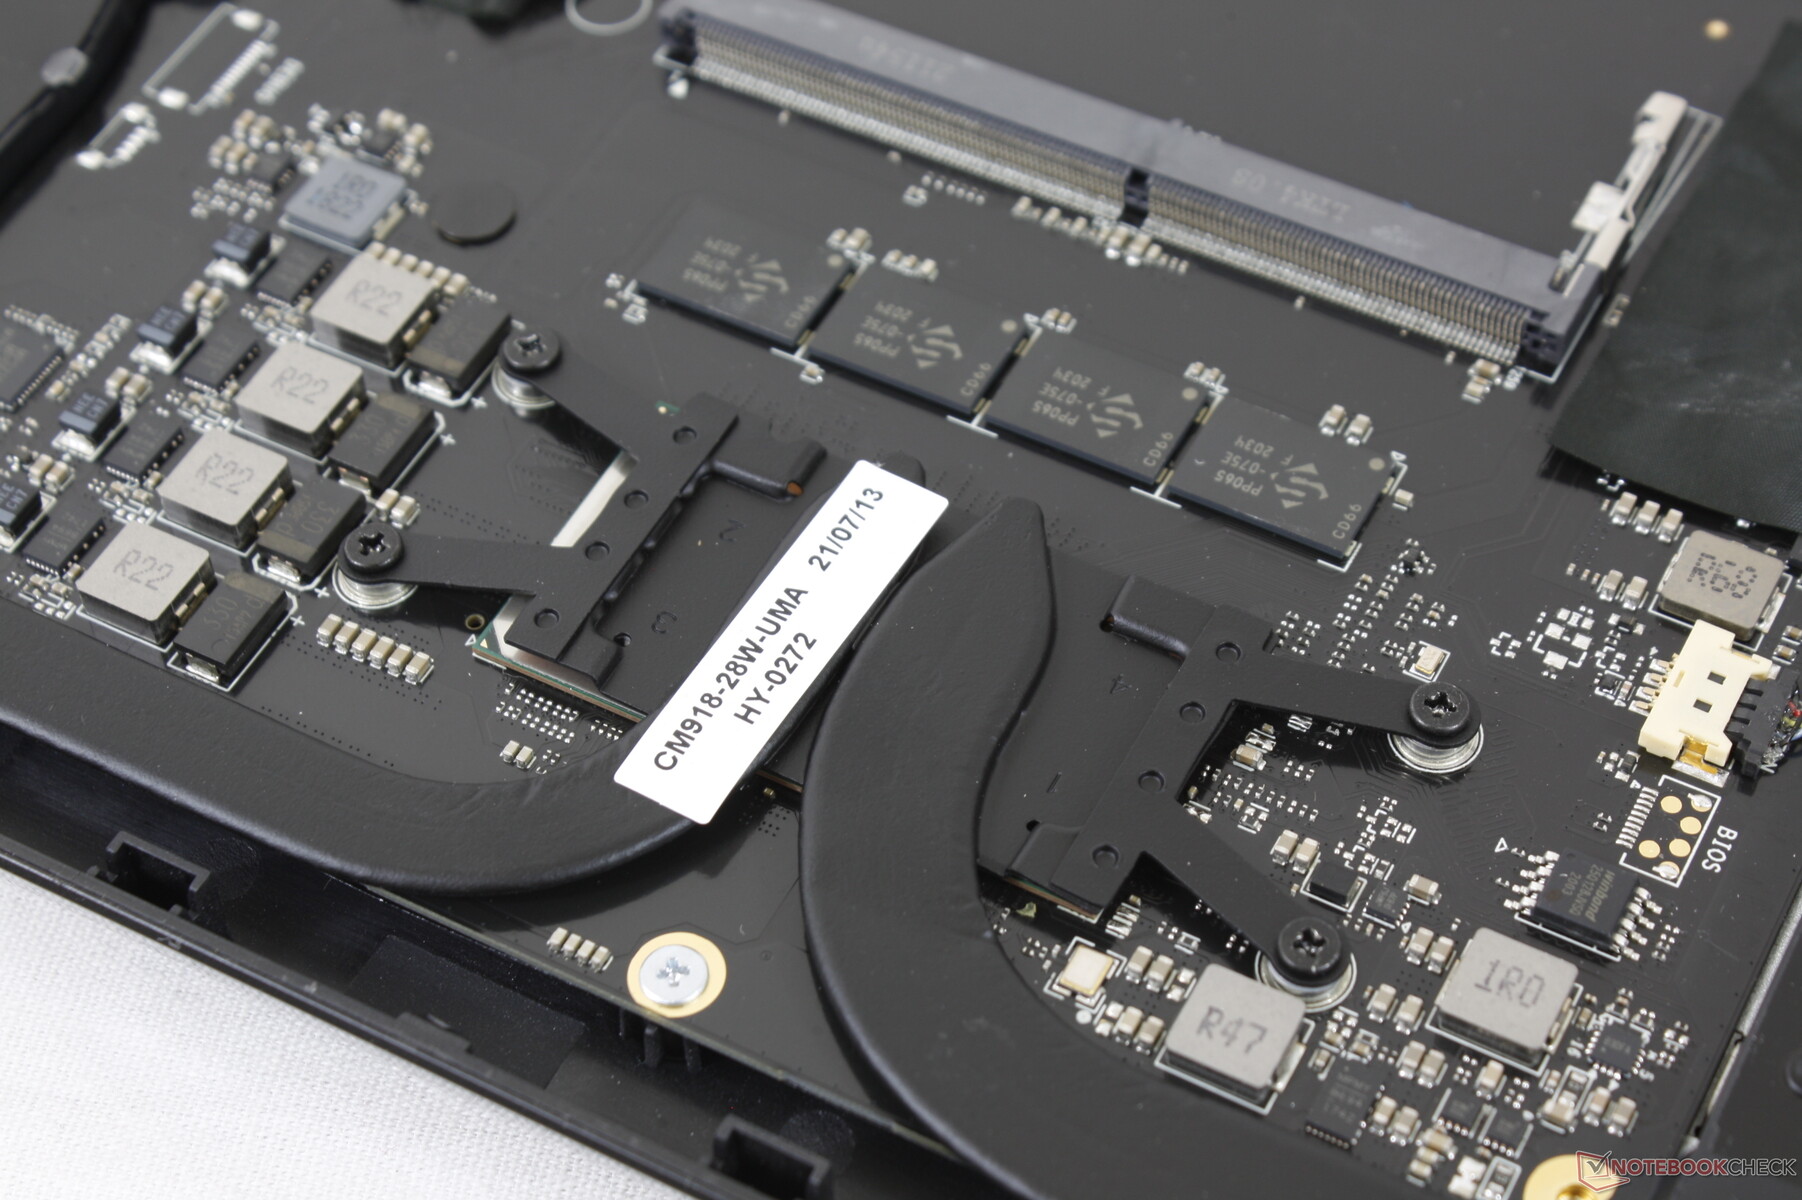
维护
只需一把飞利浦螺丝刀和锋利的边缘,就可以很容易地拆除底部面板。用户可以直接访问2个M.2托架和一个SODIMM插槽进行扩展。

配件和保修
除了文件和交流电适配器外,盒子里没有其他东西。制造商提供一年的有限保修,但由于运输问题,海外买家可能很难要求保修。
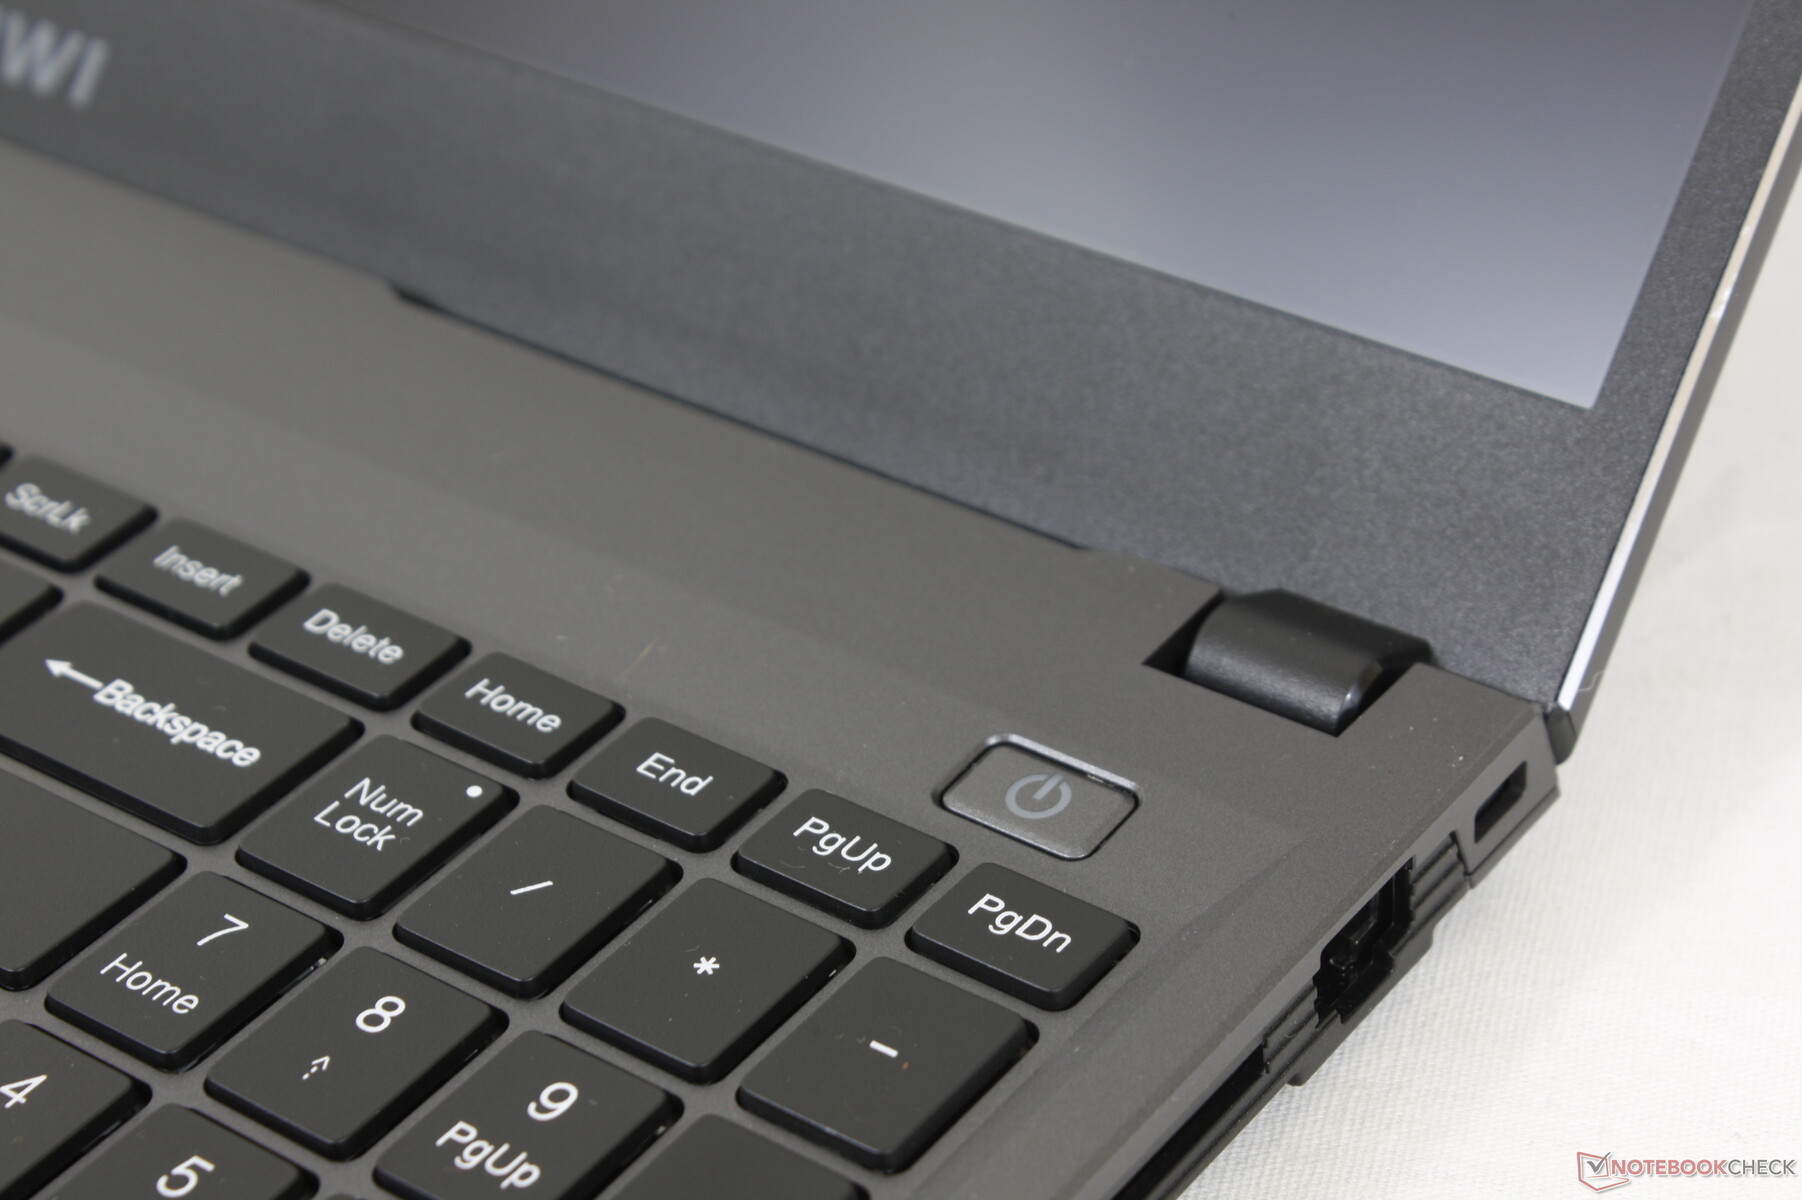
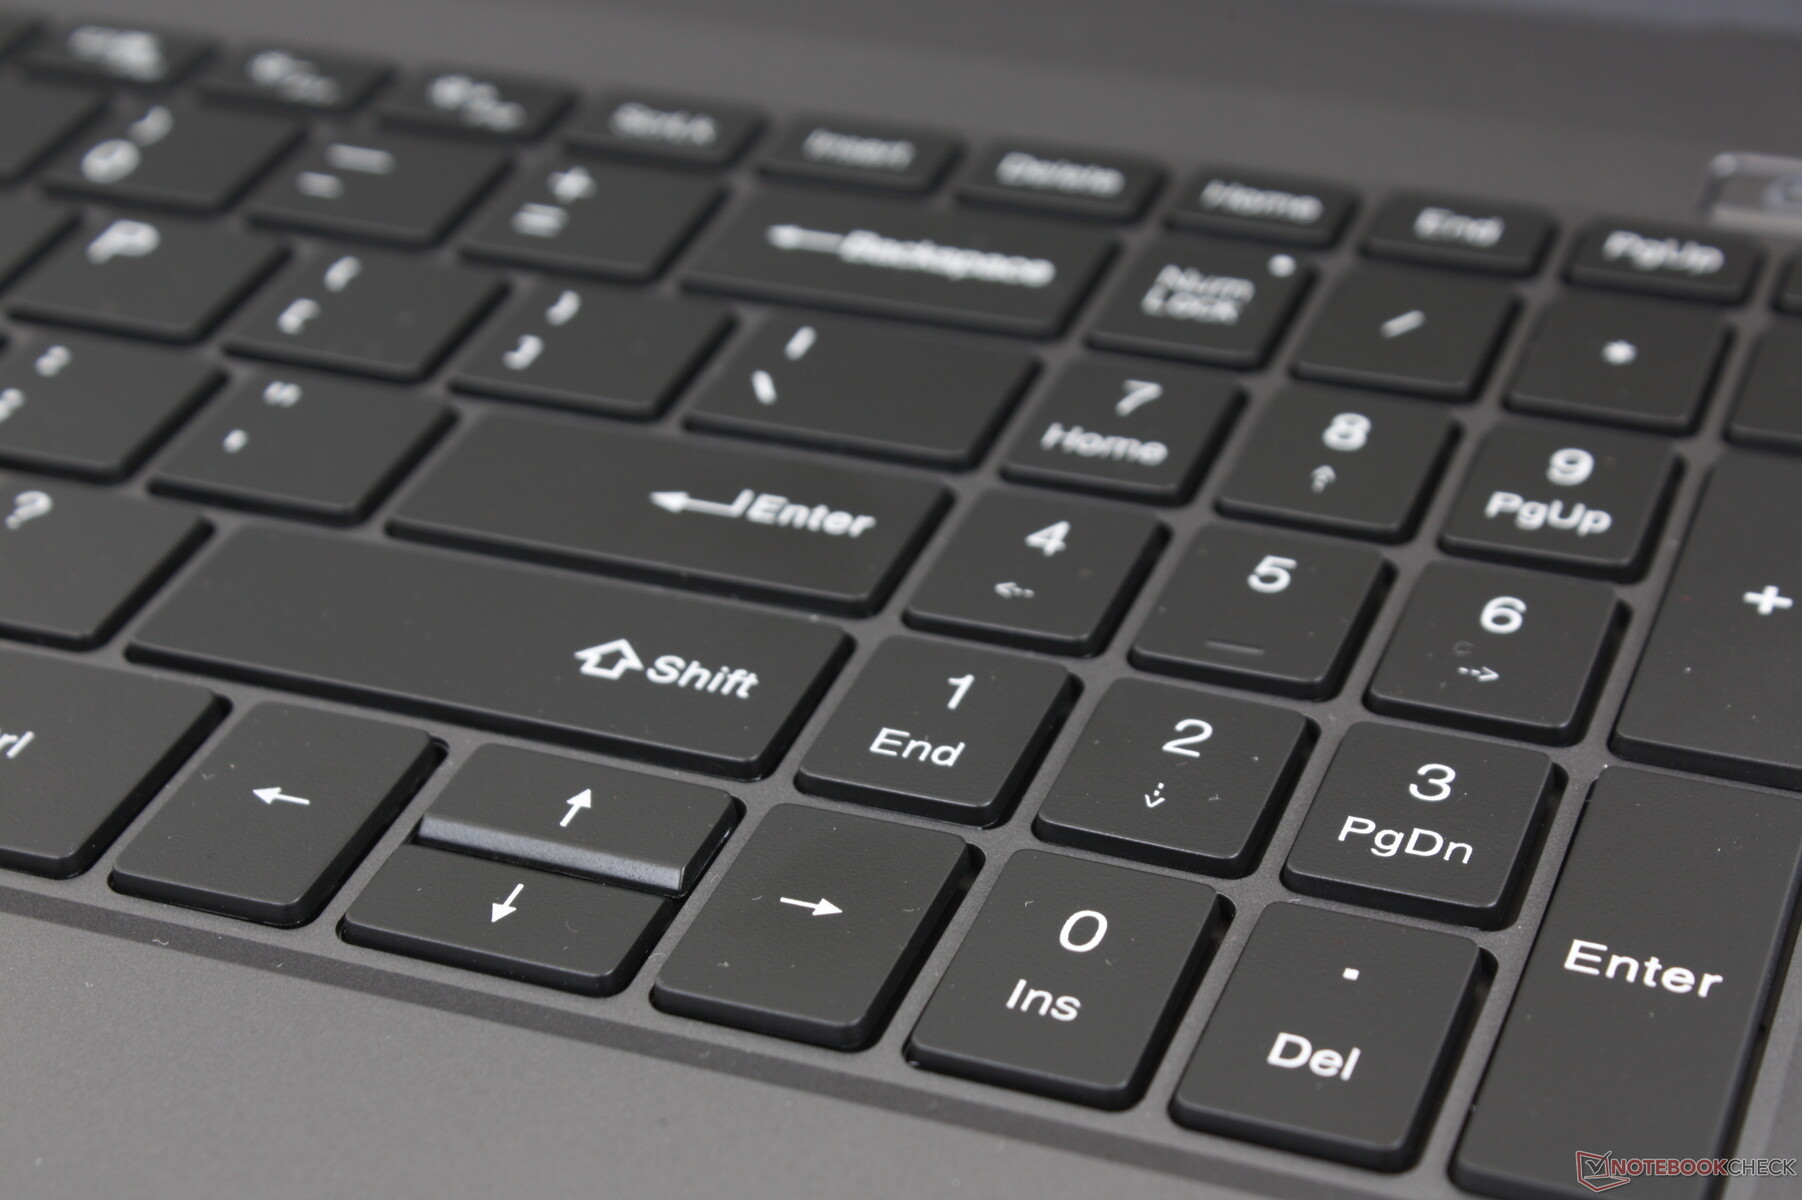
输入设备 - 笨重的按键和点击板
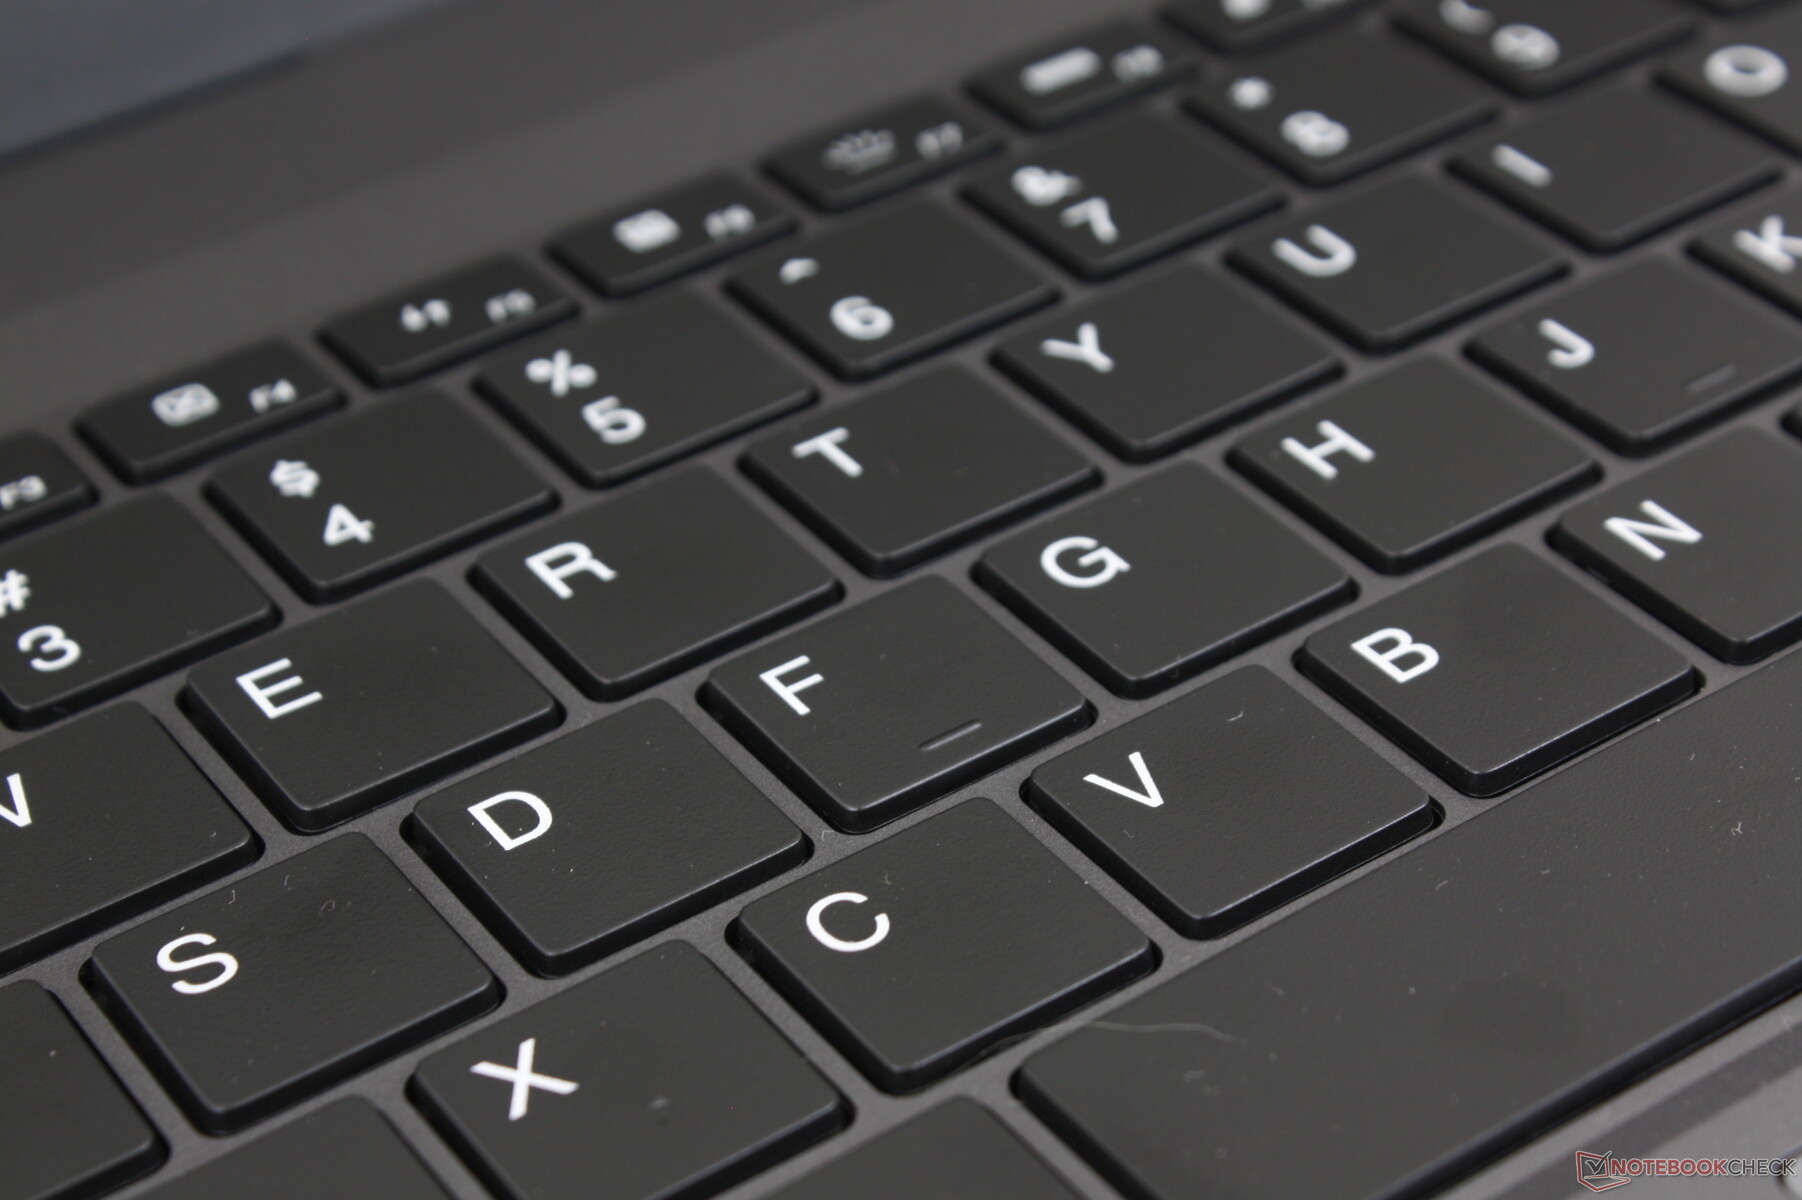
键盘
虽然超极本的键盘通常很浅,但CoreBook X Pro的按键既浅又软,打字体验不尽人意。特别是回车键和空格键太过松软,而我们的测试装置上的Windows键有时甚至无法记录按下的动作。
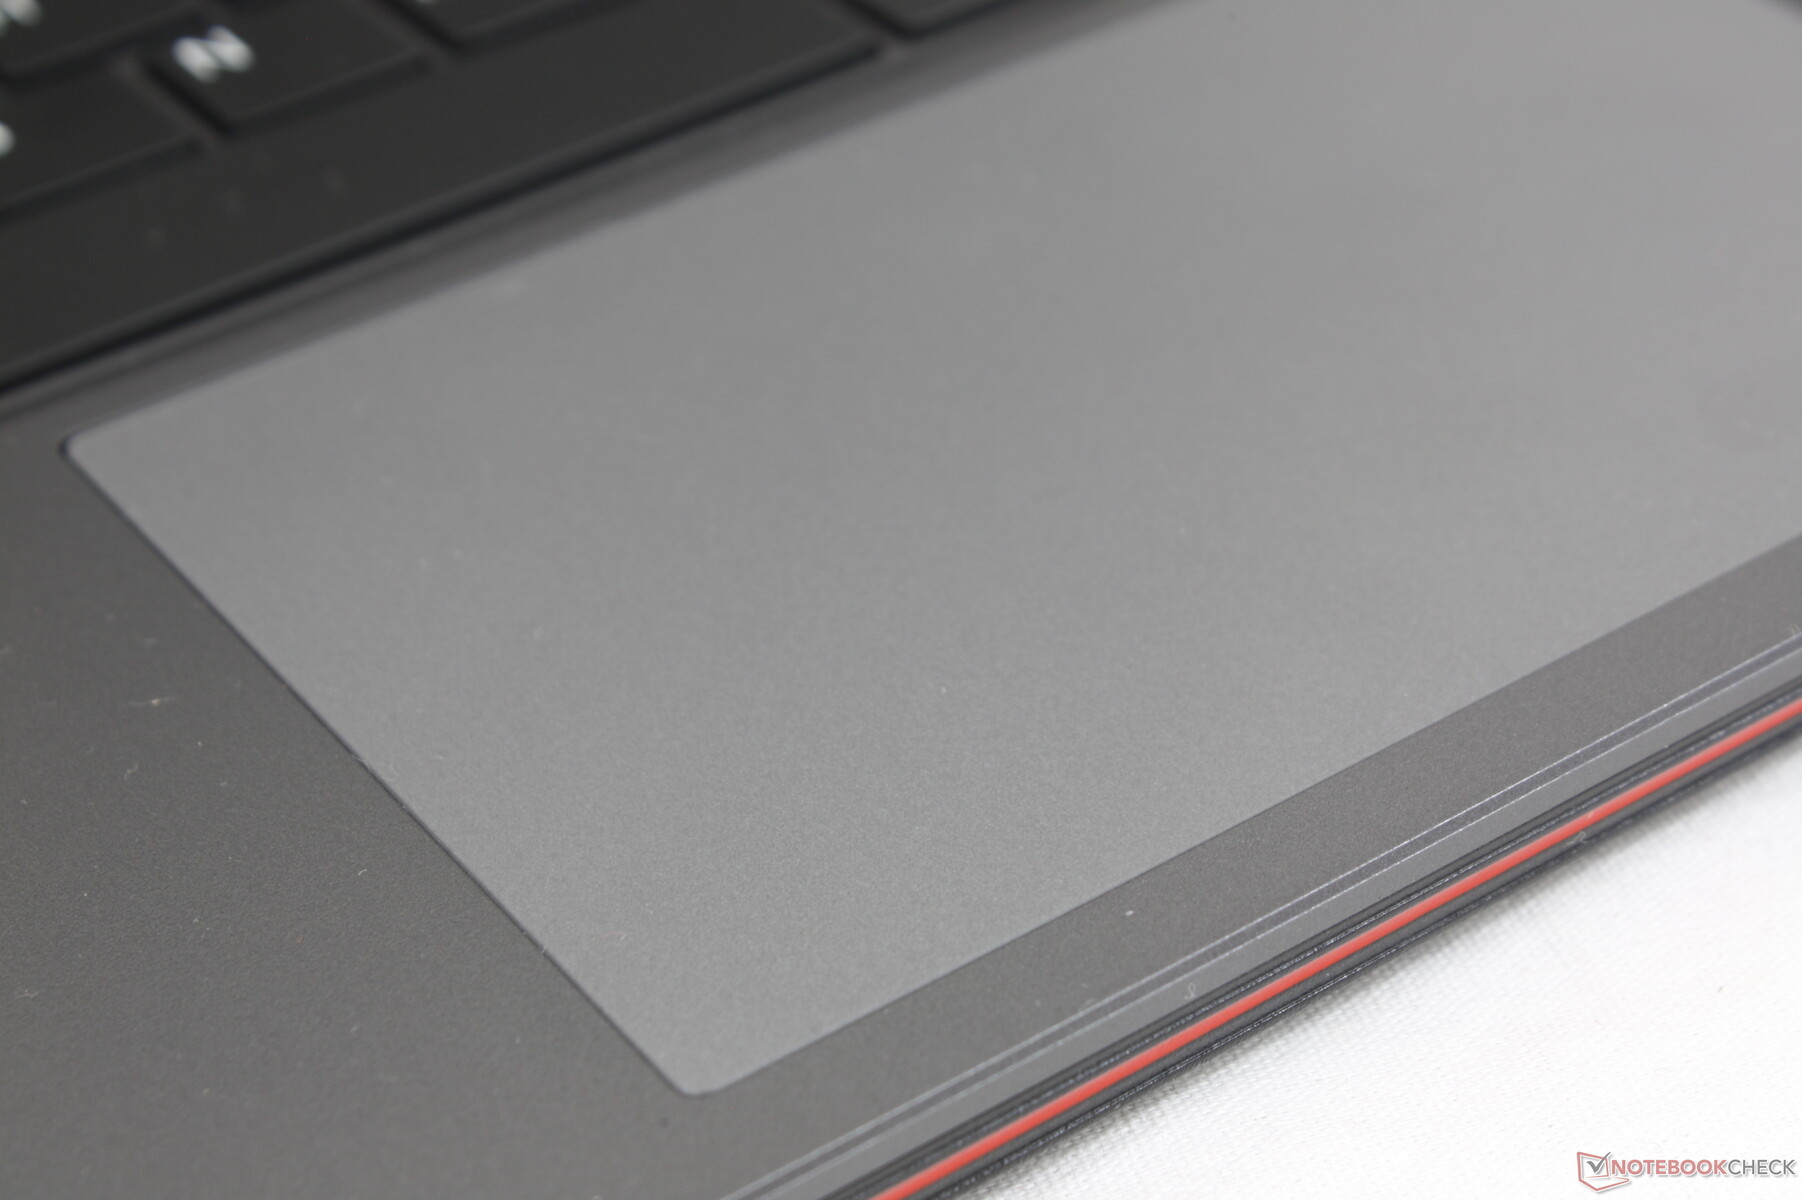
触摸板
点击板要比 微软Surface Laptop 3(12.5 x 7.8 cm vs. 11.5 x 7.6 cm)。常规的光标控制是可靠的,由于显示器的120赫兹刷新率,特别流畅。然而,多点触控的拖放动作并不那么可靠,因为光标有时可能会跳动。当以较慢的速度滑行时,点击板的表面也有点过于粘稠,这影响了精确的点击。

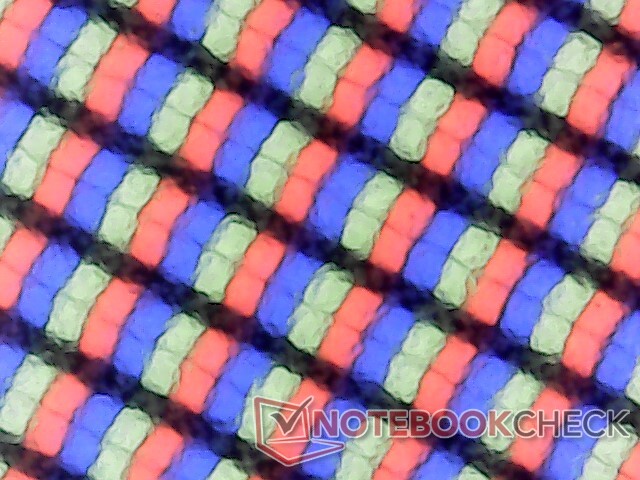
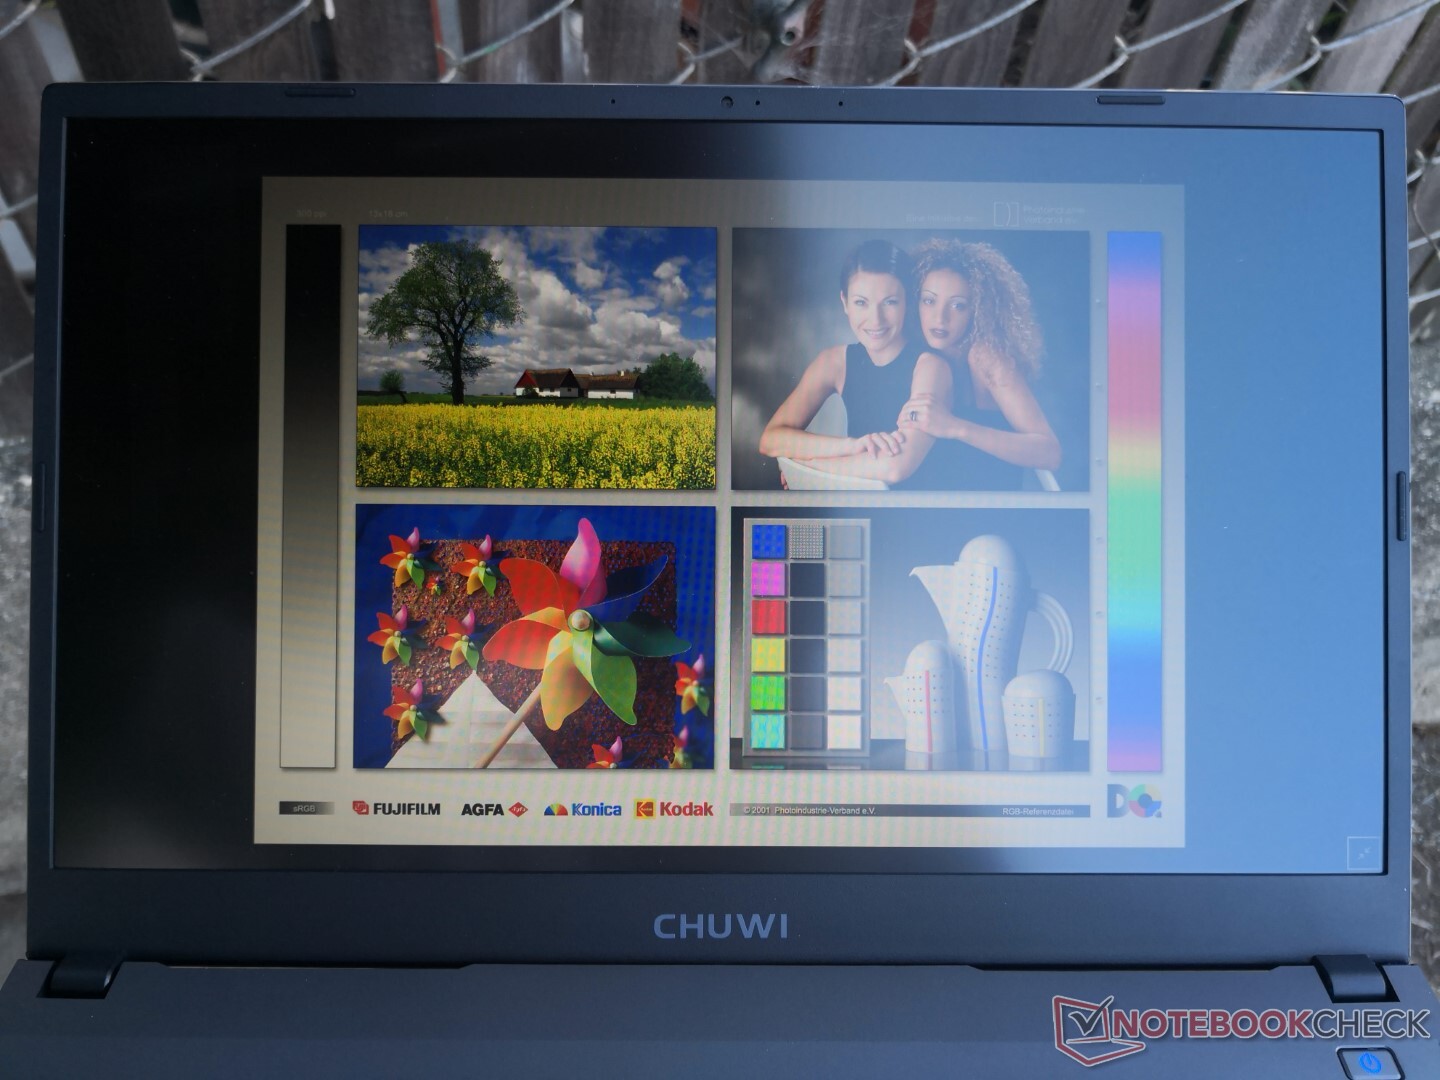
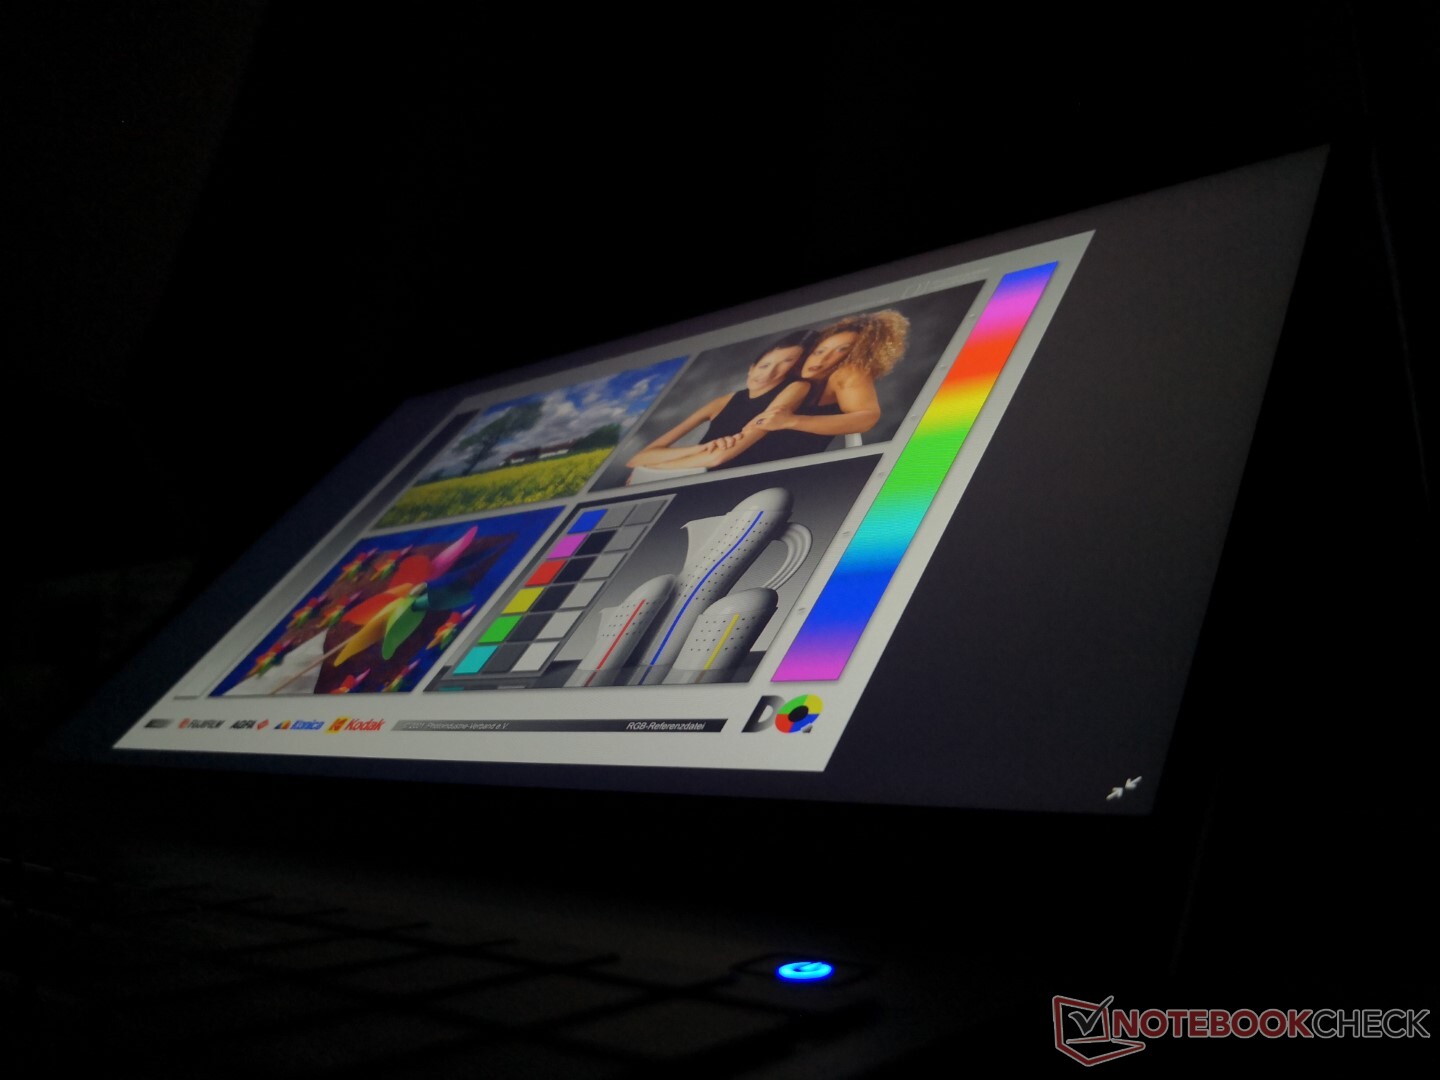
显示 - 120赫兹不是免费的
CoreBook X Pro使用的是奇美N156HRA-EA1 IPS面板,与华硕TUF Gaming F15 FX506HM的面板相同。 华硕TUF游戏F15 FX506HM或 Acer Nitro 5 AN515-55游戏笔记本电脑。这块特殊的面板提供了120赫兹的原生刷新率,同时为更流畅的游戏提供了相当快的响应时间。然而,颜色和亮度是有限的,因为这在技术上是一台预算笔记本电脑。更高端的面板,如那些发现在 雷蛇刀片15能够为游戏和数字编辑提供更快的响应时间、更快的刷新率和更深的色彩。
| |||||||||||||||||||||||||
Brightness Distribution: 87 %
Center on Battery: 269.7 cd/m²
Contrast: 1348:1 (Black: 0.2 cd/m²)
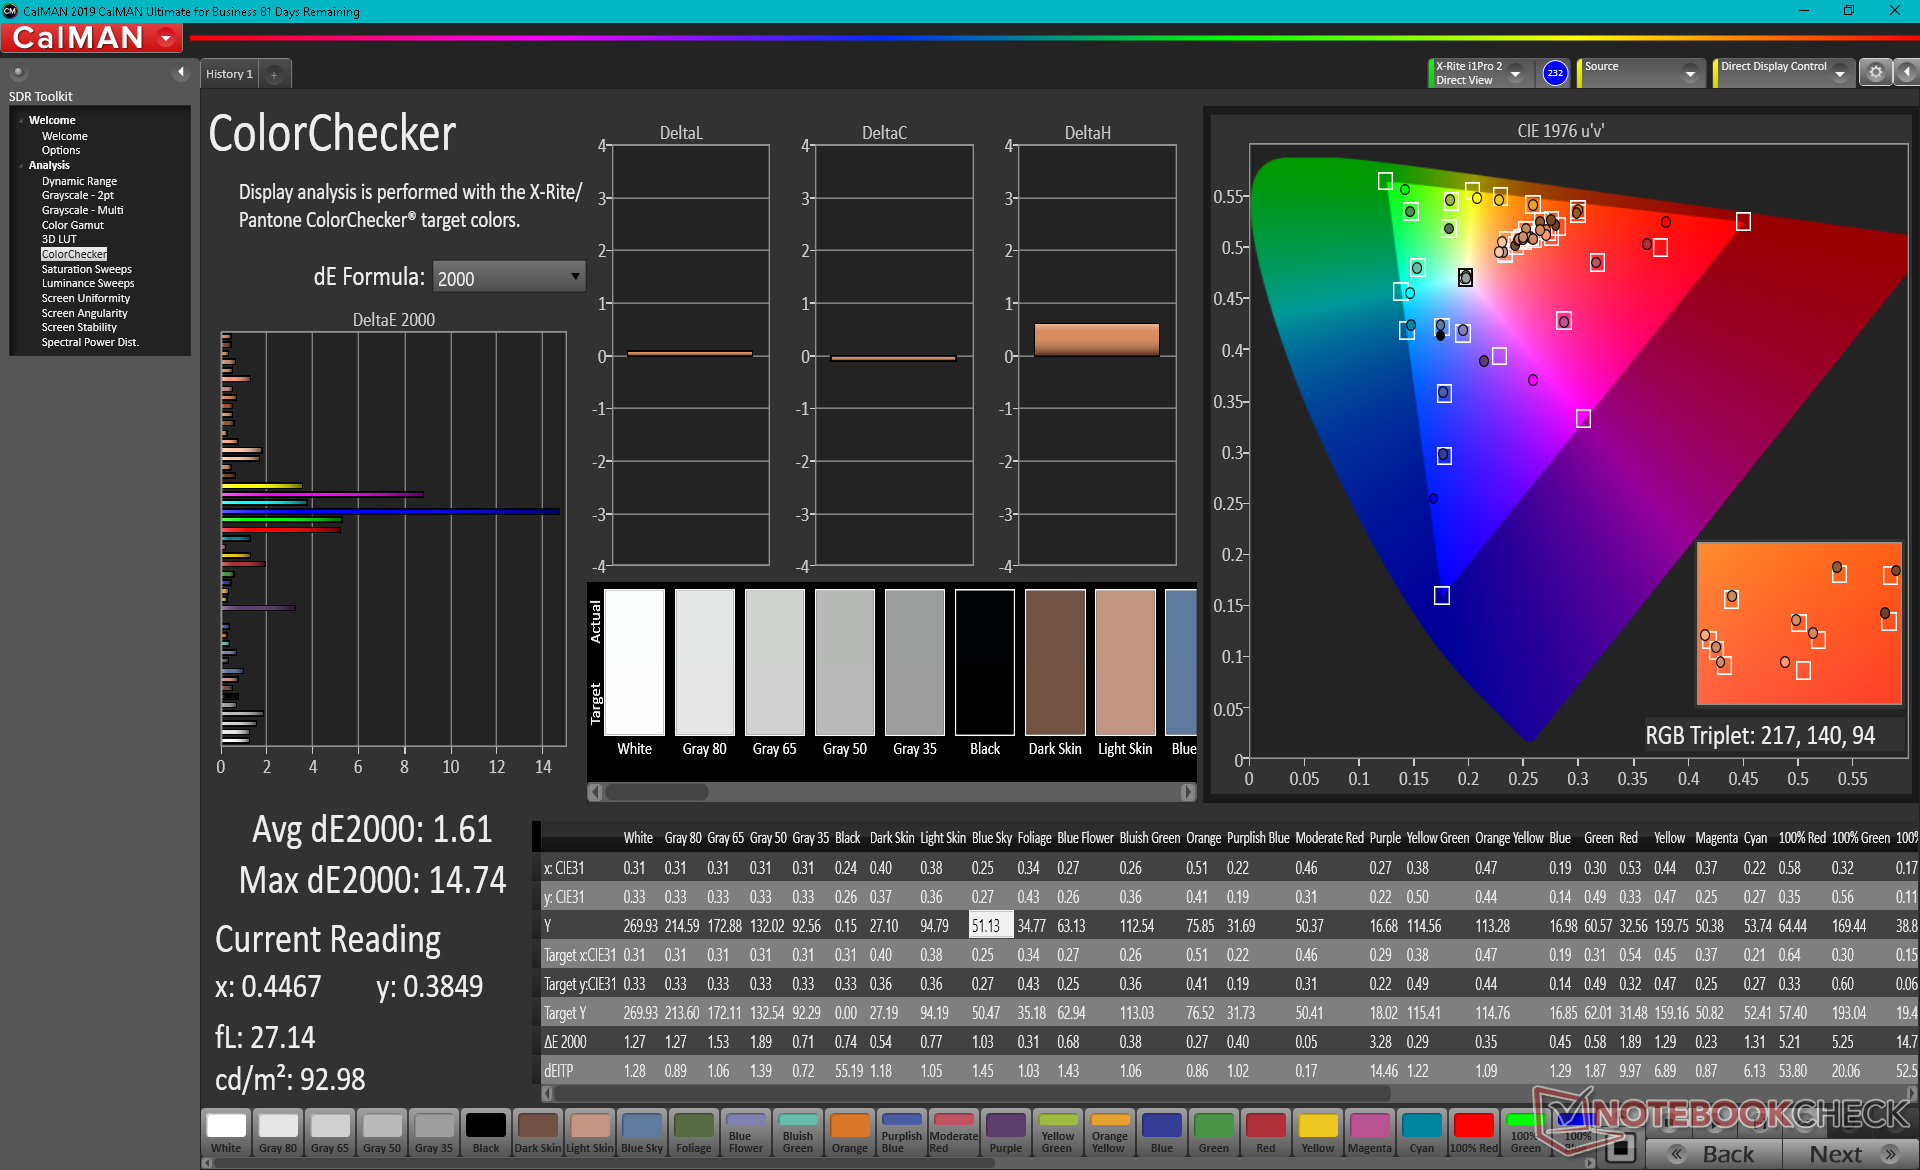
ΔE ColorChecker Calman: 3.9 | ∀{0.5-29.43 Ø4.71}
calibrated: 1.61
ΔE Greyscale Calman: 3.5 | ∀{0.09-98 Ø4.96}
43.4% AdobeRGB 1998 (Argyll 3D)
62.9% sRGB (Argyll 3D)
41.9% Display P3 (Argyll 3D)
Gamma: 2.27
CCT: 7045 K
| Chuwi CoreBook X Pro Chi Mei N156HRA-EA1, IPS, 15.6", 1920x1080 | Teclast TBOLT F15 Pro N156HCA-EN1, IPS, 15.6", 1920x1080 | Asus VivoBook S15 D533UA Chi Mei N156HCA-EAB, IPS, 15.6", 1920x1080 | Tuxedo Aura 15 Gen1 N156HCA-EA1, IPS, 15.6", 1920x1080 | Honor MagicBook 15 AU Optronics B156HAN02.8, IPS, 15.6", 1920x1080 | Dell XPS 15 9500 Core i5 Sharp LQ156N1, IPS, 15.6", 1920x1200 | |
|---|---|---|---|---|---|---|
| Display | 56% | 4% | 52% | -5% | 79% | |
| Display P3 Coverage (%) | 41.9 | 65.6 57% | 43.6 4% | 65.9 57% | 39.96 -5% | 81.5 95% |
| sRGB Coverage (%) | 62.9 | 98.1 56% | 65.2 4% | 91.9 46% | 59.7 -5% | 100 59% |
| AdobeRGB 1998 Coverage (%) | 43.4 | 67.8 56% | 45 4% | 66.7 54% | 41.29 -5% | 79.6 83% |
| Response Times | -22% | 30% | -32% | -12% | -30% | |
| Response Time Grey 50% / Grey 80% * (ms) | 31.2 ? | 39.6 ? -27% | 18 ? 42% | 42 ? -35% | 36 ? -15% | 42 ? -35% |
| Response Time Black / White * (ms) | 23.2 ? | 26.8 ? -16% | 19 ? 18% | 29.6 ? -28% | 25 ? -8% | 28.8 ? -24% |
| PWM Frequency (Hz) | 25510 ? | |||||
| Screen | 20% | -22% | -7% | -9% | 17% | |
| Brightness middle (cd/m²) | 269.7 | 293 9% | 289 7% | 351 30% | 251 -7% | 592 120% |
| Brightness (cd/m²) | 253 | 266 5% | 267 6% | 337 33% | 247 -2% | 565 123% |
| Brightness Distribution (%) | 87 | 84 -3% | 85 -2% | 91 5% | 85 -2% | 85 -2% |
| Black Level * (cd/m²) | 0.2 | 0.21 -5% | 0.56 -180% | 0.29 -45% | 0.205 -2% | 0.46 -130% |
| Contrast (:1) | 1348 | 1395 3% | 516 -62% | 1210 -10% | 1224 -9% | 1287 -5% |
| Colorchecker dE 2000 * | 3.9 | 2.1 46% | 3.96 -2% | 4.5 -15% | 3.94 -1% | 3.19 18% |
| Colorchecker dE 2000 max. * | 15.77 | 5 68% | 6.76 57% | 9.4 40% | 7.87 50% | 5.45 65% |
| Colorchecker dE 2000 calibrated * | 1.61 | 0.7 57% | 1.9 -18% | 3.42 -112% | 2.03 -26% | |
| Greyscale dE 2000 * | 3.5 | 3.5 -0% | 3.43 2% | 6.3 -80% | 3.42 2% | 3.9 -11% |
| Gamma | 2.27 97% | 2.21 100% | 2.28 96% | 2.25 98% | 2.44 90% | 2.25 98% |
| CCT | 7045 92% | 6681 97% | 7191 90% | 6601 98% | 6319 103% | 6522 100% |
| Color Space (Percent of AdobeRGB 1998) (%) | 42 | 59.7 | 38 | 71.6 | ||
| Color Space (Percent of sRGB) (%) | 65 | 91.8 | 59 | 100 | ||
| Total Average (Program / Settings) | 18% /
22% | 4% /
-8% | 4% /
2% | -9% /
-9% | 22% /
24% |
* ... smaller is better
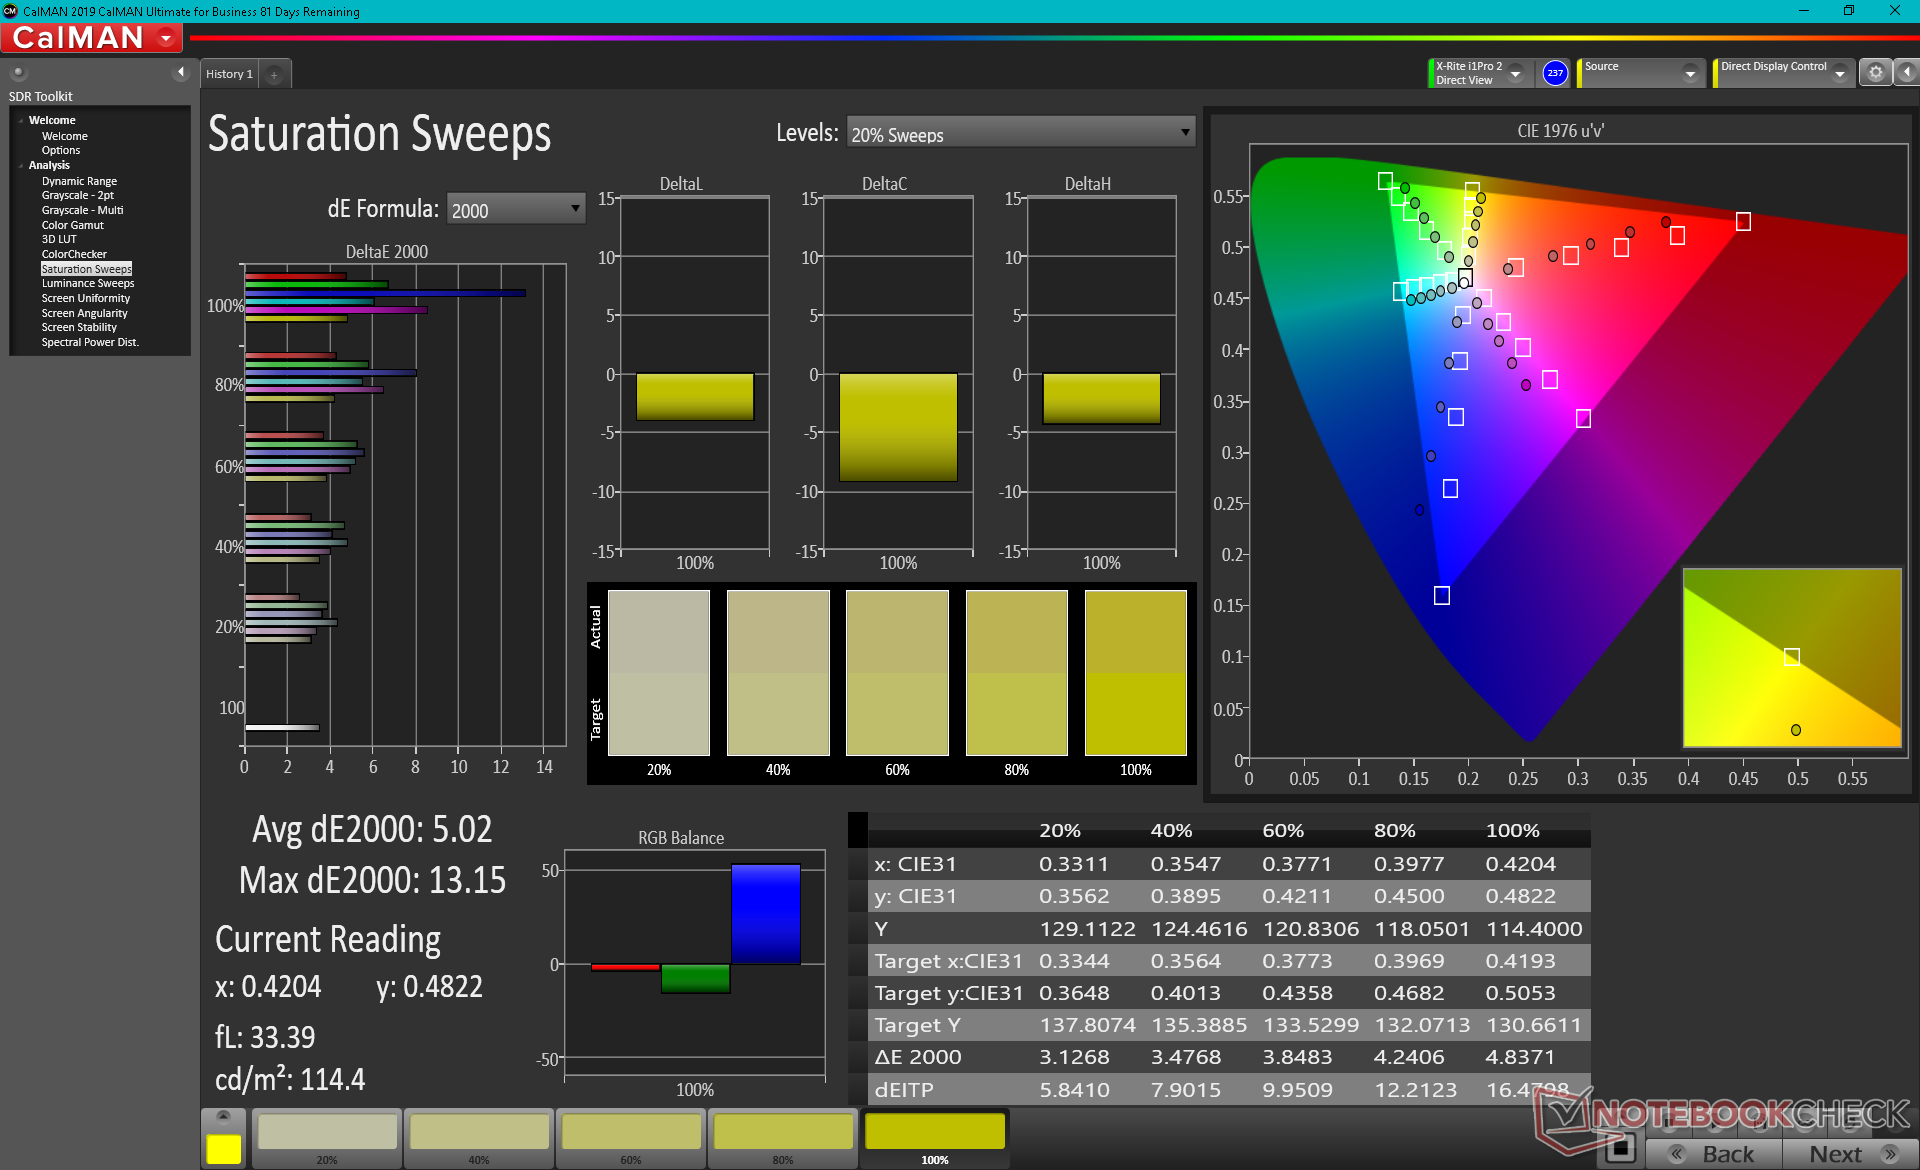
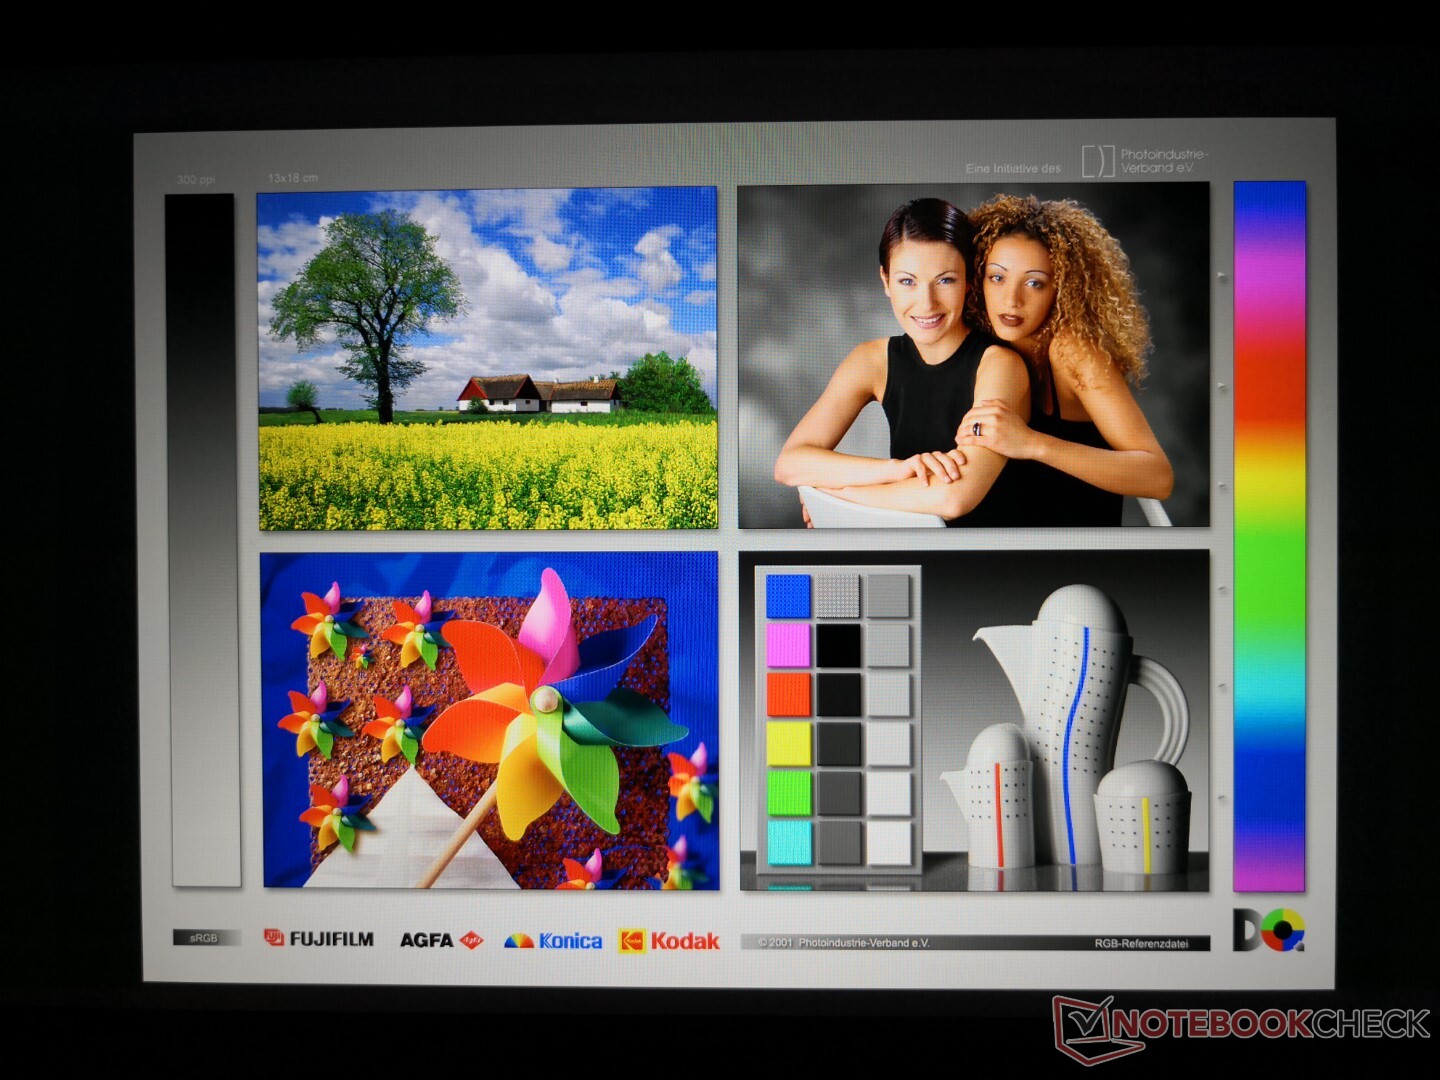
色彩空间狭窄,仅为sRGB的63%,表明面板不适合数字编辑。这是少数同时具有120赫兹高刷新率和有限色域的显示器之一,因为高刷新率通常会带来高(>90%)的sRGB覆盖率。
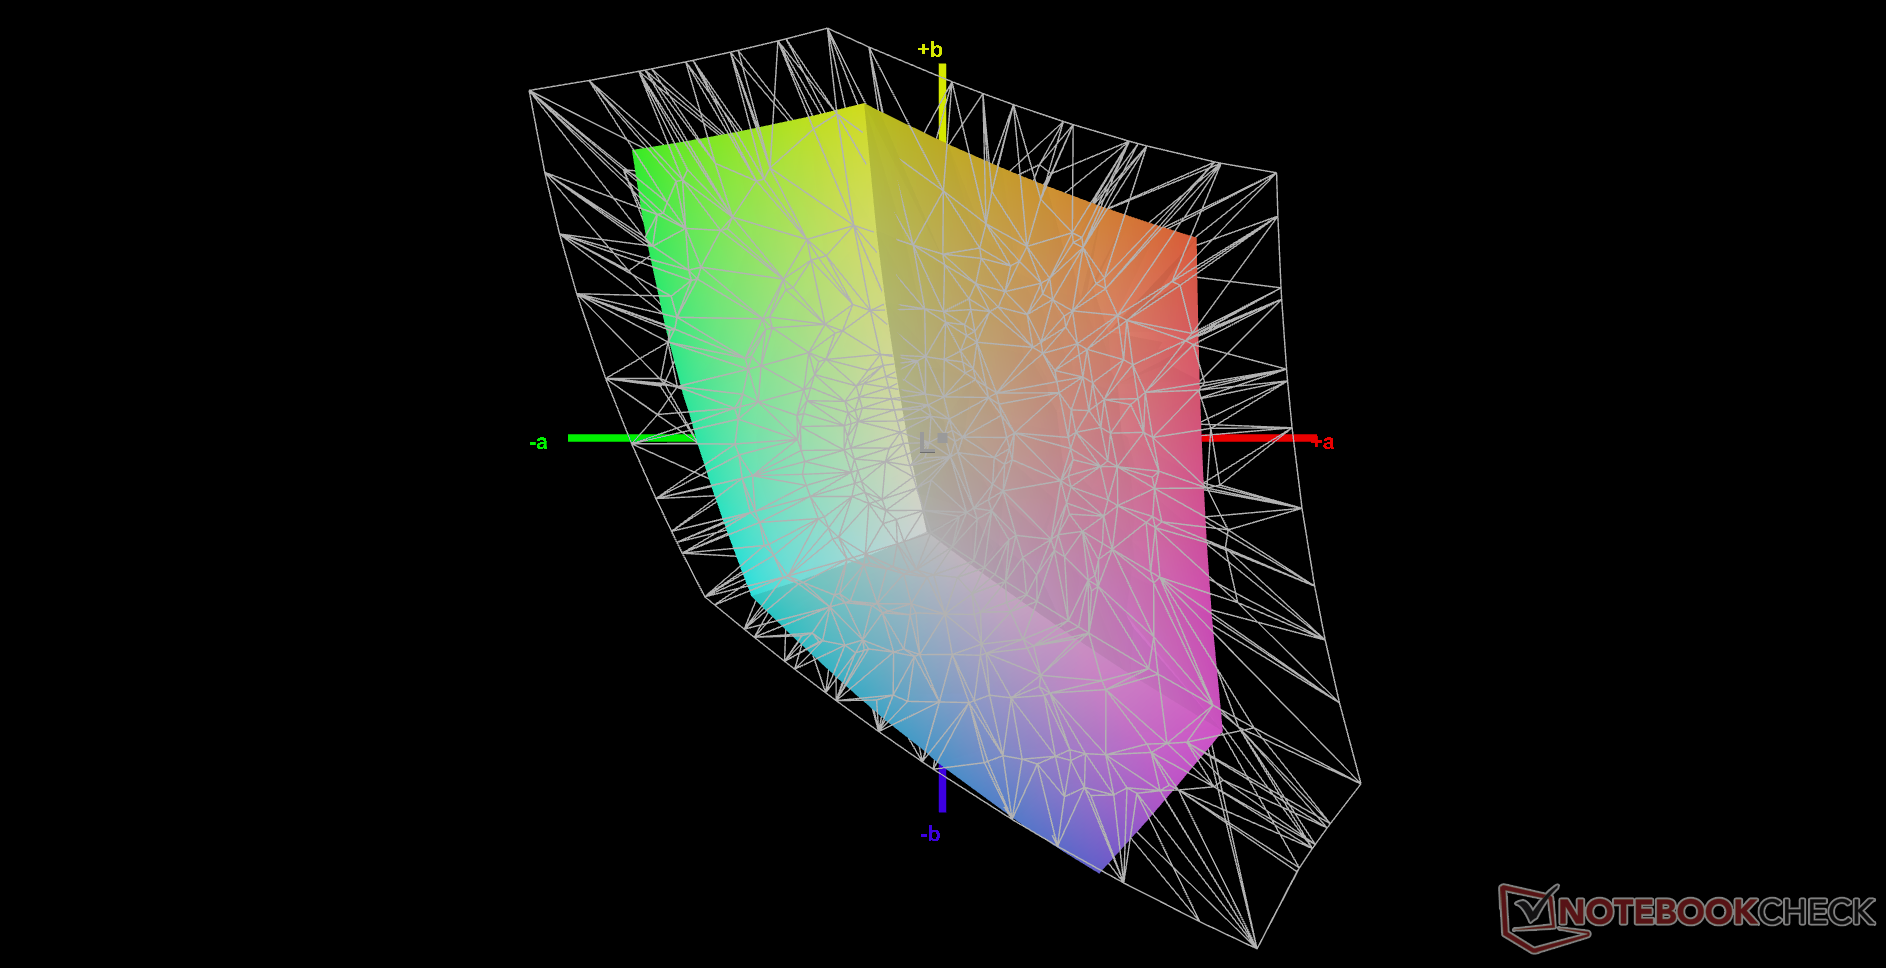
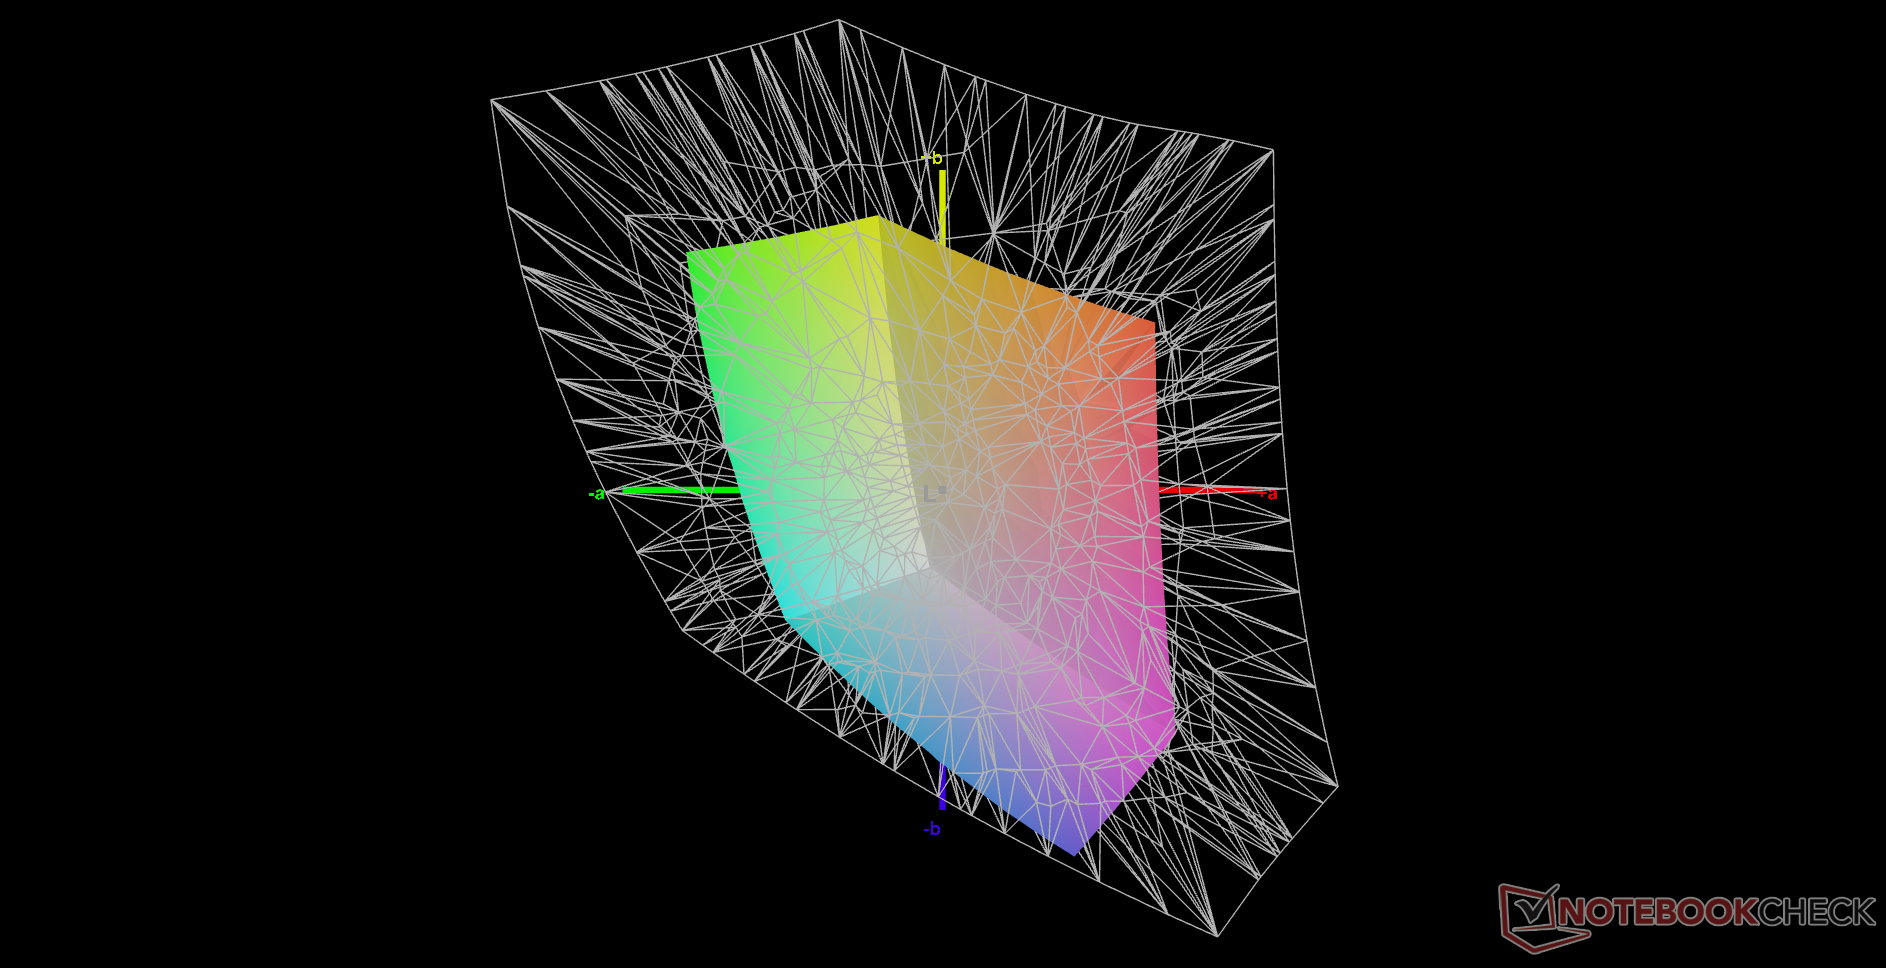
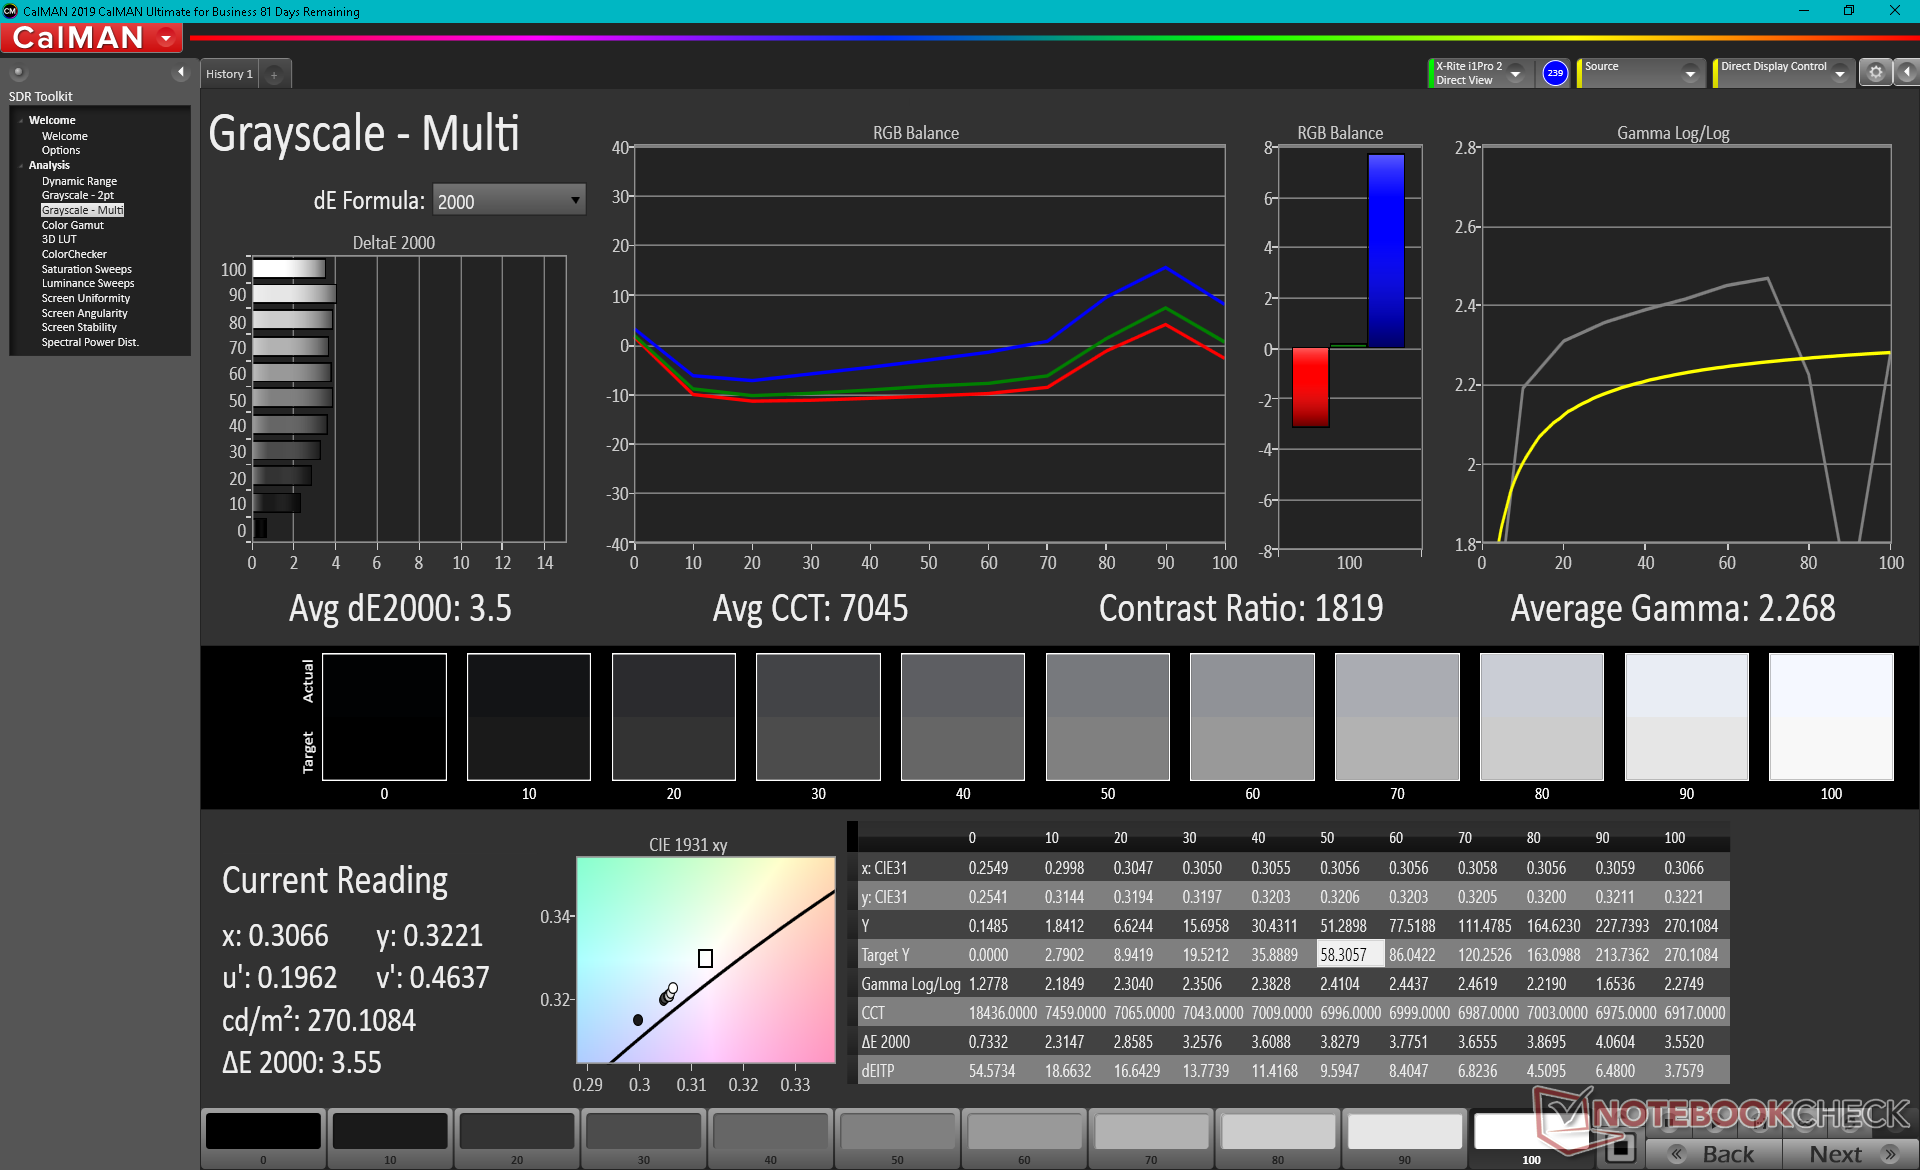
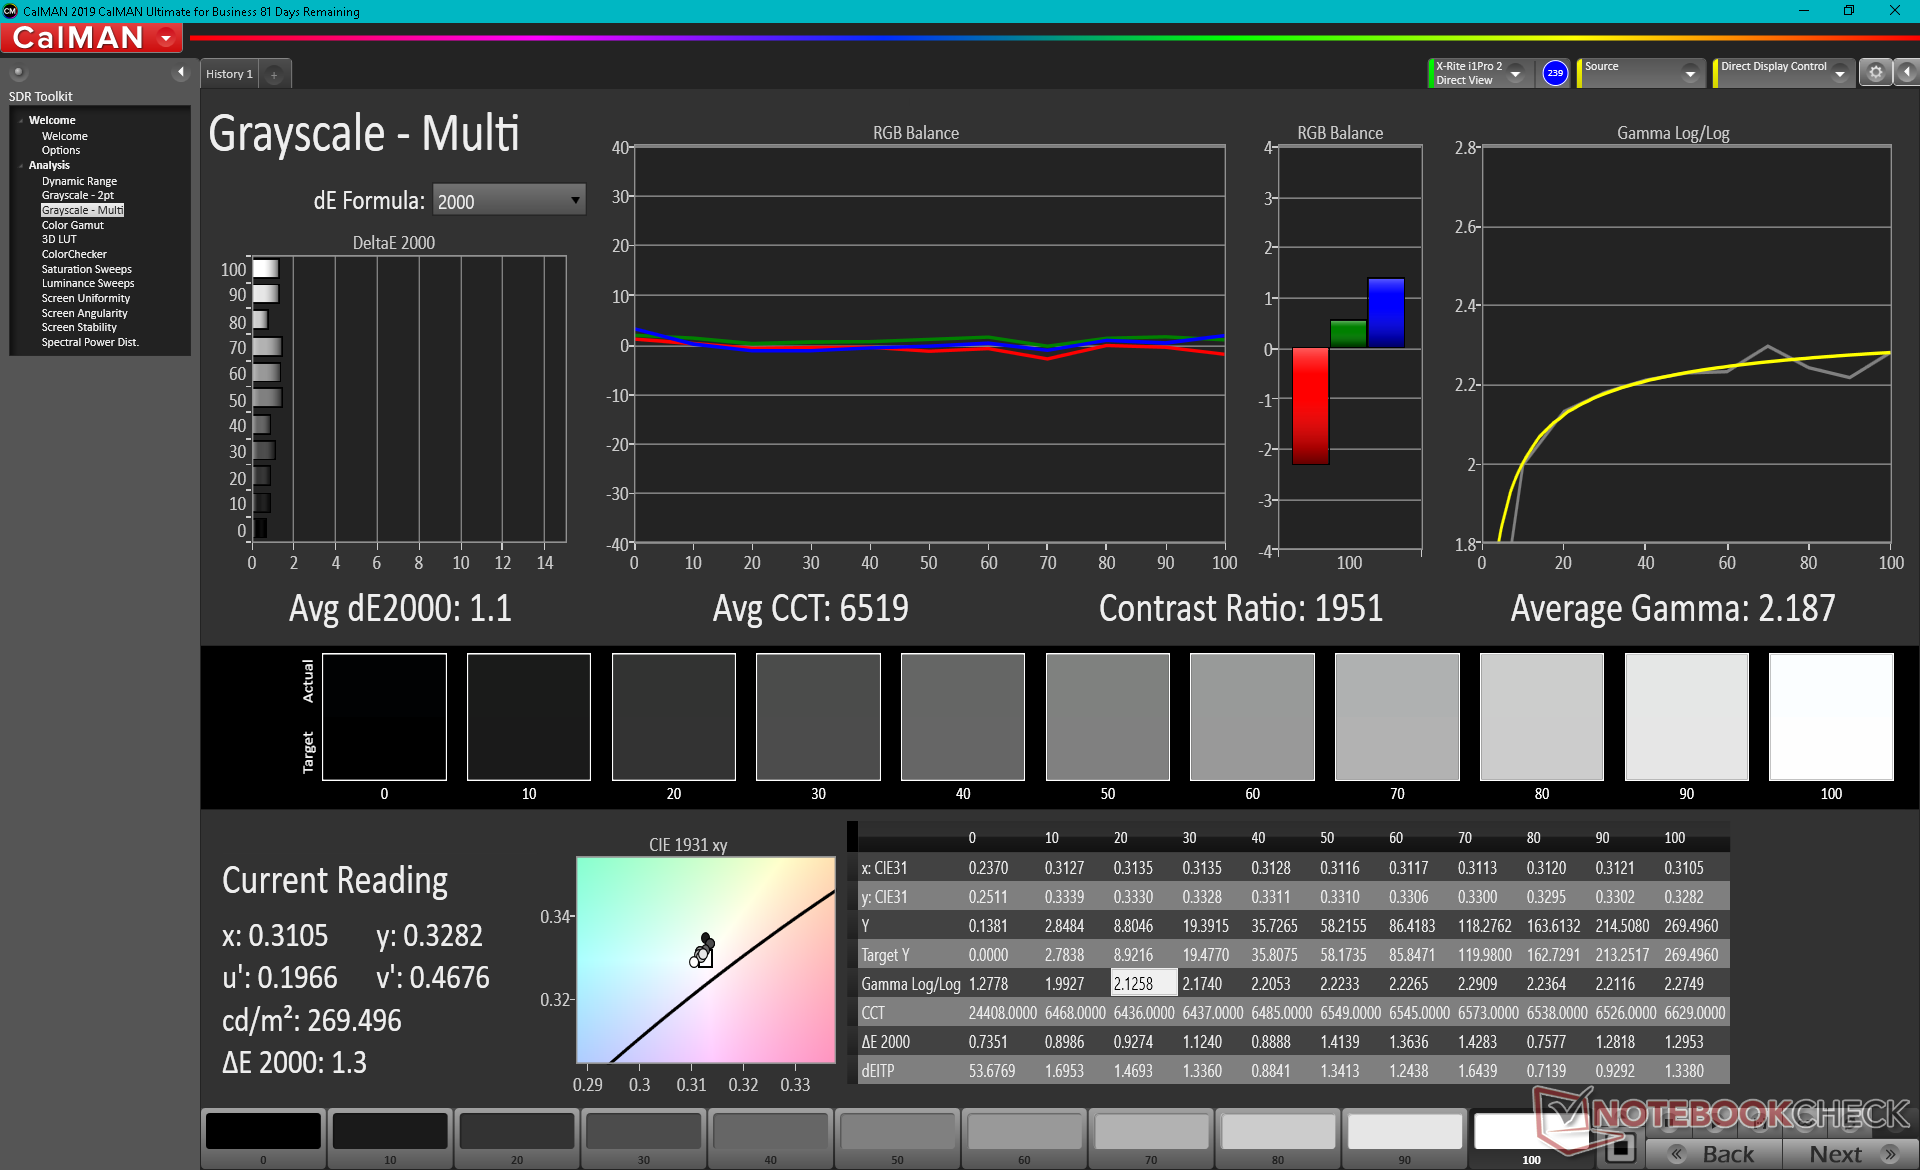
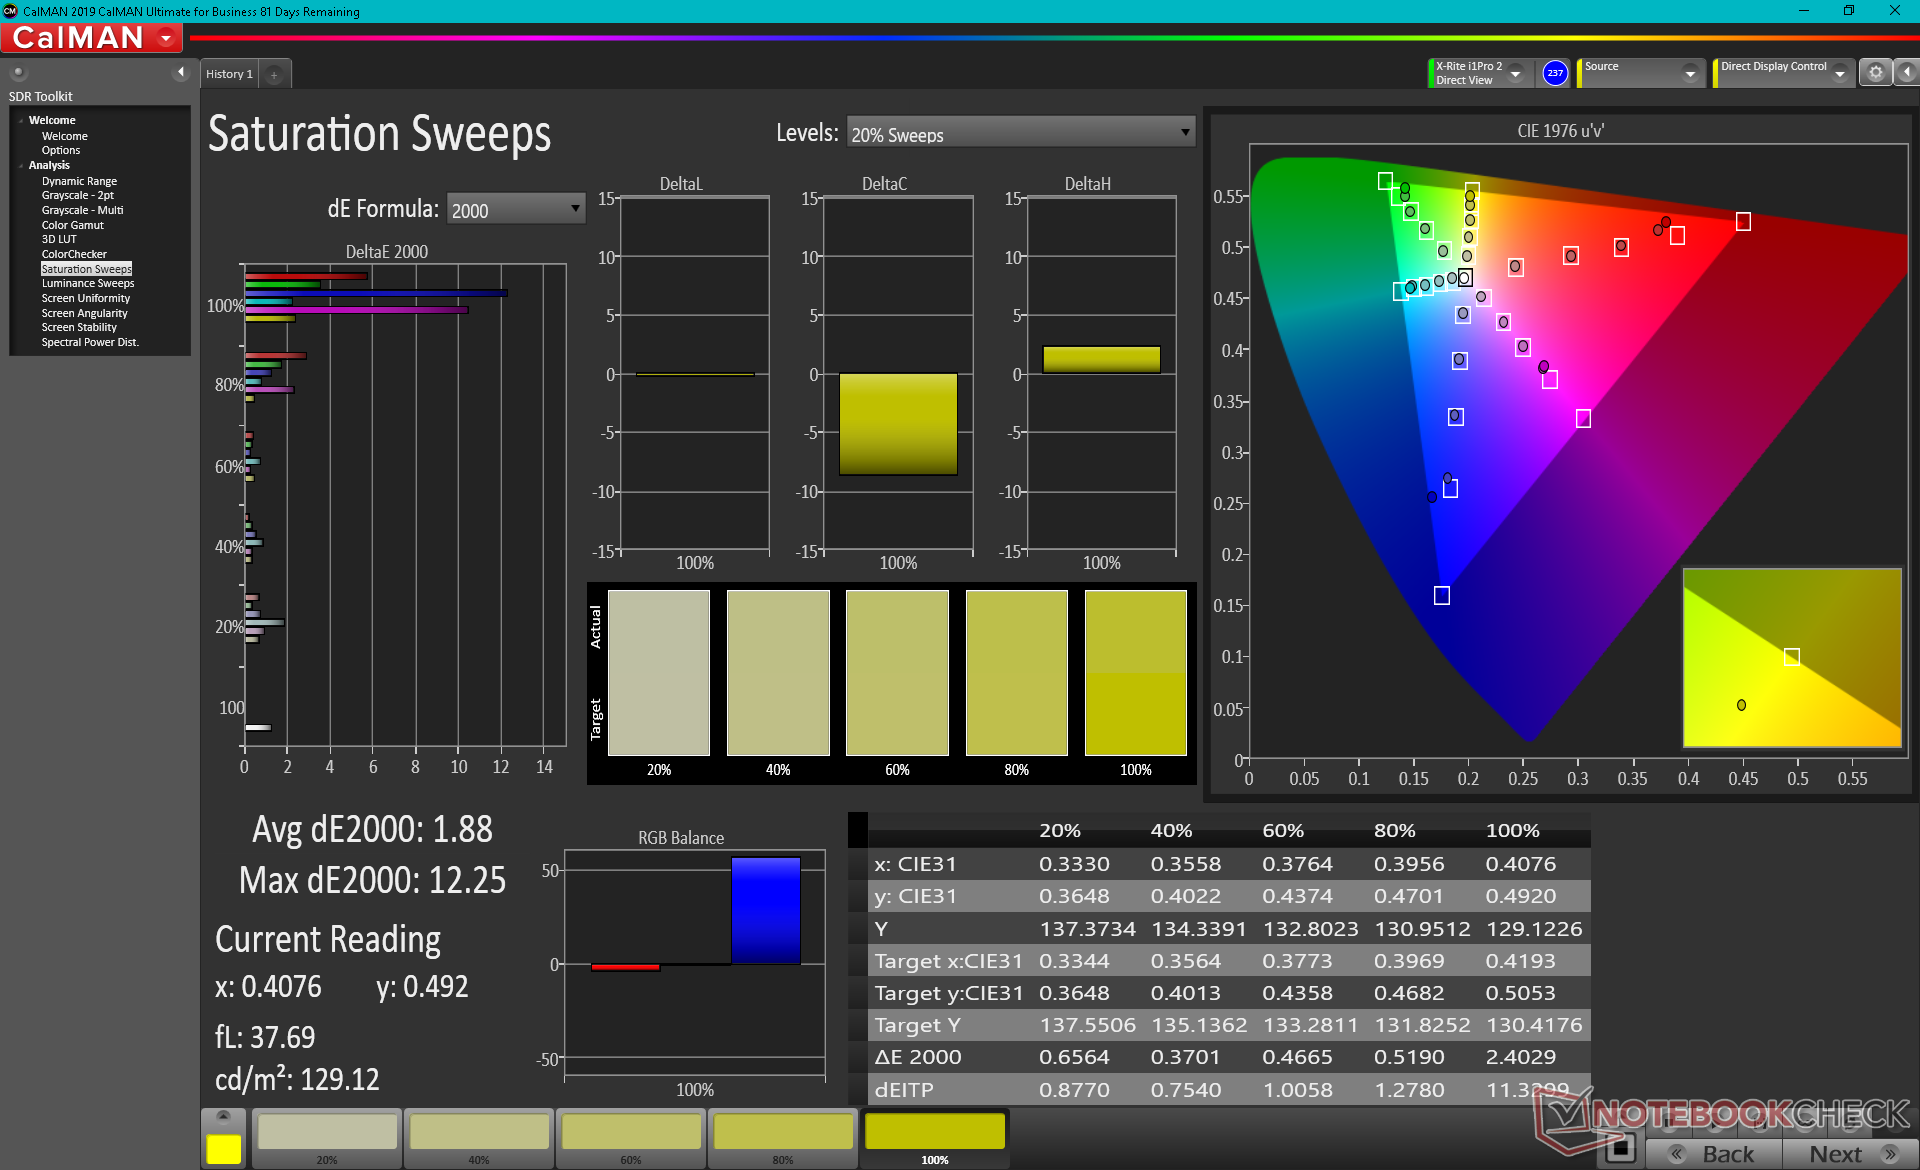
X-Rite色度计的测量结果显示,7045K的色温与6500K的sRGB目标相比,略显过冷。一旦我们校准了显示器,灰度和颜色就会有明显的改善。由于面板的色彩空间有限,颜色在高饱和度水平上仍然变得更加不准确。

Display Response Times
| ↔ Response Time Black to White | ||
|---|---|---|
| 23.2 ms ... rise ↗ and fall ↘ combined | ↗ 12.4 ms rise | 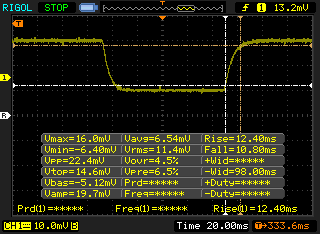 |
| ↘ 10.8 ms fall | ||
| The screen shows good response rates in our tests, but may be too slow for competitive gamers. In comparison, all tested devices range from 0.1 (minimum) to 240 (maximum) ms. » 53 % of all devices are better. This means that the measured response time is worse than the average of all tested devices (19.8 ms). | ||
| ↔ Response Time 50% Grey to 80% Grey | ||
| 31.2 ms ... rise ↗ and fall ↘ combined | ↗ 17.2 ms rise | 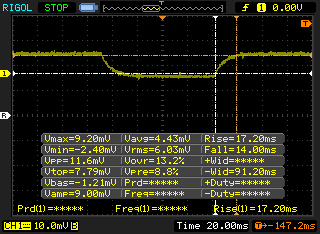 |
| ↘ 14 ms fall | ||
| The screen shows slow response rates in our tests and will be unsatisfactory for gamers. In comparison, all tested devices range from 0.165 (minimum) to 636 (maximum) ms. » 42 % of all devices are better. This means that the measured response time is similar to the average of all tested devices (31 ms). | ||
Screen Flickering / PWM (Pulse-Width Modulation)
| Screen flickering / PWM not detected | 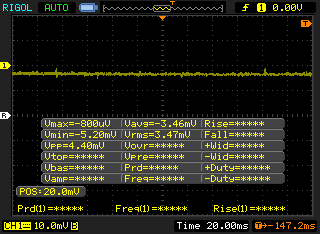 | ||
In comparison: 52 % of all tested devices do not use PWM to dim the display. If PWM was detected, an average of 7754 (minimum: 5 - maximum: 343500) Hz was measured. | |||
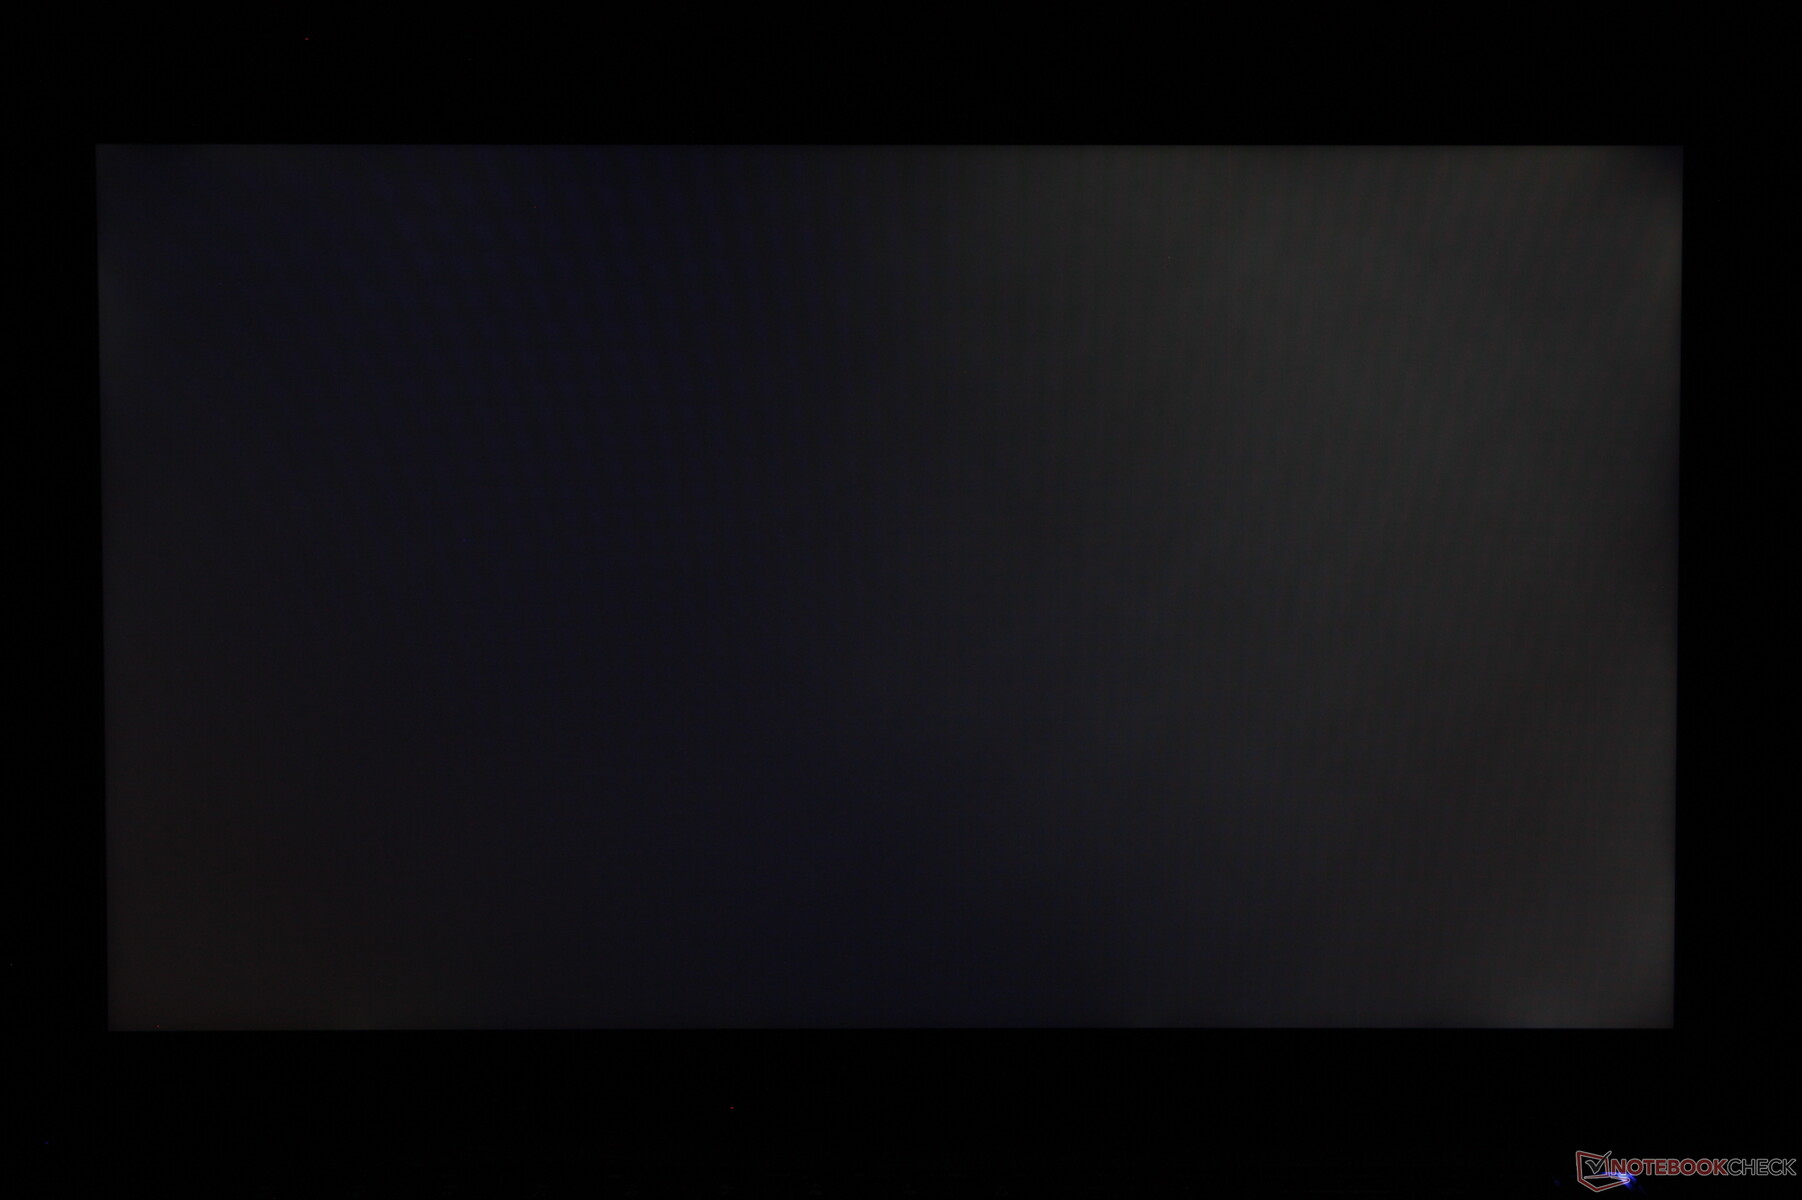
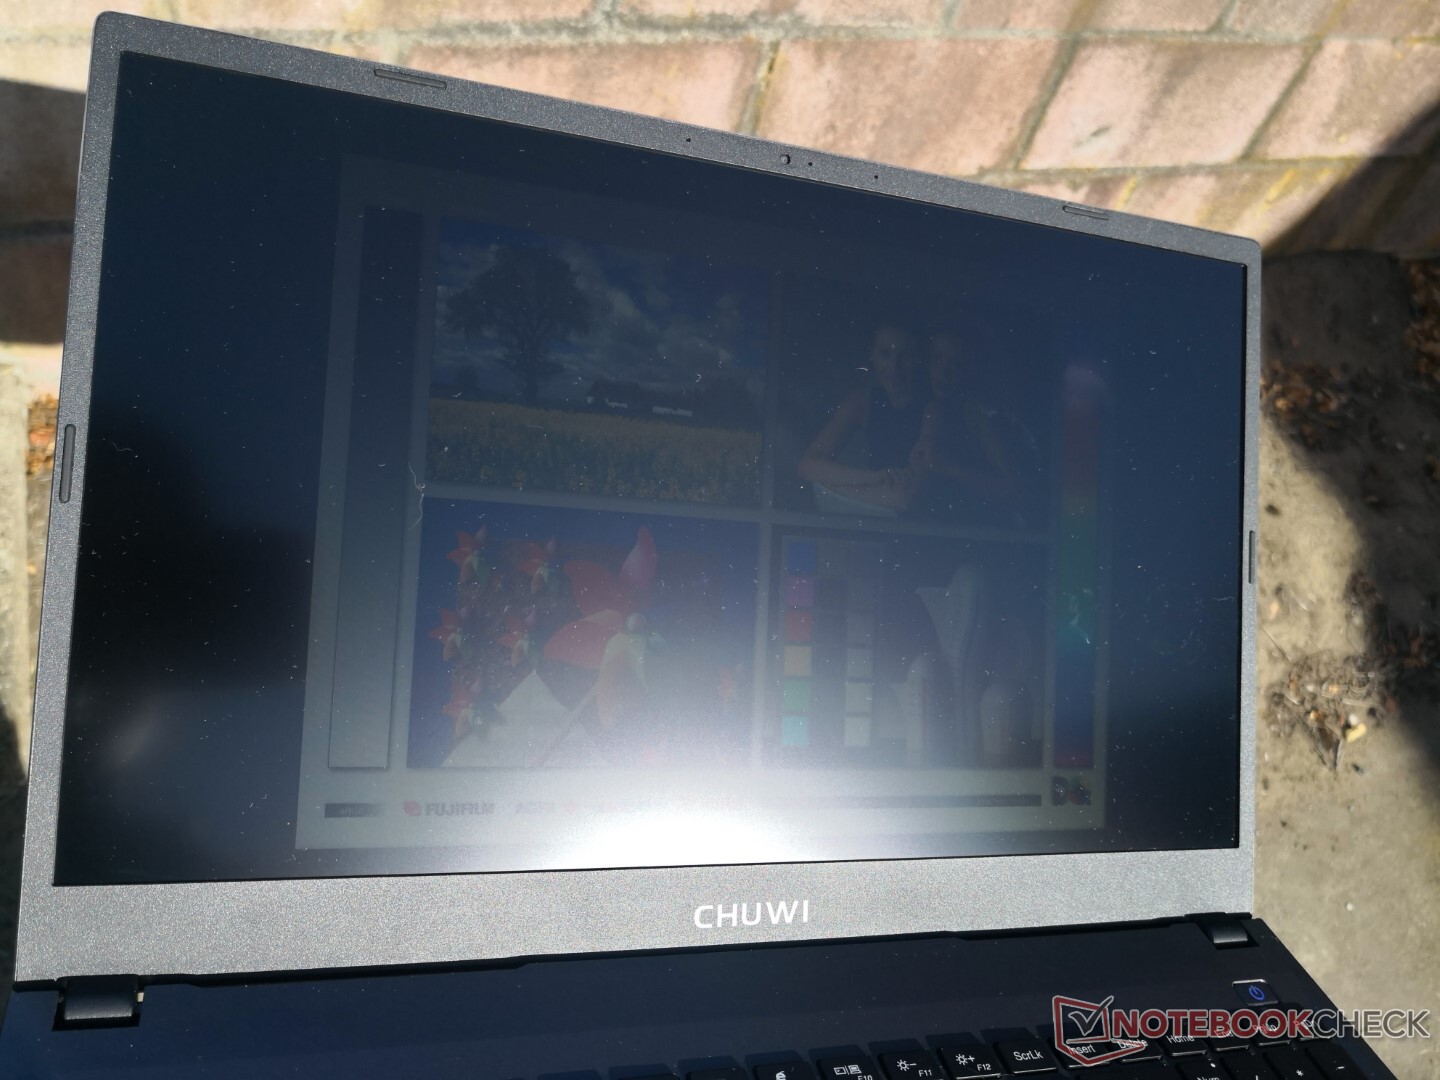
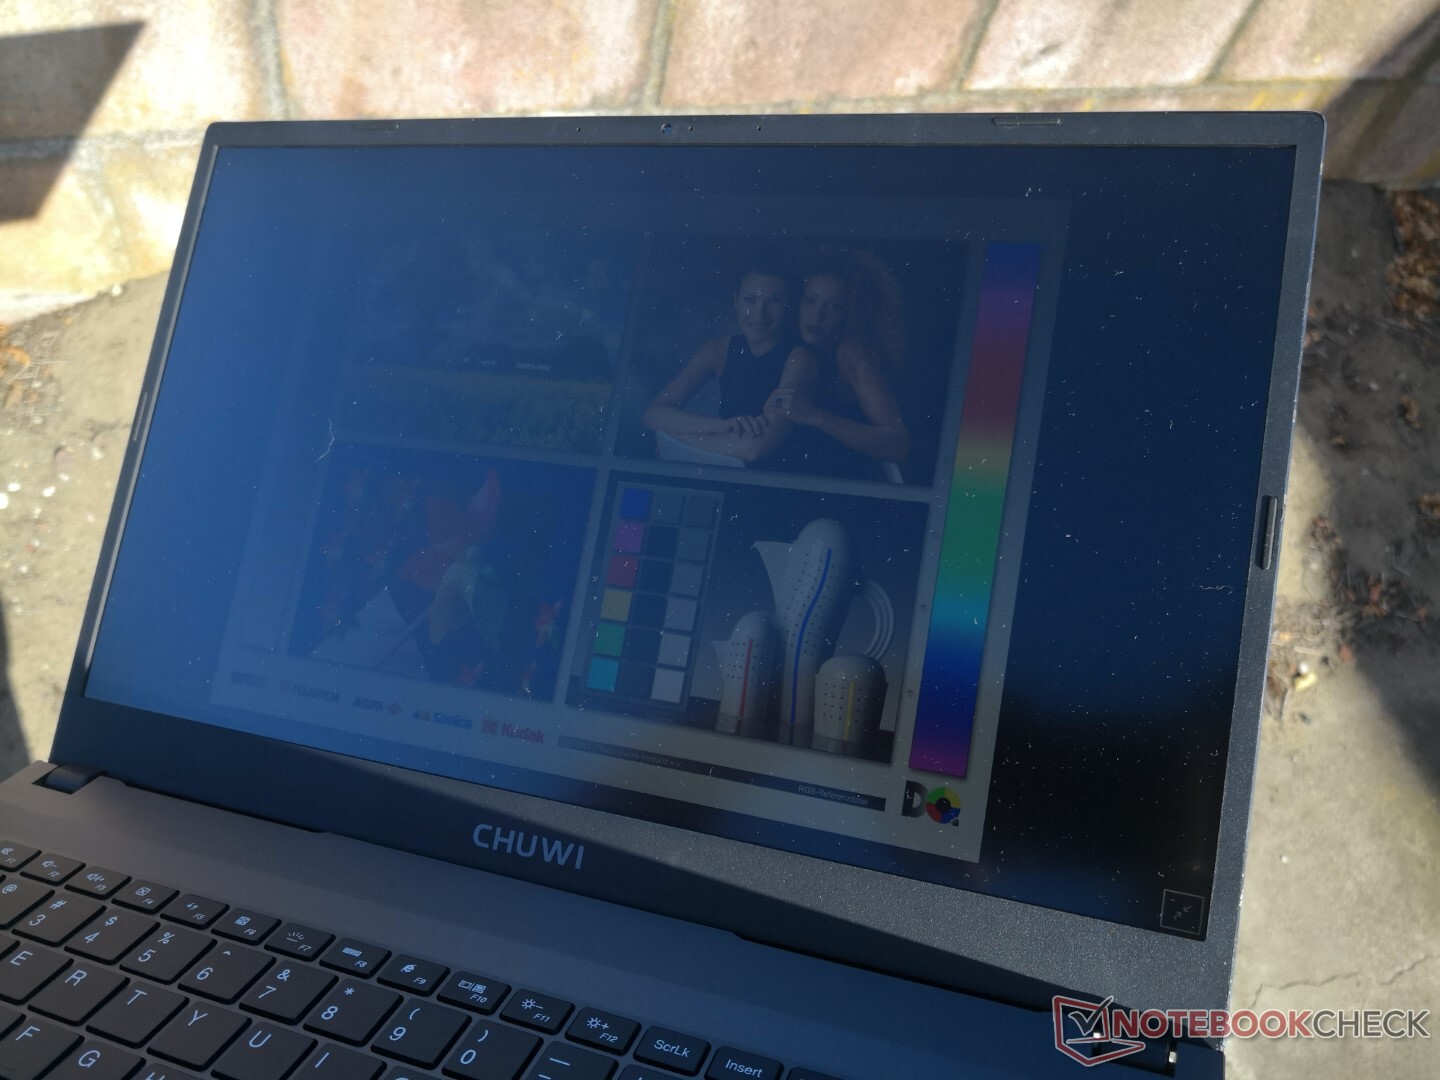
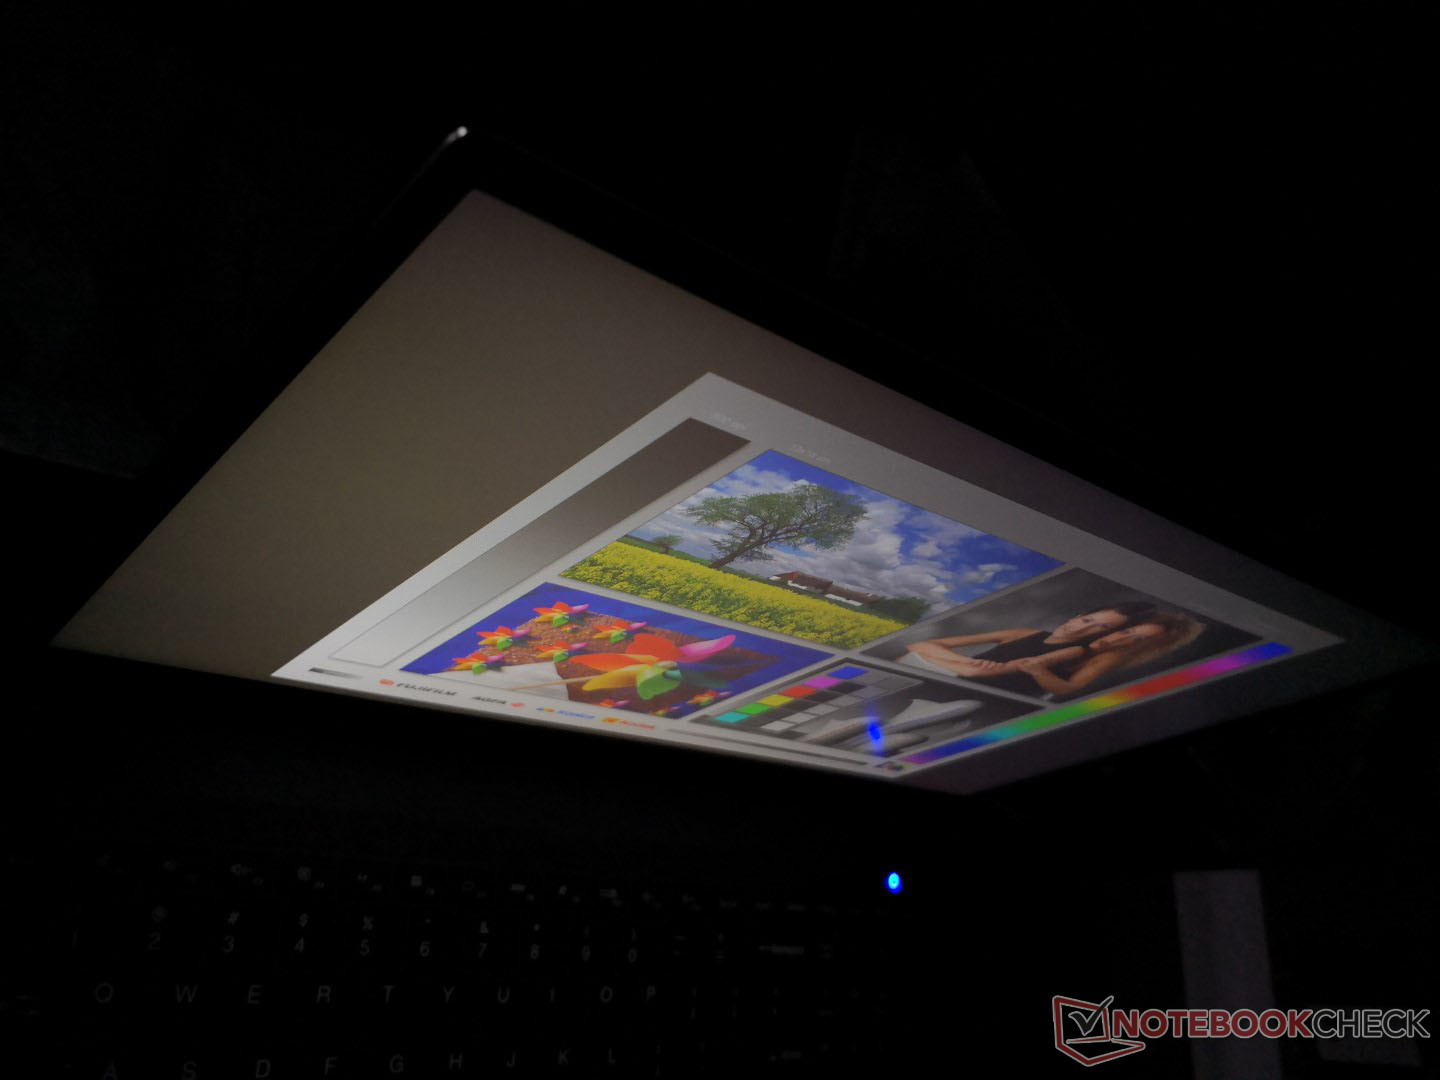
户外能见度最好是在阴暗处,因为任何更亮的东西都会冲淡颜色和文字。这并不是说显示屏很暗淡,因为它对室内条件来说足够明亮,但像XPS 15这样价格较高的替代品可以有两倍的亮度,在户外的能见度明显提高。
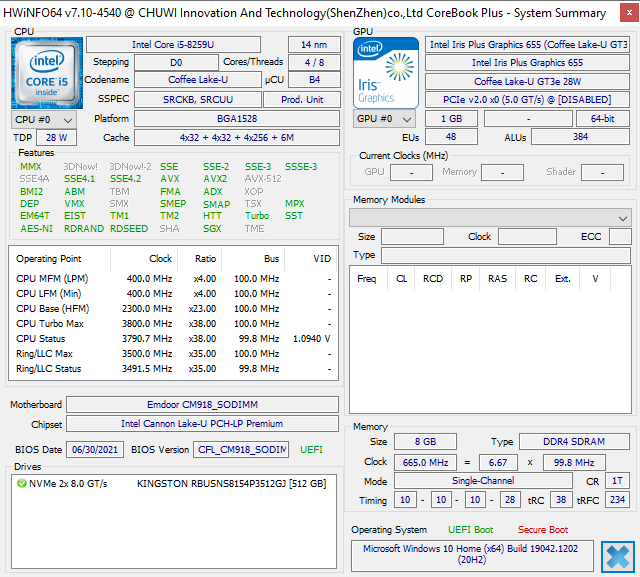
性能 - 28 W TDP酷睿i7-8259U回报
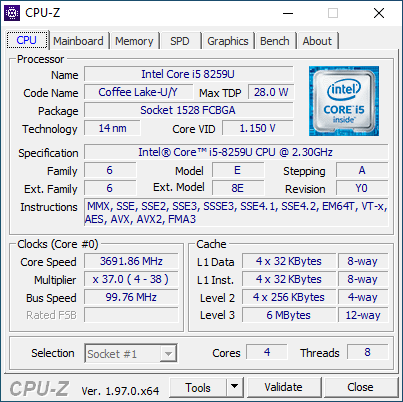
处理器
28W的 酷睿i5-8259U尽管是几年前的产品,但与较新的型号相比,它的性能良好。多线程性能超过了较新的第十代 酷睿i3-1035G1和 i7-1065G7而在单线程性能方面则落后10%至15%。
性能的可持续性非常好,在CPU利用率达到100%的情况下,长时间内没有明显的下降。
Cinebench R15 Multi Loop
Cinebench R23: Multi Core | Single Core
Cinebench R15: CPU Multi 64Bit | CPU Single 64Bit
Blender: v2.79 BMW27 CPU
7-Zip 18.03: 7z b 4 -mmt1 | 7z b 4
Geekbench 5.5: Single-Core | Multi-Core
HWBOT x265 Benchmark v2.2: 4k Preset
LibreOffice : 20 Documents To PDF
R Benchmark 2.5: Overall mean
| Cinebench R20 / CPU (Multi Core) | |
| Tuxedo Aura 15 Gen1 | |
| Honor MagicBook 15 4500U | |
| HP Pavilion 15-eg | |
| HP Pavilion x360 15-er0155ng | |
| Chuwi CoreBook X Pro | |
| Average Intel Core i5-8259U (1385 - 1567, n=5) | |
| HP 15s-fq1440ng | |
| HP 250 G7-15S40ES | |
| Dynabook Satellite Pro C50-E-105 | |
| HP Pavilion x360 15-dq0065cl | |
| Cinebench R20 / CPU (Single Core) | |
| HP Pavilion 15-eg | |
| HP Pavilion x360 15-er0155ng | |
| Tuxedo Aura 15 Gen1 | |
| HP 15s-fq1440ng | |
| Honor MagicBook 15 4500U | |
| HP 250 G7-15S40ES | |
| HP Pavilion x360 15-dq0065cl | |
| Chuwi CoreBook X Pro | |
| Average Intel Core i5-8259U (369 - 386, n=5) | |
| Dynabook Satellite Pro C50-E-105 | |
| Cinebench R23 / Multi Core | |
| Tuxedo Aura 15 Gen1 | |
| HP Pavilion 15-eg | |
| HP Pavilion x360 15-er0155ng | |
| Chuwi CoreBook X Pro | |
| Average Intel Core i5-8259U (3592 - 4025, n=5) | |
| Cinebench R23 / Single Core | |
| HP Pavilion 15-eg | |
| HP Pavilion x360 15-er0155ng | |
| Tuxedo Aura 15 Gen1 | |
| Chuwi CoreBook X Pro | |
| Average Intel Core i5-8259U (959 - 991, n=4) | |
| Cinebench R15 / CPU Multi 64Bit | |
| Tuxedo Aura 15 Gen1 | |
| Honor MagicBook 15 4500U | |
| HP Pavilion 15-eg | |
| HP Pavilion x360 15-er0155ng | |
| HP 15s-fq1440ng | |
| Chuwi CoreBook X Pro | |
| Average Intel Core i5-8259U (575 - 687, n=7) | |
| HP 250 G7-15S40ES | |
| Dynabook Satellite Pro C50-E-105 | |
| HP Pavilion x360 15-dq0065cl | |
| Cinebench R15 / CPU Single 64Bit | |
| HP Pavilion 15-eg | |
| HP Pavilion x360 15-er0155ng | |
| Tuxedo Aura 15 Gen1 | |
| HP 15s-fq1440ng | |
| HP Pavilion x360 15-dq0065cl | |
| Honor MagicBook 15 4500U | |
| HP 250 G7-15S40ES | |
| Chuwi CoreBook X Pro | |
| Average Intel Core i5-8259U (132 - 154, n=6) | |
| Dynabook Satellite Pro C50-E-105 | |
| Blender / v2.79 BMW27 CPU | |
| HP 15s-fq1440ng | |
| HP 250 G7-15S40ES | |
| Dynabook Satellite Pro C50-E-105 | |
| Average Intel Core i5-8259U (688 - 769, n=6) | |
| Chuwi CoreBook X Pro | |
| HP Pavilion x360 15-er0155ng | |
| HP Pavilion 15-eg | |
| Honor MagicBook 15 4500U | |
| Tuxedo Aura 15 Gen1 | |
| 7-Zip 18.03 / 7z b 4 -mmt1 | |
| HP Pavilion 15-eg | |
| HP Pavilion x360 15-er0155ng | |
| HP 15s-fq1440ng | |
| Tuxedo Aura 15 Gen1 | |
| Honor MagicBook 15 4500U | |
| HP 250 G7-15S40ES | |
| Chuwi CoreBook X Pro | |
| Average Intel Core i5-8259U (3753 - 4022, n=6) | |
| Dynabook Satellite Pro C50-E-105 | |
| 7-Zip 18.03 / 7z b 4 | |
| Tuxedo Aura 15 Gen1 | |
| Honor MagicBook 15 4500U | |
| HP Pavilion 15-eg | |
| HP Pavilion x360 15-er0155ng | |
| Average Intel Core i5-8259U (17799 - 28824, n=6) | |
| Chuwi CoreBook X Pro | |
| Dynabook Satellite Pro C50-E-105 | |
| HP 15s-fq1440ng | |
| HP 250 G7-15S40ES | |
| Geekbench 5.5 / Single-Core | |
| HP Pavilion x360 15-er0155ng | |
| HP 15s-fq1440ng | |
| Honor MagicBook 15 4500U | |
| HP 250 G7-15S40ES | |
| Tuxedo Aura 15 Gen1 | |
| Average Intel Core i5-8259U (948 - 984, n=3) | |
| Dynabook Satellite Pro C50-E-105 | |
| Geekbench 5.5 / Multi-Core | |
| Tuxedo Aura 15 Gen1 | |
| Honor MagicBook 15 4500U | |
| HP Pavilion x360 15-er0155ng | |
| HP 15s-fq1440ng | |
| Average Intel Core i5-8259U (3359 - 3839, n=3) | |
| Dynabook Satellite Pro C50-E-105 | |
| HP 250 G7-15S40ES | |
| HWBOT x265 Benchmark v2.2 / 4k Preset | |
| Tuxedo Aura 15 Gen1 | |
| Honor MagicBook 15 4500U | |
| HP Pavilion 15-eg | |
| HP Pavilion x360 15-er0155ng | |
| Chuwi CoreBook X Pro | |
| Average Intel Core i5-8259U (4.72 - 5.49, n=6) | |
| Dynabook Satellite Pro C50-E-105 | |
| HP 15s-fq1440ng | |
| HP 250 G7-15S40ES | |
| LibreOffice / 20 Documents To PDF | |
| Dynabook Satellite Pro C50-E-105 | |
| Chuwi CoreBook X Pro | |
| Average Intel Core i5-8259U (62.7 - 76, n=5) | |
| Honor MagicBook 15 4500U | |
| HP 250 G7-15S40ES | |
| Tuxedo Aura 15 Gen1 | |
| HP 15s-fq1440ng | |
| HP Pavilion x360 15-er0155ng | |
| HP Pavilion 15-eg | |
| R Benchmark 2.5 / Overall mean | |
| Dynabook Satellite Pro C50-E-105 | |
| Average Intel Core i5-8259U (0.738 - 0.818, n=5) | |
| HP 250 G7-15S40ES | |
| Chuwi CoreBook X Pro | |
| HP 15s-fq1440ng | |
| HP Pavilion x360 15-er0155ng | |
| Honor MagicBook 15 4500U | |
| Tuxedo Aura 15 Gen1 | |
| HP Pavilion 15-eg | |
* ... smaller is better
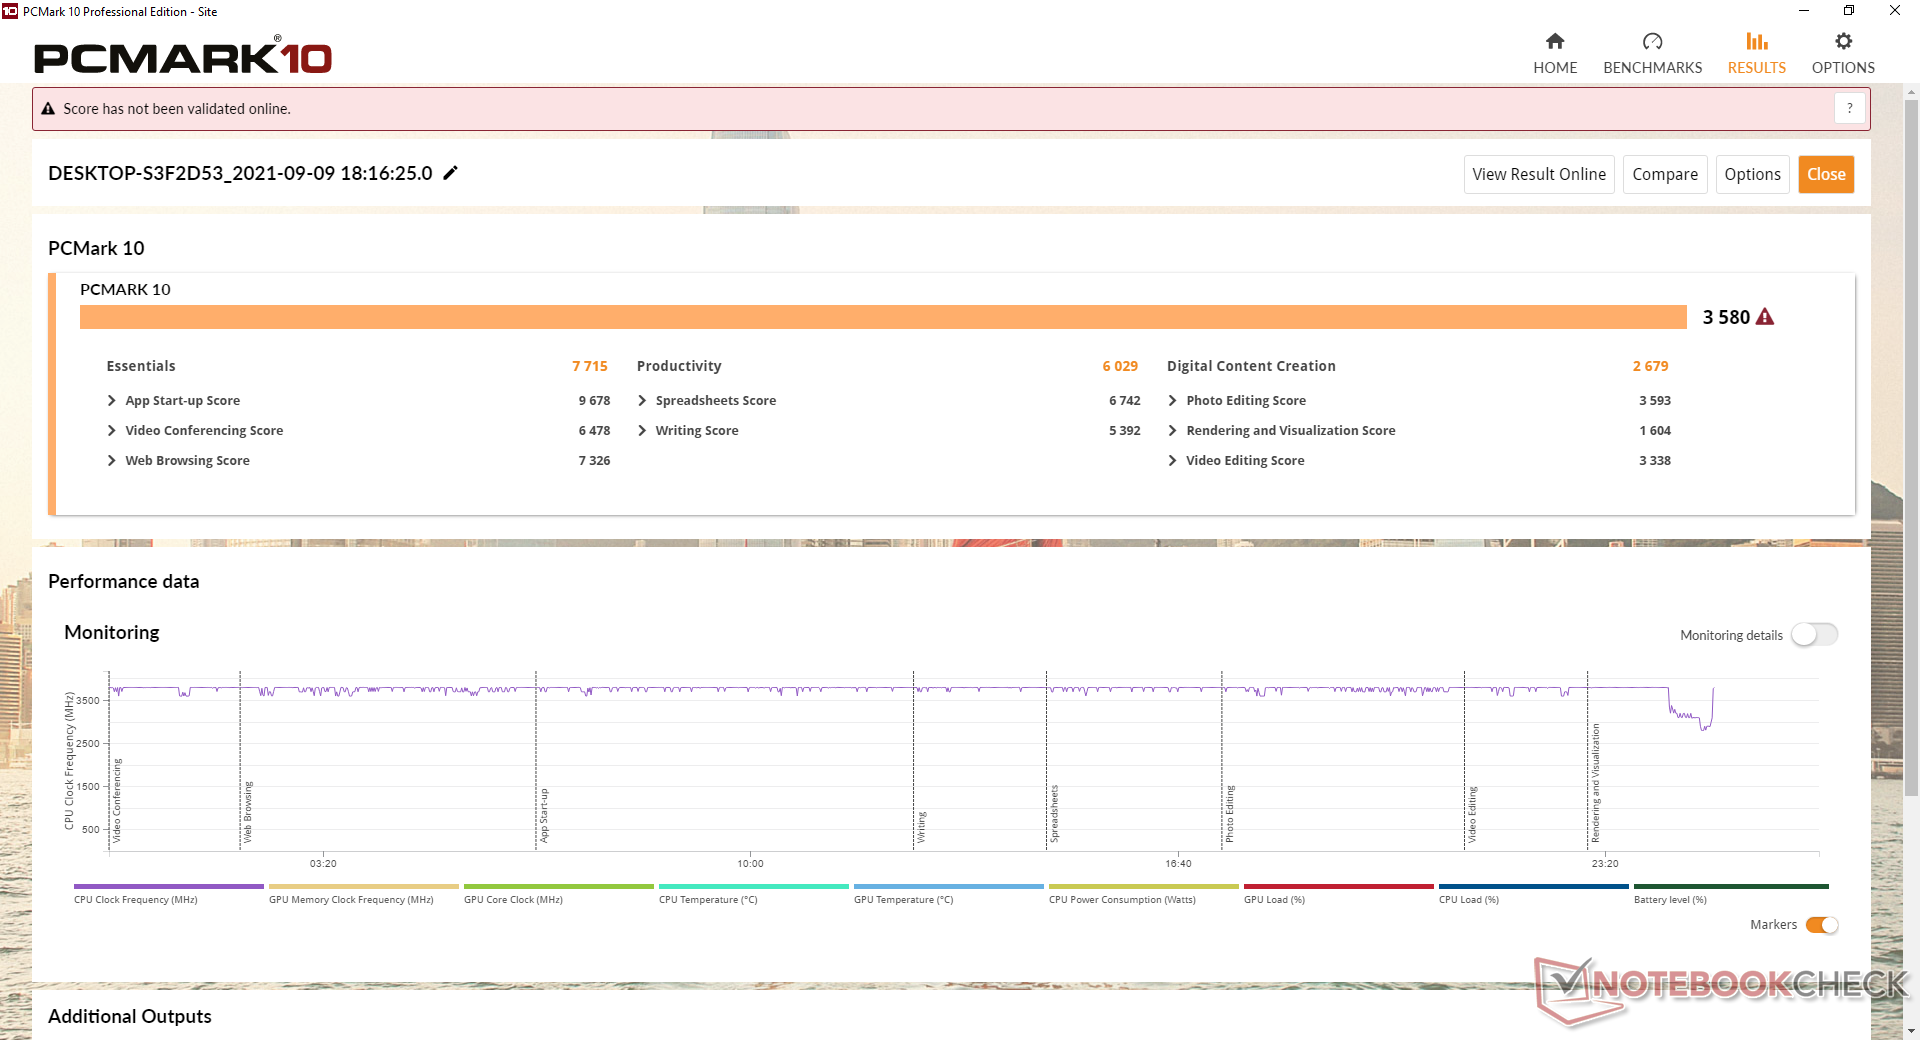
系统性能
PCMark 10的结果被我们设备中缓慢的Iris Plus Graphics 655拖累。特别是,与我们数据库中配备完全相同的GPU的普通笔记本电脑相比,我们的数字内容创作得分比它应该达到的水平低17%左右。
| PCMark 10 / Score | |
| Asus VivoBook S15 D533UA | |
| Tuxedo Aura 15 Gen1 | |
| Dell XPS 15 9500 Core i5 | |
| Honor MagicBook 15 | |
| Average Intel Core i5-8259U, Intel Iris Plus Graphics 655 (3284 - 4132, n=6) | |
| Chuwi CoreBook X Pro | |
| Teclast TBOLT F15 Pro | |
| PCMark 10 / Essentials | |
| Dell XPS 15 9500 Core i5 | |
| Tuxedo Aura 15 Gen1 | |
| Asus VivoBook S15 D533UA | |
| Teclast TBOLT F15 Pro | |
| Average Intel Core i5-8259U, Intel Iris Plus Graphics 655 (7364 - 8351, n=6) | |
| Honor MagicBook 15 | |
| Chuwi CoreBook X Pro | |
| PCMark 10 / Productivity | |
| Asus VivoBook S15 D533UA | |
| Tuxedo Aura 15 Gen1 | |
| Dell XPS 15 9500 Core i5 | |
| Chuwi CoreBook X Pro | |
| Average Intel Core i5-8259U, Intel Iris Plus Graphics 655 (4390 - 6400, n=6) | |
| Honor MagicBook 15 | |
| Teclast TBOLT F15 Pro | |
| PCMark 10 / Digital Content Creation | |
| Asus VivoBook S15 D533UA | |
| Tuxedo Aura 15 Gen1 | |
| Honor MagicBook 15 | |
| Average Intel Core i5-8259U, Intel Iris Plus Graphics 655 (2679 - 3902, n=6) | |
| Dell XPS 15 9500 Core i5 | |
| Chuwi CoreBook X Pro | |
| Teclast TBOLT F15 Pro | |
| PCMark 10 Score | 3580 points | |
Help | ||
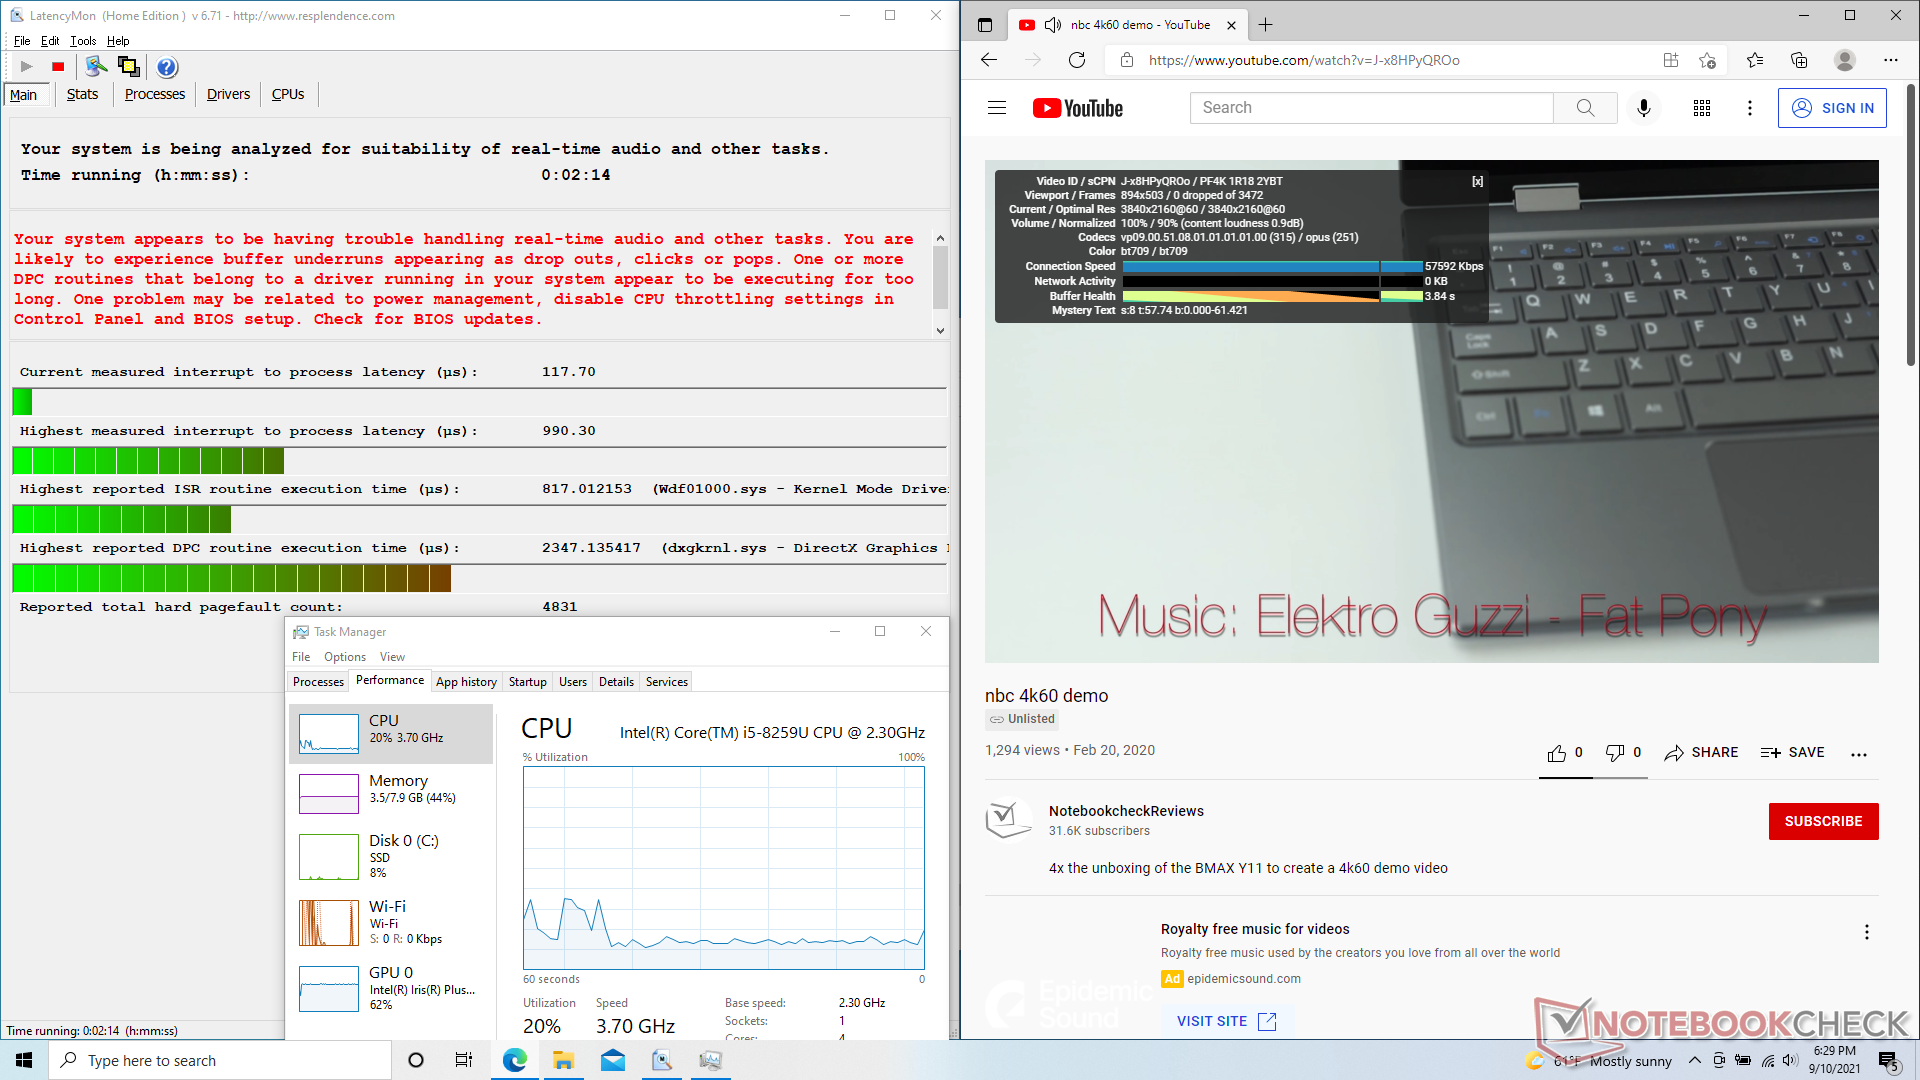
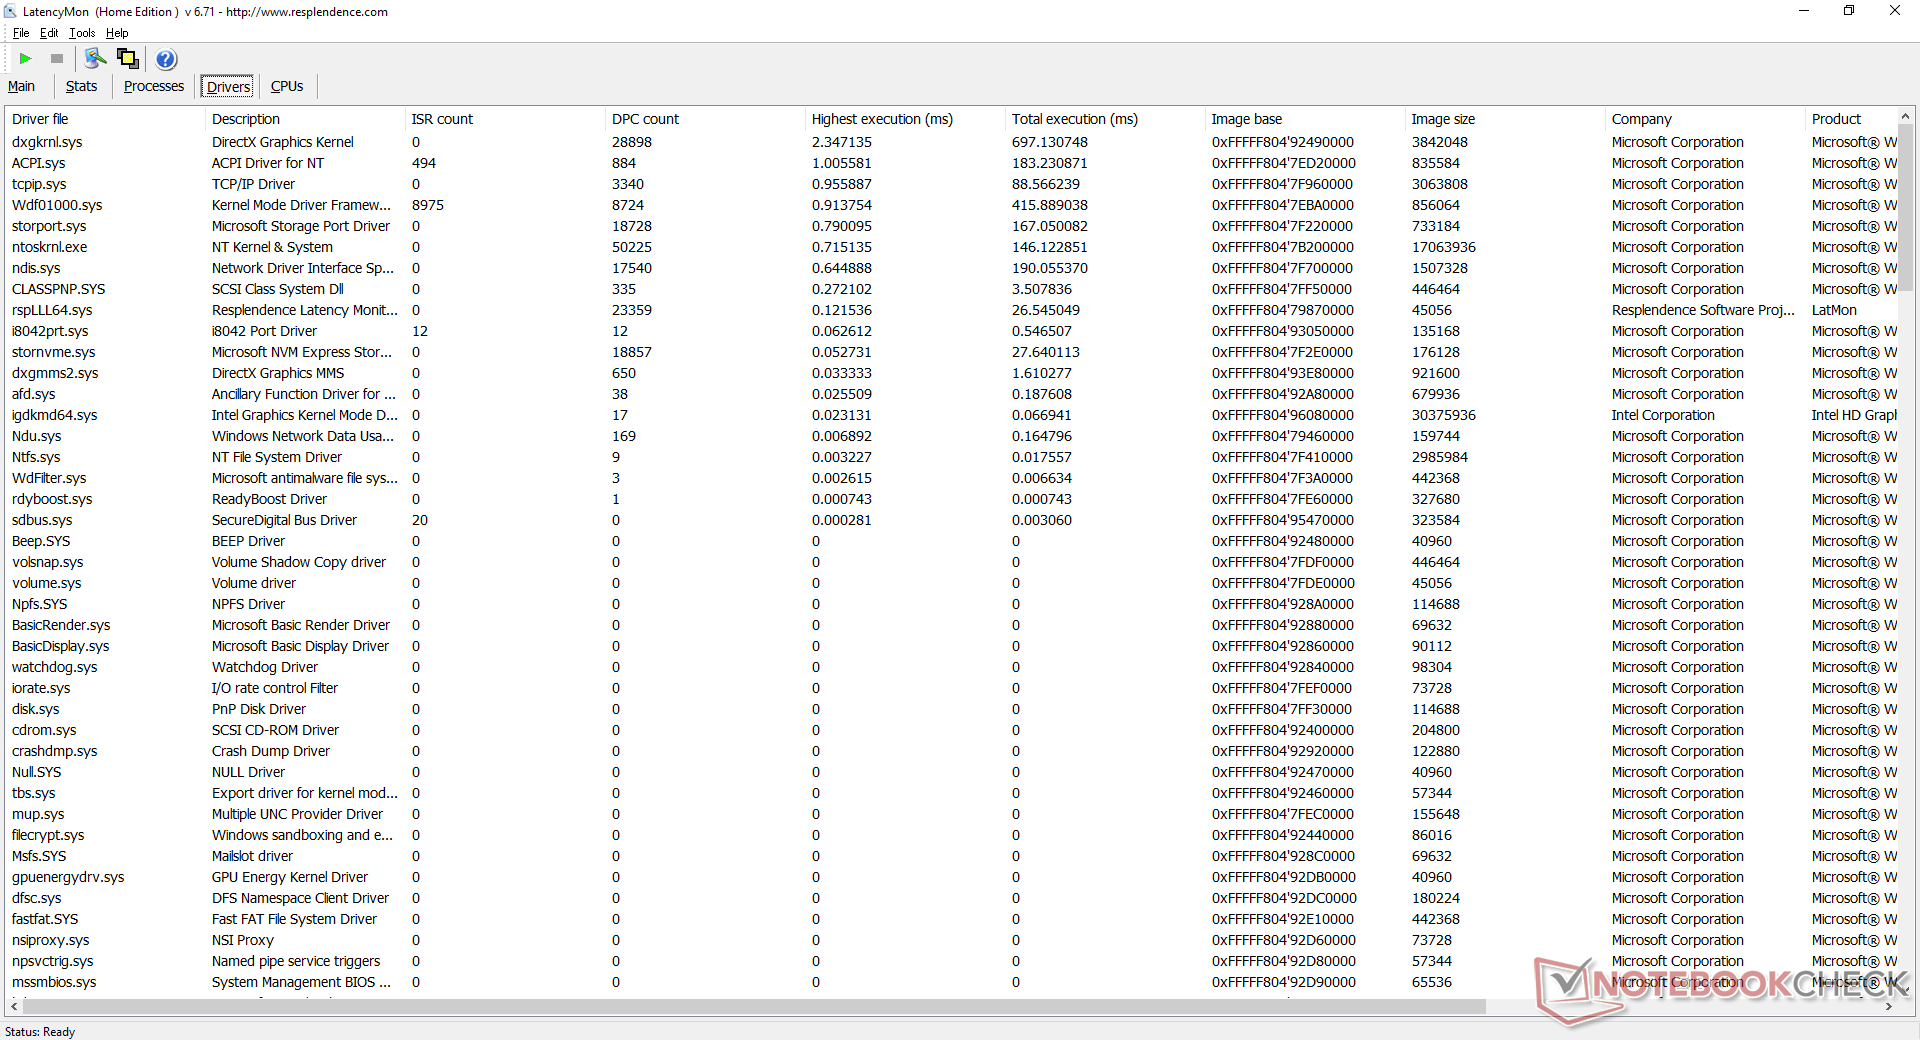
DPC延时
LatencyMon显示在我们的主页上打开多个标签时有延迟问题。尽管我们的Iris Plus Graphics 655的图形性能比预期的要慢,但在60 FPS下的4K UHD视频播放还是很流畅,没有丢帧。
| DPC Latencies / LatencyMon - interrupt to process latency (max), Web, Youtube, Prime95 | |
| Dell XPS 15 9500 Core i5 | |
| Honor MagicBook 15 | |
| Teclast TBOLT F15 Pro | |
| Chuwi CoreBook X Pro | |
| Asus VivoBook S15 D533UA | |
| Tuxedo Aura 15 Gen1 | |
* ... smaller is better
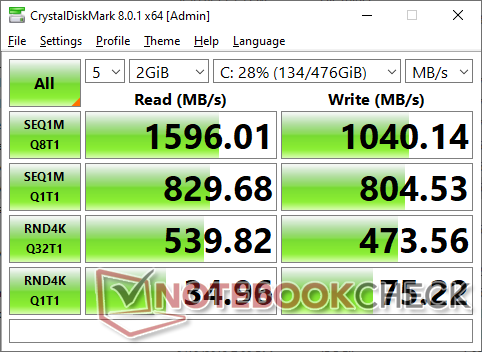
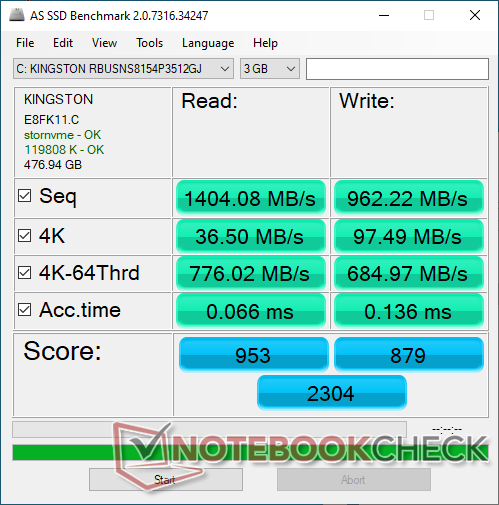
存储设备 - 多达2个M.2 2280固态硬盘
根据我们自己的测试和基准,我们的测试装置配备了一个预算的512GB金士顿NVMe固态硬盘,连续读取和写入速度分别高达约1600MB/s和约1000MB/s。更快的NVMe驱动器是存在的,但该系统只能支持到PCI x2而不是x4的速度,考虑到价格、ULV处理器和图形,这是可以接受的。如果安装第二个驱动器,请记住,它必须是M.2 SATA III驱动器。
| Chuwi CoreBook X Pro Kingston RBUSNS8154P3512GJ | Teclast TBOLT F15 Pro Teclast BD256GB | Asus VivoBook S15 D533UA WDC PC SN530 SDBPNPZ-1T00 | Honor MagicBook 15 Samsung SSD PM981a MZVLB256HBHQ | Dell XPS 15 9500 Core i5 Toshiba KBG40ZNS256G NVMe | |
|---|---|---|---|---|---|
| AS SSD | -54% | 54% | 33% | -35% | |
| Seq Read (MB/s) | 1404 | 523 -63% | 2082 48% | 2830 102% | 1423 1% |
| Seq Write (MB/s) | 962 | 443 -54% | 1844 92% | 2187 127% | 766 -20% |
| 4K Read (MB/s) | 36.5 | 23.12 -37% | 44.33 21% | 45.36 24% | 42.21 16% |
| 4K Write (MB/s) | 97.5 | 97 -1% | 157.5 62% | 88.6 -9% | 74.8 -23% |
| 4K-64 Read (MB/s) | 776 | 202.4 -74% | 1039 34% | 732 -6% | 973 25% |
| 4K-64 Write (MB/s) | 685 | 264.1 -61% | 1556 127% | 1199 75% | 218.8 -68% |
| Access Time Read * (ms) | 0.066 | 0.122 -85% | 0.05 24% | 0.055 17% | 0.125 -89% |
| Access Time Write * (ms) | 0.136 | 0.171 -26% | 0.065 52% | 0.037 73% | 0.552 -306% |
| Score Read (Points) | 953 | 278 -71% | 1292 36% | 1060 11% | 1157 21% |
| Score Write (Points) | 879 | 405 -54% | 1898 116% | 1506 71% | 370 -58% |
| Score Total (Points) | 2304 | 830 -64% | 3845 67% | 3087 34% | 2094 -9% |
| Copy ISO MB/s (MB/s) | 961 | 1441 50% | 1151 20% | 1151 20% | |
| Copy Program MB/s (MB/s) | 442.2 | 484.9 10% | 239.3 -46% | 499.4 13% | |
| Copy Game MB/s (MB/s) | 898 | 1098 22% | 635 -29% | 733 -18% | |
| CrystalDiskMark 5.2 / 6 | -9% | 85% | 99% | 42% | |
| Write 4K (MB/s) | 52.1 | 109.4 110% | 116.8 124% | 136.1 161% | 93.3 79% |
| Read 4K (MB/s) | 27.74 | 38.89 40% | 43.92 58% | 42.88 55% | 45.9 65% |
| Write Seq (MB/s) | 799 | 405.2 -49% | 1990 149% | 2335 192% | 1211 52% |
| Read Seq (MB/s) | 814 | 529 -35% | 1959 141% | 2183 168% | 1633 101% |
| Write 4K Q32T1 (MB/s) | 306.6 | 284.2 -7% | 373.3 22% | 261.2 -15% | 273.1 -11% |
| Read 4K Q32T1 (MB/s) | 373.2 | 337.8 -9% | 524 40% | 328.1 -12% | 356 -5% |
| Write Seq Q32T1 (MB/s) | 1042 | 436.5 -58% | 1985 90% | 2348 125% | 1198 15% |
| Read Seq Q32T1 (MB/s) | 1612 | 560 -65% | 2456 52% | 3564 121% | 2269 41% |
| Total Average (Program / Settings) | -32% /
-35% | 70% /
65% | 66% /
57% | 4% /
-7% |
* ... smaller is better

Disk Throttling: DiskSpd Read Loop, Queue Depth 8
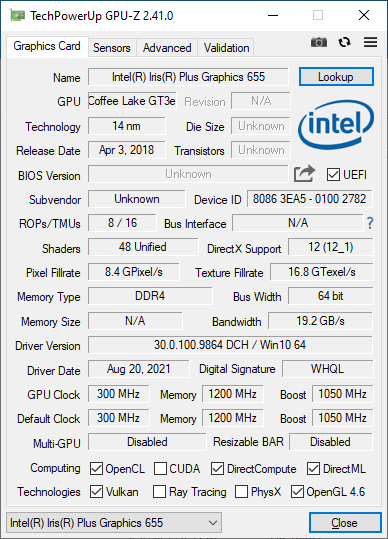
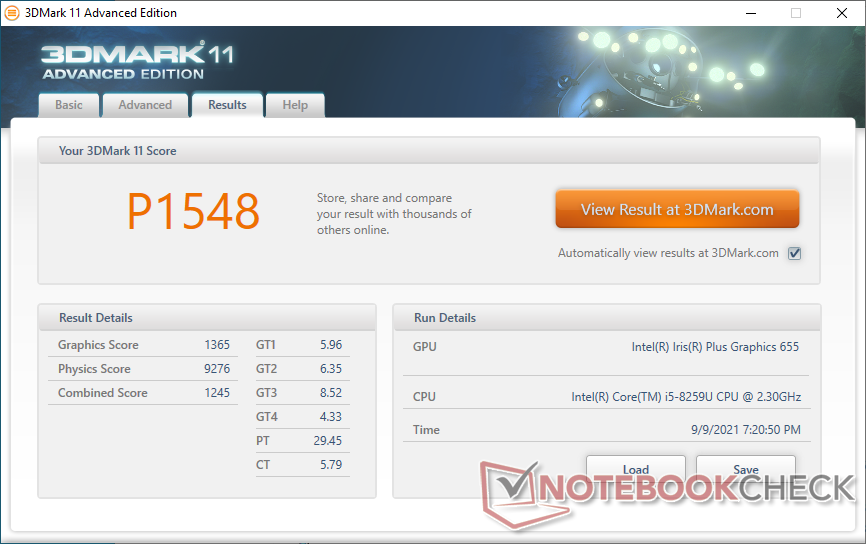
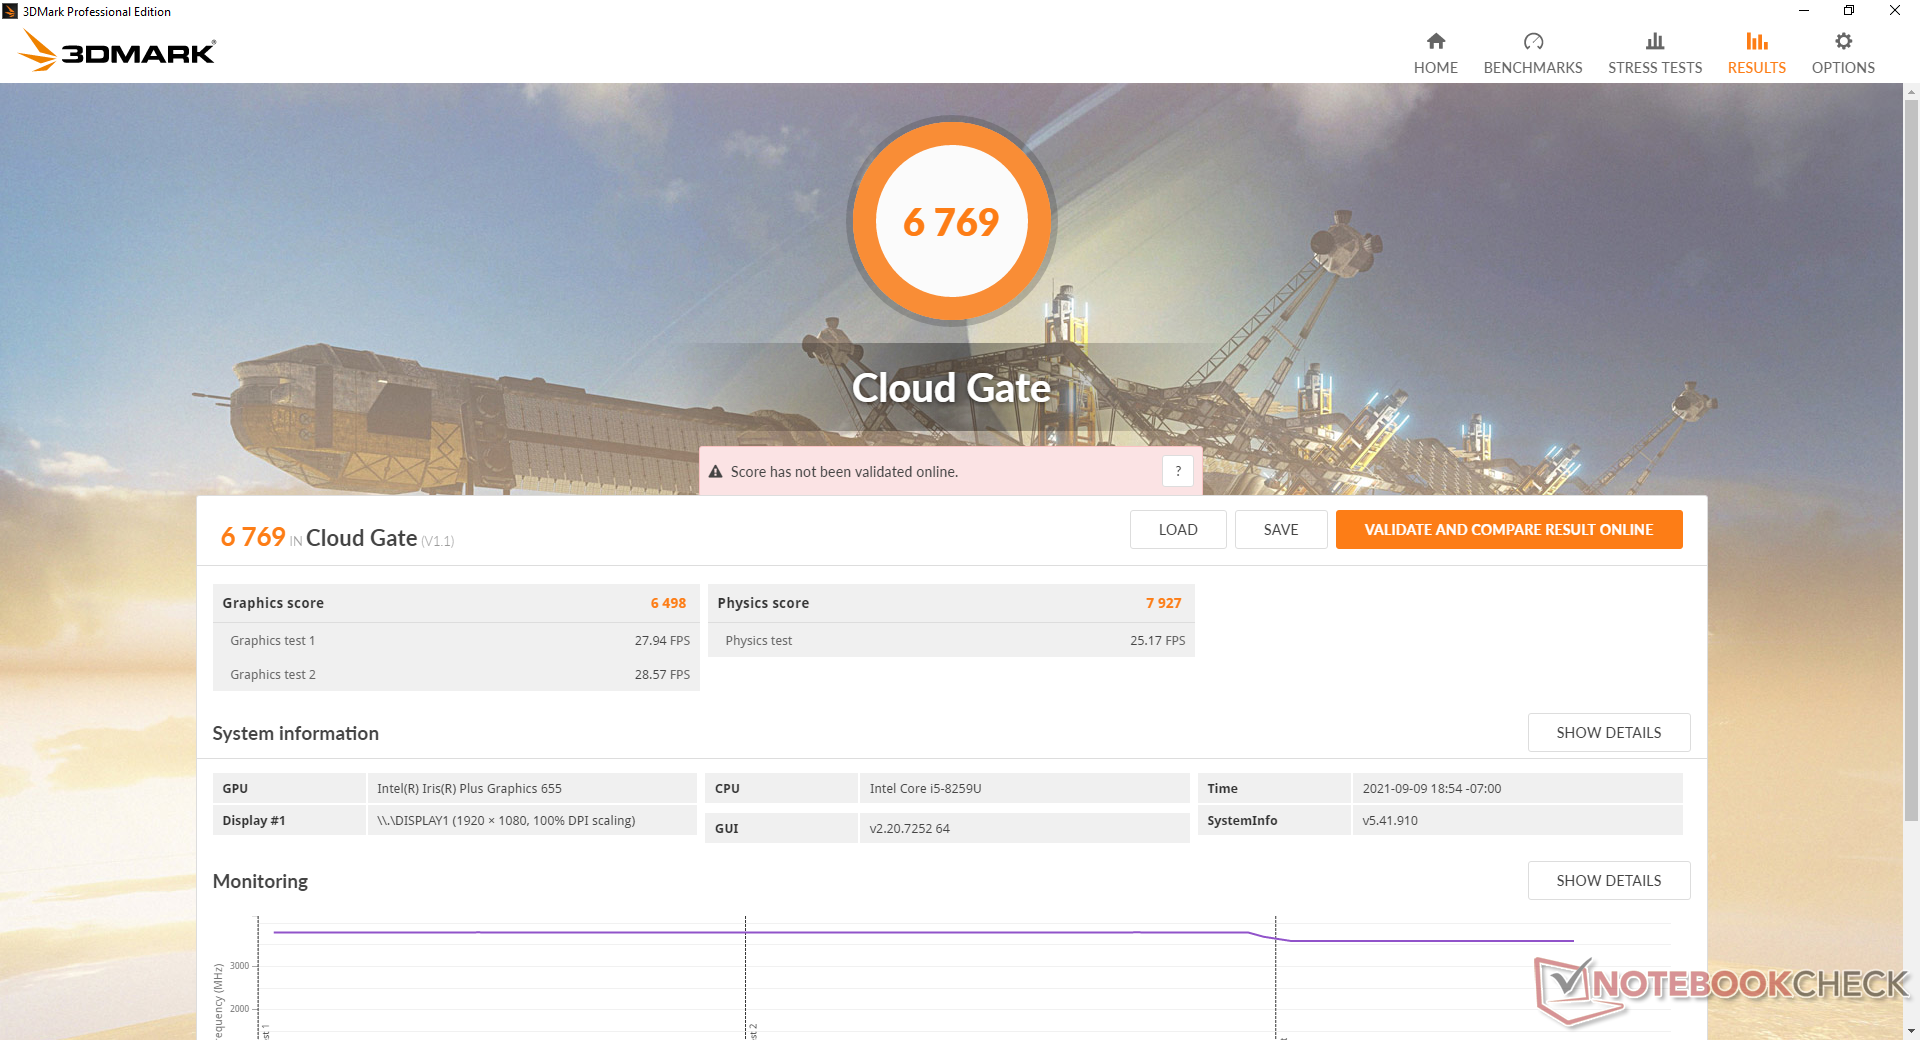
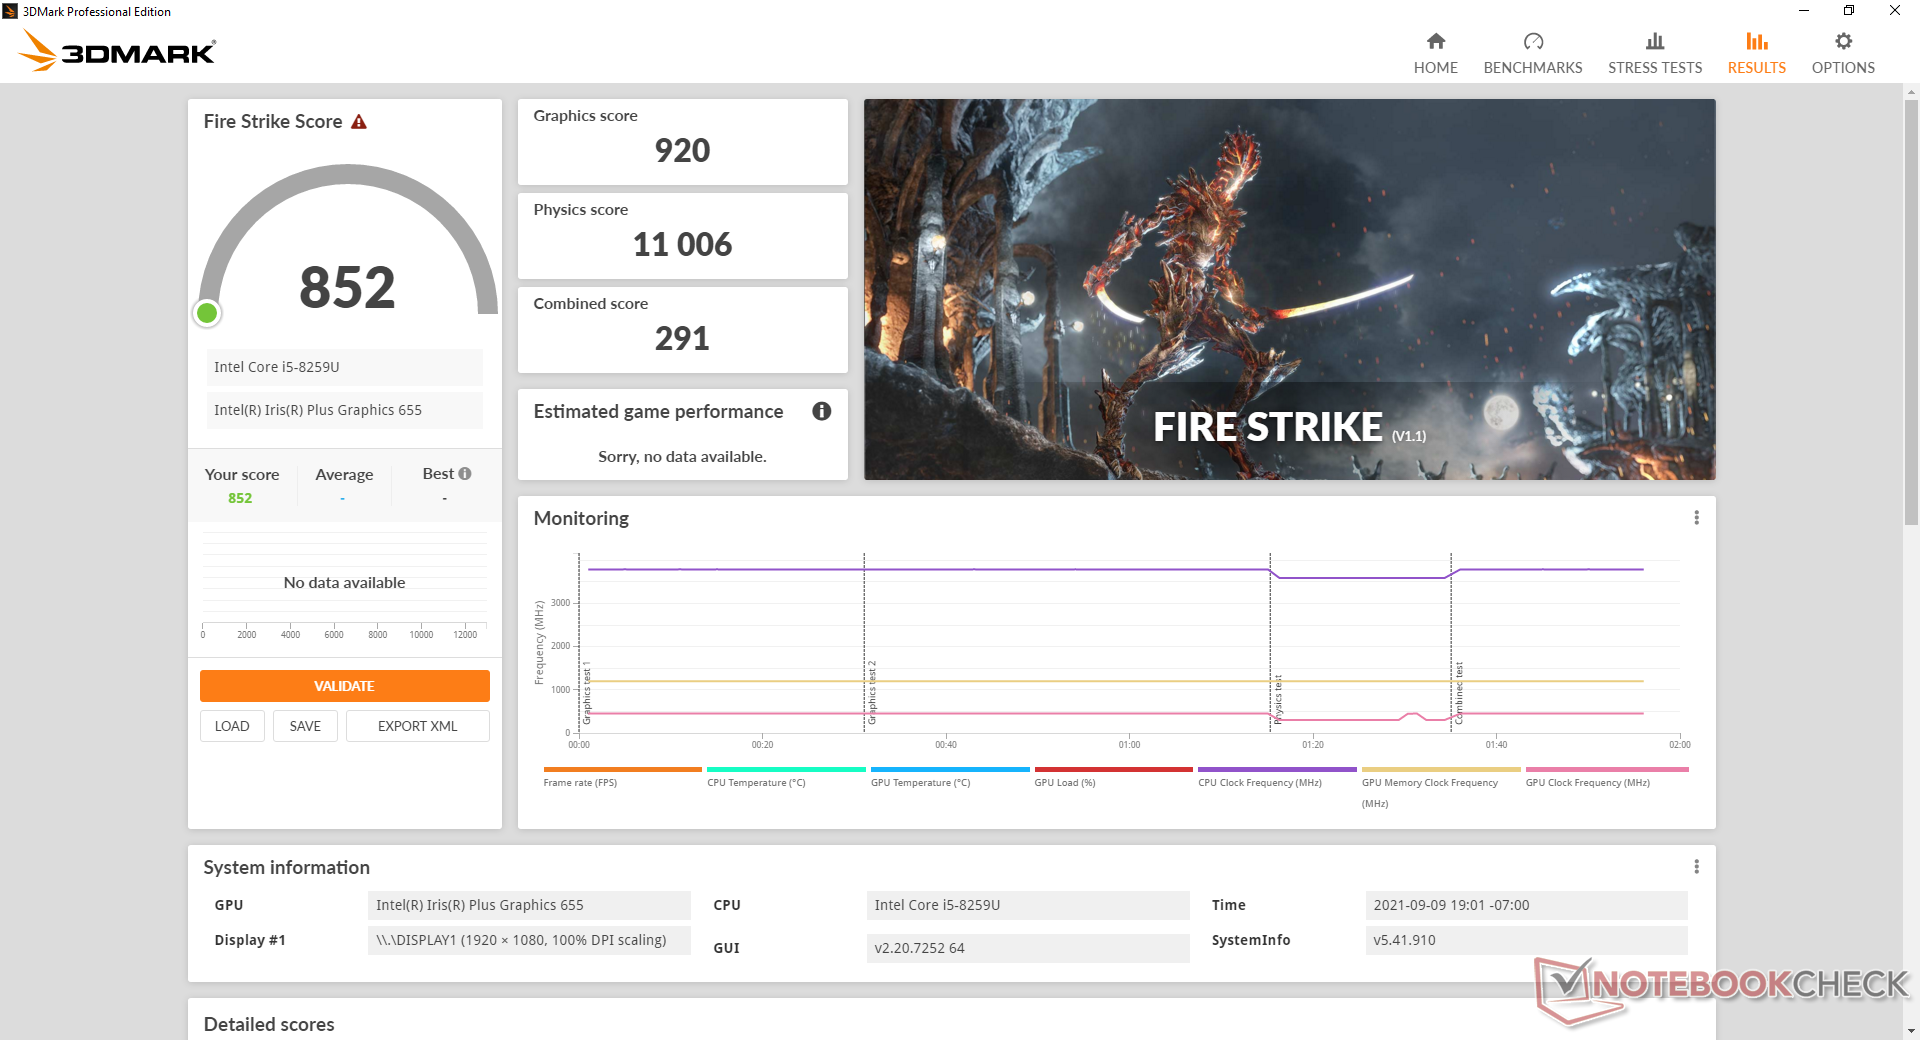
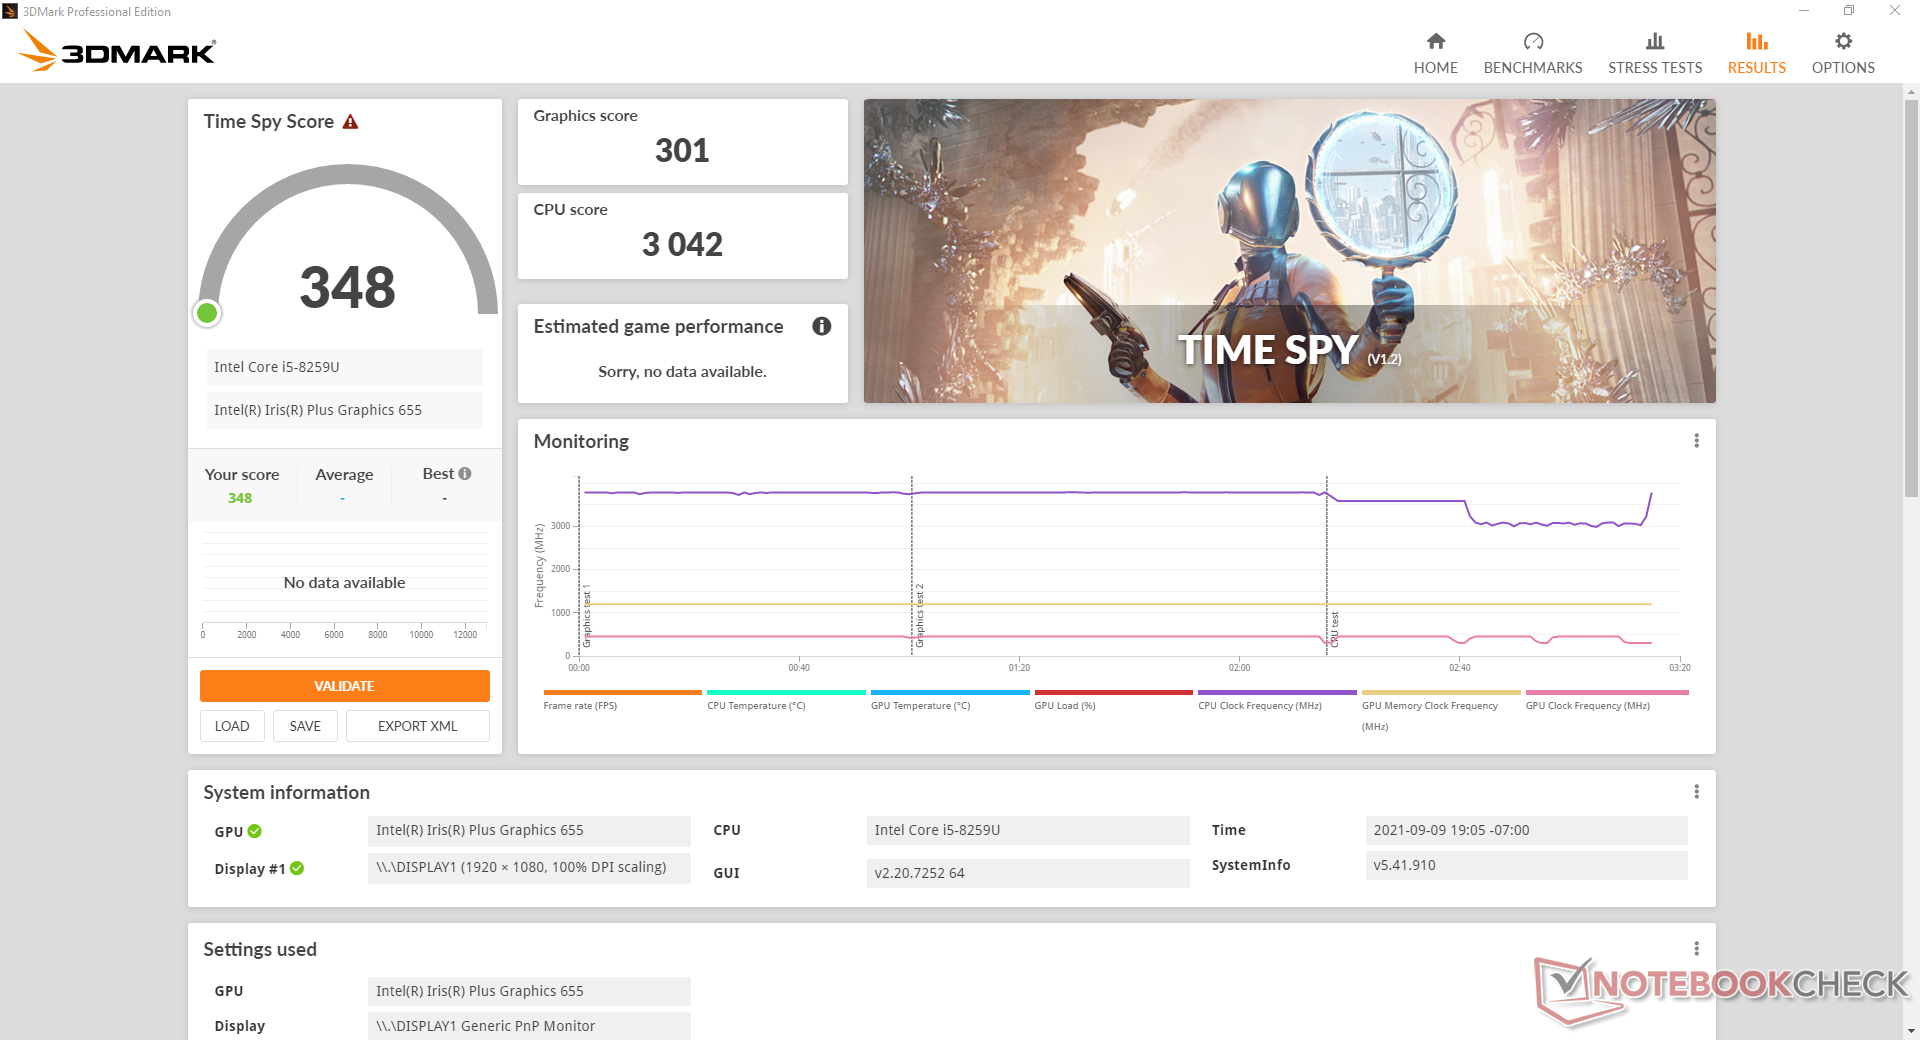
GPU性能 - 表现不佳
图形性能异常低下,比平均水平慢了近50%。Iris Plus Graphics 655在我们的数据库中。即使更新了驱动程序,我们的结果也不会改变。
| 3DMark 11 | |
| 1280x720 Performance GPU | |
| HP Pavilion 15-eg | |
| HP Pavilion x360 15-er0155ng | |
| Asus VivoBook S15 D533UA | |
| Tuxedo Aura 15 Gen1 | |
| Honor MagicBook 15 4500U | |
| Honor MagicBook 15 | |
| HP 15s-fq1440ng | |
| Average Intel Iris Plus Graphics 655 (1365 - 3081, n=8) | |
| Chuwi CoreBook X | |
| HP 250 G7-15S40ES | |
| Teclast TBOLT F15 Pro | |
| Dynabook Satellite Pro C50-E-105 | |
| HP Pavilion x360 15-dq0065cl | |
| Dell XPS 15 9500 Core i5 | |
| Chuwi CoreBook X Pro | |
| 1280x720 Performance Combined | |
| HP Pavilion 15-eg | |
| Tuxedo Aura 15 Gen1 | |
| HP Pavilion x360 15-er0155ng | |
| Asus VivoBook S15 D533UA | |
| Honor MagicBook 15 4500U | |
| HP 15s-fq1440ng | |
| Honor MagicBook 15 | |
| Average Intel Iris Plus Graphics 655 (1245 - 2688, n=8) | |
| Teclast TBOLT F15 Pro | |
| HP 250 G7-15S40ES | |
| Chuwi CoreBook X | |
| Dell XPS 15 9500 Core i5 | |
| Dynabook Satellite Pro C50-E-105 | |
| HP Pavilion x360 15-dq0065cl | |
| Chuwi CoreBook X Pro | |
| 3DMark 11 Performance | 1548 points | |
| 3DMark Cloud Gate Standard Score | 6769 points | |
| 3DMark Fire Strike Score | 852 points | |
| 3DMark Time Spy Score | 348 points | |
Help | ||
| Final Fantasy XV Benchmark - 1280x720 Lite Quality | |
| HP Pavilion 15-eg | |
| Asus VivoBook S15 D533UA | |
| HP Pavilion x360 15-er0155ng | |
| Honor MagicBook 15 4500U | |
| Average Intel Iris Plus Graphics 655 (9.11 - 18.1, n=8) | |
| Chuwi CoreBook X | |
| Teclast TBOLT F15 Pro | |
| Chuwi CoreBook X Pro | |
| low | med. | high | ultra | |
|---|---|---|---|---|
| Dota 2 Reborn (2015) | 51.4 | 37.1 | 15.8 | 13.4 |
| Final Fantasy XV Benchmark (2018) | 9.11 | |||
| X-Plane 11.11 (2018) | 13.8 | 9.75 | 8.55 |
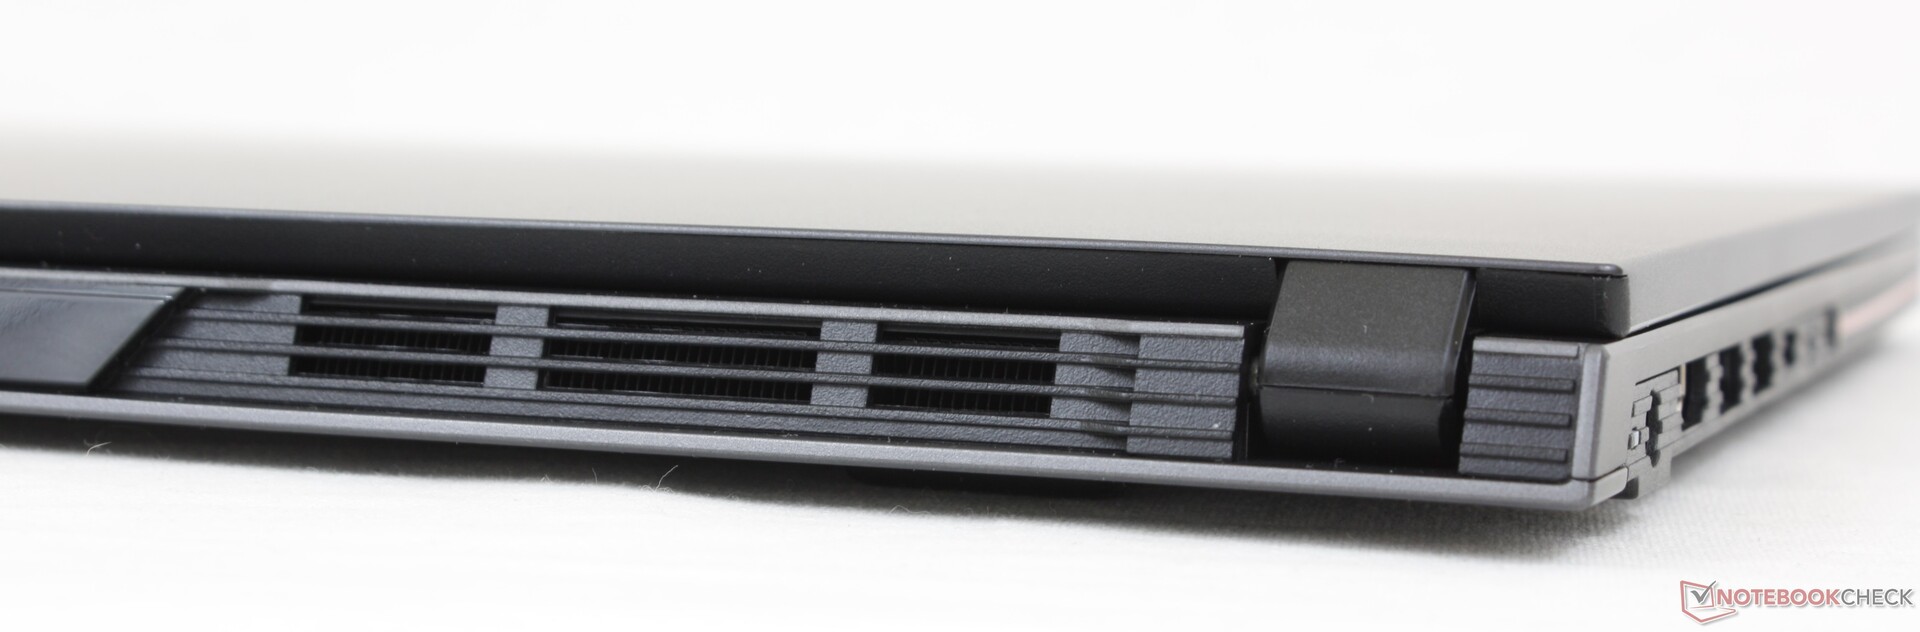
Emissions — Quiet Most of the Time
系统噪音
在浏览或流媒体等低至中度负载期间,风扇噪音几乎总是很安静。当运行3DMark 06的第一个基准场景时,风扇噪音会慢慢增加到27.9 dB(A),然后回落到一个几乎不明显的25.9 dB(A)。
当长时间运行游戏等更高要求的负载时,风扇噪音会稳步上升,直到最高达到43分贝(A),这对超极本来说并不是一个罕见的上限。除非CPU经常处于紧张的负载下,否则用户不太可能体验到这个最大值。
| Chuwi CoreBook X Pro Iris Plus Graphics 655, i5-8259U, Kingston RBUSNS8154P3512GJ | Teclast TBOLT F15 Pro UHD Graphics G1 (Ice Lake 32 EU), i3-1005G1, Teclast BD256GB | Asus VivoBook S15 D533UA Vega 8, R7 5700U, WDC PC SN530 SDBPNPZ-1T00 | Honor MagicBook 15 Vega 8, R5 3500U, Samsung SSD PM981a MZVLB256HBHQ | Dell XPS 15 9500 Core i5 UHD Graphics 630, i5-10300H, Toshiba KBG40ZNS256G NVMe | |
|---|---|---|---|---|---|
| Noise | 9% | -18% | -18% | -10% | |
| off / environment * (dB) | 24.3 | 24.2 -0% | 26 -7% | 30.7 -26% | 28 -15% |
| Idle Minimum * (dB) | 24.3 | 24.2 -0% | 26 -7% | 30.7 -26% | 28 -15% |
| Idle Average * (dB) | 24.3 | 24.2 -0% | 26 -7% | 30.7 -26% | 28 -15% |
| Idle Maximum * (dB) | 24.3 | 24.2 -0% | 28.8 -19% | 30.7 -26% | 28 -15% |
| Load Average * (dB) | 27.9 | 24.2 13% | 45 -61% | 32.7 -17% | 28 -0% |
| Load Maximum * (dB) | 43 | 25.3 41% | 45 -5% | 38.4 11% | 41.9 3% |
* ... smaller is better
Noise level
| Idle |
| 24.3 / 24.3 / 24.3 dB(A) |
| Load |
| 27.9 / 43 dB(A) |
 | ||
30 dB silent 40 dB(A) audible 50 dB(A) loud |
||
min: | ||
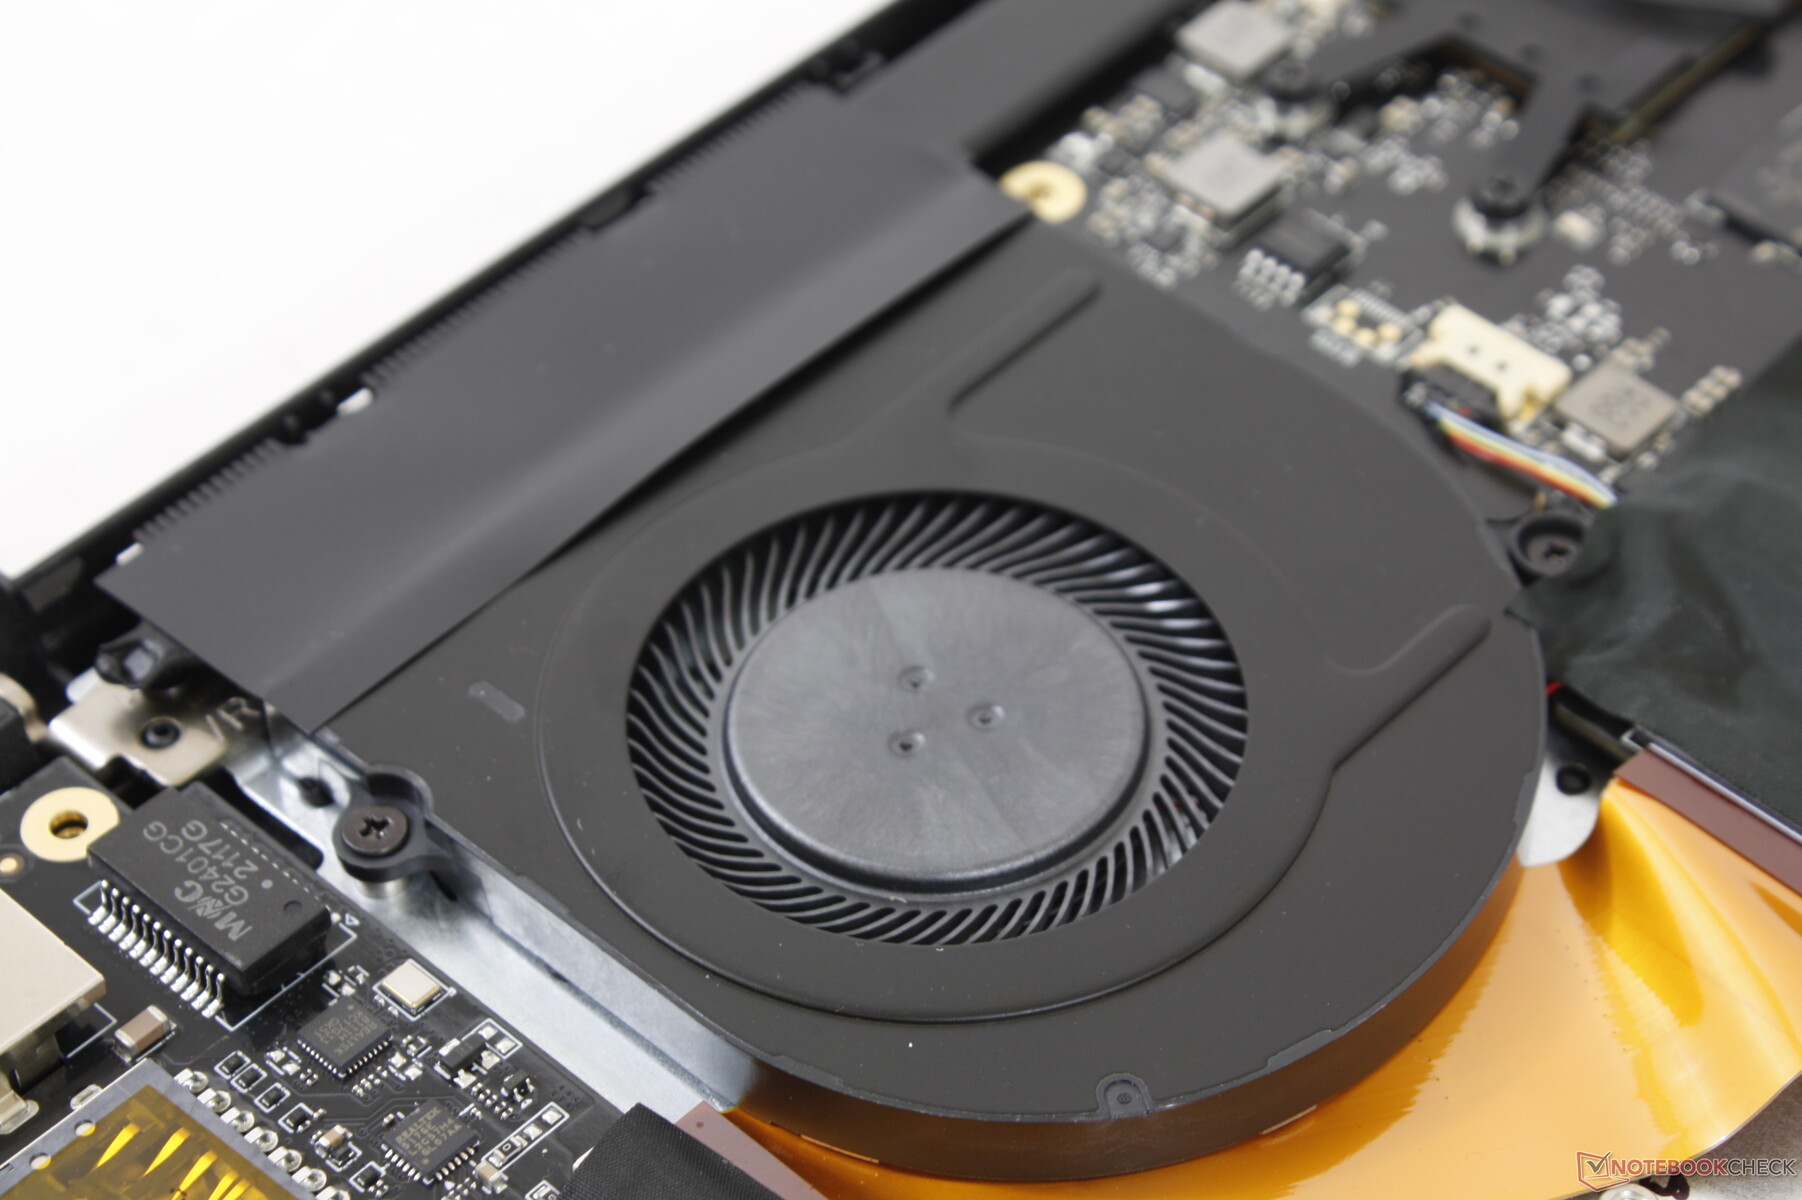
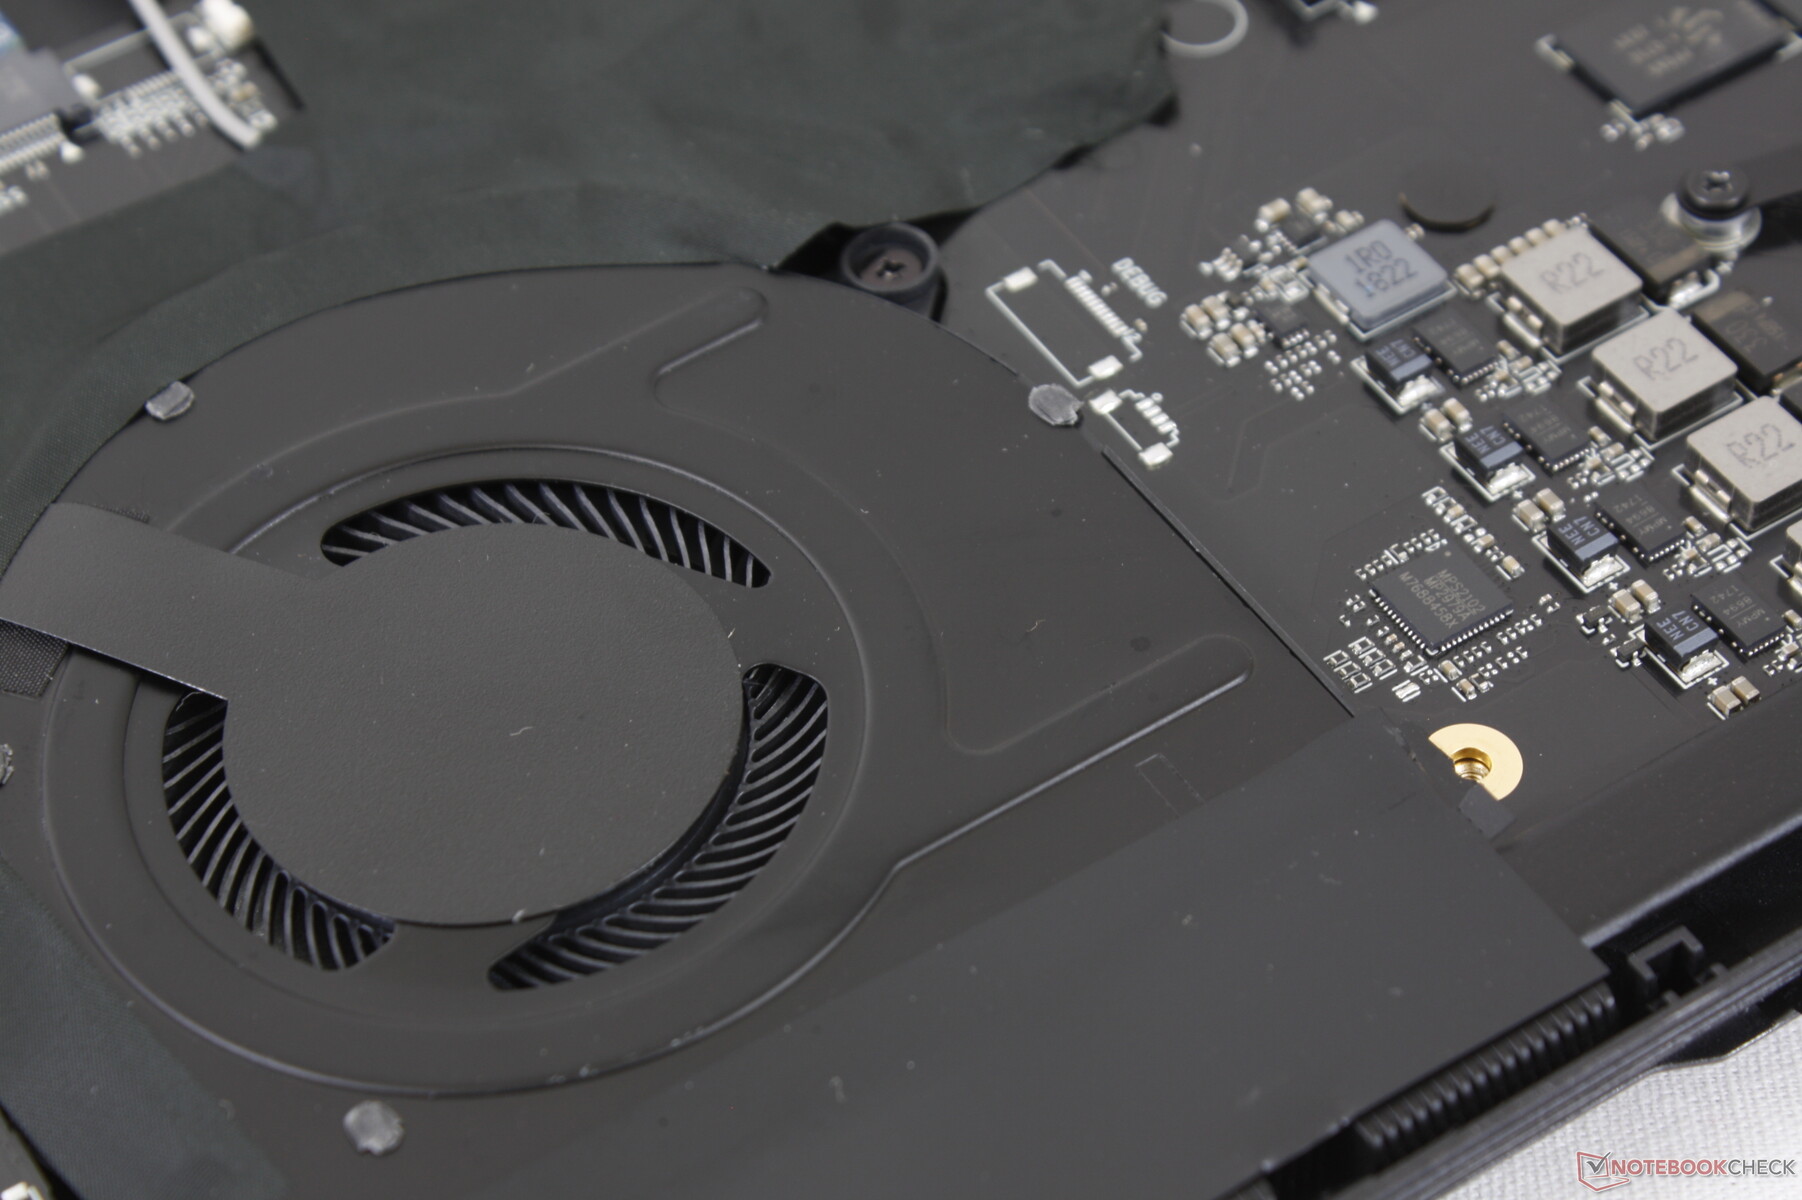
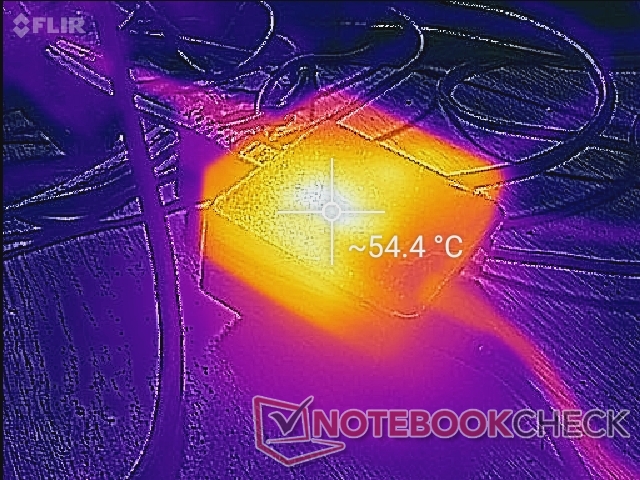
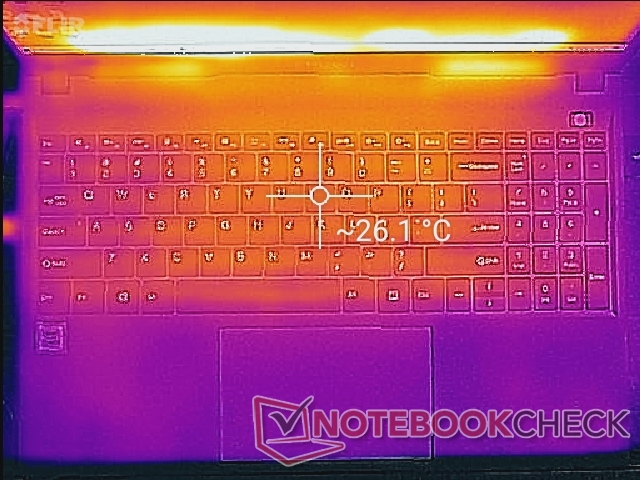
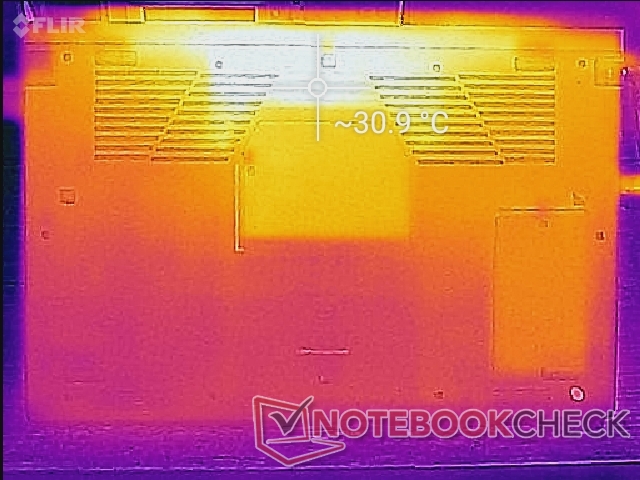
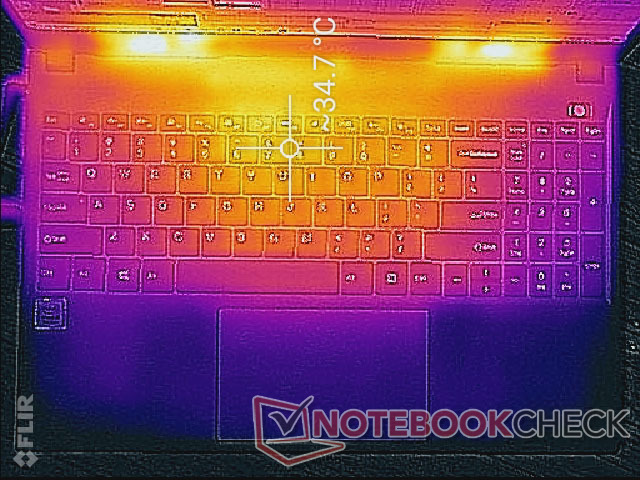
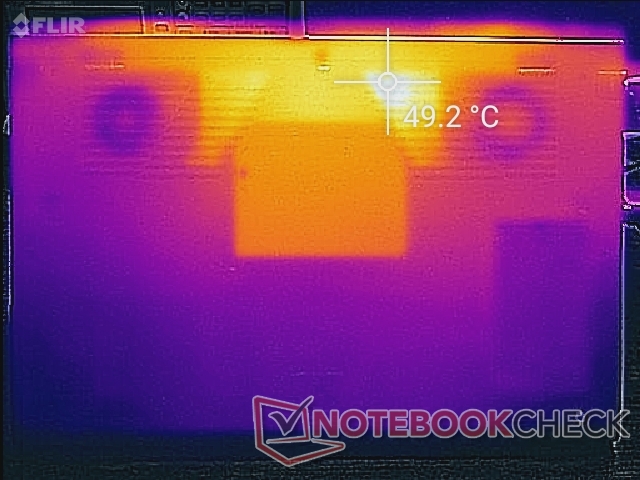
温度
无论负载多少,表面温度都不是问题,因为15.6英寸的外形尺寸和双风扇足以冷却Core-U系列处理器。机箱顶部和底部向后的小热点可以分别达到35摄氏度和50摄氏度,手不太可能碰到这些地方。
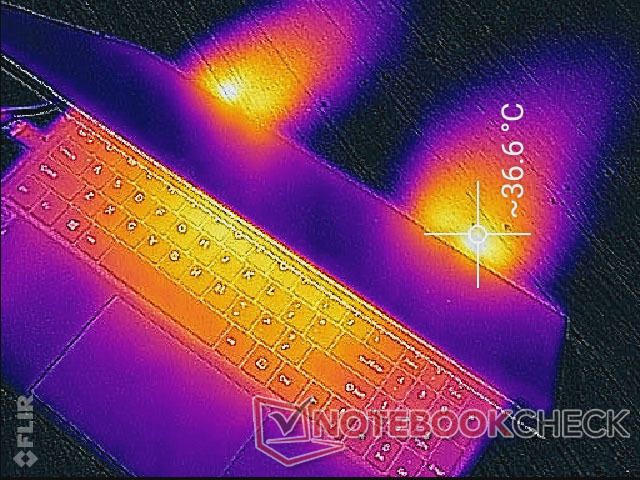
(+) The maximum temperature on the upper side is 35.6 °C / 96 F, compared to the average of 36.8 °C / 98 F, ranging from 21 to 71 °C for the class Multimedia.
(-) The bottom heats up to a maximum of 49 °C / 120 F, compared to the average of 39.1 °C / 102 F
(+) In idle usage, the average temperature for the upper side is 25.2 °C / 77 F, compared to the device average of 31.3 °C / 88 F.
(+) The palmrests and touchpad are cooler than skin temperature with a maximum of 24.2 °C / 75.6 F and are therefore cool to the touch.
(+) The average temperature of the palmrest area of similar devices was 28.7 °C / 83.7 F (+4.5 °C / 8.1 F).
压力测试
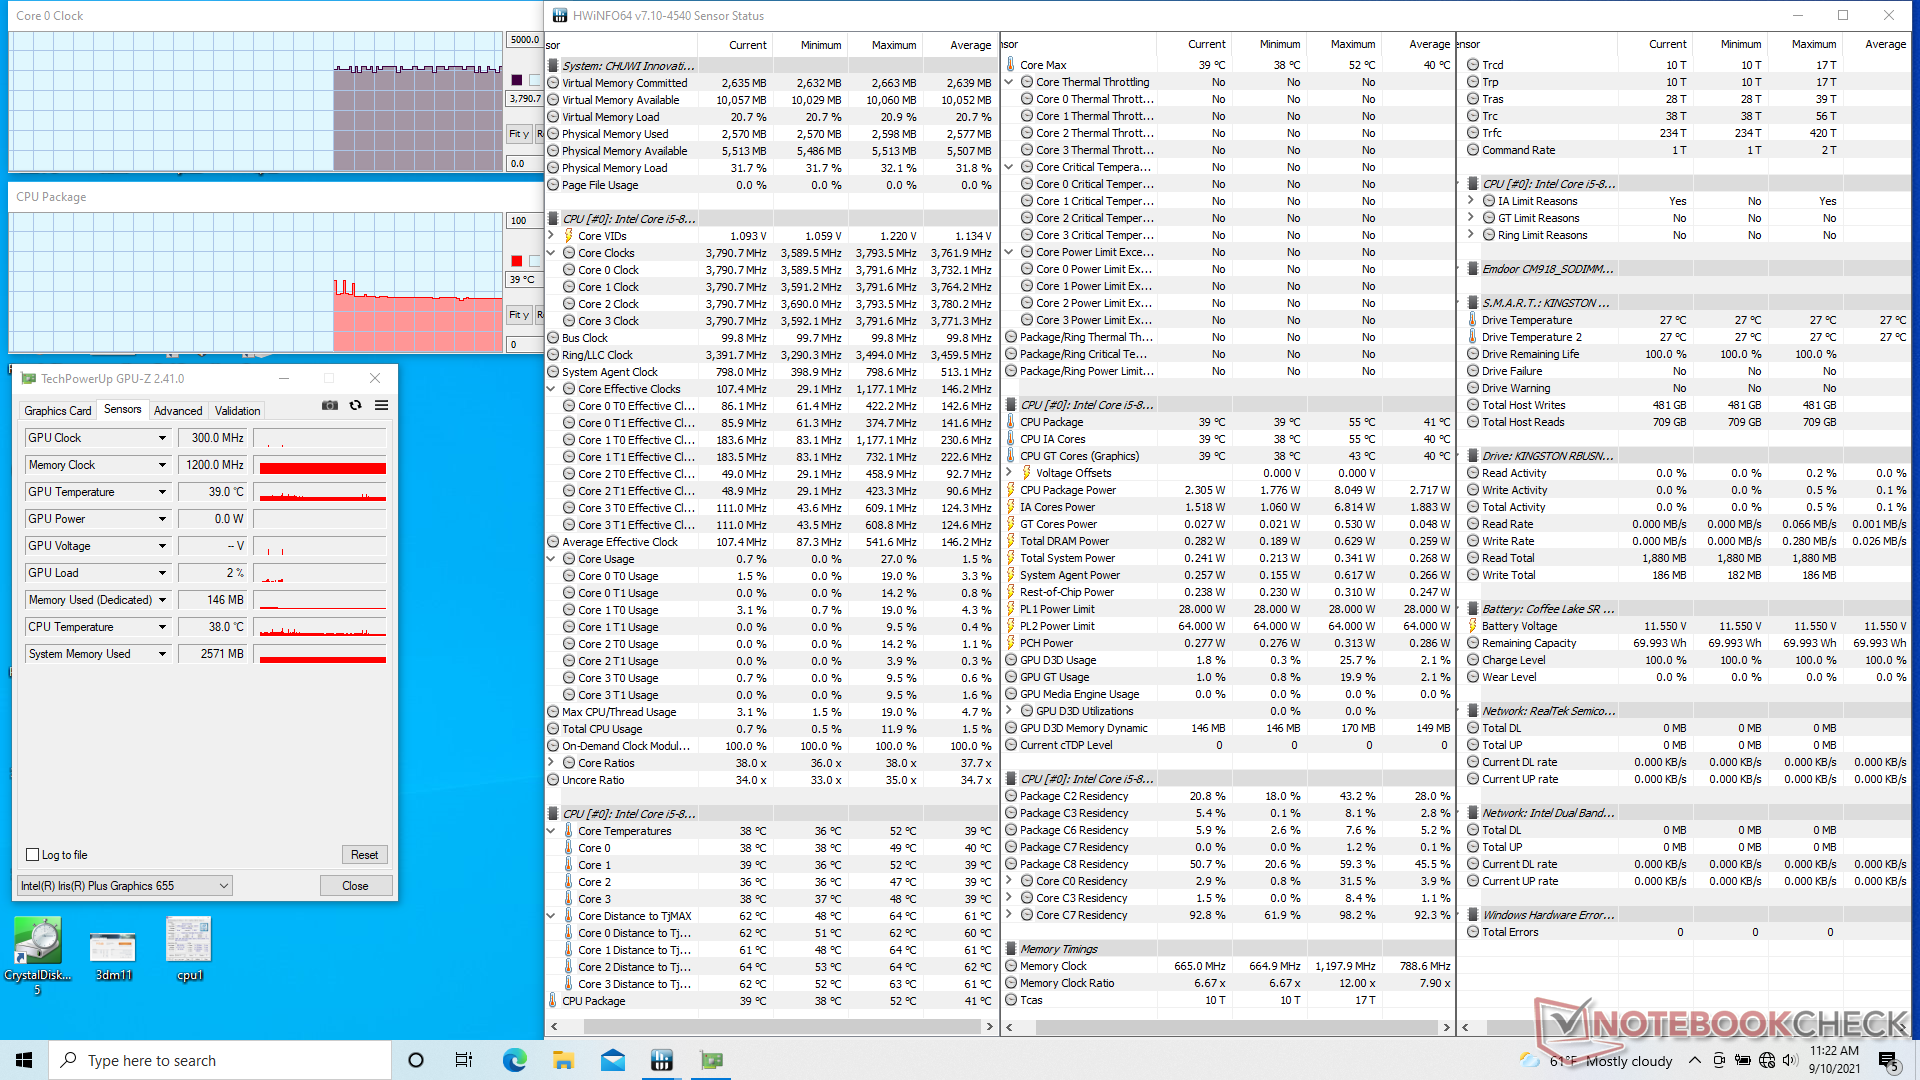
因此,Turbo Boost的可持续性很差,因为Core i5-8259U的基本时钟频率为2.3 GHz,或仅比稳定的Turbo Boost时钟频率慢100 MHz。
用电池供电运行会影响处理器的性能。在电池上进行的3DMark 11测试将返回物理和图形分数,分别为6738和1296分,而在主电源上则为9276和1365分。
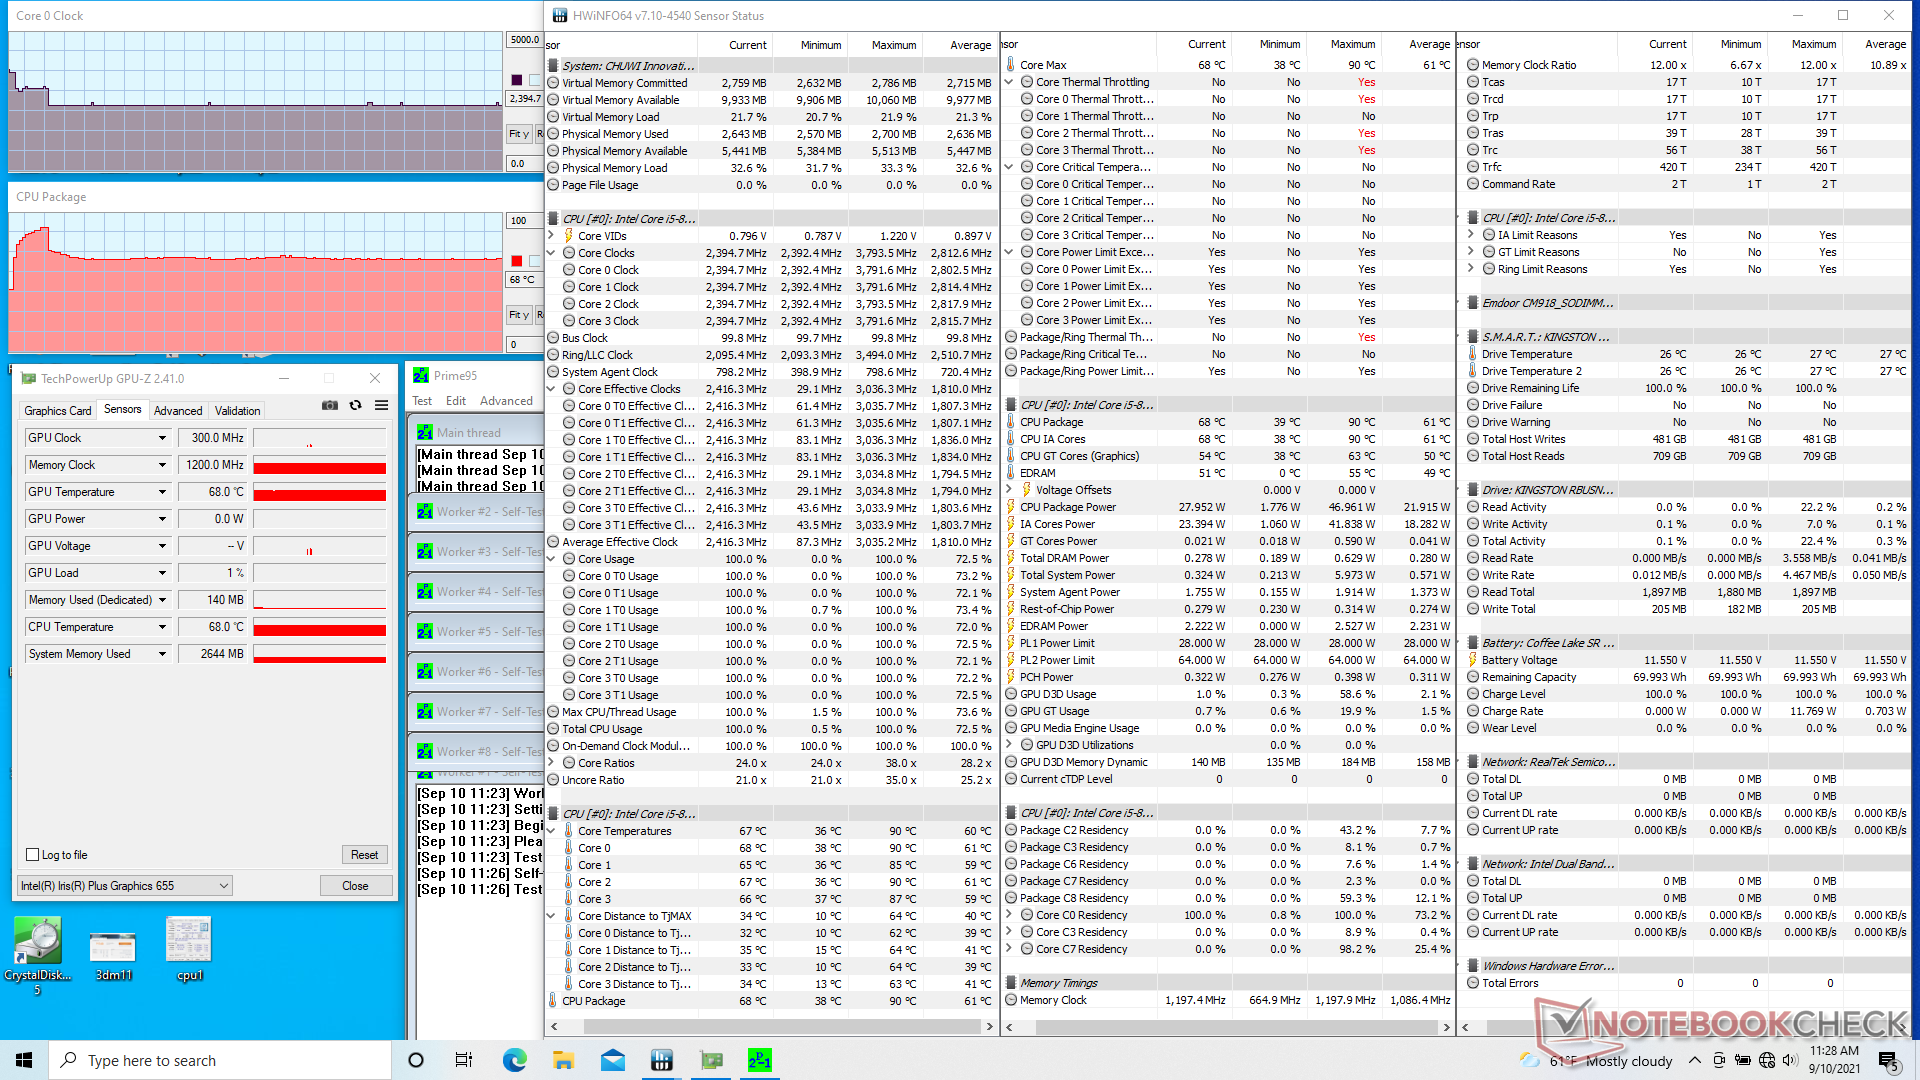
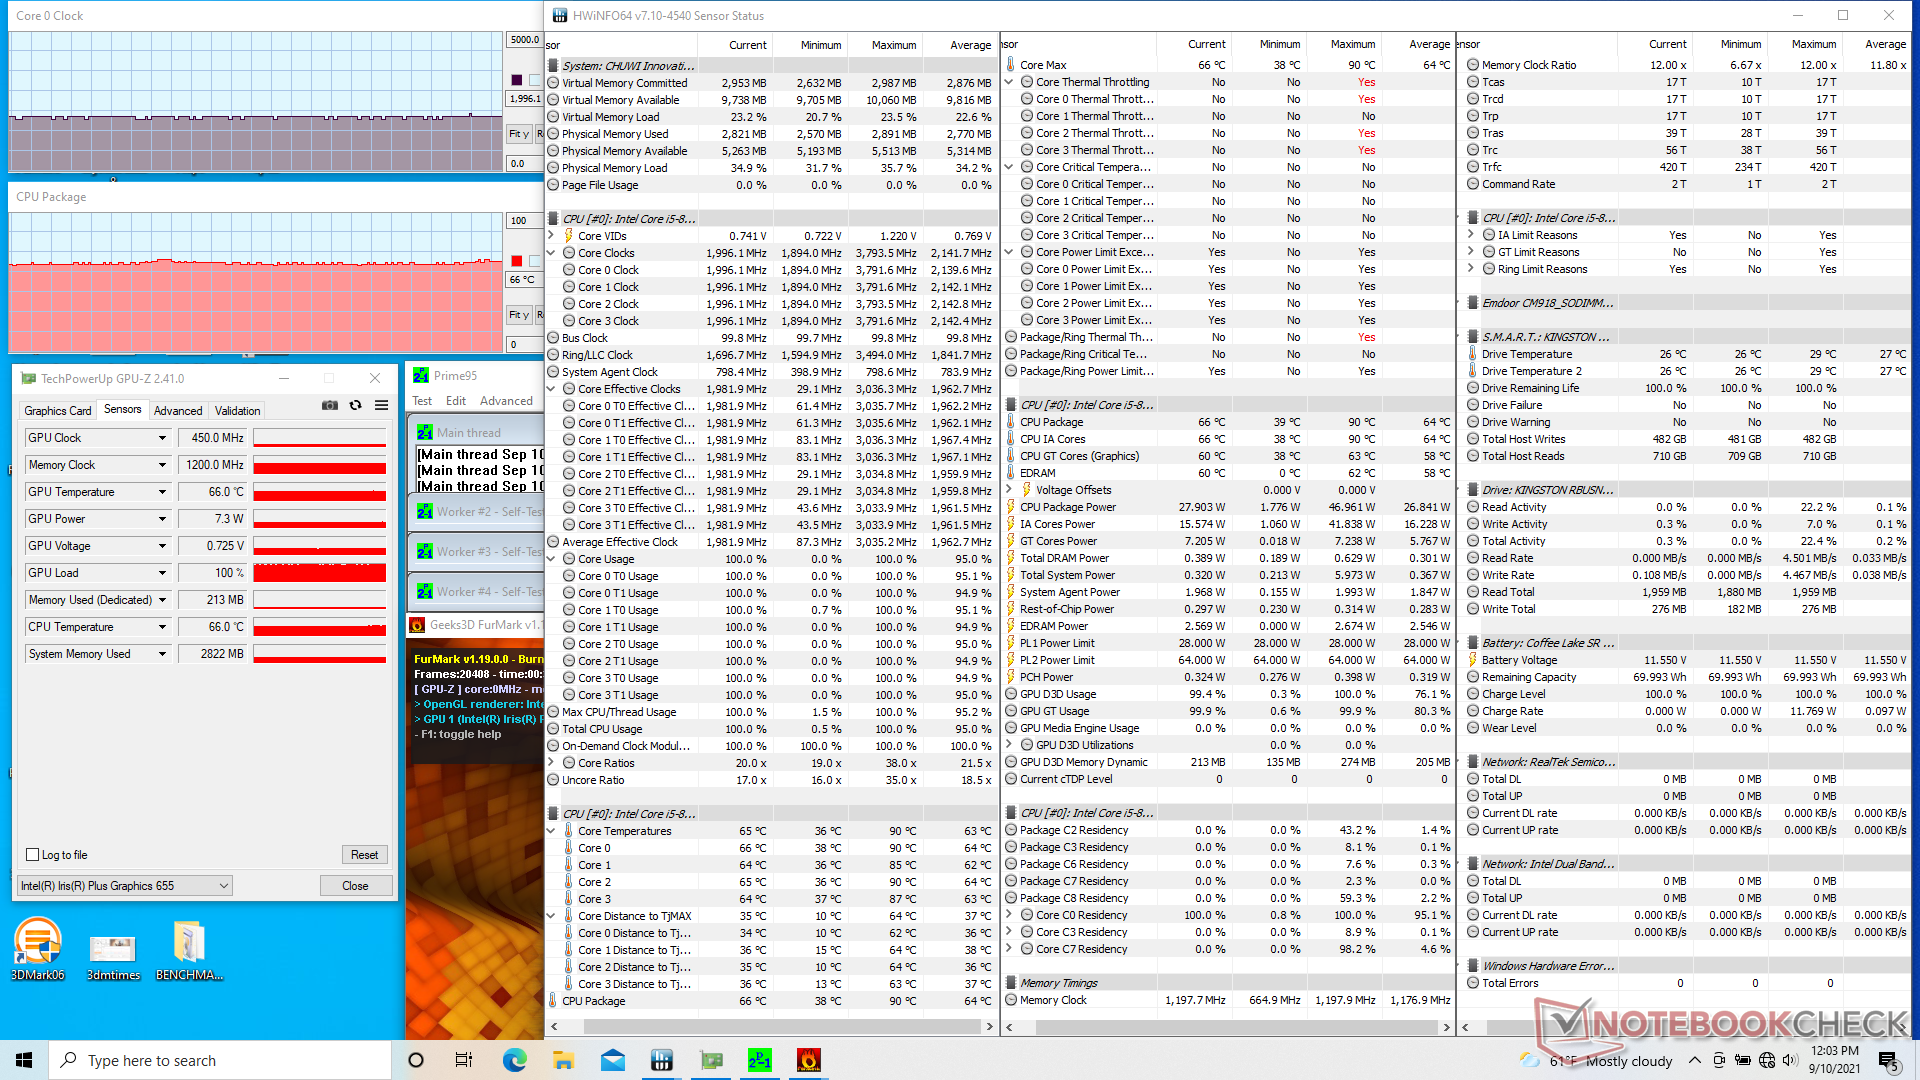
| CPU时钟(GHz) | GPU时钟(MHz) | CPU平均温度(℃) | |
| 系统空闲 | -- | -- | 39 |
| Prime95压力 | 2.4 | -- | 68 |
| Prime95 + FurMark压力 | 2.0 | 450 |
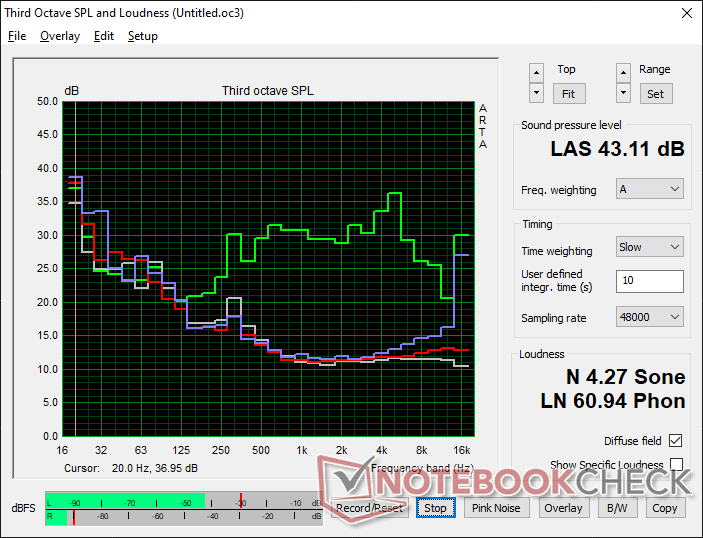
扬声器--铁罐质量


Chuwi CoreBook X Pro audio analysis
(-) | not very loud speakers (68.7 dB)
Bass 100 - 315 Hz
(-) | nearly no bass - on average 29.7% lower than median
(±) | linearity of bass is average (8.8% delta to prev. frequency)
Mids 400 - 2000 Hz
(±) | reduced mids - on average 9.3% lower than median
(±) | linearity of mids is average (13.6% delta to prev. frequency)
Highs 2 - 16 kHz
(+) | balanced highs - only 3.1% away from median
(+) | highs are linear (4.1% delta to prev. frequency)
Overall 100 - 16.000 Hz
(-) | overall sound is not linear (33.8% difference to median)
Compared to same class
» 98% of all tested devices in this class were better, 0% similar, 2% worse
» The best had a delta of 5%, average was 17%, worst was 45%
Compared to all devices tested
» 93% of all tested devices were better, 1% similar, 6% worse
» The best had a delta of 4%, average was 23%, worst was 134%
Apple MacBook 12 (Early 2016) 1.1 GHz audio analysis
(+) | speakers can play relatively loud (83.6 dB)
Bass 100 - 315 Hz
(±) | reduced bass - on average 11.3% lower than median
(±) | linearity of bass is average (14.2% delta to prev. frequency)
Mids 400 - 2000 Hz
(+) | balanced mids - only 2.4% away from median
(+) | mids are linear (5.5% delta to prev. frequency)
Highs 2 - 16 kHz
(+) | balanced highs - only 2% away from median
(+) | highs are linear (4.5% delta to prev. frequency)
Overall 100 - 16.000 Hz
(+) | overall sound is linear (10.2% difference to median)
Compared to same class
» 7% of all tested devices in this class were better, 2% similar, 90% worse
» The best had a delta of 5%, average was 18%, worst was 53%
Compared to all devices tested
» 5% of all tested devices were better, 1% similar, 94% worse
» The best had a delta of 4%, average was 23%, worst was 134%
Energy Management
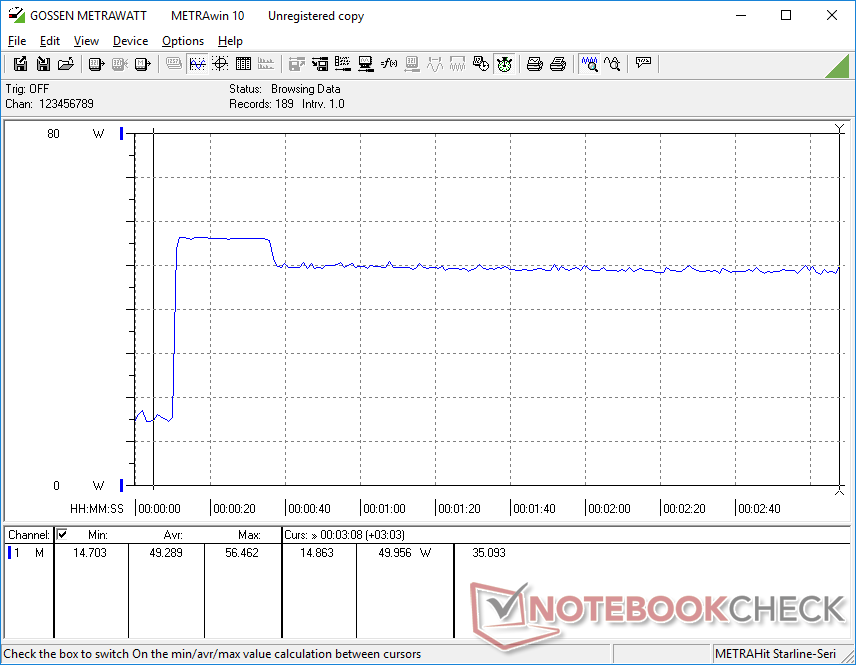
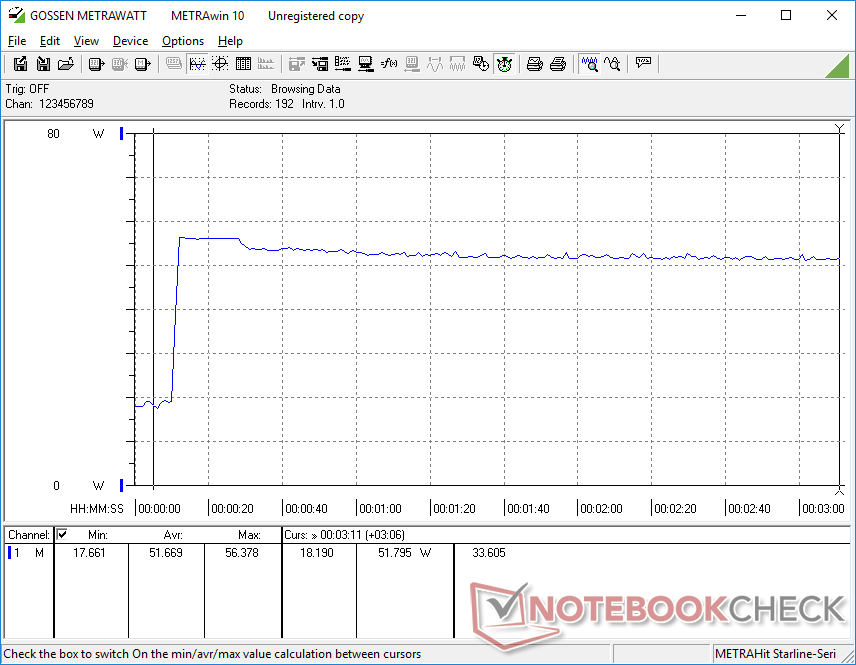
消耗功率
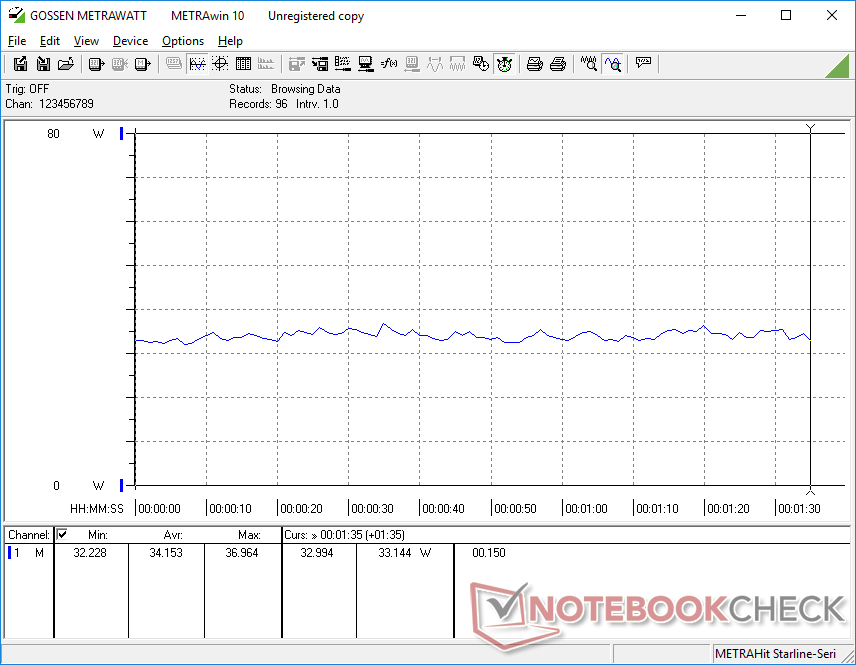
功耗比预期的要高,可能是由于较老的第八代英特尔处理器的原因。例如,在Zen 2或第10代Ice Lake CPU上运行的系统,在网络浏览和文字处理等低负载期间,功耗要高得多。游戏的耗电量在34W到57W之间,而由AMD驱动的Tuxedo Aura 15的耗电量为44W到60W,其图形性能明显比我们的Chuwi快。
| Off / Standby | |
| Idle | |
| Load |
|
Key:
min: | |
| Chuwi CoreBook X Pro i5-8259U, Iris Plus Graphics 655, Kingston RBUSNS8154P3512GJ, IPS, 1920x1080, 15.6" | Teclast TBOLT F15 Pro i3-1005G1, UHD Graphics G1 (Ice Lake 32 EU), Teclast BD256GB, IPS, 1920x1080, 15.6" | Asus VivoBook S15 D533UA R7 5700U, Vega 8, WDC PC SN530 SDBPNPZ-1T00, IPS, 1920x1080, 15.6" | Tuxedo Aura 15 Gen1 R7 4700U, Vega 7, Kingston SA2000M81000G, IPS, 1920x1080, 15.6" | Honor MagicBook 15 R5 3500U, Vega 8, Samsung SSD PM981a MZVLB256HBHQ, IPS, 1920x1080, 15.6" | Dell XPS 15 9500 Core i5 i5-10300H, UHD Graphics 630, Toshiba KBG40ZNS256G NVMe, IPS, 1920x1200, 15.6" | |
|---|---|---|---|---|---|---|
| Power Consumption | 35% | 19% | 19% | 32% | 17% | |
| Idle Minimum * (Watt) | 12.6 | 7.3 42% | 5 60% | 4.5 64% | 4.6 63% | 2.9 77% |
| Idle Average * (Watt) | 15 | 9.9 34% | 7.7 49% | 8.6 43% | 8.5 43% | 7.6 49% |
| Idle Maximum * (Watt) | 15.3 | 10.9 29% | 12.2 20% | 11.6 24% | 9.1 41% | 8 48% |
| Load Average * (Watt) | 34.2 | 22 36% | 41 -20% | 44 -29% | 38 -11% | 41.7 -22% |
| Load Maximum * (Watt) | 56.5 | 38 33% | 65 -15% | 59.7 -6% | 44 22% | 94.8 -68% |
| Witcher 3 ultra * (Watt) | 23.3 | 43 | 43.6 |
* ... smaller is better
Power Consumption Witcher 3 / Stresstest
电池寿命 - 充电非常慢
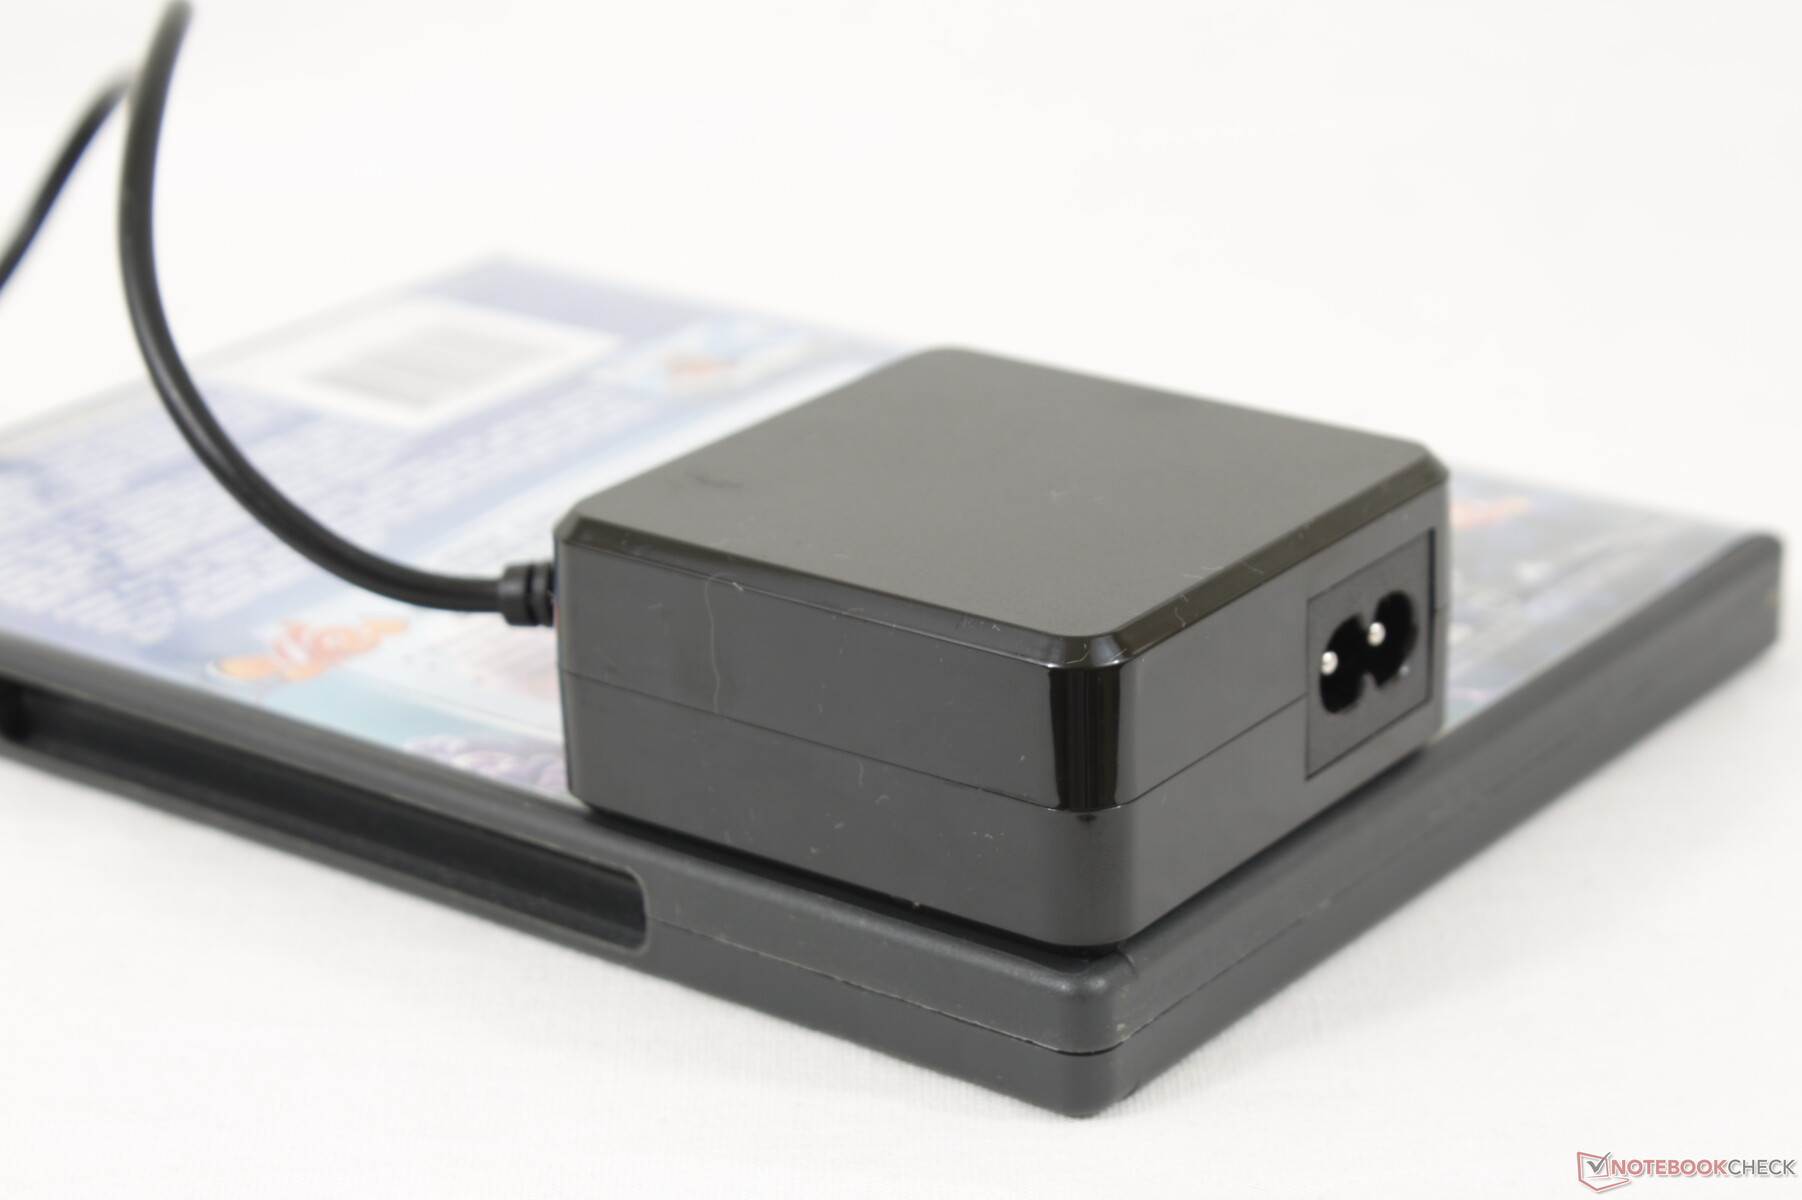
运行时间是可敬的,70Wh的大电池在现实世界中使用WLAN约7.5小时。然而,从空到满的充电速度很慢,需要3个小时,而大多数其他超极本只有1.5小时。
| Chuwi CoreBook X Pro i5-8259U, Iris Plus Graphics 655, 70 Wh | Teclast TBOLT F15 Pro i3-1005G1, UHD Graphics G1 (Ice Lake 32 EU), 53.8 Wh | Asus VivoBook S15 D533UA R7 5700U, Vega 8, 50 Wh | Tuxedo Aura 15 Gen1 R7 4700U, Vega 7, 49 Wh | Honor MagicBook 15 R5 3500U, Vega 8, 42 Wh | Dell XPS 15 9500 Core i5 i5-10300H, UHD Graphics 630, 56 Wh | |
|---|---|---|---|---|---|---|
| Battery runtime | -20% | 22% | 4% | -19% | 26% | |
| WiFi v1.3 (h) | 7.4 | 5.9 -20% | 9 22% | 7.7 4% | 6 -19% | 9.3 26% |
| Reader / Idle (h) | 26.4 | |||||
| Load (h) | 1.6 |
Pros
Cons
结论------切角多多
Chuwi笔记本电脑都有类似的优点和缺点。我们不得不称赞CoreBook X Pro,因为它有吸引人的设计,高刷新率的显示屏,以及适当的Core U系列CPU,与这个价格范围内太常见的过度塑料、60赫兹显示屏或英特尔Atom或Celeron替代品形成鲜明对比。易维修性和可升级的内存和存储也是不错的惊喜。
令人印象深刻的120赫兹显示屏和有吸引力的视觉设计几乎毫无意义,如果键盘、点击板、建造质量和铰链需要一些工作。
该系统的其他几乎所有东西都会崩溃。脆弱的铰链、摇摇欲坠的机箱、粘稠的点击板、软弱的扬声器、非常糟糕的网络摄像头和反应迟钝的键盘按键给我们的印象是,这台笔记本电脑可能不会持续超过几年。如果寿命是一个问题,那么我们会建议选择一个更老的 联想瑜伽或 戴尔Inspiron第八代英特尔CPU,那里的保修期更容易申请。最新的 惠普Pavilion 15酷睿i3 SKU也是一个优秀且更可靠的选择。
价格和可用性
Chuwi是,现在通过其官方在线商店运送其CoreBook X Pro通过其官方在线商店以559美元的价格出售。我们预计亚马逊在不久的将来也会有这种产品。
Chuwi CoreBook X Pro
- 09/15/2021 v7 (old)
Allen Ngo
Price comparison

