苹果MacBook Pro 2019笔记本电脑评测:性能不错,但没有创新
Rating | Date | Model | Weight | Height | Size | Resolution | Price |
|---|---|---|---|---|---|---|---|
| 90.7 % v7 (old) | 03 / 2020 | Apple MacBook Pro 13 2019 i5 4TB3 i5-8279U, Iris Plus Graphics 655 | 1.4 kg | 14.9 mm | 13.30" | 2560x1600 | |
| 90.1 % v7 (old) | 09 / 2019 | Lenovo ThinkPad X1 Carbon 2019-20QE000VGE i7-8665U, UHD Graphics 620 | 1.1 kg | 14.9 mm | 14.00" | 2560x1440 | |
| 87.7 % v6 (old) | 02 / 2019 | Dell XPS 13 9380 i7 4K i7-8565U, UHD Graphics 620 | 1.2 kg | 11.6 mm | 13.30" | 3840x2160 | |
| 85.6 % v7 (old) | 01 / 2019 | Razer Blade Stealth i7-8565U i7-8565U, GeForce MX150 | 1.3 kg | 14.8 mm | 13.30" | 1920x1080 | |
| 84.5 % v7 (old) | 08 / 2019 | HP Envy 13-aq0003ng i7-8565U, GeForce MX250 | 1.2 kg | 14.7 mm | 13.30" | 1920x1080 |
| |||||||||||||||||||||||||
Brightness Distribution: 87 %
Center on Battery: 513 cd/m²
Contrast: 1524:1 (Black: 0.34 cd/m²)
ΔE ColorChecker Calman: 1.5 | ∀{0.5-29.43 Ø4.73}
calibrated: 2.6
ΔE Greyscale Calman: 2 | ∀{0.09-98 Ø4.97}
99.9% sRGB (Argyll 1.6.3 3D)
78.4% AdobeRGB 1998 (Argyll 1.6.3 3D)
87.7% AdobeRGB 1998 (Argyll 3D)
100% sRGB (Argyll 3D)
98.7% Display P3 (Argyll 3D)
Gamma: 2.22
CCT: 6898 K
| Apple MacBook Pro 13 2019 i5 4TB3 APPA03E, , 2560x1600, 13.3" | Apple MacBook Pro 13 2018 Touchbar i5 APPA03E, , 2560x1600, 13.3" | Lenovo ThinkPad X1 Carbon 2019-20QE000VGE LP140QH2-SPD1, , 2560x1440, 14" | Dell XPS 13 9380 i7 4K ID: AUO 282B B133ZAN Dell: 90NTH, , 3840x2160, 13.3" | Razer Blade Stealth i7-8565U Sharp LQ133M1JW41, , 1920x1080, 13.3" | HP Envy 13-aq0003ng InfoVision M133NVF3 R2, , 1920x1080, 13.3" | |
|---|---|---|---|---|---|---|
| Display | 0% | -15% | -22% | -21% | -23% | |
| Display P3 Coverage (%) | 98.7 | 98.5 0% | 72.5 -27% | 64.8 -34% | 65.5 -34% | 64.4 -35% |
| sRGB Coverage (%) | 100 | 99.9 0% | 97.8 -2% | 93.6 -6% | 96.3 -4% | 91.7 -8% |
| AdobeRGB 1998 Coverage (%) | 87.7 | 87.3 0% | 73.8 -16% | 65.8 -25% | 66.3 -24% | 65.2 -26% |
| Response Times | -7% | 21% | -39% | -24% | 24% | |
| Response Time Grey 50% / Grey 80% * (ms) | 43.2 ? | 46 ? -6% | 33.6 ? 22% | 64.8 ? -50% | 57.6 ? -33% | 31 ? 28% |
| Response Time Black / White * (ms) | 29.6 ? | 32 ? -8% | 24 ? 19% | 38 ? -28% | 34 ? -15% | 24 ? 19% |
| PWM Frequency (Hz) | 118000 ? | 22730 ? | 4000 ? | |||
| Screen | 2% | -62% | -27% | 1% | -31% | |
| Brightness middle (cd/m²) | 518 | 519 0% | 338 -35% | 428.3 -17% | 429.8 -17% | 768 48% |
| Brightness (cd/m²) | 480 | 504 5% | 315 -34% | 414 -14% | 403 -16% | 778 62% |
| Brightness Distribution (%) | 87 | 95 9% | 88 1% | 88 1% | 89 2% | 82 -6% |
| Black Level * (cd/m²) | 0.34 | 0.33 3% | 0.43 -26% | 0.27 21% | 0.32 6% | 0.48 -41% |
| Contrast (:1) | 1524 | 1573 3% | 786 -48% | 1586 4% | 1343 -12% | 1600 5% |
| Colorchecker dE 2000 * | 1.5 | 1.4 7% | 4 -167% | 2.69 -79% | 1.08 28% | 3.49 -133% |
| Colorchecker dE 2000 max. * | 2.8 | 2.8 -0% | 7.9 -182% | 6.19 -121% | 3.96 -41% | 7.41 -165% |
| Colorchecker dE 2000 calibrated * | 2.6 | 1.7 35% | 2.01 23% | 1.21 53% | 2.07 20% | |
| Greyscale dE 2000 * | 2 | 2.2 -10% | 6.2 -210% | 3.7 -85% | 1.3 35% | 4.09 -105% |
| Gamma | 2.22 99% | 2.22 99% | 2.13 103% | 2.1 105% | 2.23 99% | 2.54 87% |
| CCT | 6898 94% | 6908 94% | 6787 96% | 6706 97% | 6452 101% | 6452 101% |
| Color Space (Percent of AdobeRGB 1998) (%) | 78.4 | 77.3 -1% | 68.1 -13% | 60.4 -23% | 61.4 -22% | 60 -23% |
| Color Space (Percent of sRGB) (%) | 99.9 | 99.99 0% | 97.8 -2% | 93.5 -6% | 96.3 -4% | 92 -8% |
| Total Average (Program / Settings) | -2% /
0% | -19% /
-43% | -29% /
-27% | -15% /
-6% | -10% /
-23% |
* ... smaller is better
Display Response Times
| ↔ Response Time Black to White | ||
|---|---|---|
| 29.6 ms ... rise ↗ and fall ↘ combined | ↗ 15.6 ms rise | 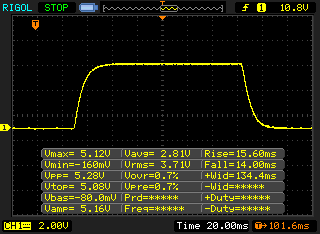 |
| ↘ 14 ms fall | ||
| The screen shows relatively slow response rates in our tests and may be too slow for gamers. In comparison, all tested devices range from 0.1 (minimum) to 240 (maximum) ms. » 79 % of all devices are better. This means that the measured response time is worse than the average of all tested devices (19.9 ms). | ||
| ↔ Response Time 50% Grey to 80% Grey | ||
| 43.2 ms ... rise ↗ and fall ↘ combined | ↗ 22 ms rise | 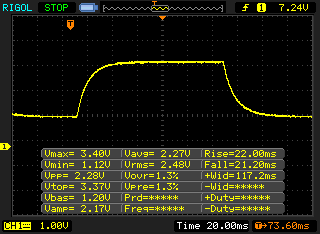 |
| ↘ 21.2 ms fall | ||
| The screen shows slow response rates in our tests and will be unsatisfactory for gamers. In comparison, all tested devices range from 0.165 (minimum) to 636 (maximum) ms. » 72 % of all devices are better. This means that the measured response time is worse than the average of all tested devices (31.1 ms). | ||
Screen Flickering / PWM (Pulse-Width Modulation)
| Screen flickering / PWM not detected | 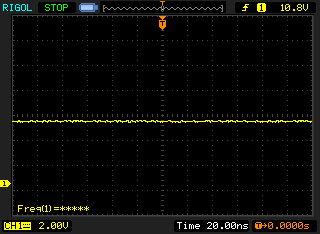 | ||
In comparison: 52 % of all tested devices do not use PWM to dim the display. If PWM was detected, an average of 7798 (minimum: 5 - maximum: 343500) Hz was measured. | |||
| PCMark 8 Home Score Accelerated v2 | 4056 points | |
| PCMark 8 Creative Score Accelerated v2 | 5689 points | |
| PCMark 8 Work Score Accelerated v2 | 4537 points | |
| PCMark 10 Score | 3779 points | |
Help | ||

| 3DMark 06 Standard Score | 17176 points | |
| 3DMark Ice Storm Standard Score | 57033 points | |
| 3DMark Cloud Gate Standard Score | 11806 points | |
| 3DMark Fire Strike Score | 1903 points | |
| 3DMark Time Spy Score | 705 points | |
Help | ||
| low | med. | high | ultra | |
|---|---|---|---|---|
| BioShock Infinite (2013) | 78.4 | 54.3 | 49.4 | 15.5 |
| Dota 2 Reborn (2015) | 84 | 63 | 33.3 | 29.9 |
| X-Plane 11.11 (2018) | 42.8 | 29.5 | 25.1 |
Noise level
| Idle |
| 29 / 29 / 29 dB(A) |
| Load |
| 33.9 / 41.8 dB(A) |
 | ||
30 dB silent 40 dB(A) audible 50 dB(A) loud |
||
min: | ||
| Apple MacBook Pro 13 2019 i5 4TB3 Iris Plus Graphics 655, i5-8279U, Apple SSD AP0512 | Apple MacBook Pro 13 2018 Touchbar i5 Iris Plus Graphics 655, i5-8259U | Lenovo ThinkPad X1 Carbon 2019-20QE000VGE UHD Graphics 620, i7-8665U, WDC PC SN720 SDAQNTW-512G | Dell XPS 13 9380 i7 4K UHD Graphics 620, i7-8565U, Samsung SSD PM981 MZVLB512HAJQ | Razer Blade Stealth i7-8565U GeForce MX150, i7-8565U, Lite-On CA3-8D256-Q11 | HP Envy 13-aq0003ng GeForce MX250, i7-8565U, Toshiba KBG30ZMV512G | |
|---|---|---|---|---|---|---|
| Noise | -5% | 6% | -3% | -4% | -1% | |
| off / environment * (dB) | 29 | 29.6 -2% | 28.4 2% | 28.4 2% | 28.4 2% | 30 -3% |
| Idle Minimum * (dB) | 29 | 29.6 -2% | 28.4 2% | 29.4 -1% | 28.5 2% | 30 -3% |
| Idle Average * (dB) | 29 | 29.6 -2% | 28.4 2% | 29.4 -1% | 29 -0% | 30 -3% |
| Idle Maximum * (dB) | 29 | 29.6 -2% | 28.6 1% | 29.4 -1% | 29.1 -0% | 30 -3% |
| Load Average * (dB) | 33.9 | 36.7 -8% | 31.5 7% | 34.6 -2% | 42.8 -26% | |
| Load Maximum * (dB) | 41.8 | 46.7 -12% | 33.1 21% | 46.8 -12% | 41.6 -0% | 39.5 6% |
| Witcher 3 ultra * (dB) | 32.5 | 41.4 |
* ... smaller is better
(-) The maximum temperature on the upper side is 45.7 °C / 114 F, compared to the average of 35.9 °C / 97 F, ranging from 21.4 to 59 °C for the class Subnotebook.
(±) The bottom heats up to a maximum of 44.2 °C / 112 F, compared to the average of 39.2 °C / 103 F
(+) In idle usage, the average temperature for the upper side is 28.3 °C / 83 F, compared to the device average of 30.8 °C / 87 F.
(+) The palmrests and touchpad are reaching skin temperature as a maximum (32.5 °C / 90.5 F) and are therefore not hot.
(-) The average temperature of the palmrest area of similar devices was 28.2 °C / 82.8 F (-4.3 °C / -7.7 F).
Apple MacBook Pro 13 2019 i5 4TB3 audio analysis
(±) | speaker loudness is average but good (79.7 dB)
Bass 100 - 315 Hz
(±) | reduced bass - on average 12.8% lower than median
(±) | linearity of bass is average (11.2% delta to prev. frequency)
Mids 400 - 2000 Hz
(+) | balanced mids - only 3.2% away from median
(+) | mids are linear (4.6% delta to prev. frequency)
Highs 2 - 16 kHz
(+) | balanced highs - only 3.4% away from median
(+) | highs are linear (5.3% delta to prev. frequency)
Overall 100 - 16.000 Hz
(+) | overall sound is linear (13.7% difference to median)
Compared to same class
» 24% of all tested devices in this class were better, 5% similar, 71% worse
» The best had a delta of 5%, average was 18%, worst was 53%
Compared to all devices tested
» 15% of all tested devices were better, 4% similar, 81% worse
» The best had a delta of 4%, average was 24%, worst was 134%
Lenovo ThinkPad X1 Carbon 2019-20QE000VGE audio analysis
(±) | speaker loudness is average but good (76.8 dB)
Bass 100 - 315 Hz
(±) | reduced bass - on average 11.2% lower than median
(±) | linearity of bass is average (7.1% delta to prev. frequency)
Mids 400 - 2000 Hz
(±) | higher mids - on average 5.1% higher than median
(+) | mids are linear (5.4% delta to prev. frequency)
Highs 2 - 16 kHz
(+) | balanced highs - only 2.9% away from median
(±) | linearity of highs is average (9.1% delta to prev. frequency)
Overall 100 - 16.000 Hz
(±) | linearity of overall sound is average (16.7% difference to median)
Compared to same class
» 21% of all tested devices in this class were better, 8% similar, 71% worse
» The best had a delta of 7%, average was 21%, worst was 53%
Compared to all devices tested
» 29% of all tested devices were better, 7% similar, 64% worse
» The best had a delta of 4%, average was 24%, worst was 134%
| Off / Standby | |
| Idle | |
| Load |
|
Key:
min: | |
| Apple MacBook Pro 13 2019 i5 4TB3 i5-8279U, Iris Plus Graphics 655, Apple SSD AP0512, IPS, 2560x1600, 13.3" | Apple MacBook Pro 13 2018 Touchbar i5 i5-8259U, Iris Plus Graphics 655, , IPS, 2560x1600, 13.3" | Lenovo ThinkPad X1 Carbon 2019-20QE000VGE i7-8665U, UHD Graphics 620, WDC PC SN720 SDAQNTW-512G, IPS, 2560x1440, 14" | Dell XPS 13 9380 i7 4K i7-8565U, UHD Graphics 620, Samsung SSD PM981 MZVLB512HAJQ, IPS, 3840x2160, 13.3" | Razer Blade Stealth i7-8565U i7-8565U, GeForce MX150, Lite-On CA3-8D256-Q11, IPS, 1920x1080, 13.3" | HP Envy 13-aq0003ng i7-8565U, GeForce MX250, Toshiba KBG30ZMV512G, IPS, 1920x1080, 13.3" | Average Intel Iris Plus Graphics 655 | Average of class Subnotebook | |
|---|---|---|---|---|---|---|---|---|
| Power Consumption | -15% | -3% | -28% | -52% | -23% | -38% | -7% | |
| Idle Minimum * (Watt) | 2.2 | 2.3 -5% | 3 -36% | 5.2 -136% | 6.7 -205% | 3.9 -77% | 5.96 ? -171% | 3.79 ? -72% |
| Idle Average * (Watt) | 7.2 | 8.7 -21% | 6.3 12% | 8.6 -19% | 8.6 -19% | 7.8 -8% | 8.44 ? -17% | 6.57 ? 9% |
| Idle Maximum * (Watt) | 8.2 | 12.2 -49% | 8.9 -9% | 10.5 -28% | 9.4 -15% | 10.8 -32% | 10.6 ? -29% | 7.94 ? 3% |
| Load Average * (Watt) | 54 | 53.3 1% | 40.8 24% | 44.2 18% | 64.1 -19% | 53 2% | 46.5 ? 14% | 41.8 ? 23% |
| Load Maximum * (Watt) | 63.9 | 64 -0% | 67.5 -6% | 47.5 26% | 64.1 -0% | 62.7 2% | 56.2 ? 12% | 64.1 ? -0% |
| Witcher 3 ultra * (Watt) | 63.7 |
* ... smaller is better
| Apple MacBook Pro 13 2019 i5 4TB3 i5-8279U, Iris Plus Graphics 655, 58 Wh | Apple MacBook Pro 13 2018 Touchbar i5 i5-8259U, Iris Plus Graphics 655, 58 Wh | Lenovo ThinkPad X1 Carbon 2019-20QE000VGE i7-8665U, UHD Graphics 620, 51 Wh | Dell XPS 13 9380 i7 4K i7-8565U, UHD Graphics 620, 52 Wh | Razer Blade Stealth i7-8565U i7-8565U, GeForce MX150, 53.1 Wh | HP Envy 13-aq0003ng i7-8565U, GeForce MX250, 53.2 Wh | Average of class Subnotebook | |
|---|---|---|---|---|---|---|---|
| Battery runtime | -13% | -24% | -33% | -17% | -26% | 26% | |
| H.264 (h) | 12 | 10.9 -9% | 9.8 -18% | 15.6 ? 30% | |||
| WiFi v1.3 (h) | 11.5 | 9.7 -16% | 8.2 -29% | 7.7 -33% | 9.5 -17% | 8.5 -26% | 14 ? 22% |
| Witcher 3 ultra (h) | 1.6 |
Pros
Cons
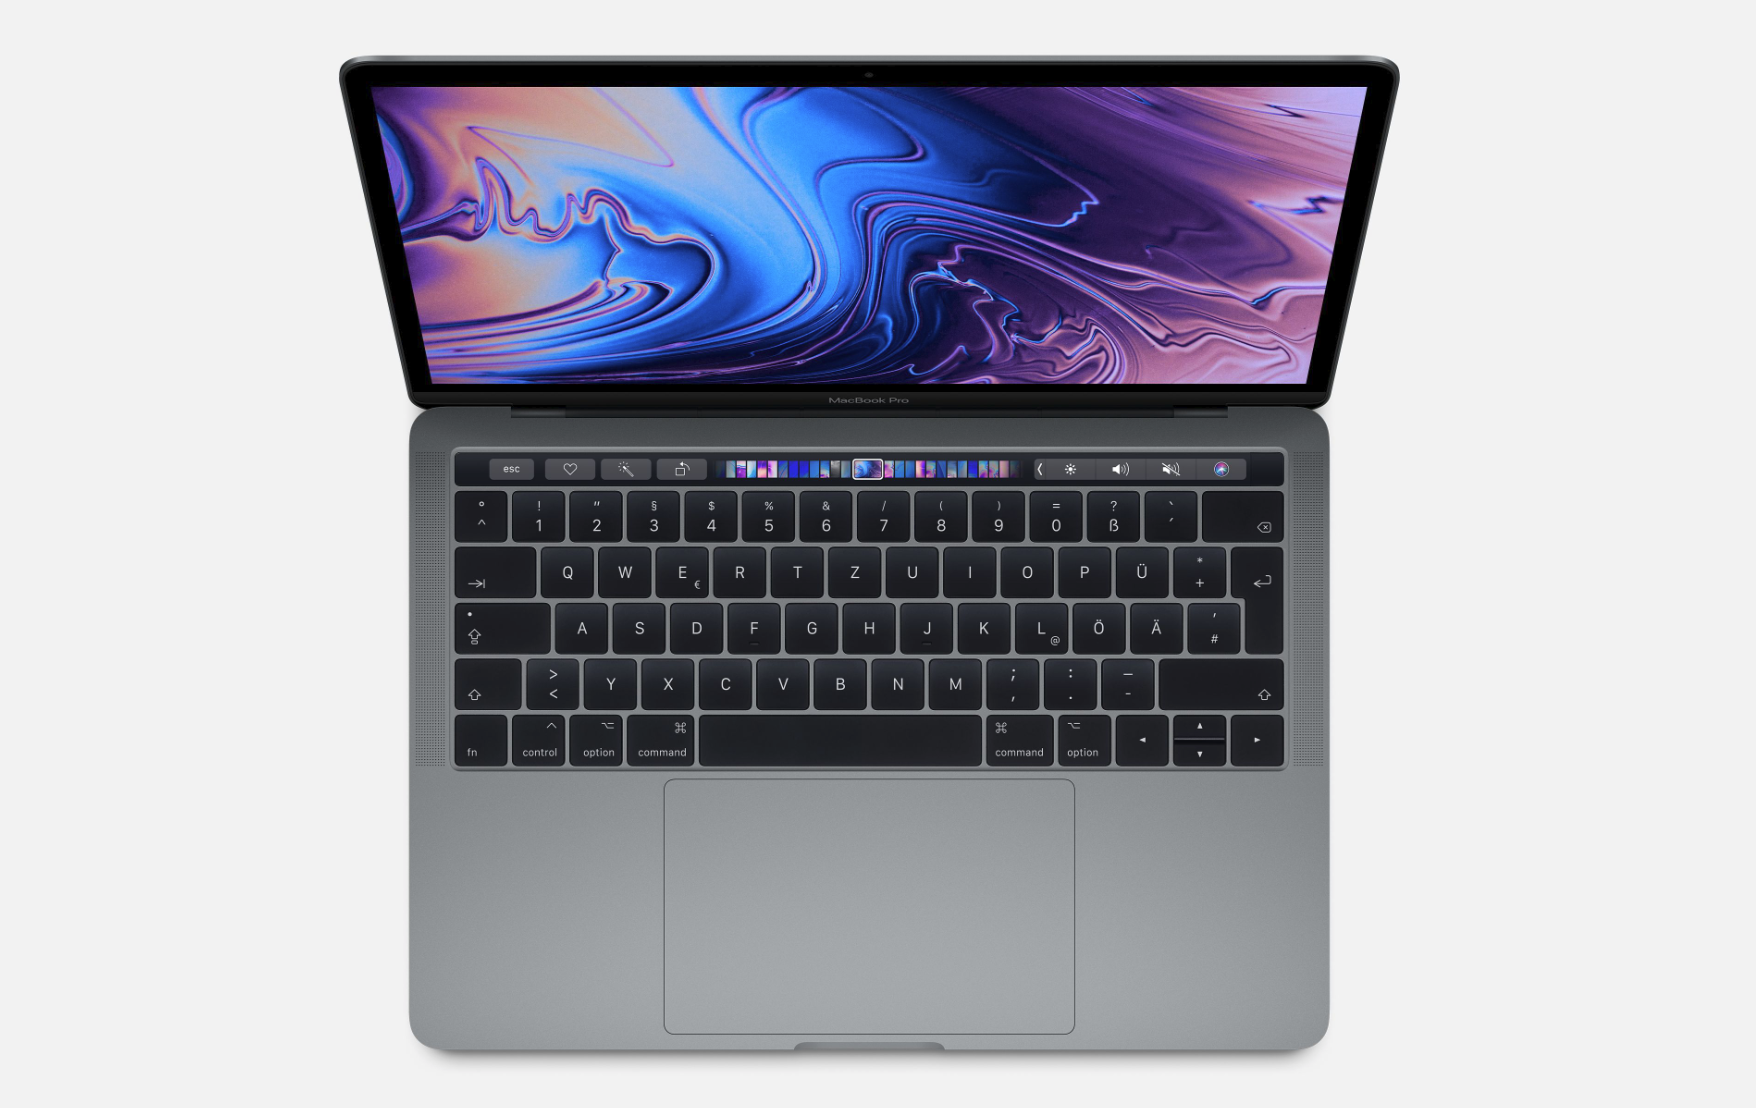
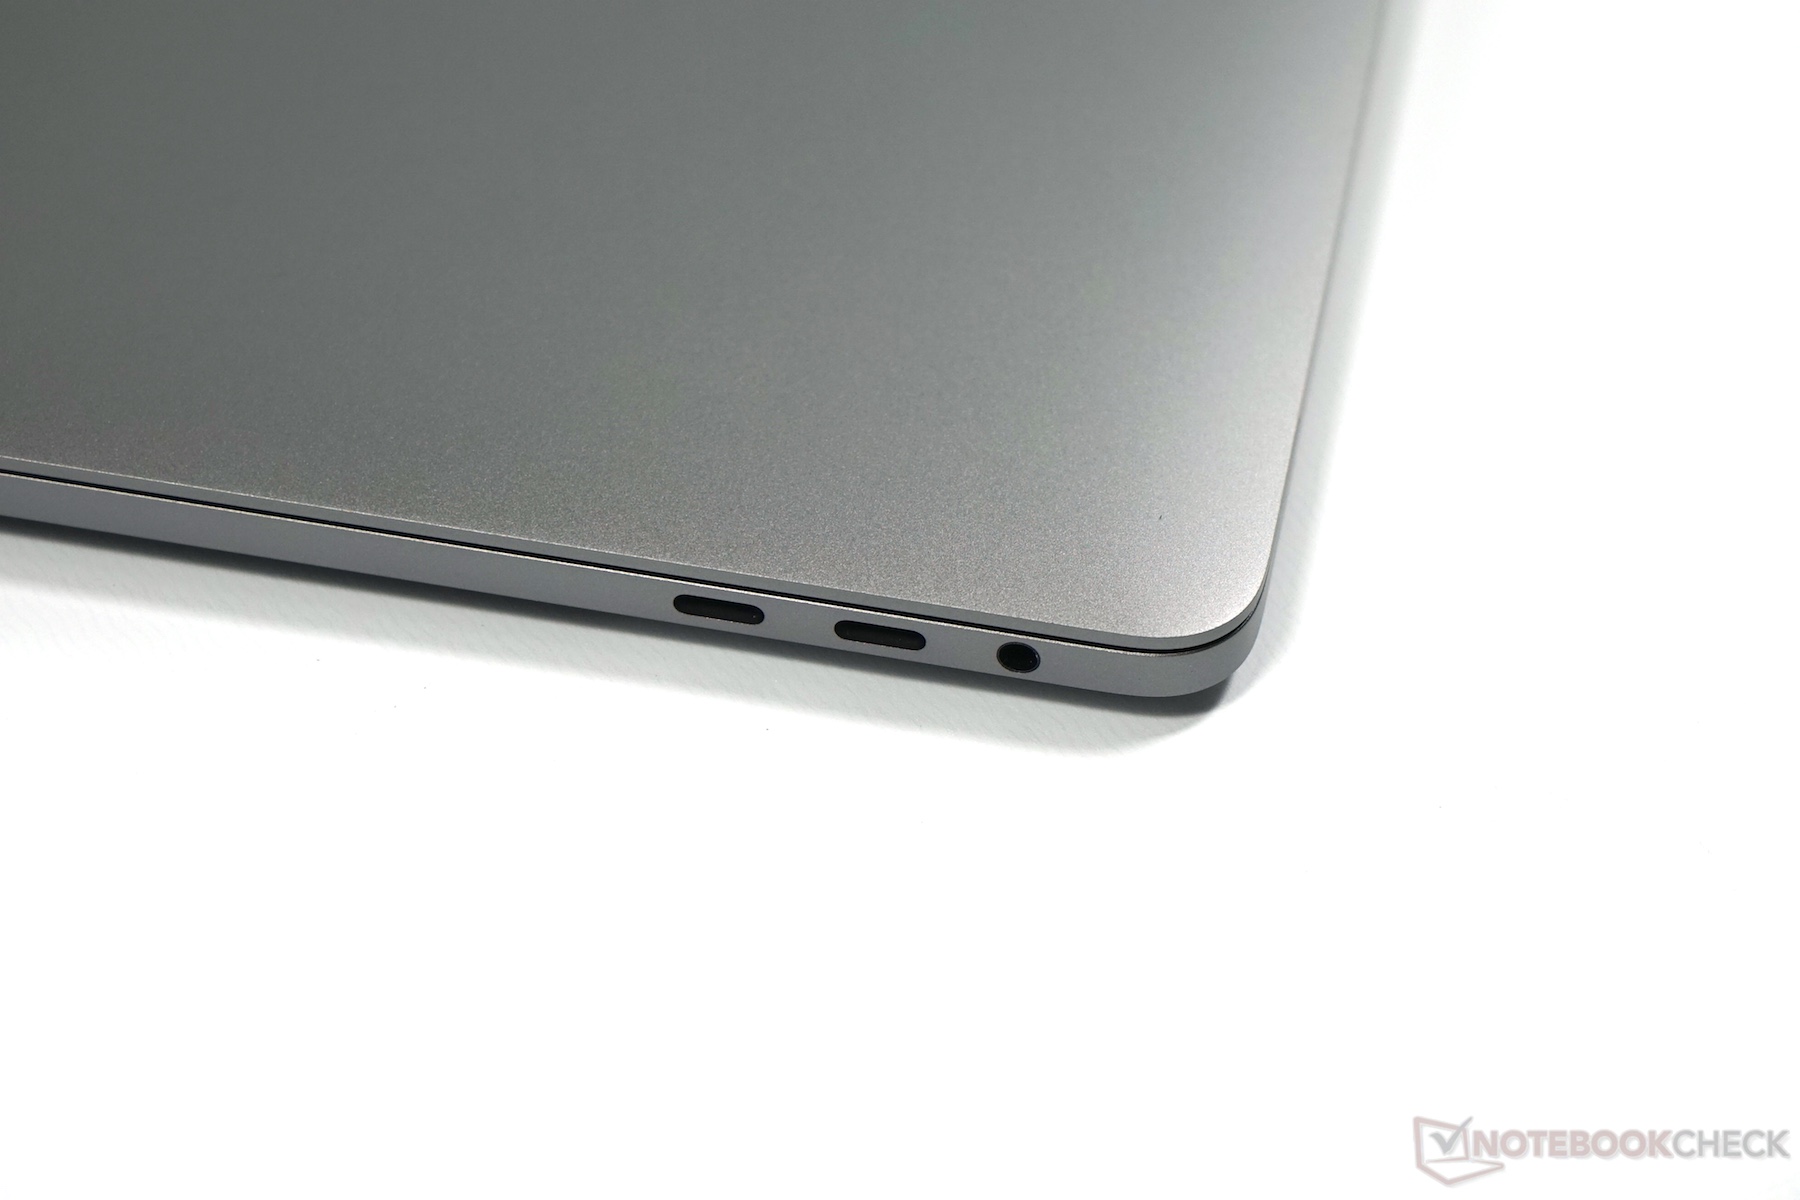
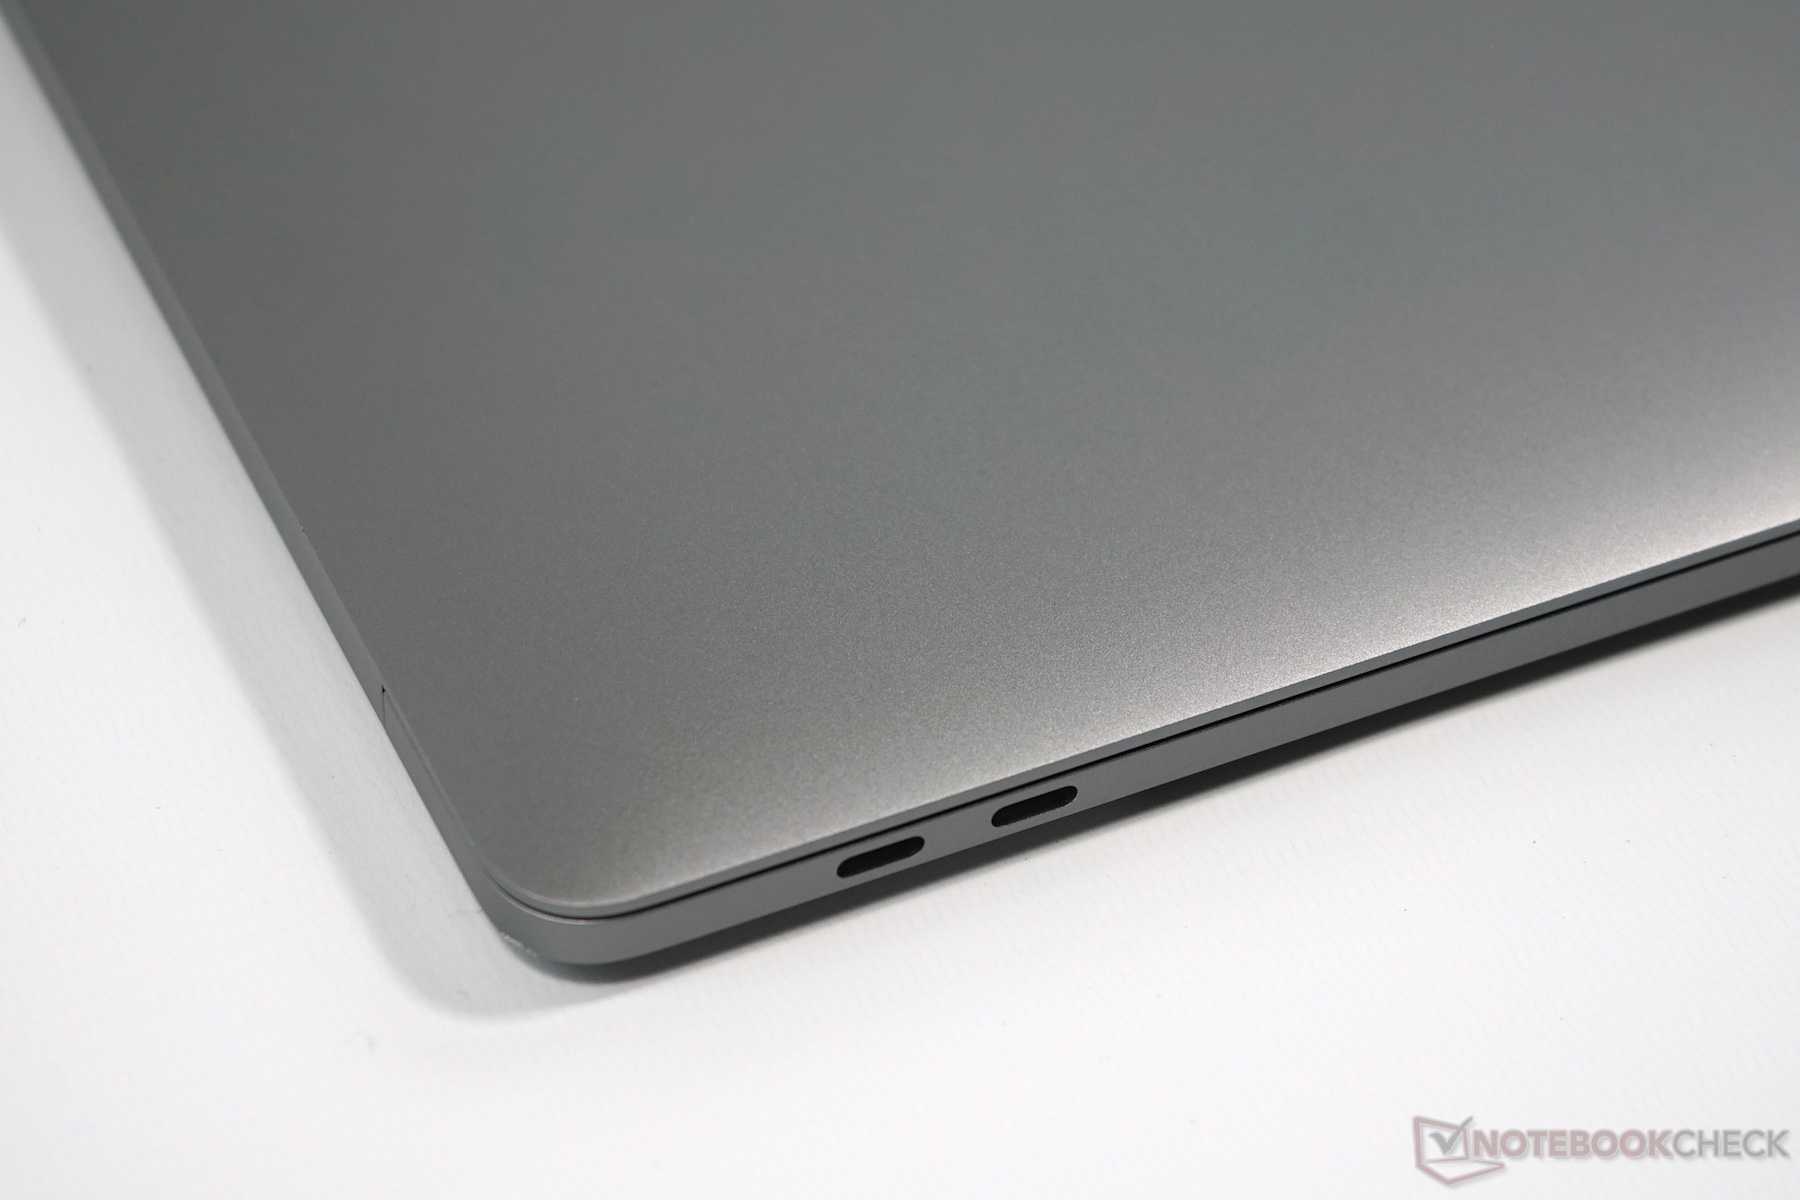
MacBook Pro 2019配备4个Thunderbolt 3端口,因此仅进行了常规更新。制造商今年的重点当然是更便宜的MacBook Pro 13(2 TB TB3)的更新,现在它也配备了Touch Bar。
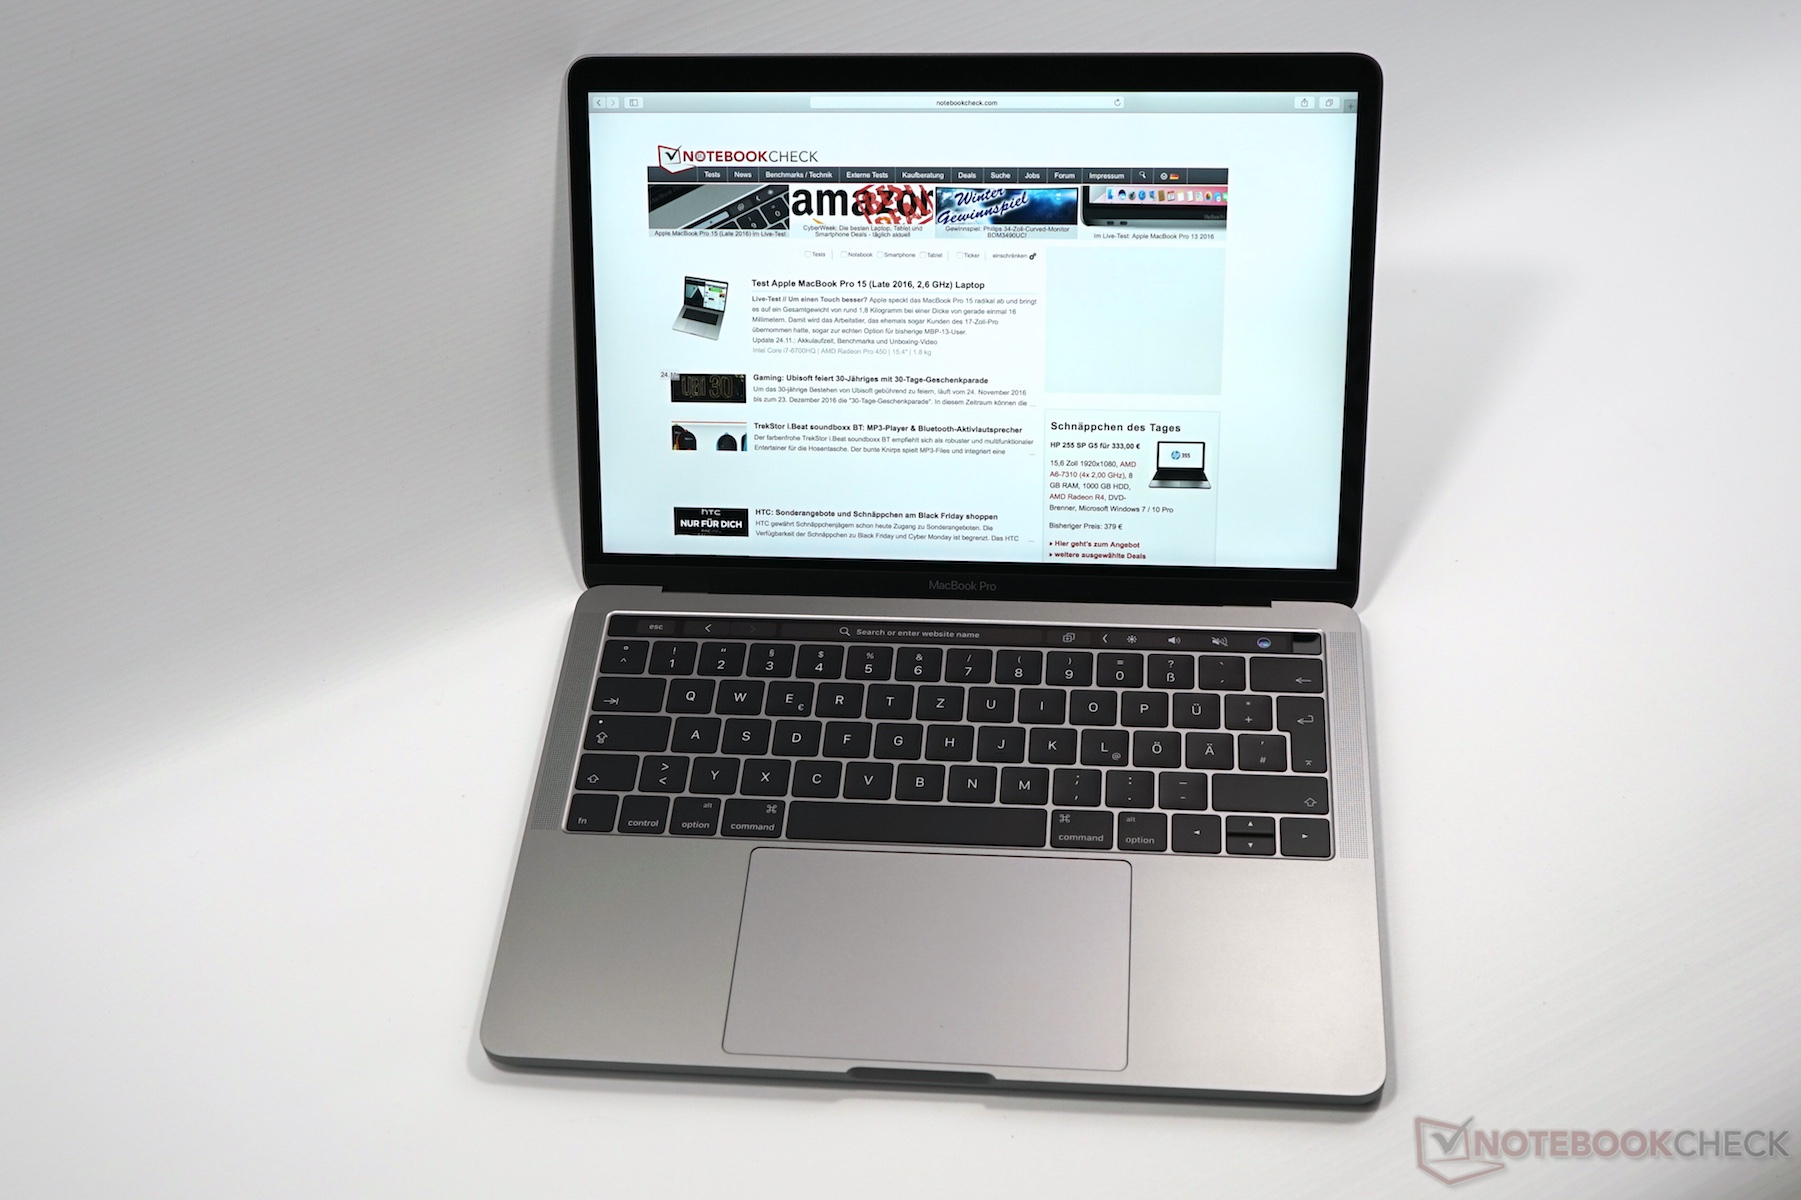
对于我们来说,出乎意料的是,尽管处理器非常相似,但性能却有显着提高,即使在持续的负载下,性能也不会下降。在超极本类别中很少见。屏幕方面也没有任何变化,但是仍然是市场上最好的之一,并且不必担心与竞争对手的比较。此外,它还是16:10比例的少数面板之一。
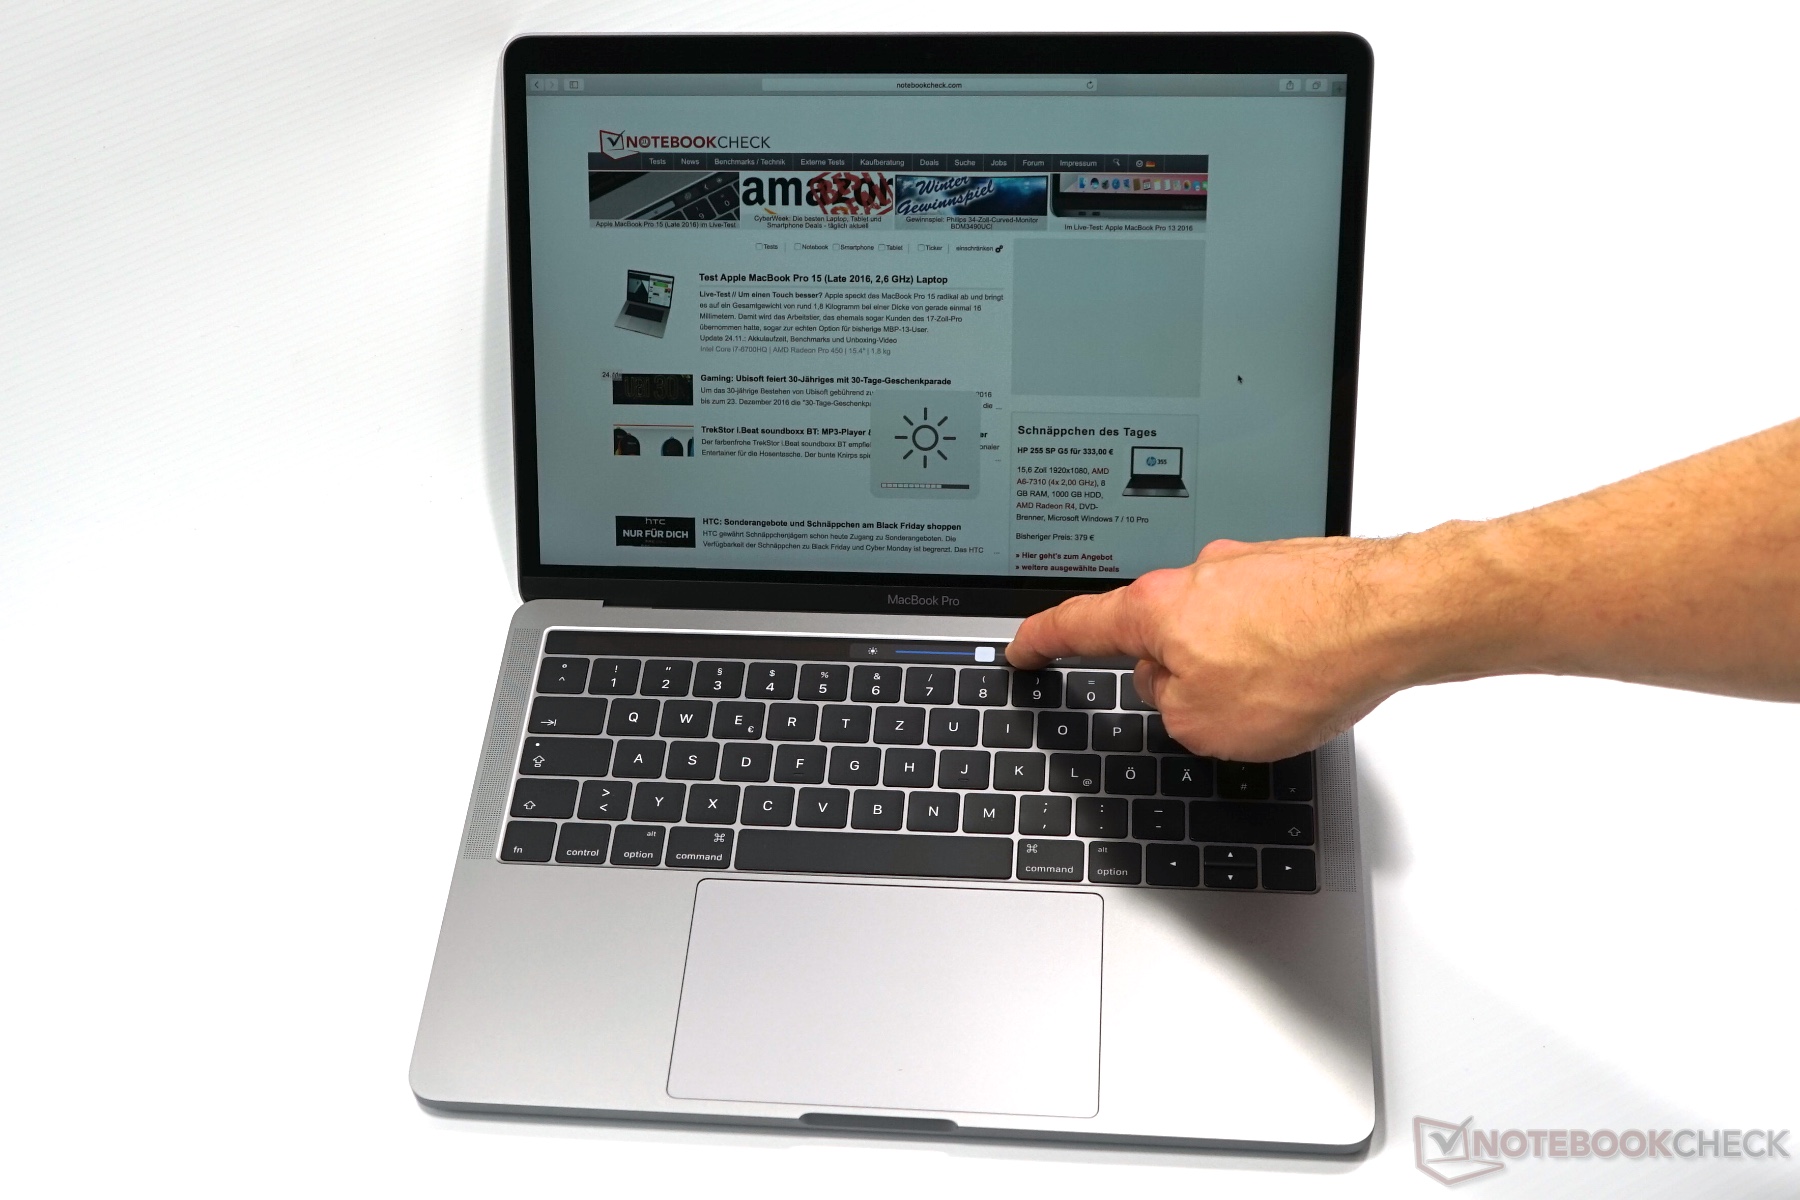
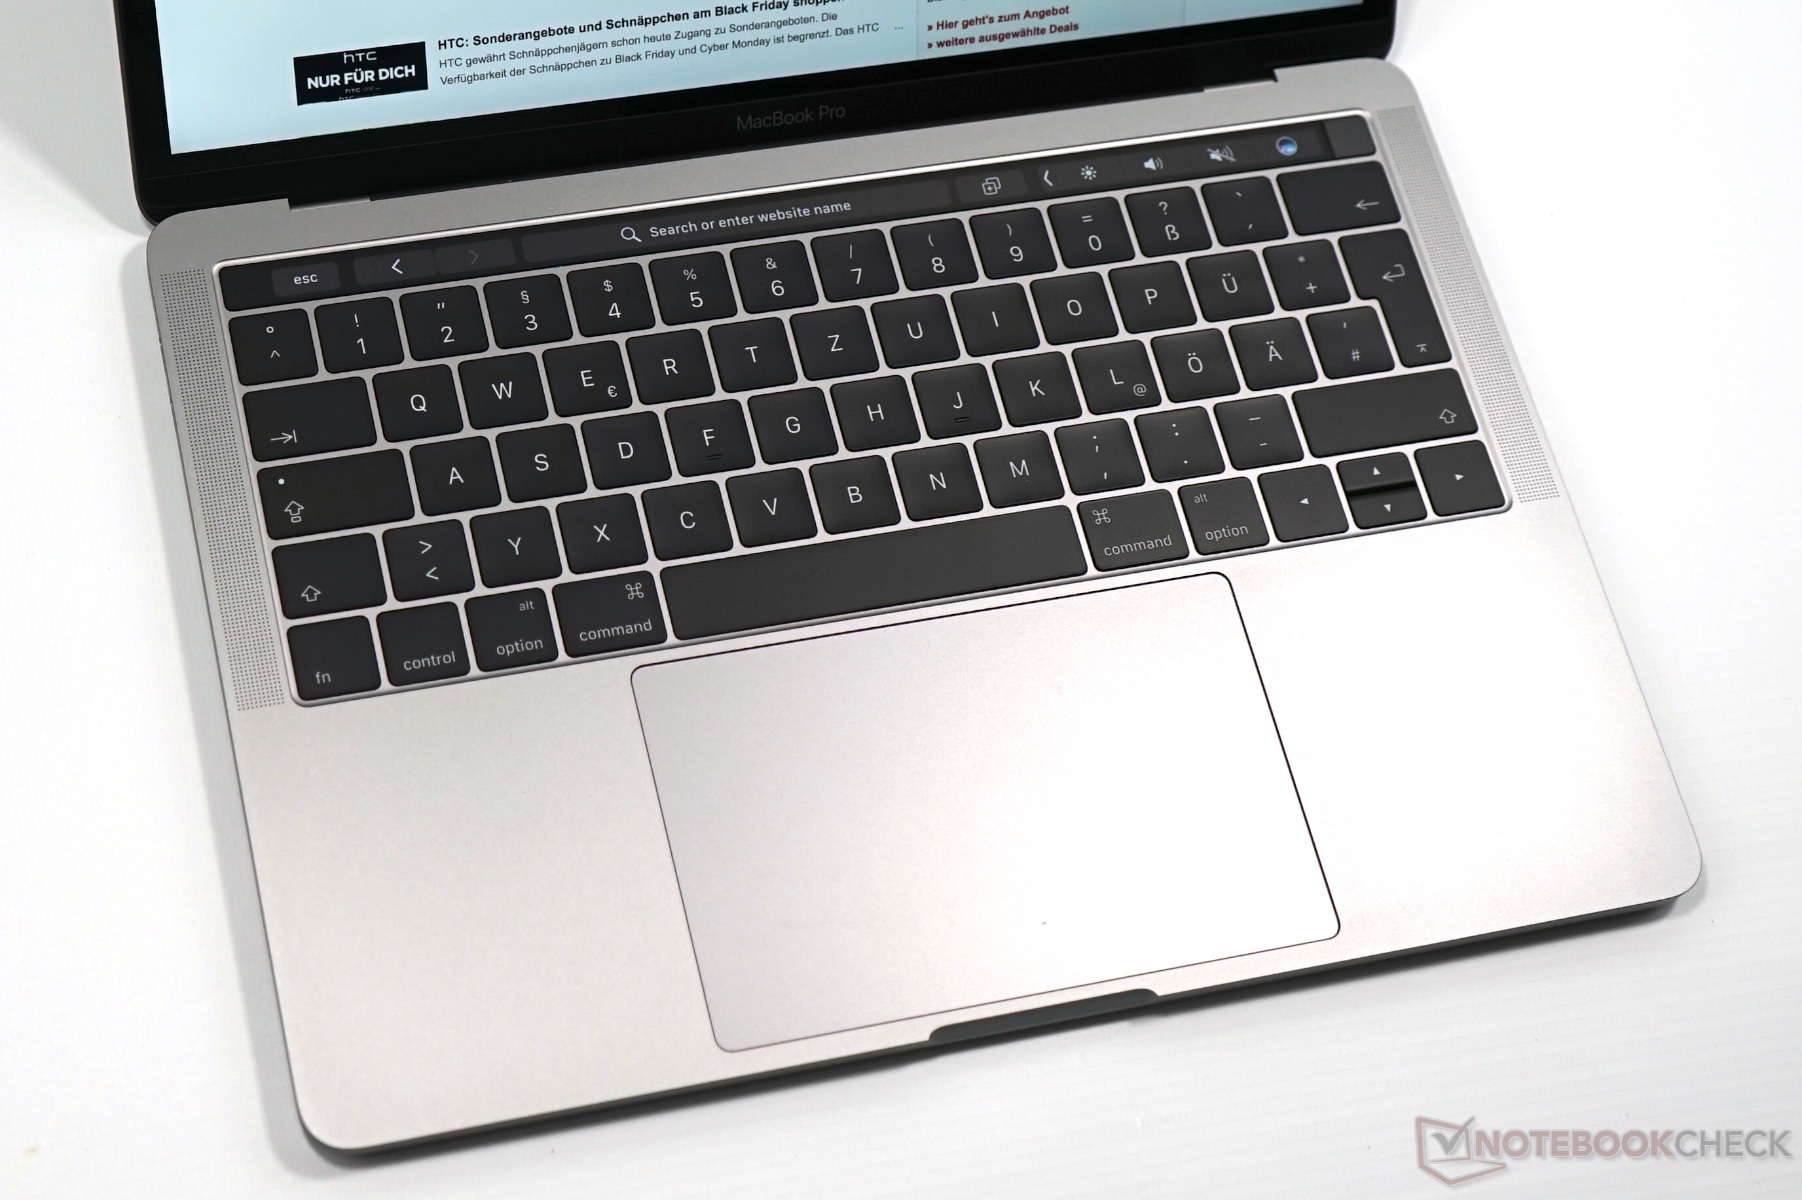
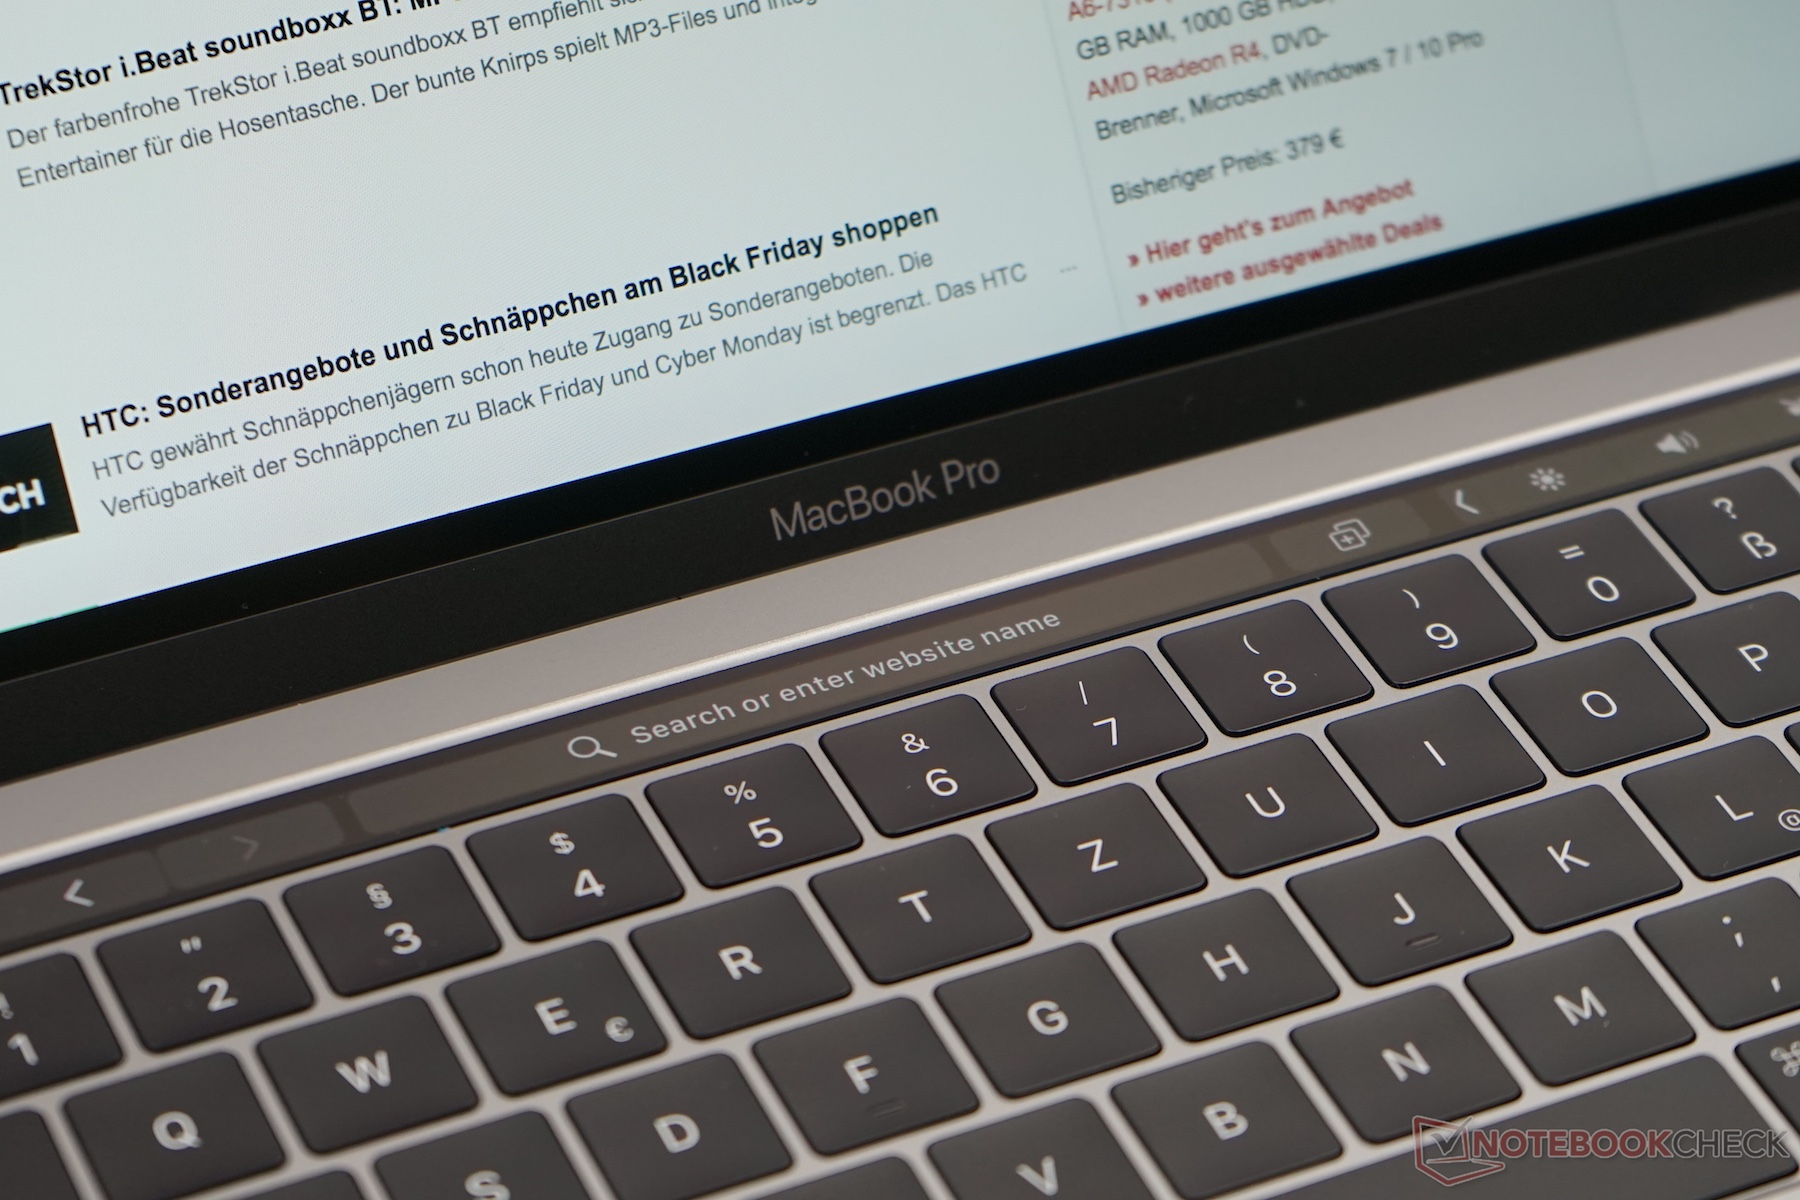
提高的CPU性能和略微修改的键盘:苹果对具有4个Thunderbolt端口的2019 MacBook Pro 13所做的更改很小,在任何情况下都不能明显看出从去年的型号进行的升级。尽管如此,MBP 13仍然是出色的笔记本。
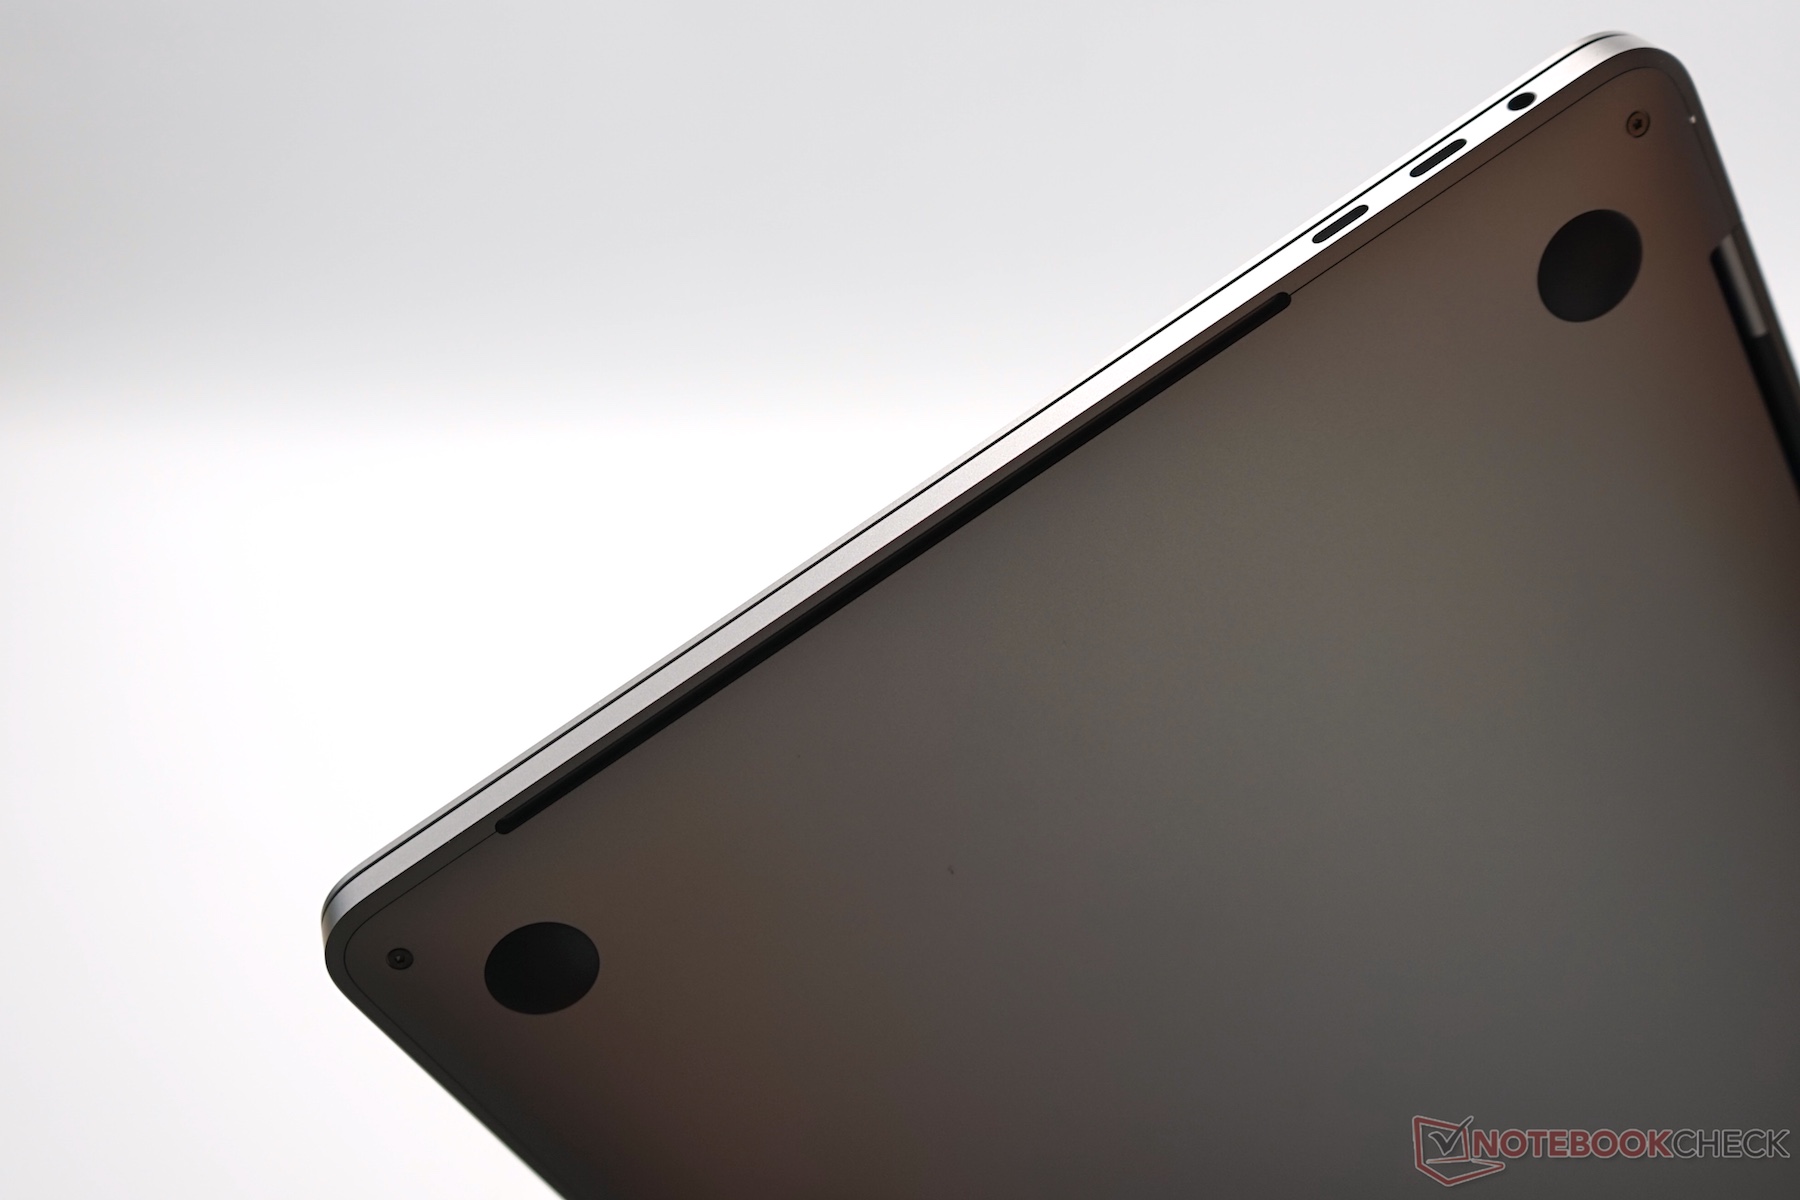
除了众所周知的优点(出色的外壳,完美的触摸板,4个Thunderbolt 3,较长的续航时间)外,前代的缺点依然存在。 Thunderbolt端口具有多种用途,但是在日常使用中,您通常需要适配器。没有SD卡读卡器,键盘仍然是一个主观问题,但是过去几年的可靠性问题已经给人留下了不愉快的印象。最后,硬件升级仍然伴随着很高的价格和溢价。但是,这一切都没有改变以下事实:2019年版的MacBook Pro 13也是一台出色的笔记本电脑。
Apple MacBook Pro 13 2019 i5 4TB3
- 10/02/2019 v7 (old)
Andreas Osthoff
Price comparison
