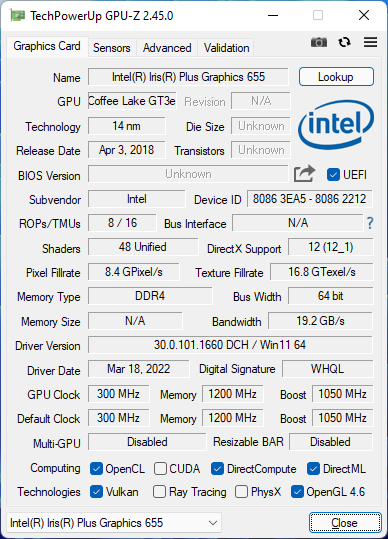
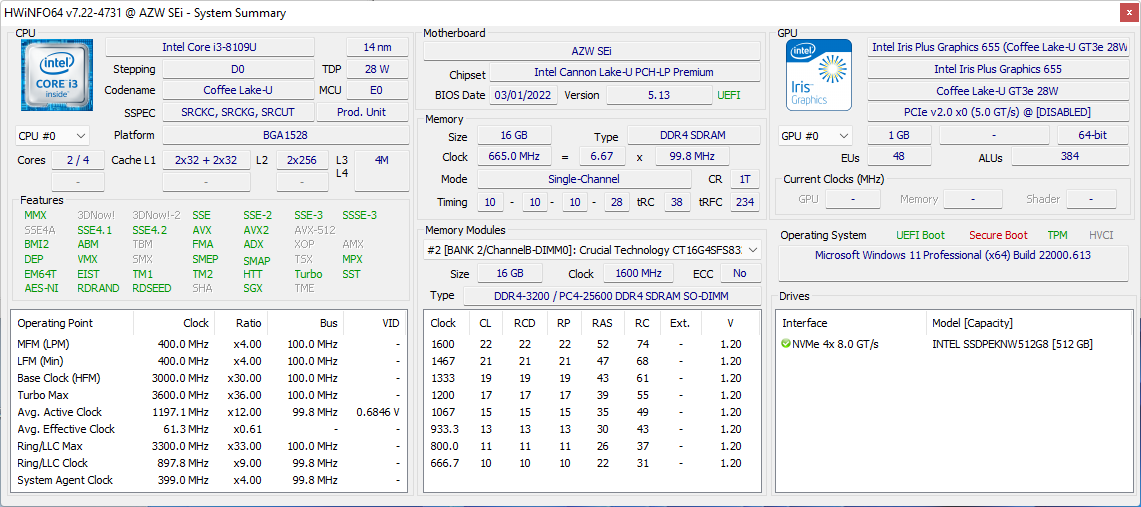
Beelink SEi8回顾。不常见的酷睿i3-8109U用于新的迷你电脑
Beelink正在稳步成为英特尔NUC系列的主要替代品,其迷你电脑的范围不断扩大。例如,最近的SER4已被证明与许多采用第11代酷睿U系列CPU的英特尔NUC模型一样快,而成本却低数百美元。
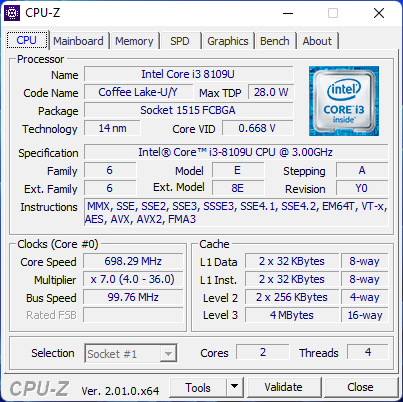
SEi8配备了较旧的第八代酷睿i3-8109U或酷睿i5-8259U,而去年的SEi10则配备了第十代酷睿U系列选项。旧的酷睿i3使该模型更加实惠,是酷睿i3驱动的英特尔NUC的一个有吸引力的替代品。
Beelink目前正在运送SEi8的起价为320美元,含8GB内存,或380美元,含16GB内存。如果配置酷睿i5-8279U,价格将上升到400美元的范围。
更多关于Beelink的评论。
潜在的竞争对手比较
Rating | Date | Model | Weight | Height | Size | Resolution | Price |
|---|---|---|---|---|---|---|---|
v (old) | 04 / 2022 | Beelink SEi8 i3-8109U, Iris Plus Graphics 655 | 346 g | 41 mm | x | ||
v (old) | Beelink SEi10 i3-1005G1, UHD Graphics G1 (Ice Lake 32 EU) | 350 g | 41 mm | x | |||
v (old) | 04 / 2022 | Beelink SER4 R7 4800U, Vega 8 | 494 g | 40 mm | x | ||
v (old) | Intel NUC11TNKi5 i5-1135G7, Iris Xe G7 80EUs | 504 g | 37 mm | x | |||
v (old) | Intel NUC8i7BE i7-8559U, Iris Plus Graphics 655 | 683 g | 51 mm | x | |||
v (old) | GMK NucBox 2 i5-8259U, Iris Plus Graphics 655 | 430 g | 50 mm | x |
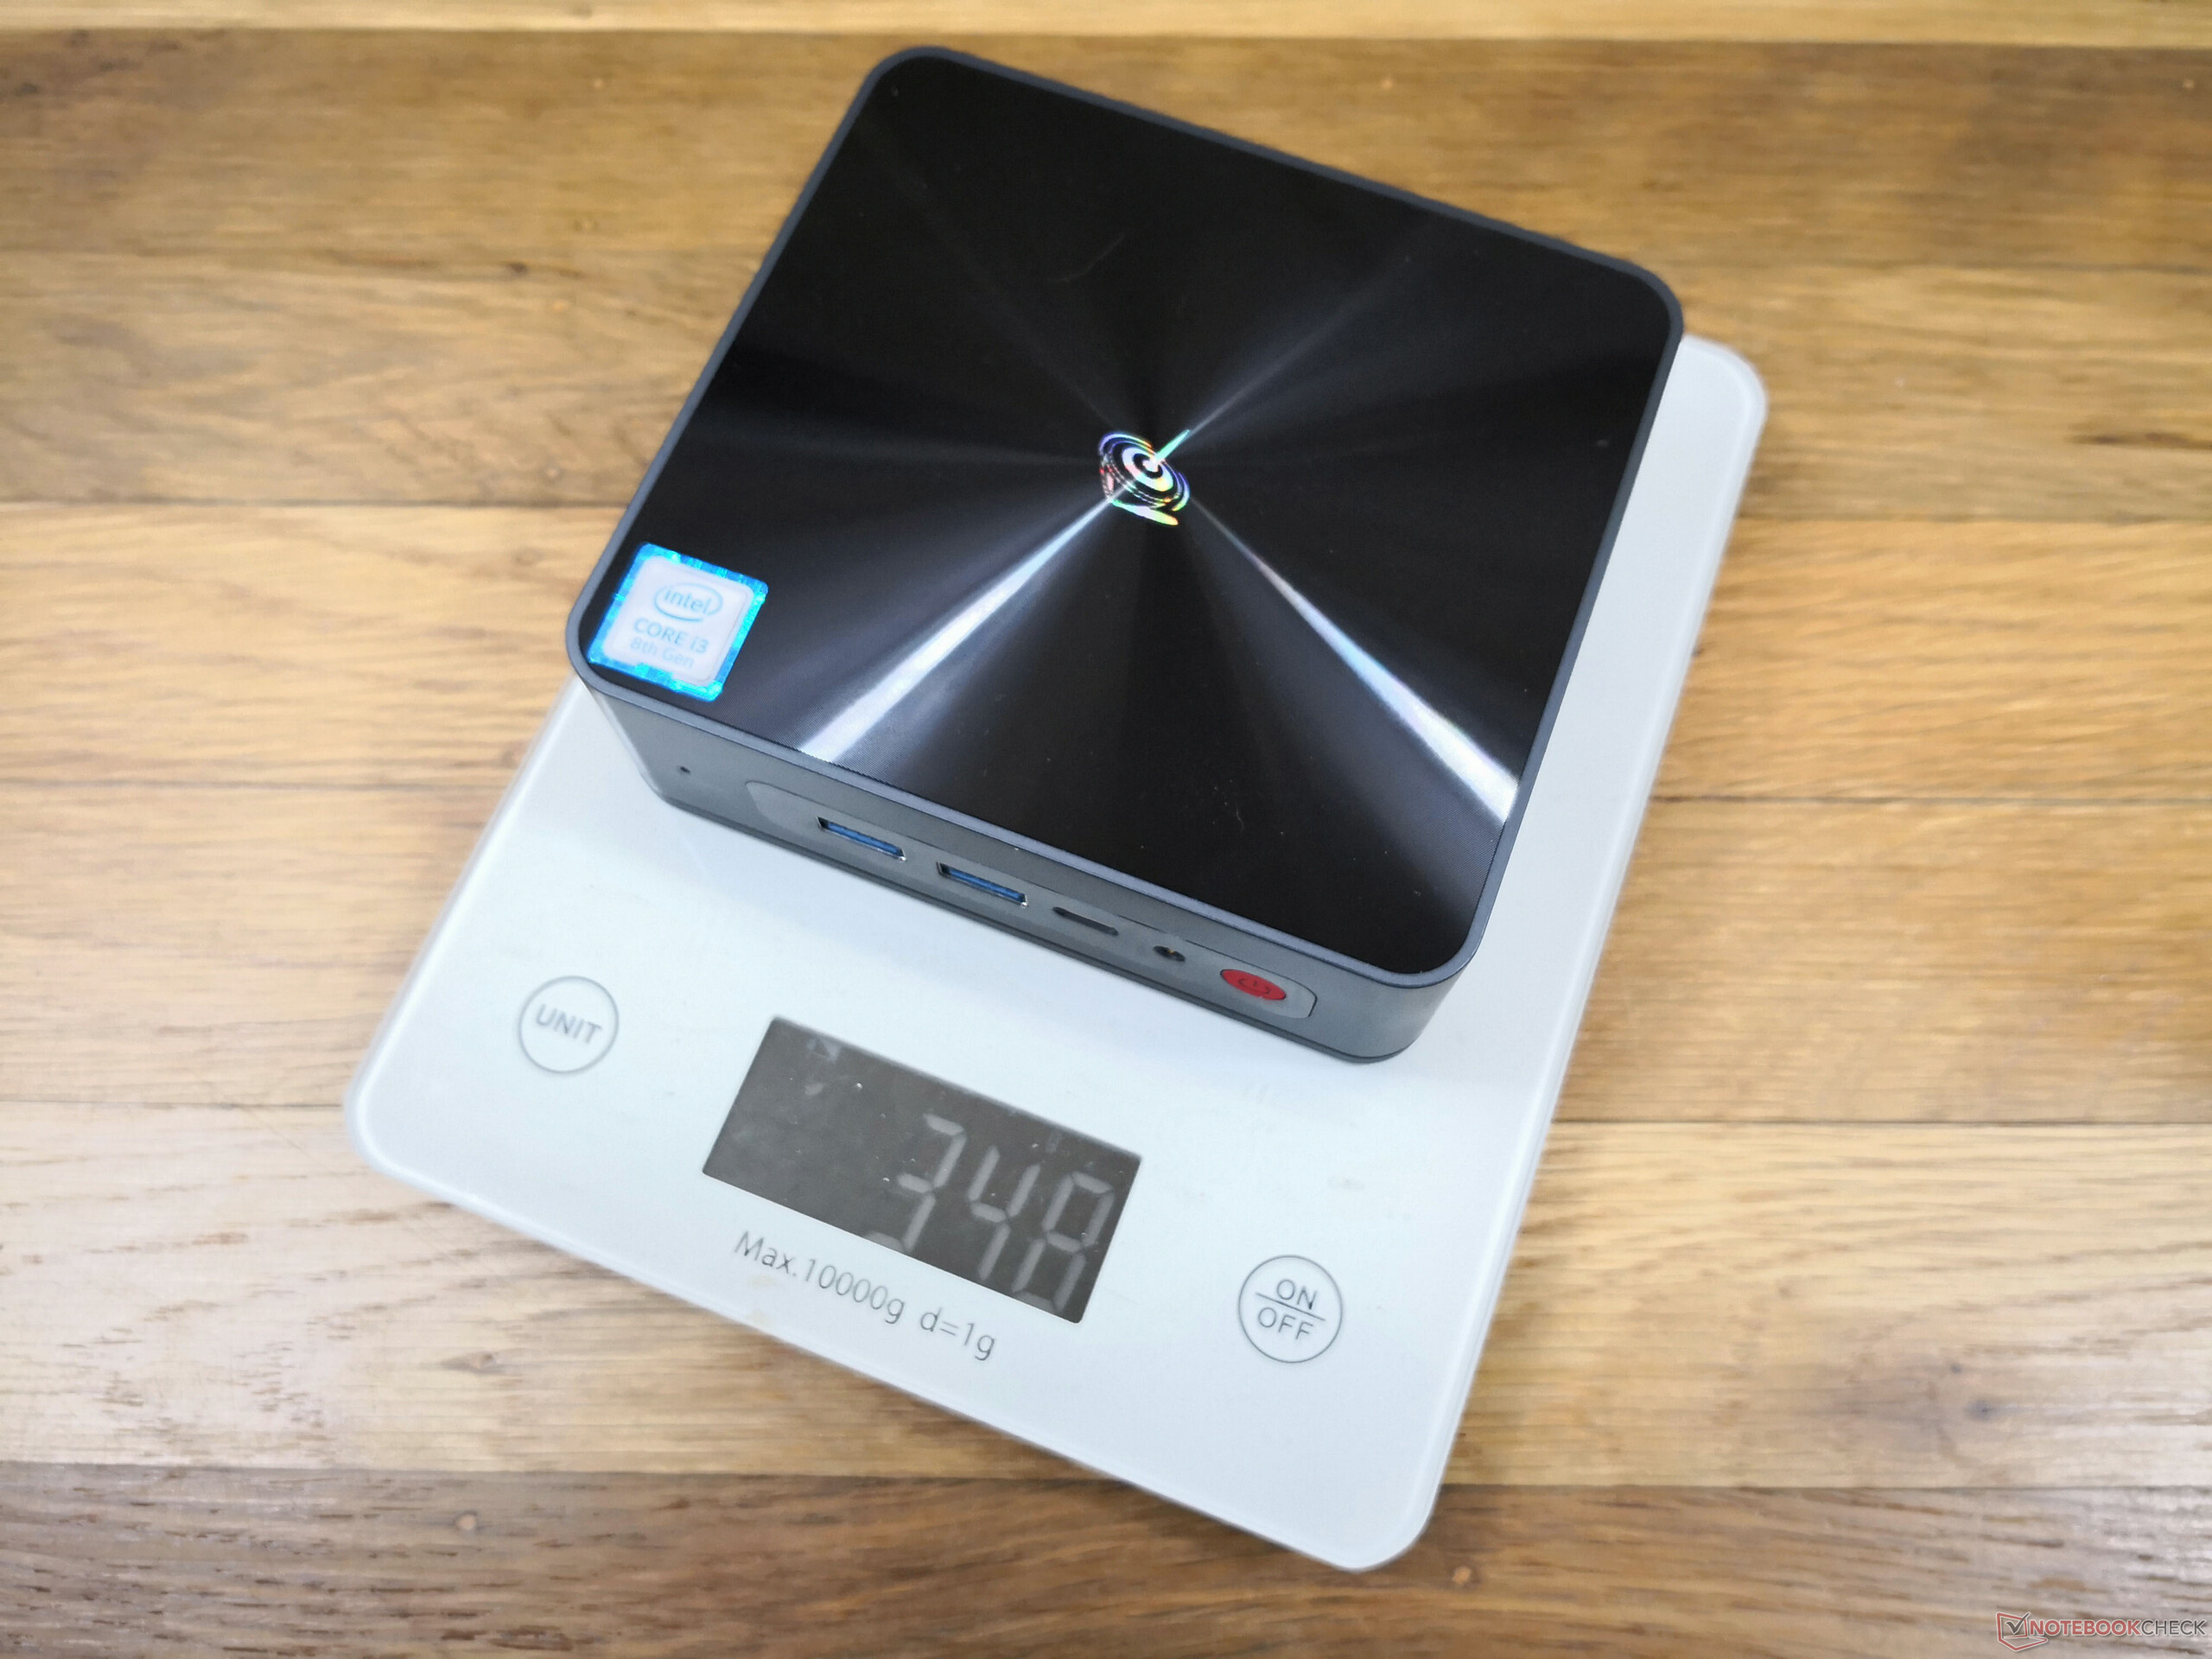
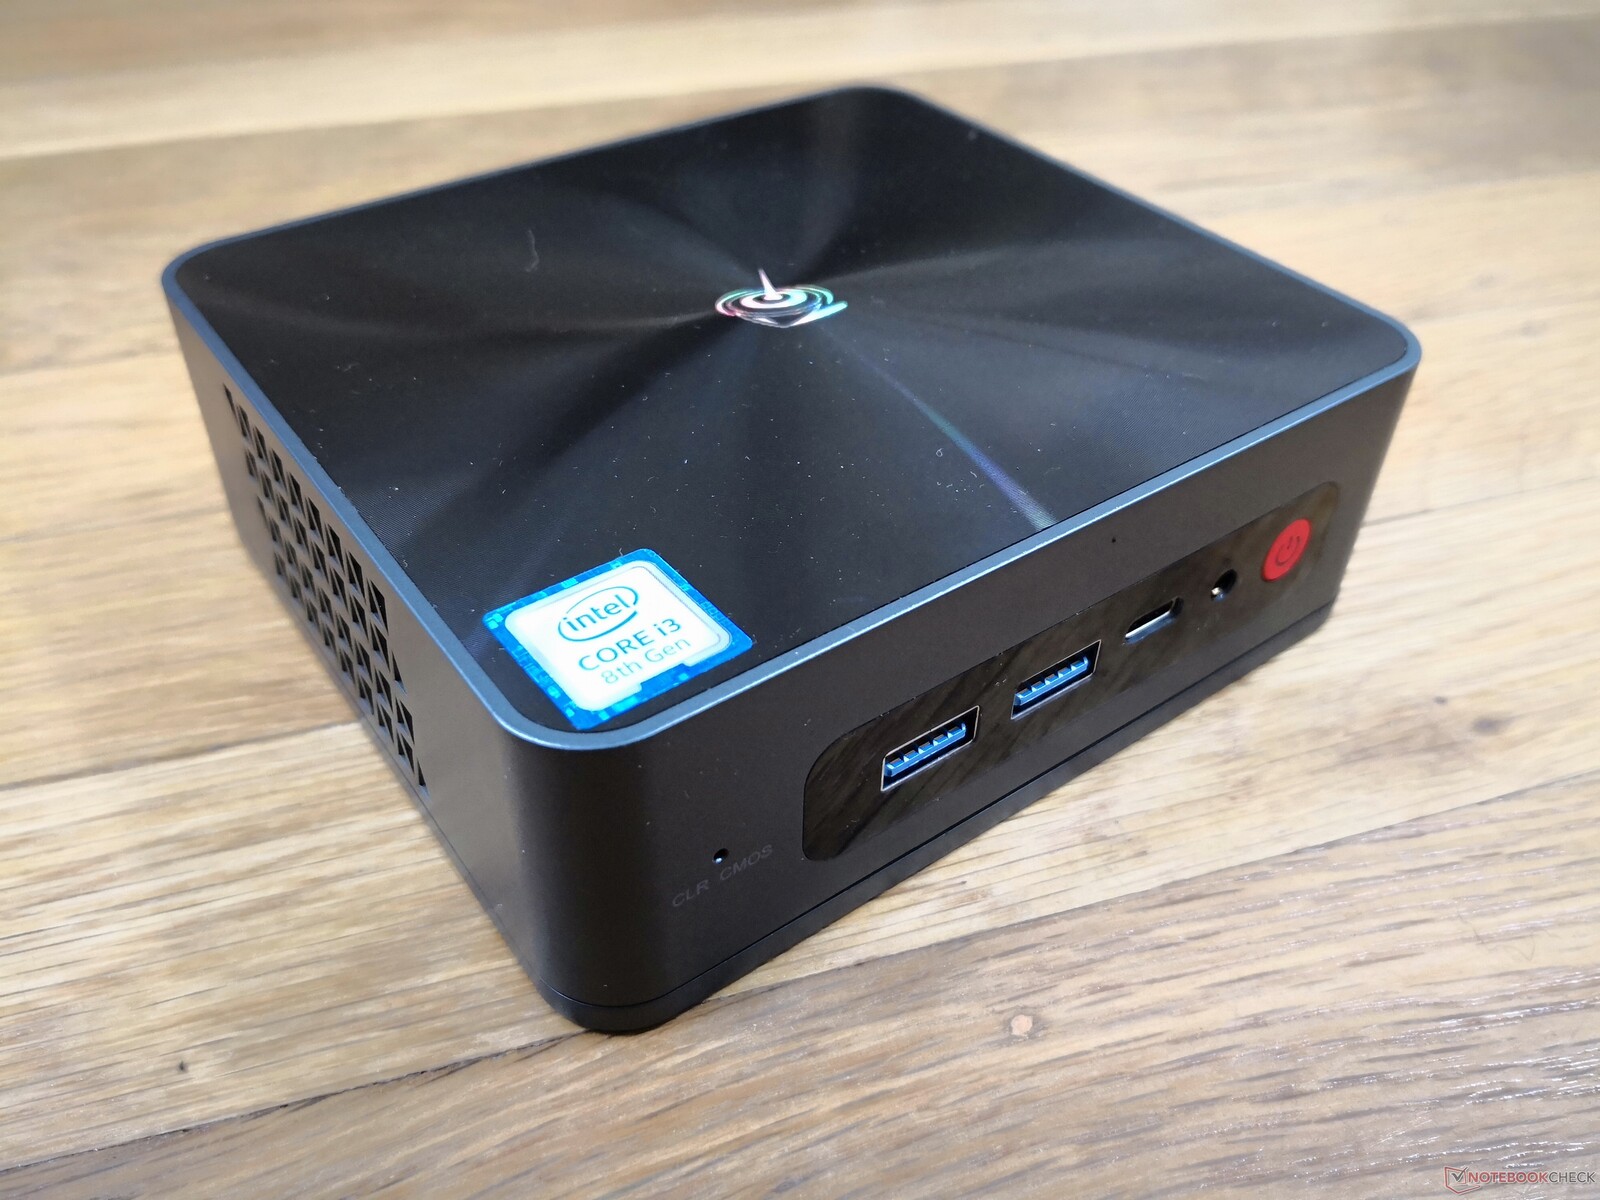
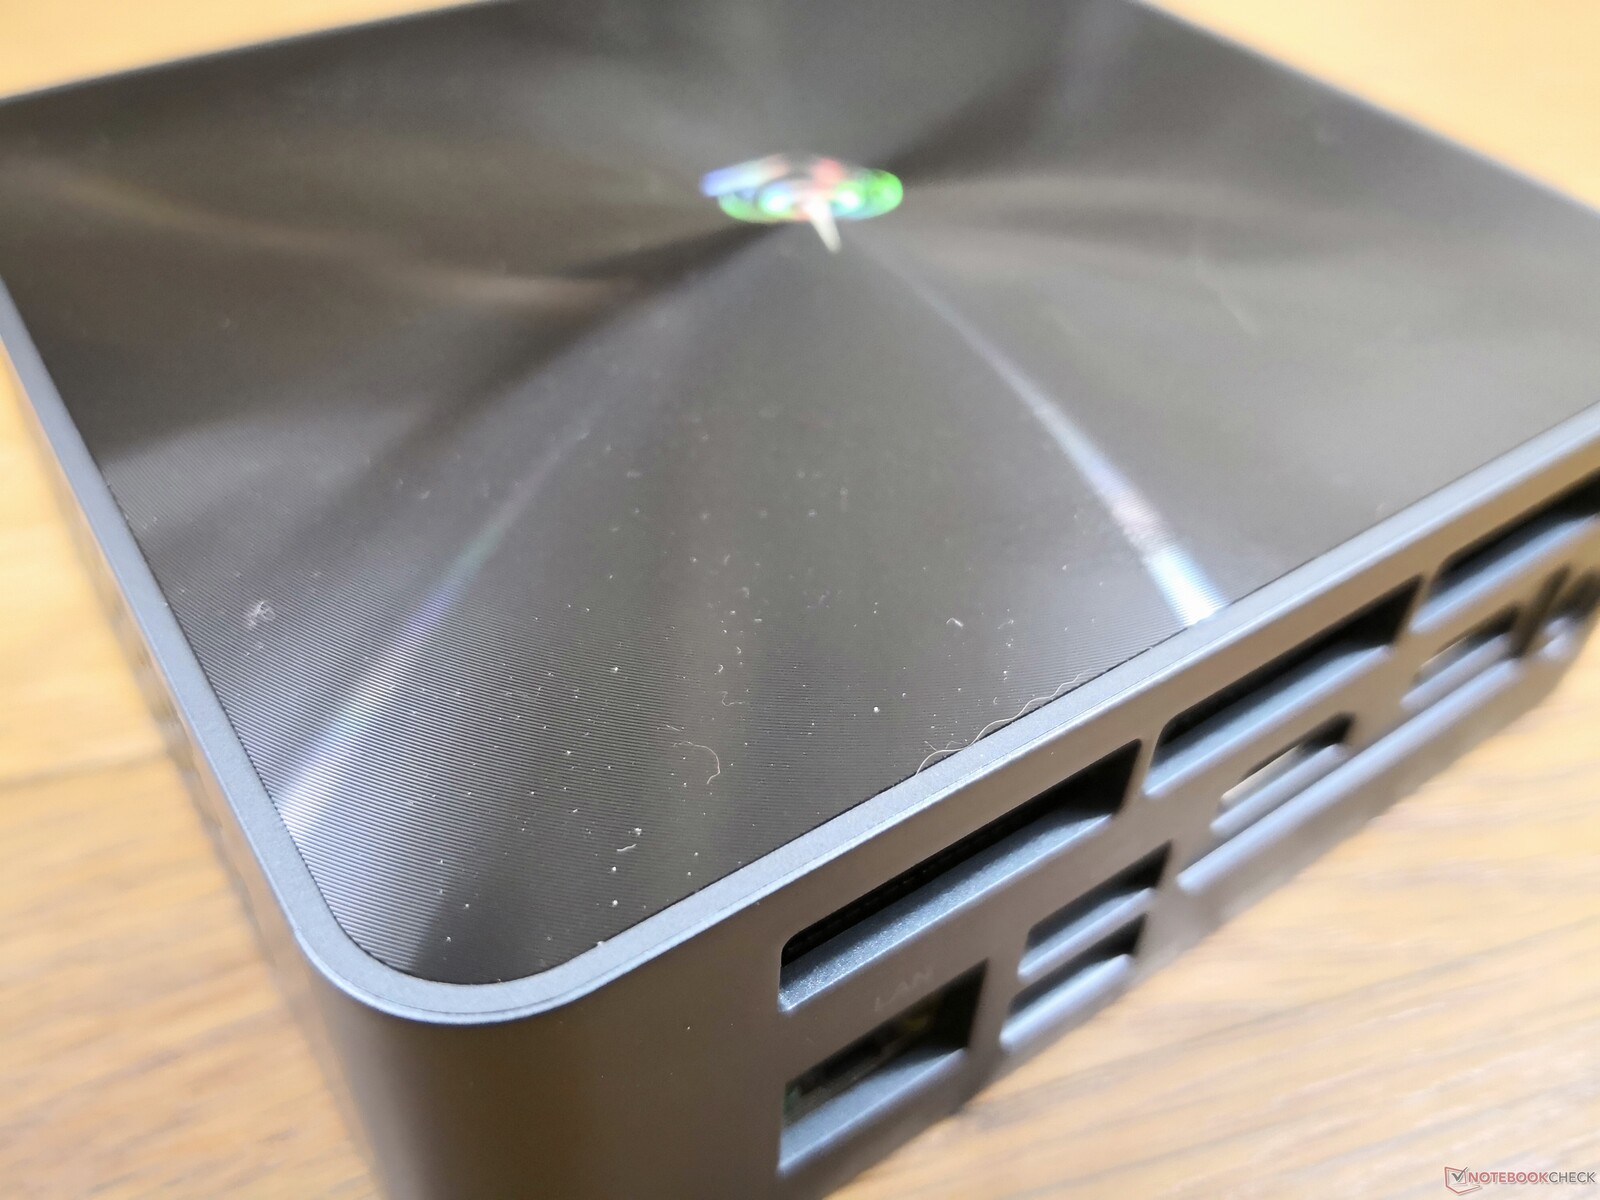
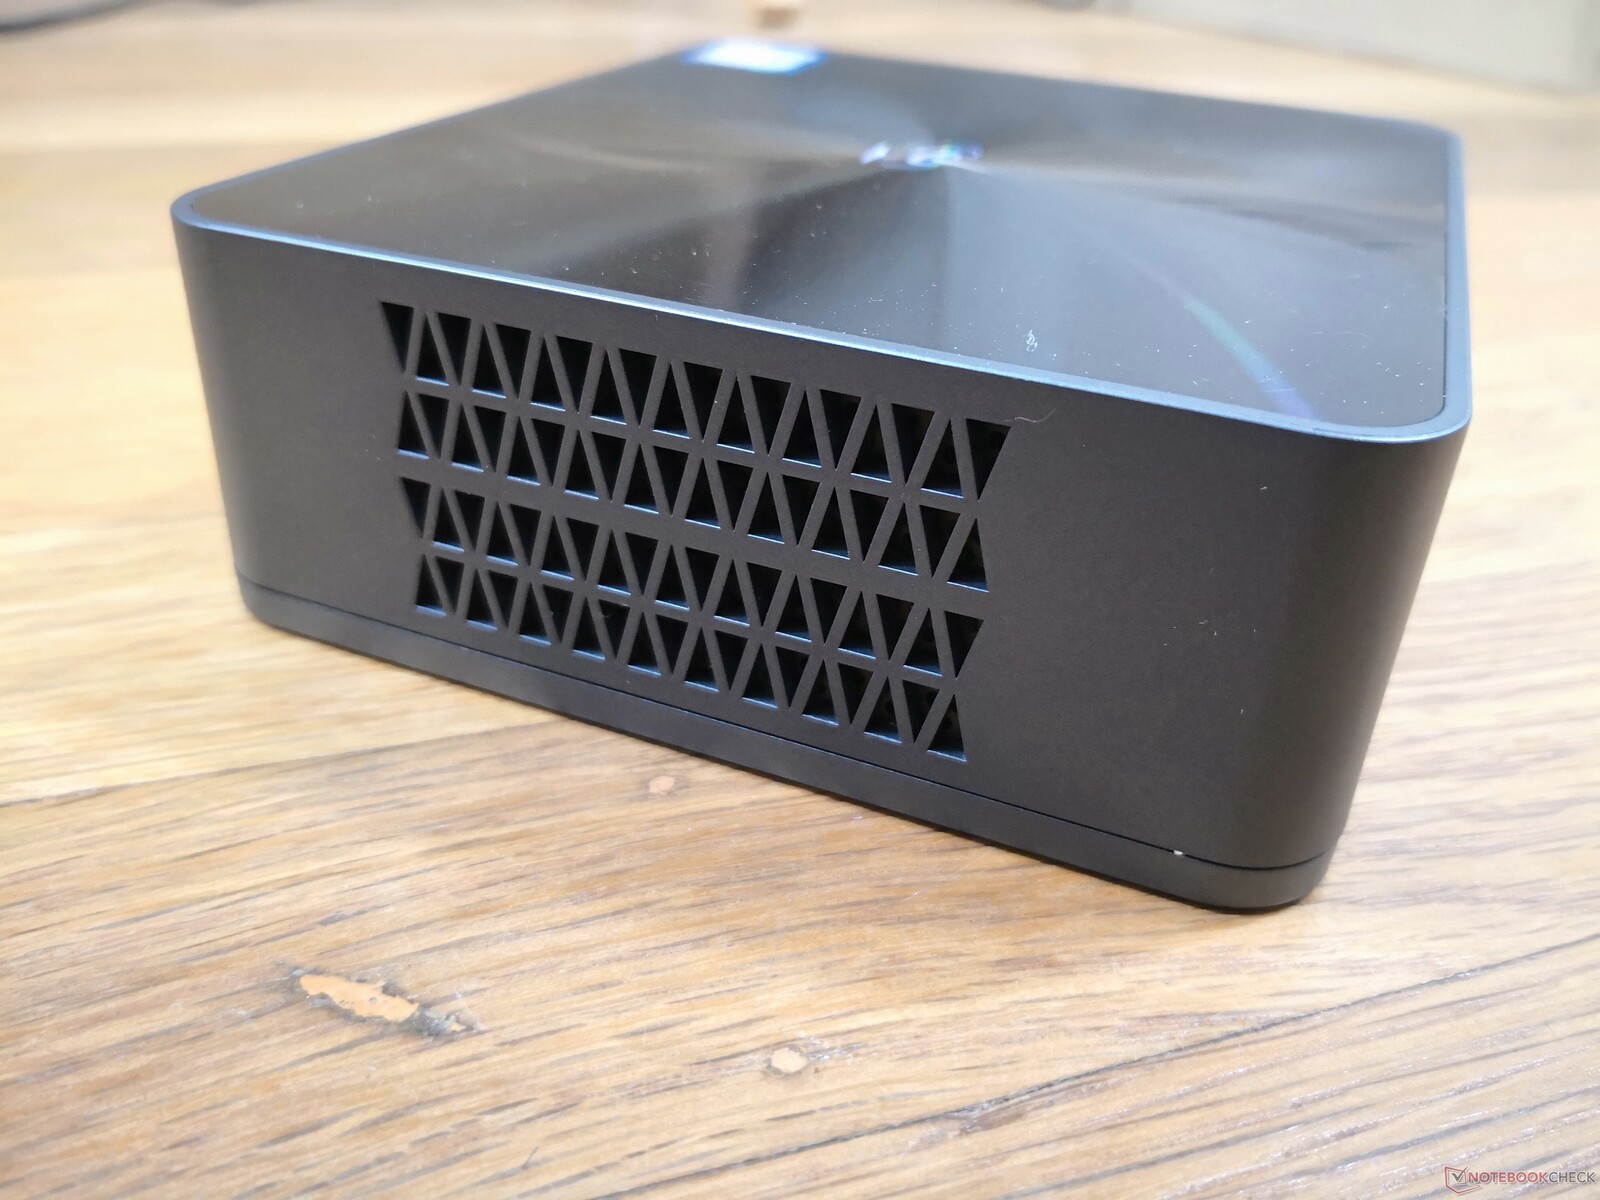
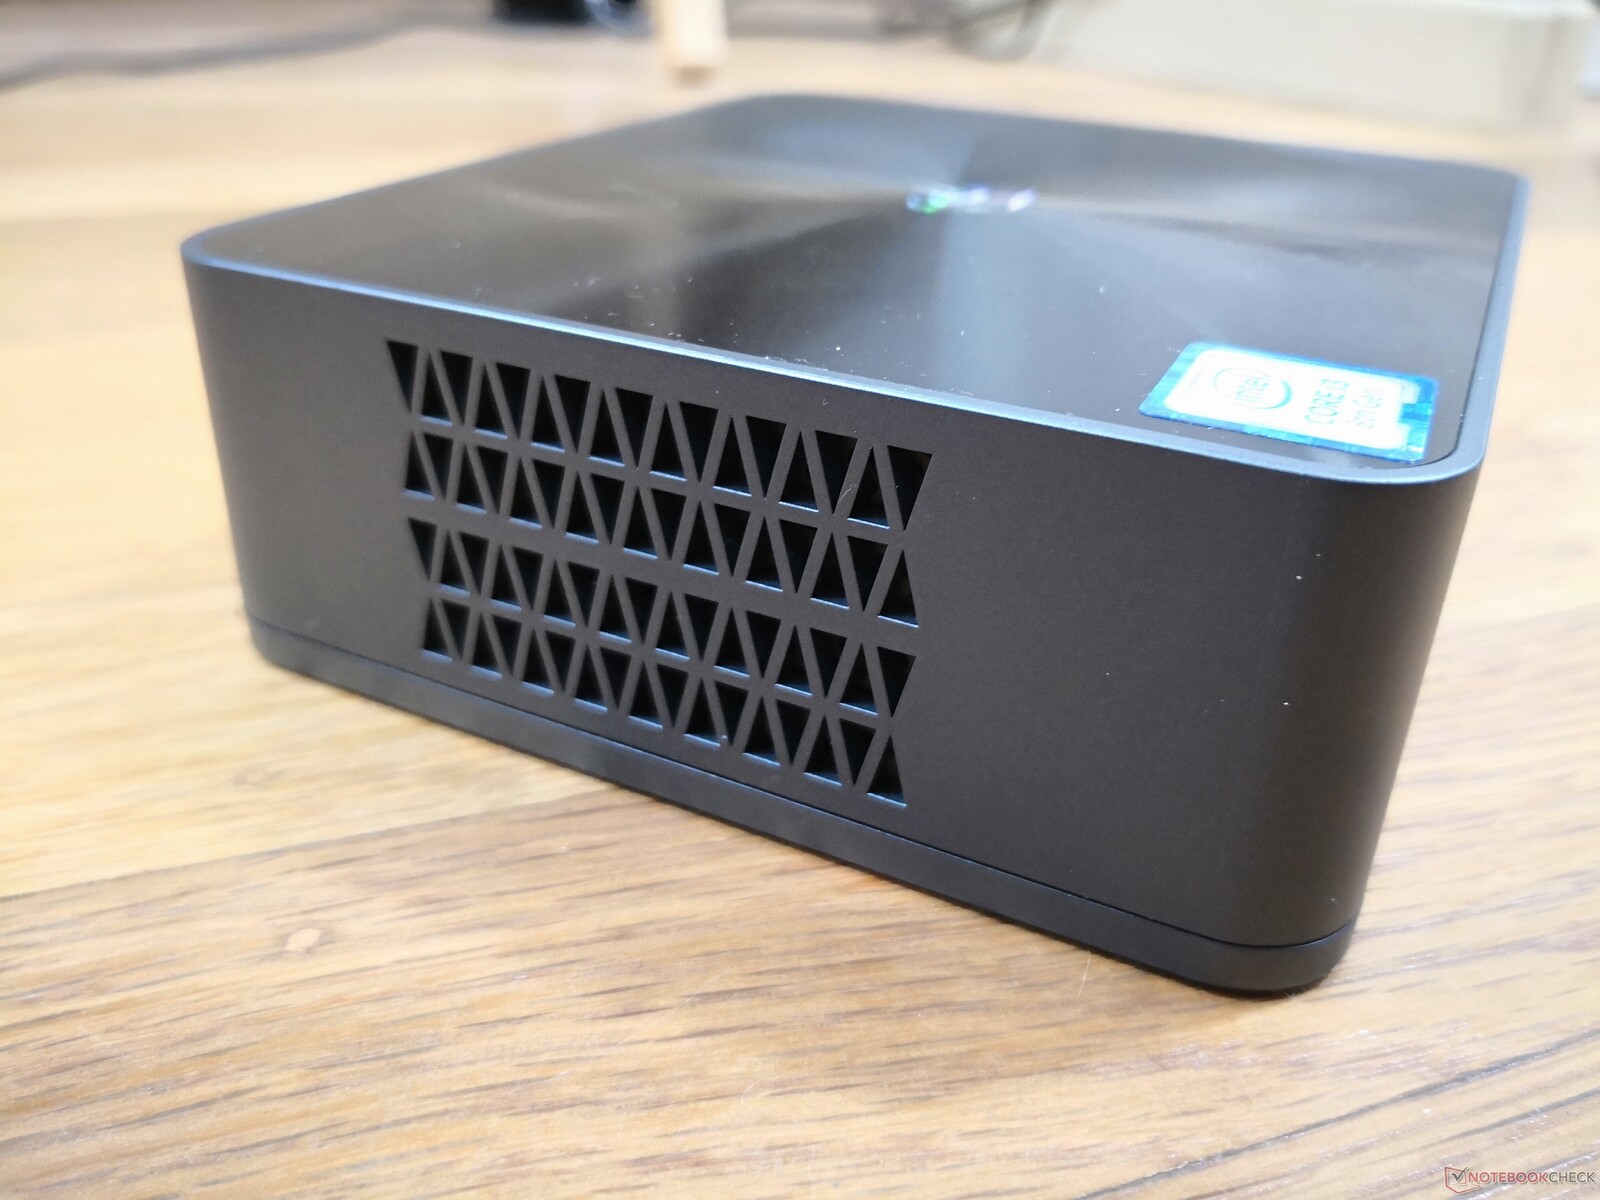
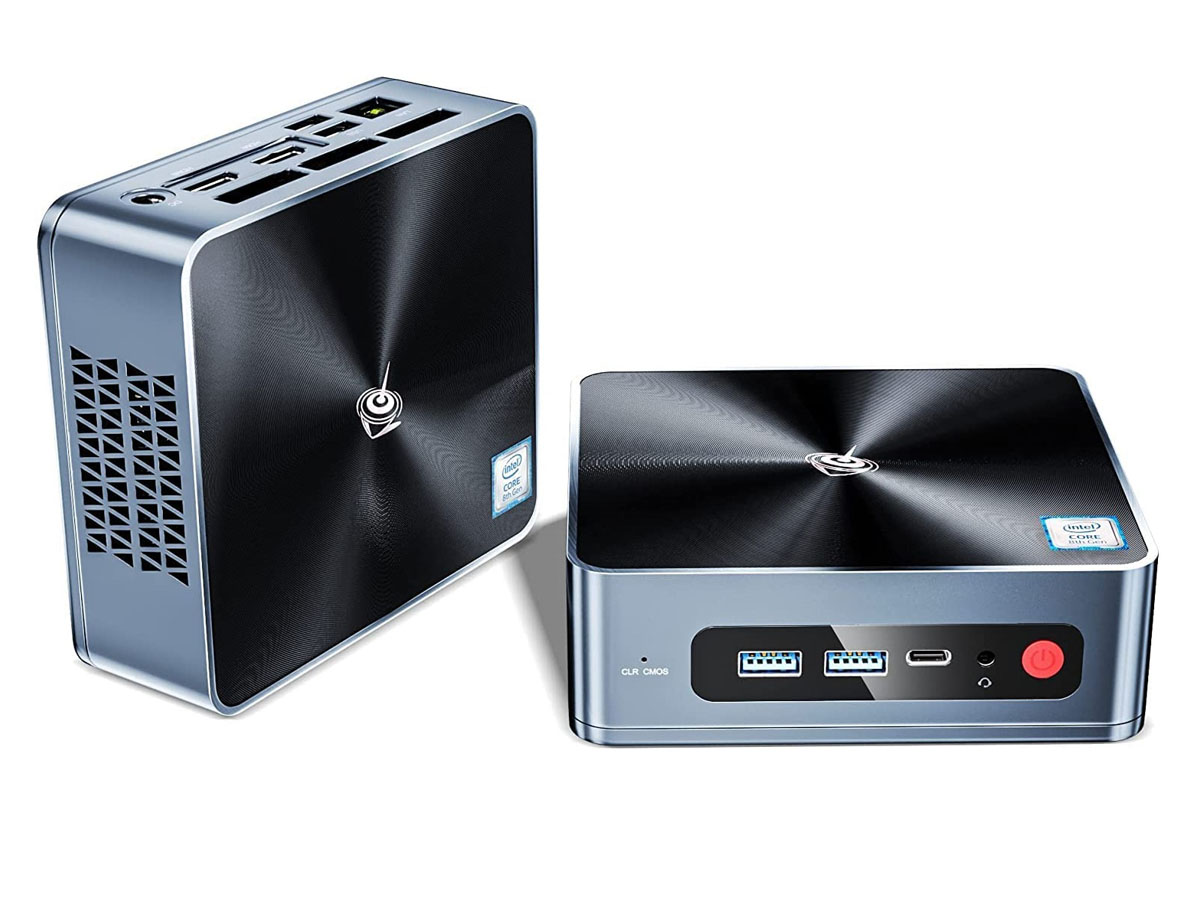
案例
外部机箱与SEi10相同。它的设计值得注意的是与英特尔NUC的尺寸差不多,而重量却轻了30%。机箱材料虽然仍然很坚硬,但没有NUC那么厚或结实。
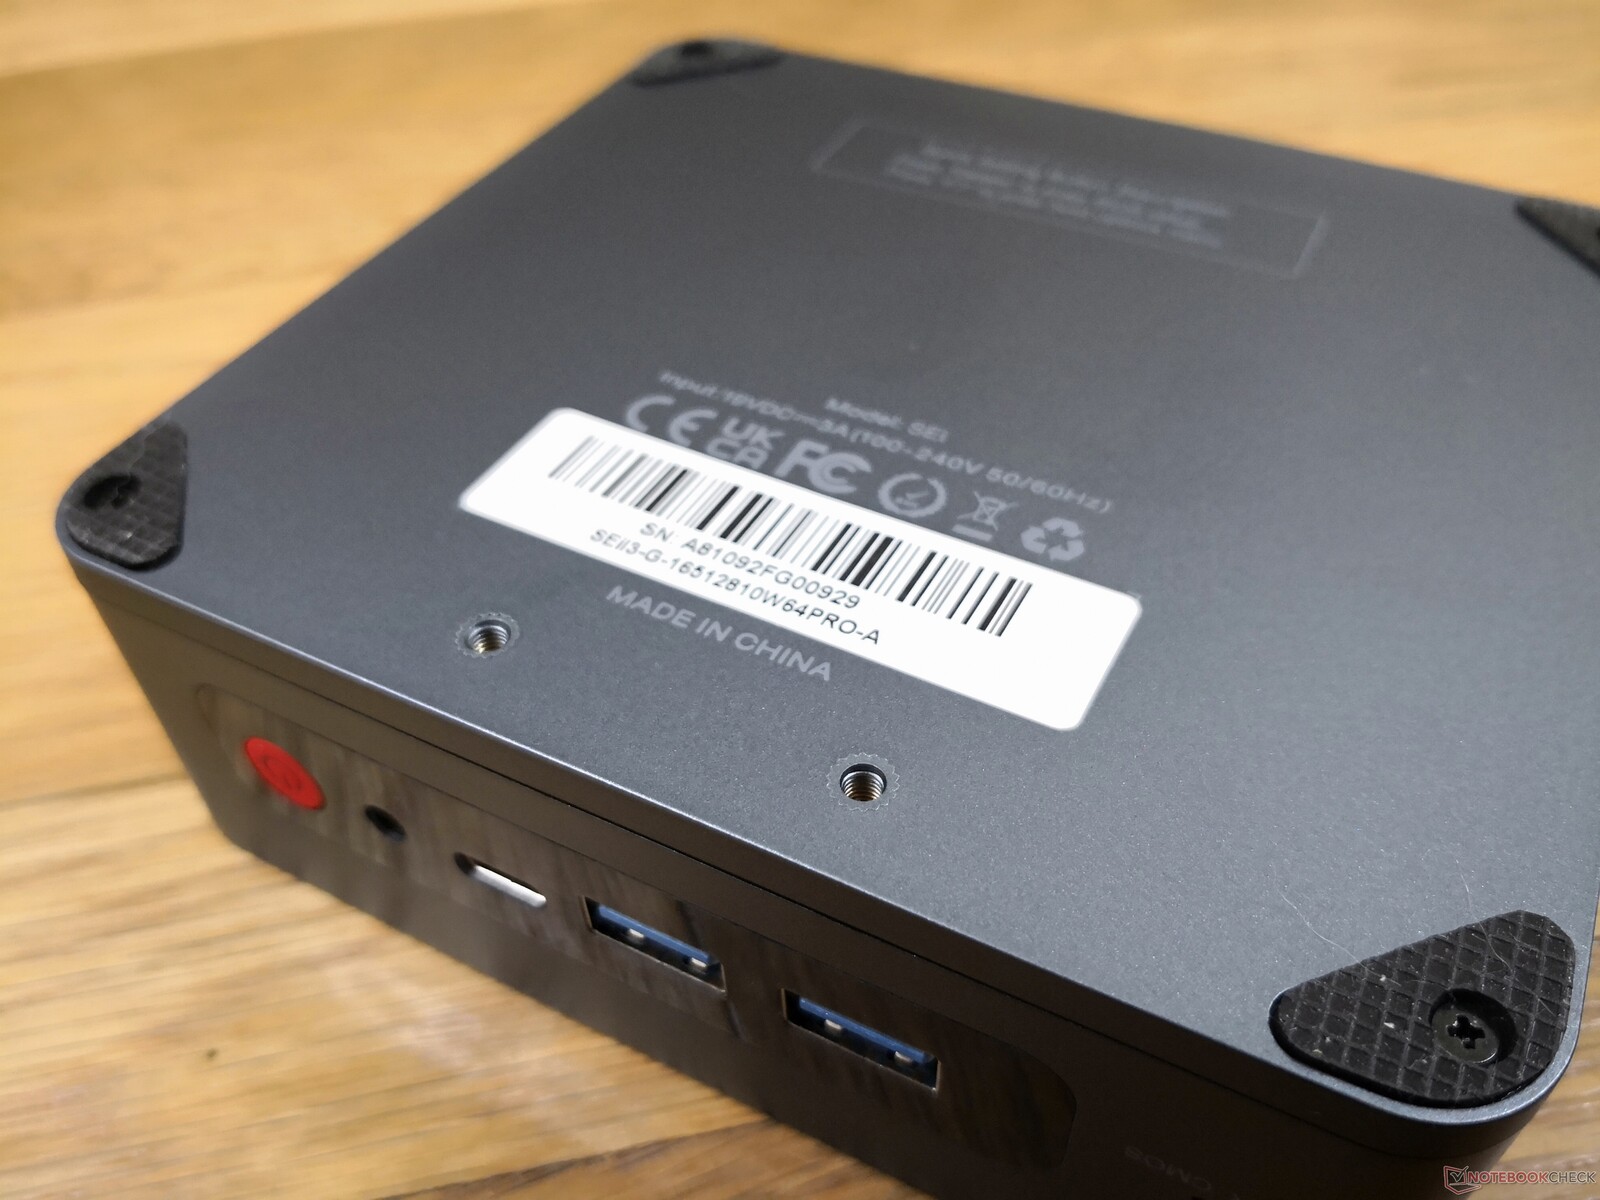
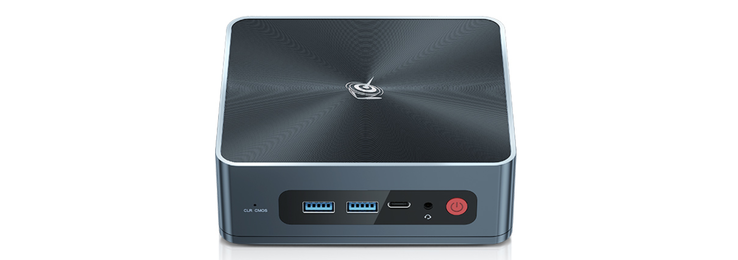
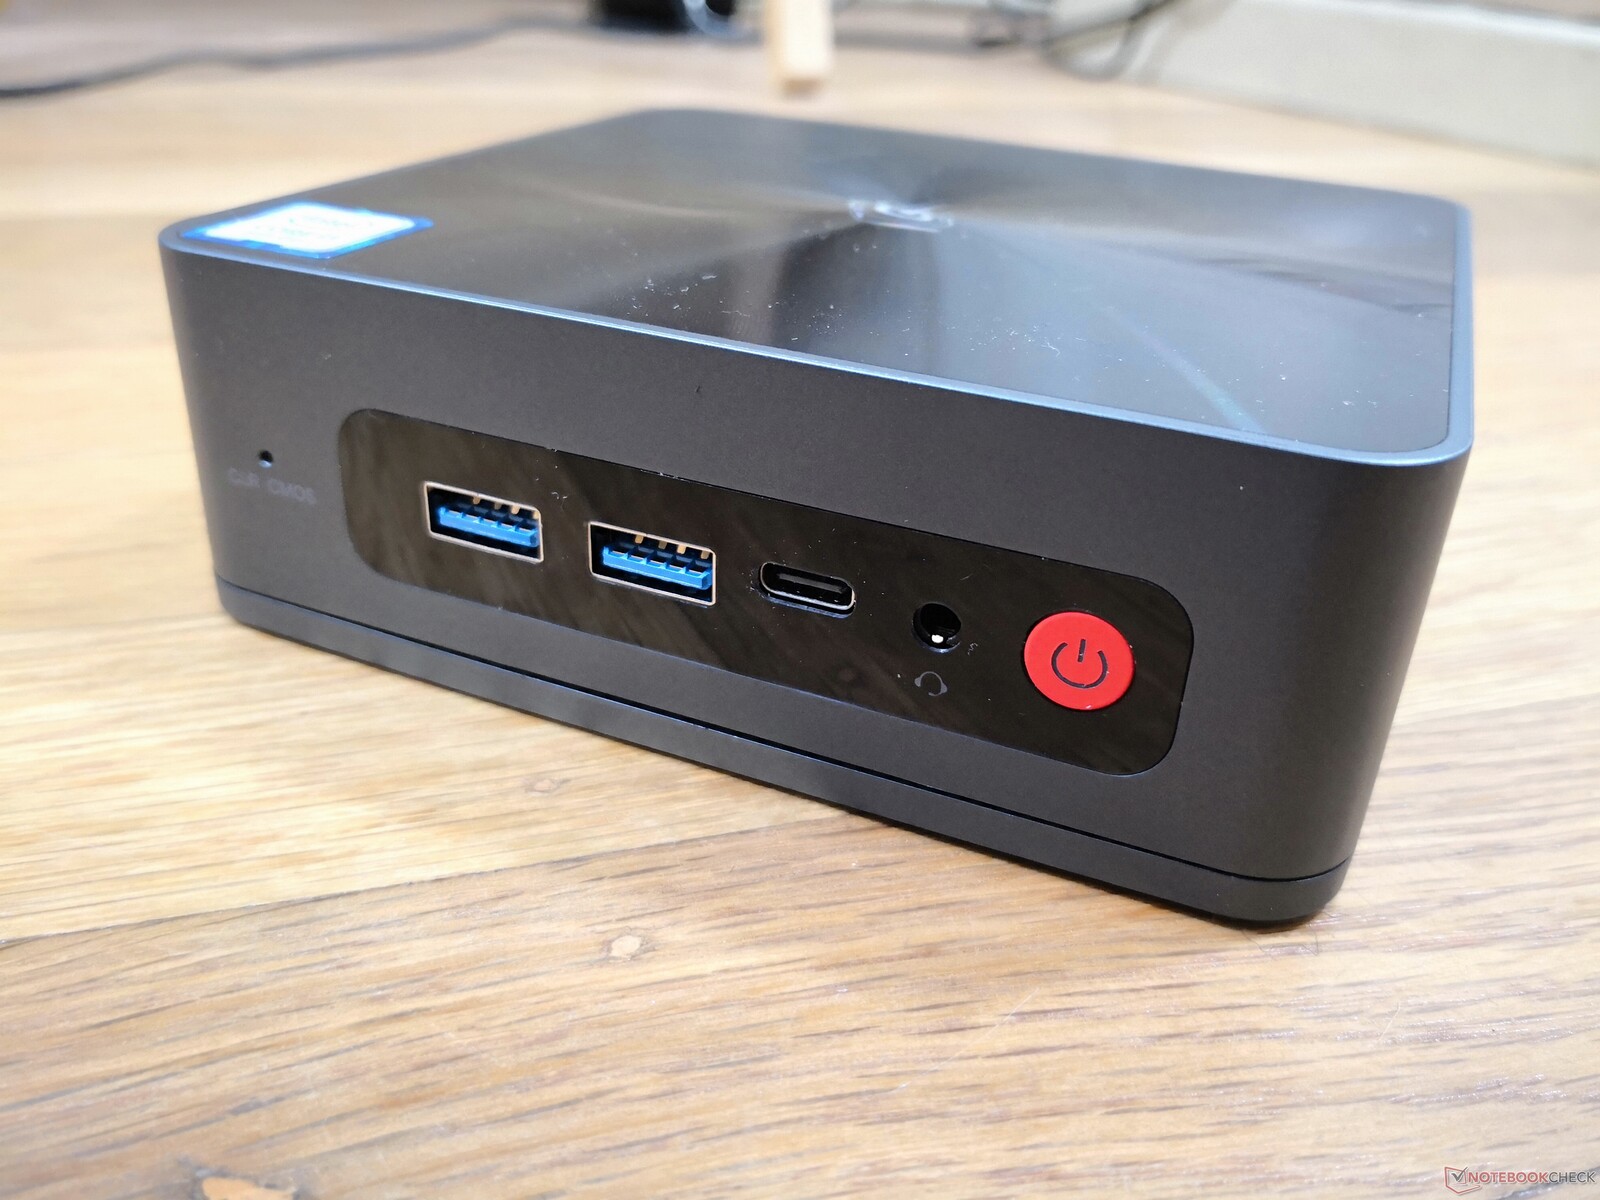
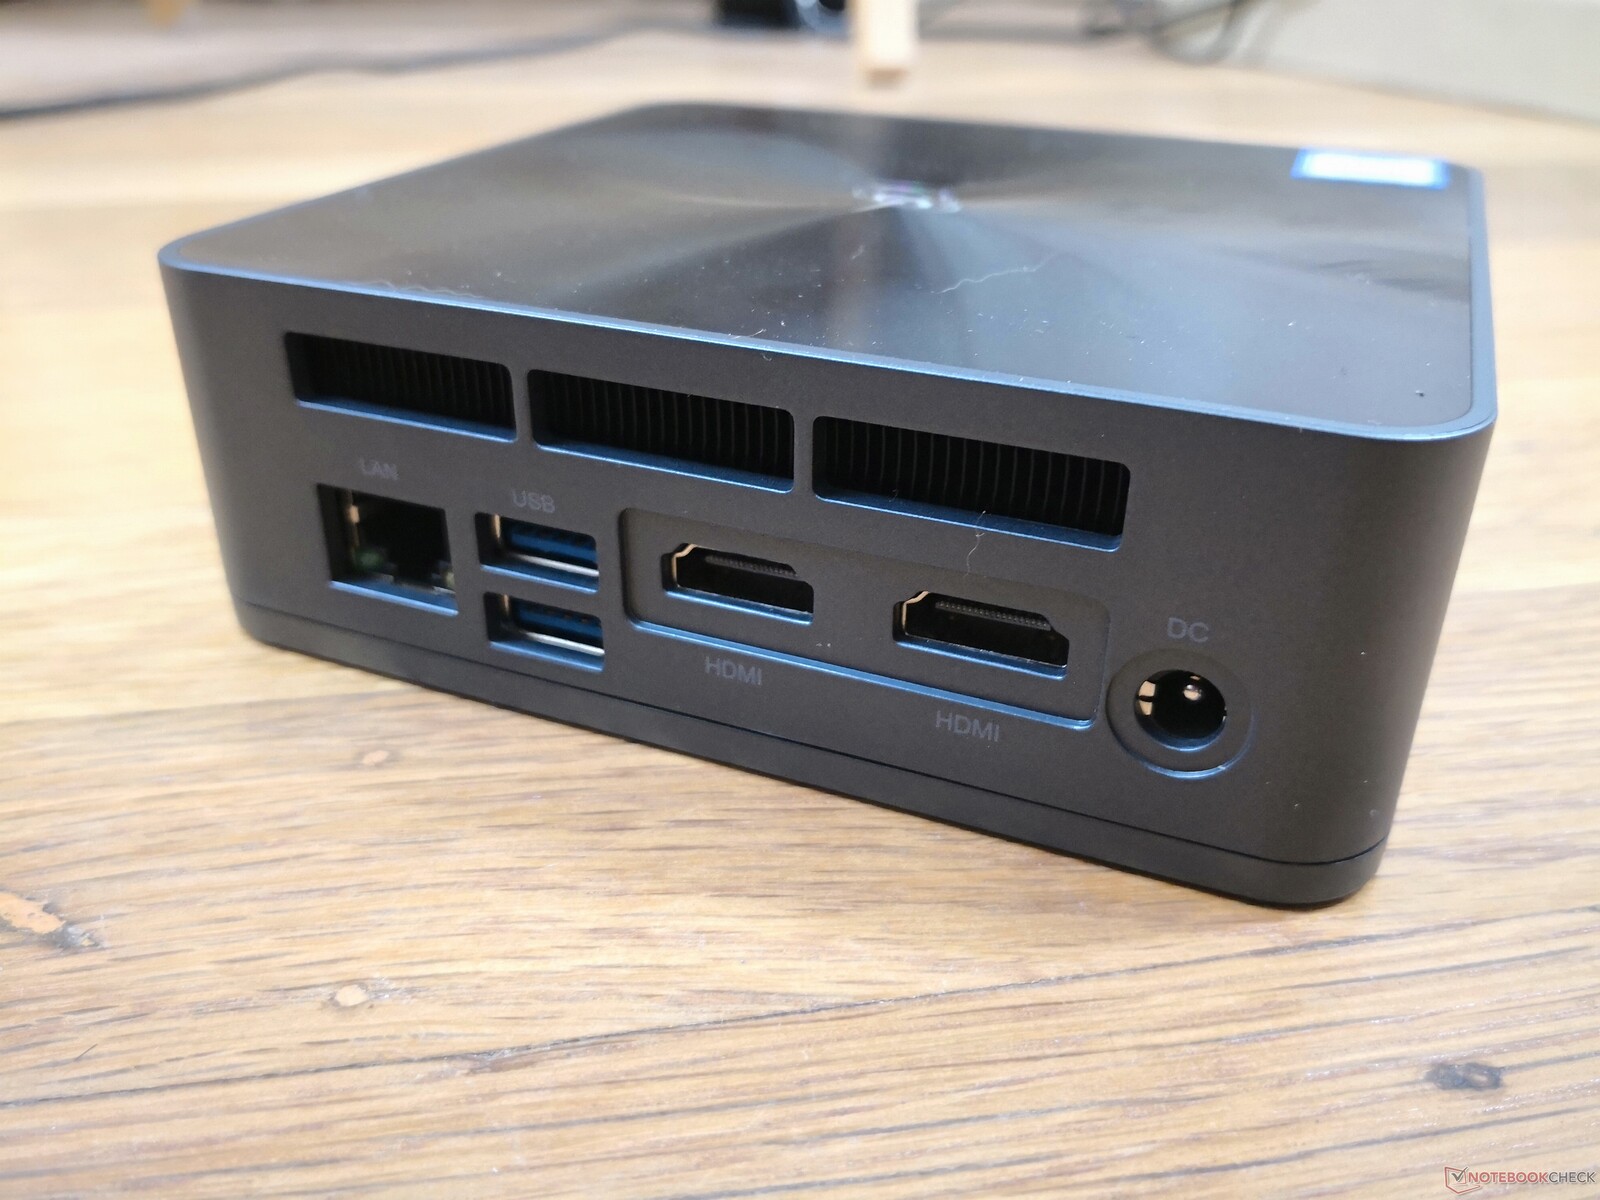
连接性
除了不支持Thunderbolt和不再有集成的SD读卡器外,端口选项与SEi10完全相同。我们可以确认,USB-C端口仍然支持DisplayPort,但它不能像SER4那样用于为迷你电脑供电。
沟通
内置有线和无线通信模块,将网络测试数据与竞争对手进行比较,可用的替代解决方案(5G/LTE)?,不规则(无线电接收)?
| Networking | |
| iperf3 transmit AX12 | |
| Intel NUC11TNKi5 | |
| Beelink SER4 | |
| Beelink SEi10 | |
| Intel NUC8i7BE | |
| GMK NucBox 2 | |
| Beelink SEi8 | |
| iperf3 receive AX12 | |
| Intel NUC11TNKi5 | |
| Beelink SEi10 | |
| Beelink SER4 | |
| GMK NucBox 2 | |
| Intel NUC8i7BE | |
| Beelink SEi8 | |
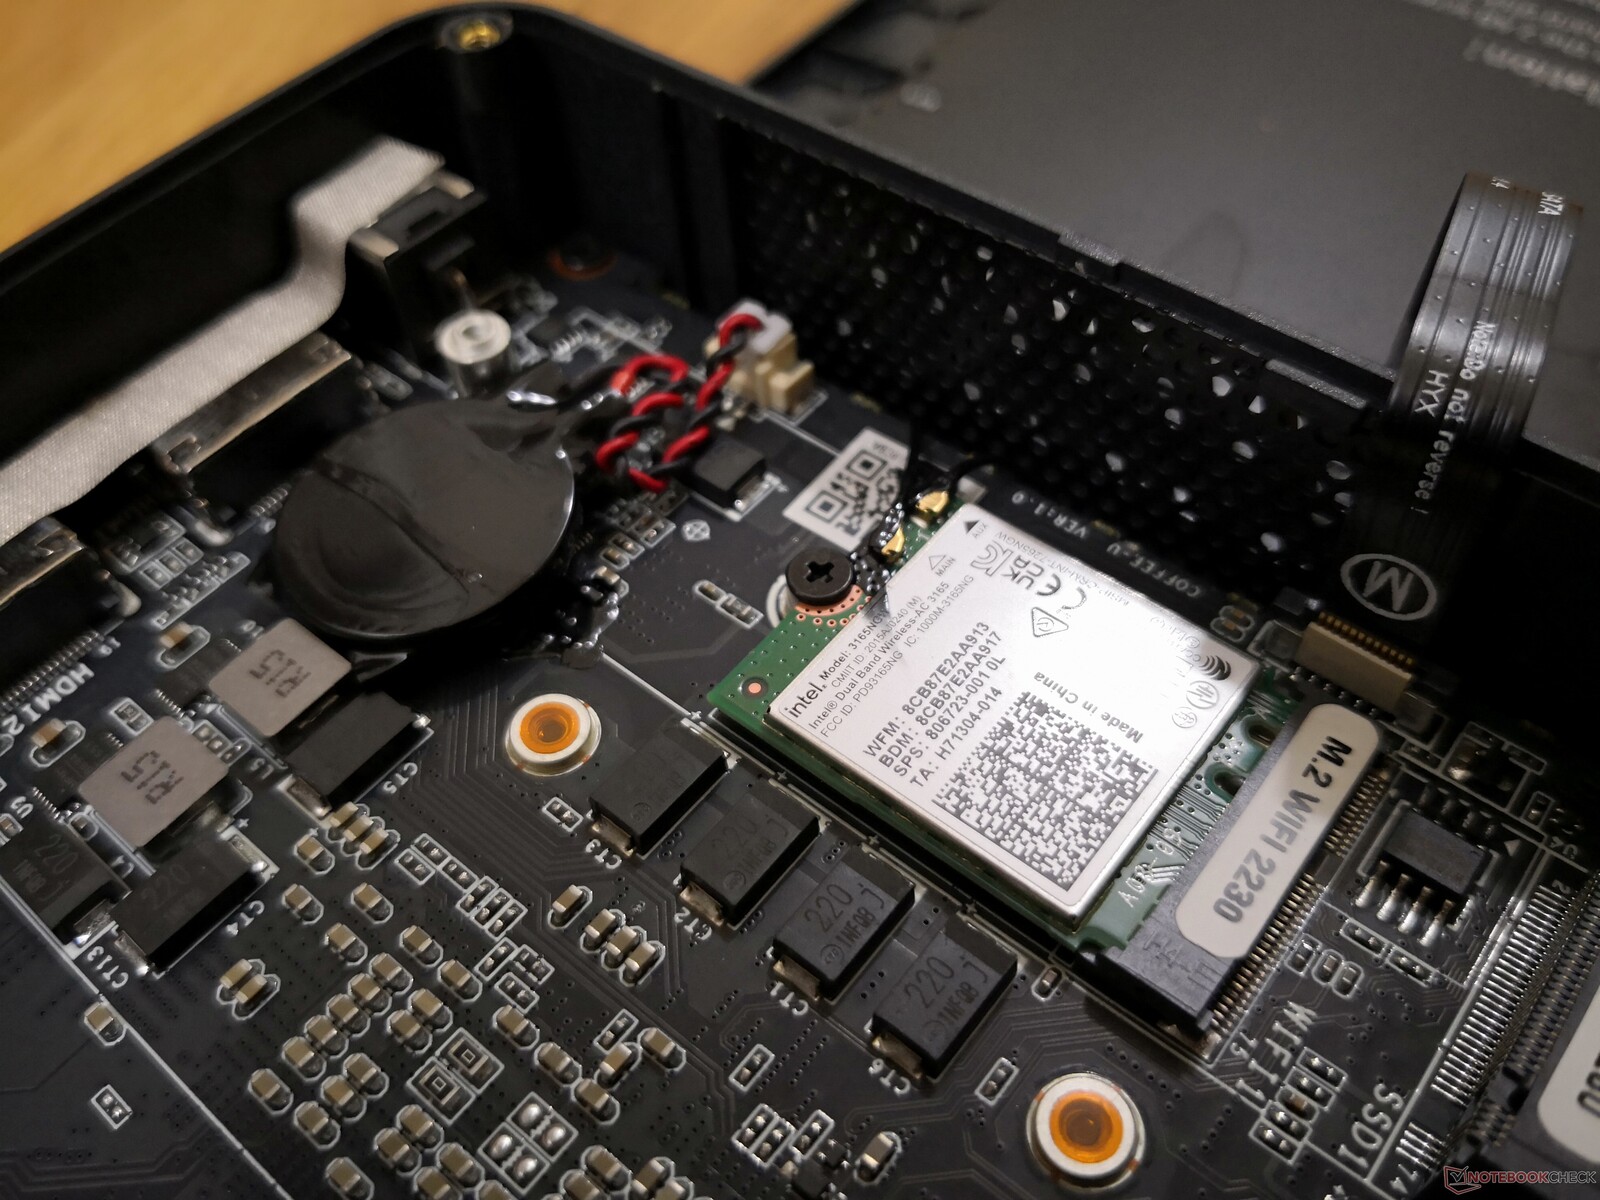
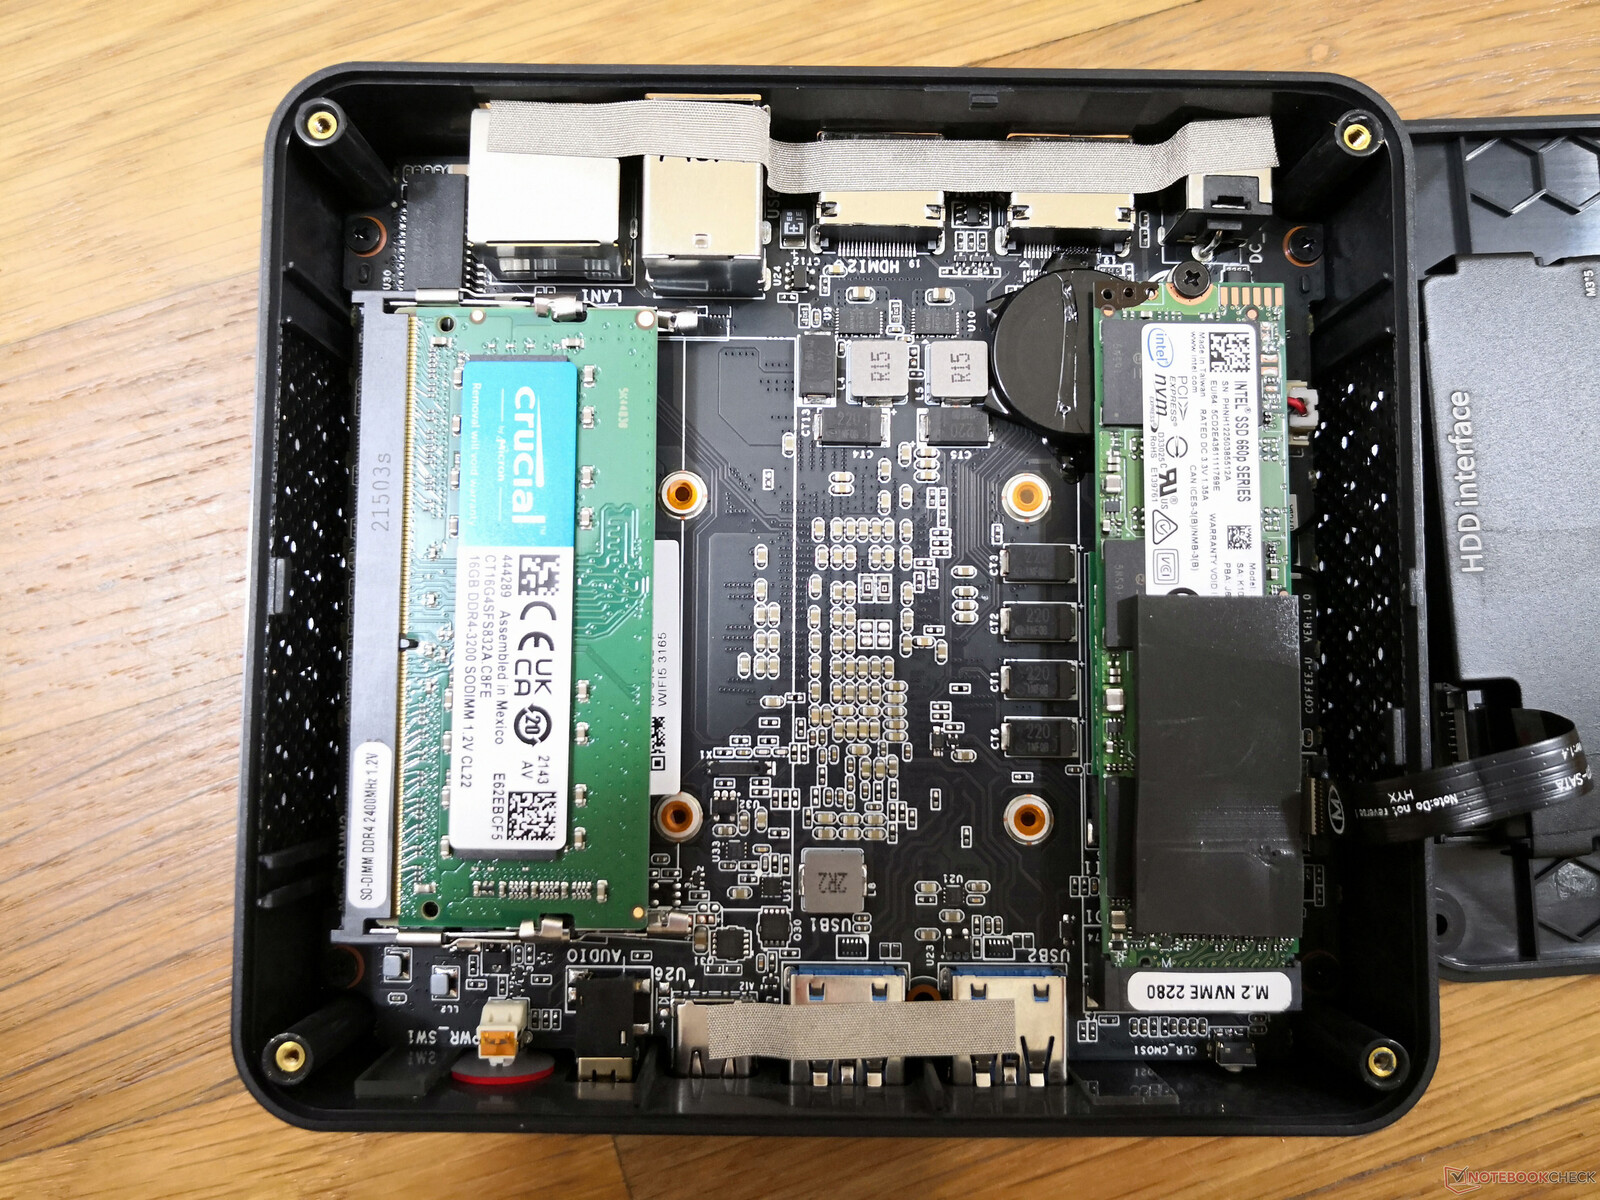
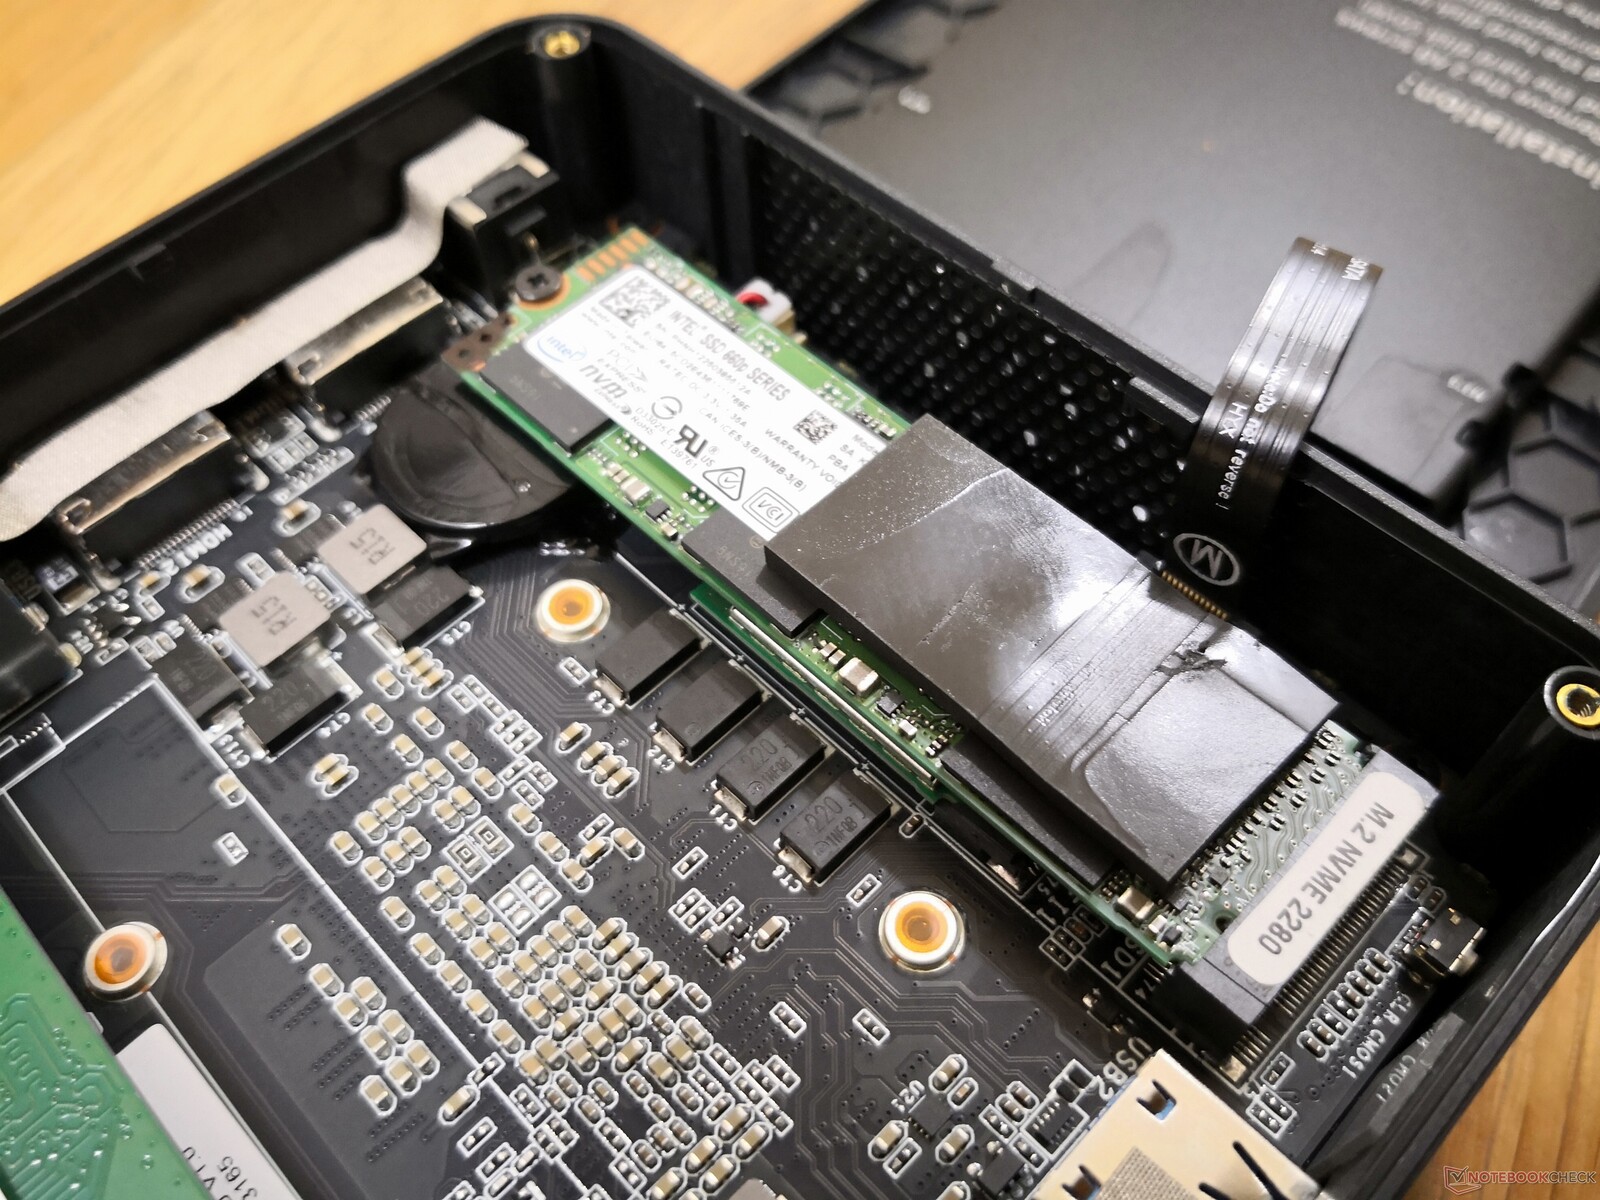
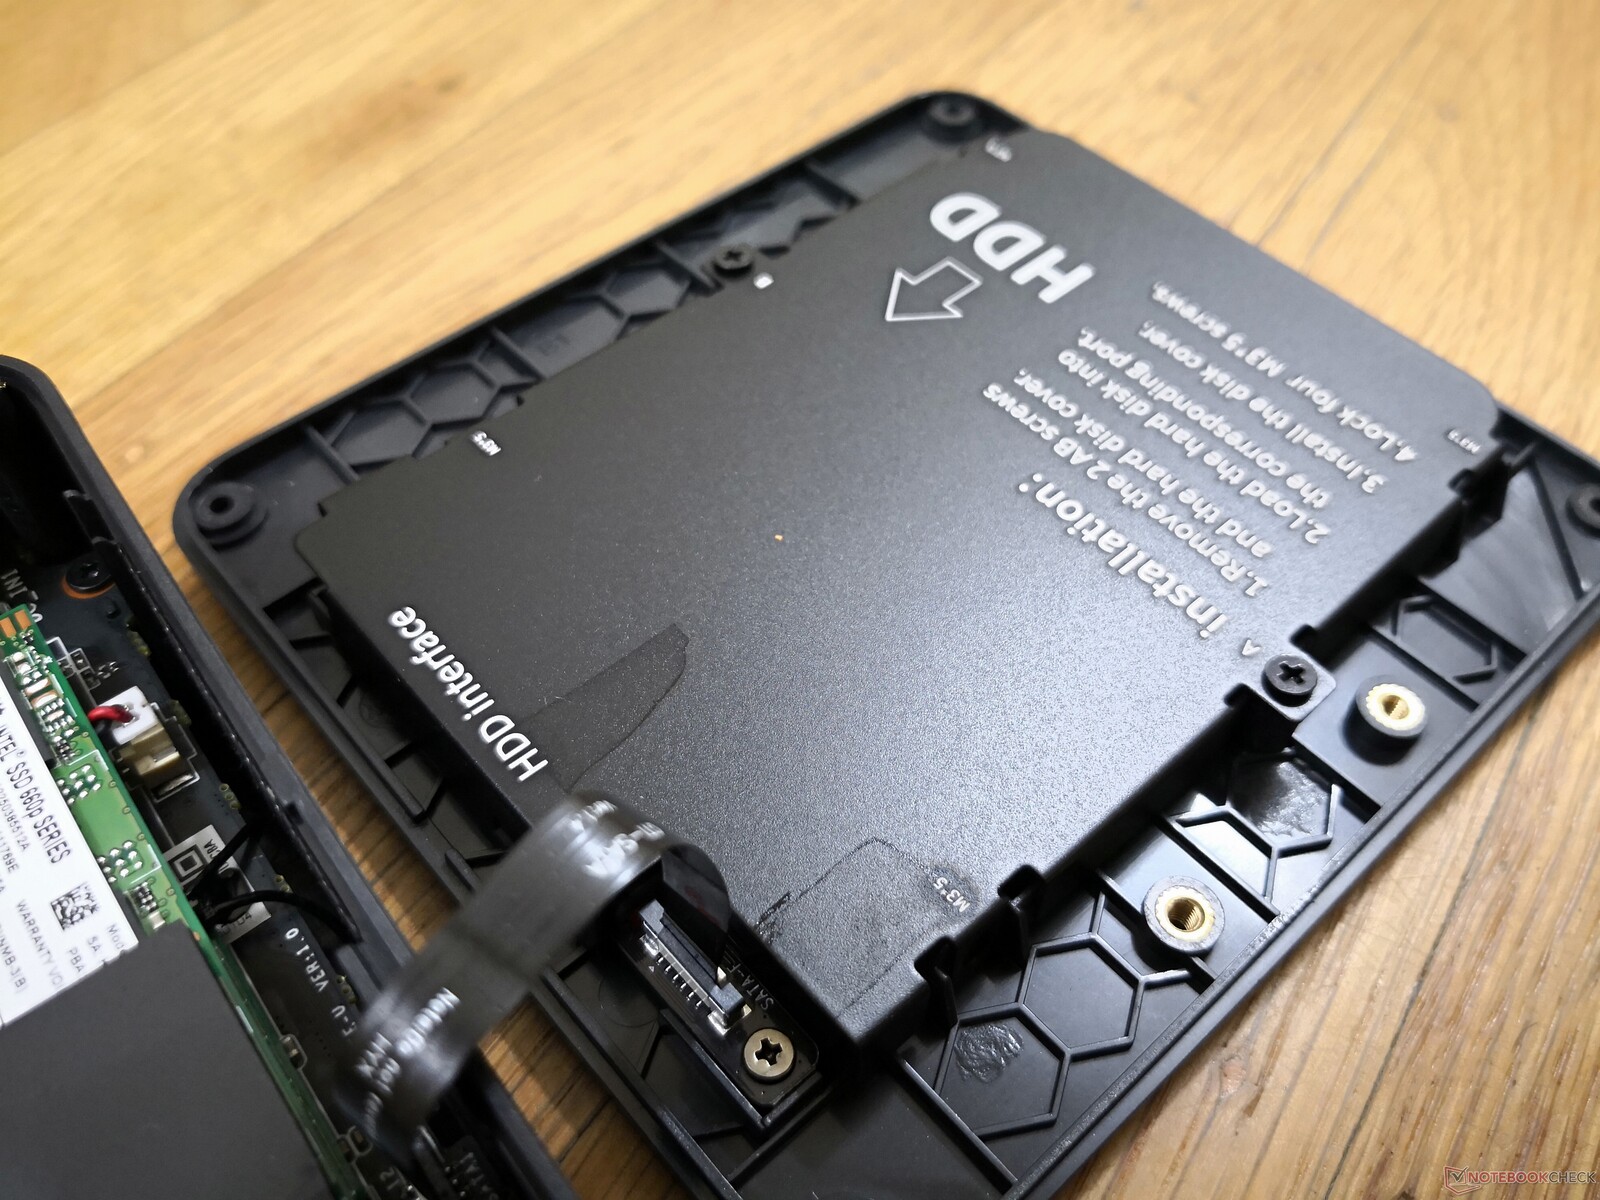
维护
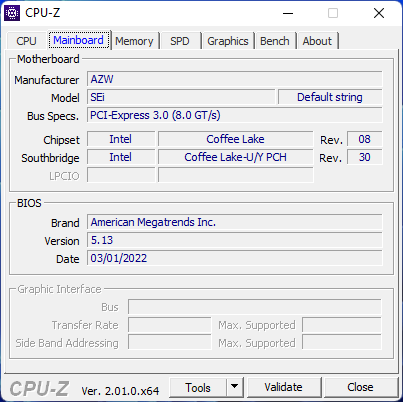
SEi8的主板与SEi10的主板略有不同。例如,M.2 SSD插槽现在朝向相反的方向,而BIOS电池现在更容易接近。
配件和保修
零售包装盒包括额外的螺丝、手册和一个可拆卸的VESA支架。申请保修可能很困难,因为它可能涉及海外运输。与大多数英特尔NUC的三年保修期不同,它只提供一年的基本保修期。
业绩
测试条件
在运行以下任何基准测试之前,我们的设备被设置为Windows性能模式。
处理器
原始CPU性能介于赛扬和Atom系列与更高端的Core i5 U系列之间。也许最值得注意的是,它明显比竞争者的 Ryzen 3 3200U和被动冷却的 酷睿i3-10100Y上发现的那样 微软Surface Go 3.Surface Go 3处理器因其相对于Surface Pro的慢如蜗牛的性能而受到高度批评。
Beelink提供的SEi8带有 Core i5-8279U作为升级,这将提供大约20%的单线程性能,比我们的Core i3-8109U的多线程性能快2倍以上。
Cinebench R15 Multi Loop
Cinebench R23: Multi Core | Single Core
Cinebench R15: CPU Multi 64Bit | CPU Single 64Bit
Blender: v2.79 BMW27 CPU
7-Zip 18.03: 7z b 4 | 7z b 4 -mmt1
Geekbench 5.5: Multi-Core | Single-Core
HWBOT x265 Benchmark v2.2: 4k Preset
LibreOffice : 20 Documents To PDF
R Benchmark 2.5: Overall mean
| Cinebench R20 / CPU (Multi Core) | |
| Beelink SER4 | |
| Intel NUC11TNKi5 | |
| Apple MacBook Pro 13 2019 i5 4TB3 | |
| Intel NUC8i7BE | |
| Acer Swift 3 SF314-42-R27B | |
| GMK NucBox 2 | |
| Beelink SEi10 | |
| Beelink U59 | |
| Beelink SEi8 | |
| Average Intel Core i3-8109U (n=1) | |
| Microsoft Surface Go 3 Core i3 | |
| HP 255 G7 159P1EA | |
| GMK NucBox 3 | |
| Chuwi LapBook Plus | |
| Teclast Tbook 16 Power | |
| Cinebench R20 / CPU (Single Core) | |
| Intel NUC11TNKi5 | |
| Beelink SER4 | |
| Intel NUC8i7BE | |
| Acer Swift 3 SF314-42-R27B | |
| Apple MacBook Pro 13 2019 i5 4TB3 | |
| Beelink SEi10 | |
| GMK NucBox 2 | |
| Beelink SEi8 | |
| Average Intel Core i3-8109U (n=1) | |
| Microsoft Surface Go 3 Core i3 | |
| HP 255 G7 159P1EA | |
| Beelink U59 | |
| GMK NucBox 3 | |
| Chuwi LapBook Plus | |
| Teclast Tbook 16 Power | |
| Cinebench R23 / Multi Core | |
| Beelink SER4 | |
| Intel NUC11TNKi5 | |
| GMK NucBox 2 | |
| Beelink U59 | |
| Beelink SEi8 | |
| Average Intel Core i3-8109U (n=1) | |
| HP 255 G7 159P1EA | |
| Microsoft Surface Go 3 Core i3 | |
| GMK NucBox 3 | |
| Teclast Tbook 16 Power | |
| Cinebench R23 / Single Core | |
| Intel NUC11TNKi5 | |
| Beelink SER4 | |
| GMK NucBox 2 | |
| Beelink SEi8 | |
| Average Intel Core i3-8109U (n=1) | |
| Microsoft Surface Go 3 Core i3 | |
| HP 255 G7 159P1EA | |
| Beelink U59 | |
| GMK NucBox 3 | |
| Teclast Tbook 16 Power | |
| Cinebench R15 / CPU Multi 64Bit | |
| Beelink SER4 | |
| Intel NUC8i7BE | |
| Intel NUC11TNKi5 | |
| Apple MacBook Pro 13 2019 i5 4TB3 | |
| Apple MacBook Pro 13 2019 i5 4TB3 | |
| GMK NucBox 2 | |
| Acer Swift 3 SF314-42-R27B | |
| Beelink SEi10 | |
| Beelink U59 | |
| HP 255 G7 159P1EA | |
| Average Intel Core i3-8109U (324 - 381, n=2) | |
| Beelink SEi8 | |
| Microsoft Surface Go 3 Core i3 | |
| GMK NucBox 3 | |
| Teclast Tbook 16 Power | |
| Chuwi LapBook Plus | |
| Cinebench R15 / CPU Single 64Bit | |
| Intel NUC11TNKi5 | |
| Intel NUC8i7BE | |
| Beelink SER4 | |
| Apple MacBook Pro 13 2019 i5 4TB3 | |
| Apple MacBook Pro 13 2019 i5 4TB3 | |
| Acer Swift 3 SF314-42-R27B | |
| Beelink SEi10 | |
| GMK NucBox 2 | |
| Average Intel Core i3-8109U (124.3 - 153, n=2) | |
| HP 255 G7 159P1EA | |
| Beelink SEi8 | |
| Microsoft Surface Go 3 Core i3 | |
| Beelink U59 | |
| GMK NucBox 3 | |
| Chuwi LapBook Plus | |
| Teclast Tbook 16 Power | |
| Blender / v2.79 BMW27 CPU | |
| Teclast Tbook 16 Power | |
| Chuwi LapBook Plus | |
| GMK NucBox 3 | |
| Microsoft Surface Go 3 Core i3 | |
| Beelink U59 | |
| HP 255 G7 159P1EA | |
| Beelink SEi8 | |
| Average Intel Core i3-8109U (n=1) | |
| Beelink SEi10 | |
| Acer Swift 3 SF314-42-R27B | |
| GMK NucBox 2 | |
| Intel NUC8i7BE | |
| Intel NUC8i7BE | |
| Apple MacBook Pro 13 2019 i5 4TB3 | |
| Intel NUC11TNKi5 | |
| Beelink SER4 | |
| 7-Zip 18.03 / 7z b 4 | |
| Beelink SER4 | |
| Intel NUC8i7BE | |
| Intel NUC8i7BE | |
| Intel NUC11TNKi5 | |
| Apple MacBook Pro 13 2019 i5 4TB3 | |
| GMK NucBox 2 | |
| Acer Swift 3 SF314-42-R27B | |
| Beelink U59 | |
| Beelink SEi10 | |
| Beelink SEi8 | |
| Average Intel Core i3-8109U (n=1) | |
| HP 255 G7 159P1EA | |
| Microsoft Surface Go 3 Core i3 | |
| GMK NucBox 3 | |
| Chuwi LapBook Plus | |
| 7-Zip 18.03 / 7z b 4 -mmt1 | |
| Intel NUC8i7BE | |
| Intel NUC8i7BE | |
| Intel NUC11TNKi5 | |
| Beelink SER4 | |
| Apple MacBook Pro 13 2019 i5 4TB3 | |
| Beelink SEi10 | |
| Acer Swift 3 SF314-42-R27B | |
| GMK NucBox 2 | |
| Beelink SEi8 | |
| Average Intel Core i3-8109U (n=1) | |
| Microsoft Surface Go 3 Core i3 | |
| HP 255 G7 159P1EA | |
| Beelink U59 | |
| GMK NucBox 3 | |
| Chuwi LapBook Plus | |
| Geekbench 5.5 / Multi-Core | |
| Beelink SER4 | |
| Intel NUC11TNKi5 | |
| Intel NUC8i7BE | |
| GMK NucBox 2 | |
| Acer Swift 3 SF314-42-R27B | |
| Beelink SEi10 | |
| Microsoft Surface Go 3 Core i3 | |
| Beelink SEi8 | |
| Average Intel Core i3-8109U (n=1) | |
| HP 255 G7 159P1EA | |
| GMK NucBox 3 | |
| Teclast Tbook 16 Power | |
| Geekbench 5.5 / Single-Core | |
| Intel NUC11TNKi5 | |
| Beelink SER4 | |
| Beelink SEi10 | |
| Acer Swift 3 SF314-42-R27B | |
| Microsoft Surface Go 3 Core i3 | |
| GMK NucBox 2 | |
| Beelink SEi8 | |
| Average Intel Core i3-8109U (n=1) | |
| HP 255 G7 159P1EA | |
| Intel NUC8i7BE | |
| GMK NucBox 3 | |
| Teclast Tbook 16 Power | |
| HWBOT x265 Benchmark v2.2 / 4k Preset | |
| Beelink SER4 | |
| Intel NUC11TNKi5 | |
| Apple MacBook Pro 13 2019 i5 4TB3 | |
| Intel NUC8i7BE | |
| Intel NUC8i7BE | |
| GMK NucBox 2 | |
| Acer Swift 3 SF314-42-R27B | |
| Beelink SEi10 | |
| Beelink SEi8 | |
| Average Intel Core i3-8109U (n=1) | |
| Beelink U59 | |
| Microsoft Surface Go 3 Core i3 | |
| HP 255 G7 159P1EA | |
| GMK NucBox 3 | |
| Chuwi LapBook Plus | |
| Teclast Tbook 16 Power | |
| LibreOffice / 20 Documents To PDF | |
| Teclast Tbook 16 Power | |
| GMK NucBox 3 | |
| Microsoft Surface Go 3 Core i3 | |
| Beelink U59 | |
| HP 255 G7 159P1EA | |
| Beelink SEi8 | |
| Average Intel Core i3-8109U (n=1) | |
| GMK NucBox 2 | |
| Beelink SER4 | |
| Acer Swift 3 SF314-42-R27B | |
| Beelink SEi10 | |
| Intel NUC11TNKi5 | |
| R Benchmark 2.5 / Overall mean | |
| Teclast Tbook 16 Power | |
| GMK NucBox 3 | |
| Beelink U59 | |
| Microsoft Surface Go 3 Core i3 | |
| Beelink SEi8 | |
| Average Intel Core i3-8109U (n=1) | |
| HP 255 G7 159P1EA | |
| GMK NucBox 2 | |
| Beelink SEi10 | |
| Acer Swift 3 SF314-42-R27B | |
| Intel NUC8i7BE | |
| Intel NUC11TNKi5 | |
| Beelink SER4 | |
Cinebench R23: Multi Core | Single Core
Cinebench R15: CPU Multi 64Bit | CPU Single 64Bit
Blender: v2.79 BMW27 CPU
7-Zip 18.03: 7z b 4 | 7z b 4 -mmt1
Geekbench 5.5: Multi-Core | Single-Core
HWBOT x265 Benchmark v2.2: 4k Preset
LibreOffice : 20 Documents To PDF
R Benchmark 2.5: Overall mean
* ... smaller is better
AIDA64: FP32 Ray-Trace | FPU Julia | CPU SHA3 | CPU Queen | FPU SinJulia | FPU Mandel | CPU AES | CPU ZLib | FP64 Ray-Trace | CPU PhotoWorxx
| Performance rating | |
| Beelink SER4 | |
| Intel NUC11TNKi5 | |
| Intel NUC8i7BE -1! | |
| GMK NucBox 2 | |
| Beelink SEi8 | |
| AIDA64 / FP32 Ray-Trace | |
| Beelink SER4 | |
| Intel NUC11TNKi5 | |
| Intel NUC8i7BE | |
| GMK NucBox 2 | |
| Beelink SEi8 | |
| AIDA64 / FPU Julia | |
| Beelink SER4 | |
| Intel NUC11TNKi5 | |
| Intel NUC8i7BE | |
| GMK NucBox 2 | |
| Beelink SEi8 | |
| AIDA64 / CPU SHA3 | |
| Intel NUC11TNKi5 | |
| Beelink SER4 | |
| GMK NucBox 2 | |
| Beelink SEi8 | |
| AIDA64 / CPU Queen | |
| Beelink SER4 | |
| Intel NUC8i7BE | |
| Intel NUC11TNKi5 | |
| GMK NucBox 2 | |
| Beelink SEi8 | |
| AIDA64 / FPU SinJulia | |
| Beelink SER4 | |
| Intel NUC8i7BE | |
| Intel NUC11TNKi5 | |
| GMK NucBox 2 | |
| Beelink SEi8 | |
| AIDA64 / FPU Mandel | |
| Beelink SER4 | |
| Intel NUC11TNKi5 | |
| Intel NUC8i7BE | |
| GMK NucBox 2 | |
| Beelink SEi8 | |
| AIDA64 / CPU AES | |
| Intel NUC11TNKi5 | |
| Beelink SER4 | |
| Intel NUC8i7BE | |
| GMK NucBox 2 | |
| Beelink SEi8 | |
| AIDA64 / CPU ZLib | |
| Beelink SER4 | |
| Intel NUC11TNKi5 | |
| Intel NUC8i7BE | |
| GMK NucBox 2 | |
| Beelink SEi8 | |
| AIDA64 / FP64 Ray-Trace | |
| Beelink SER4 | |
| Intel NUC11TNKi5 | |
| Intel NUC8i7BE | |
| GMK NucBox 2 | |
| Beelink SEi8 | |
| AIDA64 / CPU PhotoWorxx | |
| Beelink SER4 | |
| Intel NUC8i7BE | |
| Intel NUC11TNKi5 | |
| Beelink SEi8 | |
| GMK NucBox 2 | |
系统性能
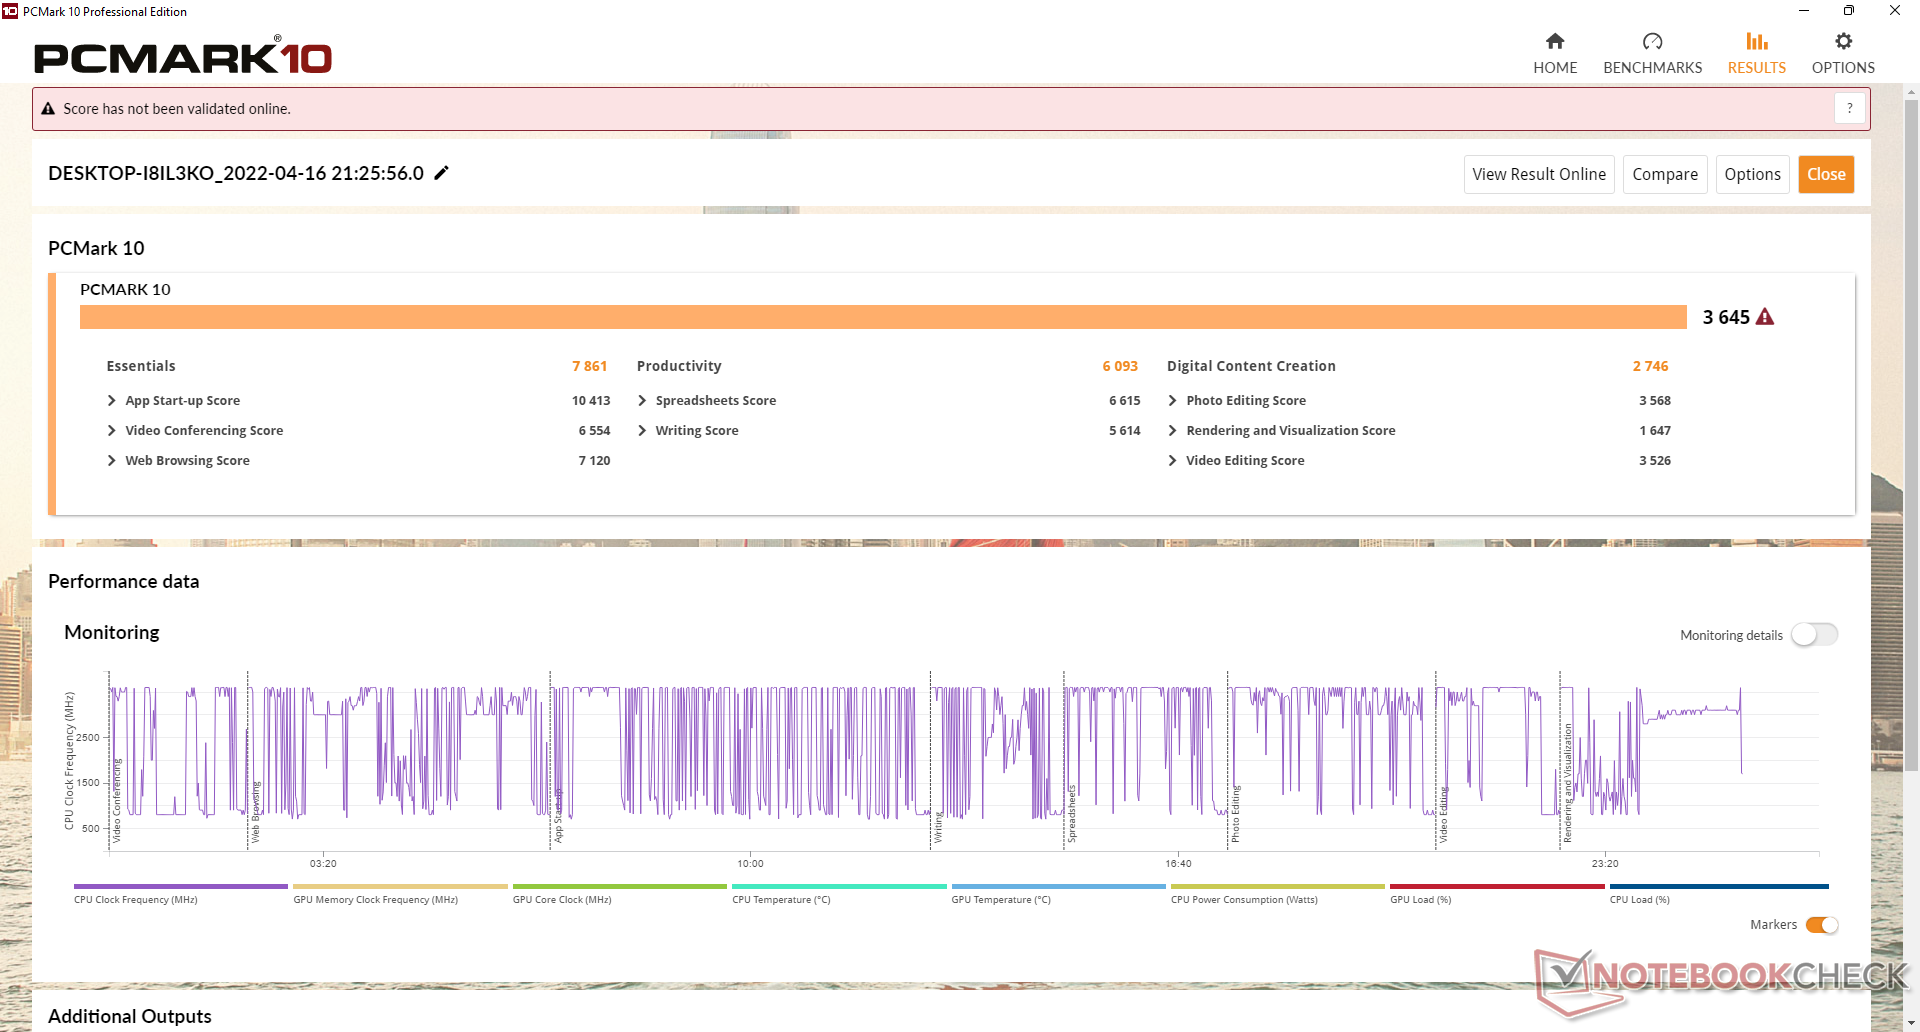
PCMark的结果略微领先于SEi10,可能是由于我们的SEi8的集成Iris图形更快。在我们的测试设备上运行Windows 11 Pro没有遇到任何问题,除了在启动应用程序或在适度的多任务处理时偶尔会出现速度减慢。
| PCMark 10 / Score | |
| Beelink SER4 | |
| Intel NUC8i7BE | |
| Intel NUC11TNKi5 | |
| GMK NucBox 2 | |
| Beelink SEi8 | |
| Beelink SEi10 | |
| PCMark 10 / Essentials | |
| Beelink SER4 | |
| Intel NUC11TNKi5 | |
| Intel NUC8i7BE | |
| GMK NucBox 2 | |
| Beelink SEi8 | |
| Beelink SEi10 | |
| PCMark 10 / Productivity | |
| Beelink SER4 | |
| Intel NUC8i7BE | |
| GMK NucBox 2 | |
| Intel NUC11TNKi5 | |
| Beelink SEi8 | |
| Beelink SEi10 | |
| PCMark 10 / Digital Content Creation | |
| Beelink SER4 | |
| Intel NUC11TNKi5 | |
| Intel NUC8i7BE | |
| GMK NucBox 2 | |
| Beelink SEi8 | |
| Beelink SEi10 | |
| PCMark 10 Score | 3645 points | |
Help | ||
| AIDA64 / Memory Copy | |
| Intel NUC8i7BE | |
| GMK NucBox 2 | |
| Beelink SER4 | |
| Beelink SEi8 | |
| Intel NUC11TNKi5 | |
| AIDA64 / Memory Read | |
| Intel NUC8i7BE | |
| Beelink SER4 | |
| GMK NucBox 2 | |
| Beelink SEi8 | |
| Intel NUC11TNKi5 | |
| AIDA64 / Memory Write | |
| Intel NUC8i7BE | |
| GMK NucBox 2 | |
| Beelink SER4 | |
| Intel NUC11TNKi5 | |
| Beelink SEi8 | |
| AIDA64 / Memory Latency | |
| Beelink SER4 | |
| Intel NUC11TNKi5 | |
| Beelink SEi8 | |
| GMK NucBox 2 | |
| Intel NUC8i7BE | |
* ... smaller is better
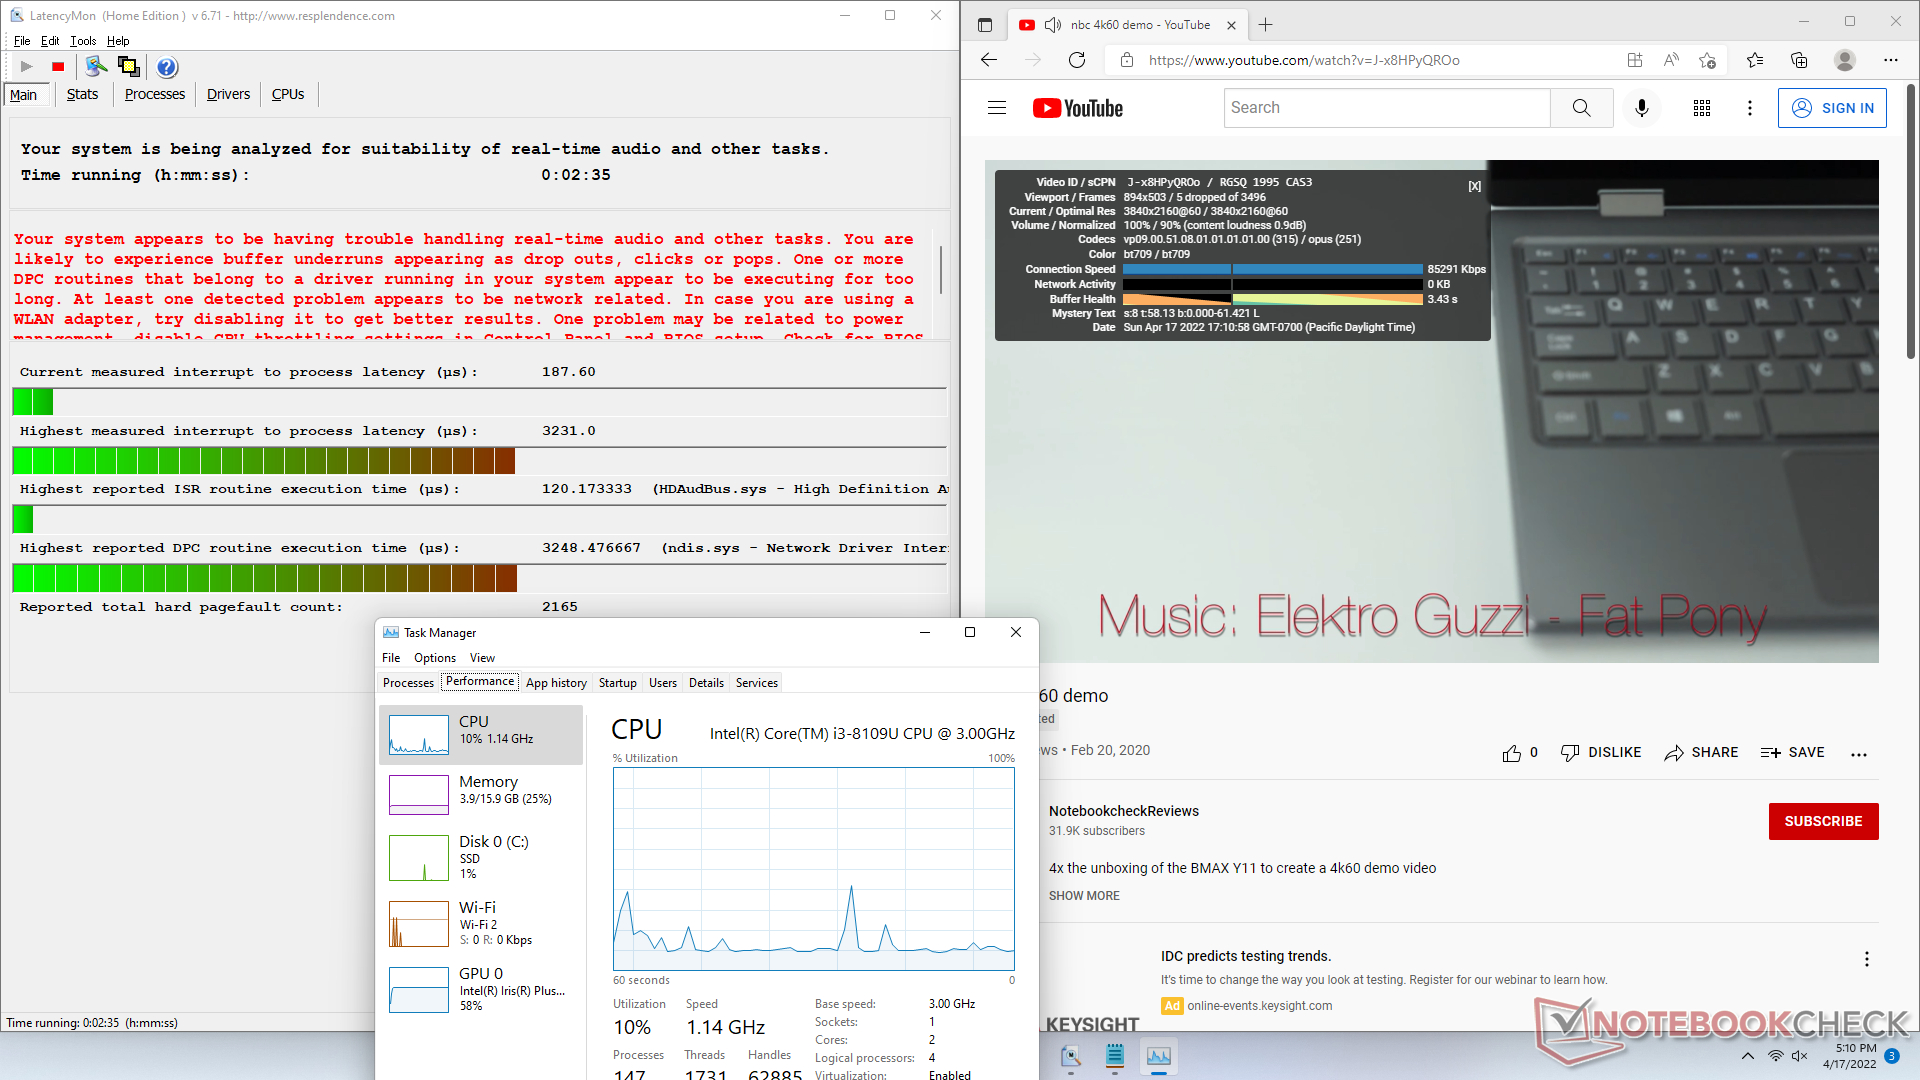
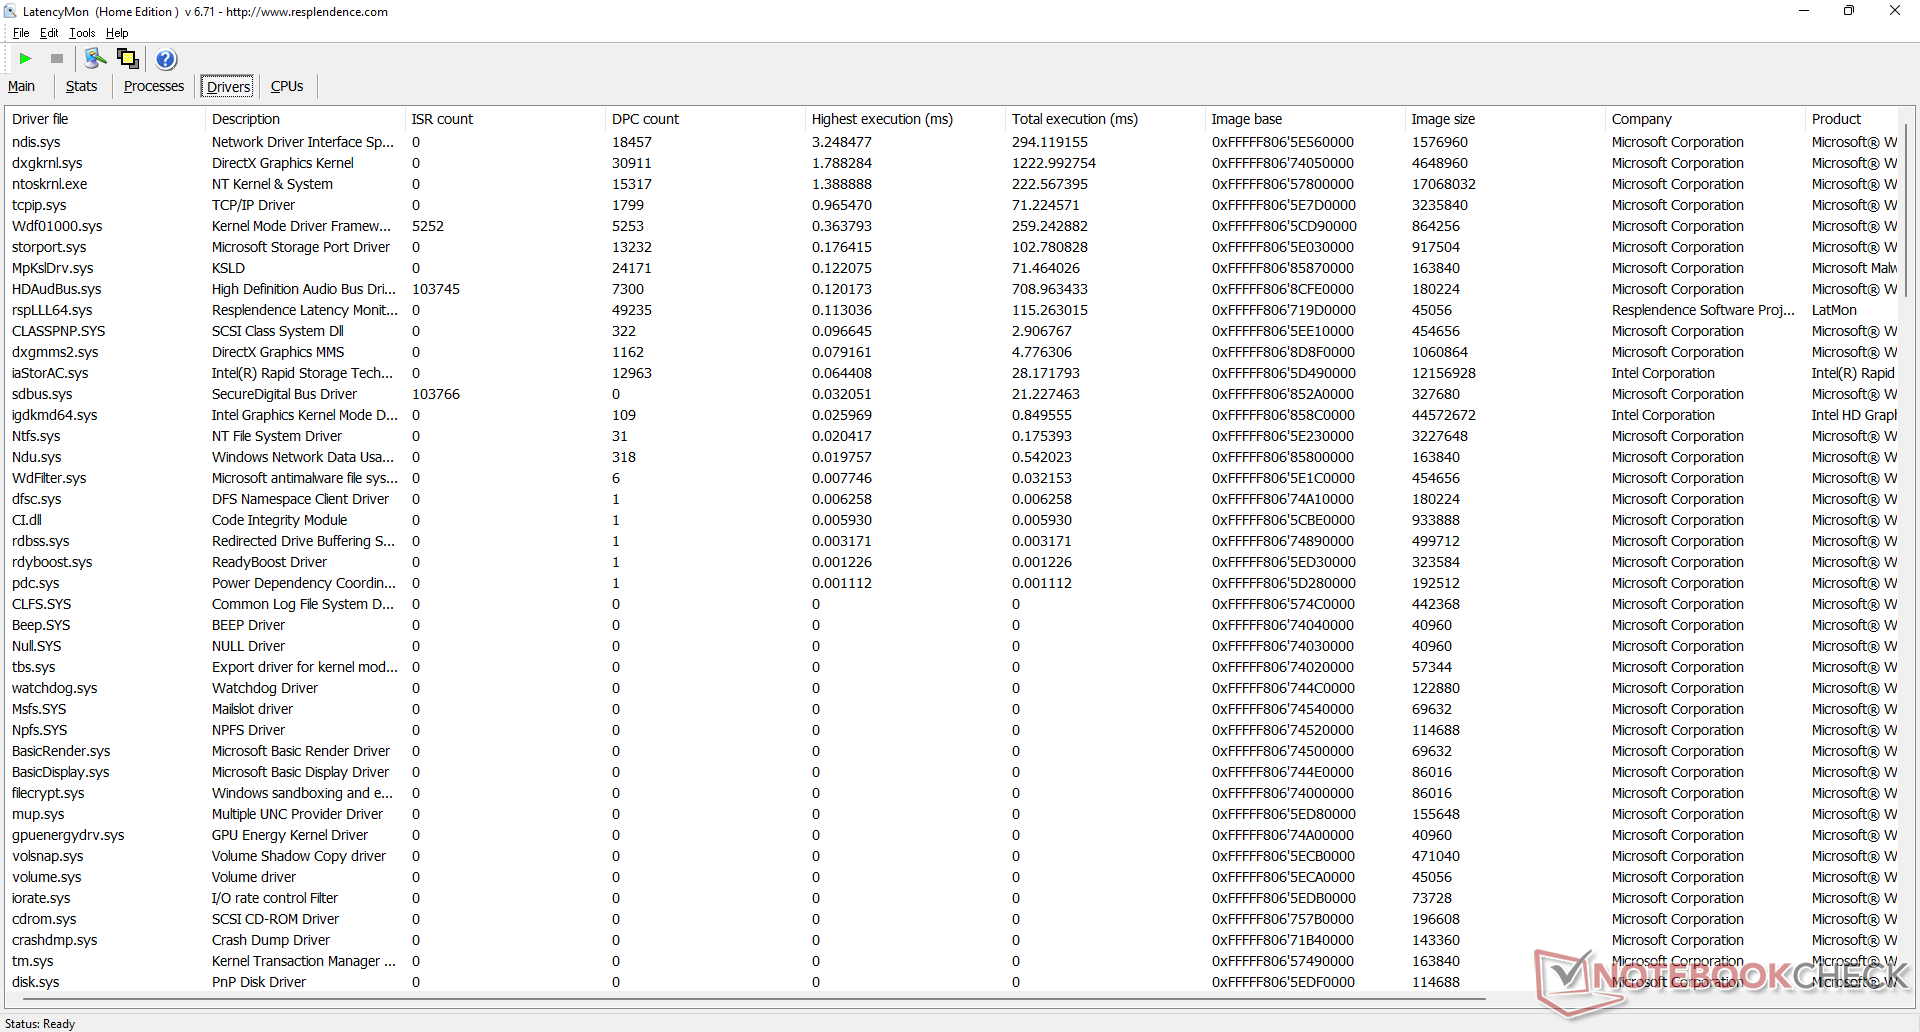
DPC延时
LatencyMon在打开我们的主页的多个浏览器标签时发现了DPC问题。4K视频播放大多很流畅,在我们长达1分钟的视频测试中只有5个丢帧。
| DPC Latencies / LatencyMon - interrupt to process latency (max), Web, Youtube, Prime95 | |
| Beelink SEi8 | |
| Beelink SEi10 | |
| GMK NucBox 2 | |
| Intel NUC11TNKi5 | |
| Beelink SER4 | |
* ... smaller is better
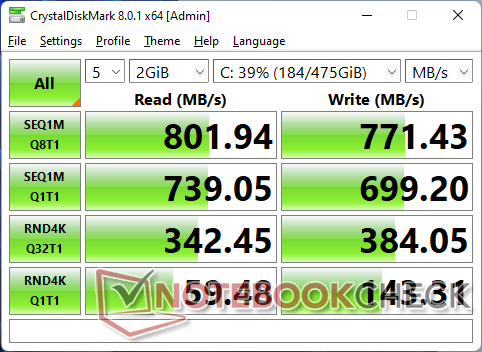
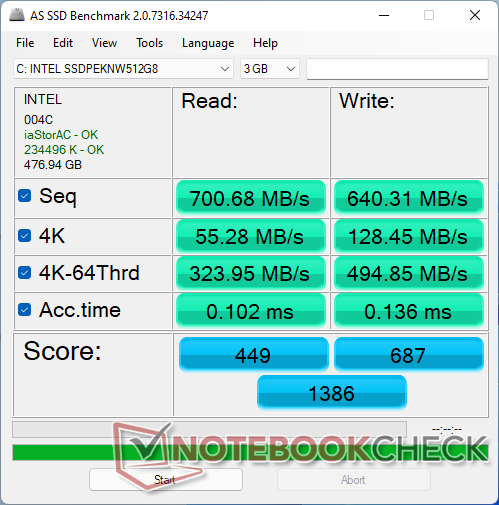
存储设备
我们的设备配置了一个预算为512GB的英特尔660p NVMe固态硬盘.尽管该驱动器本身能够分别达到1500MB/s和1000MB/s的连续读取和写入速率,但我们在SEi8上只能记录到800MB/s的最高速率。

| Drive Performance rating - Percent | |
| Beelink SER4 | |
| GMK NucBox 2 | |
| Beelink SEi8 | |
| Beelink SEi10 | |
| Intel NUC11TNKi5 | |
| DiskSpd | |
| seq read | |
| GMK NucBox 2 | |
| Beelink SER4 | |
| Beelink SEi10 | |
| Beelink SEi8 | |
| Intel NUC11TNKi5 | |
| seq write | |
| GMK NucBox 2 | |
| Beelink SER4 | |
| Beelink SEi10 | |
| Beelink SEi8 | |
| Intel NUC11TNKi5 | |
| seq q8 t1 read | |
| GMK NucBox 2 | |
| Beelink SEi10 | |
| Beelink SER4 | |
| Beelink SEi8 | |
| Intel NUC11TNKi5 | |
| seq q8 t1 write | |
| GMK NucBox 2 | |
| Beelink SER4 | |
| Beelink SEi10 | |
| Beelink SEi8 | |
| Intel NUC11TNKi5 | |
| 4k q1 t1 read | |
| Beelink SER4 | |
| Beelink SEi8 | |
| Beelink SEi10 | |
| GMK NucBox 2 | |
| Intel NUC11TNKi5 | |
| 4k q1 t1 write | |
| Beelink SER4 | |
| Beelink SEi10 | |
| GMK NucBox 2 | |
| Beelink SEi8 | |
| Intel NUC11TNKi5 | |
| 4k q32 t16 read | |
| Beelink SEi10 | |
| Beelink SEi8 | |
| Beelink SER4 | |
| GMK NucBox 2 | |
| Intel NUC11TNKi5 | |
| 4k q32 t16 write | |
| Beelink SER4 | |
| GMK NucBox 2 | |
| Beelink SEi8 | |
| Beelink SEi10 | |
| Intel NUC11TNKi5 | |
| AS SSD | |
| Score Total | |
| Beelink SER4 | |
| GMK NucBox 2 | |
| Beelink SEi8 | |
| Beelink SEi10 | |
| Intel NUC11TNKi5 | |
| Score Read | |
| GMK NucBox 2 | |
| Beelink SER4 | |
| Beelink SEi10 | |
| Beelink SEi8 | |
| Intel NUC11TNKi5 | |
| Score Write | |
| Beelink SER4 | |
| Beelink SEi8 | |
| GMK NucBox 2 | |
| Intel NUC11TNKi5 | |
| Beelink SEi10 | |
| Seq Read | |
| GMK NucBox 2 | |
| Beelink SER4 | |
| Beelink SEi10 | |
| Beelink SEi8 | |
| Intel NUC11TNKi5 | |
| Seq Write | |
| GMK NucBox 2 | |
| Beelink SER4 | |
| Beelink SEi8 | |
| Intel NUC11TNKi5 | |
| Beelink SEi10 | |
| 4K Read | |
| Beelink SER4 | |
| Beelink SEi8 | |
| GMK NucBox 2 | |
| Beelink SEi10 | |
| Intel NUC11TNKi5 | |
| 4K Write | |
| Beelink SER4 | |
| GMK NucBox 2 | |
| Beelink SEi8 | |
| Beelink SEi10 | |
| Intel NUC11TNKi5 | |
| 4K-64 Read | |
| GMK NucBox 2 | |
| Beelink SEi10 | |
| Beelink SEi8 | |
| Beelink SER4 | |
| Intel NUC11TNKi5 | |
| 4K-64 Write | |
| Beelink SER4 | |
| Beelink SEi8 | |
| GMK NucBox 2 | |
| Intel NUC11TNKi5 | |
| Beelink SEi10 | |
| Access Time Read | |
| Intel NUC11TNKi5 | |
| Beelink SEi8 | |
| Beelink SER4 | |
| Beelink SEi10 | |
| GMK NucBox 2 | |
| Access Time Write | |
| Beelink SEi10 | |
| GMK NucBox 2 | |
| Intel NUC11TNKi5 | |
| Beelink SER4 | |
| Beelink SEi8 | |
* ... smaller is better
Disk Throttling: DiskSpd Read Loop, Queue Depth 8
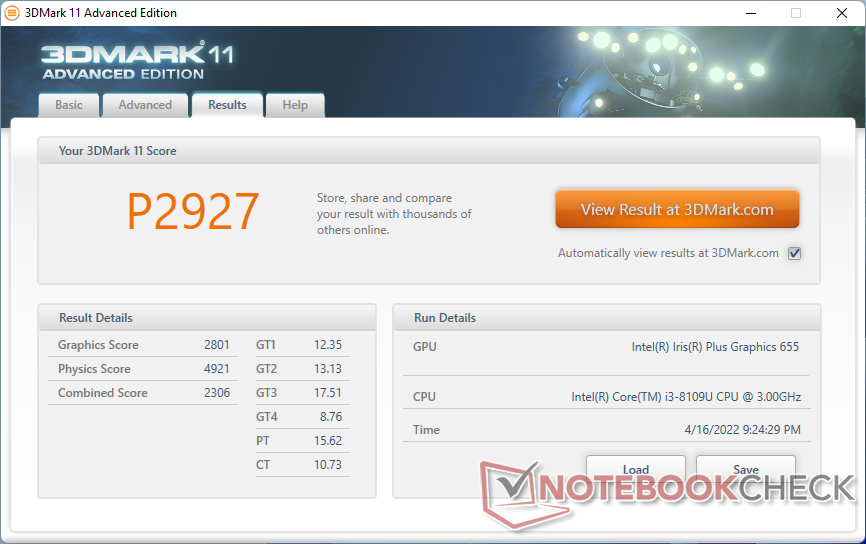
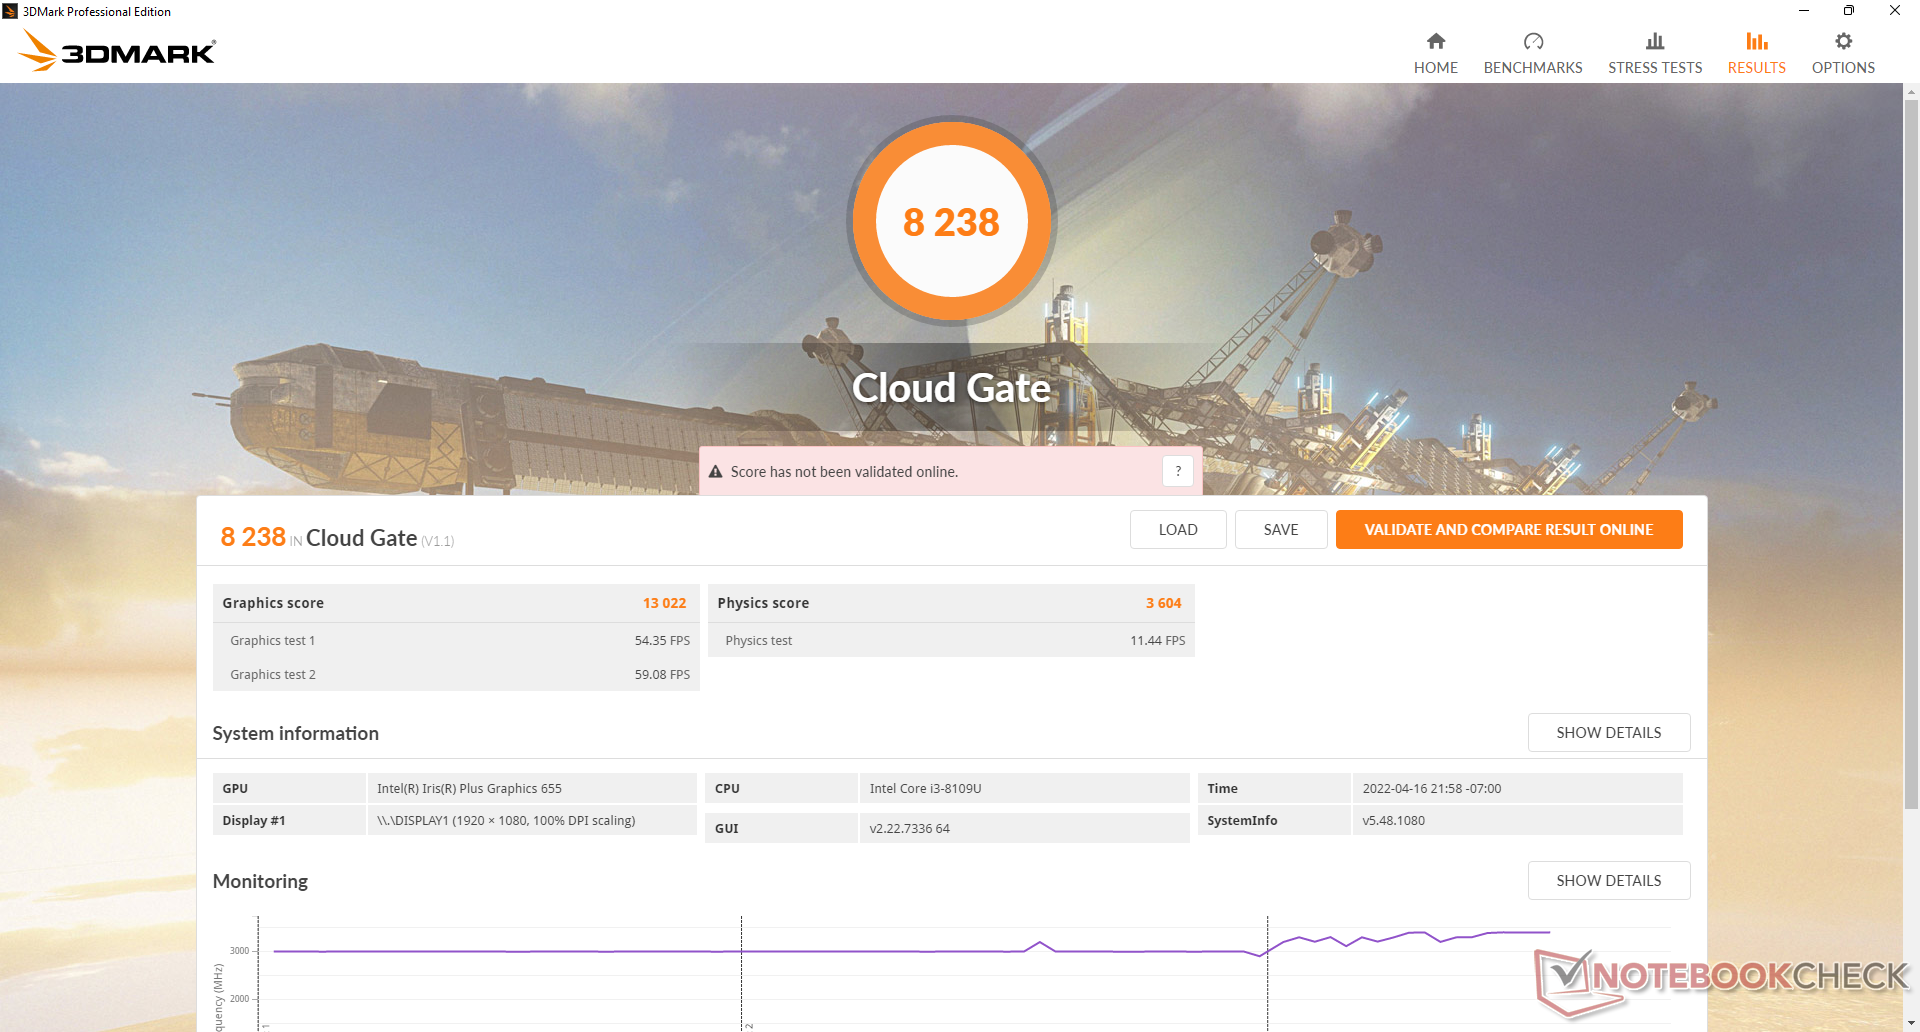
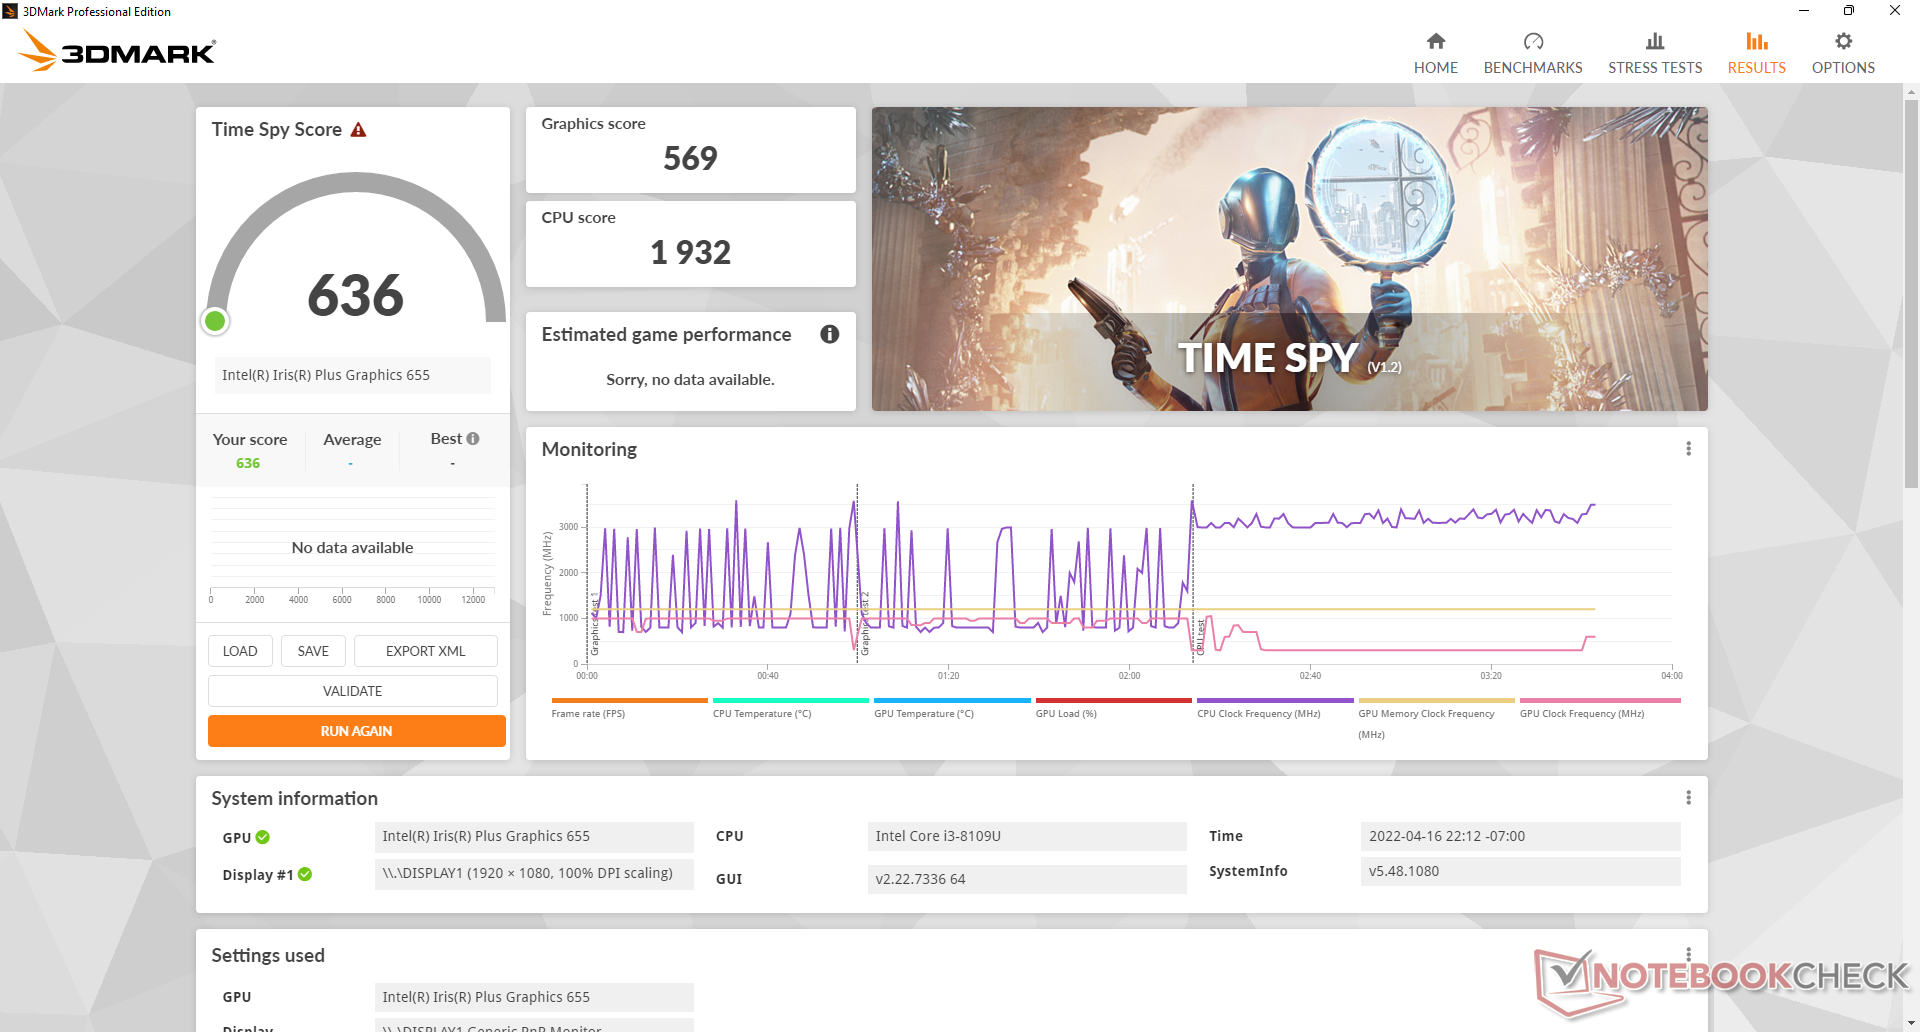
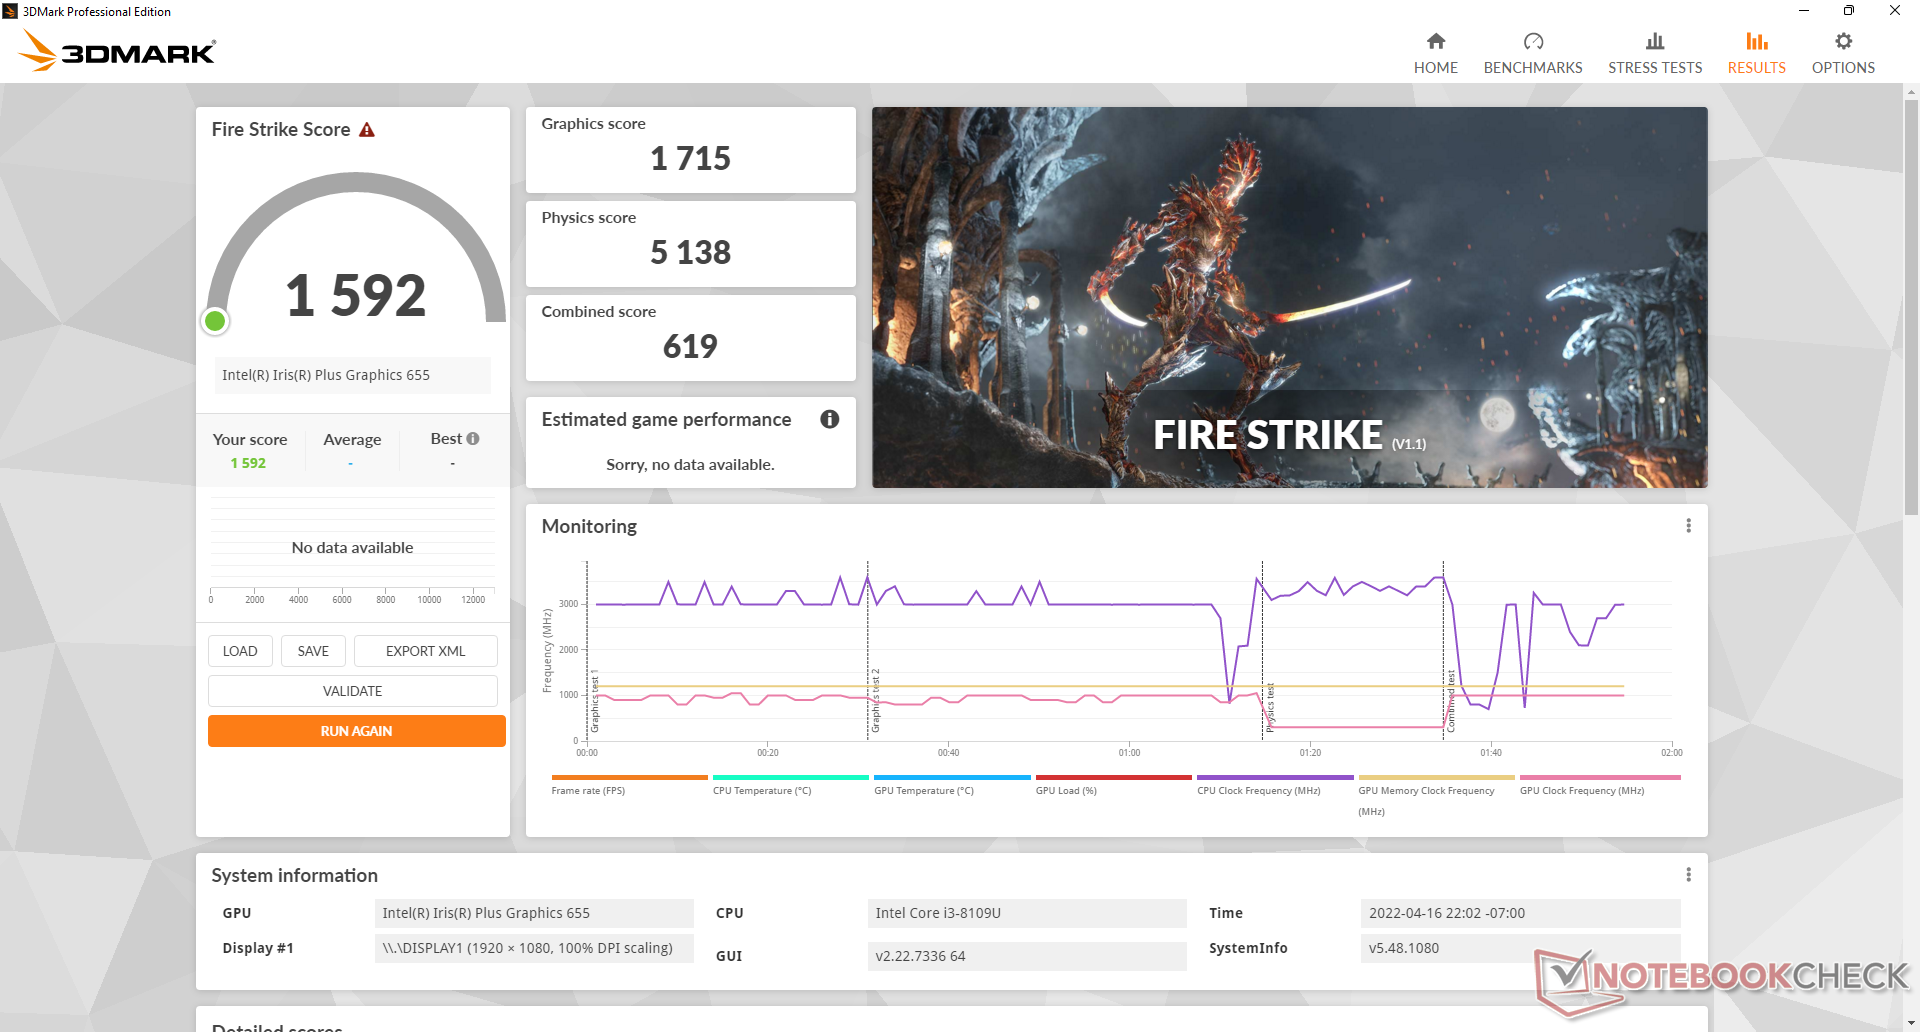
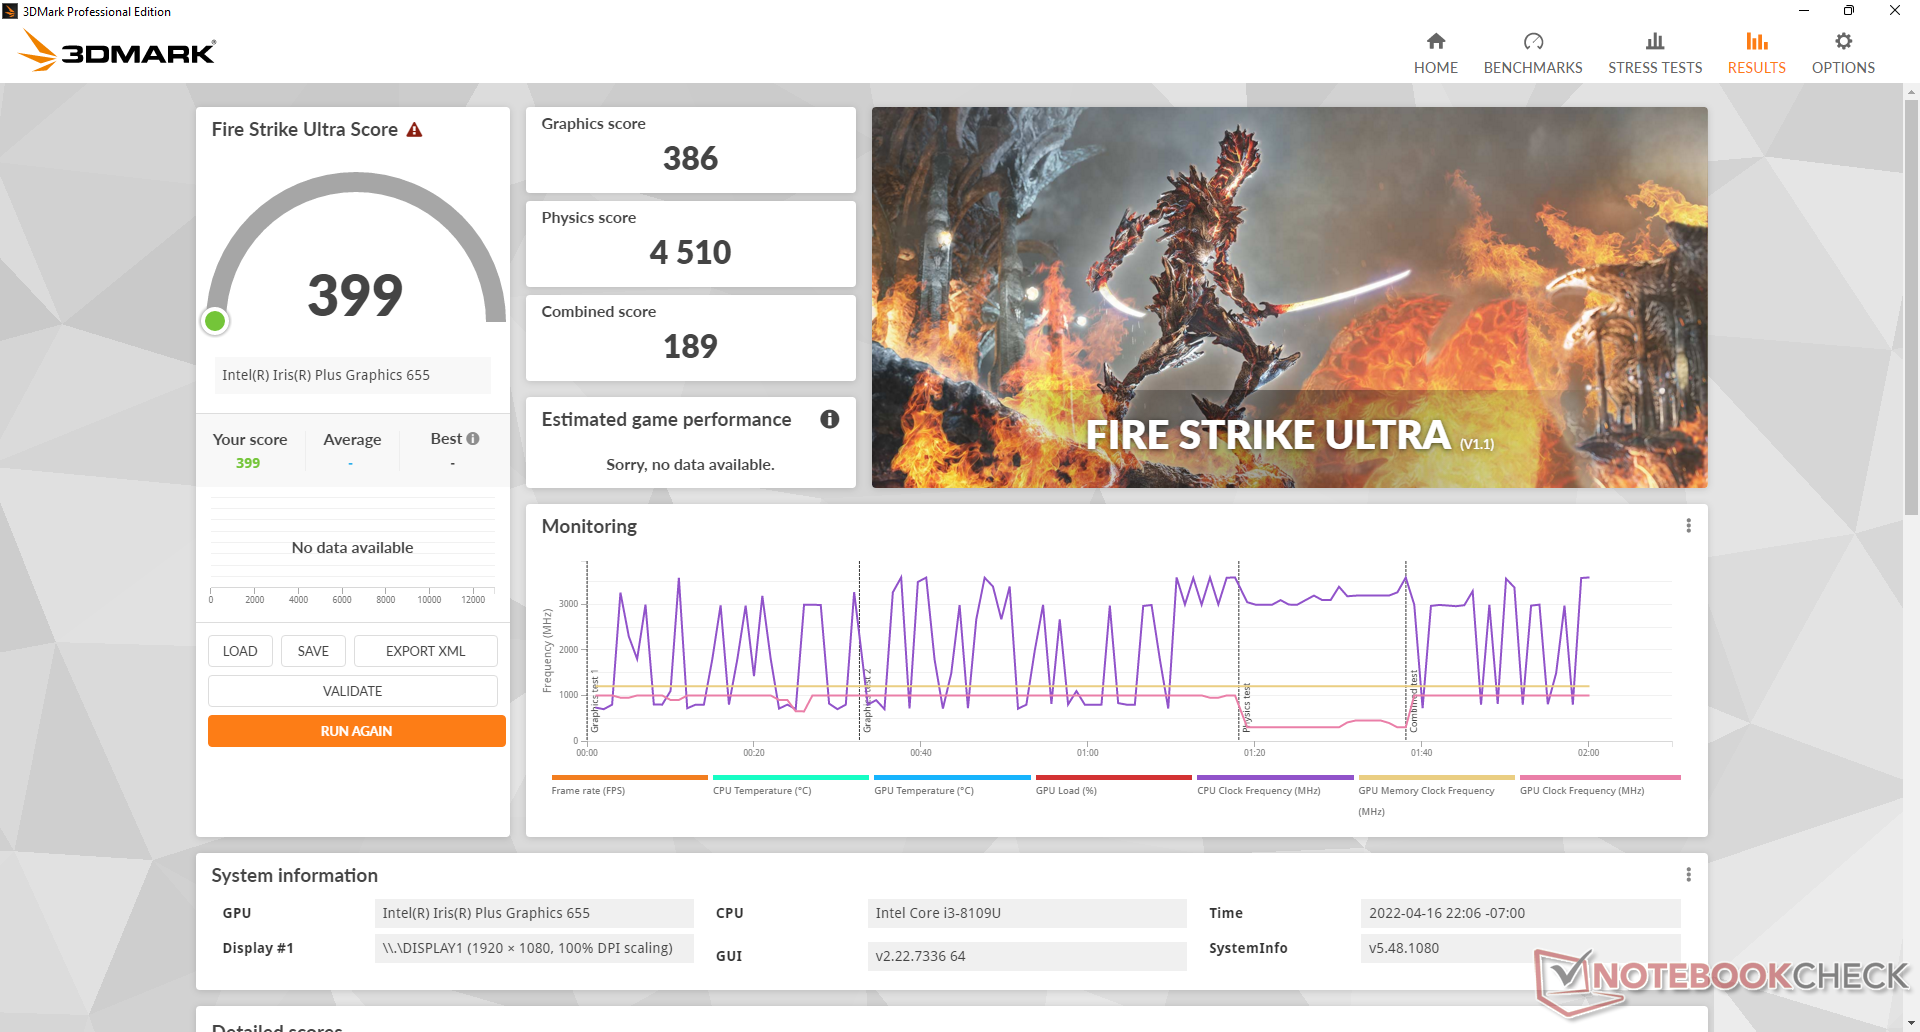
GPU性能
原始图形性能来自 Iris Plus 655的原始图形性能比平均水平快40%至50%。 UHD Graphics 620在第十代Ice Lake 之前的许多老式英特尔驱动的迷你电脑上发现的那样。对于流媒体和4K视频播放等任务来说,性能的提升是可敬的,但对于游戏来说,这远远不够。 Witcher 3例如,即使更新了所有的Windows和图形驱动,在我们的测试设备上启动时也会有问题。
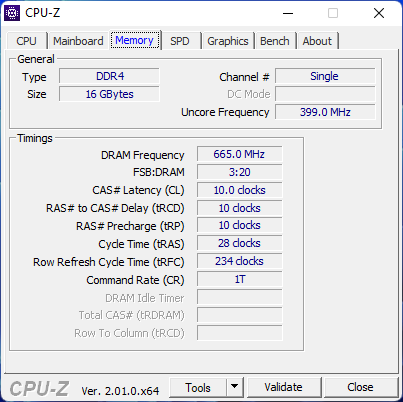
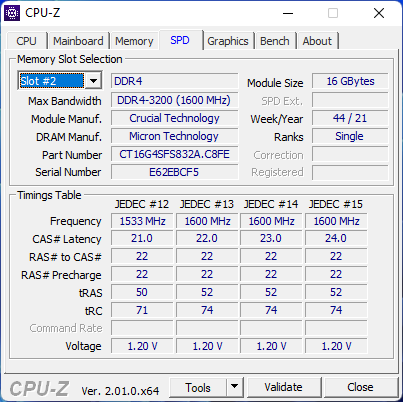
由于我们的测试设备只配备了单通道内存,如果配置了双通道内存,结果可能会比我们下面记录的快。
| 3DMark | |
| 1280x720 Cloud Gate Standard Graphics | |
| VAIO SX12 VJS124X1011P | |
| Beelink SER4 | |
| Intel NUC11TNKi5 | |
| Acer Swift 3 SF314-42-R27B | |
| Intel NUC8i7BE | |
| GMK NucBox 2 | |
| Average Intel Iris Plus Graphics 655 (6498 - 16698, n=9) | |
| Beelink SEi8 | |
| HP 255 G7 159P1EA | |
| Average Intel UHD Graphics 620 (6205 - 16400, n=225) | |
| Beelink SEi10 | |
| Beelink U59 | |
| Chuwi LapBook Plus | |
| GMK NucBox 3 | |
| Teclast Tbook 16 Power | |
| 1920x1080 Fire Strike Graphics | |
| VAIO SX12 VJS124X1011P | |
| Beelink SER4 | |
| Intel NUC11TNKi5 | |
| Acer Swift 3 SF314-42-R27B | |
| Intel NUC8i7BE | |
| GMK NucBox 2 | |
| Average Intel Iris Plus Graphics 655 (920 - 2260, n=9) | |
| Beelink SEi8 | |
| HP 255 G7 159P1EA | |
| Average Intel UHD Graphics 620 (557 - 2608, n=213) | |
| Beelink SEi10 | |
| Beelink U59 | |
| GMK NucBox 3 | |
| 2560x1440 Time Spy Graphics | |
| VAIO SX12 VJS124X1011P | |
| Beelink SER4 | |
| Intel NUC11TNKi5 | |
| Acer Swift 3 SF314-42-R27B | |
| Intel NUC8i7BE | |
| GMK NucBox 2 | |
| Average Intel Iris Plus Graphics 655 (301 - 633, n=10) | |
| Beelink SEi8 | |
| HP 255 G7 159P1EA | |
| Average Intel UHD Graphics 620 (299 - 797, n=88) | |
| Beelink SEi10 | |
| Beelink U59 | |
| Chuwi LapBook Plus | |
| GMK NucBox 3 | |
| 3DMark 11 - 1280x720 Performance GPU | |
| Beelink SER4 | |
| VAIO SX12 VJS124X1011P | |
| Intel NUC11TNKi5 | |
| Acer Swift 3 SF314-42-R27B | |
| Intel NUC8i7BE | |
| GMK NucBox 2 | |
| Beelink SEi8 | |
| Average Intel Iris Plus Graphics 655 (1365 - 3081, n=8) | |
| HP 255 G7 159P1EA | |
| Average Intel UHD Graphics 620 (1144 - 3432, n=244) | |
| Beelink SEi10 | |
| Microsoft Surface Go 3 Core i3 | |
| Beelink U59 | |
| Chuwi LapBook Plus | |
| GMK NucBox 3 | |
| Teclast Tbook 16 Power | |
| 3DMark 11 Performance | 2927 points | |
| 3DMark Cloud Gate Standard Score | 8238 points | |
| 3DMark Fire Strike Score | 1592 points | |
| 3DMark Time Spy Score | 636 points | |
Help | ||
| Final Fantasy XV Benchmark | |
| 1280x720 Lite Quality | |
| Beelink SER4 | |
| Intel NUC11TNKi5 | |
| GMK NucBox 2 | |
| Intel NUC8i7BE | |
| Beelink SEi8 | |
| Average Intel Iris Plus Graphics 655 (9.11 - 18.1, n=8) | |
| Beelink U59 | |
| GMK NucBox 3 | |
| 1920x1080 Standard Quality | |
| Beelink SER4 | |
| Intel NUC11TNKi5 | |
| GMK NucBox 2 | |
| Average Intel Iris Plus Graphics 655 (7.88 - 9.73, n=4) | |
| Beelink SEi8 | |
| 1920x1080 High Quality | |
| Beelink SER4 | |
| Intel NUC11TNKi5 | |
| Beelink SEi8 | |
| GMK NucBox 2 | |
| Average Intel Iris Plus Graphics 655 (5.25 - 6.55, n=4) | |
| X-Plane 11.11 | |
| 1280x720 low (fps_test=1) | |
| Beelink SER4 | |
| Intel NUC11TNKi5 | |
| Intel NUC8i7BE | |
| Acer Swift 3 SF314-42-R27B | |
| Average Intel Iris Plus Graphics 655 (13.8 - 42.8, n=7) | |
| GMK NucBox 2 | |
| Beelink SEi8 | |
| HP 255 G7 159P1EA | |
| Beelink U59 | |
| Microsoft Surface Go 3 Core i3 | |
| GMK NucBox 3 | |
| 1920x1080 med (fps_test=2) | |
| Beelink SER4 | |
| Intel NUC11TNKi5 | |
| Acer Swift 3 SF314-42-R27B | |
| Intel NUC8i7BE | |
| Average Intel Iris Plus Graphics 655 (9.75 - 29.5, n=7) | |
| GMK NucBox 2 | |
| Beelink SEi8 | |
| HP 255 G7 159P1EA | |
| Beelink U59 | |
| Microsoft Surface Go 3 Core i3 | |
| GMK NucBox 3 | |
| 1920x1080 high (fps_test=3) | |
| Beelink SER4 | |
| Intel NUC11TNKi5 | |
| Acer Swift 3 SF314-42-R27B | |
| Intel NUC8i7BE | |
| GMK NucBox 2 | |
| Average Intel Iris Plus Graphics 655 (8.55 - 25.1, n=7) | |
| Beelink SEi8 | |
| HP 255 G7 159P1EA | |
| Beelink U59 | |
| Microsoft Surface Go 3 Core i3 | |
| GMK NucBox 3 | |
| low | med. | high | ultra | |
|---|---|---|---|---|
| Dota 2 Reborn (2015) | 94.4 | 34.6 | 25.3 | 22.7 |
| Final Fantasy XV Benchmark (2018) | 16.6 | 8.8 | 6.08 | |
| X-Plane 11.11 (2018) | 22.4 | 15 | 12.3 |
排放
系统噪音
风扇的噪音在很大程度上是二进制的,即转速往往在最低和最高之间波动,中间的步骤很少。换句话说,在进行多任务处理或启动应用程序时,预期风扇会经常从安静变成嘈杂。这并不像更强大的Beelink GTi11系列或SER4那样糟糕,但与NUC相比,风扇噪音的变化更加明显和频繁。
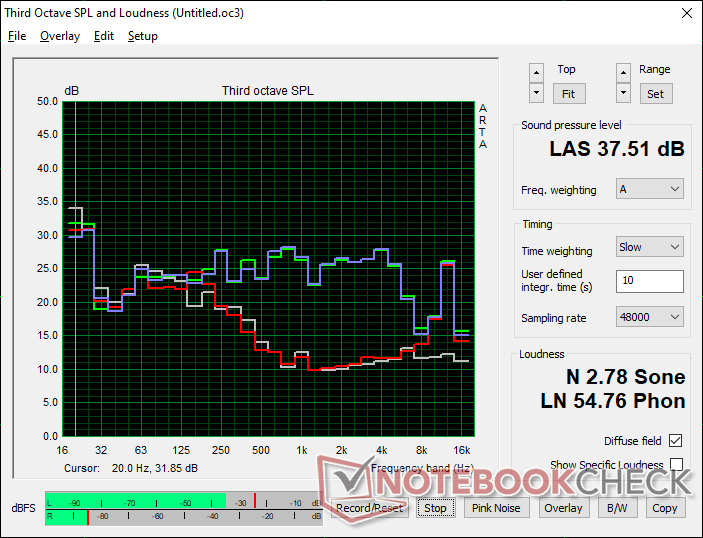
Noise level
| Idle |
| 26.5 / 26.5 / 31.1 dB(A) |
| Load |
| 37.7 / 37.5 dB(A) |
 | ||
30 dB silent 40 dB(A) audible 50 dB(A) loud |
||
min: | ||
| Beelink SEi8 Iris Plus Graphics 655, i3-8109U, Intel SSD 660p SSDPEKNW512G8 | Beelink SEi10 UHD Graphics G1 (Ice Lake 32 EU), i3-1005G1, Silicon Motion AZW 256G M.2280 NVMe 4X 200725 D | Beelink SER4 Vega 8, R7 4800U, Intel SSD 660p SSDPEKNW512G8 | Intel NUC11TNKi5 Iris Xe G7 80EUs, i5-1135G7, Transcend M.2 SSD 430S TS512GMTS430S | Intel NUC8i7BE Iris Plus Graphics 655, i7-8559U | GMK NucBox 2 Iris Plus Graphics 655, i5-8259U, Netac S930E8/256GPN | |
|---|---|---|---|---|---|---|
| Noise | -17% | -11% | -18% | -9% | 5% | |
| off / environment * (dB) | 24.5 | 27.5 -12% | 23.4 4% | 24.8 -1% | 28.7 -17% | 25.6 -4% |
| Idle Minimum * (dB) | 26.5 | 30.9 -17% | 33.2 -25% | 35.6 -34% | 28.7 -8% | 25.7 3% |
| Idle Average * (dB) | 26.5 | 33.5 -26% | 33.2 -25% | 35.6 -34% | 29.3 -11% | 25.7 3% |
| Idle Maximum * (dB) | 31.1 | 33.5 -8% | 33.2 -7% | 35.6 -14% | 31.8 -2% | 25.7 17% |
| Load Average * (dB) | 37.7 | 38.5 -2% | 38.6 -2% | 36.2 4% | 39 -3% | 35.3 6% |
| Load Maximum * (dB) | 37.5 | 51.6 -38% | 40.8 -9% | 47.6 -27% | 41.4 -10% | 35.1 6% |
| Witcher 3 ultra * (dB) | 39.2 | 38 | 39 |
* ... smaller is better
温度
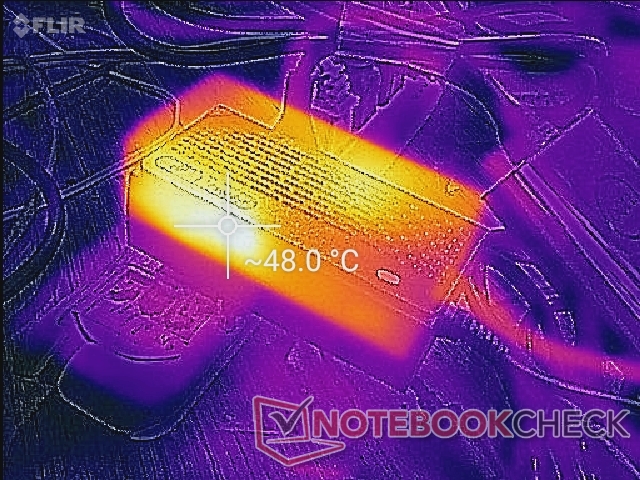
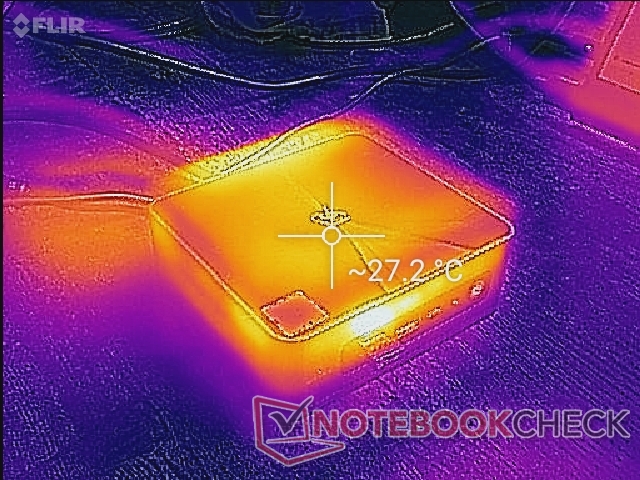
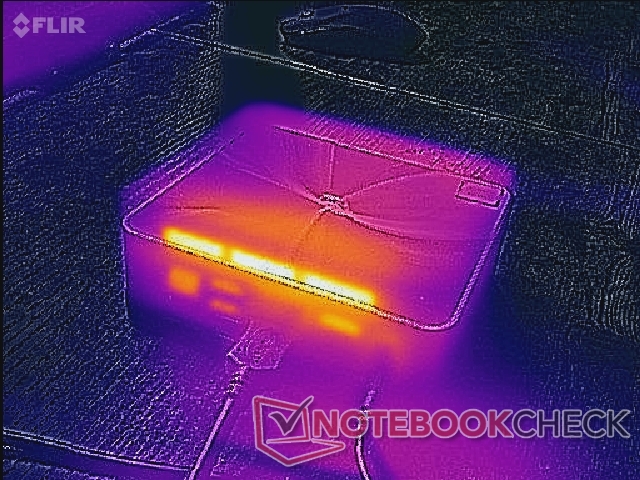
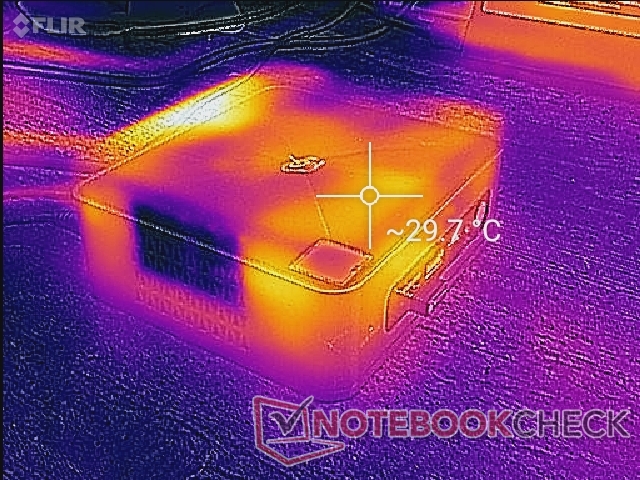
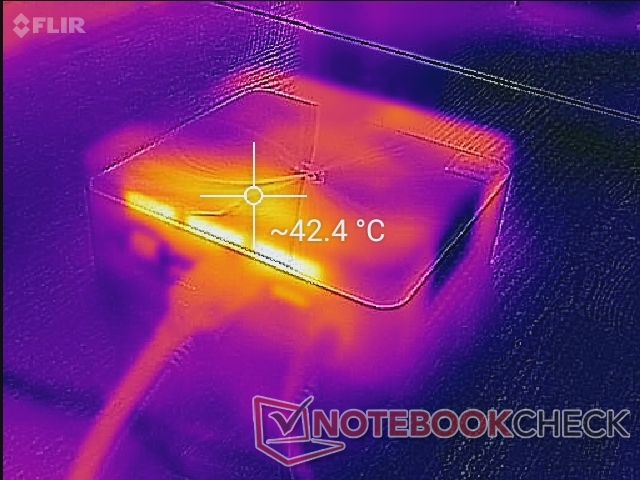
与更强大的SER4不同,SEi8的顶部表面没有通风格栅,因此用户可以安全地在上面放置纸张和其他物体而不影响散热。进气口只沿着机箱的两边。在最靠近后方的顶部和排气栅栏旁边,热点可以达到42℃以上。
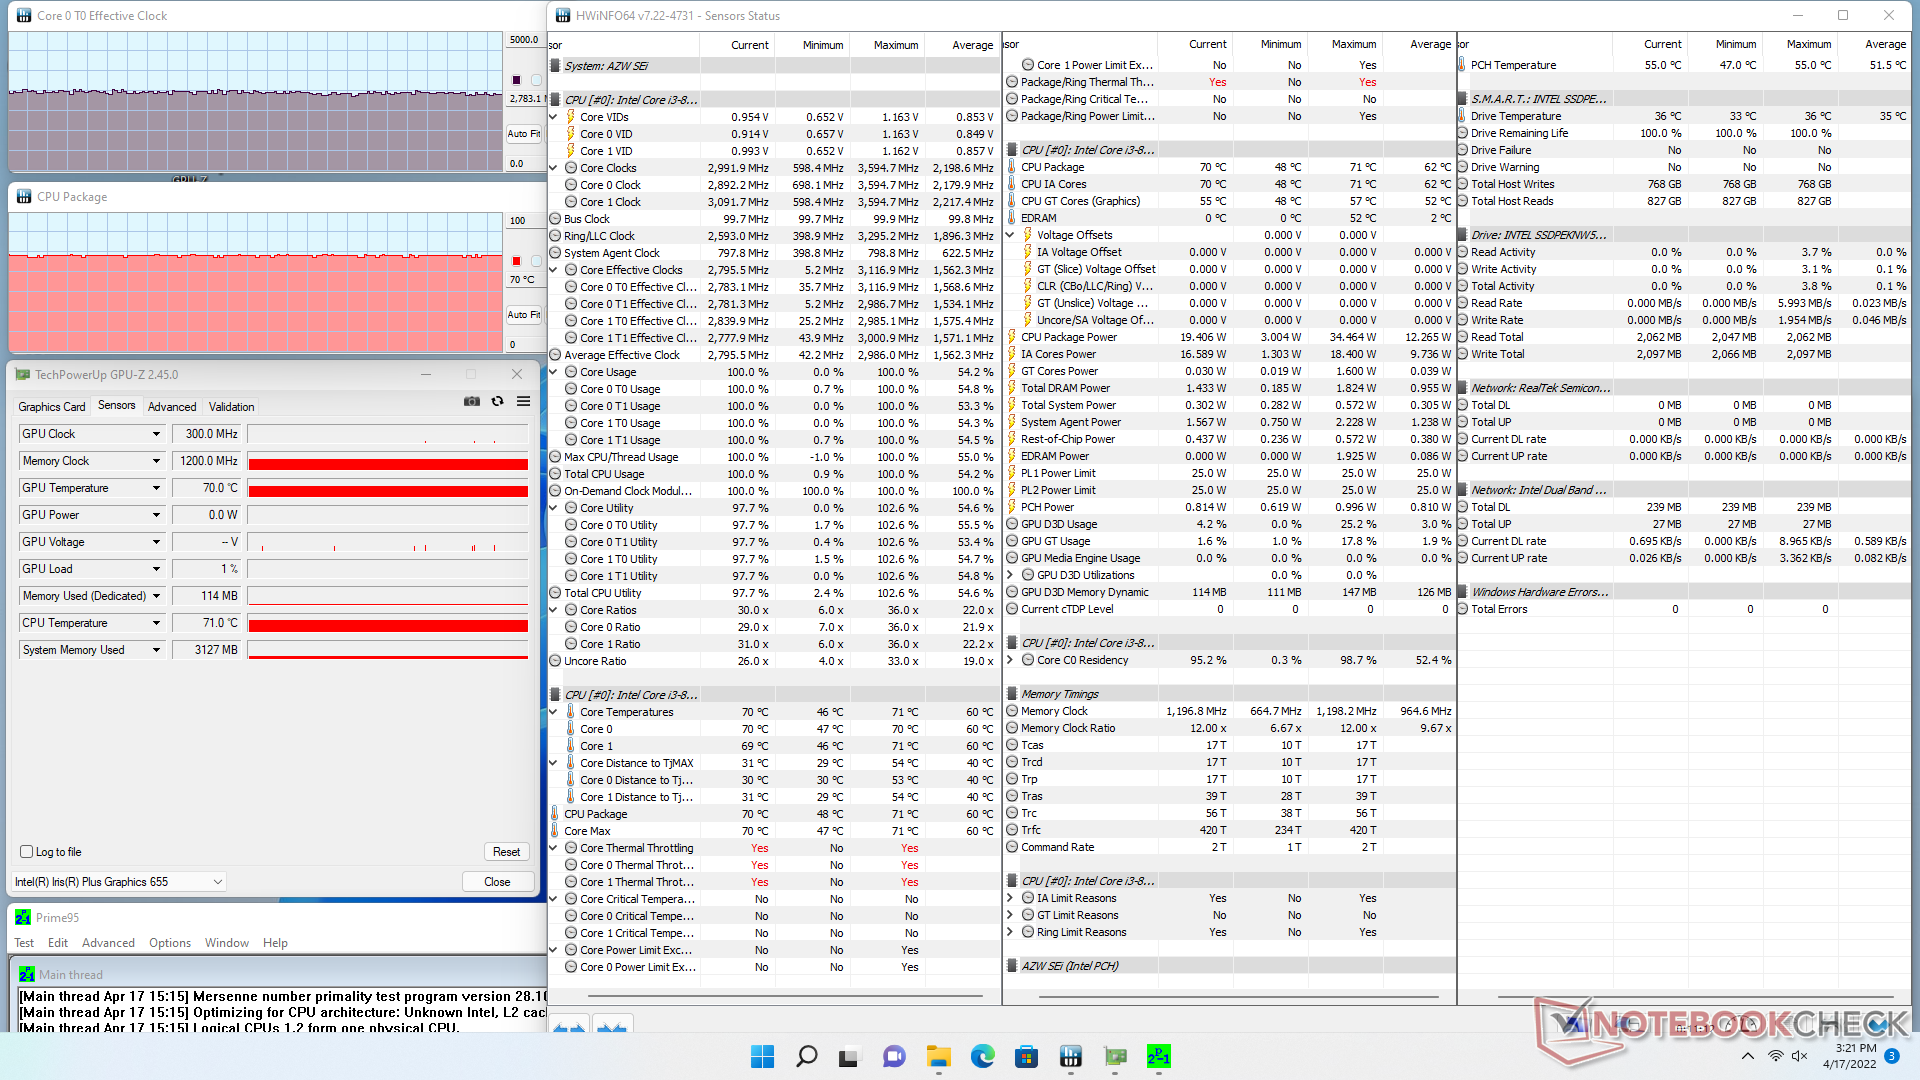
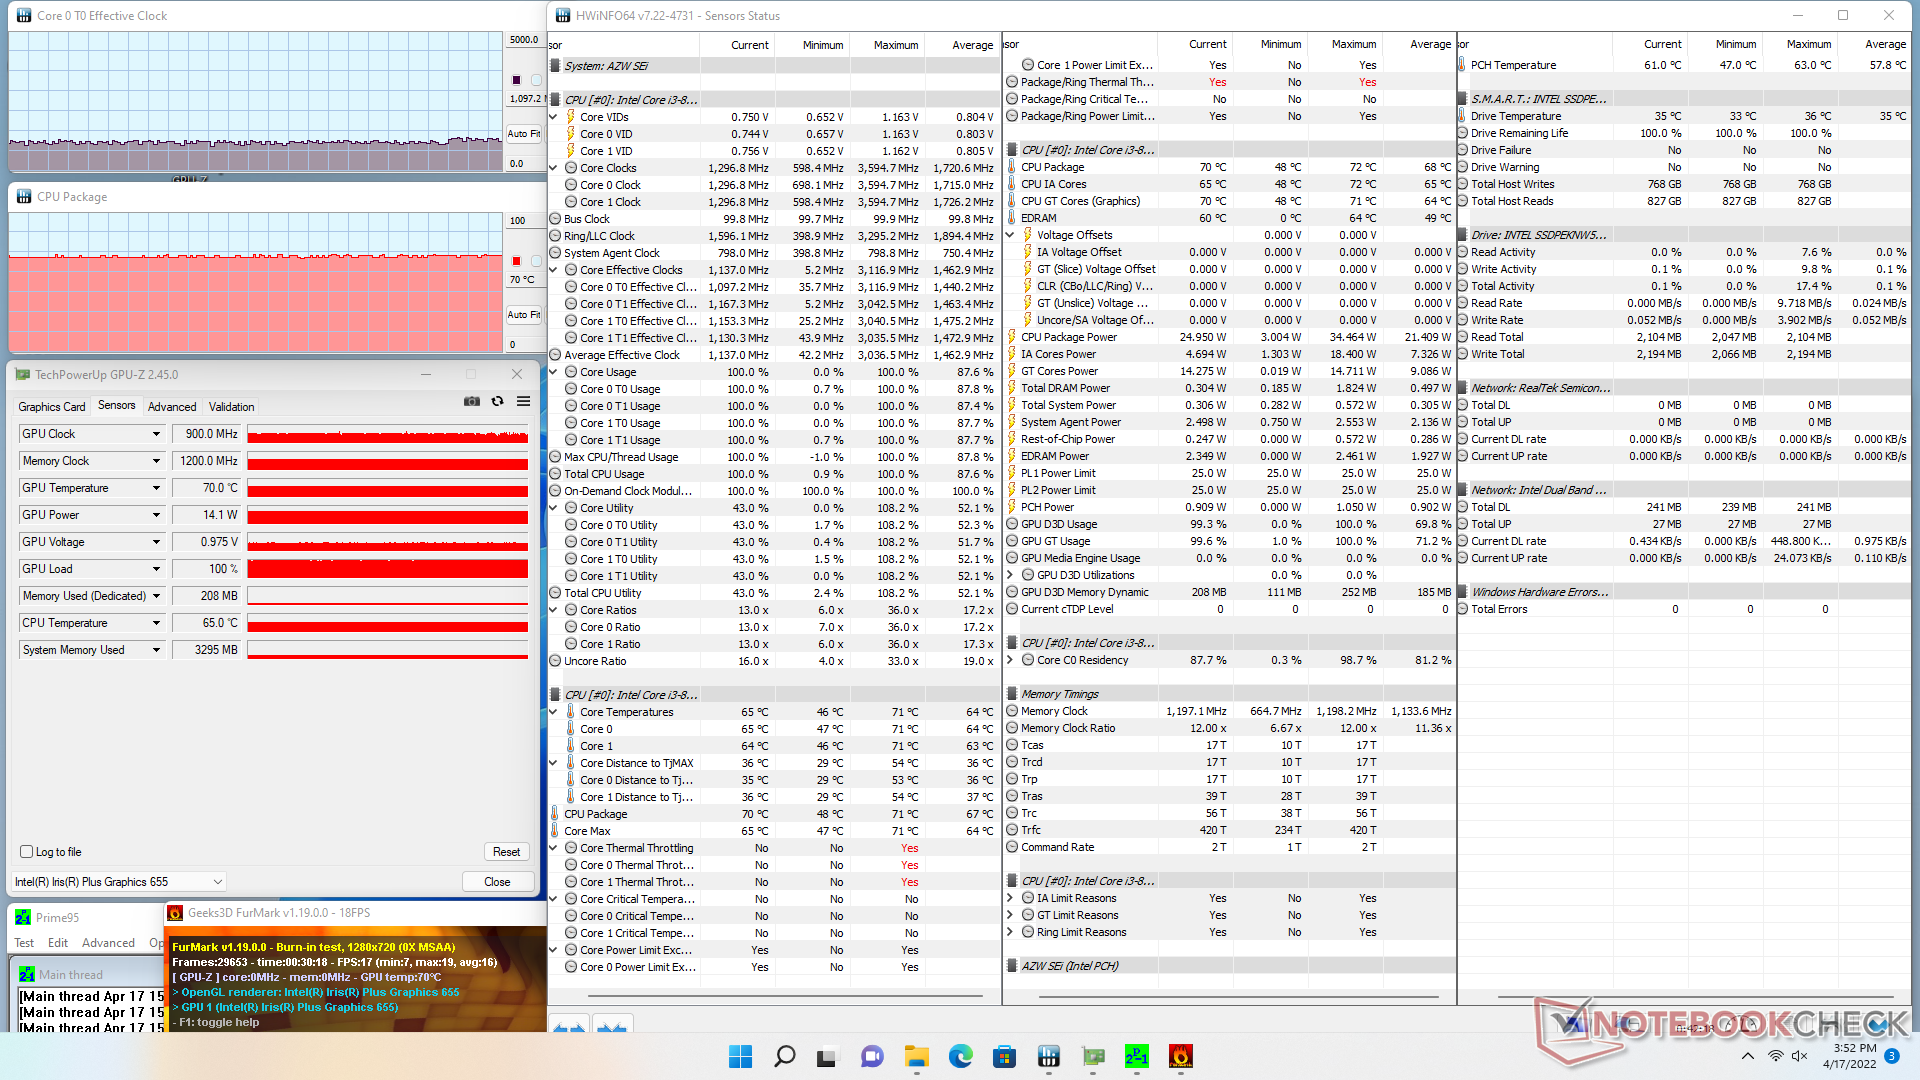
压力测试
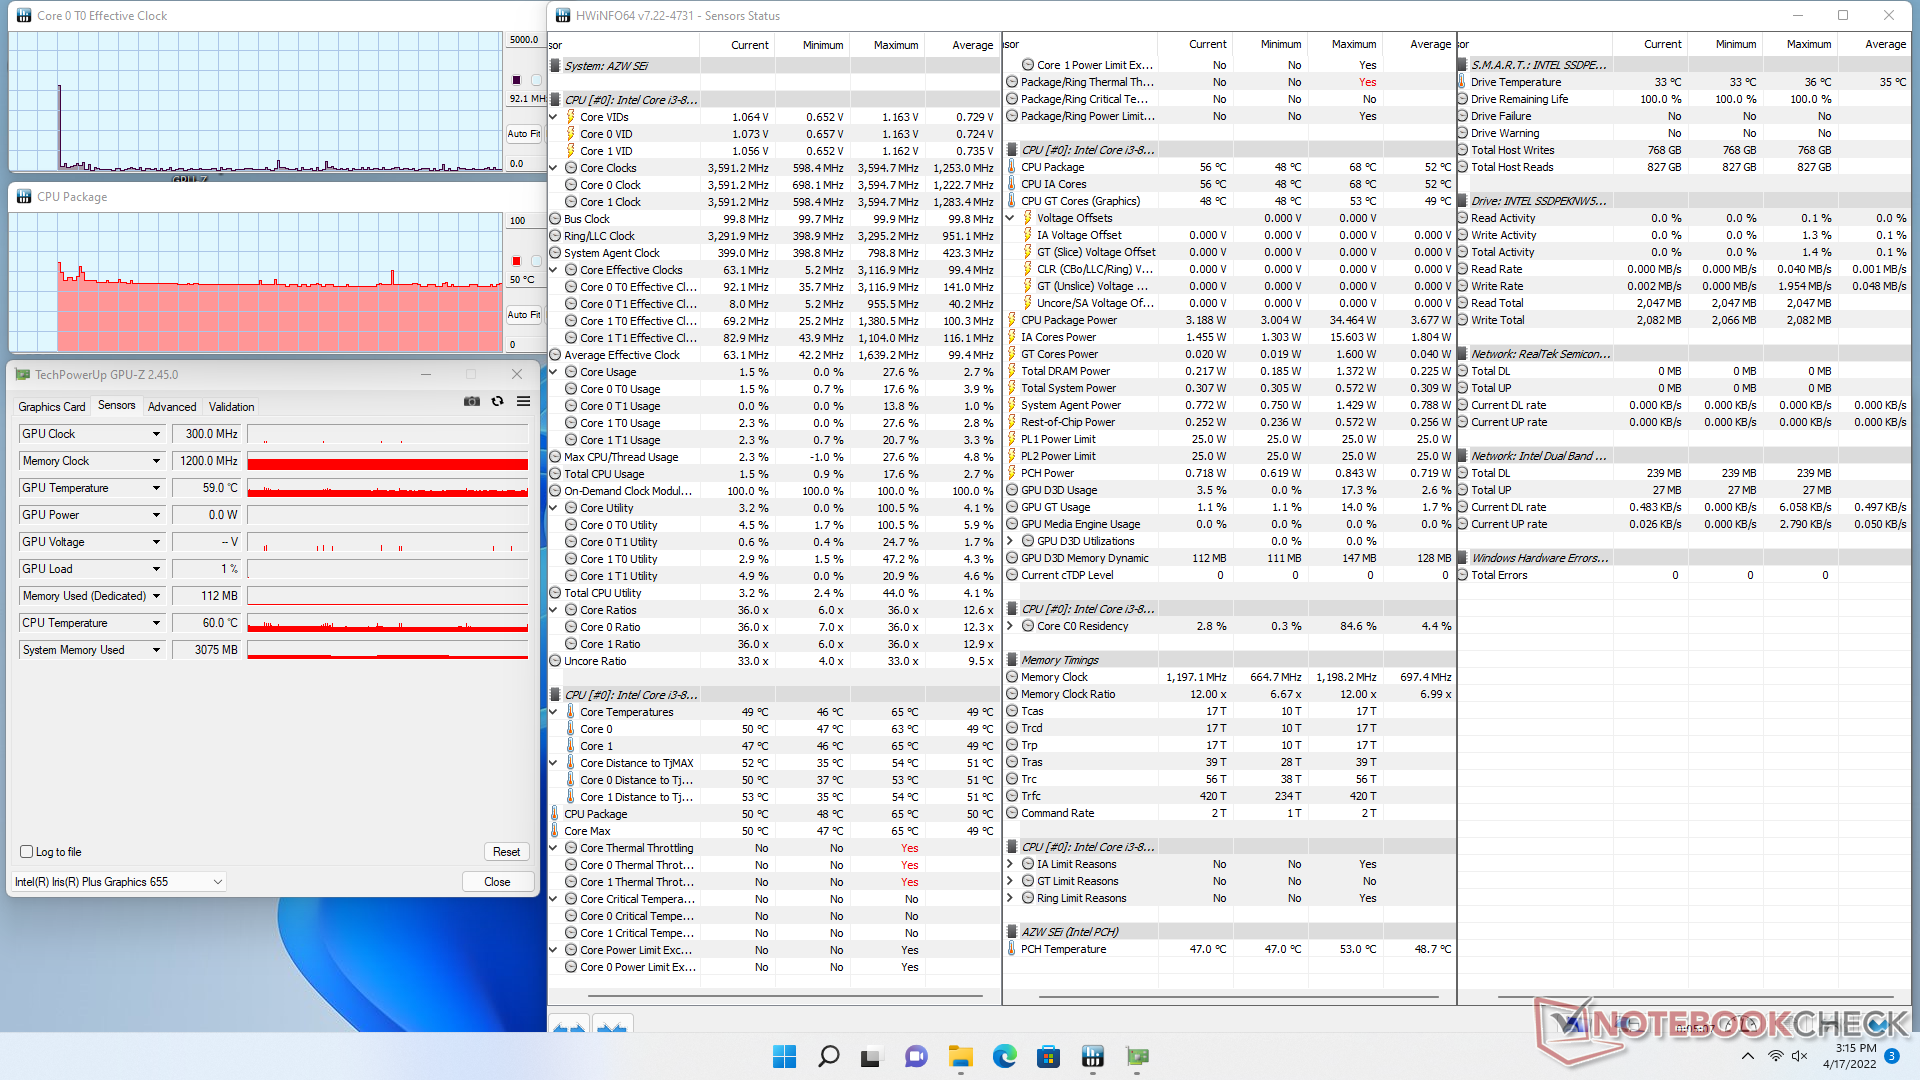
当运行Prime95时,CPU会提升到2.9 GHz,然后稳定在2.8 GHz和70 C。CPU封装功率在测试开始时也会高达34.4 W,然后下降并稳定在19.4 W。 Core i3-1005G1将看到更高的时钟频率和核心温度,分别为3.4 GHz和90 C。
| CPU时钟(GHz) | GPU时钟(MHz) | CPU平均温度(°C) | |
| 系统空闲 | -- | -- | 50 |
| Prime95压力 | 2.8 | -- | 70 |
| Prime95 + FurMark Stress | 1.1 | 900 | 70 |
能源管理
消耗功率
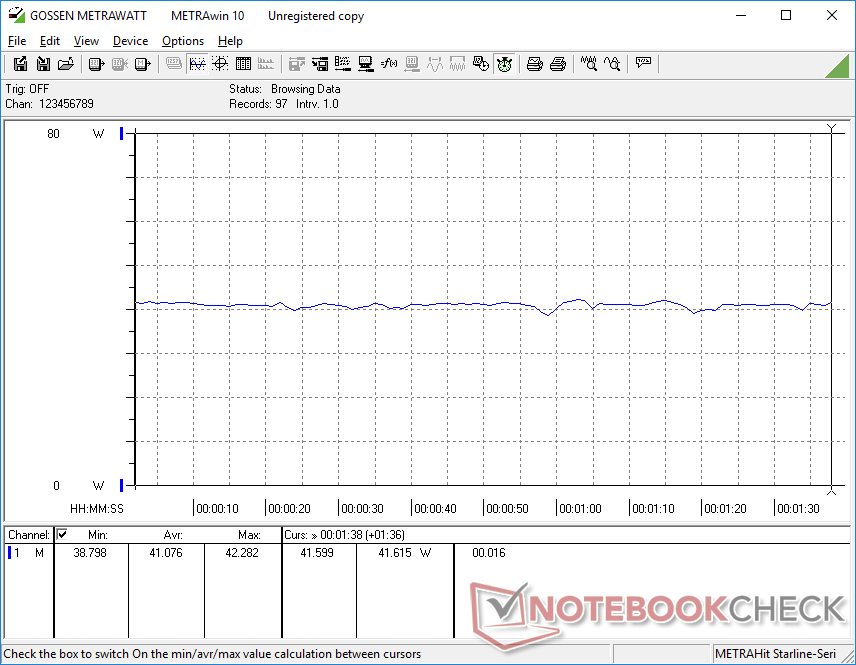
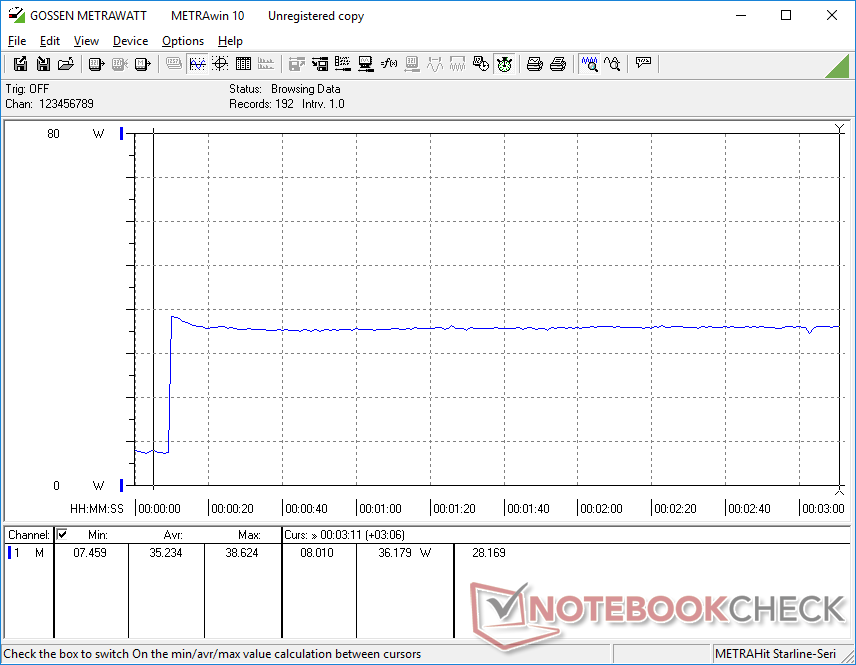
尽管有第11代CPU系列的性能优势,但SEi8的耗电量与采用较新的第11代CPU的NUC 11差不多。这是由于第8代系列的优化程度要低得多,特别是在集成图形性能方面。为了获得更高的每瓦特性能,用户将考虑采用Core i5-8279U或SEi10系列的SEi8。
预计该系统在运行高要求的负载时,消耗的功率刚刚超过40瓦。

| Off / Standby | |
| Idle | |
| Load |
|
Key:
min: | |
| Beelink SEi8 i3-8109U, Iris Plus Graphics 655, Intel SSD 660p SSDPEKNW512G8, , x, | Beelink SEi10 i3-1005G1, UHD Graphics G1 (Ice Lake 32 EU), Silicon Motion AZW 256G M.2280 NVMe 4X 200725 D, , x, | Beelink SER4 R7 4800U, Vega 8, Intel SSD 660p SSDPEKNW512G8, , x, | Intel NUC11TNKi5 i5-1135G7, Iris Xe G7 80EUs, Transcend M.2 SSD 430S TS512GMTS430S, , x, | Intel NUC8i7BE i7-8559U, Iris Plus Graphics 655, , , x, | GMK NucBox 2 i5-8259U, Iris Plus Graphics 655, Netac S930E8/256GPN, , x, | |
|---|---|---|---|---|---|---|
| Power Consumption | 16% | 32% | -47% | 4% | 3% | |
| Idle Minimum * (Watt) | 7.5 | 6.3 16% | 4.1 45% | 11.5 -53% | 2.7 64% | 6.1 19% |
| Idle Average * (Watt) | 7.6 | 6.6 13% | 4.1 46% | 12.4 -63% | 3.1 59% | 6.8 11% |
| Idle Maximum * (Watt) | 9.2 | 6.7 27% | 4.6 50% | 12.9 -40% | 6.3 32% | 7.3 21% |
| Load Average * (Watt) | 41.1 | 25.9 37% | 35.6 13% | 40.7 1% | 59.7 -45% | 46.3 -13% |
| Load Maximum * (Watt) | 41.4 | 46.7 -13% | 39.9 4% | 73.5 -78% | 78 -88% | 50.7 -22% |
| Witcher 3 ultra * (Watt) | 35.6 | 43.9 | 47.2 |
* ... smaller is better
Power Consumption Witcher 3 / Stresstest
Pros
Cons
判决书
与大多数其他Beelink迷你电脑一样,SEi8的低价格是它与竞争对手相比的最大优势。一台满载酷睿i3-3109U处理器、16GB内存、正版Windows 11 Pro和256GB NVMe固态硬盘的SEi8售价约为380美元,而一台配备完全相同的处理器但采用裸机配置的英特尔NUC8I3BEK可以在网上以350美元找到。
对于一个四年前的处理器来说,酷睿i3-8109U的速度足以满足基本的HTPC应用,如浏览、流媒体、操作系统导航和轻度多任务处理,而不会出现基于赛扬或Atom的较弱解决方案中常见的持续减速现象。如果你想尽可能便宜,同时尽量减少对用户界面体验的影响,那么SEi8酷睿i3应该是你清单上的首选。对于需要更快的处理器、更长的腿和更多的多任务处理潜力的用户来说,升级到SEi8酷睿i5将大大提升性能,而价格不会有太大的增加。
英特尔NUC的明显缺点包括更薄的机箱材料、更慢的WLAN模块、更短的保修期、更频繁的风扇脉动、没有SD卡读卡器和更有限的BIOS选项。值得庆幸的是,对于目标预算的HTPC设置来说,这些被削减的角落还不足以成为交易的破坏者。
Price comparison

