惠普 EliteBook 755 G4 (AMD PRO A12-9800B) 笔记本电脑简短评测
| SD Card Reader | |
| average JPG Copy Test (av. of 3 runs) | |
| Fujitsu LifeBook U757 | |
| Lenovo ThinkPad T570-20H90002GE | |
| HP EliteBook 850 G4-Z2W86ET | |
| HP ProBook 650 G2 V1A44ET | |
| HP EliteBook 755 G4 | |
| maximum AS SSD Seq Read Test (1GB) | |
| Lenovo ThinkPad T570-20H90002GE | |
| HP EliteBook 850 G4-Z2W86ET | |
| Fujitsu LifeBook U757 | |
| HP EliteBook 755 G4 | |
| Networking | |
| iperf3 transmit AX12 | |
| HP EliteBook 755 G4 | |
| Lenovo ThinkPad T570-20H90002GE | |
| HP EliteBook 850 G4-Z2W86ET | |
| Fujitsu LifeBook U757 | |
| iperf3 receive AX12 | |
| Fujitsu LifeBook U757 | |
| Lenovo ThinkPad T570-20H90002GE | |
| HP EliteBook 850 G4-Z2W86ET | |
| HP EliteBook 755 G4 | |
| |||||||||||||||||||||||||
Brightness Distribution: 82 %
Center on Battery: 333 cd/m²
Contrast: 374:1 (Black: 0.89 cd/m²)
ΔE ColorChecker Calman: 11.69 | ∀{0.5-29.43 Ø4.71}
ΔE Greyscale Calman: 13.7 | ∀{0.09-98 Ø4.96}
84% sRGB (Argyll 1.6.3 3D)
54% AdobeRGB 1998 (Argyll 1.6.3 3D)
57.7% AdobeRGB 1998 (Argyll 3D)
84.2% sRGB (Argyll 3D)
56.3% Display P3 (Argyll 3D)
Gamma: 2.29
CCT: 15194 K
| HP EliteBook 755 G4 Chi Mei, CMN15C3, , 1920x1080, 15.6" | Lenovo ThinkPad T570-20H90002GE N156HCA-EAA, , 1920x1080, 15.6" | HP EliteBook 850 G4-Z2W86ET AUO35ED, , 1920x1080, 15.6" | Fujitsu LifeBook U757 LP156WF6-SPP1, , 1920x1080, 15.6" | HP ProBook 650 G2 V1A44ET Chi Mei, , 1920x1080, 15.6" | |
|---|---|---|---|---|---|
| Display | -22% | 1% | 8% | -7% | |
| Display P3 Coverage (%) | 56.3 | 44.08 -22% | 56.8 1% | 65.8 17% | 52.1 -7% |
| sRGB Coverage (%) | 84.2 | 65.6 -22% | 83.7 -1% | 84.8 1% | 78.3 -7% |
| AdobeRGB 1998 Coverage (%) | 57.7 | 45.66 -21% | 58.7 2% | 62 7% | 53.7 -7% |
| Response Times | -4% | 6% | -14% | -21% | |
| Response Time Grey 50% / Grey 80% * (ms) | 45 ? | 41.6 ? 8% | 47.2 ? -5% | 36 ? 20% | 41 ? 9% |
| Response Time Black / White * (ms) | 18 ? | 20.8 ? -16% | 15.2 ? 16% | 26.4 ? -47% | 27 ? -50% |
| PWM Frequency (Hz) | 1000 ? | 26040 ? | 199.2 ? | 200 ? | |
| Screen | 37% | 6% | 46% | 7% | |
| Brightness middle (cd/m²) | 333 | 262 -21% | 338 2% | 313 -6% | 313 -6% |
| Brightness (cd/m²) | 306 | 245 -20% | 341 11% | 294 -4% | 296 -3% |
| Brightness Distribution (%) | 82 | 89 9% | 90 10% | 84 2% | 90 10% |
| Black Level * (cd/m²) | 0.89 | 0.24 73% | 0.81 9% | 0.27 70% | 0.59 34% |
| Contrast (:1) | 374 | 1092 192% | 417 11% | 1159 210% | 531 42% |
| Colorchecker dE 2000 * | 11.69 | 4.5 62% | 10.9 7% | 4.5 62% | 11.89 -2% |
| Colorchecker dE 2000 max. * | 20.57 | 10.5 49% | 18.7 9% | 10.5 49% | 20.81 -1% |
| Greyscale dE 2000 * | 13.7 | 3.5 74% | 13.3 3% | 4 71% | 12.95 5% |
| Gamma | 2.29 96% | 2.32 95% | 2.11 104% | 2.24 98% | 2.4 92% |
| CCT | 15194 43% | 6524 100% | 16030 41% | 6387 102% | 15063 43% |
| Color Space (Percent of AdobeRGB 1998) (%) | 54 | 42.04 -22% | 53.8 0% | 55.3 2% | 50 -7% |
| Color Space (Percent of sRGB) (%) | 84 | 65.4 -22% | 83.4 -1% | 84.74 1% | 78 -7% |
| Total Average (Program / Settings) | 4% /
20% | 4% /
5% | 13% /
30% | -7% /
0% |
* ... smaller is better
Display Response Times
| ↔ Response Time Black to White | ||
|---|---|---|
| 18 ms ... rise ↗ and fall ↘ combined | ↗ 14 ms rise | 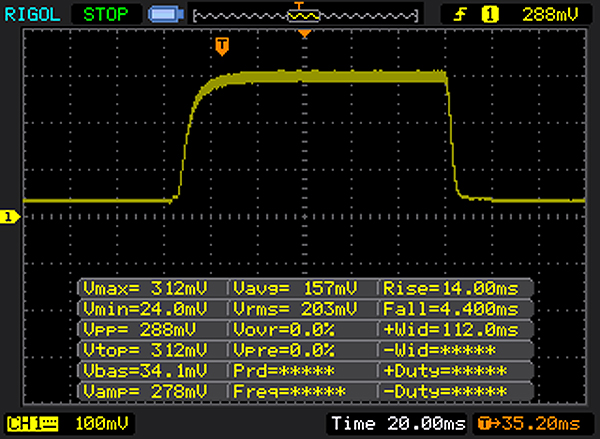 |
| ↘ 4 ms fall | ||
| The screen shows good response rates in our tests, but may be too slow for competitive gamers. In comparison, all tested devices range from 0.1 (minimum) to 240 (maximum) ms. » 40 % of all devices are better. This means that the measured response time is similar to the average of all tested devices (19.8 ms). | ||
| ↔ Response Time 50% Grey to 80% Grey | ||
| 45 ms ... rise ↗ and fall ↘ combined | ↗ 27 ms rise | 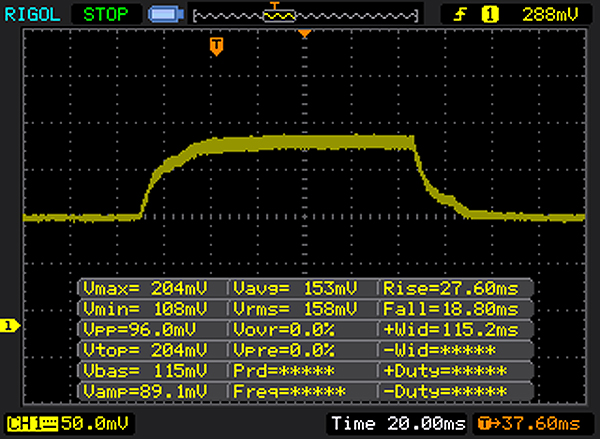 |
| ↘ 18 ms fall | ||
| The screen shows slow response rates in our tests and will be unsatisfactory for gamers. In comparison, all tested devices range from 0.165 (minimum) to 636 (maximum) ms. » 77 % of all devices are better. This means that the measured response time is worse than the average of all tested devices (31 ms). | ||
Screen Flickering / PWM (Pulse-Width Modulation)
| Screen flickering / PWM detected | 1000 Hz | ≤ 90 % brightness setting | 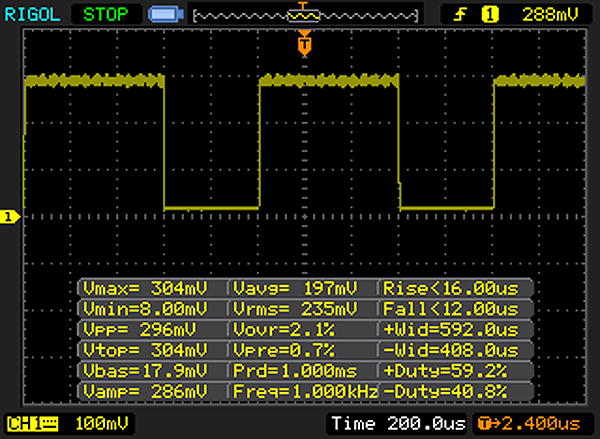 |
The display backlight flickers at 1000 Hz (worst case, e.g., utilizing PWM) Flickering detected at a brightness setting of 90 % and below. There should be no flickering or PWM above this brightness setting. The frequency of 1000 Hz is quite high, so most users sensitive to PWM should not notice any flickering. In comparison: 52 % of all tested devices do not use PWM to dim the display. If PWM was detected, an average of 7757 (minimum: 5 - maximum: 343500) Hz was measured. | |||
| Cinebench R11.5 | |
| CPU Single 64Bit | |
| HP EliteBook 755 G4 | |
| CPU Multi 64Bit | |
| HP EliteBook 755 G4 | |
| JetStream 1.1 - 1.1 Total | |
| HP EliteBook 850 G4-Z2W86ET | |
| Lenovo ThinkPad T570-20H90002GE | |
| Fujitsu LifeBook U757 | |
| HP EliteBook 755 G4 | |
| HP ProBook 650 G2 V1A44ET | |
| Octane V2 - Total Score | |
| Lenovo ThinkPad T570-20H90002GE | |
| HP EliteBook 850 G4-Z2W86ET | |
| HP EliteBook 755 G4 | |
| Mozilla Kraken 1.1 - Total | |
| HP EliteBook 755 G4 | |
| HP EliteBook 850 G4-Z2W86ET | |
| Lenovo ThinkPad T570-20H90002GE | |
* ... smaller is better
| PCMark 8 | |
| Home Score Accelerated v2 | |
| HP EliteBook 850 G4-Z2W86ET | |
| Lenovo ThinkPad T570-20H90002GE | |
| Fujitsu LifeBook U757 | |
| HP ProBook 650 G2 V1A44ET | |
| HP EliteBook 755 G4 | |
| Work Score Accelerated v2 | |
| Lenovo ThinkPad T570-20H90002GE | |
| HP EliteBook 850 G4-Z2W86ET | |
| HP EliteBook 755 G4 | |
| Creative Score Accelerated v2 | |
| Lenovo ThinkPad T570-20H90002GE | |
| HP EliteBook 755 G4 | |
| PCMark 7 | |
| Productivity | |
| HP EliteBook 755 G4 | |
| Score | |
| HP EliteBook 755 G4 | |
| PCMark 7 Score | 7184 points | |
| PCMark 8 Home Score Accelerated v2 | 1579 points | |
| PCMark 8 Creative Score Accelerated v2 | 3292 points | |
| PCMark 8 Work Score Accelerated v2 | 3765 points | |
| PCMark 10 Score | 2332 points | |
Help | ||
| HP EliteBook 755 G4 Samsung PM961 MZVLW256HEHP | Lenovo ThinkPad T570-20H90002GE Samsung PM961 MZVLW256HEHP | HP EliteBook 850 G4-Z2W86ET Samsung PM951 NVMe MZVLV256 | Fujitsu LifeBook U757 Samsung CM871a MZNTY256HDHP | HP ProBook 650 G2 V1A44ET Sandisk X300 SD7SN6S-256G-1006 | |
|---|---|---|---|---|---|
| CrystalDiskMark 3.0 | 132% | 78% | 36% | 14% | |
| Read Seq (MB/s) | 800 | 1318 65% | 1245 56% | 509 -36% | 475 -41% |
| Write Seq (MB/s) | 774 | 1166 51% | 298.6 -61% | 488.4 -37% | 435 -44% |
| Read 512 (MB/s) | 583 | 933 60% | 673 15% | 414.3 -29% | 280.4 -52% |
| Write 512 (MB/s) | 580 | 860 48% | 298.8 -48% | 321.7 -45% | 265.5 -54% |
| Read 4k (MB/s) | 31.42 | 56.6 80% | 41.79 33% | 36.43 16% | 32.71 4% |
| Write 4k (MB/s) | 49.86 | 130.6 162% | 138.4 178% | 88.4 77% | 98.7 98% |
| Read 4k QD32 (MB/s) | 141.2 | 510 261% | 495 251% | 402.8 185% | 347.2 146% |
| Write 4k QD32 (MB/s) | 99.1 | 426.4 330% | 297.5 200% | 256.7 159% | 154.1 55% |

| 3DMark | |
| 1280x720 Cloud Gate Standard Graphics | |
| Lenovo ThinkPad T570-20H90002GE | |
| HP EliteBook 850 G4-Z2W86ET | |
| HP EliteBook 755 G4 | |
| 1920x1080 Fire Strike Graphics | |
| HP EliteBook 755 G4 | |
| Lenovo ThinkPad T570-20H90002GE | |
| HP EliteBook 850 G4-Z2W86ET | |
| 3DMark 11 - 1280x720 Performance GPU | |
| HP EliteBook 755 G4 | |
| Lenovo ThinkPad T570-20H90002GE | |
| HP EliteBook 850 G4-Z2W86ET | |
| Fujitsu LifeBook U757 | |
| HP ProBook 650 G2 V1A44ET | |
| 3DMark 11 Performance | 1737 points | |
| 3DMark Ice Storm Standard Score | 37561 points | |
| 3DMark Cloud Gate Standard Score | 3897 points | |
| 3DMark Fire Strike Score | 833 points | |
| 3DMark Fire Strike Extreme Score | 417 points | |
| 3DMark Time Spy Score | 358 points | |
Help | ||
| low | med. | high | ultra | |
|---|---|---|---|---|
| BioShock Infinite (2013) | 46.2 | 27.9 | 22.5 | 7.8 |
| Battlefield 4 (2013) | 32.5 | 22.8 | 15.2 | 5.6 |
| The Witcher 3 (2015) | 11.9 | 7.6 | ||
| Rise of the Tomb Raider (2016) | 20.6 | 12.4 | 6.2 |
Noise level
| Idle |
| 29.9 / 29.9 / 29.9 dB(A) |
| Load |
| 30.9 / 32.8 dB(A) |
 | ||
30 dB silent 40 dB(A) audible 50 dB(A) loud |
||
min: | ||
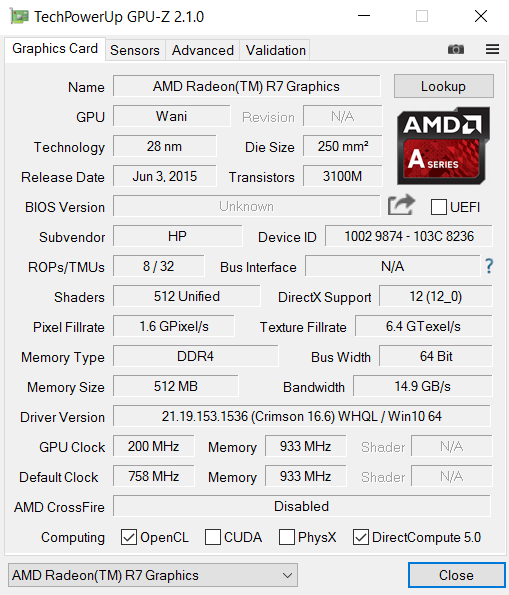
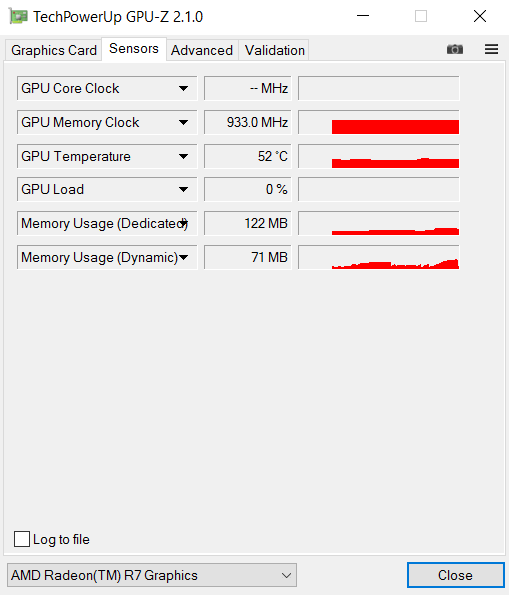
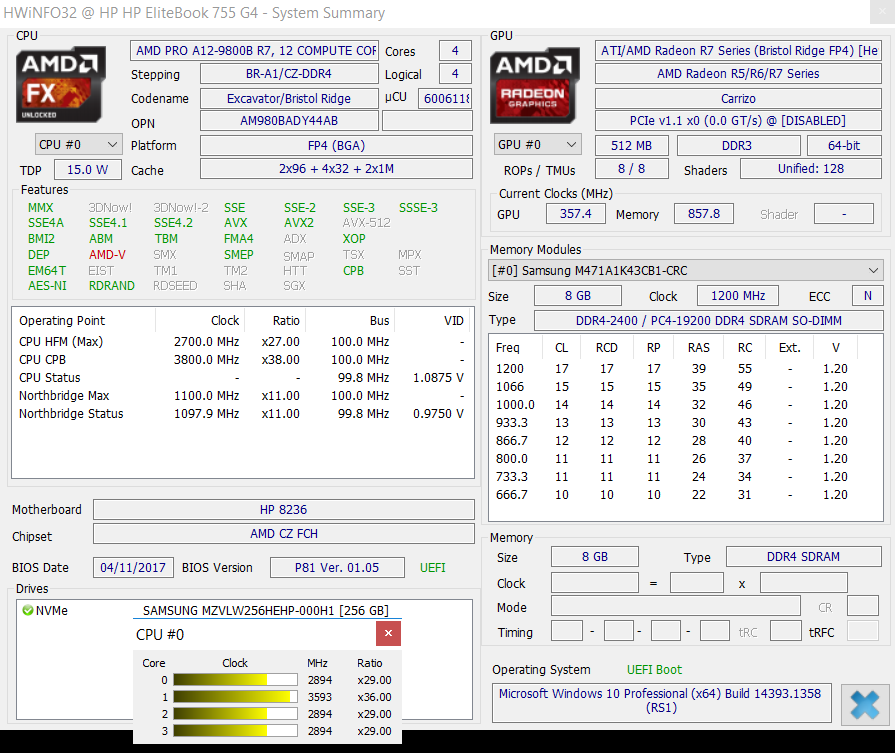
| HP EliteBook 755 G4 PRO A12-9800B, Radeon R7 (Bristol Ridge) | Lenovo ThinkPad T570-20H90002GE i5-7200U, HD Graphics 620 | HP EliteBook 850 G4-Z2W86ET i5-7200U, HD Graphics 620 | Fujitsu LifeBook U757 i5-7200U, HD Graphics 620 | HP ProBook 650 G2 V1A44ET 6200U, HD Graphics 520 | |
|---|---|---|---|---|---|
| Noise | -5% | 2% | 2% | -6% | |
| off / environment * (dB) | 29.9 | 29.3 2% | 29 3% | 28.2 6% | 30.5 -2% |
| Idle Minimum * (dB) | 29.9 | 29.3 2% | 29 3% | 28.2 6% | 30.5 -2% |
| Idle Average * (dB) | 29.9 | 29.3 2% | 29 3% | 28.2 6% | 31.6 -6% |
| Idle Maximum * (dB) | 29.9 | 31.2 -4% | 29 3% | 28.2 6% | 31.9 -7% |
| Load Average * (dB) | 30.9 | 35.1 -14% | 31 -0% | 33.3 -8% | 34.7 -12% |
| Load Maximum * (dB) | 32.8 | 38.7 -18% | 33.4 -2% | 34 -4% | 34.5 -5% |
* ... smaller is better
(+) The maximum temperature on the upper side is 35.7 °C / 96 F, compared to the average of 34.3 °C / 94 F, ranging from 21.2 to 62.5 °C for the class Office.
(+) The bottom heats up to a maximum of 31.8 °C / 89 F, compared to the average of 36.8 °C / 98 F
(+) In idle usage, the average temperature for the upper side is 28.1 °C / 83 F, compared to the device average of 29.5 °C / 85 F.
(+) The palmrests and touchpad are cooler than skin temperature with a maximum of 28.1 °C / 82.6 F and are therefore cool to the touch.
(±) The average temperature of the palmrest area of similar devices was 27.5 °C / 81.5 F (-0.6 °C / -1.1 F).
| HP EliteBook 755 G4 PRO A12-9800B, Radeon R7 (Bristol Ridge) | Lenovo ThinkPad T570-20H90002GE i5-7200U, HD Graphics 620 | HP EliteBook 850 G4-Z2W86ET i5-7200U, HD Graphics 620 | Fujitsu LifeBook U757 i5-7200U, HD Graphics 620 | HP ProBook 650 G2 V1A44ET 6200U, HD Graphics 520 | |
|---|---|---|---|---|---|
| Heat | -6% | 5% | -4% | -9% | |
| Maximum Upper Side * (°C) | 35.7 | 39.5 -11% | 37 -4% | 42 -18% | 39.6 -11% |
| Maximum Bottom * (°C) | 31.8 | 48.3 -52% | 41.1 -29% | 38.8 -22% | 41.8 -31% |
| Idle Upper Side * (°C) | 30.9 | 24.5 21% | 23.2 25% | 29.2 6% | 31.6 -2% |
| Idle Bottom * (°C) | 31.8 | 25.3 20% | 23.2 27% | 26.3 17% | 29.7 7% |
* ... smaller is better
HP EliteBook 755 G4 audio analysis
(-) | not very loud speakers (68 dB)
Bass 100 - 315 Hz
(-) | nearly no bass - on average 20.7% lower than median
(±) | linearity of bass is average (12.8% delta to prev. frequency)
Mids 400 - 2000 Hz
(+) | balanced mids - only 1.6% away from median
(±) | linearity of mids is average (10.2% delta to prev. frequency)
Highs 2 - 16 kHz
(+) | balanced highs - only 2.6% away from median
(+) | highs are linear (3.4% delta to prev. frequency)
Overall 100 - 16.000 Hz
(±) | linearity of overall sound is average (17.5% difference to median)
Compared to same class
» 28% of all tested devices in this class were better, 7% similar, 66% worse
» The best had a delta of 7%, average was 21%, worst was 53%
Compared to all devices tested
» 34% of all tested devices were better, 8% similar, 58% worse
» The best had a delta of 4%, average was 23%, worst was 134%
HP EliteBook 850 G4-Z2W86ET audio analysis
(±) | speaker loudness is average but good (74.6 dB)
Bass 100 - 315 Hz
(-) | nearly no bass - on average 15.5% lower than median
(±) | linearity of bass is average (11% delta to prev. frequency)
Mids 400 - 2000 Hz
(+) | balanced mids - only 1.7% away from median
(+) | mids are linear (3.8% delta to prev. frequency)
Highs 2 - 16 kHz
(+) | balanced highs - only 3.2% away from median
(±) | linearity of highs is average (7.6% delta to prev. frequency)
Overall 100 - 16.000 Hz
(±) | linearity of overall sound is average (17.7% difference to median)
Compared to same class
» 29% of all tested devices in this class were better, 6% similar, 65% worse
» The best had a delta of 7%, average was 21%, worst was 53%
Compared to all devices tested
» 35% of all tested devices were better, 8% similar, 57% worse
» The best had a delta of 4%, average was 23%, worst was 134%
| Off / Standby | |
| Idle | |
| Load |
|
Key:
min: | |
| HP EliteBook 755 G4 PRO A12-9800B, Radeon R7 (Bristol Ridge), Samsung PM961 MZVLW256HEHP, TN LED, 1920x1080, 15.6" | Lenovo ThinkPad T570-20H90002GE i5-7200U, HD Graphics 620, Samsung PM961 MZVLW256HEHP, IPS, 1920x1080, 15.6" | HP EliteBook 850 G4-Z2W86ET i5-7200U, HD Graphics 620, Samsung PM951 NVMe MZVLV256, TN LED, 1920x1080, 15.6" | Fujitsu LifeBook U757 i5-7200U, HD Graphics 620, Samsung CM871a MZNTY256HDHP, IPS LED, 1920x1080, 15.6" | HP ProBook 650 G2 V1A44ET 6200U, HD Graphics 520, Sandisk X300 SD7SN6S-256G-1006, TN LED, 1920x1080, 15.6" | |
|---|---|---|---|---|---|
| Power Consumption | 15% | 25% | 22% | 28% | |
| Idle Minimum * (Watt) | 7 | 3.6 49% | 3.58 49% | 3.96 43% | 3.4 51% |
| Idle Average * (Watt) | 10.9 | 7.7 29% | 5.97 45% | 7.74 29% | 7.5 31% |
| Idle Maximum * (Watt) | 11 | 8.2 25% | 6.81 38% | 8.64 21% | 7.6 31% |
| Load Average * (Watt) | 30.5 | 30.8 -1% | 29.4 4% | 28.8 6% | 28.4 7% |
| Load Maximum * (Watt) | 36.1 | 46.1 -28% | 39.7 -10% | 32 11% | 28.4 21% |
* ... smaller is better
| HP EliteBook 755 G4 PRO A12-9800B, Radeon R7 (Bristol Ridge), 51 Wh | Lenovo ThinkPad T570-20H90002GE i5-7200U, HD Graphics 620, 56 Wh | HP EliteBook 850 G4-Z2W86ET i5-7200U, HD Graphics 620, 51 Wh | Fujitsu LifeBook U757 i5-7200U, HD Graphics 620, 50 Wh | HP ProBook 650 G2 V1A44ET 6200U, HD Graphics 520, 48 Wh | |
|---|---|---|---|---|---|
| Battery runtime | 83% | 82% | 70% | 65% | |
| Reader / Idle (h) | 12.3 | 19.5 59% | 18 46% | ||
| H.264 (h) | 4.5 | 9.8 118% | 10.6 136% | ||
| WiFi v1.3 (h) | 4.3 | 7.6 77% | 8.8 105% | 7.3 70% | 7.1 65% |
| Load (h) | 1.9 | 3.4 79% | 2.7 42% |
Pros
Cons

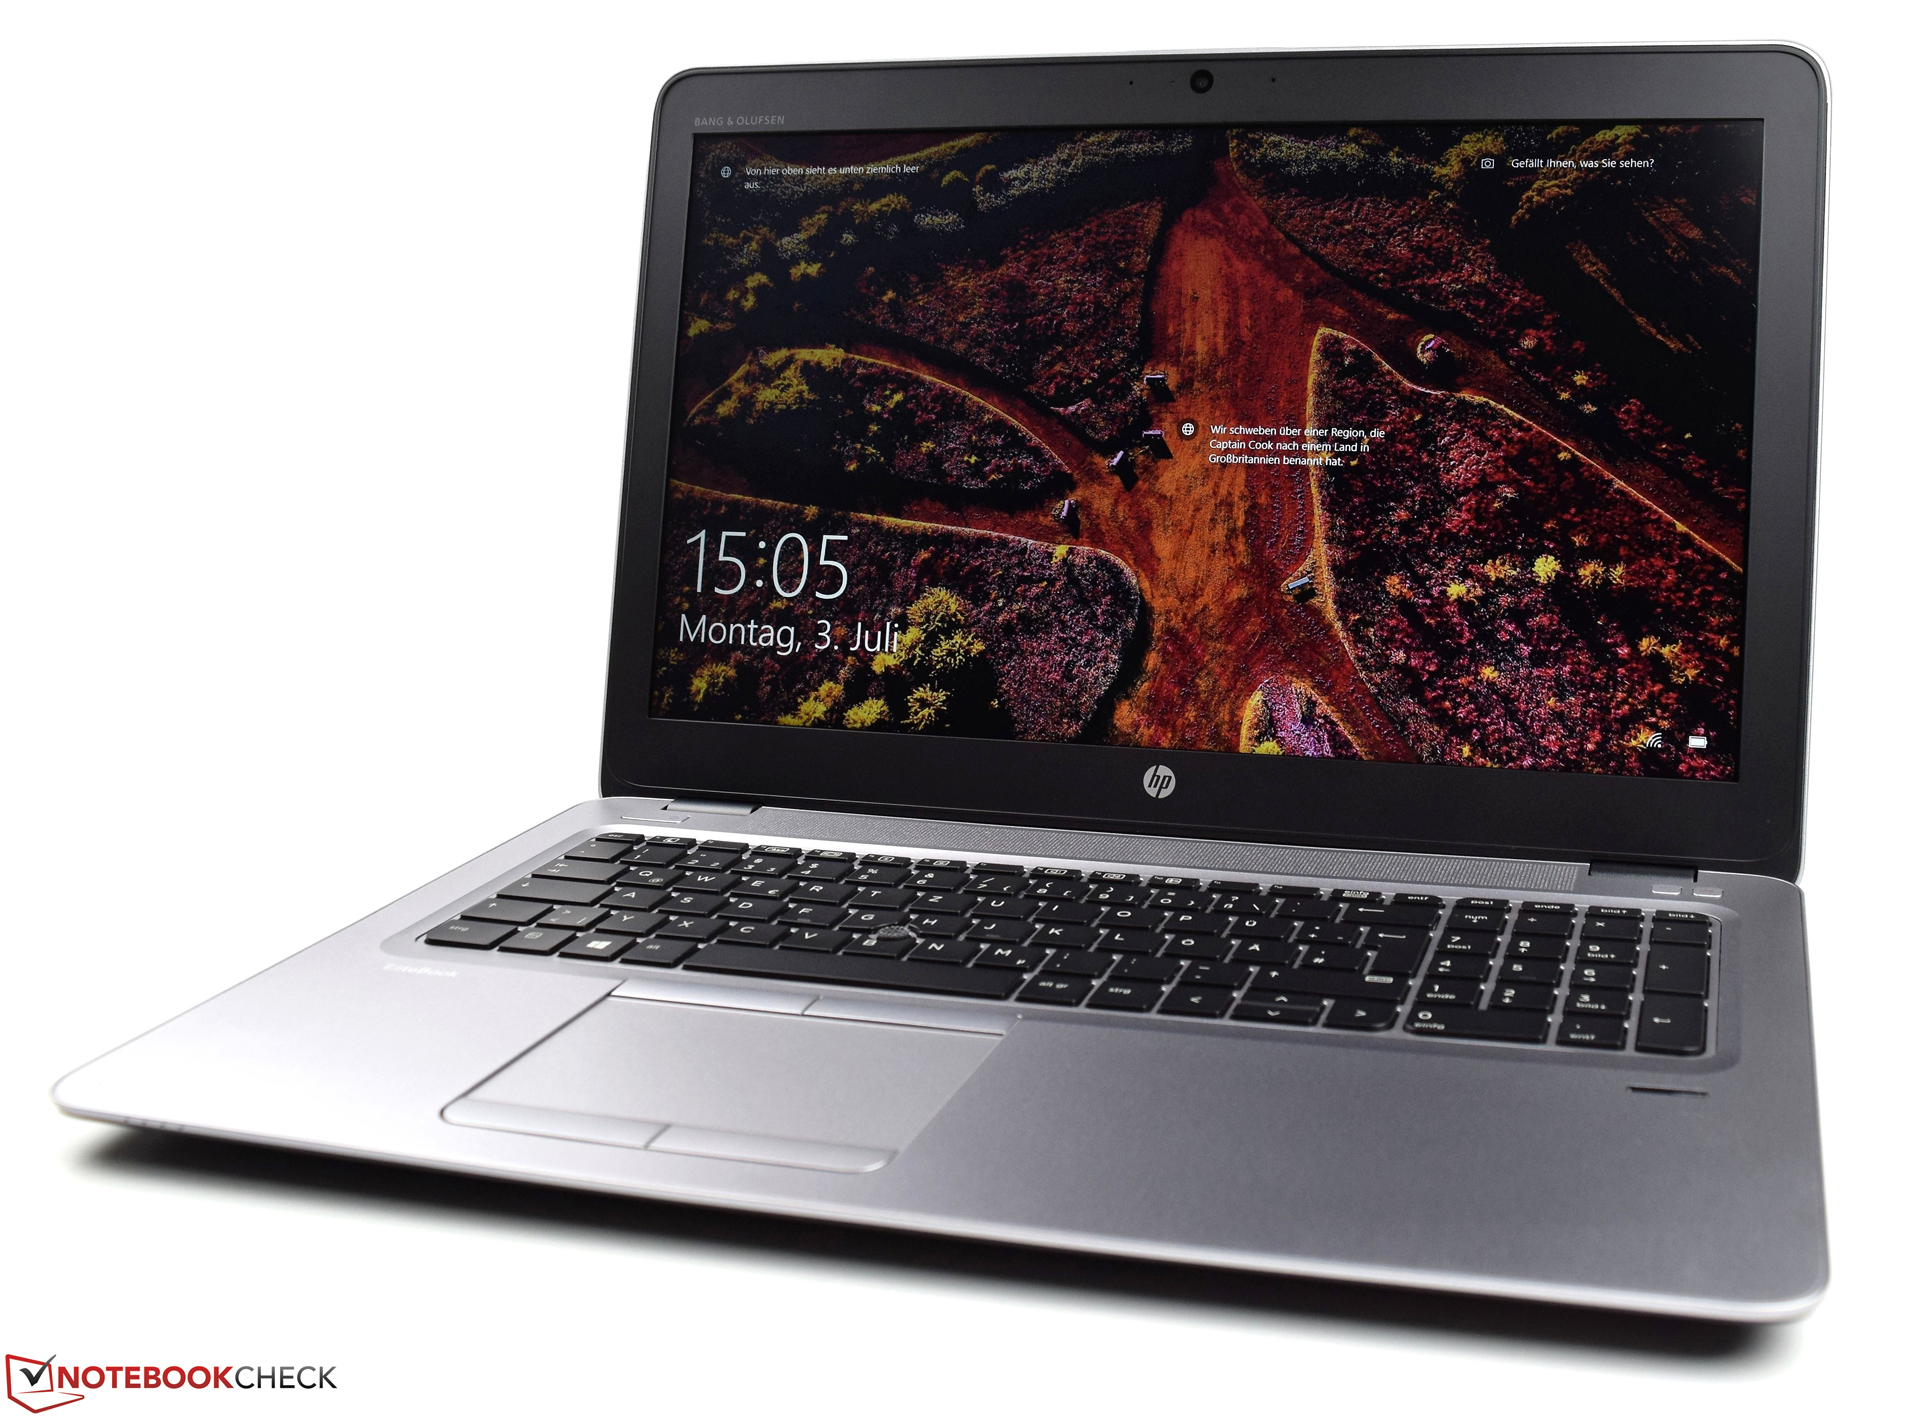
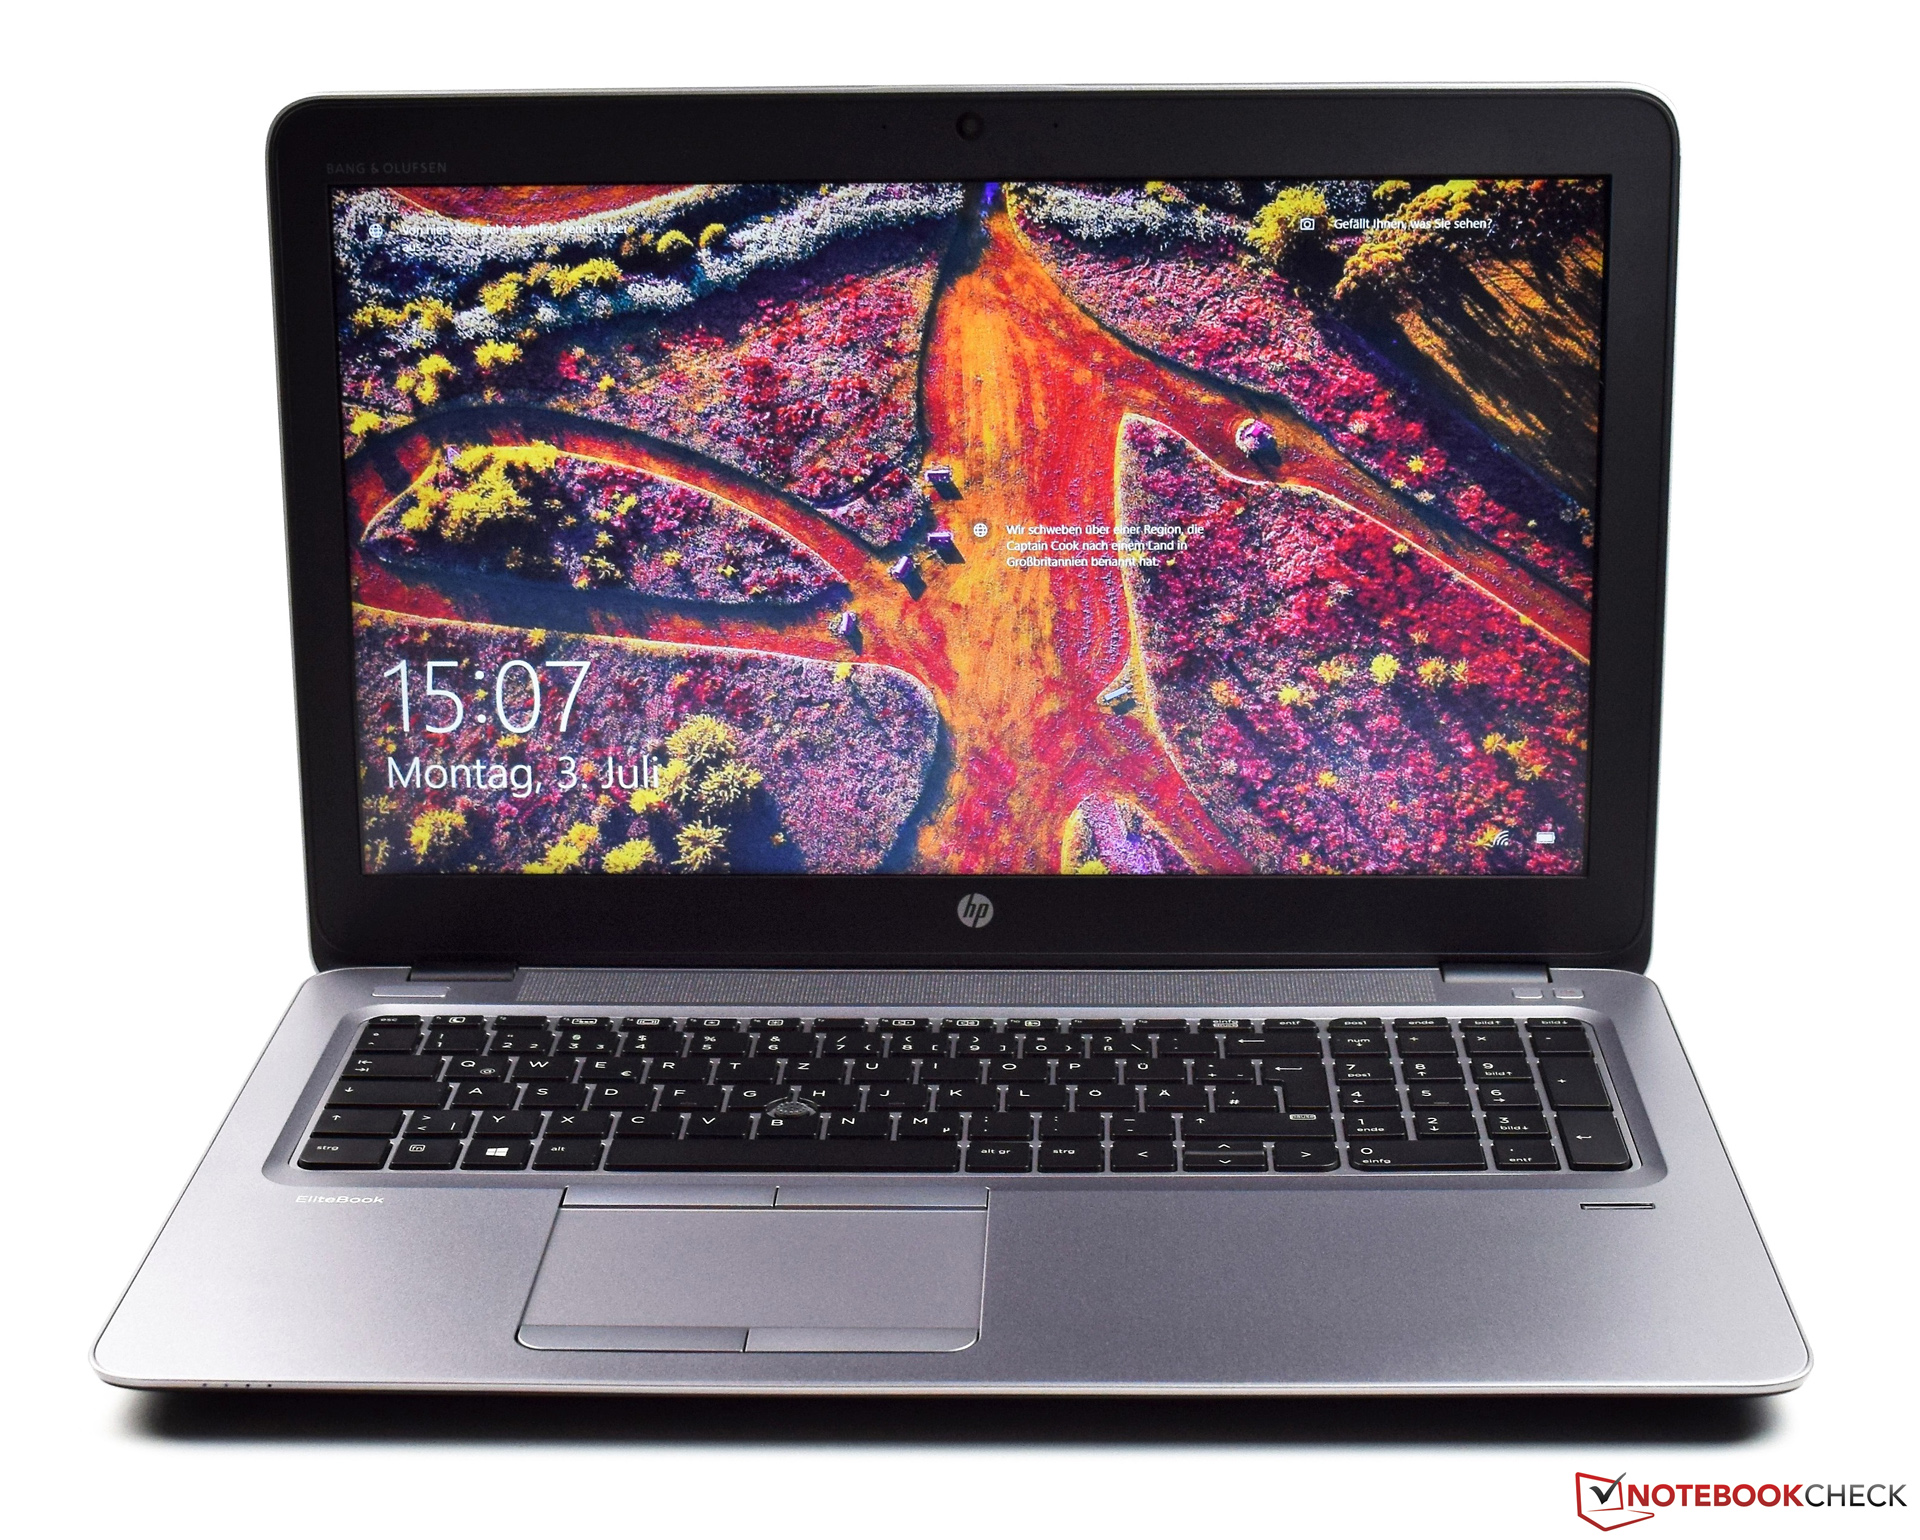
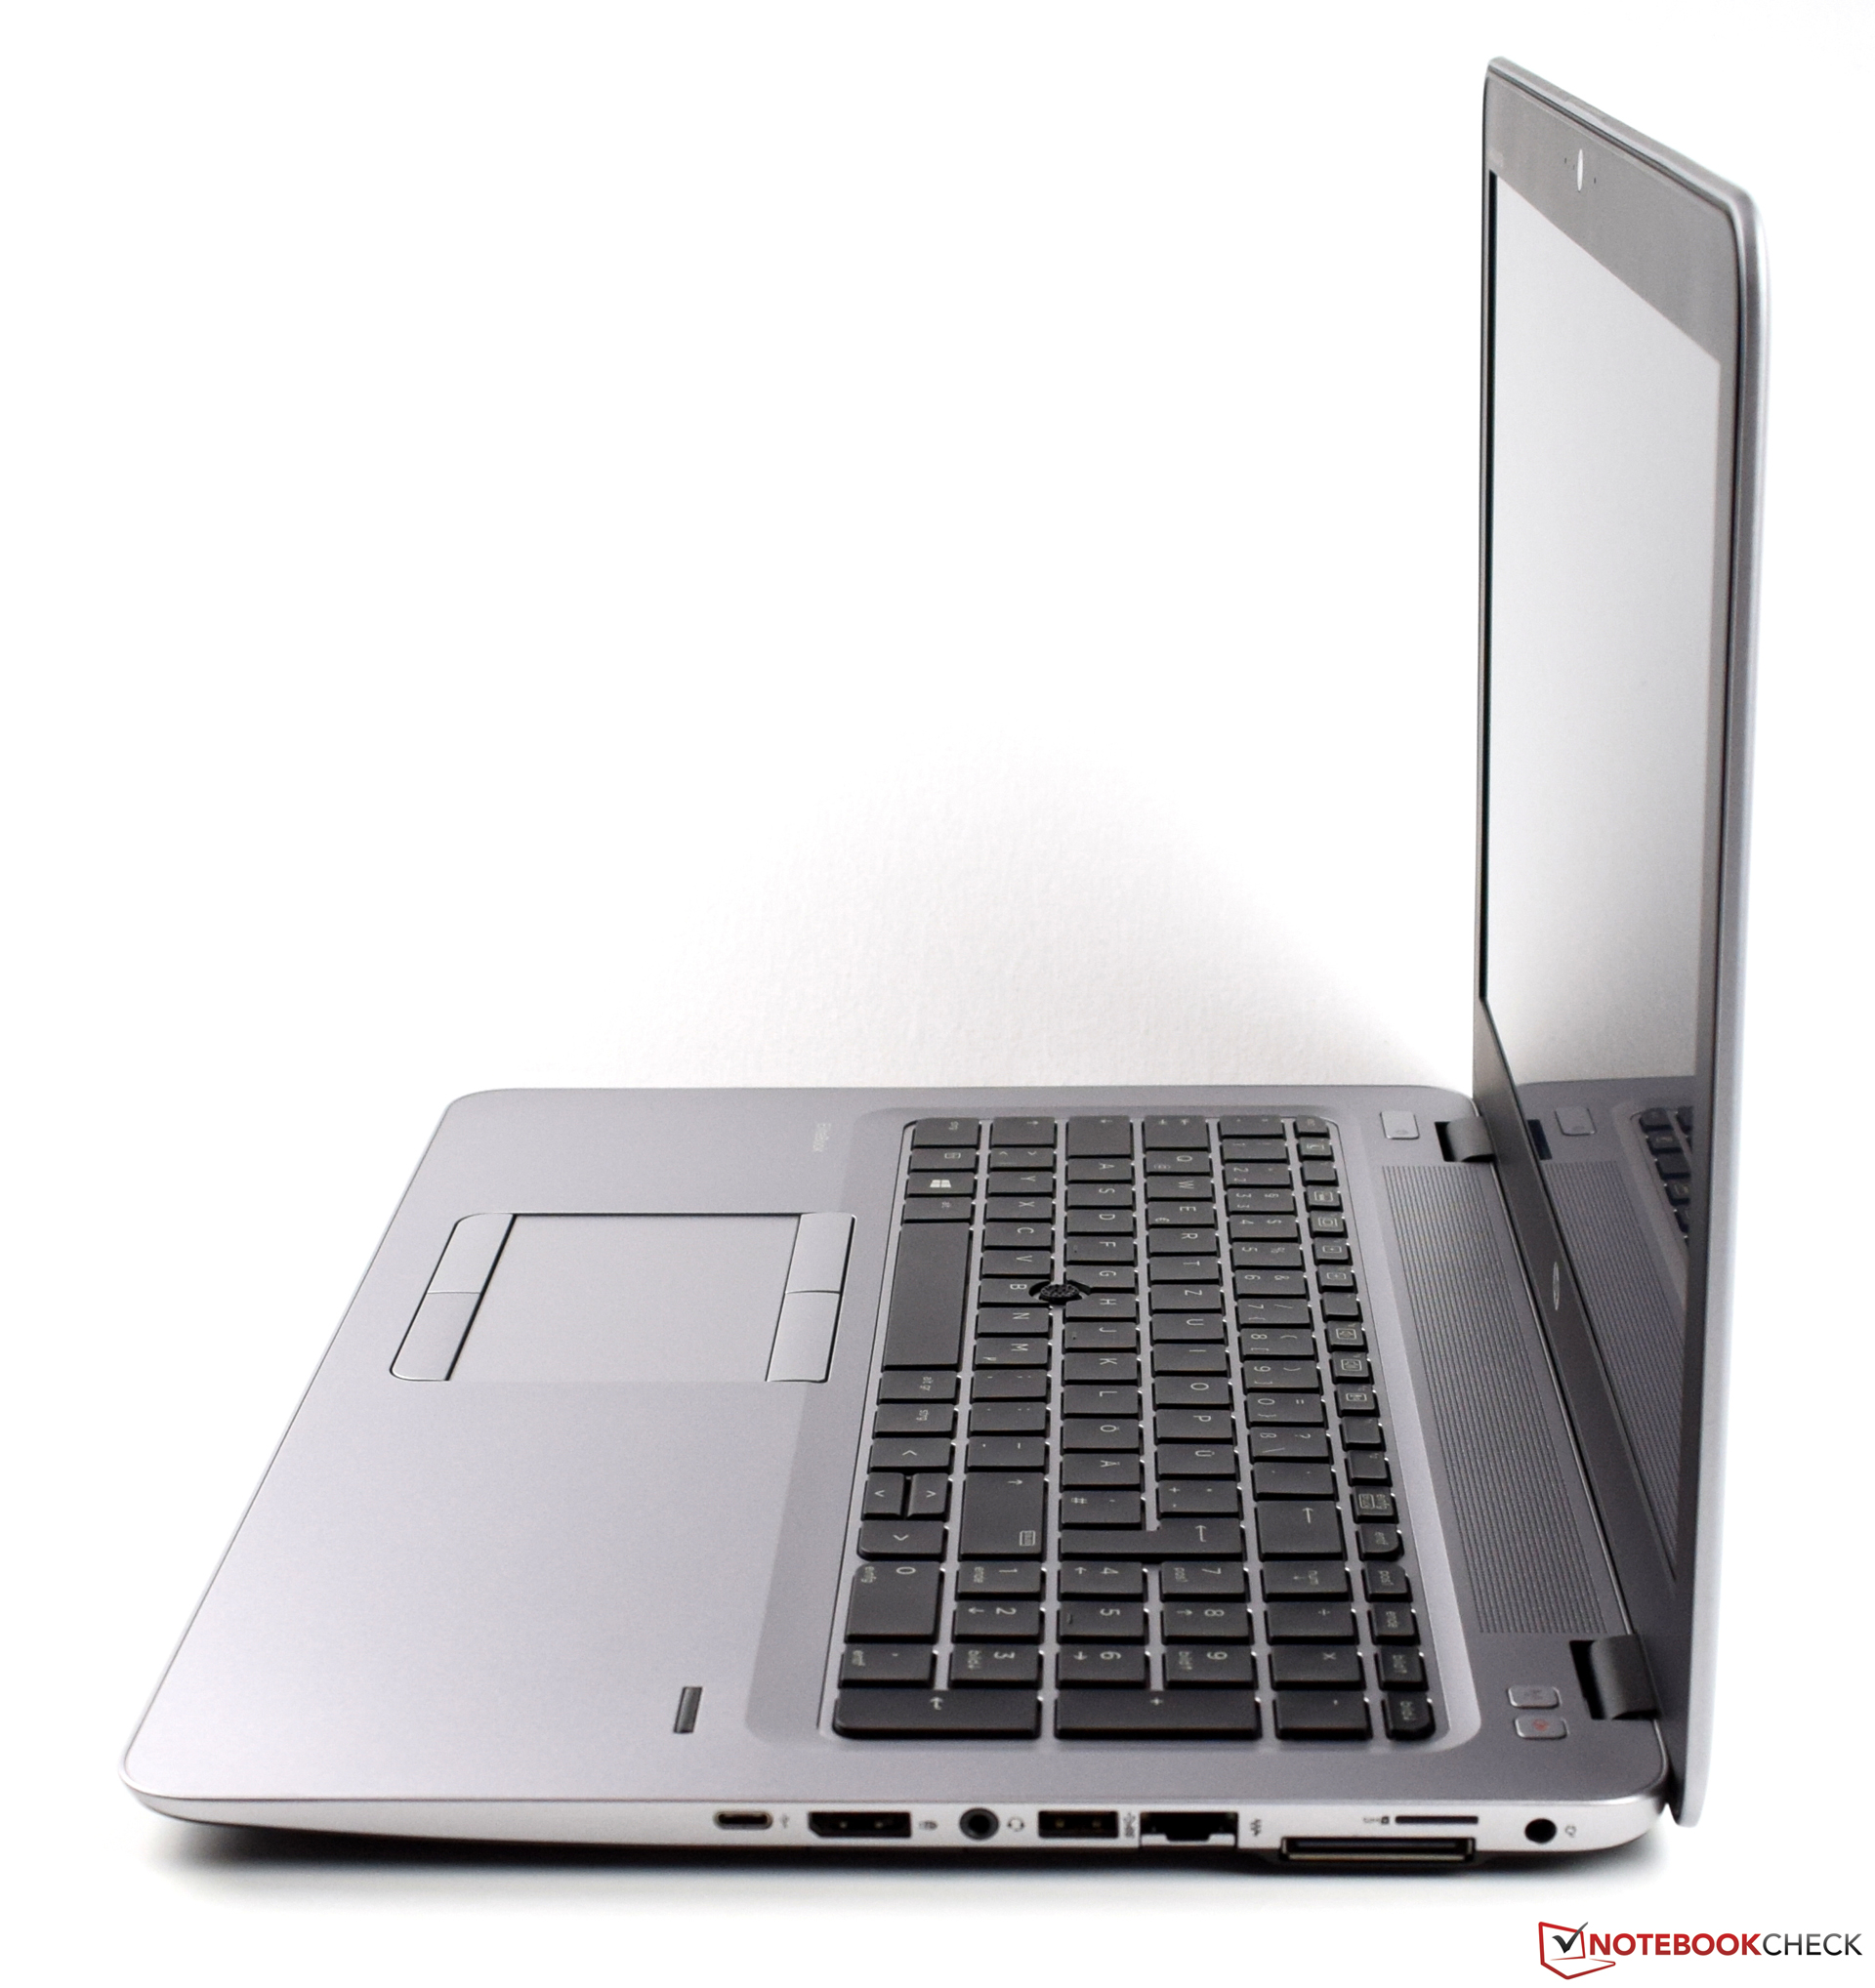
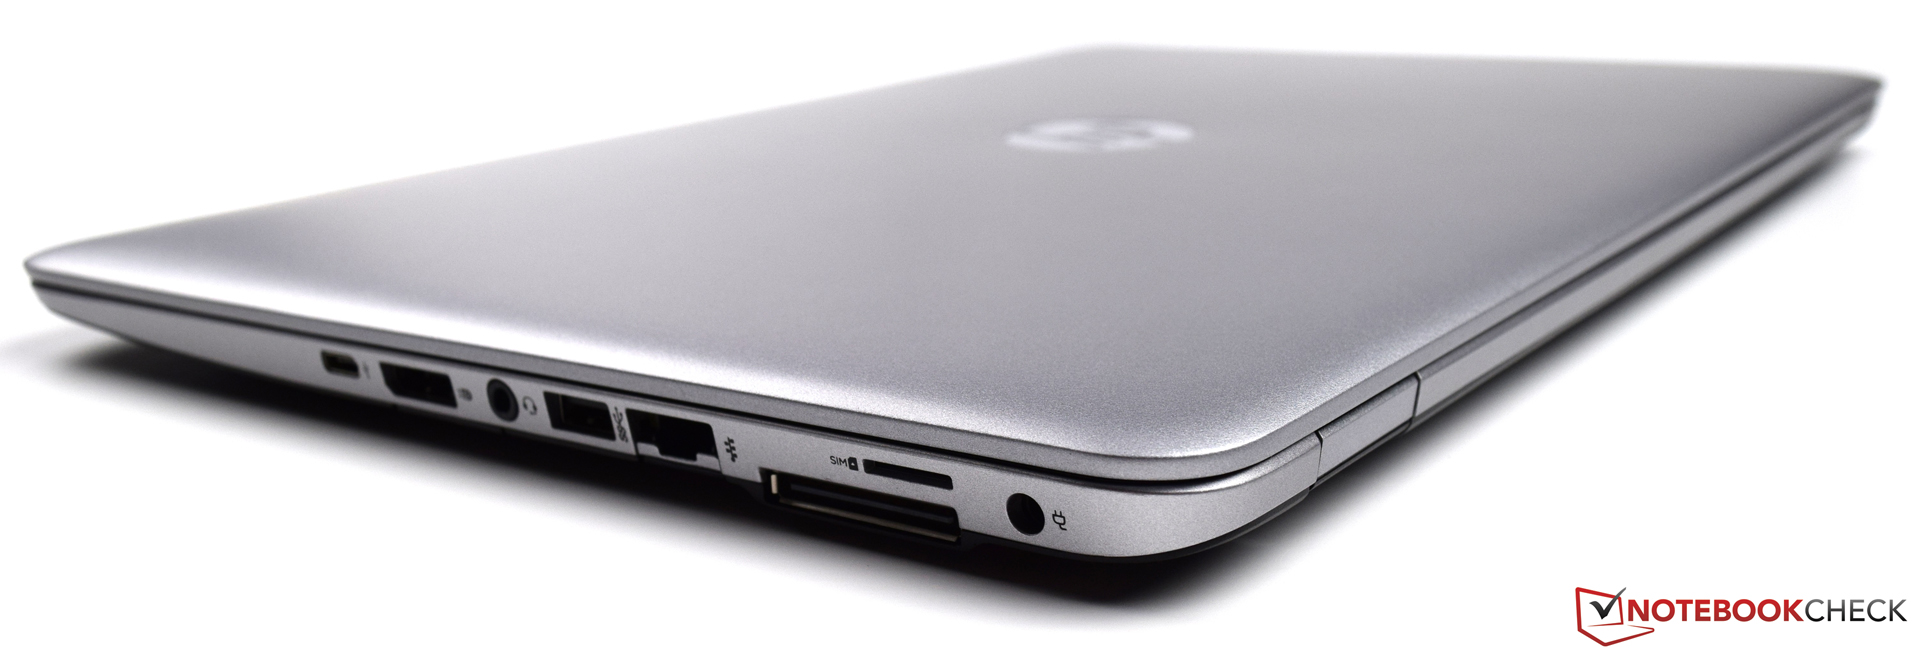
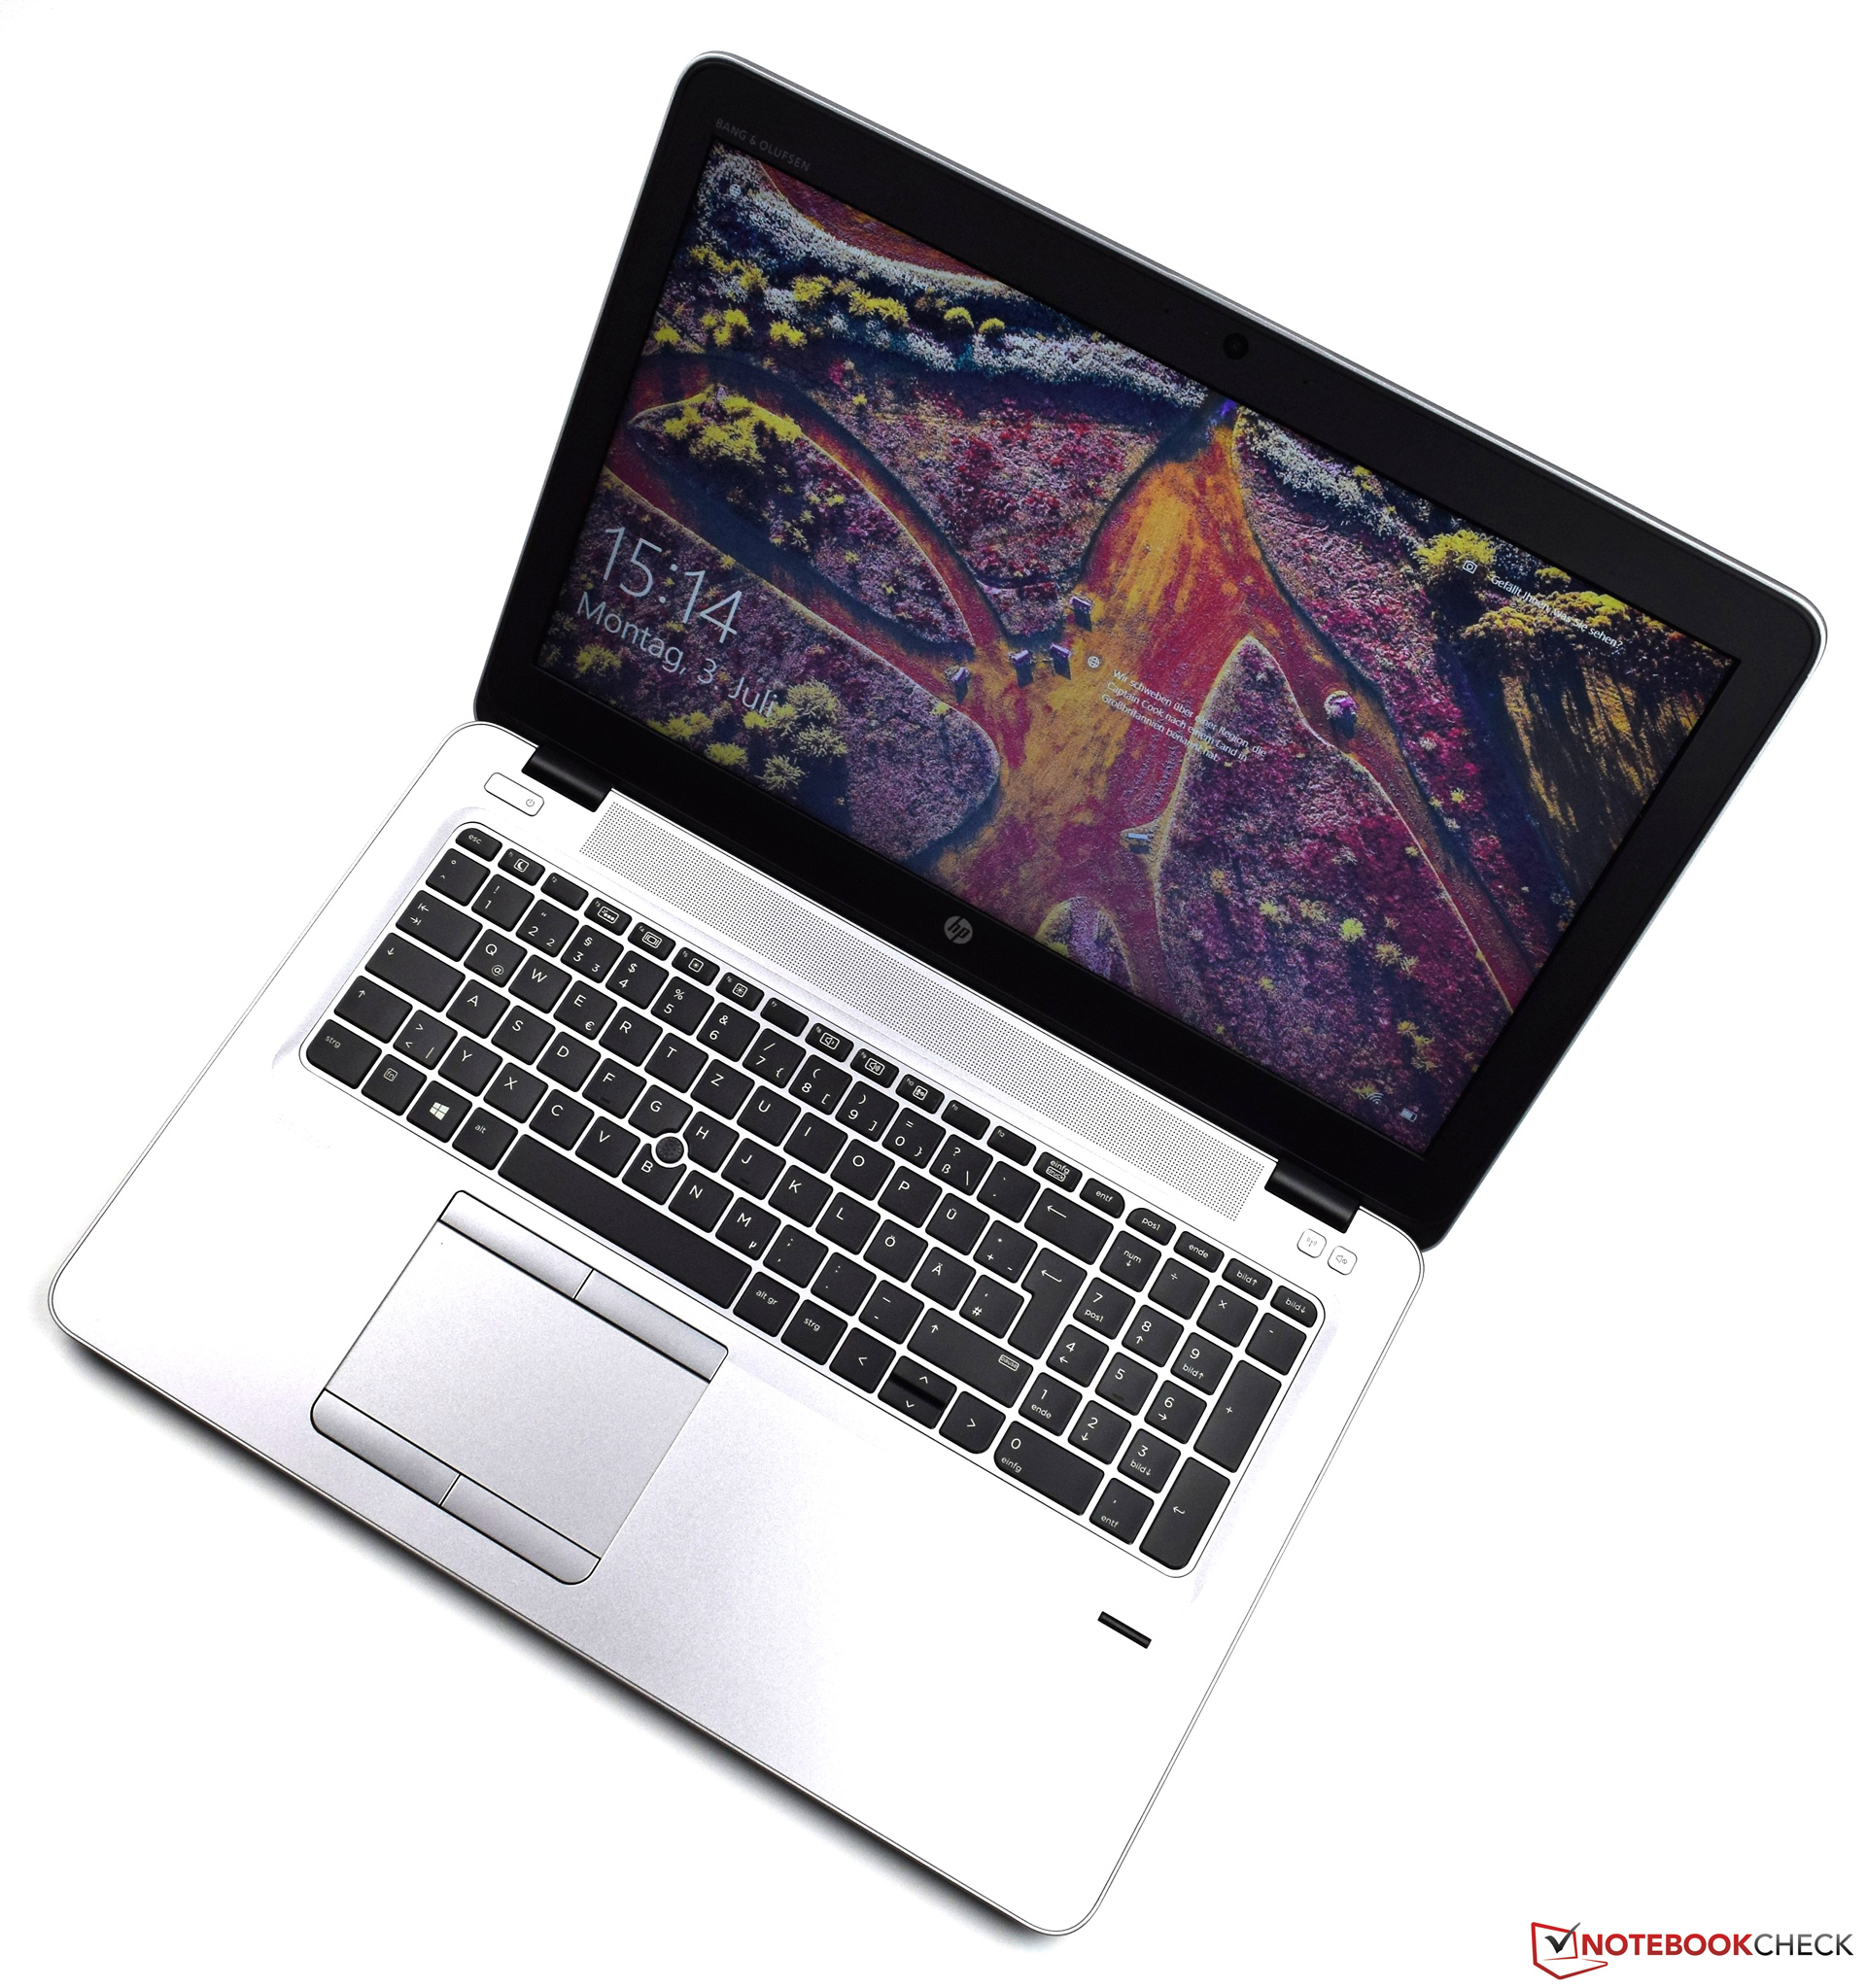
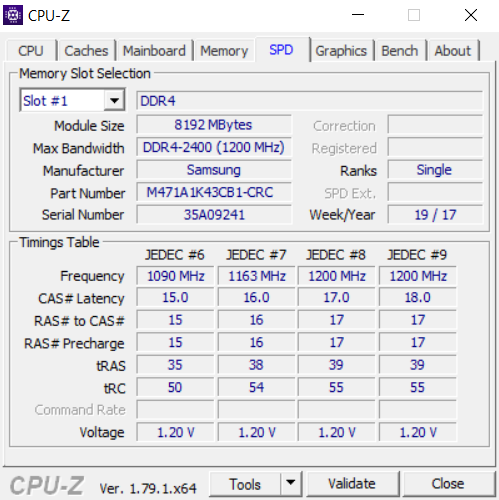
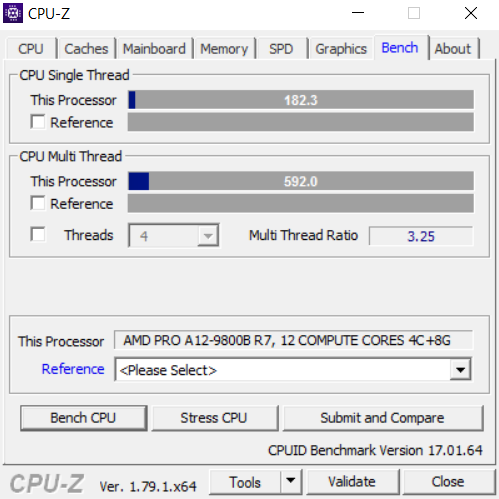
HP EliteBook 755 G4是一台15英寸格式的商务笔记本电脑。AMD处理器对于预想的用途来说是已经足够,尽管它也有一些缺点。此外,提供给我们的笔记本电脑配备了8 GB的DDR4运行内存和一个256 GB M.2-2280格式的固态硬盘,目前价位1460欧元(约1650美元)。我们非常喜欢该机没有任何缺陷的干净做工。我们也喜欢看起来非常优雅的外观。由于选用的材料很好,外壳非常稳定,因此非常适合日常使用。
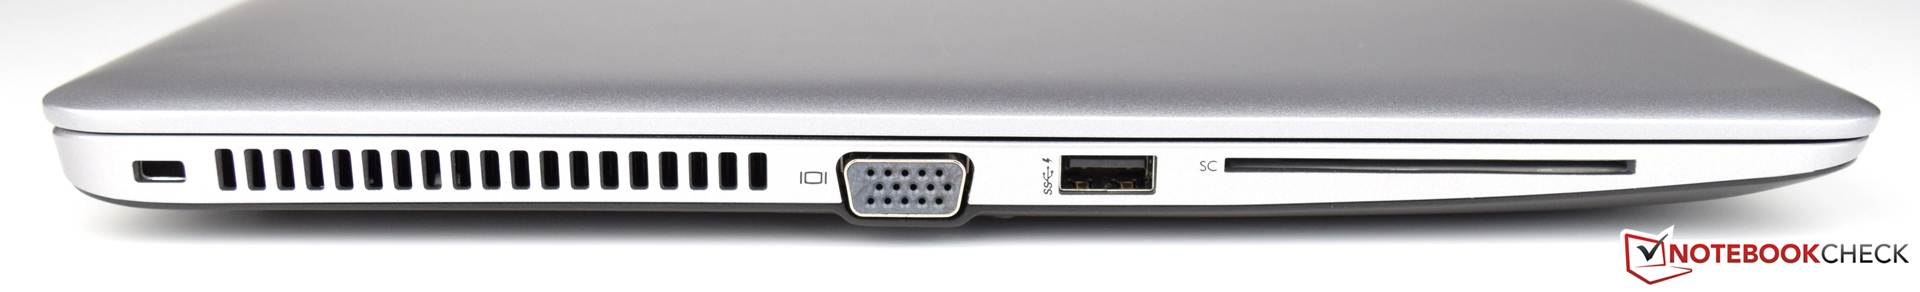
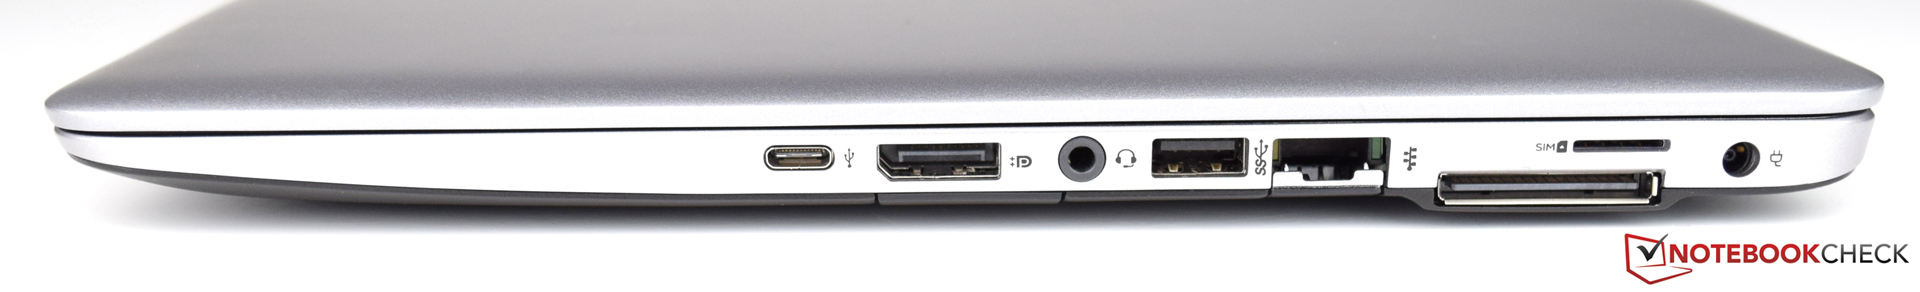
惠普 EliteBook 755 G4是一款良好的商务设备。作为入门级设备,带来许多安全功能。使用惠普 EliteBook 755 G4时,AMD处理器的性能足以满足工作所需,且具有良好的连接性。
我们最不满的地方是它的显示屏幕,让整个设备显得不完美。 它的质量根本不符合EliteBook系列的水准。制造商应该检查这个质量水平是否符合真正的目标。另一个问题是由于处理器有点耗电,导致电池续航短。
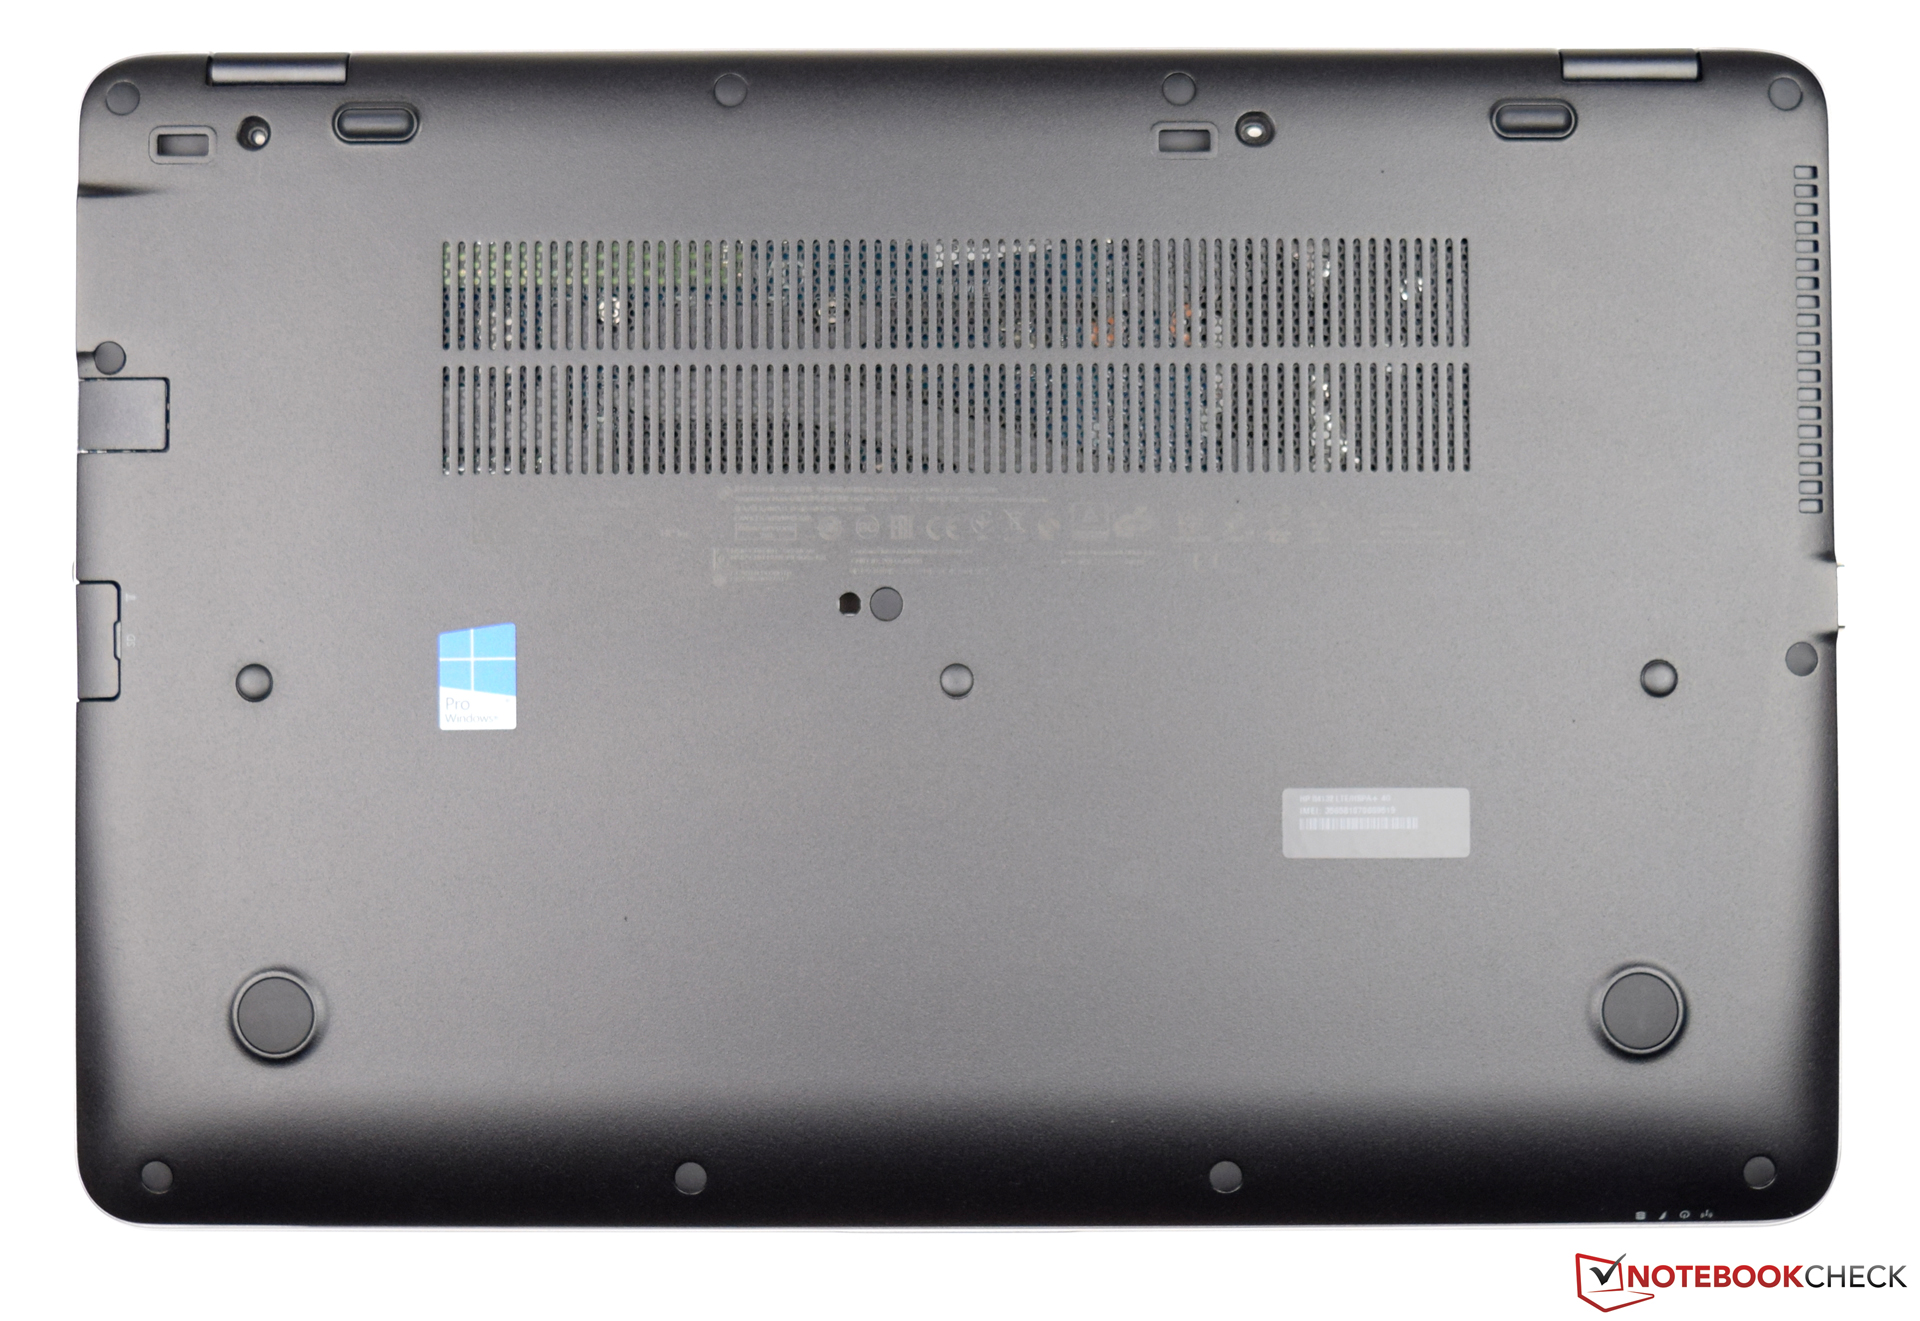
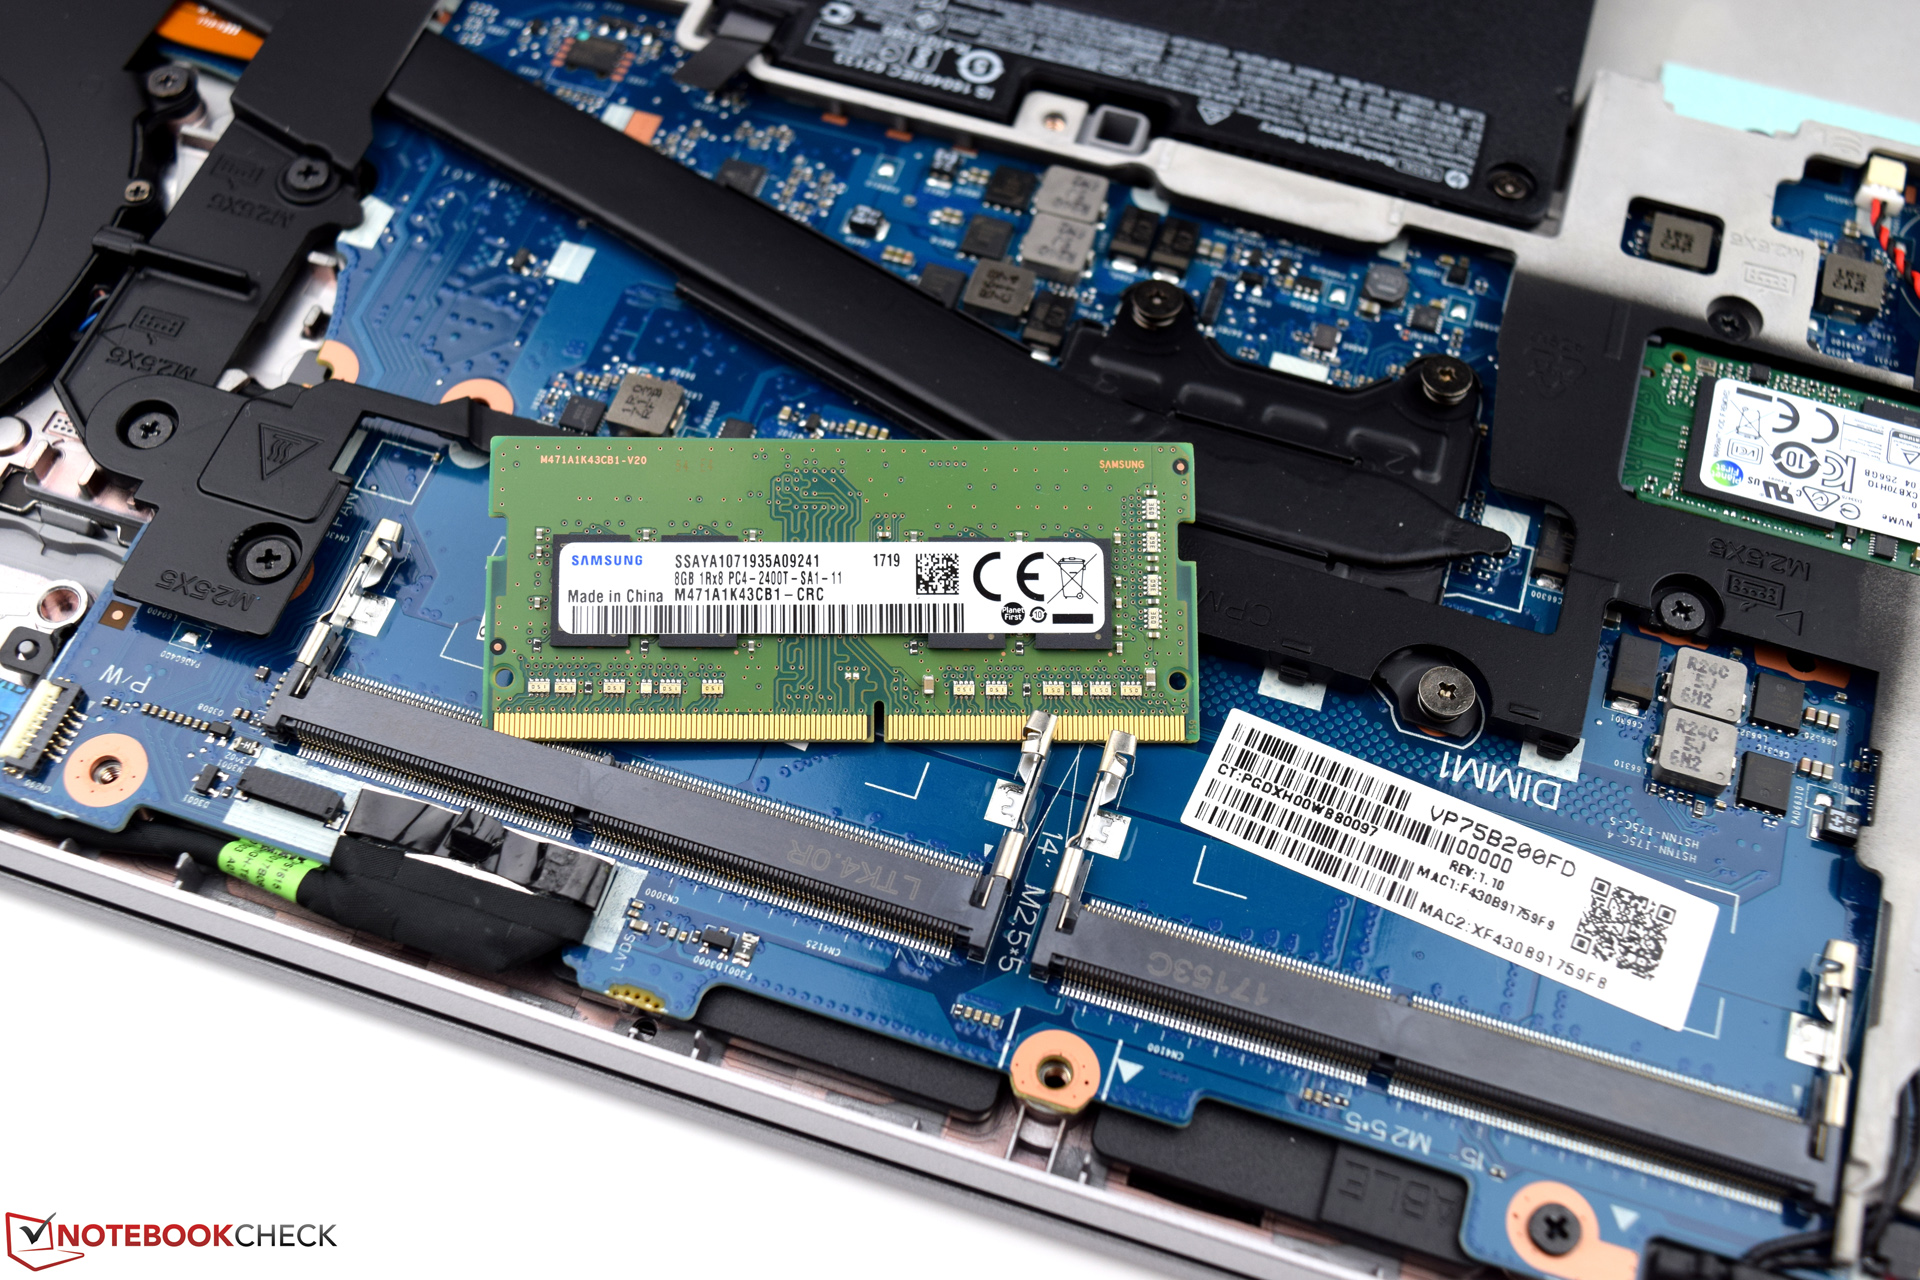
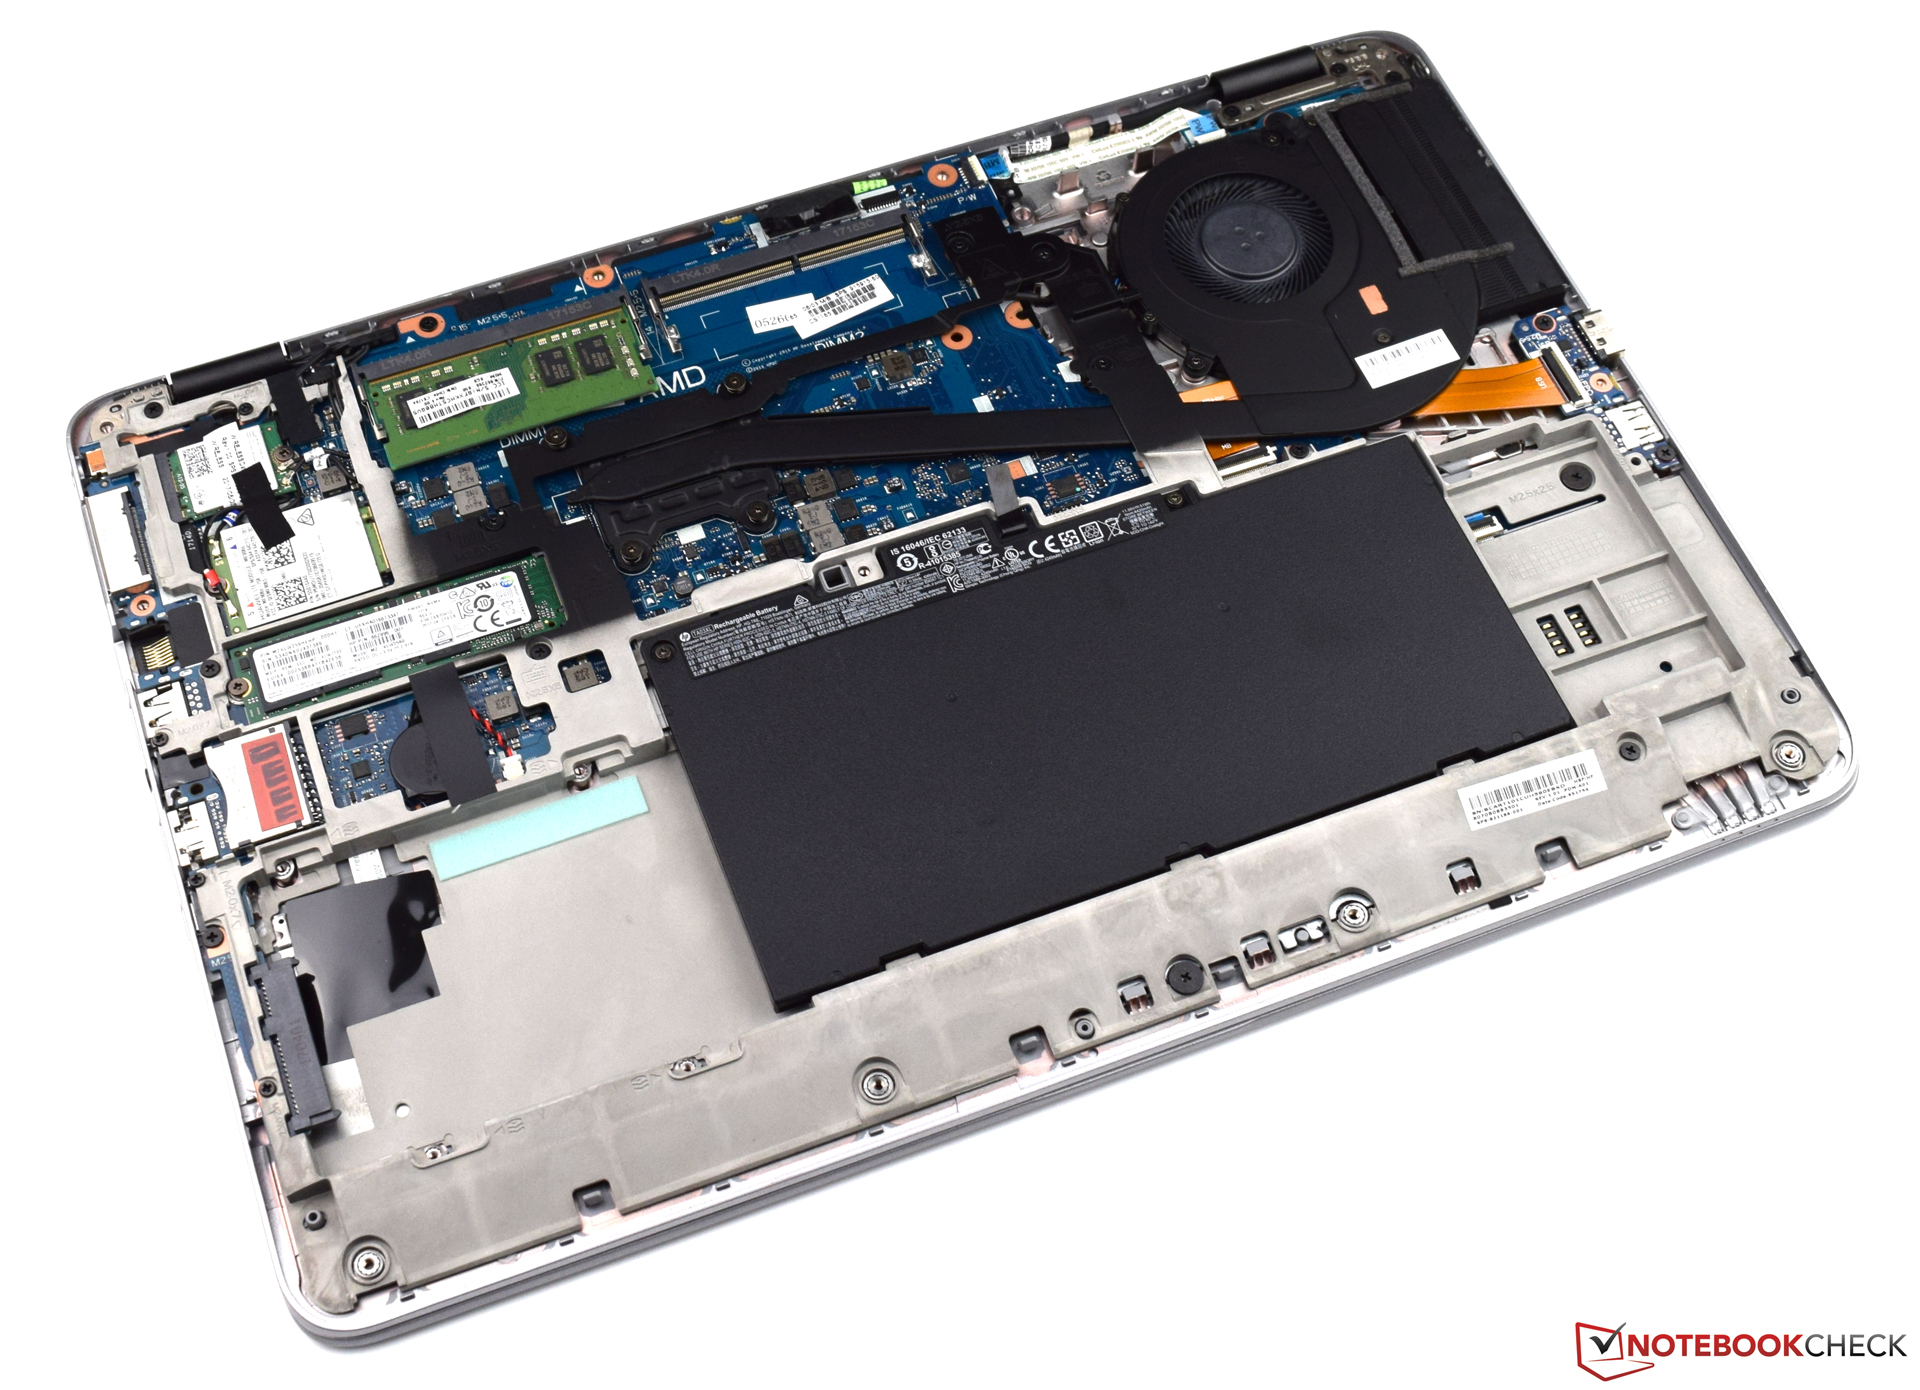
缺乏维护舱口让我们有点恼火,底部外壳拆卸需要一点时间。如果拥有维护舱口,我们觉得会更方便。电脑的音质,键盘和快速的固态硬盘都让人喜欢。同时,这些对系统来说也是最重要的地方。
注:本文是基于完整评测的缩减版本,阅读完整的英文评测,请点击这里。
HP EliteBook 755 G4
- 07/12/2017 v6 (old)
Sebastian Bade