惠普 Omen 15 (7700HQ, GTX 1060 Max-Q, Full-HD) 笔记本电脑简短评测
| SD Card Reader | |
| average JPG Copy Test (av. of 3 runs) | |
| Schenker XMG P507 PRO (Toshiba Exceria Pro SDXC 64 GB UHS-II) | |
| Gigabyte Aero 15 (Toshiba Exceria Pro SDXC 64 GB UHS-II) | |
| HP Omen 15-ce002ng (Toshiba Exceria Pro SDXC 64 GB UHS-II) | |
| MSI GS63VR 7RF-228US (Toshiba Exceria Pro SDXC 64 GB UHS-II) | |
| Acer Aspire VX5-591G-75C4 VX15 | |
| maximum AS SSD Seq Read Test (1GB) | |
| Gigabyte Aero 15 (Toshiba Exceria Pro SDXC 64 GB UHS-II) | |
| Schenker XMG P507 PRO (Toshiba Exceria Pro SDXC 64 GB UHS-II) | |
| HP Omen 15-ce002ng (Toshiba Exceria Pro SDXC 64 GB UHS-II) | |
| Acer Aspire VX5-591G-75C4 VX15 | |
| MSI GS63VR 7RF-228US (Toshiba Exceria Pro SDXC 64 GB UHS-II) | |
| |||||||||||||||||||||||||
Brightness Distribution: 86 %
Center on Battery: 304 cd/m²
Contrast: 1169:1 (Black: 0.26 cd/m²)
ΔE ColorChecker Calman: 3.46 | ∀{0.5-29.43 Ø4.71}
ΔE Greyscale Calman: 2.46 | ∀{0.09-98 Ø4.96}
91% sRGB (Argyll 1.6.3 3D)
59% AdobeRGB 1998 (Argyll 1.6.3 3D)
66.5% AdobeRGB 1998 (Argyll 3D)
90.9% sRGB (Argyll 3D)
65.8% Display P3 (Argyll 3D)
Gamma: 2.38
CCT: 6915 K
| HP Omen 15-ce002ng AUO42ED, 1920x1080 | Acer Aspire VX5-591G-75C4 VX15 LG Philips LGD0550 / LP156WF6-SPK4, 1920x1080 | MSI GS63VR 7RF-228US 3840x2160 | Gigabyte Aero 15 N156HCA-EA1 (CMN15D7), 1920x1080 | Schenker XMG P507 PRO AUO B156HTN05.2 (AUO52ED), 1920x1080 | |
|---|---|---|---|---|---|
| Display | -39% | -24% | 0% | -1% | |
| Display P3 Coverage (%) | 65.8 | 38.88 -41% | 48.21 -27% | 65.2 -1% | 66.4 1% |
| sRGB Coverage (%) | 90.9 | 58.2 -36% | 72.6 -20% | 92.5 2% | 88.9 -2% |
| AdobeRGB 1998 Coverage (%) | 66.5 | 40.2 -40% | 49.81 -25% | 66.5 0% | 65.1 -2% |
| Response Times | 38% | 30% | -1% | 53% | |
| Response Time Grey 50% / Grey 80% * (ms) | 43.2 ? | 22 ? 49% | 28 ? 35% | 42.8 ? 1% | 24 ? 44% |
| Response Time Black / White * (ms) | 31.2 ? | 23 ? 26% | 23.6 ? 24% | 32 ? -3% | 12 ? 62% |
| PWM Frequency (Hz) | 1351 ? | 26000 ? | |||
| Screen | -29% | -66% | -24% | -69% | |
| Brightness middle (cd/m²) | 304 | 281 -8% | 274.2 -10% | 320 5% | 357 17% |
| Brightness (cd/m²) | 289 | 257 -11% | 263 -9% | 316 9% | 365 26% |
| Brightness Distribution (%) | 86 | 85 -1% | 92 7% | 90 5% | 85 -1% |
| Black Level * (cd/m²) | 0.26 | 0.32 -23% | 0.44 -69% | 0.36 -38% | 0.5 -92% |
| Contrast (:1) | 1169 | 878 -25% | 623 -47% | 889 -24% | 714 -39% |
| Colorchecker dE 2000 * | 3.46 | 5.16 -49% | 8 -131% | 4.62 -34% | 9.93 -187% |
| Colorchecker dE 2000 max. * | 7.72 | 9.09 -18% | 14.6 -89% | 9.75 -26% | 14.87 -93% |
| Greyscale dE 2000 * | 2.46 | 4.57 -86% | 9.1 -270% | 6 -144% | 10.32 -320% |
| Gamma | 2.38 92% | 2.59 85% | 2.24 98% | 2.46 89% | 2.11 104% |
| CCT | 6915 94% | 6931 94% | 5020 129% | 6761 96% | 10096 64% |
| Color Space (Percent of AdobeRGB 1998) (%) | 59 | 37 -37% | 45.7 -23% | 60 2% | 58 -2% |
| Color Space (Percent of sRGB) (%) | 91 | 58 -36% | 72.1 -21% | 92 1% | 89 -2% |
| Total Average (Program / Settings) | -10% /
-22% | -20% /
-45% | -8% /
-16% | -6% /
-39% |
* ... smaller is better
Display Response Times
| ↔ Response Time Black to White | ||
|---|---|---|
| 31.2 ms ... rise ↗ and fall ↘ combined | ↗ 16.4 ms rise | 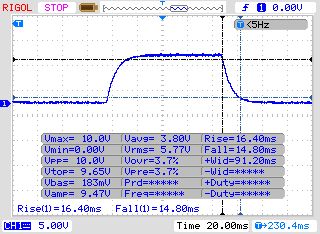 |
| ↘ 14.8 ms fall | ||
| The screen shows slow response rates in our tests and will be unsatisfactory for gamers. In comparison, all tested devices range from 0.1 (minimum) to 240 (maximum) ms. » 84 % of all devices are better. This means that the measured response time is worse than the average of all tested devices (19.8 ms). | ||
| ↔ Response Time 50% Grey to 80% Grey | ||
| 43.2 ms ... rise ↗ and fall ↘ combined | ↗ 21.2 ms rise | 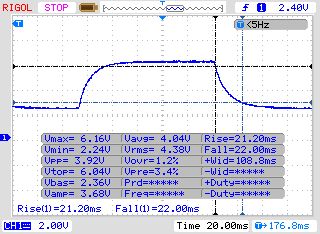 |
| ↘ 22 ms fall | ||
| The screen shows slow response rates in our tests and will be unsatisfactory for gamers. In comparison, all tested devices range from 0.165 (minimum) to 636 (maximum) ms. » 72 % of all devices are better. This means that the measured response time is worse than the average of all tested devices (31 ms). | ||
Screen Flickering / PWM (Pulse-Width Modulation)
| Screen flickering / PWM not detected | 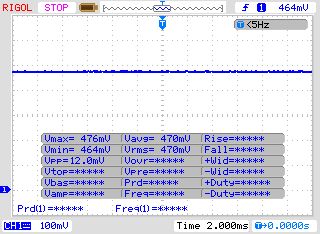 | ||
In comparison: 52 % of all tested devices do not use PWM to dim the display. If PWM was detected, an average of 7757 (minimum: 5 - maximum: 343500) Hz was measured. | |||
| Cinebench R11.5 | |
| CPU Single 64Bit | |
| Gigabyte Aero 15 | |
| HP Omen 15-ce002ng | |
| Schenker XMG P507 PRO | |
| MSI GS63VR 7RF-228US | |
| CPU Multi 64Bit | |
| Gigabyte Aero 15 | |
| MSI GS63VR 7RF-228US | |
| HP Omen 15-ce002ng | |
| Schenker XMG P507 PRO | |
| PCMark 8 | |
| Home Score Accelerated v2 | |
| HP Omen 15-ce002ng | |
| Schenker XMG P507 PRO | |
| Gigabyte Aero 15 | |
| MSI GS63VR 7RF-228US | |
| Acer Aspire VX5-591G-75C4 VX15 | |
| Work Score Accelerated v2 | |
| HP Omen 15-ce002ng | |
| Gigabyte Aero 15 | |
| MSI GS63VR 7RF-228US | |
| Schenker XMG P507 PRO | |
| Acer Aspire VX5-591G-75C4 VX15 | |
| PCMark 10 - Score | |
| HP Omen 15-ce002ng | |
| PCMark 8 Home Score Accelerated v2 | 4858 points | |
| PCMark 8 Work Score Accelerated v2 | 5348 points | |
| PCMark 10 Score | 4861 points | |
Help | ||
| HP Omen 15-ce002ng Samsung PM961 MZVLW256HEHP | Schenker XMG A517 Samsung SSD 960 Evo 500GB m.2 NVMe | Gigabyte P56XT LiteOn CX2-8B256 | Asus Zephyrus GX501 Samsung SSD SM961 1TB M.2 MZVKW1T0HMLH | |
|---|---|---|---|---|
| CrystalDiskMark 5.2 / 6 | 20% | -11% | -3% | |
| Read Seq Q32T1 (MB/s) | 3431 | 3389 -1% | 2445 -29% | 3445 0% |
| Write Seq Q32T1 (MB/s) | 1246 | 1706 37% | 790 -37% | 1848 48% |
| Read 4K Q32T1 (MB/s) | 586 | 627 7% | 588 0% | 547 -7% |
| Write 4K Q32T1 (MB/s) | 486 | 591 22% | 455.5 -6% | 463 -5% |
| Read Seq (MB/s) | 1419 | 1856 31% | 1881 33% | 954 -33% |
| Write Seq (MB/s) | 1266 | 1652 30% | 797 -37% | 1049 -17% |
| Read 4K (MB/s) | 47.14 | 49 4% | 46.69 -1% | 45 -5% |
| Write 4K (MB/s) | 156 | 196 26% | 142.5 -9% | 149 -4% |

| 3DMark - 1920x1080 Fire Strike Graphics | |
| Schenker XMG P507 PRO | |
| MSI GS63VR 7RF-228US | |
| Gigabyte Aero 15 | |
| HP Omen 15-ce002ng | |
| Acer Aspire VX5-591G-75C4 VX15 | |
| 3DMark 11 - 1280x720 Performance GPU | |
| Schenker XMG P507 PRO | |
| MSI GS63VR 7RF-228US | |
| Gigabyte Aero 15 | |
| HP Omen 15-ce002ng | |
| Acer Aspire VX5-591G-75C4 VX15 | |
| Unigine Heaven 4.0 - Extreme Preset DX11 | |
| Schenker XMG P507 PRO | |
| Gigabyte Aero 15 | |
| HP Omen 15-ce002ng | |
| 3DMark 11 Performance | 11902 points | |
| 3DMark Ice Storm Standard Score | 138488 points | |
| 3DMark Cloud Gate Standard Score | 25573 points | |
| 3DMark Fire Strike Score | 8949 points | |
| 3DMark Time Spy Score | 3271 points | |
Help | ||
| The Witcher 3 - 1920x1080 Ultra Graphics & Postprocessing (HBAO+) | |
| MSI GT62VR-6RE16H21 | |
| Schenker XMG P507 | |
| HP Omen 15-ce002ng | |
| MSI GE72 7RE-046 | |
| Batman: Arkham Knight - 1920x1080 High / On AA:SM AF:16x | |
| MSI GT62VR-6RE16H21 | |
| Schenker XMG P507 | |
| HP Omen 15-ce002ng | |
| MSI GE72 7RE-046 | |
| Star Wars Battlefront - 1920x1080 Ultra Preset AA:FX | |
| MSI GT62VR-6RE16H21 | |
| Schenker XMG P507 | |
| HP Omen 15-ce002ng | |
| MSI GE72 7RE-046 | |
| Assassin's Creed Syndicate - 1920x1080 Ultra High Preset AA:4x MSAA + FX | |
| MSI GT62VR-6RE16H21 | |
| Schenker XMG P507 | |
| HP Omen 15-ce002ng | |
| MSI GE72 7RE-046 | |
| Rainbow Six Siege - 1920x1080 Ultra Preset AA:T AF:16x | |
| MSI GT62VR-6RE16H21 | |
| Schenker XMG P507 | |
| HP Omen 15-ce002ng | |
| MSI GE72 7RE-046 | |
| Rise of the Tomb Raider - 1920x1080 Very High Preset AA:FX AF:16x | |
| MSI GT62VR-6RE16H21 | |
| Schenker XMG P507 | |
| HP Omen 15-ce002ng | |
| MSI GE72 7RE-046 | |
| Far Cry Primal - 1920x1080 Ultra Preset AA:SM | |
| MSI GT62VR-6RE16H21 | |
| Schenker XMG P507 | |
| HP Omen 15-ce002ng | |
| MSI GE72 7RE-046 | |
| The Division - 1920x1080 Ultra Preset AF:16x | |
| MSI GT62VR-6RE16H21 | |
| Schenker XMG P507 | |
| HP Omen 15-ce002ng | |
| MSI GE72 7RE-046 | |
| Doom - 1920x1080 Ultra Preset AA:SM | |
| MSI GT62VR-6RE16H21 | |
| Schenker XMG P507 | |
| HP Omen 15-ce002ng | |
| MSI GE72 7RE-046 | |
| Mirror's Edge Catalyst - 1920x1080 Ultra Preset AF:16x | |
| MSI GT62VR-6RE16H21 | |
| Schenker XMG P507 | |
| HP Omen 15-ce002ng | |
| MSI GE72 7RE-046 | |
| Deus Ex Mankind Divided - 1920x1080 Ultra Preset AA:2xMS AF:8x | |
| Asus G752VS | |
| HP Omen 15-ce002ng | |
| MSI GE72 7RE-046 | |
| Battlefield 1 - 1920x1080 Ultra Preset AA:T | |
| Asus G752VS | |
| HP Omen 15-ce002ng | |
| MSI GE72 7RE-046 | |
| Titanfall 2 - 1920x1080 Very High (Insane Texture Quality) / Enabled AA:TS AF:16x | |
| Asus G752VS | |
| HP Omen 15-ce002ng | |
| MSI GE72 7RE-046 | |
| Call of Duty Infinite Warfare - 1920x1080 Ultra / On AA:T2X SM | |
| Asus G752VS | |
| MSI GT62VR | |
| HP Omen 15-ce002ng | |
| MSI GE72 7RE-046 | |
| Dishonored 2 - 1920x1080 Ultra Preset AA:TX | |
| Asus G752VS | |
| MSI GT62VR | |
| HP Omen 15-ce002ng | |
| MSI GE72 7RE-046 | |
| Watch Dogs 2 - 1920x1080 Ultra Preset | |
| Asus G752VS | |
| MSI GT62VR | |
| HP Omen 15-ce002ng | |
| MSI GE72 7RE-046 | |
| Resident Evil 7 - 1920x1080 Very High / On AA:FXAA+T | |
| Asus G752VS | |
| MSI GT62VR | |
| HP Omen 15-ce002ng | |
| MSI GE72 7RE-046 | |
| For Honor - 1920x1080 Extreme Preset AA:T AF:16x | |
| Asus G752VS | |
| MSI GT62VR | |
| HP Omen 15-ce002ng | |
| MSI GE72 7RE-046 | |
| Ghost Recon Wildlands - 1920x1080 Ultra Preset AA:T AF:16x | |
| Asus G752VS | |
| MSI GT62VR | |
| HP Omen 15-ce002ng | |
| MSI GE72 7RE-046 | |
| Prey - 1920x1080 Very High Preset AA:2TX SM AF:16x | |
| Asus G752VS | |
| MSI GT62VR | |
| HP Omen 15-ce002ng | |
| Dirt 4 - 1920x1080 Ultra Preset AA:4xMS AF:16x | |
| Asus G752VS | |
| MSI GT62VR | |
| HP Omen 15-ce002ng | |
| MSI GE72 7RE-046 | |
| low | med. | high | ultra | 4K | |
|---|---|---|---|---|---|
| The Witcher 3 (2015) | 119 | 63.2 | 34.6 | 22.9 | |
| Batman: Arkham Knight (2015) | 129 | 81 | 54 | 26 | |
| Star Wars Battlefront (2015) | 188 | 93 | 80.9 | 29.3 | |
| Assassin's Creed Syndicate (2015) | 82.6 | 65.8 | 29.4 | 22.2 | |
| Rainbow Six Siege (2015) | 224 | 126 | 102 | 37.3 | |
| Rise of the Tomb Raider (2016) | 124 | 65.6 | 51.1 | 23.5 | |
| Far Cry Primal (2016) | 81 | 71 | 53 | 22 | |
| The Division (2016) | 127 | 61.9 | 48.8 | 22.1 | |
| Doom (2016) | 127 | 91.1 | 86.2 | 28.4 | |
| Mirror's Edge Catalyst (2016) | 130 | 66.4 | 59.6 | 20.5 | |
| Deus Ex Mankind Divided (2016) | 93.8 | 50.2 | 26.7 | 15.8 | |
| FIFA 17 (2016) | 330 | 250 | 248 | 95.2 | |
| Battlefield 1 (2016) | 154 | 76 | 67.8 | 25.3 | |
| Titanfall 2 (2016) | 144 | 79 | 67.3 | 24.8 | |
| Call of Duty Infinite Warfare (2016) | 124 | 91.6 | 81.7 | 34.6 | |
| Dishonored 2 (2016) | 85.4 | 64.7 | 54.8 | 23.7 | |
| Watch Dogs 2 (2016) | 101 | 56.8 | 39.4 | 18.9 | |
| Resident Evil 7 (2017) | 169 | 93 | 76.1 | 25.1 | |
| For Honor (2017) | 92.3 | 87.8 | 63.9 | 25.7 | |
| Ghost Recon Wildlands (2017) | 65 | 58.7 | 33.2 | 19.4 | |
| Prey (2017) | 126 | 101 | 84.7 | 27.7 | |
| Rocket League (2017) | 194 | 134 | 56.5 | ||
| Dirt 4 (2017) | 129 | 93.6 | 49.9 |
Noise level
| Idle |
| 30 / 33 / 37 dB(A) |
| HDD |
| 34 dB(A) |
| Load |
| 41 / 50 dB(A) |
 | ||
30 dB silent 40 dB(A) audible 50 dB(A) loud |
||
min: | ||
| HP Omen 15-ce002ng GeForce GTX 1060 Max-Q, i7-7700HQ | Acer Aspire VX5-591G-75C4 VX15 GeForce GTX 1050 Ti Mobile, i7-7700HQ | MSI GS63VR 7RF-228US GeForce GTX 1060 Mobile, i7-7700HQ | Gigabyte Aero 15 GeForce GTX 1060 Mobile, i7-7700HQ | Schenker XMG P507 PRO GeForce GTX 1070 Mobile, i7-7700HQ | |
|---|---|---|---|---|---|
| Noise | 7% | 1% | 0% | -9% | |
| off / environment * (dB) | 30 | 30.4 -1% | 28.8 4% | 31 -3% | 31 -3% |
| Idle Minimum * (dB) | 30 | 31.4 -5% | 33.1 -10% | 32 -7% | 33 -10% |
| Idle Average * (dB) | 33 | 31.4 5% | 33.1 -0% | 33 -0% | 34 -3% |
| Idle Maximum * (dB) | 37 | 31.4 15% | 34 8% | 34 8% | 44 -19% |
| Load Average * (dB) | 41 | 36.8 10% | 37.2 9% | 39 5% | 46 -12% |
| Witcher 3 ultra * (dB) | 42 | 46.1 -10% | 43 -2% | ||
| Load Maximum * (dB) | 50 | 41.3 17% | 47.1 6% | 50 -0% | 52 -4% |
* ... smaller is better
(-) The maximum temperature on the upper side is 47 °C / 117 F, compared to the average of 40.4 °C / 105 F, ranging from 21.2 to 68.8 °C for the class Gaming.
(-) The bottom heats up to a maximum of 54 °C / 129 F, compared to the average of 43.2 °C / 110 F
(±) In idle usage, the average temperature for the upper side is 33.8 °C / 93 F, compared to the device average of 33.9 °C / 93 F.
(-) Playing The Witcher 3, the average temperature for the upper side is 39.8 °C / 104 F, compared to the device average of 33.9 °C / 93 F.
(+) The palmrests and touchpad are reaching skin temperature as a maximum (34 °C / 93.2 F) and are therefore not hot.
(-) The average temperature of the palmrest area of similar devices was 28.8 °C / 83.8 F (-5.2 °C / -9.4 F).
| HP Omen 15-ce002ng GeForce GTX 1060 Max-Q, i7-7700HQ | Acer Aspire VX5-591G-75C4 VX15 GeForce GTX 1050 Ti Mobile, i7-7700HQ | MSI GS63VR 7RF-228US GeForce GTX 1060 Mobile, i7-7700HQ | Gigabyte Aero 15 GeForce GTX 1060 Mobile, i7-7700HQ | Schenker XMG P507 PRO GeForce GTX 1070 Mobile, i7-7700HQ | |
|---|---|---|---|---|---|
| Heat | 17% | 24% | 10% | 2% | |
| Maximum Upper Side * (°C) | 47 | 47 -0% | 56 -19% | 49.2 -5% | |
| Maximum Bottom * (°C) | 54 | 47 13% | 61 -13% | 62 -15% | |
| Idle Upper Side * (°C) | 36 | 28.4 21% | 28.4 21% | 25 31% | 32.4 10% |
| Idle Bottom * (°C) | 40 | 27.1 32% | 29.6 26% | 24 40% | 33 17% |
* ... smaller is better
HP Omen 15-ce002ng audio analysis
(±) | speaker loudness is average but good (80 dB)
Bass 100 - 315 Hz
(±) | reduced bass - on average 12.9% lower than median
(±) | linearity of bass is average (14.8% delta to prev. frequency)
Mids 400 - 2000 Hz
(+) | balanced mids - only 3.5% away from median
(+) | mids are linear (3.3% delta to prev. frequency)
Highs 2 - 16 kHz
(+) | balanced highs - only 2.9% away from median
(+) | highs are linear (5% delta to prev. frequency)
Overall 100 - 16.000 Hz
(+) | overall sound is linear (13.6% difference to median)
Compared to same class
» 20% of all tested devices in this class were better, 7% similar, 73% worse
» The best had a delta of 6%, average was 18%, worst was 132%
Compared to all devices tested
» 15% of all tested devices were better, 4% similar, 82% worse
» The best had a delta of 4%, average was 23%, worst was 134%
Acer Aspire VX5-591G-75C4 VX15 audio analysis
(±) | speaker loudness is average but good (73 dB)
Bass 100 - 315 Hz
(-) | nearly no bass - on average 15% lower than median
(±) | linearity of bass is average (10.7% delta to prev. frequency)
Mids 400 - 2000 Hz
(+) | balanced mids - only 1.9% away from median
(+) | mids are linear (5.9% delta to prev. frequency)
Highs 2 - 16 kHz
(+) | balanced highs - only 4.8% away from median
(+) | highs are linear (2.2% delta to prev. frequency)
Overall 100 - 16.000 Hz
(+) | overall sound is linear (14.8% difference to median)
Compared to same class
» 35% of all tested devices in this class were better, 4% similar, 61% worse
» The best had a delta of 5%, average was 17%, worst was 45%
Compared to all devices tested
» 20% of all tested devices were better, 4% similar, 76% worse
» The best had a delta of 4%, average was 23%, worst was 134%
| Off / Standby | |
| Idle | |
| Load |
|
Key:
min: | |
| HP Omen 15-ce002ng GeForce GTX 1060 Max-Q, i7-7700HQ | Acer Aspire VX5-591G-75C4 VX15 GeForce GTX 1050 Ti Mobile, i7-7700HQ | MSI GS63VR 7RF-228US GeForce GTX 1060 Mobile, i7-7700HQ | Gigabyte Aero 15 GeForce GTX 1060 Mobile, i7-7700HQ | Schenker XMG P507 PRO GeForce GTX 1070 Mobile, i7-7700HQ | |
|---|---|---|---|---|---|
| Power Consumption | 40% | 9% | 15% | 7% | |
| Idle Minimum * (Watt) | 18 | 7 61% | 14.5 19% | 12 33% | 14 22% |
| Idle Average * (Watt) | 23 | 10.2 56% | 17.3 25% | 15 35% | 18 22% |
| Idle Maximum * (Watt) | 30 | 14 53% | 17.4 42% | 20 33% | 24 20% |
| Load Average * (Watt) | 85 | 78 8% | 93 -9% | 82 4% | 87 -2% |
| Witcher 3 ultra * (Watt) | 96 | 128.8 -34% | 111 -16% | ||
| Load Maximum * (Watt) | 158 | 127 20% | 161 -2% | 201 -27% |
* ... smaller is better
| HP Omen 15-ce002ng GeForce GTX 1060 Max-Q, i7-7700HQ, 70 Wh | Acer Aspire VX5-591G-75C4 VX15 GeForce GTX 1050 Ti Mobile, i7-7700HQ, 52.5 Wh | MSI GS63VR 7RF-228US GeForce GTX 1060 Mobile, i7-7700HQ, 65 Wh | Gigabyte Aero 15 GeForce GTX 1060 Mobile, i7-7700HQ, 94.24 Wh | Schenker XMG P507 PRO GeForce GTX 1070 Mobile, i7-7700HQ, 60 Wh | |
|---|---|---|---|---|---|
| Battery runtime | 29% | 22% | 103% | -2% | |
| Reader / Idle (h) | 4.3 | 5.4 26% | 6.4 49% | 10.6 147% | |
| H.264 (h) | 3.7 | 7.7 108% | 3.6 -3% | ||
| WiFi v1.3 (h) | 3.3 | 5 52% | 3.9 18% | 7 112% | 3.3 0% |
| Load (h) | 1.3 | 1.4 8% | 1.3 0% | 1.9 46% |
Pros
Cons
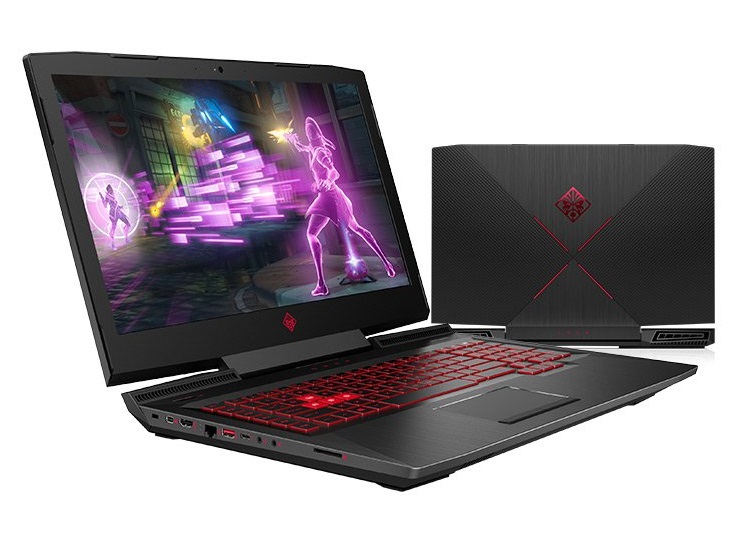
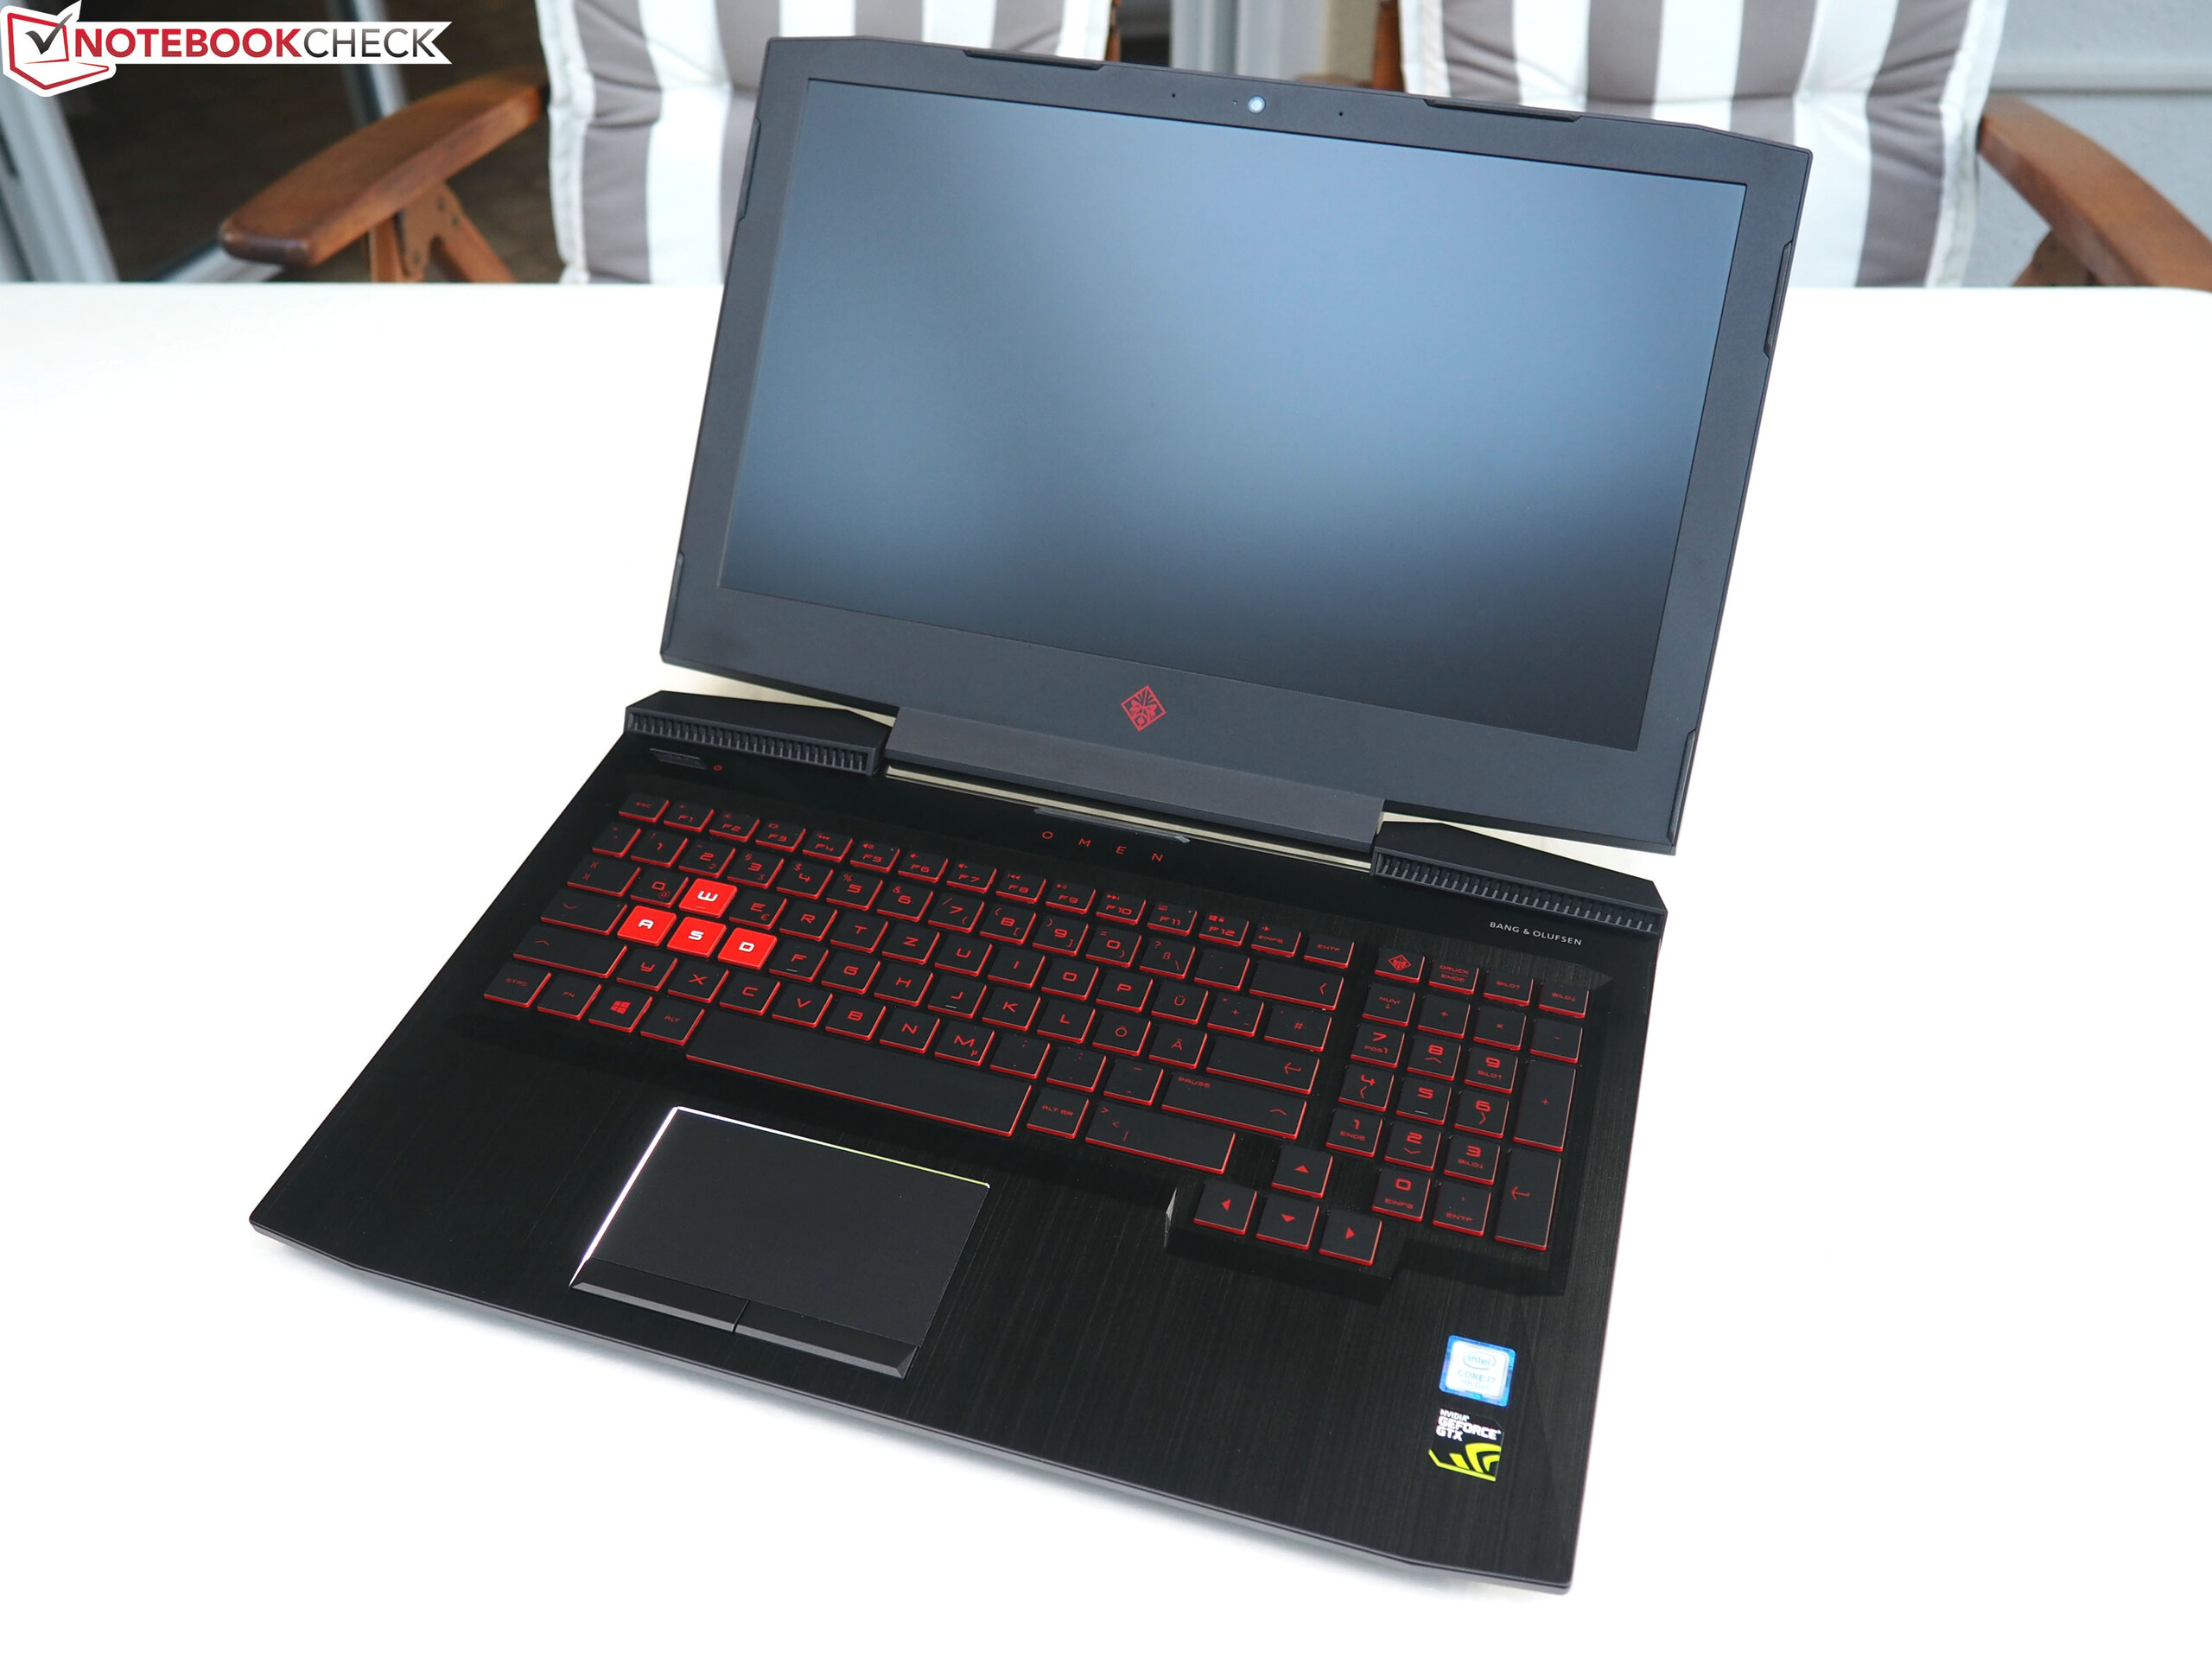
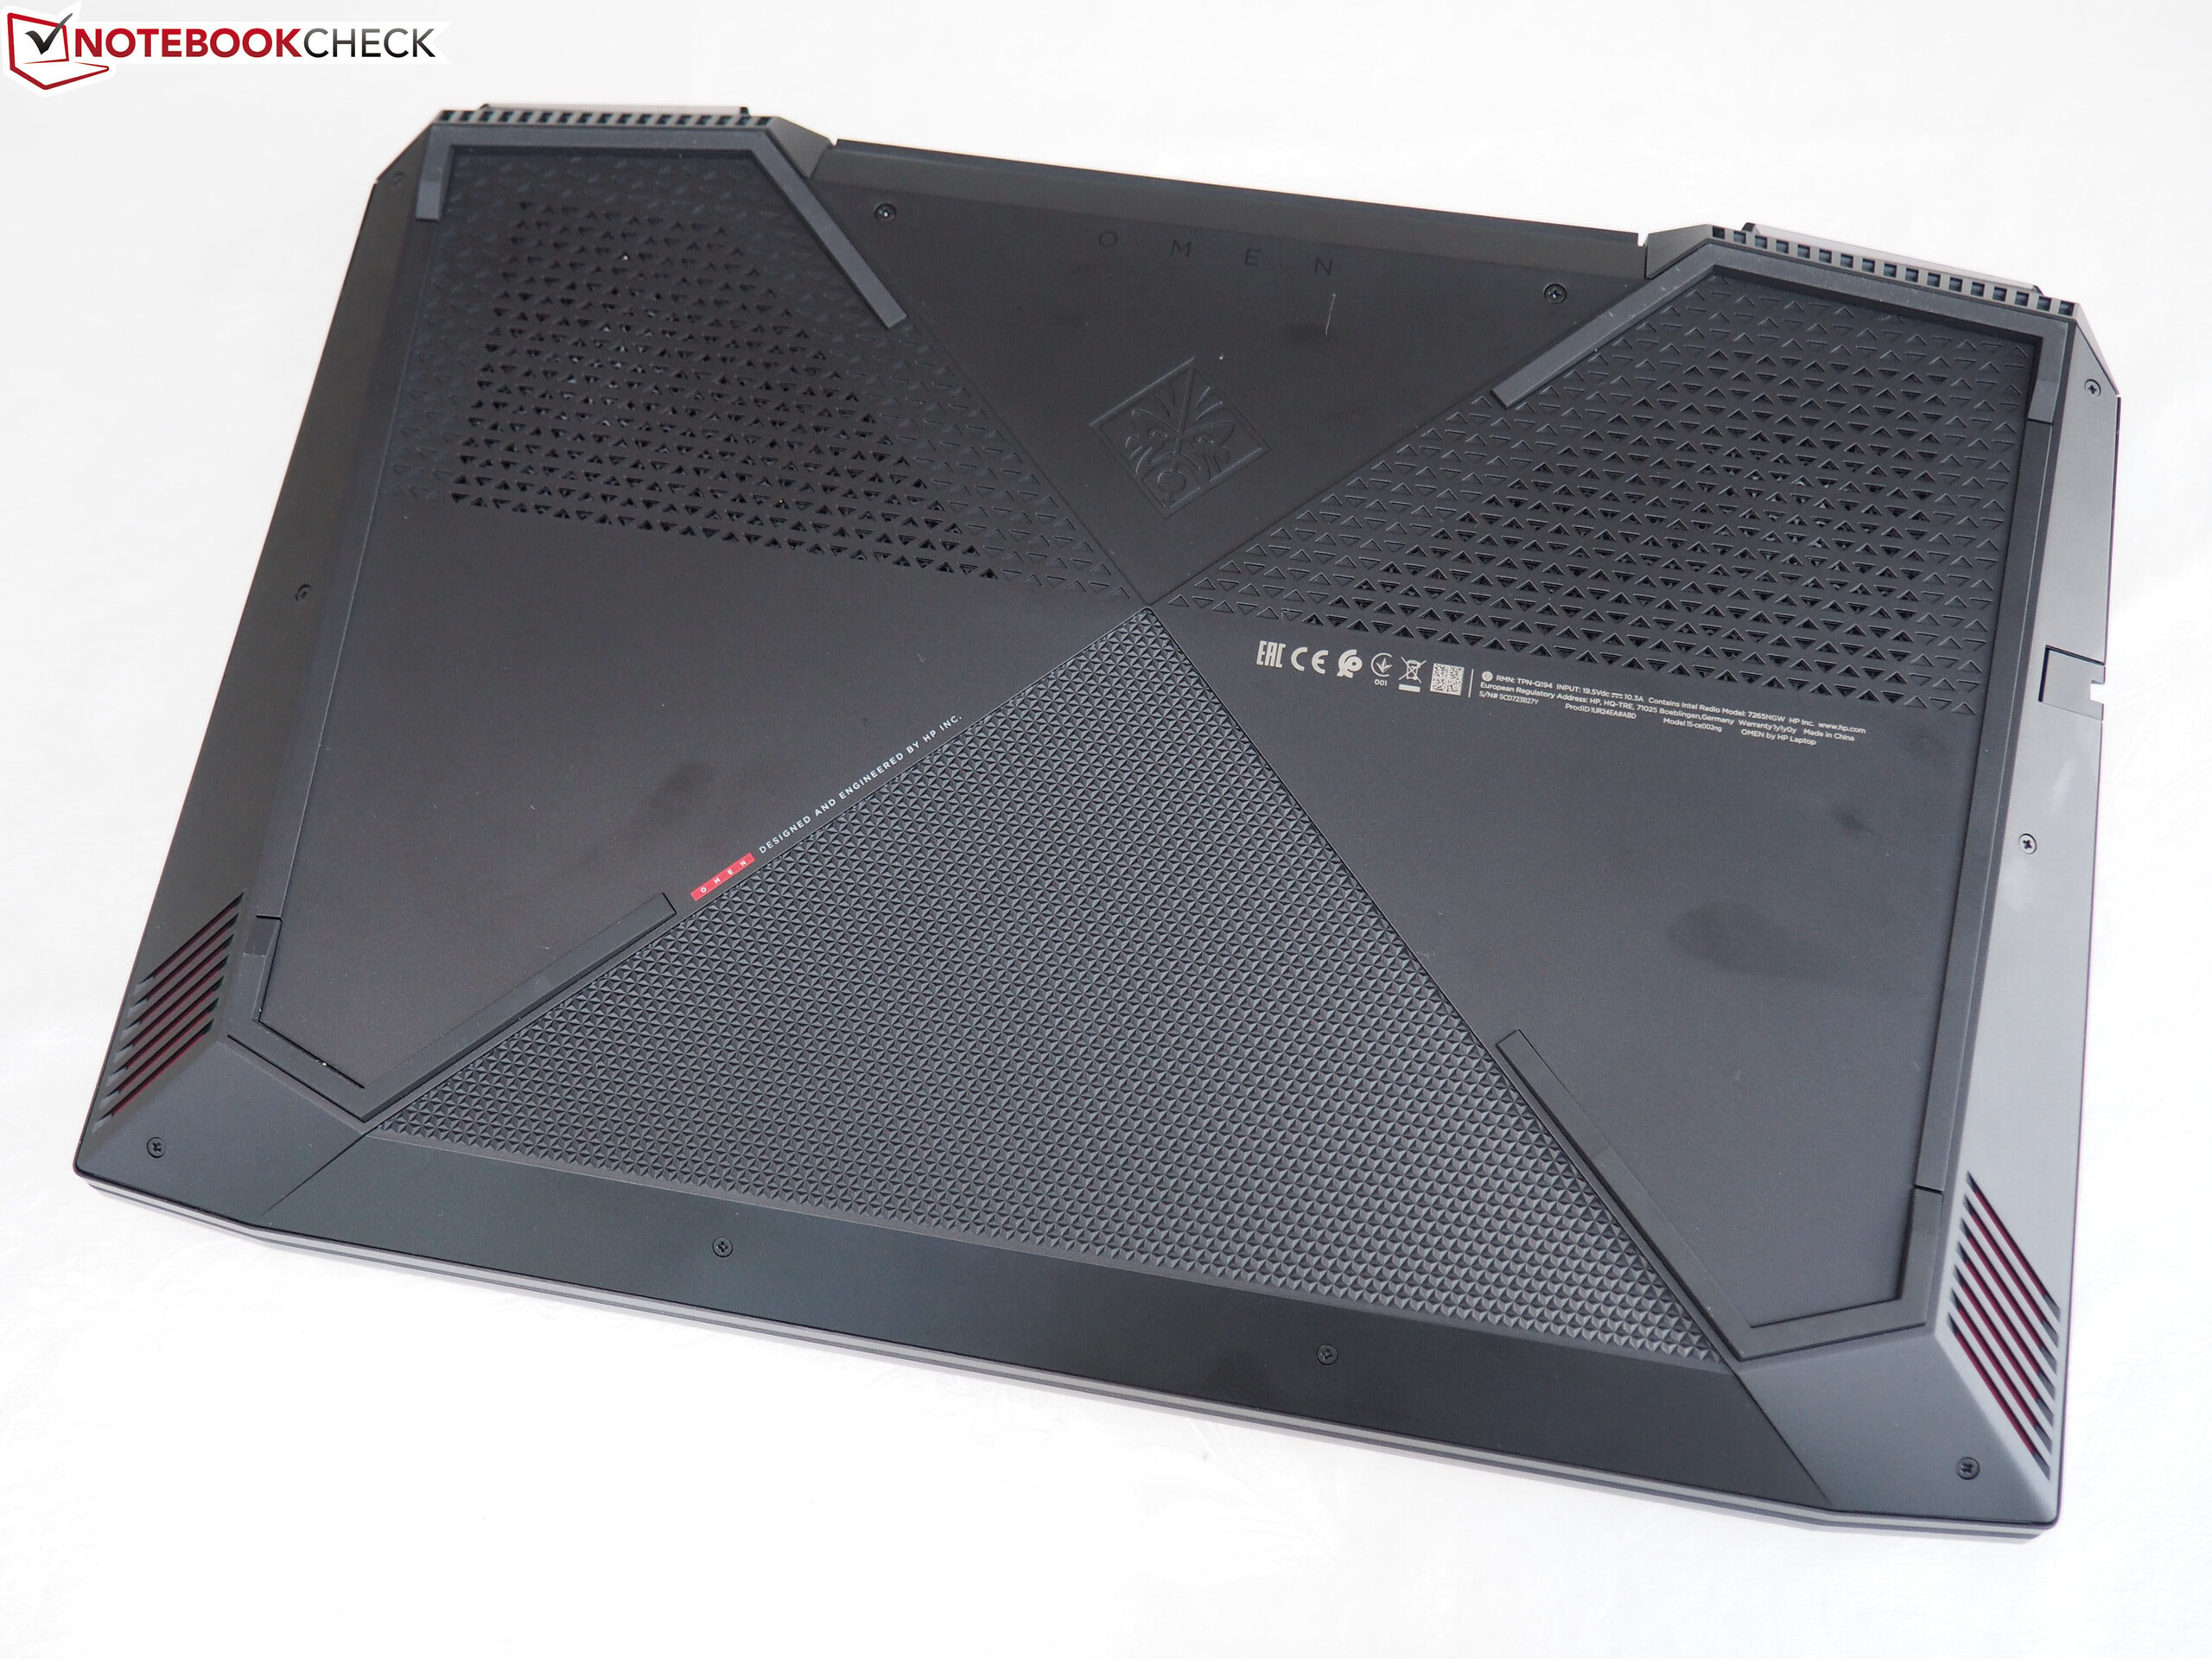
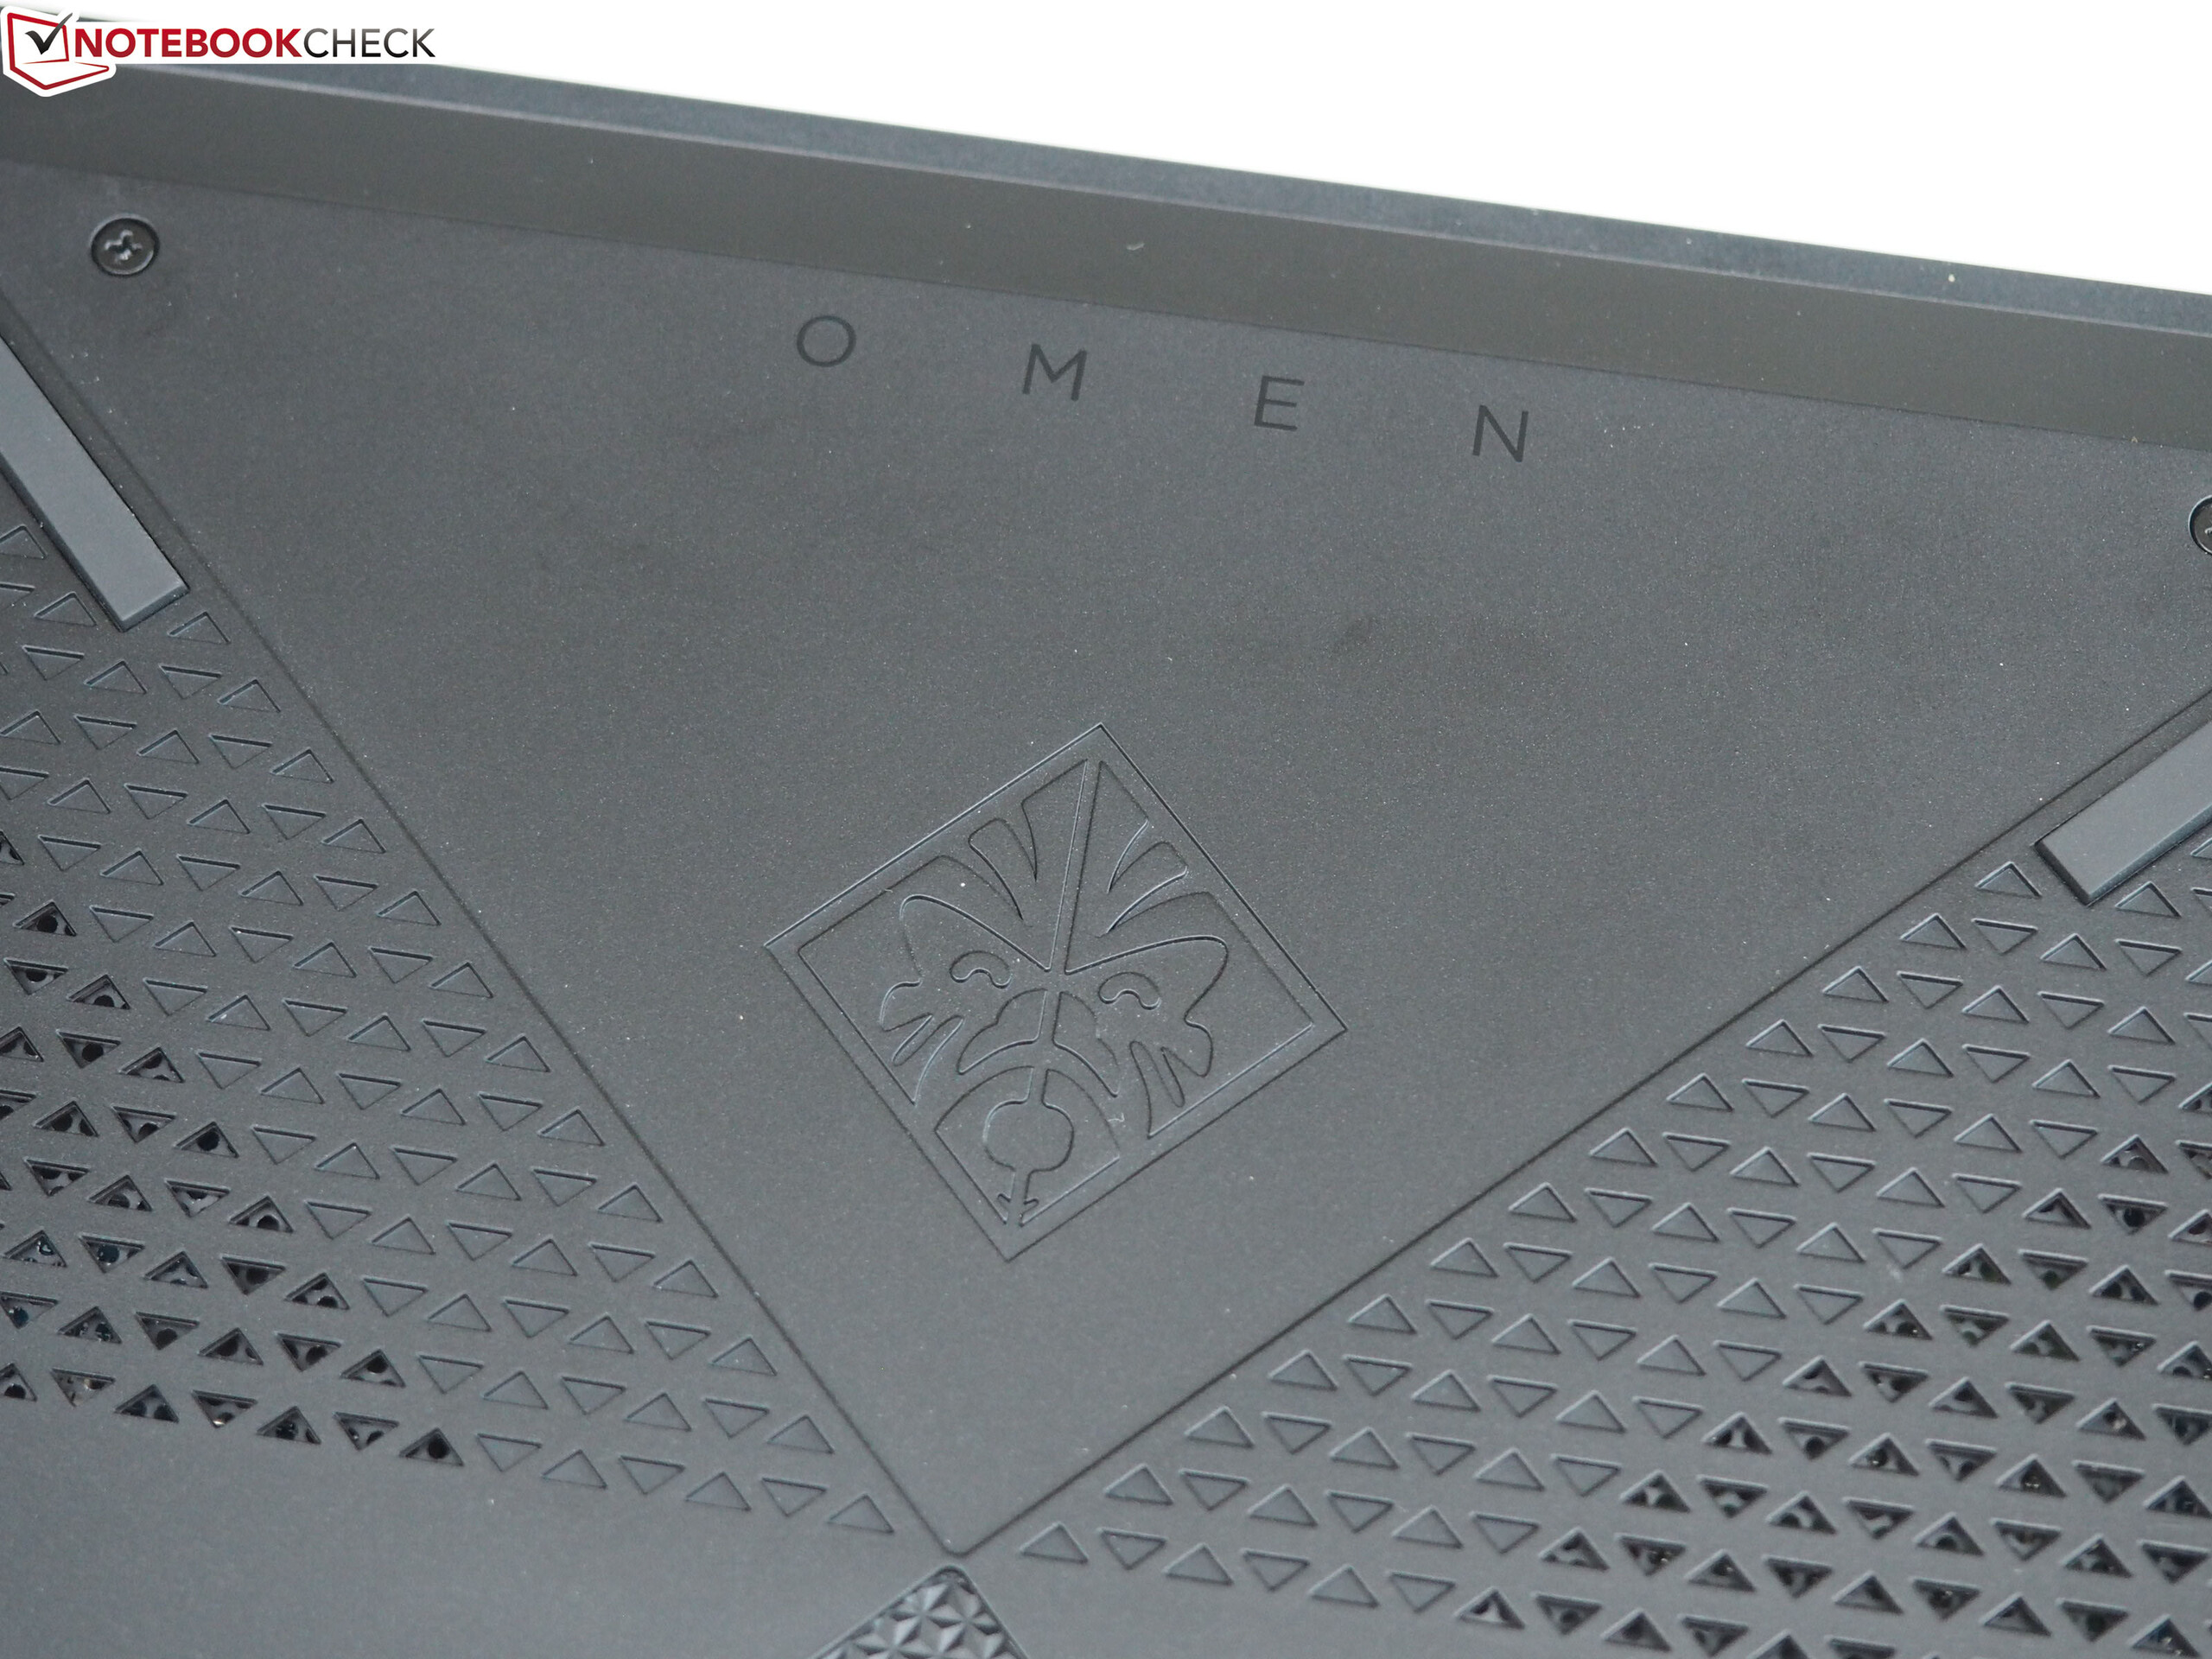
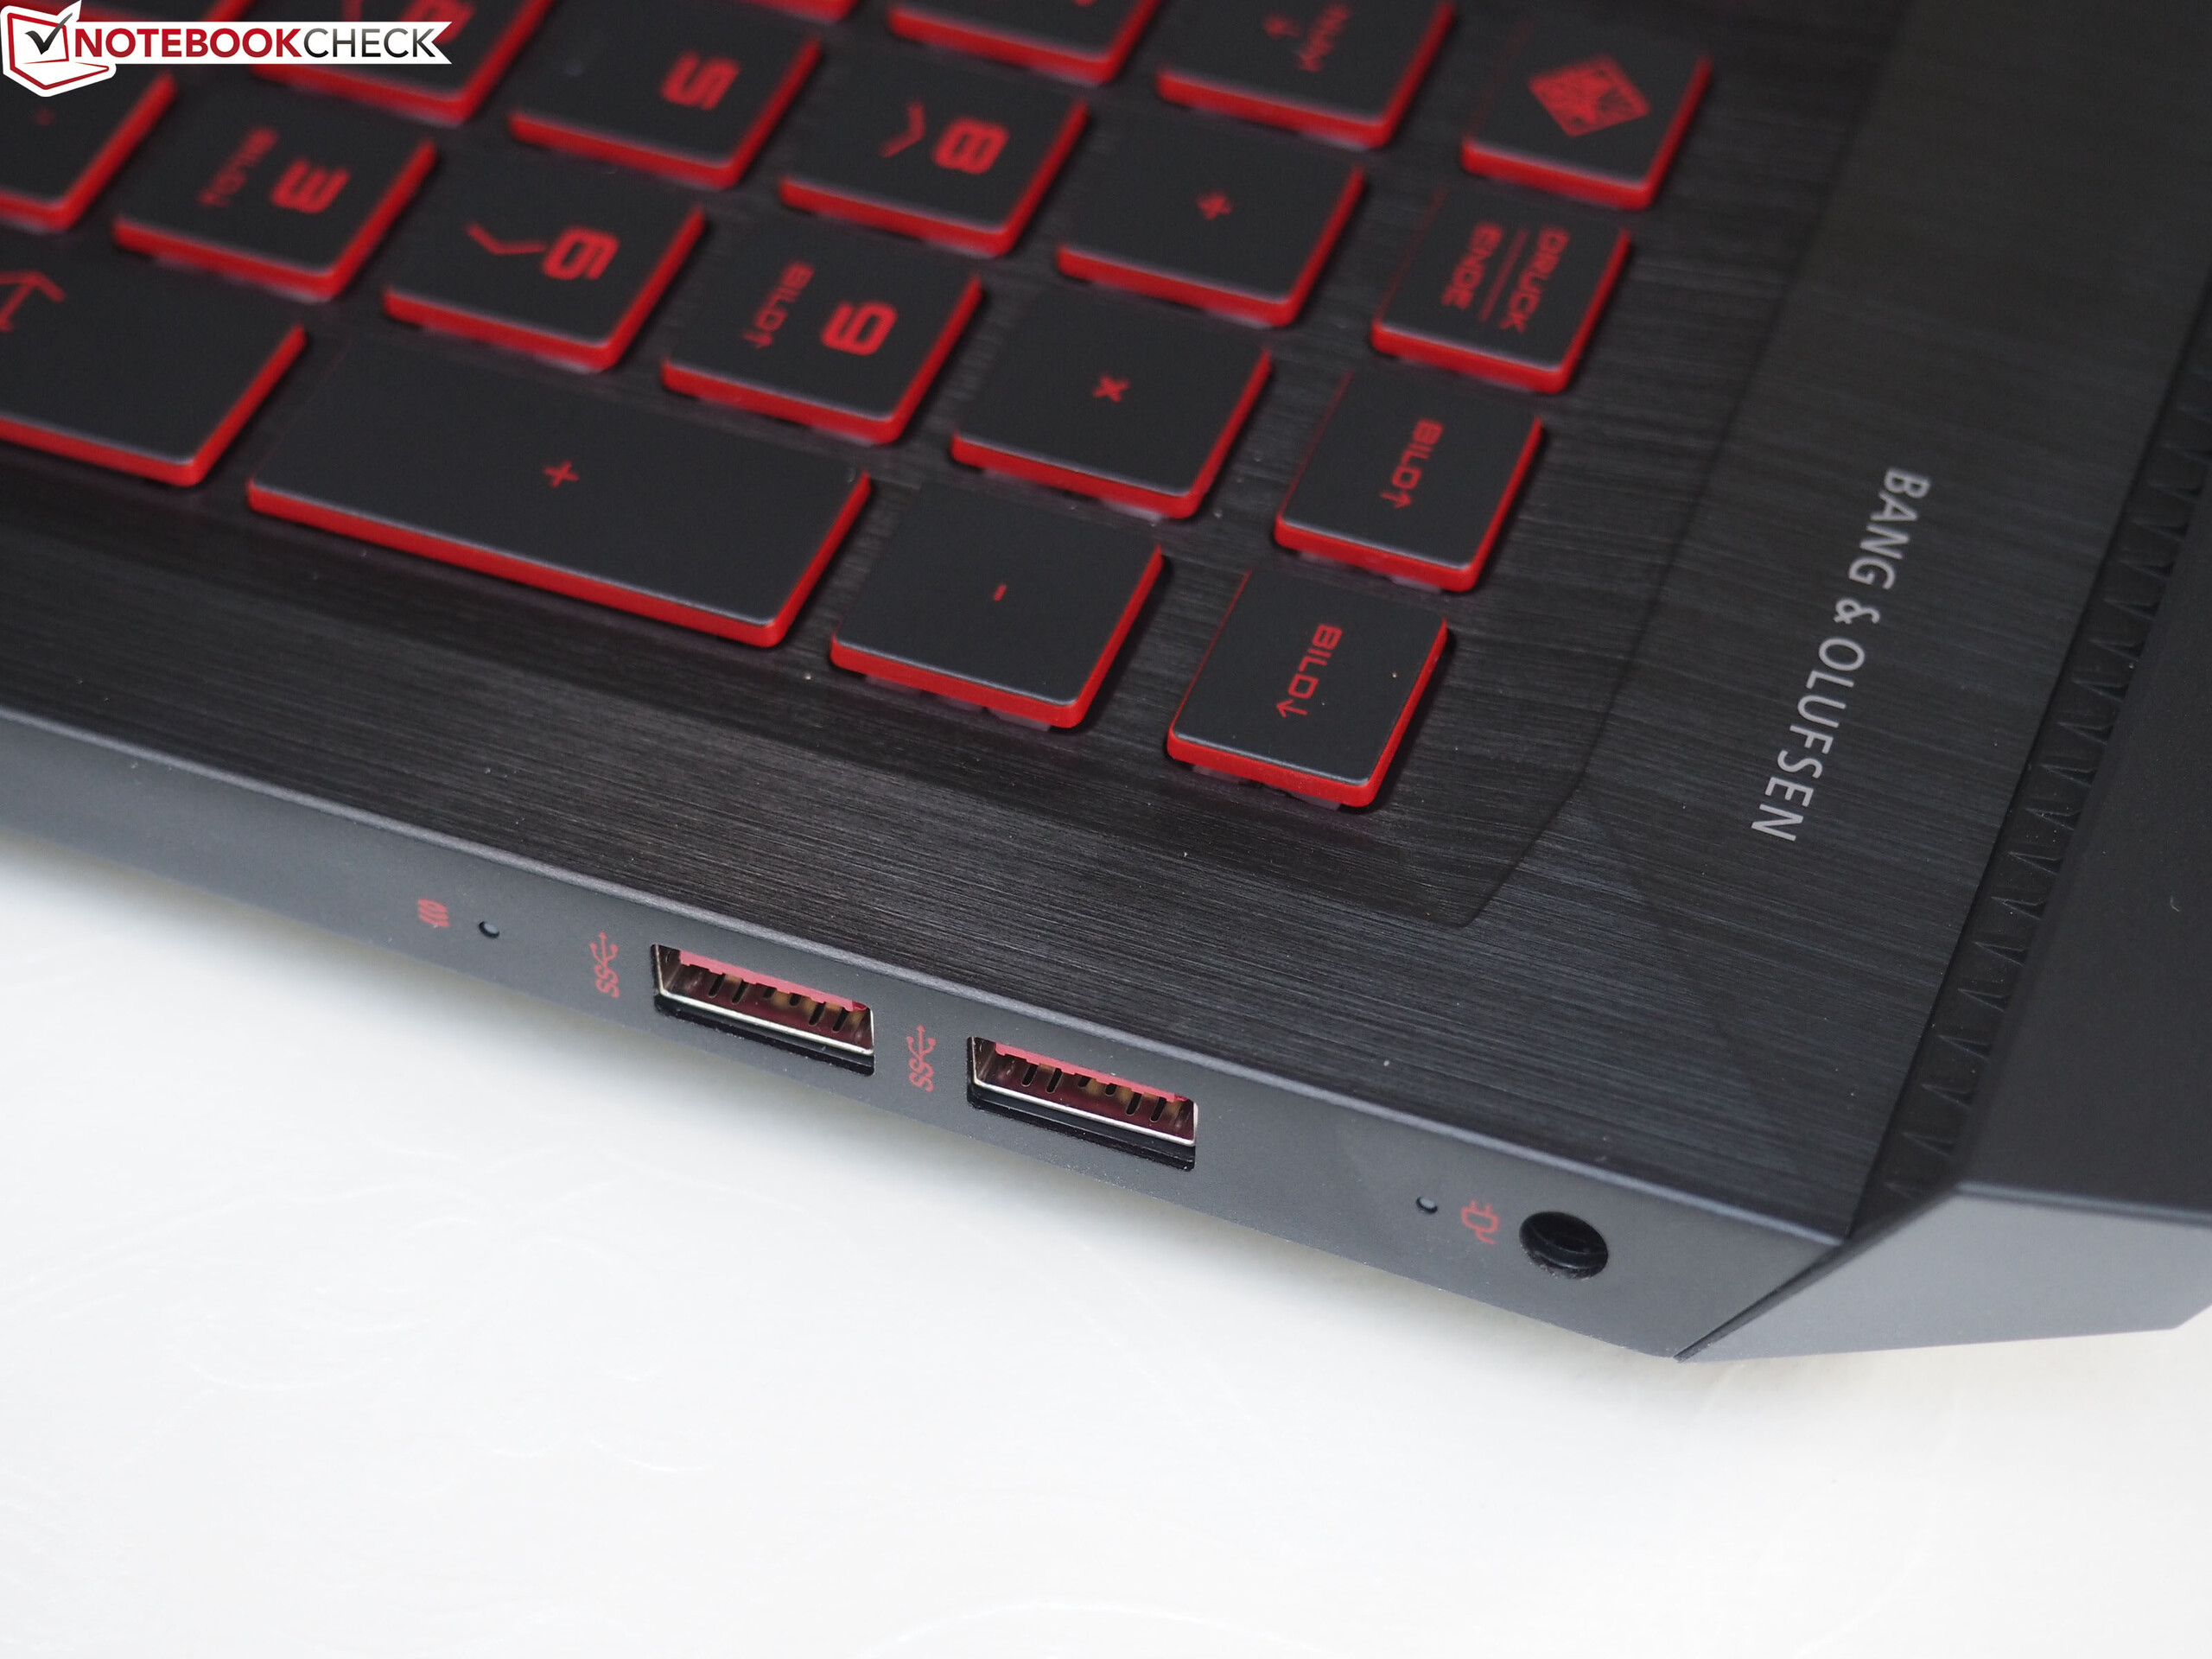
多年来,许多笔记本制造商都依赖于其“荣誉”,或者准确地说,它的外壳。以及,不断更新迭代的中央处理器和图形处理器。而新一代的Omen,惠普敢于重新设计。在我们看来,获得了许多方面的成功。
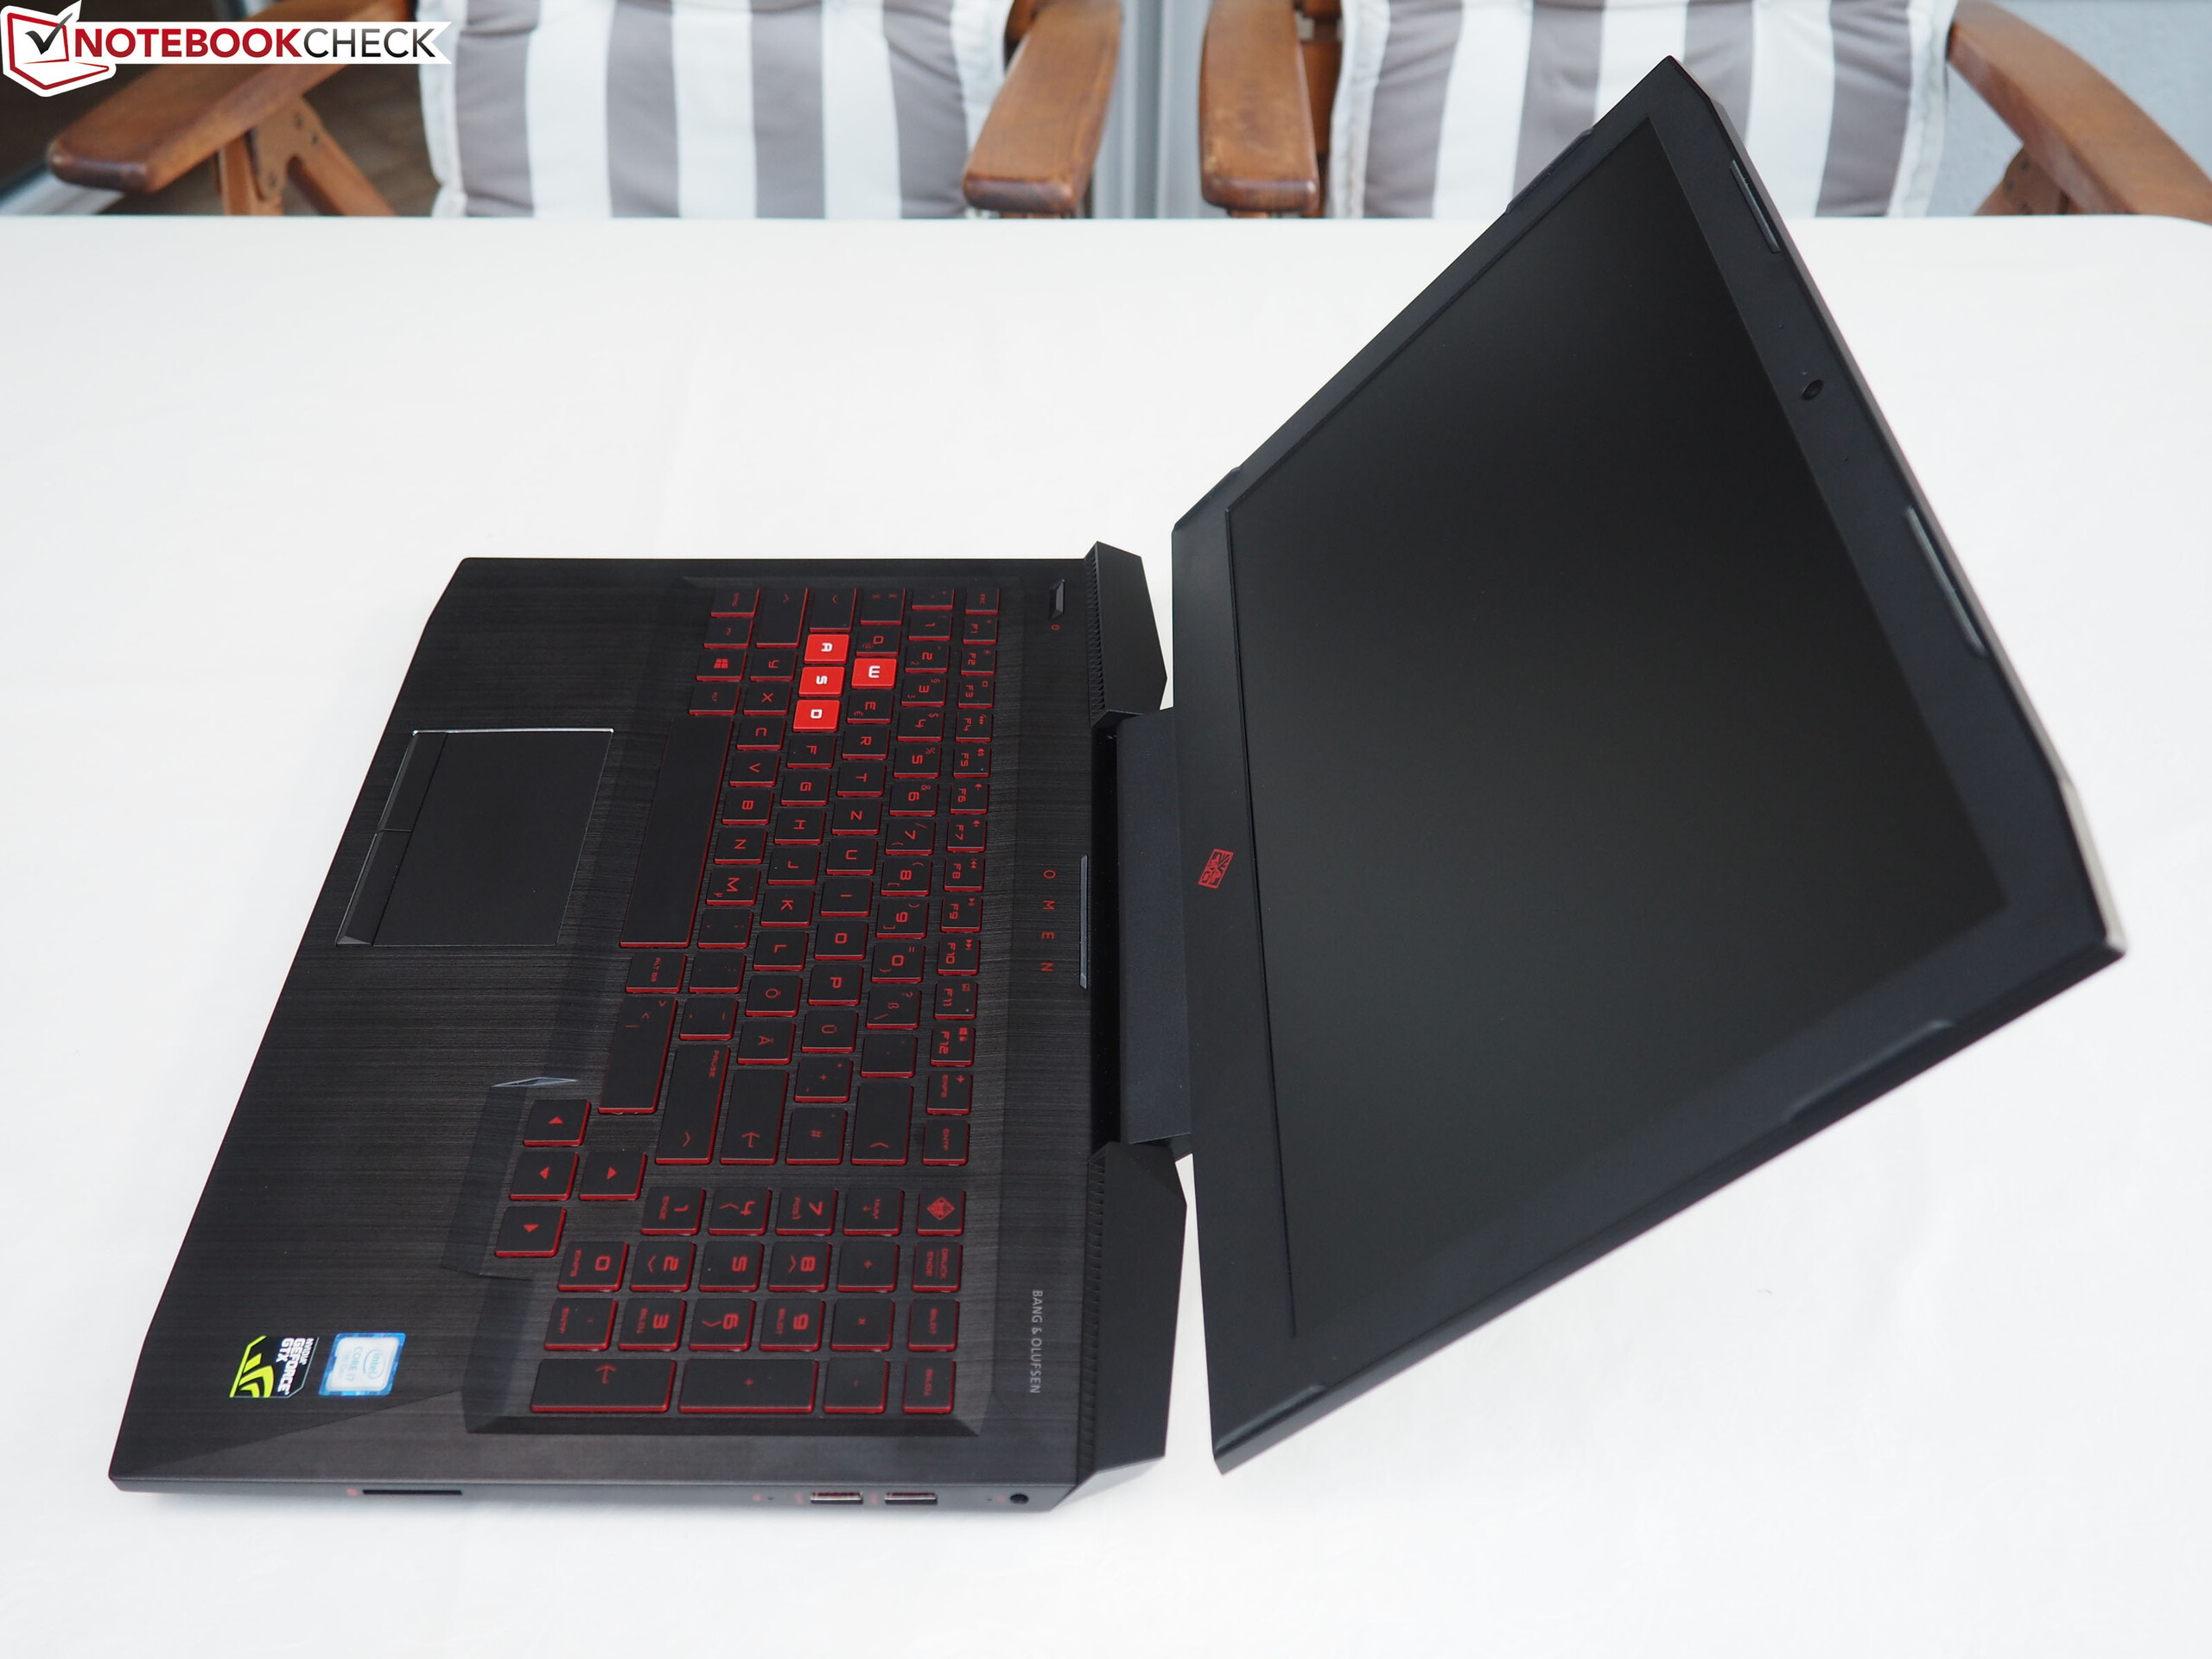
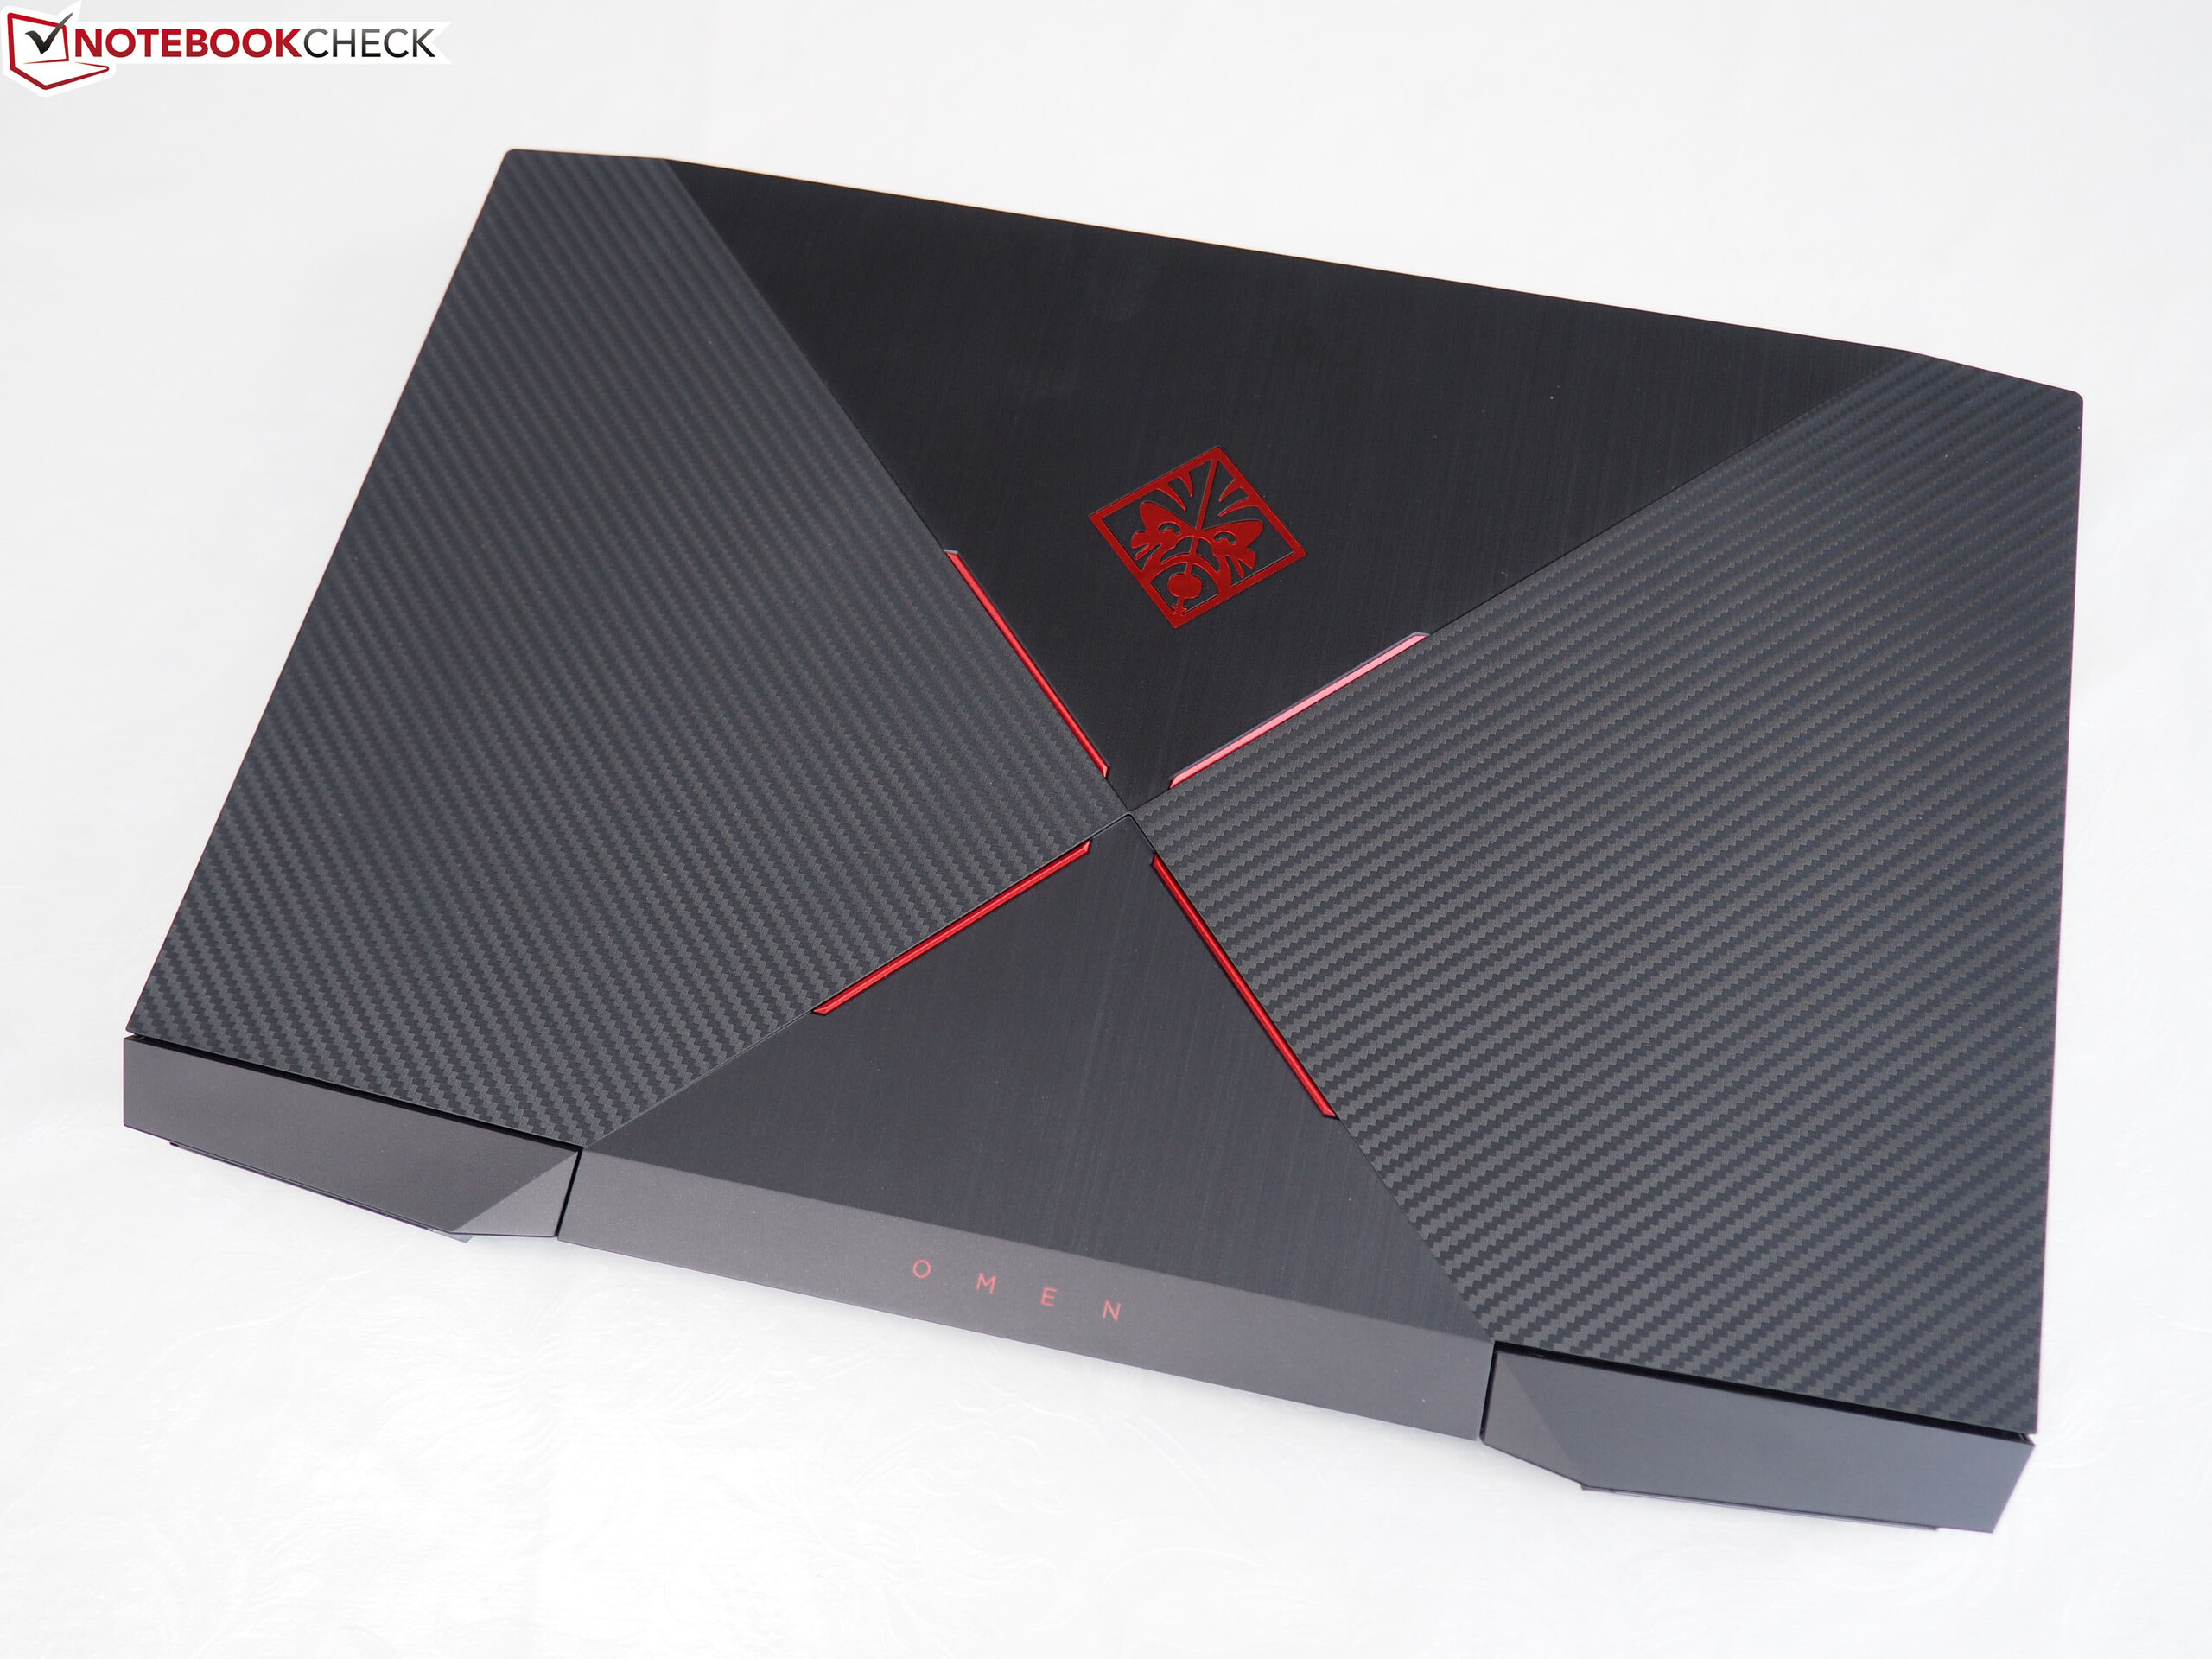
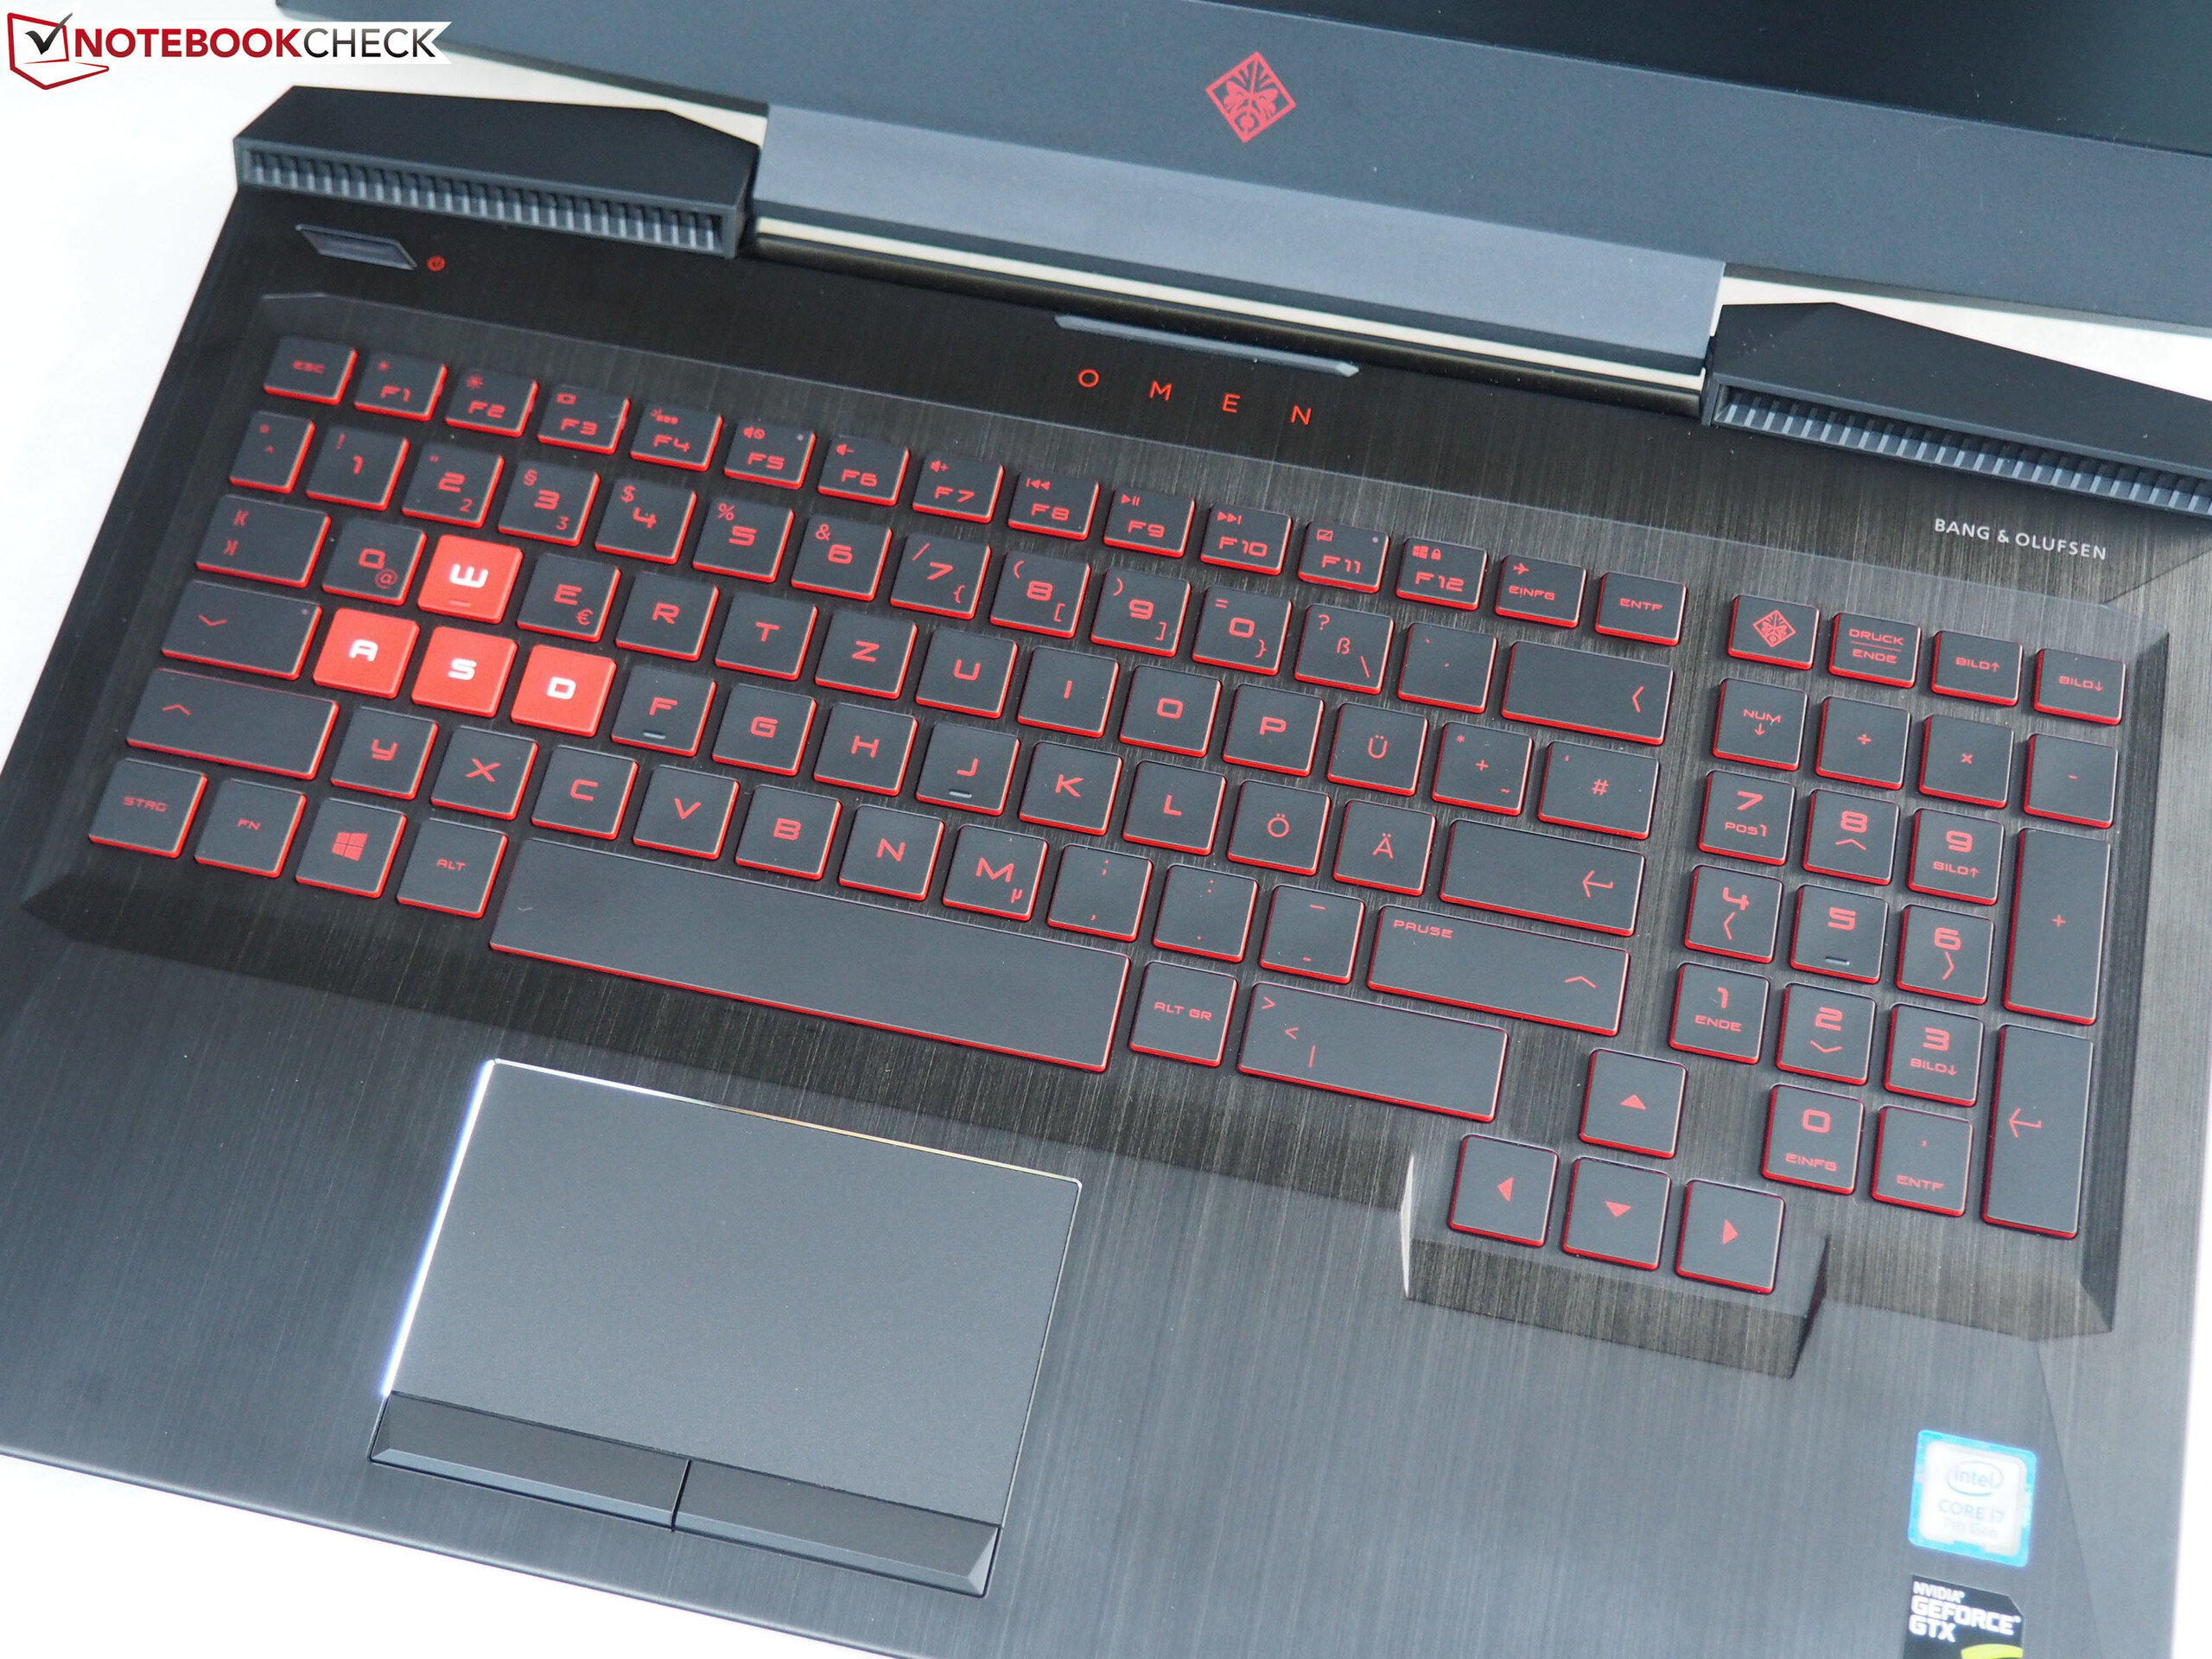
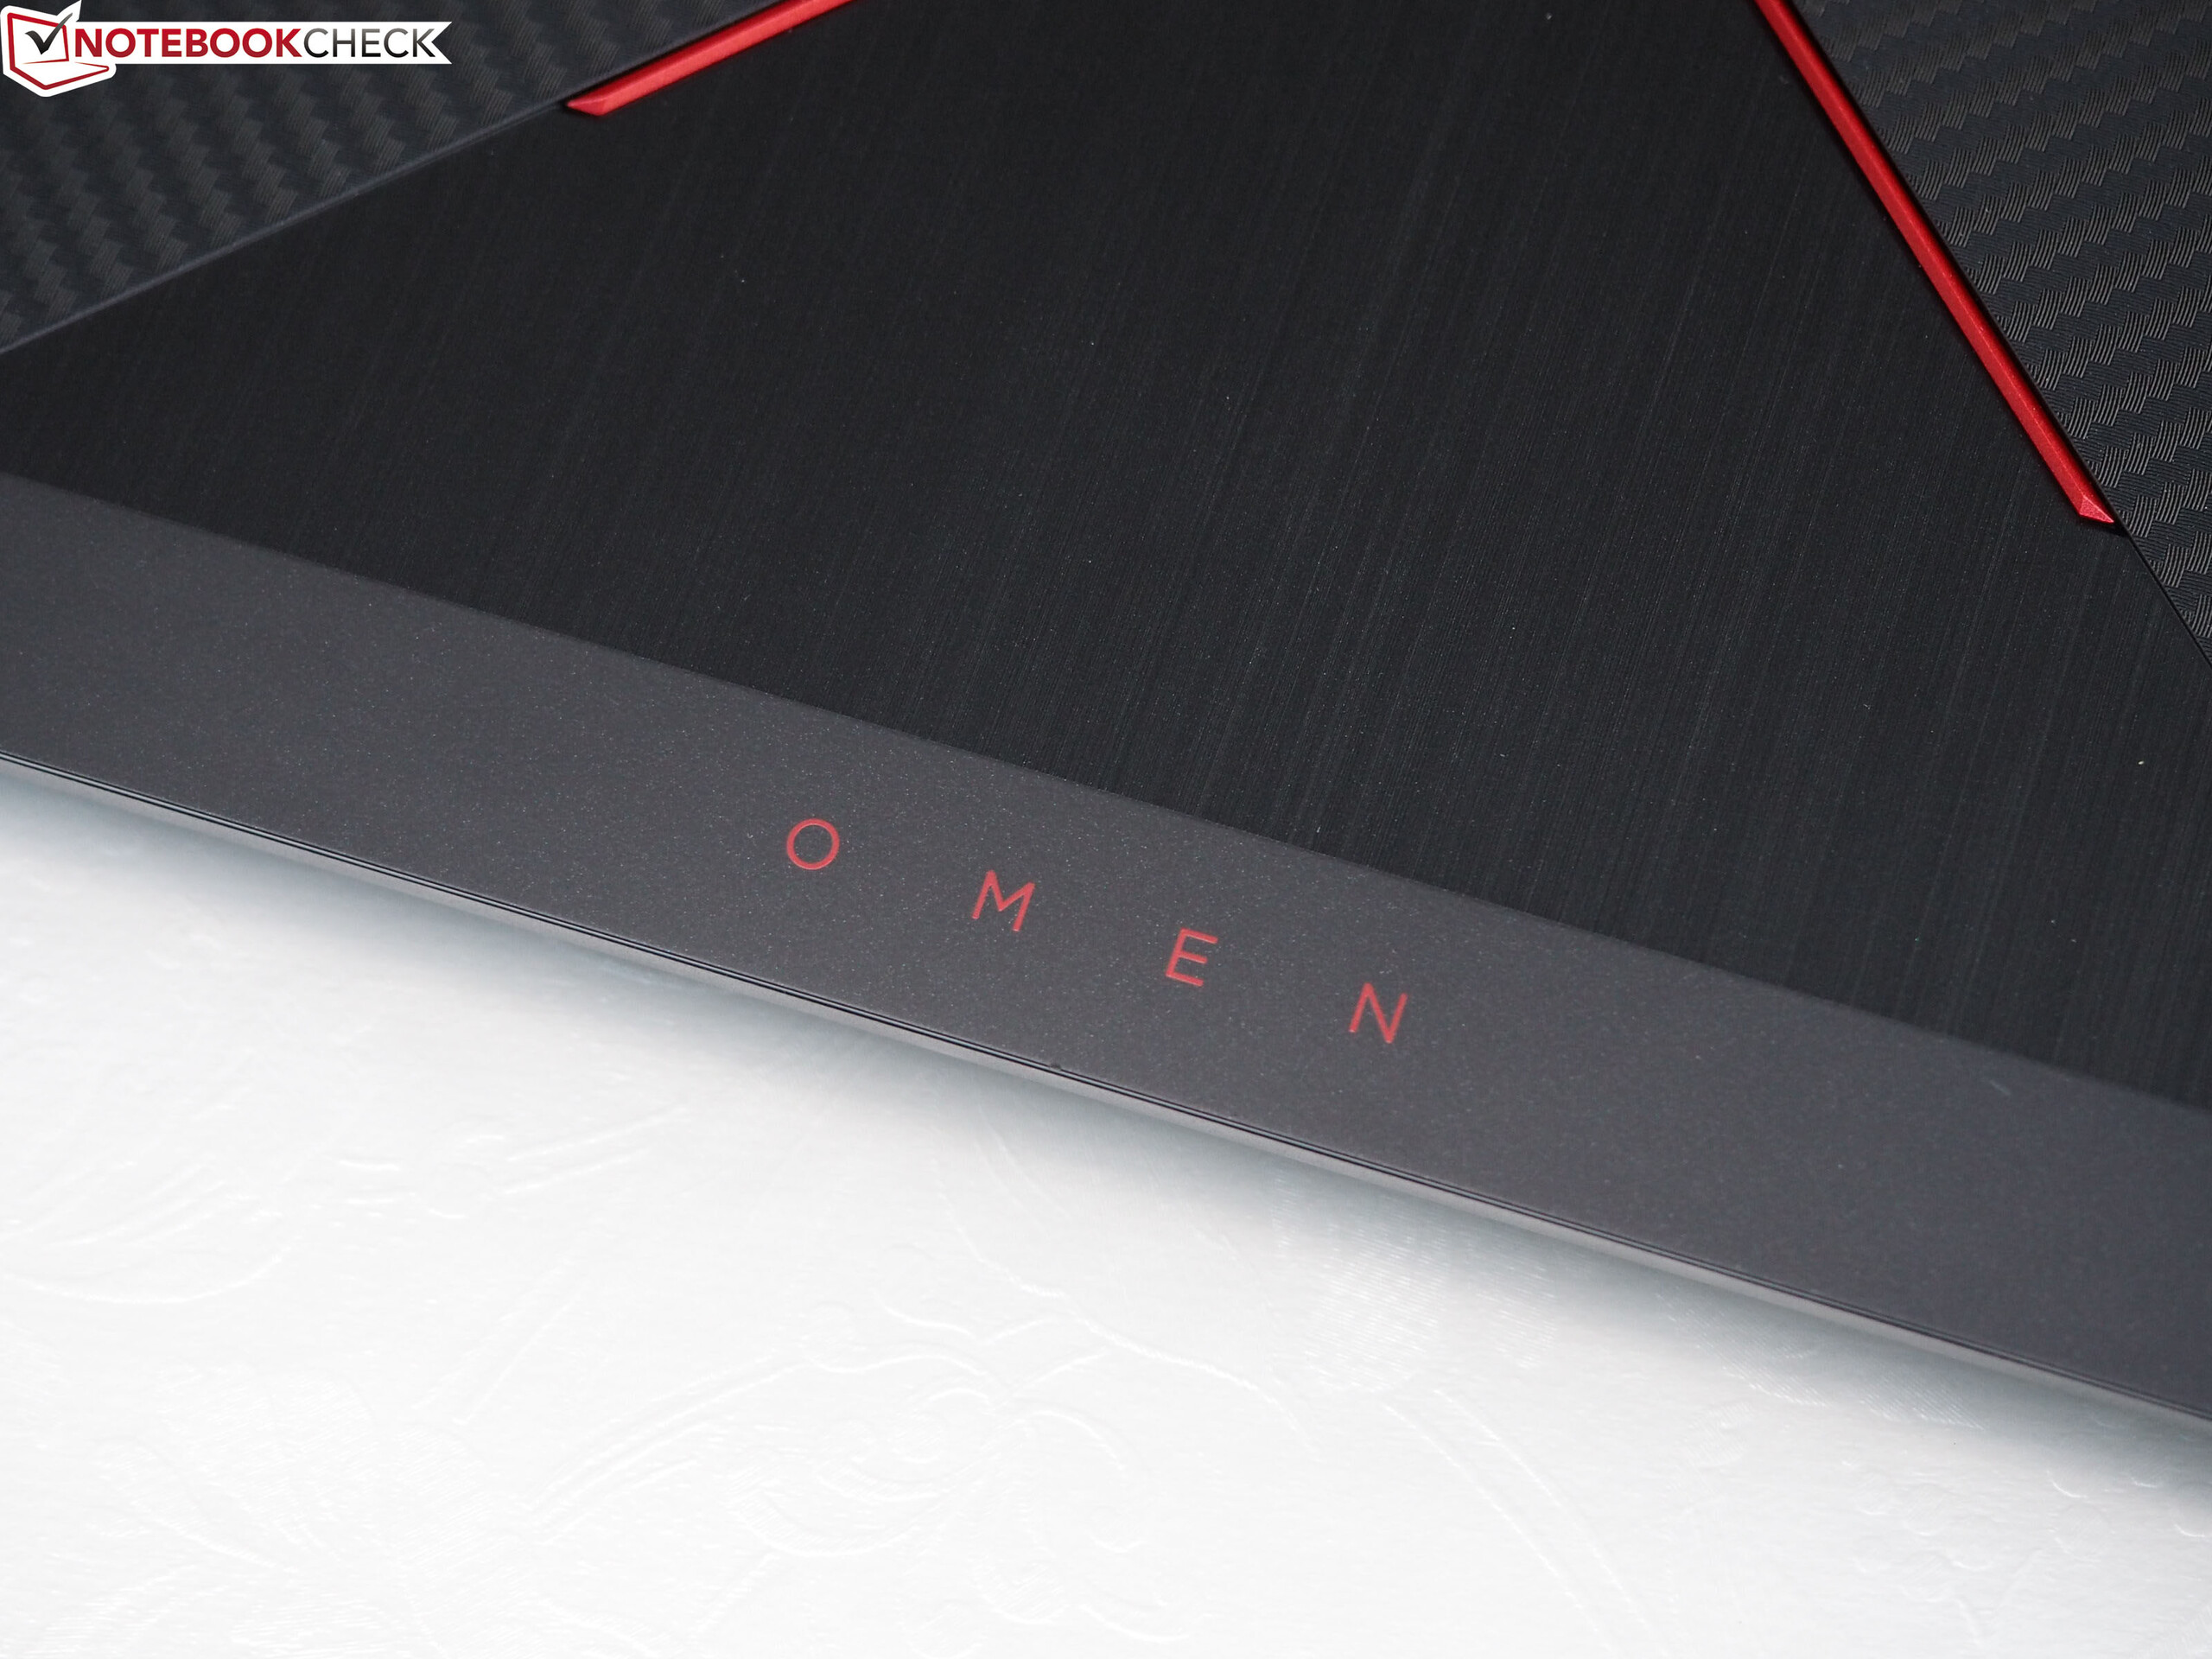
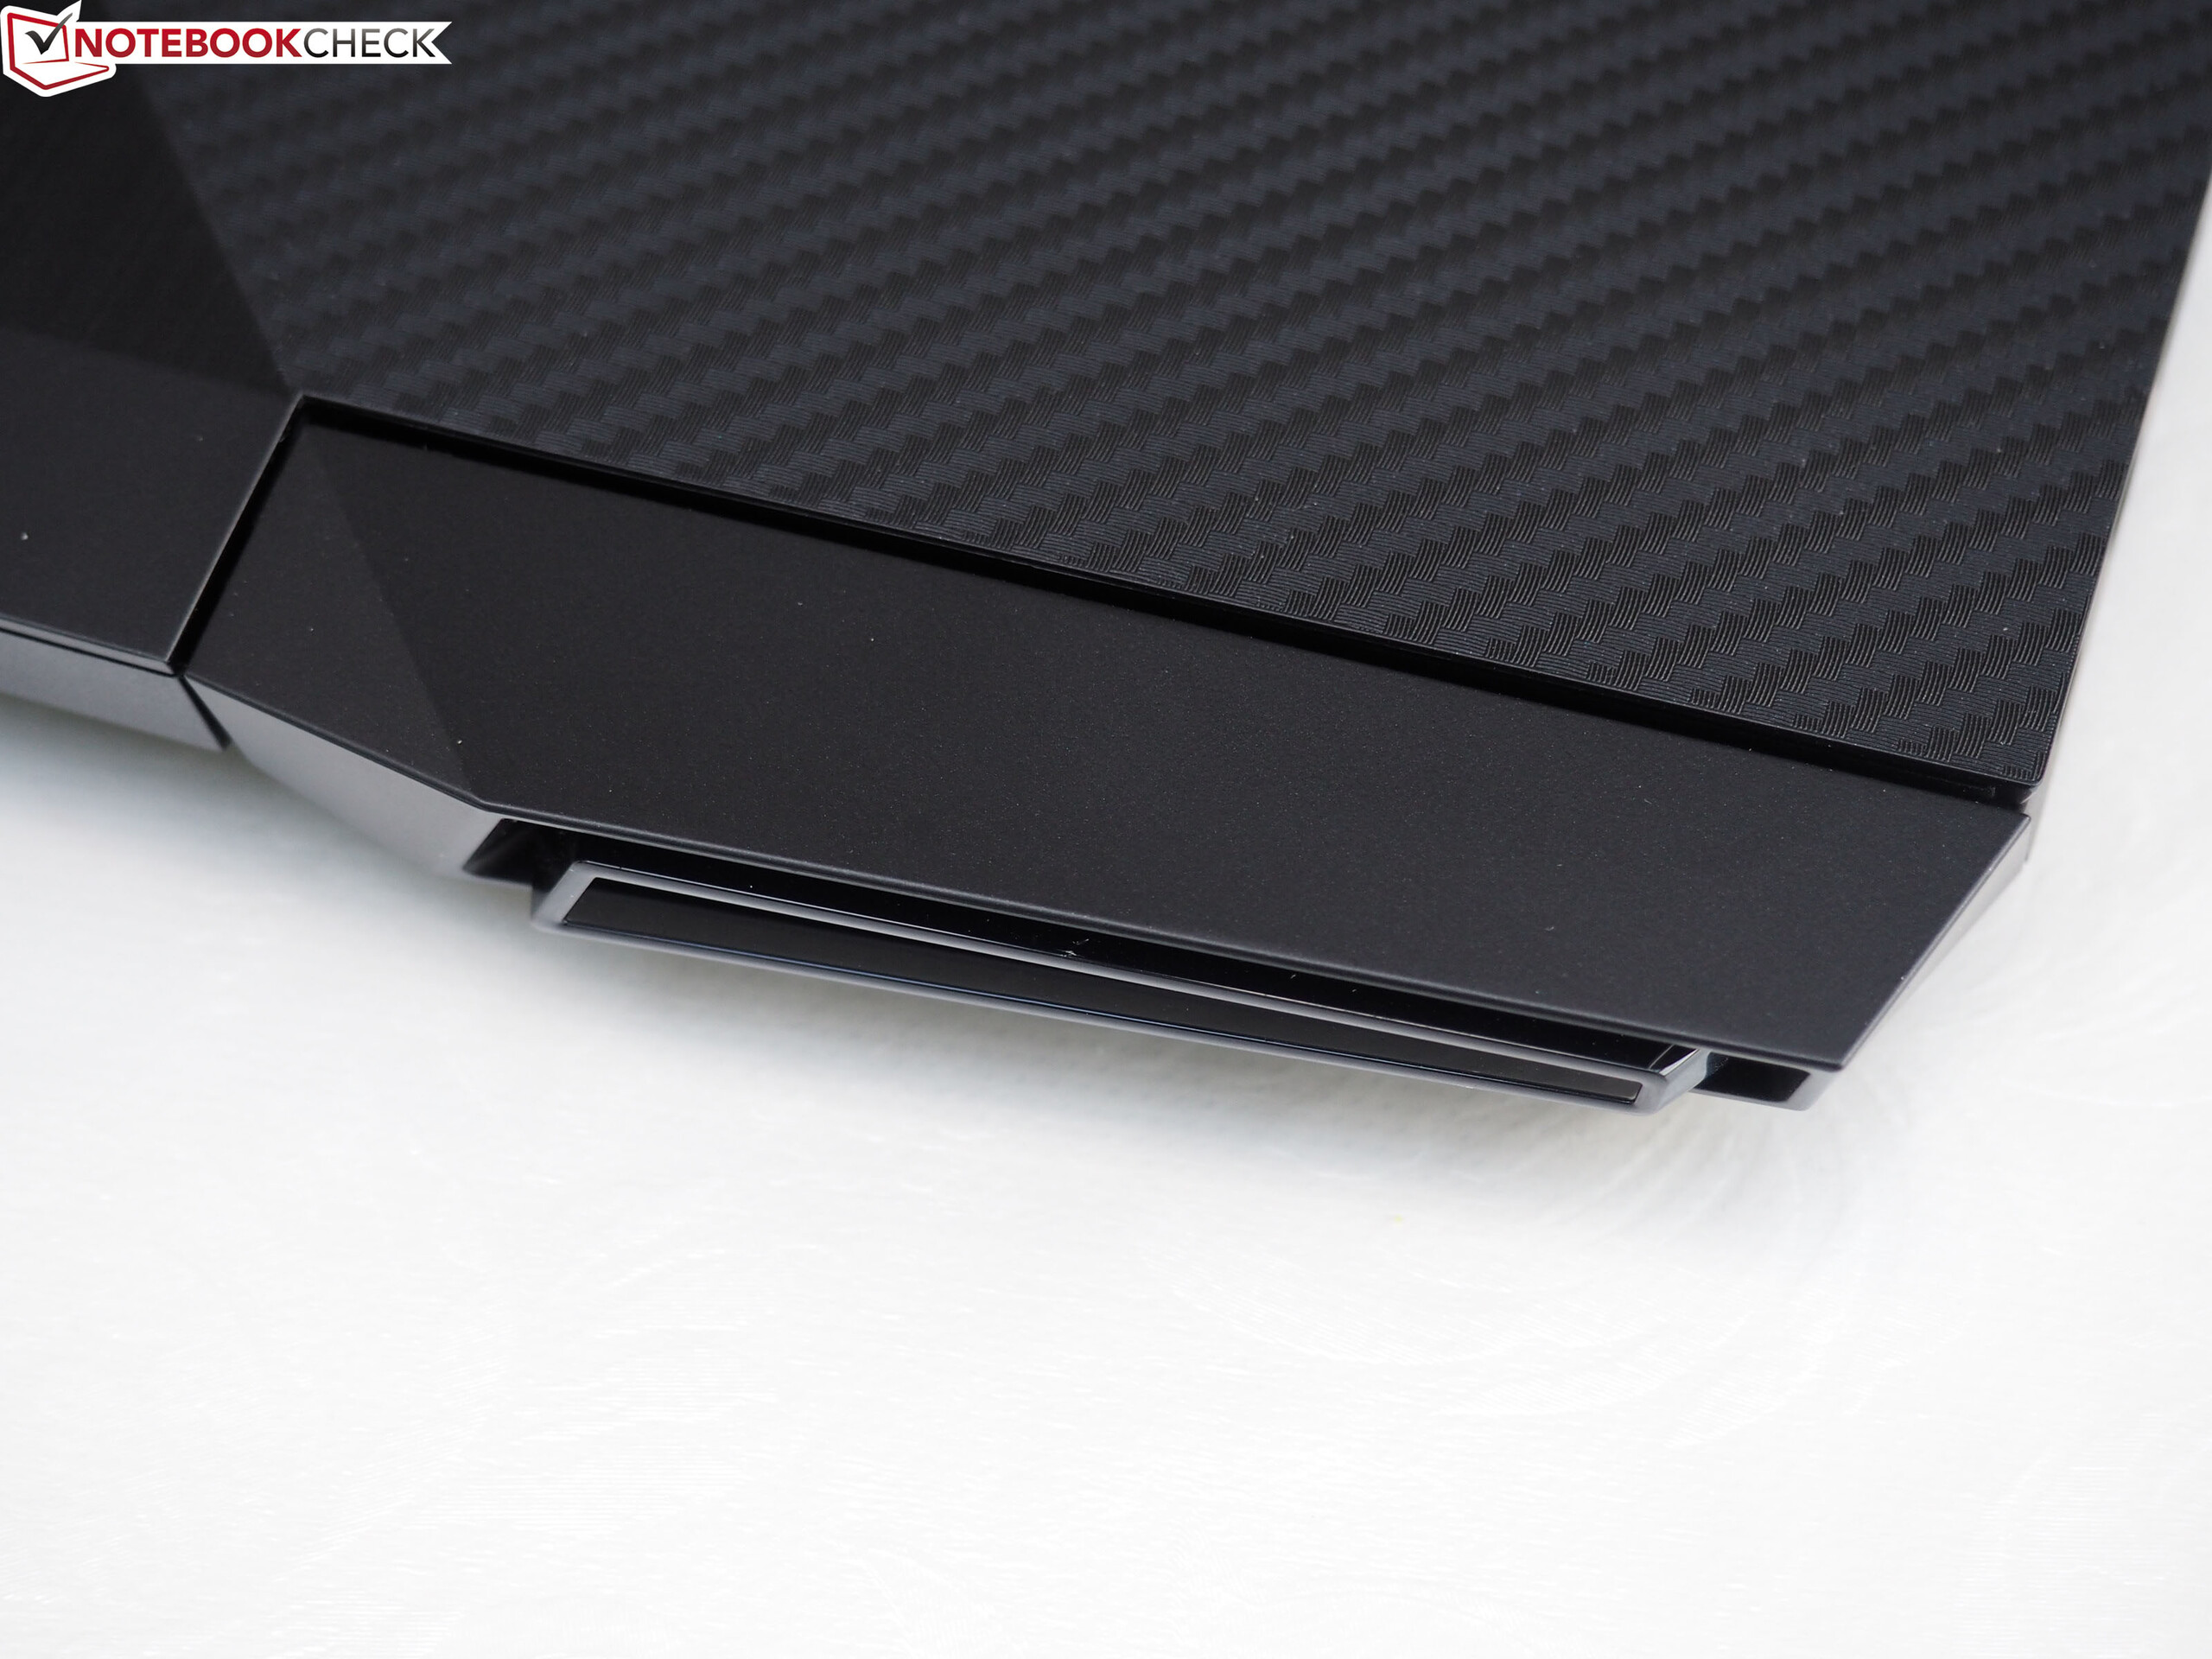
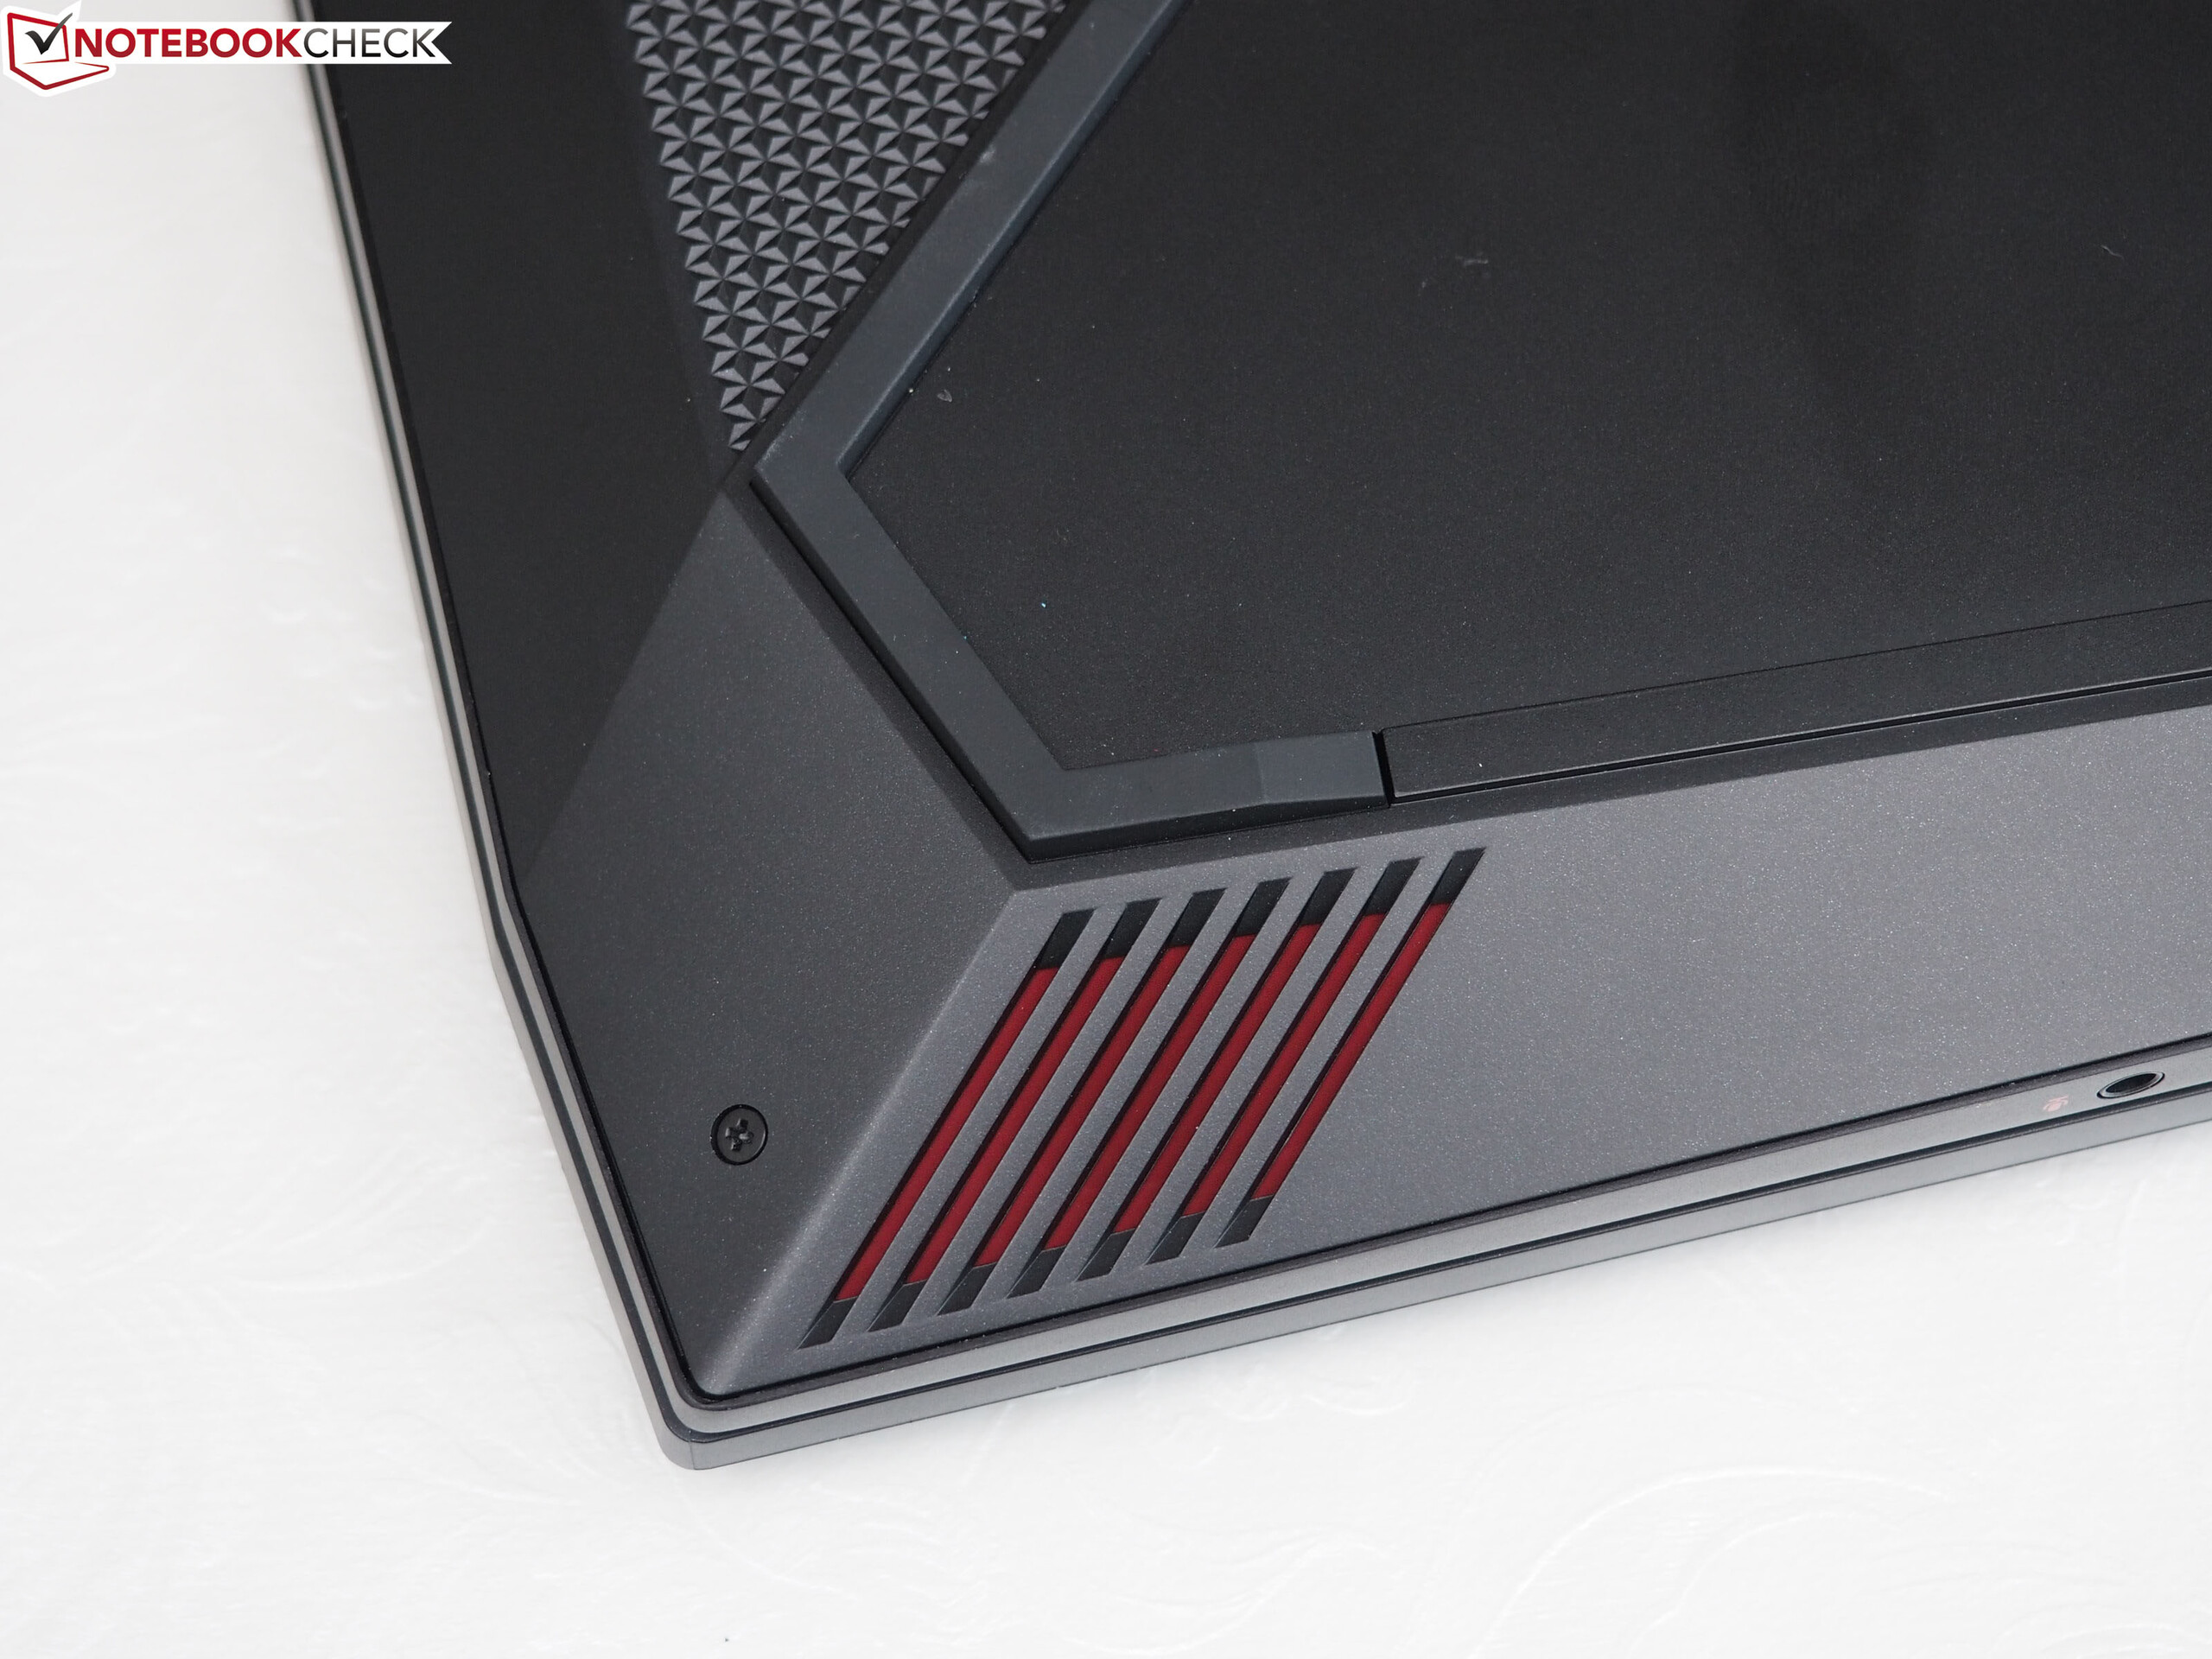
即便机身没有变得轻薄,但是它既有更高的稳定性,更好的输入配件,和更优雅的材料。惠普采用了比较奇特的外观设计,无论用户喜欢与否。撇开较慢的反应时间,其屏幕也是令人瞩目。
顶级配置的120赫兹显示屏,确保了视角的稳定性,高对比度,以及体面的色彩值。
同样,我们对扬声器也几乎没有任何抱怨。
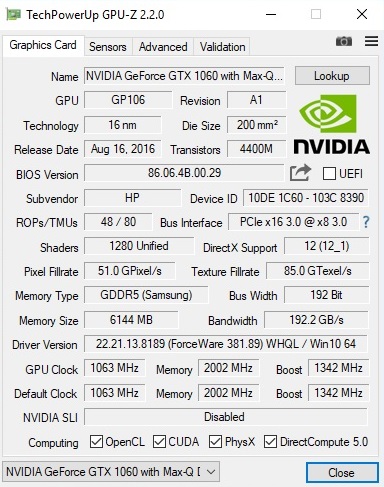
对于显卡,我们有些犹豫。实际生活中, Max-Q 设计 的作用非常的有限,另一方面,损失了接近于10%的性能,而不是将这些地方省下来,降低价格。采用 GTX 1060,其他运营商达到了相同或者是较少的排放量(温度,噪声)。
尽管如此,惠普成功地迈出了决定性的一步,所以也在前10排行榜获得了好位置。(轻薄游戏本表)。
注:本文是基于完整评测的缩减版本,阅读完整的英文评测,请点击这里。
HP Omen 15-ce002ng
- 07/20/2017 v6 (old)
Florian Glaser
Price comparison