雷蛇灵刃15标准版(i7-8750H,GTX 1060 Max-Q)笔记本电脑评测

| Networking | |
| iperf3 transmit AX12 | |
| Razer Blade 15 Base Model | |
| Razer Blade 15 2018 | |
| MSI GS65 Stealth Thin 8RE-051US | |
| HP Pavilion Gaming 15t-cx0000 | |
| iperf3 receive AX12 | |
| Razer Blade 15 2018 | |
| HP Pavilion Gaming 15t-cx0000 | |
| MSI GS65 Stealth Thin 8RE-051US | |
| Razer Blade 15 Base Model | |
| |||||||||||||||||||||||||
Brightness Distribution: 86 %
Center on Battery: 273.6 cd/m²
Contrast: 912:1 (Black: 0.3 cd/m²)
ΔE ColorChecker Calman: 3.22 | ∀{0.5-29.43 Ø4.73}
calibrated: 4.1
ΔE Greyscale Calman: 1.4 | ∀{0.09-98 Ø4.97}
86.2% sRGB (Argyll 1.6.3 3D)
56.4% AdobeRGB 1998 (Argyll 1.6.3 3D)
63.3% AdobeRGB 1998 (Argyll 3D)
86.6% sRGB (Argyll 3D)
66.3% Display P3 (Argyll 3D)
Gamma: 2.24
CCT: 6636 K
| Razer Blade 15 Base Model BOE NV156FHM-N61, IPS, 15.6", 1920x1080 | Razer Blade 15 GTX 1060 LGD05C0, IPS, 15.6", 1920x1080 | HP Pavilion Gaming 15t-cx0000 AU Optronics AUO82ED, IPS, 15.6", 1920x1080 | MSI GS65 Stealth Thin 8RE-051US AUO80ED, IPS, 15.6", 1920x1080 | Gigabyte Aero 15X v8 LGD05C0, IPS, 15.6", 1920x1080 | Apple MacBook Pro 15 2018 (2.6 GHz, 560X) APPA040, IPS, 15.4", 2880x1800 | |
|---|---|---|---|---|---|---|
| Display | 3% | 4% | 4% | 2% | 34% | |
| Display P3 Coverage (%) | 66.3 | 64.4 -3% | 66.5 0% | 65.8 -1% | 63.6 -4% | 98.7 49% |
| sRGB Coverage (%) | 86.6 | 93.4 8% | 91.7 6% | 92.1 6% | 93.8 8% | 99.9 15% |
| AdobeRGB 1998 Coverage (%) | 63.3 | 65.5 3% | 67.1 6% | 67 6% | 64.9 3% | 86.6 37% |
| Response Times | 66% | 62% | 58% | 63% | 1% | |
| Response Time Grey 50% / Grey 80% * (ms) | 39.2 ? | 13.6 ? 65% | 17.6 ? 55% | 20 ? 49% | 16.8 ? 57% | 43.2 ? -10% |
| Response Time Black / White * (ms) | 35.2 ? | 12 ? 66% | 11.2 ? 68% | 12 ? 66% | 11.2 ? 68% | 31.2 ? 11% |
| PWM Frequency (Hz) | 21190 ? | 117000 ? | ||||
| Screen | 11% | -8% | -12% | 21% | 42% | |
| Brightness middle (cd/m²) | 273.6 | 304.3 11% | 357.5 31% | 250.9 -8% | 313 14% | 520 90% |
| Brightness (cd/m²) | 262 | 293 12% | 351 34% | 257 -2% | 300 15% | 492 88% |
| Brightness Distribution (%) | 86 | 80 -7% | 85 -1% | 83 -3% | 78 -9% | 88 2% |
| Black Level * (cd/m²) | 0.3 | 0.38 -27% | 0.36 -20% | 0.32 -7% | 0.33 -10% | 0.39 -30% |
| Contrast (:1) | 912 | 801 -12% | 993 9% | 784 -14% | 948 4% | 1333 46% |
| Colorchecker dE 2000 * | 3.22 | 1.79 44% | 4.19 -30% | 2.77 14% | 1.29 60% | 1.2 63% |
| Colorchecker dE 2000 max. * | 7.61 | 3.69 52% | 6.97 8% | 5.89 23% | 2.04 73% | 2.3 70% |
| Colorchecker dE 2000 calibrated * | 4.1 | 3.2 22% | 2.5 39% | |||
| Greyscale dE 2000 * | 1.4 | 1.1 21% | 3.5 -150% | 4 -186% | 0.69 51% | 1.3 7% |
| Gamma | 2.24 98% | 2.27 97% | 2.324 95% | 2.27 97% | 2.43 91% | 2.18 101% |
| CCT | 6636 98% | 6665 98% | 7028 92% | 6901 94% | 6550 99% | 6738 96% |
| Color Space (Percent of AdobeRGB 1998) (%) | 56.4 | 59.8 6% | 60 6% | 60 6% | 60 6% | |
| Color Space (Percent of sRGB) (%) | 86.2 | 92.8 8% | 91 6% | 92 7% | 94 9% | |
| Total Average (Program / Settings) | 27% /
16% | 19% /
3% | 17% /
-0% | 29% /
23% | 26% /
34% |
* ... smaller is better
Display Response Times
| ↔ Response Time Black to White | ||
|---|---|---|
| 35.2 ms ... rise ↗ and fall ↘ combined | ↗ 20.4 ms rise | 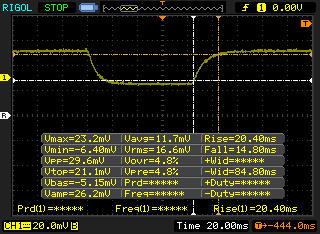 |
| ↘ 14.8 ms fall | ||
| The screen shows slow response rates in our tests and will be unsatisfactory for gamers. In comparison, all tested devices range from 0.1 (minimum) to 240 (maximum) ms. » 93 % of all devices are better. This means that the measured response time is worse than the average of all tested devices (19.9 ms). | ||
| ↔ Response Time 50% Grey to 80% Grey | ||
| 39.2 ms ... rise ↗ and fall ↘ combined | ↗ 19.6 ms rise | 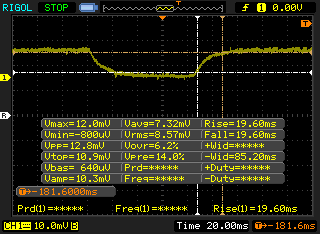 |
| ↘ 19.6 ms fall | ||
| The screen shows slow response rates in our tests and will be unsatisfactory for gamers. In comparison, all tested devices range from 0.165 (minimum) to 636 (maximum) ms. » 60 % of all devices are better. This means that the measured response time is worse than the average of all tested devices (31.1 ms). | ||
Screen Flickering / PWM (Pulse-Width Modulation)
| Screen flickering / PWM detected | 21190 Hz | ≤ 99 % brightness setting | 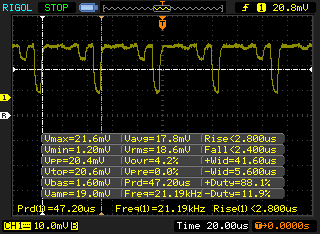 |
The display backlight flickers at 21190 Hz (worst case, e.g., utilizing PWM) Flickering detected at a brightness setting of 99 % and below. There should be no flickering or PWM above this brightness setting. The frequency of 21190 Hz is quite high, so most users sensitive to PWM should not notice any flickering. In comparison: 52 % of all tested devices do not use PWM to dim the display. If PWM was detected, an average of 7791 (minimum: 5 - maximum: 343500) Hz was measured. | |||
| PCMark 10 - Score | |
| MSI GT75 8RG-090 Titan | |
| Razer Blade 15 GTX 1060 | |
| Gigabyte Aero 15X v8 | |
| Razer Blade 15 2018 | |
| Average Intel Core i7-8750H, NVIDIA GeForce GTX 1060 Max-Q (4724 - 5285, n=4) | |
| Razer Blade 15 Base Model | |
| PCMark 8 | |
| Home Score Accelerated v2 | |
| MSI GT75 8RG-090 Titan | |
| Razer Blade 15 2018 | |
| Razer Blade 15 GTX 1060 | |
| Gigabyte Aero 15X v8 | |
| Razer Blade 15 Base Model | |
| Average Intel Core i7-8750H, NVIDIA GeForce GTX 1060 Max-Q (3968 - 4650, n=4) | |
| Razer Blade 14 2015 | |
| Work Score Accelerated v2 | |
| MSI GT75 8RG-090 Titan | |
| Razer Blade 15 GTX 1060 | |
| Gigabyte Aero 15X v8 | |
| Razer Blade 15 2018 | |
| Average Intel Core i7-8750H, NVIDIA GeForce GTX 1060 Max-Q (5308 - 5705, n=4) | |
| Razer Blade 15 Base Model | |
| Razer Blade 14 2015 | |
| Creative Score Accelerated v2 | |
| Razer Blade 14 2015 | |
| PCMark 8 Home Score Accelerated v2 | 4425 points | |
| PCMark 8 Work Score Accelerated v2 | 5395 points | |
| PCMark 10 Score | 4896 points | |
Help | ||
| Razer Blade 15 Base Model Samsung SSD PM981 MZVLB256HAHQ | Razer Blade 15 2018 Samsung PM961 NVMe MZVLW512HMJP | HP Pavilion Gaming 15t-cx0000 Samsung SSD PM981 MZVLB512HAJQ | MSI GS65 Stealth Thin 8RE-051US Samsung SSD PM981 MZVLB256HAHQ | Gigabyte Aero 15X v8 Toshiba NVMe THNSN5512GPU7 | Apple MacBook Pro 15 2018 (2.6 GHz, 560X) Apple SSD AP0512 | |
|---|---|---|---|---|---|---|
| AS SSD | 25% | 24% | -14% | -12% | -35% | |
| Copy Game MB/s (MB/s) | 1070 | |||||
| Copy Program MB/s (MB/s) | 495.5 | |||||
| Copy ISO MB/s (MB/s) | 1892 | |||||
| Score Total (Points) | 2952 | 3806 29% | 4113 39% | 2039 -31% | 2536 -14% | 2119 -28% |
| Score Write (Points) | 1499 | 1450 -3% | 2087 39% | 802 -46% | 939 -37% | 347 -77% |
| Score Read (Points) | 970 | 1584 63% | 1319 36% | 815 -16% | 1092 13% | 1199 24% |
| Access Time Write * (ms) | 0.04 | 0.038 5% | 0.038 5% | 0.045 -13% | 0.046 -15% | |
| Access Time Read * (ms) | 0.113 | 0.051 55% | 0.051 55% | 0.071 37% | 0.119 -5% | 0.225 -99% |
| 4K-64 Write (MB/s) | 1270 | 1204 -5% | 1808 42% | 570 -55% | 742 -42% | 163.5 -87% |
| 4K-64 Read (MB/s) | 749 | 1300 74% | 1160 55% | 611 -18% | 847 13% | 965 29% |
| 4K Write (MB/s) | 93 | 93.6 1% | 95.9 3% | 83.8 -10% | 80.4 -14% | 18.78 -80% |
| 4K Read (MB/s) | 40.75 | 46.45 14% | 35.03 -14% | 43.09 6% | 23.36 -43% | 9.46 -77% |
| Seq Write (MB/s) | 1367 | 1521 11% | 1829 34% | 1475 8% | 1163 -15% | 1644 20% |
| Seq Read (MB/s) | 1803 | 2376 32% | 1235 -32% | 1612 -11% | 2213 23% | 2239 24% |
* ... smaller is better

| 3DMark | |
| 1280x720 Cloud Gate Standard Graphics | |
| MSI GT75 8RG-090 Titan | |
| Razer Blade Pro 2017 | |
| Razer Blade 15 2018 | |
| Razer Blade 15 Base Model | |
| Nvidia GeForce GTX 1060 Founders Edition 6 GB | |
| Razer Blade Pro RZ09-0220 | |
| Average NVIDIA GeForce GTX 1060 Max-Q (42781 - 81720, n=10) | |
| Lenovo Legion Y730-17ICH, i7-8750H | |
| MSI GF63 8RC | |
| Razer Blade 14 2015 | |
| Apple MacBook Pro 15 2018 (2.6 GHz, 560X) | |
| 1920x1080 Fire Strike Graphics | |
| MSI GT75 8RG-090 Titan | |
| Razer Blade Pro 2017 | |
| Razer Blade 15 2018 | |
| Nvidia GeForce GTX 1060 Founders Edition 6 GB | |
| Razer Blade 15 Base Model | |
| Razer Blade Pro RZ09-0220 | |
| Average NVIDIA GeForce GTX 1060 Max-Q (9992 - 11366, n=10) | |
| Lenovo Legion Y730-17ICH, i7-8750H | |
| Razer Blade 14 2015 | |
| MSI GF63 8RC | |
| Apple MacBook Pro 15 2018 (2.6 GHz, 560X) | |
| 3DMark 11 | |
| 1280x720 Performance GPU | |
| MSI GT75 8RG-090 Titan | |
| Razer Blade Pro 2017 | |
| Razer Blade 15 2018 | |
| Nvidia GeForce GTX 1060 Founders Edition 6 GB | |
| Razer Blade 15 Base Model | |
| Razer Blade Pro RZ09-0220 | |
| Average NVIDIA GeForce GTX 1060 Max-Q (12970 - 14487, n=10) | |
| Razer Blade 14 2015 | |
| MSI GF63 8RC | |
| Apple MacBook Pro 15 2018 (2.6 GHz, 560X) | |
| 1280x720 Performance Combined | |
| MSI GT75 8RG-090 Titan | |
| Nvidia GeForce GTX 1060 Founders Edition 6 GB | |
| Razer Blade Pro 2017 | |
| Razer Blade 15 Base Model | |
| Average NVIDIA GeForce GTX 1060 Max-Q (6212 - 11735, n=10) | |
| Razer Blade Pro RZ09-0220 | |
| Razer Blade 15 2018 | |
| Razer Blade 14 2015 | |
| MSI GF63 8RC | |
| Apple MacBook Pro 15 2018 (2.6 GHz, 560X) | |
| 3DMark 11 Performance | 12856 points | |
| 3DMark Cloud Gate Standard Score | 25931 points | |
| 3DMark Fire Strike Score | 9851 points | |
Help | ||
| low | med. | high | ultra | |
|---|---|---|---|---|
| BioShock Infinite (2013) | 288 | 224 | 213.4 | 112 |
| The Witcher 3 (2015) | 204.9 | 134.7 | 71.4 | 38.5 |
| Rise of the Tomb Raider (2016) | 183.7 | 133.3 | 73.3 | 66.4 |
Noise level
| Idle |
| 31 / 31.2 / 31.3 dB(A) |
| Load |
| 47.2 / 44.3 dB(A) |
 | ||
30 dB silent 40 dB(A) audible 50 dB(A) loud |
||
min: | ||
| Razer Blade 15 Base Model GeForce GTX 1060 Max-Q, i7-8750H, Samsung SSD PM981 MZVLB256HAHQ | Razer Blade 15 2018 GeForce GTX 1070 Max-Q, i7-8750H, Samsung PM961 NVMe MZVLW512HMJP | Razer Blade 15 GTX 1060 GeForce GTX 1060 Max-Q, i7-8750H, Samsung SSD PM981 MZVLB512HAJQ | HP Pavilion Gaming 15t-cx0000 GeForce GTX 1060 Max-Q, i7-8750H, Samsung SSD PM981 MZVLB512HAJQ | MSI GS65 Stealth Thin 8RE-051US GeForce GTX 1060 Mobile, i7-8750H, Samsung SSD PM981 MZVLB256HAHQ | Gigabyte Aero 15X v8 GeForce GTX 1070 Max-Q, i7-8750H, Toshiba NVMe THNSN5512GPU7 | Apple MacBook Pro 15 2018 (2.6 GHz, 560X) Radeon Pro 560X, i7-8850H, Apple SSD AP0512 | |
|---|---|---|---|---|---|---|---|
| Noise | -2% | 2% | 1% | 5% | -5% | 4% | |
| off / environment * (dB) | 27.8 | 29 -4% | 28.1 -1% | 28.3 -2% | 28.4 -2% | 29 -4% | 29.6 -6% |
| Idle Minimum * (dB) | 31 | 29 6% | 28.1 9% | 32.2 -4% | 28.4 8% | 30 3% | 30.1 3% |
| Idle Average * (dB) | 31.2 | 30 4% | 33 -6% | 32.4 -4% | 28.4 9% | 31 1% | 30.1 4% |
| Idle Maximum * (dB) | 31.3 | 38 -21% | 33.5 -7% | 32.4 -4% | 29.6 5% | 35 -12% | 30.1 4% |
| Load Average * (dB) | 47.2 | 46 3% | 42.2 11% | 40.2 15% | 43.5 8% | 49 -4% | 46.8 1% |
| Witcher 3 ultra * (dB) | 51.3 | 49 4% | 45.3 12% | 45 12% | 45.7 11% | 51 1% | 36 30% |
| Load Maximum * (dB) | 44.3 | 46 -4% | 45.7 -3% | 47.2 -7% | 45.7 -3% | 54 -22% | 46.8 -6% |
* ... smaller is better
(-) The maximum temperature on the upper side is 45.2 °C / 113 F, compared to the average of 40.4 °C / 105 F, ranging from 21.2 to 68.8 °C for the class Gaming.
(-) The bottom heats up to a maximum of 46.4 °C / 116 F, compared to the average of 43.2 °C / 110 F
(+) In idle usage, the average temperature for the upper side is 26.6 °C / 80 F, compared to the device average of 33.9 °C / 93 F.
(±) Playing The Witcher 3, the average temperature for the upper side is 36.1 °C / 97 F, compared to the device average of 33.9 °C / 93 F.
(+) The palmrests and touchpad are reaching skin temperature as a maximum (33.8 °C / 92.8 F) and are therefore not hot.
(-) The average temperature of the palmrest area of similar devices was 28.8 °C / 83.8 F (-5 °C / -9 F).
| Off / Standby | |
| Idle | |
| Load |
|
Key:
min: | |
| Razer Blade 15 Base Model i7-8750H, GeForce GTX 1060 Max-Q, Samsung SSD PM981 MZVLB256HAHQ, IPS, 1920x1080, 15.6" | Razer Blade 15 2018 i7-8750H, GeForce GTX 1070 Max-Q, Samsung PM961 NVMe MZVLW512HMJP, IPS, 1920x1080, 15.6" | HP Pavilion Gaming 15t-cx0000 i7-8750H, GeForce GTX 1060 Max-Q, Samsung SSD PM981 MZVLB512HAJQ, IPS, 1920x1080, 15.6" | MSI GS65 Stealth Thin 8RE-051US i7-8750H, GeForce GTX 1060 Mobile, Samsung SSD PM981 MZVLB256HAHQ, IPS, 1920x1080, 15.6" | Gigabyte Aero 15X v8 i7-8750H, GeForce GTX 1070 Max-Q, Toshiba NVMe THNSN5512GPU7, IPS, 1920x1080, 15.6" | Apple MacBook Pro 15 2018 (2.6 GHz, 560X) i7-8850H, Radeon Pro 560X, Apple SSD AP0512, IPS, 2880x1800, 15.4" | |
|---|---|---|---|---|---|---|
| Power Consumption | -23% | 17% | 0% | -24% | 30% | |
| Idle Minimum * (Watt) | 10.2 | 14 -37% | 6 41% | 8.7 15% | 14 -37% | 3.4 67% |
| Idle Average * (Watt) | 13.2 | 17 -29% | 11.2 15% | 13 2% | 18 -36% | 11 17% |
| Idle Maximum * (Watt) | 17.6 | 21 -19% | 13.3 24% | 14.3 19% | 22 -25% | 14.9 15% |
| Load Average * (Watt) | 99.5 | 95 5% | 89.2 10% | 107.4 -8% | 91 9% | 78.9 21% |
| Witcher 3 ultra * (Watt) | 113.6 | 141 -24% | 101.9 10% | 129 -14% | 142 -25% | |
| Load Maximum * (Watt) | 133.3 | 179 -34% | 134.5 -1% | 151.5 -14% | 173 -30% | 91.2 32% |
* ... smaller is better
| Razer Blade 15 Base Model i7-8750H, GeForce GTX 1060 Max-Q, 65 Wh | Razer Blade 15 GTX 1060 i7-8750H, GeForce GTX 1060 Max-Q, 80 Wh | HP Pavilion Gaming 15t-cx0000 i7-8750H, GeForce GTX 1060 Max-Q, 70 Wh | MSI GS65 Stealth Thin 8RE-051US i7-8750H, GeForce GTX 1060 Mobile, 82 Wh | Gigabyte Aero 15X v8 i7-8750H, GeForce GTX 1070 Max-Q, 94.24 Wh | Apple MacBook Pro 15 2018 (2.6 GHz, 560X) i7-8850H, Radeon Pro 560X, 83 Wh | |
|---|---|---|---|---|---|---|
| Battery runtime | 22% | -3% | -4% | 46% | 85% | |
| Reader / Idle (h) | 11.5 | 8 -30% | 12.7 10% | |||
| WiFi v1.3 (h) | 5.5 | 6.7 22% | 6.3 15% | 6.2 13% | 8.6 56% | 10.2 85% |
| Load (h) | 1.5 | 1.6 7% | 1.2 -20% | 2.6 73% | ||
| Witcher 3 ultra (h) | 1.5 |
Pros
Cons
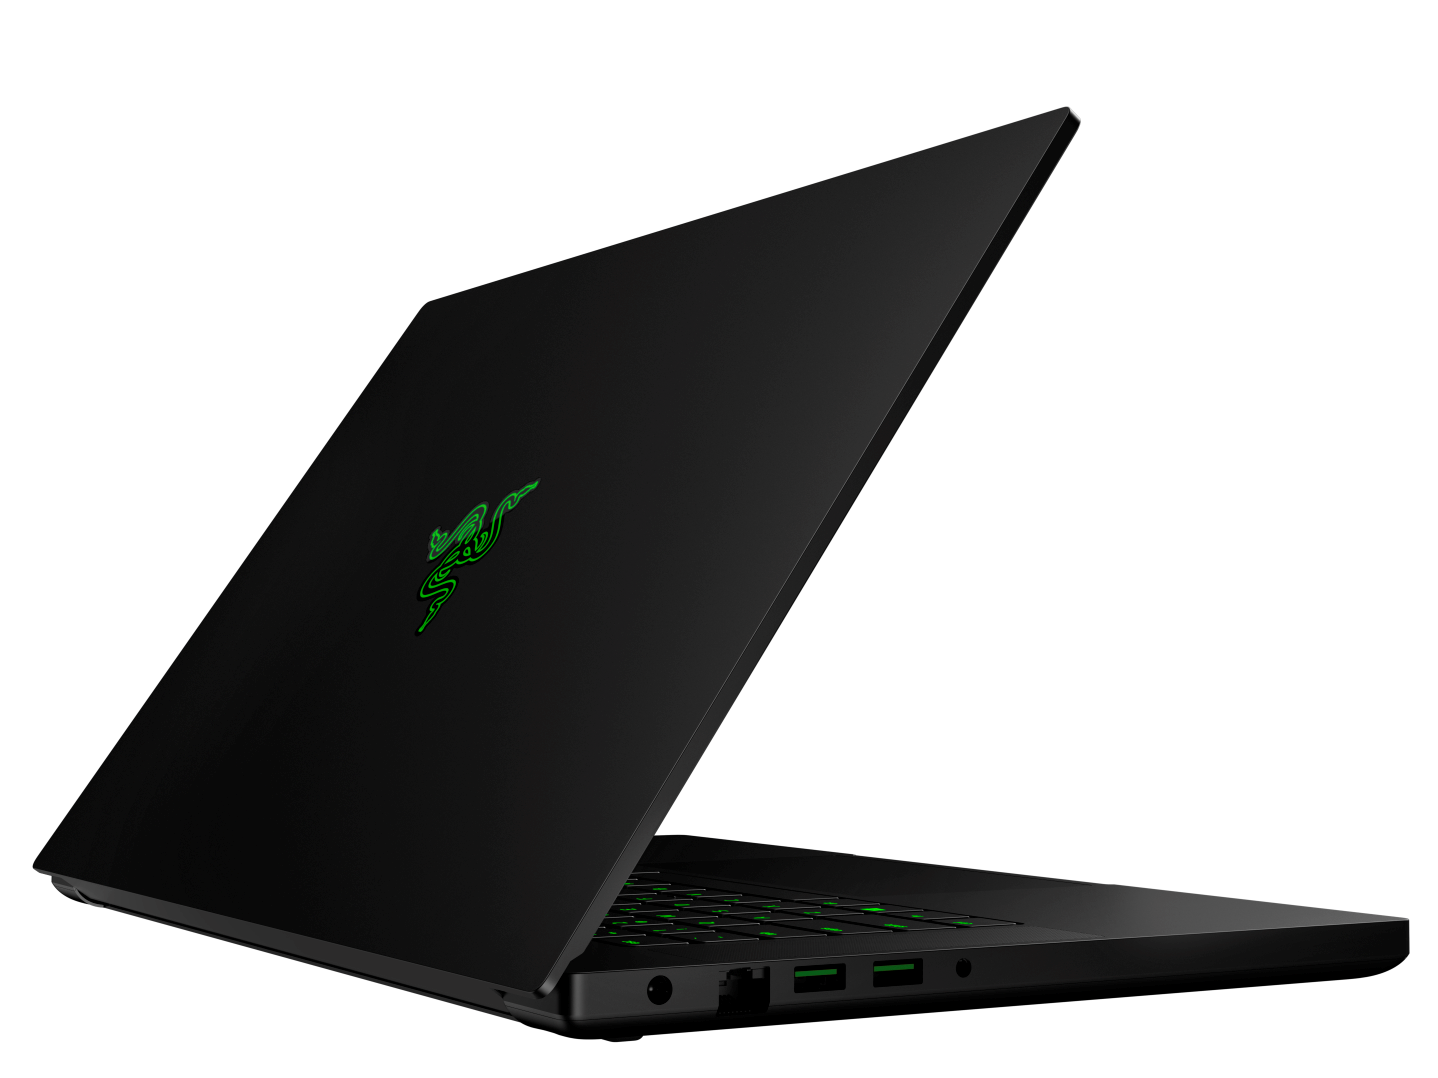
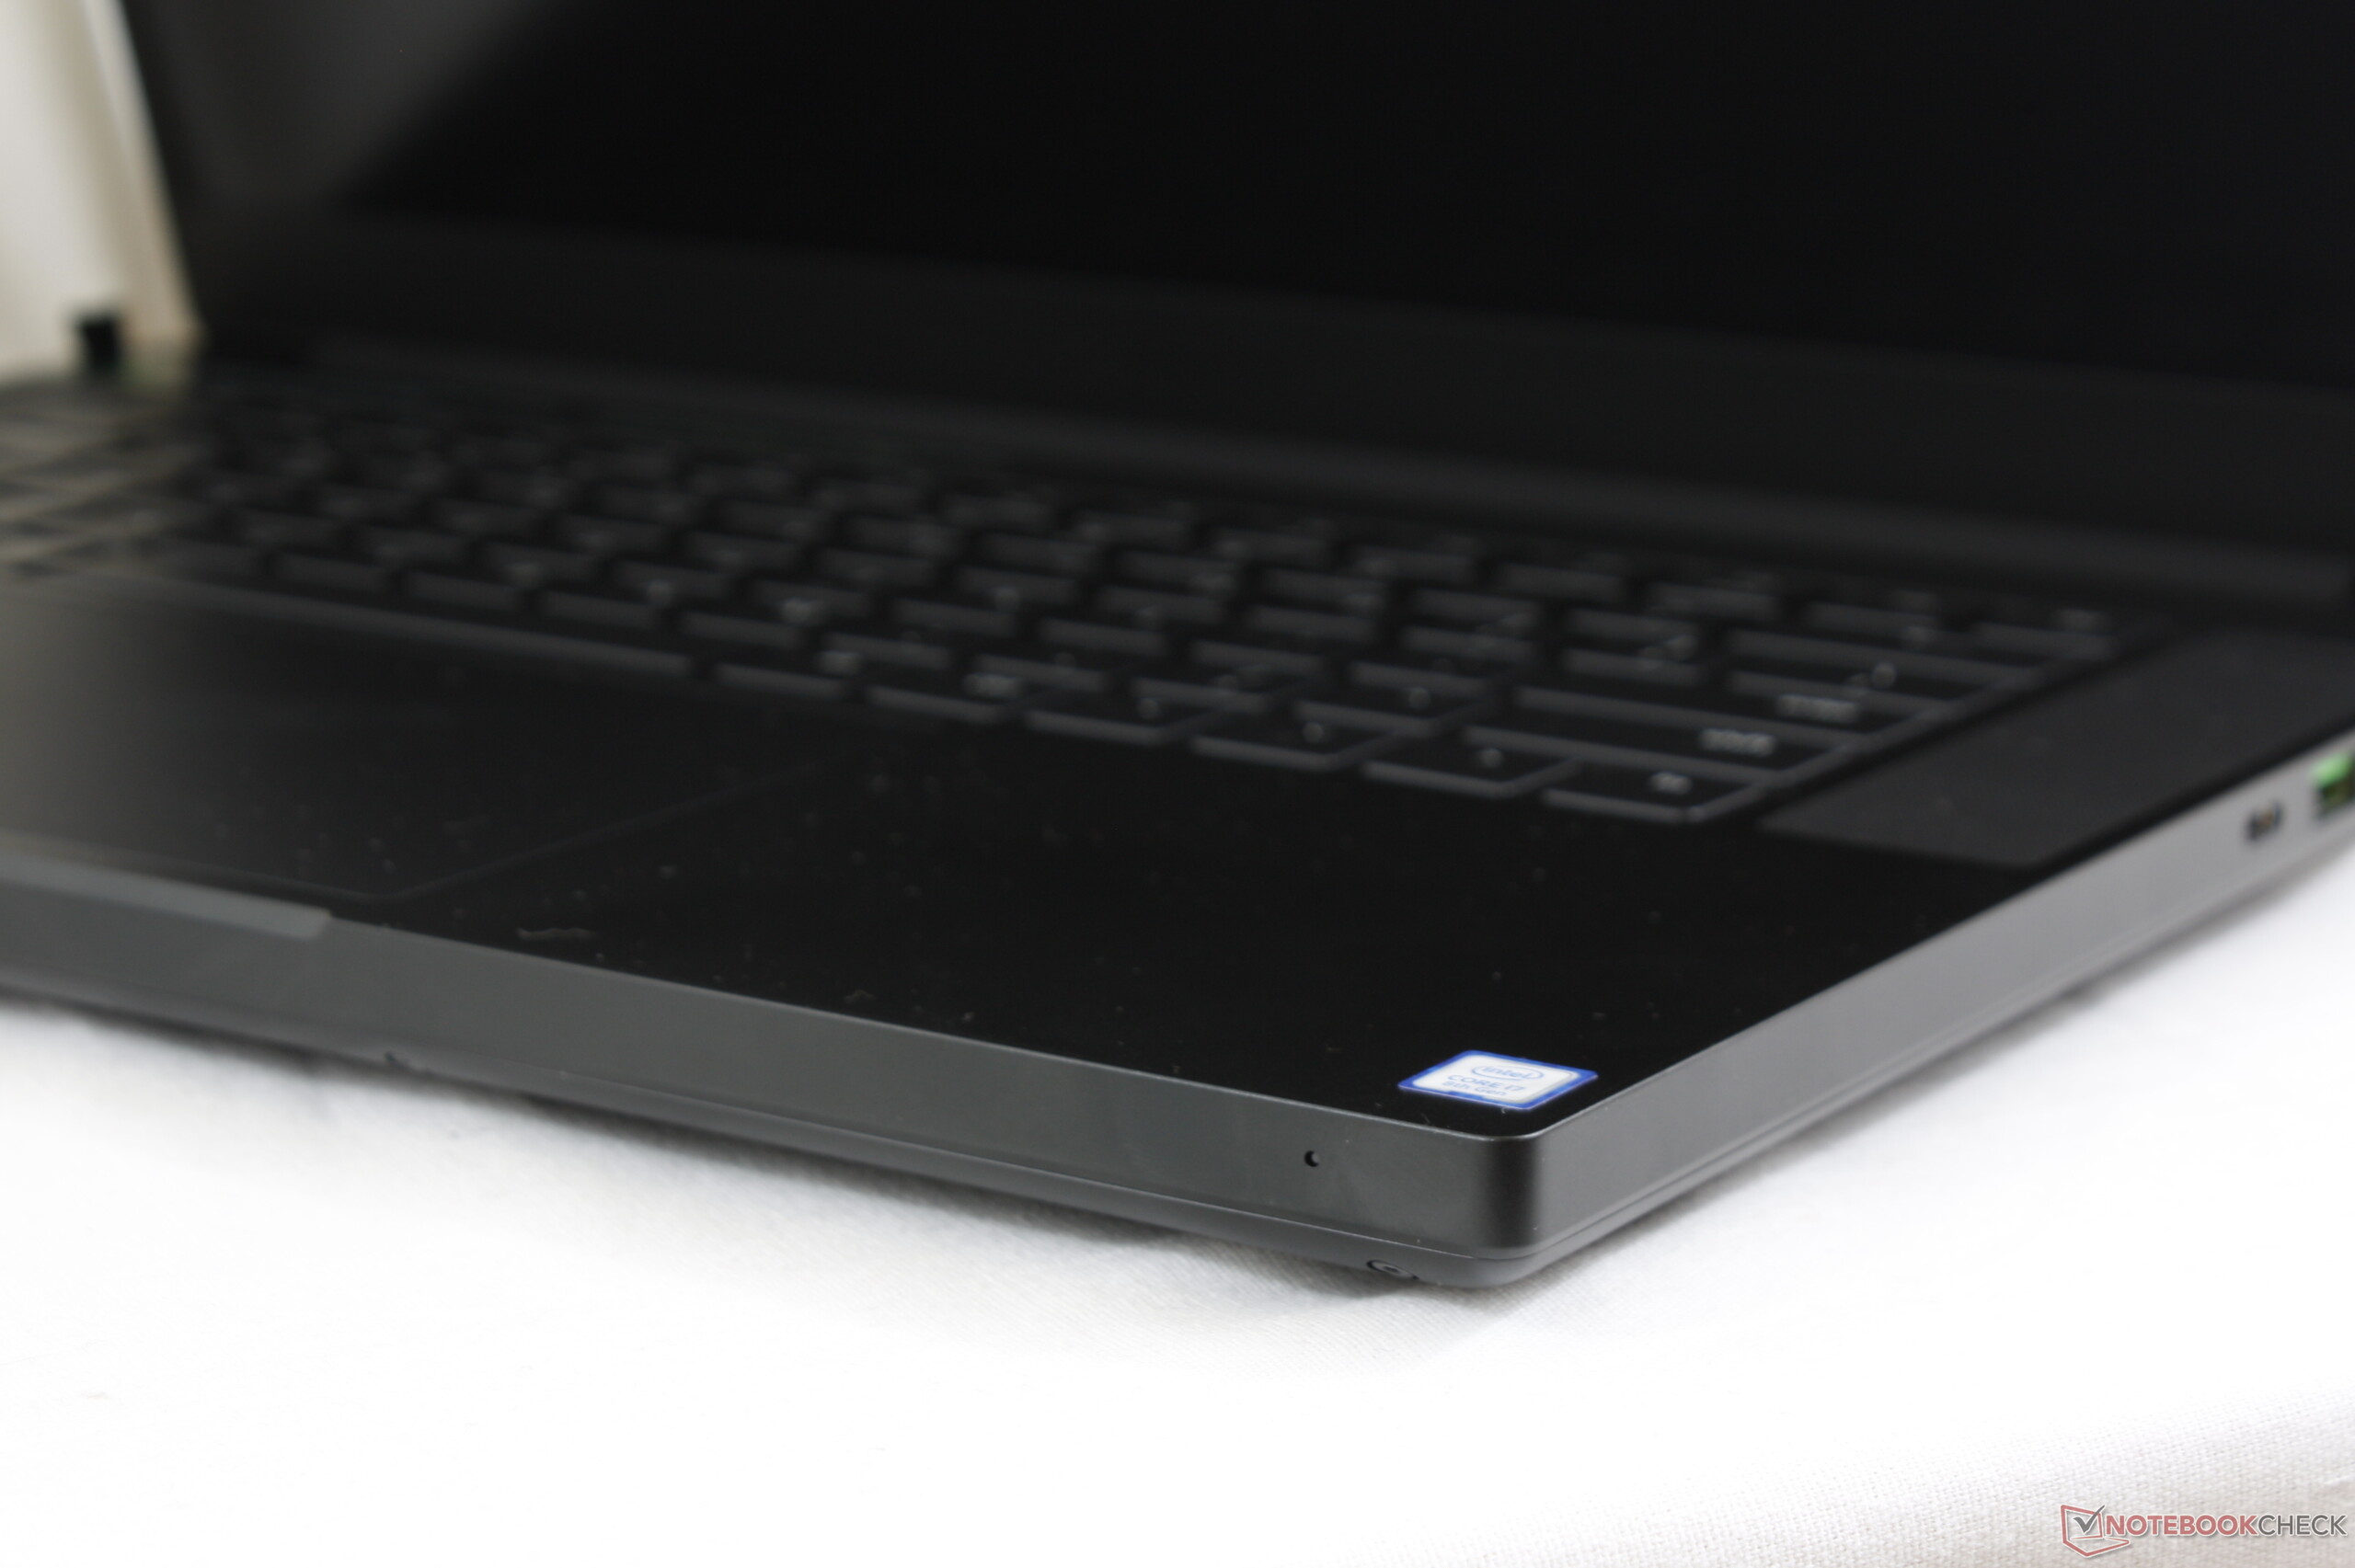
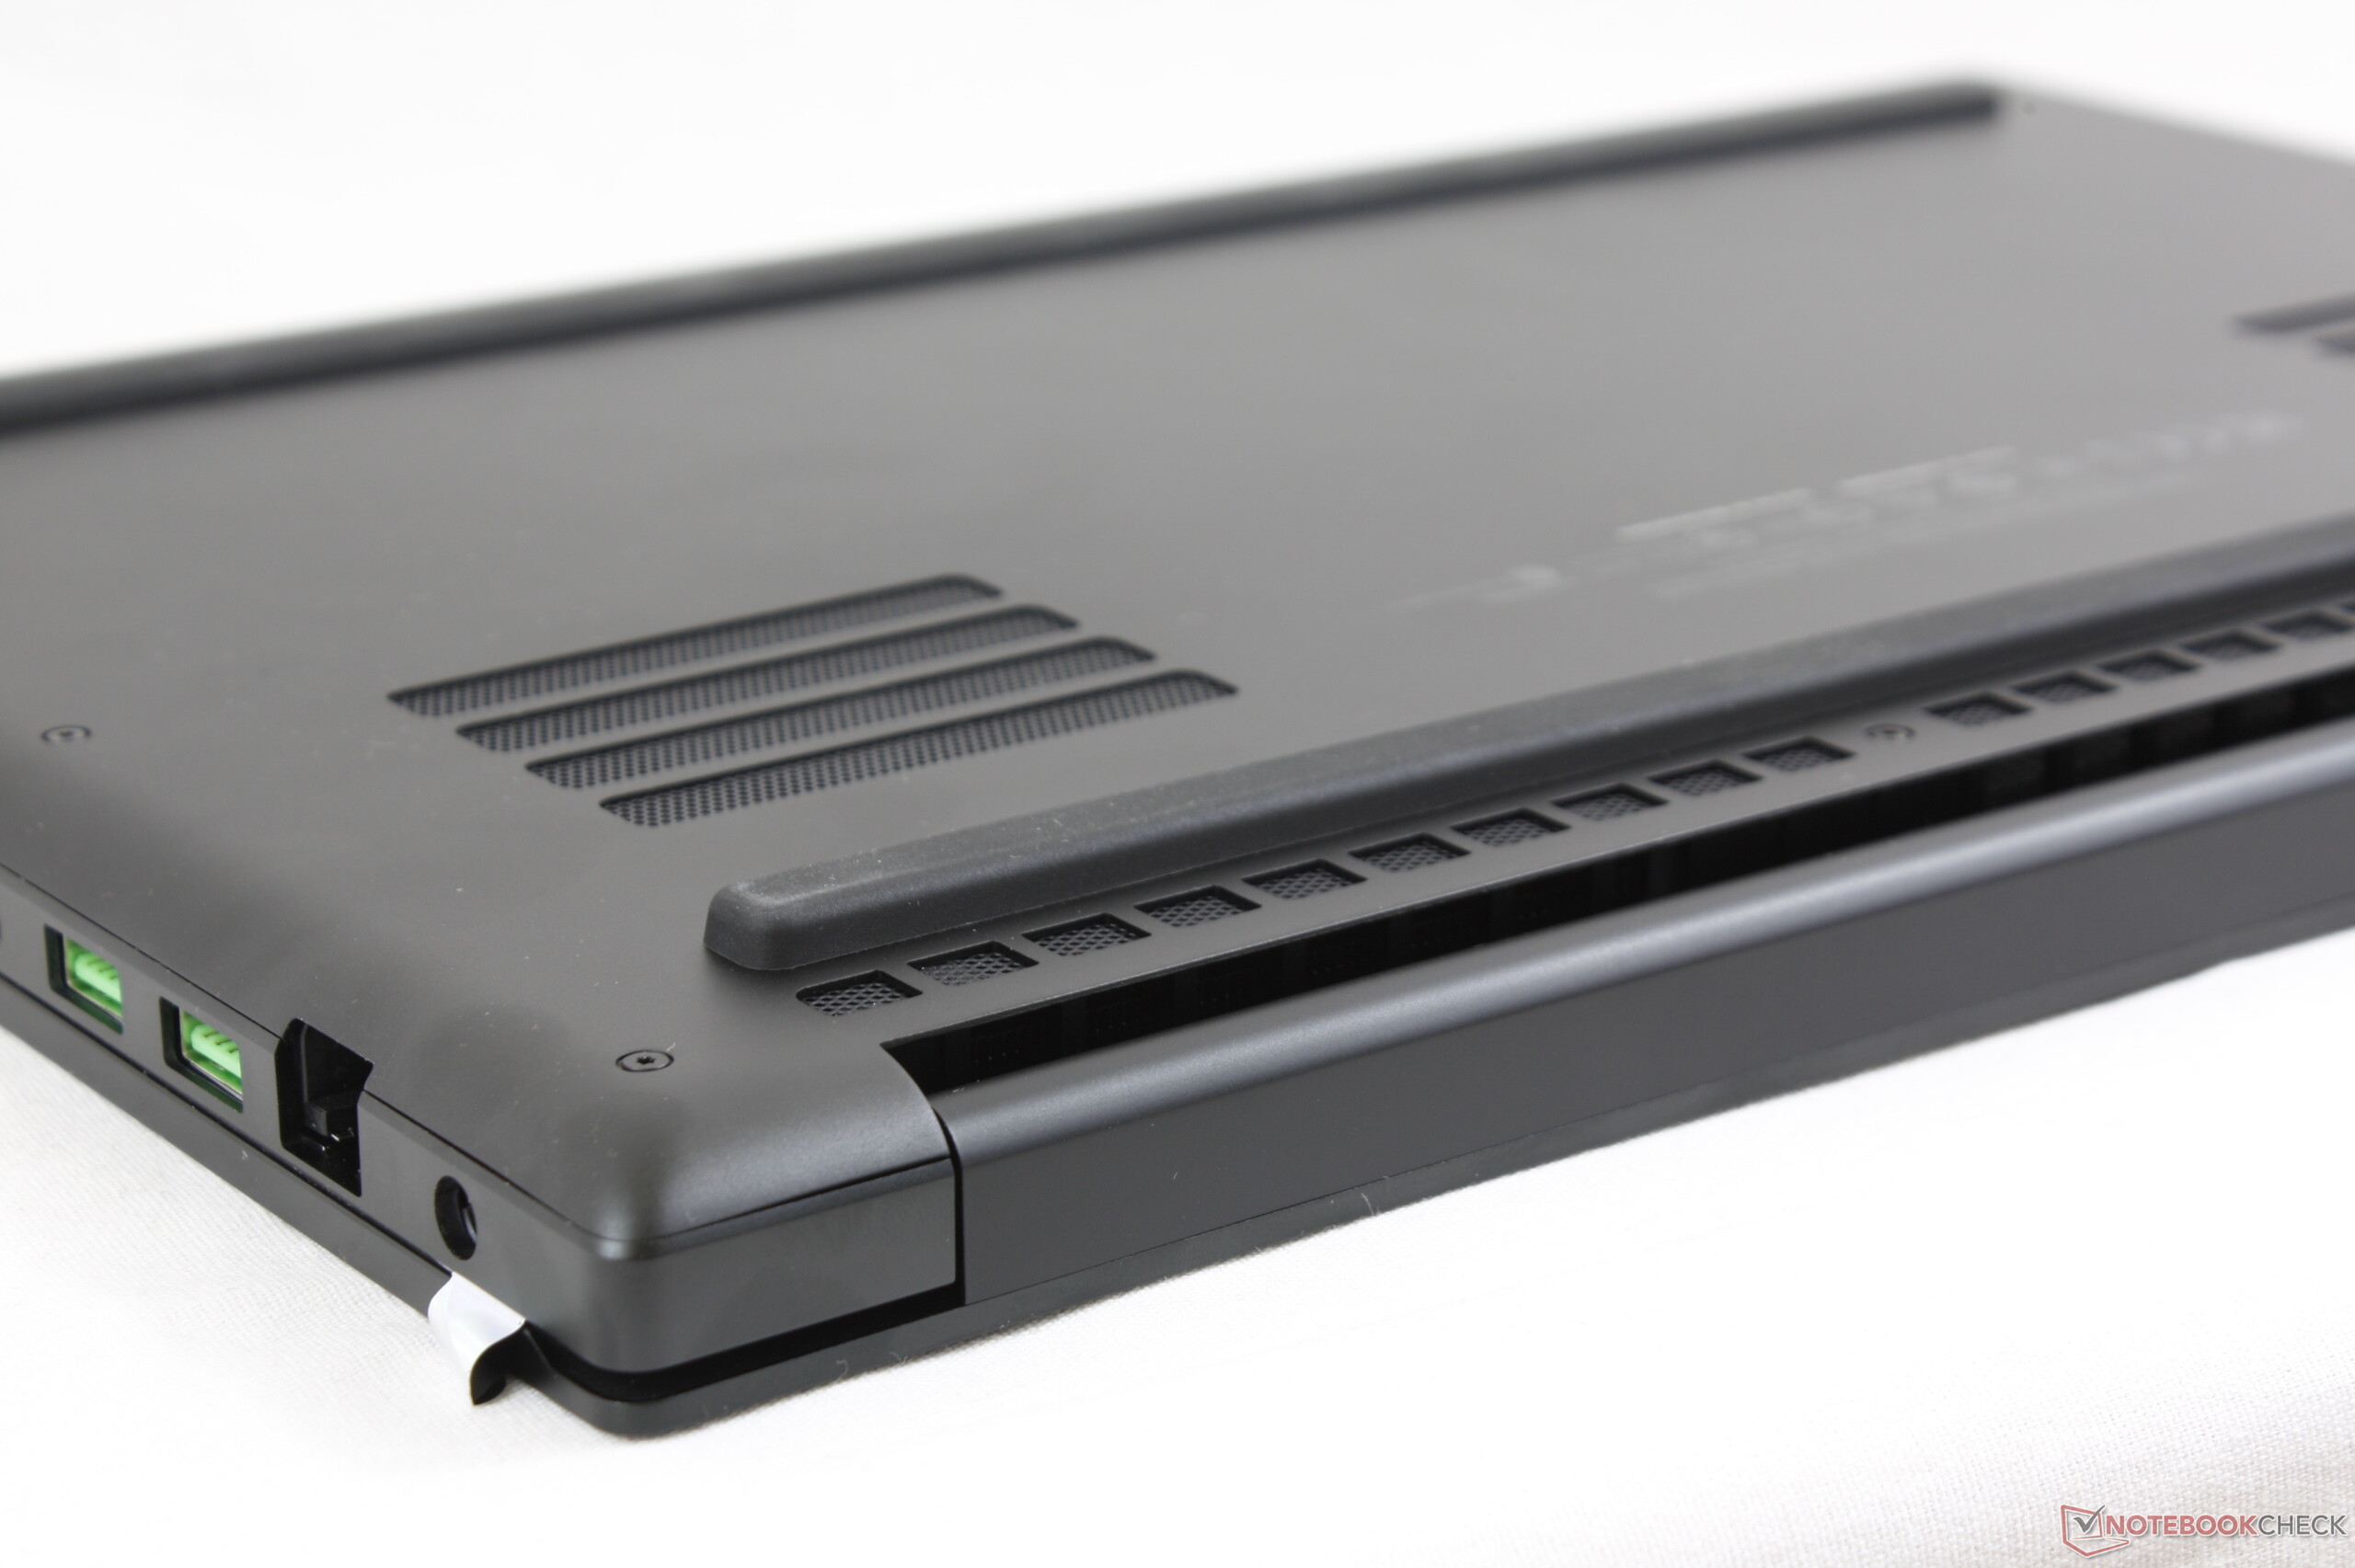
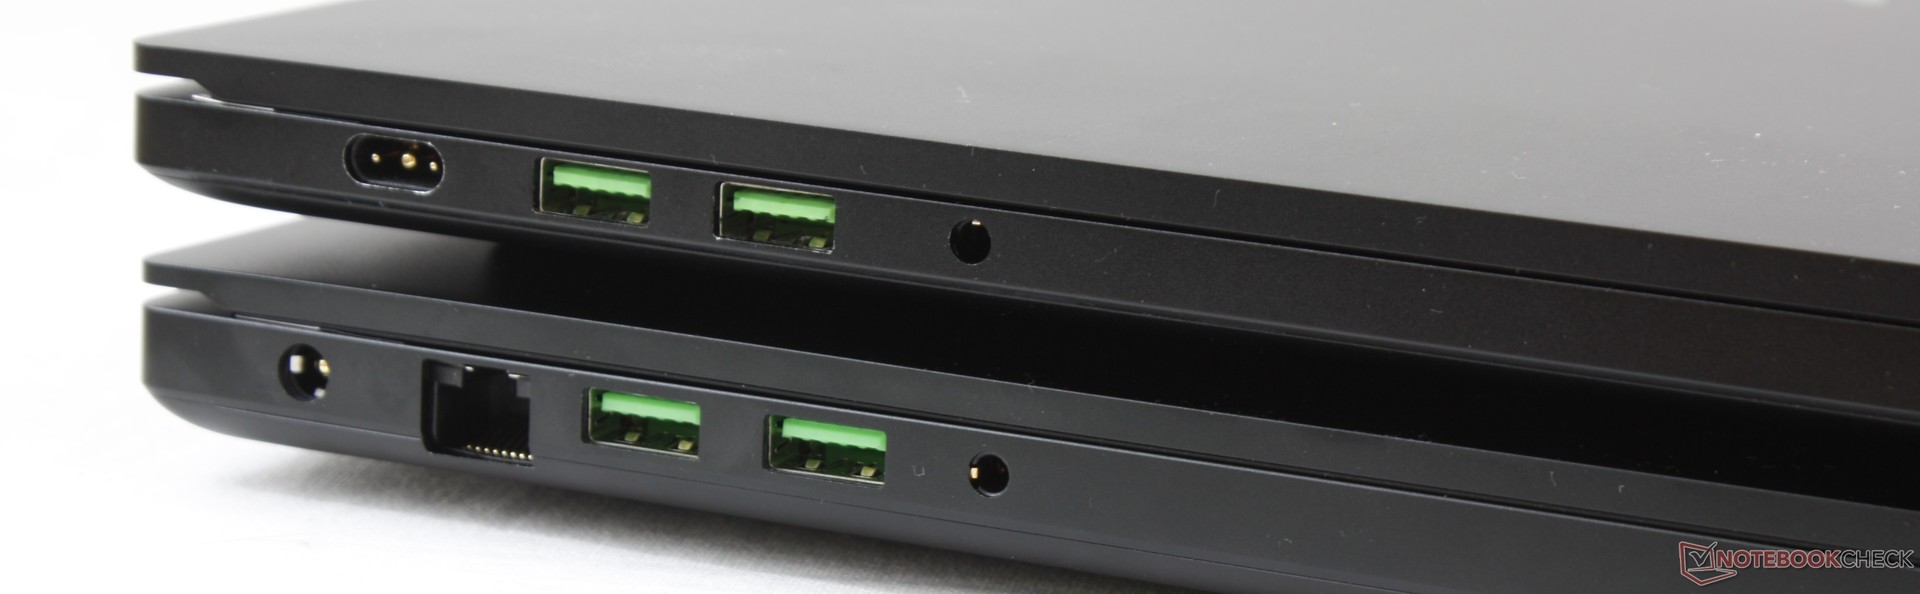
当买家看到“标准版”时,他们可能觉得会比“高级版”性能更差且功能更少,但事实是,标准版和高级版性能相同,而且后者缺少了2.5英寸硬盘和RJ-45网线接口。事实上,标准版更轻,散热更好。无论哪个版本,买家得到的都是时尚的外观设计和优秀的机身做工。
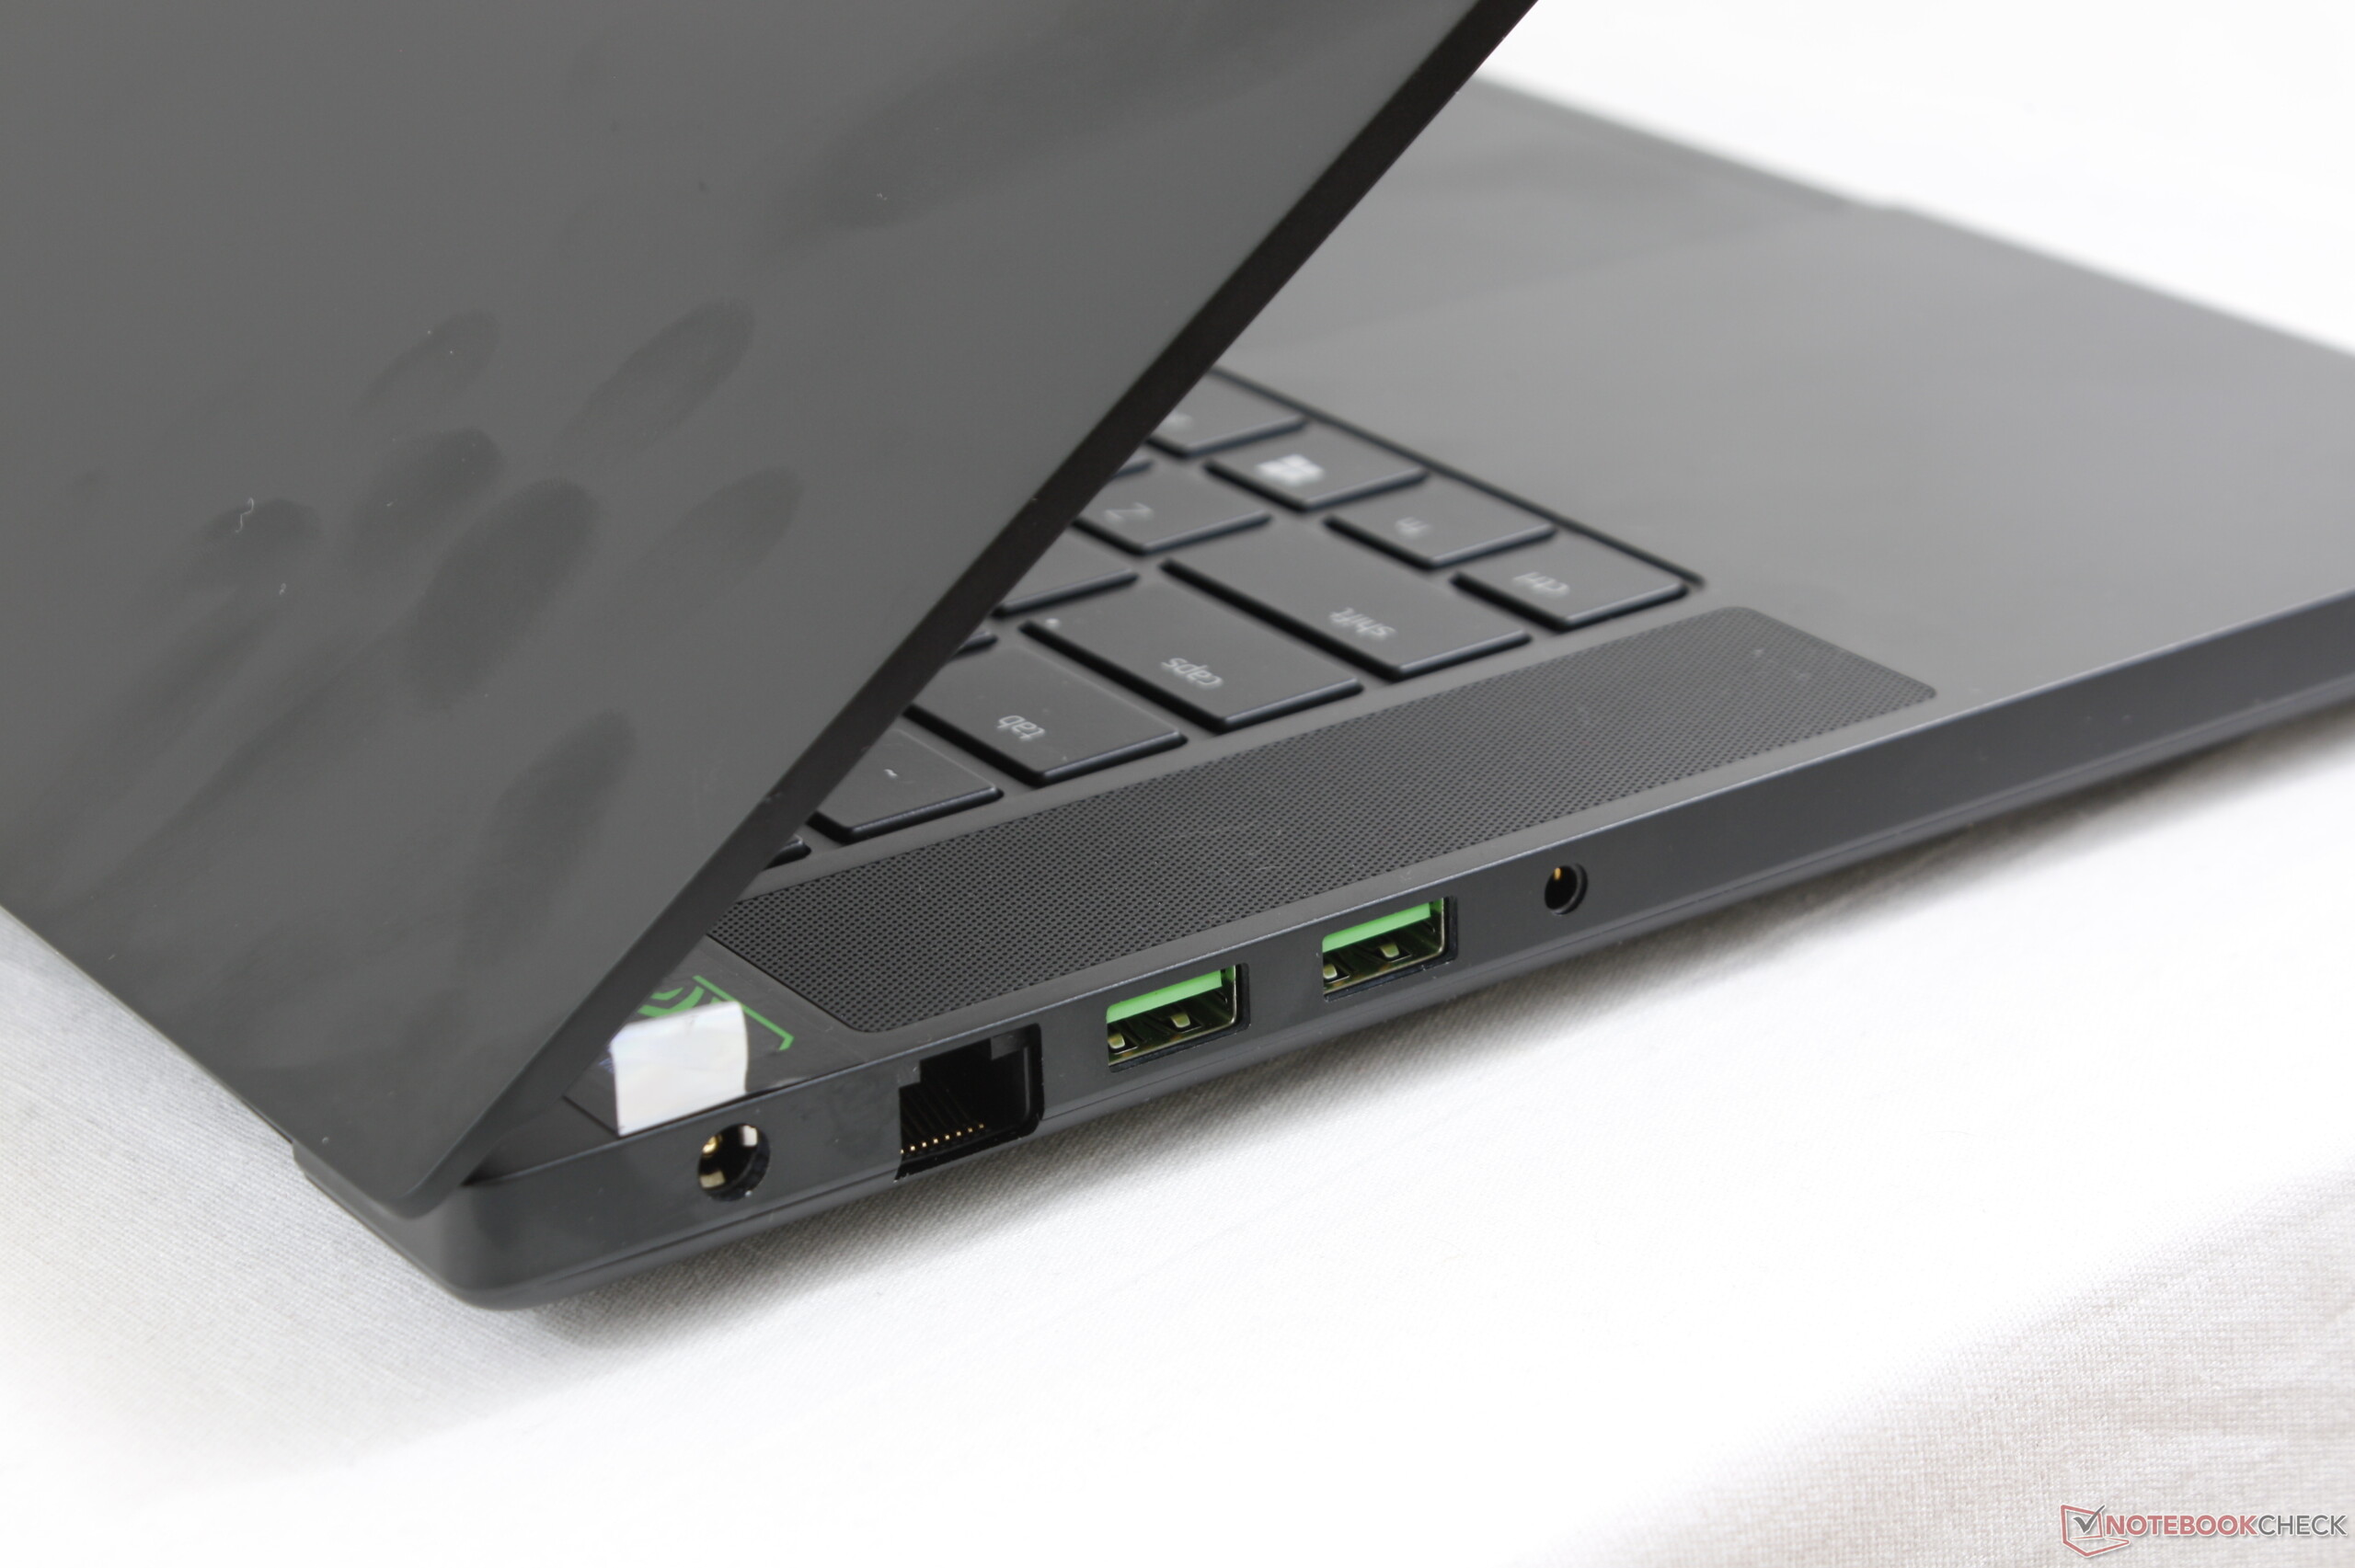
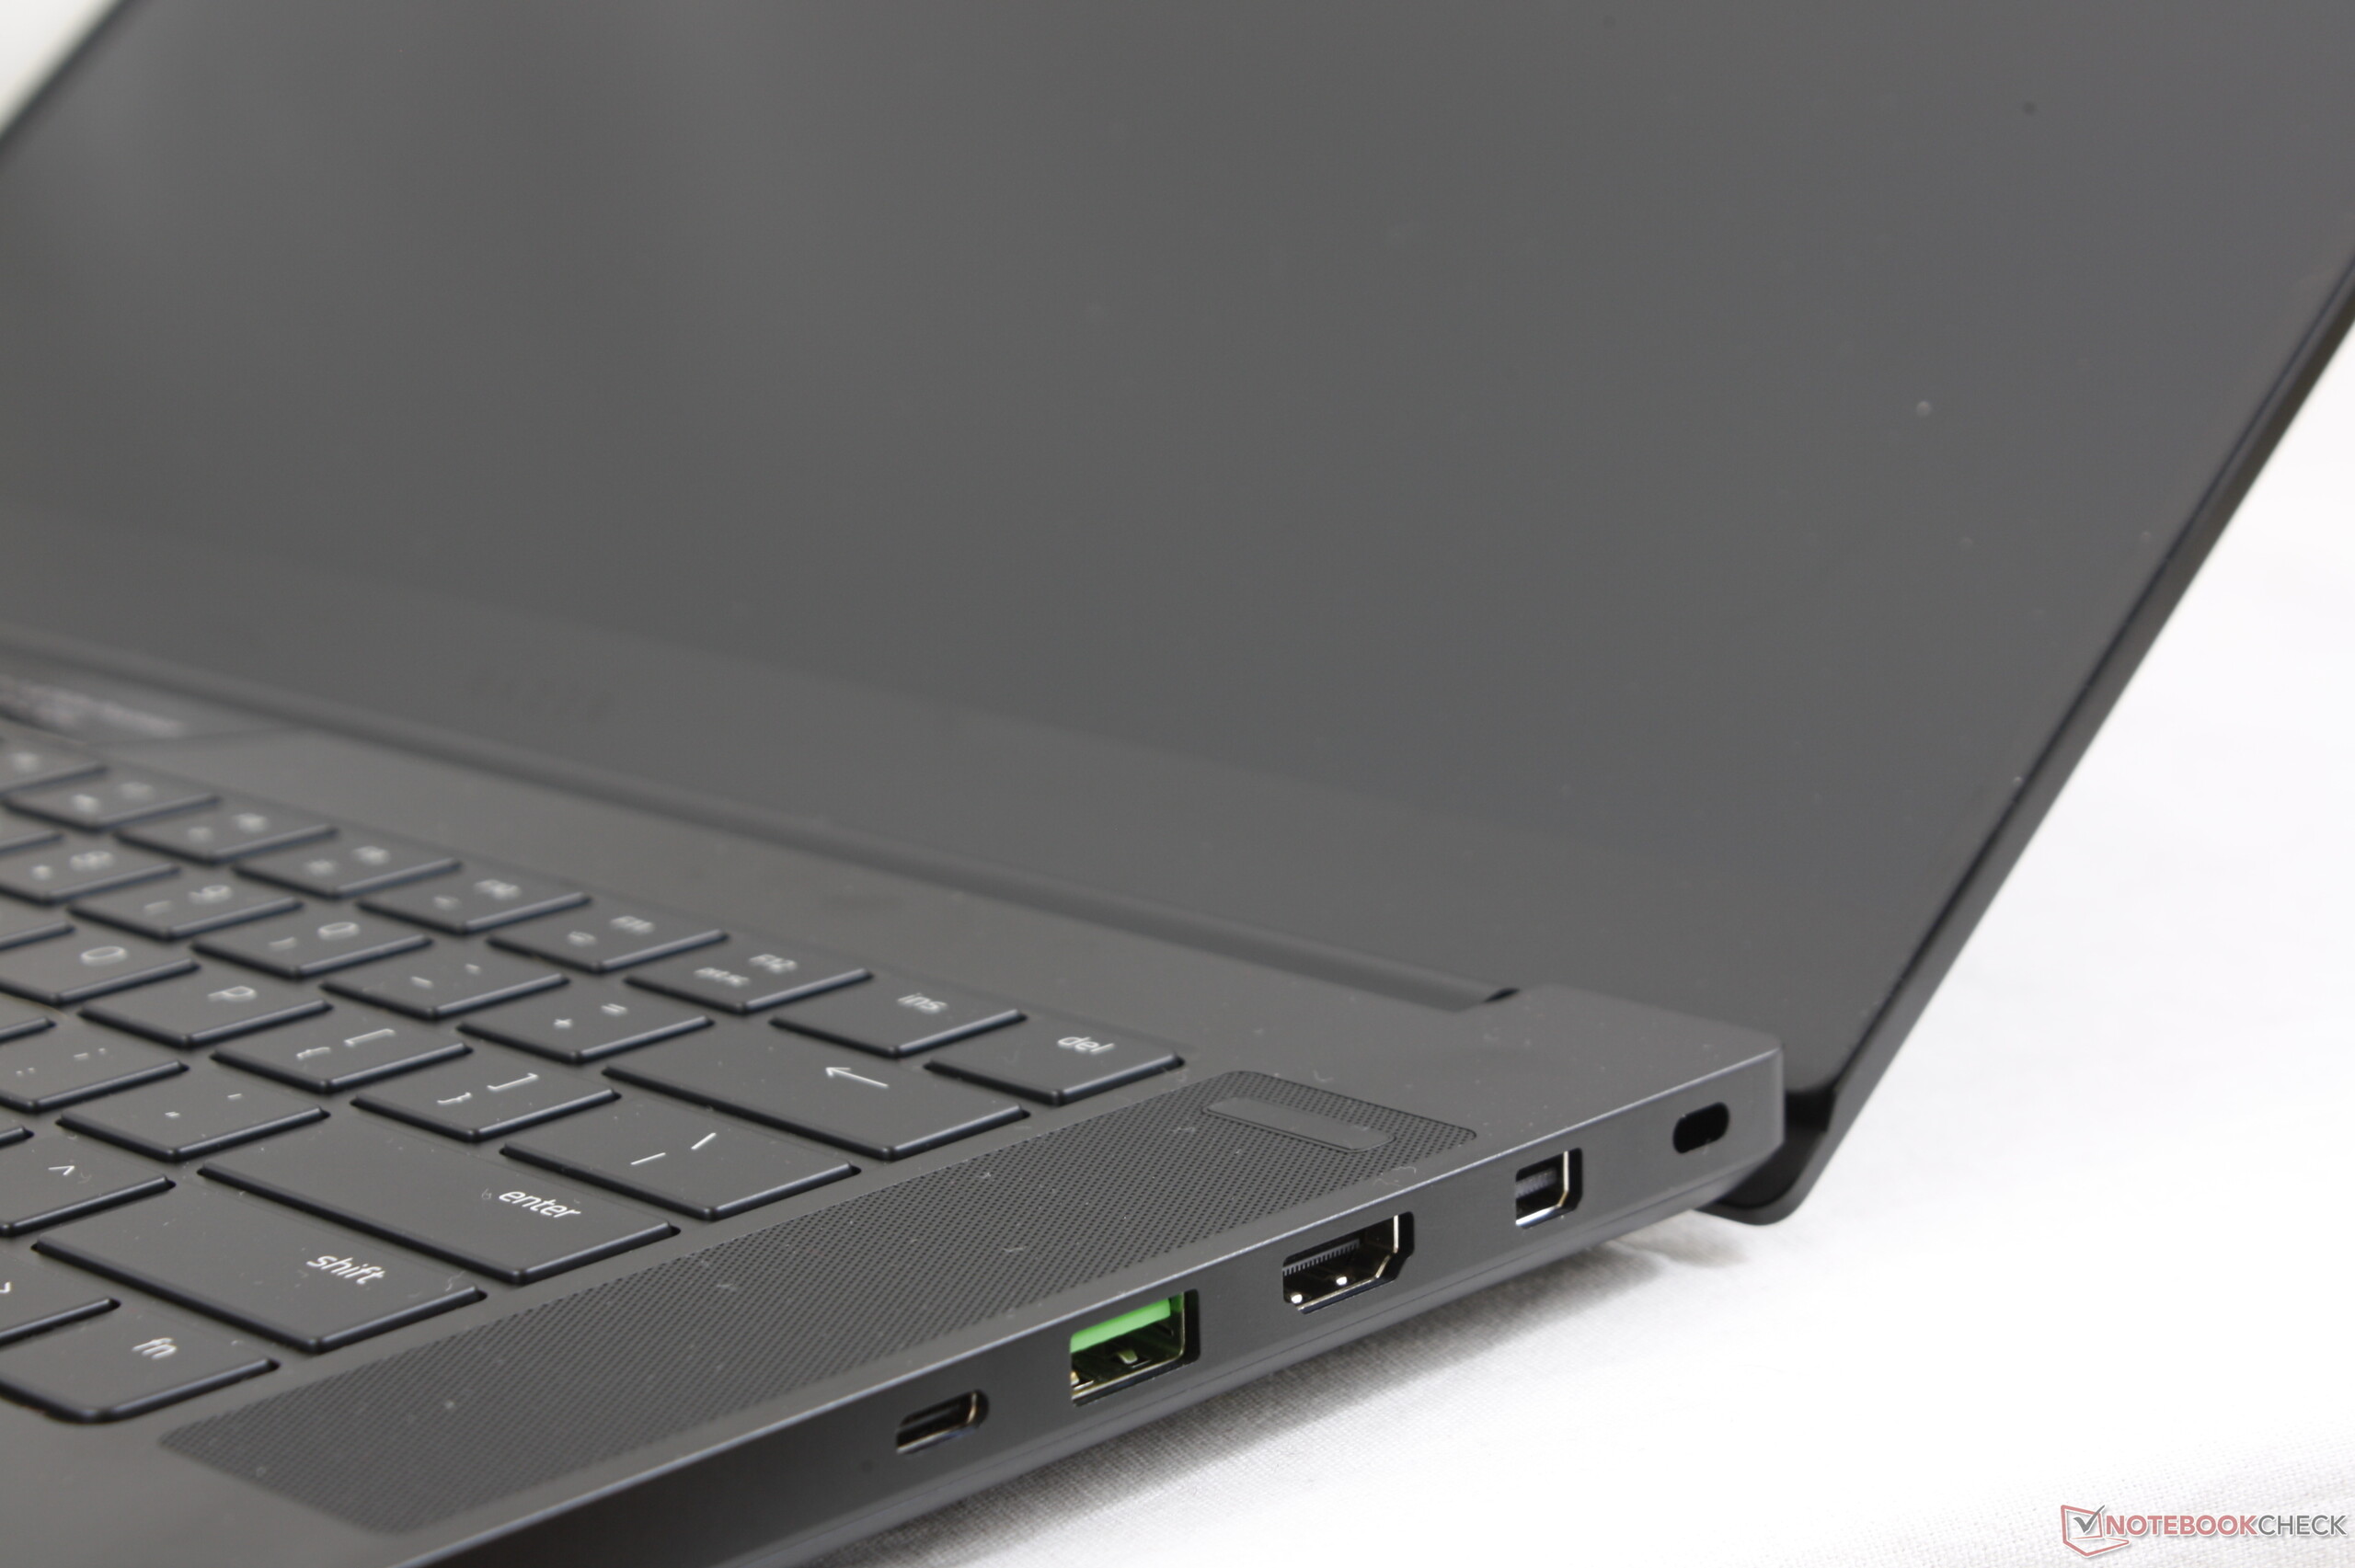
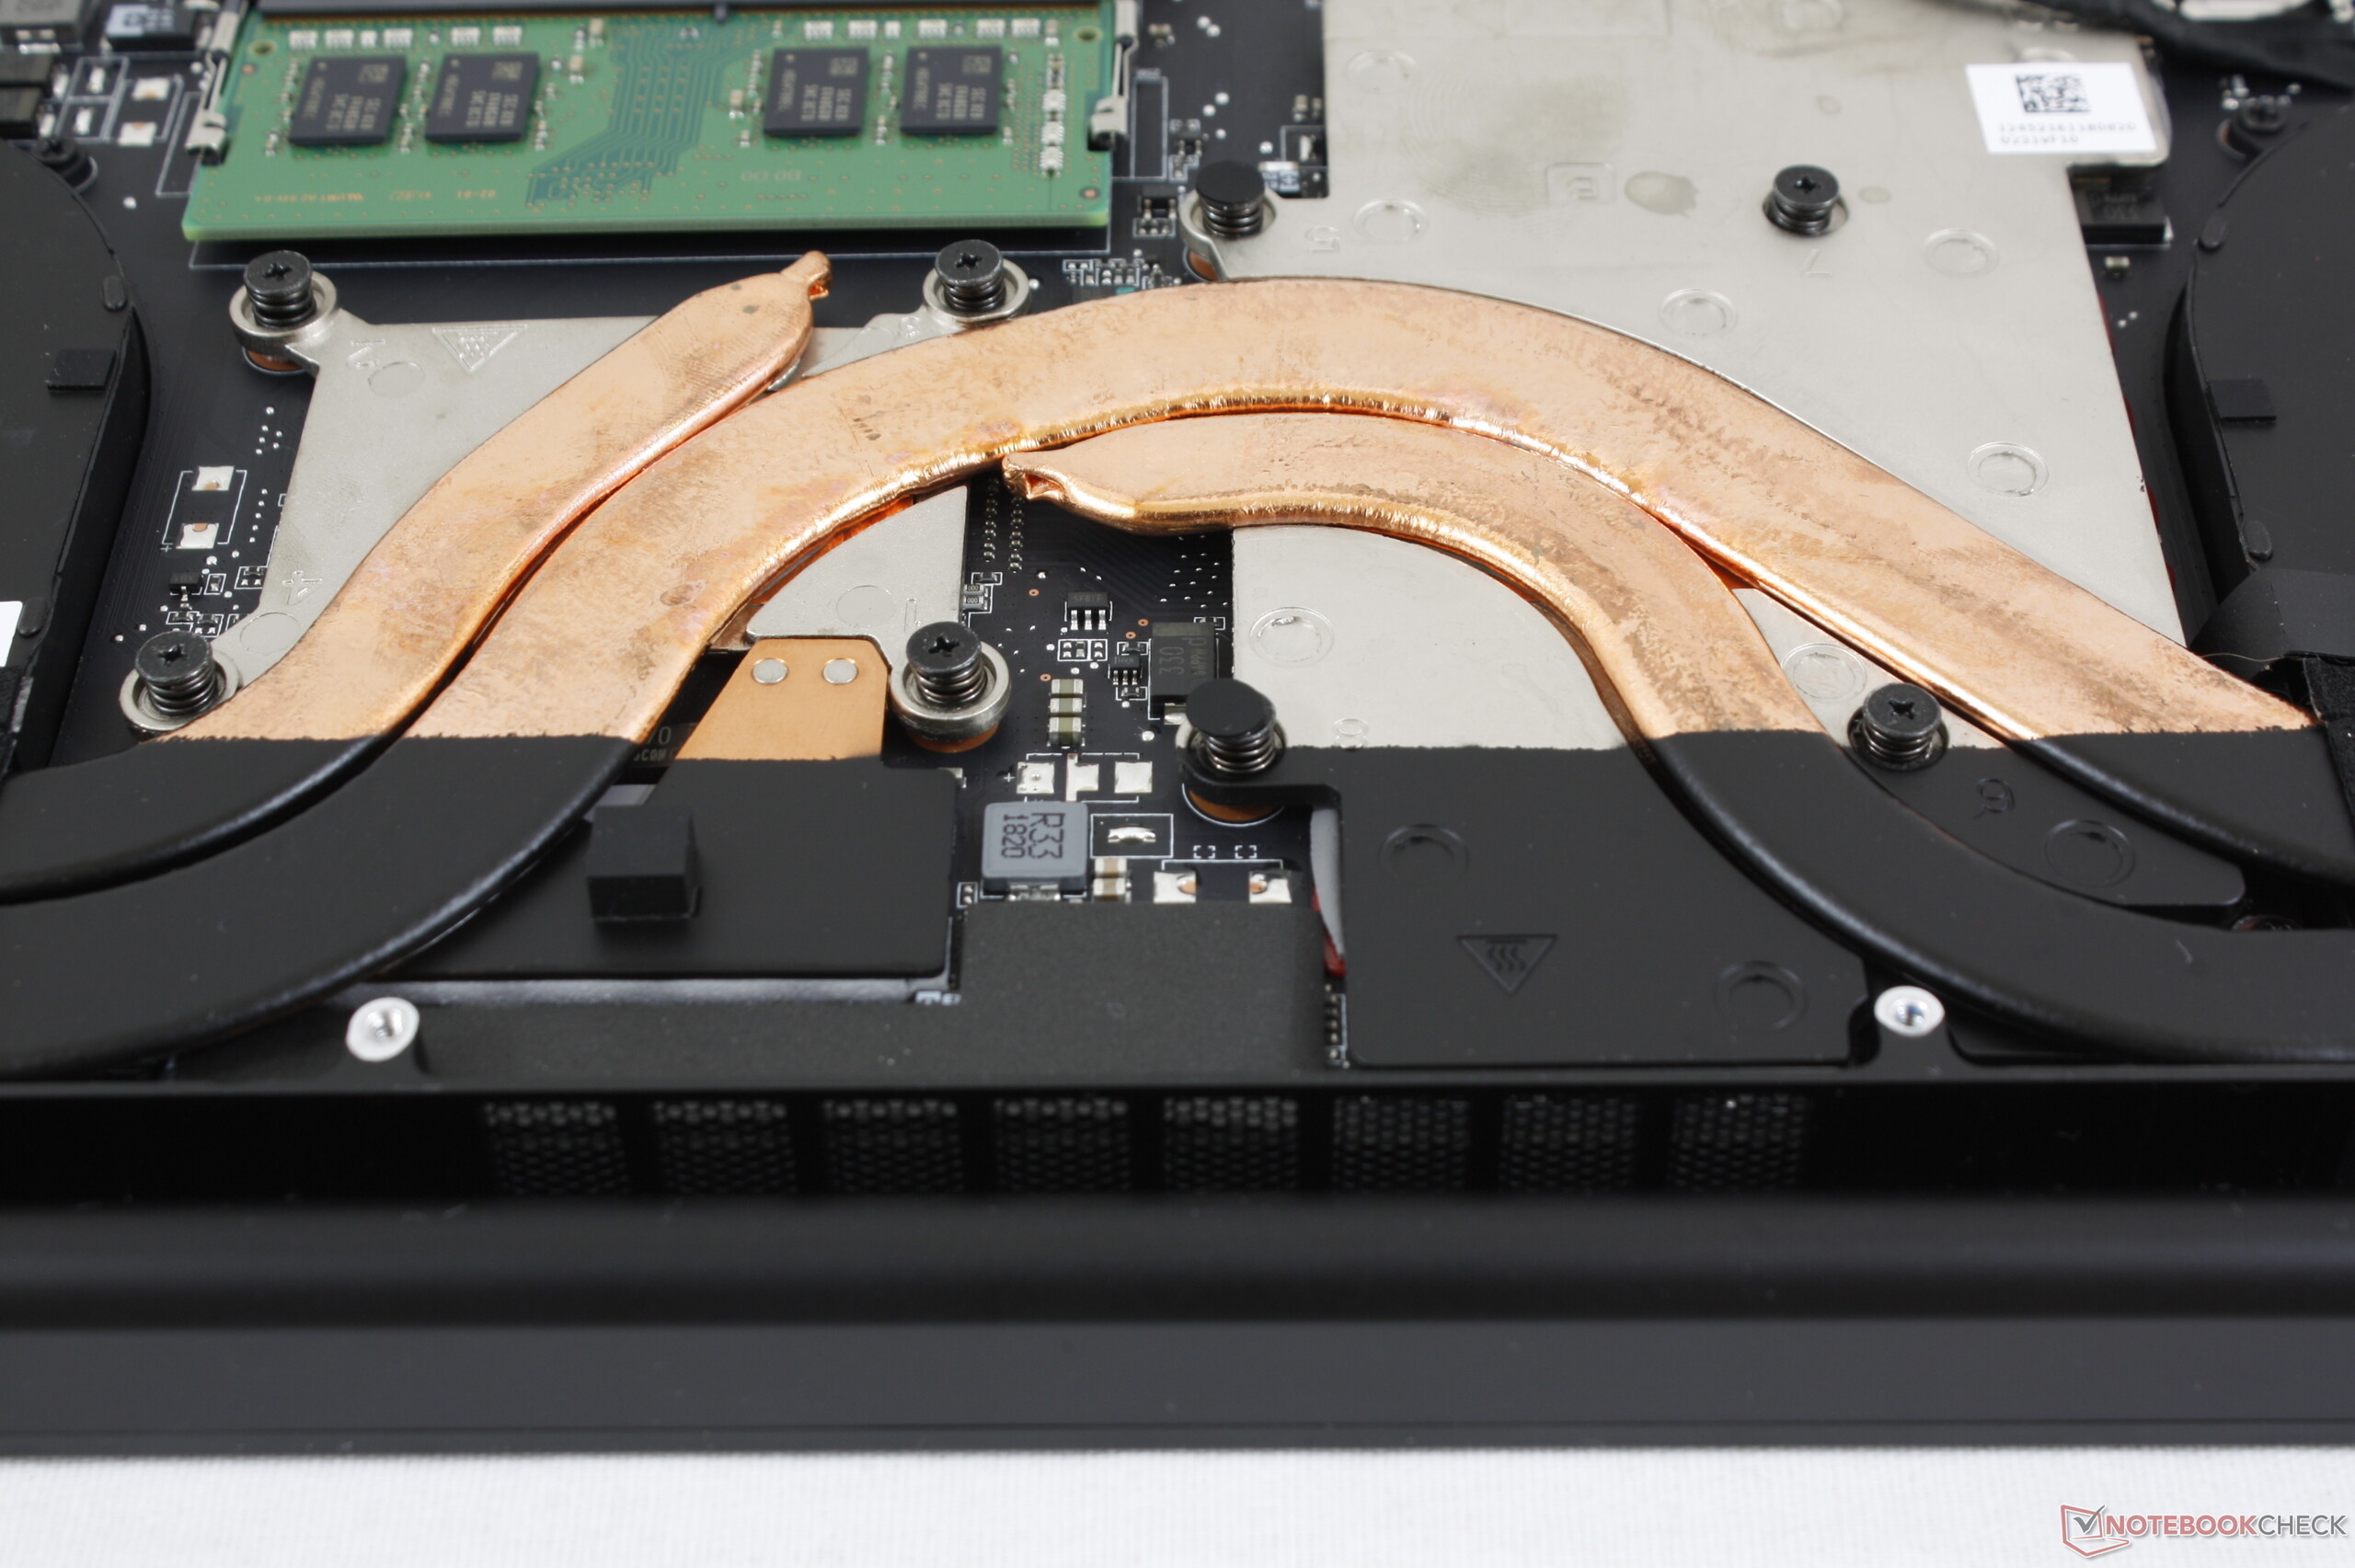
之所以标准版更加便宜是因为它去掉了高级版中的许多高端的游戏功能-GTX 1070显卡、蒸汽室冷却、单键RGB、144赫兹和高响应屏都是高级版才有的配置。但最基本的显卡性能和贵上几千块的高级版的GTX 1060 Max-Q相差无几。
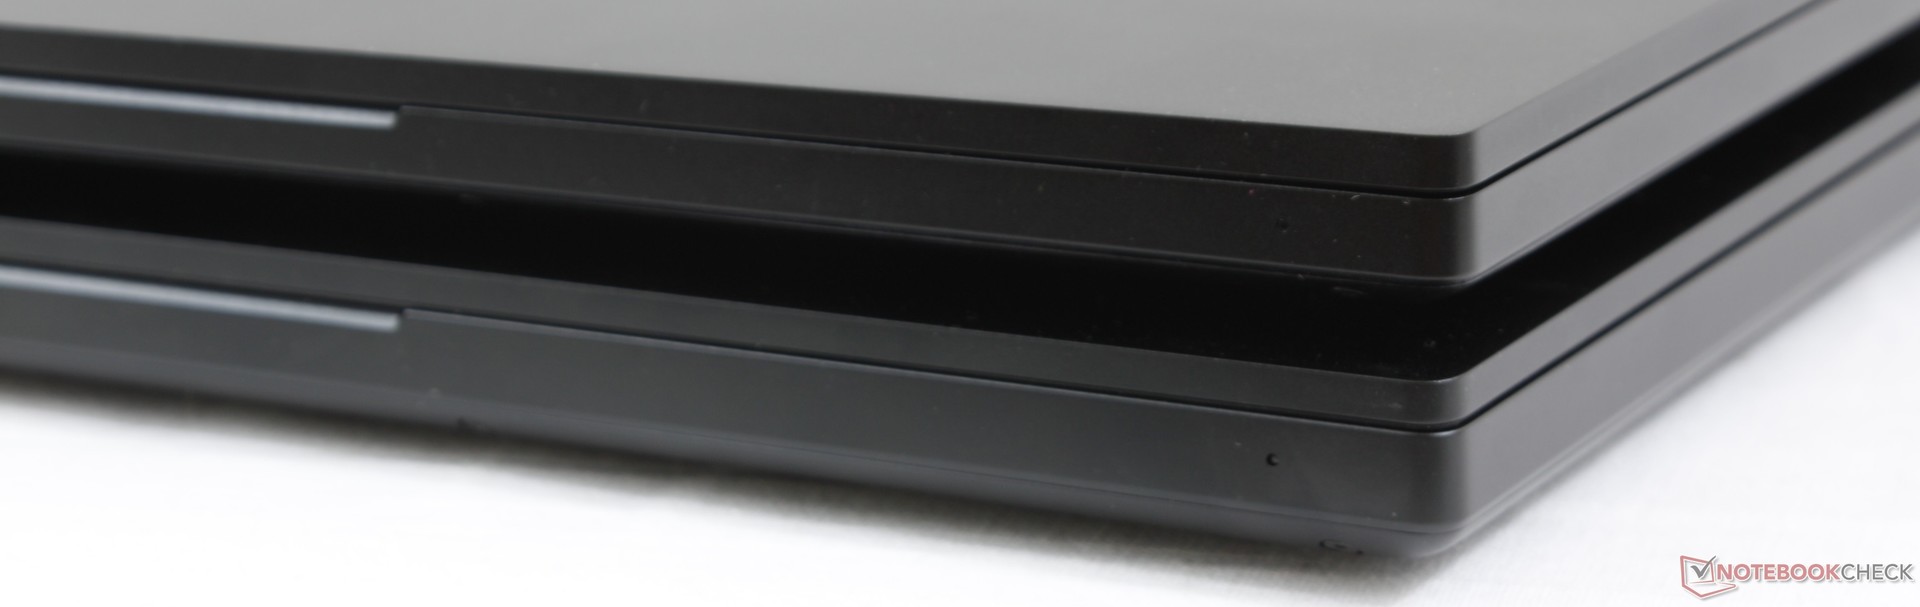
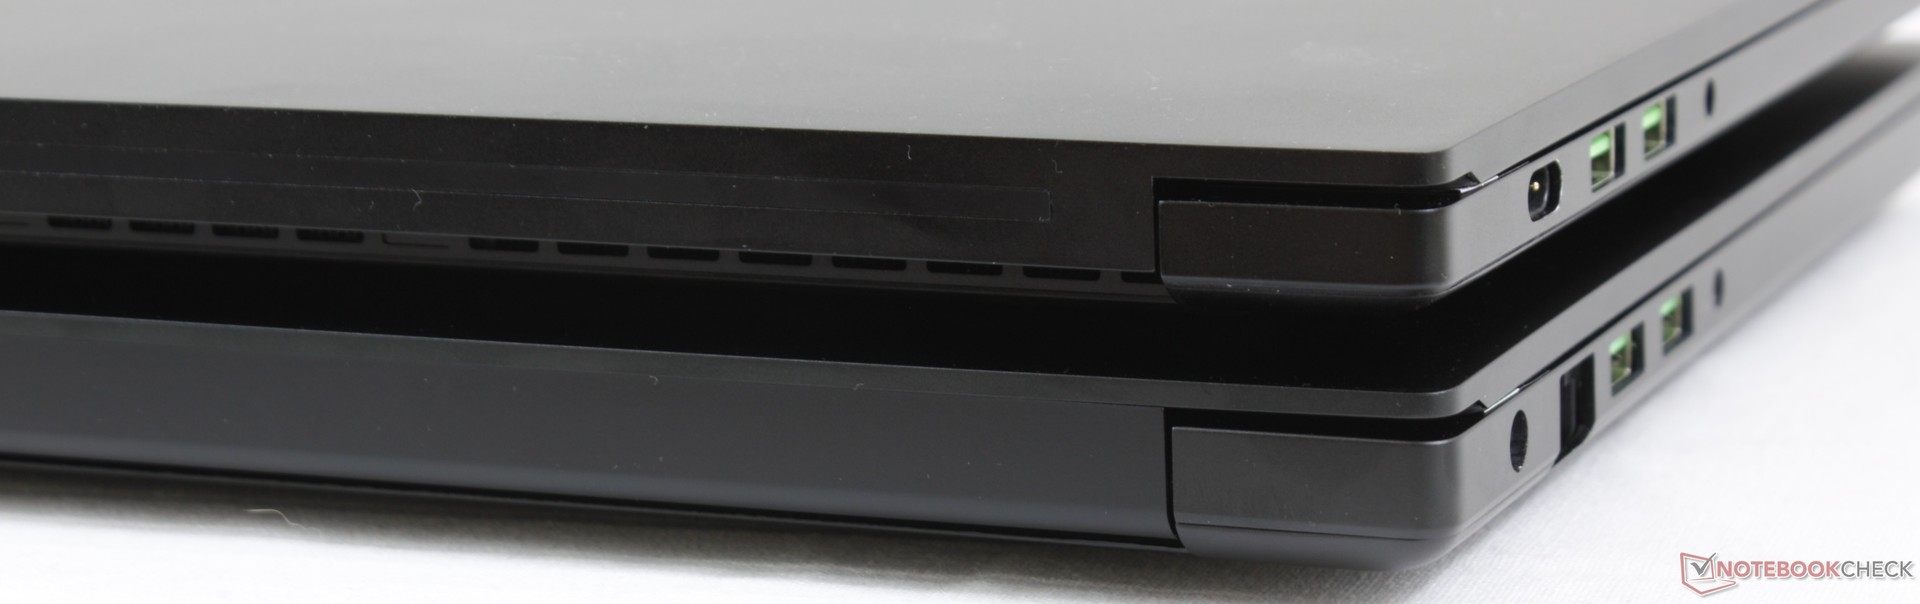
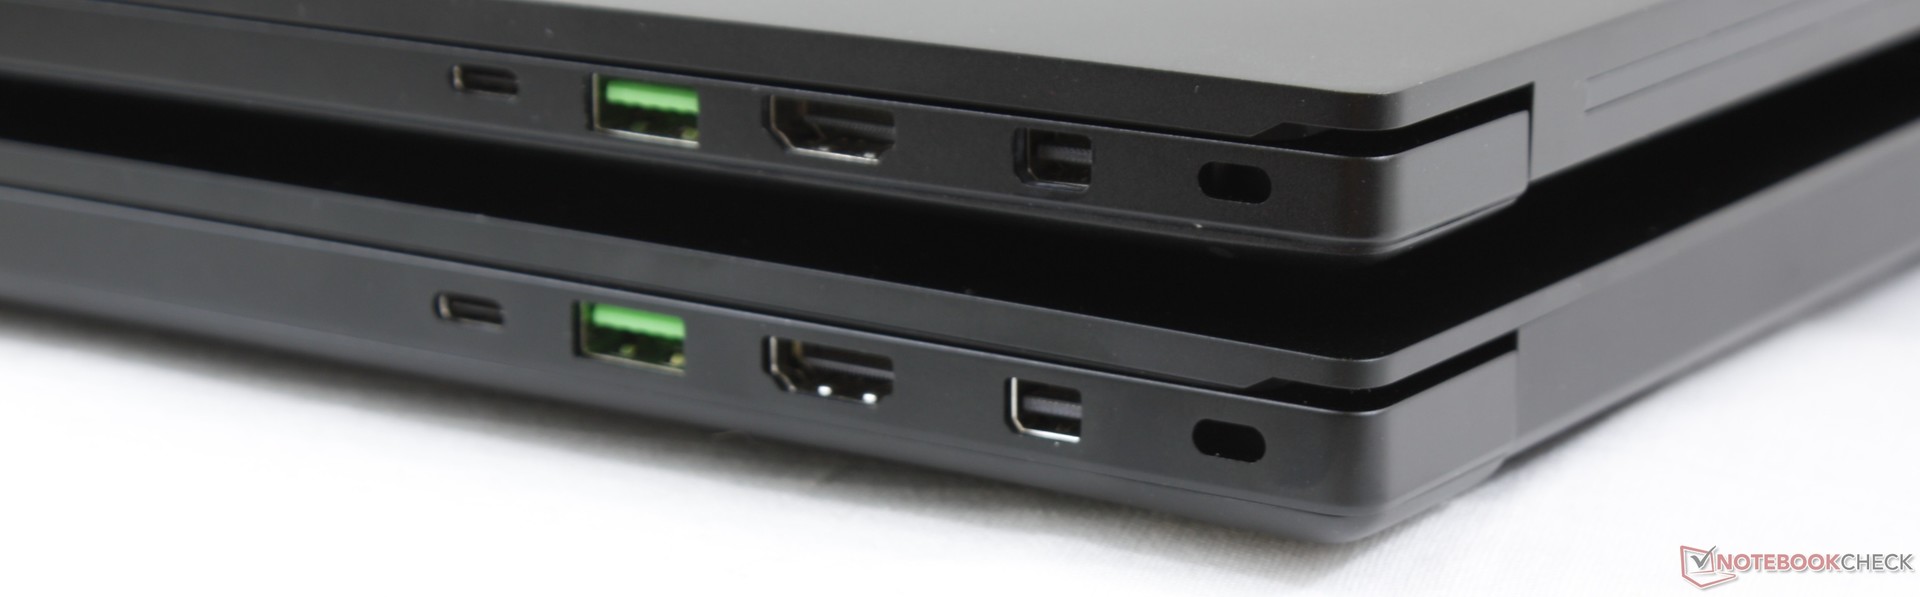
主要的缺点和高级版类似:风扇声音响,键盘键程短。较小的电池使得续航时间短了一个小时左右,比不上GS65和Aero 15X。与高级版相比,多出的2毫米厚度基本上感觉不出来,而标志性的雷蛇设计也从上到下被保留了下来。
“雷蛇灵刃15标准版的价格与其他窄边框游戏本竞品价格相差不大,为了得到最好的机身做工,我们会毫不犹豫地推荐它。不过如果你需要更长的续航和144赫兹屏幕,我们建议购买高级版。”
Razer Blade 15 Base Model
- 10/26/2018 v6 (old)
Allen Ngo
Price comparison

