结论 - 对大多数人来说最合理的配置
核心 酷睿至尊 7 355Core Ultra 7 355 失去了 Panther Lake H 系列最初的许多特色。尤其是在考虑到集成显卡性能的情况下,其性能和每瓦性能都更接近于 Lunar Lake-V,甚至更差。而旗舰产品 酷睿至尊 X7 358H是该系列的一次巨大飞跃,而中端产品酷睿至尊 7 355 给人的感觉就像是改头换面的 酷睿至尊 7 255U在许多方面。尽管性能上存在差异,但系统运行时的温度和时间并没有明显低于速度更快的酷睿 Ultra X7。
当然,不需要酷睿至尊 X7 性能优势的用户可能还是更喜欢价格较低的酷睿至尊 7 355 配置,因为它在物理设计上仍然比有分歧的 2025 或更早型号有所改进。即使是基本的 1200p IPS 面板,在图像质量方面也优于大多数其他同类产品。不喜欢 Arc B390 GPU 的用户会发现,酷睿至尊 7 355 在浏览、文字处理和一般多媒体方面同样出色。否则,内容创作者和偶尔玩游戏的人肯定会考虑更高端的酷睿至尊 7。
Pros
Cons
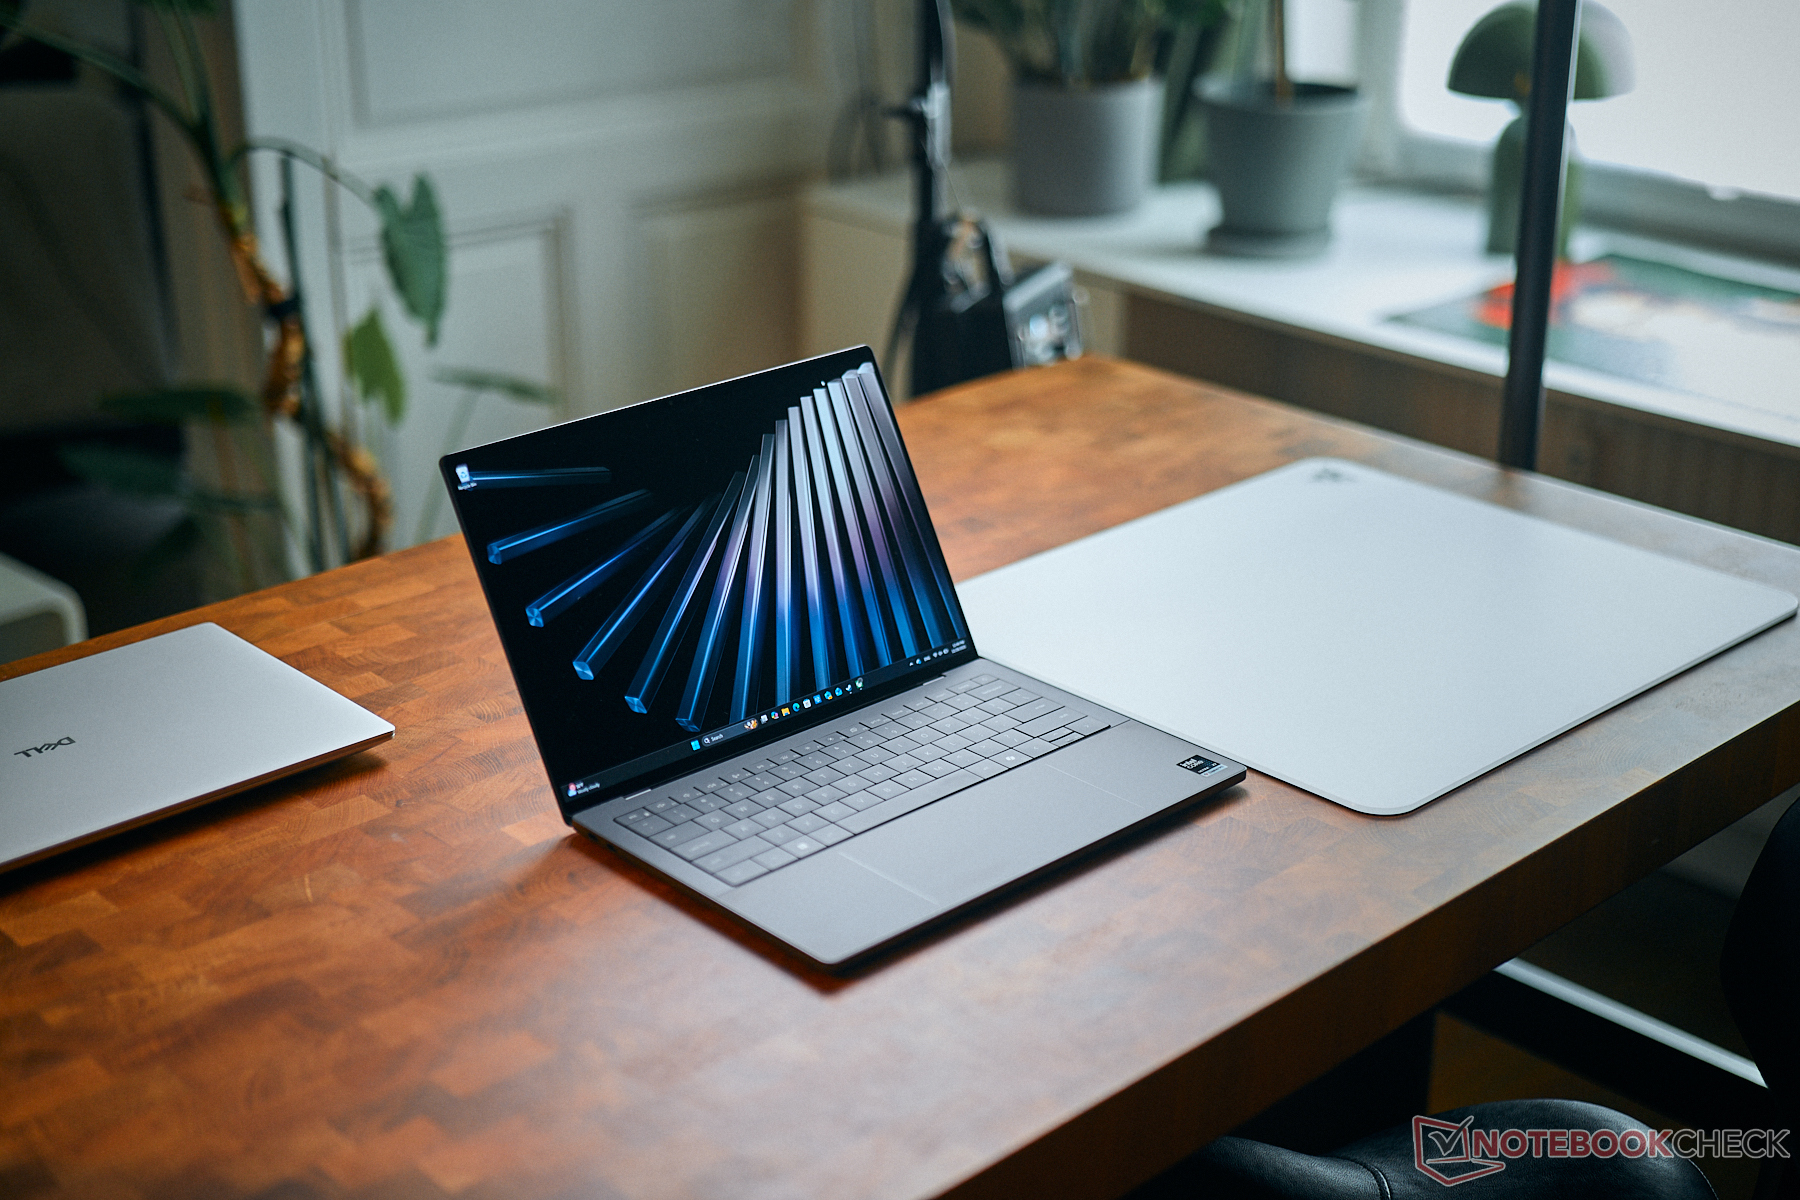
我们最近检查了酷睿 X7 OLED XPS 14,对其性能和设计方面的所有改进都给予了很高的评价。尽管如此,大多数用户可能会对配备酷睿至尊 7 和 IPS 显示屏、价格低廉的 SKU 更感兴趣,因为它们的价格几乎低 500 美元。本评测将对这两种配置进行比较,以了解用户在购买前可以预期的性能差距有多大。
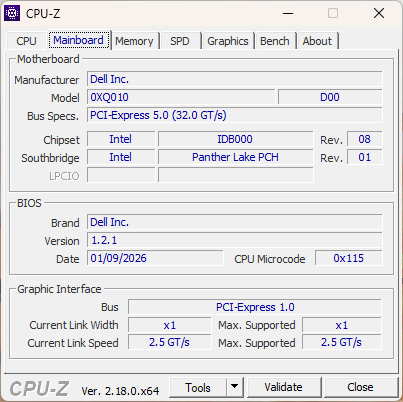
由于酷睿至尊 7 和酷睿至尊 X7 在外观上完全相同,我们建议您阅读我们的 OLED XPS 14 的现有评测来了解该机型的物理特性。
更多戴尔评测:
规格
案例
非触摸式 IPS 配置比 OLED 触摸屏配置略薄(14.6 毫米对 15.2 毫米)。其他方面给人的印象相同,都是结构明显强于旧机型,但维修过程略显繁琐。
连接性


交流
网络摄像头


维护

可持续性
戴尔继续使用越来越多的可回收材料来制造其旗舰机型,包括我们在最初的评测中提到的最新款 XPS 14。
显示屏
有以下两种显示选项:
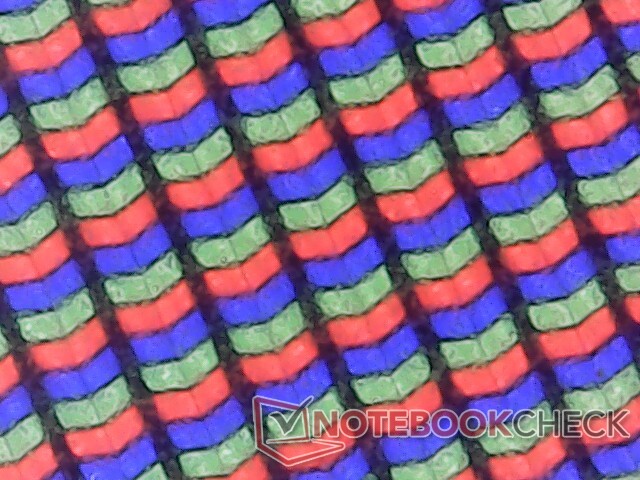
- 1920 x 1200,非触摸屏,哑光,500 nits,100% sRGB,IPS,1 - 120 Hz
- 2880 x 1800,触摸屏,亮面,500 尼特,100% DCI-P3,OLED,20 - 120 赫兹
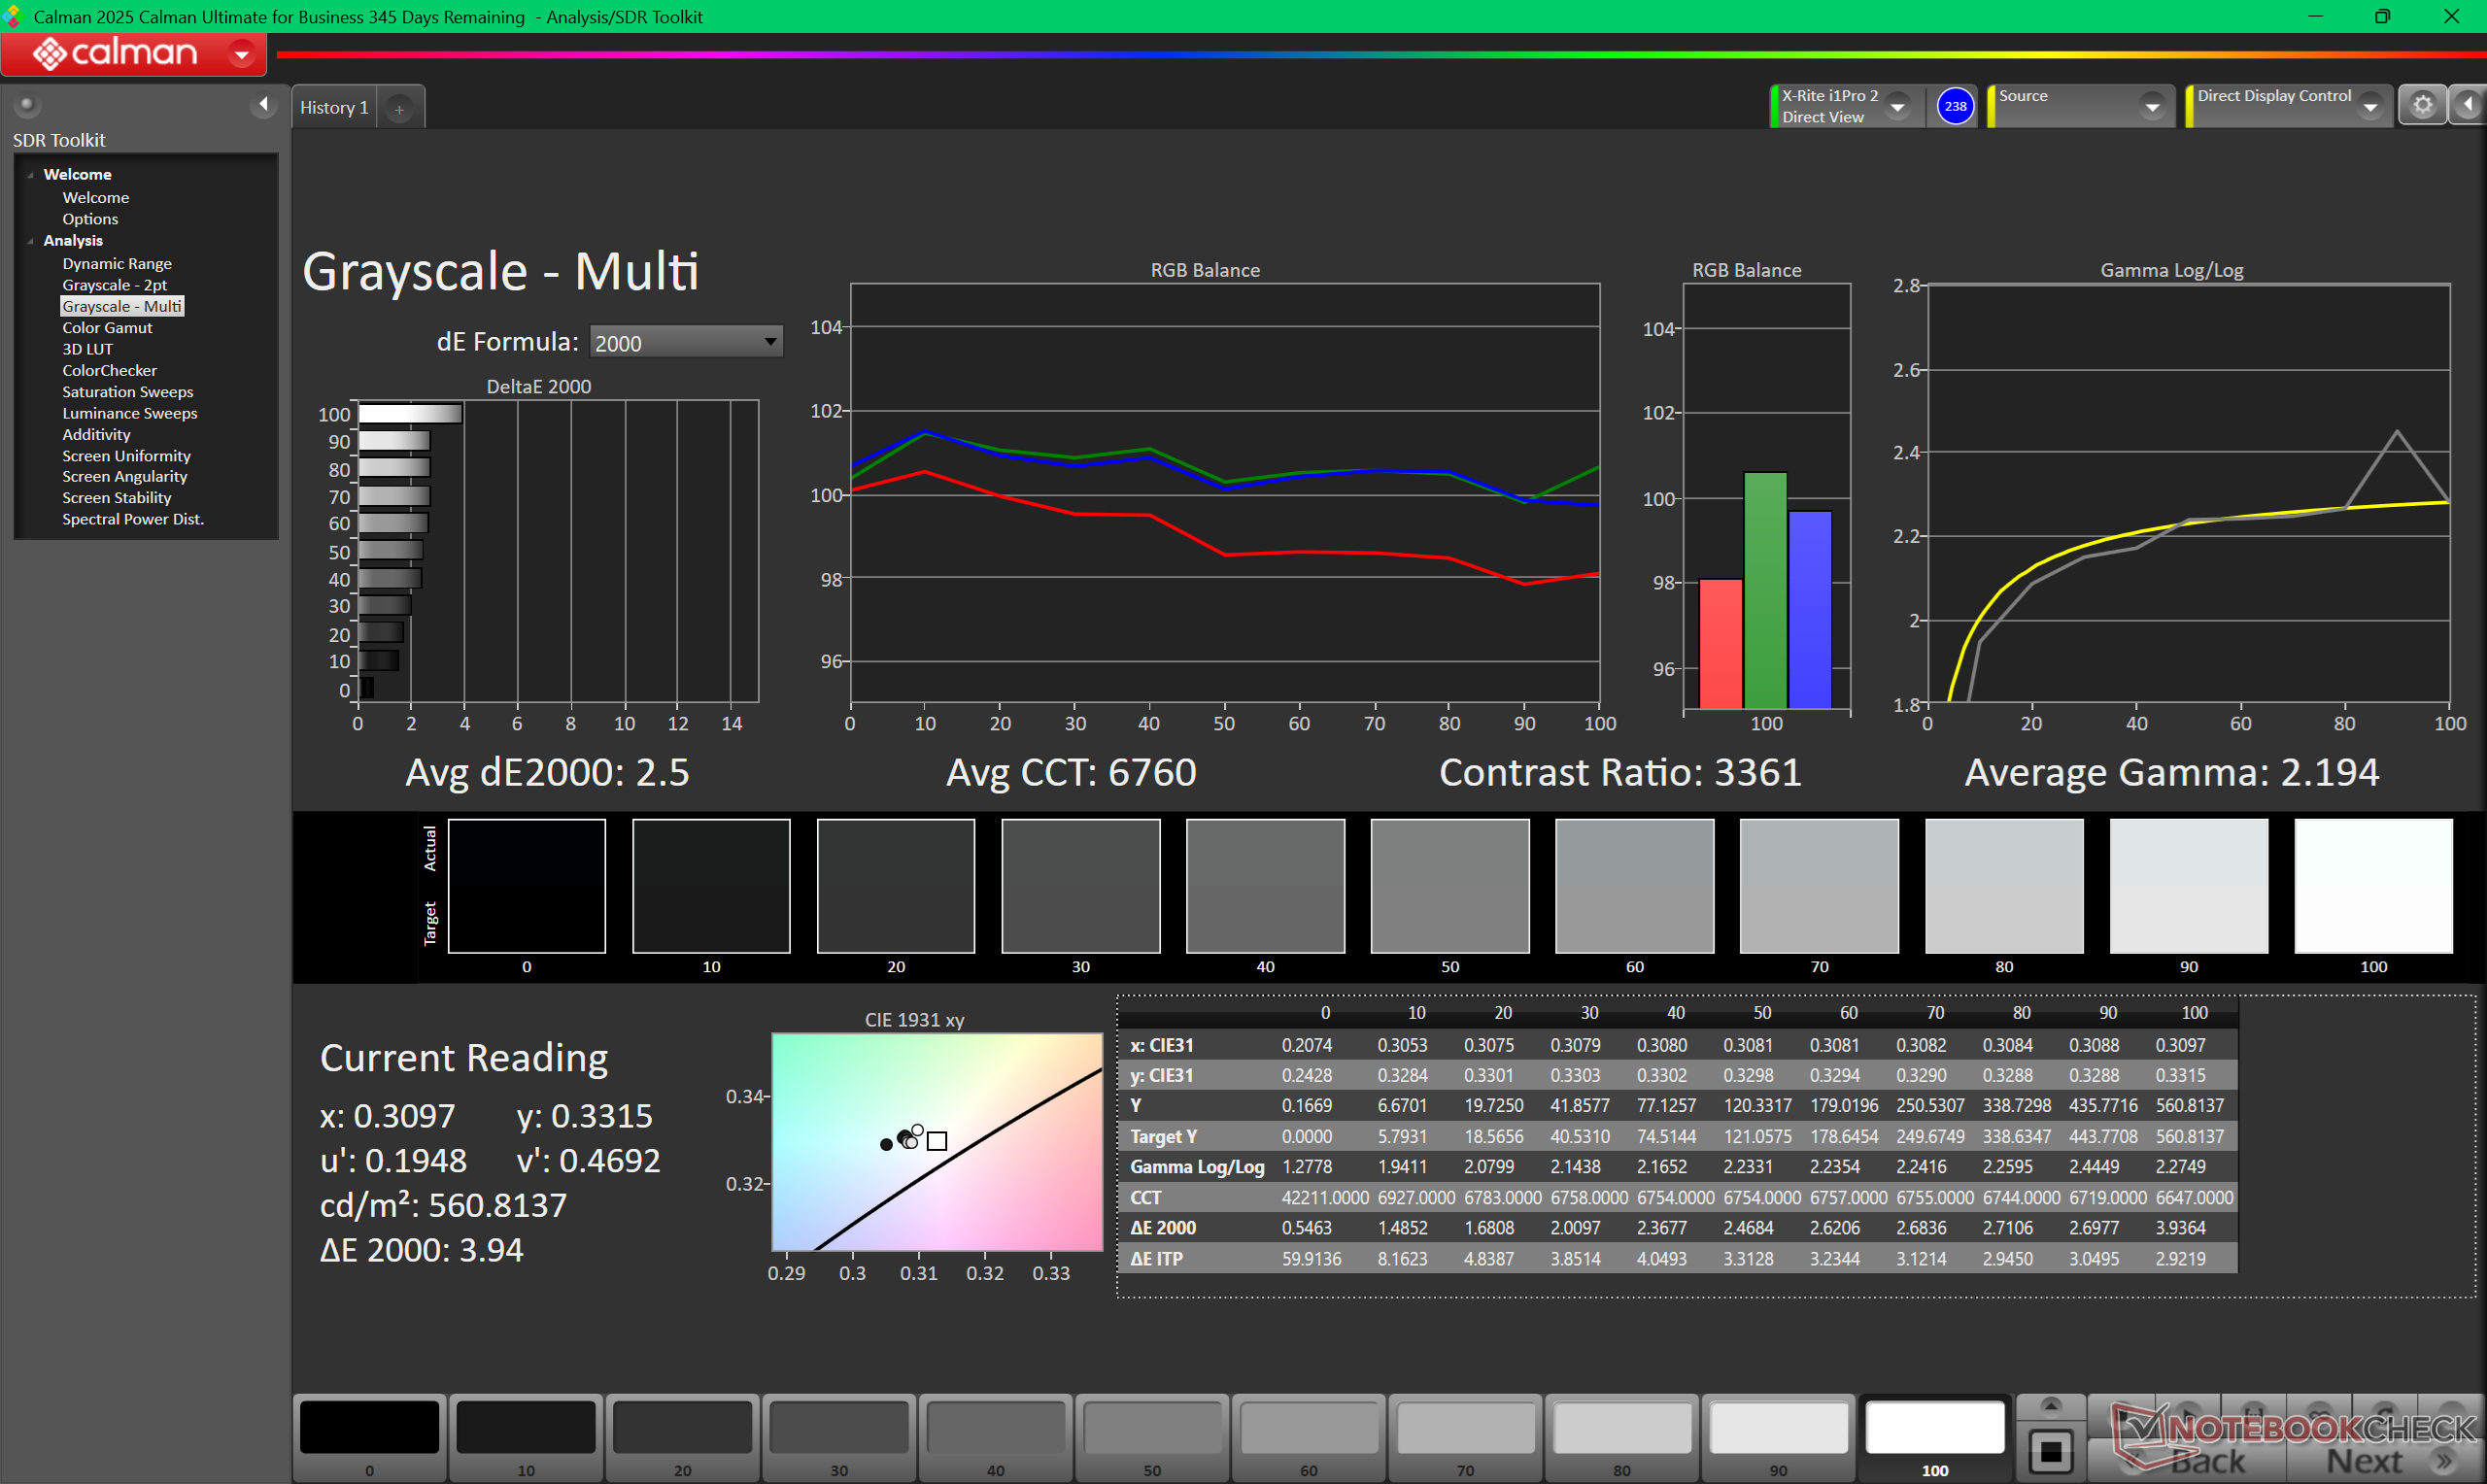
与 OLED 面板相比,价格较低的 IPS 面板中央亮度稍高,但由于均匀度较差,边缘和角落的亮度稍低。对比度仍然很好,尤其是对于超过 2000:1 的 IPS 面板来说,而 Windows VRR 在空闲时仅支持低至 1 Hz,而其他大多数笔记本电脑则支持 20 Hz 或更高的频率。需要注意的是,该功能默认为禁用,必须手动启用。
IPS 面板最显著的两个缺点是黑白响应时间更慢,以及缺乏 DCI-P3 覆盖范围。因此,重影现象会非常明显,尤其是在玩游戏和官方不支持 HDR 的情况下。


| |||||||||||||||||||||||||
Brightness Distribution: 85 %
Center on Battery: 561.2 cd/m²
Contrast: 2551:1 (Black: 0.22 cd/m²)
ΔE ColorChecker Calman: 2.09 | ∀{0.5-29.43 Ø4.73}
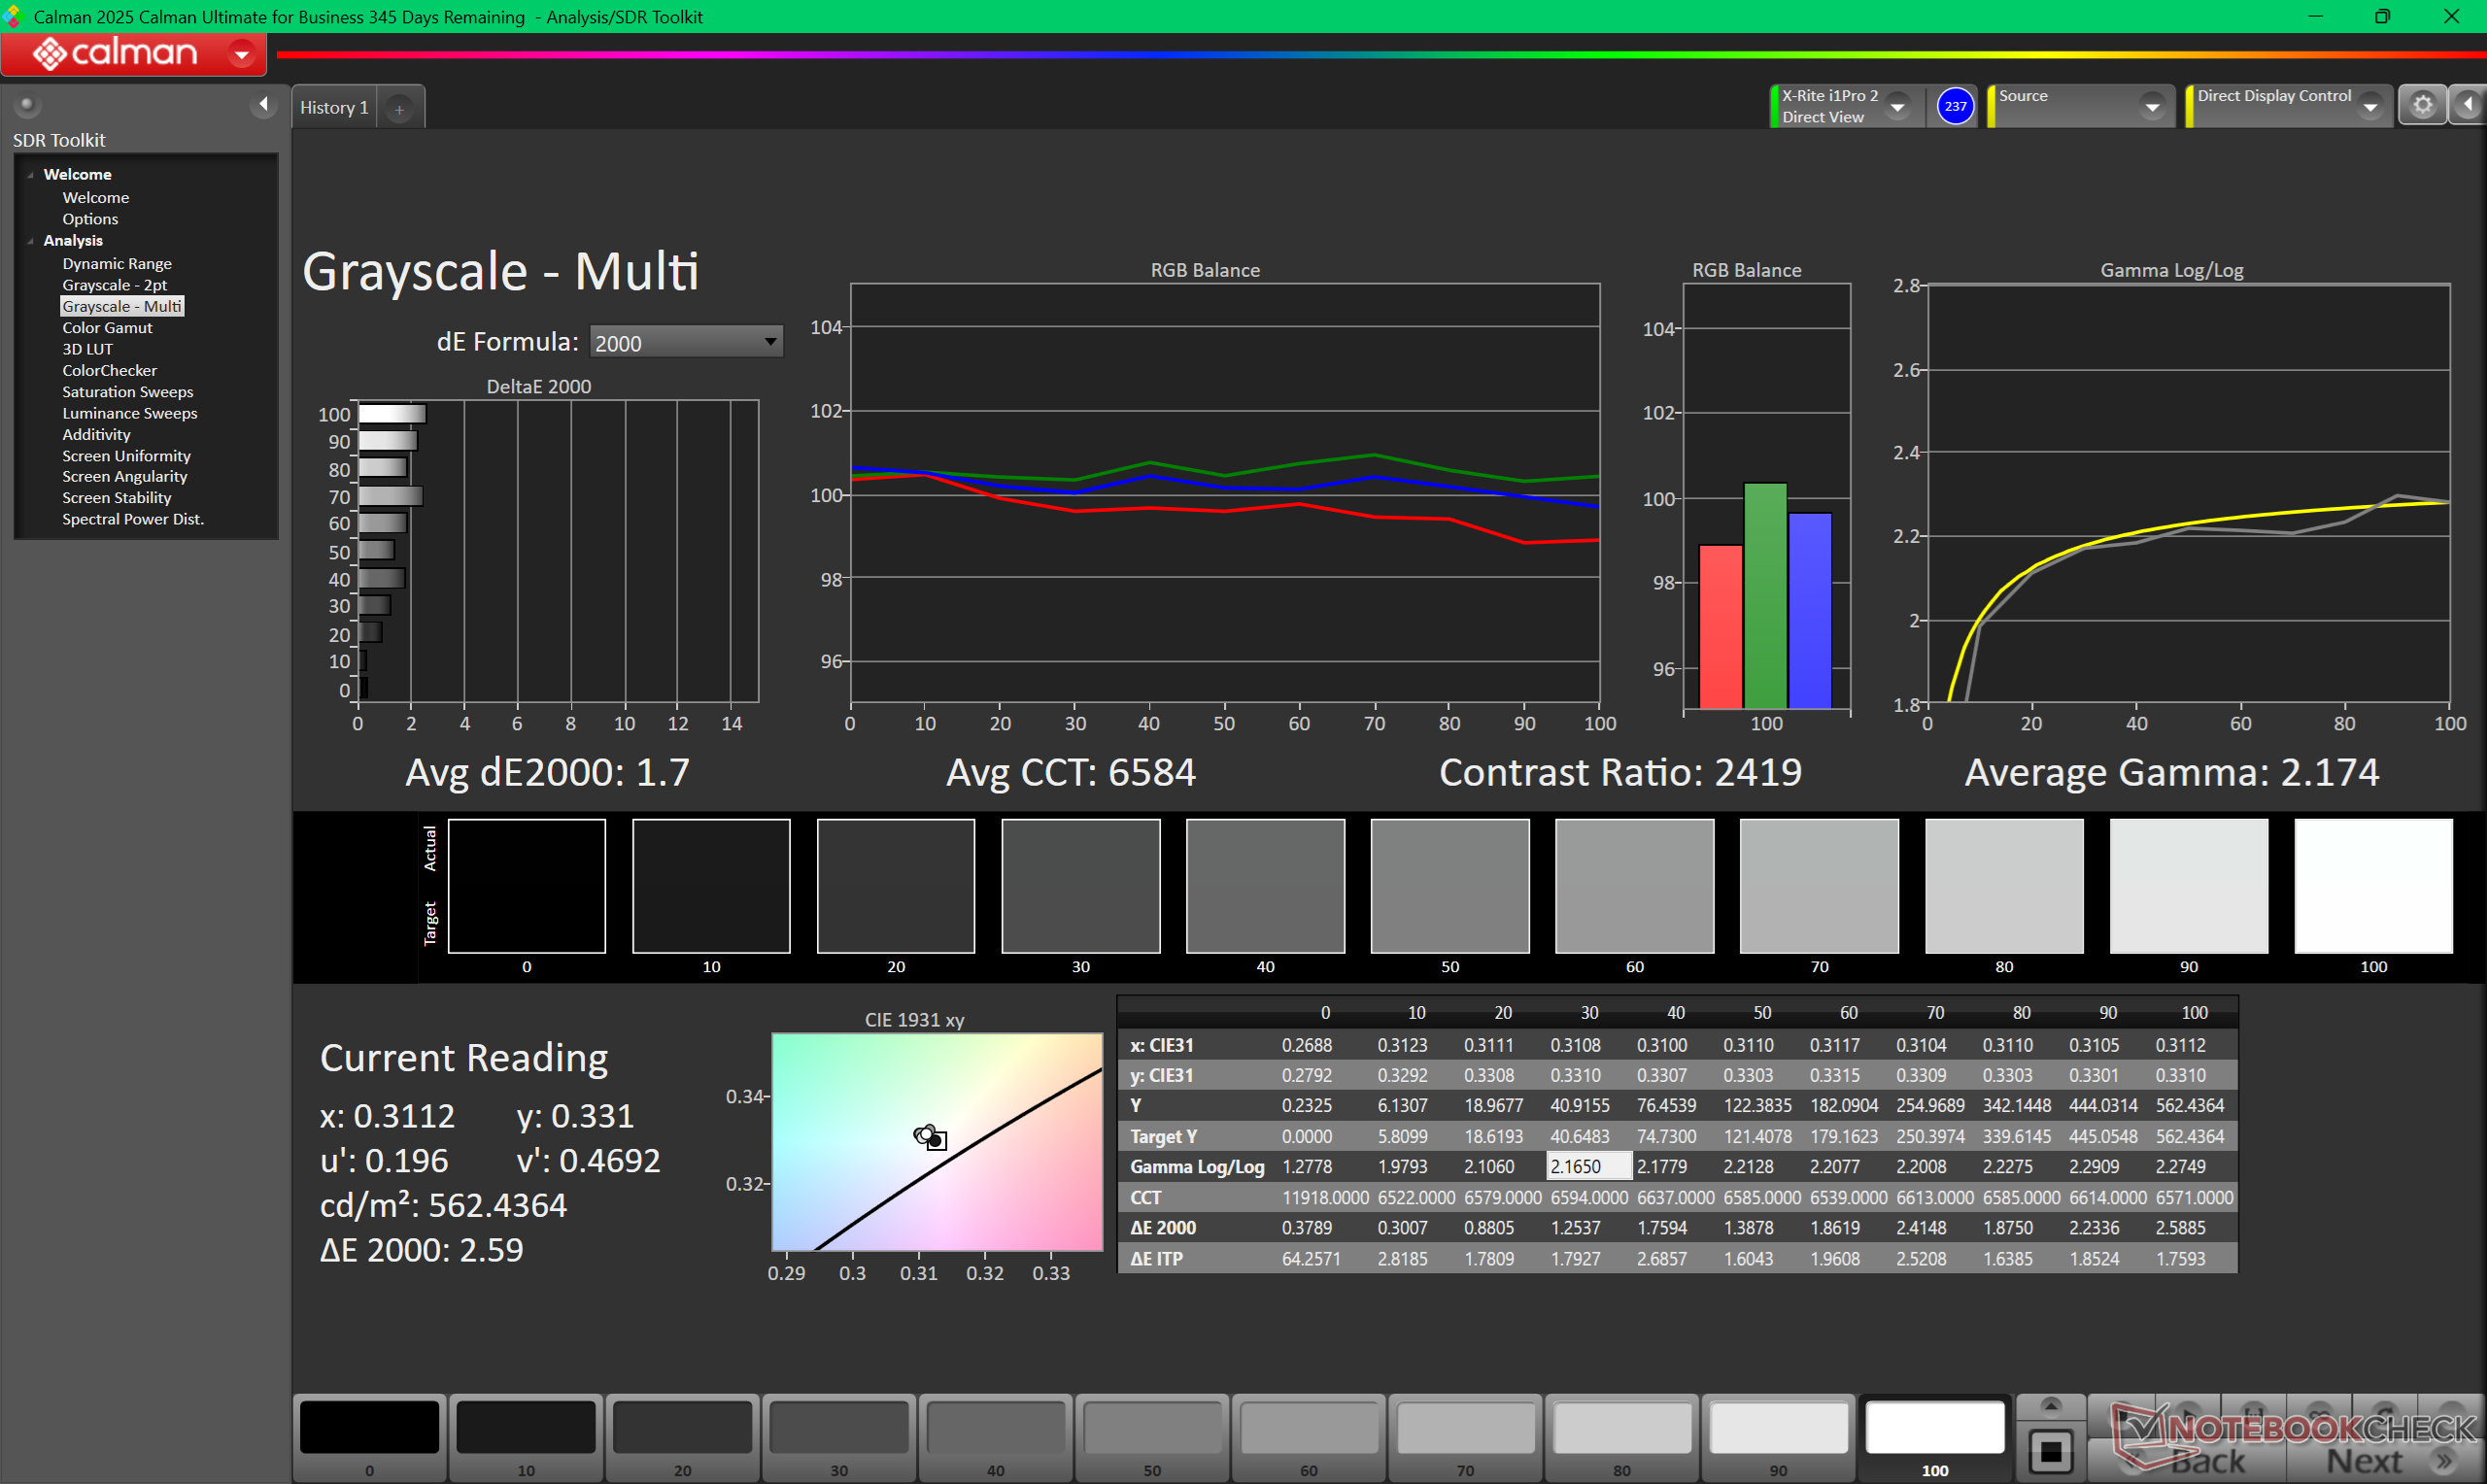
calibrated: 1.09
ΔE Greyscale Calman: 2.5 | ∀{0.09-98 Ø4.97}
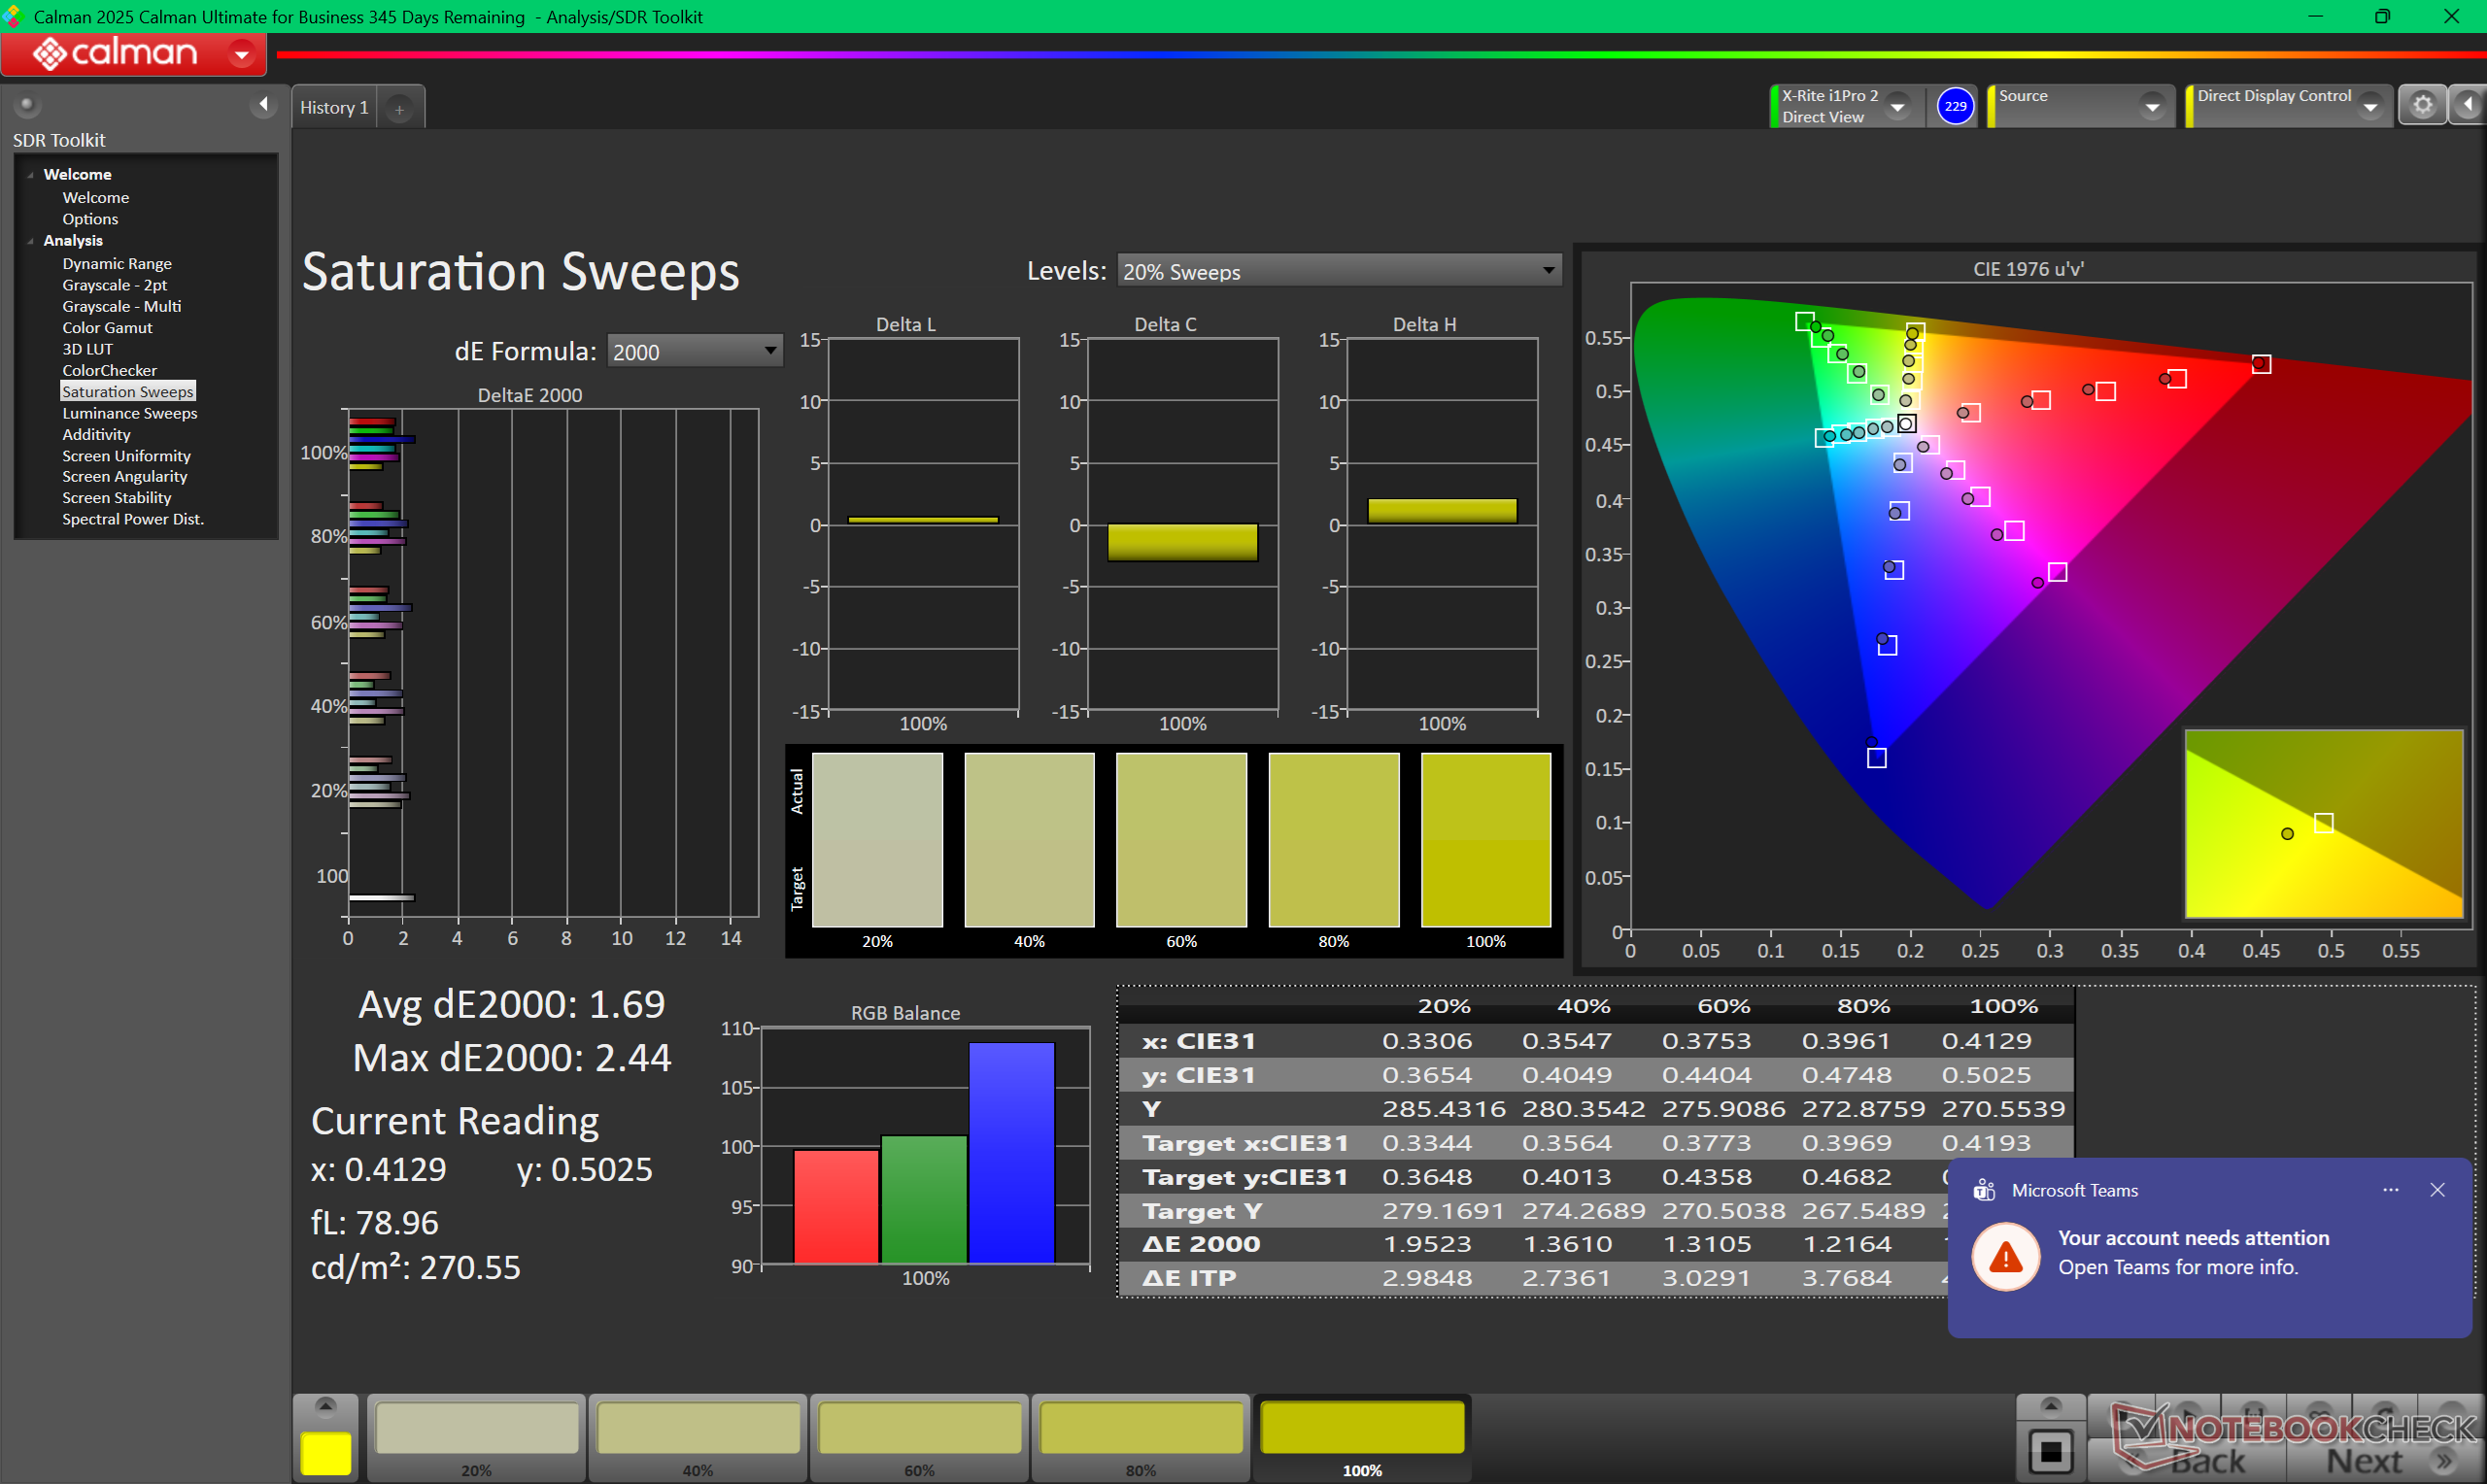
66.2% AdobeRGB 1998 (Argyll 3D)
95.3% sRGB (Argyll 3D)
64% Display P3 (Argyll 3D)
Gamma: 2.19
CCT: 6760 K
| Dell XPS 14 Core Ultra 7 355 LG Philips 140WUX, IPS, 1920x1200, 14", 120 Hz | Dell XPS 14 Core Ultra X7 358H LG Philips 140WT2, OLED, 2880x1800, 14", 120 Hz | Asus ExpertBook PM3406 MNE007QS3-6, IPS, 1920x1200, 14", 60 Hz | Lenovo ThinkPad T14 Gen 6 21QG001VGE MNE007JA1-3, IPS LED, 1920x1200, 14", 60 Hz | HP OmniBook Ultra Flip 14 Samsung SDC41AA, OLED, 2880x1800, 14", 120 Hz | Samsung Galaxy Book5 Pro 14 940XHA ATNA40CU07-0, OLED, 2880x1800, 14", 120 Hz | |
|---|---|---|---|---|---|---|
| Display | 36% | -39% | 5% | 36% | 35% | |
| Display P3 Coverage (%) | 64 | 99.7 56% | 39.3 -39% | 67.7 6% | 99.8 56% | 99.9 56% |
| sRGB Coverage (%) | 95.3 | 100 5% | 58.1 -39% | 98.3 3% | 100 5% | 100 5% |
| AdobeRGB 1998 Coverage (%) | 66.2 | 98.2 48% | 40.6 -39% | 69.9 6% | 96.7 46% | 95.7 45% |
| Response Times | 98% | 54% | 28% | 98% | 99% | |
| Response Time Grey 50% / Grey 80% * (ms) | 57.7 ? | 0.75 ? 99% | 27.6 ? 52% | 40.2 ? 30% | 0.86 ? 99% | 0.83 ? 99% |
| Response Time Black / White * (ms) | 38.8 ? | 1.03 ? 97% | 17 ? 56% | 29.1 ? 25% | 1.01 ? 97% | 0.69 ? 98% |
| PWM Frequency (Hz) | 240.62 ? | 469 ? | 240 ? | |||
| PWM Amplitude * (%) | 29 | 33.3 | 66 | |||
| Screen | 11% | -102% | 5% | 19% | -7% | |
| Brightness middle (cd/m²) | 561.2 | 393.8 -30% | 320 -43% | 554 -1% | 363.9 -35% | 400 -29% |
| Brightness (cd/m²) | 505 | 389 -23% | 310 -39% | 516 2% | 366 -28% | 402 -20% |
| Brightness Distribution (%) | 85 | 96 13% | 93 9% | 91 7% | 99 16% | 99 16% |
| Black Level * (cd/m²) | 0.22 | 0.26 -18% | 0.24 -9% | |||
| Contrast (:1) | 2551 | 1231 -52% | 2308 -10% | |||
| Colorchecker dE 2000 * | 2.09 | 1.27 39% | 5.1 -144% | 1.5 28% | 0.84 60% | 2.1 -0% |
| Colorchecker dE 2000 max. * | 4.37 | 3.35 23% | 18.1 -314% | 3.4 22% | 2.72 38% | 3.3 24% |
| Colorchecker dE 2000 calibrated * | 1.09 | 0.71 35% | 4.9 -350% | 0.9 17% | 0.82 25% | 1.6 -47% |
| Greyscale dE 2000 * | 2.5 | 2 20% | 1.7 32% | 2.7 -8% | 1.1 56% | 2.3 8% |
| Gamma | 2.19 100% | 2.19 100% | 2.21 100% | 2.25 98% | 2.18 101% | 2.26 97% |
| CCT | 6760 96% | 6379 102% | 6398 102% | 6882 94% | 6330 103% | 6795 96% |
| Total Average (Program / Settings) | 48% /
32% | -29% /
-66% | 13% /
8% | 51% /
36% | 42% /
21% |
* ... smaller is better
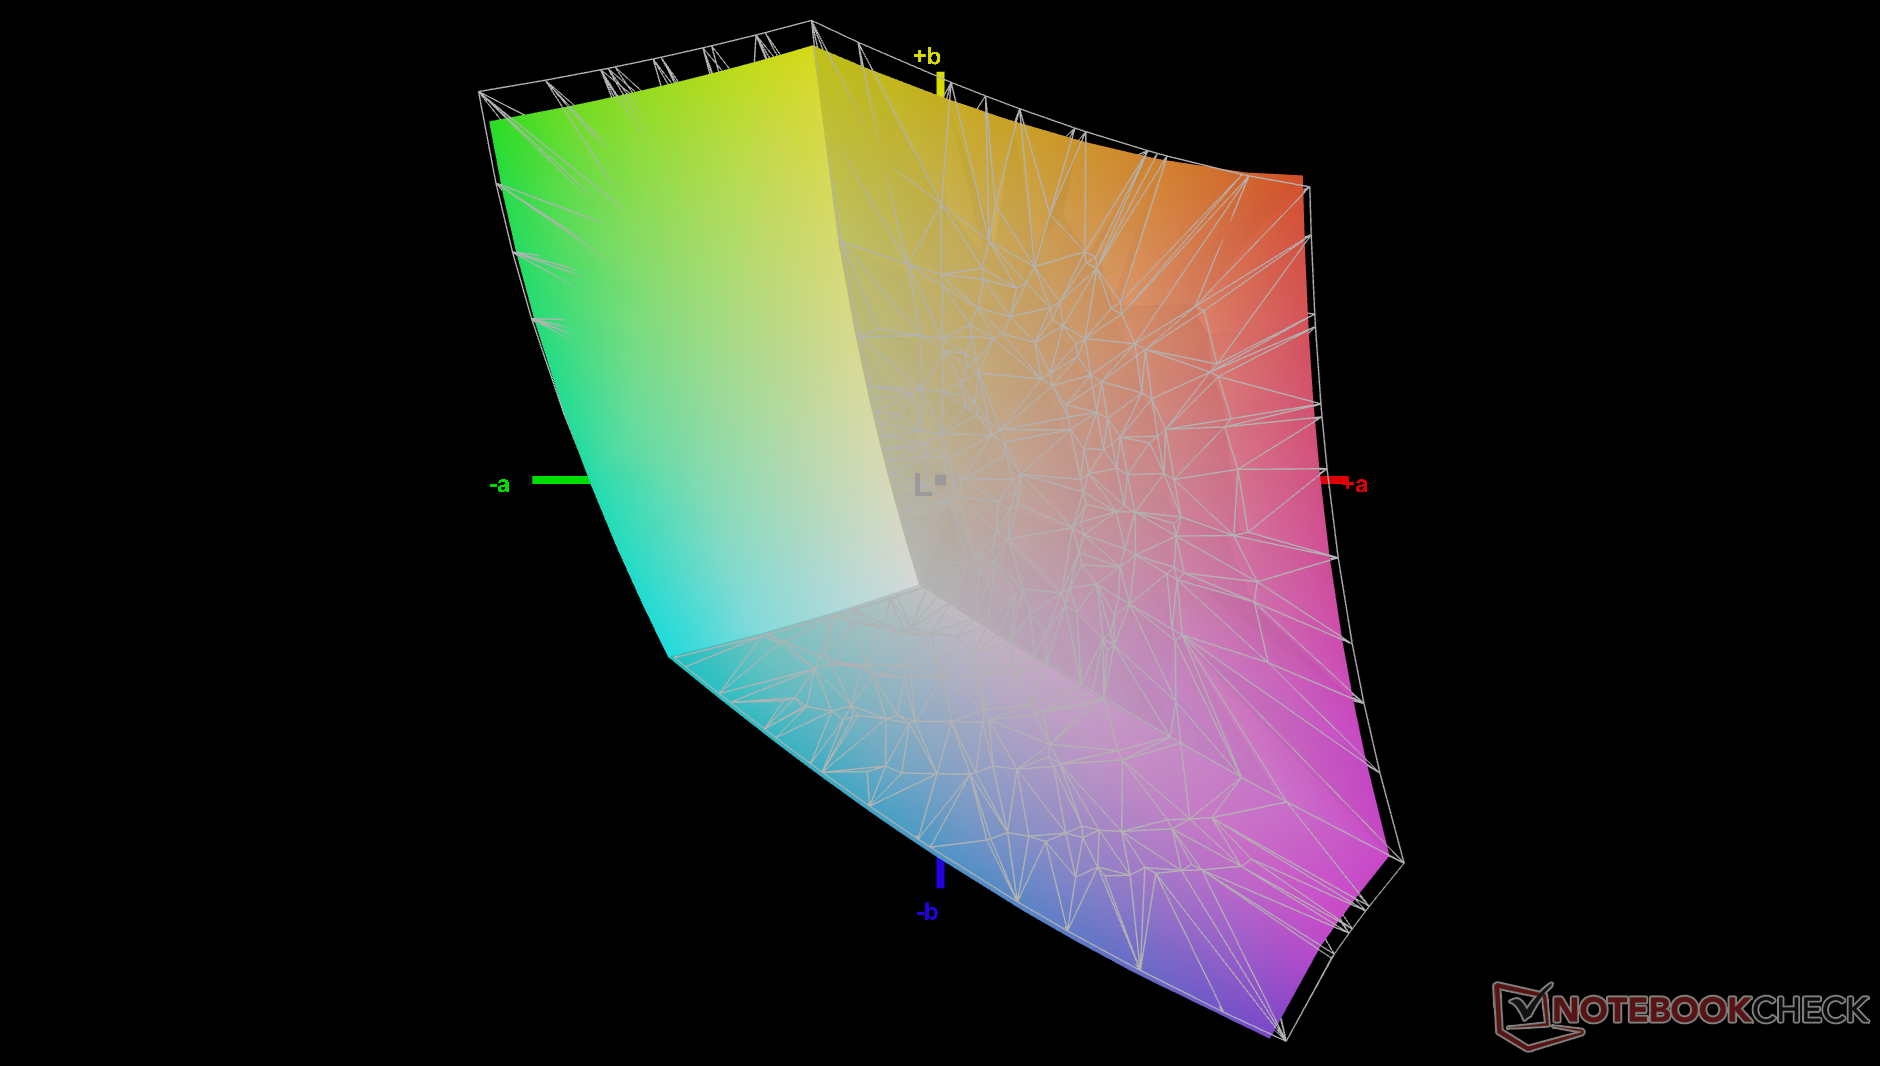
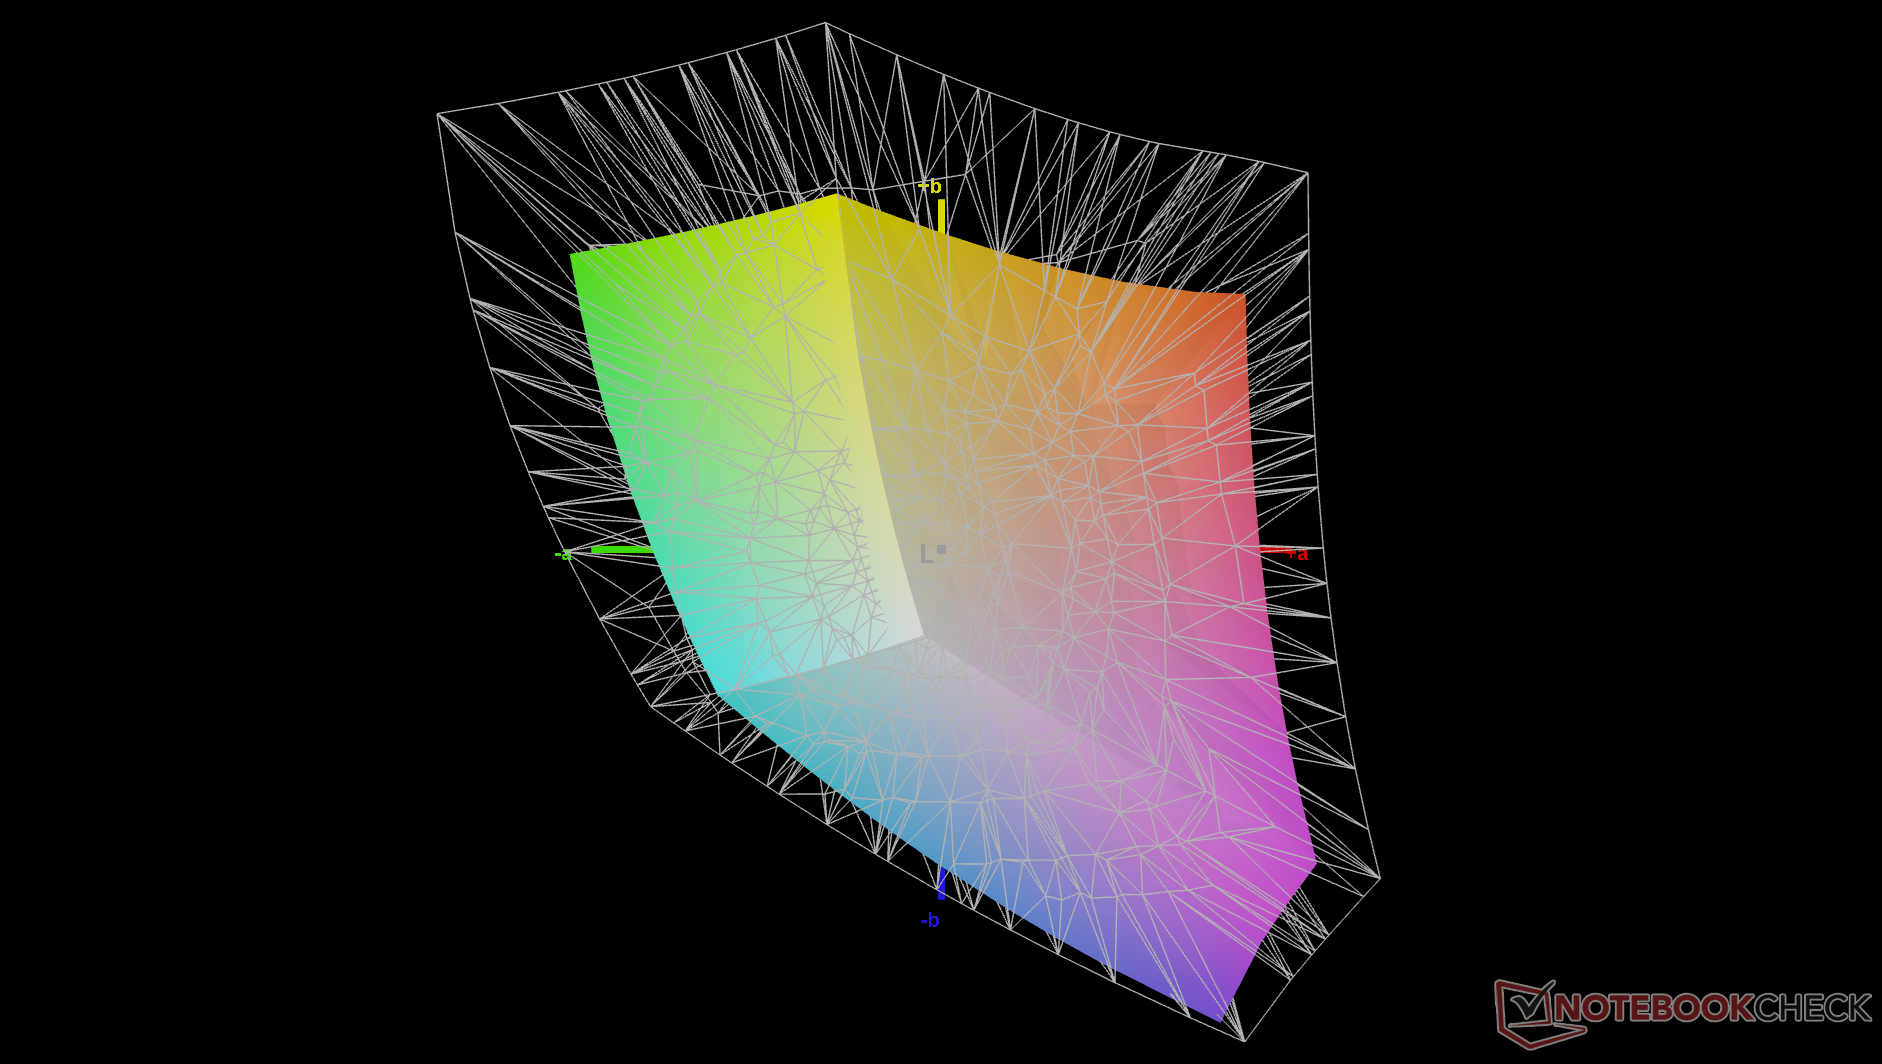
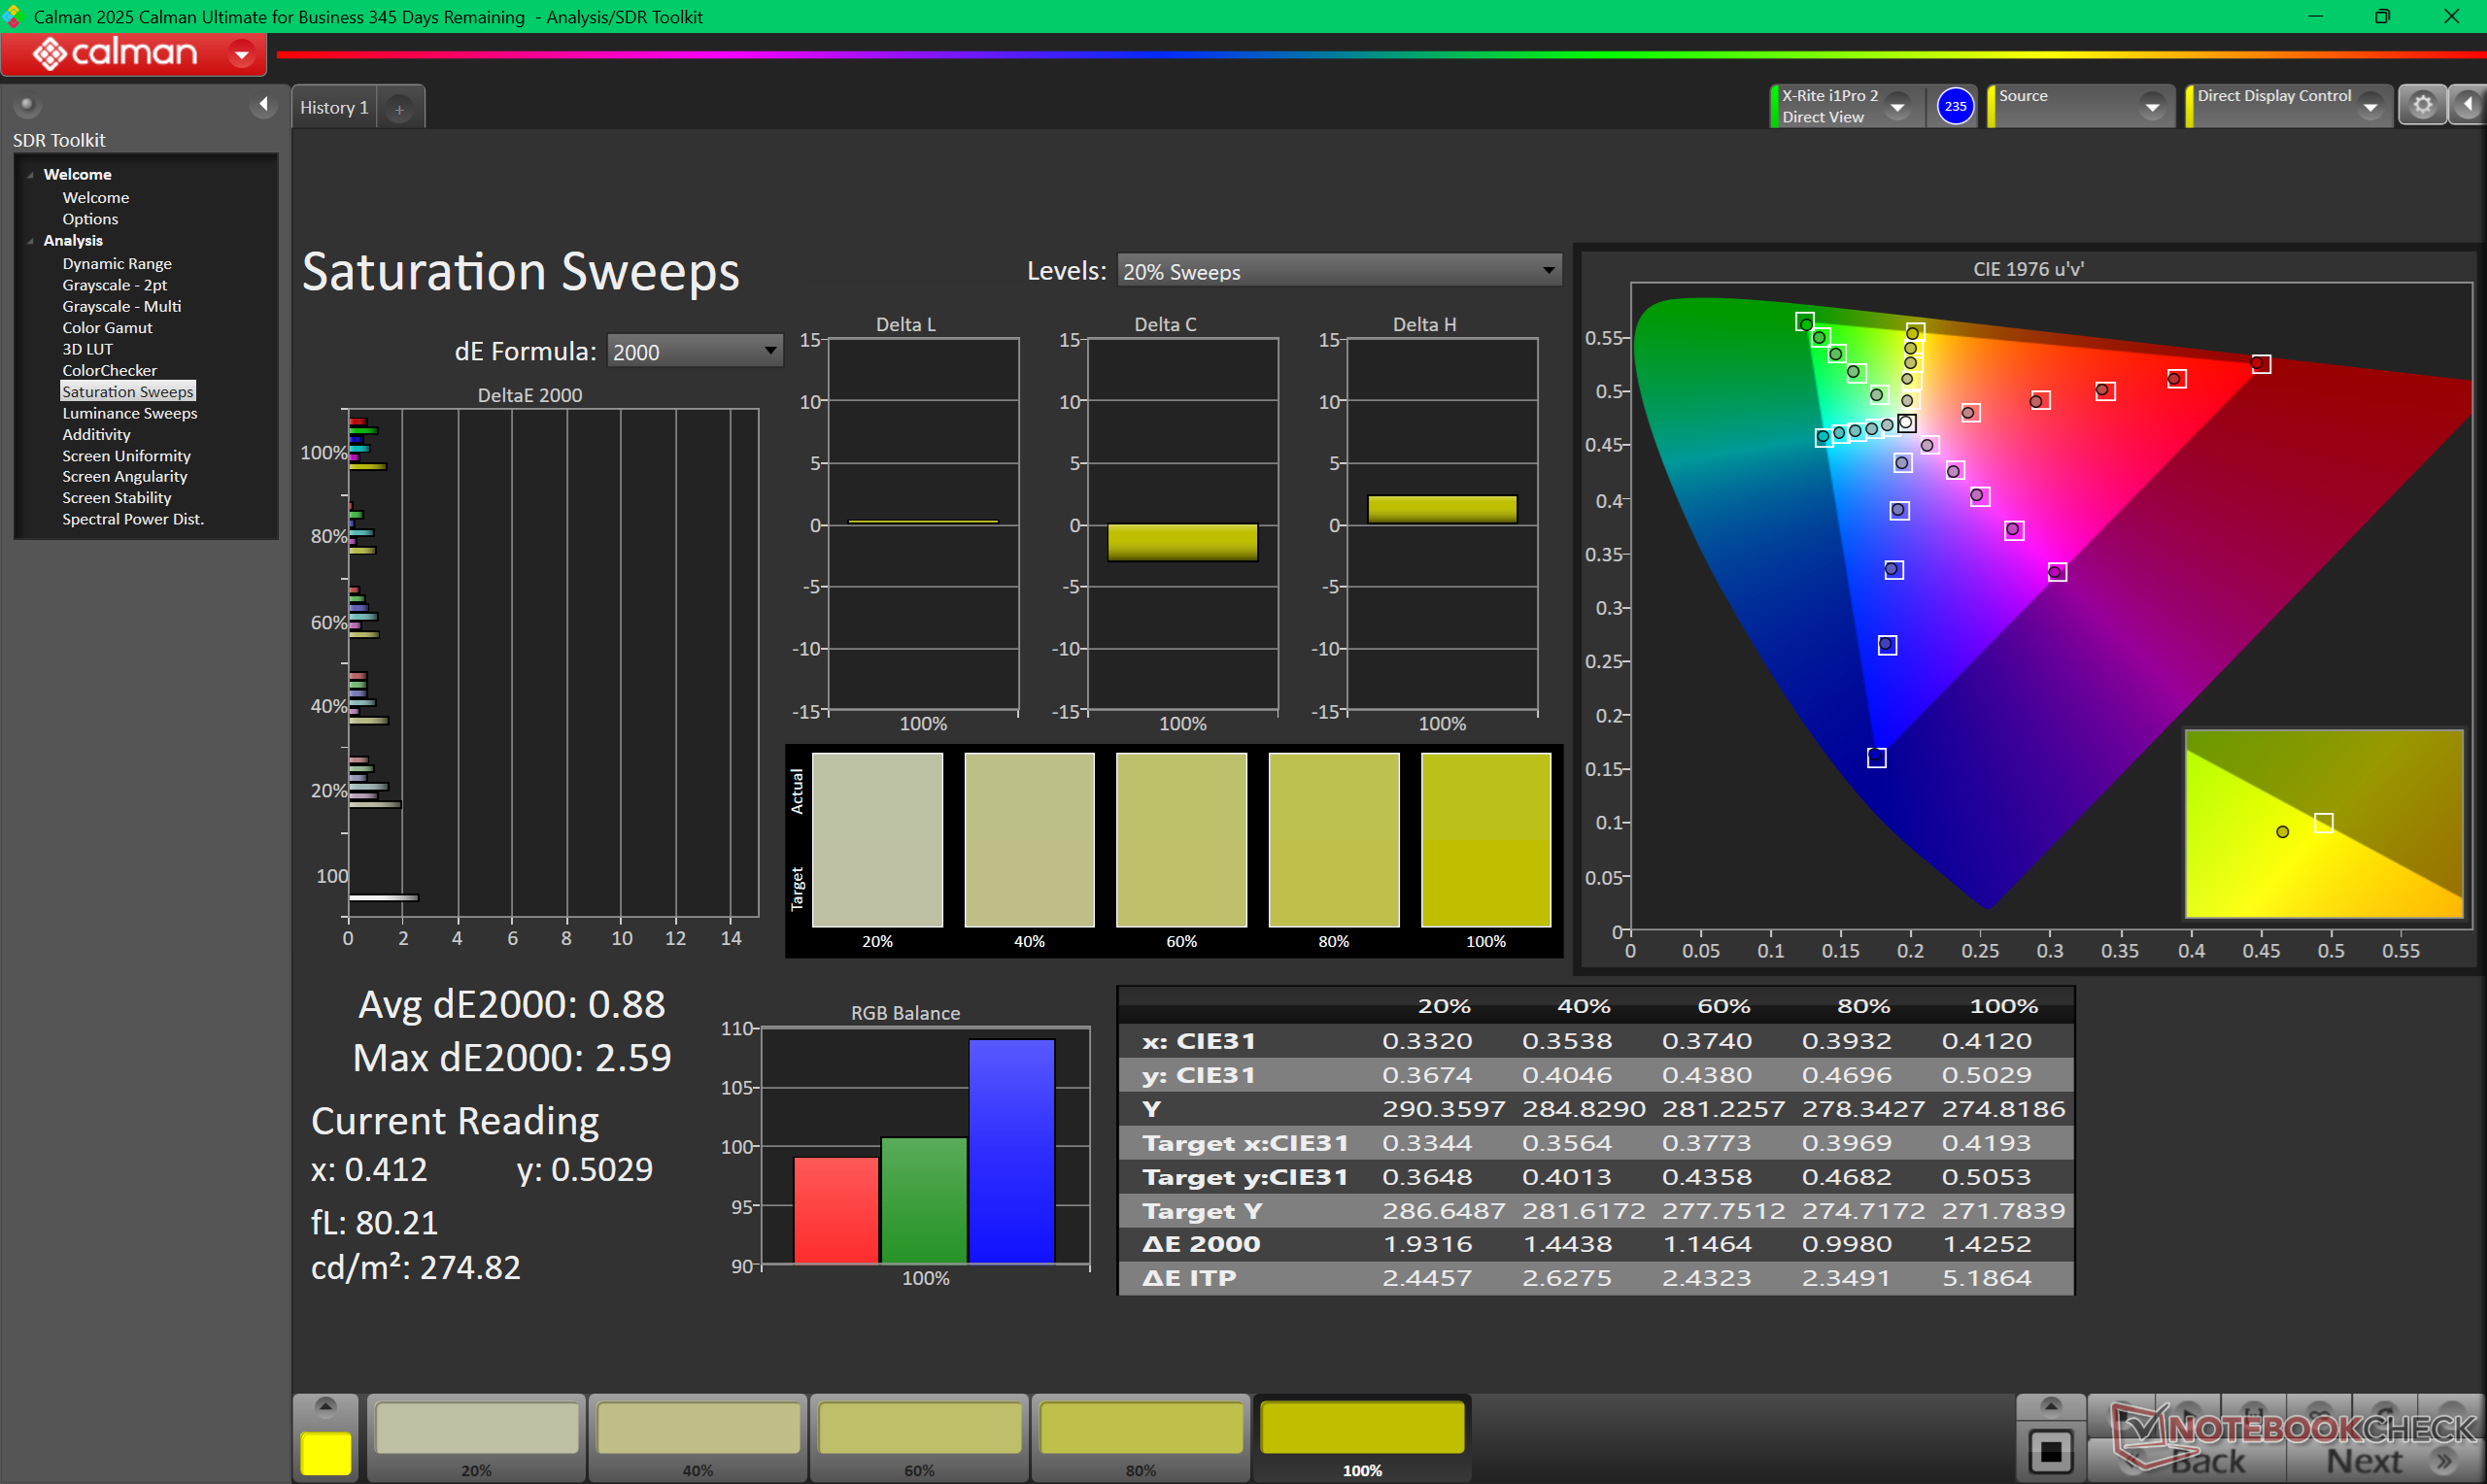
虽然显示器的开箱校准效果不错,但仍有改进的余地。使用 X-Rite 色差计自行校准面板,可将平均灰度和色彩 deltaE 值分别从 2.5 和 2.09 提高到 1.7 和 1.09,同时还可将色温提高到 6500K 目标值。


Display Response Times
| ↔ Response Time Black to White | ||
|---|---|---|
| 38.8 ms ... rise ↗ and fall ↘ combined | ↗ 17 ms rise | 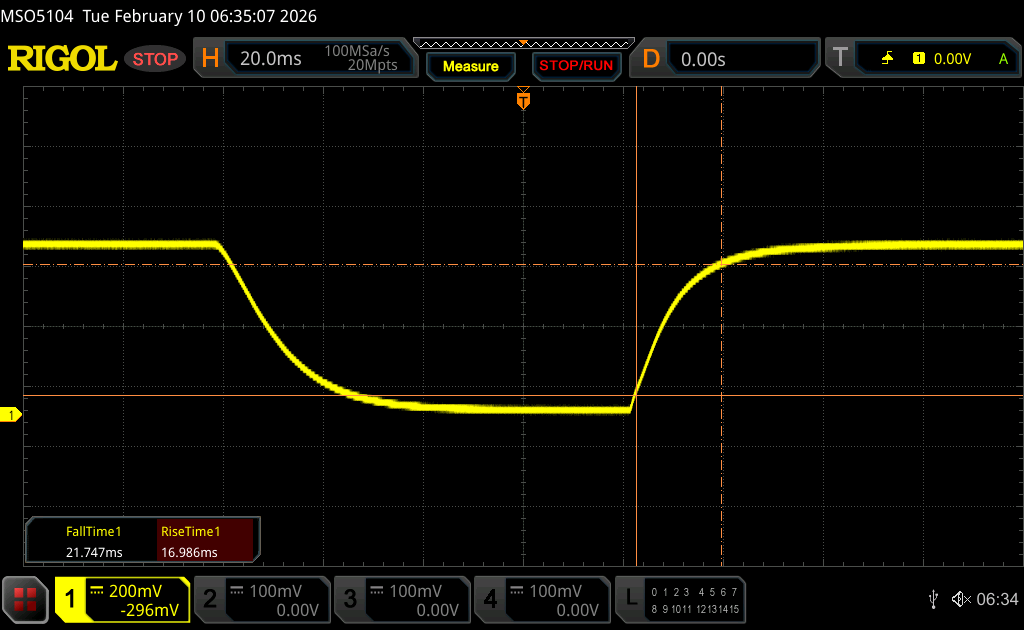 |
| ↘ 21.8 ms fall | ||
| The screen shows slow response rates in our tests and will be unsatisfactory for gamers. In comparison, all tested devices range from 0.1 (minimum) to 240 (maximum) ms. » 96 % of all devices are better. This means that the measured response time is worse than the average of all tested devices (19.9 ms). | ||
| ↔ Response Time 50% Grey to 80% Grey | ||
| 57.7 ms ... rise ↗ and fall ↘ combined | ↗ 26.4 ms rise | 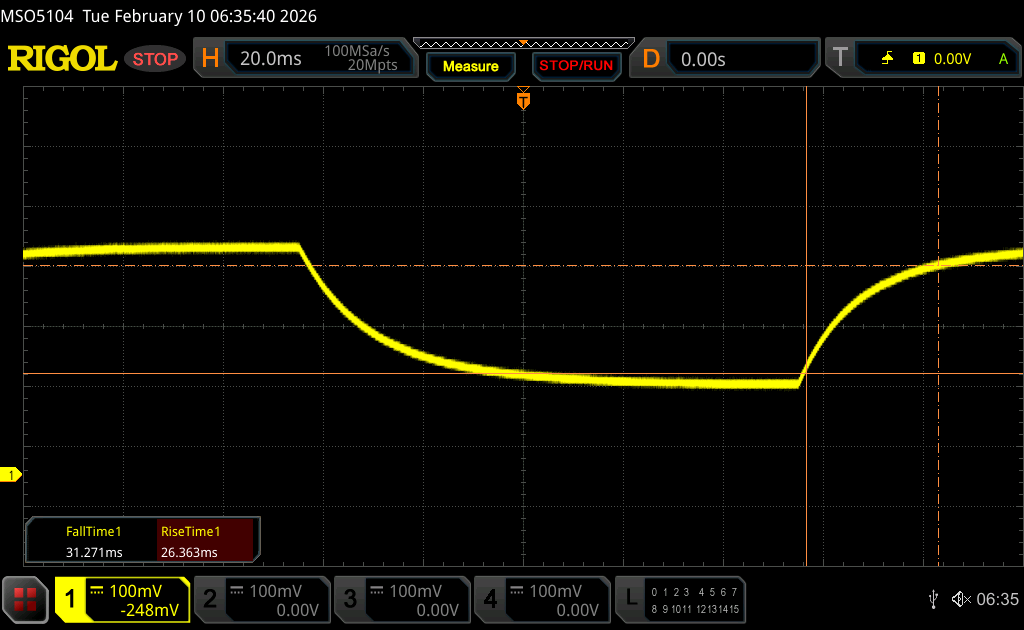 |
| ↘ 31.3 ms fall | ||
| The screen shows slow response rates in our tests and will be unsatisfactory for gamers. In comparison, all tested devices range from 0.165 (minimum) to 636 (maximum) ms. » 94 % of all devices are better. This means that the measured response time is worse than the average of all tested devices (31.1 ms). | ||
Screen Flickering / PWM (Pulse-Width Modulation)
| Screen flickering / PWM not detected | 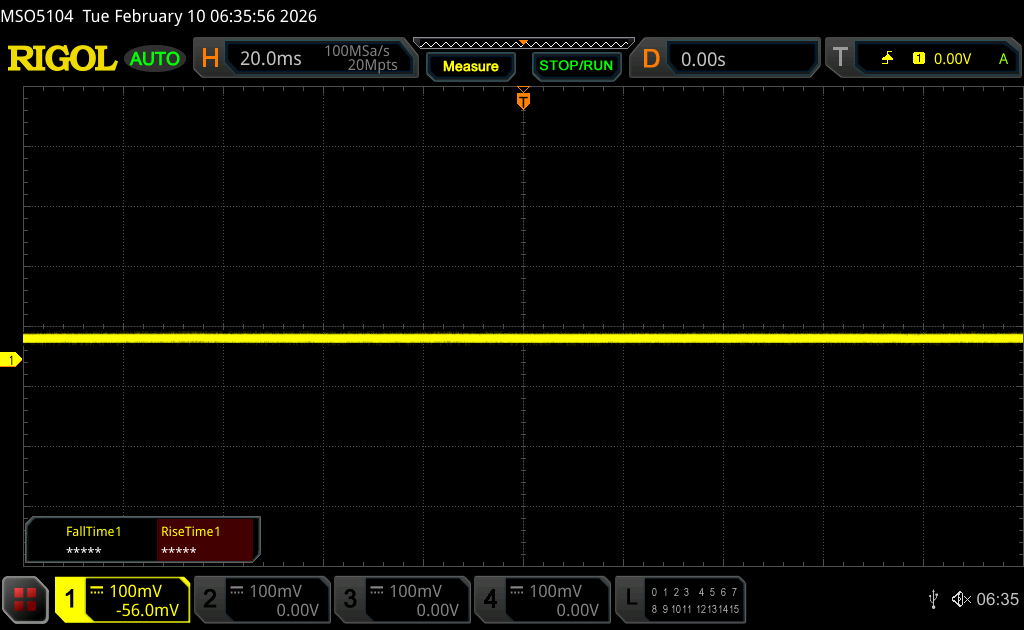 | ||
In comparison: 52 % of all tested devices do not use PWM to dim the display. If PWM was detected, an average of 7784 (minimum: 5 - maximum: 343500) Hz was measured. | |||


性能
测试条件
在运行以下基准测试之前,我们将 Windows 和戴尔优化大师设置为性能模式。
处理器
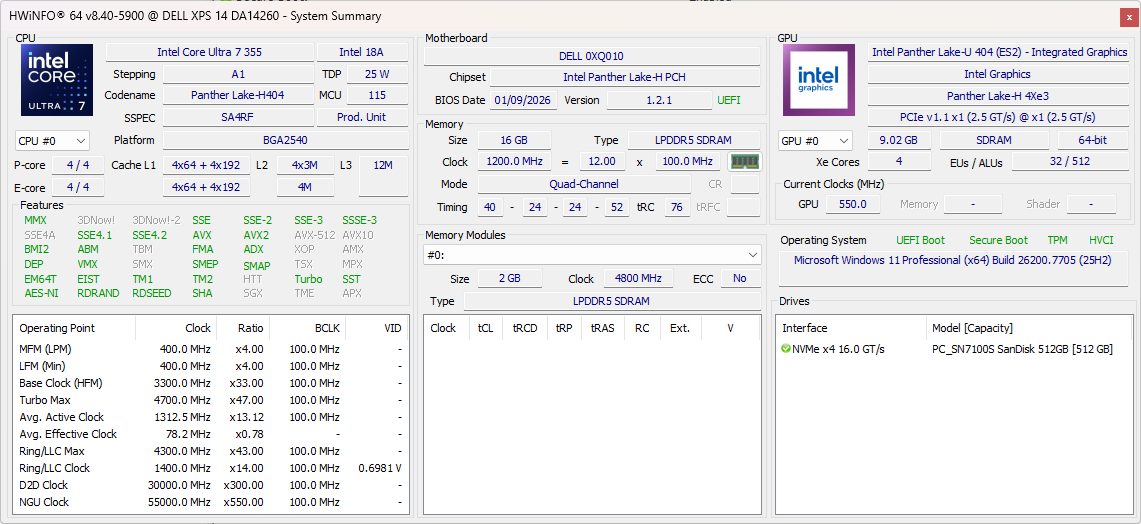
我们的 Core Ultra 7 355比 Core Ultra X7 358HXPS 14 的配置几乎与运行较旧的 Arrow Lake-U 处理器的笔记本电脑相同 酷睿至尊 7 255U或 Lunar Lake-V 酷睿至尊 7 258V的笔记本电脑几乎完全相同,因此每年的收益微乎其微。从下面的 CineBench R15 xT 循环图可以看出,Turbo Boost 的潜力也比 Core Ultra X7 配置有限得多。
Cinebench R15 多回路运行
Cinebench R23: Multi Core | Single Core
Cinebench R20: CPU (Multi Core) | CPU (Single Core)
Cinebench R15: CPU Multi 64Bit | CPU Single 64Bit
Blender: v2.79 BMW27 CPU
7-Zip 18.03: 7z b 4 | 7z b 4 -mmt1
Geekbench 6.7: Multi-Core | Single-Core
Geekbench 5.5: Multi-Core | Single-Core
HWBOT x265 Benchmark v2.2: 4k Preset
LibreOffice : 20 Documents To PDF
R Benchmark 2.5: Overall mean
* ... smaller is better
AIDA64: FP32 Ray-Trace | FPU Julia | CPU SHA3 | CPU Queen | FPU SinJulia | FPU Mandel | CPU AES | CPU ZLib | FP64 Ray-Trace | CPU PhotoWorxx | CPU CheckMate
| Performance rating | |
| Asus ExpertBook PM3406 -1! | |
| Dell XPS 14 Core Ultra X7 358H | |
| HP OmniBook Ultra Flip 14 -1! | |
| Lenovo ThinkPad T14 Gen 6 21QG001VGE -1! | |
| Average Intel Core Ultra 7 355 | |
| Dell XPS 14 Core Ultra 7 355 | |
| Samsung Galaxy Book5 Pro 14 940XHA -1! | |
| AIDA64 / FP32 Ray-Trace | |
| Asus ExpertBook PM3406 (v6.92.6600) | |
| Dell XPS 14 Core Ultra X7 358H (v8.20.8100) | |
| HP OmniBook Ultra Flip 14 (v6.92.6600) | |
| Lenovo ThinkPad T14 Gen 6 21QG001VGE (v6.92.6600) | |
| Average Intel Core Ultra 7 355 (12228 - 12838, n=3) | |
| Dell XPS 14 Core Ultra 7 355 (v8.20.8100) | |
| Samsung Galaxy Book5 Pro 14 940XHA (v6.92.6600) | |
| AIDA64 / FPU Julia | |
| Asus ExpertBook PM3406 (v6.92.6600) | |
| Dell XPS 14 Core Ultra X7 358H (v8.20.8100) | |
| Dell XPS 14 Core Ultra 7 355 (v8.20.8100) | |
| Average Intel Core Ultra 7 355 (60741 - 65963, n=3) | |
| Lenovo ThinkPad T14 Gen 6 21QG001VGE (v6.92.6600) | |
| HP OmniBook Ultra Flip 14 (v6.92.6600) | |
| Samsung Galaxy Book5 Pro 14 940XHA (v6.92.6600) | |
| AIDA64 / CPU SHA3 | |
| Dell XPS 14 Core Ultra X7 358H (v8.20.8100) | |
| Asus ExpertBook PM3406 (v6.92.6600) | |
| HP OmniBook Ultra Flip 14 (v6.92.6600) | |
| Average Intel Core Ultra 7 355 (2763 - 2845, n=3) | |
| Dell XPS 14 Core Ultra 7 355 (v8.20.8100) | |
| Lenovo ThinkPad T14 Gen 6 21QG001VGE (v6.92.6600) | |
| Samsung Galaxy Book5 Pro 14 940XHA (v6.92.6600) | |
| AIDA64 / CPU Queen | |
| Asus ExpertBook PM3406 (v6.92.6600) | |
| Dell XPS 14 Core Ultra X7 358H (v6.92.6600) | |
| HP OmniBook Ultra Flip 14 (v6.92.6600) | |
| Lenovo ThinkPad T14 Gen 6 21QG001VGE (v6.92.6600) | |
| Samsung Galaxy Book5 Pro 14 940XHA (v6.92.6600) | |
| Dell XPS 14 Core Ultra 7 355 (v6.92.6600) | |
| Average Intel Core Ultra 7 355 (n=1) | |
| AIDA64 / FPU SinJulia | |
| Asus ExpertBook PM3406 (v6.92.6600) | |
| Dell XPS 14 Core Ultra X7 358H (v8.20.8100) | |
| Average Intel Core Ultra 7 355 (4597 - 4601, n=3) | |
| Dell XPS 14 Core Ultra 7 355 (v8.20.8100) | |
| HP OmniBook Ultra Flip 14 (v6.92.6600) | |
| Lenovo ThinkPad T14 Gen 6 21QG001VGE (v6.92.6600) | |
| Samsung Galaxy Book5 Pro 14 940XHA (v6.92.6600) | |
| AIDA64 / FPU Mandel | |
| Asus ExpertBook PM3406 (v6.92.6600) | |
| Dell XPS 14 Core Ultra X7 358H (v8.20.8100) | |
| Dell XPS 14 Core Ultra 7 355 (v8.20.8100) | |
| Average Intel Core Ultra 7 355 (32404 - 35293, n=3) | |
| Lenovo ThinkPad T14 Gen 6 21QG001VGE (v6.92.6600) | |
| HP OmniBook Ultra Flip 14 (v6.92.6600) | |
| Samsung Galaxy Book5 Pro 14 940XHA (v6.92.6600) | |
| AIDA64 / CPU AES | |
| Asus ExpertBook PM3406 (v6.92.6600) | |
| Dell XPS 14 Core Ultra X7 358H (v8.20.8100) | |
| HP OmniBook Ultra Flip 14 (v6.92.6600) | |
| Lenovo ThinkPad T14 Gen 6 21QG001VGE (v6.92.6600) | |
| Average Intel Core Ultra 7 355 (39050 - 39424, n=3) | |
| Dell XPS 14 Core Ultra 7 355 (v8.20.8100) | |
| Samsung Galaxy Book5 Pro 14 940XHA (v6.92.6600) | |
| AIDA64 / CPU ZLib | |
| Dell XPS 14 Core Ultra X7 358H (v8.20.8100) | |
| Asus ExpertBook PM3406 (v6.92.6600) | |
| Average Intel Core Ultra 7 355 (635 - 646, n=3) | |
| Dell XPS 14 Core Ultra 7 355 (v8.20.8100) | |
| HP OmniBook Ultra Flip 14 (v6.92.6600) | |
| Lenovo ThinkPad T14 Gen 6 21QG001VGE (v6.92.6600) | |
| Samsung Galaxy Book5 Pro 14 940XHA (v6.92.6600) | |
| AIDA64 / FP64 Ray-Trace | |
| Asus ExpertBook PM3406 (v6.92.6600) | |
| Dell XPS 14 Core Ultra X7 358H (v8.20.8100) | |
| Lenovo ThinkPad T14 Gen 6 21QG001VGE (v6.92.6600) | |
| HP OmniBook Ultra Flip 14 (v6.92.6600) | |
| Dell XPS 14 Core Ultra 7 355 (v8.20.8100) | |
| Average Intel Core Ultra 7 355 (6147 - 6833, n=3) | |
| Samsung Galaxy Book5 Pro 14 940XHA (v6.92.6600) | |
| AIDA64 / CPU PhotoWorxx | |
| Dell XPS 14 Core Ultra X7 358H (v8.20.8100) | |
| Average Intel Core Ultra 7 355 (57998 - 60440, n=3) | |
| Dell XPS 14 Core Ultra 7 355 (v8.20.8100) | |
| Lenovo ThinkPad T14 Gen 6 21QG001VGE (v6.92.6600) | |
| HP OmniBook Ultra Flip 14 (v6.92.6600) | |
| Samsung Galaxy Book5 Pro 14 940XHA (v6.92.6600) | |
| Asus ExpertBook PM3406 (v6.92.6600) | |
| AIDA64 / CPU CheckMate | |
| Dell XPS 14 Core Ultra X7 358H (v8.20.8100) | |
| Average Intel Core Ultra 7 355 (2790 - 2813, n=3) | |
| Dell XPS 14 Core Ultra 7 355 (v8.20.8100) | |
系统性能
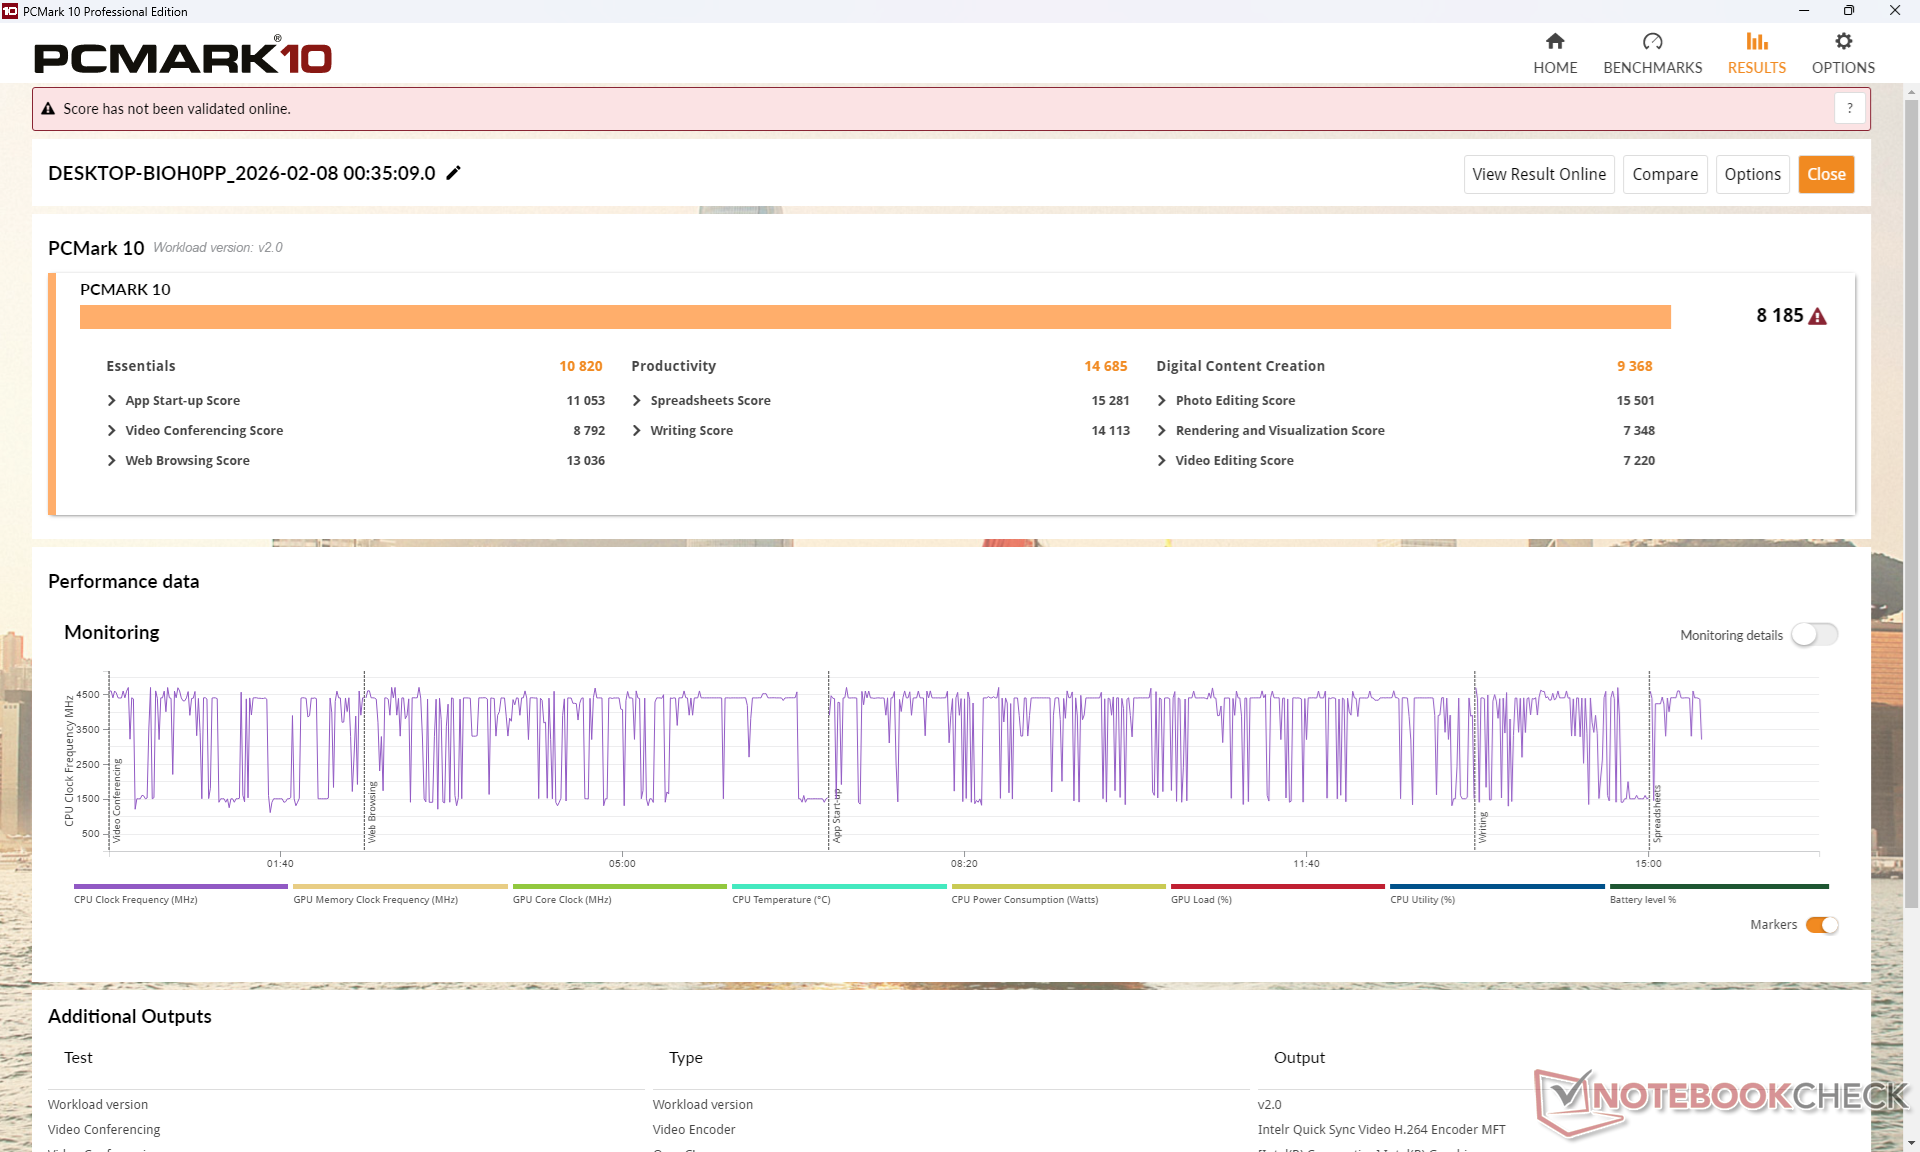
PCMark 10: Score | Essentials | Productivity | Digital Content Creation
CrossMark: Overall | Productivity | Creativity | Responsiveness
WebXPRT 3: Overall
WebXPRT 4: Overall
Mozilla Kraken 1.1: Total
Geekbench AI: Single Precision GPU 1.7 | Half Precision GPU 1.7 | Quantized GPU 1.7
| PCMark 10 / Score | |
| Dell XPS 14 Core Ultra X7 358H | |
| Asus ExpertBook PM3406 | |
| Dell XPS 14 Core Ultra 7 355 | |
| Lenovo ThinkPad T14 Gen 6 21QG001VGE | |
| Samsung Galaxy Book5 Pro 14 940XHA | |
| HP OmniBook Ultra Flip 14 | |
| PCMark 10 / Essentials | |
| Dell XPS 14 Core Ultra X7 358H | |
| Asus ExpertBook PM3406 | |
| Dell XPS 14 Core Ultra 7 355 | |
| Lenovo ThinkPad T14 Gen 6 21QG001VGE | |
| Samsung Galaxy Book5 Pro 14 940XHA | |
| HP OmniBook Ultra Flip 14 | |
| CrossMark / Overall | |
| Dell XPS 14 Core Ultra X7 358H | |
| Lenovo ThinkPad T14 Gen 6 21QG001VGE | |
| Dell XPS 14 Core Ultra 7 355 | |
| HP OmniBook Ultra Flip 14 | |
| Samsung Galaxy Book5 Pro 14 940XHA | |
| Asus ExpertBook PM3406 | |
| CrossMark / Creativity | |
| Dell XPS 14 Core Ultra X7 358H | |
| Lenovo ThinkPad T14 Gen 6 21QG001VGE | |
| HP OmniBook Ultra Flip 14 | |
| Dell XPS 14 Core Ultra 7 355 | |
| Samsung Galaxy Book5 Pro 14 940XHA | |
| Asus ExpertBook PM3406 | |
| WebXPRT 3 / Overall | |
| Dell XPS 14 Core Ultra X7 358H | |
| Dell XPS 14 Core Ultra 7 355 | |
| Lenovo ThinkPad T14 Gen 6 21QG001VGE | |
| Samsung Galaxy Book5 Pro 14 940XHA | |
| HP OmniBook Ultra Flip 14 | |
| Asus ExpertBook PM3406 | |
| WebXPRT 4 / Overall | |
| Dell XPS 14 Core Ultra X7 358H | |
| Dell XPS 14 Core Ultra 7 355 | |
| Lenovo ThinkPad T14 Gen 6 21QG001VGE | |
| HP OmniBook Ultra Flip 14 | |
| Samsung Galaxy Book5 Pro 14 940XHA | |
| Asus ExpertBook PM3406 | |
| Geekbench AI / Single Precision GPU 1.7 | |
| Dell XPS 14 Core Ultra X7 358H | |
| Samsung Galaxy Book5 Pro 14 940XHA | |
| Dell XPS 14 Core Ultra 7 355 | |
| Geekbench AI / Half Precision GPU 1.7 | |
| Dell XPS 14 Core Ultra X7 358H | |
| Samsung Galaxy Book5 Pro 14 940XHA | |
| Dell XPS 14 Core Ultra 7 355 | |
| Geekbench AI / Quantized GPU 1.7 | |
| Dell XPS 14 Core Ultra X7 358H | |
| Samsung Galaxy Book5 Pro 14 940XHA | |
| Dell XPS 14 Core Ultra 7 355 | |
* ... smaller is better
| PCMark 10 Score | 8185 points | |
Help | ||
| AIDA64 / Memory Copy | |
| Dell XPS 14 Core Ultra X7 358H | |
| Lenovo ThinkPad T14 Gen 6 21QG001VGE | |
| HP OmniBook Ultra Flip 14 | |
| Average Intel Core Ultra 7 355 (97301 - 105135, n=3) | |
| Samsung Galaxy Book5 Pro 14 940XHA | |
| Dell XPS 14 Core Ultra 7 355 | |
| Asus ExpertBook PM3406 | |
| AIDA64 / Memory Read | |
| Dell XPS 14 Core Ultra X7 358H | |
| Lenovo ThinkPad T14 Gen 6 21QG001VGE | |
| HP OmniBook Ultra Flip 14 | |
| Samsung Galaxy Book5 Pro 14 940XHA | |
| Average Intel Core Ultra 7 355 (79551 - 85021, n=3) | |
| Dell XPS 14 Core Ultra 7 355 | |
| Asus ExpertBook PM3406 | |
| AIDA64 / Memory Write | |
| Dell XPS 14 Core Ultra X7 358H | |
| Lenovo ThinkPad T14 Gen 6 21QG001VGE | |
| HP OmniBook Ultra Flip 14 | |
| Samsung Galaxy Book5 Pro 14 940XHA | |
| Average Intel Core Ultra 7 355 (103056 - 108621, n=3) | |
| Dell XPS 14 Core Ultra 7 355 | |
| Asus ExpertBook PM3406 | |
| AIDA64 / Memory Latency | |
| Dell XPS 14 Core Ultra 7 355 | |
| Average Intel Core Ultra 7 355 (99.7 - 105.8, n=3) | |
| Lenovo ThinkPad T14 Gen 6 21QG001VGE | |
| HP OmniBook Ultra Flip 14 | |
| Samsung Galaxy Book5 Pro 14 940XHA | |
| Dell XPS 14 Core Ultra X7 358H | |
| Asus ExpertBook PM3406 | |
* ... smaller is better
DPC 延迟
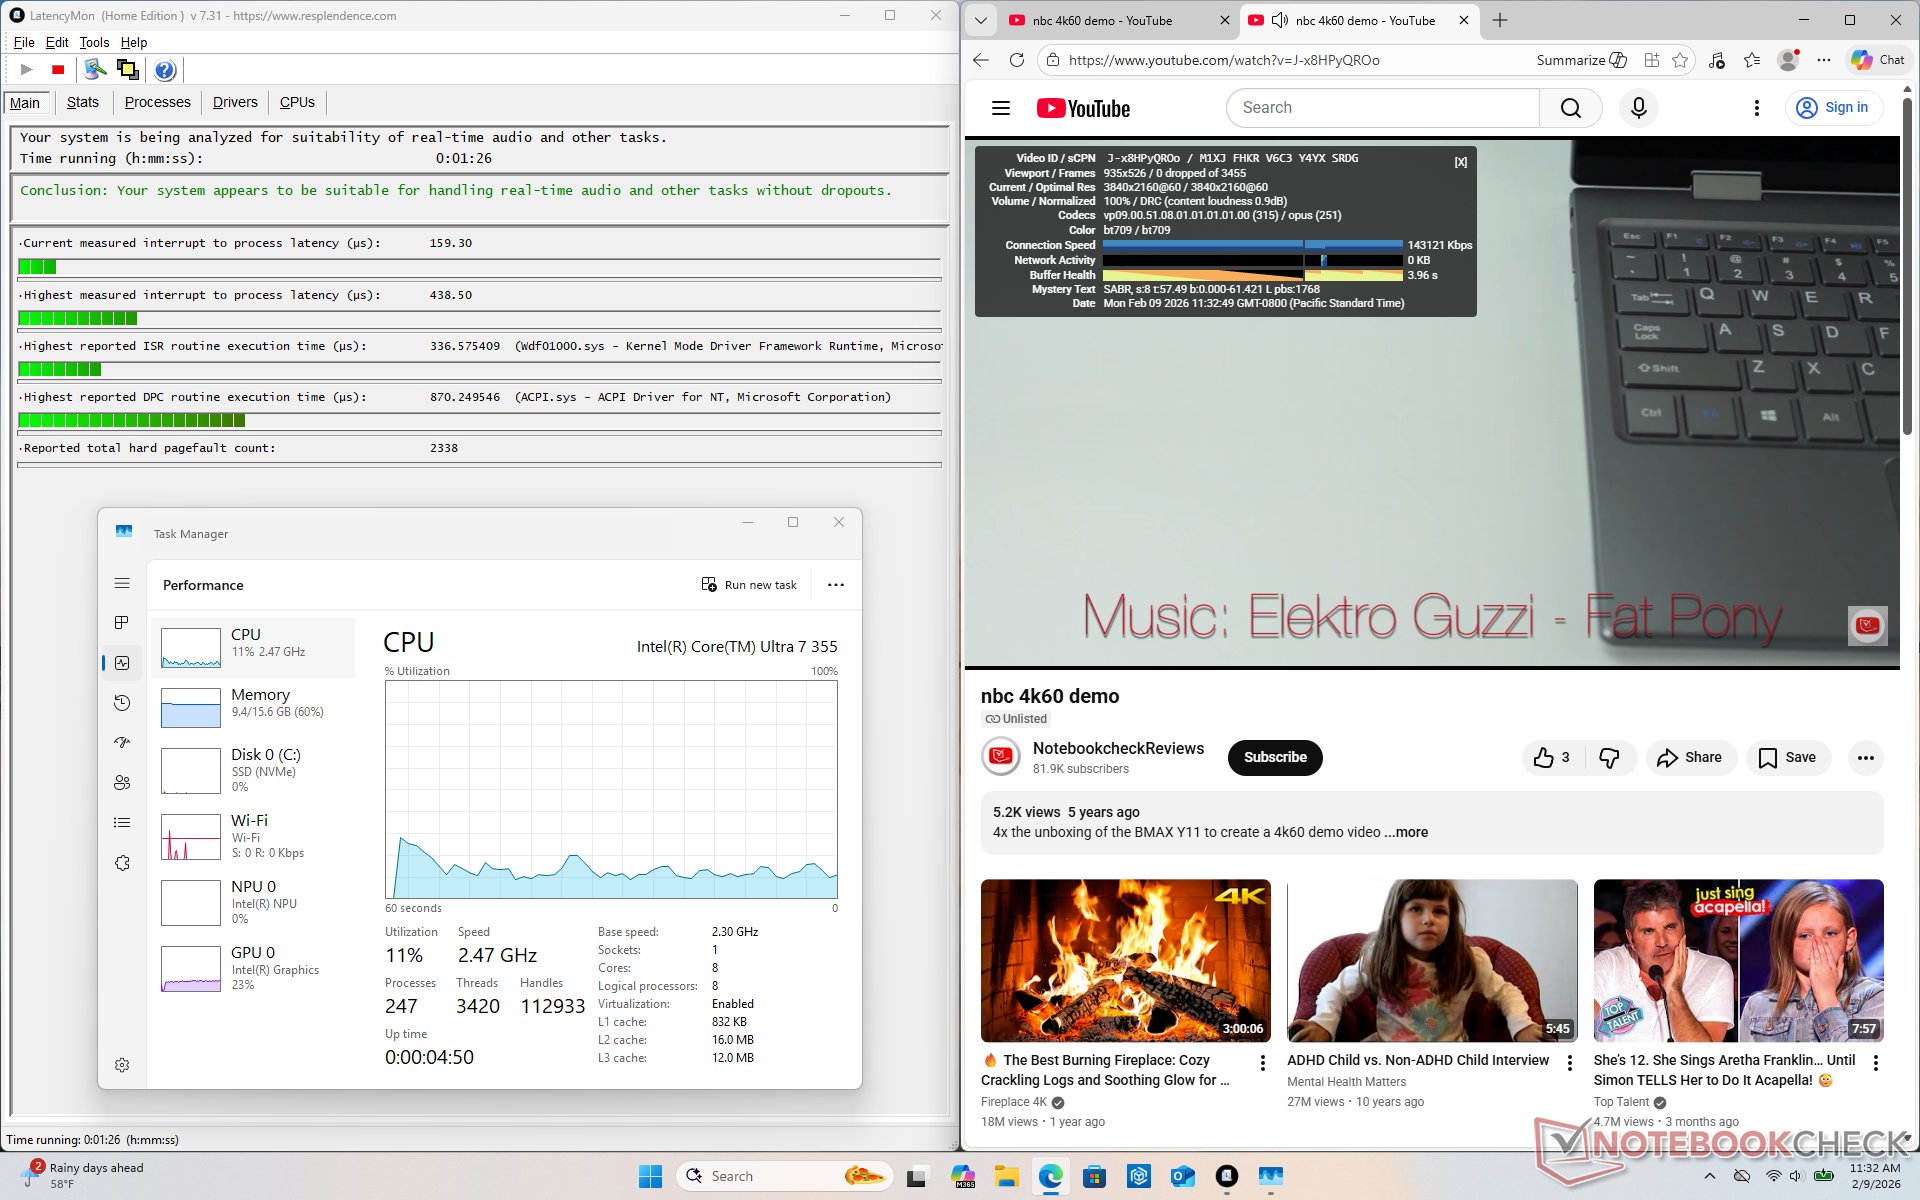
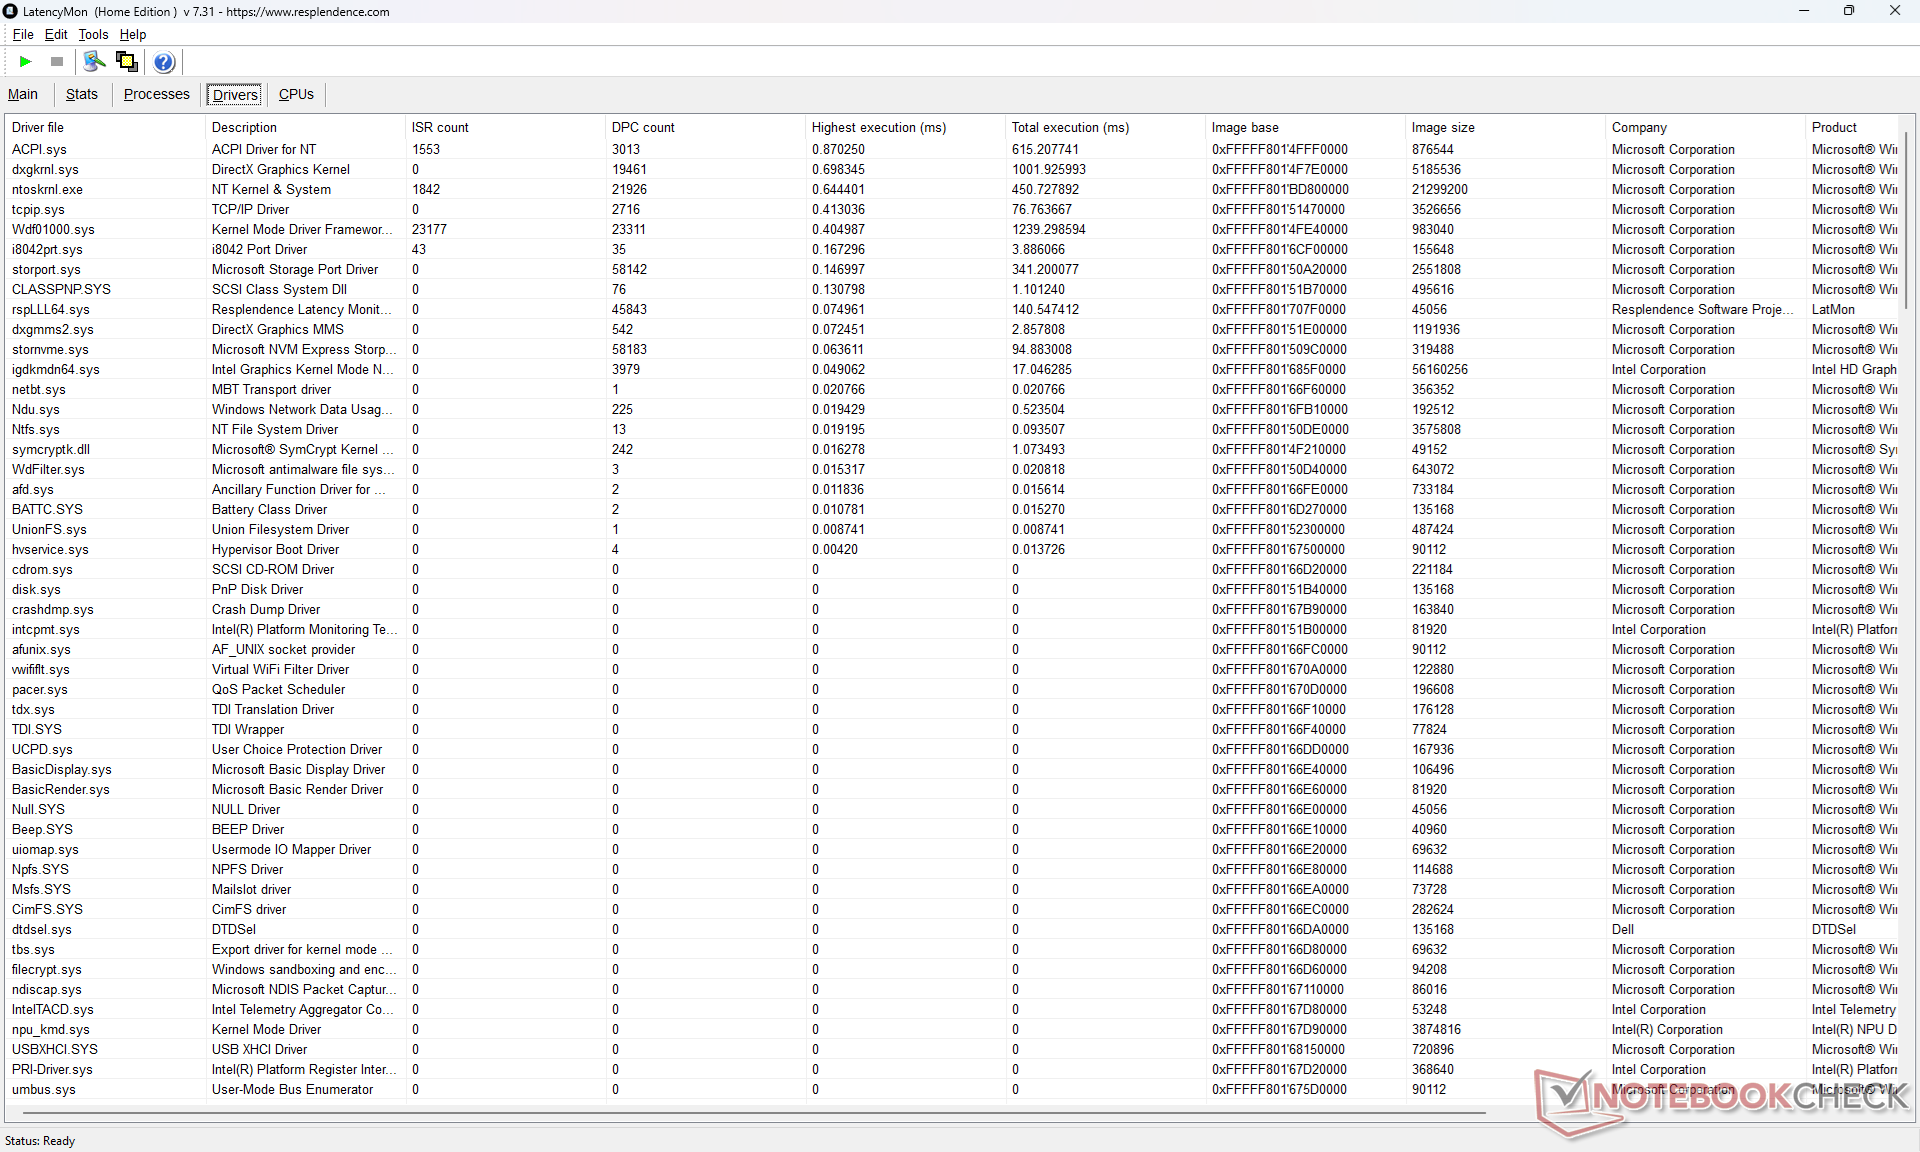
| DPC Latencies / LatencyMon - interrupt to process latency (max), Web, Youtube, Prime95 | |
| Asus ExpertBook PM3406 | |
| Samsung Galaxy Book5 Pro 14 940XHA | |
| Lenovo ThinkPad T14 Gen 6 21QG001VGE | |
| Dell XPS 14 Core Ultra X7 358H | |
| Dell XPS 14 Core Ultra 7 355 | |
* ... smaller is better
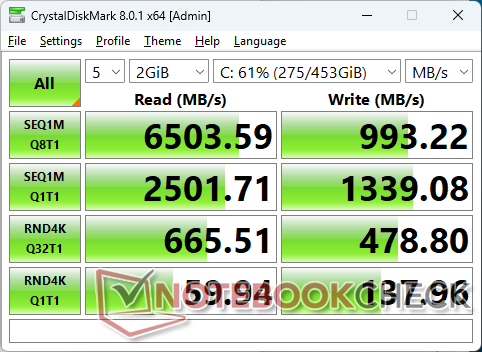
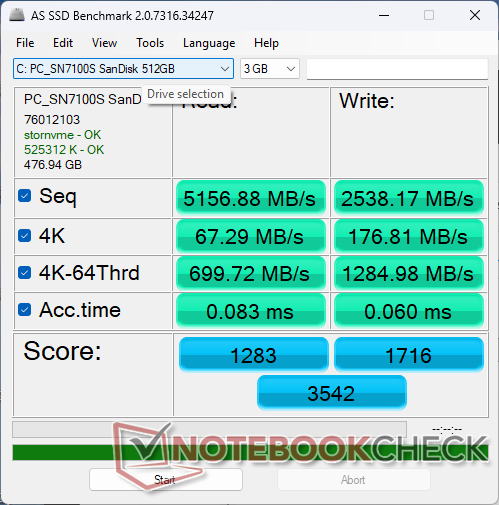
存储设备
我们的设备配有 闪迪 SN7100SPCIe4 x4 NVMe 固态硬盘,而不是酷睿 Ultra X7 XPS 14 配置上的三星 PM9C1b。它们之间的性能非常接近,没有发现明显的节流现象。

* ... smaller is better
磁盘节流DiskSpd 读取循环,队列深度 8
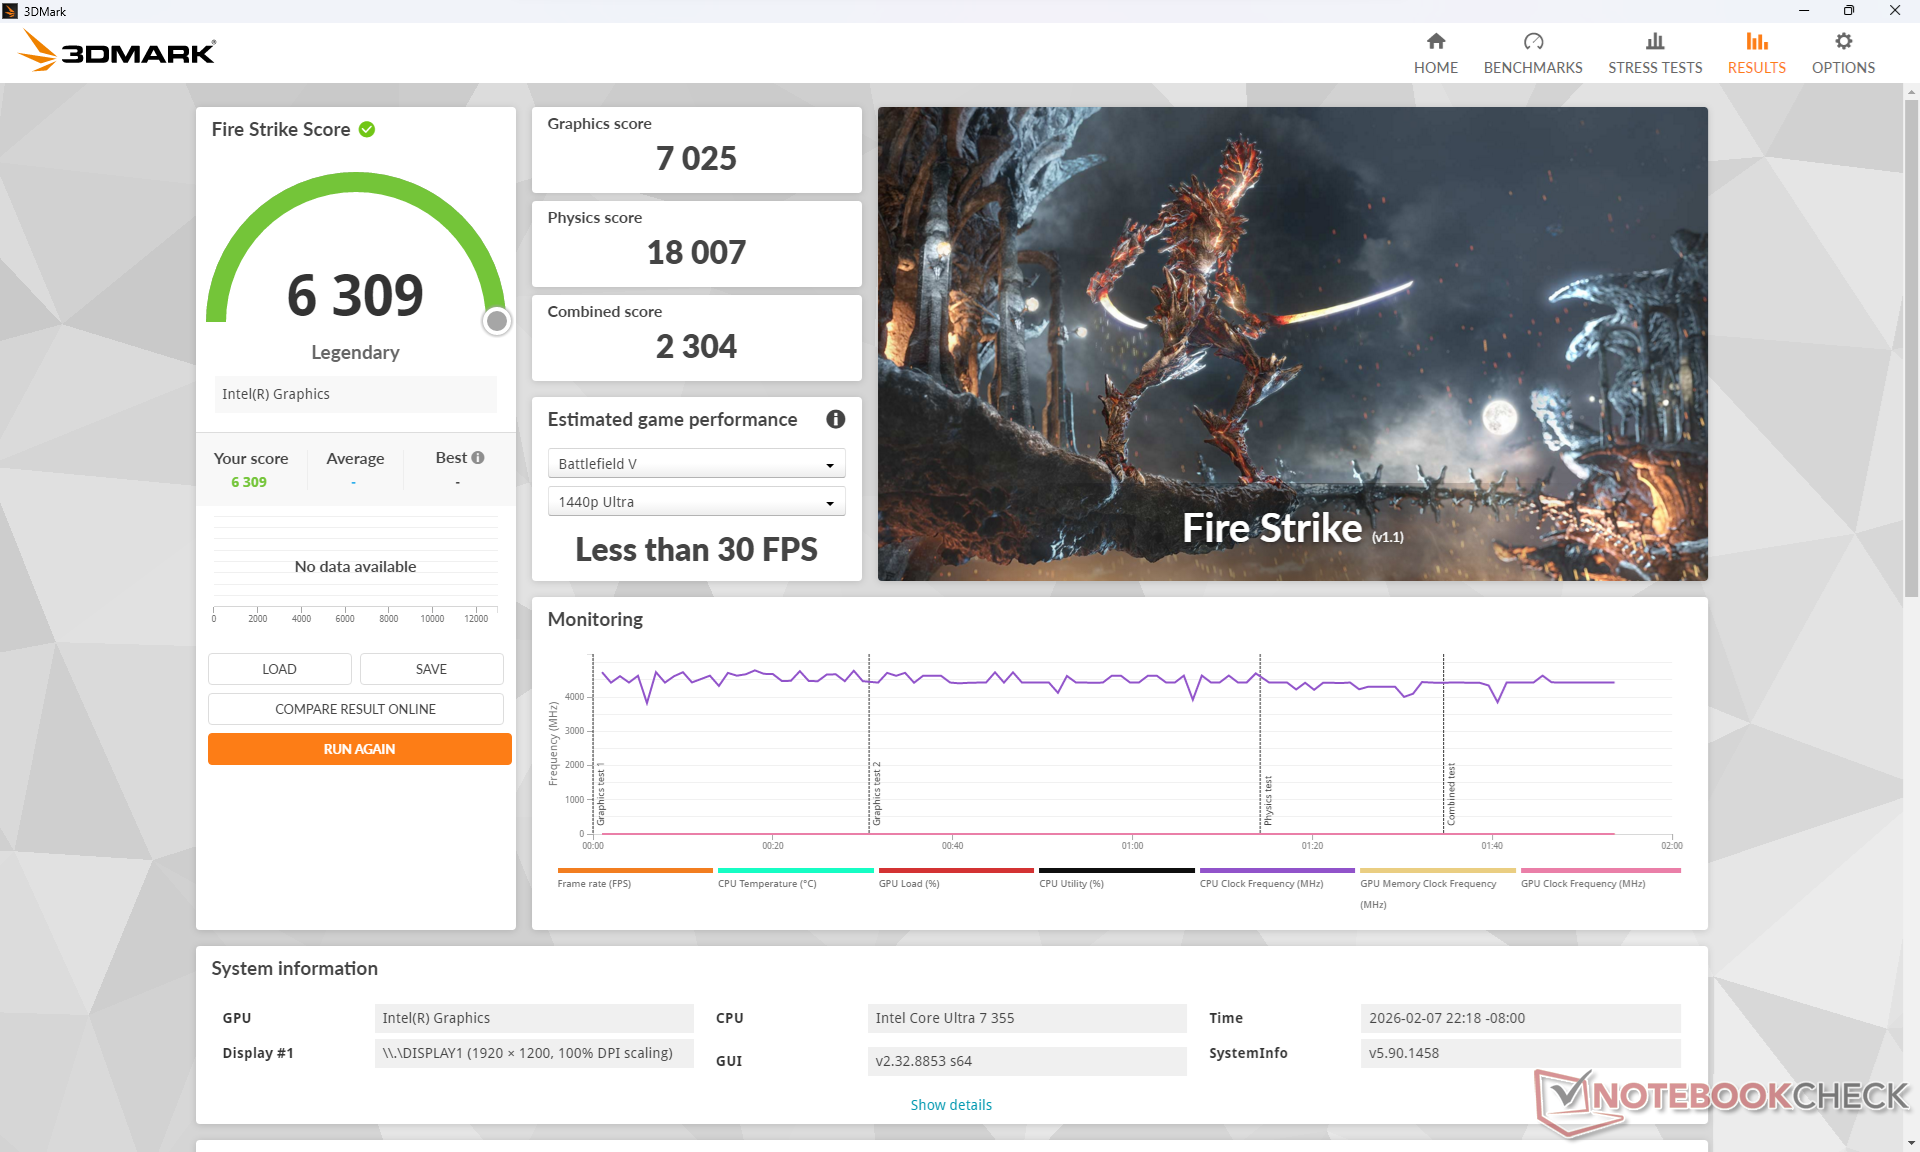
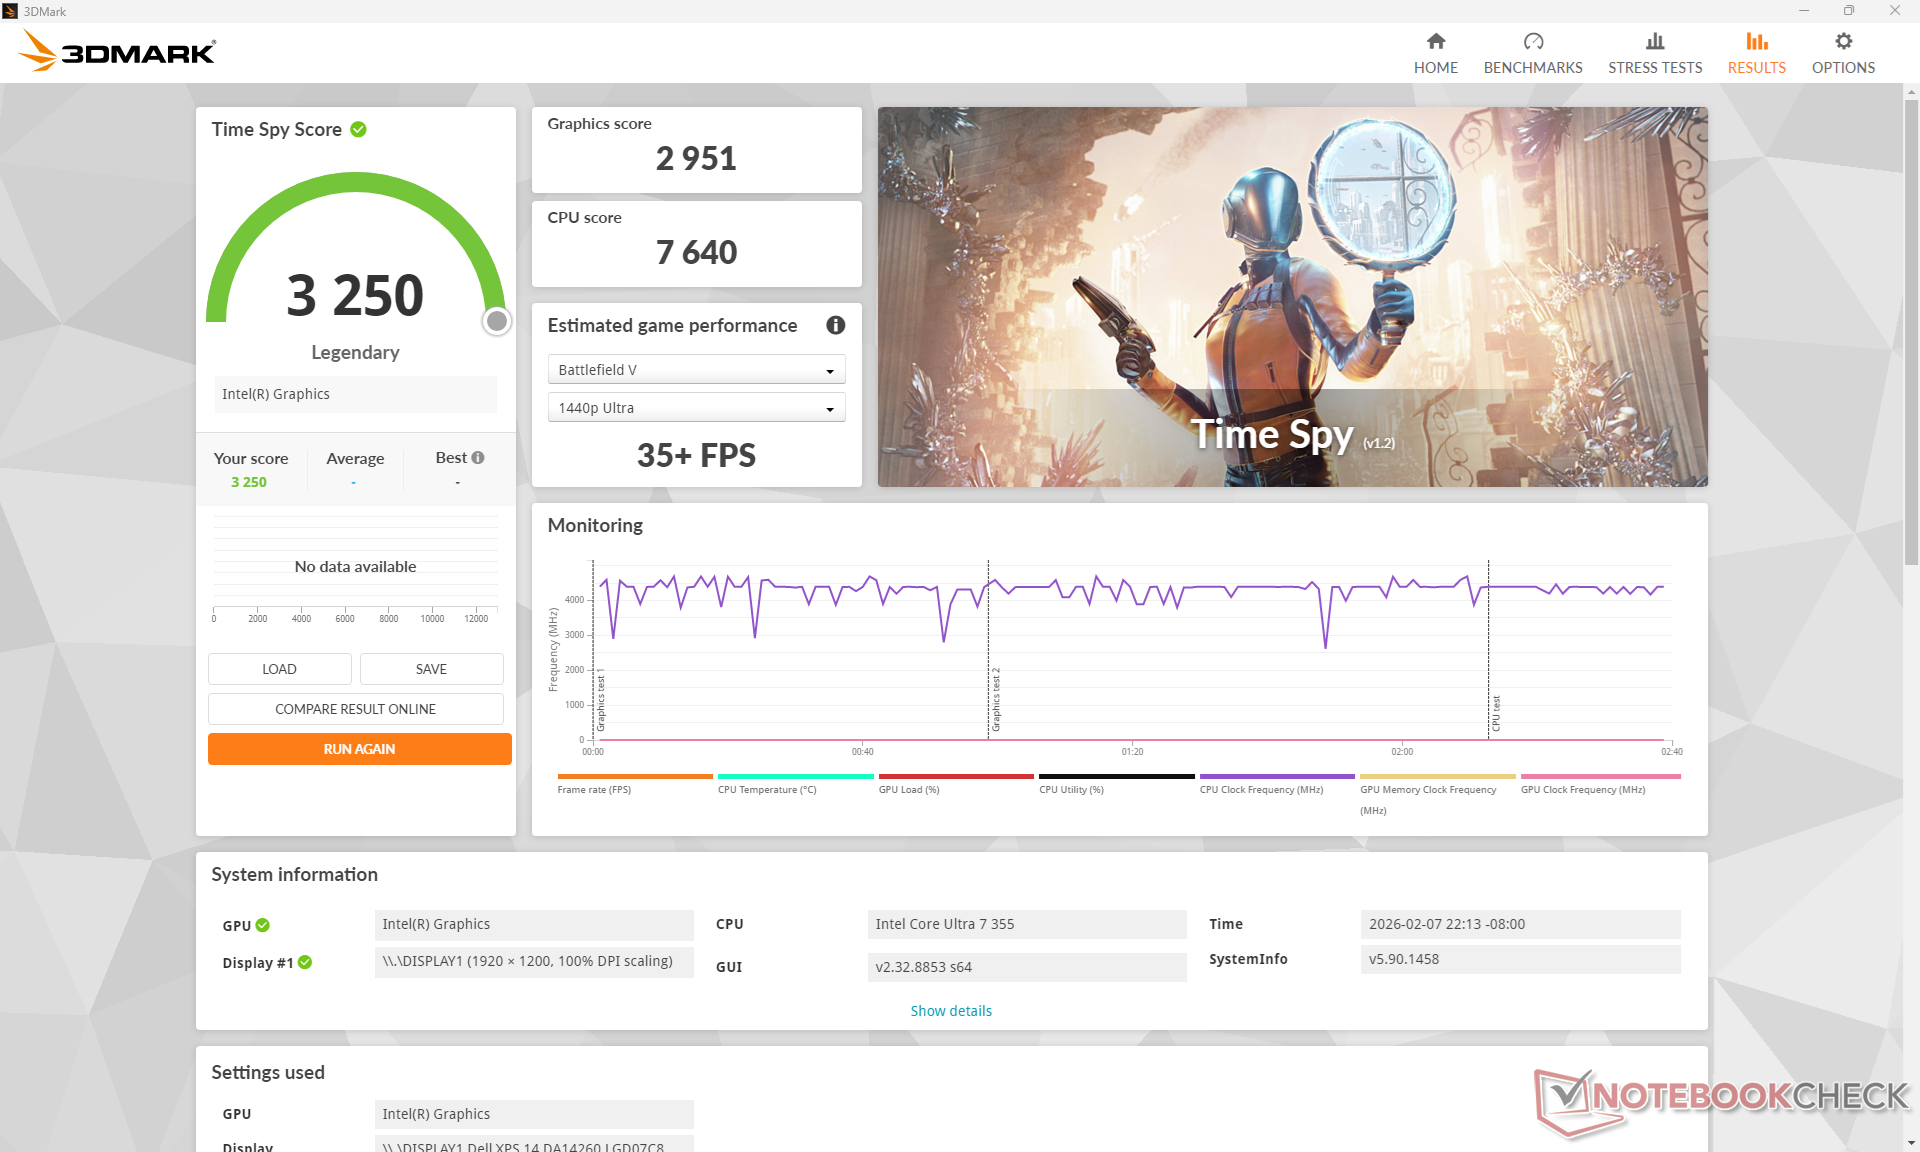
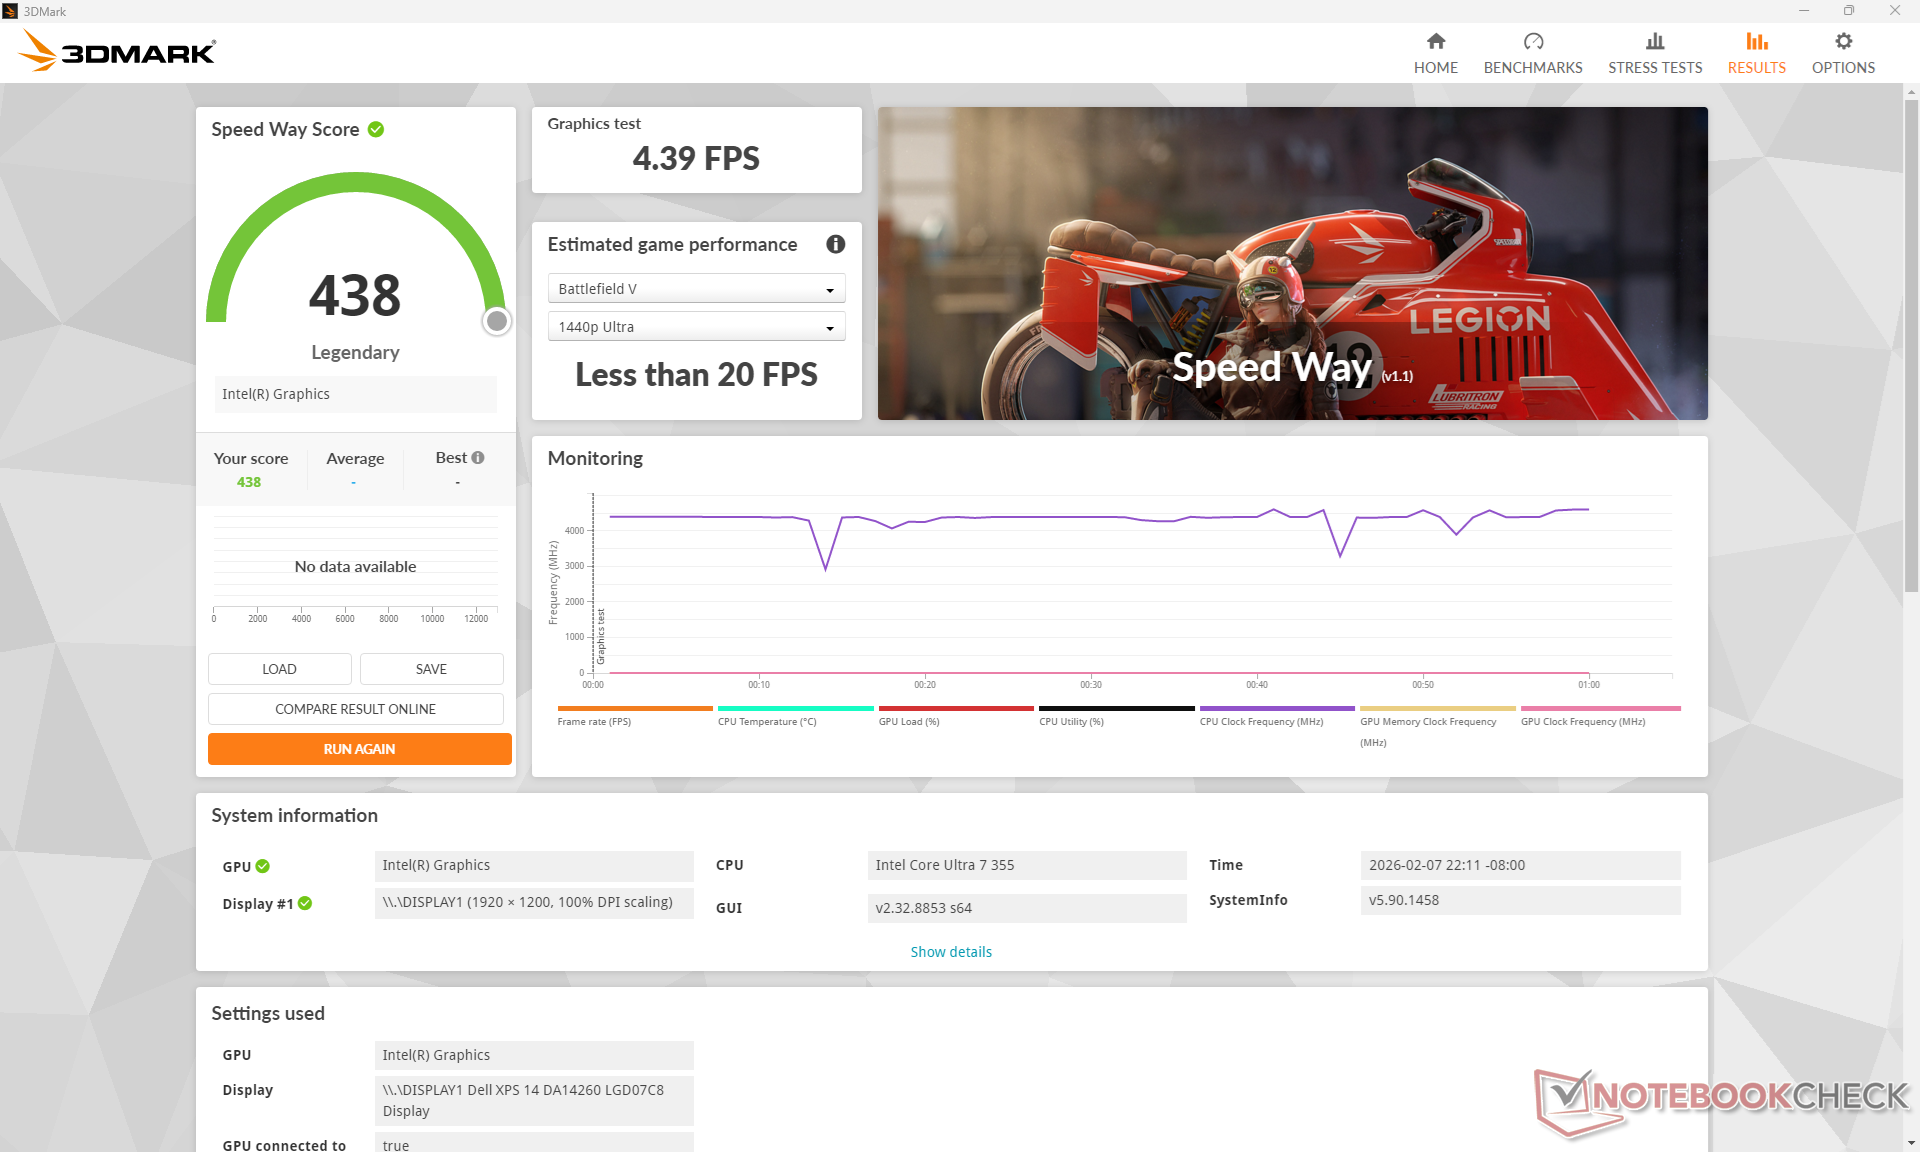
图形处理器性能
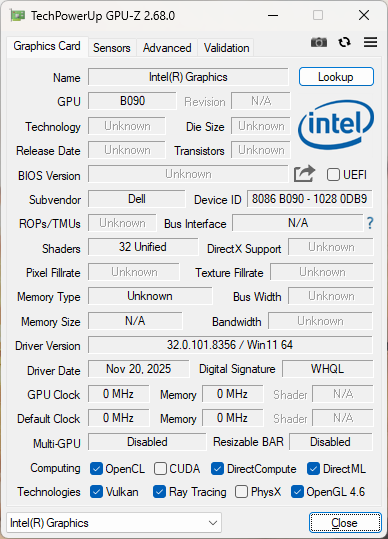
与酷睿 Ultra X7 及其集成的 12 核 Xe3 B390图形处理器不同,酷睿至尊 7 355 配备了 4 核 Xe3iGPU。游戏性能比 12 核 B390 慢约 60%,与 Arc 8 8 大致相当。 弧 8两年前英特尔最快的 iGPU 解决方案。不过,Blender 的渲染速度要慢 2.5 倍,因此 4 核 Xe3 在专业应用中的性能可能会有更大的差距。
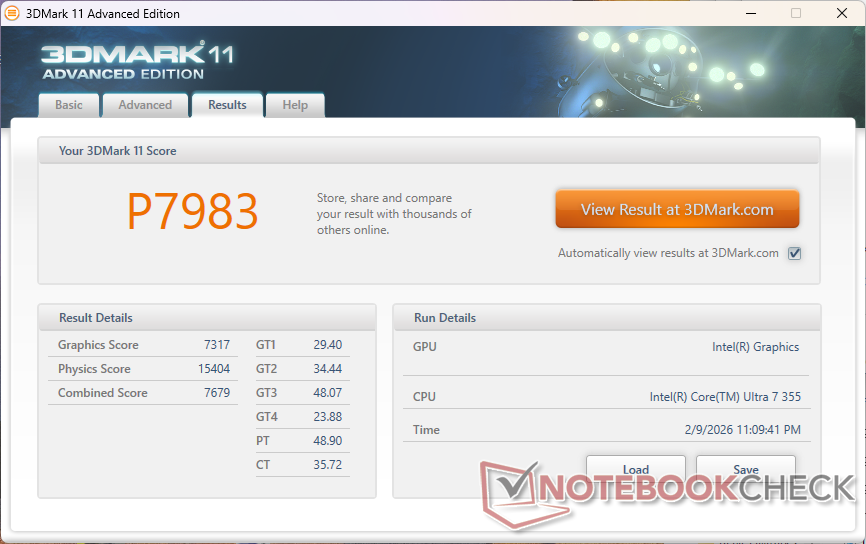
| 3DMark 11 Performance | 7983 points | |
| 3DMark Cloud Gate Standard Score | 28681 points | |
| 3DMark Fire Strike Score | 6309 points | |
| 3DMark Time Spy Score | 3250 points | |
Help | ||
* ... smaller is better
| Cyberpunk 2077 - 1920x1080 Ultra Preset (FSR off) | |
| Dell XPS 14 Core Ultra X7 358H | |
| Lenovo ThinkPad T14 Gen 6 21QG001VGE | |
| Samsung Galaxy Book5 Pro 14 940XHA | |
| HP OmniBook Ultra Flip 14 | |
| Dell XPS 14 Core Ultra 7 355 | |
| Asus ExpertBook PM3406 | |
| Baldur's Gate 3 - 1920x1080 Ultra Preset AA:T | |
| Dell XPS 14 Core Ultra X7 358H | |
| HP OmniBook Ultra Flip 14 | |
| Lenovo ThinkPad T14 Gen 6 21QG001VGE | |
| Samsung Galaxy Book5 Pro 14 940XHA | |
| Dell XPS 14 Core Ultra 7 355 | |
| Asus ExpertBook PM3406 | |
| GTA V - 1920x1080 Highest AA:4xMSAA + FX AF:16x | |
| Dell XPS 14 Core Ultra X7 358H | |
| Lenovo ThinkPad T14 Gen 6 21QG001VGE | |
| HP OmniBook Ultra Flip 14 | |
| Dell XPS 14 Core Ultra 7 355 | |
| Samsung Galaxy Book5 Pro 14 940XHA | |
| Asus ExpertBook PM3406 | |
| Final Fantasy XV Benchmark - 1920x1080 High Quality | |
| Dell XPS 14 Core Ultra X7 358H | |
| Lenovo ThinkPad T14 Gen 6 21QG001VGE | |
| HP OmniBook Ultra Flip 14 | |
| Samsung Galaxy Book5 Pro 14 940XHA | |
| Dell XPS 14 Core Ultra 7 355 | |
| Asus ExpertBook PM3406 | |
| Strange Brigade - 1920x1080 ultra AA:ultra AF:16 | |
| Dell XPS 14 Core Ultra X7 358H | |
| HP OmniBook Ultra Flip 14 | |
| Samsung Galaxy Book5 Pro 14 940XHA | |
| Dell XPS 14 Core Ultra 7 355 | |
| Asus ExpertBook PM3406 | |
| Dota 2 Reborn - 1920x1080 ultra (3/3) best looking | |
| Dell XPS 14 Core Ultra X7 358H | |
| Lenovo ThinkPad T14 Gen 6 21QG001VGE | |
| HP OmniBook Ultra Flip 14 | |
| Samsung Galaxy Book5 Pro 14 940XHA | |
| Dell XPS 14 Core Ultra 7 355 | |
| Asus ExpertBook PM3406 | |
| X-Plane 11.11 - 1920x1080 high (fps_test=3) | |
| Dell XPS 14 Core Ultra X7 358H | |
| Asus ExpertBook PM3406 | |
| HP OmniBook Ultra Flip 14 | |
| Samsung Galaxy Book5 Pro 14 940XHA | |
| Lenovo ThinkPad T14 Gen 6 21QG001VGE | |
| Dell XPS 14 Core Ultra 7 355 | |
| ARC Raiders | |
| 1920x1080 Low Preset | |
| Asus ZenBook Duo UX8407AA | |
| Dell XPS 14 Core Ultra X7 358H | |
| Dell XPS 14 Core Ultra 7 355 | |
| Average Intel Graphics 4 Xe3 Panther Lake iGPU (n=1) | |
| 1920x1080 Medium Preset AA:TSR | |
| Asus ZenBook Duo UX8407AA | |
| Dell XPS 14 Core Ultra X7 358H | |
| Dell XPS 14 Core Ultra 7 355 | |
| Average Intel Graphics 4 Xe3 Panther Lake iGPU (n=1) | |
| 1920x1080 High Preset AA:TSR | |
| Asus ZenBook Duo UX8407AA | |
| Dell XPS 14 Core Ultra X7 358H | |
| Dell XPS 14 Core Ultra 7 355 | |
| Average Intel Graphics 4 Xe3 Panther Lake iGPU (n=1) | |
| Black Myth: Wukong | |
| 1280x720 low TSR 100 | |
| Dell XPS 14 Core Ultra X7 358H | |
| Dell XPS 14 Core Ultra 7 355 | |
| Average Intel Graphics 4 Xe3 Panther Lake iGPU (n=1) | |
| 1920x1080 low TSR 100 | |
| Dell XPS 14 Core Ultra X7 358H | |
| Dell XPS 14 Core Ultra 7 355 | |
| Average Intel Graphics 4 Xe3 Panther Lake iGPU (n=1) | |
| 1920x1080 medium TSR 100 | |
| Dell XPS 14 Core Ultra X7 358H | |
| Dell XPS 14 Core Ultra 7 355 | |
| Average Intel Graphics 4 Xe3 Panther Lake iGPU (n=1) | |
| 1920x1080 high TSR 100 | |
| Dell XPS 14 Core Ultra X7 358H | |
| Dell XPS 14 Core Ultra 7 355 | |
| Average Intel Graphics 4 Xe3 Panther Lake iGPU (n=1) | |
| 1920x1080 cinematic TSR 100 | |
| Dell XPS 14 Core Ultra X7 358H | |
| Dell XPS 14 Core Ultra 7 355 | |
| Average Intel Graphics 4 Xe3 Panther Lake iGPU (n=1) | |
赛博朋克 2077》超 FPS 图表
| low | med. | high | ultra | |
|---|---|---|---|---|
| GTA V (2015) | 165.6 | 163 | 52.9 | 20.9 |
| Dota 2 Reborn (2015) | 101.7 | 89.4 | 73.7 | 69.4 |
| Final Fantasy XV Benchmark (2018) | 67.3 | 34.9 | 25.4 | |
| X-Plane 11.11 (2018) | 43.6 | 30.9 | 30.5 | |
| Strange Brigade (2018) | 184.9 | 64.7 | 58.9 | 50.6 |
| Baldur's Gate 3 (2023) | 28.4 | 23 | 19.6 | 19.5 |
| Cyberpunk 2077 (2023) | 32.7 | 27.7 | 21 | 17.7 |
| F1 24 (2024) | 65.9 | 56.6 | 41.7 | 13.8 |
| Black Myth: Wukong (2024) | 18 | 14 | 11 | 6 |
| ARC Raiders (2025) | 48.8 | 23.5 | 17.5 | 11.4 |
排放量
系统噪音
与酷睿 Ultra X7 配置相比,噪音水平可以保持更长时间的安静,但上限完全相同。例如,在运行《赛博朋克 2077》时,风扇噪音将稳定在 35 dB(A),而速度更快的 Core Ultra X7 SKU 则为 43 dB(A),但在运行 Prime95 压力测试时,两个 SKU 几乎达到相同的最大值。
Noise level
| Idle |
| 23 / 23 / 23.1 dB(A) |
| Load |
| 30.8 / 45.9 dB(A) |
 | ||
30 dB silent 40 dB(A) audible 50 dB(A) loud |
||
min: | ||
| Dell XPS 14 Core Ultra 7 355 Ultra 7 355, Intel Graphics 4 Xe3 PTL | Dell XPS 14 Core Ultra X7 358H Ultra X7 358H, Arc B390 Panther Lake iGPU | Asus ExpertBook PM3406 Ryzen AI 7 350, Radeon 860M | Lenovo ThinkPad T14 Gen 6 21QG001VGE Core Ultra 7 258V, Arc 140V | HP OmniBook Ultra Flip 14 Core Ultra 7 258V, Arc 140V | Samsung Galaxy Book5 Pro 14 940XHA Core Ultra 5 226V, Arc 130V | |
|---|---|---|---|---|---|---|
| Noise | -5% | -7% | -7% | 3% | -1% | |
| off / environment * (dB) | 23 | 22.9 -0% | 25.7 -12% | 25.1 -9% | 22.9 -0% | 25.1 -9% |
| Idle Minimum * (dB) | 23 | 23.3 -1% | 25.7 -12% | 25.1 -9% | 23.2 -1% | 25.1 -9% |
| Idle Average * (dB) | 23 | 23.3 -1% | 25.7 -12% | 25.1 -9% | 23.2 -1% | 25.1 -9% |
| Idle Maximum * (dB) | 23.1 | 23.3 -1% | 25.7 -11% | 27.1 -17% | 23.2 -0% | 25.1 -9% |
| Load Average * (dB) | 30.8 | 34 -10% | 33.6 -9% | 34.8 -13% | 27.8 10% | 29.3 5% |
| Cyberpunk 2077 ultra * (dB) | 35.4 | 43.5 -23% | 39.1 -10% | 38.3 -8% | 33.6 5% | 33.1 6% |
| Load Maximum * (dB) | 45.9 | 45.7 -0% | 39.1 15% | 38.5 16% | 43.4 5% | 38.7 16% |
* ... smaller is better
温度
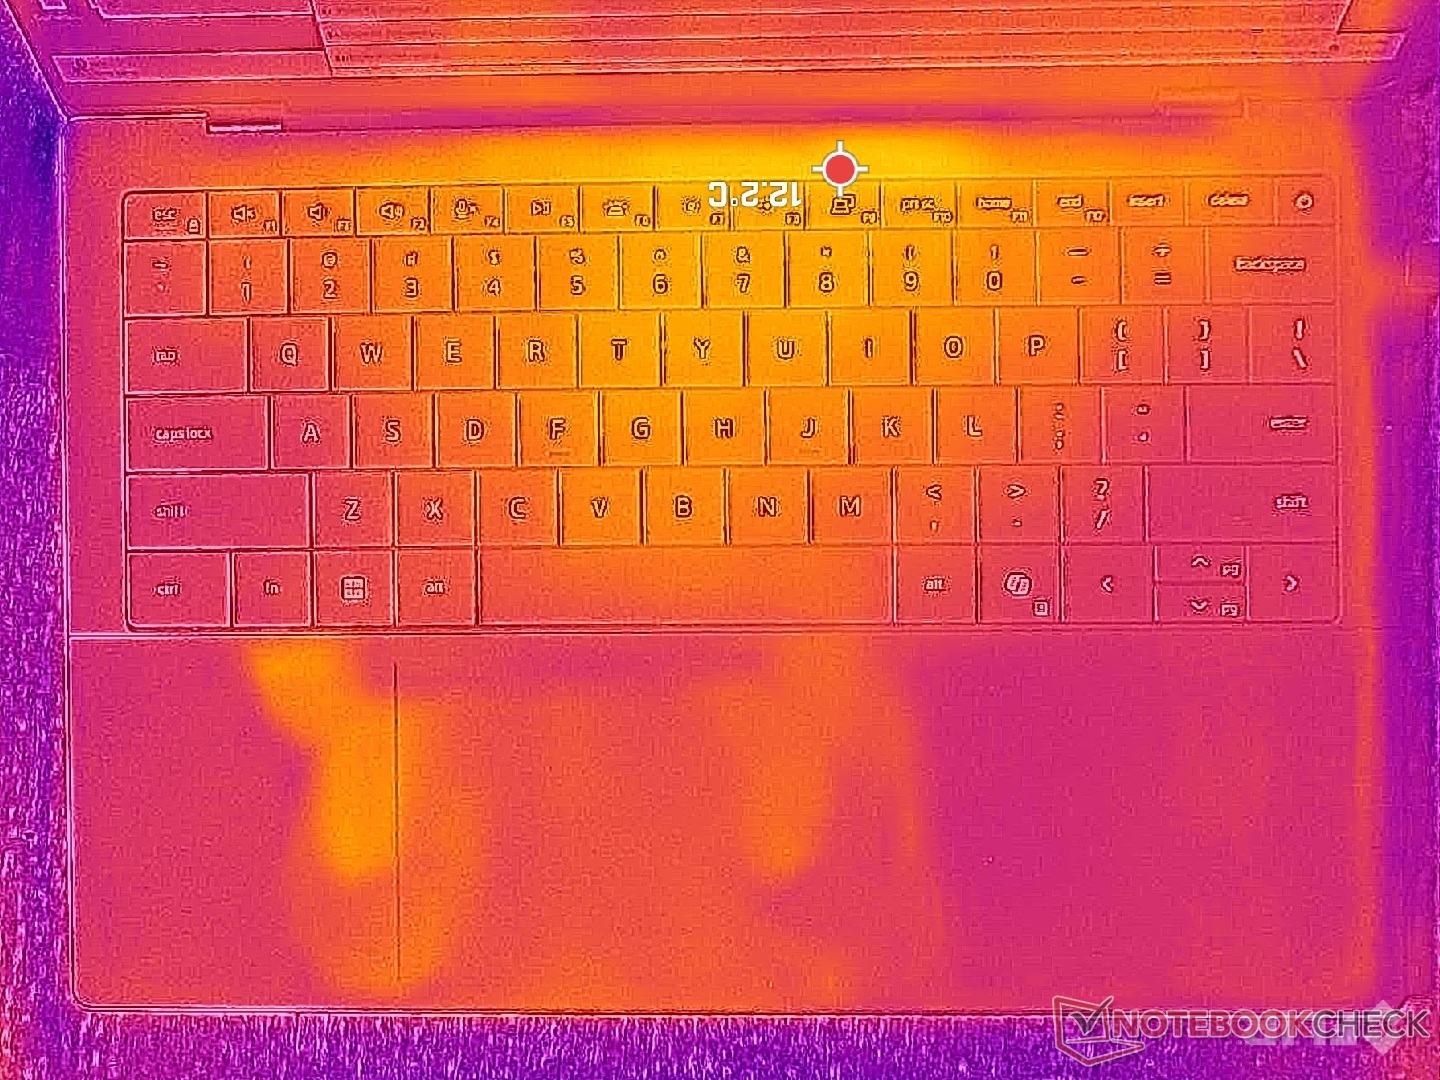
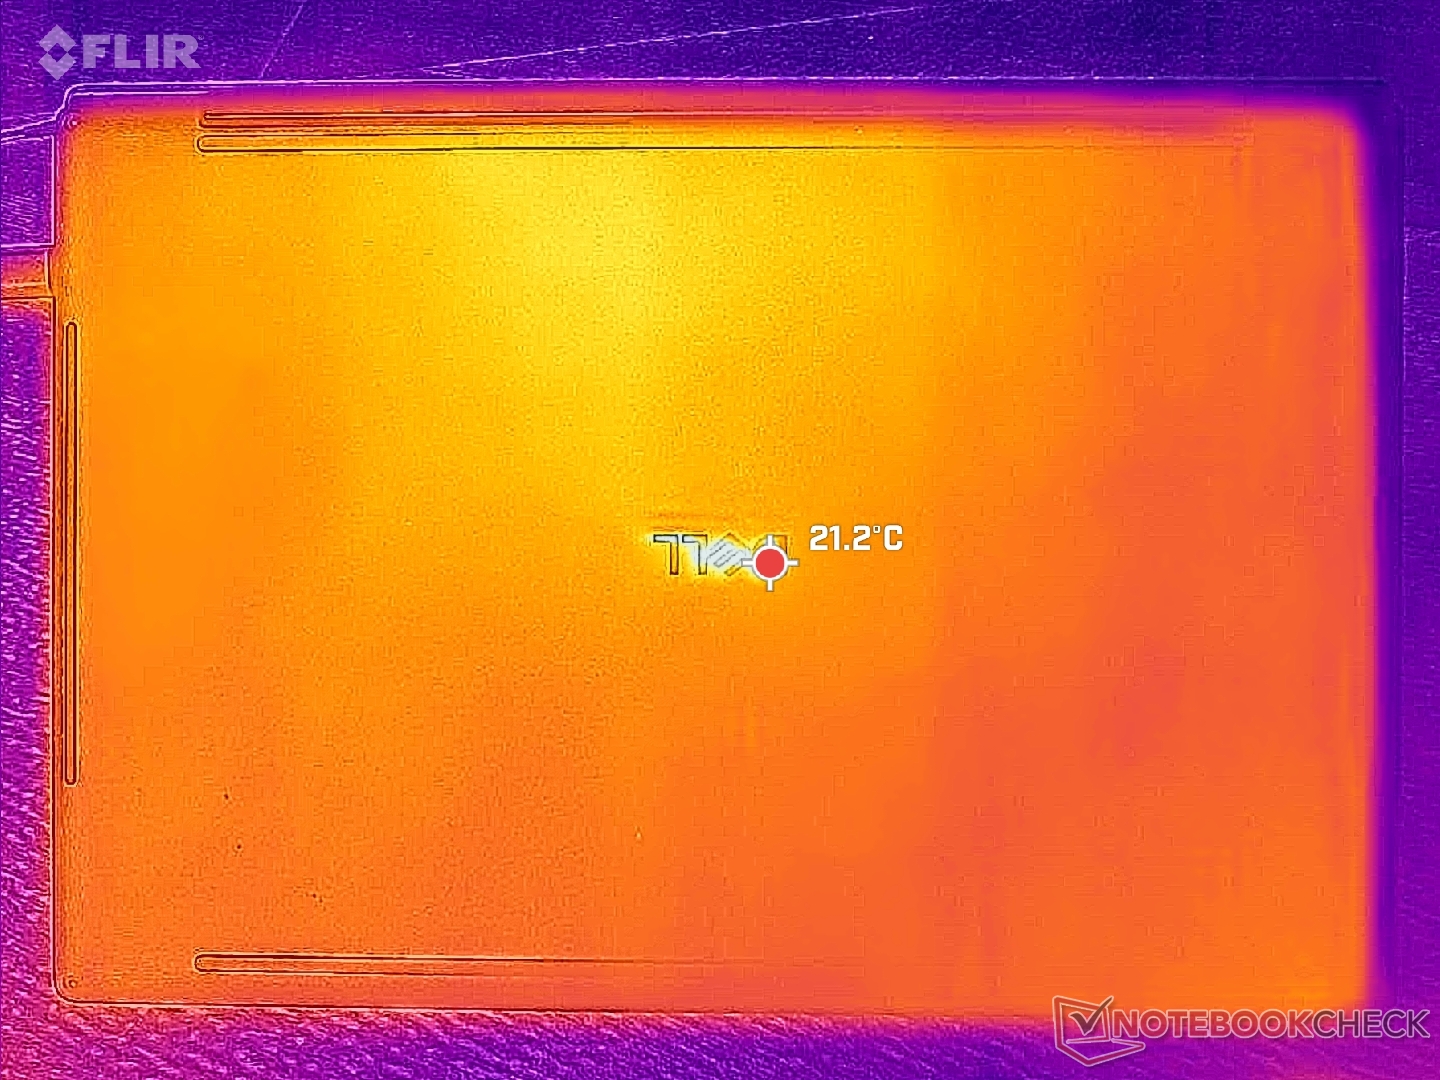
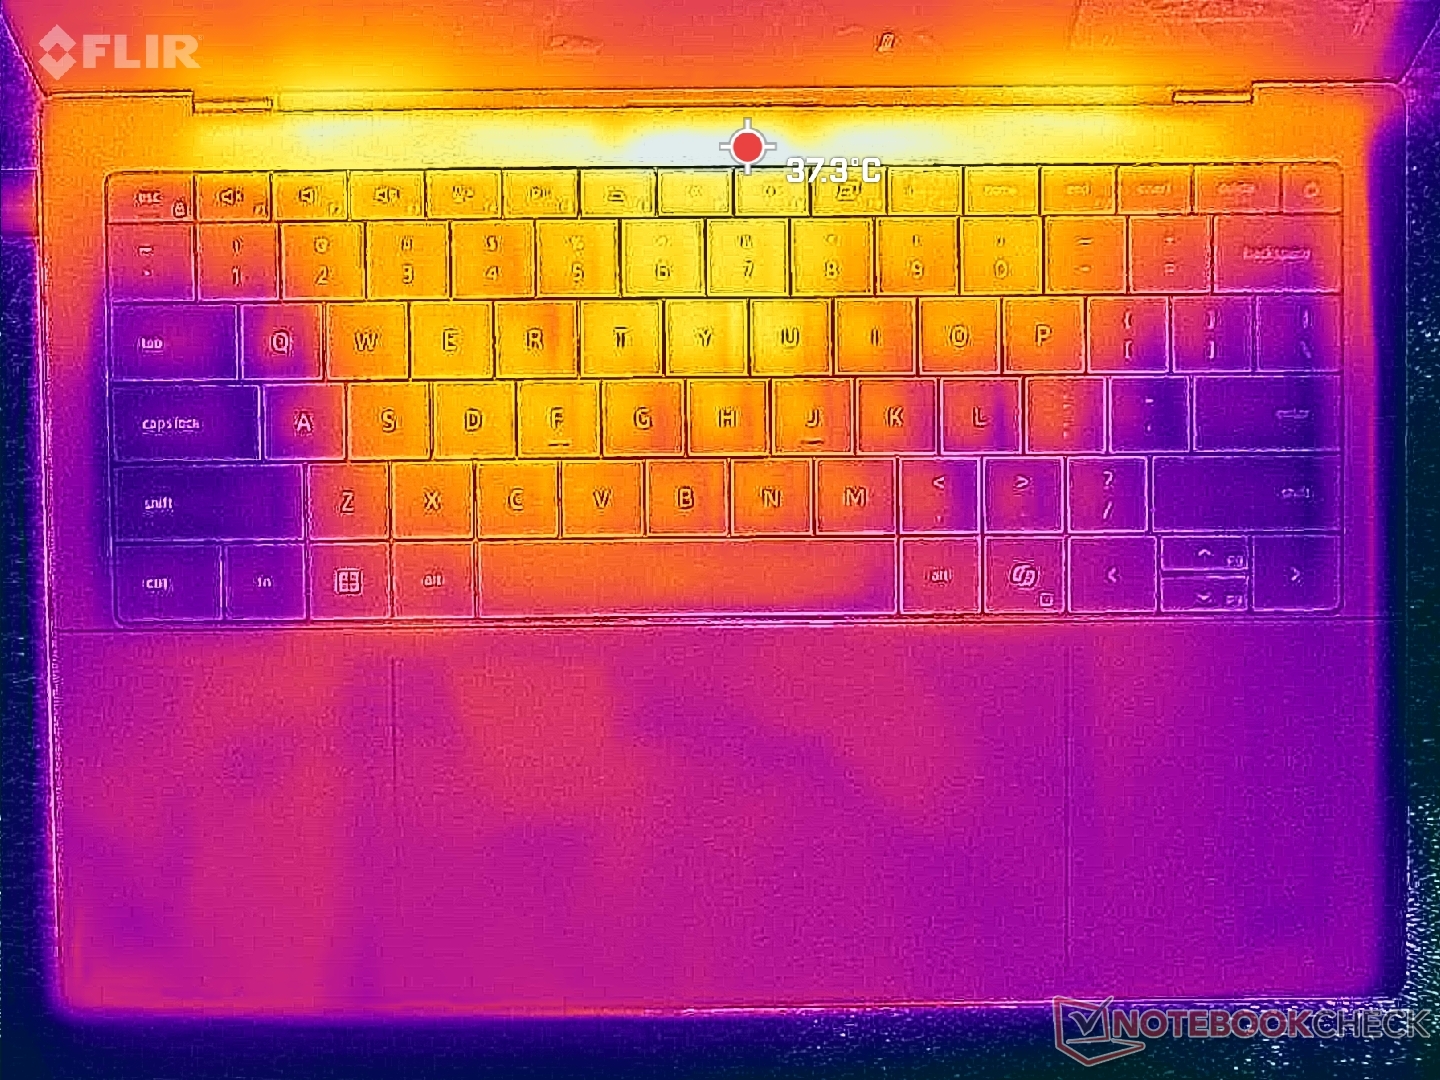
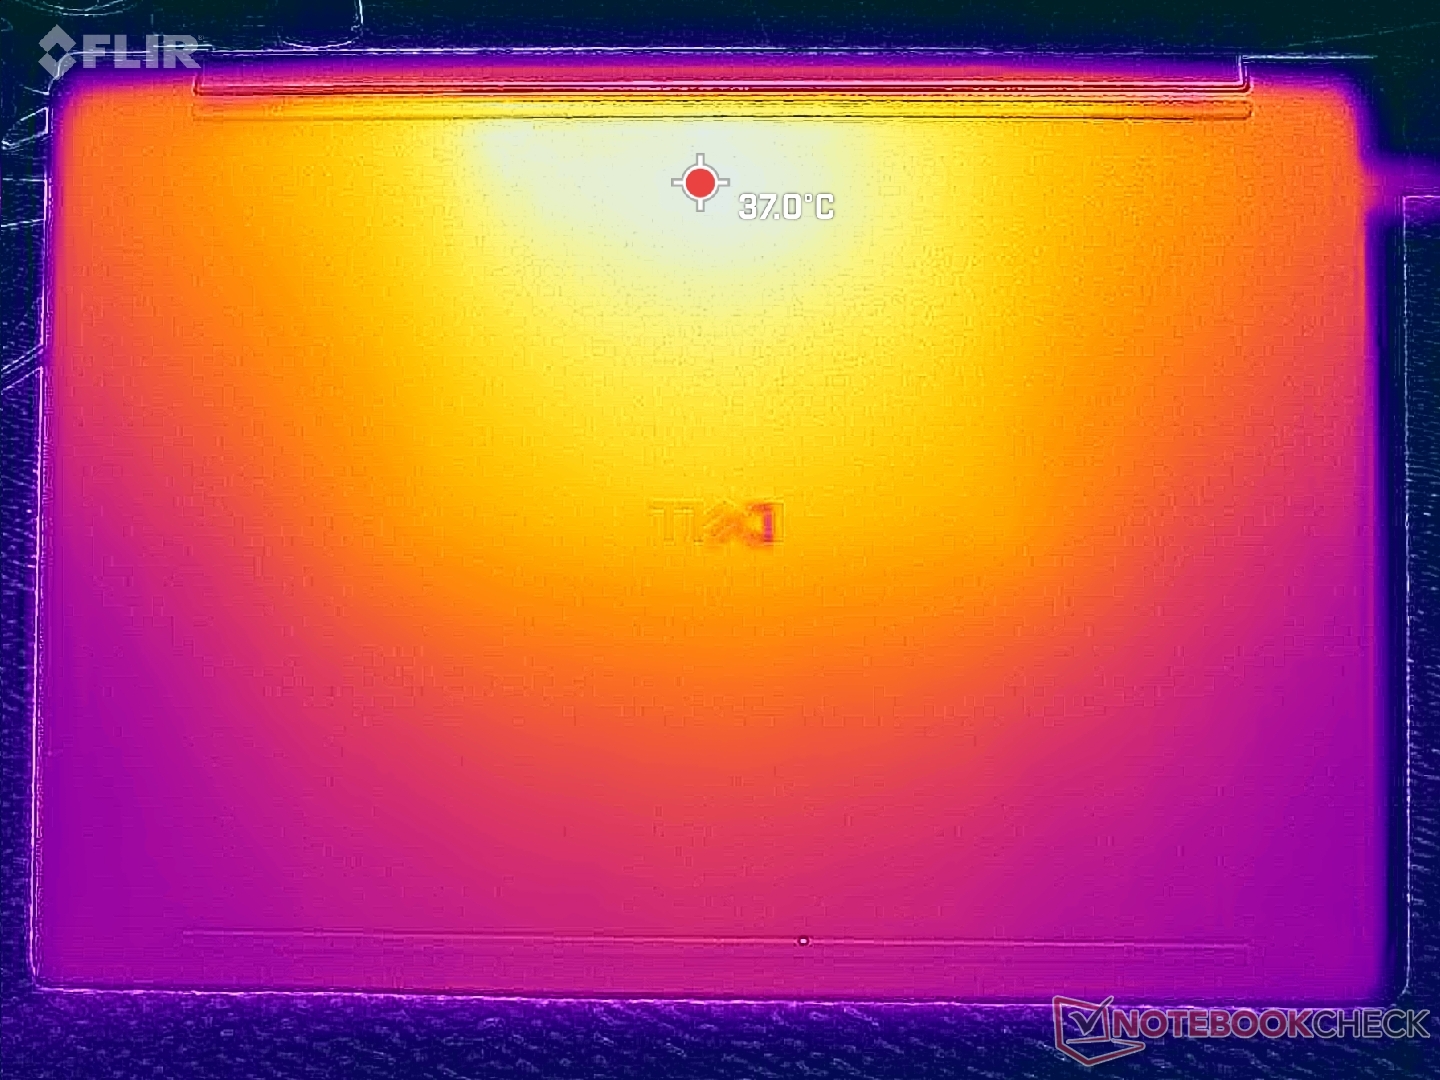
表面温度热点将稳定在与我们在 XPS 14 X7尽管后者的性能明显更快。
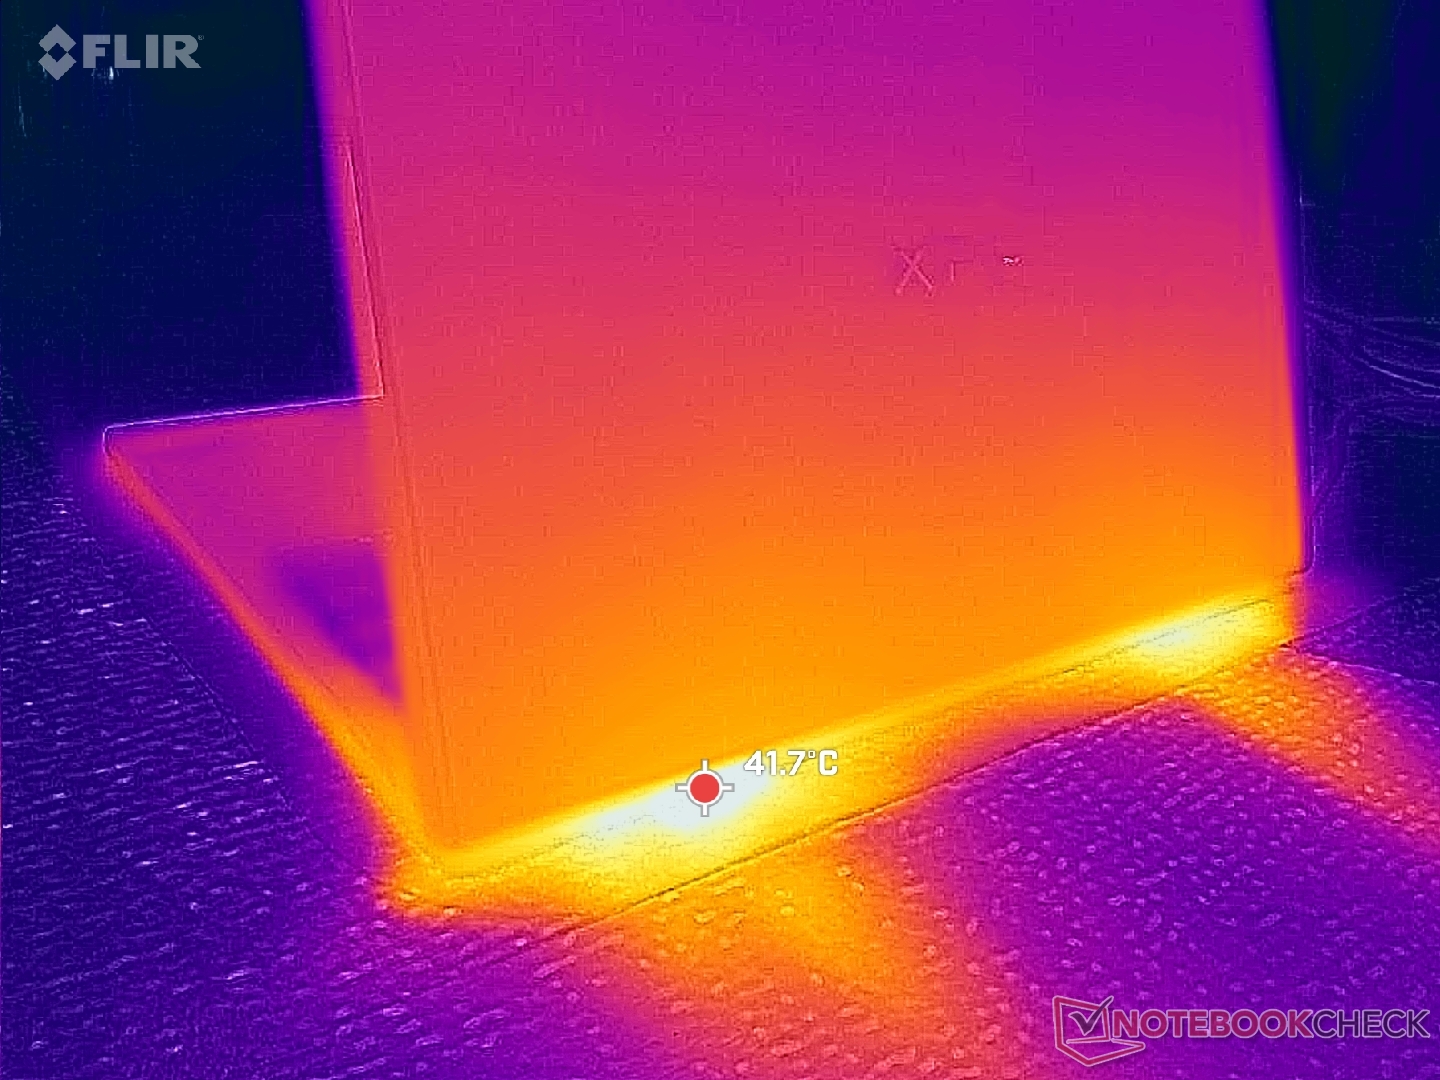
(+) The maximum temperature on the upper side is 37.8 °C / 100 F, compared to the average of 36.8 °C / 98 F, ranging from 21 to 71 °C for the class Multimedia.
(+) The bottom heats up to a maximum of 38.6 °C / 101 F, compared to the average of 39.1 °C / 102 F
(+) In idle usage, the average temperature for the upper side is 20.4 °C / 69 F, compared to the device average of 31.3 °C / 88 F.
(+) The palmrests and touchpad are cooler than skin temperature with a maximum of 27.4 °C / 81.3 F and are therefore cool to the touch.
(±) The average temperature of the palmrest area of similar devices was 28.7 °C / 83.7 F (+1.3 °C / 2.4 F).
| Dell XPS 14 Core Ultra 7 355 Ultra 7 355, Intel Graphics 4 Xe3 PTL | Dell XPS 14 Core Ultra X7 358H Ultra X7 358H, Arc B390 Panther Lake iGPU | Asus ExpertBook PM3406 Ryzen AI 7 350, Radeon 860M | Lenovo ThinkPad T14 Gen 6 21QG001VGE Core Ultra 7 258V, Arc 140V | HP OmniBook Ultra Flip 14 Core Ultra 7 258V, Arc 140V | Samsung Galaxy Book5 Pro 14 940XHA Core Ultra 5 226V, Arc 130V | |
|---|---|---|---|---|---|---|
| Heat | -7% | -14% | -12% | -9% | -16% | |
| Maximum Upper Side * (°C) | 37.8 | 34 10% | 39.8 -5% | 39.7 -5% | 35.8 5% | 41.4 -10% |
| Maximum Bottom * (°C) | 38.6 | 35.8 7% | 40.8 -6% | 38.1 1% | 37.6 3% | 44.6 -16% |
| Idle Upper Side * (°C) | 21.2 | 25.6 -21% | 26 -23% | 24.3 -15% | 25.2 -19% | 24.9 -17% |
| Idle Bottom * (°C) | 21.4 | 26.4 -23% | 26.3 -23% | 27.7 -29% | 26.6 -24% | 25.5 -19% |
* ... smaller is better
压力测试
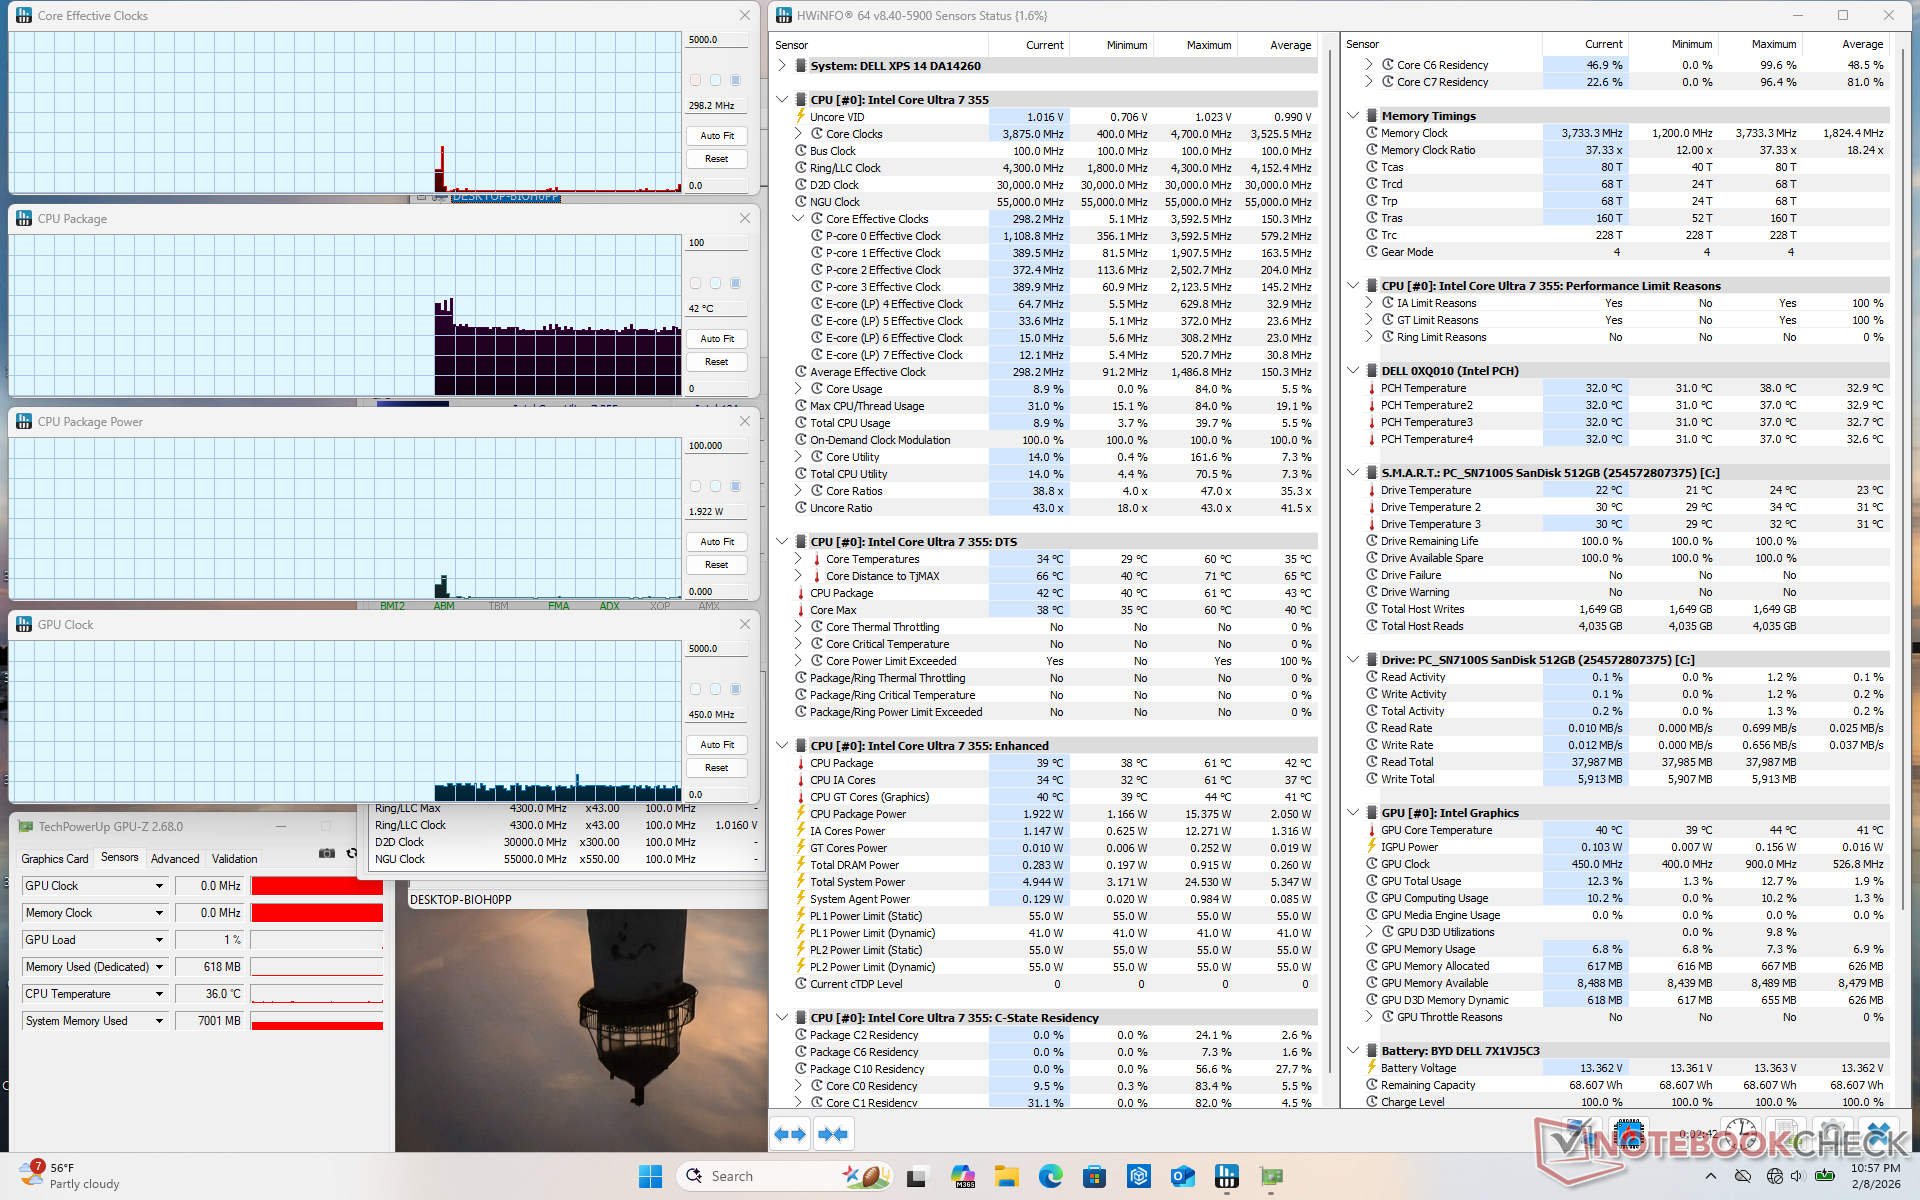
在运行 Prime95 压力测试时,CPU 会升至 3.7 GHz 和 54 W,在 100 C 的温度下仅持续几秒钟。此后,CPU 会稳定在 2.9 GHz、28 W 和 81 C,这表明 Turbo Boost 的潜力有限。在运行苛刻负载时,核心温度会稳定在 80 摄氏度以下,这比我们去年在 Arrow Lake-H 上记录的温度略低。 戴尔 14 Premium.
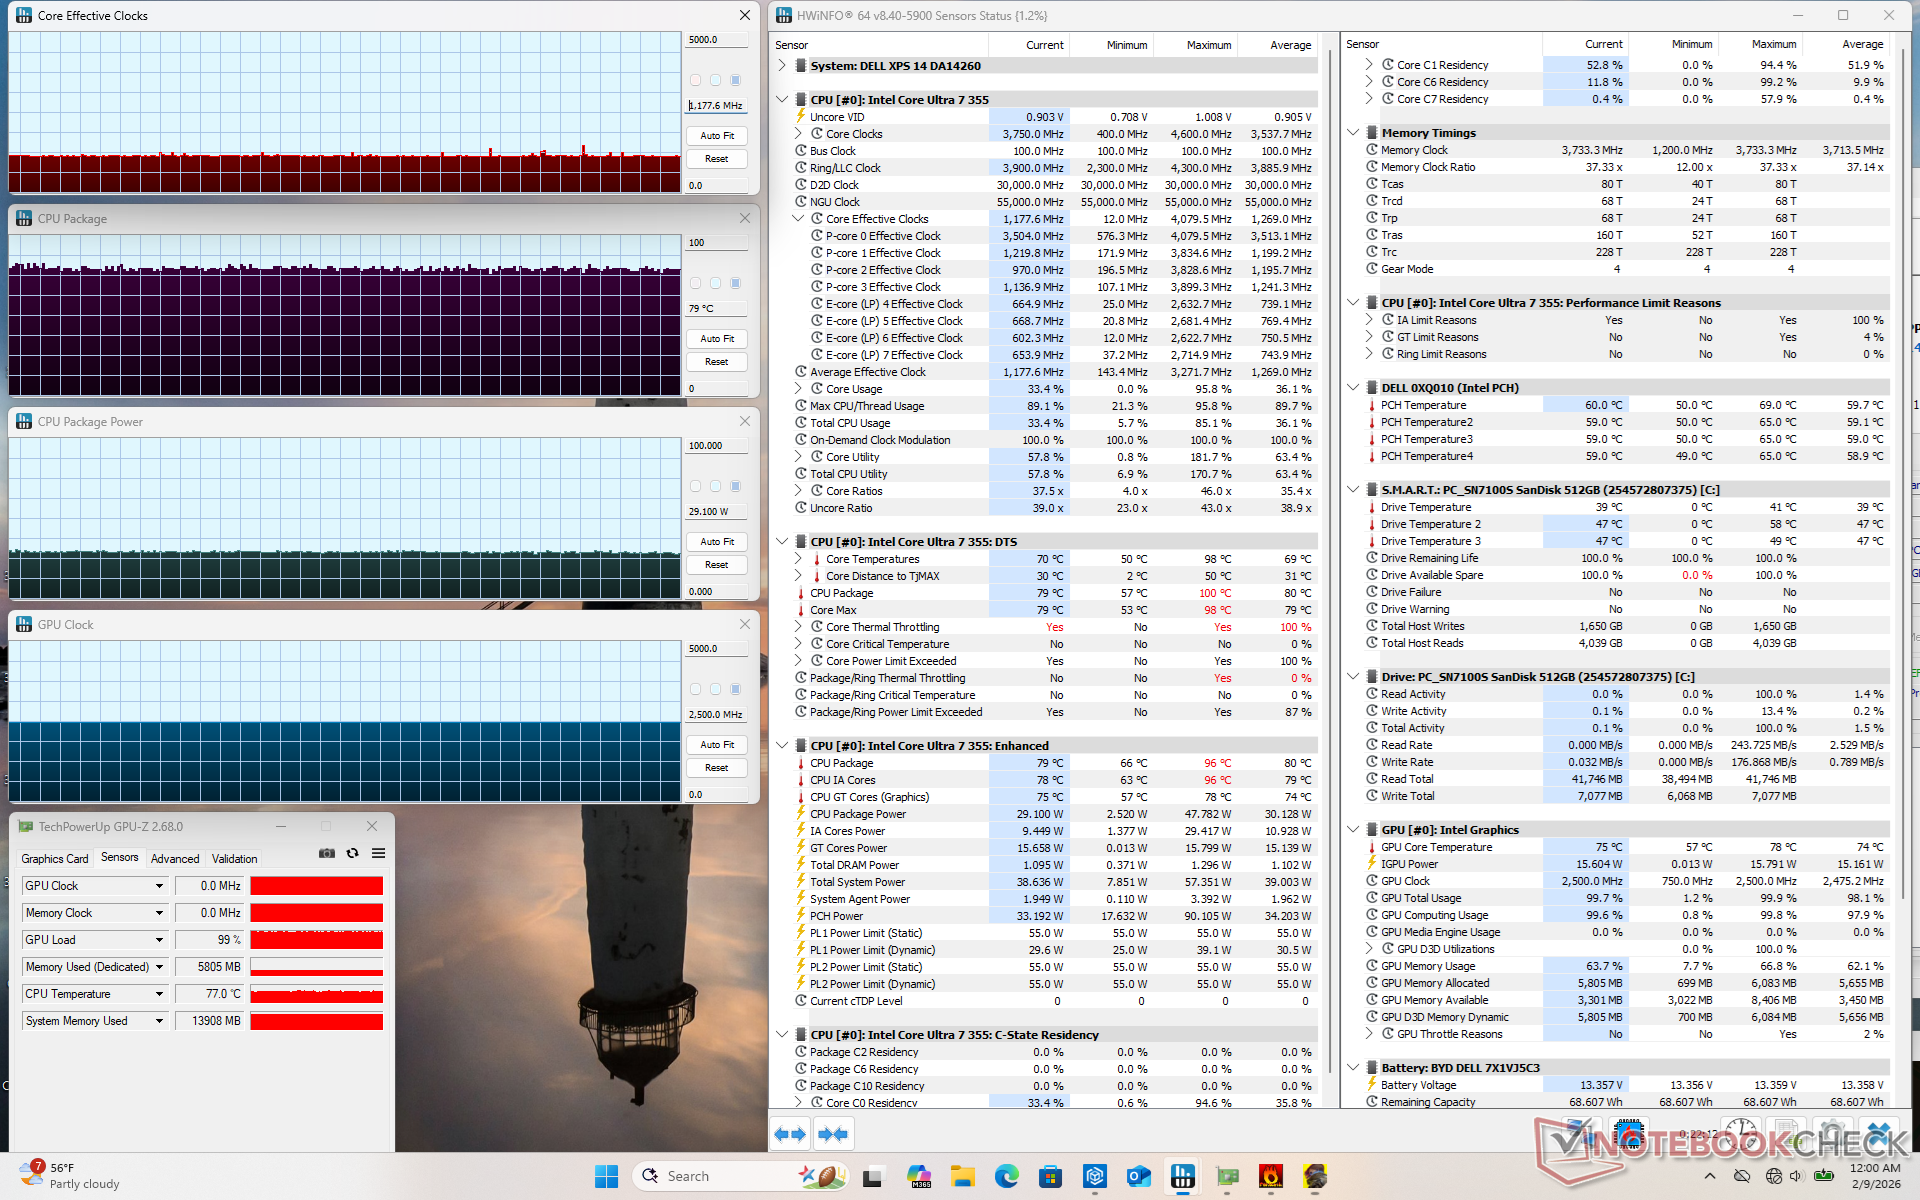
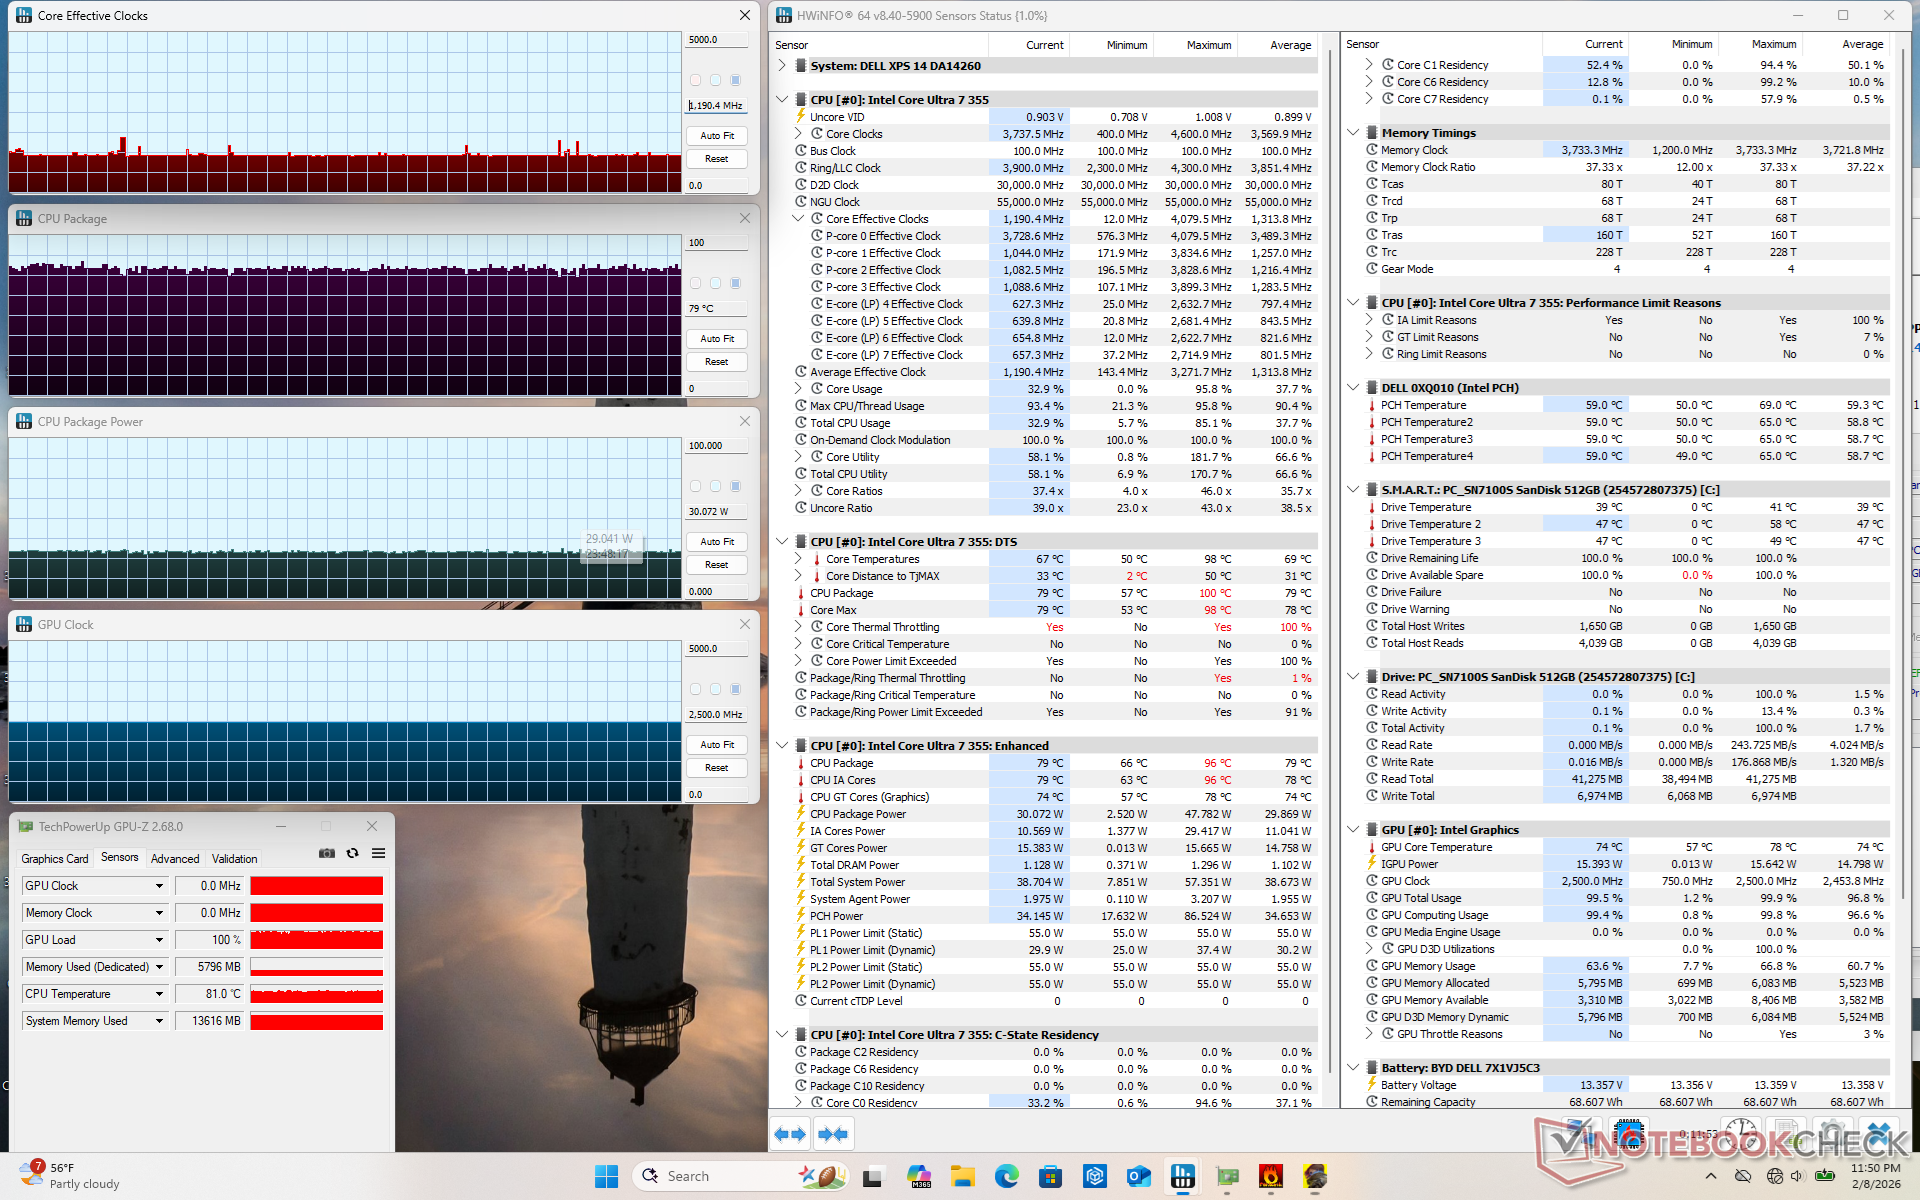
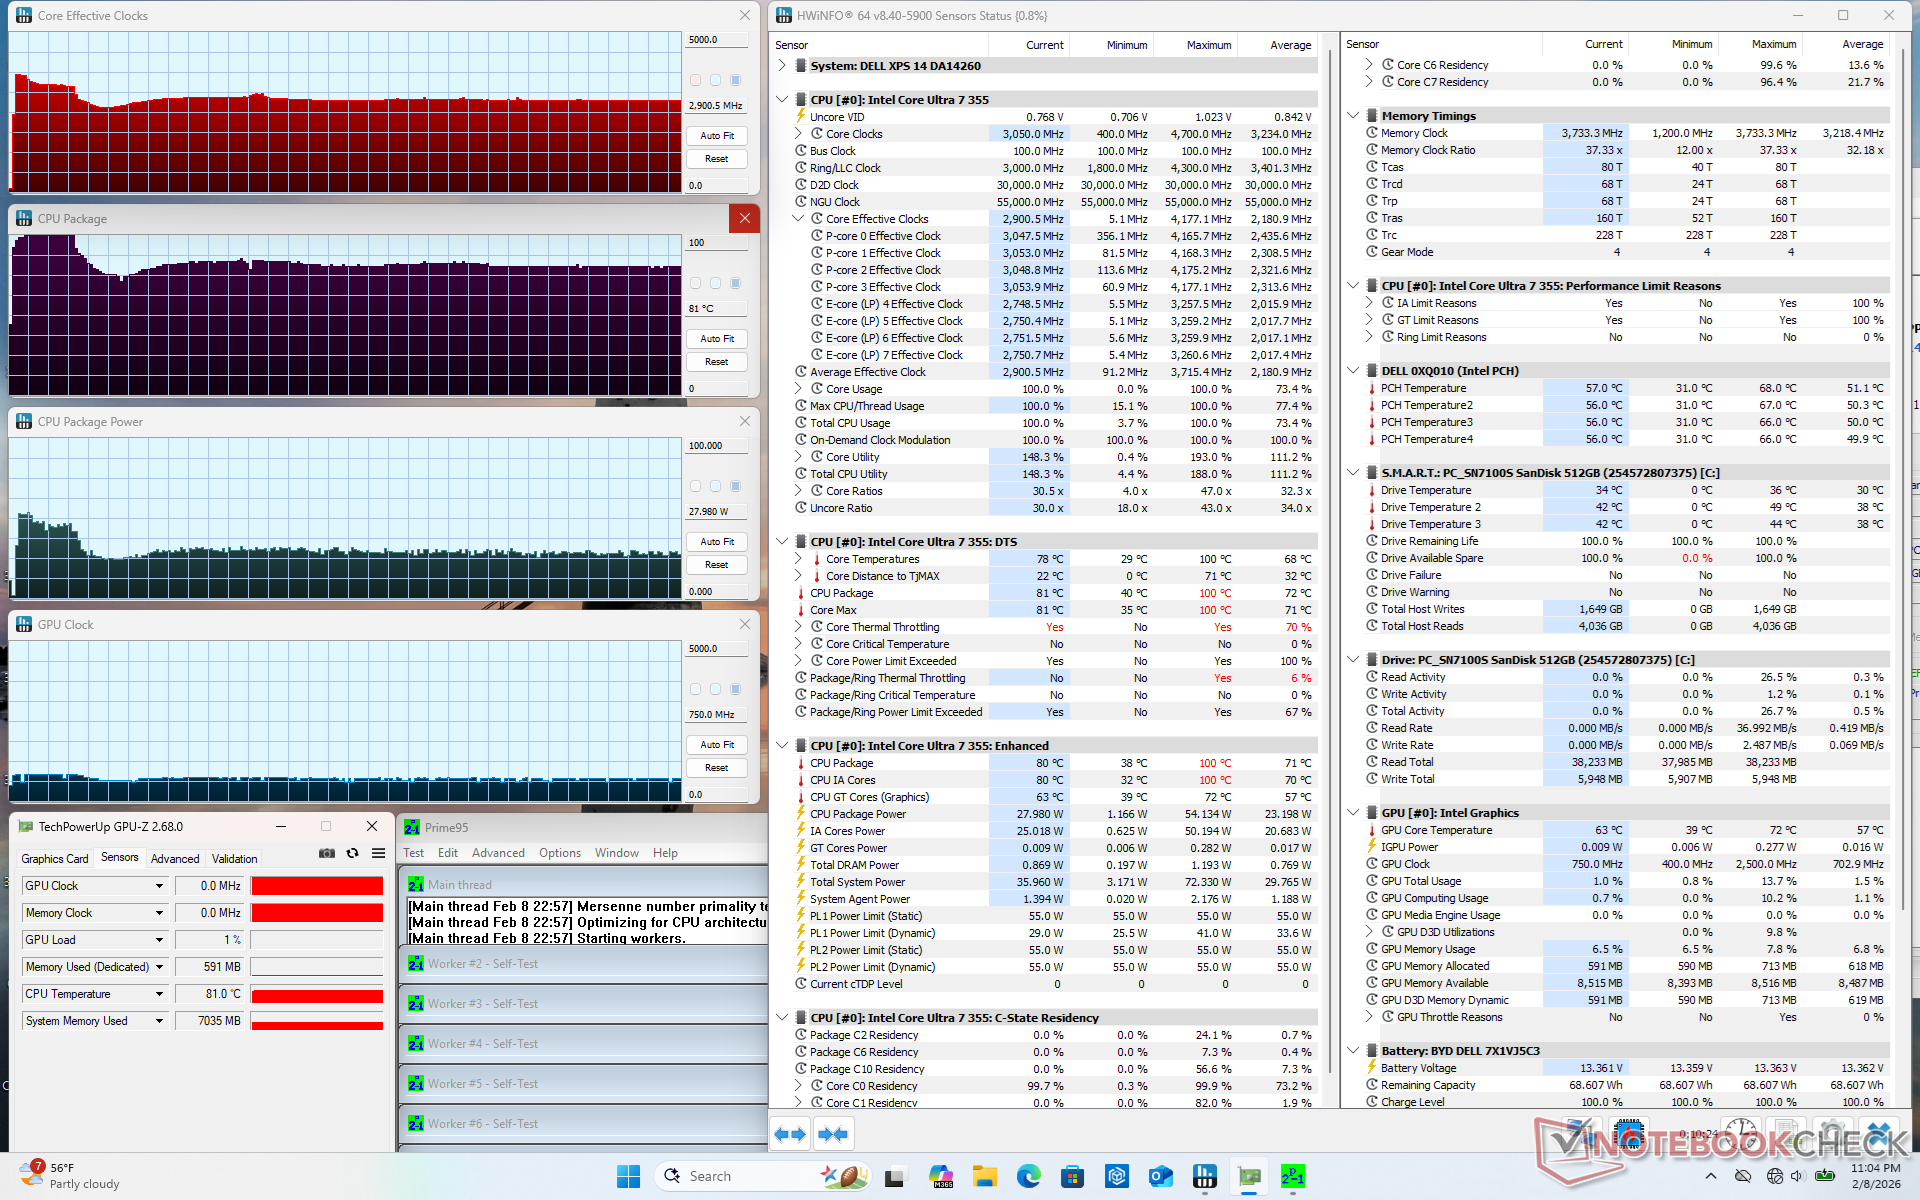
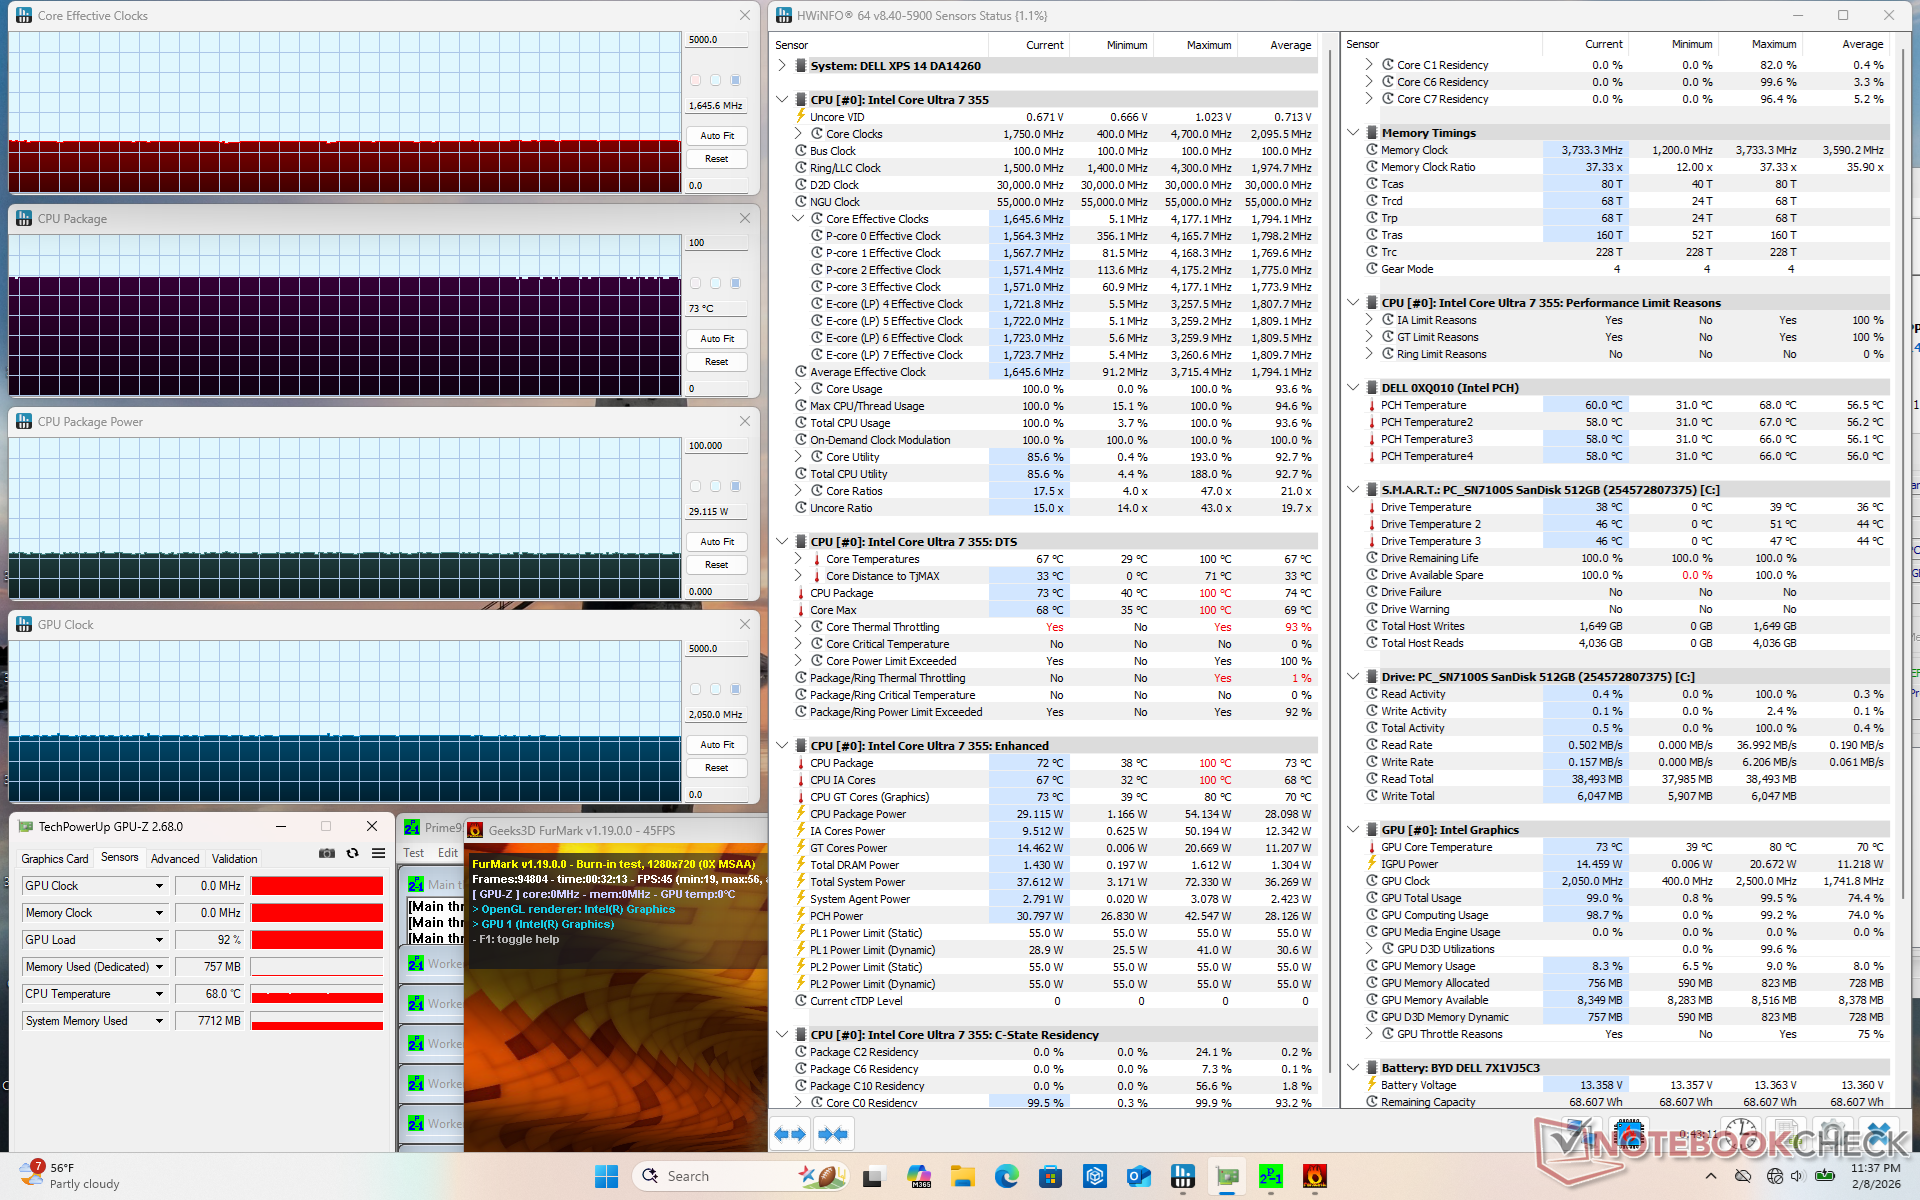
| CPU 时钟 (GHz) | GPU 时钟 (MHz) | CPU 平均温度 (°C) | |
| 系统闲置 | -- | -- | 42 |
| Prime95 压力 | 2.9 | -- | 81 |
| Prime95 + FurMark Stress | 1.7 | 2050 | 73 |
| 赛博朋克 2077》压力(平衡模式) | 1.2 | 2500 | 79 |
| 赛博朋克2077压力(性能模式) | 1.2 | 2500 | 79 |
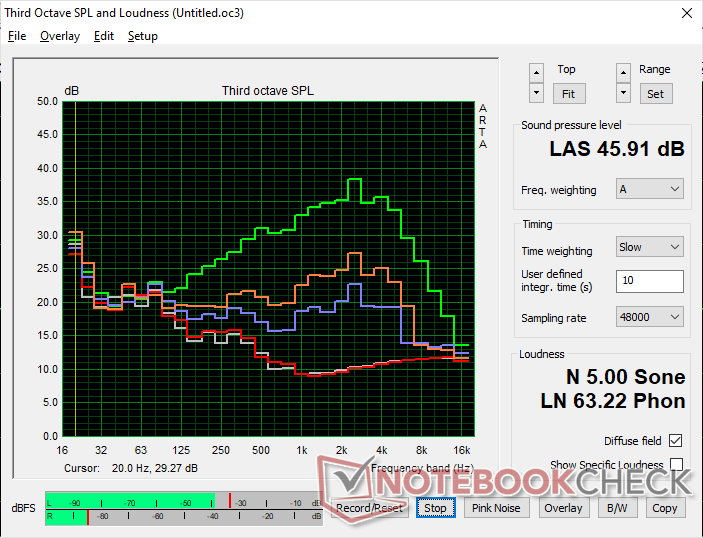
发言人
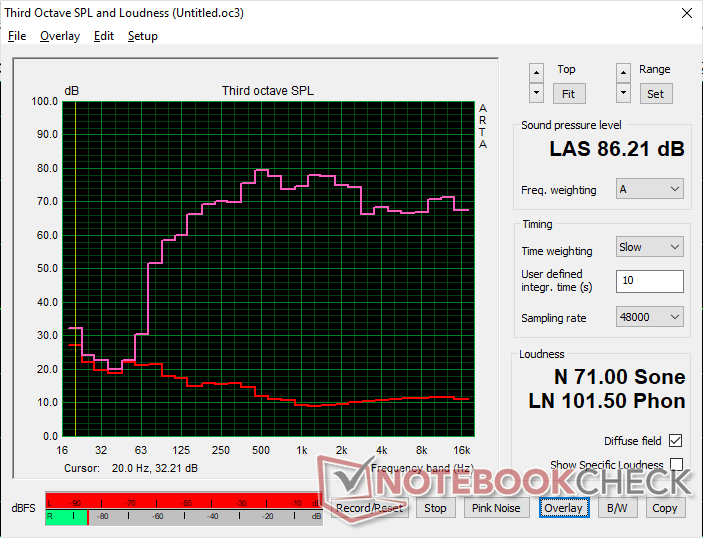
Dell XPS 14 Core Ultra 7 355 audio analysis
(+) | speakers can play relatively loud (86.2 dB)
Bass 100 - 315 Hz
(±) | reduced bass - on average 5% lower than median
(+) | bass is linear (5.3% delta to prev. frequency)
Mids 400 - 2000 Hz
(±) | higher mids - on average 5.7% higher than median
(+) | mids are linear (4.7% delta to prev. frequency)
Highs 2 - 16 kHz
(+) | balanced highs - only 3.1% away from median
(+) | highs are linear (4.1% delta to prev. frequency)
Overall 100 - 16.000 Hz
(+) | overall sound is linear (7.9% difference to median)
Compared to same class
» 7% of all tested devices in this class were better, 2% similar, 91% worse
» The best had a delta of 5%, average was 17%, worst was 45%
Compared to all devices tested
» 2% of all tested devices were better, 1% similar, 98% worse
» The best had a delta of 4%, average was 24%, worst was 134%
Apple MacBook Pro 16 2021 M1 Pro audio analysis
(+) | speakers can play relatively loud (84.7 dB)
Bass 100 - 315 Hz
(+) | good bass - only 3.8% away from median
(+) | bass is linear (5.2% delta to prev. frequency)
Mids 400 - 2000 Hz
(+) | balanced mids - only 1.3% away from median
(+) | mids are linear (2.1% delta to prev. frequency)
Highs 2 - 16 kHz
(+) | balanced highs - only 1.9% away from median
(+) | highs are linear (2.7% delta to prev. frequency)
Overall 100 - 16.000 Hz
(+) | overall sound is linear (4.6% difference to median)
Compared to same class
» 0% of all tested devices in this class were better, 0% similar, 100% worse
» The best had a delta of 5%, average was 17%, worst was 45%
Compared to all devices tested
» 0% of all tested devices were better, 0% similar, 100% worse
» The best had a delta of 4%, average was 24%, worst was 134%
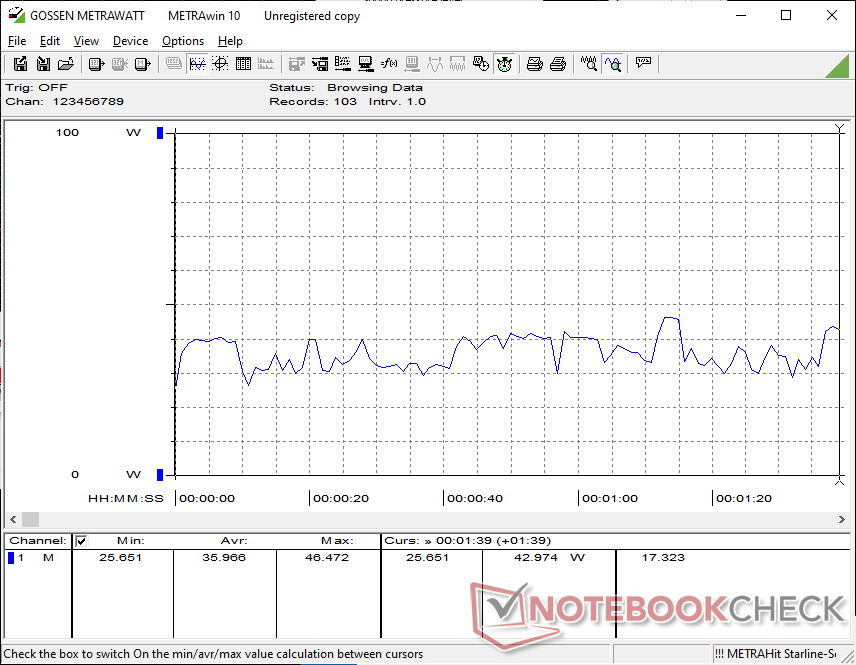
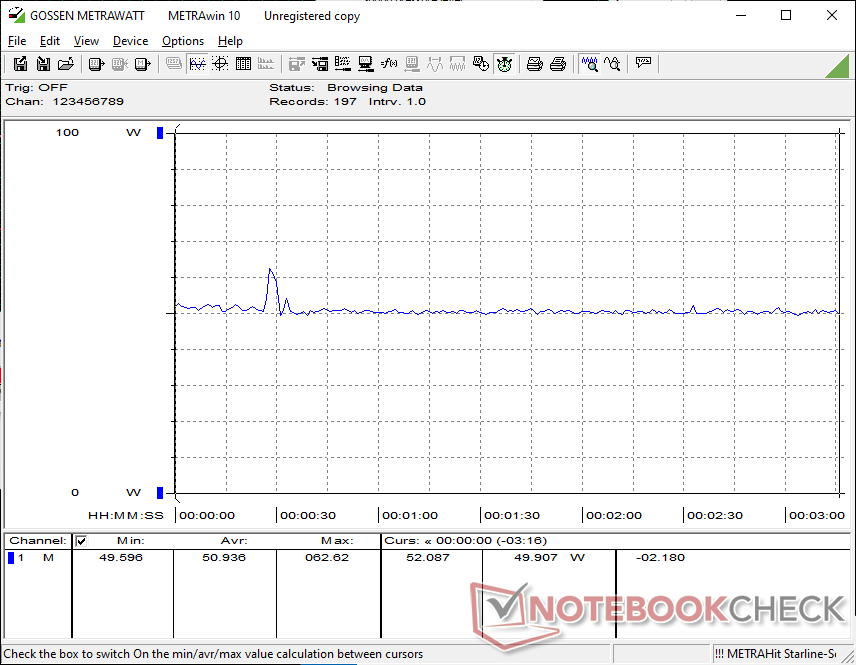
能源管理
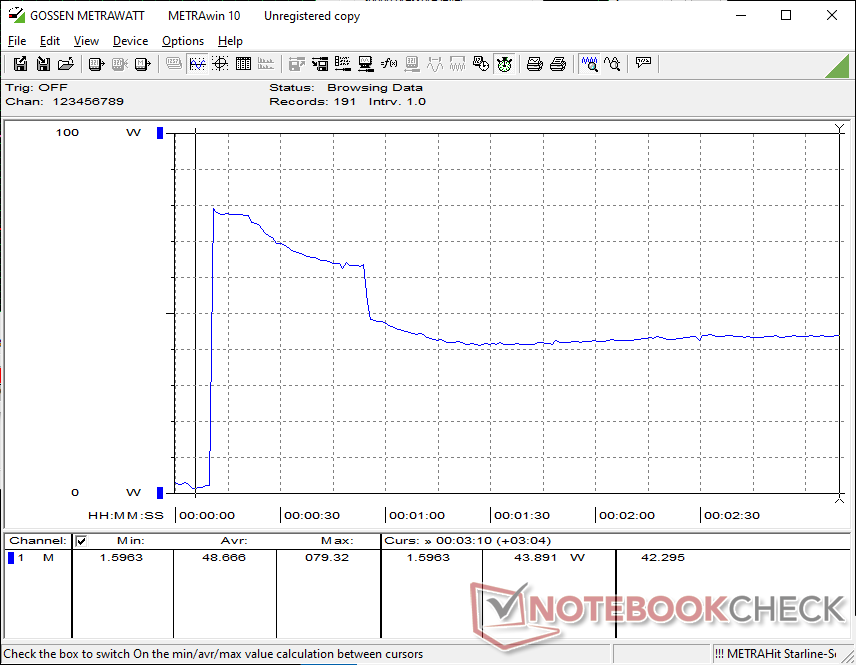
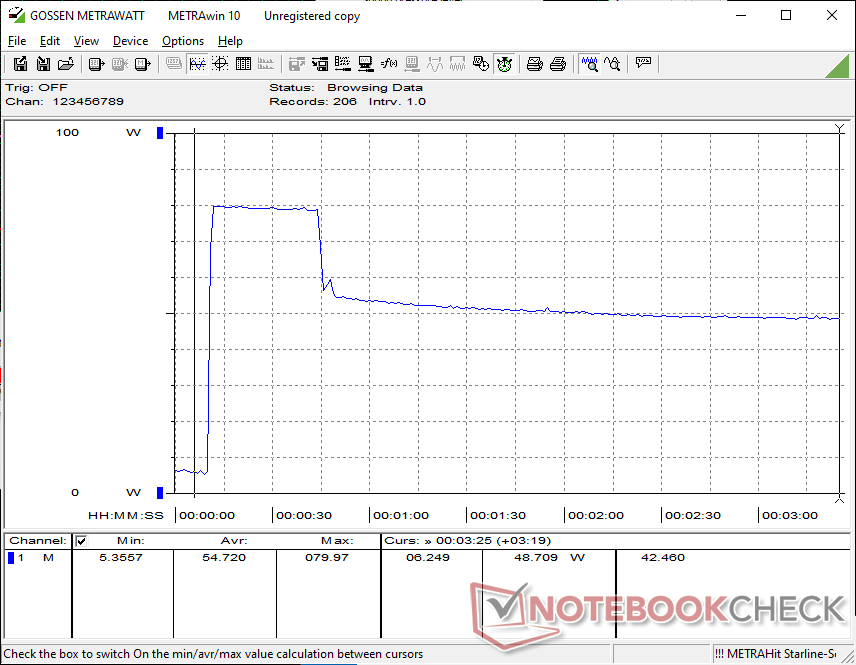
耗电量
遗憾的是,Core Ultra 7 355 并没有继承 Core Ultra X7 系列的许多每瓦性能优势。例如,在外置显示器上运行 Prime95 时,该系统的功耗仅比酷睿 Ultra X7 XPS 14 低 13%,而性能却降低了 40%。同样,运行《赛博朋克 2077》或《FurMark》时,系统能耗仅降低 7% 至 15%,而图形性能却大幅下降 60%。
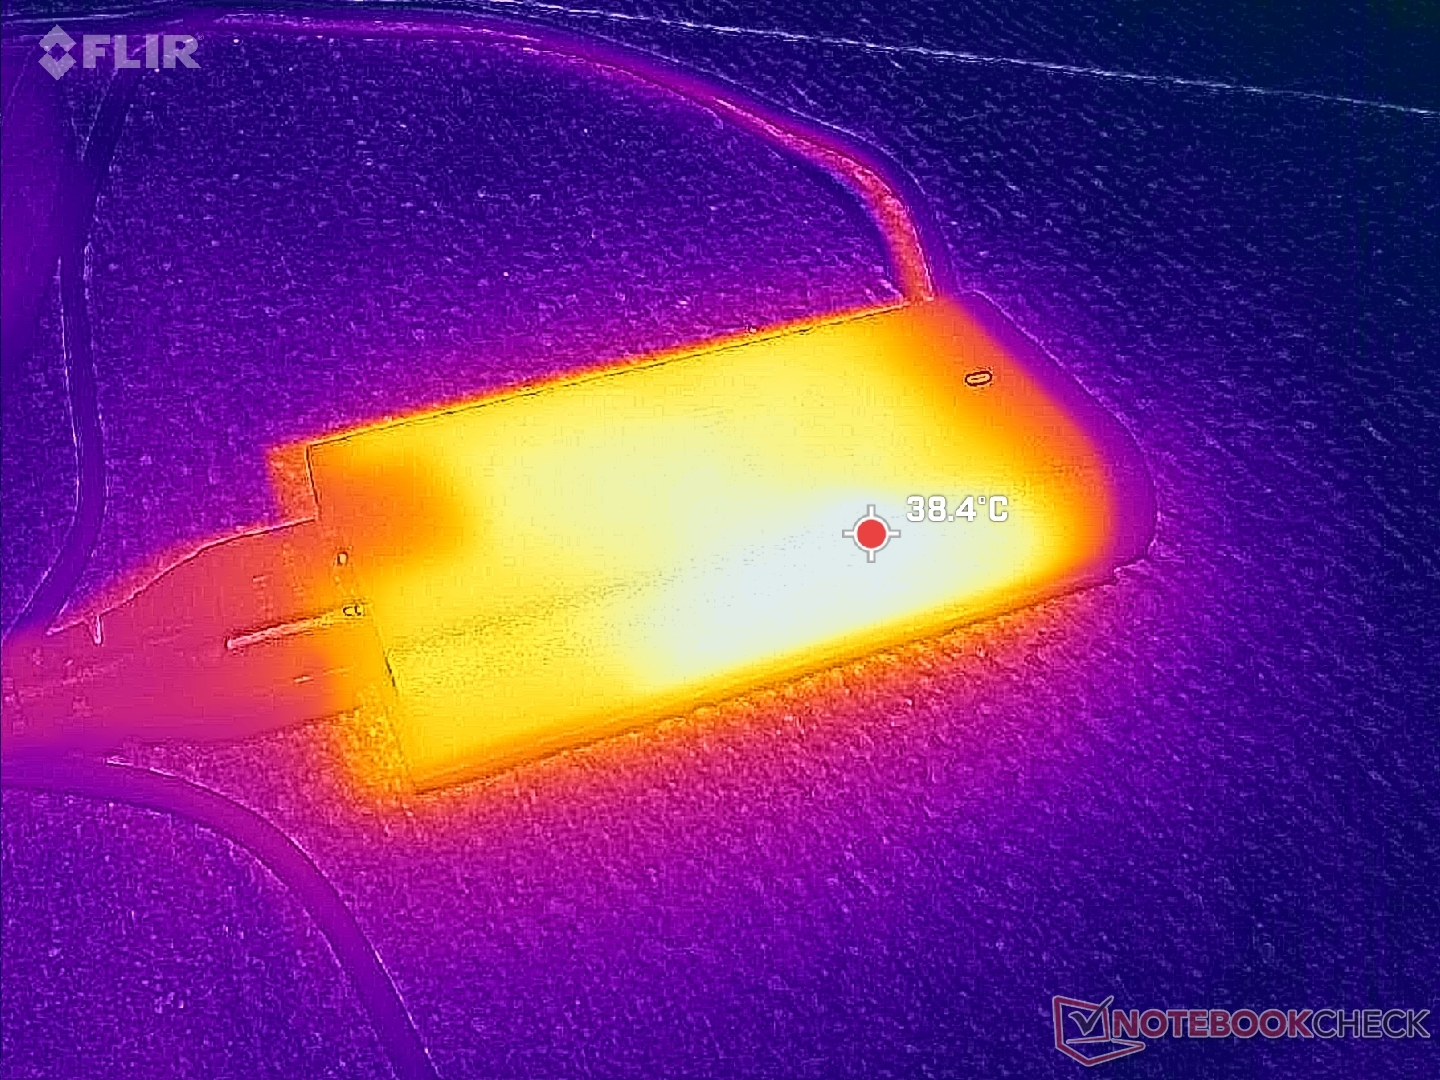
在其他方面,100 W 通用 USB-C AC 适配器在所有 2026 XPS 14 配置中都是相同的。不过,由于酷睿至尊 7 的 Turbo Boost 潜能较低,当 CPU 处于满负荷状态时,我们只能达到 80 W 的最大功耗,而酷睿至尊 X7 配置的功耗为 101 W。
| Off / Standby | |
| Idle | |
| Load |
|
Key:
min: | |
| Dell XPS 14 Core Ultra 7 355 Ultra 7 355, Intel Graphics 4 Xe3 PTL, WD PC SN7100S SDFPMSL-512G-1101, IPS, 1920x1200, 14" | Dell XPS 14 Core Ultra X7 358H Ultra X7 358H, Arc B390 Panther Lake iGPU, Samsung PM9C1b MZVL81T0HFLB-00BH1, OLED, 2880x1800, 14" | Asus ExpertBook PM3406 Ryzen AI 7 350, Radeon 860M, Western Digital PC SN5000S SDEQNSJ-512G-1002, IPS, 1920x1200, 14" | Lenovo ThinkPad T14 Gen 6 21QG001VGE Core Ultra 7 258V, Arc 140V, Samsung PM9E1 1 TB MZVLC1T0HFLU, IPS LED, 1920x1200, 14" | HP OmniBook Ultra Flip 14 Core Ultra 7 258V, Arc 140V, Samsung PM9A1 MZVL22T0HBLB, OLED, 2880x1800, 14" | Samsung Galaxy Book5 Pro 14 940XHA Core Ultra 5 226V, Arc 130V, Samsung PM9C1 MZVL8512HELU, OLED, 2880x1800, 14" | |
|---|---|---|---|---|---|---|
| Power Consumption | -42% | -45% | -14% | -36% | -21% | |
| Idle Minimum * (Watt) | 1.6 | 3.1 -94% | 3.2 -100% | 2.6 -63% | 3 -88% | 3.7 -131% |
| Idle Average * (Watt) | 3.7 | 3.6 3% | 6.1 -65% | 5.2 -41% | 4.4 -19% | 5.2 -41% |
| Idle Maximum * (Watt) | 3.9 | 10 -156% | 6.9 -77% | 6.2 -59% | 9.4 -141% | 5.4 -38% |
| Load Average * (Watt) | 36 | 39.2 -9% | 56.4 -57% | 40.1 -11% | 42.3 -17% | 26.2 27% |
| Cyberpunk 2077 ultra * (Watt) | 50.9 | 51.4 -1% | 64.9 -28% | 27.4 46% | 51.1 -0% | 47.4 7% |
| Cyberpunk 2077 ultra external monitor * (Watt) | 47.7 | 51.2 -7% | 45.3 5% | 45.2 5% | 49.9 -5% | 42.7 10% |
| Load Maximum * (Watt) | 80 | 101.4 -27% | 76.1 5% | 60.3 25% | 65 19% | 63.5 21% |
* ... smaller is better
功耗 赛博朋克/压力测试
外部显示器功耗
电池寿命
WLAN 运行时间与酷睿 Ultra X7 XPS 14 或搭载 Lunar Lake 处理器的产品相当。 HP OmniBook Ultra Flip 14在运行日常负载时表现出出色的电源管理能力。OLED 和 IPS 配置机型之间的电池续航时间差别不大。
| Dell XPS 14 Core Ultra 7 355 Ultra 7 355, Intel Graphics 4 Xe3 PTL, 70 Wh | Dell XPS 14 Core Ultra X7 358H Ultra X7 358H, Arc B390 Panther Lake iGPU, 70 Wh | Asus ExpertBook PM3406 Ryzen AI 7 350, Radeon 860M, 70 Wh | Lenovo ThinkPad T14 Gen 6 21QG001VGE Core Ultra 7 258V, Arc 140V, 57 Wh | HP OmniBook Ultra Flip 14 Core Ultra 7 258V, Arc 140V, 64 Wh | Samsung Galaxy Book5 Pro 14 940XHA Core Ultra 5 226V, Arc 130V, 63 Wh | |
|---|---|---|---|---|---|---|
| Battery runtime | 16% | -3% | 34% | -3% | -30% | |
| WiFi v1.3 (h) | 14.5 | 16.8 16% | 14 -3% | 19.4 34% | 14 -3% | 10.1 -30% |
| Load (h) | 1.6 |
笔记本检查评级
配备酷睿至尊 7 355 处理器的戴尔 XPS 14 保留了价格更高的 X7 的时尚设计,同时配备了高质量的 IPS 显示屏,但其性能和效率更接近上一代芯片。
Dell XPS 14 Core Ultra 7 355
- 02/14/2026 v8
Allen Ngo
 Total Sustainability Score:
 潜在竞争对手比较
Image | Model / Review | Price | Weight | Height | Display |
|---|---|---|---|---|---|
1. 84.8%  | Dell XPS 14 Core Ultra 7 355 Intel Core Ultra 7 355 ⎘ Intel Graphics 4 Xe3 Panther Lake iGPU ⎘ 16 GB Memory, 512 GB SSD | Amazon: 1. $1,789.99 Dell XPS 14 Premium Laptop D... 2. $2,049.00 Dell XPS 14 9440 14.5" Noteb... 3. $2,459.99 Dell Premium 16 (Previously ... List Price: 1600 USD | 1.5 kg | 15.2 mm | 14.00" 1920x1200 162 PPI IPS |
2. 87.4%  | Dell XPS 14 Core Ultra X7 358H Intel Core Ultra X7 358H ⎘ Intel Arc B390 12 Xe3 Panther Lake iGPU ⎘ 32 GB Memory, 1000 GB SSD | Amazon: 1. $1,789.99 Dell XPS 14 Premium Laptop D... 2. $2,459.99 Dell Premium 16 (Previously ... 3. $2,049.00 Dell XPS 14 9440 14.5" Noteb... List Price: 2200 USD | 1.4 kg | 14.62 mm | 14.00" 2880x1800 243 PPI OLED |
3. 84.7%  | Asus ExpertBook PM3406 AMD Ryzen AI 7 350 ⎘ AMD Radeon 860M ⎘ 16 GB Memory, 512 GB SSD | Amazon: List Price: 979€ | 1.4 kg | 17.9 mm | 14.00" 1920x1200 162 PPI IPS |
4. 88.9%  | Lenovo ThinkPad T14 Gen 6 21QG001VGE Intel Core Ultra 7 258V ⎘ Intel Arc Graphics 140V ⎘ 32 GB Memory, 1024 GB SSD | Amazon: List Price: 1960 Euro | 1.5 kg | 22 mm | 14.00" 1920x1200 162 PPI IPS LED |
5. 88.7%  | HP OmniBook Ultra Flip 14 Intel Core Ultra 7 258V ⎘ Intel Arc Graphics 140V ⎘ 32 GB Memory, 2048 GB SSD | Amazon: List Price: 1250 USD | 1.3 kg | 15 mm | 14.00" 2880x1800 243 PPI OLED |
6. 86.9%  | Samsung Galaxy Book5 Pro 14 940XHA Intel Core Ultra 5 226V ⎘ Intel Arc Graphics 130V ⎘ 16 GB Memory, 512 GB SSD | Amazon: List Price: 1699€ | 1.2 kg | 11.6 mm | 14.00" 2880x1800 243 PPI OLED |
Transparency
The selection of devices to be reviewed is made by our editorial team. The test sample was provided to the author as a loan by the manufacturer or retailer for the purpose of this review. The lender had no influence on this review, nor did the manufacturer receive a copy of this review before publication. There was no obligation to publish this review. As an independent media company, Notebookcheck is not subjected to the authority of manufacturers, retailers or publishers.
This is how Notebookcheck is testing
Every year, Notebookcheck independently reviews hundreds of laptops and smartphones using standardized procedures to ensure that all results are comparable. We have continuously developed our test methods for around 20 years and set industry standards in the process. In our test labs, high-quality measuring equipment is utilized by experienced technicians and editors. These tests involve a multi-stage validation process. Our complex rating system is based on hundreds of well-founded measurements and benchmarks, which maintains objectivity. Further information on our test methods can be found here.

