结论 - XPS 重生
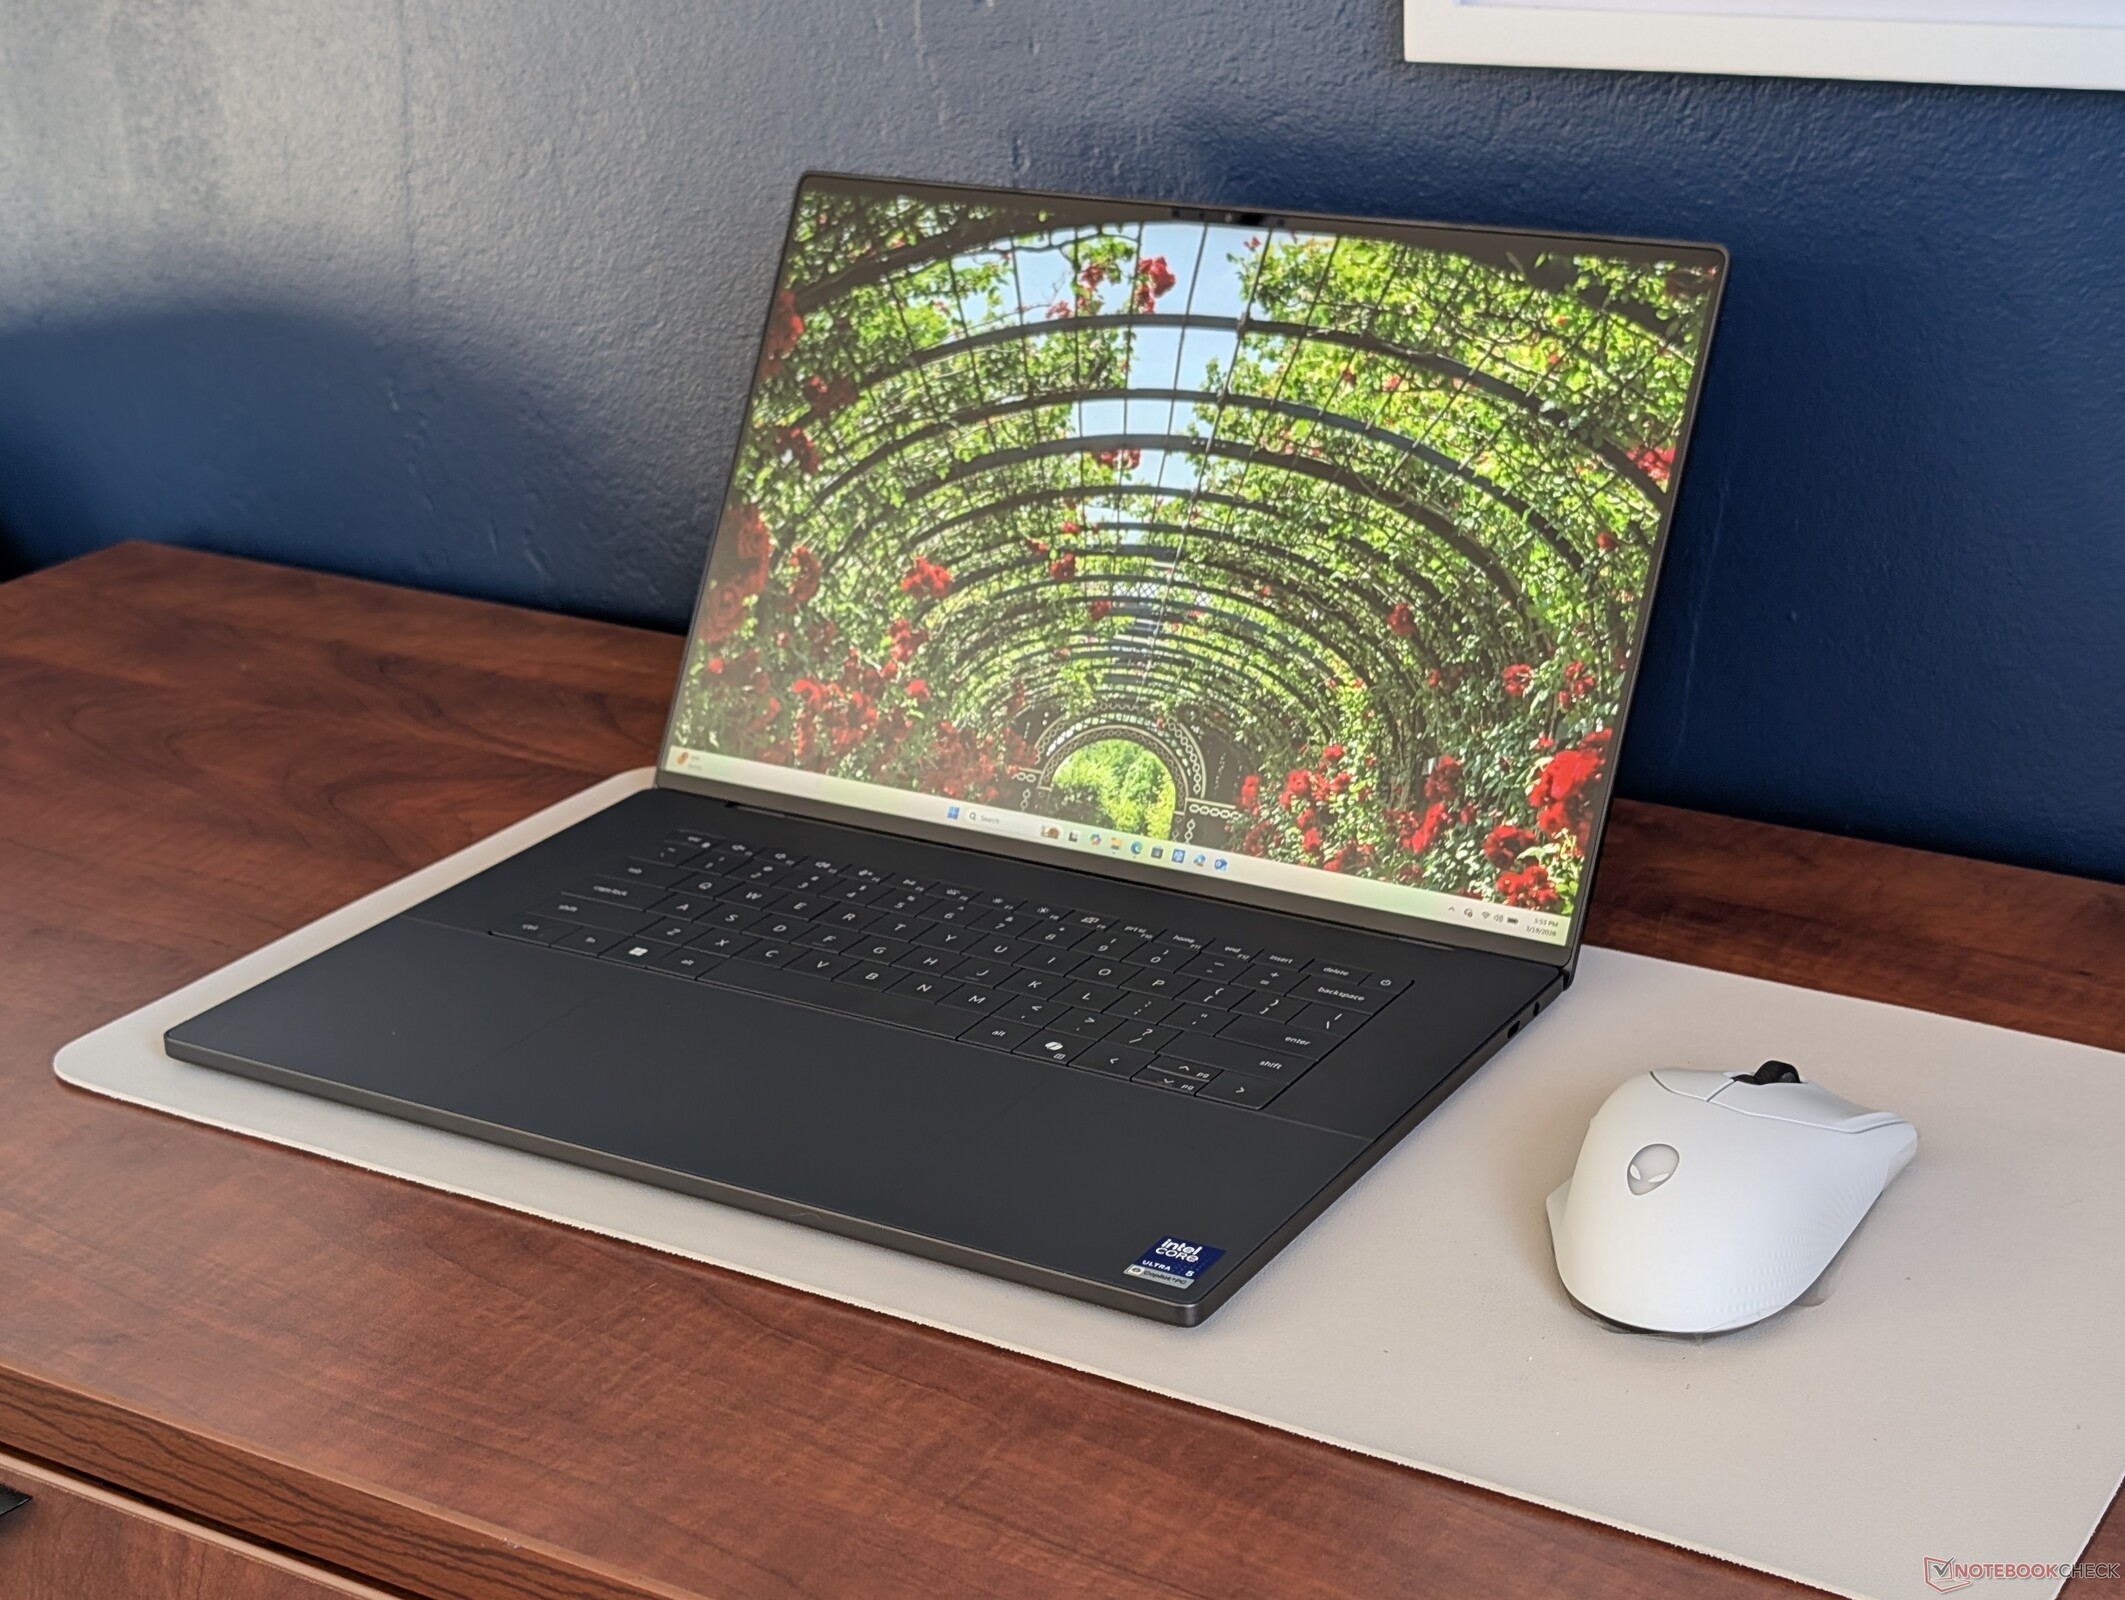
与新款 XPS 14 一样,2026 XPS 16 也解决了 2025 型号最受关注的一些问题,带来了更好的用户体验。现在,该系统更轻便、更便于旅行,视觉美感更简洁,也没有了令人沮丧的触摸式按键。采用 Panther Lake 处理器后,每瓦性能也有了显著提高,运行时间至少可以延长几个小时。
今年设计更精简、更安静、更紧凑的一个关键原因是一个重大变化:不再有独立显卡选项。没有 dGPU 意味着系统可以使用更小的印刷电路板、更小的冷却解决方案和更薄的外形,从而实现整体的轻量化。用户将牺牲图形处理性能,因为 Panther Lake 的集成 GPU 虽然高效,却无法与即将上市的戴尔 16 Premium 上的GeForce RTX 5070 相提并论。外置 GPU 可以解决这一限制,但内容创作者或需要更多图形性能的游戏玩家可能会发现 2025 型号更有价值。
与某些竞争对手相比,新款 XPS 16 更纤薄、更集中的设计有时会让人感觉很简陋。像 三星Galaxy Book6 Ultra或 华硕 Zenbook S16等替代产品拥有更多集成端口,甚至支持二级 M.2 固态硬盘,从而减少了对适配器或扩展坞的依赖。
Pros
Cons
价格和供应情况
目前,戴尔 XPS 16 的起价为 1750 美元(酷睿 5 325 配置),最高为 2160 美元(酷睿 X7 358H OLED 触摸屏配置)。
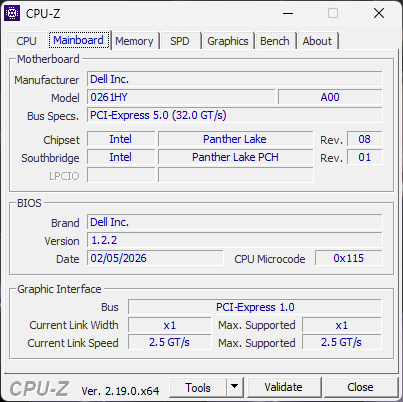
与新款 XPS 14 一起在 2026 年 CES 上亮相与新款 XPS 14 同时亮相的还有 2026 XPS 16,这是该系列在去年跳过 "XPS "品牌,转而使用 "戴尔 16 Premium "品牌之后的又一次复兴。戴尔 16 Premium"的名称。与前几年相比,新机型不仅搭载了最新的英特尔豹湖处理器,还更新了机箱设计,带来了全新的用户体验。
我们的测试机为基本配置,配备酷睿至尊 5 325 CPU 和 FHD+ 120 Hz IPS 显示屏,售价约为 1700 美元。高端配置包括酷睿至尊 7 355、酷睿至尊 X7 358H 和 OLED 120 Hz 触摸屏,售价近 2200 美元。截至发稿时,所有选件均只配备集成显卡。
戴尔 XPS 16 的替代产品包括其他高端 16 英寸多媒体机,如 三星Galaxy Book6 Ultra, 华硕 Zenbook S16或 联想 Yoga Pro 9 16.
更多戴尔评测:
规格
案例 - 比以前轻多了
重新设计的机箱与即将推出的戴尔 16 Premium 或 2024 XPS 16.不过,它采用了与 2026 XPS 14 相同的材料,所以我们对 XPS 14 的印象是 对 XPS 14 的印象因此,我们在 XPS 14 上留下的印象在新款 XPS 16 上也得到了印证。刚度感觉和以前一样好,但边缘和边角更方正,更接近 MacBook Pro 16 的视觉风格。 MacBook Pro 16.
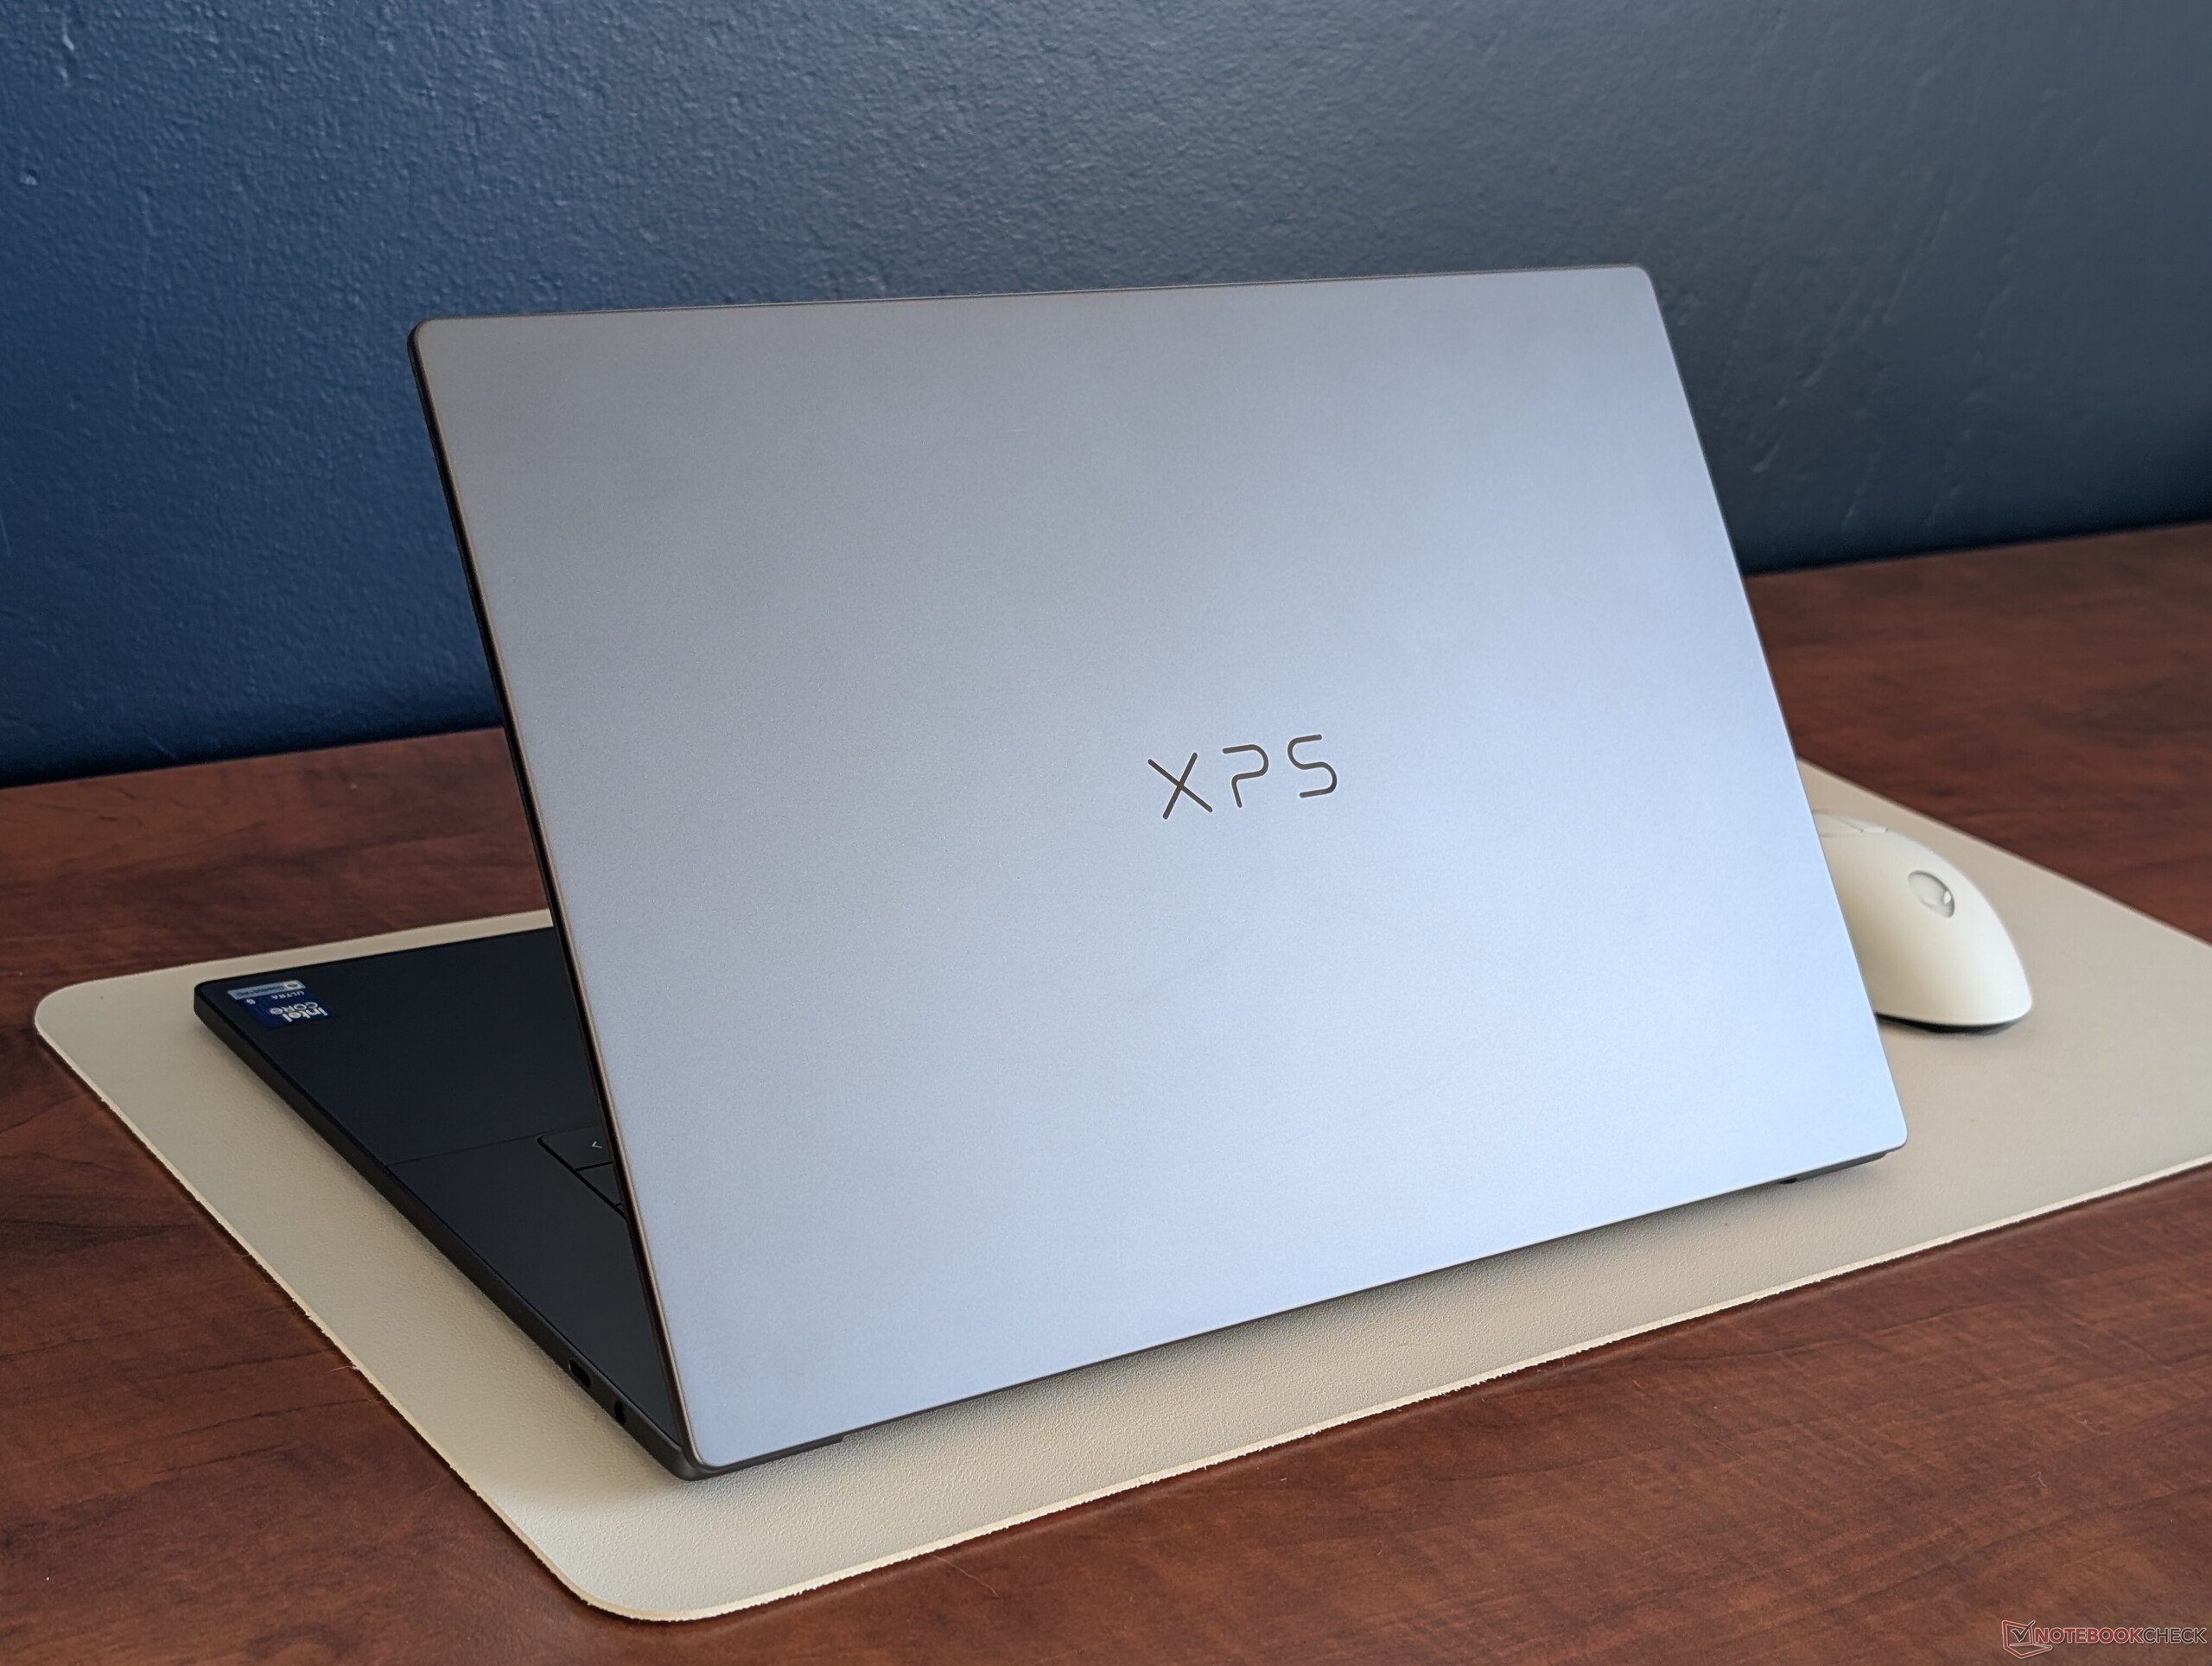
新款 XPS 16 与旧款 XPS 16(或戴尔 16 Premium)在尺寸和重量上差异显著。更新后的机型在长度、宽度和高度上都明显减小,同时重量也减轻了约 600 克。这些变化主要是由于在过渡到新款 XPS 16 设计时放弃了独立显卡选项和蒸汽腔冷却系统。屏幕尺寸也从 16.3 英寸略微缩小到 16.0 英寸。


连接性
所有三个 USB-C 端口现在都支持 Thunderbolt 4,而去年的机型则不支持。遗憾的是,戴尔放弃了 MicroSD 卡插槽,这令数码单反相机用户感到遗憾。
竞争机型如 华硕 Zenbook S16或联想 Yoga Pro 9 16IAH10 等竞争机型往往拥有比戴尔更多的集成端口和选项。


交流

网络摄像头
摄像头从戴尔 16 Premium 的 200 万像素升级到新款 XPS 16 的 800 万像素。虽然支持红外功能,但仍然没有物理相机快门。


维护
维修程序与去年的 XPS 16 设计完全不同,但在其他方面与新的 XPS 14 几乎完全相同。 在此详细说明.用户必须小心翼翼地拆下键盘面板才能接触到主板,而不是拆下底板,因此过程略显繁琐。
遗憾的是,升级选项非常有限。该机型仅支持单个 M.2 固态硬盘,尽管外形尺寸为 16 英寸,但没有其他可升级组件。

可持续性
戴尔称,上盖和下盖采用了 75% 的可回收铝,电池采用了 50% 的可回收钴,键帽采用了 90% 的可回收钢,电池 PCB 采用了 100% 的可回收铜,OLED 配置采用了 10% 的可回收玻璃。包装完全可回收且不含塑料。
配件和保修
包装盒内除了交流适配器和文件外没有其他附件。如果在美国购买,制造商通常提供为期一年的有限保修服务,保修期可延长至四年。
输入设备 - 告别触摸式按键
键盘
值得庆幸的是,戴尔放弃了去年备受争议的触摸式按键,转而采用了更为传统的方式。事实上,按键尺寸和反馈与新款 XPS 14 完全相同。 新款 XPS 14尽管我们的 XPS 16 外形尺寸更大,但它们的键入体验相同。
触摸板
与键盘不同,点击板利用了 16 英寸较大外形尺寸的优势,其表面积比 XPS 14 上的点击板略大(约 15.2 x 9 厘米对约 15.2 x 7.5 厘米)。触控非常流畅,但由于反馈较浅、较弱,多点触控或拖放操作仍然比较困难。可以说,"隐形 "点击板仍然是形式大于功能。


显示屏 - 最佳 FHD+ IPS 面板之一
有两种显示方式可供选择:
- 1920 x 1200、100% sRGB、IPS、非触摸、1 - 120 Hz、亚光
- 3200 x 2000、100% DCI-P3、OLED、触摸屏、20 - 120 Hz、DisplayHDR 500、光面
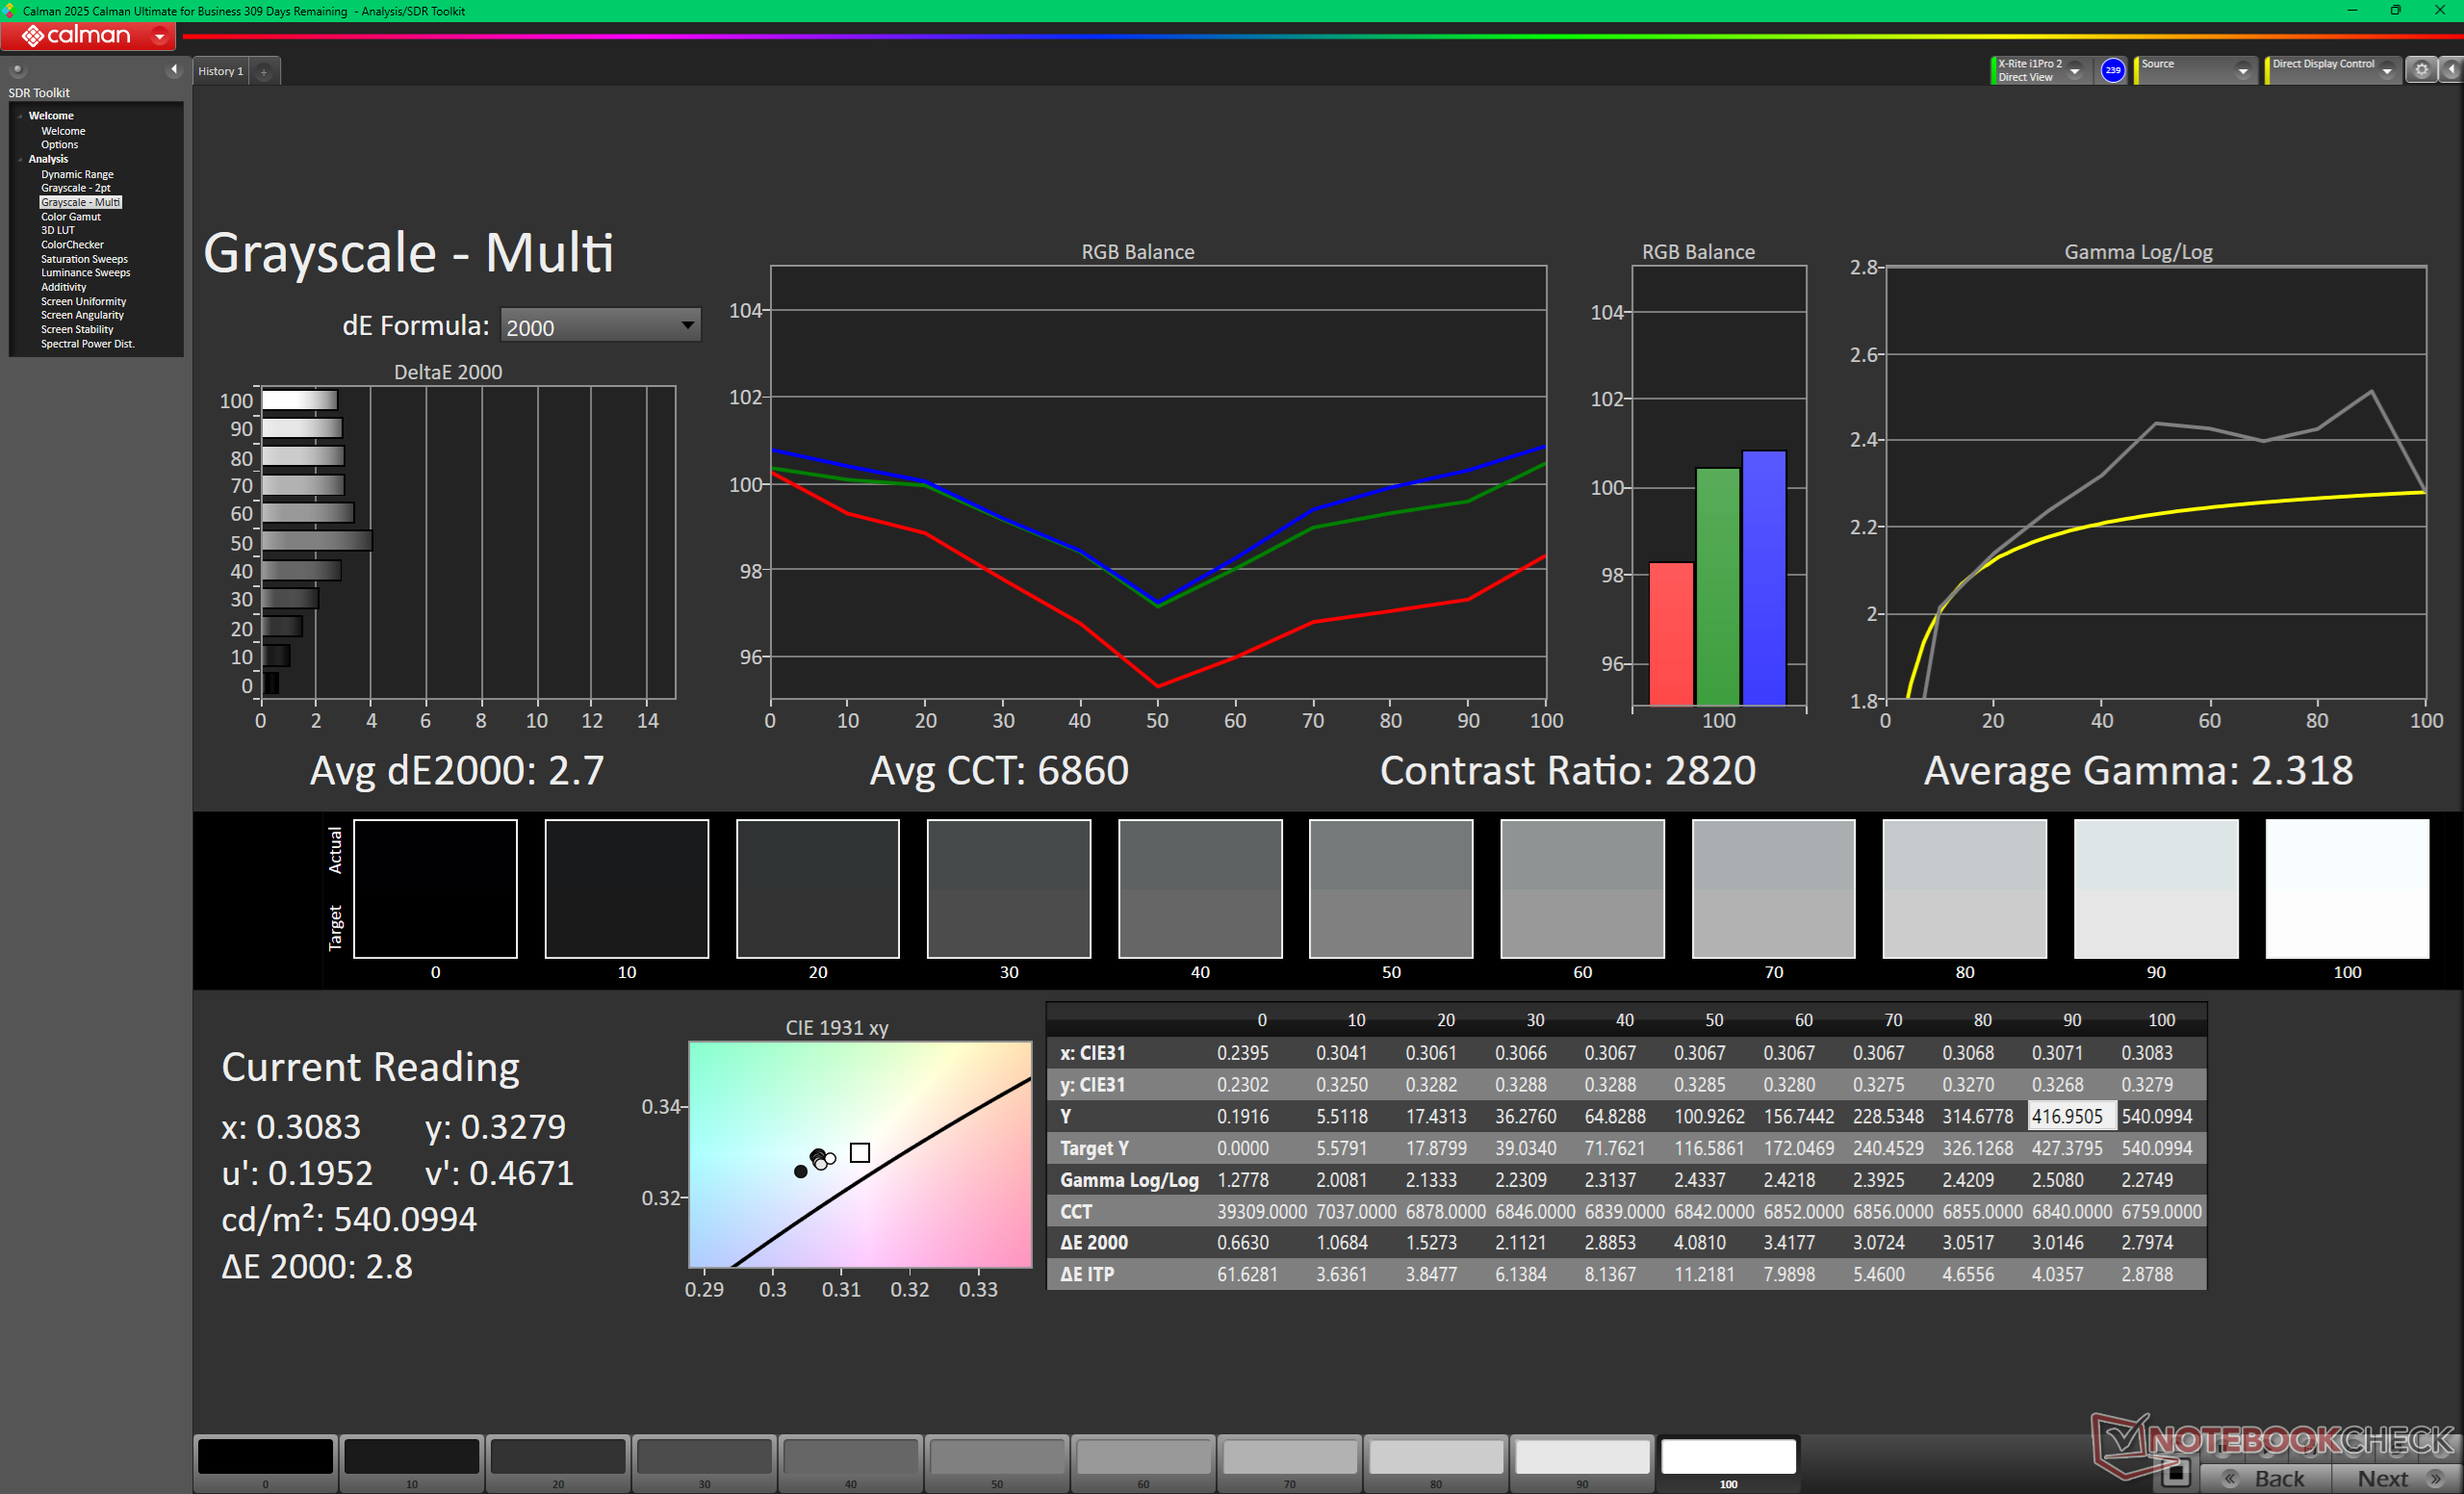
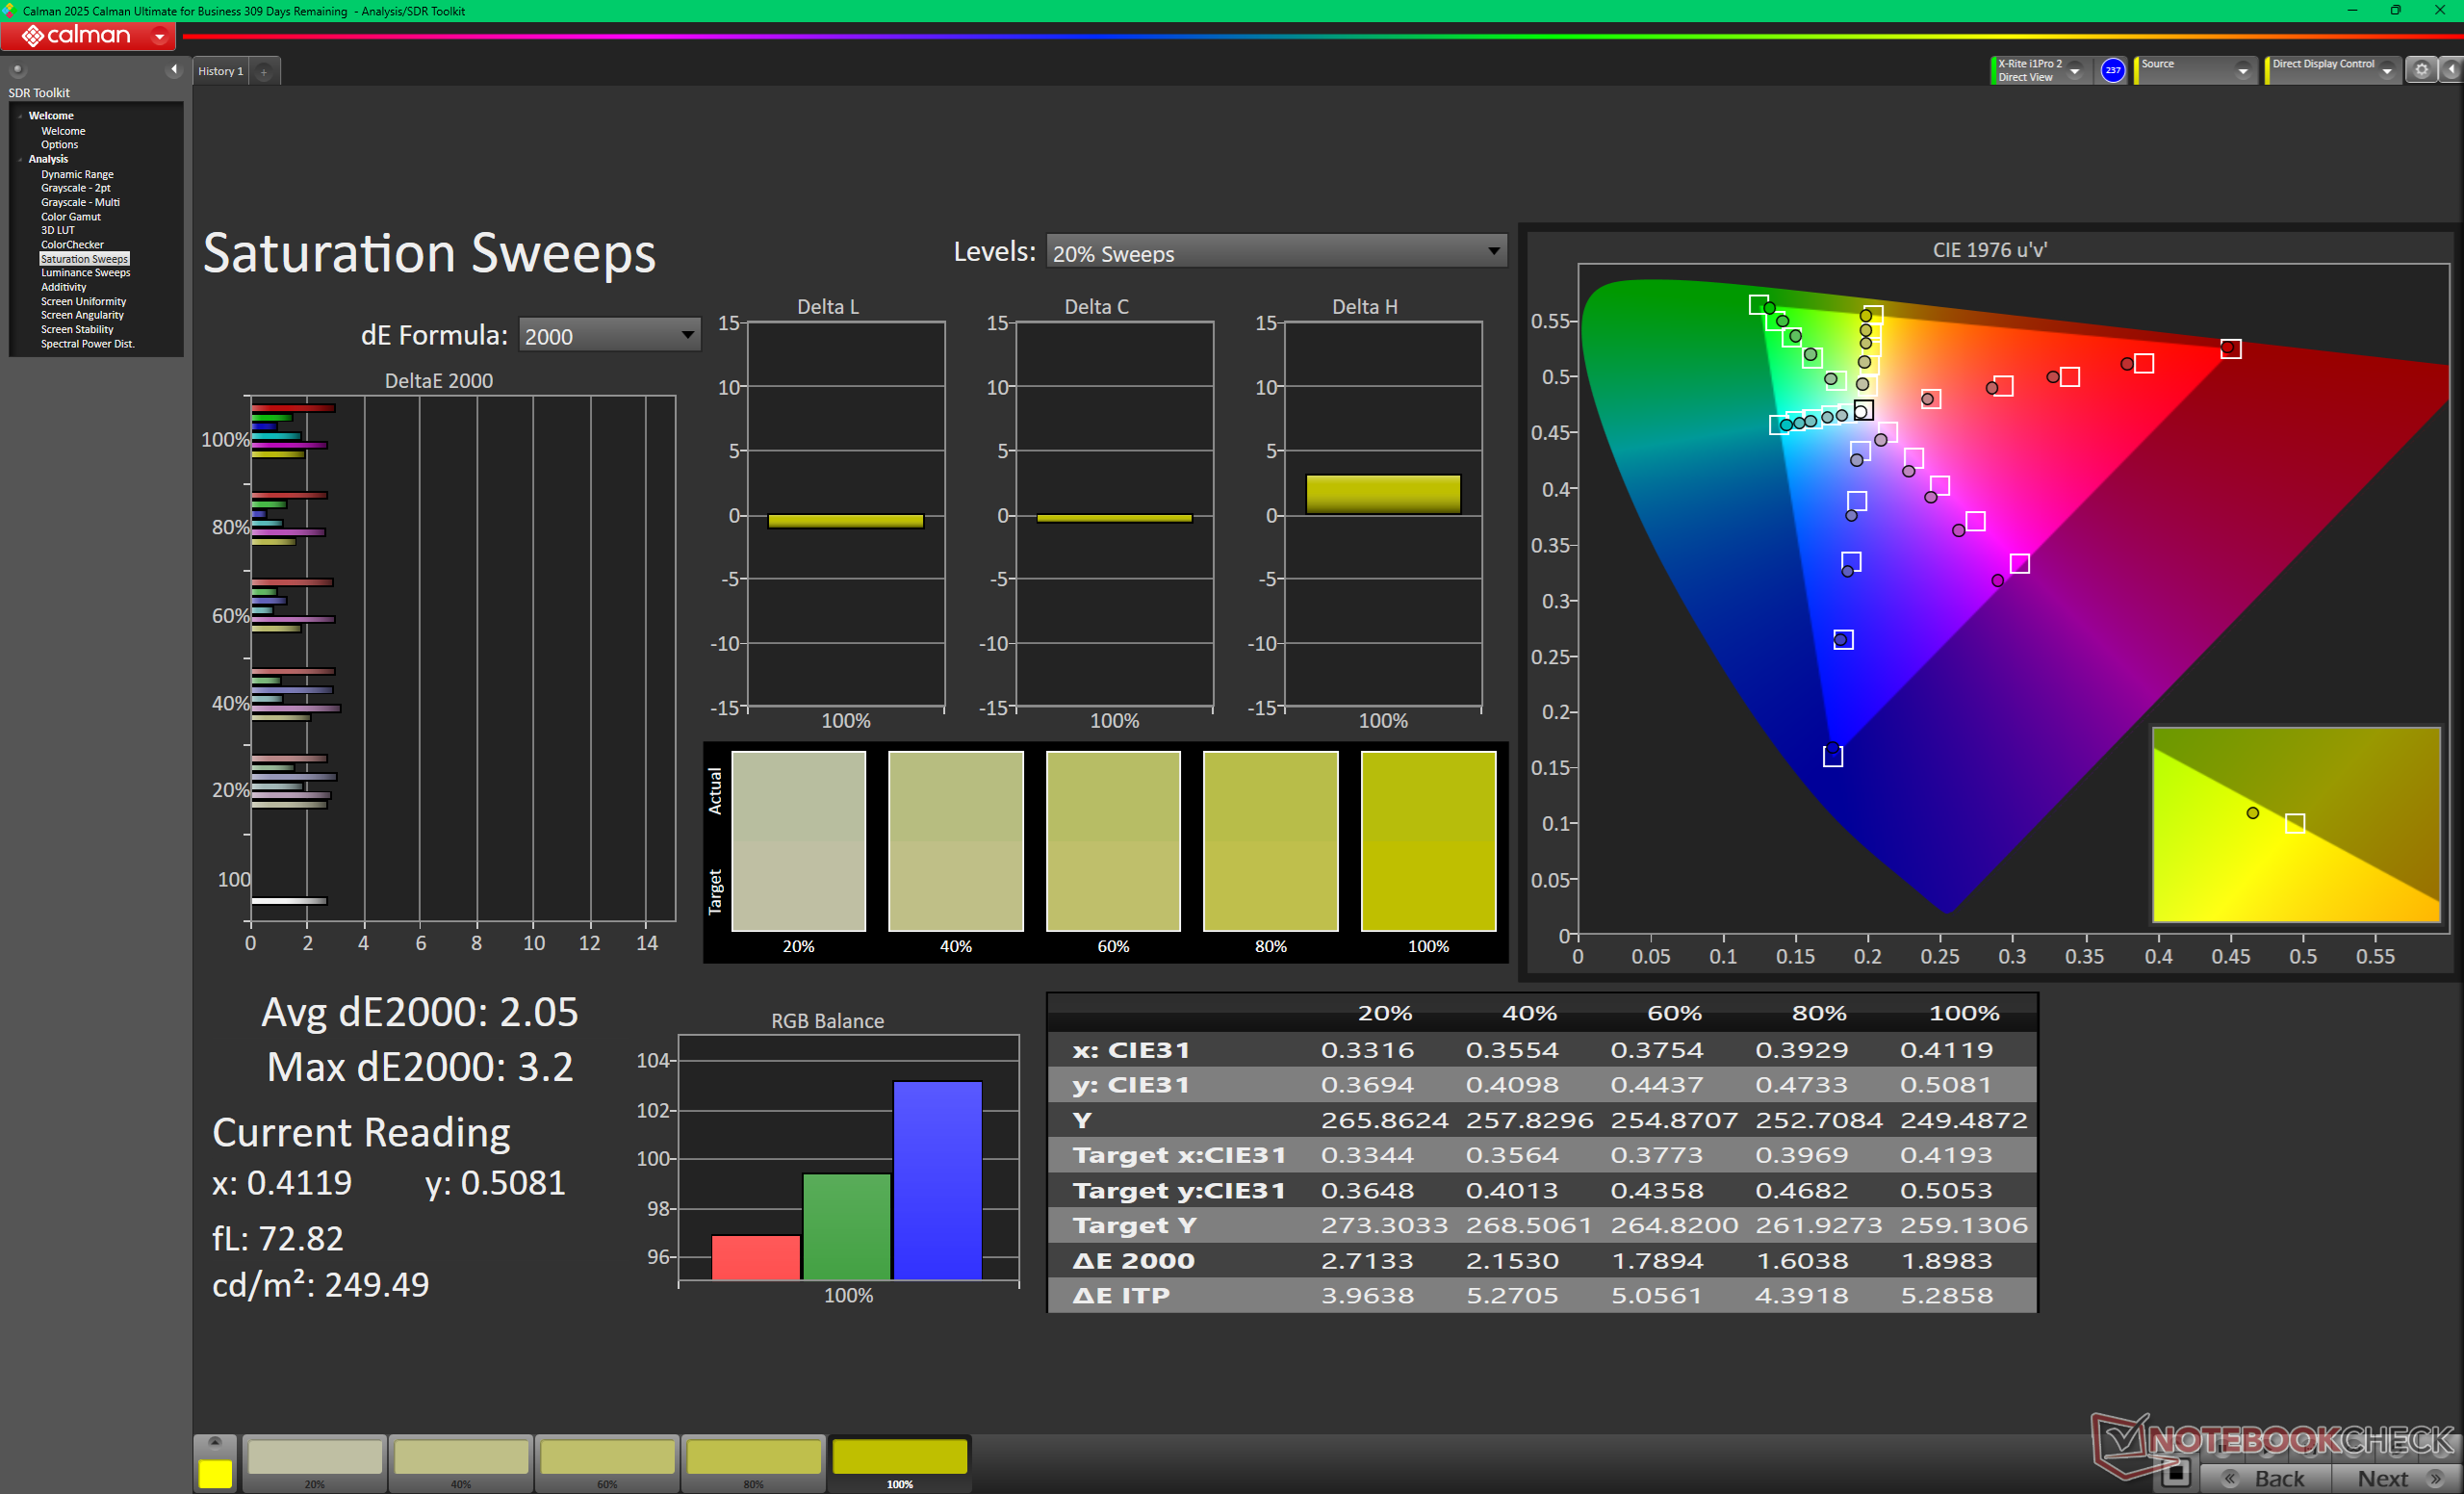
基本显示屏的对比度非常高,约为 2000:1,尤其是对于 IPS 面板而言。对于一款哑光覆盖屏来说,图像质量出奇地清晰,而完整的 sRGB 色彩应能满足大多数普通用户或休闲内容创作者的需求。只有价格较高的 OLED 配置才能提供更深的 P3 色彩、HDR 支持或触摸屏功能。
请注意,VRR 默认为禁用。用户可通过 Windows 高级显示选项启用 VRR。1 Hz 最低刷新率是基本面板的独特功能,大多数其他笔记本电脑都没有。


| |||||||||||||||||||||||||
Brightness Distribution: 92 %
Center on Battery: 534.6 cd/m²
Contrast: 2056:1 (Black: 0.26 cd/m²)
ΔE ColorChecker Calman: 2.53 | ∀{0.5-29.43 Ø4.73}
calibrated: 1.26
ΔE Greyscale Calman: 2.7 | ∀{0.09-98 Ø4.97}
67.7% AdobeRGB 1998 (Argyll 3D)
97.4% sRGB (Argyll 3D)
66.2% Display P3 (Argyll 3D)
Gamma: 2.32
CCT: 6860 K
| Dell XPS 16 Core Ultra 5 325 LG Philips 160WUX, IPS, 1920x1200, 16", 120 Hz | Dell XPS 16 9640 SDC4196, OLED, 3840x2400, 16.3", 90 Hz | Lenovo Yoga Pro 9 16IAH10 RTX 5050 ATNA60HR04-0, OLED, 2880x1800, 16", 120 Hz | Samsung Galaxy Book6 Ultra ATNA60HR05-0, OLED, 2880x1800, 16", 120 Hz | Asus ZenBook S16 UM5606GA ATNA60HR07-0, OLED, 2880x1800, 16", 120 Hz | MSI Prestige 16 AI Evo B2HMG B160QAN03_R, IPS, 2560x1600, 16", 60 Hz | |
|---|---|---|---|---|---|---|
| Display | 27% | 25% | 31% | 24% | ||
| Display P3 Coverage (%) | 66.2 | 98.3 48% | 97 47% | 99.8 51% | 96.4 46% | |
| sRGB Coverage (%) | 97.4 | 100 3% | 99.9 3% | 100 3% | 99.7 2% | |
| AdobeRGB 1998 Coverage (%) | 67.7 | 87.8 30% | 85.3 26% | 94 39% | 84.3 25% | |
| Response Times | 98% | 99% | 98% | -12% | ||
| Response Time Grey 50% / Grey 80% * (ms) | 39.3 ? | 0.82 ? 98% | 0.5 ? 99% | 1.27 ? 97% | 51.5 ? -31% | |
| Response Time Black / White * (ms) | 26 ? | 0.85 ? 97% | 0.4 ? 98% | 0.43 ? 98% | 24.3 ? 7% | |
| PWM Frequency (Hz) | 360 ? | 1200 | 240 ? | 960 ? | ||
| PWM Amplitude * (%) | 37 | 100 | 56 | |||
| Screen | 8% | -15% | 26% | 18% | -55% | |
| Brightness middle (cd/m²) | 534.6 | 366 -32% | 471.7 -12% | 499 -7% | 465 -13% | 471 -12% |
| Brightness (cd/m²) | 515 | 367 -29% | 474 -8% | 505 -2% | 466 -10% | 455 -12% |
| Brightness Distribution (%) | 92 | 96 4% | 98 7% | 97 5% | 99 8% | 92 0% |
| Black Level * (cd/m²) | 0.26 | 0.2 23% | ||||
| Contrast (:1) | 2056 | 2355 15% | ||||
| Colorchecker dE 2000 * | 2.53 | 1.3 49% | 3.53 -40% | 0.9 64% | 1 60% | 5.8 -129% |
| Colorchecker dE 2000 max. * | 4.57 | 3.6 21% | 6.31 -38% | 2.1 54% | 3 34% | 10.8 -136% |
| Colorchecker dE 2000 calibrated * | 1.26 | 1 21% | 1.9 -51% | |||
| Greyscale dE 2000 * | 2.7 | 2.2 19% | 2.6 4% | 1.6 41% | 1.9 30% | 7.8 -189% |
| Gamma | 2.32 95% | 2.14 103% | 2.24 98% | 2.22 99% | 2.19 100% | 2.07 106% |
| CCT | 6860 95% | 6680 97% | 6292 103% | 6445 101% | 6458 101% | 7262 90% |
| Total Average (Program / Settings) | 44% /
27% | -15% /
-15% | 50% /
39% | 49% /
36% | -14% /
-32% |
* ... smaller is better
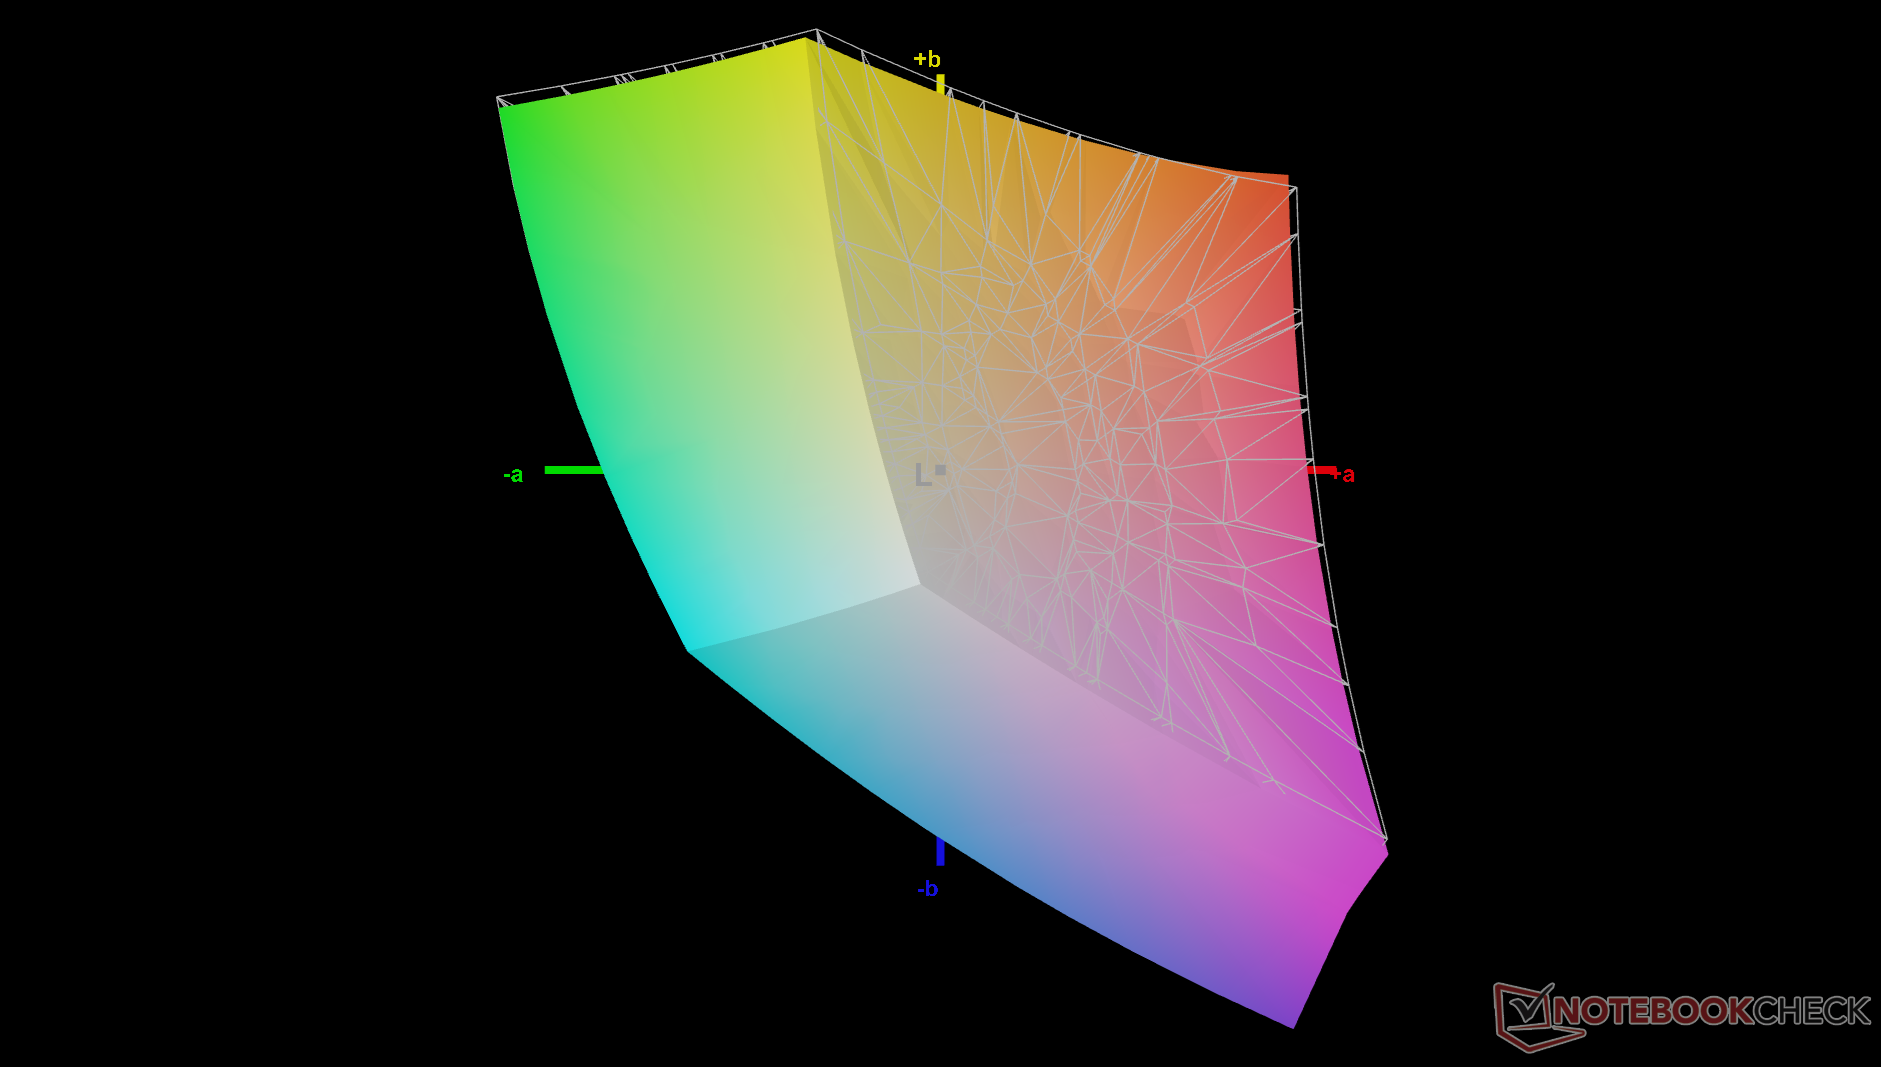
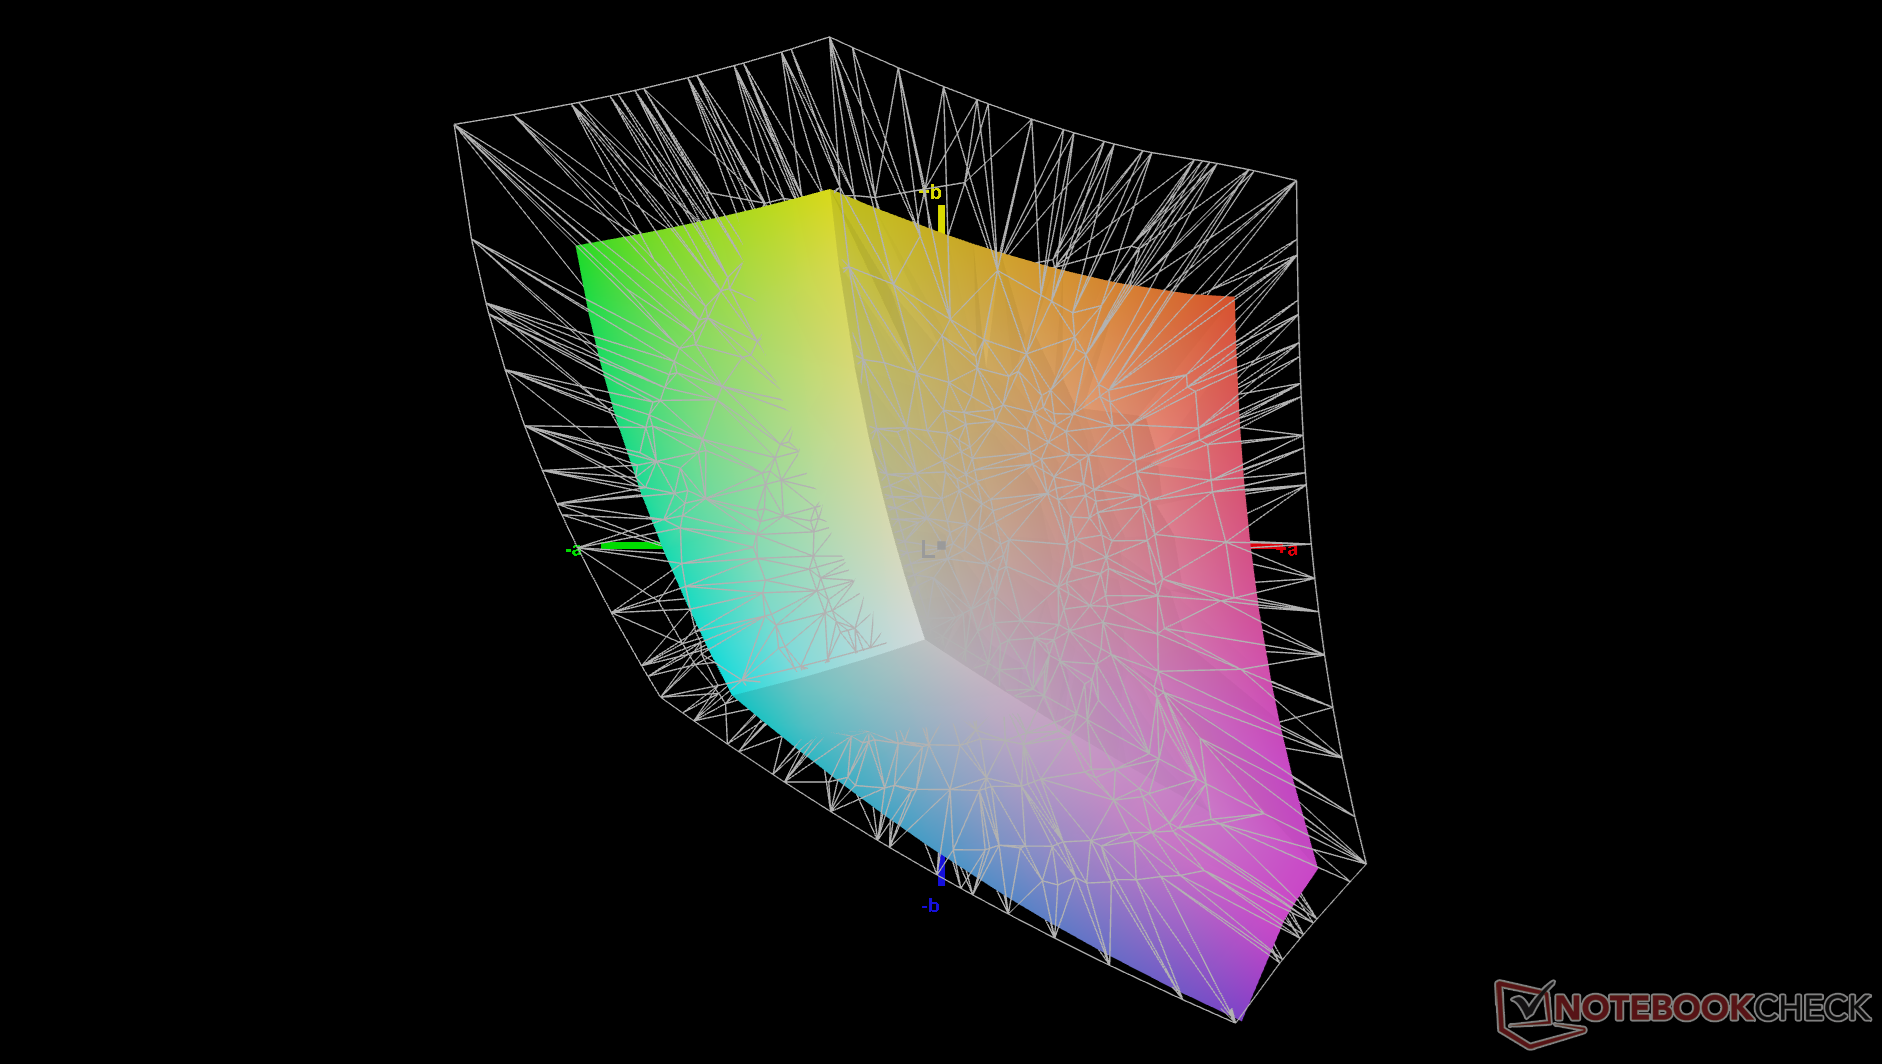
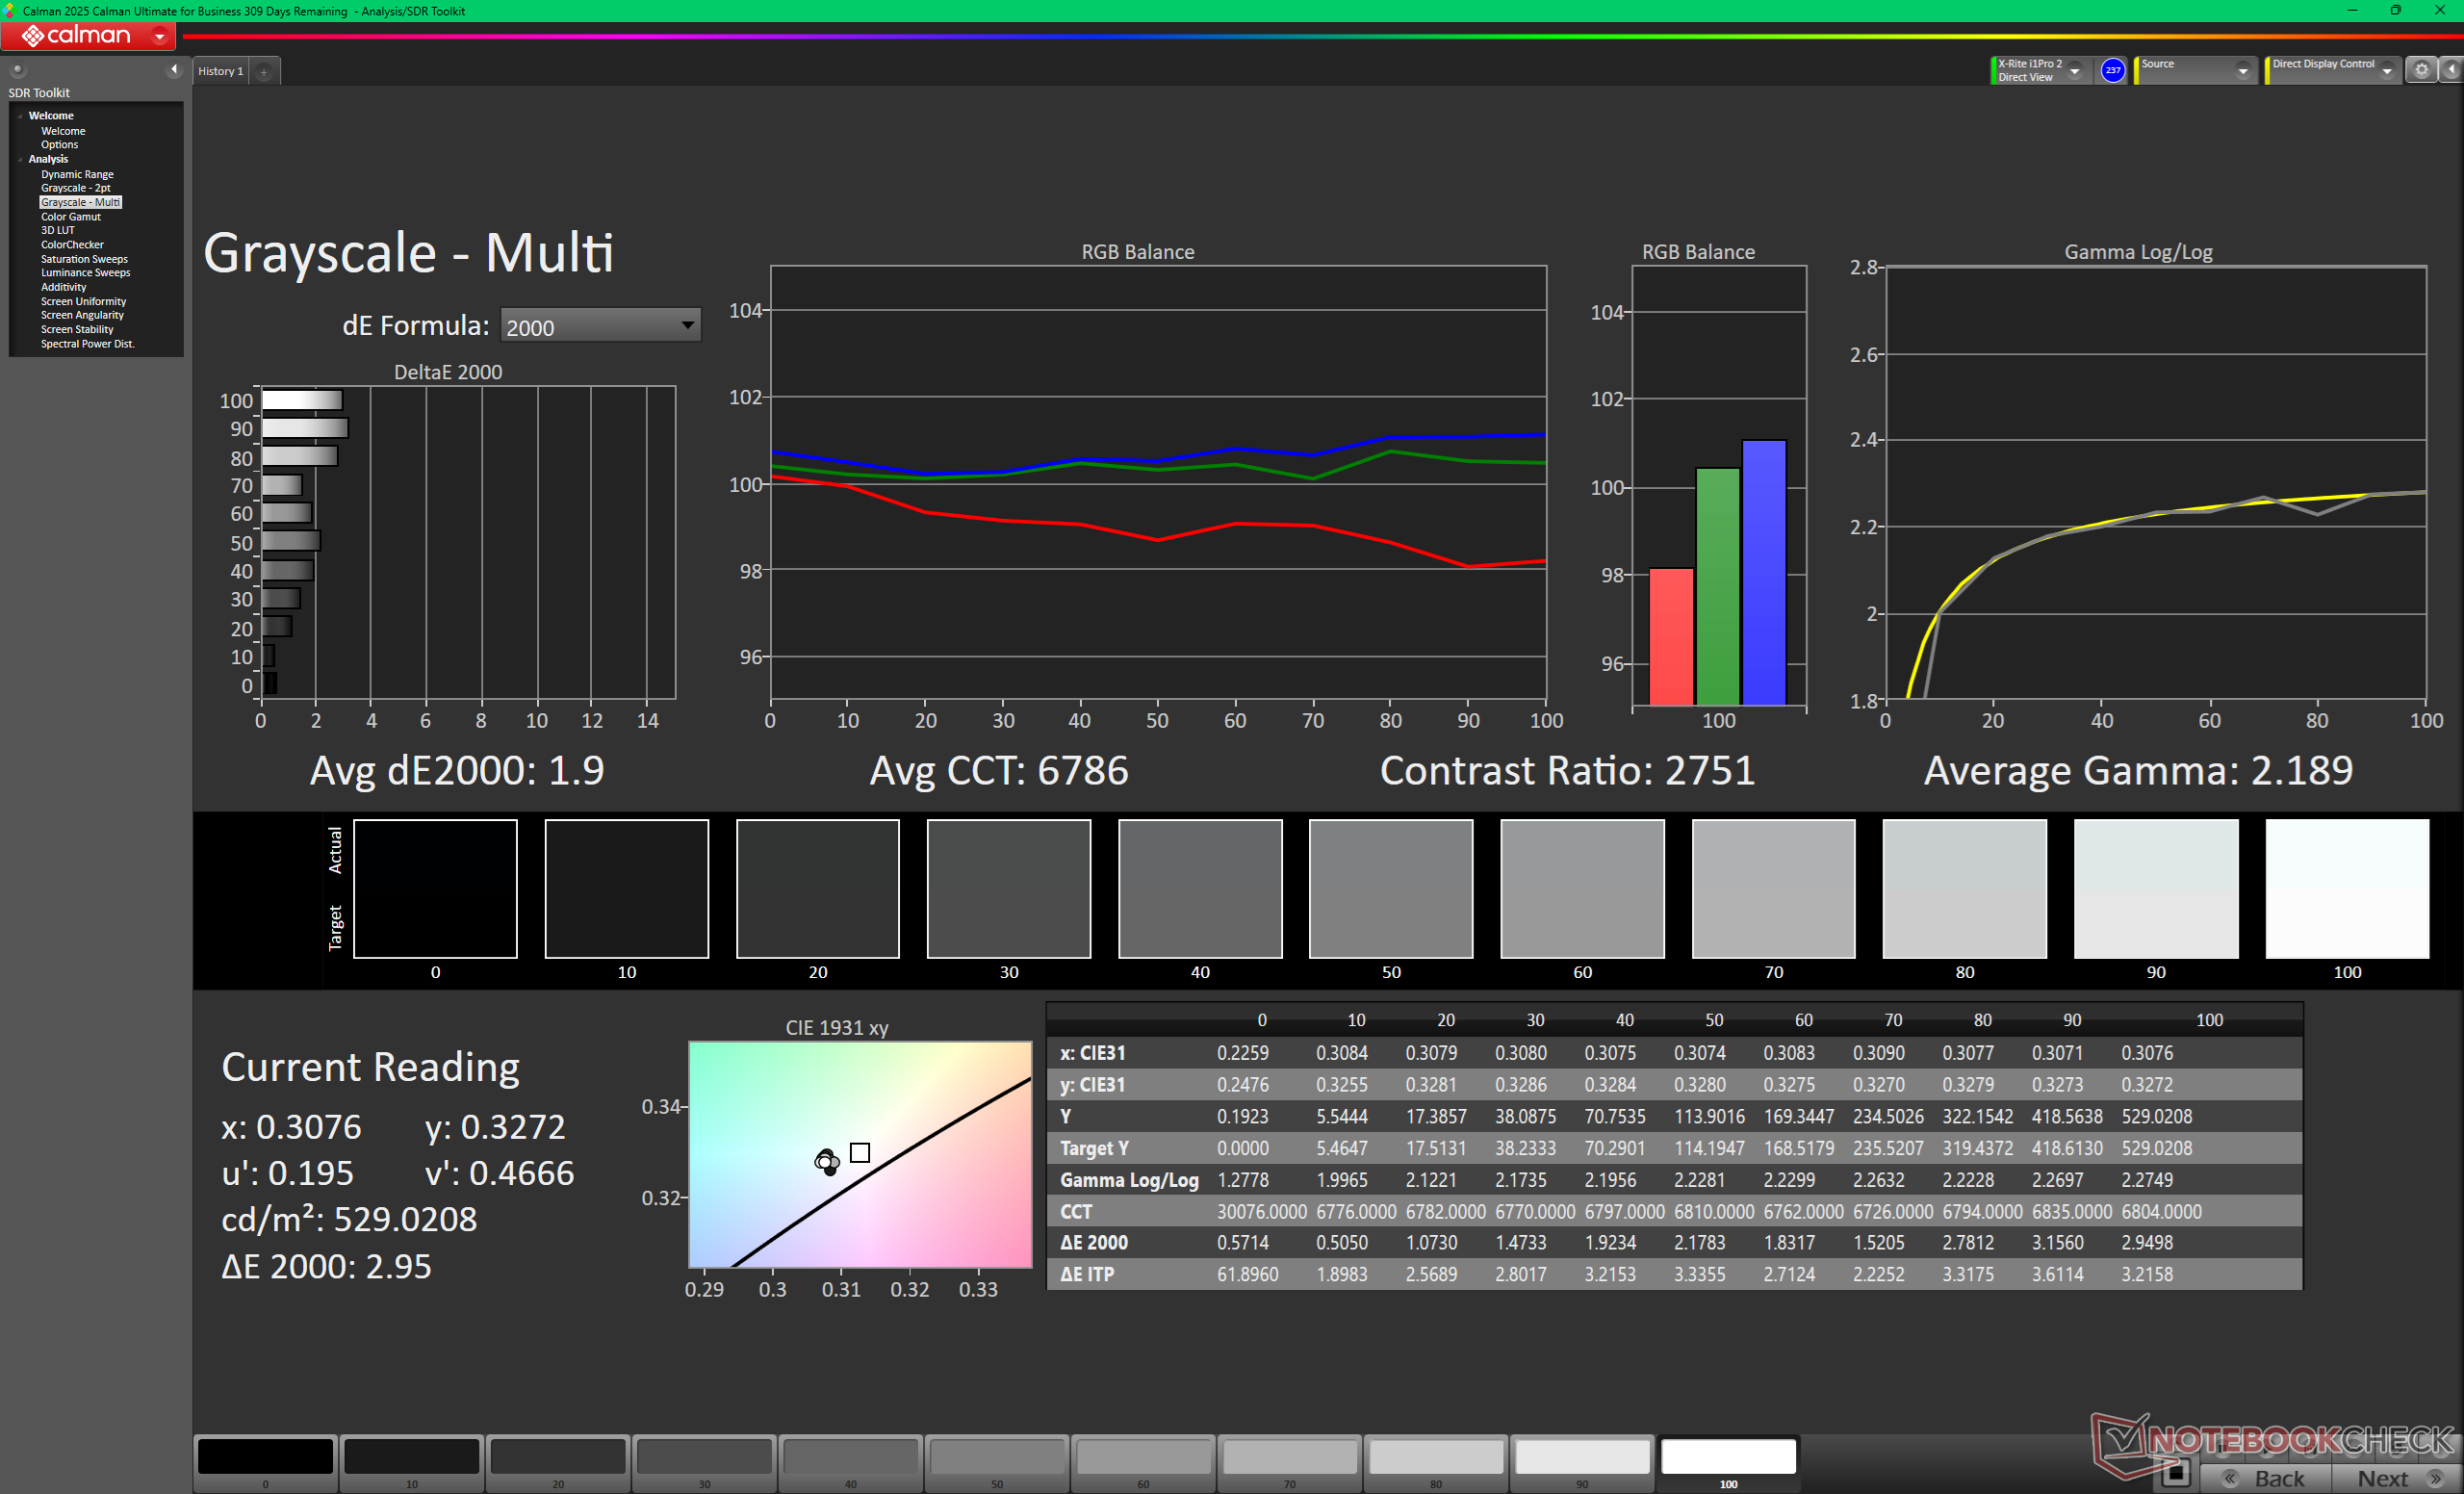
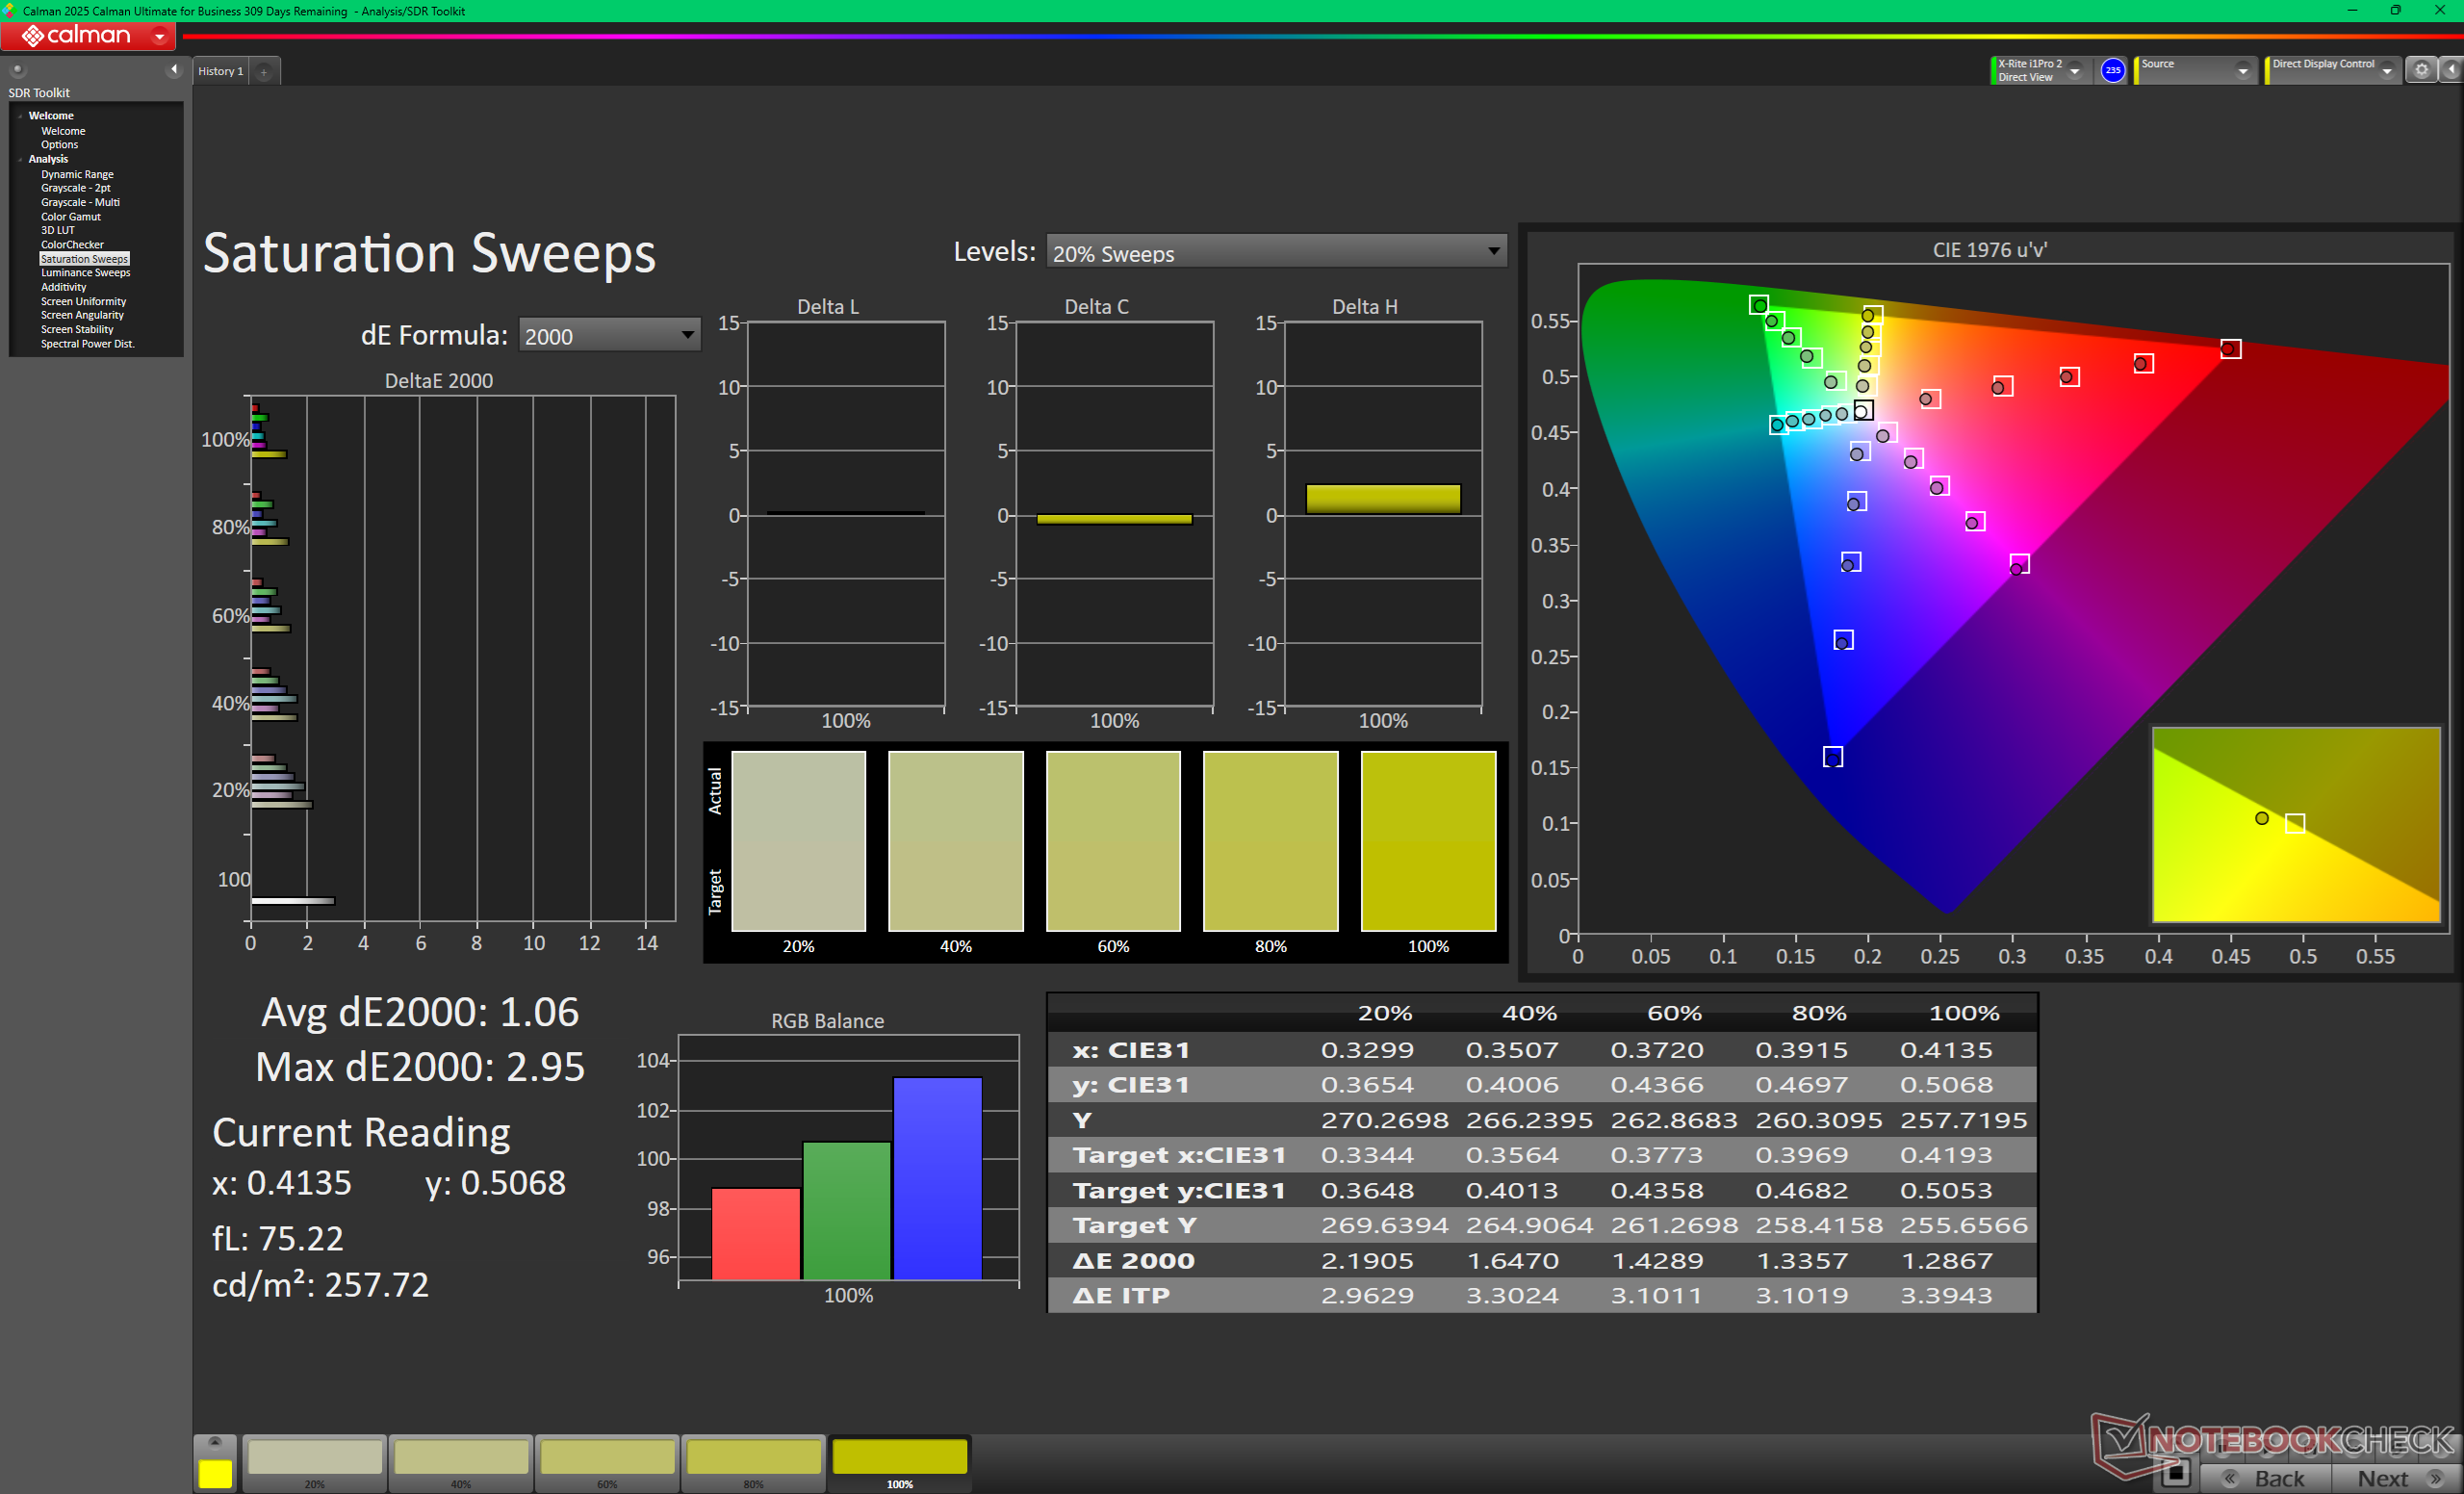
显示器开箱后的校准效果尚可,但仍有改进的余地。例如,使用我们自己的 X-Rite 色度计进行校准,可以将已经很低的灰度和色彩 deltaE 平均值分别从 2.7 和 2.53 提高到 1.9 和 1.26。您可以在上面免费下载我们校准过的 ICM 配置文件。


Display Response Times
| ↔ Response Time Black to White | ||
|---|---|---|
| 26 ms ... rise ↗ and fall ↘ combined | ↗ 11.7 ms rise | 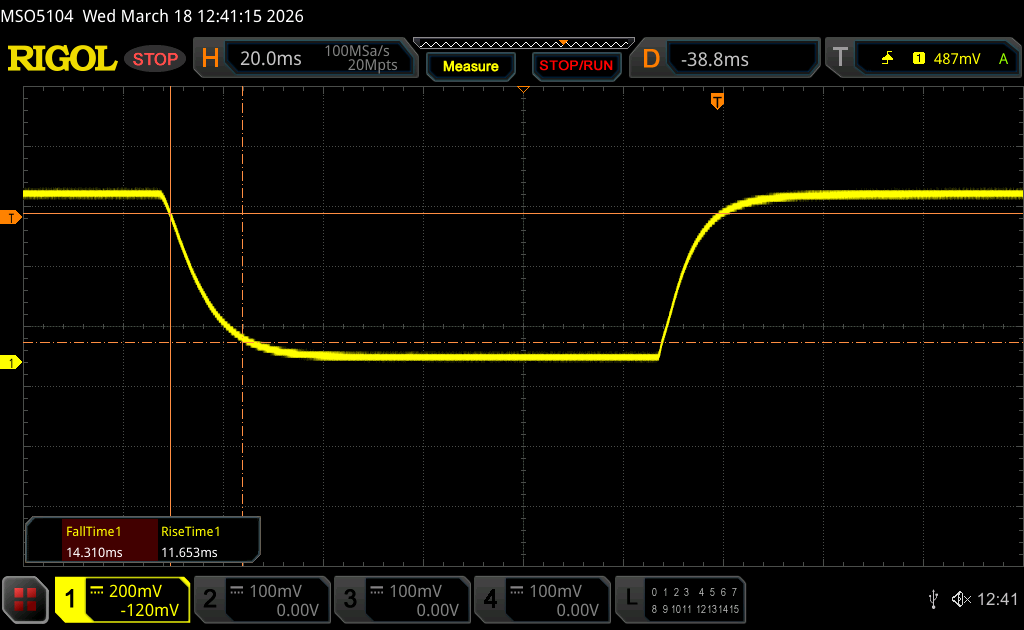 |
| ↘ 14.3 ms fall | ||
| The screen shows relatively slow response rates in our tests and may be too slow for gamers. In comparison, all tested devices range from 0.1 (minimum) to 240 (maximum) ms. » 62 % of all devices are better. This means that the measured response time is worse than the average of all tested devices (19.9 ms). | ||
| ↔ Response Time 50% Grey to 80% Grey | ||
| 39.3 ms ... rise ↗ and fall ↘ combined | ↗ 18.1 ms rise | 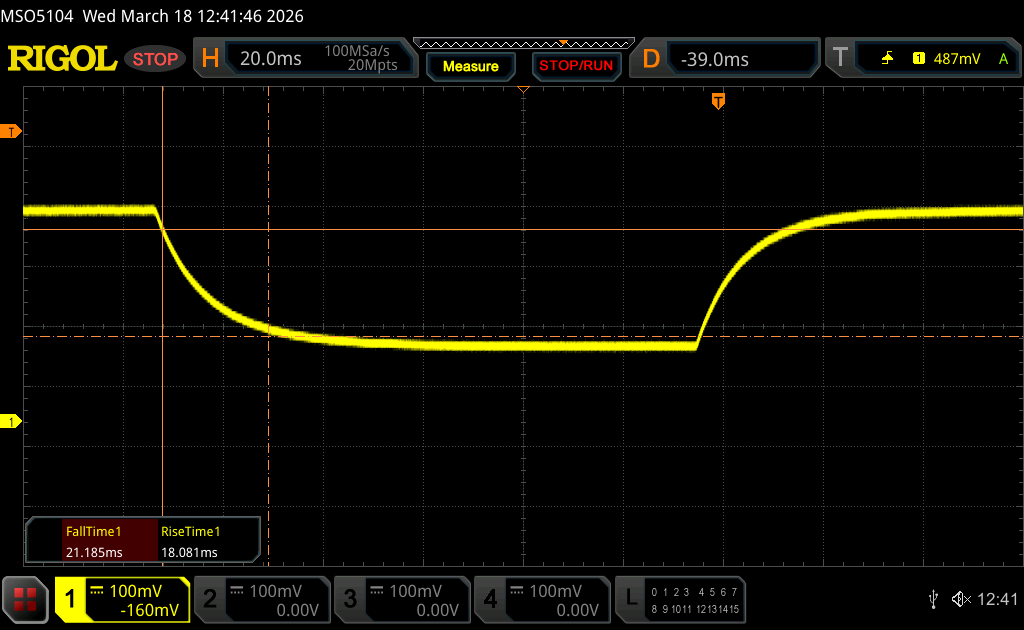 |
| ↘ 21.2 ms fall | ||
| The screen shows slow response rates in our tests and will be unsatisfactory for gamers. In comparison, all tested devices range from 0.165 (minimum) to 636 (maximum) ms. » 60 % of all devices are better. This means that the measured response time is worse than the average of all tested devices (31.1 ms). | ||
Screen Flickering / PWM (Pulse-Width Modulation)
| Screen flickering / PWM not detected | 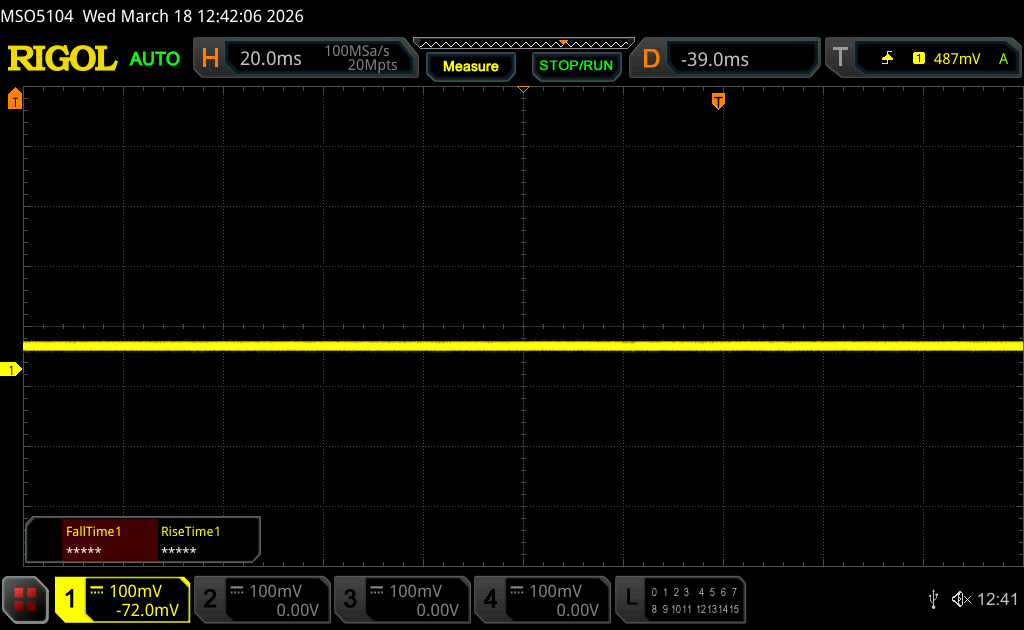 | ||
In comparison: 52 % of all tested devices do not use PWM to dim the display. If PWM was detected, an average of 7810 (minimum: 5 - maximum: 343500) Hz was measured. | |||
由于采用了相对明亮的 500 尼特背光和哑光覆盖层,因此在阴凉处的室外可视性还不错。否则,如果在阳光直射下,色彩会变得过于暗淡。


表演 - 把赌注全押在黑豹湖上
测试条件
在运行以下基准测试之前,我们将 Windows 和戴尔优化大师设置为性能模式。
处理器
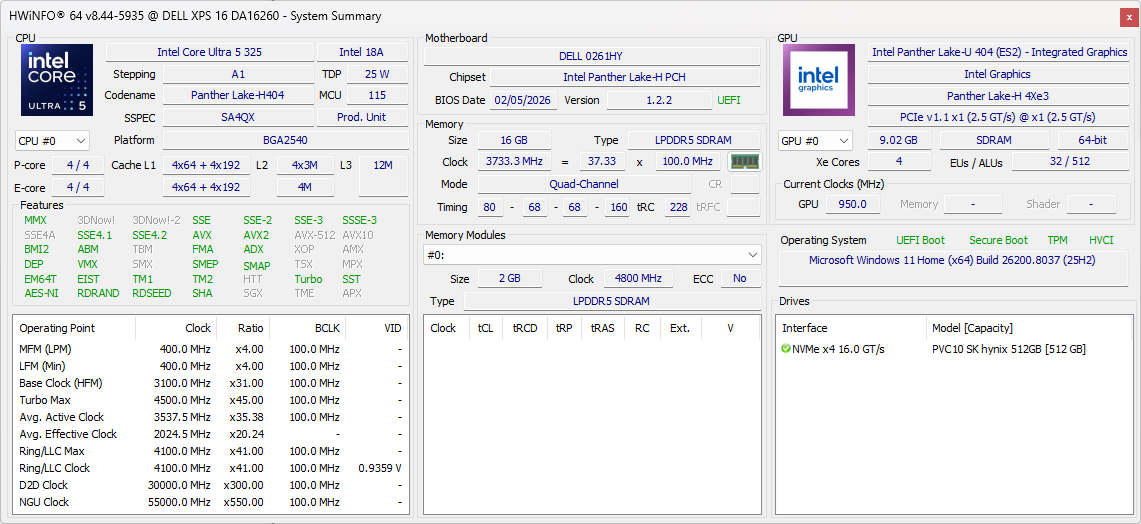
底座 酷睿至尊5 325对于 H 系列 CPU 而言,速度有点慢,因为它只比 ULV 酷睿至尊 7 258V快 10%。事实上,从酷睿 Ultra 5 325 升级到 酷睿至尊 7 355配置预计只能提高约 5%的性能,因为它们的核心数量和高速缓存大小完全相同。用户必须升级到更高端的 酷睿至尊 7 358H才能将处理器的原始性能大幅提升 70%。
Cinebench R15 多回路运行
Cinebench R23: Multi Core | Single Core
Cinebench R20: CPU (Multi Core) | CPU (Single Core)
Cinebench R15: CPU Multi 64Bit | CPU Single 64Bit
Blender: v2.79 BMW27 CPU
7-Zip 18.03: 7z b 4 | 7z b 4 -mmt1
Geekbench 6.6: Multi-Core | Single-Core
Geekbench 5.5: Multi-Core | Single-Core
HWBOT x265 Benchmark v2.2: 4k Preset
LibreOffice : 20 Documents To PDF
R Benchmark 2.5: Overall mean
* ... smaller is better
AIDA64: FP32 Ray-Trace | FPU Julia | CPU SHA3 | CPU Queen | FPU SinJulia | FPU Mandel | CPU AES | CPU ZLib | FP64 Ray-Trace | CPU PhotoWorxx | CPU CheckMate
| Performance rating | |
| Asus ZenBook S16 UM5606GA -1! | |
| Lenovo Yoga Pro 9 16IAH10 RTX 5050 -1! | |
| Samsung Galaxy Book6 Ultra -1! | |
| Dell XPS 16 9640 -1! | |
| MSI Prestige 16 AI Evo B2HMG -1! | |
| Dell XPS 16 Core Ultra 5 325 -1! | |
| Average Intel Core Ultra 5 325 -1! | |
| AIDA64 / FP32 Ray-Trace | |
| Asus ZenBook S16 UM5606GA (v6.92.6600) | |
| Lenovo Yoga Pro 9 16IAH10 RTX 5050 (v6.92.6600) | |
| Samsung Galaxy Book6 Ultra (v8.20.8100) | |
| MSI Prestige 16 AI Evo B2HMG (v6.92.6600) | |
| Dell XPS 16 9640 (v6.92.6600) | |
| Dell XPS 16 Core Ultra 5 325 (v8.20.8100) | |
| Average Intel Core Ultra 5 325 (11016 - 11977, n=2) | |
| AIDA64 / FPU Julia | |
| Lenovo Yoga Pro 9 16IAH10 RTX 5050 (v6.92.6600) | |
| Samsung Galaxy Book6 Ultra (v8.20.8100) | |
| Asus ZenBook S16 UM5606GA (v6.92.6600) | |
| MSI Prestige 16 AI Evo B2HMG (v6.92.6600) | |
| Dell XPS 16 9640 (v6.92.6600) | |
| Dell XPS 16 Core Ultra 5 325 (v8.20.8100) | |
| Average Intel Core Ultra 5 325 (57164 - 62102, n=2) | |
| AIDA64 / CPU SHA3 | |
| Samsung Galaxy Book6 Ultra (v8.20.8100) | |
| Lenovo Yoga Pro 9 16IAH10 RTX 5050 (v6.92.6600) | |
| Asus ZenBook S16 UM5606GA (v6.92.6600) | |
| MSI Prestige 16 AI Evo B2HMG (v6.92.6600) | |
| Dell XPS 16 9640 (v6.92.6600) | |
| Dell XPS 16 Core Ultra 5 325 (v8.20.8100) | |
| Average Intel Core Ultra 5 325 (2508 - 2718, n=2) | |
| AIDA64 / CPU Queen | |
| Asus ZenBook S16 UM5606GA (v6.92.6600) | |
| Dell XPS 16 9640 (v6.92.6600) | |
| MSI Prestige 16 AI Evo B2HMG (v6.92.6600) | |
| Lenovo Yoga Pro 9 16IAH10 RTX 5050 (v6.92.6600) | |
| AIDA64 / FPU SinJulia | |
| Asus ZenBook S16 UM5606GA (v6.92.6600) | |
| Dell XPS 16 9640 (v6.92.6600) | |
| Lenovo Yoga Pro 9 16IAH10 RTX 5050 (v6.92.6600) | |
| MSI Prestige 16 AI Evo B2HMG (v6.92.6600) | |
| Samsung Galaxy Book6 Ultra (v8.20.8100) | |
| Dell XPS 16 Core Ultra 5 325 (v8.20.8100) | |
| Average Intel Core Ultra 5 325 (4409 - 4414, n=2) | |
| AIDA64 / FPU Mandel | |
| Lenovo Yoga Pro 9 16IAH10 RTX 5050 (v6.92.6600) | |
| Samsung Galaxy Book6 Ultra (v8.20.8100) | |
| Asus ZenBook S16 UM5606GA (v6.92.6600) | |
| MSI Prestige 16 AI Evo B2HMG (v6.92.6600) | |
| Dell XPS 16 9640 (v6.92.6600) | |
| Dell XPS 16 Core Ultra 5 325 (v8.20.8100) | |
| Average Intel Core Ultra 5 325 (30237 - 33224, n=2) | |
| AIDA64 / CPU AES | |
| Asus ZenBook S16 UM5606GA (v6.92.6600) | |
| Dell XPS 16 9640 (v6.92.6600) | |
| Lenovo Yoga Pro 9 16IAH10 RTX 5050 (v6.92.6600) | |
| MSI Prestige 16 AI Evo B2HMG (v6.92.6600) | |
| Samsung Galaxy Book6 Ultra (v8.20.8100) | |
| Dell XPS 16 Core Ultra 5 325 (v8.20.8100) | |
| Average Intel Core Ultra 5 325 (37348 - 37641, n=2) | |
| AIDA64 / CPU ZLib | |
| Lenovo Yoga Pro 9 16IAH10 RTX 5050 (v6.92.6600) | |
| Dell XPS 16 9640 (v6.92.6600) | |
| Samsung Galaxy Book6 Ultra (v8.20.8100) | |
| Asus ZenBook S16 UM5606GA (v6.92.6600) | |
| MSI Prestige 16 AI Evo B2HMG (v6.92.6600) | |
| Dell XPS 16 Core Ultra 5 325 (v8.20.8100) | |
| Average Intel Core Ultra 5 325 (596 - 627, n=2) | |
| AIDA64 / FP64 Ray-Trace | |
| Asus ZenBook S16 UM5606GA (v6.92.6600) | |
| Lenovo Yoga Pro 9 16IAH10 RTX 5050 (v6.92.6600) | |
| Samsung Galaxy Book6 Ultra (v8.20.8100) | |
| MSI Prestige 16 AI Evo B2HMG (v6.92.6600) | |
| Dell XPS 16 9640 (v6.92.6600) | |
| Dell XPS 16 Core Ultra 5 325 (v8.20.8100) | |
| Average Intel Core Ultra 5 325 (5761 - 6324, n=2) | |
| AIDA64 / CPU PhotoWorxx | |
| Samsung Galaxy Book6 Ultra (v8.20.8100) | |
| Lenovo Yoga Pro 9 16IAH10 RTX 5050 (v6.92.6600) | |
| MSI Prestige 16 AI Evo B2HMG (v6.92.6600) | |
| Dell XPS 16 Core Ultra 5 325 (v8.20.8100) | |
| Average Intel Core Ultra 5 325 (53916 - 58393, n=2) | |
| Asus ZenBook S16 UM5606GA (v6.92.6600) | |
| Dell XPS 16 9640 (v6.92.6600) | |
| AIDA64 / CPU CheckMate | |
| Samsung Galaxy Book6 Ultra (v8.20.8100) | |
| Dell XPS 16 Core Ultra 5 325 (v8.20.8100) | |
| Average Intel Core Ultra 5 325 (2643 - 2730, n=2) | |
系统性能
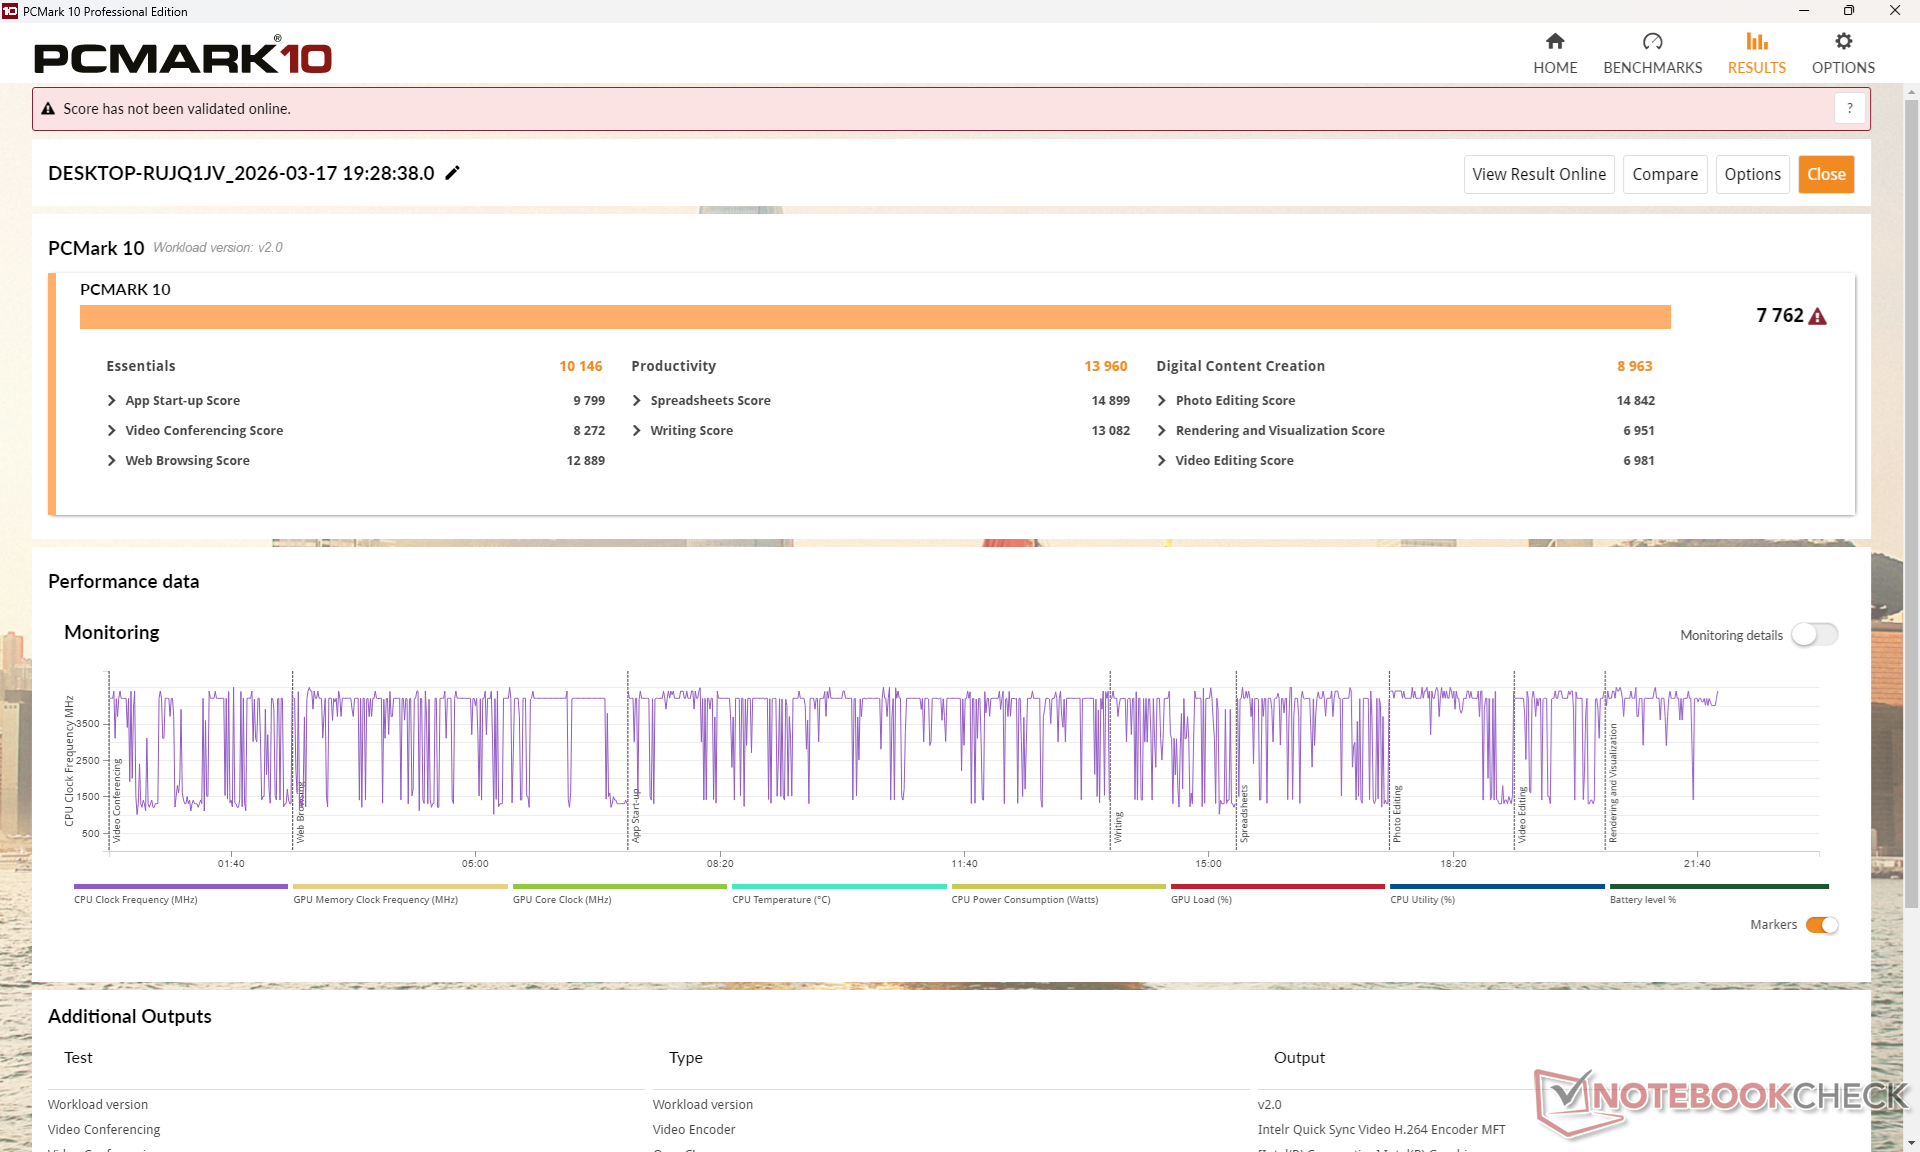
PCMark 10: Score | Essentials | Productivity | Digital Content Creation
CrossMark: Overall | Productivity | Creativity | Responsiveness
WebXPRT 3: Overall
WebXPRT 4: Overall
Mozilla Kraken 1.1: Total
Geekbench AI: Single Precision GPU 1.7 | Half Precision GPU 1.7 | Quantized GPU 1.7
| Performance rating | |
| Lenovo Yoga Pro 9 16IAH10 RTX 5050 | |
| Samsung Galaxy Book6 Ultra | |
| MSI Prestige 16 AI Evo B2HMG -3! | |
| Dell XPS 16 9640 -4! | |
| Asus ZenBook S16 UM5606GA -3! | |
| Average Intel Core Ultra 5 325, Intel Graphics 4 Xe3 Panther Lake iGPU | |
| Dell XPS 16 Core Ultra 5 325 | |
| PCMark 10 / Score | |
| Lenovo Yoga Pro 9 16IAH10 RTX 5050 | |
| Samsung Galaxy Book6 Ultra | |
| Asus ZenBook S16 UM5606GA | |
| MSI Prestige 16 AI Evo B2HMG | |
| Dell XPS 16 Core Ultra 5 325 | |
| Average Intel Core Ultra 5 325, Intel Graphics 4 Xe3 Panther Lake iGPU (7532 - 7762, n=2) | |
| Dell XPS 16 9640 | |
| PCMark 10 / Essentials | |
| MSI Prestige 16 AI Evo B2HMG | |
| Lenovo Yoga Pro 9 16IAH10 RTX 5050 | |
| Asus ZenBook S16 UM5606GA | |
| Dell XPS 16 9640 | |
| Average Intel Core Ultra 5 325, Intel Graphics 4 Xe3 Panther Lake iGPU (10146 - 10402, n=2) | |
| Dell XPS 16 Core Ultra 5 325 | |
| Samsung Galaxy Book6 Ultra | |
| PCMark 10 / Productivity | |
| Samsung Galaxy Book6 Ultra | |
| Lenovo Yoga Pro 9 16IAH10 RTX 5050 | |
| Asus ZenBook S16 UM5606GA | |
| Dell XPS 16 Core Ultra 5 325 | |
| Average Intel Core Ultra 5 325, Intel Graphics 4 Xe3 Panther Lake iGPU (12413 - 13960, n=2) | |
| MSI Prestige 16 AI Evo B2HMG | |
| Dell XPS 16 9640 | |
| PCMark 10 / Digital Content Creation | |
| Lenovo Yoga Pro 9 16IAH10 RTX 5050 | |
| Samsung Galaxy Book6 Ultra | |
| MSI Prestige 16 AI Evo B2HMG | |
| Dell XPS 16 9640 | |
| Asus ZenBook S16 UM5606GA | |
| Average Intel Core Ultra 5 325, Intel Graphics 4 Xe3 Panther Lake iGPU (8963 - 8979, n=2) | |
| Dell XPS 16 Core Ultra 5 325 | |
| CrossMark / Overall | |
| MSI Prestige 16 AI Evo B2HMG | |
| Lenovo Yoga Pro 9 16IAH10 RTX 5050 | |
| Samsung Galaxy Book6 Ultra | |
| Dell XPS 16 9640 | |
| Average Intel Core Ultra 5 325, Intel Graphics 4 Xe3 Panther Lake iGPU (1666 - 1772, n=2) | |
| Dell XPS 16 Core Ultra 5 325 | |
| Asus ZenBook S16 UM5606GA | |
| CrossMark / Productivity | |
| MSI Prestige 16 AI Evo B2HMG | |
| Lenovo Yoga Pro 9 16IAH10 RTX 5050 | |
| Dell XPS 16 9640 | |
| Samsung Galaxy Book6 Ultra | |
| Average Intel Core Ultra 5 325, Intel Graphics 4 Xe3 Panther Lake iGPU (1581 - 1715, n=2) | |
| Asus ZenBook S16 UM5606GA | |
| Dell XPS 16 Core Ultra 5 325 | |
| CrossMark / Creativity | |
| MSI Prestige 16 AI Evo B2HMG | |
| Lenovo Yoga Pro 9 16IAH10 RTX 5050 | |
| Samsung Galaxy Book6 Ultra | |
| Dell XPS 16 9640 | |
| Asus ZenBook S16 UM5606GA | |
| Average Intel Core Ultra 5 325, Intel Graphics 4 Xe3 Panther Lake iGPU (1889 - 1917, n=2) | |
| Dell XPS 16 Core Ultra 5 325 | |
| CrossMark / Responsiveness | |
| MSI Prestige 16 AI Evo B2HMG | |
| Dell XPS 16 9640 | |
| Samsung Galaxy Book6 Ultra | |
| Lenovo Yoga Pro 9 16IAH10 RTX 5050 | |
| Average Intel Core Ultra 5 325, Intel Graphics 4 Xe3 Panther Lake iGPU (1338 - 1544, n=2) | |
| Asus ZenBook S16 UM5606GA | |
| Dell XPS 16 Core Ultra 5 325 | |
| WebXPRT 3 / Overall | |
| MSI Prestige 16 AI Evo B2HMG | |
| Lenovo Yoga Pro 9 16IAH10 RTX 5050 | |
| Samsung Galaxy Book6 Ultra | |
| Asus ZenBook S16 UM5606GA | |
| Average Intel Core Ultra 5 325, Intel Graphics 4 Xe3 Panther Lake iGPU (282 - 308, n=2) | |
| Dell XPS 16 9640 | |
| Dell XPS 16 Core Ultra 5 325 | |
| WebXPRT 4 / Overall | |
| MSI Prestige 16 AI Evo B2HMG | |
| Lenovo Yoga Pro 9 16IAH10 RTX 5050 | |
| Samsung Galaxy Book6 Ultra | |
| Average Intel Core Ultra 5 325, Intel Graphics 4 Xe3 Panther Lake iGPU (267 - 276, n=2) | |
| Dell XPS 16 Core Ultra 5 325 | |
| Dell XPS 16 9640 | |
| Asus ZenBook S16 UM5606GA | |
| Mozilla Kraken 1.1 / Total | |
| Dell XPS 16 Core Ultra 5 325 | |
| Average Intel Core Ultra 5 325, Intel Graphics 4 Xe3 Panther Lake iGPU (492 - 497, n=2) | |
| Asus ZenBook S16 UM5606GA | |
| Samsung Galaxy Book6 Ultra | |
| Lenovo Yoga Pro 9 16IAH10 RTX 5050 | |
| MSI Prestige 16 AI Evo B2HMG | |
| Geekbench AI / Single Precision GPU 1.7 | |
| Samsung Galaxy Book6 Ultra | |
| Lenovo Yoga Pro 9 16IAH10 RTX 5050 | |
| Dell XPS 16 Core Ultra 5 325 | |
| Average Intel Core Ultra 5 325, Intel Graphics 4 Xe3 Panther Lake iGPU (n=1) | |
| Geekbench AI / Half Precision GPU 1.7 | |
| Lenovo Yoga Pro 9 16IAH10 RTX 5050 | |
| Samsung Galaxy Book6 Ultra | |
| Dell XPS 16 Core Ultra 5 325 | |
| Average Intel Core Ultra 5 325, Intel Graphics 4 Xe3 Panther Lake iGPU (n=1) | |
| Geekbench AI / Quantized GPU 1.7 | |
| Samsung Galaxy Book6 Ultra | |
| Lenovo Yoga Pro 9 16IAH10 RTX 5050 | |
| Dell XPS 16 Core Ultra 5 325 | |
| Average Intel Core Ultra 5 325, Intel Graphics 4 Xe3 Panther Lake iGPU (n=1) | |
* ... smaller is better
| PCMark 10 Score | 7762 points | |
Help | ||
| AIDA64 / Memory Copy | |
| Samsung Galaxy Book6 Ultra | |
| Dell XPS 16 Core Ultra 5 325 | |
| Lenovo Yoga Pro 9 16IAH10 RTX 5050 | |
| MSI Prestige 16 AI Evo B2HMG | |
| Asus ZenBook S16 UM5606GA | |
| Average Intel Core Ultra 5 325 (89482 - 100226, n=2) | |
| Dell XPS 16 9640 | |
| AIDA64 / Memory Read | |
| Samsung Galaxy Book6 Ultra | |
| Asus ZenBook S16 UM5606GA | |
| Lenovo Yoga Pro 9 16IAH10 RTX 5050 | |
| Dell XPS 16 Core Ultra 5 325 | |
| Dell XPS 16 9640 | |
| Average Intel Core Ultra 5 325 (74747 - 86178, n=2) | |
| MSI Prestige 16 AI Evo B2HMG | |
| AIDA64 / Memory Write | |
| Samsung Galaxy Book6 Ultra | |
| Asus ZenBook S16 UM5606GA | |
| Dell XPS 16 Core Ultra 5 325 | |
| Lenovo Yoga Pro 9 16IAH10 RTX 5050 | |
| Average Intel Core Ultra 5 325 (92966 - 107858, n=2) | |
| Dell XPS 16 9640 | |
| MSI Prestige 16 AI Evo B2HMG | |
| AIDA64 / Memory Latency | |
| Dell XPS 16 9640 | |
| MSI Prestige 16 AI Evo B2HMG | |
| Lenovo Yoga Pro 9 16IAH10 RTX 5050 | |
| Average Intel Core Ultra 5 325 (102 - 108.4, n=2) | |
| Asus ZenBook S16 UM5606GA | |
| Dell XPS 16 Core Ultra 5 325 | |
| Samsung Galaxy Book6 Ultra | |
* ... smaller is better
DPC 延迟
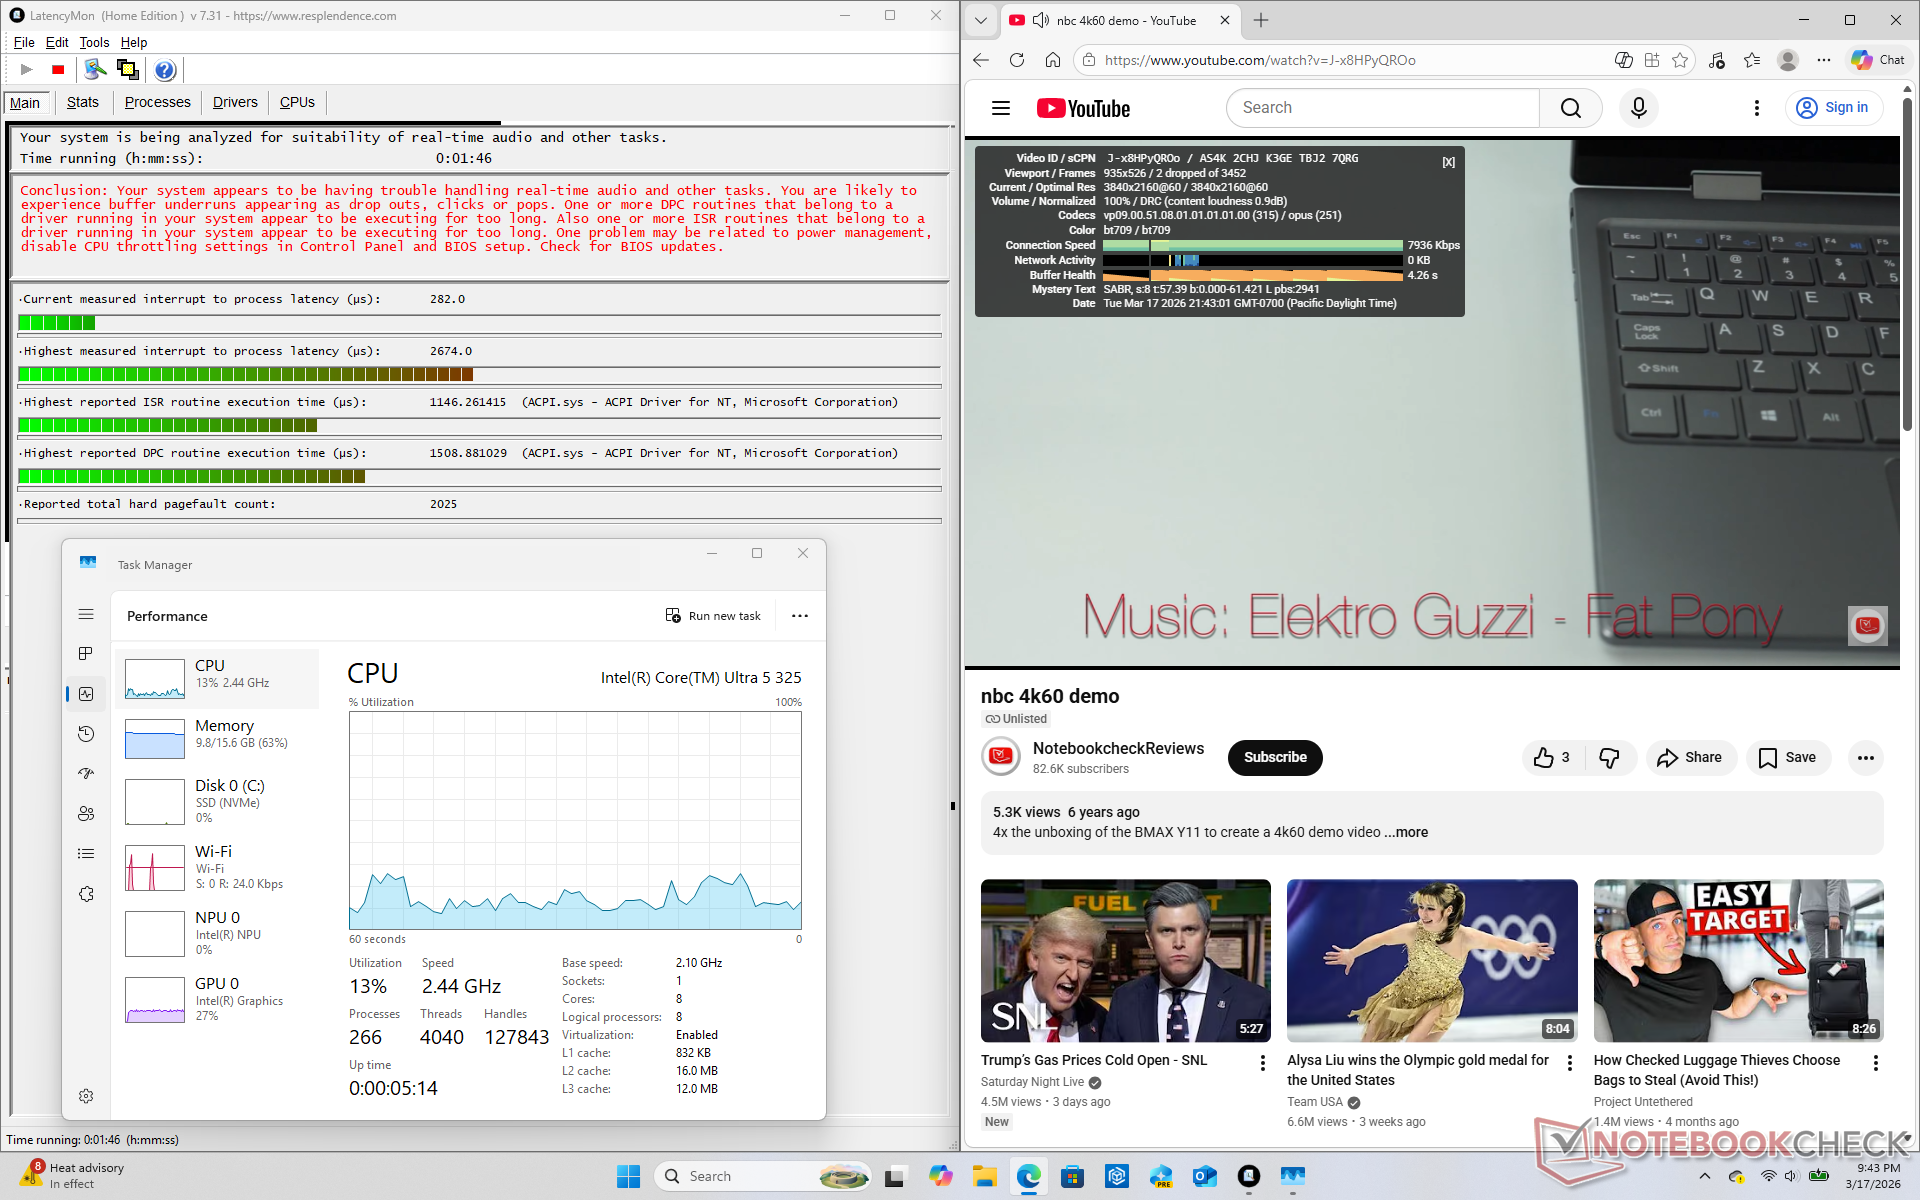
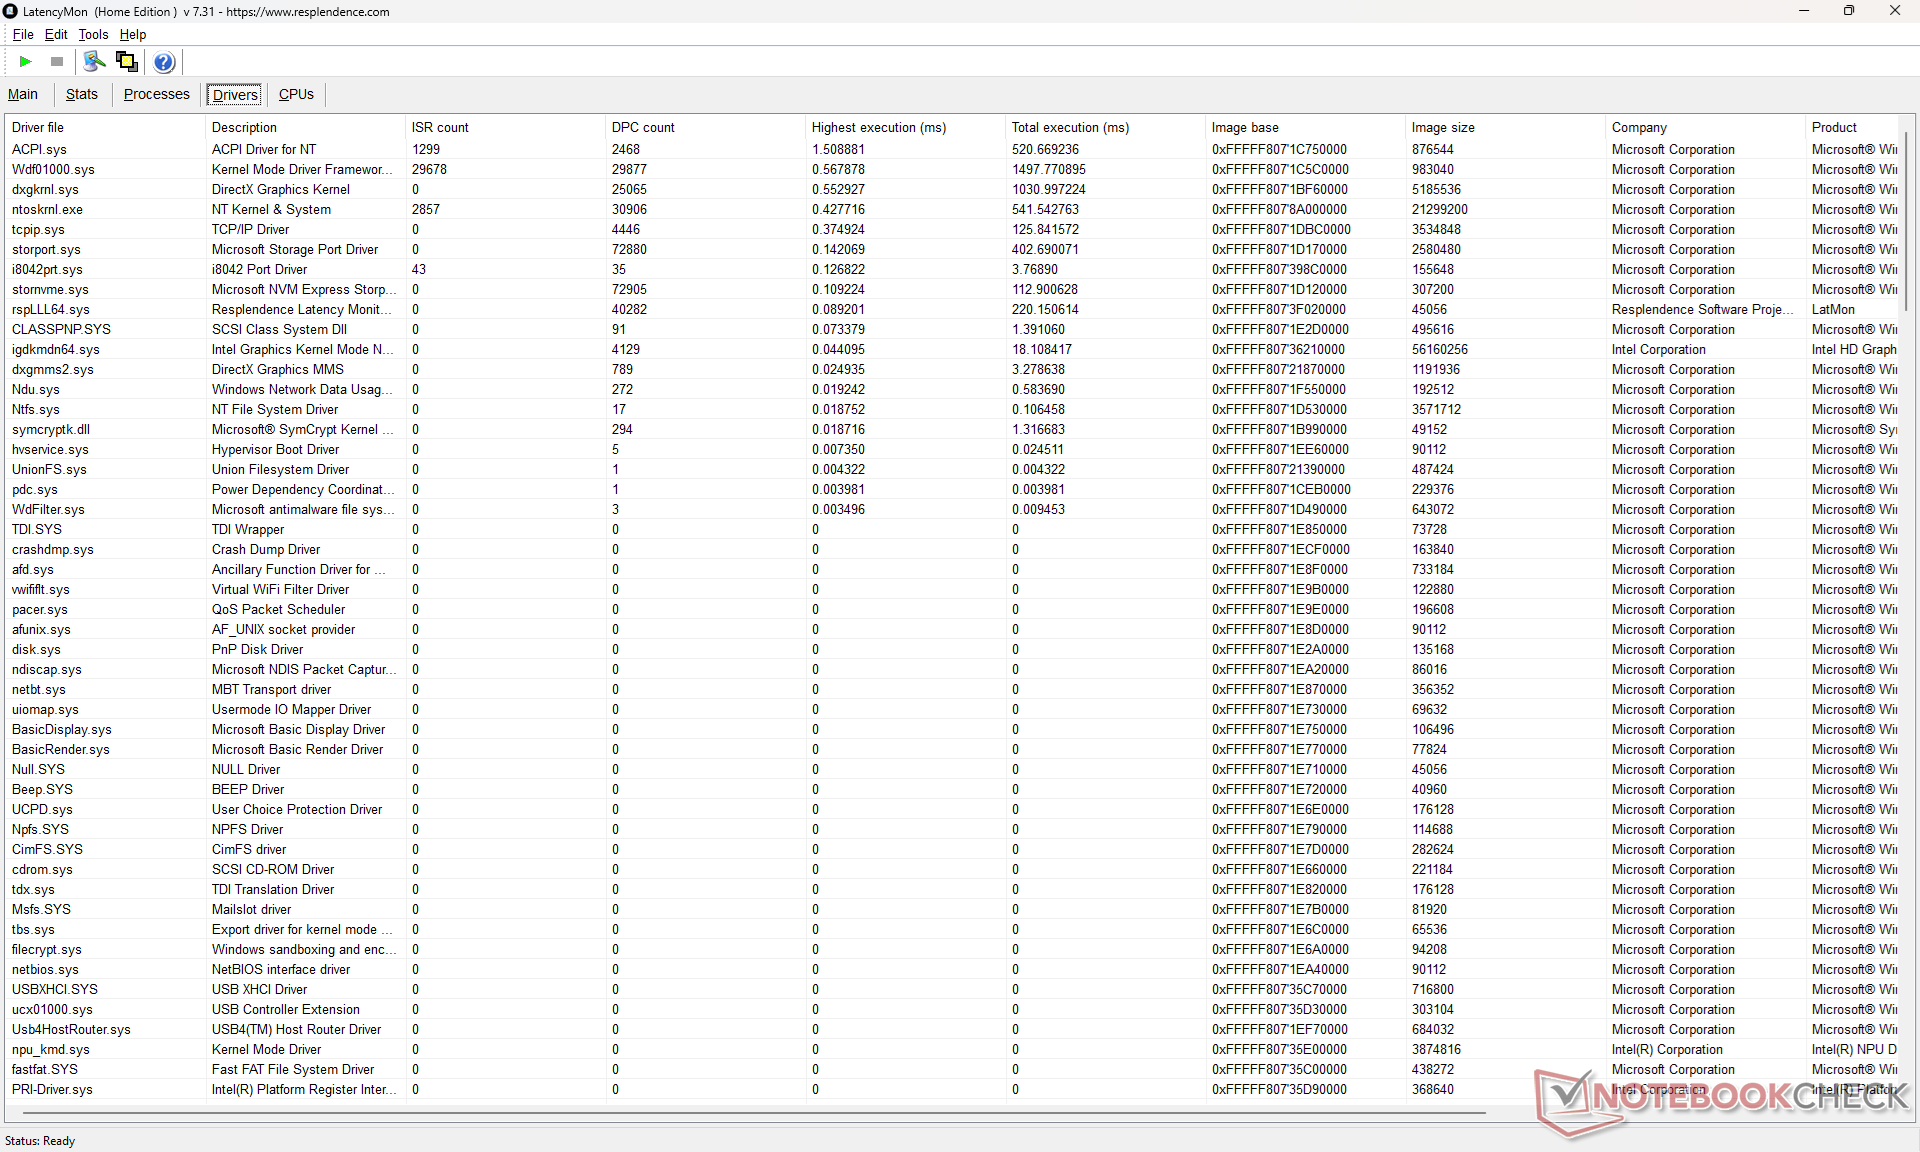
| DPC Latencies / LatencyMon - interrupt to process latency (max), Web, Youtube, Prime95 | |
| Lenovo Yoga Pro 9 16IAH10 RTX 5050 | |
| Dell XPS 16 Core Ultra 5 325 | |
| MSI Prestige 16 AI Evo B2HMG | |
| Dell XPS 16 9640 | |
| Samsung Galaxy Book6 Ultra | |
| Asus ZenBook S16 UM5606GA | |
* ... smaller is better
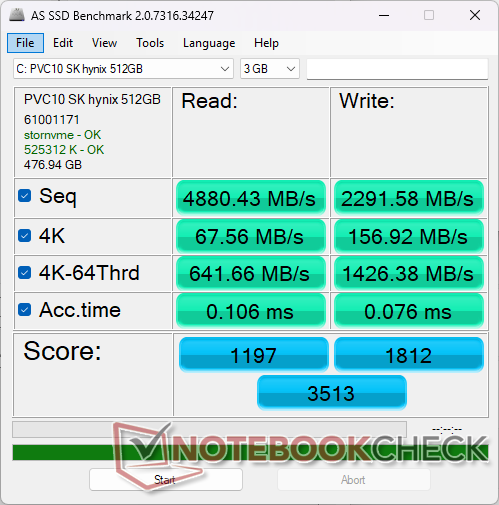
存储设备
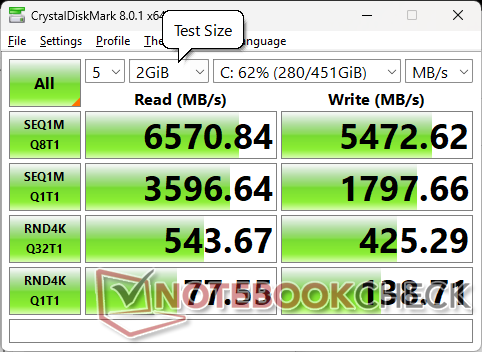
产品 SK Hynix PVC10PCIe4 x4 NVMe 固态硬盘的传输速率最高可达 6600 MB/s,不会出现任何节流问题,如下图 DiskSpd 循环测试结果所示。请注意,XPS 16 的高端配置可选配 PCIe5 SSD。


| Drive Performance rating - Percent | |
| MSI Prestige 16 AI Evo B2HMG | |
| Dell XPS 16 9640 | |
| Lenovo Yoga Pro 9 16IAH10 RTX 5050 | |
| Asus ZenBook S16 UM5606GA | |
| Samsung Galaxy Book6 Ultra | |
| Dell XPS 16 Core Ultra 5 325 | |
* ... smaller is better
磁盘节流DiskSpd 读取循环,队列深度 8
图形处理器性能
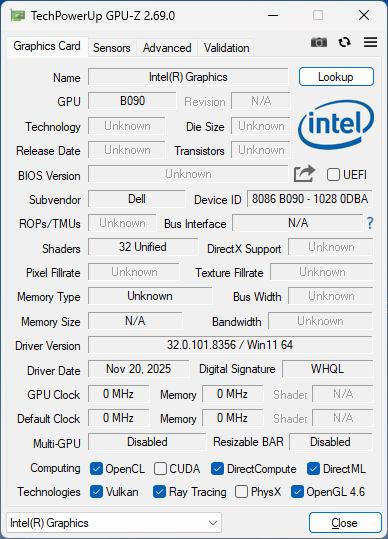
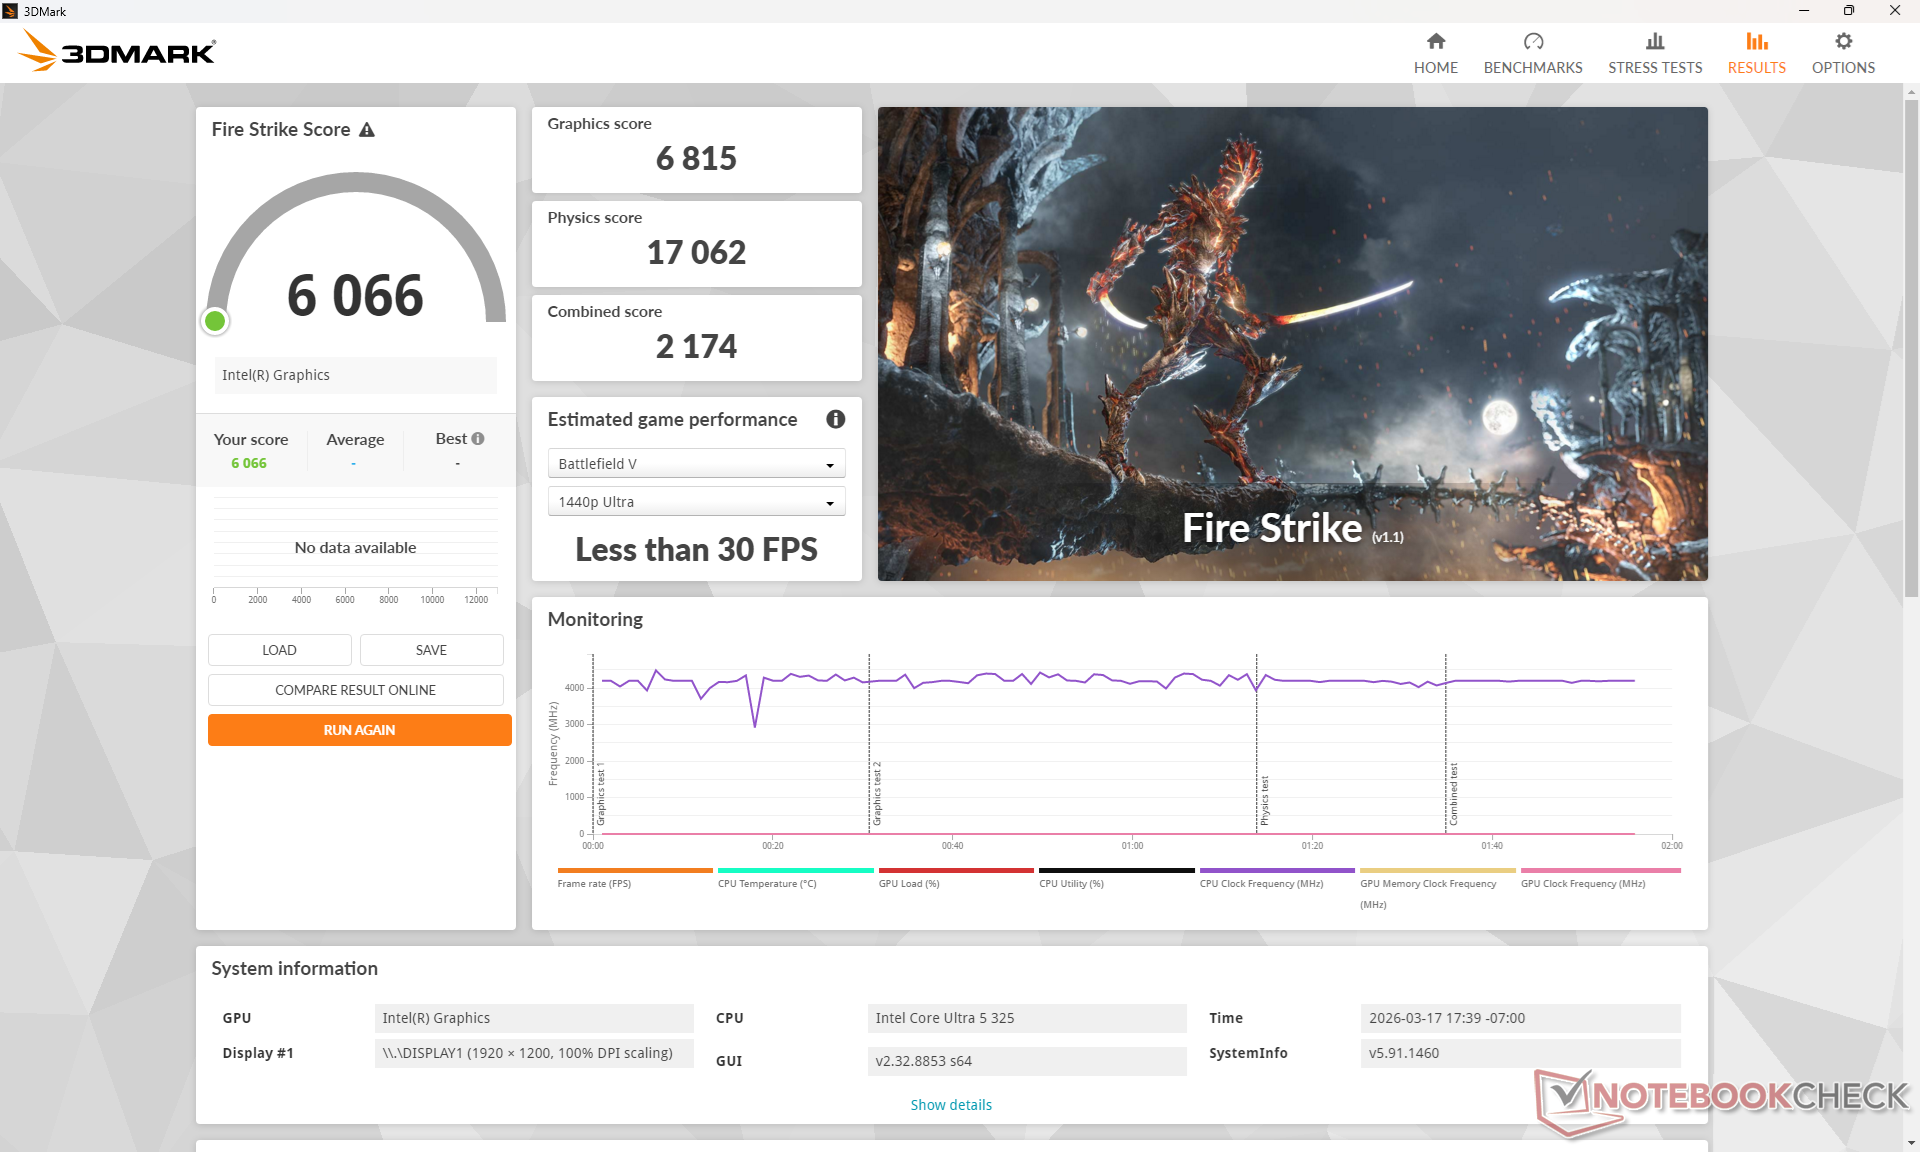
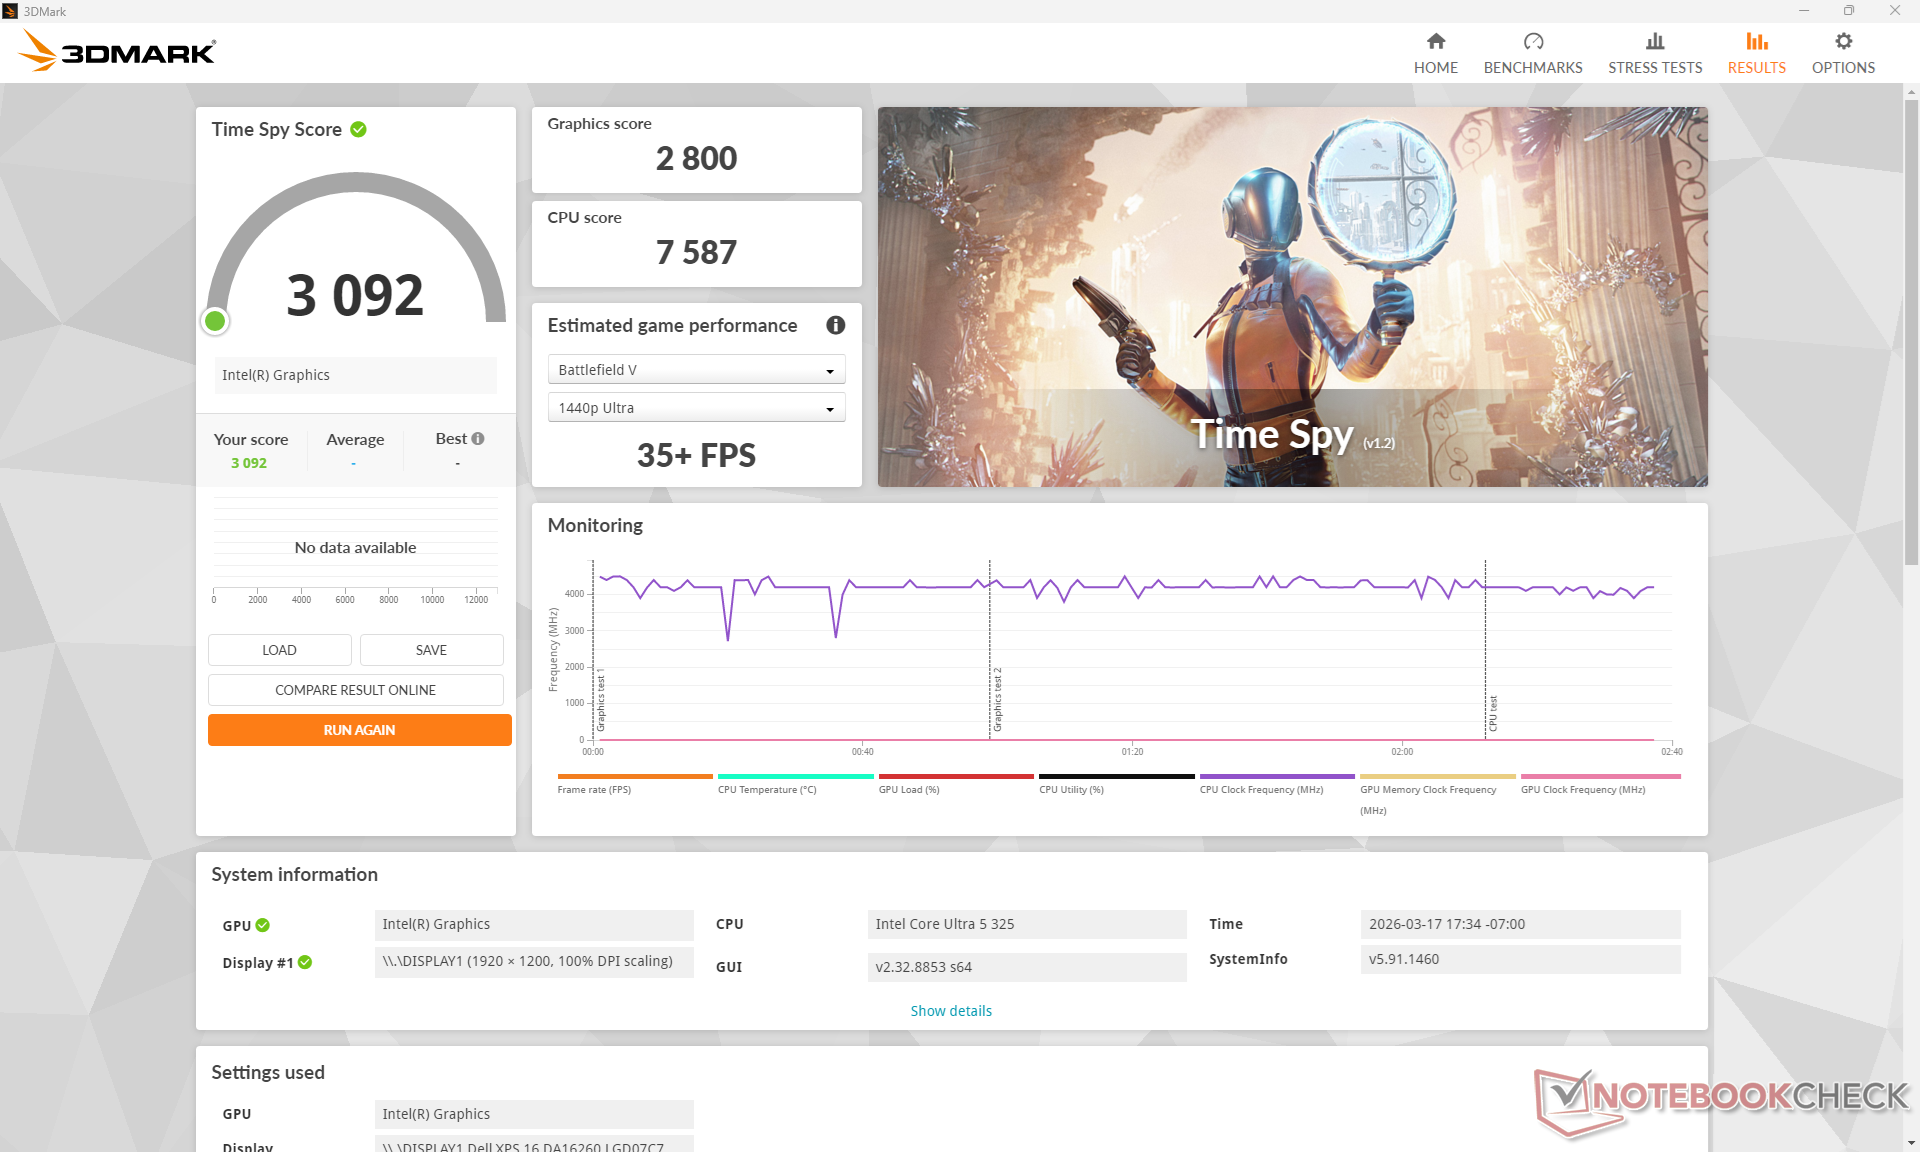
豹湖 豹湖 Xe3 4是 Panther Lake 系列中速度最慢的集成解决方案之一。性能水平与两代老产品 弧 8 或 AMD Radeon 680M.由于 CPU 使用相同的 Xe3 4 iGPU,升级到酷睿至尊 7 355 配置并不能显著提高图形性能。相反,用户必须升级到集成了 Arc B390 的酷睿至尊 7 358H。 Arc B390图形处理器,性能将提高 2.5 倍,如下表所示。
| 电源配置文件 | 图形分数 | 物理得分 | 综合得分 |
| 性能模式 | 6815 | 17062 | 2174 |
| 均衡模式 | 6633 (-3%) | 16820 (-1%) | 2039 (-6%) |
| 电池电量 | 6480 (-5%) | 17601 (+3%) | 2140 (-2%) |
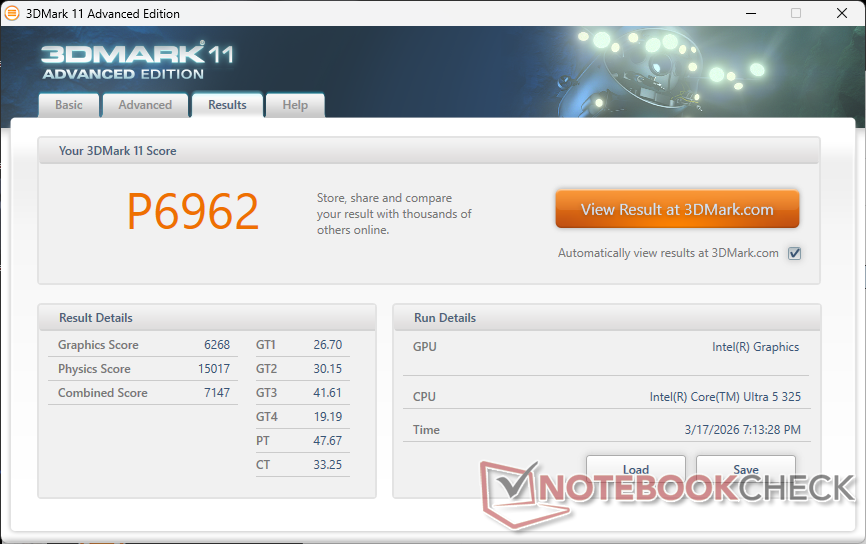
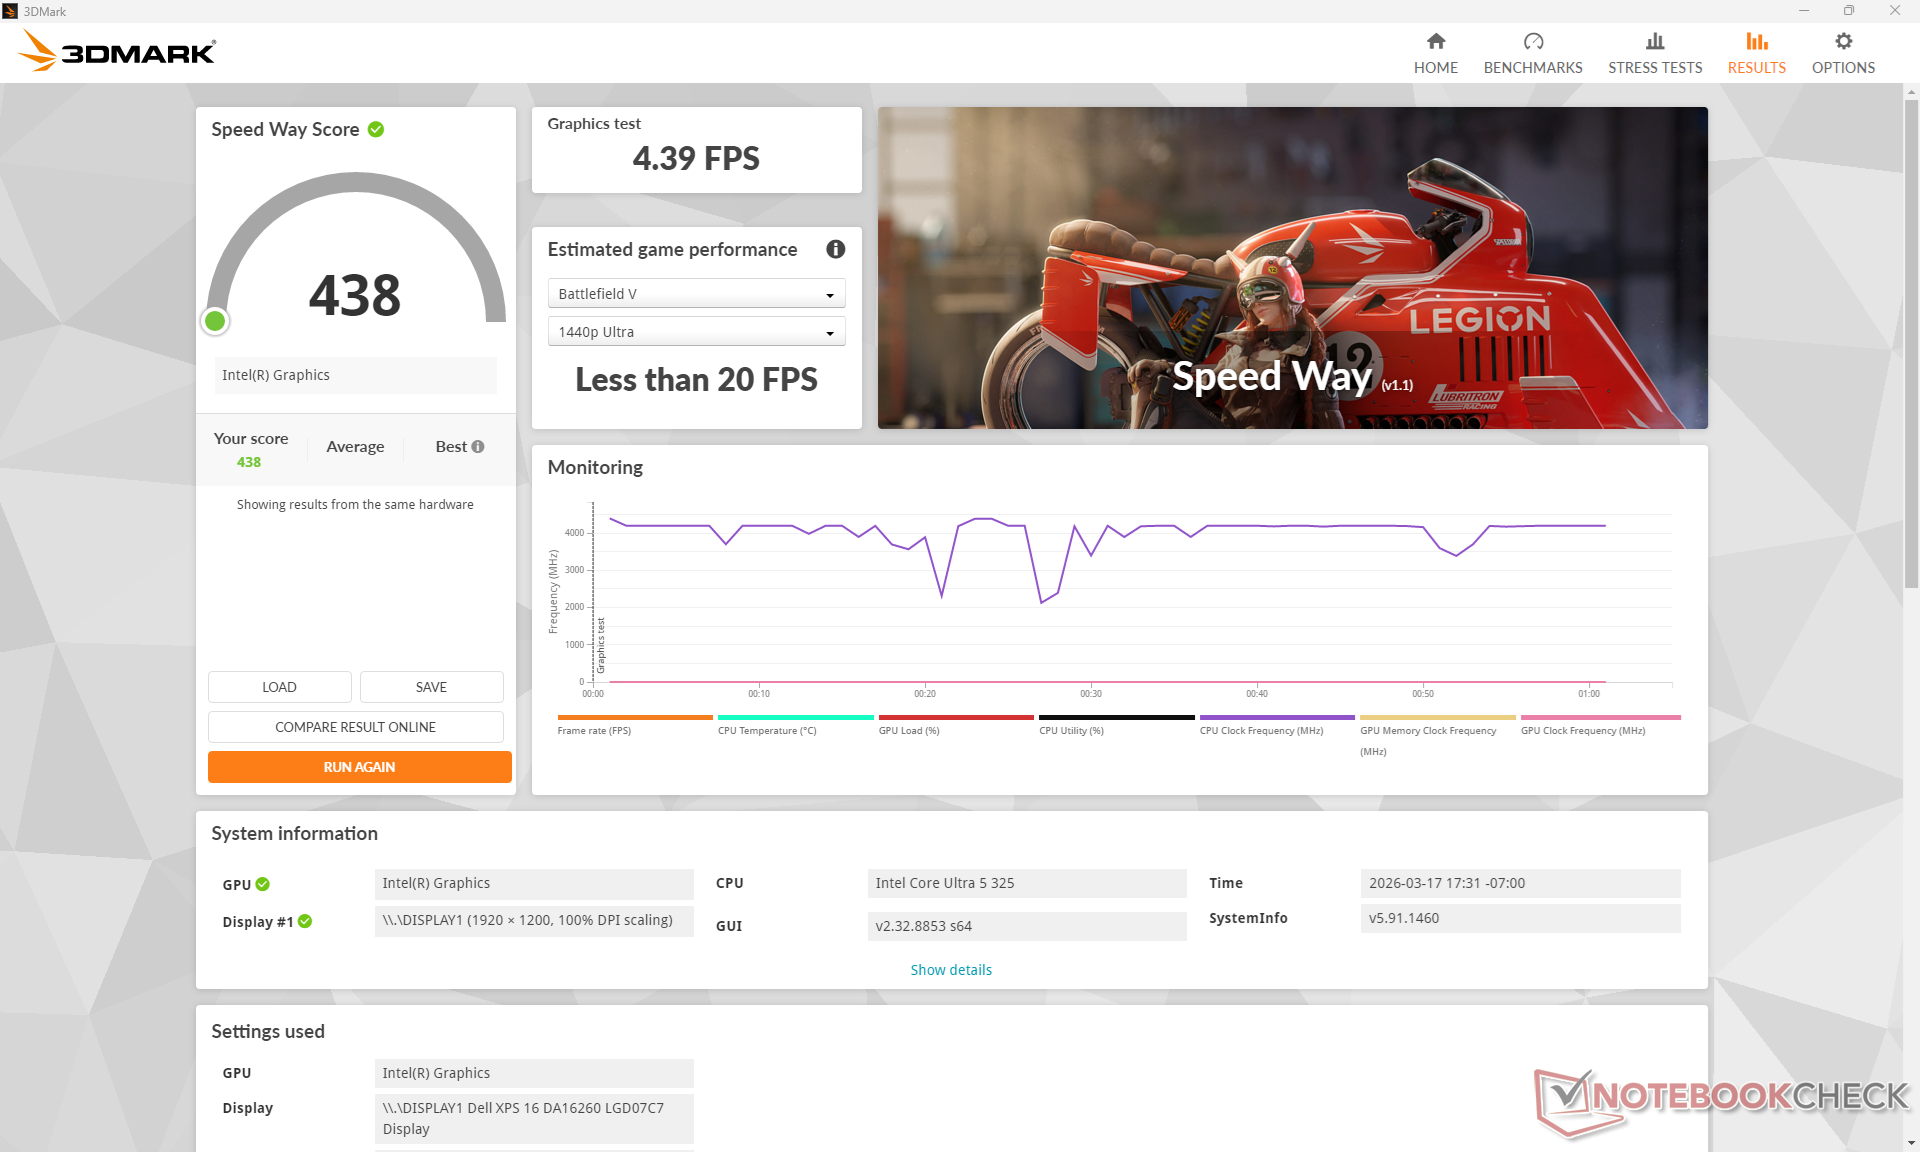
| 3DMark 11 Performance | 6962 points | |
| 3DMark Cloud Gate Standard Score | 26419 points | |
| 3DMark Fire Strike Score | 6066 points | |
| 3DMark Time Spy Score | 3092 points | |
Help | ||
* ... smaller is better
| Performance rating - Percent | |
| Samsung Galaxy Book6 Ultra | |
| Lenovo Yoga Pro 9 16IAH10 RTX 5050 | |
| Dell XPS 16 9640 | |
| Asus ZenBook S16 UM5606GA | |
| MSI Prestige 16 AI Evo B2HMG | |
| Dell XPS 16 Core Ultra 5 325 | |
| Cyberpunk 2077 - 1920x1080 Ultra Preset (FSR off) | |
| Samsung Galaxy Book6 Ultra | |
| Lenovo Yoga Pro 9 16IAH10 RTX 5050 | |
| Dell XPS 16 9640 | |
| MSI Prestige 16 AI Evo B2HMG | |
| Asus ZenBook S16 UM5606GA | |
| Dell XPS 16 Core Ultra 5 325 | |
| Baldur's Gate 3 - 1920x1080 Ultra Preset AA:T | |
| Samsung Galaxy Book6 Ultra | |
| Lenovo Yoga Pro 9 16IAH10 RTX 5050 | |
| Dell XPS 16 9640 | |
| Asus ZenBook S16 UM5606GA | |
| MSI Prestige 16 AI Evo B2HMG | |
| Dell XPS 16 Core Ultra 5 325 | |
| GTA V - 1920x1080 Highest AA:4xMSAA + FX AF:16x | |
| Samsung Galaxy Book6 Ultra | |
| Lenovo Yoga Pro 9 16IAH10 RTX 5050 | |
| Dell XPS 16 9640 | |
| Asus ZenBook S16 UM5606GA | |
| Dell XPS 16 Core Ultra 5 325 | |
| MSI Prestige 16 AI Evo B2HMG | |
| Final Fantasy XV Benchmark - 1920x1080 High Quality | |
| Samsung Galaxy Book6 Ultra | |
| Lenovo Yoga Pro 9 16IAH10 RTX 5050 | |
| Dell XPS 16 9640 | |
| MSI Prestige 16 AI Evo B2HMG | |
| Asus ZenBook S16 UM5606GA | |
| Dell XPS 16 Core Ultra 5 325 | |
| Strange Brigade - 1920x1080 ultra AA:ultra AF:16 | |
| Samsung Galaxy Book6 Ultra | |
| Lenovo Yoga Pro 9 16IAH10 RTX 5050 | |
| Dell XPS 16 9640 | |
| MSI Prestige 16 AI Evo B2HMG | |
| Asus ZenBook S16 UM5606GA | |
| Dell XPS 16 Core Ultra 5 325 | |
| Dota 2 Reborn - 1920x1080 ultra (3/3) best looking | |
| Lenovo Yoga Pro 9 16IAH10 RTX 5050 | |
| Samsung Galaxy Book6 Ultra | |
| Dell XPS 16 9640 | |
| Asus ZenBook S16 UM5606GA | |
| MSI Prestige 16 AI Evo B2HMG | |
| Dell XPS 16 Core Ultra 5 325 | |
| X-Plane 11.11 - 1920x1080 high (fps_test=3) | |
| Lenovo Yoga Pro 9 16IAH10 RTX 5050 | |
| Dell XPS 16 9640 | |
| Dell XPS 16 9640 | |
| Samsung Galaxy Book6 Ultra | |
| Asus ZenBook S16 UM5606GA | |
| MSI Prestige 16 AI Evo B2HMG | |
| Dell XPS 16 Core Ultra 5 325 | |
赛博朋克 2077》超 FPS 图表
| low | med. | high | ultra | |
|---|---|---|---|---|
| GTA V (2015) | 162.4 | 158.1 | 51.8 | 20.8 |
| Dota 2 Reborn (2015) | 102.9 | 89 | 72.6 | 68.4 |
| Final Fantasy XV Benchmark (2018) | 66.3 | 35.4 | 25.1 | |
| X-Plane 11.11 (2018) | 37.8 | 30.6 | 22.9 | |
| Strange Brigade (2018) | 107.3 | 38.2 | 35.9 | 43.3 |
| Baldur's Gate 3 (2023) | 27.4 | 22.2 | 19 | 18.7 |
| Cyberpunk 2077 (2023) | 35.2 | 27 | 23.8 | 19.9 |
| F1 24 (2024) | 55.6 | 52.7 | 40.8 | 13.2 |
排放 - 更安静,但仍相当温暖
系统噪音
基本上在所有情况下,风扇噪音都比戴尔 16 Premium 低得多。与大多数其他笔记本电脑相比,该系统能在更长的时间内保持安静或听不到噪音。例如,在运行3DMark06 时,直到第一个基准测试场景进行到三分之二 以上时,风扇噪音才会明显增大,而 ZenBookS16 则会更快地增大噪音。 ZenBook S16.
游戏时的风扇噪音介于 38 到 44 dB(A)之间,在类似条件下仍比去年的机型或上述华硕产品安静。


Noise level
| Idle |
| 22.9 / 22.9 / 23.9 dB(A) |
| Load |
| 34.8 / 43.3 dB(A) |
 | ||
30 dB silent 40 dB(A) audible 50 dB(A) loud |
||
min: | ||
| Dell XPS 16 Core Ultra 5 325 Ultra 5 325, Intel Graphics 4 Xe3 PTL | Dell XPS 16 9640 Ultra 7 155H, GeForce RTX 4070 Laptop GPU | Lenovo Yoga Pro 9 16IAH10 RTX 5050 Ultra 9 285H, GeForce RTX 5050 Laptop | Samsung Galaxy Book6 Ultra Ultra 7 356H, GeForce RTX 5070 Laptop | Asus ZenBook S16 UM5606GA Ryzen AI 9 465, Radeon 880M | MSI Prestige 16 AI Evo B2HMG Ultra 9 285H, Arc 140T | |
|---|---|---|---|---|---|---|
| Noise | -11% | -12% | -12% | -15% | -5% | |
| off / environment * (dB) | 22.8 | 24.5 -7% | 24.6 -8% | 25.1 -10% | 24.9 -9% | 23.6 -4% |
| Idle Minimum * (dB) | 22.9 | 24.5 -7% | 24.6 -7% | 25.1 -10% | 24.9 -9% | 23.6 -3% |
| Idle Average * (dB) | 22.9 | 24.5 -7% | 24.6 -7% | 25.1 -10% | 24.9 -9% | 23.6 -3% |
| Idle Maximum * (dB) | 23.9 | 27.5 -15% | 26.8 -12% | 25.1 -5% | 24.9 -4% | 26.2 -10% |
| Load Average * (dB) | 34.8 | 39.6 -14% | 32.8 6% | 36.9 -6% | 45.7 -31% | 37.1 -7% |
| Cyberpunk 2077 ultra * (dB) | 38 | 51.8 -36% | 48.5 -28% | 49 -29% | 42.1 -11% | |
| Load Maximum * (dB) | 43.3 | 49.7 -15% | 51.8 -20% | 48.5 -12% | 50.4 -16% | 42.1 3% |
| Witcher 3 ultra * (dB) | 49.7 |
* ... smaller is better
温度
表面温度比预期的要高,特别是因为新款 XPS 16 没有配备任何独立显卡。在运行游戏等要求较高的负载时,热点温度可达 43 摄氏度以上,而去年较重的 XPS 16 仅为 37 摄氏度。 戴尔 16 PremiumGeForce RTX 5070 独立显卡的温度仅为 37 摄氏度。


(±) The maximum temperature on the upper side is 43.8 °C / 111 F, compared to the average of 36.8 °C / 98 F, ranging from 21 to 71 °C for the class Multimedia.
(±) The bottom heats up to a maximum of 42 °C / 108 F, compared to the average of 39.1 °C / 102 F
(+) In idle usage, the average temperature for the upper side is 22.4 °C / 72 F, compared to the device average of 31.3 °C / 88 F.
(±) 3: The average temperature for the upper side is 35.3 °C / 96 F, compared to the average of 31.3 °C / 88 F for the class Multimedia.
(+) The palmrests and touchpad are cooler than skin temperature with a maximum of 31.6 °C / 88.9 F and are therefore cool to the touch.
(-) The average temperature of the palmrest area of similar devices was 28.7 °C / 83.7 F (-2.9 °C / -5.2 F).


| Dell XPS 16 Core Ultra 5 325 Ultra 5 325, Intel Graphics 4 Xe3 PTL | Dell XPS 16 9640 Ultra 7 155H, GeForce RTX 4070 Laptop GPU | Lenovo Yoga Pro 9 16IAH10 RTX 5050 Ultra 9 285H, GeForce RTX 5050 Laptop | Samsung Galaxy Book6 Ultra Ultra 7 356H, GeForce RTX 5070 Laptop | Asus ZenBook S16 UM5606GA Ryzen AI 9 465, Radeon 880M | MSI Prestige 16 AI Evo B2HMG Ultra 9 285H, Arc 140T | |
|---|---|---|---|---|---|---|
| Heat | -4% | -9% | -8% | -9% | -13% | |
| Maximum Upper Side * (°C) | 43.8 | 39.4 10% | 34.4 21% | 42.7 3% | 43.4 1% | 48.1 -10% |
| Maximum Bottom * (°C) | 42 | 36.9 12% | 41.4 1% | 49.1 -17% | 46.2 -10% | 51.6 -23% |
| Idle Upper Side * (°C) | 23.2 | 28.2 -22% | 28.6 -23% | 25.4 -9% | 26.5 -14% | 25.9 -12% |
| Idle Bottom * (°C) | 23.6 | 27.4 -16% | 31.8 -35% | 25.5 -8% | 27 -14% | 25.2 -7% |
* ... smaller is better
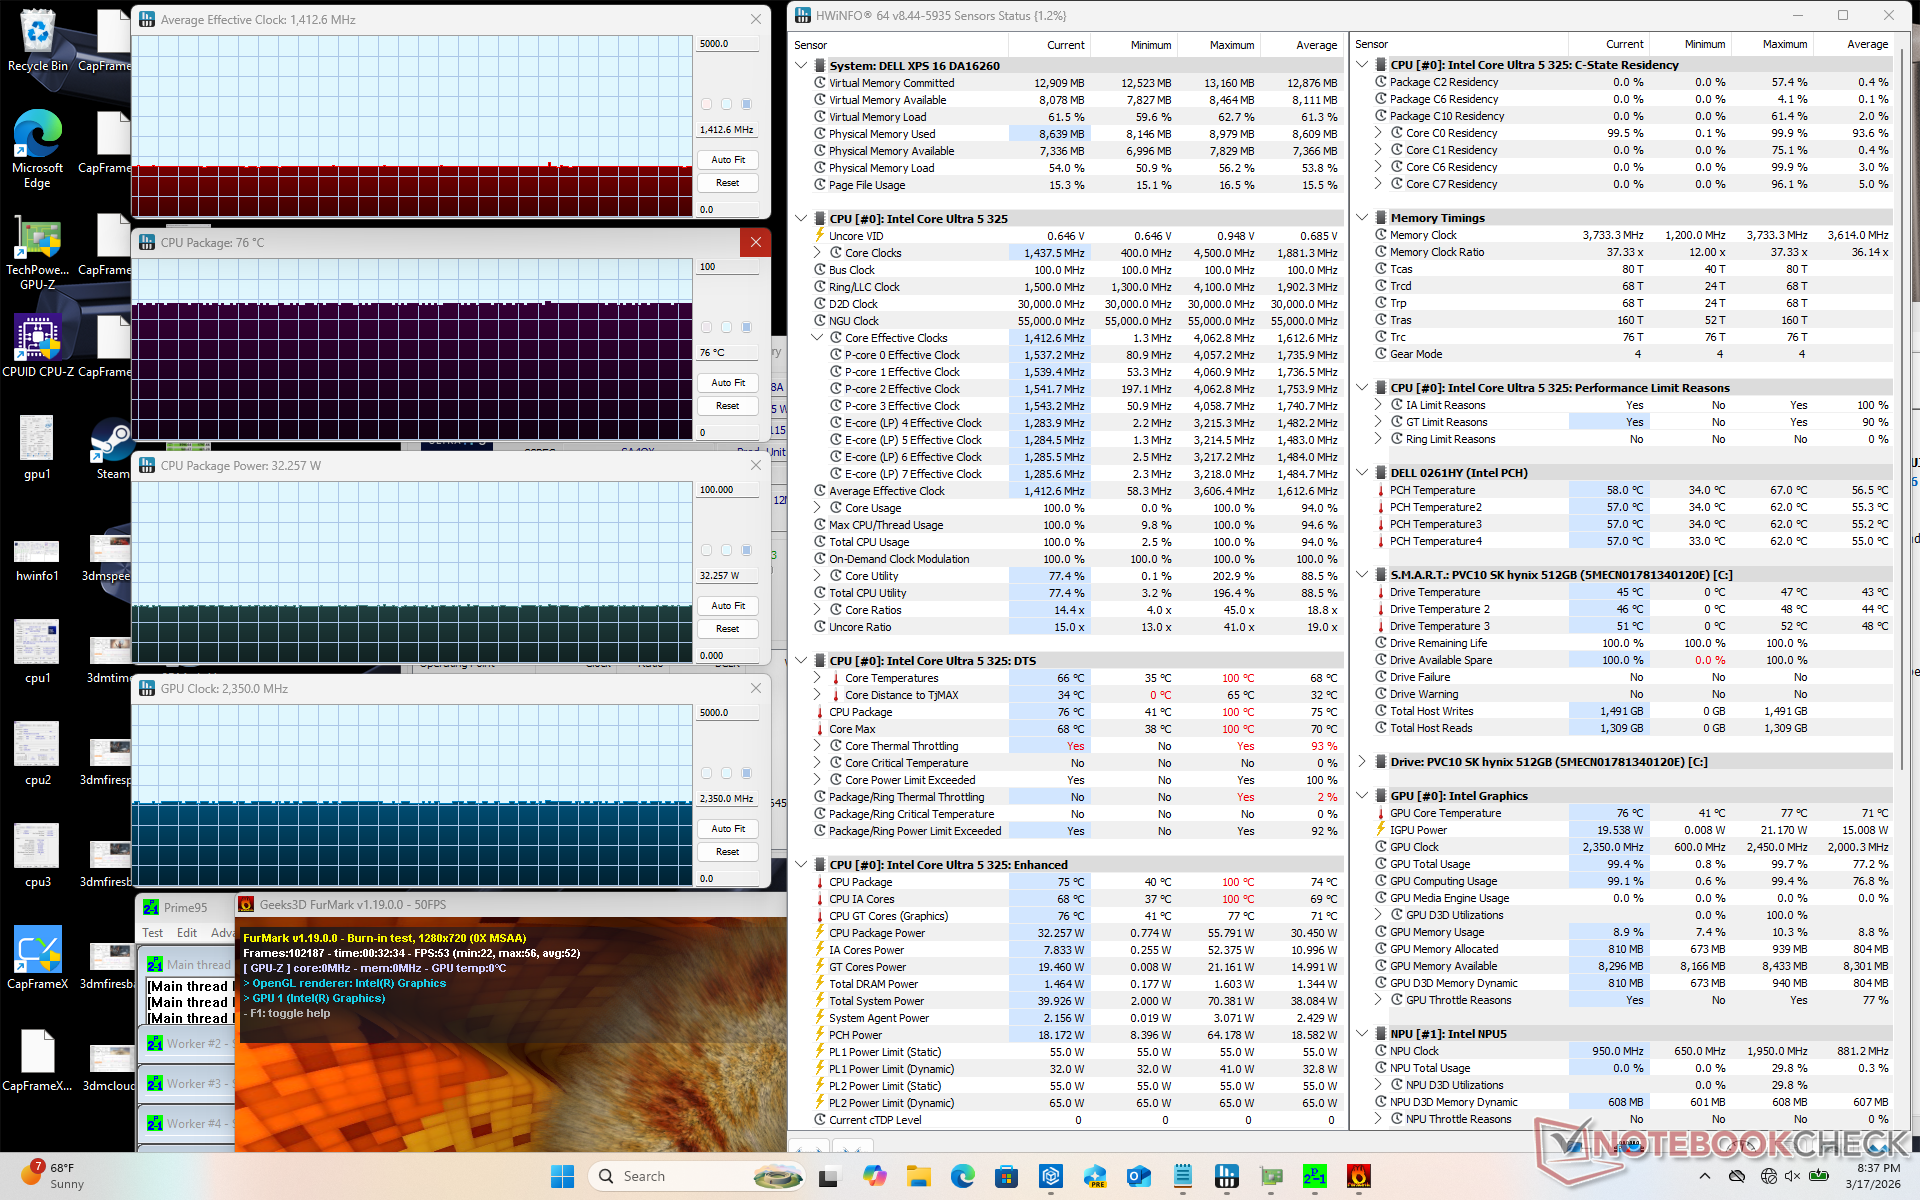
压力测试
当压力过大时,处理器会变得相当热。例如,在运行 Prime95 时,CPU 会升至 3.6 GHz、54 W 和 100 C,并持续几秒钟,然后下降并稳定在 3.0 GHz 和 32 W,以保持 86 C 的较合理核心温度。当配置速度更快的酷睿 Ultra X7 而不是酷睿 Ultra 5 时,新 XPS 16 的核心温度很可能也会稳定在 90 摄氏度以上。
在运行《赛博朋克 2077》时,CPU-GPU 负载更加平衡,核心温度稳定在 89 摄氏度,而配备速度更快的GeForce RTX 显卡的 2025 XPS 16 核心温度仅为 75 摄氏度。核心温度普遍较高可能是上述表面温度较高的原因。
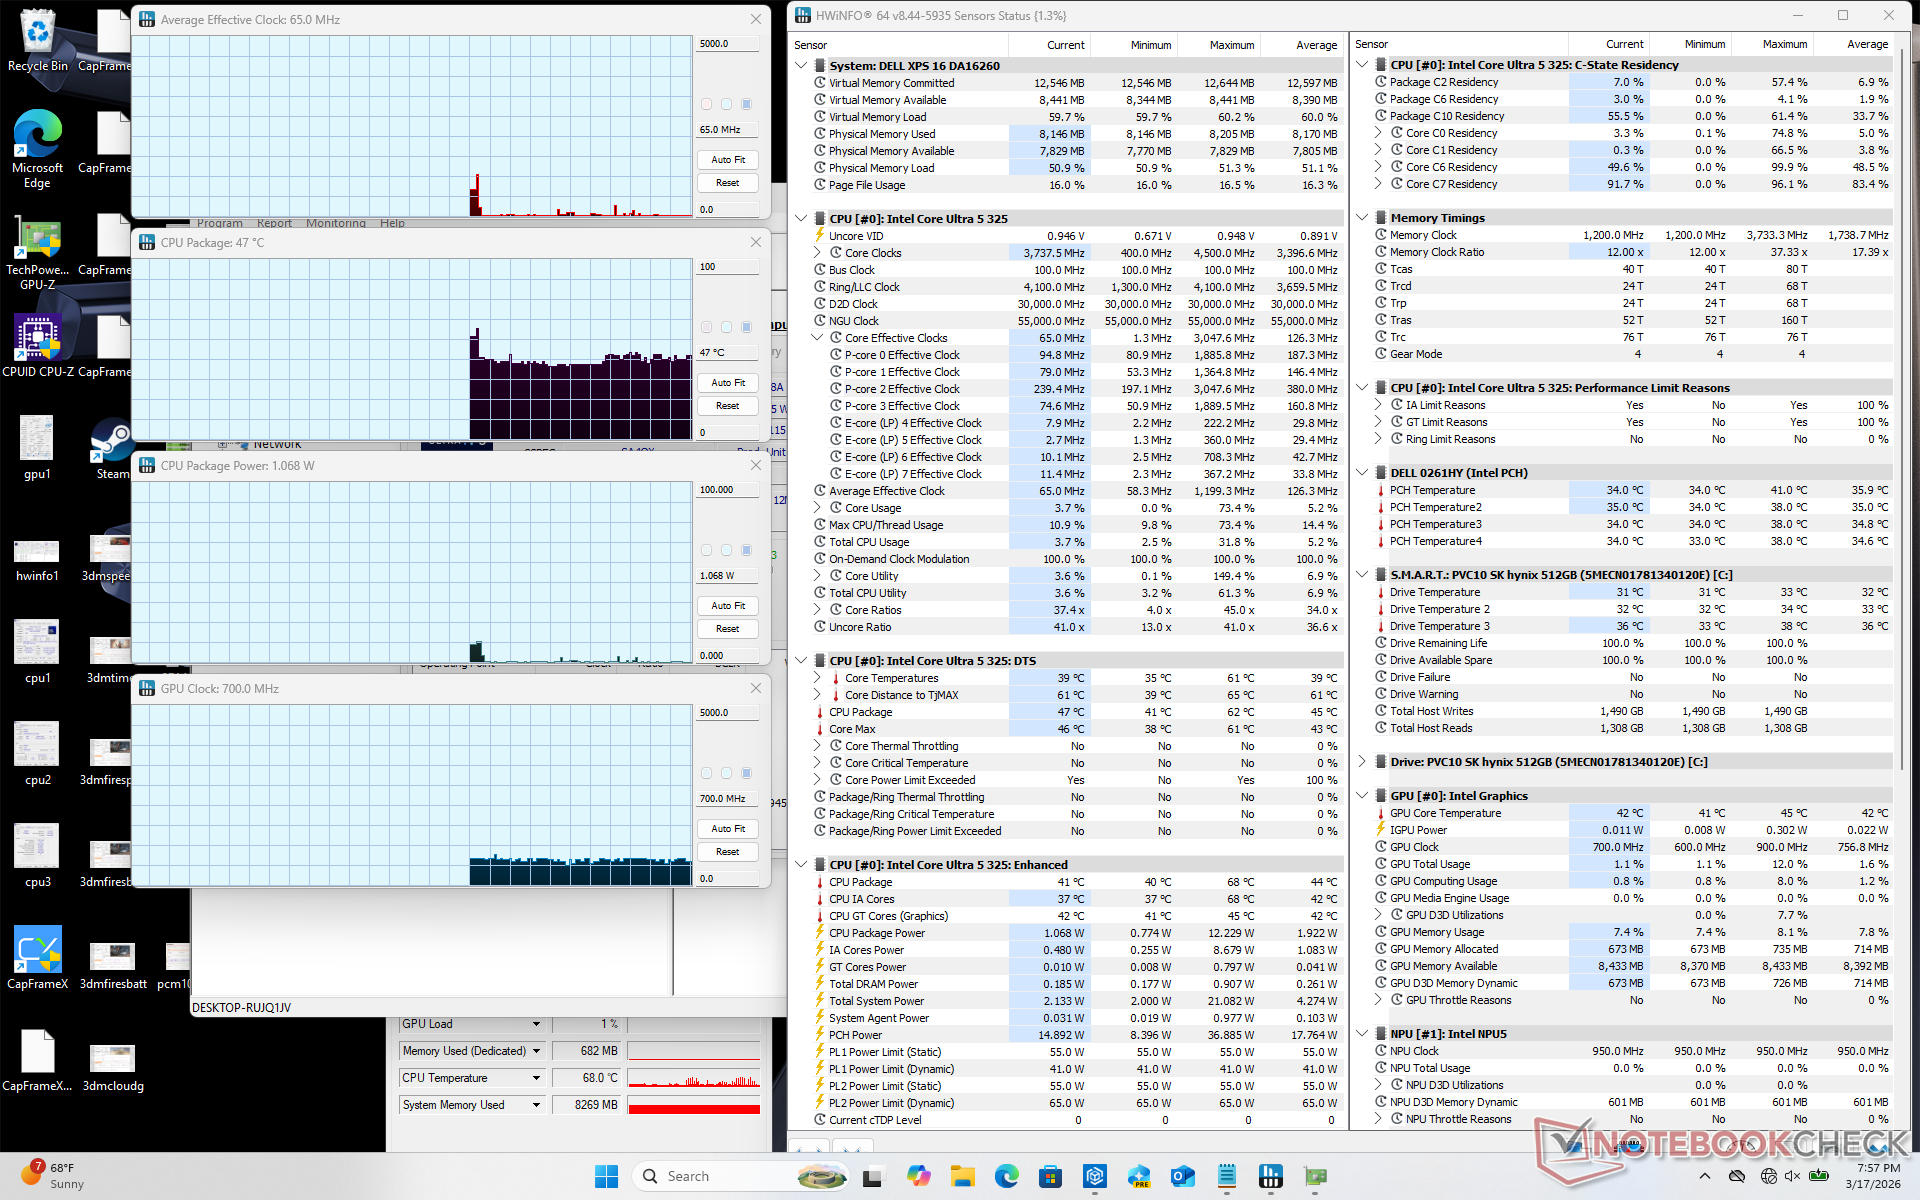
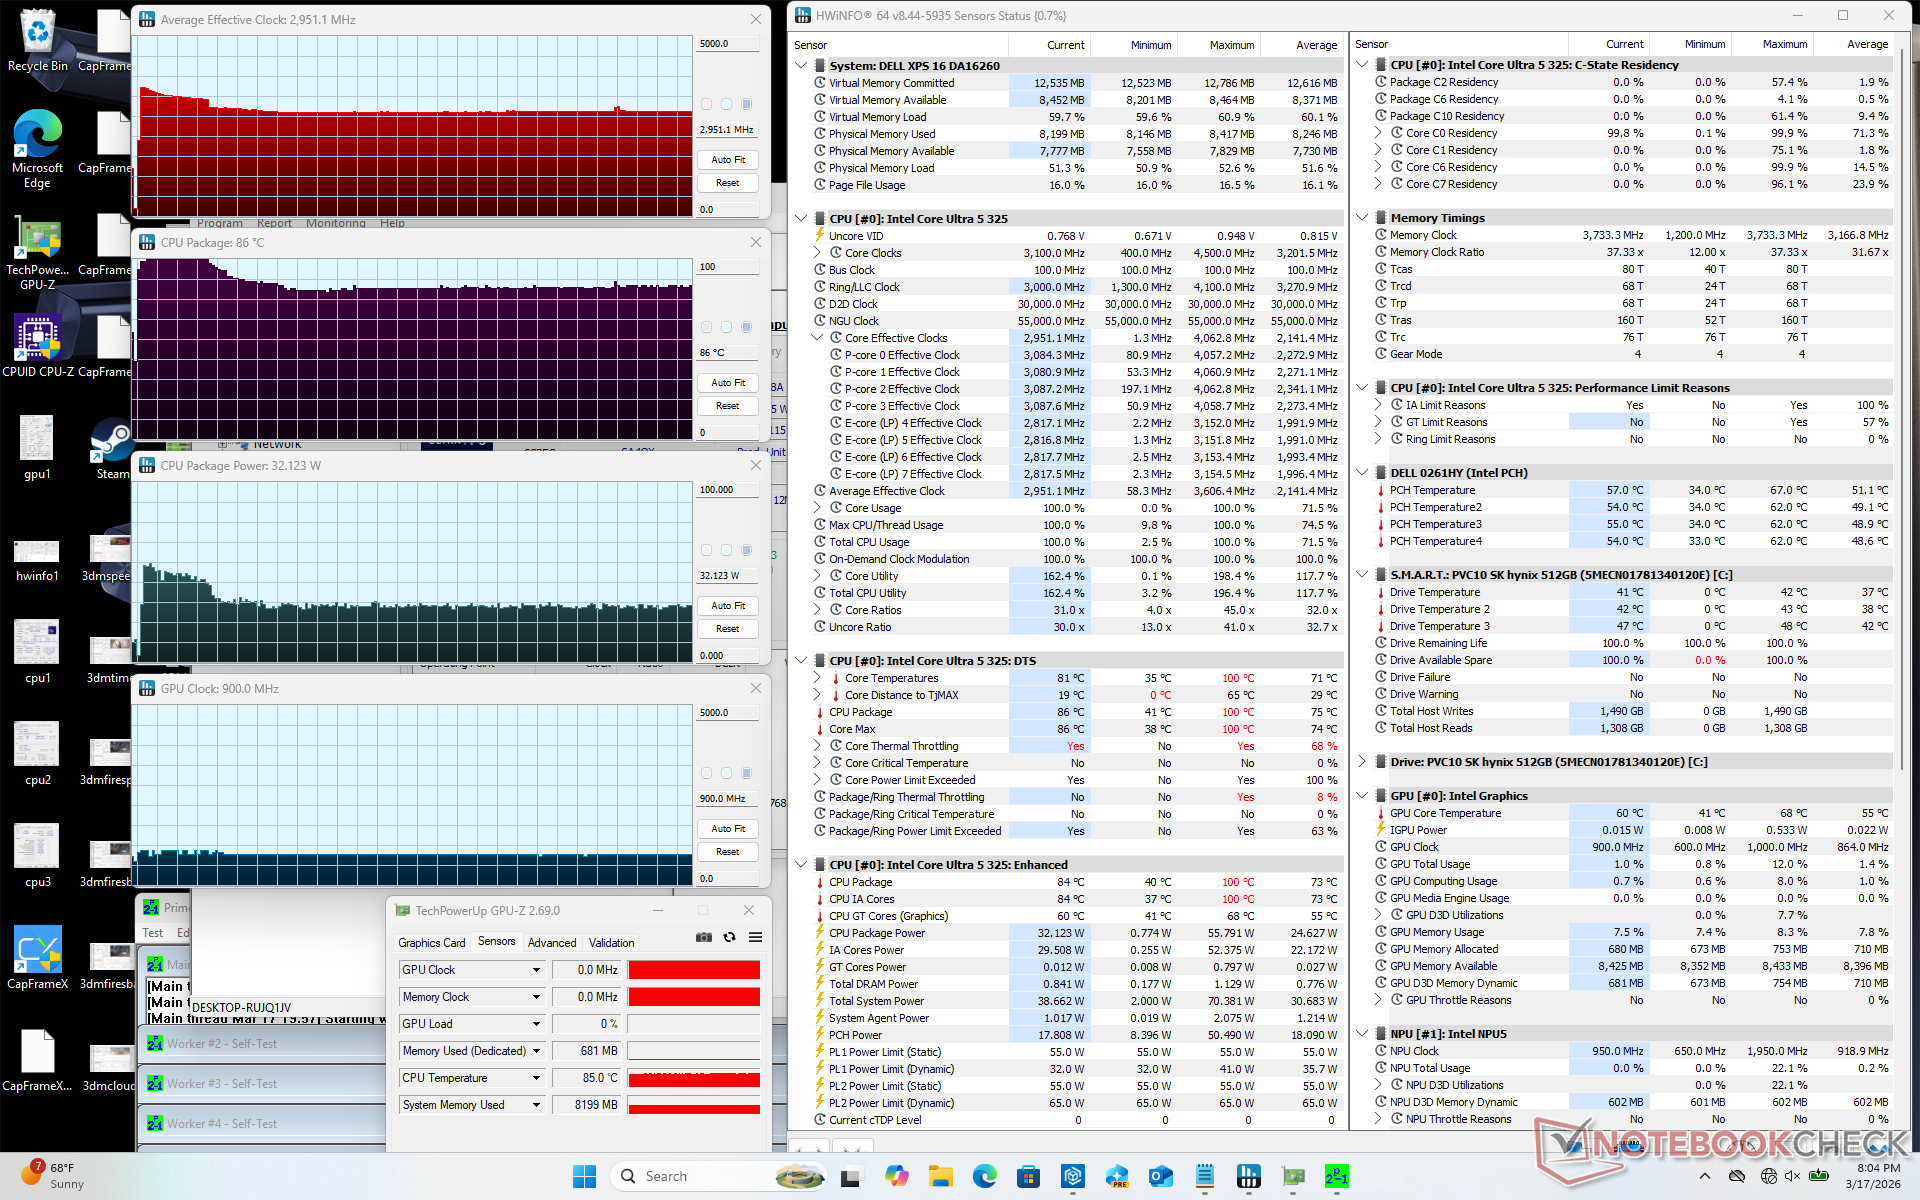
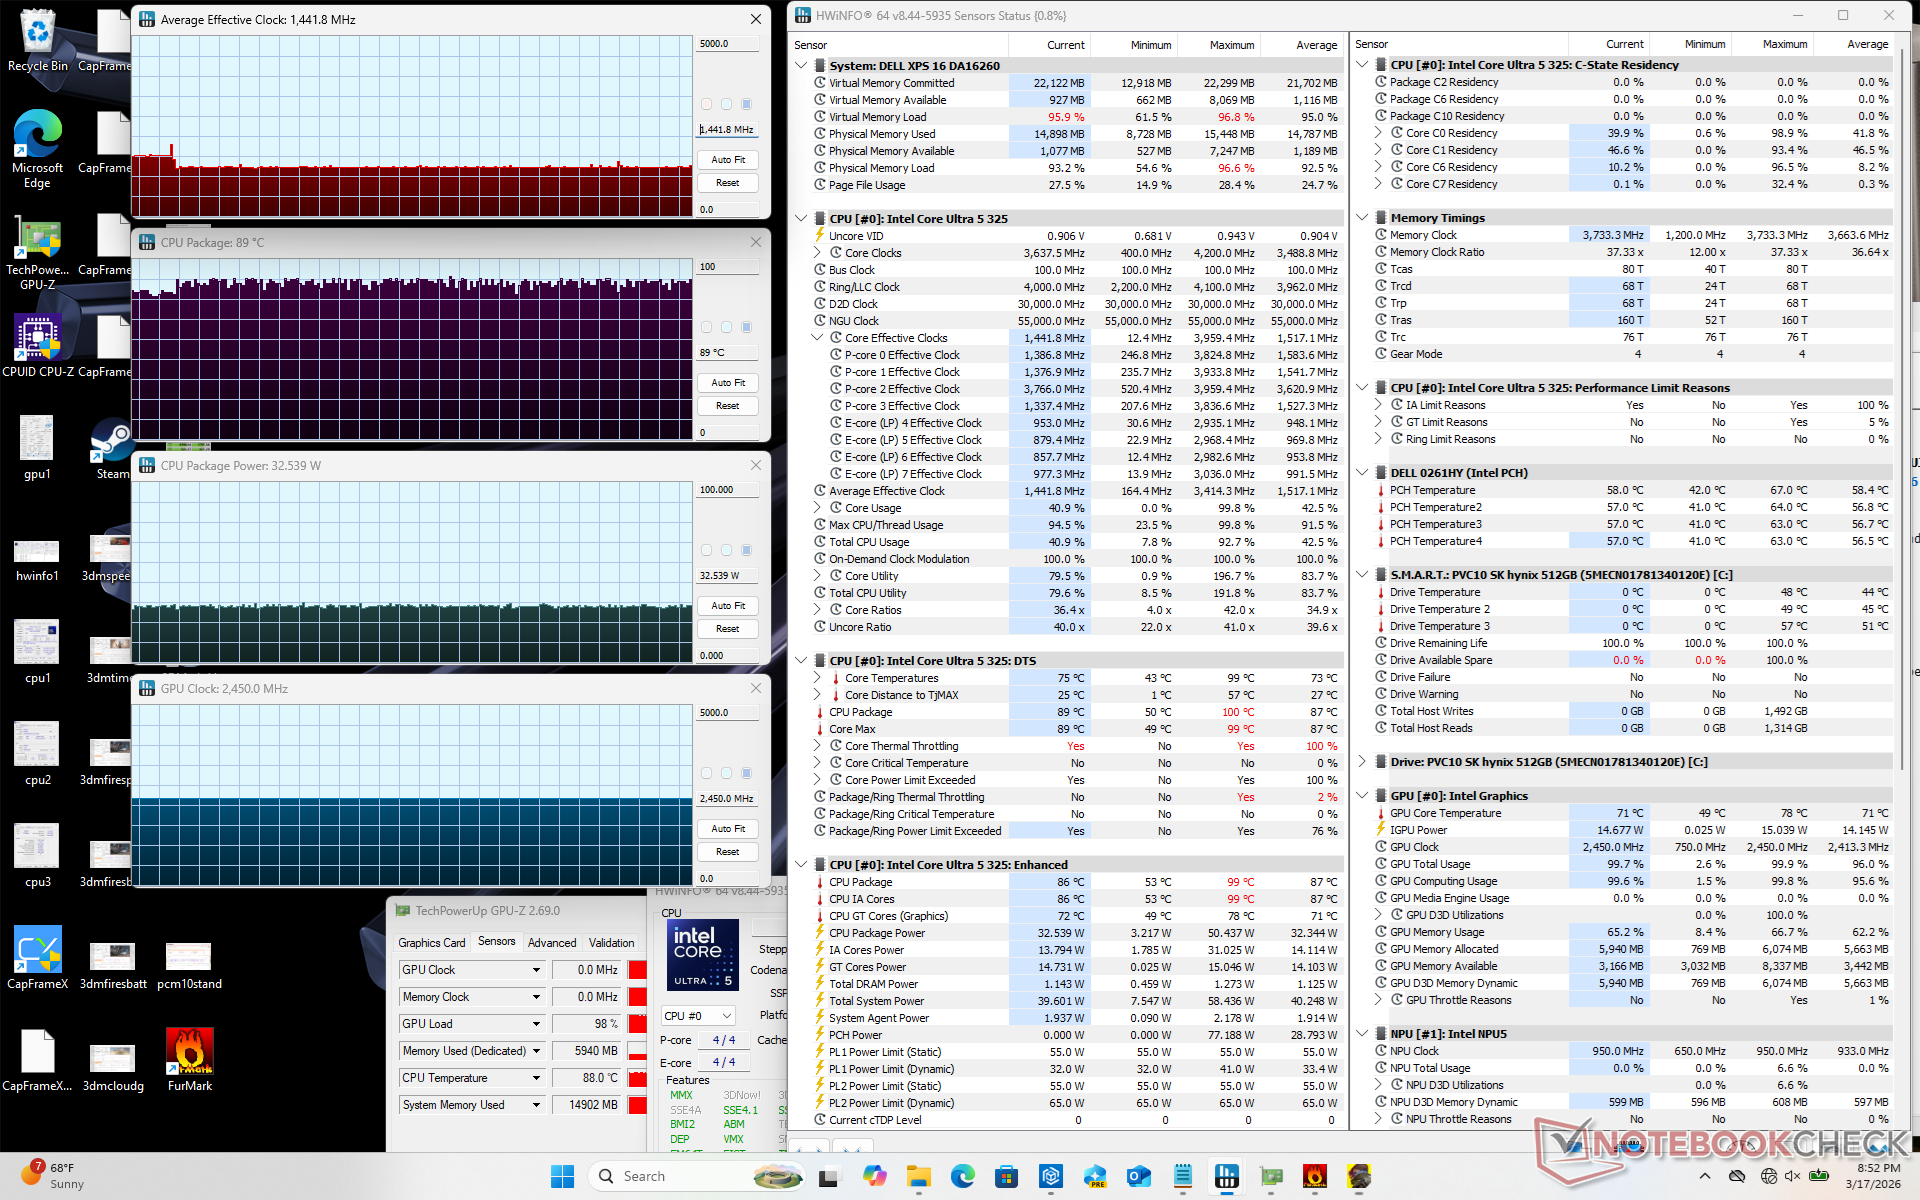
| CPU 平均时钟 (GHz) | GPU 时钟 (MHz) | CPU 平均温度 (°C) | |
| 系统闲置 | -- | -- | 47 |
| Prime95 压力 | 3.0 | -- | 86 |
| Prime95 + FurMark Stress | 1.4 | 2350 | 76 |
| 赛博朋克 2077》压力 | 1.4 | 2450 | 89 |
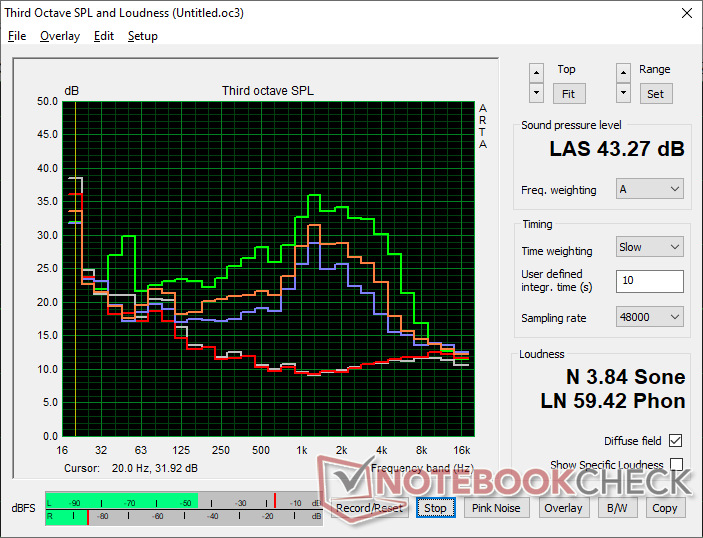
发言人

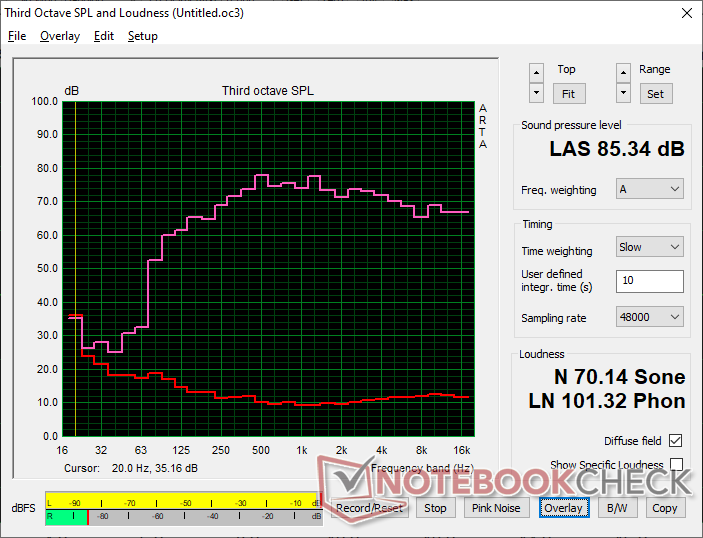
Dell XPS 16 Core Ultra 5 325 audio analysis
(+) | speakers can play relatively loud (85.3 dB)
Bass 100 - 315 Hz
(±) | reduced bass - on average 6.1% lower than median
(+) | bass is linear (5.6% delta to prev. frequency)
Mids 400 - 2000 Hz
(+) | balanced mids - only 3.2% away from median
(+) | mids are linear (4.6% delta to prev. frequency)
Highs 2 - 16 kHz
(+) | balanced highs - only 2.4% away from median
(+) | highs are linear (3.3% delta to prev. frequency)
Overall 100 - 16.000 Hz
(+) | overall sound is linear (7% difference to median)
Compared to same class
» 5% of all tested devices in this class were better, 1% similar, 94% worse
» The best had a delta of 5%, average was 17%, worst was 45%
Compared to all devices tested
» 1% of all tested devices were better, 0% similar, 99% worse
» The best had a delta of 4%, average was 24%, worst was 134%
Apple MacBook Pro 16 2021 M1 Pro audio analysis
(+) | speakers can play relatively loud (84.7 dB)
Bass 100 - 315 Hz
(+) | good bass - only 3.8% away from median
(+) | bass is linear (5.2% delta to prev. frequency)
Mids 400 - 2000 Hz
(+) | balanced mids - only 1.3% away from median
(+) | mids are linear (2.1% delta to prev. frequency)
Highs 2 - 16 kHz
(+) | balanced highs - only 1.9% away from median
(+) | highs are linear (2.7% delta to prev. frequency)
Overall 100 - 16.000 Hz
(+) | overall sound is linear (4.6% difference to median)
Compared to same class
» 0% of all tested devices in this class were better, 0% similar, 100% worse
» The best had a delta of 5%, average was 17%, worst was 45%
Compared to all devices tested
» 0% of all tested devices were better, 0% similar, 100% worse
» The best had a delta of 4%, average was 24%, worst was 134%
能源管理 - 豹湖是效率之王
耗电量
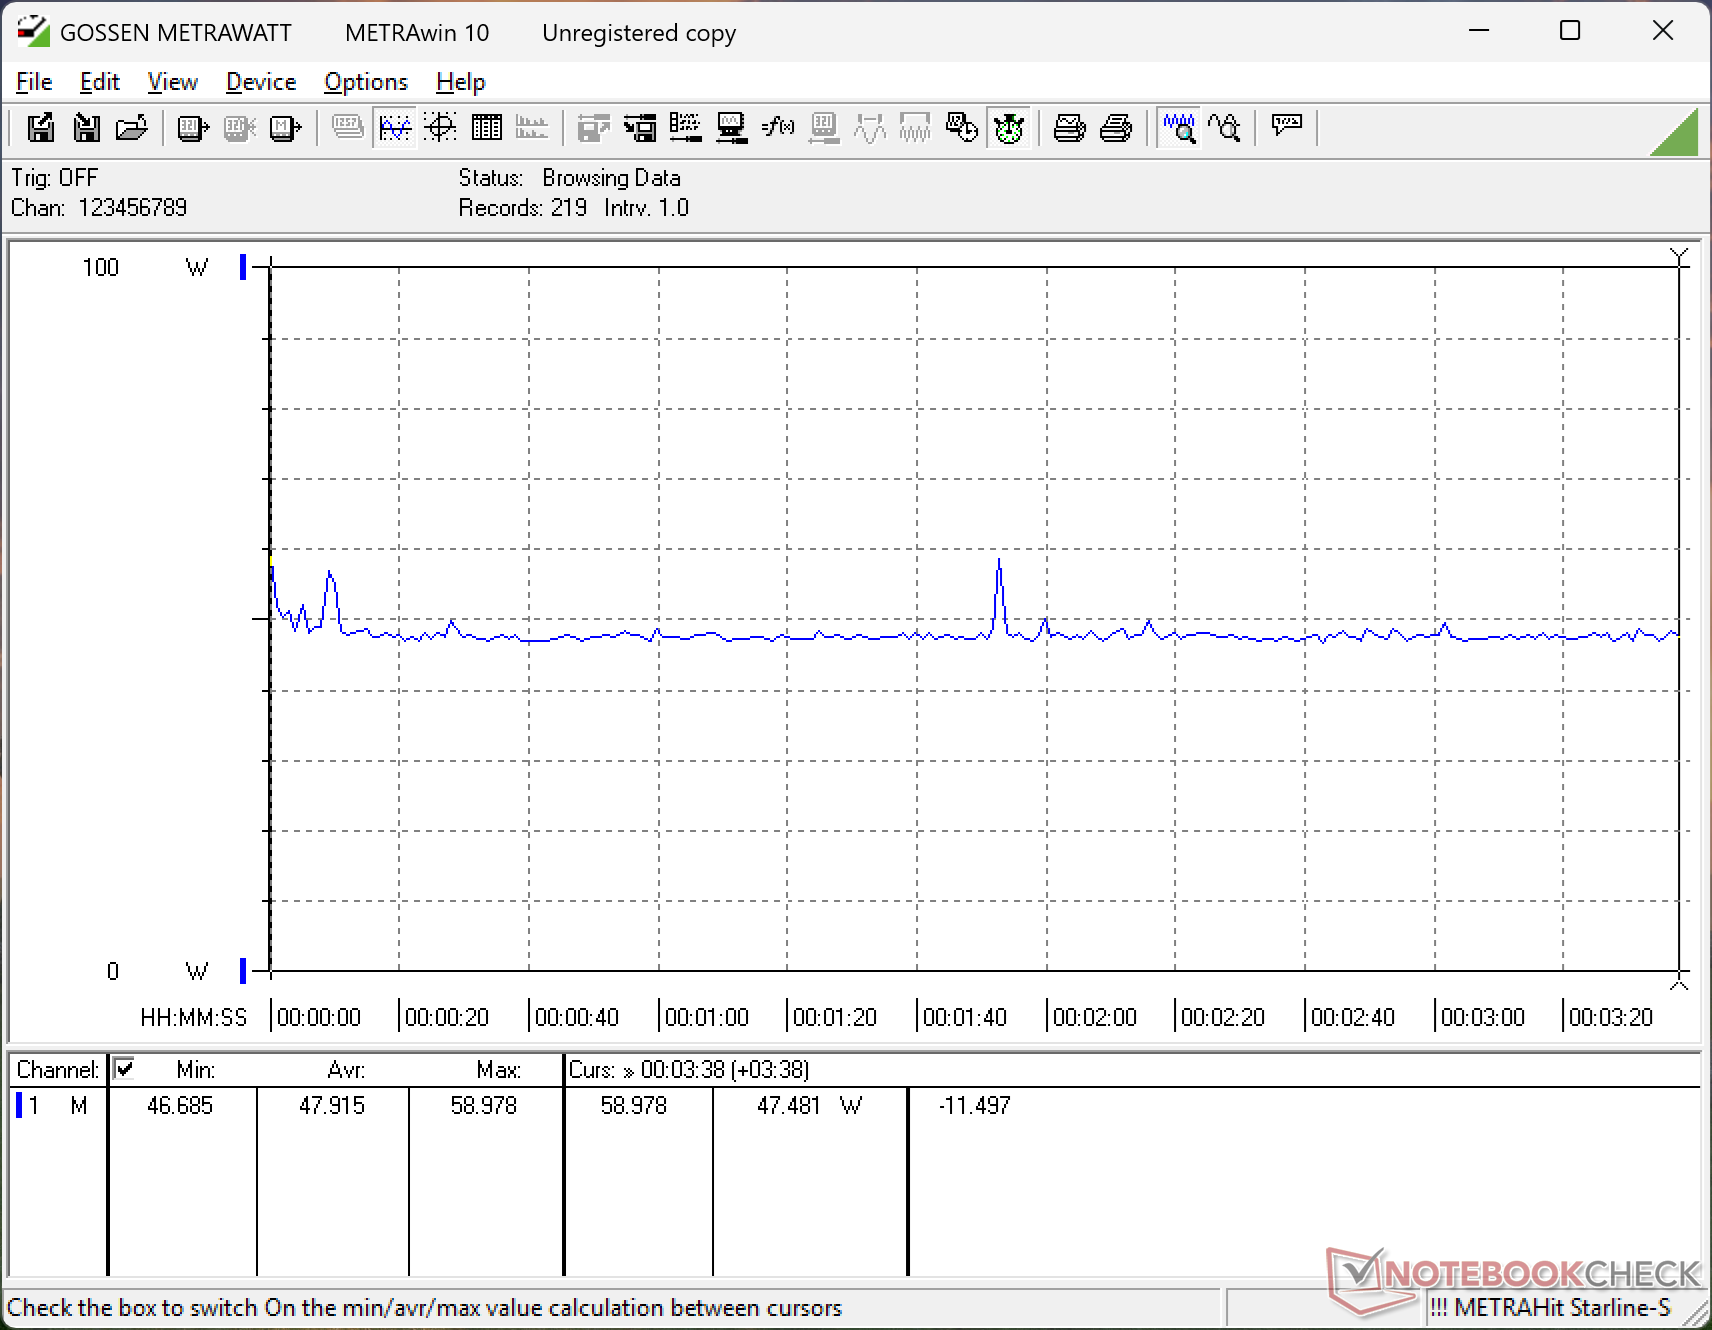
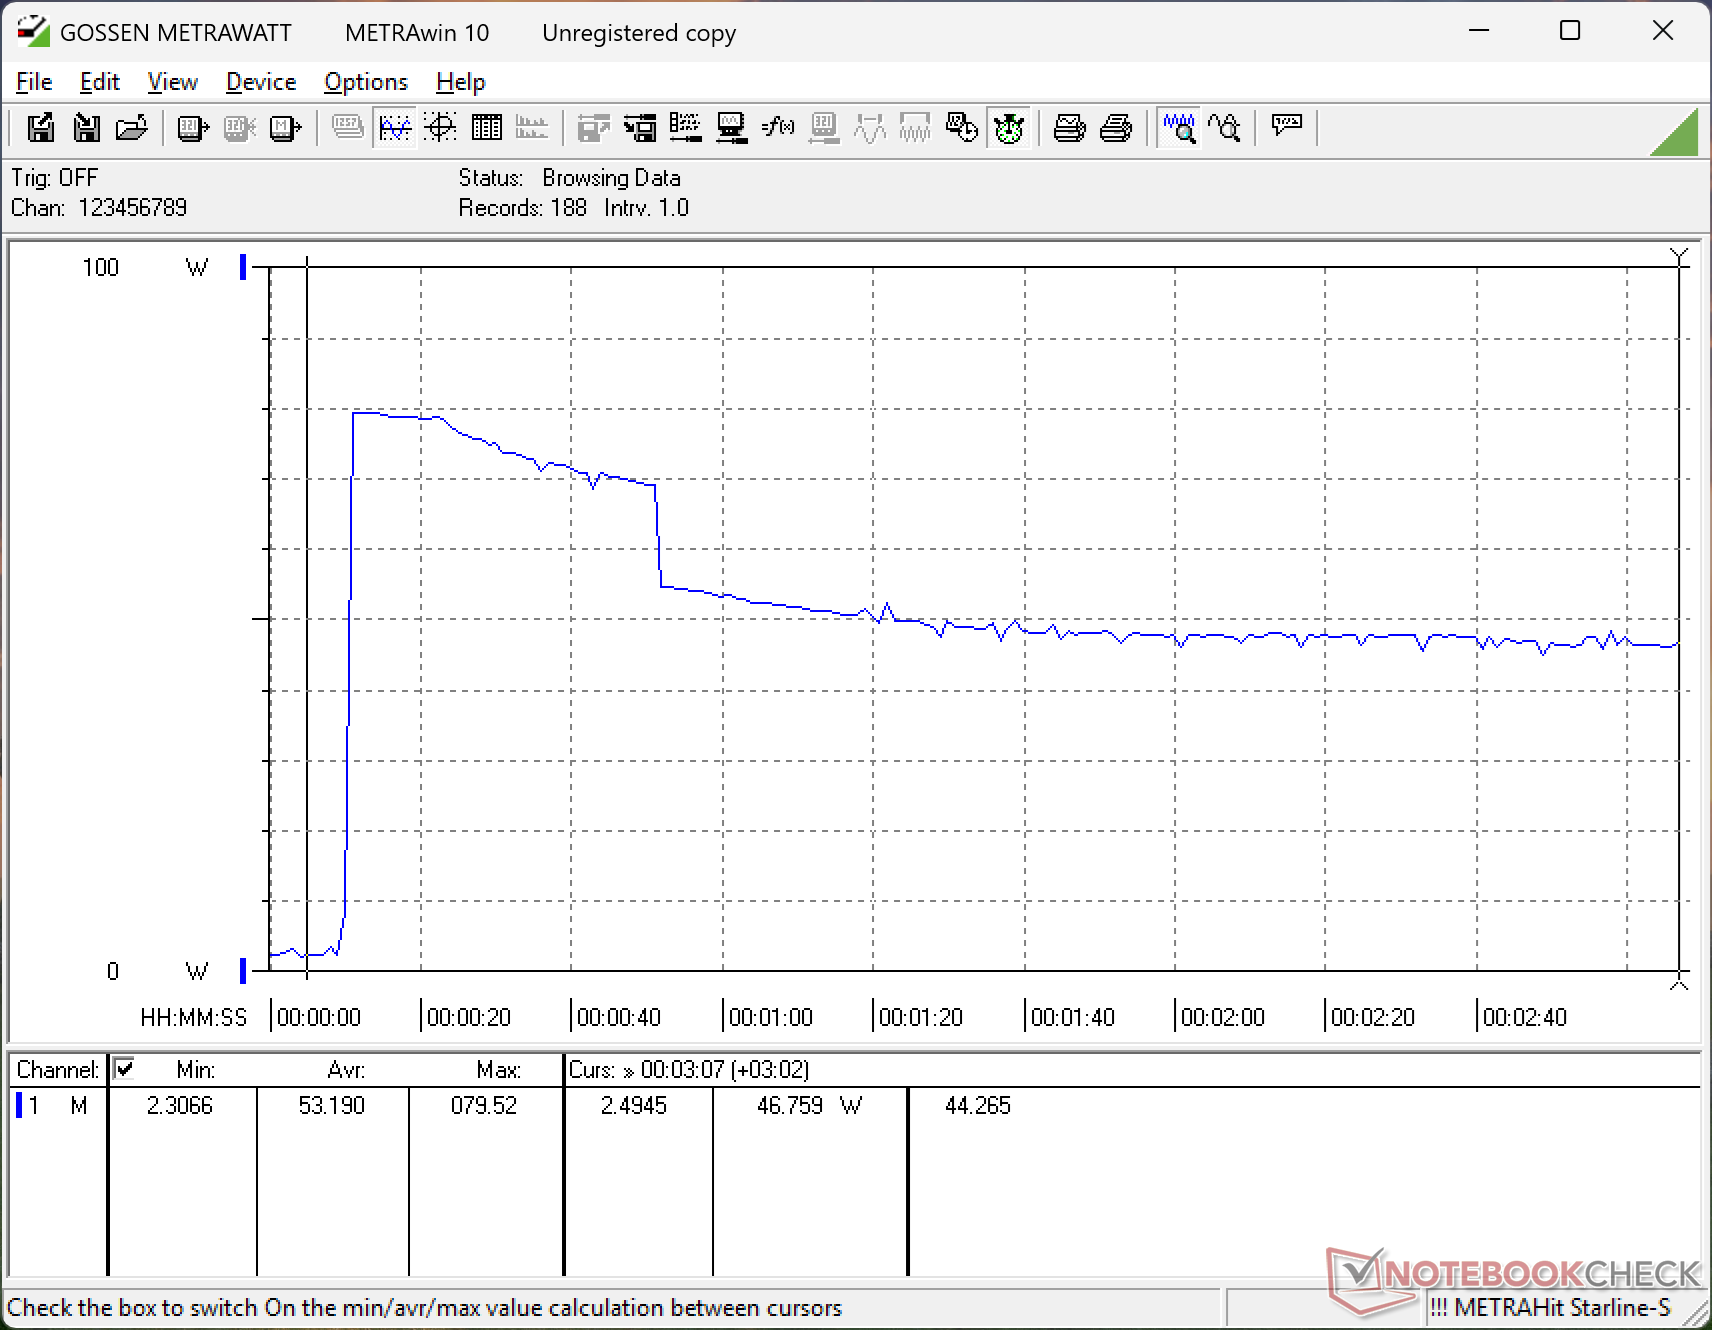
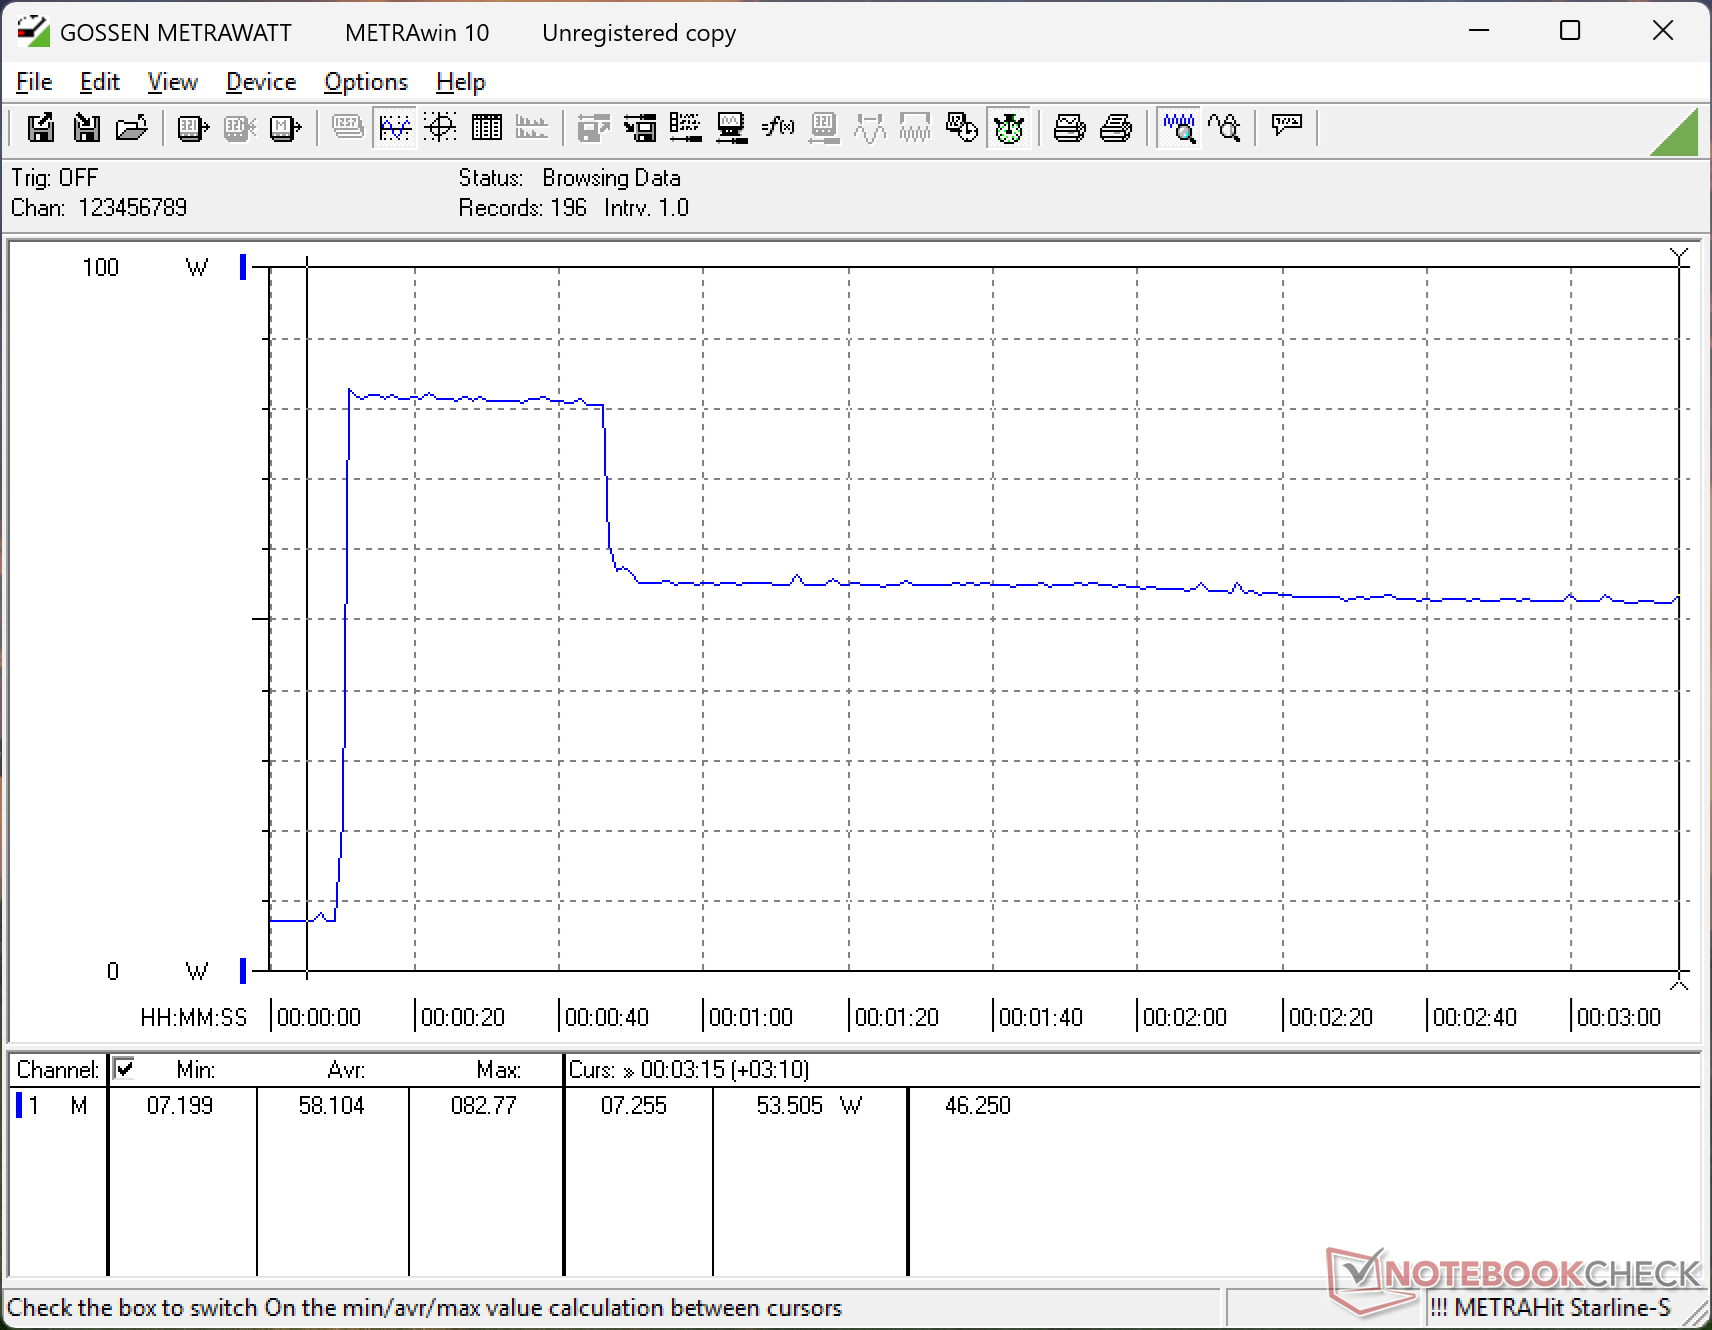
Panther Lake 采用了 Lunar Lake-V 的效率和 Arrow Lake-H 的原始性能,实现了两全其美。在最低亮度设置下闲置在桌面上的功耗仅为 1.3 瓦,这对于 16 英寸的机型来说是非常低的。由于没有独立 GPU,运行游戏时的功耗仍然很低,仅略低于 50 W。如果改用酷睿 Ultra X7,游戏时的功耗将仅高出几瓦。 XPS 14在所有 iGPU 笔记本电脑中,它的每瓦性能是最高的。
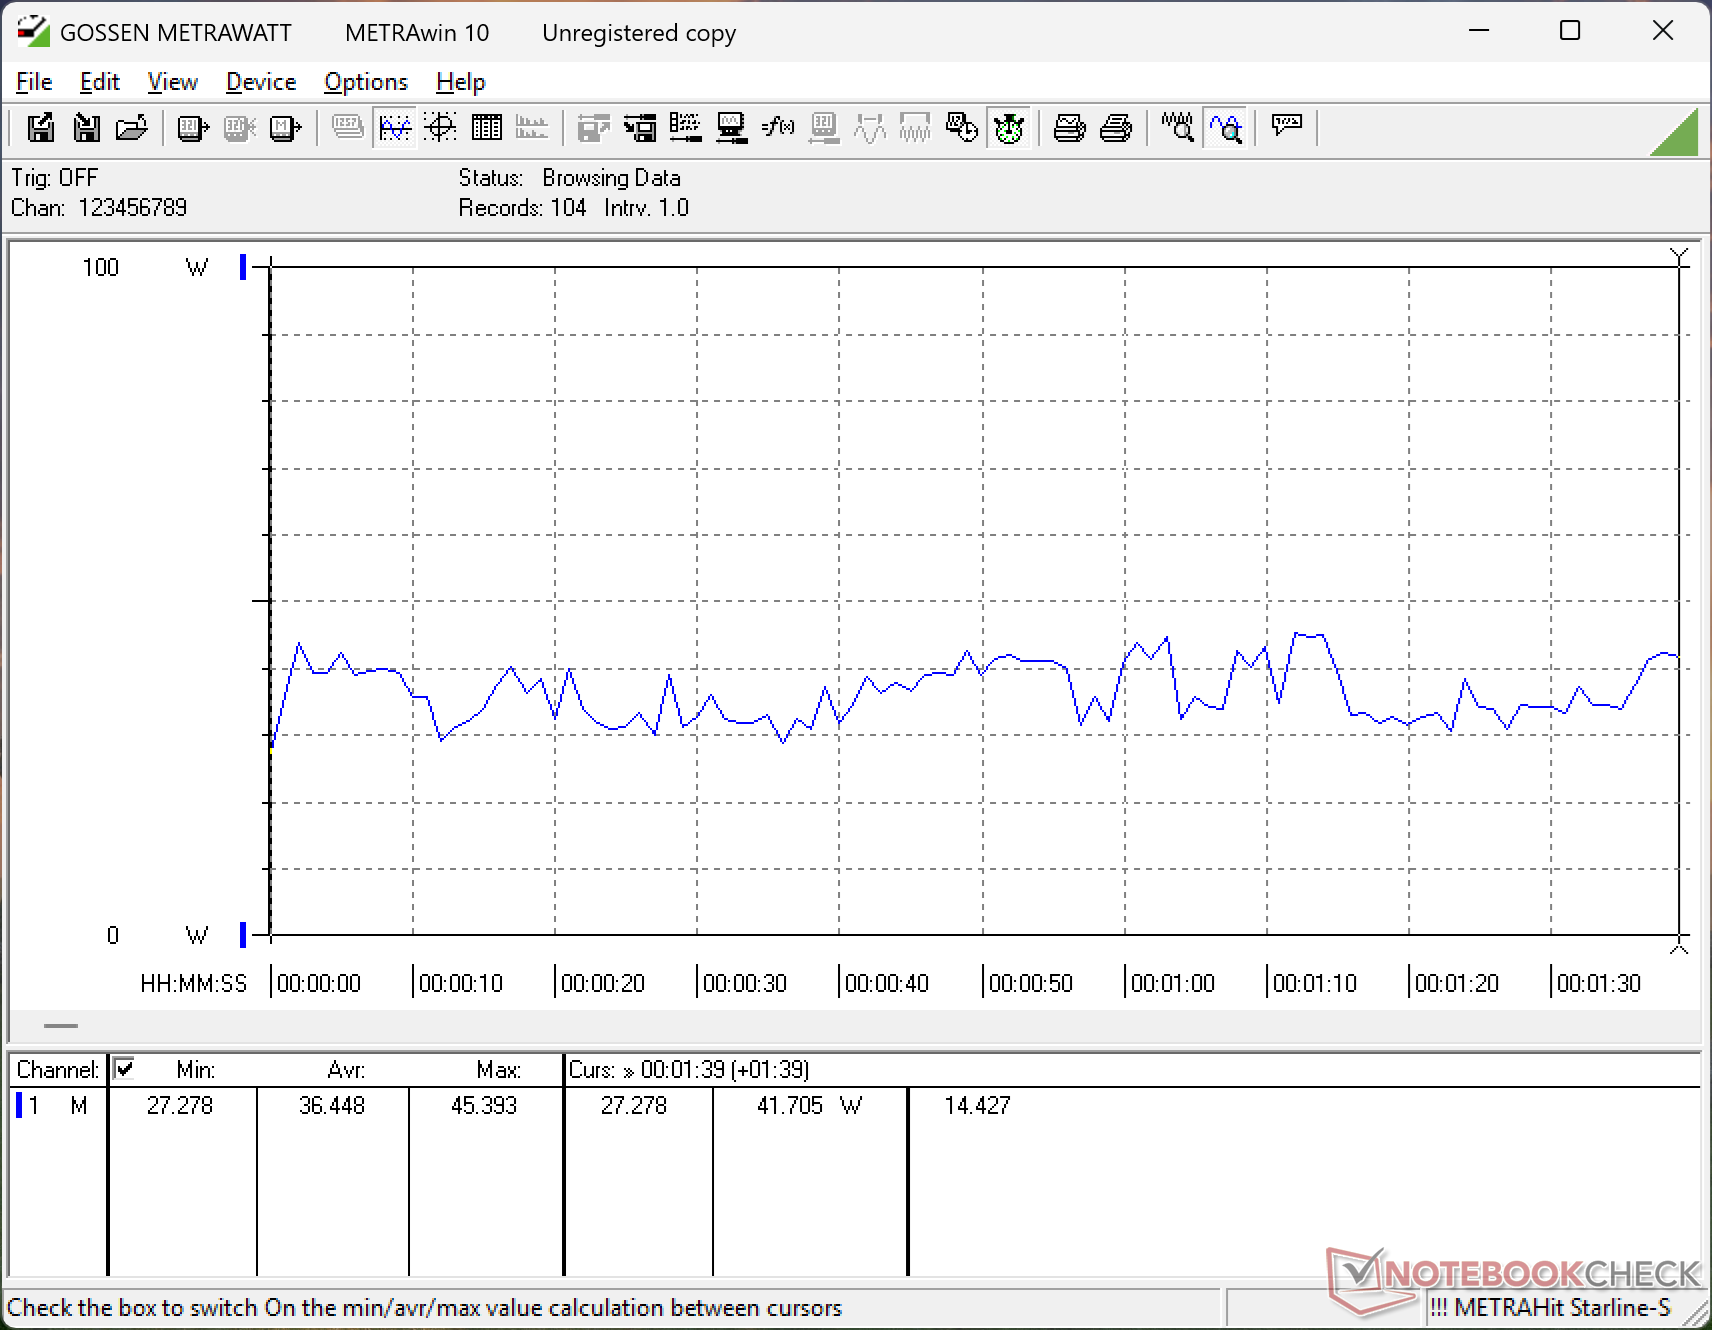
当 CPU 处于满负荷工作状态时,我们可以通过小型(约 10.2 x 5.5 x 2.2 厘米)100 瓦通用 USB-C 交流适配器记录到 83 瓦的临时最大功耗。
| Off / Standby | |
| Idle | |
| Load |
|
Key:
min: | |
| Dell XPS 16 Core Ultra 5 325 Ultra 5 325, Intel Graphics 4 Xe3 PTL, SK hynix PVC10 HFS512GEM4X182N, IPS, 1920x1200, 16" | Dell 16 Premium DA16250 Ultra 7 255H, GeForce RTX 5070 Laptop, Kioxia BG6 KBG6AZNV1T02, OLED, 3840x2400, 16.3" | Lenovo Yoga Pro 9 16IAH10 RTX 5050 Ultra 9 285H, GeForce RTX 5050 Laptop, WD PC SN7100S SDFPMSL-1T00-1101, OLED, 2880x1800, 16" | Samsung Galaxy Book6 Ultra Ultra 7 356H, GeForce RTX 5070 Laptop, Samsung PM9C1b MZVL81T0HFLB-00BH1, OLED, 2880x1800, 16" | Asus ZenBook S16 UM5606GA Ryzen AI 9 465, Radeon 880M, SanDisk PC SN5100S, OLED, 2880x1800, 16" | MSI Prestige 16 AI Evo B2HMG Ultra 9 285H, Arc 140T, Micron 2500 1TB MTFDKBA1T0QGN, IPS, 2560x1600, 16" | |
|---|---|---|---|---|---|---|
| Power Consumption | -225% | -261% | -119% | -65% | -93% | |
| Idle Minimum * (Watt) | 1.3 | 6.5 -400% | 6.8 -423% | 4.4 -238% | 3.7 -185% | 4.4 -238% |
| Idle Average * (Watt) | 4.5 | 8.1 -80% | 20.1 -347% | 6.4 -42% | 7.4 -64% | 9.2 -104% |
| Idle Maximum * (Watt) | 4.6 | 33 -617% | 21.6 -370% | 7.1 -54% | 9.5 -107% | 9.5 -107% |
| Load Average * (Watt) | 36.5 | 88.9 -144% | 87.6 -140% | 55.1 -51% | 57.9 -59% | 66.9 -83% |
| Cyberpunk 2077 ultra external monitor * (Watt) | 45.4 | 108.9 -140% | 147.9 -226% | 133 -193% | 57 -26% | 67.4 -48% |
| Cyberpunk 2077 ultra * (Watt) | 47.9 | 108.7 -127% | 148.2 -209% | 134.3 -180% | 58.5 -22% | 68.8 -44% |
| Load Maximum * (Watt) | 82.8 | 138.3 -67% | 173.5 -110% | 143.9 -74% | 76.9 7% | 102.9 -24% |
* ... smaller is better
功耗 赛博朋克/压力测试
外部显示器功耗
电池寿命

根据戴尔内部的 WLAN 测试标准,他们宣称电池续航时间长达 31 小时。然而,在我们自己的 WLAN 条件下进行测试时,我们能记录到近 27 小时的运行时间,这仍然令人印象深刻,因为对于 16 英寸的机型来说,70 Wh 的电池容量实际上偏小。
| Dell XPS 16 Core Ultra 5 325 Ultra 5 325, Intel Graphics 4 Xe3 PTL, 70 Wh | Dell XPS 16 9640 Ultra 7 155H, GeForce RTX 4070 Laptop GPU, 99.5 Wh | Lenovo Yoga Pro 9 16IAH10 RTX 5050 Ultra 9 285H, GeForce RTX 5050 Laptop, 84 Wh | Samsung Galaxy Book6 Ultra Ultra 7 356H, GeForce RTX 5070 Laptop, 80.2 Wh | Asus ZenBook S16 UM5606GA Ryzen AI 9 465, Radeon 880M, 83 Wh | MSI Prestige 16 AI Evo B2HMG Ultra 9 285H, Arc 140T, 99.9 Wh | |
|---|---|---|---|---|---|---|
| Battery runtime | -61% | -60% | -37% | -51% | -38% | |
| WiFi v1.3 (h) | 26.6 | 10.5 -61% | 10.7 -60% | 16.8 -37% | 13.1 -51% | 16.5 -38% |
| H.264 (h) | 16.5 | 20.8 | ||||
| Load (h) | 1.5 | 2.4 |
笔记本检查评级
2026 XPS 16 牺牲了独立 GPU 选项,采用了更精简、更轻、更安静、更持久和更高效的设计。
Dell XPS 16 Core Ultra 5 325
- 03/20/2026 v8
Allen Ngo
 Total Sustainability Score:
 潜在竞争对手比较
Image | Model / Review | Price | Weight | Height | Display |
|---|---|---|---|---|---|
1. 84.2%  | Dell XPS 16 Core Ultra 5 325 Intel Core Ultra 5 325 ⎘ Intel Graphics 4 Xe3 Panther Lake iGPU ⎘ 16 GB Memory, 512 GB SSD | Amazon: 1. $2,799.00 Dell Premium 16 (XPS 16 2025... 2. $2,499.99 Dell Premium 16 (XPS 16 2025... 3. $2,599.00 Dell Premium 16 (XPS 16 2025... List Price: 1600 USD | 1.7 kg | 15.4 mm | 16.00" 1920x1200 142 PPI IPS |
2. 87.9%  | Dell 16 Premium DA16250 Intel Core Ultra 7 255H ⎘ NVIDIA GeForce RTX 5070 Laptop ⎘ 32 GB Memory, 1024 GB SSD | Amazon: List Price: 3300 USD | 2.3 kg | 18.7 mm | 16.30" 3840x2400 278 PPI OLED |
3. 88.8%  | Lenovo Yoga Pro 9 16IAH10 RTX 5050 Intel Core Ultra 9 285H ⎘ NVIDIA GeForce RTX 5050 Laptop ⎘ 32 GB Memory, 1024 GB SSD | Amazon: List Price: 1800 USD | 2 kg | 17.9 mm | 16.00" 2880x1800 212 PPI OLED |
4. 90.7%  | Samsung Galaxy Book6 Ultra Intel Core Ultra 7 356H ⎘ NVIDIA GeForce RTX 5070 Laptop ⎘ 32 GB Memory, 1000 GB SSD | Amazon: List Price: 3599€ | 1.9 kg | 15.4 mm | 16.00" 2880x1800 212 PPI OLED |
5. 86.6%  | Asus ZenBook S16 UM5606GA AMD Ryzen AI 9 465 ⎘ AMD Radeon 880M ⎘ 32 GB Memory, 1024 GB SSD | Amazon: List Price: 1799€ | 1.5 kg | 12.9 mm | 16.00" 2880x1800 212 PPI OLED |
6. 82.8%  | MSI Prestige 16 AI Evo B2HMG Intel Core Ultra 9 285H ⎘ Intel Arc Graphics 140T ⎘ 32 GB Memory, 1024 GB SSD | Amazon: 1. $1,479.00 MSI Prestige 16 AI+ Evo 16" ... 2. $1,099.49 msi Prestige 13 AI Evo Lapto... 3. $1,414.25 MSI Prestige 14 AI+ EVO PRE1... | 1.6 kg | 18.95 mm | 16.00" 2560x1600 189 PPI IPS |
Transparency
The selection of devices to be reviewed is made by our editorial team. The test sample was freely purchased by the author at his/her own expense. The lender had no influence on this review, nor did the manufacturer receive a copy of this review before publication. There was no obligation to publish this review. As an independent media company, Notebookcheck is not subjected to the authority of manufacturers, retailers or publishers.
This is how Notebookcheck is testing
Every year, Notebookcheck independently reviews hundreds of laptops and smartphones using standardized procedures to ensure that all results are comparable. We have continuously developed our test methods for around 20 years and set industry standards in the process. In our test labs, high-quality measuring equipment is utilized by experienced technicians and editors. These tests involve a multi-stage validation process. Our complex rating system is based on hundreds of well-founded measurements and benchmarks, which maintains objectivity. Further information on our test methods can be found here.

