结论:全新优化,适用于办公和零售场所
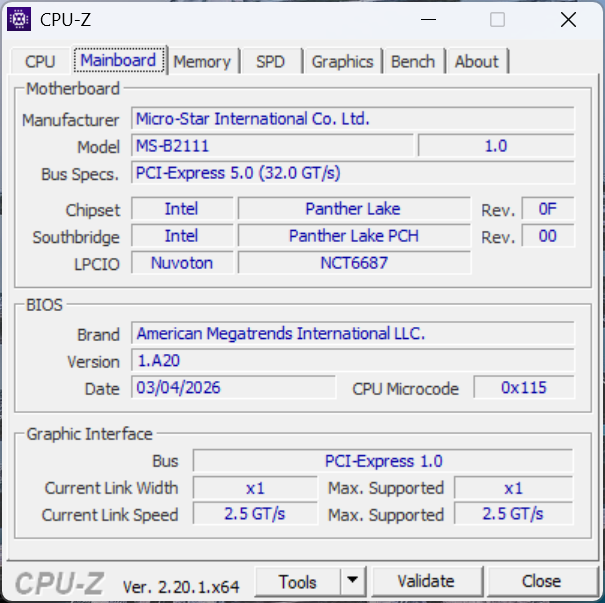
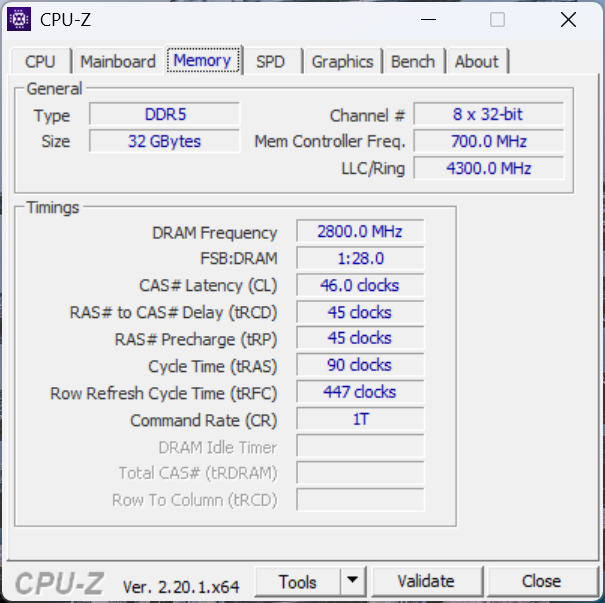
Cubi NUC AI+ 3MG 与去年的 Cubi NUC AI+ 2MG 相比,第一眼看上去可能不太像,但却是一个重大的飞跃。它的引擎盖下有许多变化,包括改良的主板和可拆卸内存、更简便的维修程序、更多有用的端口,以及更小、更不起眼的设计,以便更好地融入更专业的环境。事实上,这是最小的英特尔迷你 PC 之一,支持高达 128 GB 的可移动内存。CPU 性能的大幅提升也解决了人们对旧版 Lunar Lake 机型的主要担忧之一。
相反,体积变小也带来了一些妥协。去年机型上的 MicroSD 读卡器已不复存在,也没有集成扬声器,而集成扬声器本可以使系统的功能更加全面。核心温度普遍较高,风扇噪音也不一定比以前好或坏。相对较大的电源模块几乎与迷你 PC 本身一样重,根据使用环境的不同,很难将其收起。最后,虽然高内存容量是一个突出的特点,但其他方面已经退居其次,包括本地存储和 GPU 性能,因为竞争对手的机型,如 GMK EVO-X1或 华硕 NUC 15 Pro+等竞争机型都拥有更快的速度和更多的存储选项。
Pros
Cons
价格和供应情况
新蛋网目前正在销售配备 Core Ultra 9 CPU 的裸机微星 Cubi NUC AI+ 3MG 的售价为 830 美元。如果配置 32 GB 内存,价格将跃升至 1220 美元。
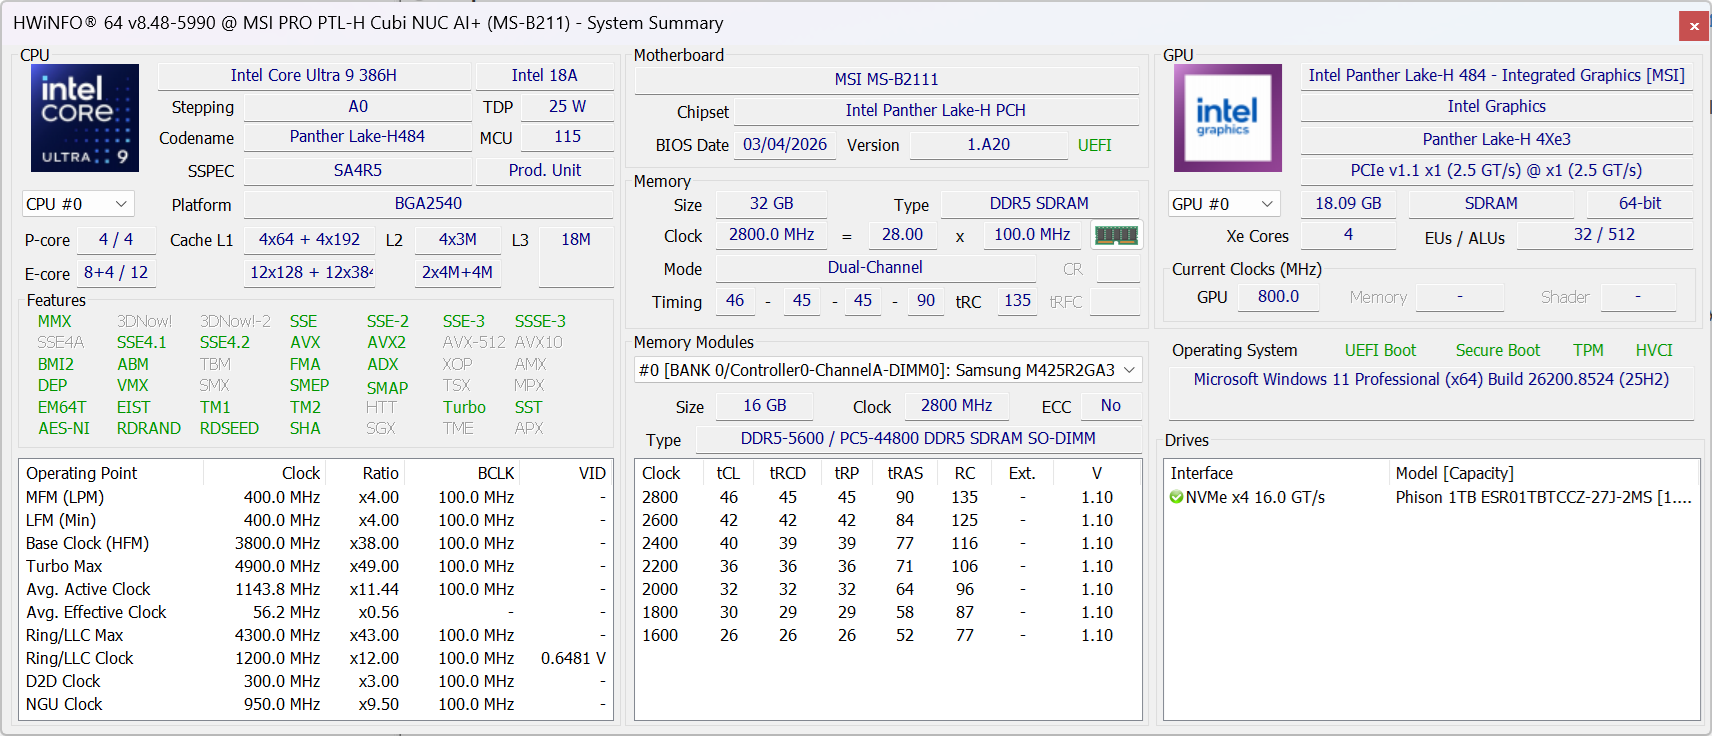
Cubi NUC AI+ 3MG 继去年的 Cubi NUC AI+ 2MG将英特尔 Lunar Lake CPU 换成了更新的 Panther Lake CPU。外部设计也发生了变化,比以前明显更小更轻。
我们的测试机是采用酷睿 Ultra 9 386H CPU 的高端配置,如果配置内存和存储空间,价格约为 1100 美元。幸好还有起价更低的裸机可供选择。此外,还提供配备入门级 Core Ultra 5 和 Core Ultra 7 的 SKU。
Cubi NUC AI+ 3MG 与其他以企业为中心的零售/办公迷你电脑竞争,如 GMK EVO 系列, 华硕 NUC 15 Pro+或 HP EliteBoard G1a AI.
更多微星评论:
规格
案例
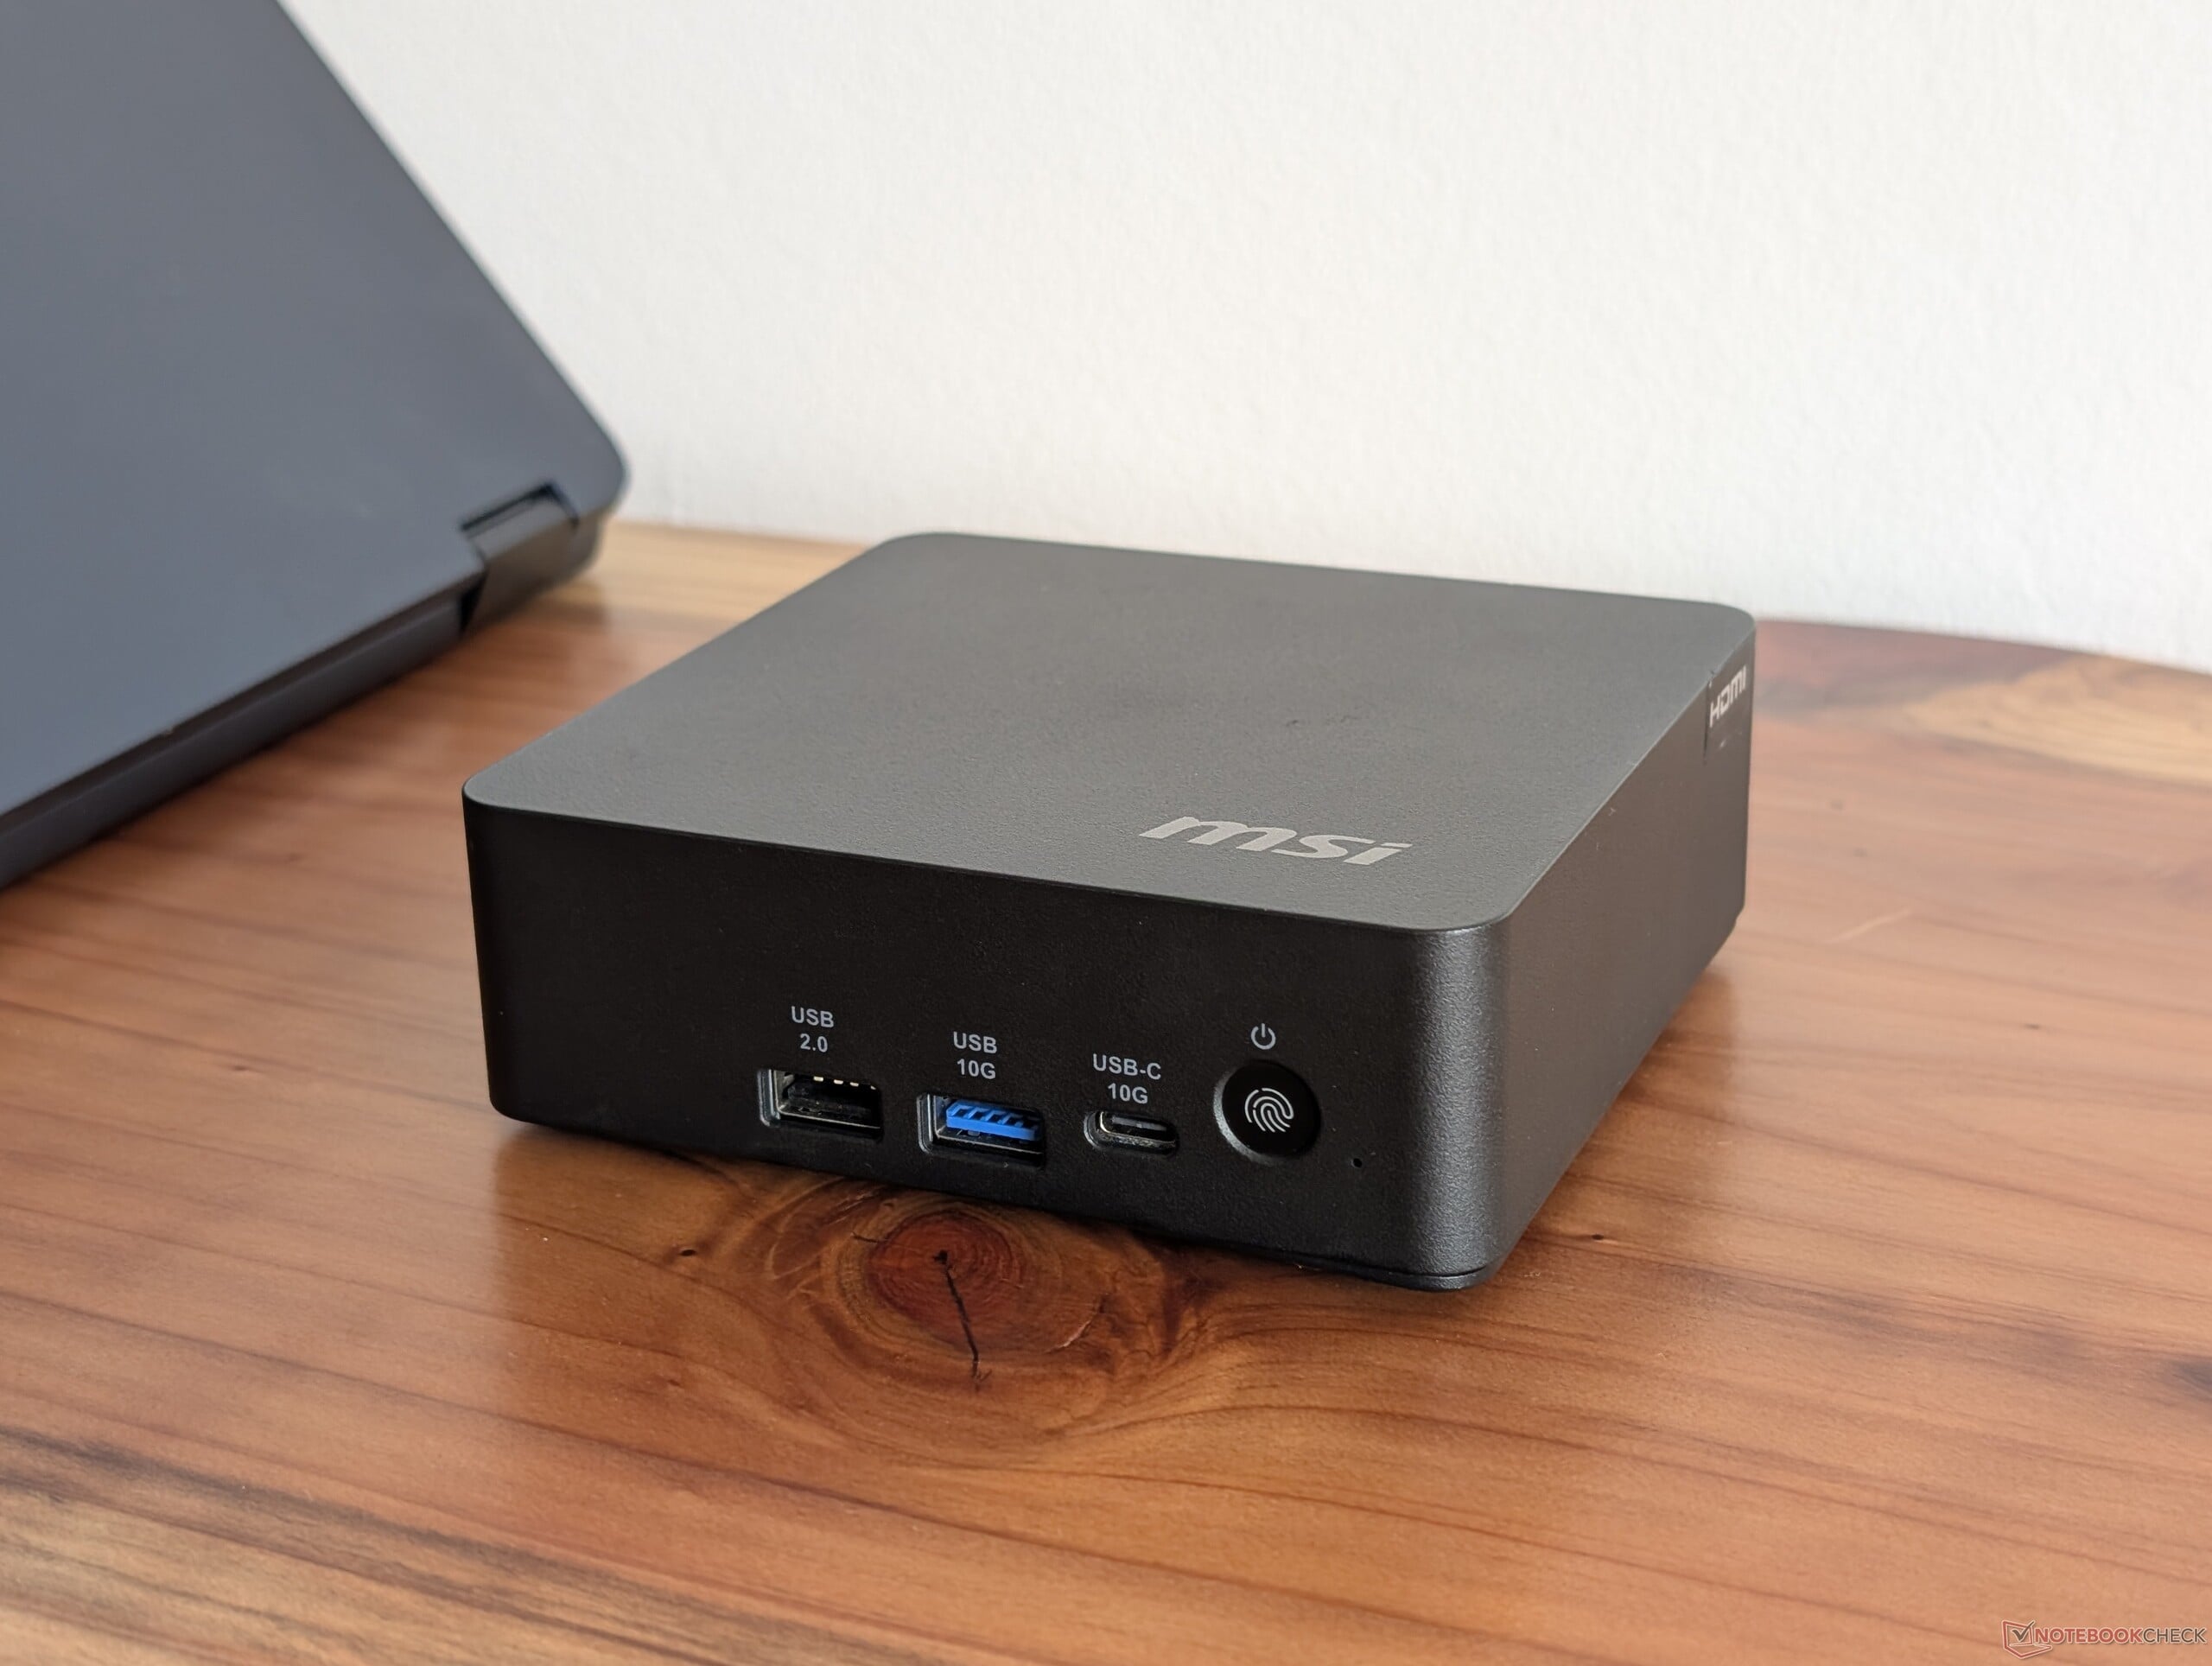
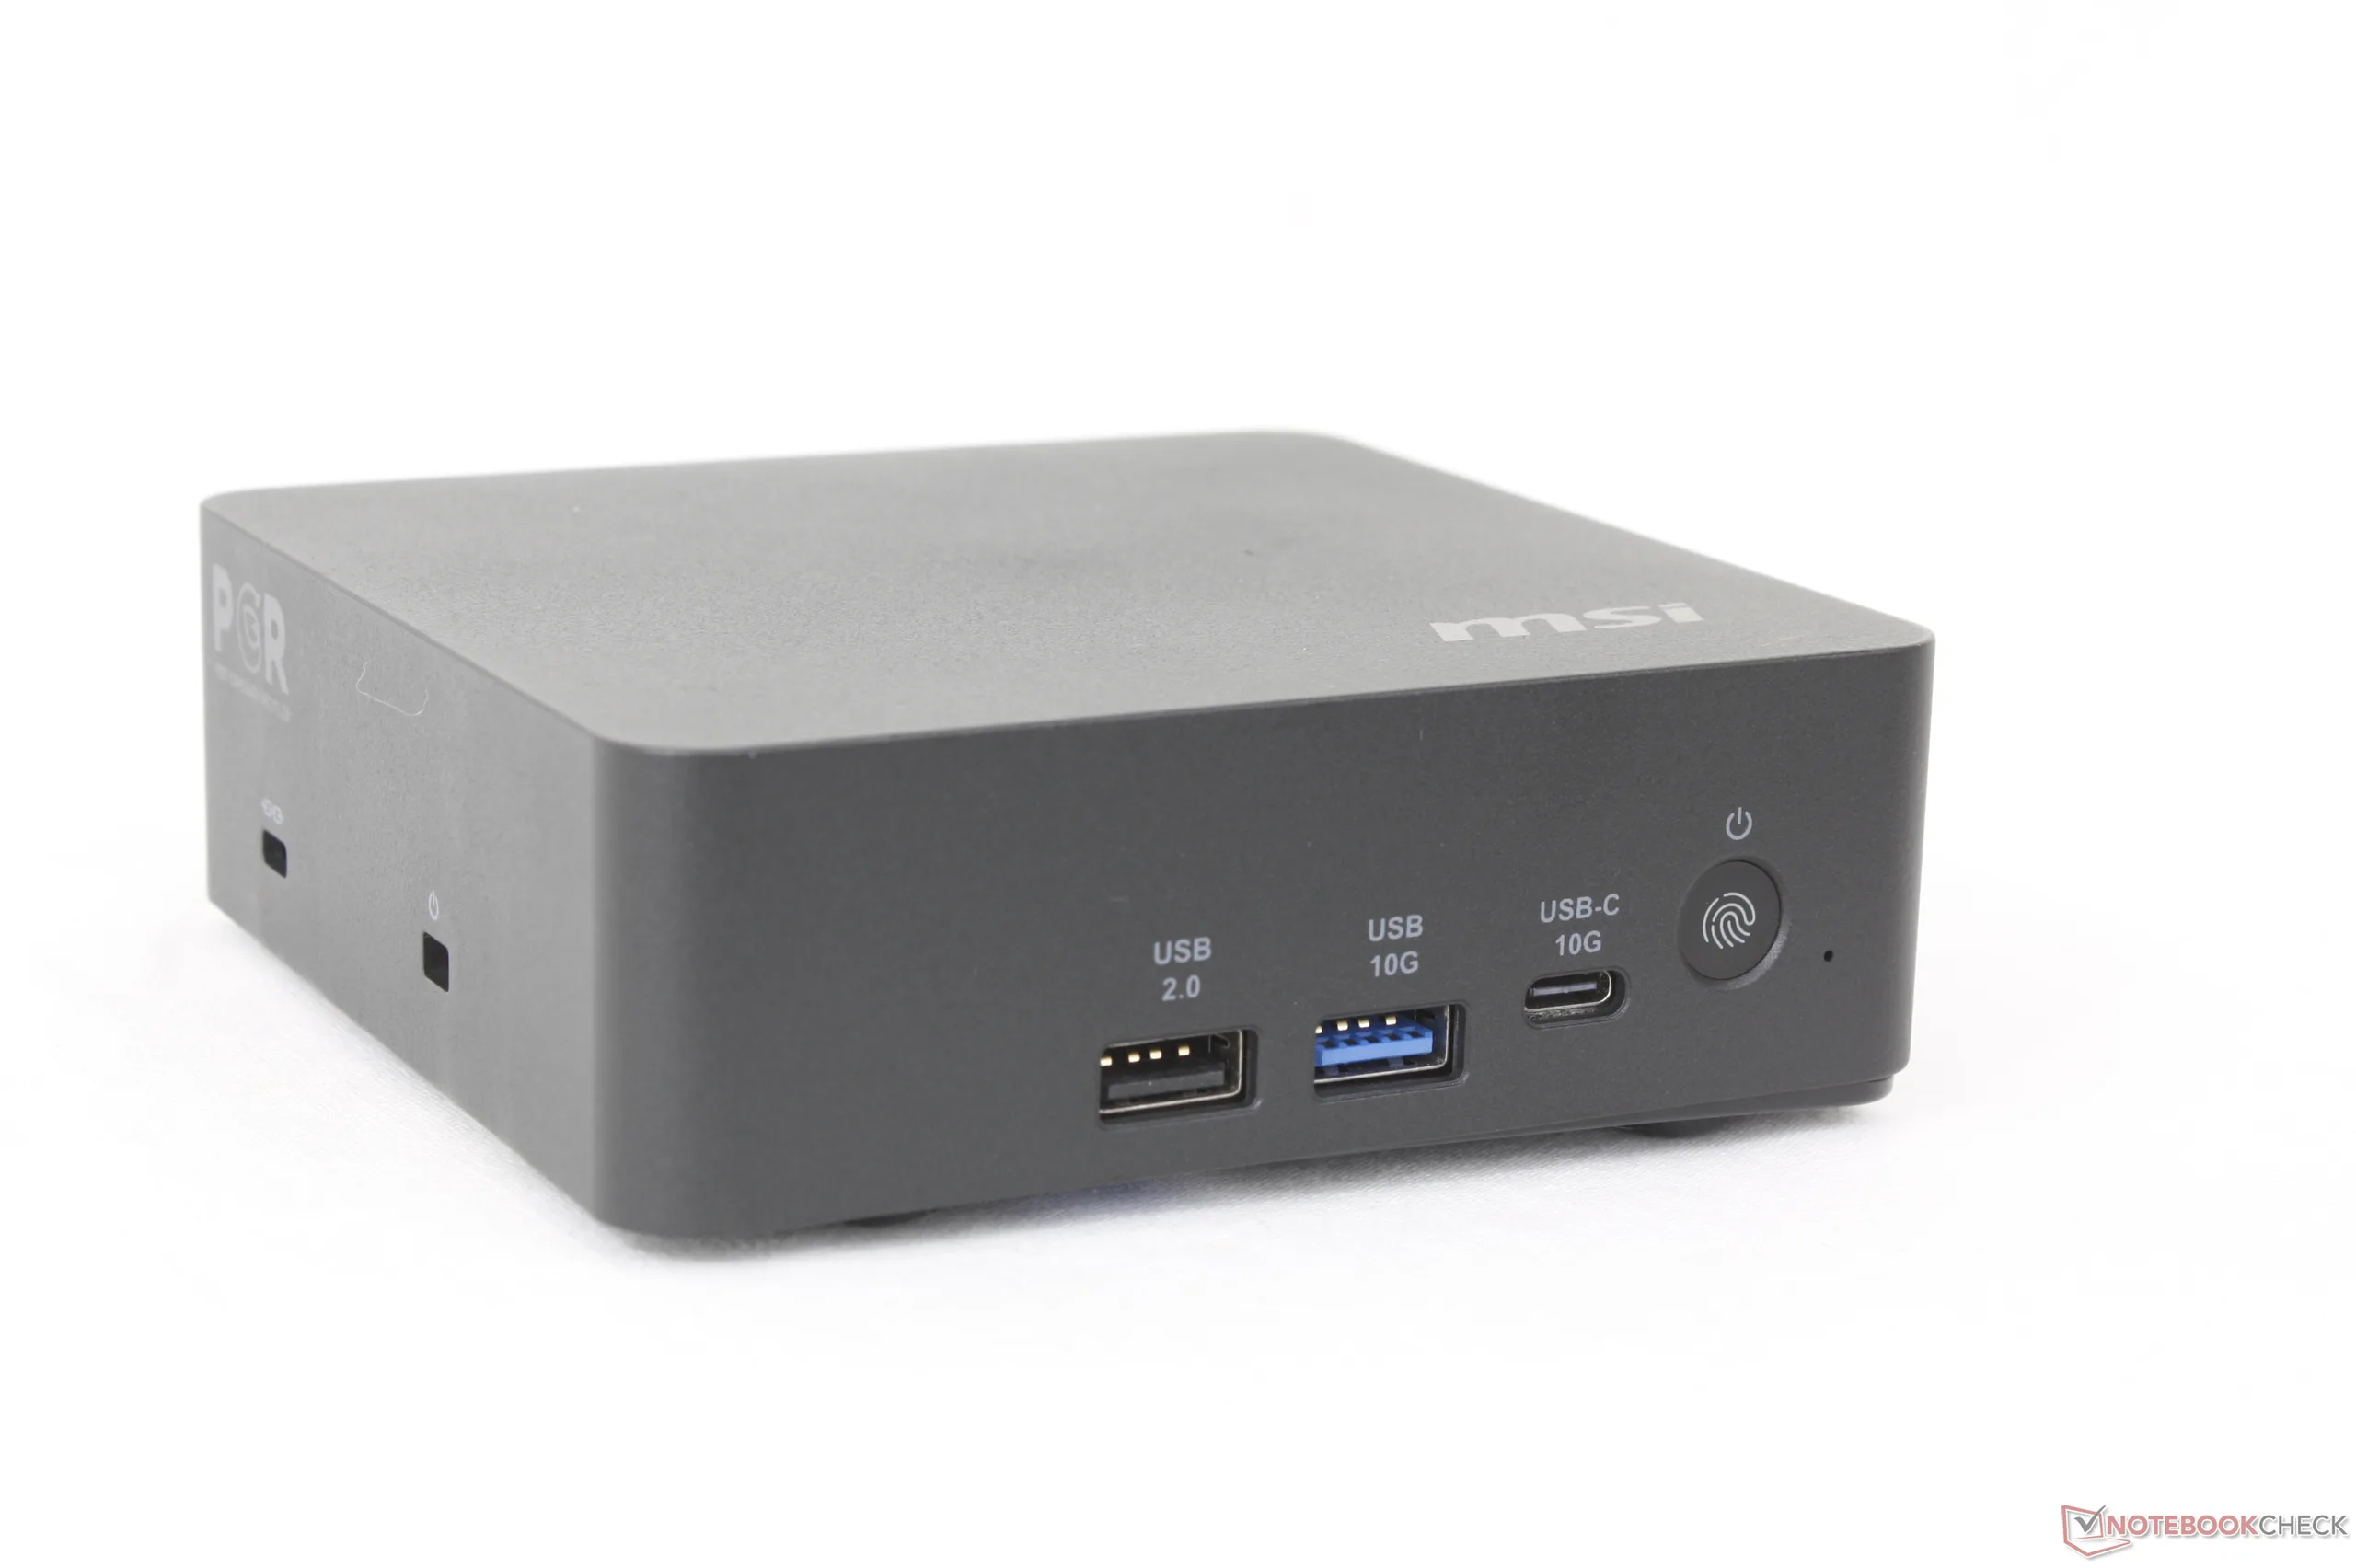
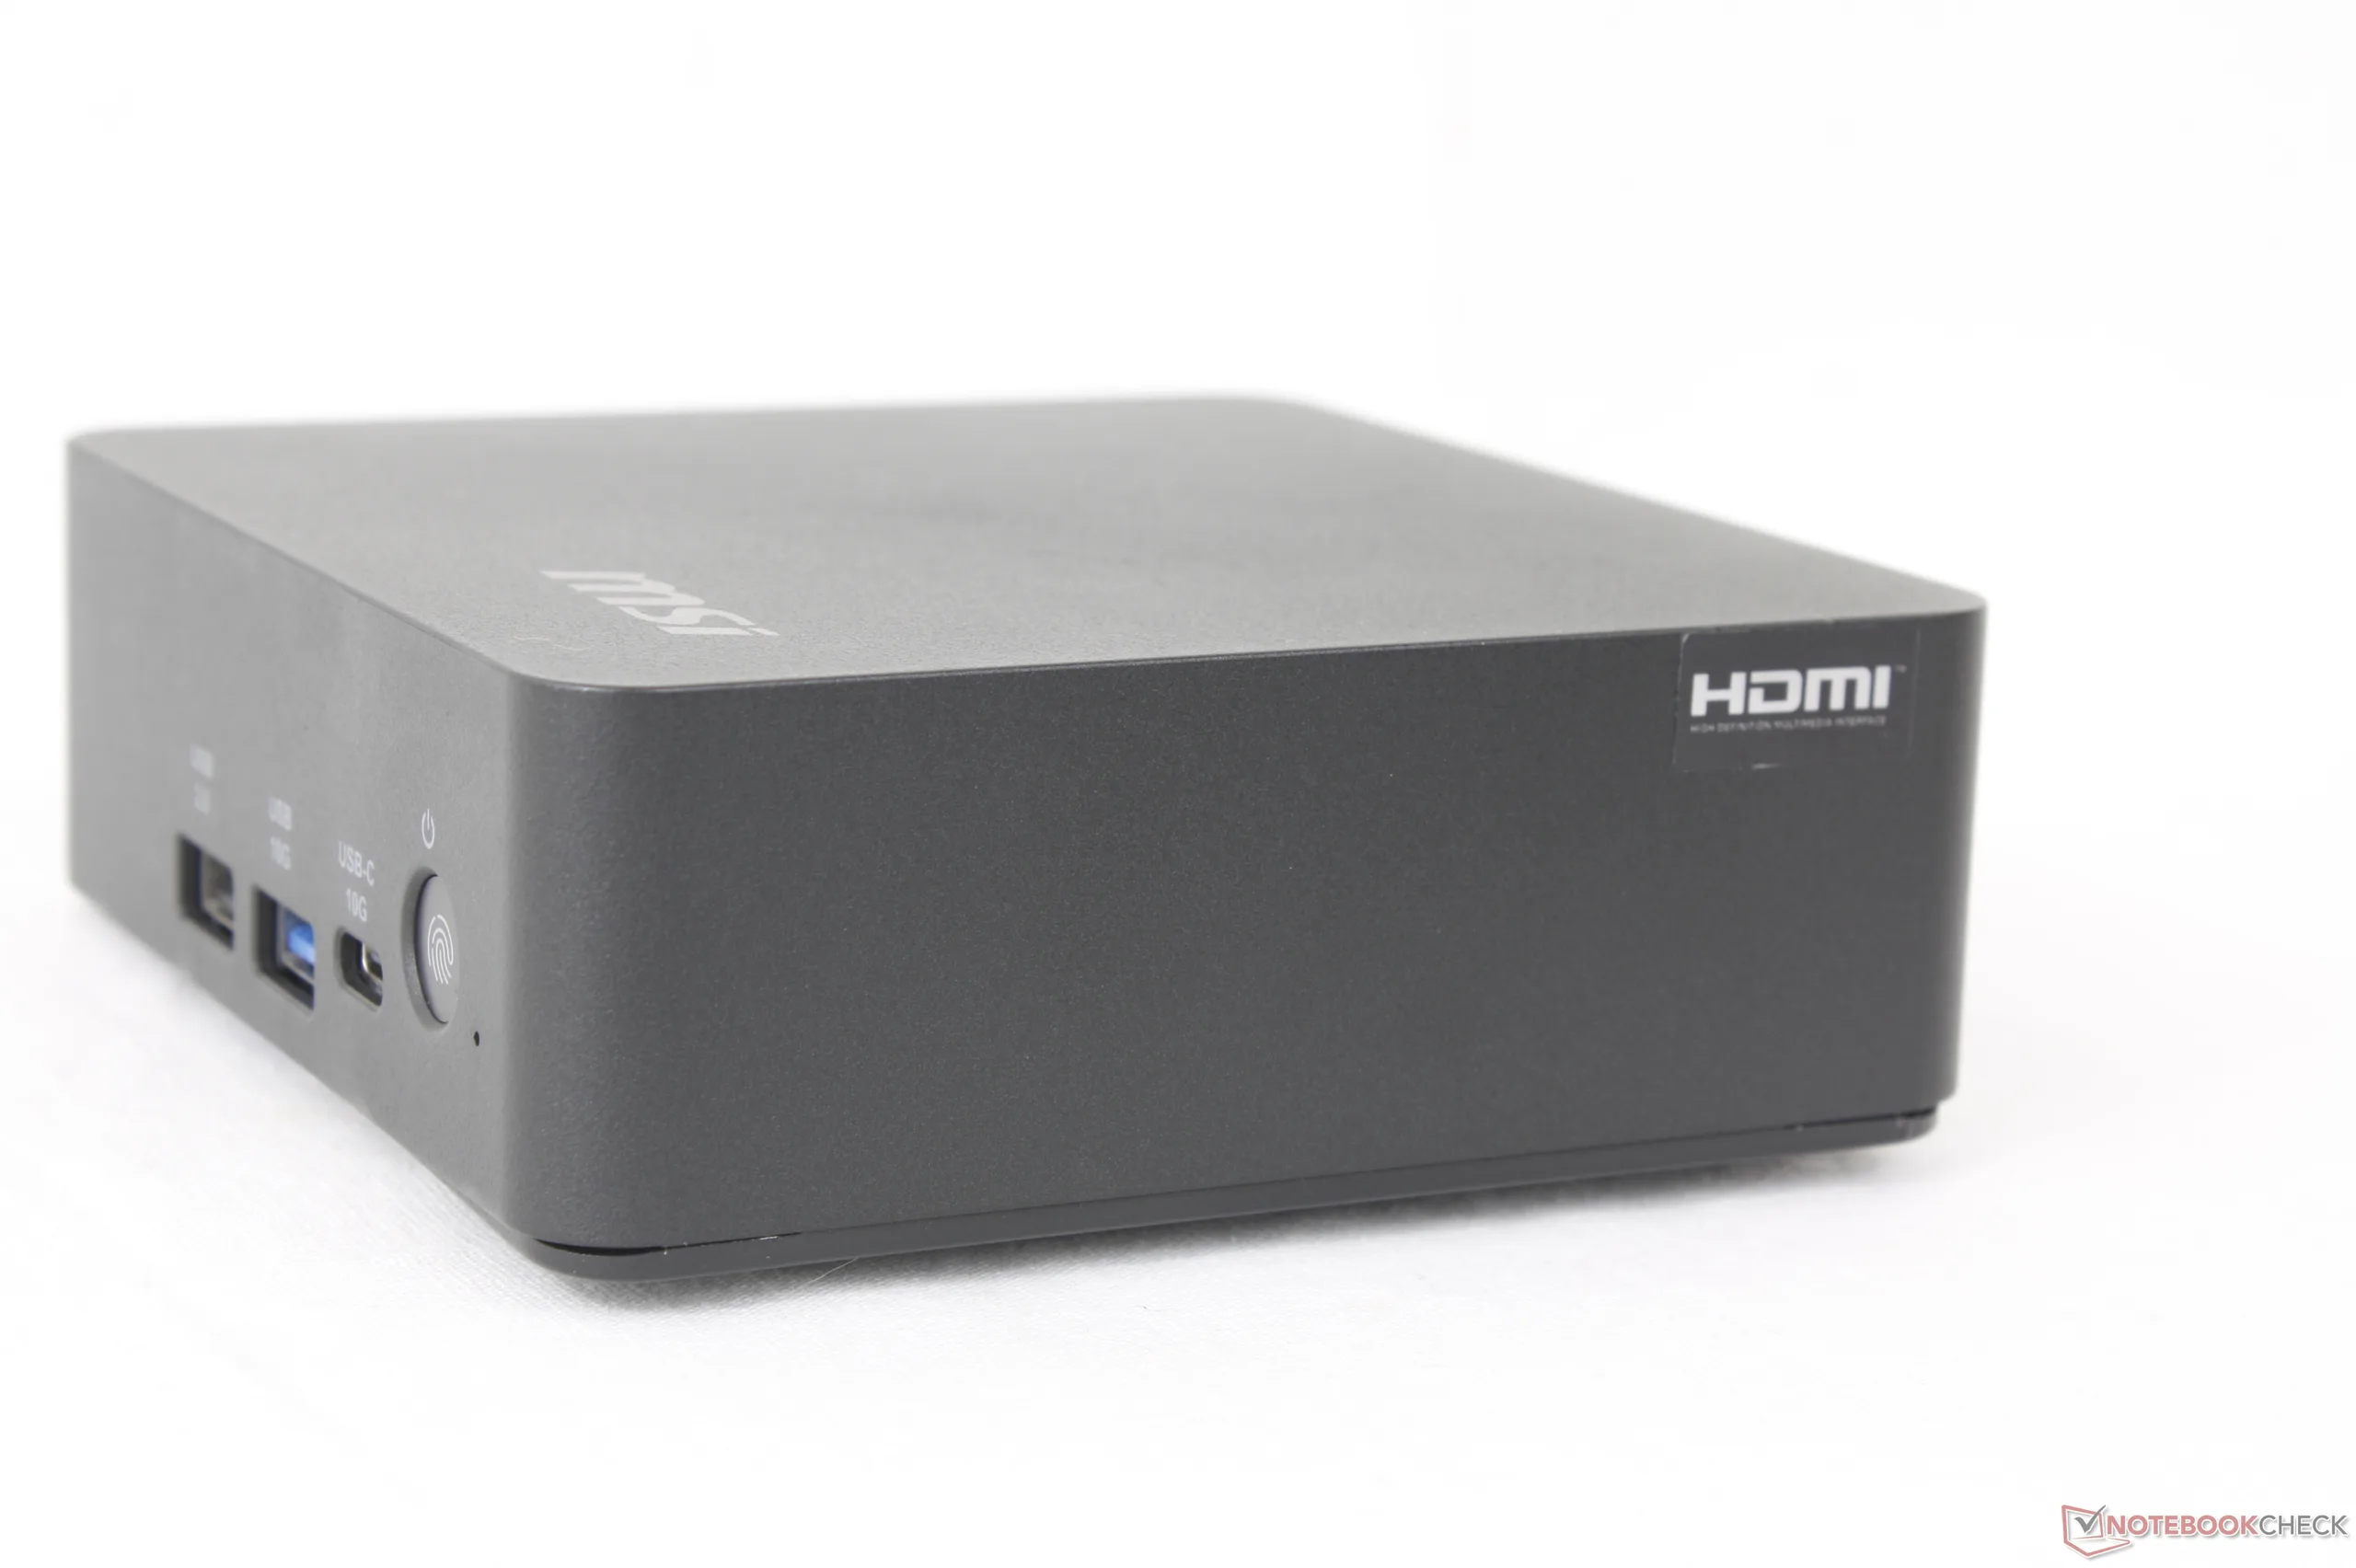
机身采用了相同的黑色塑料材料,尽管重量减轻了 17%,体积缩小了 43%,但给人的印象却与以前相似。也许更令人印象深刻的是,更小的设计并没有带来更多的通风栅或任何重大的外部改动。
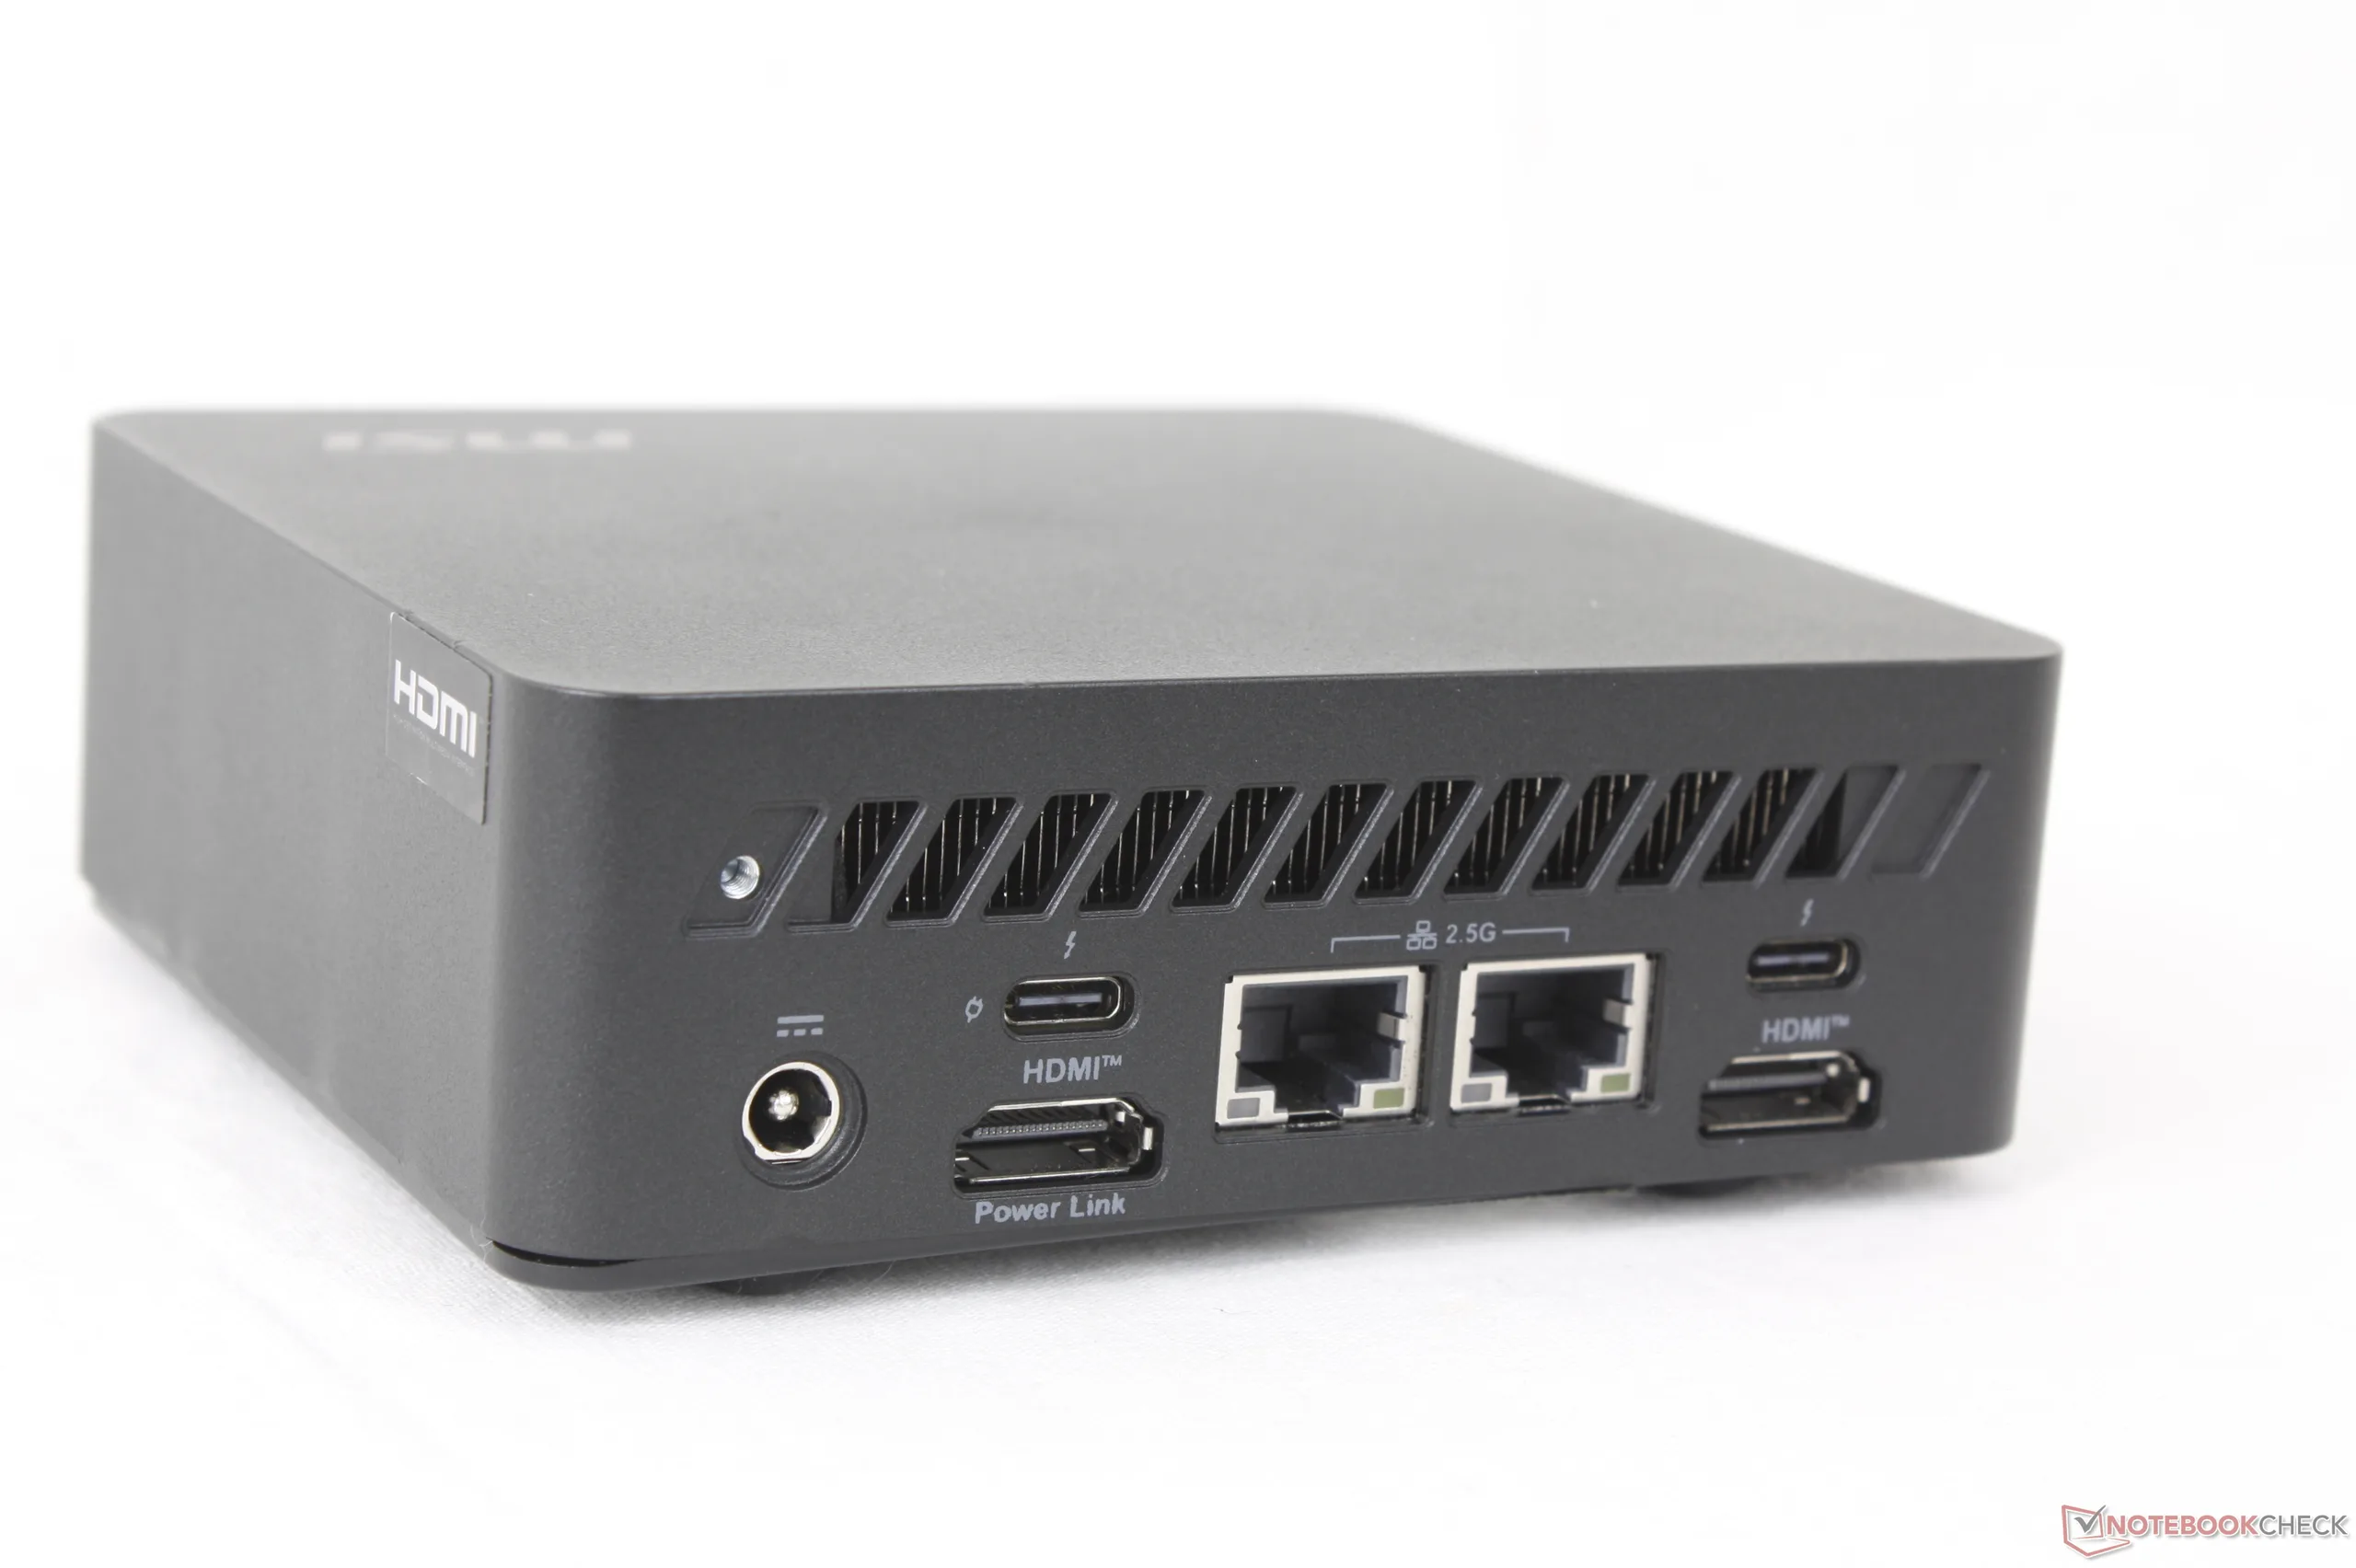
连接性
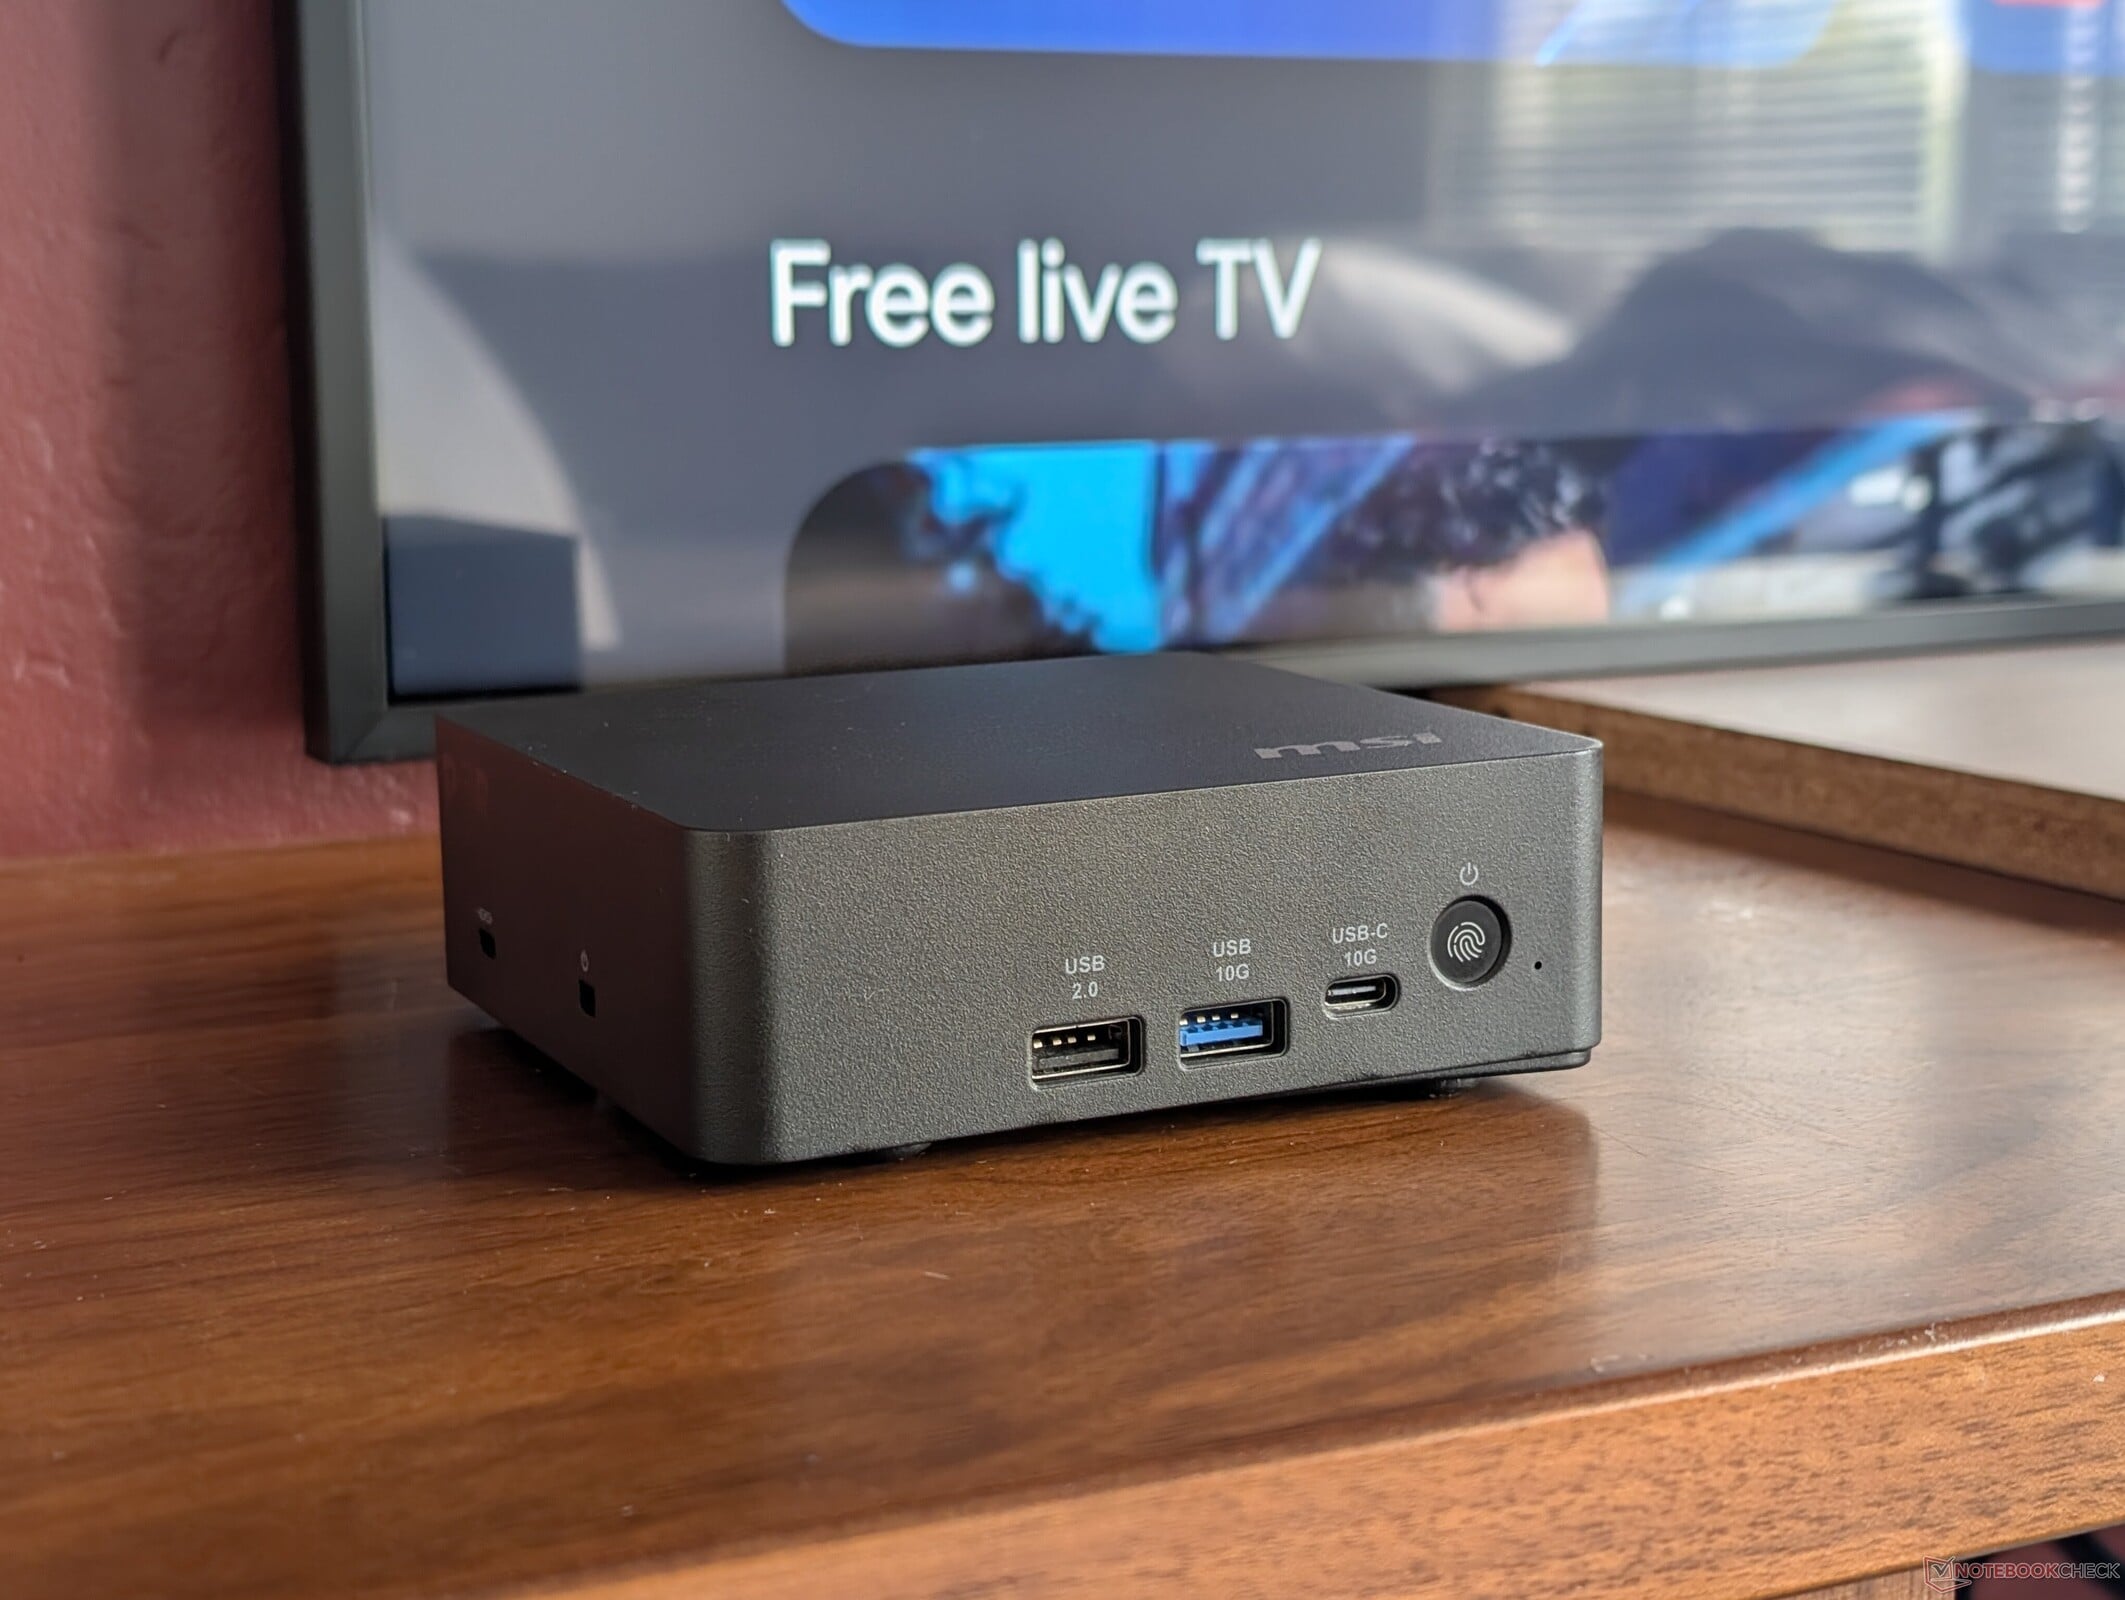
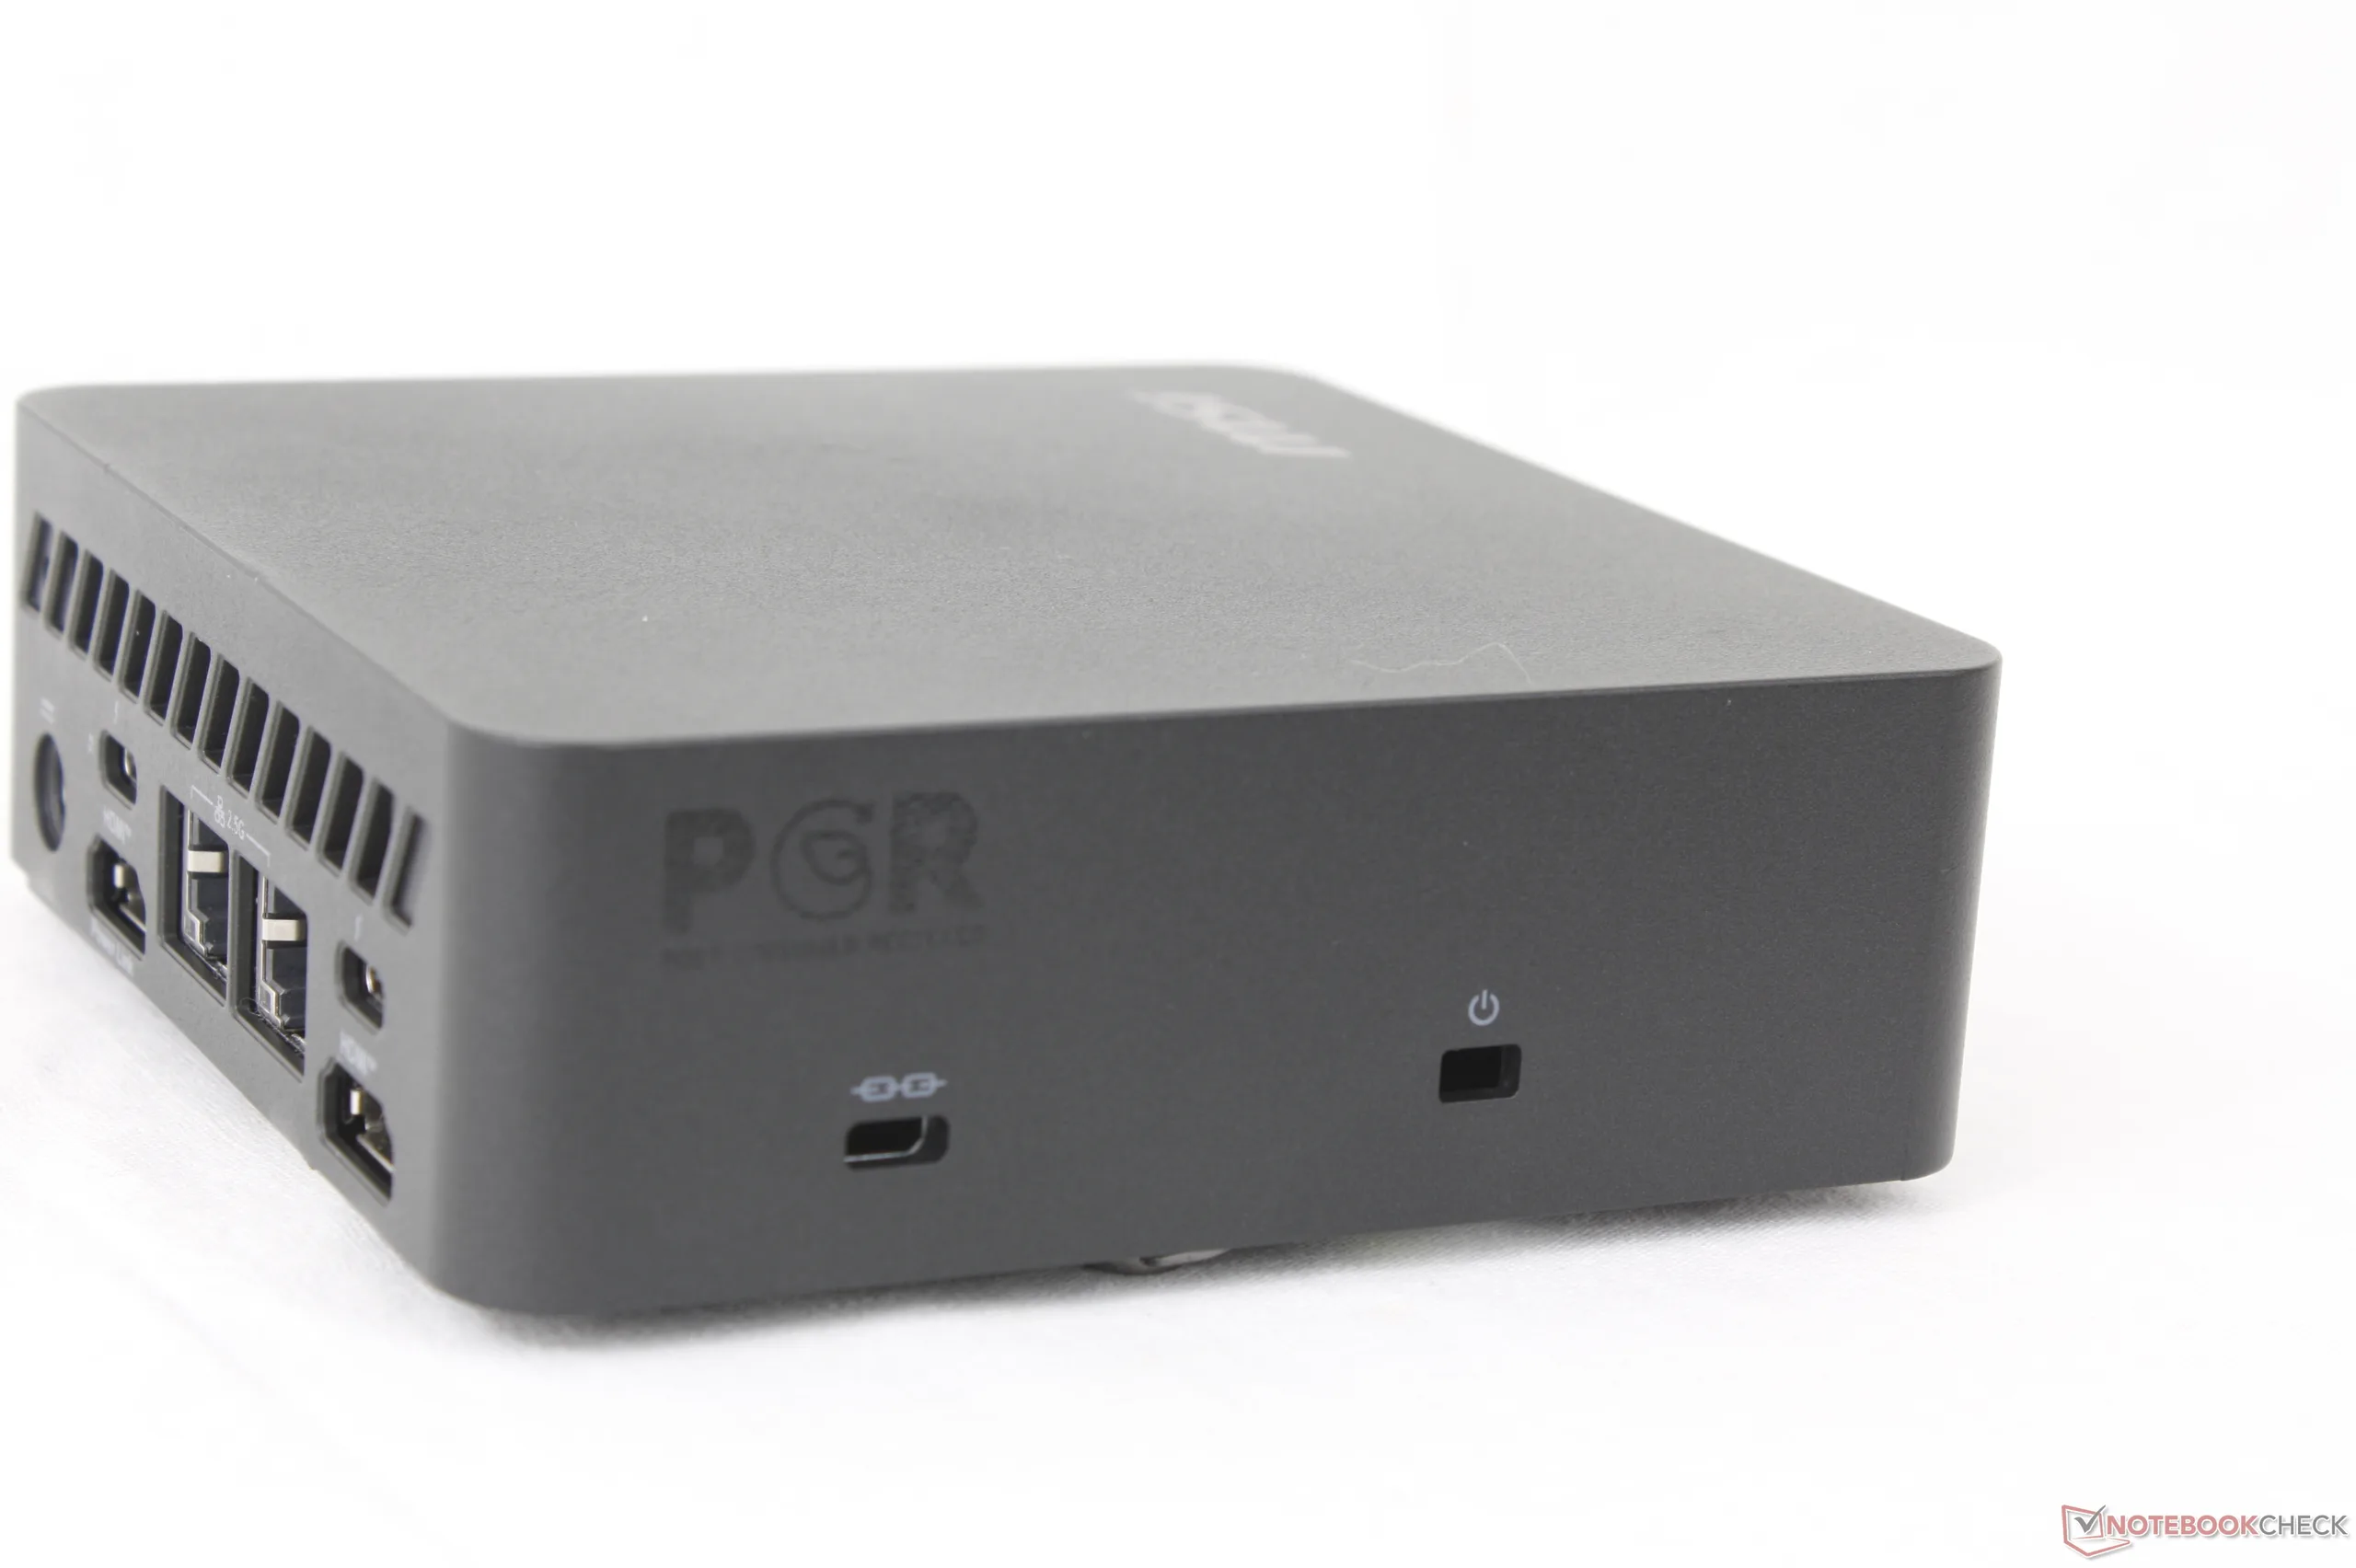
Cubi 3MG 最显著的连接功能是机身侧面的外部电源开关插针。如果迷你 PC 放在办公桌下、桌子后或显示器后等难以触及的地方,该端口允许使用有线电源按钮轻松打开或关闭系统。
与去年的机型相比,端口选项有了很大改进。现在,USB-A 端口减少了,SD 读卡器或音频插孔也没有了,取而代之的是更多的 HDMI 端口和 USB-C 端口。
请记住,两个 Thunderbolt 4 端口中只有一个支持 Power Delivery。如果你有一个兼容的 USB-C 交流适配器,而不是随附的桶装交流适配器,这个端口就可以用来为迷你 PC 供电。
交流
无线局域网模块从 Wi-Fi 6E 升级到 Wi-Fi 7,支持蓝牙 6.0。
| Networking | |
| iperf3 transmit AXE11000 | |
| MSI Cubi NUC AI+ 3MG | |
| Asus NUC 15 Pro+ | |
| GMK EVO-T1 | |
| MSI Cubi NUC AI+ 2MG | |
| GMK NucBox K16 | |
| Geekom A5 Pro | |
| MSI Cubi NUC 1M | |
| iperf3 receive AXE11000 | |
| Asus NUC 15 Pro+ | |
| GMK EVO-T1 | |
| MSI Cubi NUC AI+ 3MG | |
| MSI Cubi NUC AI+ 2MG | |
| Geekom A5 Pro | |
| GMK NucBox K16 | |
| MSI Cubi NUC 1M | |
| iperf3 transmit AXE11000 6GHz | |
| GMK NucBox K16 | |
| MSI Cubi NUC AI+ 3MG | |
| Asus NUC 15 Pro+ | |
| MSI Cubi NUC 1M | |
| MSI Cubi NUC AI+ 2MG | |
| iperf3 receive AXE11000 6GHz | |
| GMK NucBox K16 | |
| MSI Cubi NUC AI+ 3MG | |
| MSI Cubi NUC AI+ 2MG | |
| Asus NUC 15 Pro+ | |
| MSI Cubi NUC 1M | |
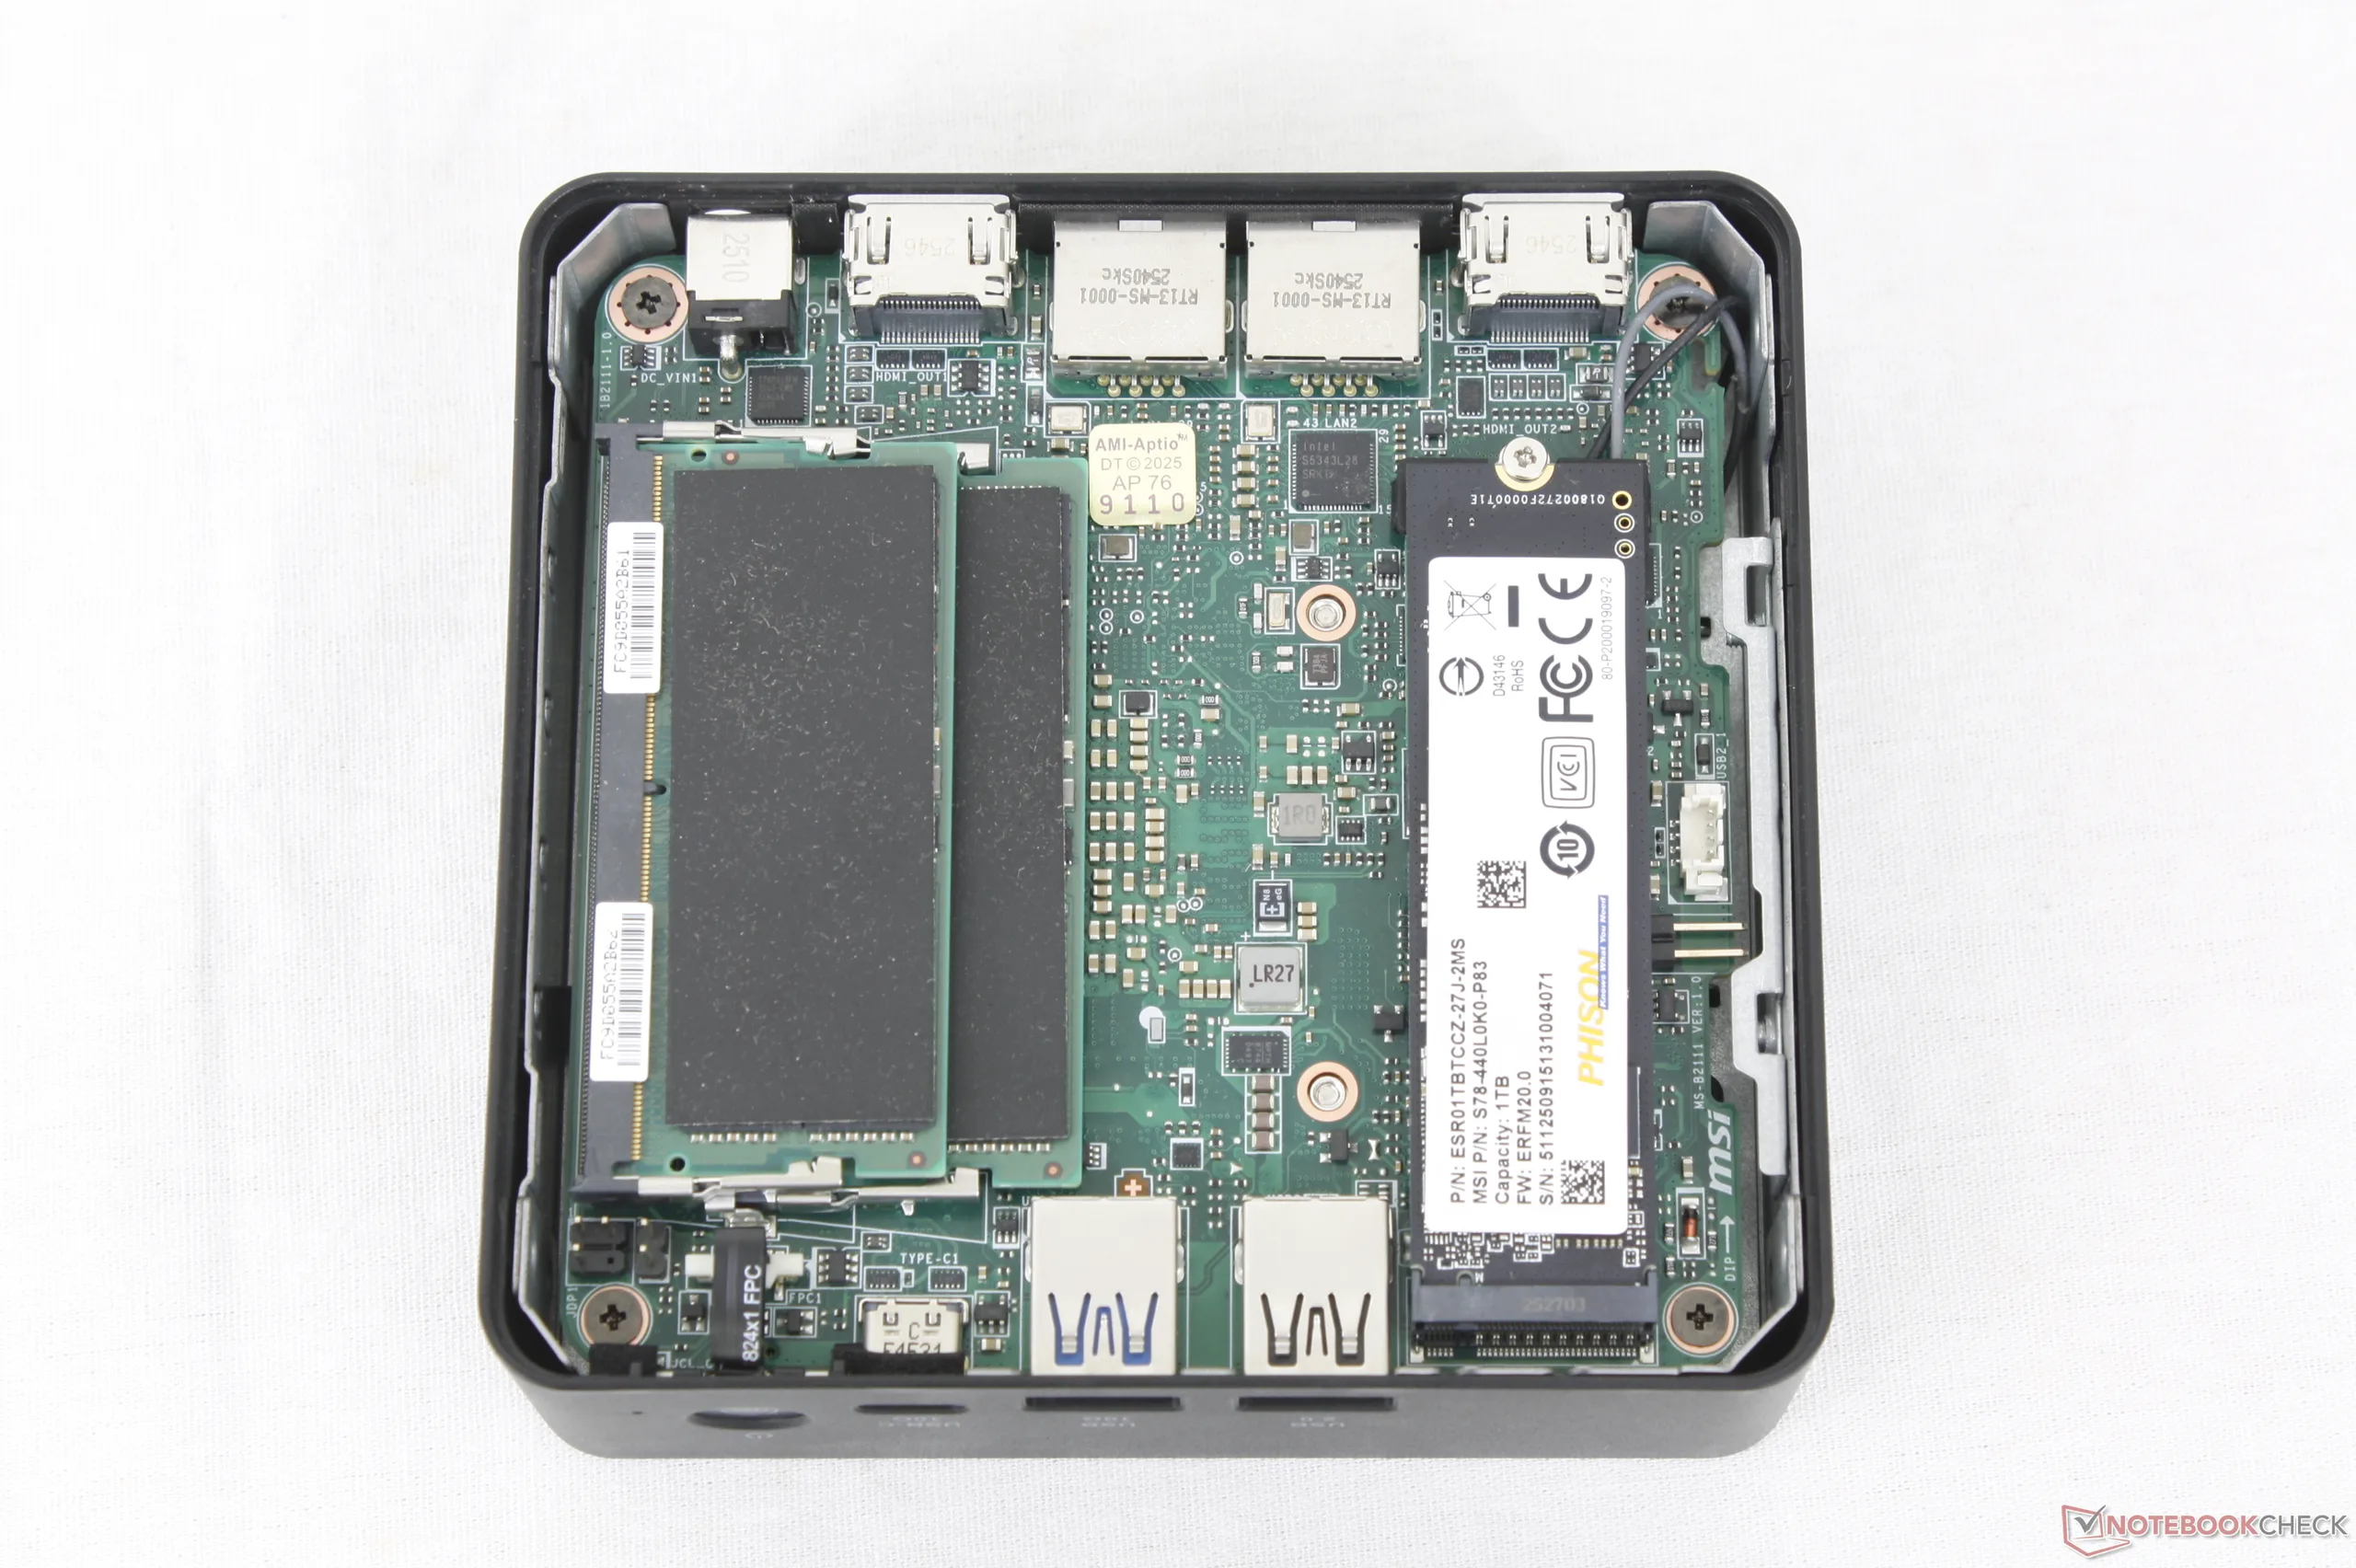
维护
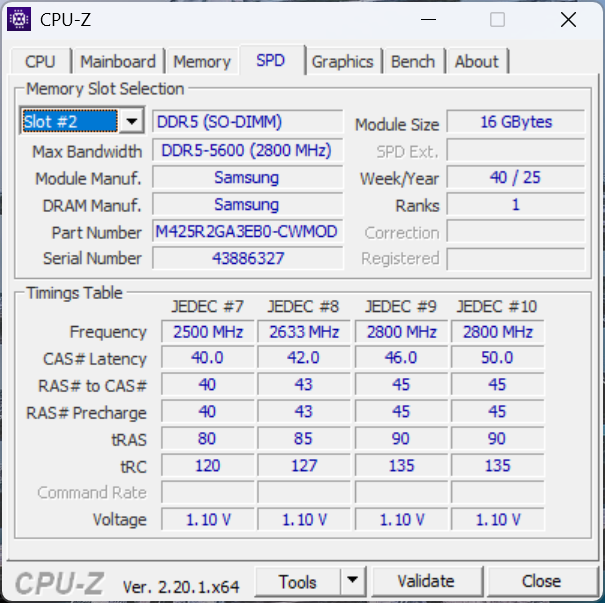
底部面板通过一个简单的拇指螺钉固定,无需任何工具即可轻松维修。进入内部后,用户可以直接访问 M.2 2280 固态硬盘插槽、可拆卸的 M.2 WLAN 模块和两个 DDR5 SODIMM 插槽。
配件和保修
零售包装盒中包括一个外置电源开关,用于连接上述电源开关引脚。不过,外接开关的长度并不长,只有约 47 厘米。
性能
测试条件
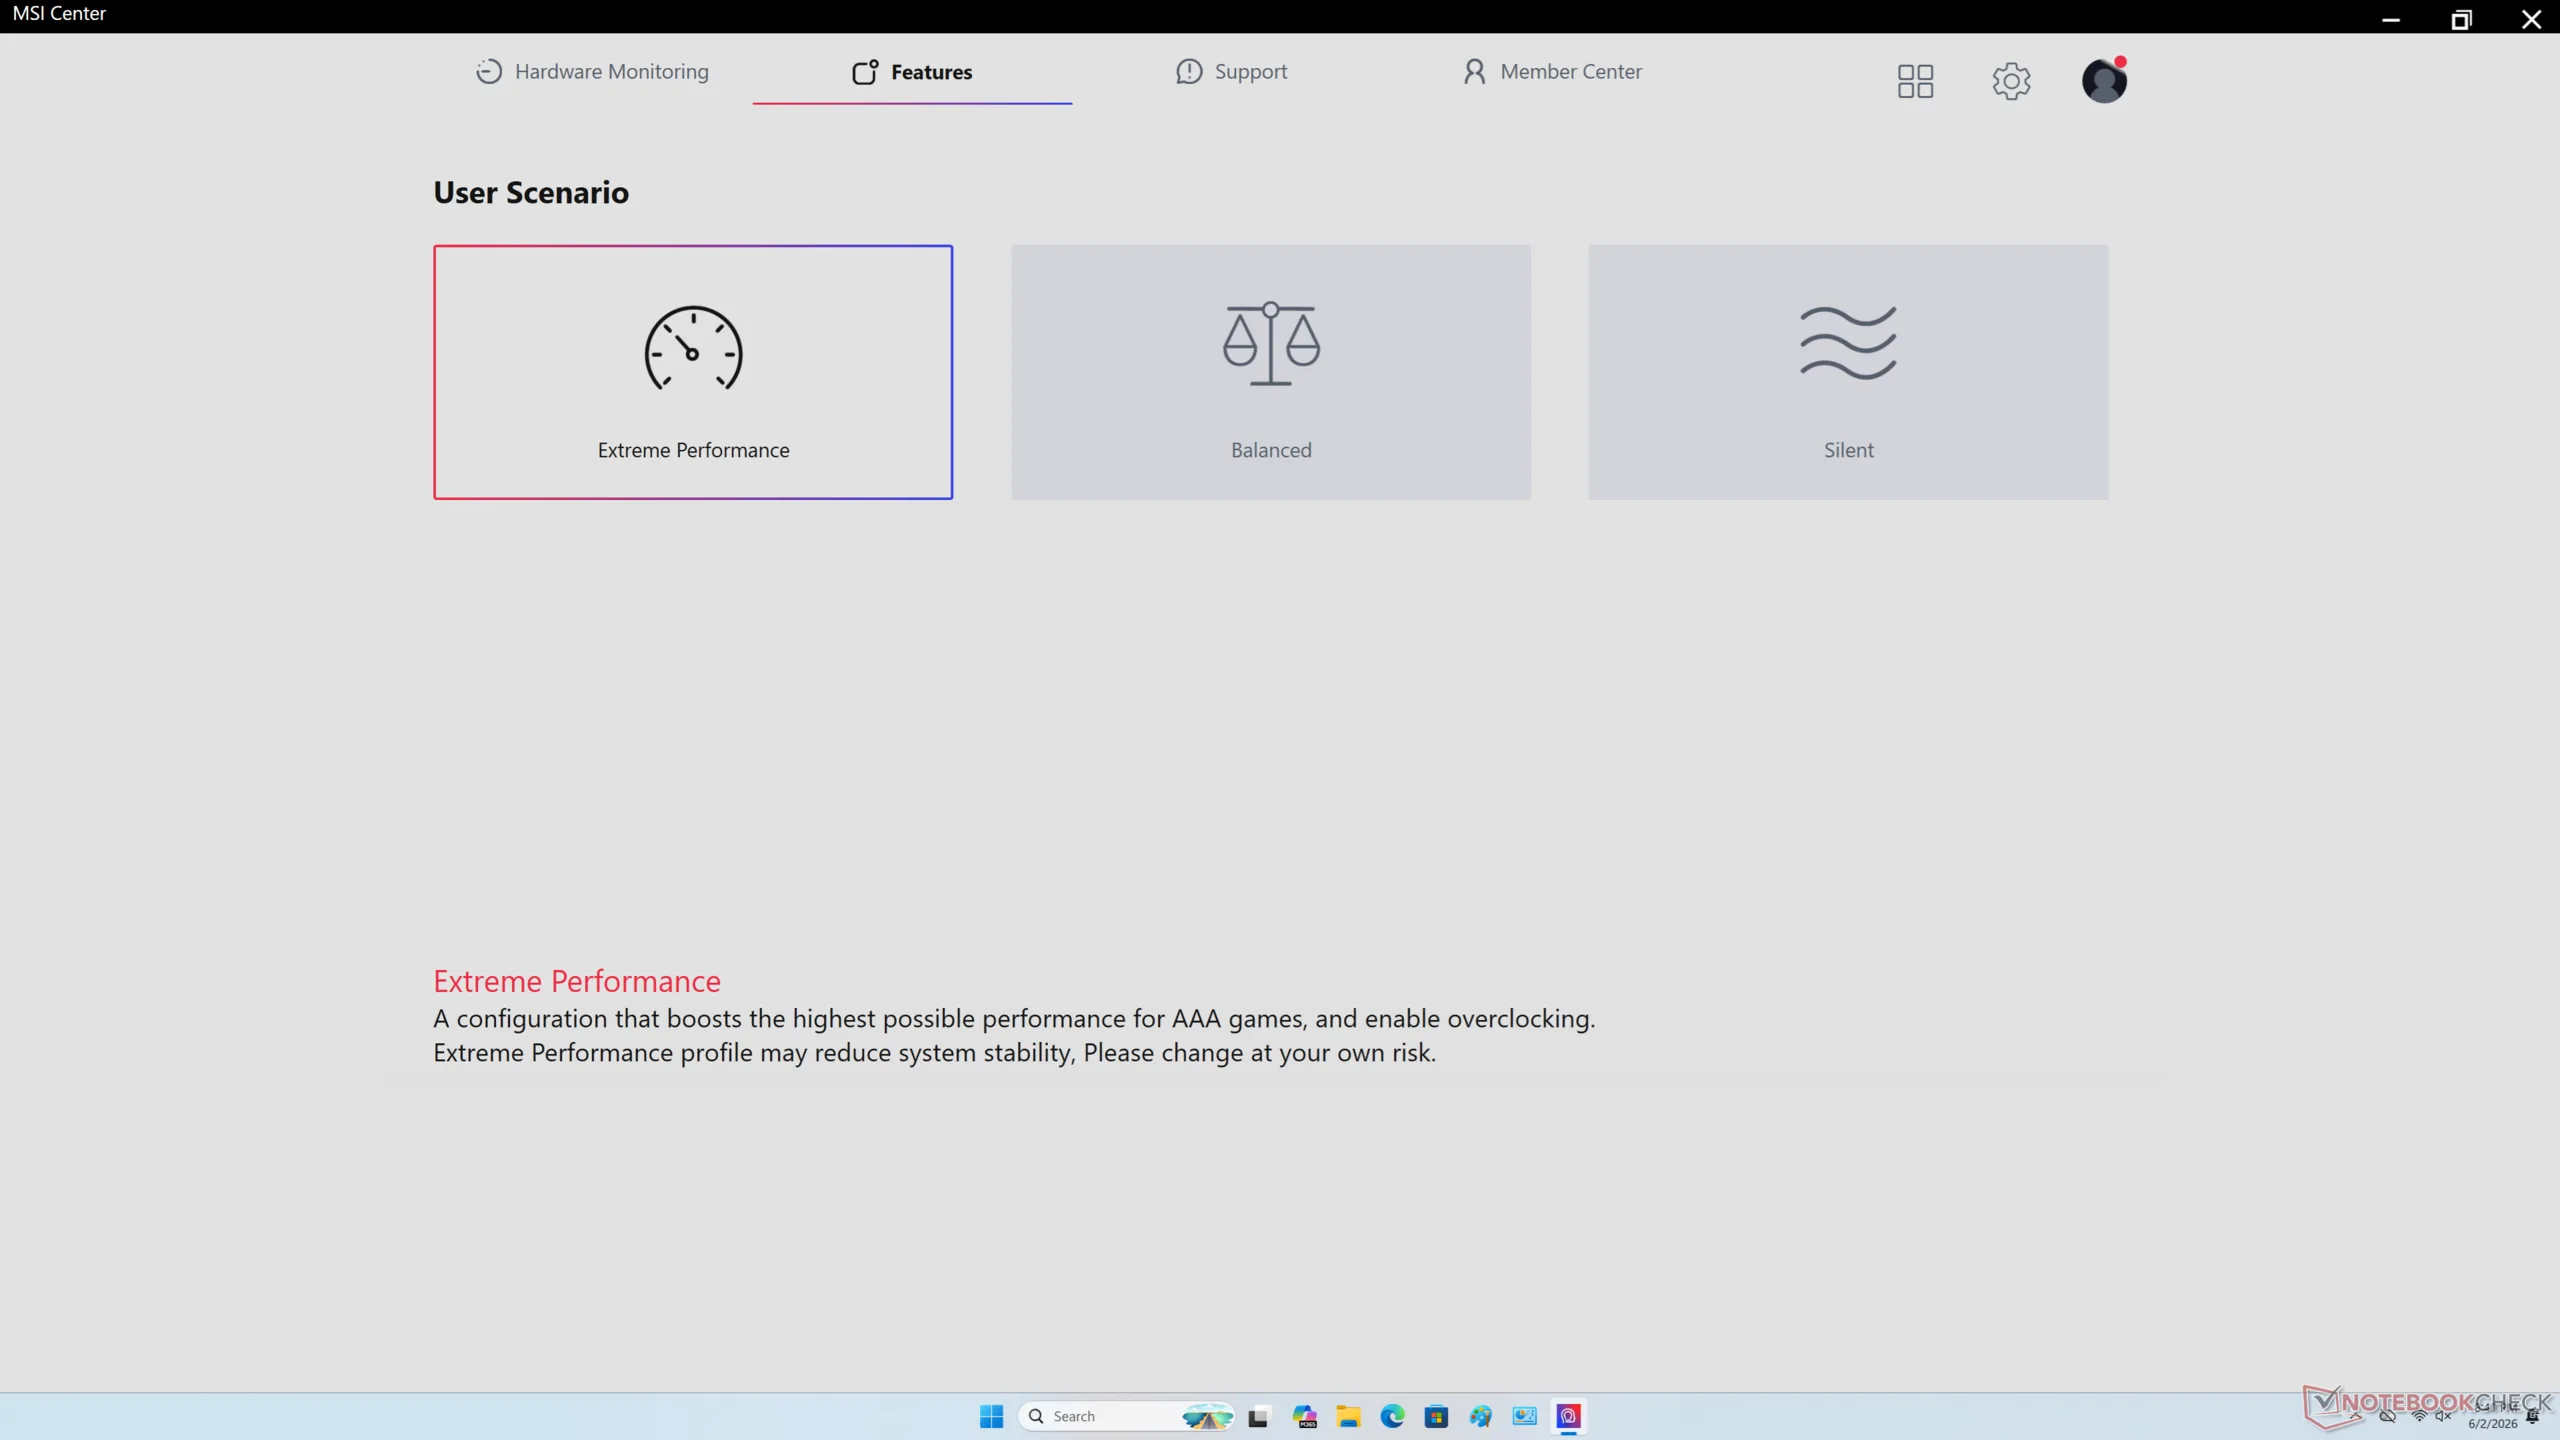
在运行以下基准测试之前,我们将 MSI Center 设置为性能模式。
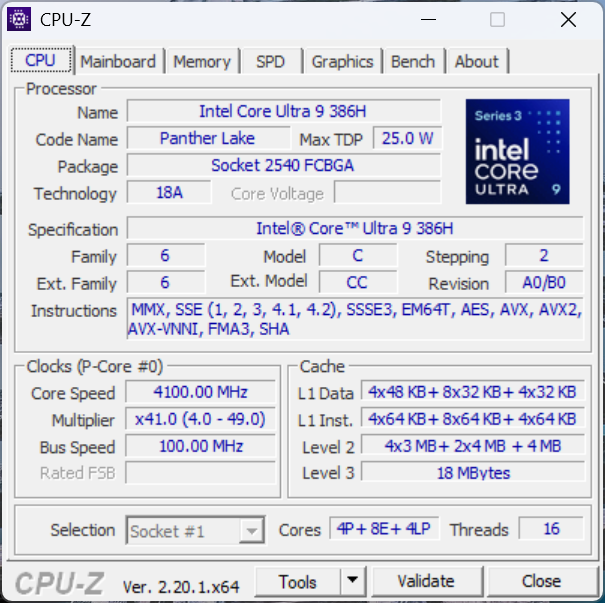
处理器
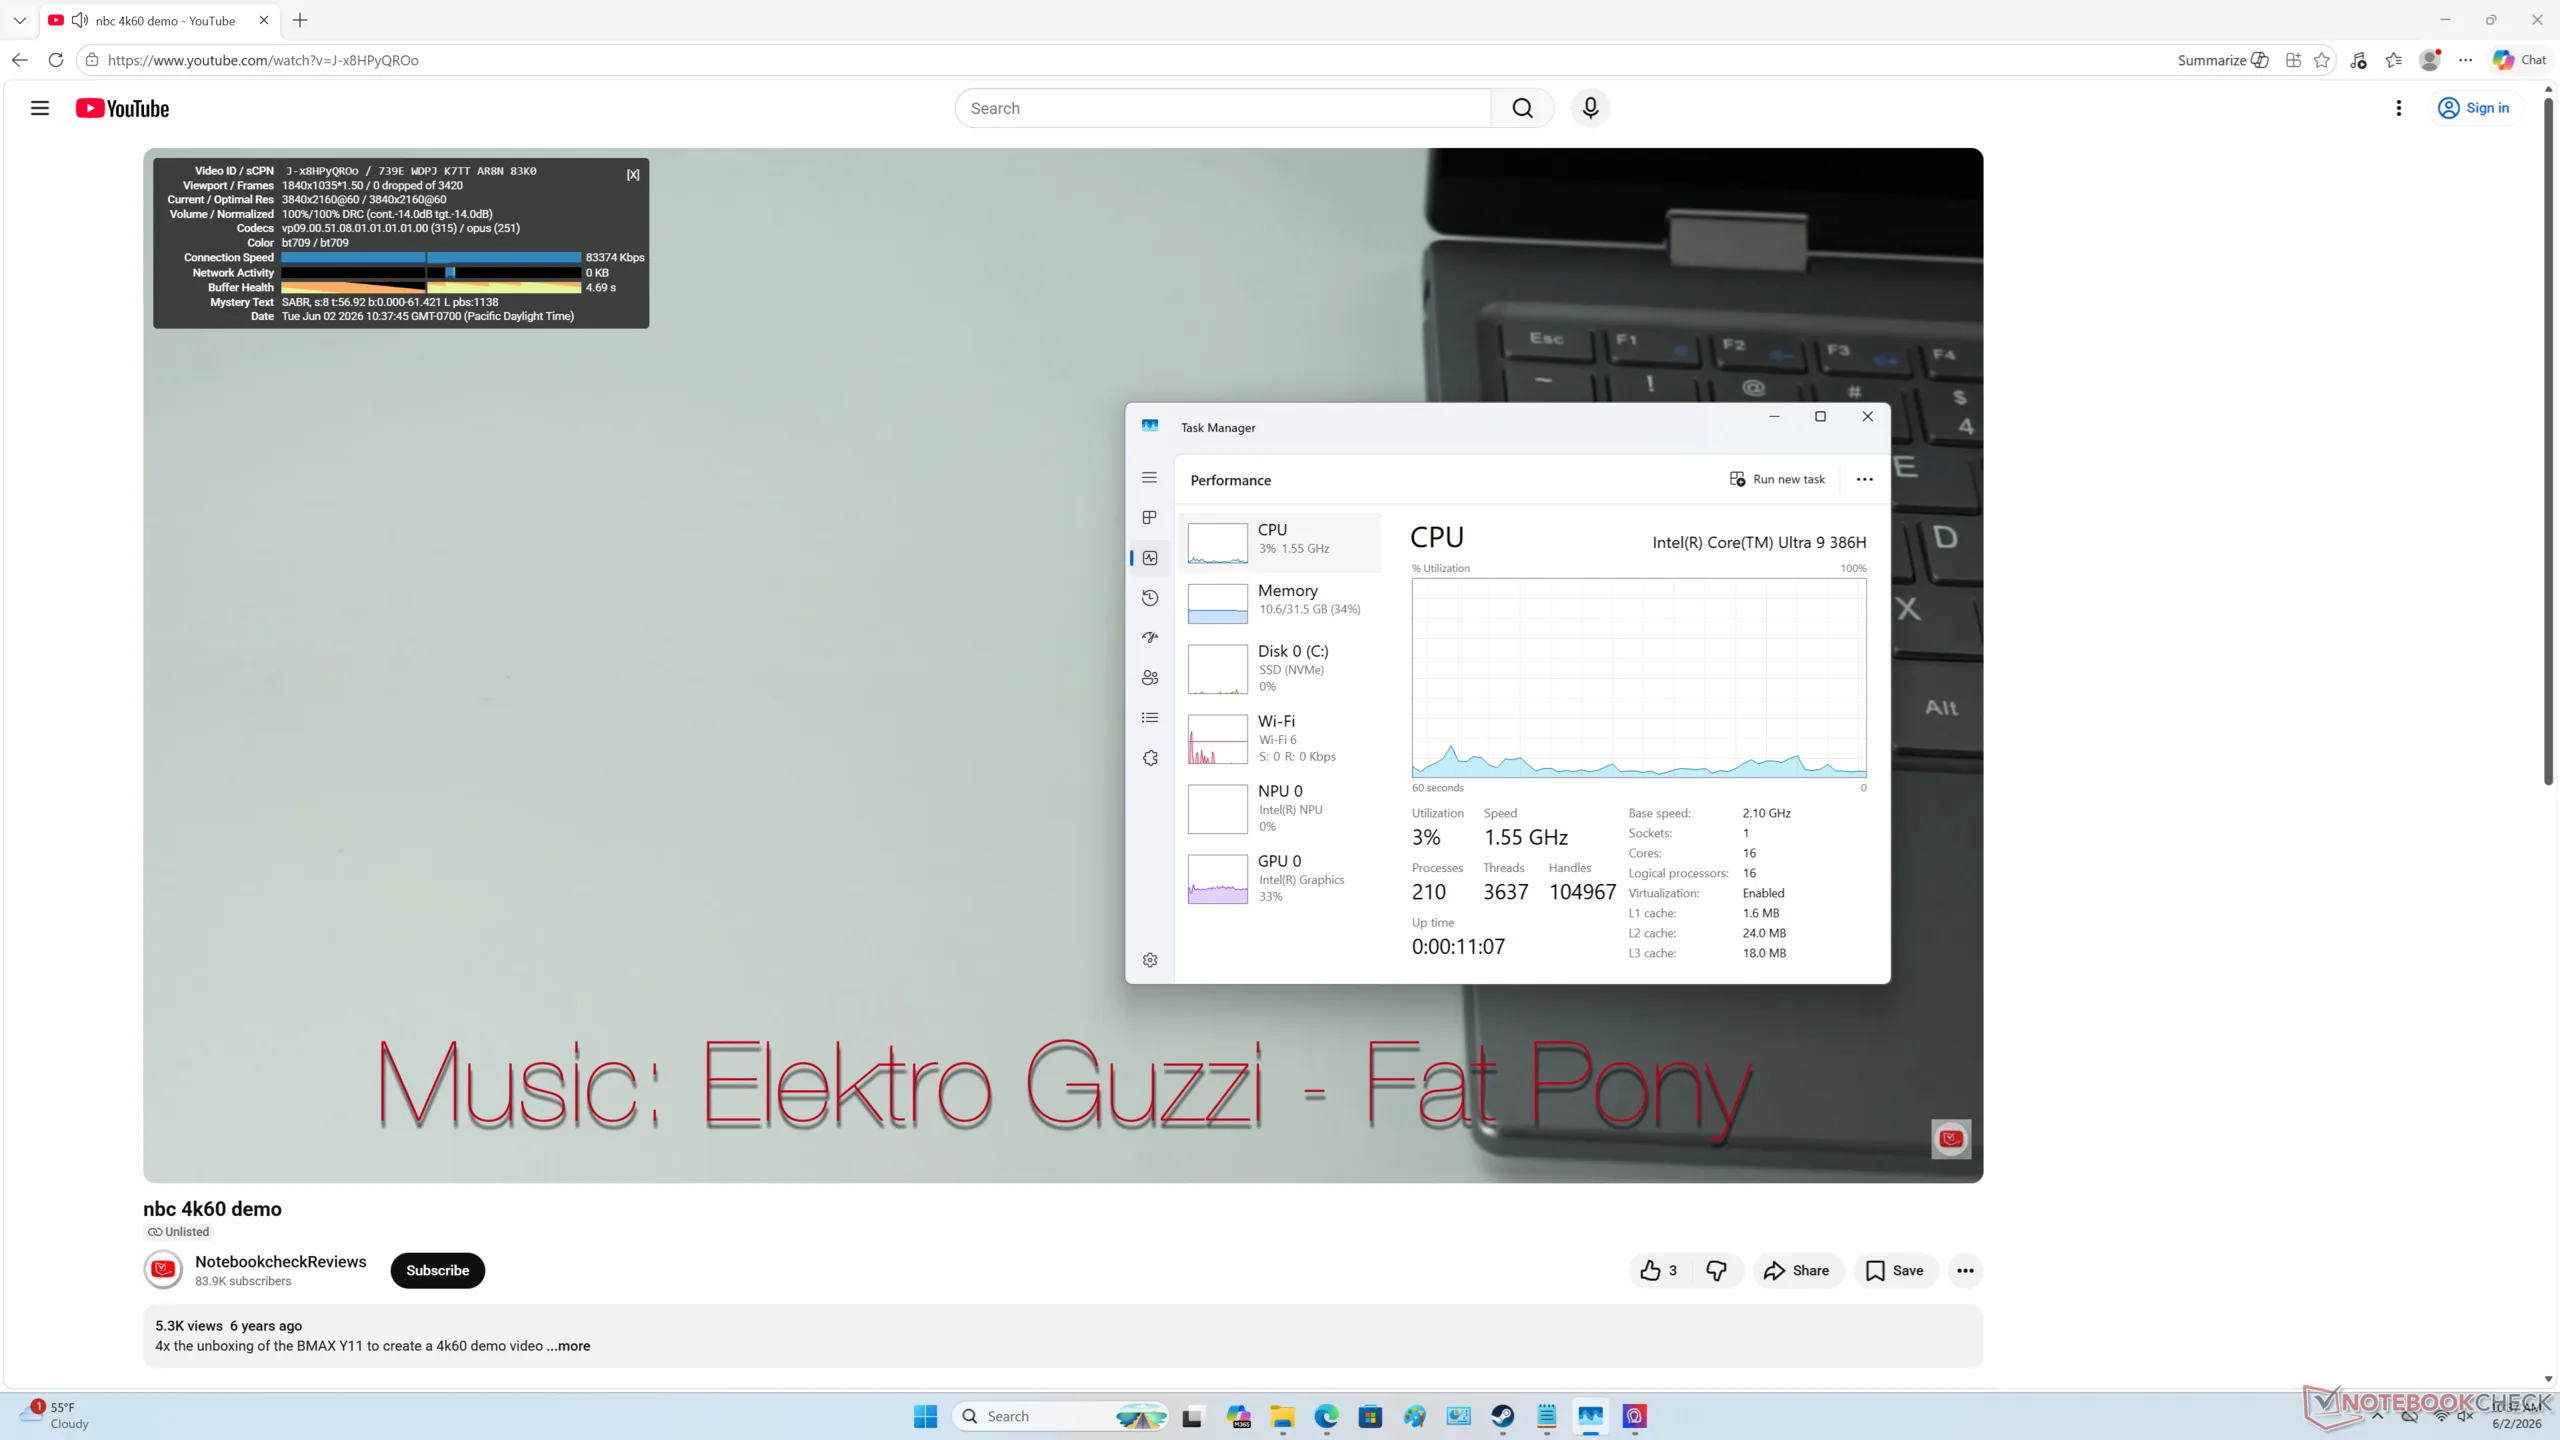
Cubi AI 3MG 配备了相同的 Core Ultra 9 386H处理器。不过,由于 Turbo Boost 的潜力有限,微星的原始多线程性能要慢 18%。例如,在循环运行 CineBench R15 xT 时,最初的 2792 分将在几轮后降至 2380 分,如下图所示。
不过,原始性能比去年的 Cubi AI+ 2MG 快了 50% 至 60%,即使考虑到任何节流因素。
Cinebench R15 多回路运行
Cinebench R23: Multi Core | Single Core
Cinebench R20: CPU (Multi Core) | CPU (Single Core)
Cinebench R15: CPU Multi 64Bit | CPU Single 64Bit
Blender: v2.79 BMW27 CPU
7-Zip 18.03: 7z b 4 | 7z b 4 -mmt1
Geekbench 6.7: Multi-Core | Single-Core
Geekbench 5.5: Multi-Core | Single-Core
HWBOT x265 Benchmark v2.2: 4k Preset
LibreOffice : 20 Documents To PDF
R Benchmark 2.5: Overall mean
| CPU Performance rating | |
| Minisforum AI X1 Pro, HX 470 | |
| Asus NUC 15 Pro+ | |
| GMK EVO-T1 | |
| Average Intel Core Ultra 9 386H | |
| Peladn HO5, AI 9 HX 370 | |
| MSI Cubi NUC AI+ 3MG | |
| HP EliteBoard G1a AI | |
| GMK NucBox K13 | |
| MSI Cubi NUC AI+ 2MG | |
| GMK NucBox K16 | |
| MSI Cubi NUC 1M | |
| Minix Elite EU512-AI -2! | |
| Geekom A5 Pro | |
| Cinebench R23 / Multi Core | |
| Minisforum AI X1 Pro, HX 470 | |
| Asus NUC 15 Pro+ | |
| GMK EVO-T1 | |
| Peladn HO5, AI 9 HX 370 | |
| Average Intel Core Ultra 9 386H (12144 - 21186, n=8) | |
| MSI Cubi NUC AI+ 3MG | |
| Minix Elite EU512-AI | |
| GMK NucBox K16 | |
| HP EliteBoard G1a AI | |
| GMK NucBox K13 | |
| MSI Cubi NUC AI+ 2MG | |
| MSI Cubi NUC 1M | |
| Geekom A5 Pro | |
| Cinebench R23 / Single Core | |
| Asus NUC 15 Pro+ | |
| GMK EVO-T1 | |
| Minisforum AI X1 Pro, HX 470 | |
| Average Intel Core Ultra 9 386H (2010 - 2101, n=8) | |
| MSI Cubi NUC AI+ 3MG | |
| Peladn HO5, AI 9 HX 370 | |
| MSI Cubi NUC AI+ 2MG | |
| GMK NucBox K13 | |
| MSI Cubi NUC 1M | |
| HP EliteBoard G1a AI | |
| Minix Elite EU512-AI | |
| GMK NucBox K16 | |
| Geekom A5 Pro | |
| Cinebench R20 / CPU (Multi Core) | |
| Minisforum AI X1 Pro, HX 470 | |
| Asus NUC 15 Pro+ | |
| GMK EVO-T1 | |
| Peladn HO5, AI 9 HX 370 | |
| Average Intel Core Ultra 9 386H (4757 - 8405, n=8) | |
| MSI Cubi NUC AI+ 3MG | |
| Minix Elite EU512-AI | |
| GMK NucBox K16 | |
| HP EliteBoard G1a AI | |
| GMK NucBox K13 | |
| MSI Cubi NUC AI+ 2MG | |
| MSI Cubi NUC 1M | |
| Geekom A5 Pro | |
| Cinebench R20 / CPU (Single Core) | |
| Asus NUC 15 Pro+ | |
| Minisforum AI X1 Pro, HX 470 | |
| GMK EVO-T1 | |
| Average Intel Core Ultra 9 386H (762 - 796, n=8) | |
| MSI Cubi NUC AI+ 3MG | |
| MSI Cubi NUC AI+ 2MG | |
| Peladn HO5, AI 9 HX 370 | |
| GMK NucBox K13 | |
| MSI Cubi NUC 1M | |
| HP EliteBoard G1a AI | |
| Minix Elite EU512-AI | |
| GMK NucBox K16 | |
| Geekom A5 Pro | |
| Cinebench R15 / CPU Multi 64Bit | |
| Minisforum AI X1 Pro, HX 470 | |
| Asus NUC 15 Pro+ | |
| GMK EVO-T1 | |
| Peladn HO5, AI 9 HX 370 | |
| Average Intel Core Ultra 9 386H (2197 - 3347, n=8) | |
| MSI Cubi NUC AI+ 3MG | |
| Minix Elite EU512-AI | |
| GMK NucBox K16 | |
| HP EliteBoard G1a AI | |
| GMK NucBox K13 | |
| MSI Cubi NUC AI+ 2MG | |
| Geekom A5 Pro | |
| MSI Cubi NUC 1M | |
| Cinebench R15 / CPU Single 64Bit | |
| Asus NUC 15 Pro+ | |
| Minisforum AI X1 Pro, HX 470 | |
| GMK EVO-T1 | |
| Peladn HO5, AI 9 HX 370 | |
| MSI Cubi NUC AI+ 2MG | |
| Average Intel Core Ultra 9 386H (249 - 314, n=8) | |
| GMK NucBox K13 | |
| HP EliteBoard G1a AI | |
| MSI Cubi NUC AI+ 3MG | |
| MSI Cubi NUC 1M | |
| GMK NucBox K16 | |
| Minix Elite EU512-AI | |
| Geekom A5 Pro | |
| Blender / v2.79 BMW27 CPU | |
| MSI Cubi NUC 1M | |
| Geekom A5 Pro | |
| MSI Cubi NUC AI+ 2MG | |
| GMK NucBox K13 | |
| HP EliteBoard G1a AI | |
| GMK NucBox K16 | |
| Minix Elite EU512-AI | |
| MSI Cubi NUC AI+ 3MG | |
| Average Intel Core Ultra 9 386H (156 - 299, n=8) | |
| GMK EVO-T1 | |
| Asus NUC 15 Pro+ | |
| Peladn HO5, AI 9 HX 370 | |
| Minisforum AI X1 Pro, HX 470 | |
| 7-Zip 18.03 / 7z b 4 -mmt1 | |
| Minisforum AI X1 Pro, HX 470 | |
| Average Intel Core Ultra 9 386H (5488 - 6493, n=8) | |
| Asus NUC 15 Pro+ | |
| GMK EVO-T1 | |
| Peladn HO5, AI 9 HX 370 | |
| MSI Cubi NUC 1M | |
| MSI Cubi NUC AI+ 2MG | |
| GMK NucBox K13 | |
| HP EliteBoard G1a AI | |
| MSI Cubi NUC AI+ 3MG | |
| Geekom A5 Pro | |
| GMK NucBox K16 | |
| Minix Elite EU512-AI | |
| Geekbench 6.7 / Multi-Core | |
| Asus NUC 15 Pro+ | |
| Average Intel Core Ultra 9 386H (13776 - 17405, n=10) | |
| GMK EVO-T1 | |
| MSI Cubi NUC AI+ 3MG | |
| Peladn HO5, AI 9 HX 370 | |
| Minisforum AI X1 Pro, HX 470 | |
| HP EliteBoard G1a AI | |
| GMK NucBox K13 | |
| MSI Cubi NUC AI+ 2MG | |
| MSI Cubi NUC 1M | |
| Geekom A5 Pro | |
| GMK NucBox K16 | |
| Geekbench 6.7 / Single-Core | |
| Minisforum AI X1 Pro, HX 470 | |
| GMK EVO-T1 | |
| Average Intel Core Ultra 9 386H (2778 - 2919, n=10) | |
| Peladn HO5, AI 9 HX 370 | |
| MSI Cubi NUC AI+ 3MG | |
| GMK NucBox K13 | |
| MSI Cubi NUC AI+ 2MG | |
| Asus NUC 15 Pro+ | |
| MSI Cubi NUC 1M | |
| HP EliteBoard G1a AI | |
| Geekom A5 Pro | |
| GMK NucBox K16 | |
| Geekbench 5.5 / Multi-Core | |
| Average Intel Core Ultra 9 386H (13098 - 17557, n=8) | |
| Asus NUC 15 Pro+ | |
| GMK EVO-T1 | |
| Peladn HO5, AI 9 HX 370 | |
| MSI Cubi NUC AI+ 3MG | |
| Minisforum AI X1 Pro, HX 470 | |
| HP EliteBoard G1a AI | |
| Minix Elite EU512-AI | |
| GMK NucBox K13 | |
| MSI Cubi NUC 1M | |
| MSI Cubi NUC AI+ 2MG | |
| GMK NucBox K16 | |
| Geekom A5 Pro | |
| Geekbench 5.5 / Single-Core | |
| Average Intel Core Ultra 9 386H (1992 - 2162, n=8) | |
| Peladn HO5, AI 9 HX 370 | |
| GMK EVO-T1 | |
| MSI Cubi NUC AI+ 2MG | |
| GMK NucBox K13 | |
| MSI Cubi NUC AI+ 3MG | |
| Minisforum AI X1 Pro, HX 470 | |
| HP EliteBoard G1a AI | |
| MSI Cubi NUC 1M | |
| Asus NUC 15 Pro+ | |
| Minix Elite EU512-AI | |
| Geekom A5 Pro | |
| GMK NucBox K16 | |
| HWBOT x265 Benchmark v2.2 / 4k Preset | |
| Asus NUC 15 Pro+ | |
| Peladn HO5, AI 9 HX 370 | |
| Minisforum AI X1 Pro, HX 470 | |
| GMK EVO-T1 | |
| Average Intel Core Ultra 9 386H (13.2 - 25.1, n=8) | |
| MSI Cubi NUC AI+ 3MG | |
| HP EliteBoard G1a AI | |
| Minix Elite EU512-AI | |
| GMK NucBox K13 | |
| MSI Cubi NUC AI+ 2MG | |
| GMK NucBox K16 | |
| Geekom A5 Pro | |
| MSI Cubi NUC 1M | |
| LibreOffice / 20 Documents To PDF | |
| Minix Elite EU512-AI | |
| HP EliteBoard G1a AI | |
| Minisforum AI X1 Pro, HX 470 | |
| GMK NucBox K16 | |
| Geekom A5 Pro | |
| Peladn HO5, AI 9 HX 370 | |
| Asus NUC 15 Pro+ | |
| GMK EVO-T1 | |
| MSI Cubi NUC AI+ 3MG | |
| GMK NucBox K13 | |
| Average Intel Core Ultra 9 386H (38.5 - 56.1, n=8) | |
| MSI Cubi NUC AI+ 2MG | |
| MSI Cubi NUC 1M | |
| R Benchmark 2.5 / Overall mean | |
| Minix Elite EU512-AI | |
| GMK NucBox K16 | |
| Geekom A5 Pro | |
| MSI Cubi NUC AI+ 2MG | |
| HP EliteBoard G1a AI | |
| GMK NucBox K13 | |
| MSI Cubi NUC 1M | |
| GMK EVO-T1 | |
| Asus NUC 15 Pro+ | |
| MSI Cubi NUC AI+ 3MG | |
| Average Intel Core Ultra 9 386H (0.4055 - 0.4384, n=8) | |
| Peladn HO5, AI 9 HX 370 | |
| Minisforum AI X1 Pro, HX 470 | |
Cinebench R23: Multi Core | Single Core
Cinebench R20: CPU (Multi Core) | CPU (Single Core)
Cinebench R15: CPU Multi 64Bit | CPU Single 64Bit
Blender: v2.79 BMW27 CPU
7-Zip 18.03: 7z b 4 | 7z b 4 -mmt1
Geekbench 6.7: Multi-Core | Single-Core
Geekbench 5.5: Multi-Core | Single-Core
HWBOT x265 Benchmark v2.2: 4k Preset
LibreOffice : 20 Documents To PDF
R Benchmark 2.5: Overall mean
* ... smaller is better
AIDA64: FP32 Ray-Trace | FPU Julia | CPU SHA3 | CPU Queen | FPU SinJulia | FPU Mandel | CPU AES | CPU ZLib | FP64 Ray-Trace | CPU PhotoWorxx | CPU CheckMate
| Performance rating | |
| Asus NUC 15 Pro+ -1! | |
| Average Intel Core Ultra 9 386H -1! | |
| GMK EVO-T1 | |
| MSI Cubi NUC AI+ 3MG -1! | |
| GMK NucBox K16 -1! | |
| MSI Cubi NUC AI+ 2MG -1! | |
| Geekom A5 Pro | |
| MSI Cubi NUC 1M -1! | |
| AIDA64 / FP32 Ray-Trace | |
| Asus NUC 15 Pro+ (v6.92.6600) | |
| GMK EVO-T1 (v6.92.6600) | |
| GMK EVO-T1 (v8.20.8100) | |
| Average Intel Core Ultra 9 386H (10001 - 21727, n=8) | |
| GMK NucBox K16 (v8.20.8100) | |
| MSI Cubi NUC AI+ 3MG (v8.20.8100) | |
| MSI Cubi NUC AI+ 2MG (v6.92.6600) | |
| Geekom A5 Pro (v8.20.8100) | |
| Geekom A5 Pro (v6.92.6600) | |
| MSI Cubi NUC 1M (v6.92.6600) | |
| AIDA64 / FPU Julia | |
| Asus NUC 15 Pro+ (v6.92.6600) | |
| GMK EVO-T1 (v6.92.6600) | |
| GMK EVO-T1 (v8.20.8100) | |
| Average Intel Core Ultra 9 386H (53370 - 113595, n=8) | |
| GMK NucBox K16 (v8.20.8100) | |
| MSI Cubi NUC AI+ 3MG (v8.20.8100) | |
| MSI Cubi NUC AI+ 2MG (v6.92.6600) | |
| Geekom A5 Pro (v8.20.8100) | |
| Geekom A5 Pro (v6.92.6600) | |
| MSI Cubi NUC 1M (v6.92.6600) | |
| AIDA64 / CPU SHA3 | |
| Asus NUC 15 Pro+ (v6.92.6600) | |
| GMK EVO-T1 (v6.92.6600) | |
| GMK EVO-T1 (v8.20.8100) | |
| Average Intel Core Ultra 9 386H (2776 - 5604, n=8) | |
| MSI Cubi NUC AI+ 3MG (v8.20.8100) | |
| GMK NucBox K16 (v8.20.8100) | |
| MSI Cubi NUC AI+ 2MG (v6.92.6600) | |
| MSI Cubi NUC 1M (v6.92.6600) | |
| Geekom A5 Pro (v6.92.6600) | |
| Geekom A5 Pro (v8.20.8100) | |
| AIDA64 / CPU Queen | |
| Asus NUC 15 Pro+ (v6.92.6600) | |
| Geekom A5 Pro (v6.92.6600) | |
| MSI Cubi NUC 1M (v6.92.6600) | |
| GMK EVO-T1 (v6.92.6600) | |
| MSI Cubi NUC AI+ 2MG (v6.92.6600) | |
| AIDA64 / FPU SinJulia | |
| GMK NucBox K16 (v8.20.8100) | |
| Asus NUC 15 Pro+ (v6.92.6600) | |
| GMK EVO-T1 (v6.92.6600) | |
| GMK EVO-T1 (v8.20.8100) | |
| Geekom A5 Pro (v6.92.6600) | |
| Geekom A5 Pro (v8.20.8100) | |
| Average Intel Core Ultra 9 386H (5314 - 7332, n=8) | |
| MSI Cubi NUC AI+ 3MG (v8.20.8100) | |
| MSI Cubi NUC AI+ 2MG (v6.92.6600) | |
| MSI Cubi NUC 1M (v6.92.6600) | |
| AIDA64 / FPU Mandel | |
| GMK EVO-T1 (v6.92.6600) | |
| GMK EVO-T1 (v8.20.8100) | |
| Asus NUC 15 Pro+ (v6.92.6600) | |
| GMK NucBox K16 (v8.20.8100) | |
| Average Intel Core Ultra 9 386H (28414 - 61578, n=8) | |
| MSI Cubi NUC AI+ 3MG (v8.20.8100) | |
| MSI Cubi NUC AI+ 2MG (v6.92.6600) | |
| Geekom A5 Pro (v6.92.6600) | |
| Geekom A5 Pro (v8.20.8100) | |
| MSI Cubi NUC 1M (v6.92.6600) | |
| AIDA64 / CPU AES | |
| Asus NUC 15 Pro+ (v6.92.6600) | |
| GMK EVO-T1 (v6.92.6600) | |
| GMK EVO-T1 (v8.20.8100) | |
| Average Intel Core Ultra 9 386H (46362 - 72112, n=8) | |
| GMK NucBox K16 (v8.20.8100) | |
| MSI Cubi NUC AI+ 3MG (v8.20.8100) | |
| MSI Cubi NUC AI+ 2MG (v6.92.6600) | |
| Geekom A5 Pro (v6.92.6600) | |
| Geekom A5 Pro (v8.20.8100) | |
| MSI Cubi NUC 1M (v6.92.6600) | |
| AIDA64 / CPU ZLib | |
| Asus NUC 15 Pro+ (v6.92.6600) | |
| GMK EVO-T1 (v6.92.6600) | |
| GMK EVO-T1 (v8.20.8100) | |
| Average Intel Core Ultra 9 386H (669 - 1271, n=8) | |
| MSI Cubi NUC AI+ 3MG (v8.20.8100) | |
| GMK NucBox K16 (v8.20.8100) | |
| MSI Cubi NUC AI+ 2MG (v6.92.6600) | |
| MSI Cubi NUC 1M (v6.92.6600) | |
| Geekom A5 Pro (v6.92.6600) | |
| Geekom A5 Pro (v8.20.8100) | |
| AIDA64 / FP64 Ray-Trace | |
| Asus NUC 15 Pro+ (v6.92.6600) | |
| GMK EVO-T1 (v6.92.6600) | |
| GMK EVO-T1 (v8.20.8100) | |
| Average Intel Core Ultra 9 386H (5138 - 11627, n=8) | |
| GMK NucBox K16 (v8.20.8100) | |
| MSI Cubi NUC AI+ 3MG (v8.20.8100) | |
| MSI Cubi NUC AI+ 2MG (v6.92.6600) | |
| Geekom A5 Pro (v8.20.8100) | |
| Geekom A5 Pro (v6.92.6600) | |
| MSI Cubi NUC 1M (v6.92.6600) | |
| AIDA64 / CPU PhotoWorxx | |
| Average Intel Core Ultra 9 386H (54042 - 89891, n=8) | |
| GMK EVO-T1 (v8.20.8100) | |
| GMK EVO-T1 (v6.92.6600) | |
| Asus NUC 15 Pro+ (v6.92.6600) | |
| MSI Cubi NUC AI+ 2MG (v6.92.6600) | |
| MSI Cubi NUC AI+ 3MG (v8.20.8100) | |
| MSI Cubi NUC 1M (v6.92.6600) | |
| Geekom A5 Pro (v6.92.6600) | |
| Geekom A5 Pro (v8.20.8100) | |
| GMK NucBox K16 (v8.20.8100) | |
| AIDA64 / CPU CheckMate | |
| Average Intel Core Ultra 9 386H (4051 - 4858, n=7) | |
| MSI Cubi NUC AI+ 3MG (v8.20.8100) | |
| GMK EVO-T1 (v8.20.8100) | |
| GMK NucBox K16 (v8.20.8100) | |
| Geekom A5 Pro (v8.20.8100) | |
系统性能
Geekbench AI: Quantized GPU 1.7 | Half Precision GPU 1.7 | Single Precision GPU 1.7
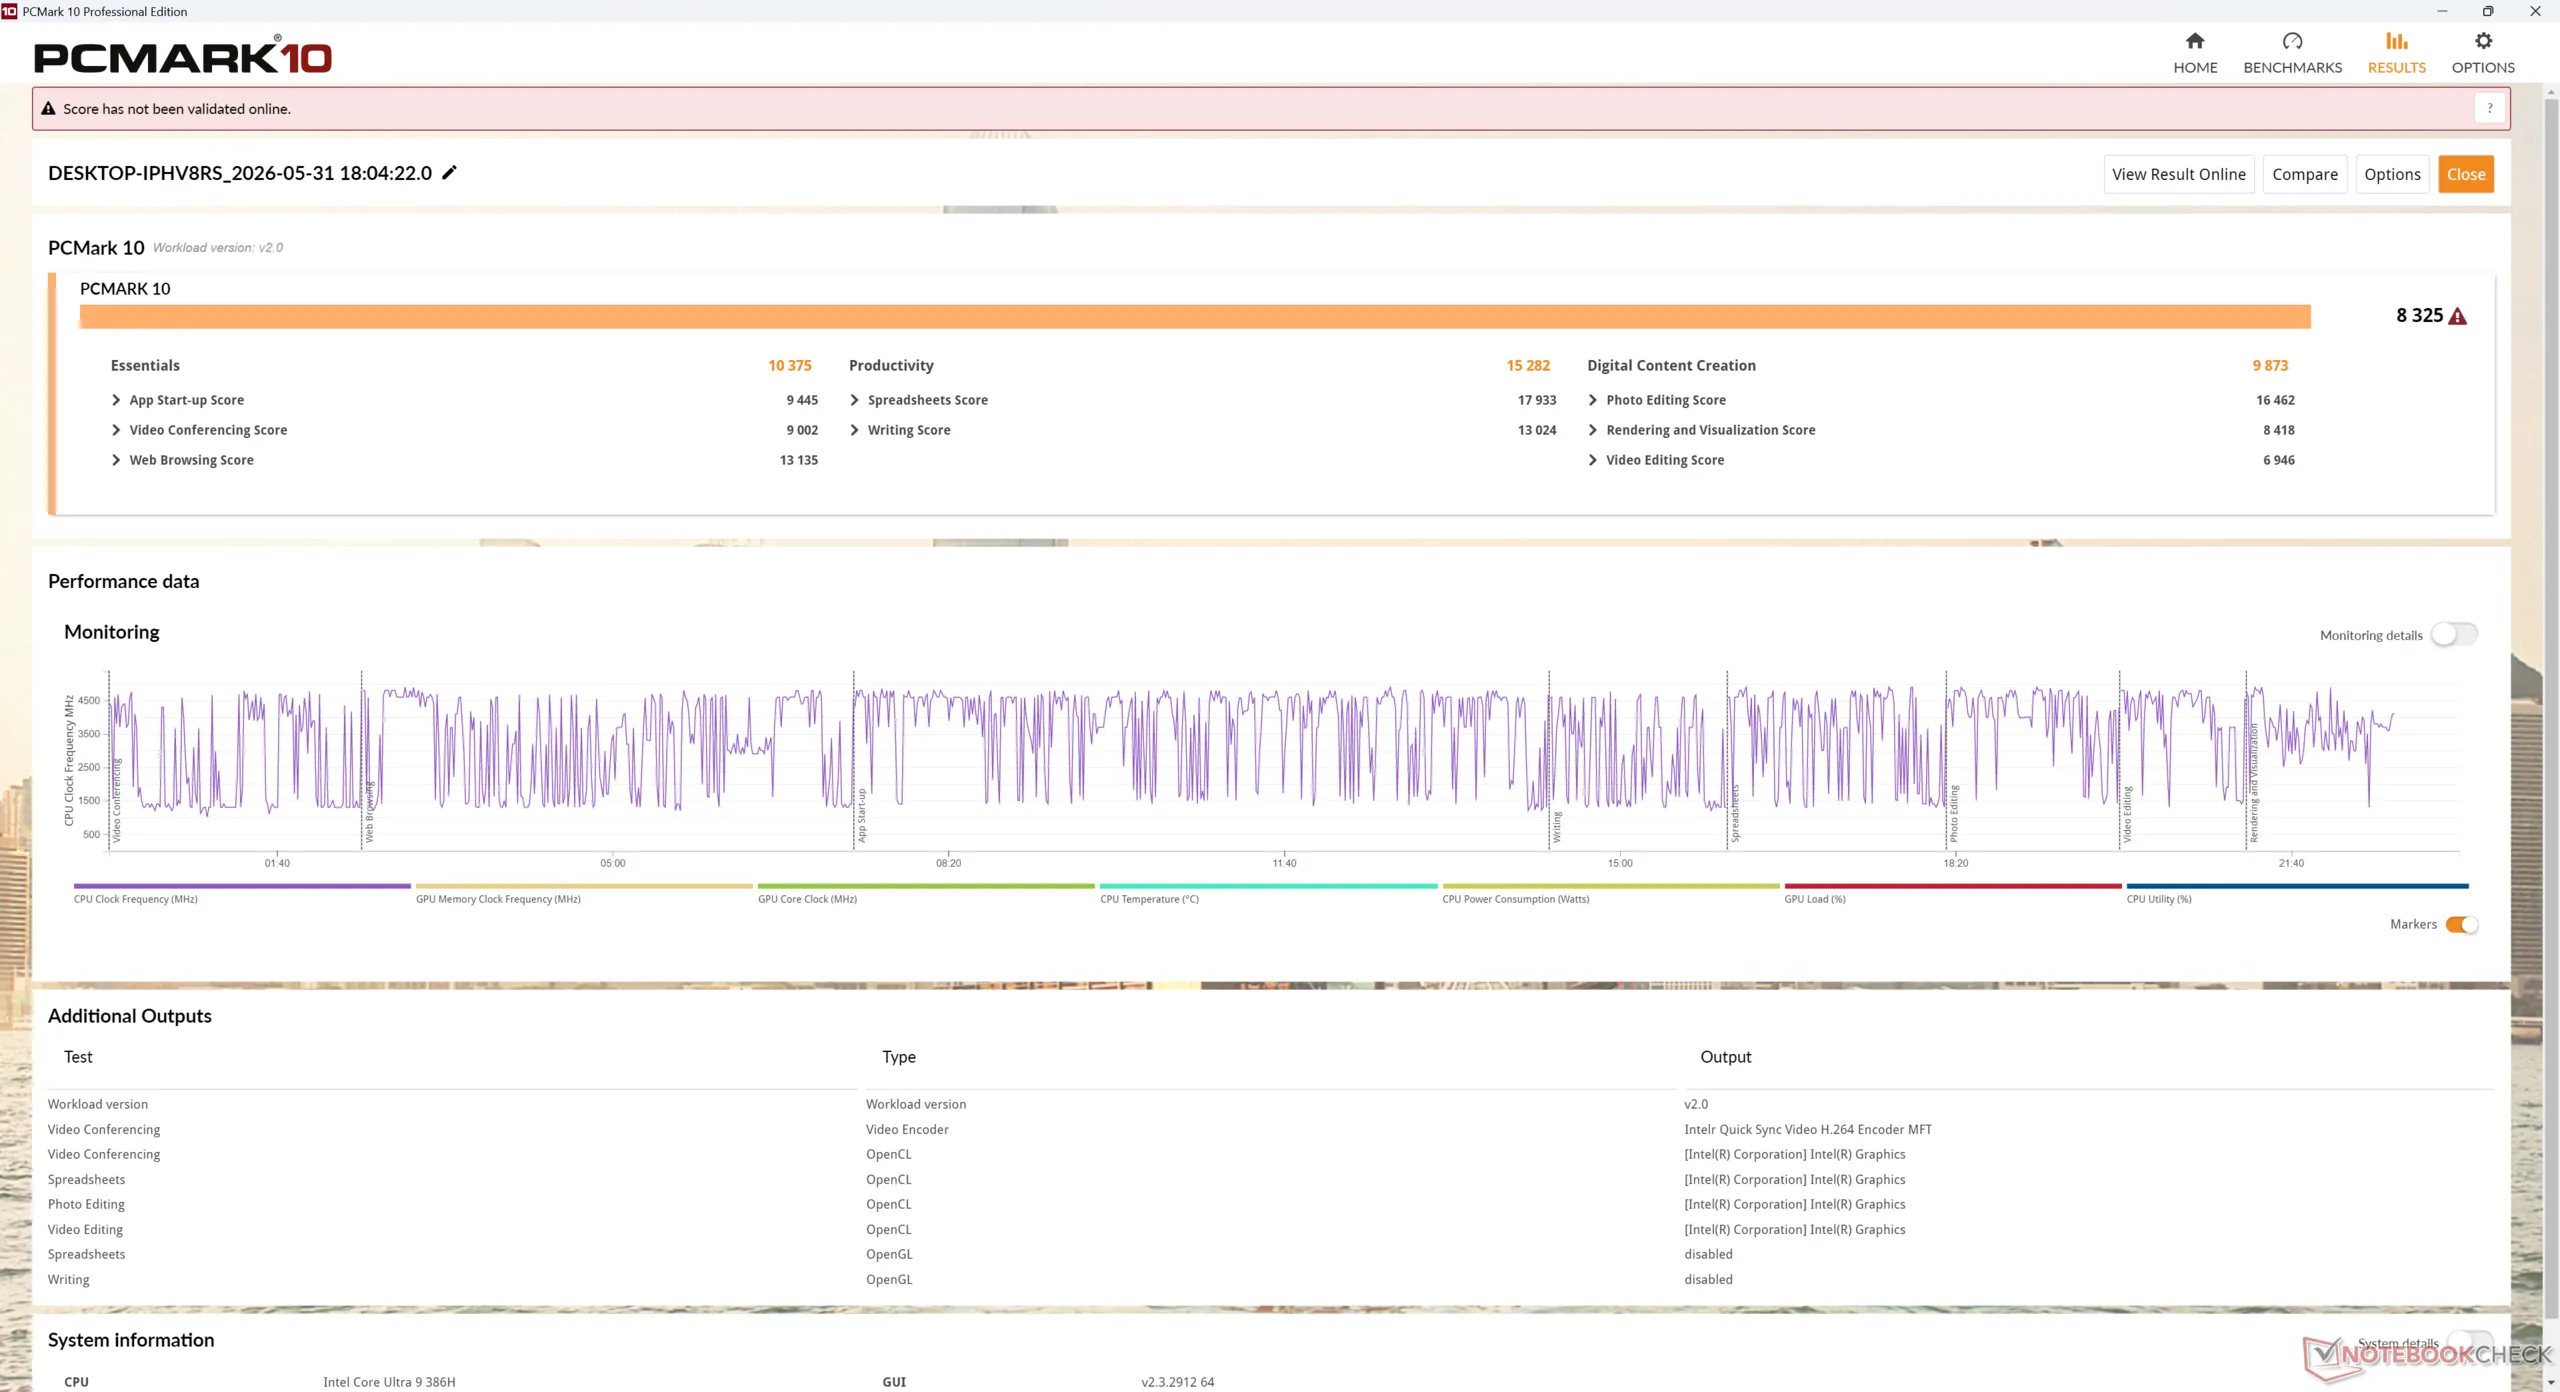
PCMark 10: Score | Essentials | Productivity | Digital Content Creation
CrossMark: Overall | Productivity | Creativity | Responsiveness
WebXPRT 3: Overall
WebXPRT 4: Overall
Mozilla Kraken 1.1: Total
| Performance rating | |
| GMK EVO-T1 | |
| MSI Cubi NUC AI+ 3MG | |
| MSI Cubi NUC AI+ 2MG | |
| Asus NUC 15 Pro+ | |
| MSI Cubi NUC 1M -3! | |
| GMK NucBox K16 -3! | |
| Geekom A5 Pro | |
| Geekbench AI / Quantized GPU 1.7 | |
| MSI Cubi NUC AI+ 2MG | |
| Asus NUC 15 Pro+ | |
| GMK EVO-T1 | |
| MSI Cubi NUC AI+ 3MG | |
| Geekom A5 Pro | |
| Geekbench AI / Half Precision GPU 1.7 | |
| MSI Cubi NUC AI+ 2MG | |
| MSI Cubi NUC AI+ 3MG | |
| GMK EVO-T1 | |
| Asus NUC 15 Pro+ | |
| Geekom A5 Pro | |
| Geekbench AI / Single Precision GPU 1.7 | |
| MSI Cubi NUC AI+ 2MG | |
| Asus NUC 15 Pro+ | |
| GMK EVO-T1 | |
| MSI Cubi NUC AI+ 3MG | |
| Geekom A5 Pro | |
| PCMark 10 / Score | |
| MSI Cubi NUC AI+ 3MG | |
| GMK EVO-T1 | |
| Asus NUC 15 Pro+ | |
| MSI Cubi NUC AI+ 2MG | |
| GMK NucBox K16 | |
| Geekom A5 Pro | |
| MSI Cubi NUC 1M | |
| PCMark 10 / Essentials | |
| MSI Cubi NUC 1M | |
| MSI Cubi NUC AI+ 3MG | |
| GMK EVO-T1 | |
| MSI Cubi NUC AI+ 2MG | |
| Asus NUC 15 Pro+ | |
| Geekom A5 Pro | |
| GMK NucBox K16 | |
| PCMark 10 / Productivity | |
| MSI Cubi NUC AI+ 3MG | |
| Geekom A5 Pro | |
| GMK NucBox K16 | |
| GMK EVO-T1 | |
| MSI Cubi NUC AI+ 2MG | |
| Asus NUC 15 Pro+ | |
| MSI Cubi NUC 1M | |
| PCMark 10 / Digital Content Creation | |
| GMK EVO-T1 | |
| Asus NUC 15 Pro+ | |
| MSI Cubi NUC AI+ 3MG | |
| MSI Cubi NUC AI+ 2MG | |
| GMK NucBox K16 | |
| MSI Cubi NUC 1M | |
| Geekom A5 Pro | |
| CrossMark / Overall | |
| GMK EVO-T1 | |
| MSI Cubi NUC AI+ 3MG | |
| Asus NUC 15 Pro+ | |
| MSI Cubi NUC 1M | |
| MSI Cubi NUC AI+ 2MG | |
| GMK NucBox K16 | |
| Geekom A5 Pro | |
| CrossMark / Productivity | |
| GMK EVO-T1 | |
| MSI Cubi NUC AI+ 3MG | |
| MSI Cubi NUC 1M | |
| Asus NUC 15 Pro+ | |
| MSI Cubi NUC AI+ 2MG | |
| GMK NucBox K16 | |
| Geekom A5 Pro | |
| CrossMark / Creativity | |
| MSI Cubi NUC AI+ 3MG | |
| GMK EVO-T1 | |
| Asus NUC 15 Pro+ | |
| MSI Cubi NUC AI+ 2MG | |
| MSI Cubi NUC 1M | |
| GMK NucBox K16 | |
| Geekom A5 Pro | |
| CrossMark / Responsiveness | |
| GMK EVO-T1 | |
| MSI Cubi NUC AI+ 3MG | |
| MSI Cubi NUC 1M | |
| Asus NUC 15 Pro+ | |
| MSI Cubi NUC AI+ 2MG | |
| GMK NucBox K16 | |
| Geekom A5 Pro | |
| WebXPRT 3 / Overall | |
| GMK EVO-T1 | |
| MSI Cubi NUC AI+ 2MG | |
| MSI Cubi NUC 1M | |
| MSI Cubi NUC AI+ 3MG | |
| Geekom A5 Pro | |
| Asus NUC 15 Pro+ | |
| GMK NucBox K16 | |
| WebXPRT 4 / Overall | |
| GMK EVO-T1 | |
| MSI Cubi NUC AI+ 3MG | |
| MSI Cubi NUC AI+ 2MG | |
| MSI Cubi NUC 1M | |
| Asus NUC 15 Pro+ | |
| Geekom A5 Pro | |
| GMK NucBox K16 | |
| Mozilla Kraken 1.1 / Total | |
| GMK NucBox K16 | |
| Geekom A5 Pro | |
| MSI Cubi NUC 1M | |
| MSI Cubi NUC AI+ 2MG | |
| Asus NUC 15 Pro+ | |
| GMK EVO-T1 | |
| MSI Cubi NUC AI+ 3MG | |
* ... smaller is better
| PCMark 10 Score | 8325 points | |
Help | ||
| AIDA64 / Memory Copy | |
| Average Intel Core Ultra 9 386H (75437 - 129946, n=8) | |
| MSI Cubi NUC AI+ 2MG | |
| Asus NUC 15 Pro+ | |
| GMK EVO-T1 | |
| GMK EVO-T1 | |
| MSI Cubi NUC AI+ 3MG | |
| MSI Cubi NUC 1M | |
| Geekom A5 Pro | |
| Geekom A5 Pro | |
| GMK NucBox K16 | |
| AIDA64 / Memory Read | |
| Average Intel Core Ultra 9 386H (81021 - 118858, n=8) | |
| Asus NUC 15 Pro+ | |
| MSI Cubi NUC AI+ 2MG | |
| MSI Cubi NUC AI+ 3MG | |
| GMK EVO-T1 | |
| GMK EVO-T1 | |
| MSI Cubi NUC 1M | |
| Geekom A5 Pro | |
| Geekom A5 Pro | |
| GMK NucBox K16 | |
| AIDA64 / Memory Write | |
| MSI Cubi NUC AI+ 2MG | |
| Average Intel Core Ultra 9 386H (75959 - 135096, n=8) | |
| Asus NUC 15 Pro+ | |
| GMK EVO-T1 | |
| GMK EVO-T1 | |
| MSI Cubi NUC AI+ 3MG | |
| MSI Cubi NUC 1M | |
| GMK NucBox K16 | |
| Geekom A5 Pro | |
| Geekom A5 Pro | |
| AIDA64 / Memory Latency | |
| GMK EVO-T1 | |
| GMK EVO-T1 | |
| MSI Cubi NUC AI+ 3MG | |
| GMK NucBox K16 | |
| Asus NUC 15 Pro+ | |
| Average Intel Core Ultra 9 386H (87.2 - 116.9, n=8) | |
| Geekom A5 Pro | |
| Geekom A5 Pro | |
| MSI Cubi NUC AI+ 2MG | |
| MSI Cubi NUC 1M | |
* ... smaller is better
DPC 延迟
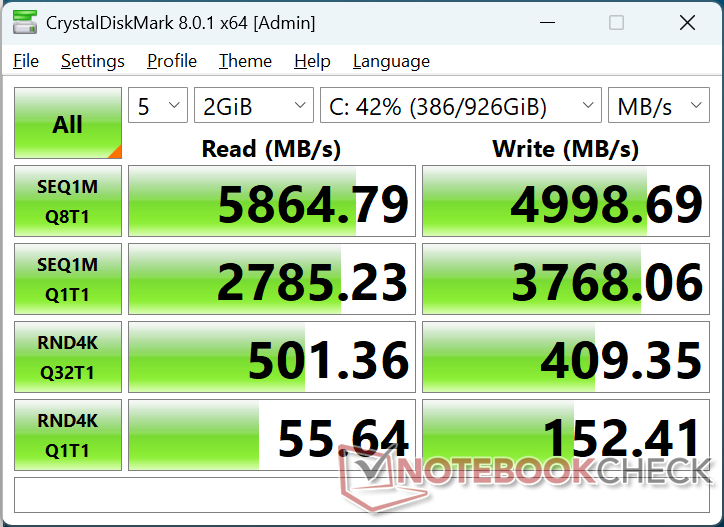
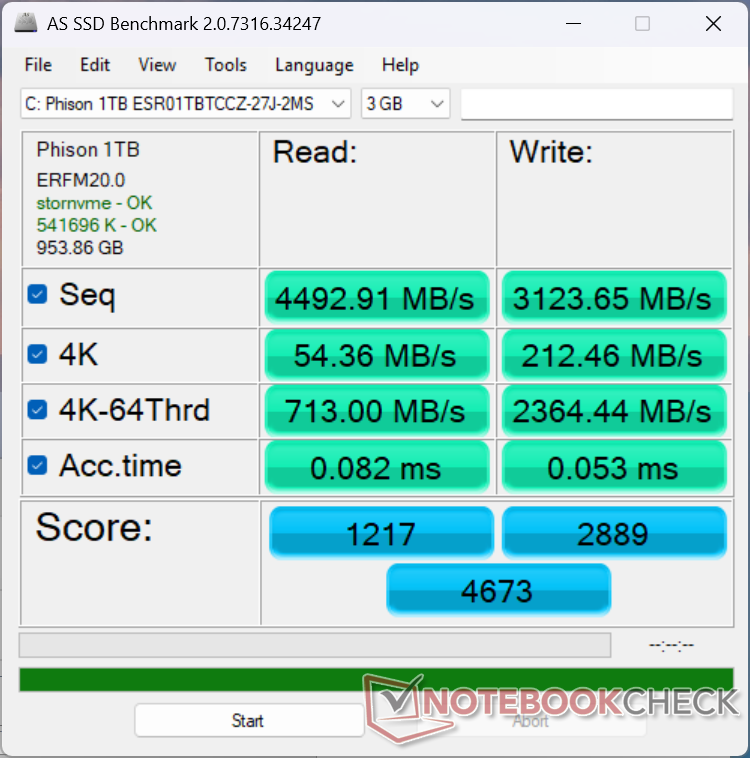
存储设备
系统随附相同的 Phison 1 TB ESR01TBTCCZPCIe4 NVMe 固态硬盘,与去年的 Cubi 2MG 相同。

| Drive Performance rating - Percent | |
| GMK EVO-T1 | |
| Asus NUC 15 Pro+ | |
| MSI Cubi NUC AI+ 3MG | |
| MSI Cubi NUC 1M | |
| Geekom A5 Pro | |
| MSI Cubi NUC AI+ 2MG | |
| GMK NucBox K16 | |
* ... smaller is better
磁盘节流DiskSpd 读取循环,队列深度 8
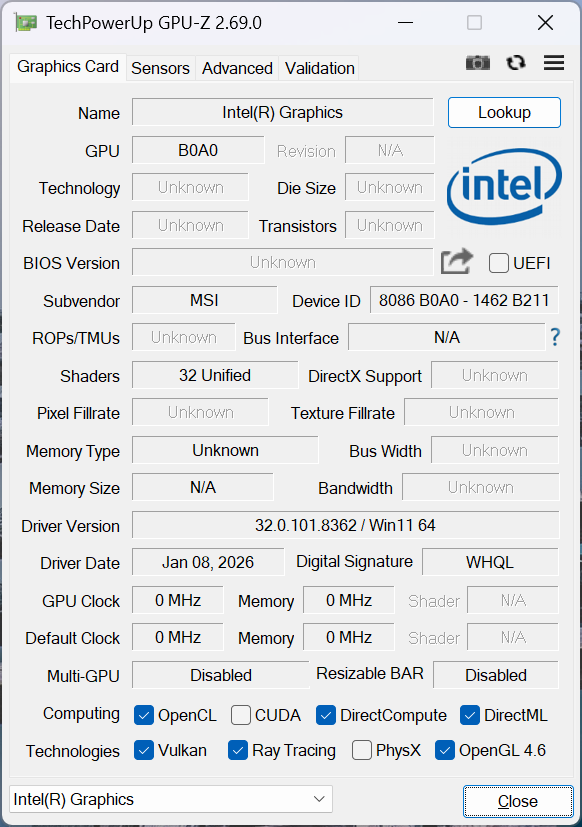
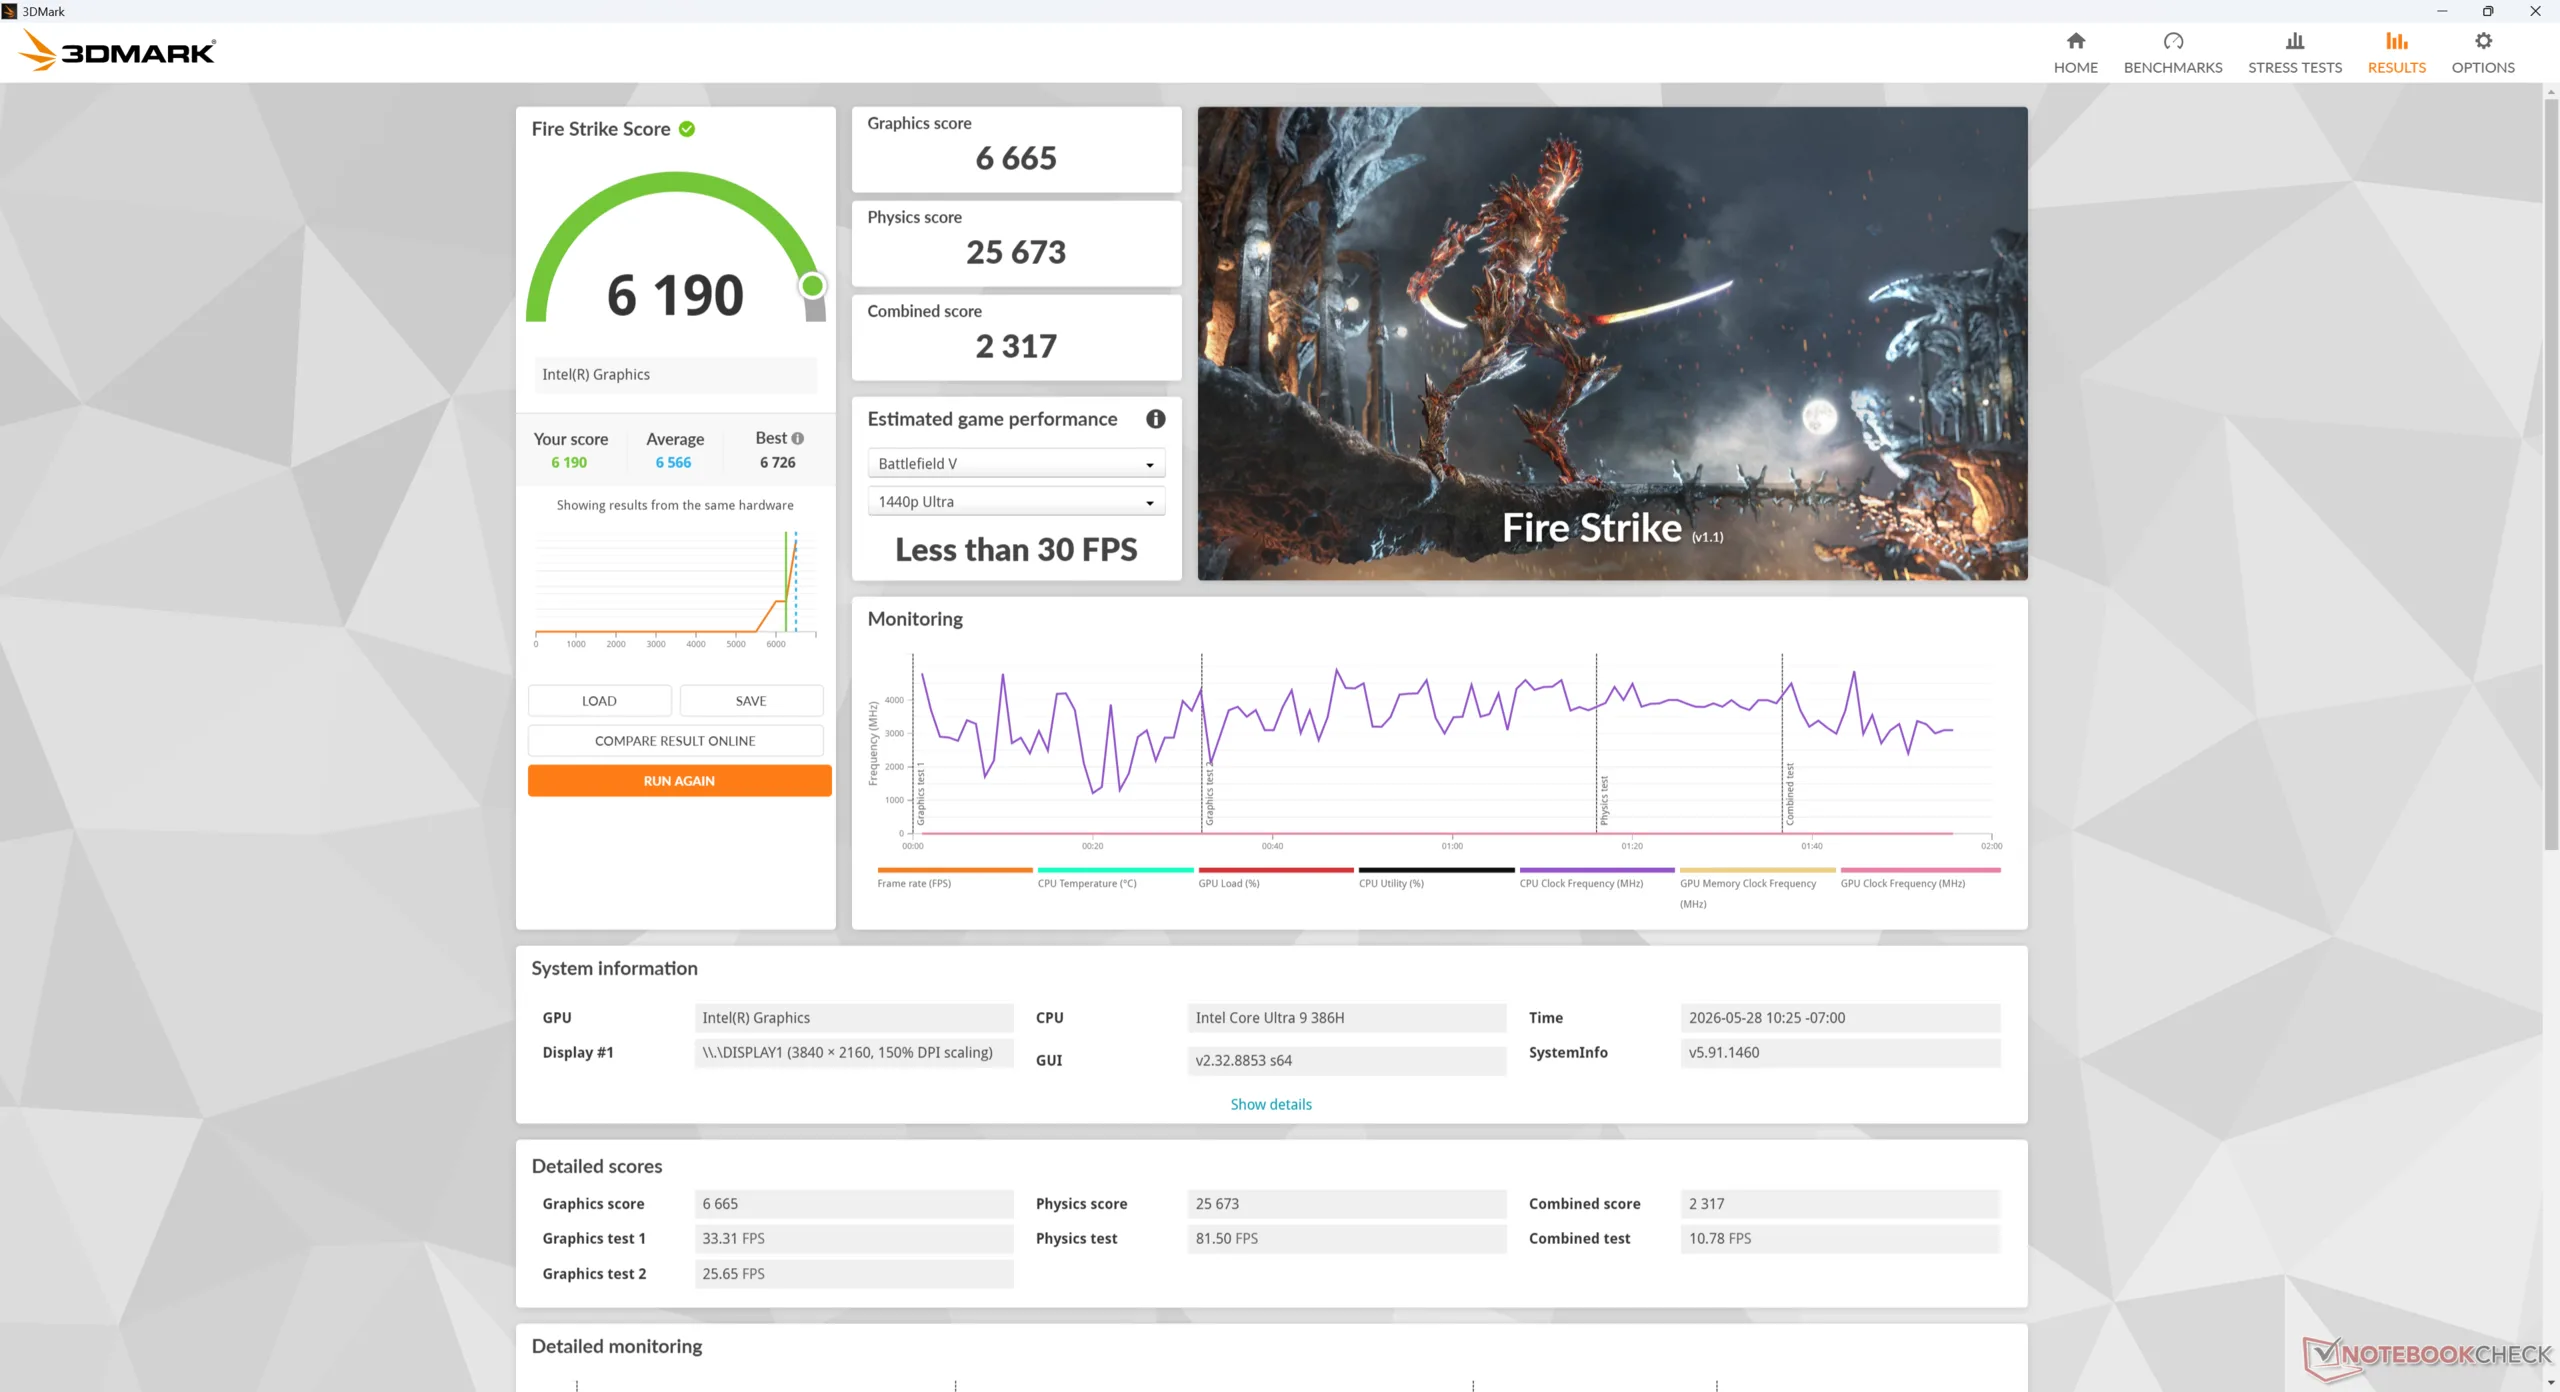
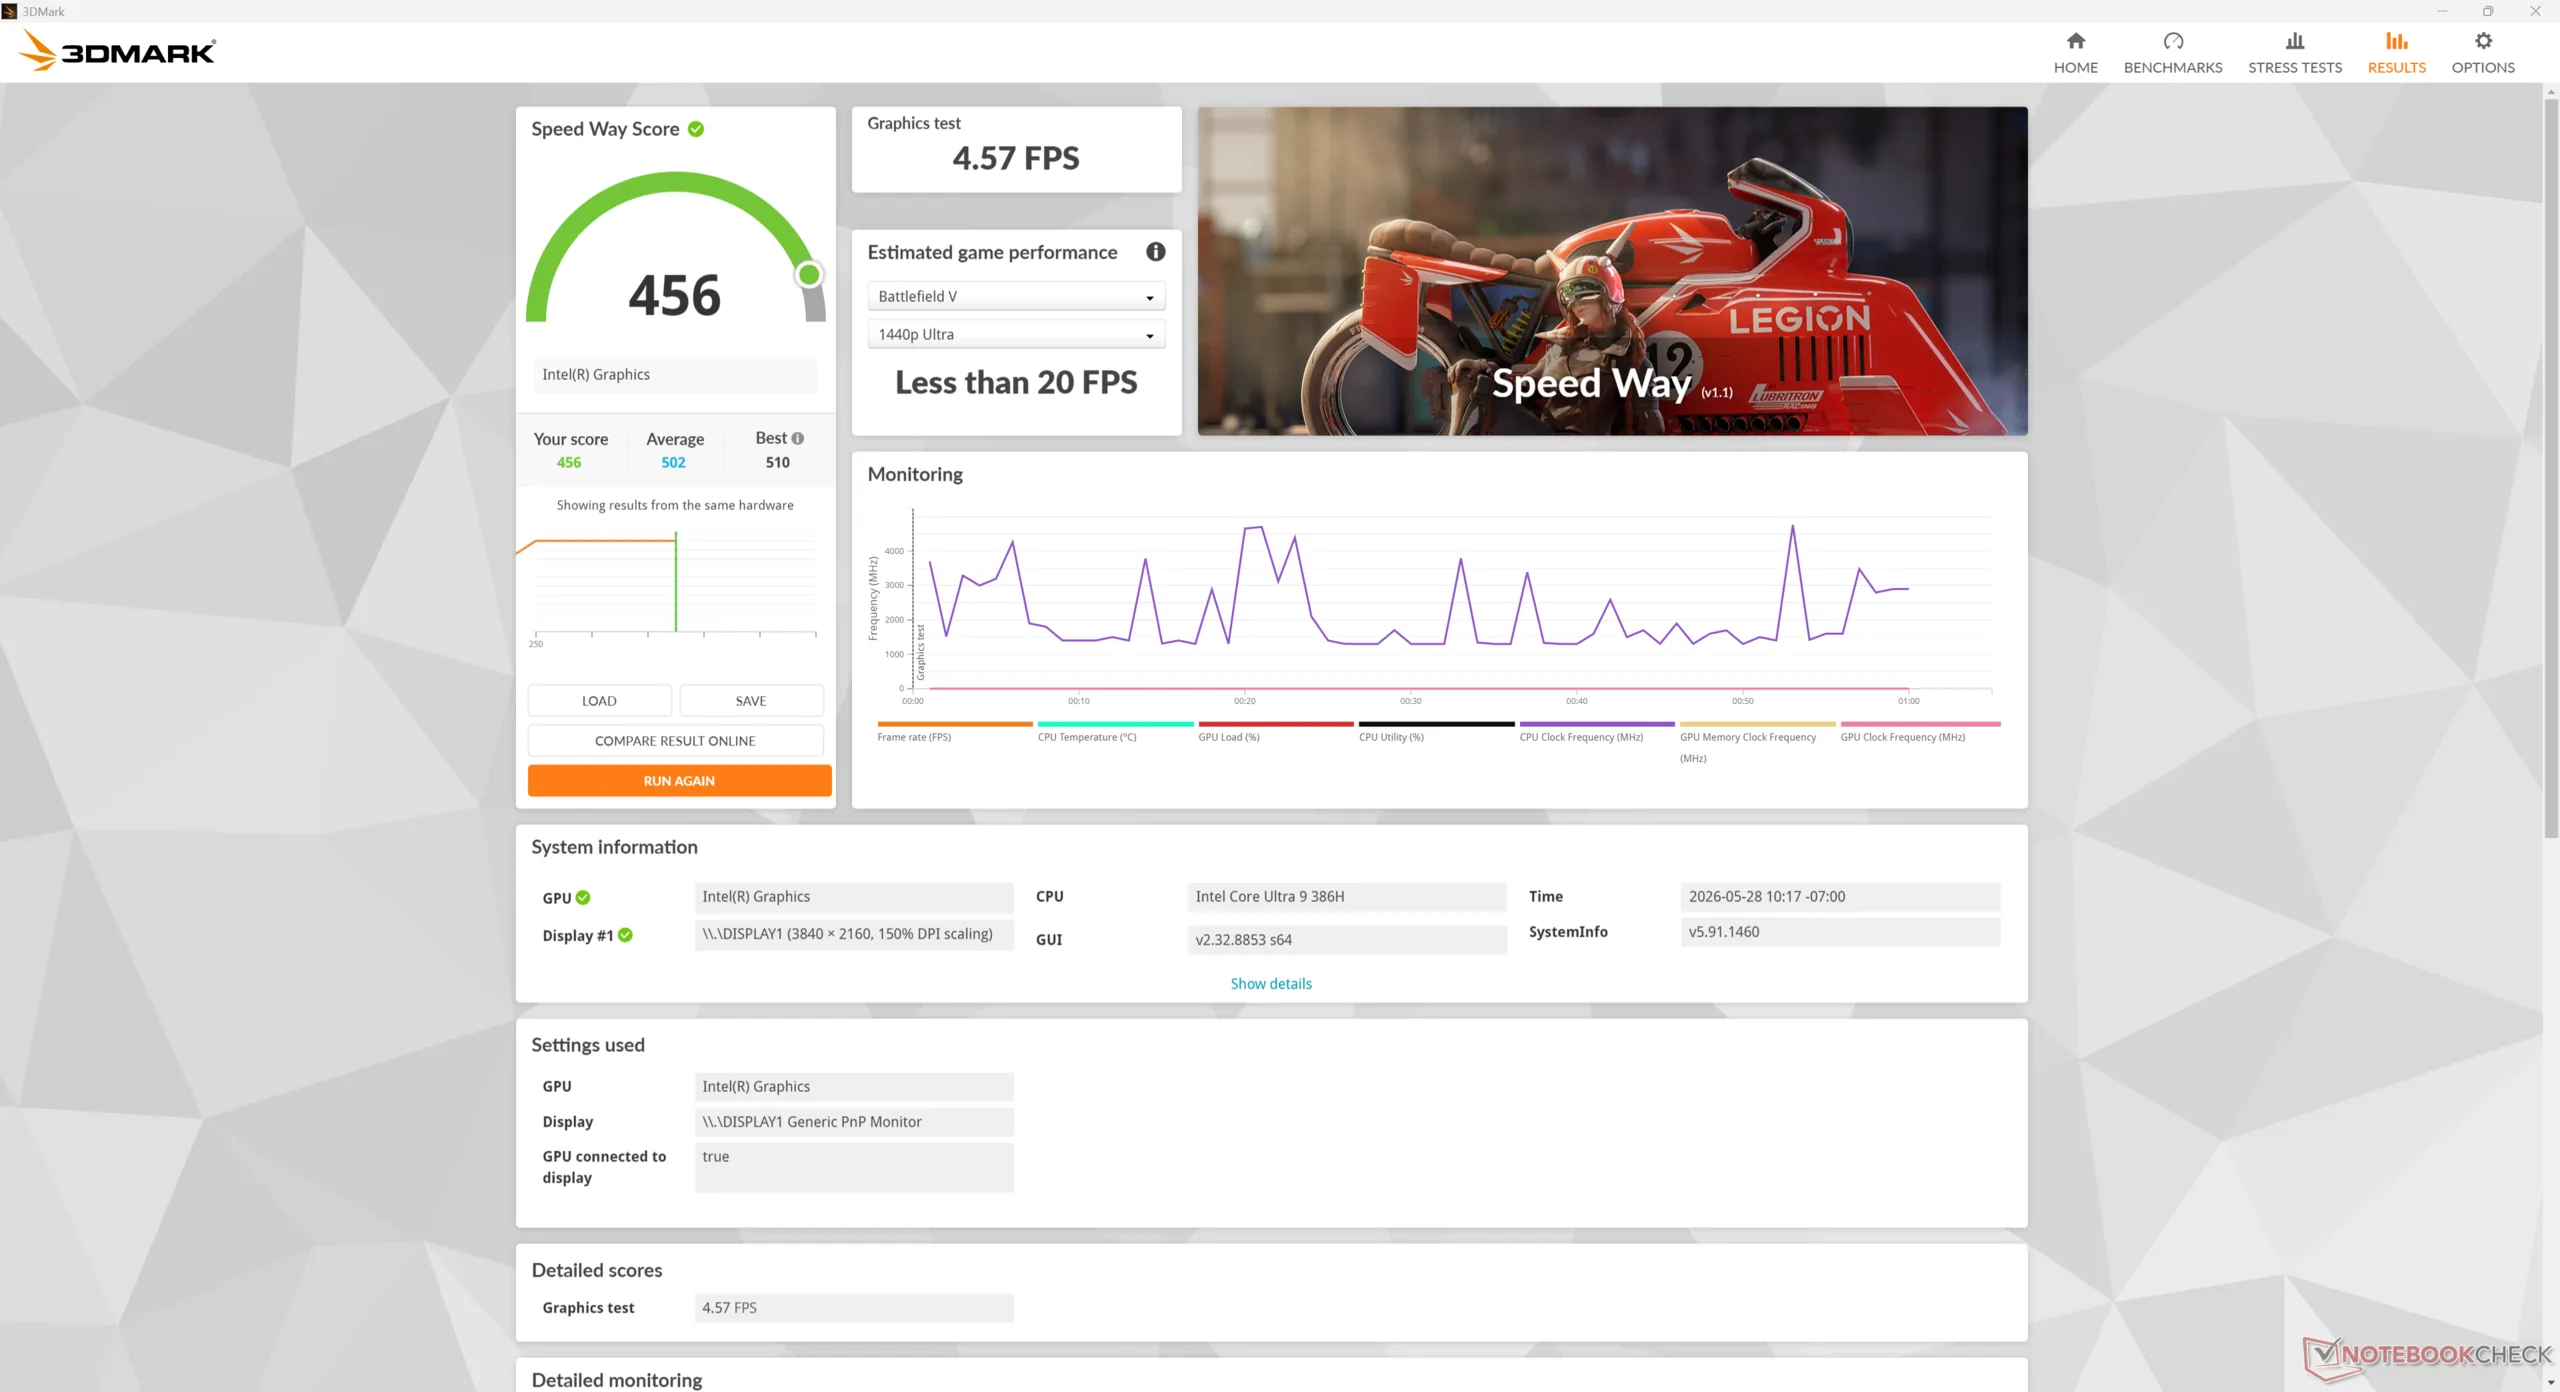
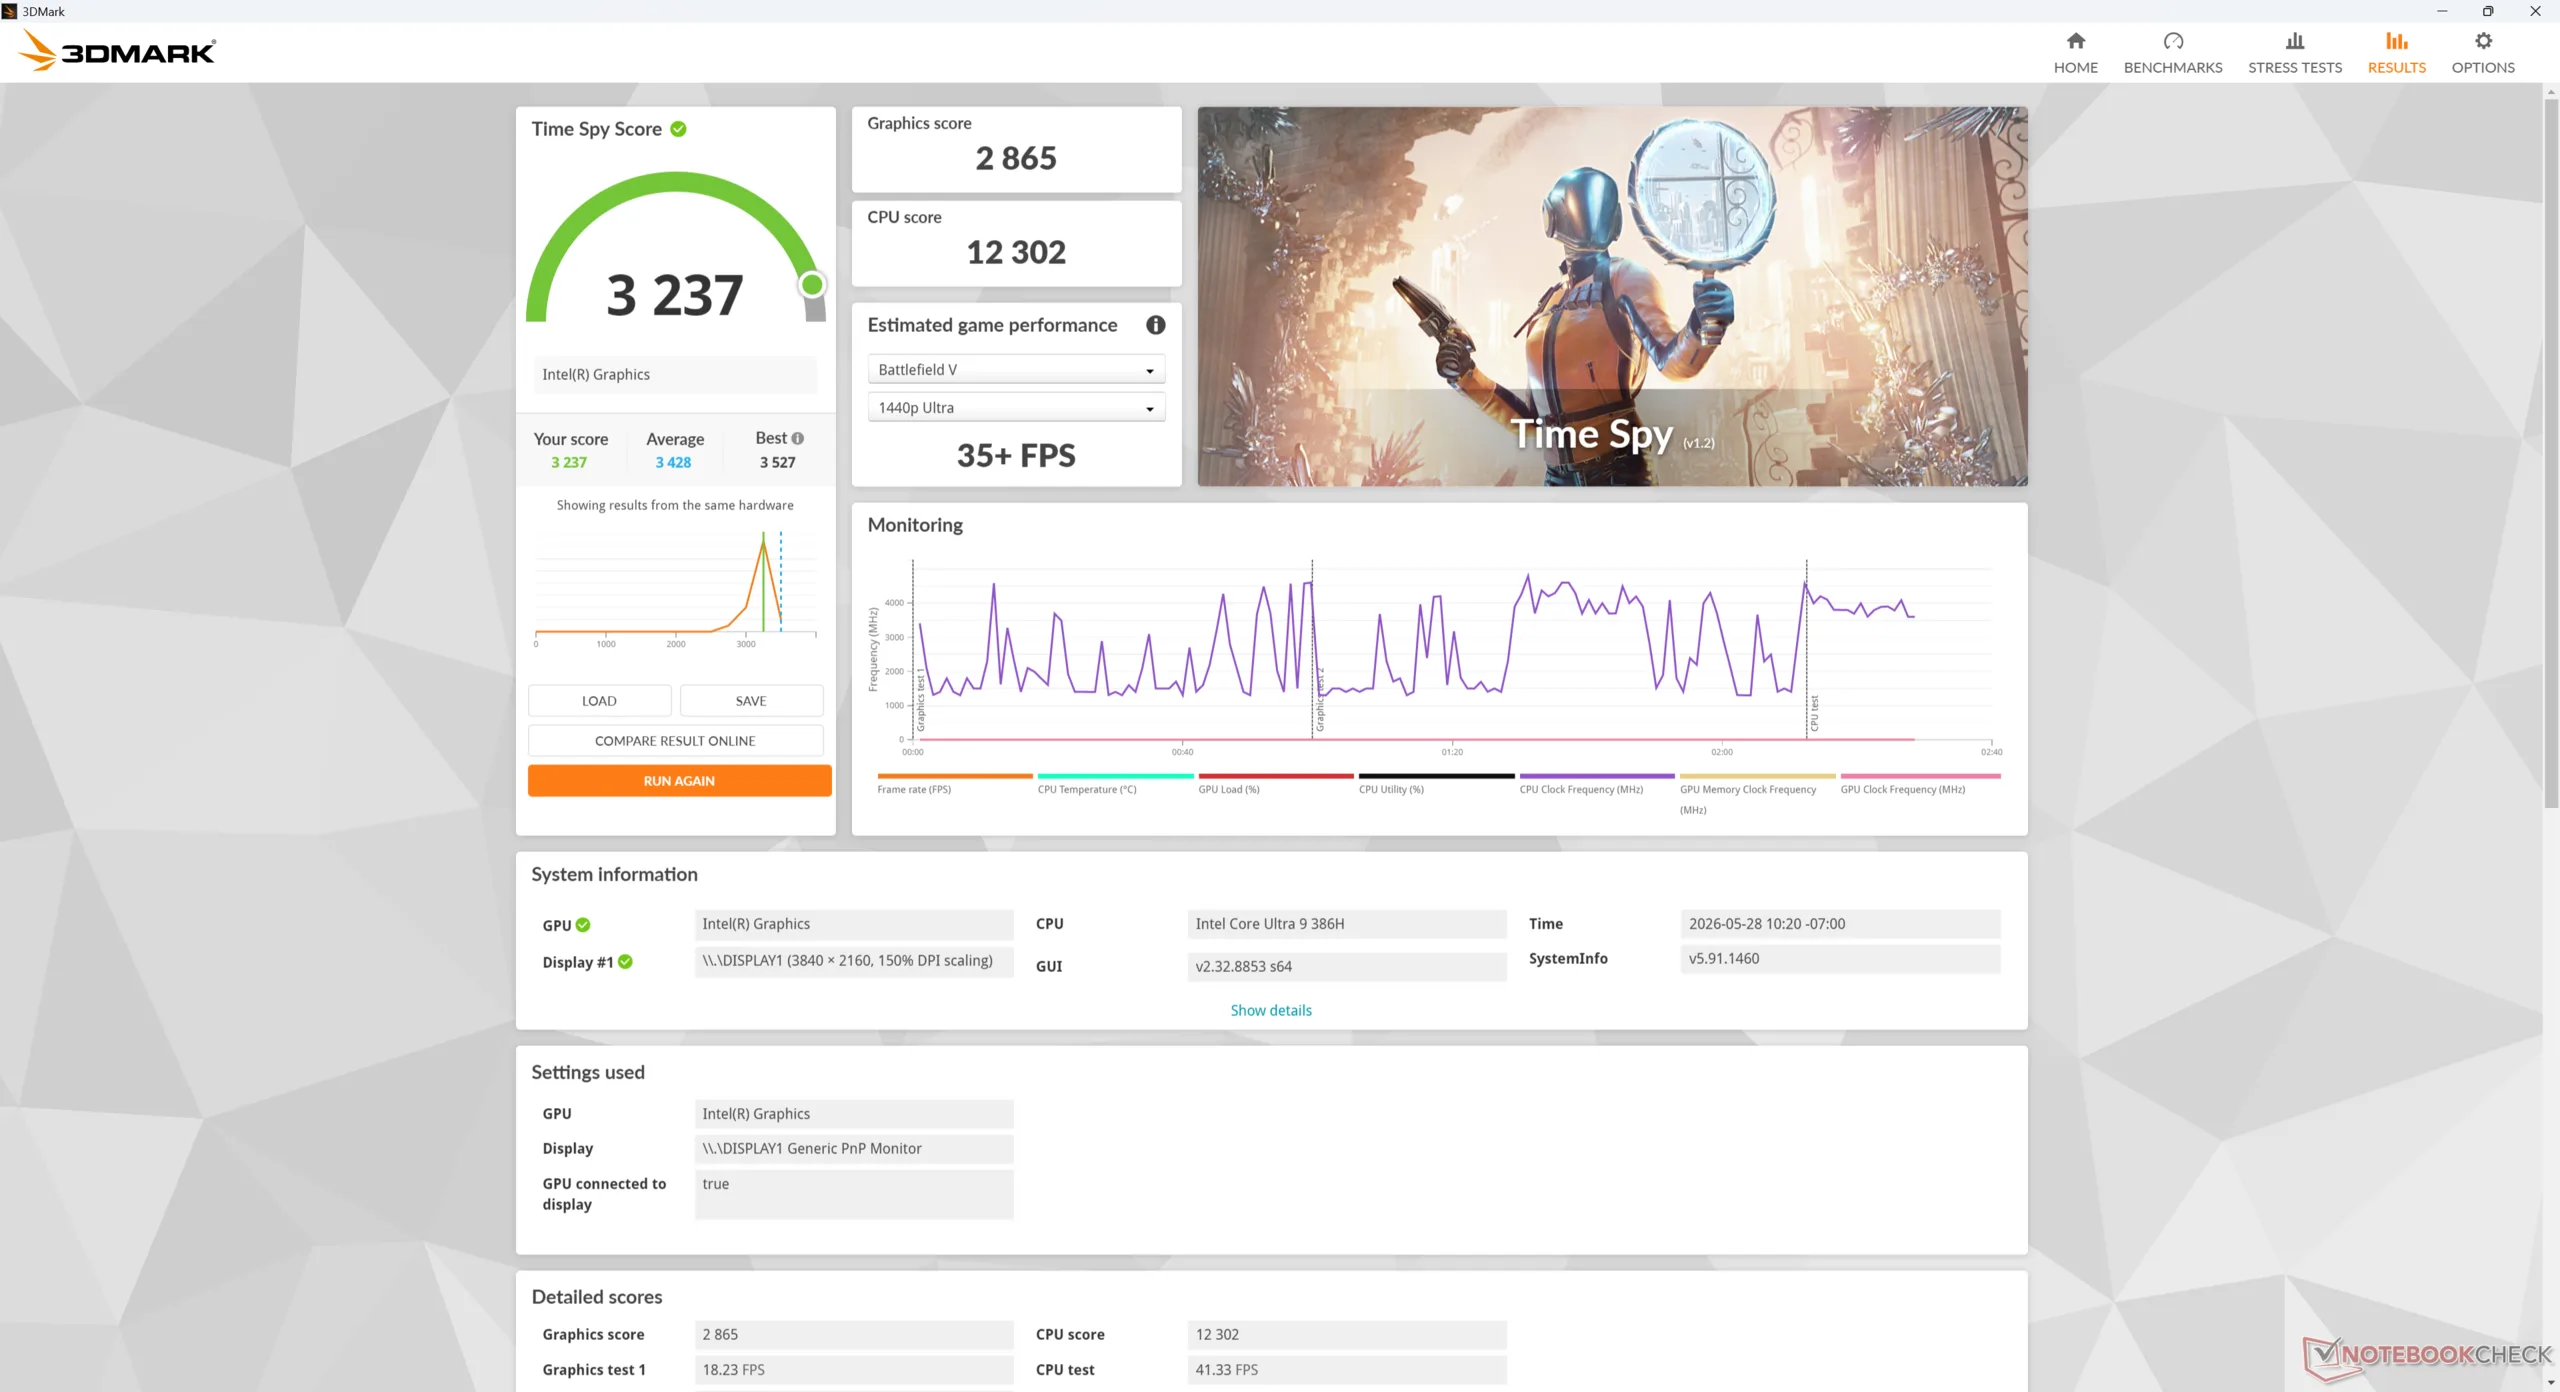
图形处理器性能
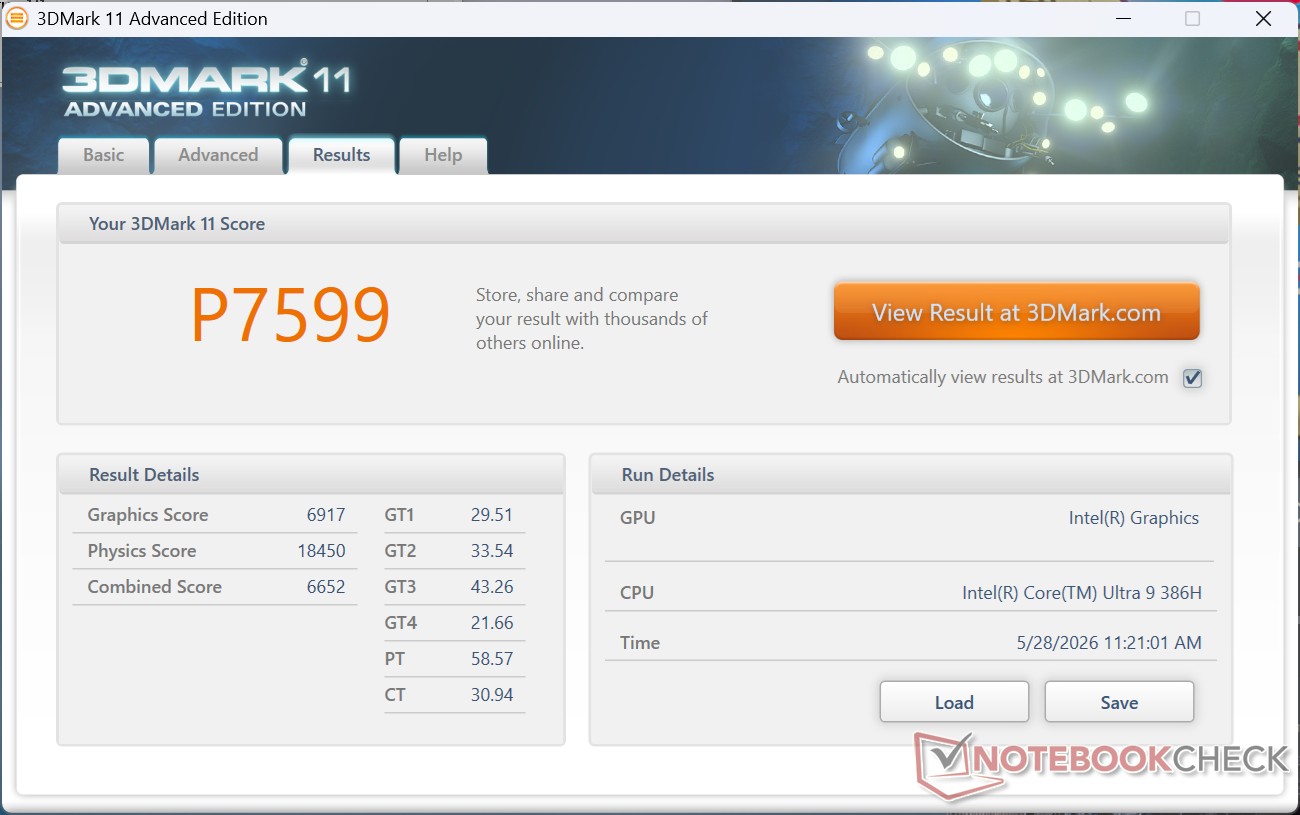
| 3DMark 11 Performance | 7599 points | |
| 3DMark Cloud Gate Standard Score | 30367 points | |
| 3DMark Fire Strike Score | 6190 points | |
| 3DMark Time Spy Score | 3237 points | |
Help | ||
* ... smaller is better
| Performance rating - Percent | |
| Asus NUC 15 Pro+ | |
| GMK EVO-T1 -1! | |
| MSI Cubi NUC AI+ 2MG | |
| MSI Cubi NUC AI+ 3MG | |
| GMK NucBox K16 | |
| MSI Cubi NUC 1M -2! | |
| Geekom A5 Pro -2! | |
| Cyberpunk 2077 - 1920x1080 Ultra Preset (FSR off) | |
| Asus NUC 15 Pro+ | |
| GMK EVO-T1 | |
| MSI Cubi NUC AI+ 3MG | |
| MSI Cubi NUC AI+ 2MG | |
| GMK NucBox K16 | |
| MSI Cubi NUC 1M | |
| Geekom A5 Pro | |
| Baldur's Gate 3 - 1920x1080 Ultra Preset AA:T | |
| MSI Cubi NUC AI+ 2MG | |
| Asus NUC 15 Pro+ | |
| GMK EVO-T1 | |
| MSI Cubi NUC AI+ 3MG | |
| GMK NucBox K16 | |
| GTA V - 1920x1080 Highest AA:4xMSAA + FX AF:16x | |
| MSI Cubi NUC AI+ 2MG | |
| MSI Cubi NUC AI+ 3MG | |
| Asus NUC 15 Pro+ | |
| GMK EVO-T1 | |
| GMK NucBox K16 | |
| MSI Cubi NUC 1M | |
| Geekom A5 Pro | |
| Final Fantasy XV Benchmark - 1920x1080 High Quality | |
| GMK EVO-T1 | |
| Asus NUC 15 Pro+ | |
| MSI Cubi NUC AI+ 2MG | |
| MSI Cubi NUC AI+ 3MG | |
| MSI Cubi NUC 1M | |
| GMK NucBox K16 | |
| Geekom A5 Pro | |
| Strange Brigade - 1920x1080 ultra AA:ultra AF:16 | |
| MSI Cubi NUC AI+ 2MG | |
| Asus NUC 15 Pro+ | |
| MSI Cubi NUC AI+ 3MG | |
| GMK NucBox K16 | |
| MSI Cubi NUC 1M | |
| Dota 2 Reborn - 1920x1080 ultra (3/3) best looking | |
| Asus NUC 15 Pro+ | |
| GMK EVO-T1 | |
| MSI Cubi NUC AI+ 3MG | |
| MSI Cubi NUC AI+ 2MG | |
| MSI Cubi NUC 1M | |
| GMK NucBox K16 | |
| Geekom A5 Pro | |
| X-Plane 11.11 - 1920x1080 high (fps_test=3) | |
| Asus NUC 15 Pro+ | |
| GMK EVO-T1 | |
| MSI Cubi NUC AI+ 2MG | |
| GMK NucBox K16 | |
| MSI Cubi NUC AI+ 3MG | |
| Geekom A5 Pro | |
| F1 24 | |
| 1920x1080 Low Preset AA:T AF:16x | |
| GMK EVO-T1 | |
| Asus NUC 15 Pro+ | |
| MSI Cubi NUC AI+ 2MG | |
| MSI Cubi NUC AI+ 3MG | |
| Average Intel Graphics 4 Xe3 Panther Lake iGPU (55.6 - 69.3, n=7) | |
| GMK NucBox K16 | |
| Geekom A5 Pro | |
| 1920x1080 Medium Preset AA:T AF:16x | |
| GMK EVO-T1 | |
| Asus NUC 15 Pro+ | |
| MSI Cubi NUC AI+ 3MG | |
| Average Intel Graphics 4 Xe3 Panther Lake iGPU (52.7 - 64.3, n=7) | |
| GMK NucBox K16 | |
| Geekom A5 Pro | |
| 1920x1080 High Preset AA:T AF:16x | |
| GMK EVO-T1 | |
| Asus NUC 15 Pro+ | |
| MSI Cubi NUC AI+ 2MG | |
| MSI Cubi NUC AI+ 3MG | |
| Average Intel Graphics 4 Xe3 Panther Lake iGPU (40.8 - 48, n=7) | |
| GMK NucBox K16 | |
| Geekom A5 Pro | |
| 1920x1080 Ultra High Preset AA:T AF:16x | |
| GMK EVO-T1 | |
| Asus NUC 15 Pro+ | |
| MSI Cubi NUC AI+ 2MG | |
| Average Intel Graphics 4 Xe3 Panther Lake iGPU (13.2 - 15.1, n=7) | |
| MSI Cubi NUC AI+ 3MG | |
| GMK NucBox K16 | |
赛博朋克 2077》超 FPS 图表
| low | med. | high | ultra | |
|---|---|---|---|---|
| GTA V (2015) | 157.9 | 149.5 | 51.1 | 20.4 |
| Dota 2 Reborn (2015) | 104.1 | 80.3 | 81.2 | 79.9 |
| Final Fantasy XV Benchmark (2018) | 64.3 | 34.6 | 25.1 | |
| X-Plane 11.11 (2018) | 41.7 | 33.2 | 28.6 | |
| Strange Brigade (2018) | 172.6 | 68 | 56.9 | 48.5 |
| Baldur's Gate 3 (2023) | 31.6 | 26.3 | 23.1 | 22.8 |
| Cyberpunk 2077 (2023) | 37.1 | 28.4 | 24.5 | 21.1 |
| F1 24 (2024) | 66.9 | 61.5 | 45.8 | 14.2 |
排放量
系统噪音
无论屏幕负载如何,内部风扇始终处于活动状态,这与我们在旧款 Cubi 机型上观察到的情况非常相似。在办公室或零售环境中,它足够安静,不会出现重大的节流问题,不会被人察觉,但当长时间运行要求较高的负载时,它的噪音会上升到 40 分贝(A)左右,不亚于某些游戏笔记本电脑。
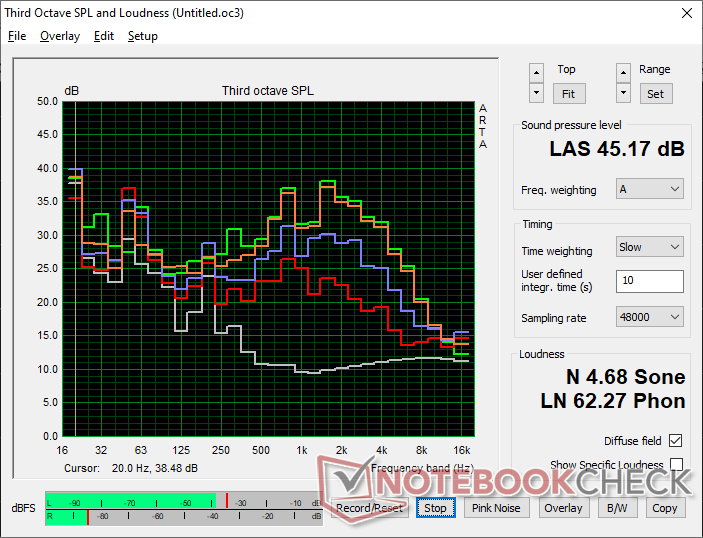
Noise level
| Idle |
| 28 / 33.2 / 33.5 dB(A) |
| Load |
| 39.1 / 45.2 dB(A) |
 | ||
30 dB silent 40 dB(A) audible 50 dB(A) loud |
||
min: | ||
| MSI Cubi NUC AI+ 3MG Ultra 9 386H, Intel Graphics 4 Xe3 PTL | GMK NucBox K16 R7 7735HS, Radeon 680M | GMK EVO-T1 Ultra 9 285H, Arc 140T | Geekom A5 Pro R5 7530U, Vega 7 | Asus NUC 15 Pro+ Ultra 9 285H, Arc 140T | MSI Cubi NUC AI+ 2MG Core Ultra 7 258V, Arc 140V | MSI Cubi NUC 1M Core 7 150U, Iris Xe G7 96EUs | |
|---|---|---|---|---|---|---|---|
| Noise | -6% | -20% | 15% | -3% | -2% | 6% | |
| off / environment * (dB) | 23.6 | 23.6 -0% | 24.7 -5% | 25 -6% | 25.3 -7% | 24.8 -5% | 23.5 -0% |
| Idle Minimum * (dB) | 28 | 30.9 -10% | 38.7 -38% | 26.6 5% | 25.4 9% | 28 -0% | 29.9 -7% |
| Idle Average * (dB) | 33.2 | 31.6 5% | 38.8 -17% | 26.6 20% | 25.5 23% | 36.1 -9% | 29.9 10% |
| Idle Maximum * (dB) | 33.5 | 31.6 6% | 38.9 -16% | 26.7 20% | 37.3 -11% | 36.1 -8% | 32 4% |
| Load Average * (dB) | 39.1 | 45.3 -16% | 51.6 -32% | 33.5 14% | 44.4 -14% | 38.9 1% | 33.5 14% |
| Cyberpunk 2077 ultra * (dB) | 44.4 | 49.2 -11% | 52 -17% | 31.2 30% | 46.2 -4% | 37 17% | 39.1 12% |
| Load Maximum * (dB) | 45.2 | 51.7 -14% | 51.6 -14% | 33.8 25% | 52.7 -17% | 49.2 -9% | 40.5 10% |
| Witcher 3 ultra * (dB) | 38.7 | 31.2 | 47.7 |
* ... smaller is better
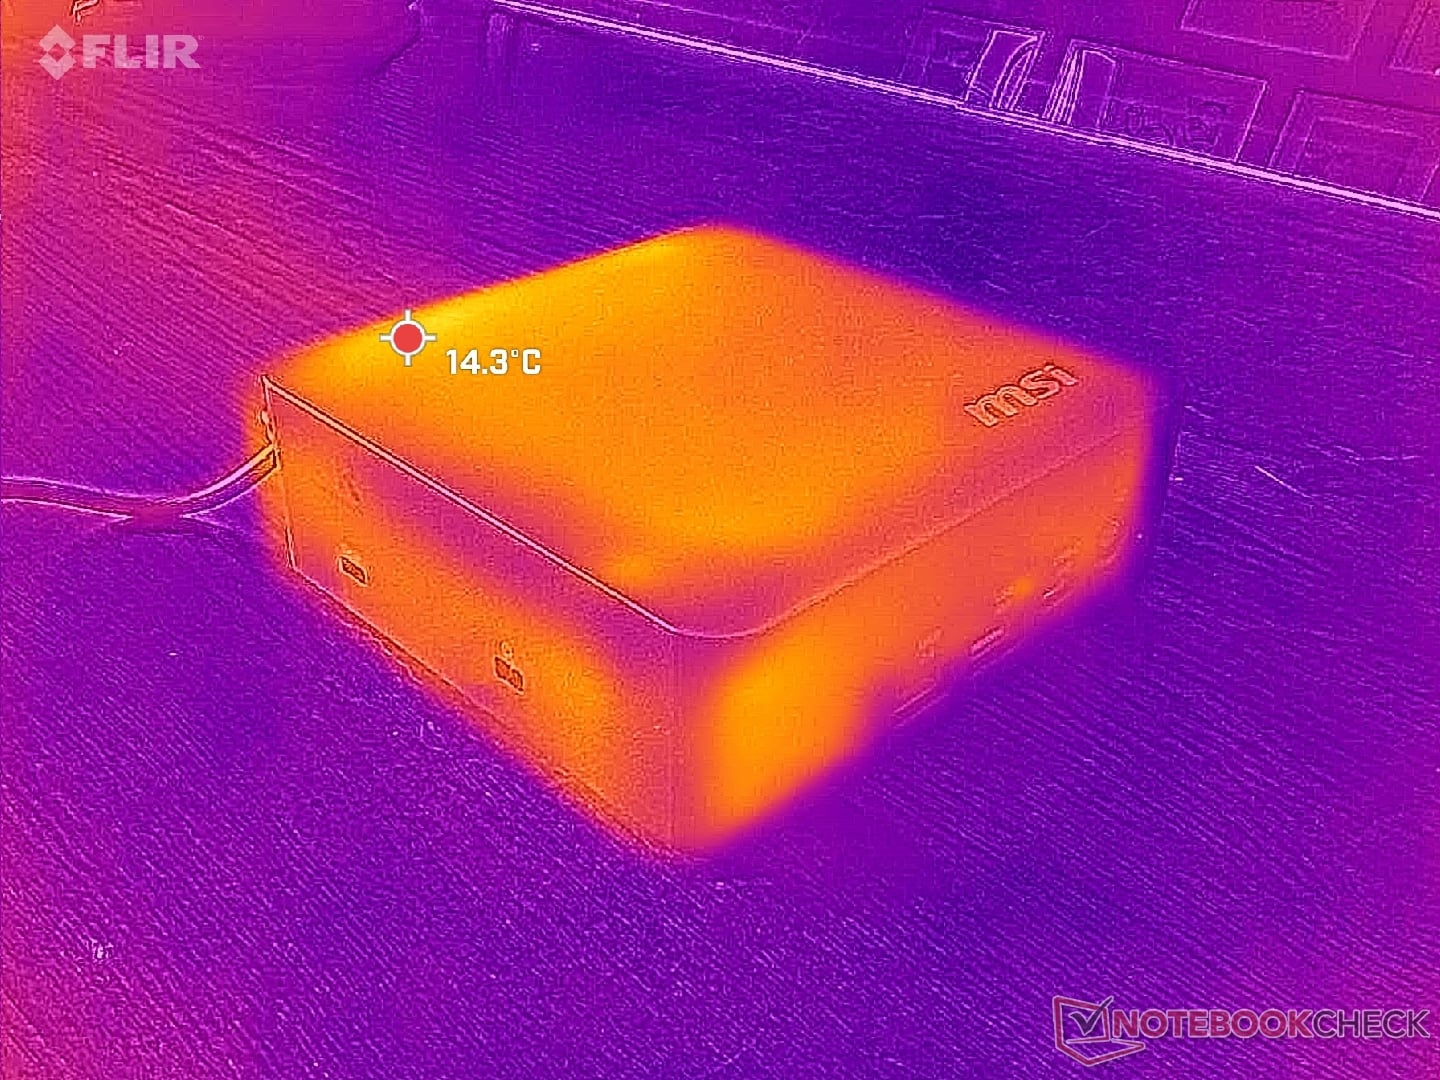
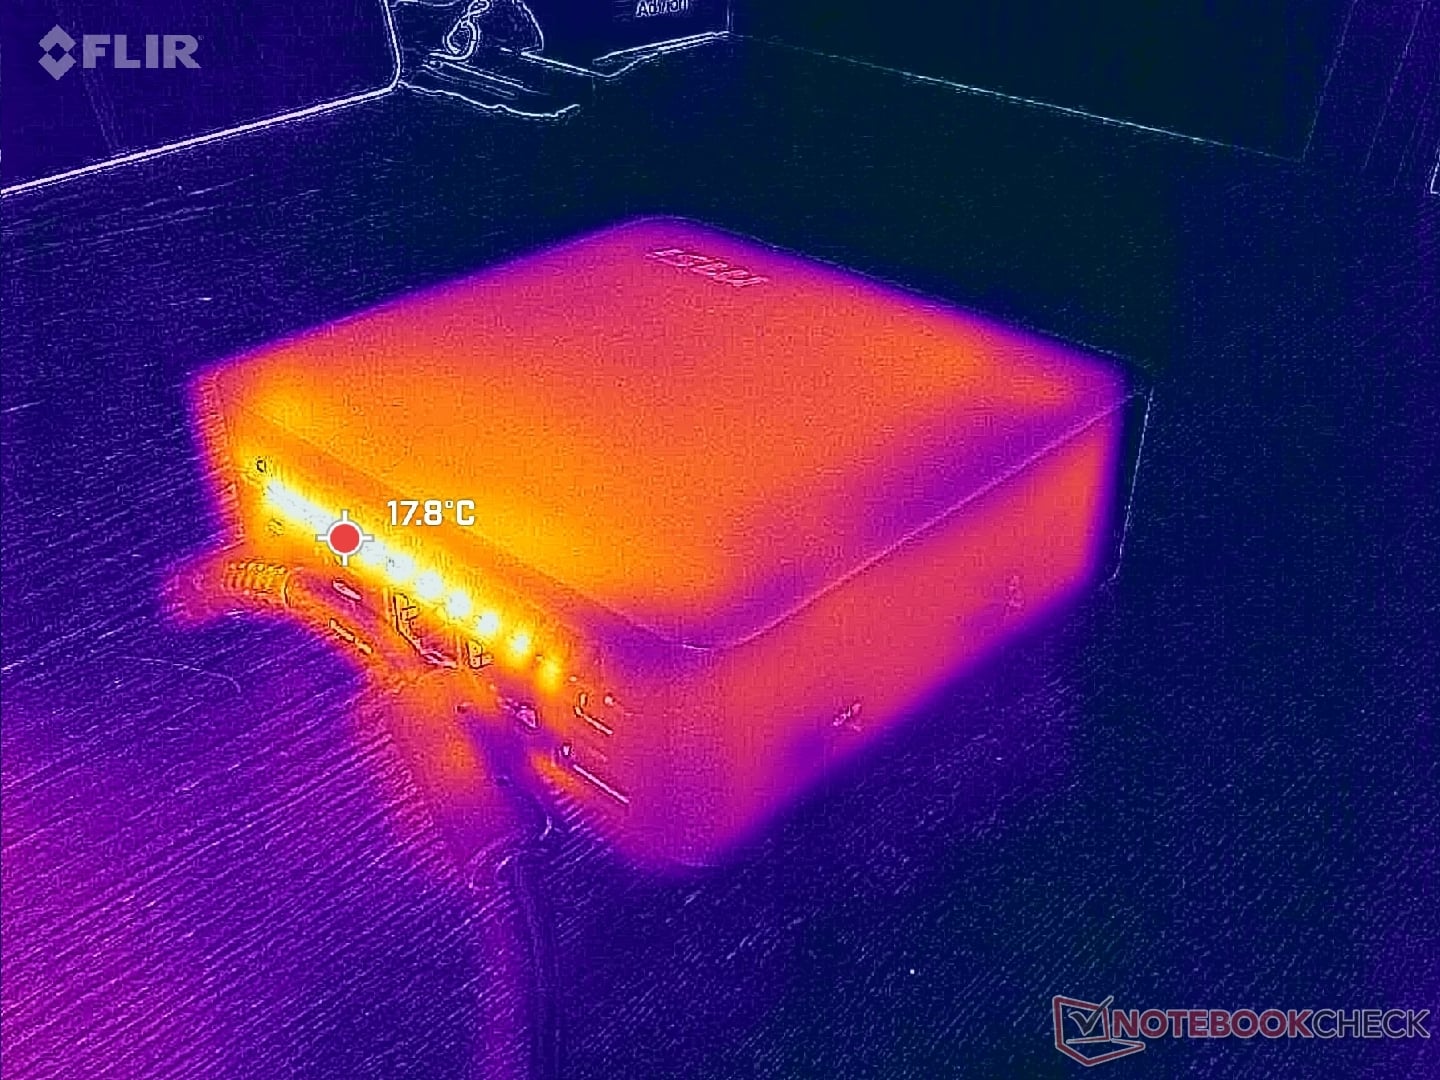
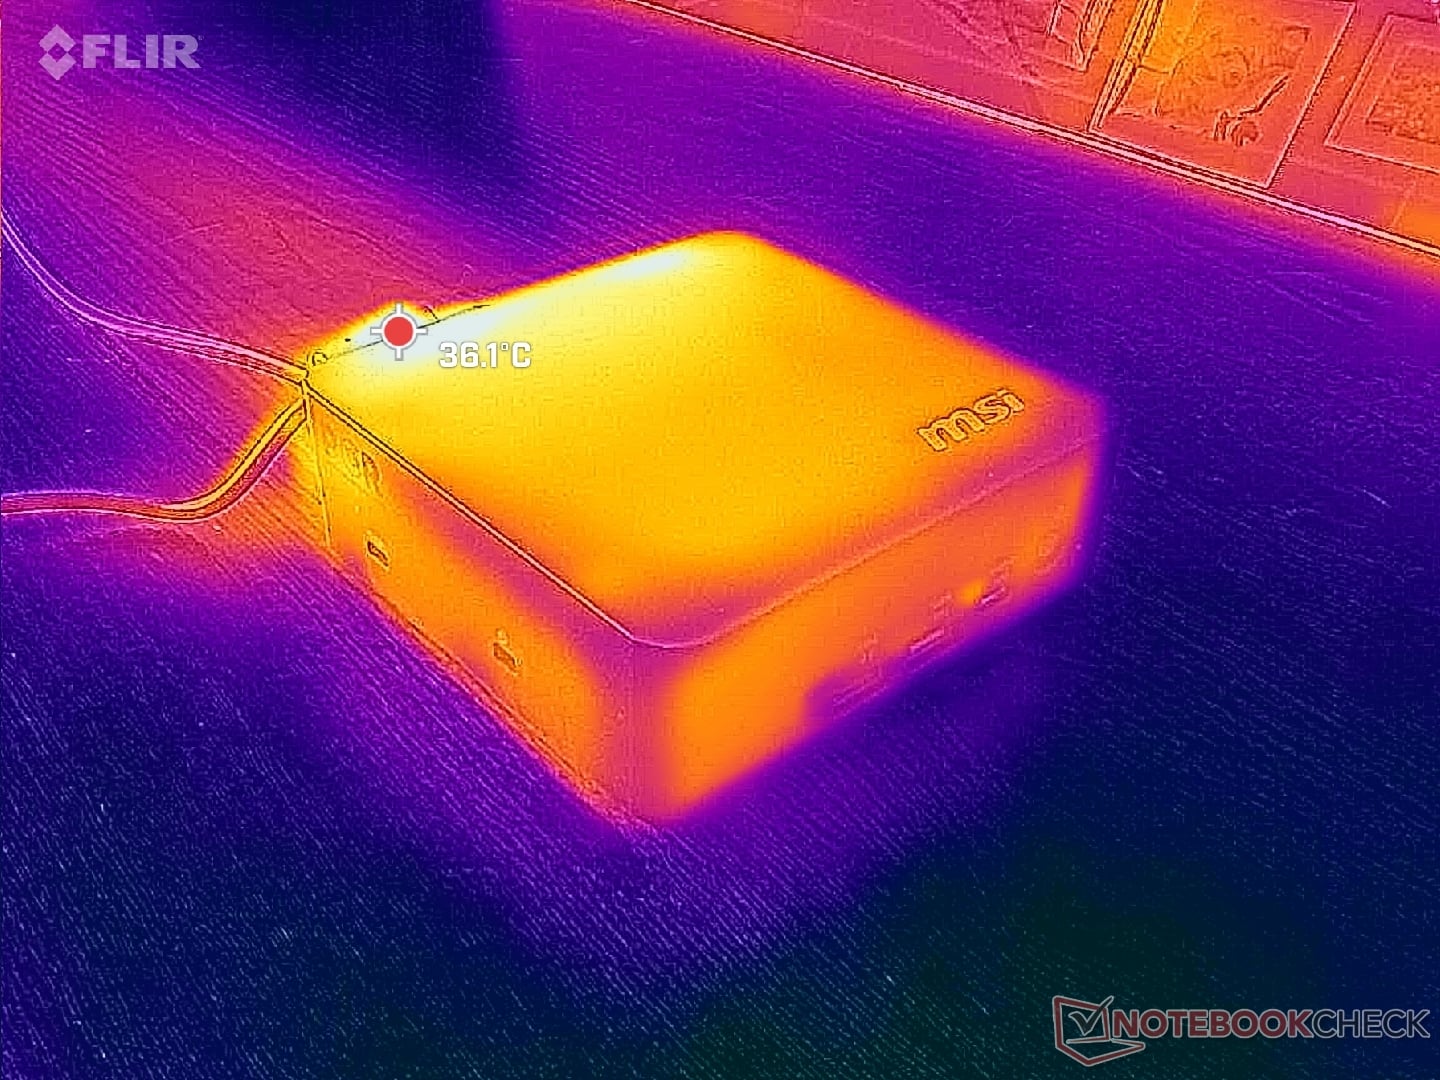
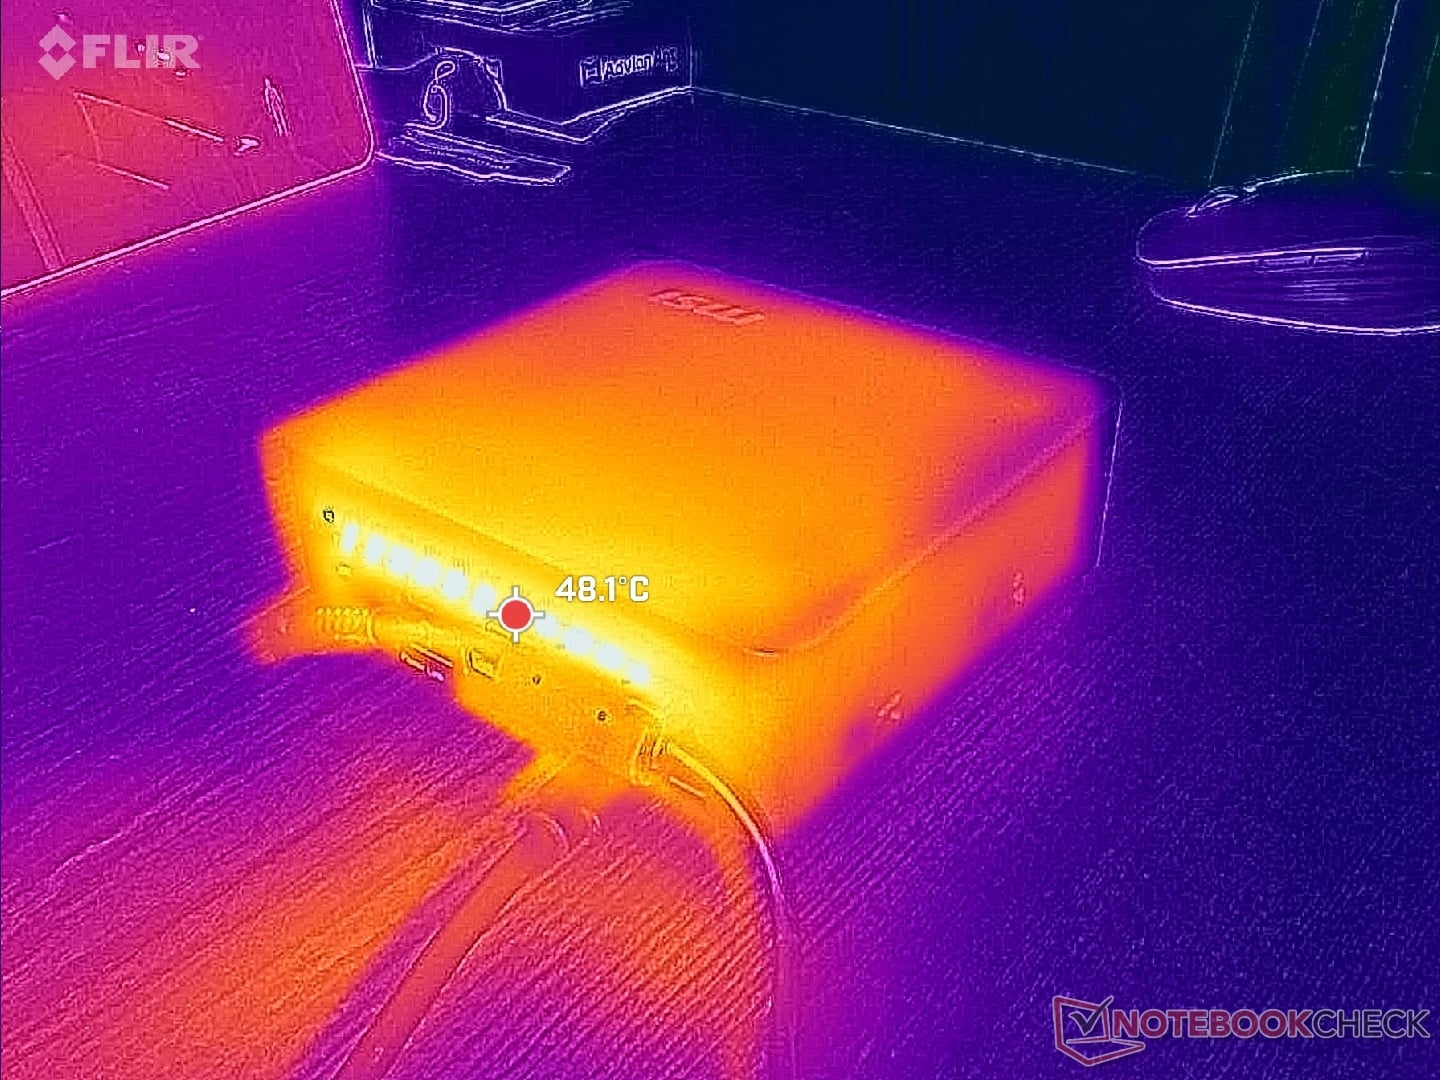
温度
表面温度相对较低,部分原因是采用了塑料机箱和高效 CPU。后部温度略高于前部,这在意料之中。
与某些替代产品(如 GMK EVO 系列.
(+) The maximum temperature on the upper side is 36.2 °C / 97 F, compared to the average of 35.4 °C / 96 F, ranging from 20.6 to 69.5 °C for the class Mini PC.
(+) The bottom heats up to a maximum of 34.6 °C / 94 F, compared to the average of 36.1 °C / 97 F
(+) In idle usage, the average temperature for the upper side is 22.8 °C / 73 F, compared to the device average of 32.1 °C / 90 F.
| MSI Cubi NUC AI+ 3MG Ultra 9 386H, Intel Graphics 4 Xe3 PTL | GMK NucBox K16 R7 7735HS, Radeon 680M | GMK EVO-T1 Ultra 9 285H, Arc 140T | Geekom A5 Pro R5 7530U, Vega 7 | Asus NUC 15 Pro+ Ultra 9 285H, Arc 140T | MSI Cubi NUC AI+ 2MG Core Ultra 7 258V, Arc 140V | |
|---|---|---|---|---|---|---|
| Heat | 8% | -26% | -8% | -25% | 3% | |
| Maximum Upper Side * (°C) | 36.2 | 28.4 22% | 36.4 -1% | 36.7 -1% | 42.2 -17% | 30.8 15% |
| Maximum Bottom * (°C) | 34.6 | 29.4 15% | 48.5 -40% | 40.5 -17% | 31.3 10% | 26.4 24% |
| Idle Upper Side * (°C) | 23.2 | 23.4 -1% | 29.6 -28% | 23.1 -0% | 34.9 -50% | 26.4 -14% |
| Idle Bottom * (°C) | 22.4 | 23.6 -5% | 30 -34% | 25.1 -12% | 32.2 -44% | 25.4 -13% |
* ... smaller is better
压力测试
在启动 Prime95 压力测试时,CPU 会提升至 3 GHz、61 W 和 92 C。然而,20 秒后,CPU 会降到 2.1 GHz 和 30 W,以维持 88 C 的核心温度。有限的 Turbo Boost 潜能支持我们的功耗和 CineBench R15 观察结果。
运行《赛博朋克 2077》时,核心温度将稳定在 80 摄氏度,而去年的 NUC 2MG 只有 63 摄氏度。
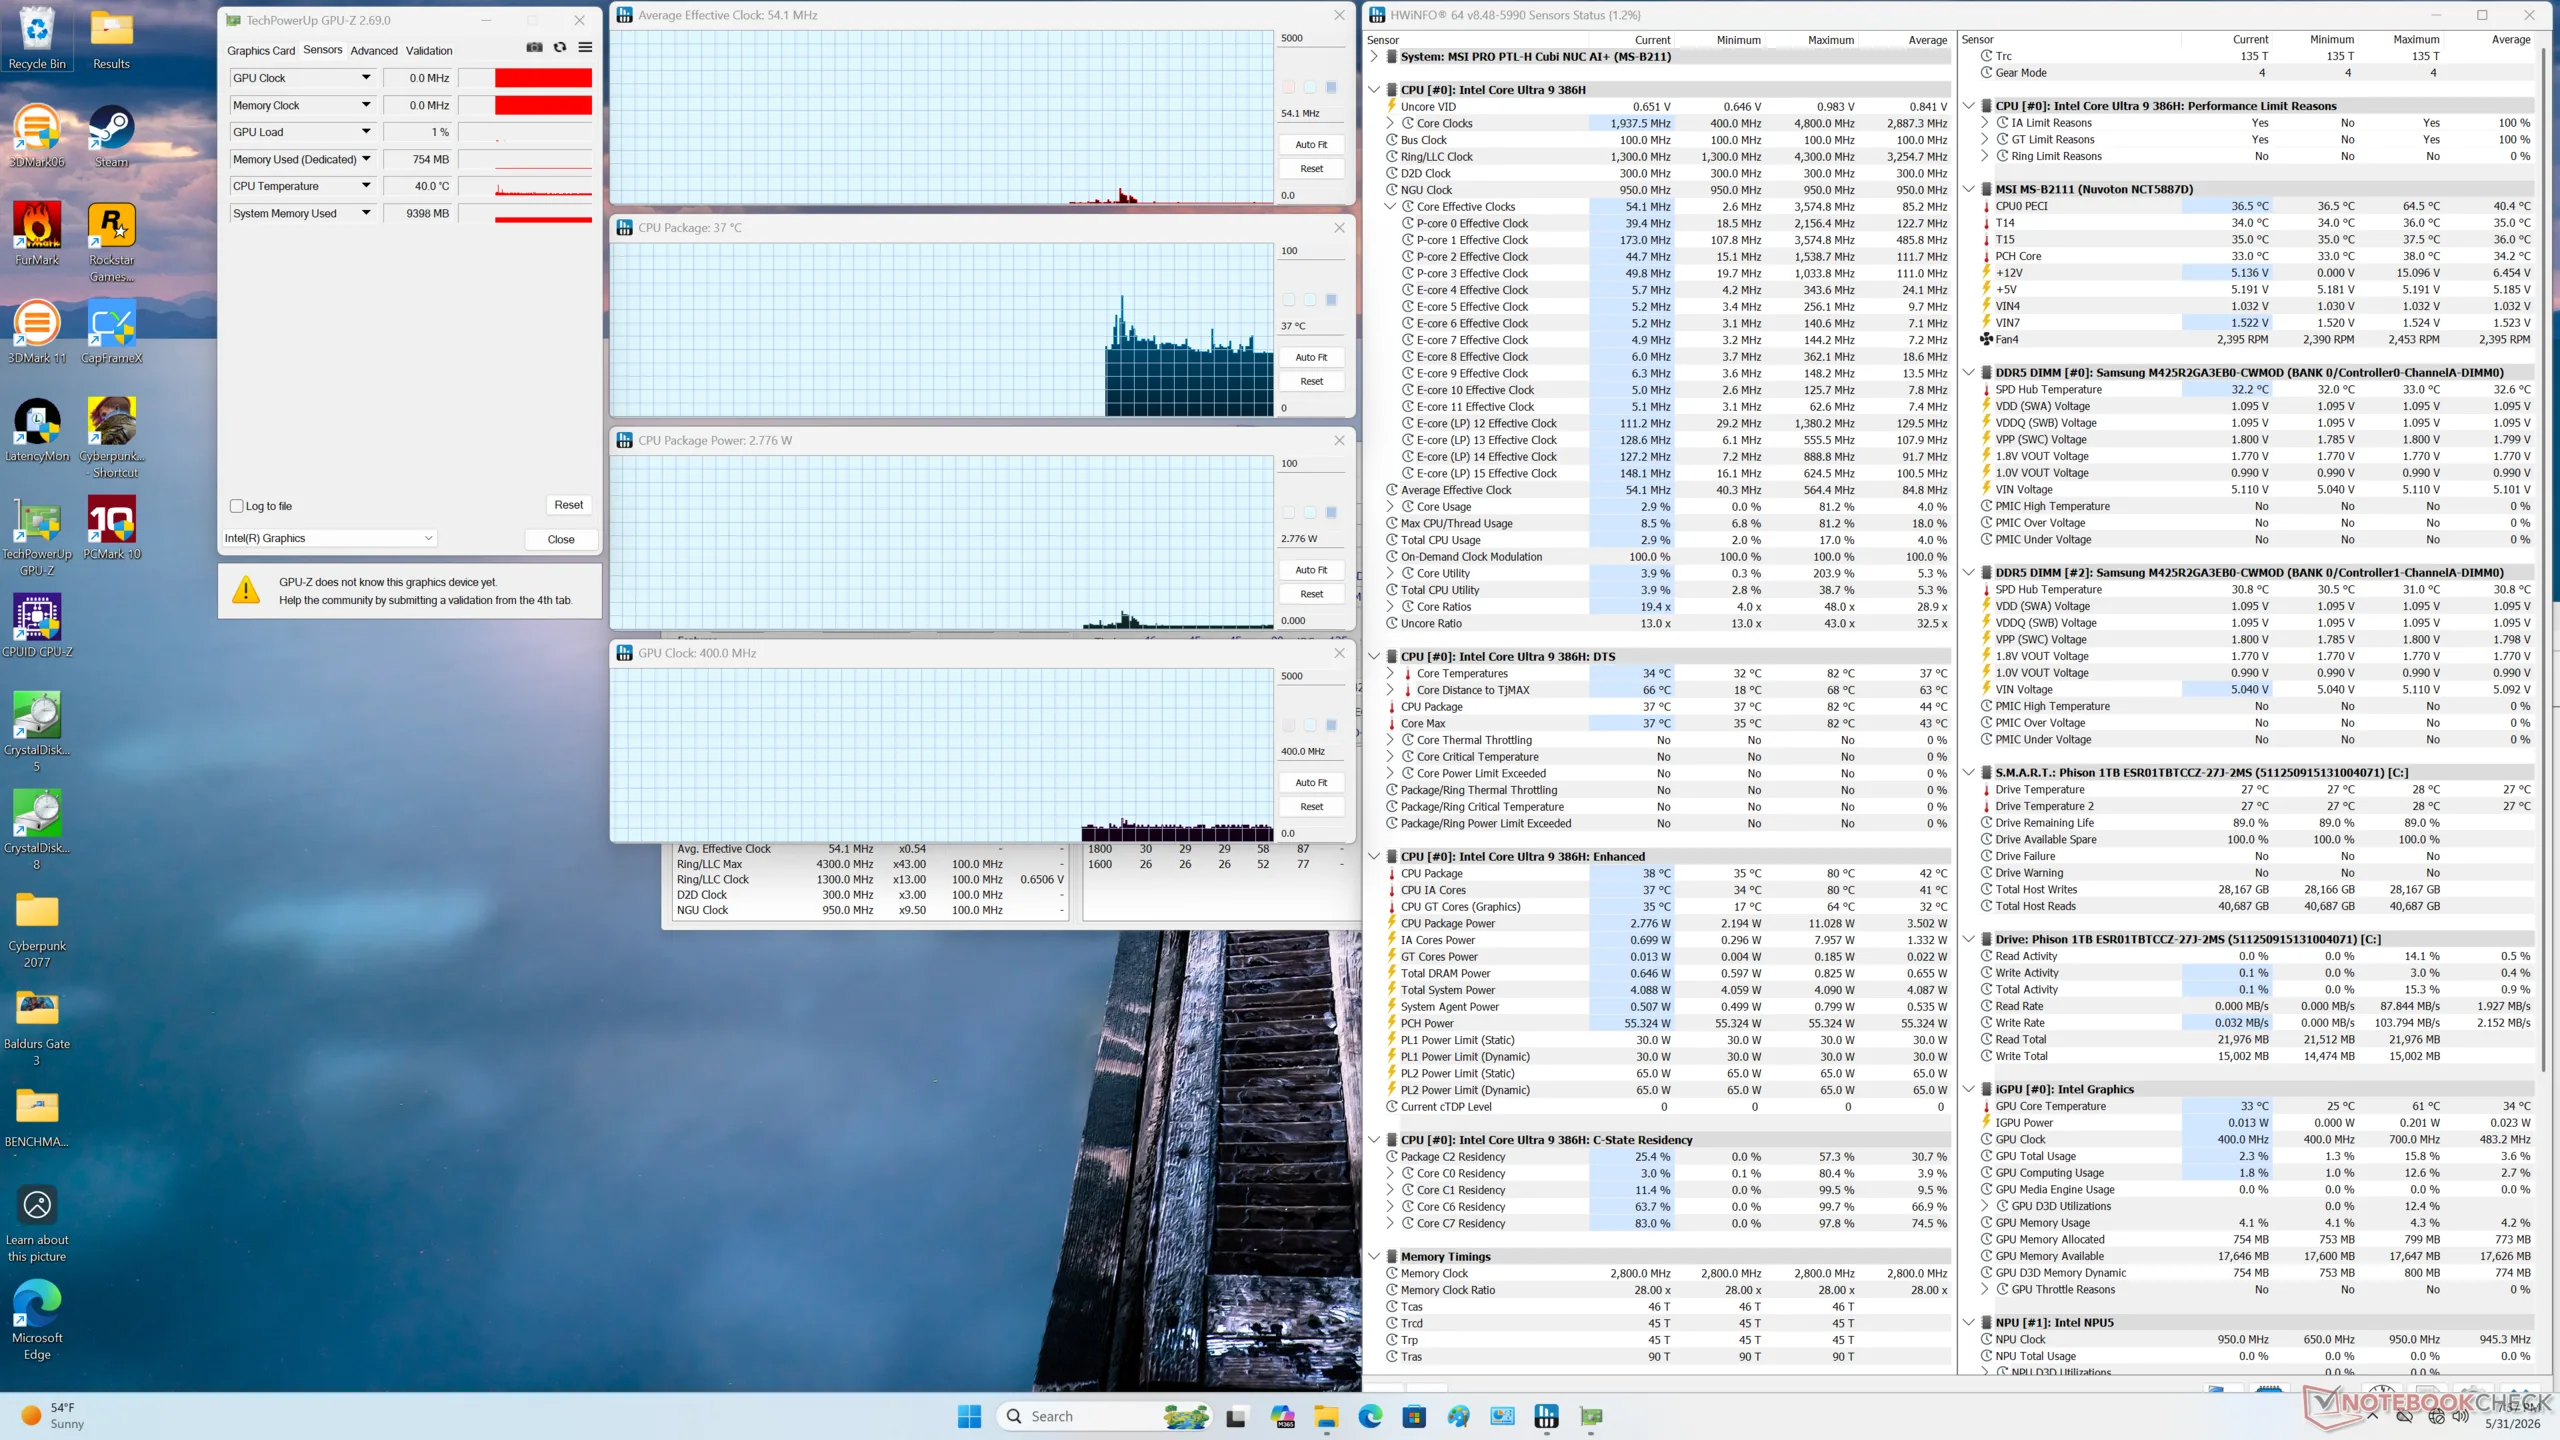
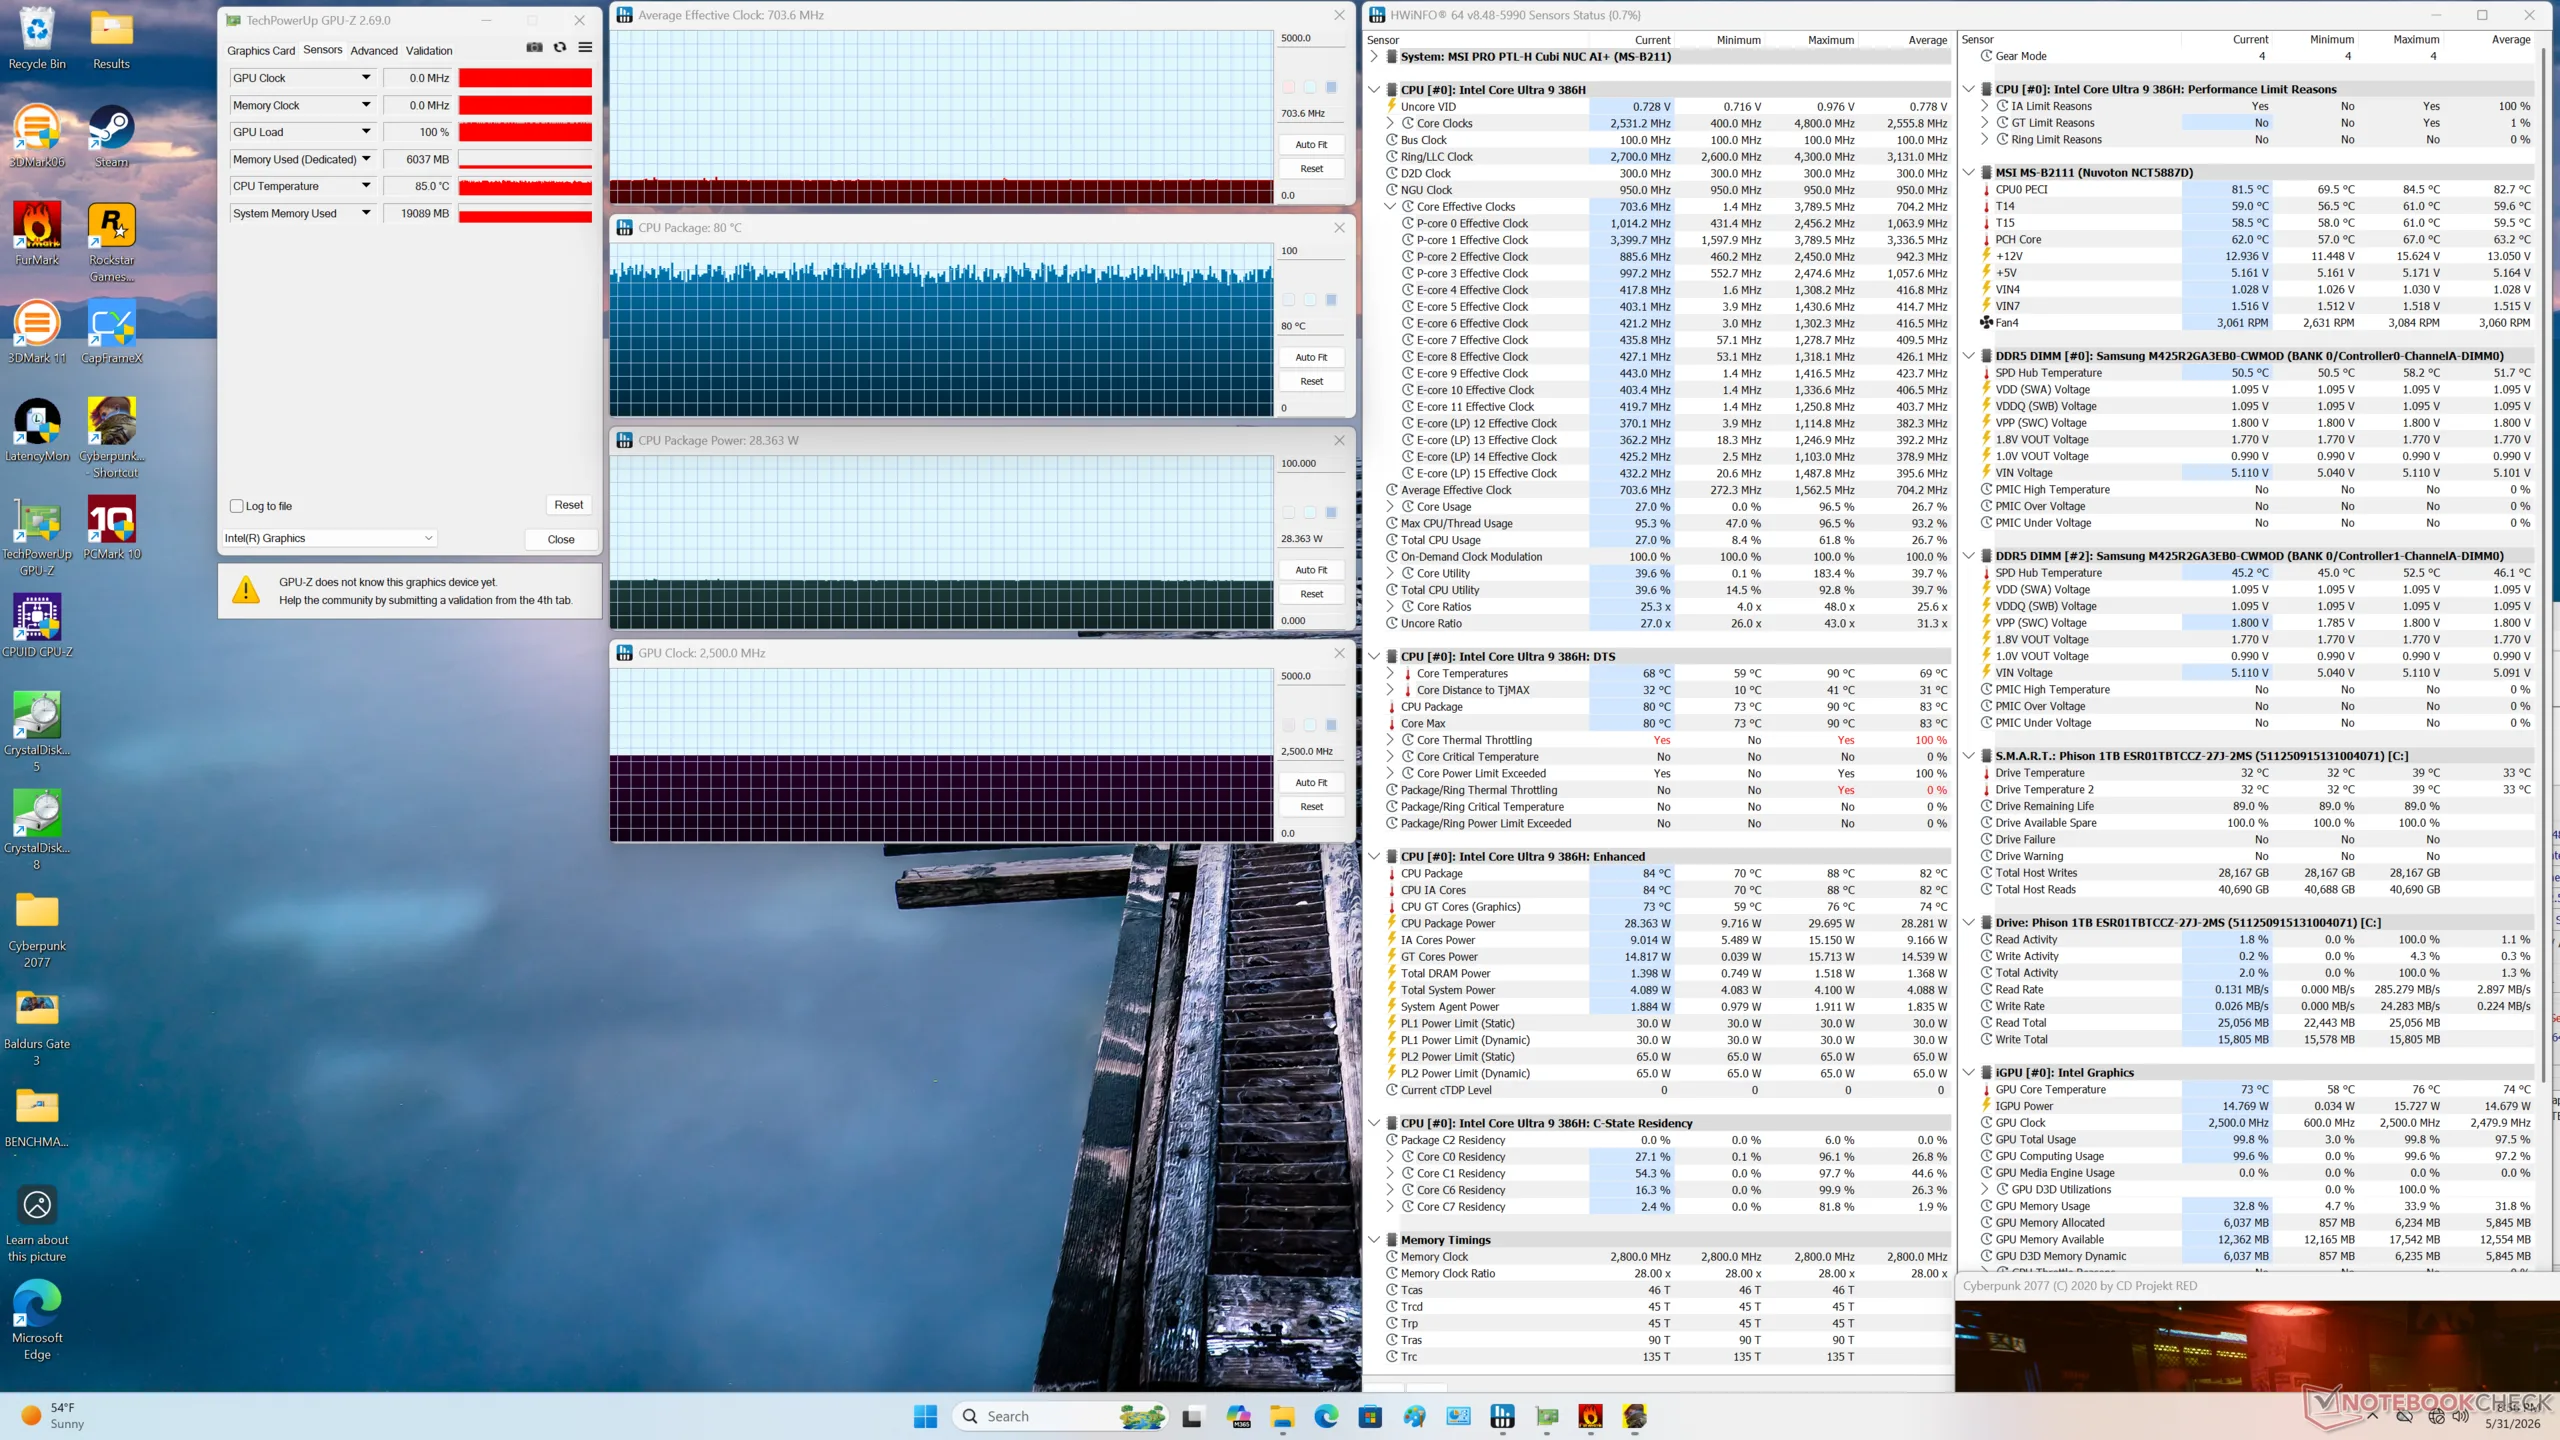
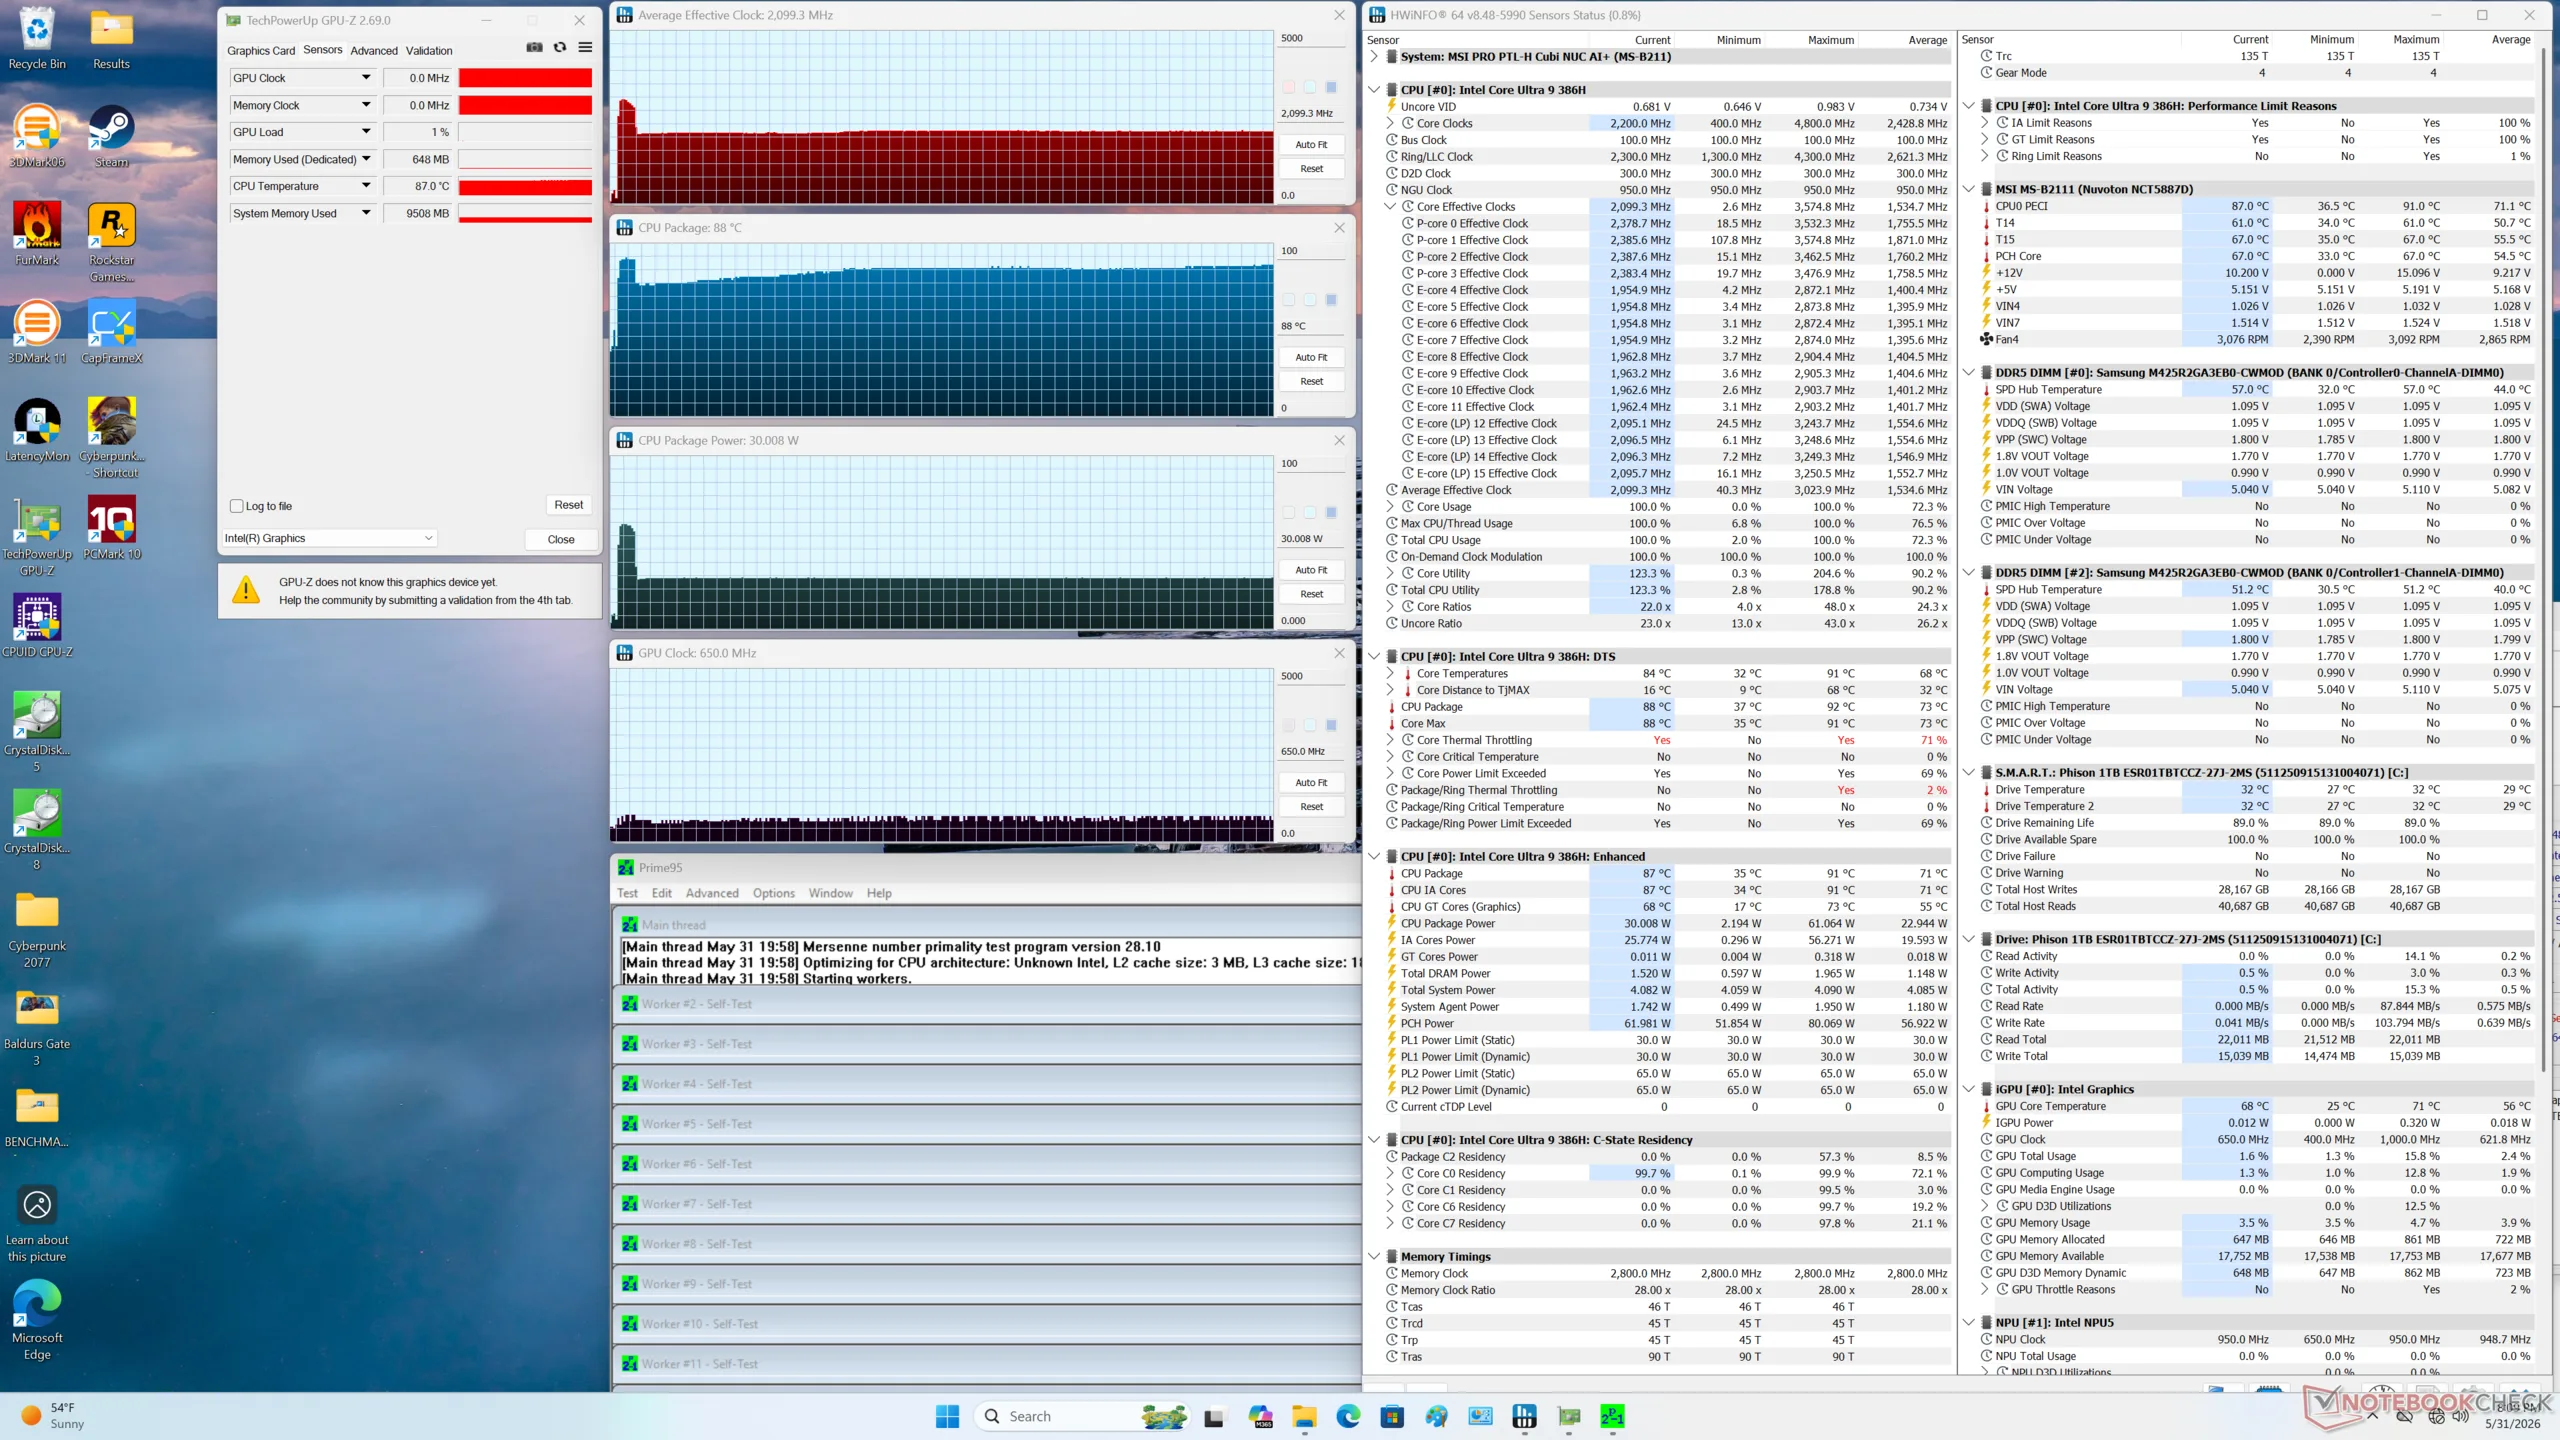
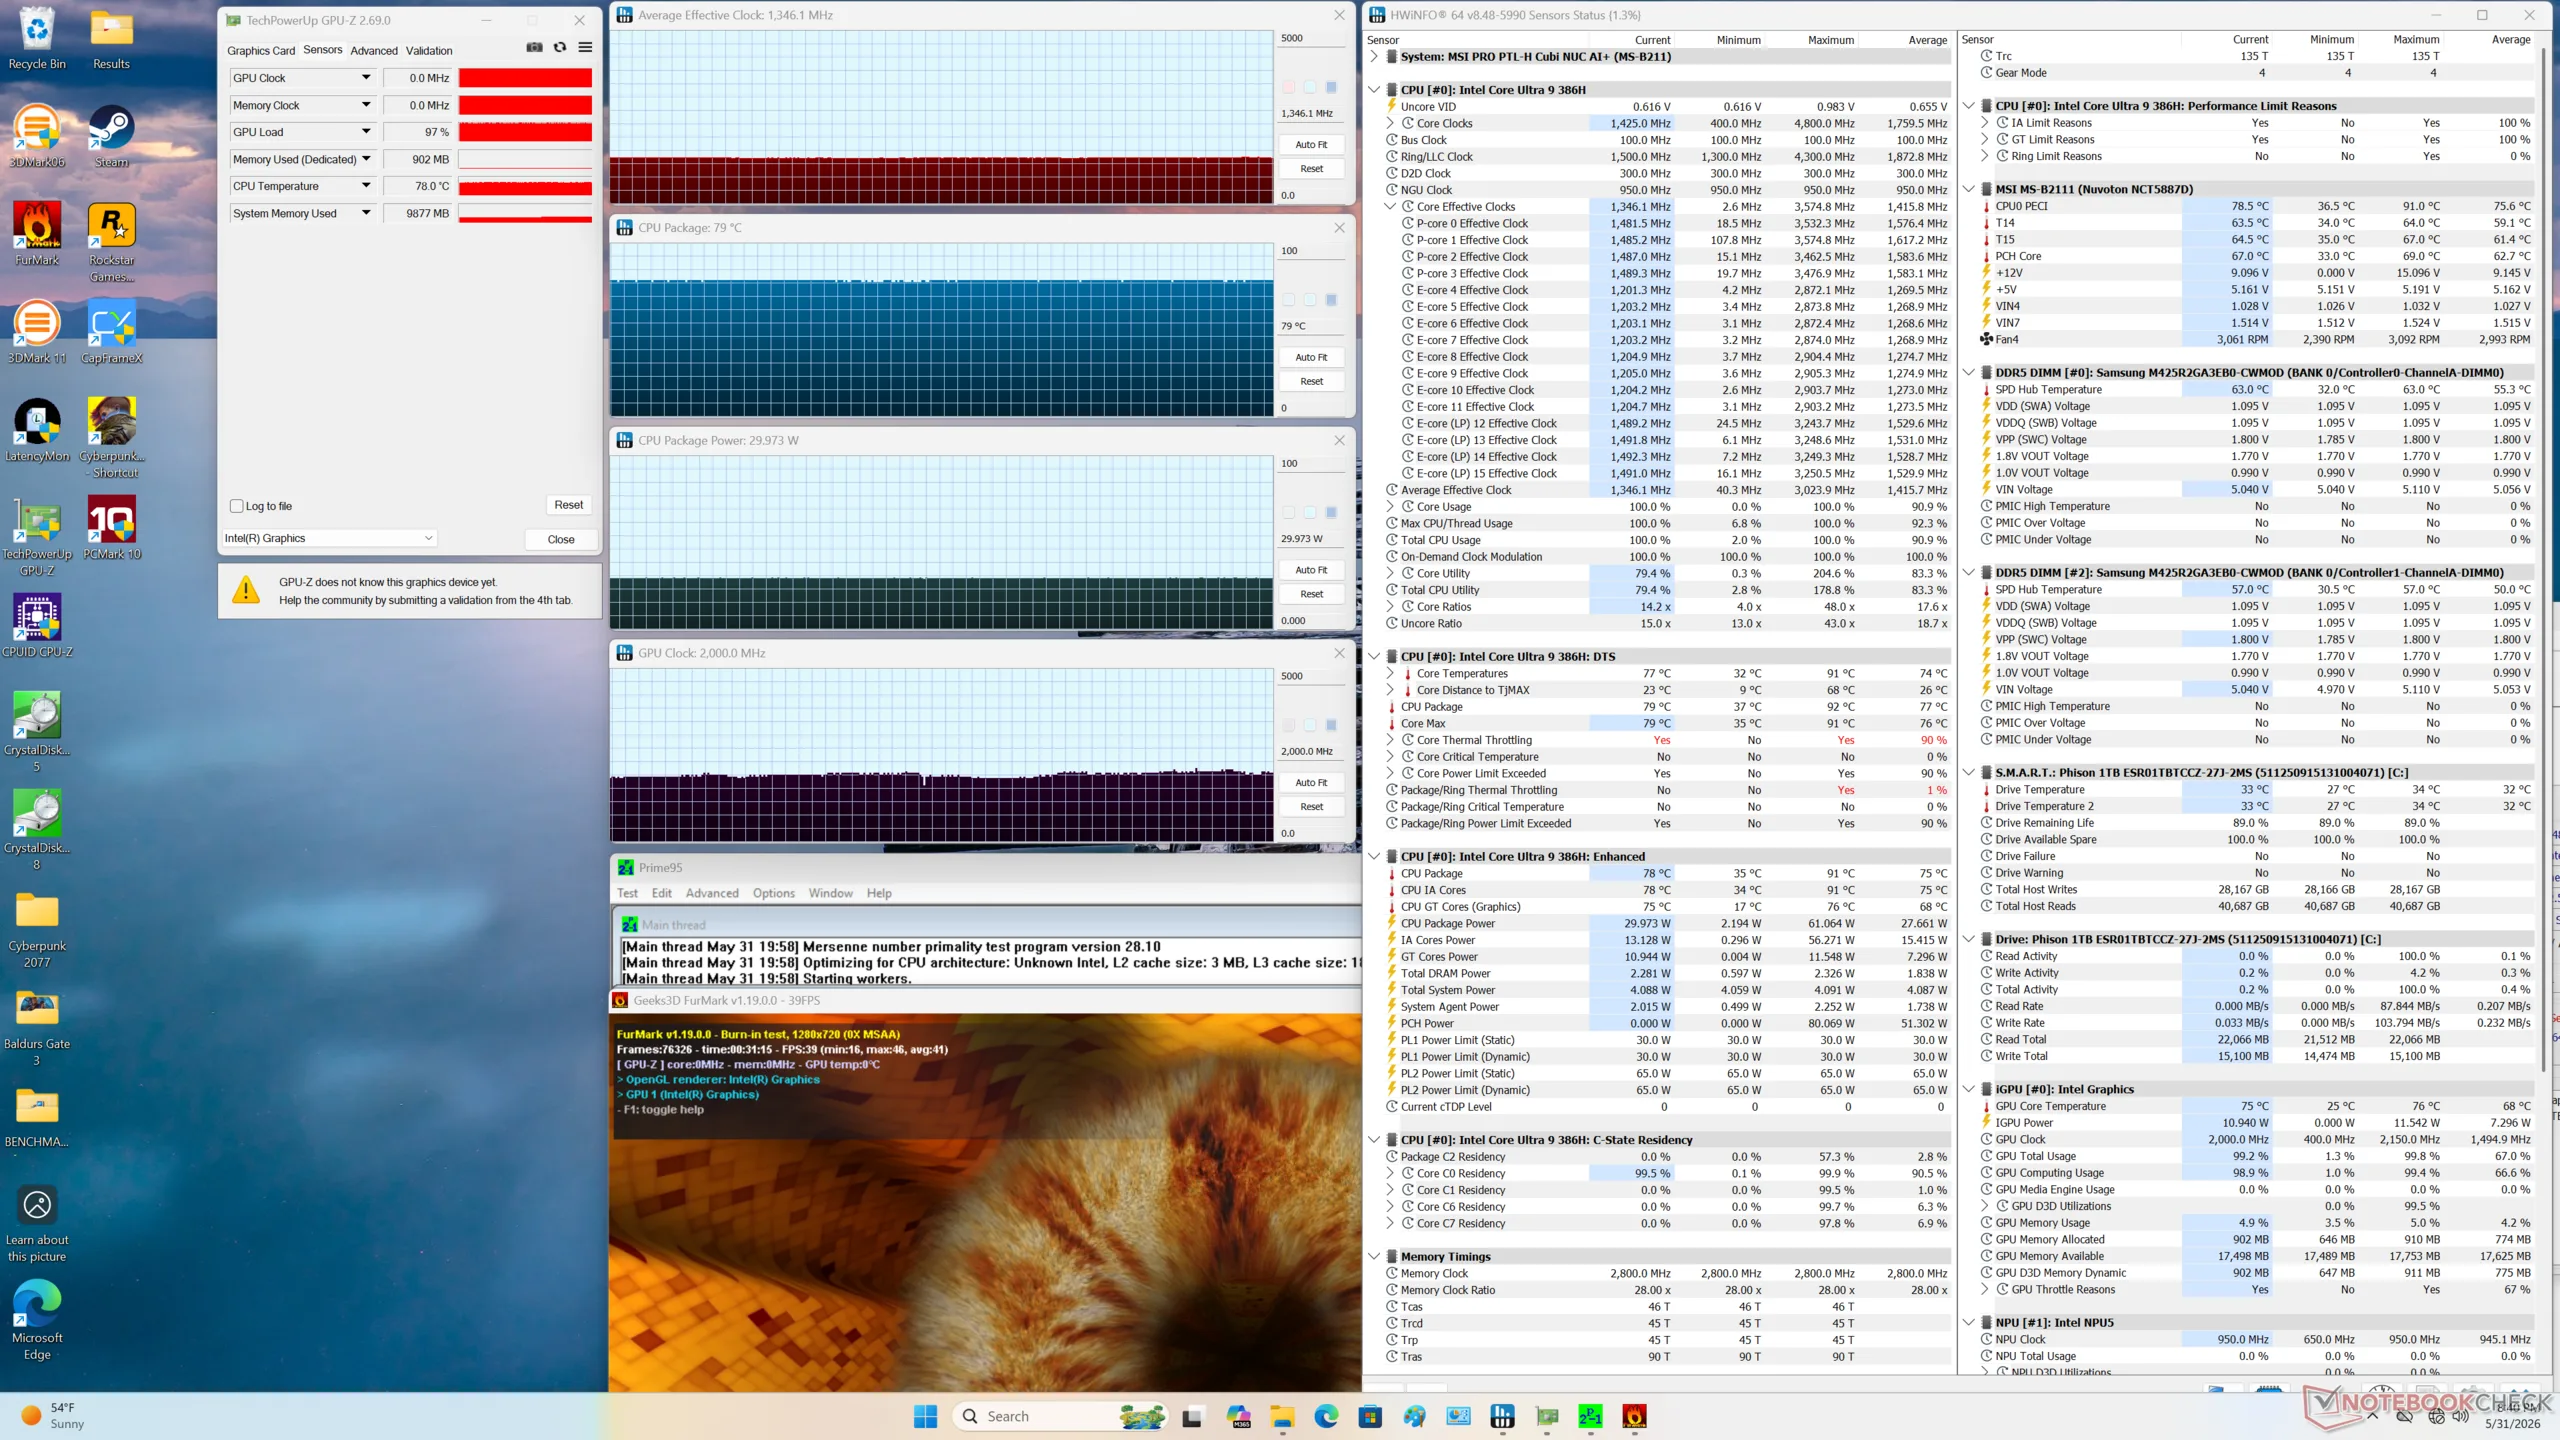
| CPU 平均时钟 (GHz) | GPU 时钟 (MHz) | CPU 平均温度 (°C) | |
| 系统闲置 | -- | -- | 37 |
| Prime95 压力 | 2.1 | -- | 88 |
| Prime95 + FurMark Stress | 1.4 | 2000 | 79 |
| 赛博朋克 2077》压力 | 0.7 | 2500 | ~80 |
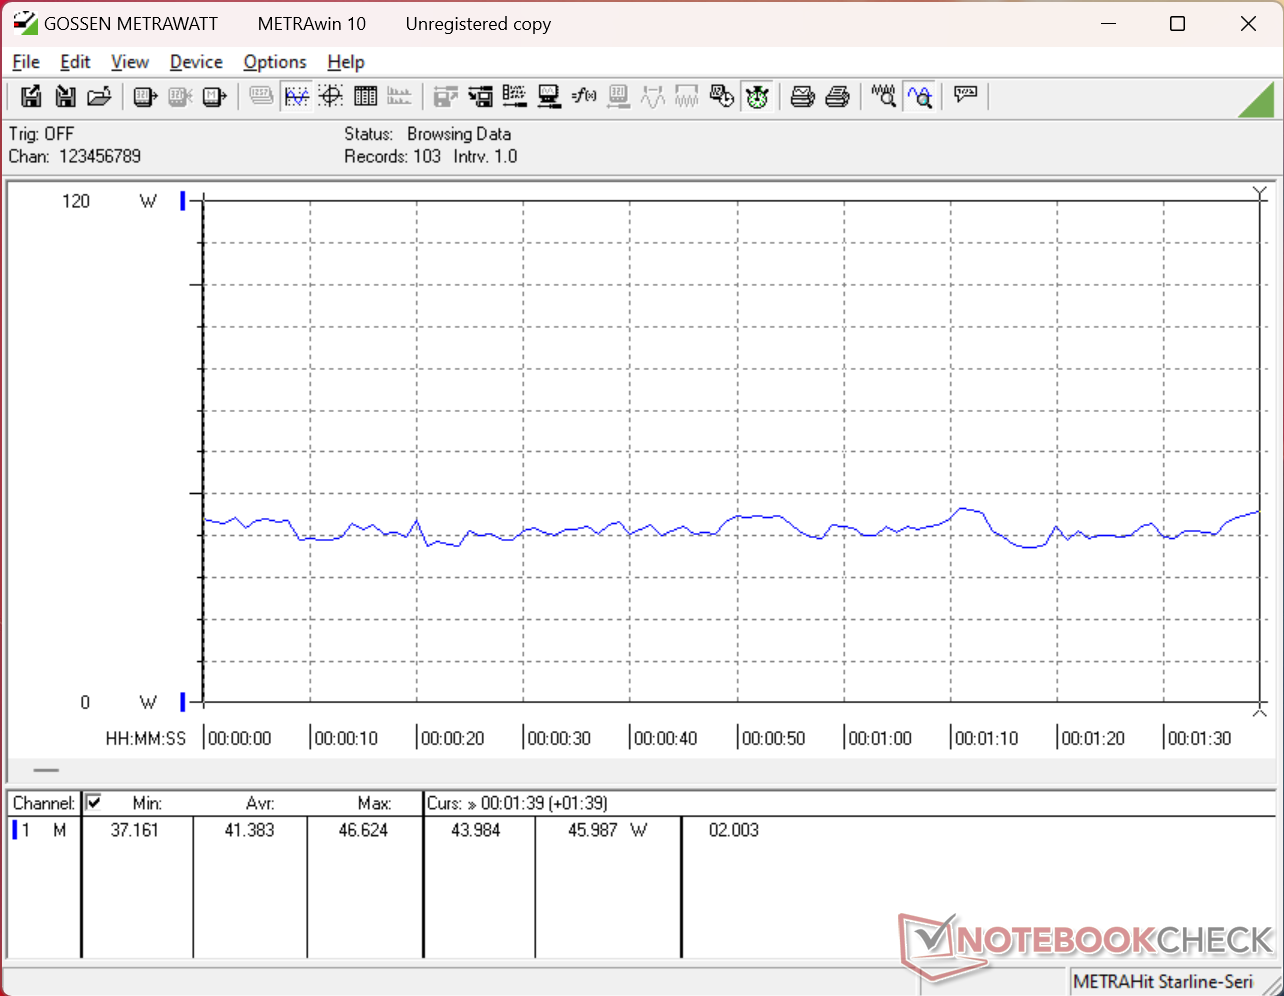
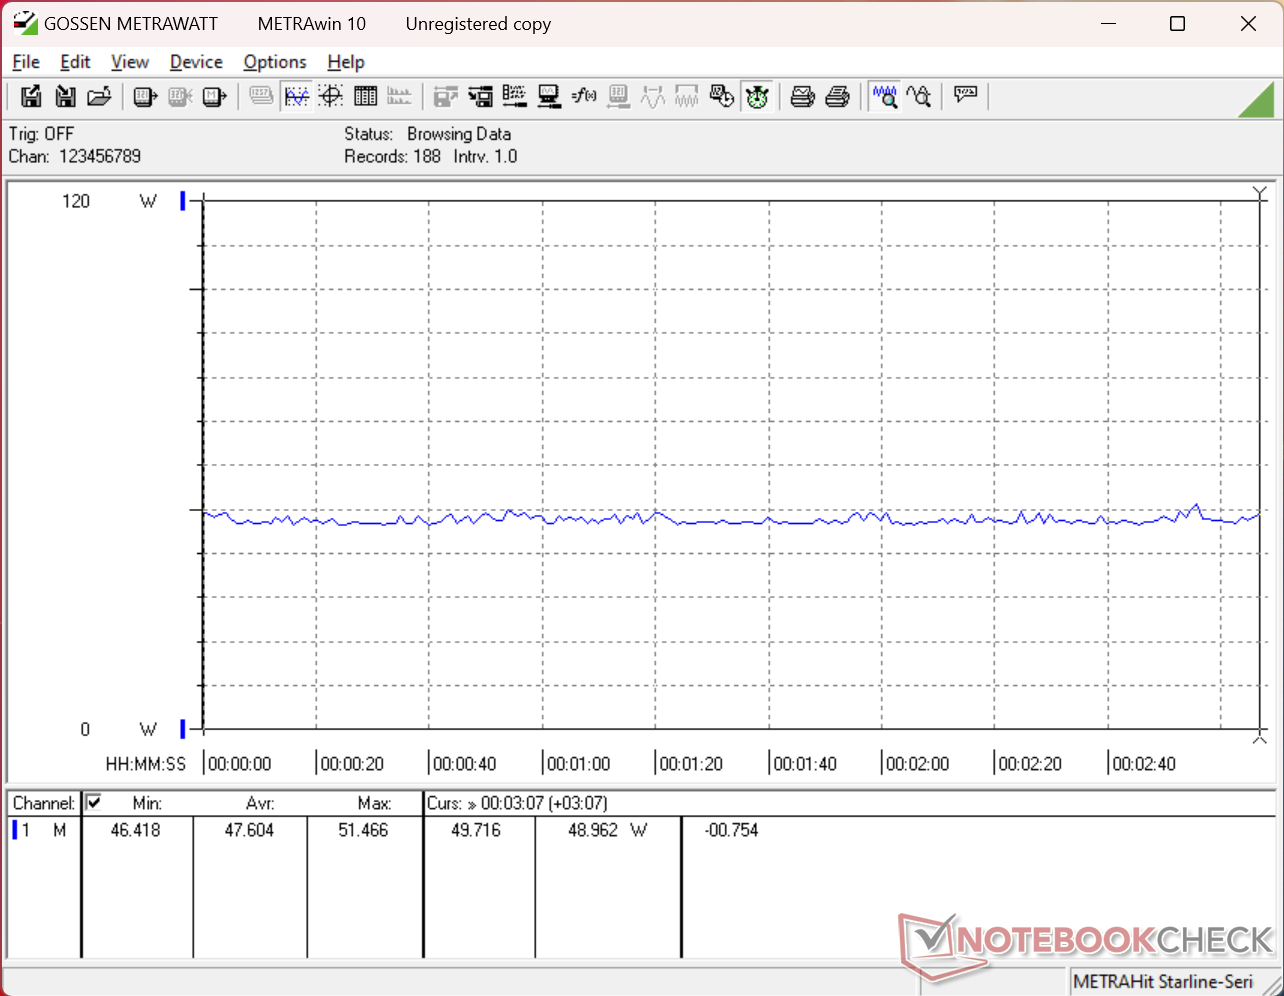
能源管理
耗电量
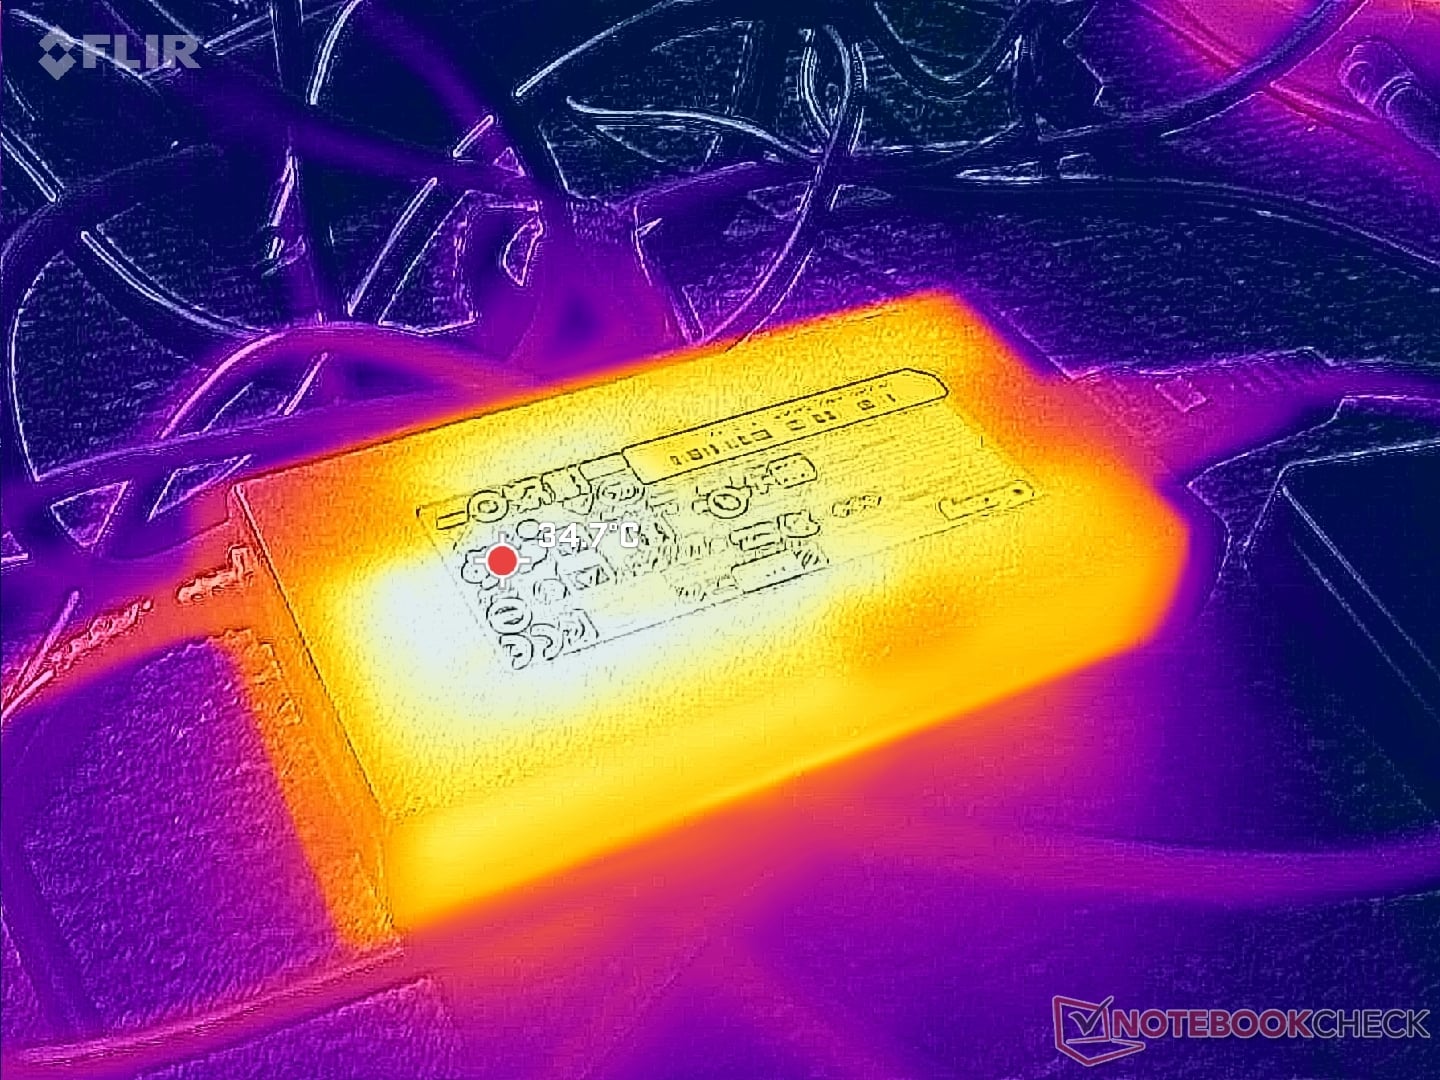
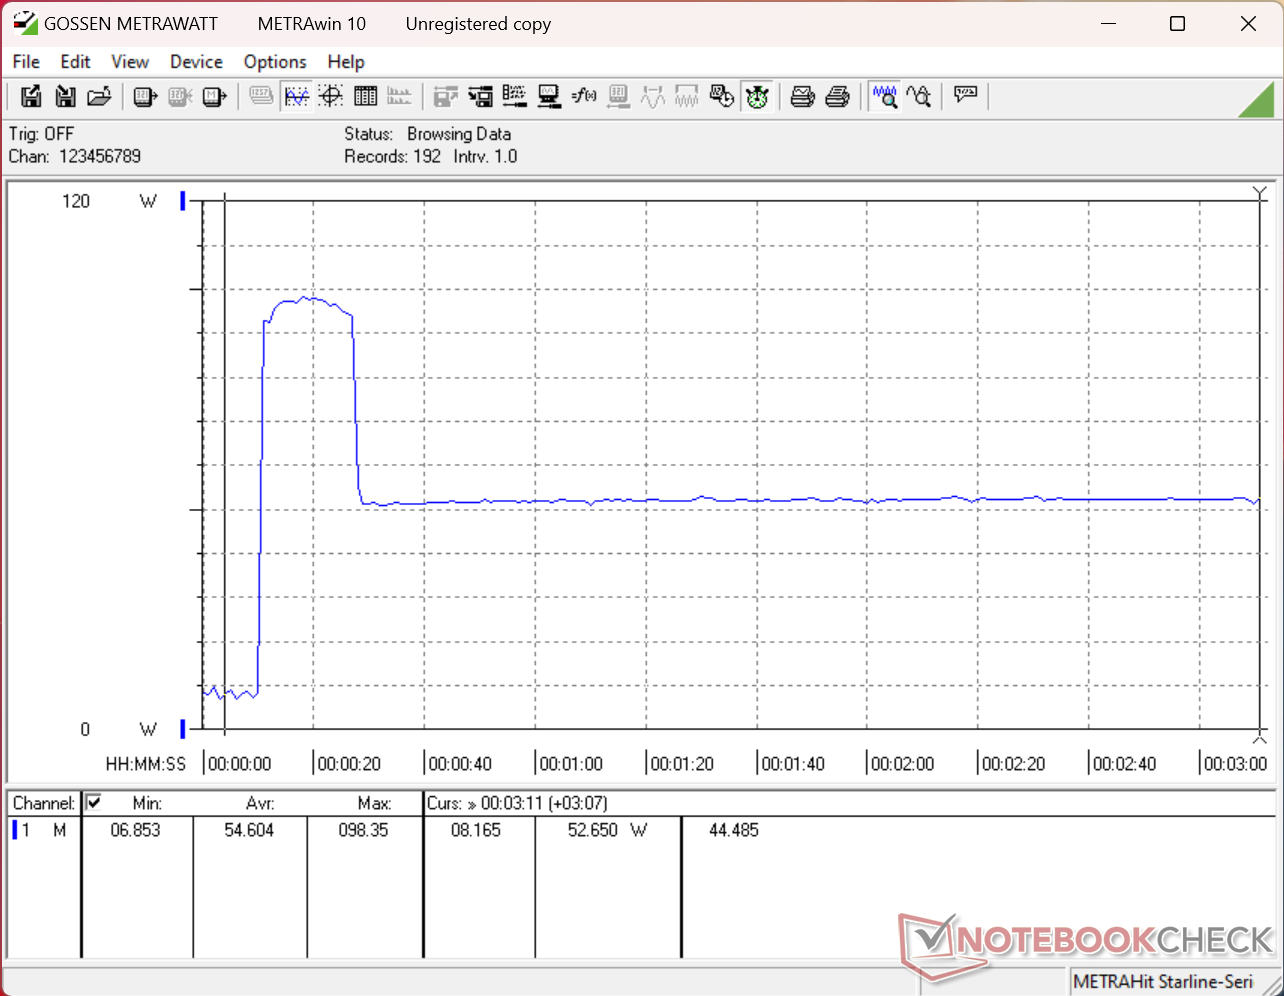
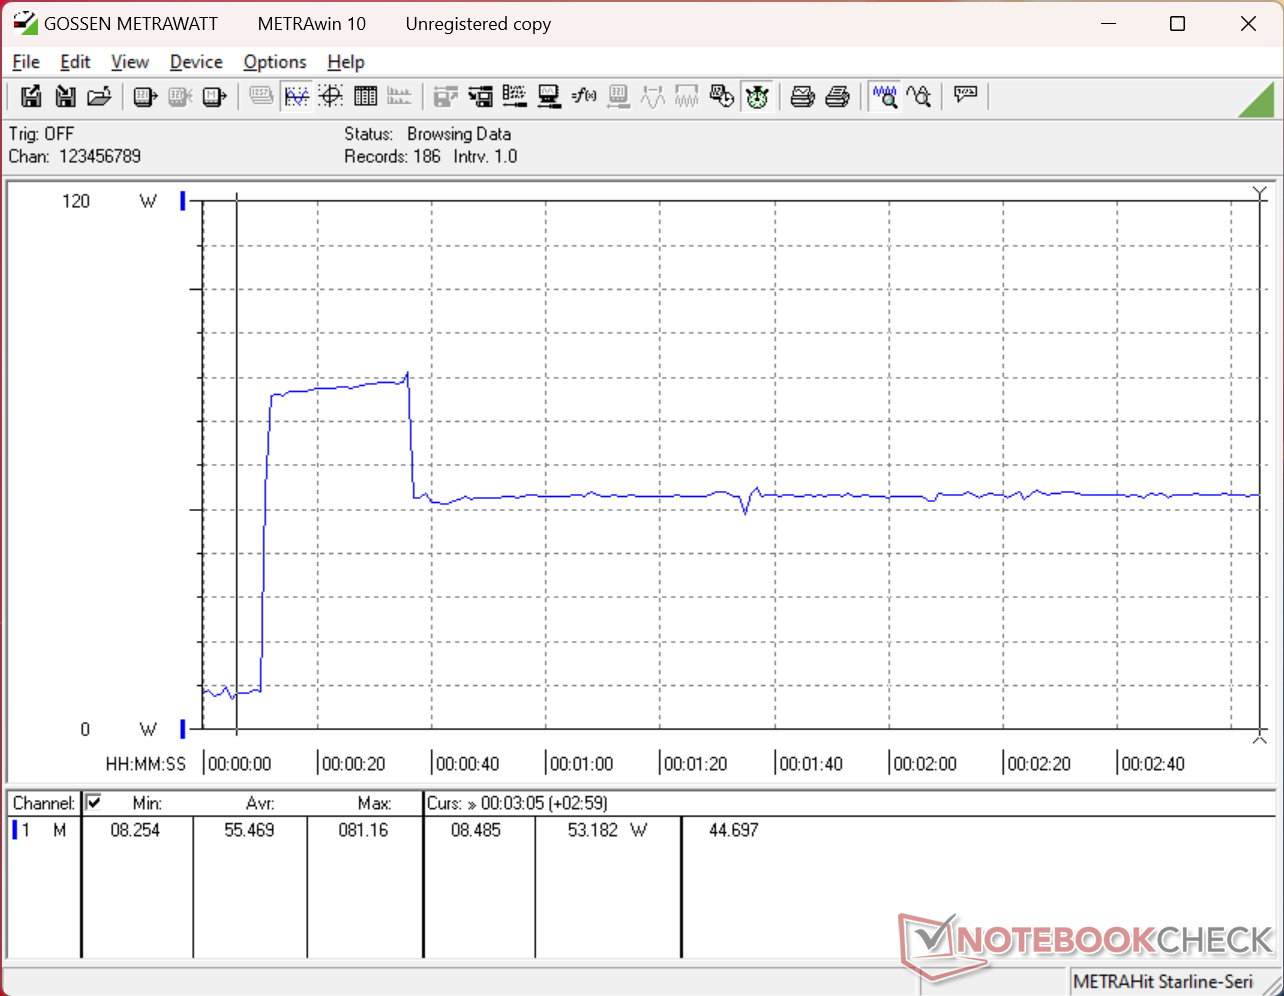
Cubi AI+ 3MG 的效率明显高于去年的 Cubi AI+ 2MG特别是在每瓦性能方面。例如,在运行 Prime95 时,尽管多线程性能大幅提升了 60% 至 65%,但功耗仍稳定在 52 瓦左右,而旧型号的功耗为 49 瓦。每瓦图形性能也有提高,尽管幅度要小得多。
需要注意的是,由于 CPU Turbo Boost 的限制,功耗可能会暂时飙升至 98 W,然后再回落。120 瓦交流适配器(约 13 x 6.9 x 2.5 厘米)在这方面绰绰有余,因为微型电脑本身在负载情况下的平均功率几乎不超过 50 至 60 瓦。
| Off / Standby | |
| Idle | |
| Load |
|
Key:
min: | |
| MSI Cubi NUC AI+ 3MG Ultra 9 386H, Intel Graphics 4 Xe3 PTL, Phison 1 TB ESR01TBTCCZ-27J, , x, | GMK NucBox K16 R7 7735HS, Radeon 680M, TWSC TSC3AN1T0-F6Q10S, , x, | GMK EVO-T1 Ultra 9 285H, Arc 140T, Crucial P3 Plus CT1000P3PSSD8, , x, | Geekom A5 Pro R5 7530U, Vega 7, Wodposit WPBSN4M8-1TGP, , x, | Asus NUC 15 Pro+ Ultra 9 285H, Arc 140T, Micron 3500 1TB MTFDKBA1T0TGD, , x, | MSI Cubi NUC AI+ 2MG Core Ultra 7 258V, Arc 140V, Phison 1 TB ESR01TBTCCZ-27J, , x, | MSI Cubi NUC 1M Core 7 150U, Iris Xe G7 96EUs, WD PC SN560 SDDPNQE-1T00, , x, | |
|---|---|---|---|---|---|---|---|
| Power Consumption | -10% | -27% | 42% | -12% | 20% | 8% | |
| Idle Minimum * (Watt) | 6.2 | 7.4 -19% | 6.1 2% | 3.2 48% | 3.9 37% | 2.9 53% | 6.4 -3% |
| Idle Average * (Watt) | 7.9 | 7.7 3% | 7.9 -0% | 4.3 46% | 6.1 23% | 5.7 28% | 8.3 -5% |
| Idle Maximum * (Watt) | 8.5 | 7.7 9% | 13.2 -55% | 5.1 40% | 8.2 4% | 10.2 -20% | 10.4 -22% |
| Load Average * (Watt) | 41.4 | 52 -26% | 60.7 -47% | 32.1 22% | 56.1 -36% | 38.7 7% | 38.5 7% |
| Cyberpunk 2077 ultra external monitor * (Watt) | 47.6 | 68 -43% | 67.4 -42% | 29.4 38% | 63.9 -34% | 41.1 14% | 36.1 24% |
| Load Maximum * (Watt) | 98 | 80.1 18% | 117.1 -19% | 43.5 56% | 160.6 -64% | 60 39% | 52.5 46% |
* ... smaller is better
功耗 赛博朋克/压力测试
外部显示器功耗
笔记本检查评级
微星 Cubi NUC AI+ 3MG 是目前能找到的配备豹湖 Core Ultra 9 CPU 的最小迷你 PC 之一。不过,由于缺少一些功能,它无法成为终极零售或办公解决方案。
MSI Cubi NUC AI+ 3MG
- 06/03/2026 v8
Allen Ngo
 Total Sustainability Score:
 潜在竞争对手比较
Image | Model / Review | Price | Weight | Height | Display |
|---|---|---|---|---|---|
1. 76.9%  | MSI Cubi NUC AI+ 3MG Intel Core Ultra 9 386H ⎘ Intel Graphics 4 Xe3 Panther Lake iGPU ⎘ 32 GB Memory, 1000 GB SSD | Amazon: List Price: 830 USD | 552 g | 37.5 mm | x |
2. 64.8%  | GMK NucBox K16 AMD Ryzen 7 7735HS ⎘ AMD Radeon 680M ⎘ 32 GB Memory, 1024 GB SSD | Amazon: 1. $639.97 GMKtec K16 Mini PC Gaming AM... List Price: 650 USD | 567 g | 63 mm | x |
3. 75.4%  | GMK EVO-T1 Intel Core Ultra 9 285H ⎘ Intel Arc Graphics 140T ⎘ 64 GB Memory, 1024 GB SSD | Amazon: List Price: 999€ | 946 g | 73.6 mm | x |
4. 72.6%  | Geekom A5 Pro AMD Ryzen 5 7530U ⎘ AMD Radeon RX Vega 7 ⎘ 16 GB Memory, 1024 GB SSD | Amazon: List Price: 619€ | 423 g | 37 mm | x |
5. 77.5% 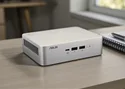 | Asus NUC 15 Pro+ Intel Core Ultra 9 285H ⎘ Intel Arc Graphics 140T ⎘ 32 GB Memory, 1024 GB SSD | Amazon: $1,240.00 List Price: 991€ | 690 g | 42 mm | x |
6. 75.2% 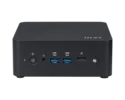 | MSI Cubi NUC AI+ 2MG Intel Core Ultra 7 258V ⎘ Intel Arc Graphics 140V ⎘ 32 GB Memory, 1000 GB SSD | Amazon: List Price: 900 USD | 669 g | 50.1 mm | x |
7. 66.1%  | MSI Cubi NUC 1M Intel Core 7 150U ⎘ Intel Iris Xe Graphics G7 96EUs ⎘ 16 GB Memory, 1024 GB SSD | Amazon: List Price: 950 USD | 660 g | 50.1 mm | x |
Transparency
The selection of devices to be reviewed is made by our editorial team. The test sample was provided to the author as a loan by the manufacturer or retailer for the purpose of this review. The lender had no influence on this review, nor did the manufacturer receive a copy of this review before publication. There was no obligation to publish this review. As an independent media company, Notebookcheck is not subjected to the authority of manufacturers, retailers or publishers.
This is how Notebookcheck is testing
Every year, Notebookcheck independently reviews hundreds of laptops and smartphones using standardized procedures to ensure that all results are comparable. We have continuously developed our test methods for around 20 years and set industry standards in the process. In our test labs, high-quality measuring equipment is utilized by experienced technicians and editors. These tests involve a multi-stage validation process. Our complex rating system is based on hundreds of well-founded measurements and benchmarks, which maintains objectivity. Further information on our test methods can be found here.

