结论 -Galaxy Book6 Pro 是一款出色的笔记本电脑,但价格也不菲
三星终于在新的Galaxy Book6 Pro 上使用了亮度更高的 OLED 屏幕,新的 120 Hz 触摸屏峰值亮度高达 1200 尼特,提供了极佳的图像质量。唯一的缺点是持续的 PWM 闪烁,因此敏感的用户应该先试用一下。英特尔还提供了全新的 Panther Lake 处理器,但我们的测试机只使用了酷睿至尊 7 356H,iGPU 速度很慢。它足以胜任包括视频流在内的日常任务,但如果你想玩一些游戏,我们推荐使用酷睿至尊 X7 的 SKU。
铝制机身再次显得非常时尚和稳定,端口选择也很充分,但三星去掉了读卡器。风扇很安静,温度很低,电池续航时间也很不错,尽管我们测试过的戴尔 XPS 16 等一些屏幕较差的竞争对手能提供更长的续航时间。我们还喜欢带有触觉触控板的新输入设备,但三星取消了专用的数字键盘。
这里最大的问题是价格,因为我们的产品售价为 2099 美元,这还不包括速度更快的酷睿 Ultra X7 处理器和 Arc B390 iGPU.总而言之,新的Galaxy Book6 Pro 是一款适合日常使用的整体解决方案,但价格昂贵。
Pros
Cons
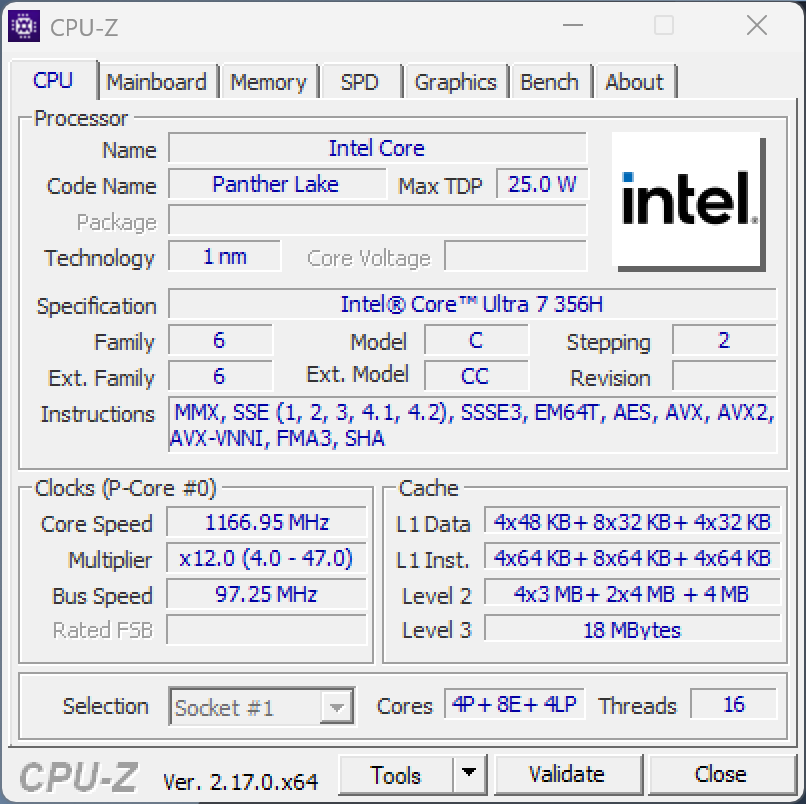
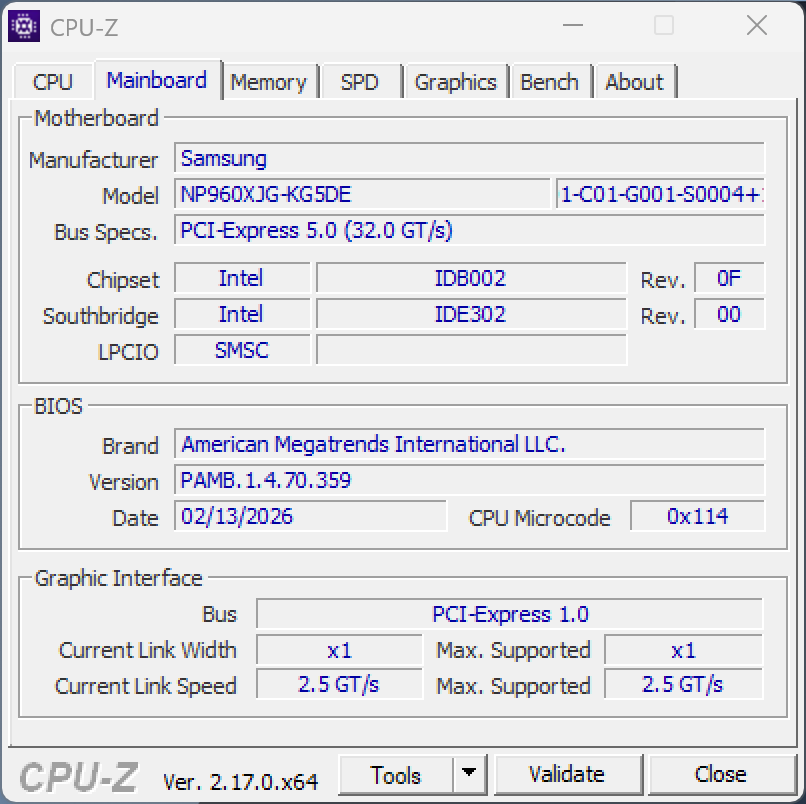
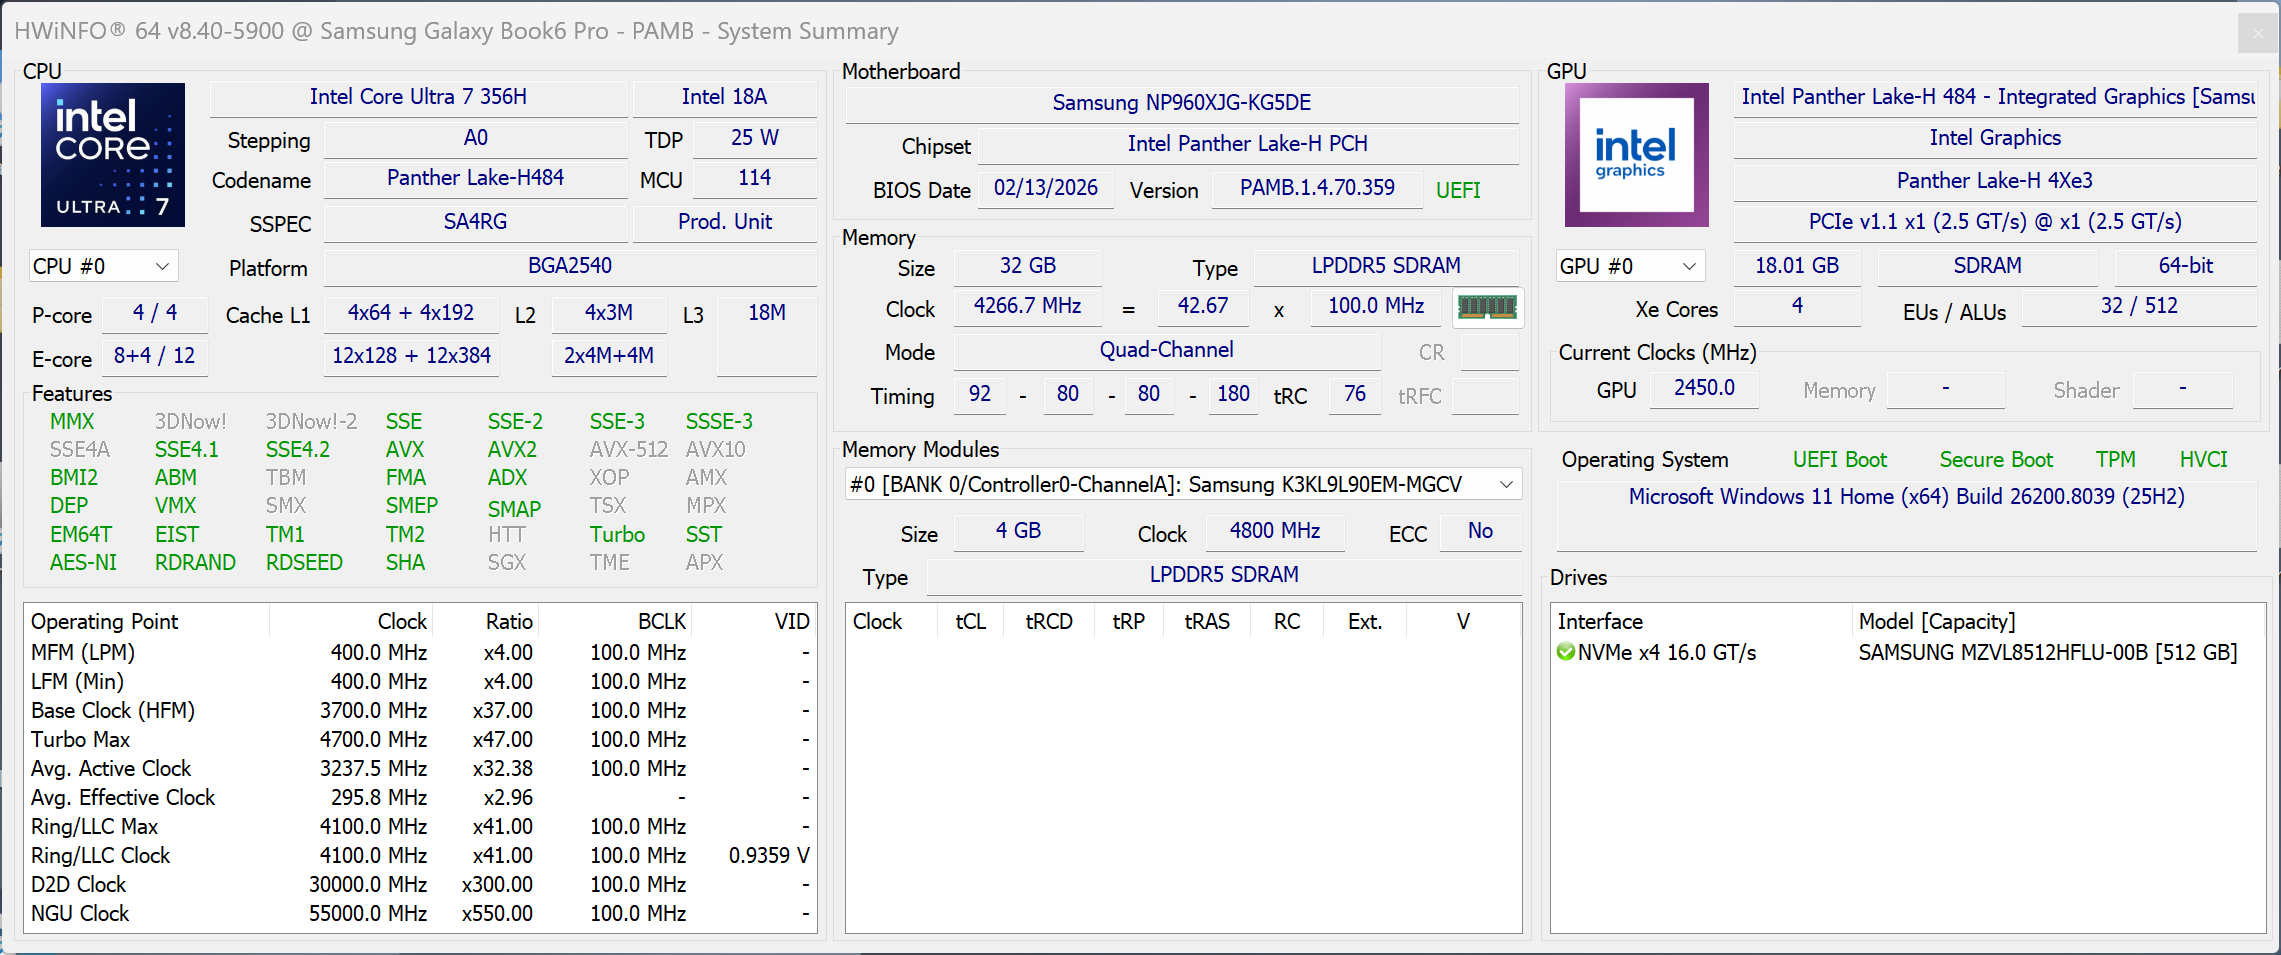
三星更新了其Galaxy Book6 Pro 机型,现在采用了英特尔最新一代 Panther Lake 处理器和更新的 OLED 屏幕。我们评测了配备 酷睿至尊 7 356H与标准的英特尔图形 iGPU(4Xe内核)、32 GB 内存以及 512 GB 固态硬盘相结合。零售价为 2049 美元的机型配备了更大的 1 TB 固态硬盘,其他规格与我们的评测机型相同。
规格
外壳和连接
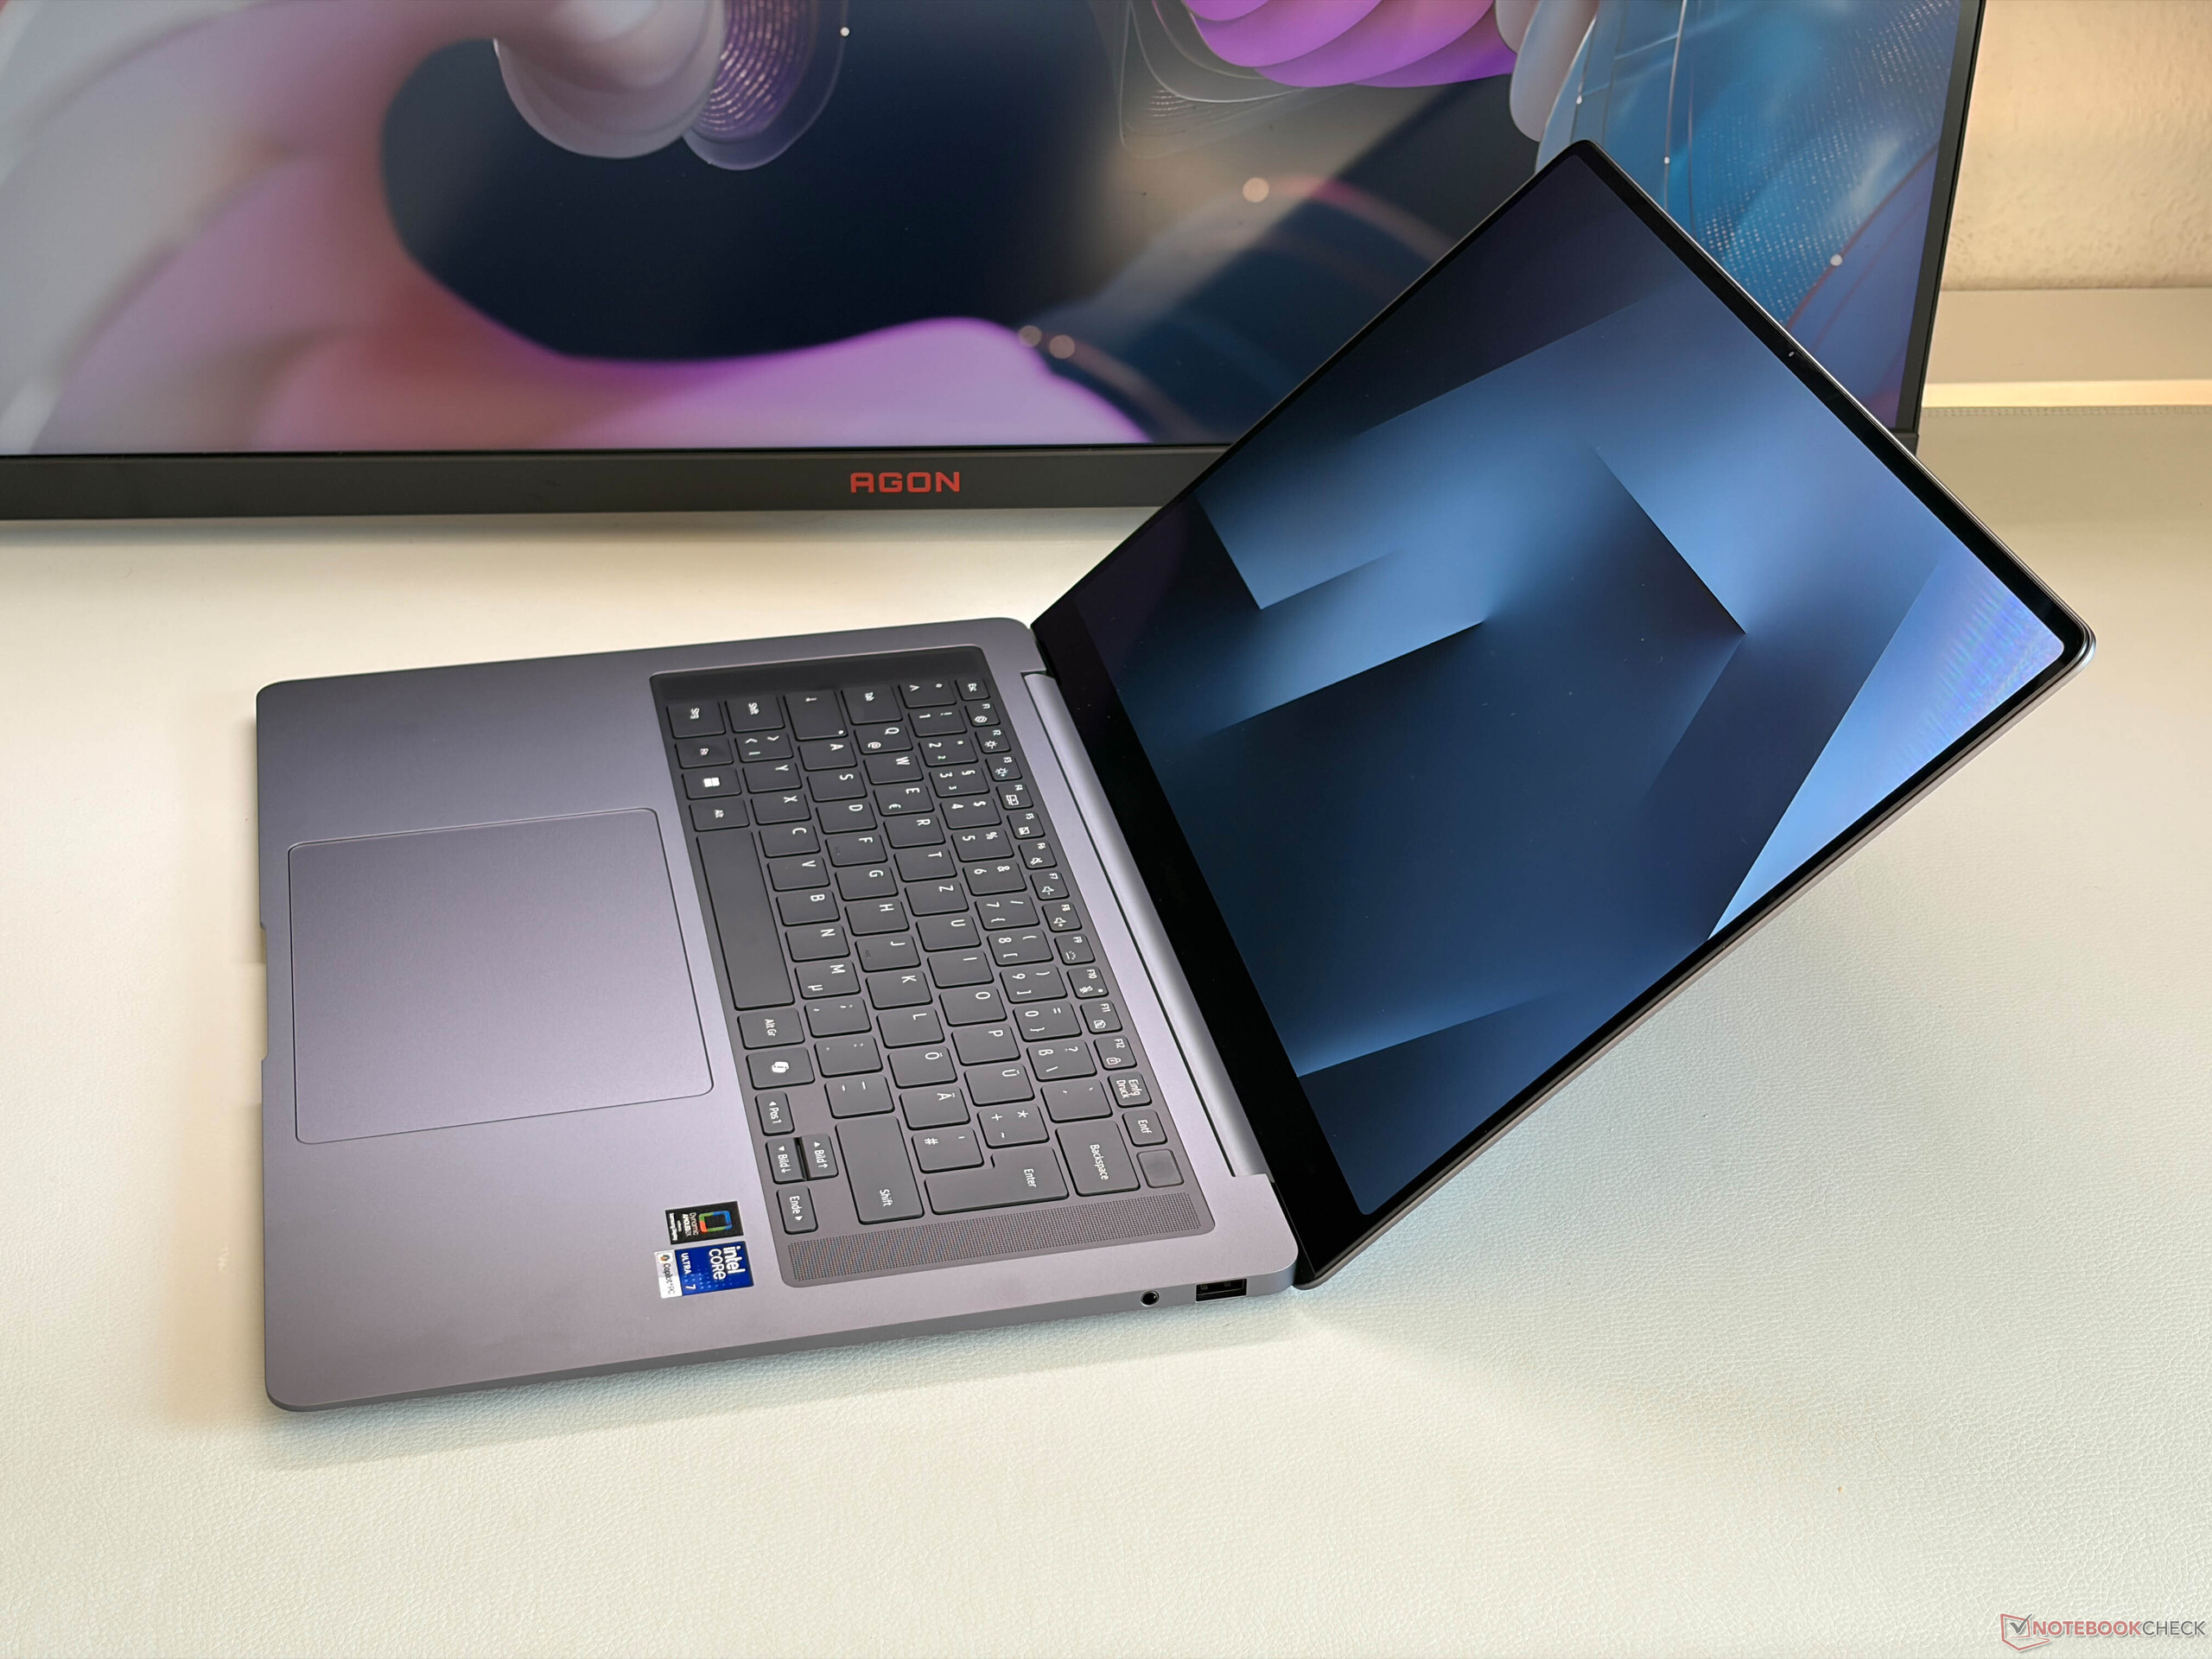
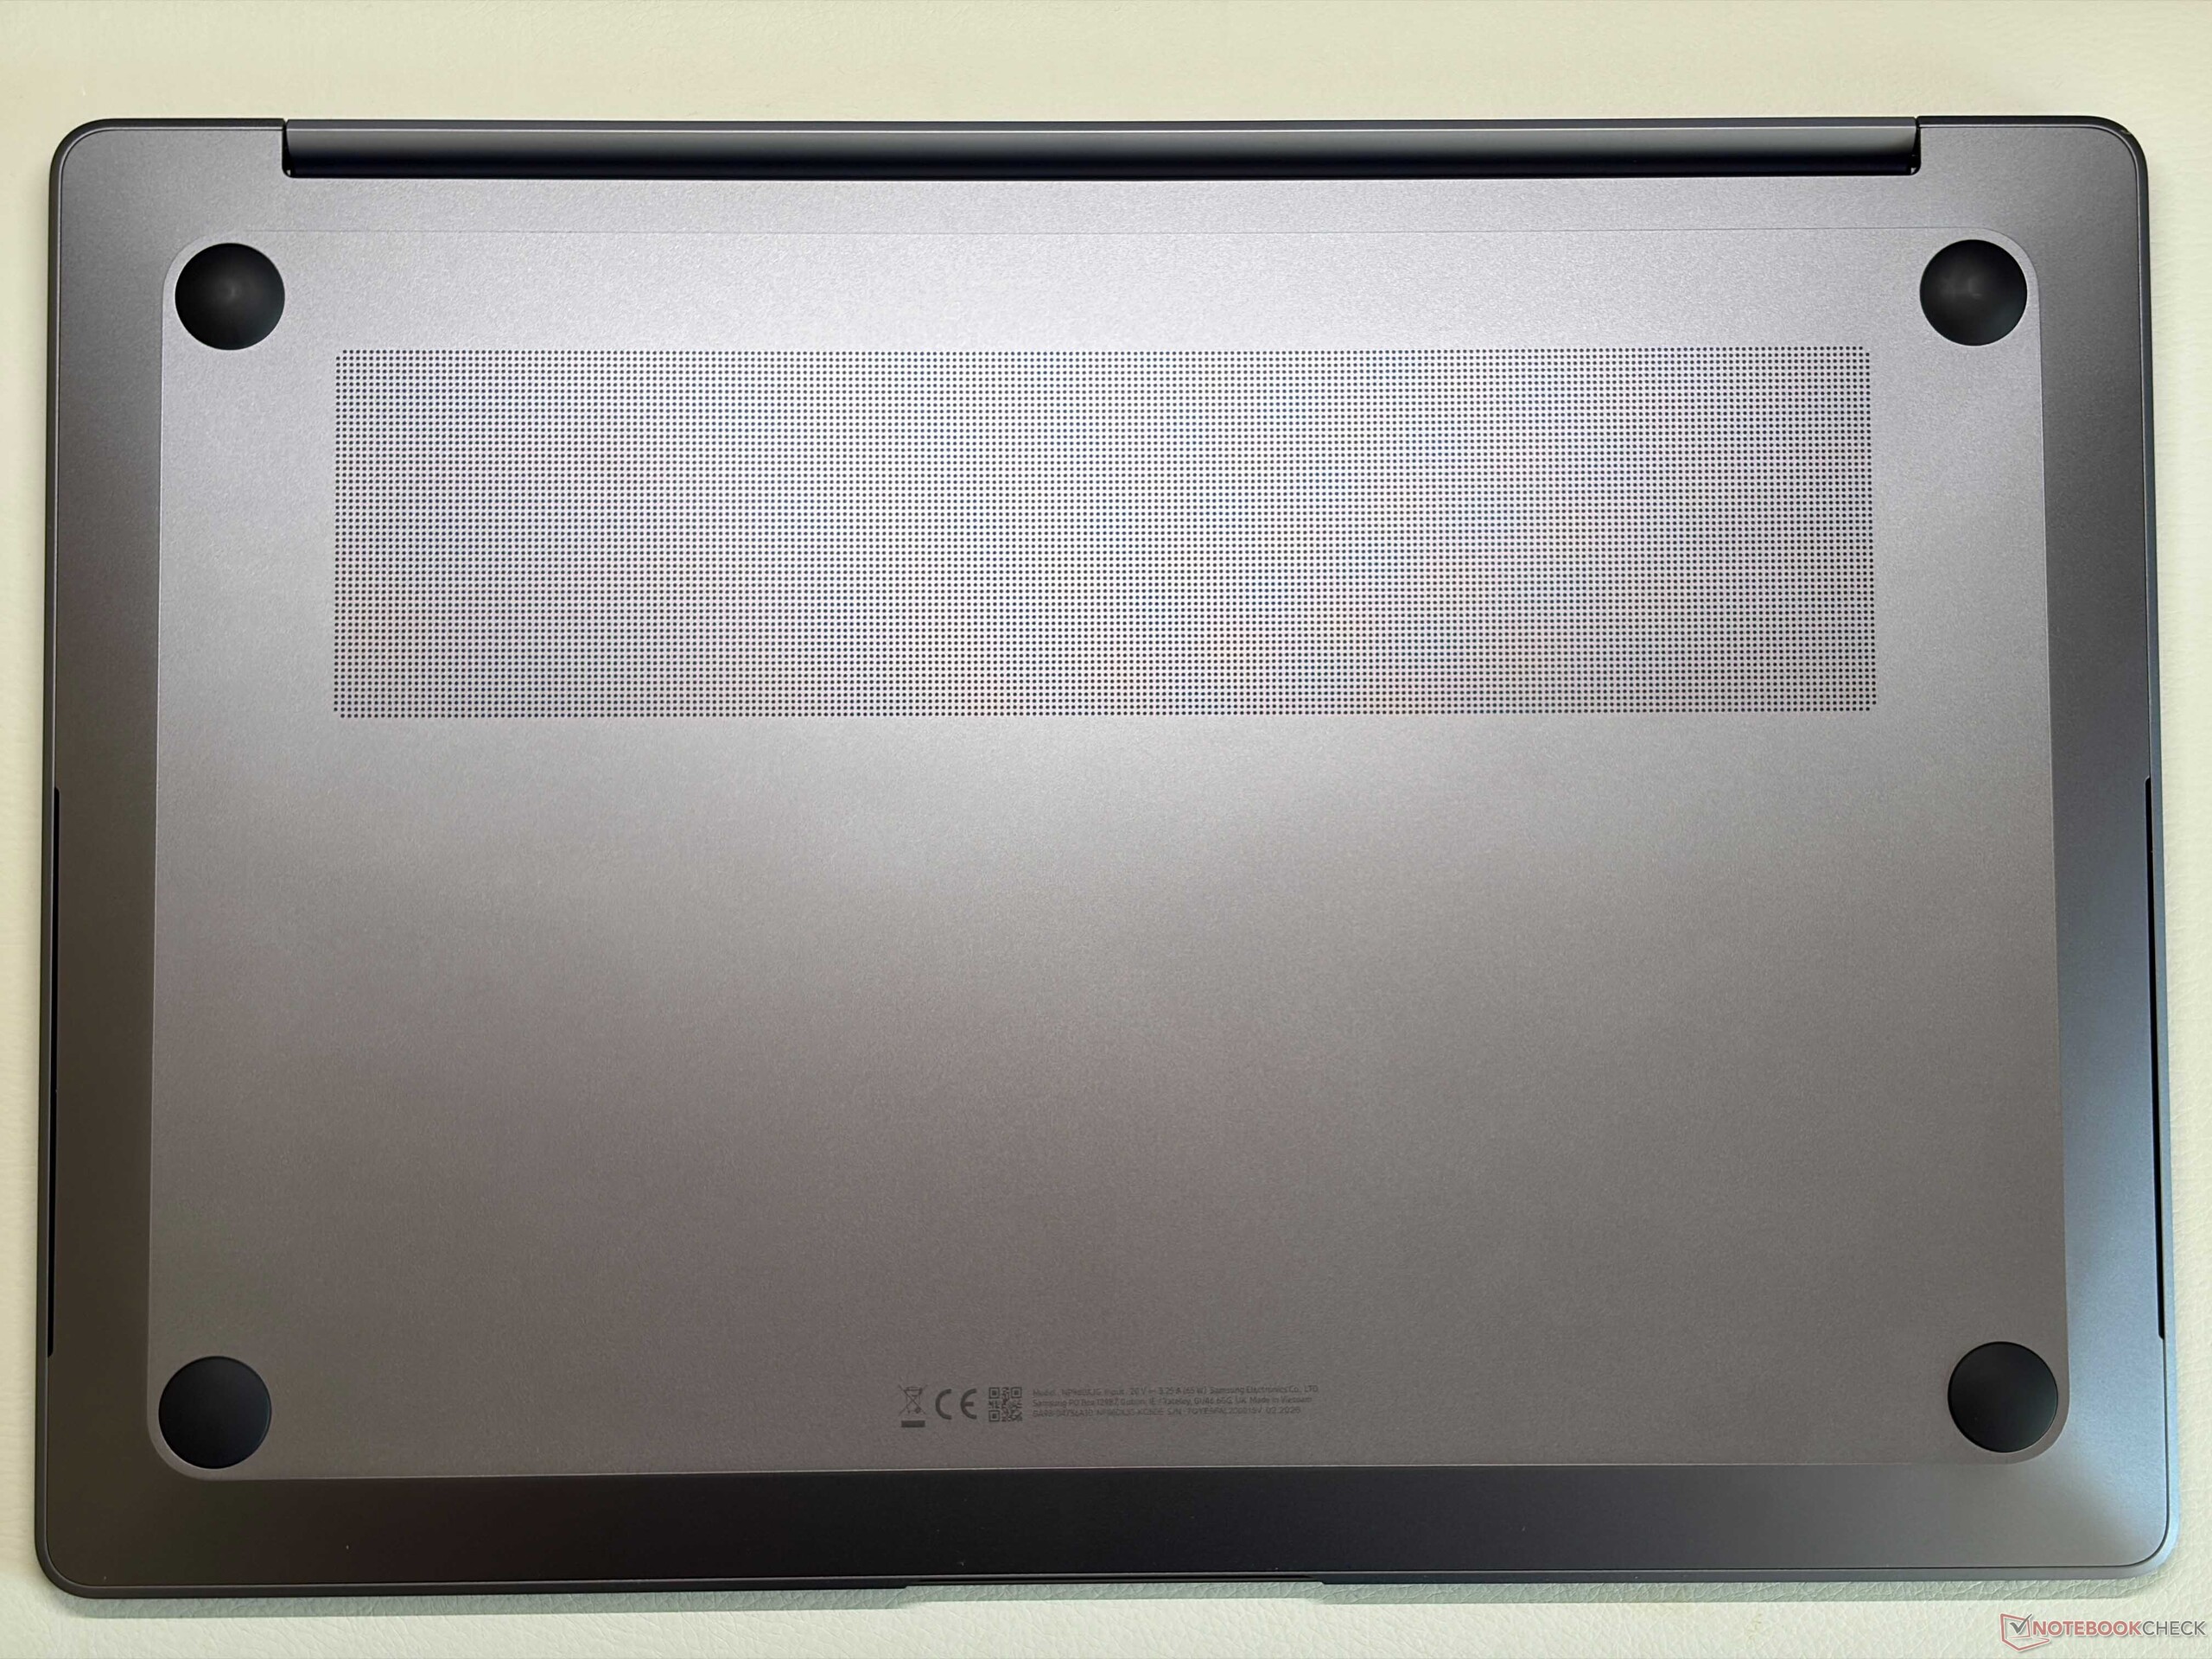
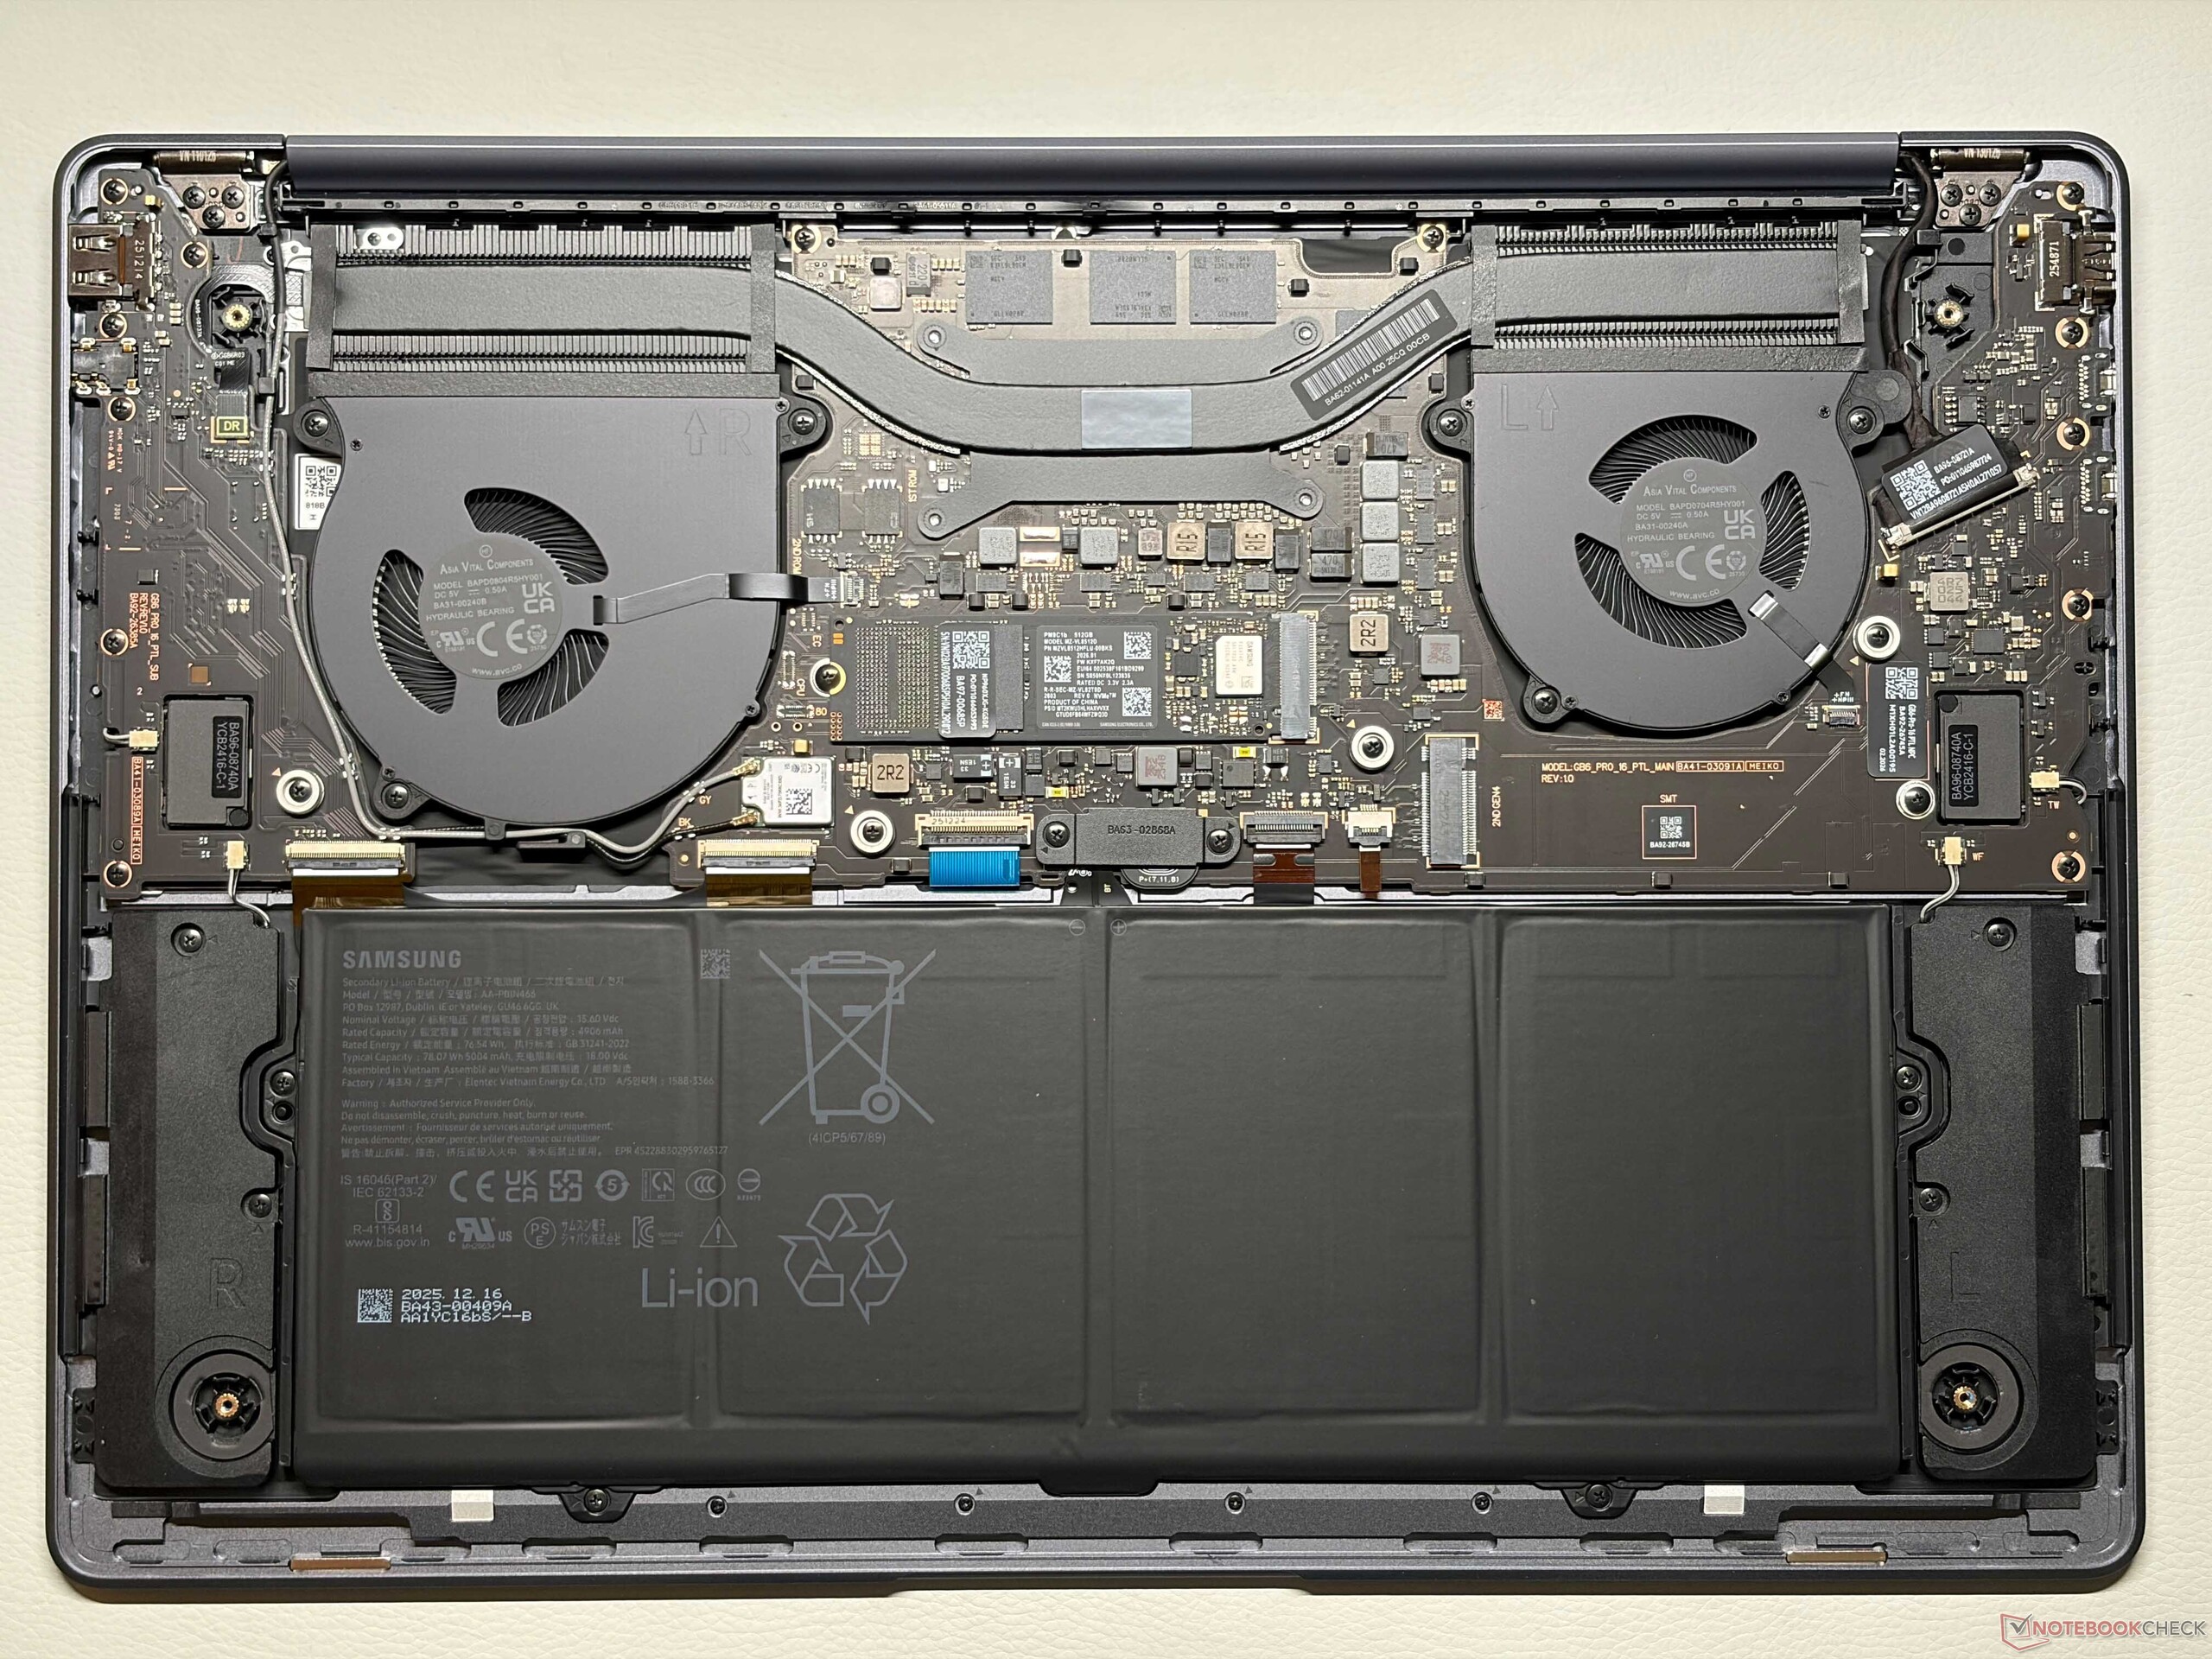
机身设计与前代机型基本相同,这意味着你将再次获得一款采用高品质铝制机身的时尚 16 英寸笔记本电脑。银色机身不易沾染指纹,稳定性也非常出色。尤其是下边框再次变得非常厚,新的键盘设计和重新排列的三星徽标基本上是仅有的两处明显变化。内部布局也略有改变,但仍有两个全尺寸 M.2-2280 SSD 插槽,其他组件均为板载。
在连接方面,你仍然可以使用 Thunderbolt 4 和一个普通的 USB-A 端口,但 microSD 读卡器不见了。Wi-Fi 模块现在支持新的 Wi-Fi 7 标准,传输速率最高可达 4.5 Gbps。1080p 网络摄像头没有变化。


| Networking | |
| Samsung Galaxy Book6 Pro | |
| iperf3 transmit AXE11000 | |
| iperf3 receive AXE11000 | |
| iperf3 transmit RT-BE96U WiFi7 | |
| iperf3 receive RT-BE96U WiFi7 | |
| Dell XPS 16 Core Ultra 5 325 | |
| iperf3 transmit AXE11000 | |
| iperf3 receive AXE11000 | |
| iperf3 transmit AXE11000 6GHz | |
| iperf3 receive AXE11000 6GHz | |
| Asus ZenBook S16 UM5606GA | |
| iperf3 transmit AXE11000 | |
| iperf3 receive AXE11000 | |
| Apple MacBook Air 15 M5 | |
| iperf3 transmit AXE11000 | |
| iperf3 receive AXE11000 | |
| Microsoft Surface Laptop 7 15 Lunar Lake | |
| iperf3 transmit AXE11000 | |
| iperf3 receive AXE11000 | |
| Lenovo ThinkPad X9-15 Aura Edition | |
| iperf3 transmit AXE11000 | |
| iperf3 receive AXE11000 | |


输入设备
三星更换了输入设备,我们已经在Galaxy Book6 Ultra 上体验了新键盘。专用的数字键盘不见了,键盘旁边有了扬声器。输入体验尚可,反馈精确,但键程较浅。两款 Zenbook S16以及 ThinkPad X9 15提供了更舒适的键盘。另一方面,巨大的触觉触控板(15 x 10.5 厘米)非常出色,你还可以使用电容式触摸屏进行输入。


显示屏 - 更明亮的 120 Hz OLED 显示屏
三星为Galaxy Book6 Pro 采用了更亮的 OLED 触摸屏,与Galaxy Book6 Ultra 的面板完全相同。主观画质非常出色,色彩丰富,图像清晰,即使是明亮的内容也不会显得有颗粒感。由于采用了 120 Hz(30-120 Hz 之间自适应),移动非常流畅,响应时间也非常快,但在每个亮度级别都会出现 PWM 闪烁,频率为 240 Hz,且幅度较大,因此敏感用户应先试用该面板。
三星最终改进了亮度,我们测得 SDR 内容的亮度为 500 尼特,HDR 内容的亮度可达 1200 尼特(全白图像为 648 尼特)。三星还为 P3 和 sRGB 实现了准确的色彩配置文件,我们使用专业的 CalMAN 软件进行分析,结果显示开箱即可获得极佳的色彩准确性,因此进行 Pitcure 编辑不成问题。我们无法通过自己的校准进一步提高准确度。
| |||||||||||||||||||||||||
Brightness Distribution: 97 %
Center on Battery: 502 cd/m²
Contrast: ∞:1 (Black: 0 cd/m²)
ΔE ColorChecker Calman: 1 | ∀{0.5-29.43 Ø4.72}
ΔE Greyscale Calman: 1.8 | ∀{0.09-98 Ø4.97}
85.9% AdobeRGB 1998 (Argyll 3D)
99.9% sRGB (Argyll 3D)
98.3% Display P3 (Argyll 3D)
Gamma: 2.24
CCT: 6435 K
| Samsung Galaxy Book6 Pro ATNA60HR05-0, OLED, 2880x1800, 16", 120 Hz | Dell XPS 16 Core Ultra 5 325 LG Philips 160WUX, IPS, 1920x1200, 16", 120 Hz | Asus ZenBook S16 UM5606GA ATNA60HR07-0, OLED, 2880x1800, 16", 120 Hz | Apple MacBook Air 15 M5 IPS, 2880x1864, 15.3", 60 Hz | Microsoft Surface Laptop 7 15 Lunar Lake LQ150P1JX61, IPS, 2496x1664, 15", 120 Hz | Lenovo ThinkPad X9-15 Aura Edition ATNA53JB01-0, OLED, 2880x1800, 15.3", 120 Hz | Samsung Galaxy Book4 Pro 16 ATNA60CL07-0, OLED, 2880x1800, 16", 120 Hz | |
|---|---|---|---|---|---|---|---|
| Display | -19% | 4% | -1% | 1% | 4% | 5% | |
| Display P3 Coverage (%) | 98.3 | 66.2 -33% | 99.8 2% | 97.5 -1% | 98.1 0% | 100 2% | 99.5 1% |
| sRGB Coverage (%) | 99.9 | 97.4 -3% | 100 0% | 98.3 -2% | 100 0% | 100 0% | 100 0% |
| AdobeRGB 1998 Coverage (%) | 85.9 | 67.7 -21% | 94 9% | 86.3 0% | 87.2 2% | 94.6 10% | 97.5 14% |
| Response Times | -6924% | -37% | -4477% | -4967% | -38% | -46% | |
| Response Time Grey 50% / Grey 80% * (ms) | 0.51 ? | 39.3 ? -7606% | 1.27 ? -149% | 26.9 ? -5175% | 33.4 ? -6449% | 1.46 ? -186% | 0.64 ? -25% |
| Response Time Black / White * (ms) | 0.41 ? | 26 ? -6241% | 0.43 ? -5% | 15.9 ? -3778% | 14.7 ? -3485% | 0.44 ? -7% | 0.68 ? -66% |
| PWM Frequency (Hz) | 240 ? | 960 ? | 1200 ? | 240 ? | |||
| PWM Amplitude * (%) | 100 | 56 44% | 22 78% | ||||
| Screen | -48% | -7% | -42% | 35% | 1% | -2% | |
| Brightness middle (cd/m²) | 502 | 534.6 6% | 465 -7% | 538 7% | 599 19% | 509 1% | 385 -23% |
| Brightness (cd/m²) | 507 | 515 2% | 466 -8% | 521 3% | 590 16% | 508 0% | 391 -23% |
| Brightness Distribution (%) | 97 | 92 -5% | 99 2% | 90 -7% | 93 -4% | 97 0% | 97 0% |
| Black Level * (cd/m²) | 0.26 | 0.44 | 0.4 | 0.01 | |||
| Colorchecker dE 2000 * | 1 | 2.53 -153% | 1 -0% | 2.1 -110% | 0.5 50% | 1.1 -10% | 1.1 -10% |
| Colorchecker dE 2000 max. * | 2.4 | 4.57 -90% | 3 -25% | 4.1 -71% | 0.9 62% | 2.5 -4% | 1.8 25% |
| Greyscale dE 2000 * | 1.8 | 2.7 -50% | 1.9 -6% | 3.1 -72% | 0.6 67% | 1.5 17% | 1.4 22% |
| Gamma | 2.24 98% | 2.32 95% | 2.19 100% | 2.19 100% | 2.16 102% | 2.28 96% | 2.24 98% |
| CCT | 6435 101% | 6860 95% | 6458 101% | 7075 92% | 6543 99% | 6294 103% | 6444 101% |
| Contrast (:1) | 2056 | 1223 | 1498 | 50900 | |||
| Colorchecker dE 2000 calibrated * | 1.26 | 0.7 | |||||
| Total Average (Program / Settings) | -2330% /
-1290% | -13% /
-12% | -1507% /
-837% | -1644% /
-884% | -11% /
-8% | -14% /
-8% |
* ... smaller is better


Display Response Times
| ↔ Response Time Black to White | ||
|---|---|---|
| 0.41 ms ... rise ↗ and fall ↘ combined | ↗ 0.2 ms rise | 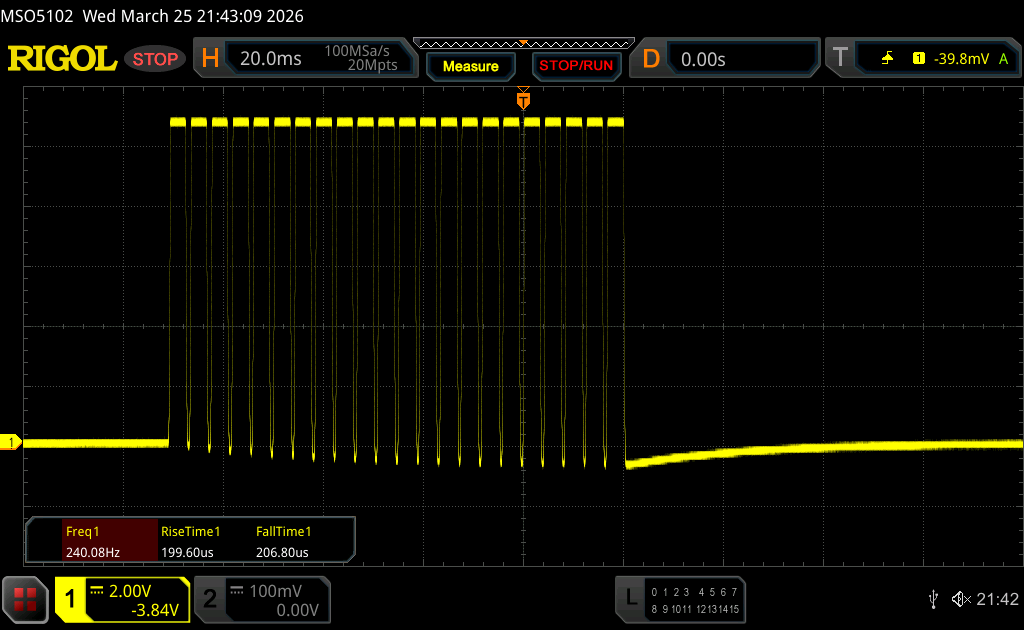 |
| ↘ 0.21 ms fall | ||
| The screen shows very fast response rates in our tests and should be very well suited for fast-paced gaming. In comparison, all tested devices range from 0.1 (minimum) to 240 (maximum) ms. » 0 % of all devices are better. This means that the measured response time is better than the average of all tested devices (19.8 ms). | ||
| ↔ Response Time 50% Grey to 80% Grey | ||
| 0.51 ms ... rise ↗ and fall ↘ combined | ↗ 0.25 ms rise | 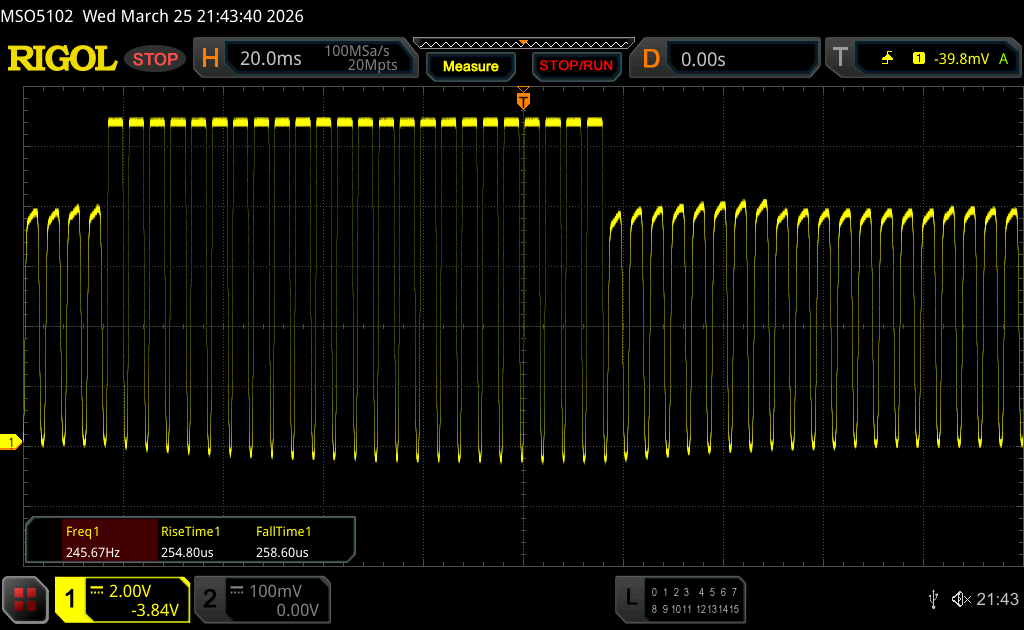 |
| ↘ 0.26 ms fall | ||
| The screen shows very fast response rates in our tests and should be very well suited for fast-paced gaming. In comparison, all tested devices range from 0.165 (minimum) to 636 (maximum) ms. » 1 % of all devices are better. This means that the measured response time is better than the average of all tested devices (31 ms). | ||
Screen Flickering / PWM (Pulse-Width Modulation)
| Screen flickering / PWM detected | 240 Hz Amplitude: 100 % | ≤ 100 % brightness setting | 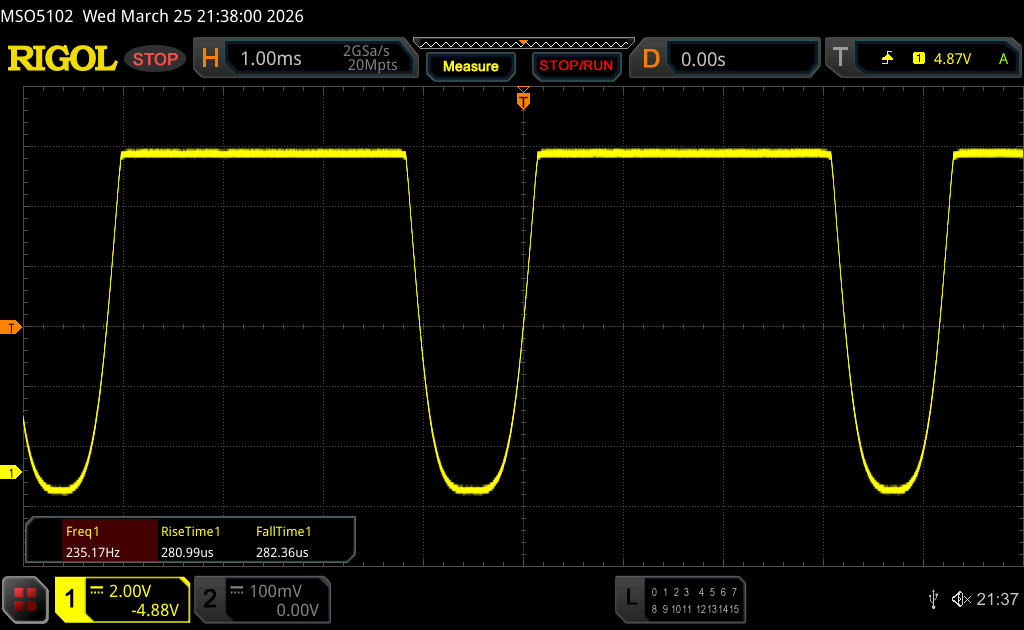 |
The display backlight flickers at 240 Hz (worst case, e.g., utilizing PWM) Flickering detected at a brightness setting of 100 % and below. There should be no flickering or PWM above this brightness setting. The frequency of 240 Hz is relatively low, so sensitive users will likely notice flickering and experience eyestrain at the stated brightness setting and below. In comparison: 52 % of all tested devices do not use PWM to dim the display. If PWM was detected, an average of 7781 (minimum: 5 - maximum: 343500) Hz was measured. | |||


表演 - 黑豹湖
三星目前只提供配备酷睿至尊 7 356H、焊接内存和 4 Xe 内核慢速 iGPU 的新款Galaxy Book6 Pro。三星还发布了一款配备 Core Ultra X7 358H 和速度更快的 Arc B390 iGPU 的 SKU。
测试条件
三星提供多种电源配置文件,并与 Windows 设置同步。对于我们的测试设备,使用高性能模式没有意义,因为性能提升几乎不存在,而且仅限于 CPU,但风扇的声音会更大。我们在基准测试中使用了优化模式。
处理器
三星采用了全新酷睿至尊 7 356H(Panther Lake),共有 16 个内核。短期功耗限制很高,为 80 瓦,但很快就降至 30 瓦。这意味着在短时间峰值负载情况下性能良好,但在持续工作负载情况下性能会下降约 25%。在电池供电情况下,CPU 性能仅略有下降(- 5%,60/30 瓦)。
Cinebench R15 多回路运行
Cinebench 2024: CPU Multi Core | CPU Single Core
Cinebench R23: Multi Core | Single Core
Cinebench R20: CPU (Multi Core) | CPU (Single Core)
Cinebench R15: CPU Multi 64Bit | CPU Single 64Bit
Blender: v2.79 BMW27 CPU
7-Zip 18.03: 7z b 4 | 7z b 4 -mmt1
Geekbench 6.7: Multi-Core | Single-Core
Geekbench 5.5: Multi-Core | Single-Core
HWBOT x265 Benchmark v2.2: 4k Preset
LibreOffice : 20 Documents To PDF
R Benchmark 2.5: Overall mean
| CPU Performance rating | |
| Apple MacBook Air 15 M5 -14! | |
| Average Intel Core Ultra 7 356H | |
| Samsung Galaxy Book6 Pro | |
| Asus ZenBook S16 UM5606GA | |
| Average of class Multimedia | |
| Samsung Galaxy Book4 Pro 16 -2! | |
| Microsoft Surface Laptop 7 15 Lunar Lake | |
| Dell XPS 16 Core Ultra 5 325 | |
| Lenovo ThinkPad X9-15 Aura Edition | |
| Cinebench 2024 / CPU Multi Core | |
| Average Intel Core Ultra 7 356H (1006 - 1232, n=3) | |
| Average of class Multimedia (327 - 2437, n=81, last 2 years) | |
| Samsung Galaxy Book6 Pro | |
| Apple MacBook Air 15 M5 | |
| Asus ZenBook S16 UM5606GA | |
| Dell XPS 16 Core Ultra 5 325 | |
| Microsoft Surface Laptop 7 15 Lunar Lake | |
| Lenovo ThinkPad X9-15 Aura Edition | |
| Cinebench 2024 / CPU Single Core | |
| Apple MacBook Air 15 M5 | |
| Average of class Multimedia (72.5 - 201, n=62, last 2 years) | |
| Microsoft Surface Laptop 7 15 Lunar Lake | |
| Samsung Galaxy Book6 Pro | |
| Average Intel Core Ultra 7 356H (116 - 122.4, n=3) | |
| Lenovo ThinkPad X9-15 Aura Edition | |
| Asus ZenBook S16 UM5606GA | |
| Dell XPS 16 Core Ultra 5 325 | |
| Cinebench R23 / Multi Core | |
| Average Intel Core Ultra 7 356H (18395 - 20650, n=2) | |
| Samsung Galaxy Book6 Pro | |
| Asus ZenBook S16 UM5606GA | |
| Average of class Multimedia (4861 - 33362, n=80, last 2 years) | |
| Samsung Galaxy Book4 Pro 16 | |
| Dell XPS 16 Core Ultra 5 325 | |
| Microsoft Surface Laptop 7 15 Lunar Lake | |
| Lenovo ThinkPad X9-15 Aura Edition | |
| Cinebench R23 / Single Core | |
| Average Intel Core Ultra 7 356H (2040 - 2045, n=2) | |
| Samsung Galaxy Book6 Pro | |
| Asus ZenBook S16 UM5606GA | |
| Average of class Multimedia (1128 - 2459, n=72, last 2 years) | |
| Microsoft Surface Laptop 7 15 Lunar Lake | |
| Lenovo ThinkPad X9-15 Aura Edition | |
| Dell XPS 16 Core Ultra 5 325 | |
| Samsung Galaxy Book4 Pro 16 | |
| Cinebench R20 / CPU (Multi Core) | |
| Average Intel Core Ultra 7 356H (7180 - 8074, n=2) | |
| Samsung Galaxy Book6 Pro | |
| Asus ZenBook S16 UM5606GA | |
| Average of class Multimedia (1887 - 12912, n=63, last 2 years) | |
| Samsung Galaxy Book4 Pro 16 | |
| Dell XPS 16 Core Ultra 5 325 | |
| Microsoft Surface Laptop 7 15 Lunar Lake | |
| Lenovo ThinkPad X9-15 Aura Edition | |
| Cinebench R20 / CPU (Single Core) | |
| Asus ZenBook S16 UM5606GA | |
| Samsung Galaxy Book6 Pro | |
| Average Intel Core Ultra 7 356H (773 - 774, n=2) | |
| Microsoft Surface Laptop 7 15 Lunar Lake | |
| Average of class Multimedia (425 - 853, n=63, last 2 years) | |
| Lenovo ThinkPad X9-15 Aura Edition | |
| Dell XPS 16 Core Ultra 5 325 | |
| Samsung Galaxy Book4 Pro 16 | |
| Cinebench R15 / CPU Multi 64Bit | |
| Average Intel Core Ultra 7 356H (2937 - 3201, n=2) | |
| Samsung Galaxy Book6 Pro | |
| Asus ZenBook S16 UM5606GA | |
| Average of class Multimedia (856 - 5224, n=67, last 2 years) | |
| Samsung Galaxy Book4 Pro 16 | |
| Dell XPS 16 Core Ultra 5 325 | |
| Microsoft Surface Laptop 7 15 Lunar Lake | |
| Lenovo ThinkPad X9-15 Aura Edition | |
| Cinebench R15 / CPU Single 64Bit | |
| Average Intel Core Ultra 7 356H (303 - 306, n=2) | |
| Samsung Galaxy Book6 Pro | |
| Lenovo ThinkPad X9-15 Aura Edition | |
| Microsoft Surface Laptop 7 15 Lunar Lake | |
| Average of class Multimedia (184.8 - 326, n=65, last 2 years) | |
| Dell XPS 16 Core Ultra 5 325 | |
| Samsung Galaxy Book4 Pro 16 | |
| Asus ZenBook S16 UM5606GA | |
| Blender / v2.79 BMW27 CPU | |
| Lenovo ThinkPad X9-15 Aura Edition | |
| Microsoft Surface Laptop 7 15 Lunar Lake | |
| Dell XPS 16 Core Ultra 5 325 | |
| Average of class Multimedia (100 - 557, n=64, last 2 years) | |
| Samsung Galaxy Book4 Pro 16 | |
| Samsung Galaxy Book6 Pro | |
| Asus ZenBook S16 UM5606GA | |
| Average Intel Core Ultra 7 356H (163 - 196, n=2) | |
| 7-Zip 18.03 / 7z b 4 | |
| Average Intel Core Ultra 7 356H (65579 - 69785, n=2) | |
| Asus ZenBook S16 UM5606GA | |
| Samsung Galaxy Book6 Pro | |
| Samsung Galaxy Book4 Pro 16 | |
| Average of class Multimedia (29095 - 130368, n=61, last 2 years) | |
| Dell XPS 16 Core Ultra 5 325 | |
| Microsoft Surface Laptop 7 15 Lunar Lake | |
| Lenovo ThinkPad X9-15 Aura Edition | |
| 7-Zip 18.03 / 7z b 4 -mmt1 | |
| Samsung Galaxy Book6 Pro | |
| Average Intel Core Ultra 7 356H (6305 - 6375, n=2) | |
| Asus ZenBook S16 UM5606GA | |
| Microsoft Surface Laptop 7 15 Lunar Lake | |
| Average of class Multimedia (3666 - 7545, n=62, last 2 years) | |
| Lenovo ThinkPad X9-15 Aura Edition | |
| Dell XPS 16 Core Ultra 5 325 | |
| Samsung Galaxy Book4 Pro 16 | |
| Geekbench 6.7 / Multi-Core | |
| Apple MacBook Air 15 M5 | |
| Samsung Galaxy Book6 Pro | |
| Average Intel Core Ultra 7 356H (15578 - 16676, n=3) | |
| Average of class Multimedia (4983 - 29415, n=75, last 2 years) | |
| Asus ZenBook S16 UM5606GA | |
| Samsung Galaxy Book4 Pro 16 | |
| Microsoft Surface Laptop 7 15 Lunar Lake | |
| Dell XPS 16 Core Ultra 5 325 | |
| Lenovo ThinkPad X9-15 Aura Edition | |
| Geekbench 6.7 / Single-Core | |
| Apple MacBook Air 15 M5 | |
| Average of class Multimedia (1534 - 4335, n=74, last 2 years) | |
| Microsoft Surface Laptop 7 15 Lunar Lake | |
| Samsung Galaxy Book6 Pro | |
| Asus ZenBook S16 UM5606GA | |
| Lenovo ThinkPad X9-15 Aura Edition | |
| Average Intel Core Ultra 7 356H (2532 - 2851, n=3) | |
| Dell XPS 16 Core Ultra 5 325 | |
| Samsung Galaxy Book4 Pro 16 | |
| Geekbench 5.5 / Multi-Core | |
| Average Intel Core Ultra 7 356H (16721 - 16761, n=2) | |
| Samsung Galaxy Book6 Pro | |
| Asus ZenBook S16 UM5606GA | |
| Average of class Multimedia (4652 - 20422, n=61, last 2 years) | |
| Samsung Galaxy Book4 Pro 16 | |
| Dell XPS 16 Core Ultra 5 325 | |
| Microsoft Surface Laptop 7 15 Lunar Lake | |
| Lenovo ThinkPad X9-15 Aura Edition | |
| Geekbench 5.5 / Single-Core | |
| Asus ZenBook S16 UM5606GA | |
| Samsung Galaxy Book6 Pro | |
| Average Intel Core Ultra 7 356H (2086 - 2098, n=2) | |
| Microsoft Surface Laptop 7 15 Lunar Lake | |
| Lenovo ThinkPad X9-15 Aura Edition | |
| Average of class Multimedia (805 - 2974, n=61, last 2 years) | |
| Dell XPS 16 Core Ultra 5 325 | |
| Samsung Galaxy Book4 Pro 16 | |
| HWBOT x265 Benchmark v2.2 / 4k Preset | |
| Average Intel Core Ultra 7 356H (20 - 25.1, n=2) | |
| Asus ZenBook S16 UM5606GA | |
| Samsung Galaxy Book6 Pro | |
| Average of class Multimedia (5.26 - 36.1, n=62, last 2 years) | |
| Samsung Galaxy Book4 Pro 16 | |
| Dell XPS 16 Core Ultra 5 325 | |
| Microsoft Surface Laptop 7 15 Lunar Lake | |
| Lenovo ThinkPad X9-15 Aura Edition | |
| LibreOffice / 20 Documents To PDF | |
| Samsung Galaxy Book6 Pro | |
| Asus ZenBook S16 UM5606GA | |
| Average Intel Core Ultra 7 356H (47.3 - 57.8, n=2) | |
| Average of class Multimedia (23.9 - 146.7, n=63, last 2 years) | |
| Dell XPS 16 Core Ultra 5 325 | |
| Microsoft Surface Laptop 7 15 Lunar Lake | |
| Lenovo ThinkPad X9-15 Aura Edition | |
| Samsung Galaxy Book4 Pro 16 | |
| R Benchmark 2.5 / Overall mean | |
| Lenovo ThinkPad X9-15 Aura Edition | |
| Samsung Galaxy Book4 Pro 16 | |
| Average of class Multimedia (0.3604 - 0.947, n=62, last 2 years) | |
| Samsung Galaxy Book6 Pro | |
| Dell XPS 16 Core Ultra 5 325 | |
| Microsoft Surface Laptop 7 15 Lunar Lake | |
| Average Intel Core Ultra 7 356H (0.4268 - 0.459, n=2) | |
| Asus ZenBook S16 UM5606GA | |
* ... smaller is better
AIDA64: FP32 Ray-Trace | FPU Julia | CPU SHA3 | CPU Queen | FPU SinJulia | FPU Mandel | CPU AES | CPU ZLib | FP64 Ray-Trace | CPU PhotoWorxx | CPU CheckMate
| Performance rating | |
| Asus ZenBook S16 UM5606GA -1! | |
| Average Intel Core Ultra 7 356H -1! | |
| Samsung Galaxy Book6 Pro -1! | |
| Average of class Multimedia | |
| Samsung Galaxy Book4 Pro 16 -1! | |
| Dell XPS 16 Core Ultra 5 325 -1! | |
| Lenovo ThinkPad X9-15 Aura Edition | |
| Microsoft Surface Laptop 7 15 Lunar Lake -1! | |
| AIDA64 / FP32 Ray-Trace | |
| Asus ZenBook S16 UM5606GA (v6.92.6600) | |
| Average Intel Core Ultra 7 356H (16303 - 20528, n=2) | |
| Average of class Multimedia (2214 - 50388, n=59, last 2 years) | |
| Samsung Galaxy Book6 Pro (v8.20.8100) | |
| Samsung Galaxy Book4 Pro 16 (v6.92.6600) | |
| Lenovo ThinkPad X9-15 Aura Edition (v6.92.6600) | |
| Lenovo ThinkPad X9-15 Aura Edition (v6.92.6600) | |
| Lenovo ThinkPad X9-15 Aura Edition (v8.20.8100) | |
| Dell XPS 16 Core Ultra 5 325 (v8.20.8100) | |
| Microsoft Surface Laptop 7 15 Lunar Lake (v6.92.6600) | |
| AIDA64 / FPU Julia | |
| Asus ZenBook S16 UM5606GA (v6.92.6600) | |
| Average Intel Core Ultra 7 356H (81236 - 108092, n=2) | |
| Average of class Multimedia (12867 - 201874, n=60, last 2 years) | |
| Samsung Galaxy Book6 Pro (v8.20.8100) | |
| Samsung Galaxy Book4 Pro 16 (v6.92.6600) | |
| Dell XPS 16 Core Ultra 5 325 (v8.20.8100) | |
| Lenovo ThinkPad X9-15 Aura Edition (v6.92.6600) | |
| Lenovo ThinkPad X9-15 Aura Edition (v8.20.8100) | |
| Lenovo ThinkPad X9-15 Aura Edition (v6.92.6600) | |
| Microsoft Surface Laptop 7 15 Lunar Lake (v6.92.6600) | |
| AIDA64 / CPU SHA3 | |
| Average Intel Core Ultra 7 356H (4141 - 5284, n=2) | |
| Asus ZenBook S16 UM5606GA (v6.92.6600) | |
| Samsung Galaxy Book6 Pro (v8.20.8100) | |
| Average of class Multimedia (653 - 8623, n=60, last 2 years) | |
| Samsung Galaxy Book4 Pro 16 (v6.92.6600) | |
| Dell XPS 16 Core Ultra 5 325 (v8.20.8100) | |
| Lenovo ThinkPad X9-15 Aura Edition (v6.92.6600) | |
| Lenovo ThinkPad X9-15 Aura Edition (v8.20.8100) | |
| Lenovo ThinkPad X9-15 Aura Edition (v6.92.6600) | |
| Microsoft Surface Laptop 7 15 Lunar Lake (v6.92.6600) | |
| AIDA64 / CPU Queen | |
| Asus ZenBook S16 UM5606GA (v6.92.6600) | |
| Samsung Galaxy Book4 Pro 16 (v6.92.6600) | |
| Average of class Multimedia (13483 - 181505, n=48, last 2 years) | |
| Lenovo ThinkPad X9-15 Aura Edition (v6.92.6600) | |
| Lenovo ThinkPad X9-15 Aura Edition (v6.92.6600) | |
| Microsoft Surface Laptop 7 15 Lunar Lake (v6.92.6600) | |
| AIDA64 / FPU SinJulia | |
| Asus ZenBook S16 UM5606GA (v6.92.6600) | |
| Samsung Galaxy Book4 Pro 16 (v6.92.6600) | |
| Average of class Multimedia (1240 - 28794, n=60, last 2 years) | |
| Samsung Galaxy Book6 Pro (v8.20.8100) | |
| Average Intel Core Ultra 7 356H (6960 - 6965, n=2) | |
| Lenovo ThinkPad X9-15 Aura Edition (v8.20.8100) | |
| Lenovo ThinkPad X9-15 Aura Edition (v6.92.6600) | |
| Lenovo ThinkPad X9-15 Aura Edition (v6.92.6600) | |
| Microsoft Surface Laptop 7 15 Lunar Lake (v6.92.6600) | |
| Dell XPS 16 Core Ultra 5 325 (v8.20.8100) | |
| AIDA64 / FPU Mandel | |
| Asus ZenBook S16 UM5606GA (v6.92.6600) | |
| Average Intel Core Ultra 7 356H (44538 - 58505, n=2) | |
| Samsung Galaxy Book6 Pro (v8.20.8100) | |
| Average of class Multimedia (6395 - 105740, n=59, last 2 years) | |
| Samsung Galaxy Book4 Pro 16 (v6.92.6600) | |
| Dell XPS 16 Core Ultra 5 325 (v8.20.8100) | |
| Lenovo ThinkPad X9-15 Aura Edition (v6.92.6600) | |
| Lenovo ThinkPad X9-15 Aura Edition (v6.92.6600) | |
| Lenovo ThinkPad X9-15 Aura Edition (v8.20.8100) | |
| Microsoft Surface Laptop 7 15 Lunar Lake (v6.92.6600) | |
| AIDA64 / CPU AES | |
| Asus ZenBook S16 UM5606GA (v6.92.6600) | |
| Samsung Galaxy Book4 Pro 16 (v6.92.6600) | |
| Average of class Multimedia (13243 - 126790, n=60, last 2 years) | |
| Average Intel Core Ultra 7 356H (64920 - 67037, n=2) | |
| Samsung Galaxy Book6 Pro (v8.20.8100) | |
| Lenovo ThinkPad X9-15 Aura Edition (v8.20.8100) | |
| Lenovo ThinkPad X9-15 Aura Edition (v6.92.6600) | |
| Lenovo ThinkPad X9-15 Aura Edition (v6.92.6600) | |
| Microsoft Surface Laptop 7 15 Lunar Lake (v6.92.6600) | |
| Dell XPS 16 Core Ultra 5 325 (v8.20.8100) | |
| AIDA64 / CPU ZLib | |
| Asus ZenBook S16 UM5606GA (v6.92.6600) | |
| Average Intel Core Ultra 7 356H (1086 - 1199, n=2) | |
| Samsung Galaxy Book6 Pro (v8.20.8100) | |
| Average of class Multimedia (167.2 - 2022, n=60, last 2 years) | |
| Samsung Galaxy Book4 Pro 16 (v6.92.6600) | |
| Dell XPS 16 Core Ultra 5 325 (v8.20.8100) | |
| Lenovo ThinkPad X9-15 Aura Edition (v6.92.6600) | |
| Lenovo ThinkPad X9-15 Aura Edition (v8.20.8100) | |
| Lenovo ThinkPad X9-15 Aura Edition (v6.92.6600) | |
| Microsoft Surface Laptop 7 15 Lunar Lake (v6.92.6600) | |
| AIDA64 / FP64 Ray-Trace | |
| Asus ZenBook S16 UM5606GA (v6.92.6600) | |
| Average of class Multimedia (1014 - 26875, n=60, last 2 years) | |
| Average Intel Core Ultra 7 356H (8201 - 11057, n=2) | |
| Samsung Galaxy Book6 Pro (v8.20.8100) | |
| Samsung Galaxy Book4 Pro 16 (v6.92.6600) | |
| Lenovo ThinkPad X9-15 Aura Edition (v6.92.6600) | |
| Lenovo ThinkPad X9-15 Aura Edition (v6.92.6600) | |
| Lenovo ThinkPad X9-15 Aura Edition (v8.20.8100) | |
| Dell XPS 16 Core Ultra 5 325 (v8.20.8100) | |
| Microsoft Surface Laptop 7 15 Lunar Lake (v6.92.6600) | |
| AIDA64 / CPU PhotoWorxx | |
| Samsung Galaxy Book6 Pro (v8.20.8100) | |
| Average Intel Core Ultra 7 356H (83099 - 83163, n=2) | |
| Lenovo ThinkPad X9-15 Aura Edition (v8.20.8100) | |
| Lenovo ThinkPad X9-15 Aura Edition (v6.92.6600) | |
| Lenovo ThinkPad X9-15 Aura Edition (v6.92.6600) | |
| Dell XPS 16 Core Ultra 5 325 (v8.20.8100) | |
| Microsoft Surface Laptop 7 15 Lunar Lake (v6.92.6600) | |
| Asus ZenBook S16 UM5606GA (v6.92.6600) | |
| Samsung Galaxy Book4 Pro 16 (v6.92.6600) | |
| Average of class Multimedia (12860 - 88154, n=60, last 2 years) | |
| AIDA64 / CPU CheckMate | |
| Average Intel Core Ultra 7 356H (4196 - 4629, n=2) | |
| Samsung Galaxy Book6 Pro (v8.20.8100) | |
| Average of class Multimedia (1570 - 4742, n=15, last 2 years) | |
| Dell XPS 16 Core Ultra 5 325 (v8.20.8100) | |
| Lenovo ThinkPad X9-15 Aura Edition (v8.20.8100) | |
系统性能
主观性能印象极佳,我们没有发现任何卡顿或稳定性问题。
PCMark 10: Score | Essentials | Productivity | Digital Content Creation
CrossMark: Overall | Productivity | Creativity | Responsiveness
WebXPRT 3: Overall
WebXPRT 4: Overall
Mozilla Kraken 1.1: Total
| Performance rating | |
| Apple MacBook Air 15 M5 -4! | |
| Samsung Galaxy Book6 Pro | |
| Average Intel Core Ultra 7 356H, Intel Graphics 4 Xe3 Panther Lake iGPU | |
| Average of class Multimedia | |
| Asus ZenBook S16 UM5606GA | |
| Microsoft Surface Laptop 7 15 Lunar Lake | |
| Dell XPS 16 Core Ultra 5 325 | |
| Lenovo ThinkPad X9-15 Aura Edition | |
| Samsung Galaxy Book4 Pro 16 | |
| PCMark 10 / Score | |
| Samsung Galaxy Book6 Pro | |
| Average Intel Core Ultra 7 356H, Intel Graphics 4 Xe3 Panther Lake iGPU (n=1) | |
| Asus ZenBook S16 UM5606GA | |
| Dell XPS 16 Core Ultra 5 325 | |
| Average of class Multimedia (4325 - 10386, n=57, last 2 years) | |
| Microsoft Surface Laptop 7 15 Lunar Lake | |
| Lenovo ThinkPad X9-15 Aura Edition | |
| Samsung Galaxy Book4 Pro 16 | |
| PCMark 10 / Essentials | |
| Samsung Galaxy Book4 Pro 16 | |
| Microsoft Surface Laptop 7 15 Lunar Lake | |
| Lenovo ThinkPad X9-15 Aura Edition | |
| Average of class Multimedia (8025 - 11664, n=56, last 2 years) | |
| Asus ZenBook S16 UM5606GA | |
| Samsung Galaxy Book6 Pro | |
| Average Intel Core Ultra 7 356H, Intel Graphics 4 Xe3 Panther Lake iGPU (n=1) | |
| Dell XPS 16 Core Ultra 5 325 | |
| PCMark 10 / Productivity | |
| Samsung Galaxy Book6 Pro | |
| Average Intel Core Ultra 7 356H, Intel Graphics 4 Xe3 Panther Lake iGPU (n=1) | |
| Asus ZenBook S16 UM5606GA | |
| Dell XPS 16 Core Ultra 5 325 | |
| Average of class Multimedia (7323 - 18233, n=56, last 2 years) | |
| Microsoft Surface Laptop 7 15 Lunar Lake | |
| Lenovo ThinkPad X9-15 Aura Edition | |
| Samsung Galaxy Book4 Pro 16 | |
| PCMark 10 / Digital Content Creation | |
| Average of class Multimedia (3651 - 16240, n=56, last 2 years) | |
| Microsoft Surface Laptop 7 15 Lunar Lake | |
| Samsung Galaxy Book6 Pro | |
| Average Intel Core Ultra 7 356H, Intel Graphics 4 Xe3 Panther Lake iGPU (n=1) | |
| Asus ZenBook S16 UM5606GA | |
| Lenovo ThinkPad X9-15 Aura Edition | |
| Dell XPS 16 Core Ultra 5 325 | |
| Samsung Galaxy Book4 Pro 16 | |
| CrossMark / Overall | |
| Apple MacBook Air 15 M5 | |
| Samsung Galaxy Book6 Pro | |
| Average Intel Core Ultra 7 356H, Intel Graphics 4 Xe3 Panther Lake iGPU (n=1) | |
| Average of class Multimedia (866 - 2728, n=66, last 2 years) | |
| Samsung Galaxy Book4 Pro 16 | |
| Lenovo ThinkPad X9-15 Aura Edition | |
| Microsoft Surface Laptop 7 15 Lunar Lake | |
| Dell XPS 16 Core Ultra 5 325 | |
| Asus ZenBook S16 UM5606GA | |
| CrossMark / Productivity | |
| Apple MacBook Air 15 M5 | |
| Samsung Galaxy Book6 Pro | |
| Average Intel Core Ultra 7 356H, Intel Graphics 4 Xe3 Panther Lake iGPU (n=1) | |
| Average of class Multimedia (931 - 2489, n=66, last 2 years) | |
| Samsung Galaxy Book4 Pro 16 | |
| Lenovo ThinkPad X9-15 Aura Edition | |
| Microsoft Surface Laptop 7 15 Lunar Lake | |
| Asus ZenBook S16 UM5606GA | |
| Dell XPS 16 Core Ultra 5 325 | |
| CrossMark / Creativity | |
| Apple MacBook Air 15 M5 | |
| Samsung Galaxy Book6 Pro | |
| Average Intel Core Ultra 7 356H, Intel Graphics 4 Xe3 Panther Lake iGPU (n=1) | |
| Average of class Multimedia (907 - 3465, n=66, last 2 years) | |
| Lenovo ThinkPad X9-15 Aura Edition | |
| Microsoft Surface Laptop 7 15 Lunar Lake | |
| Samsung Galaxy Book4 Pro 16 | |
| Asus ZenBook S16 UM5606GA | |
| Dell XPS 16 Core Ultra 5 325 | |
| CrossMark / Responsiveness | |
| Apple MacBook Air 15 M5 | |
| Samsung Galaxy Book6 Pro | |
| Average Intel Core Ultra 7 356H, Intel Graphics 4 Xe3 Panther Lake iGPU (n=1) | |
| Samsung Galaxy Book4 Pro 16 | |
| Average of class Multimedia (605 - 2024, n=66, last 2 years) | |
| Asus ZenBook S16 UM5606GA | |
| Dell XPS 16 Core Ultra 5 325 | |
| Lenovo ThinkPad X9-15 Aura Edition | |
| Microsoft Surface Laptop 7 15 Lunar Lake | |
| WebXPRT 3 / Overall | |
| Apple MacBook Air 15 M5 | |
| Average of class Multimedia (136.4 - 596, n=69, last 2 years) | |
| Microsoft Surface Laptop 7 15 Lunar Lake | |
| Asus ZenBook S16 UM5606GA | |
| Lenovo ThinkPad X9-15 Aura Edition | |
| Samsung Galaxy Book6 Pro | |
| Average Intel Core Ultra 7 356H, Intel Graphics 4 Xe3 Panther Lake iGPU (n=1) | |
| Dell XPS 16 Core Ultra 5 325 | |
| Samsung Galaxy Book4 Pro 16 | |
| WebXPRT 4 / Overall | |
| Apple MacBook Air 15 M5 | |
| Average of class Multimedia (167.3 - 402, n=70, last 2 years) | |
| Microsoft Surface Laptop 7 15 Lunar Lake | |
| Lenovo ThinkPad X9-15 Aura Edition | |
| Samsung Galaxy Book6 Pro | |
| Average Intel Core Ultra 7 356H, Intel Graphics 4 Xe3 Panther Lake iGPU (n=1) | |
| Dell XPS 16 Core Ultra 5 325 | |
| Samsung Galaxy Book4 Pro 16 | |
| Asus ZenBook S16 UM5606GA | |
| Mozilla Kraken 1.1 / Total | |
| Samsung Galaxy Book4 Pro 16 | |
| Dell XPS 16 Core Ultra 5 325 | |
| Asus ZenBook S16 UM5606GA | |
| Microsoft Surface Laptop 7 15 Lunar Lake | |
| Lenovo ThinkPad X9-15 Aura Edition | |
| Samsung Galaxy Book6 Pro | |
| Average Intel Core Ultra 7 356H, Intel Graphics 4 Xe3 Panther Lake iGPU (n=1) | |
| Average of class Multimedia (228 - 835, n=72, last 2 years) | |
| Apple MacBook Air 15 M5 | |
* ... smaller is better
| PCMark 10 Score | 8644 points | |
Help | ||
| AIDA64 / Memory Copy | |
| Samsung Galaxy Book6 Pro | |
| Average Intel Core Ultra 7 356H (116043 - 121055, n=2) | |
| Lenovo ThinkPad X9-15 Aura Edition | |
| Microsoft Surface Laptop 7 15 Lunar Lake | |
| Dell XPS 16 Core Ultra 5 325 | |
| Asus ZenBook S16 UM5606GA | |
| Samsung Galaxy Book4 Pro 16 | |
| Average of class Multimedia (21158 - 132135, n=60, last 2 years) | |
| AIDA64 / Memory Read | |
| Samsung Galaxy Book6 Pro | |
| Average Intel Core Ultra 7 356H (107881 - 112376, n=2) | |
| Asus ZenBook S16 UM5606GA | |
| Samsung Galaxy Book4 Pro 16 | |
| Microsoft Surface Laptop 7 15 Lunar Lake | |
| Lenovo ThinkPad X9-15 Aura Edition | |
| Dell XPS 16 Core Ultra 5 325 | |
| Average of class Multimedia (19699 - 174586, n=60, last 2 years) | |
| AIDA64 / Memory Write | |
| Samsung Galaxy Book6 Pro | |
| Average Intel Core Ultra 7 356H (120431 - 120449, n=2) | |
| Microsoft Surface Laptop 7 15 Lunar Lake | |
| Lenovo ThinkPad X9-15 Aura Edition | |
| Asus ZenBook S16 UM5606GA | |
| Dell XPS 16 Core Ultra 5 325 | |
| Average of class Multimedia (17733 - 134998, n=60, last 2 years) | |
| Samsung Galaxy Book4 Pro 16 | |
| AIDA64 / Memory Latency | |
| Samsung Galaxy Book4 Pro 16 | |
| Average of class Multimedia (7 - 535, n=59, last 2 years) | |
| Asus ZenBook S16 UM5606GA | |
| Dell XPS 16 Core Ultra 5 325 | |
| Microsoft Surface Laptop 7 15 Lunar Lake | |
| Lenovo ThinkPad X9-15 Aura Edition | |
| Average Intel Core Ultra 7 356H (88.6 - 90, n=2) | |
| Samsung Galaxy Book6 Pro | |
* ... smaller is better
DPC 延迟
我们的标准延迟测试并未显示Galaxy Book6 Pro 有任何限制。
| DPC Latencies / LatencyMon - interrupt to process latency (max), Web, Youtube, Prime95 | |
| Dell XPS 16 Core Ultra 5 325 | |
| Samsung Galaxy Book4 Pro 16 | |
| Lenovo ThinkPad X9-15 Aura Edition | |
| Microsoft Surface Laptop 7 15 Lunar Lake | |
| Asus ZenBook S16 UM5606GA | |
| Samsung Galaxy Book6 Pro | |
* ... smaller is better
存储设备
我们的设备配备了 512 GB 硬盘(剩余 369 GB,三星 PM9C1b),PCIe 4.0 SSD 的传输速率良好且稳定。得益于额外的 M.2-2280 插槽,增加存储容量不成问题。

* ... smaller is better
磁盘节流DiskSpd 读取循环,队列深度 8
图形处理器性能
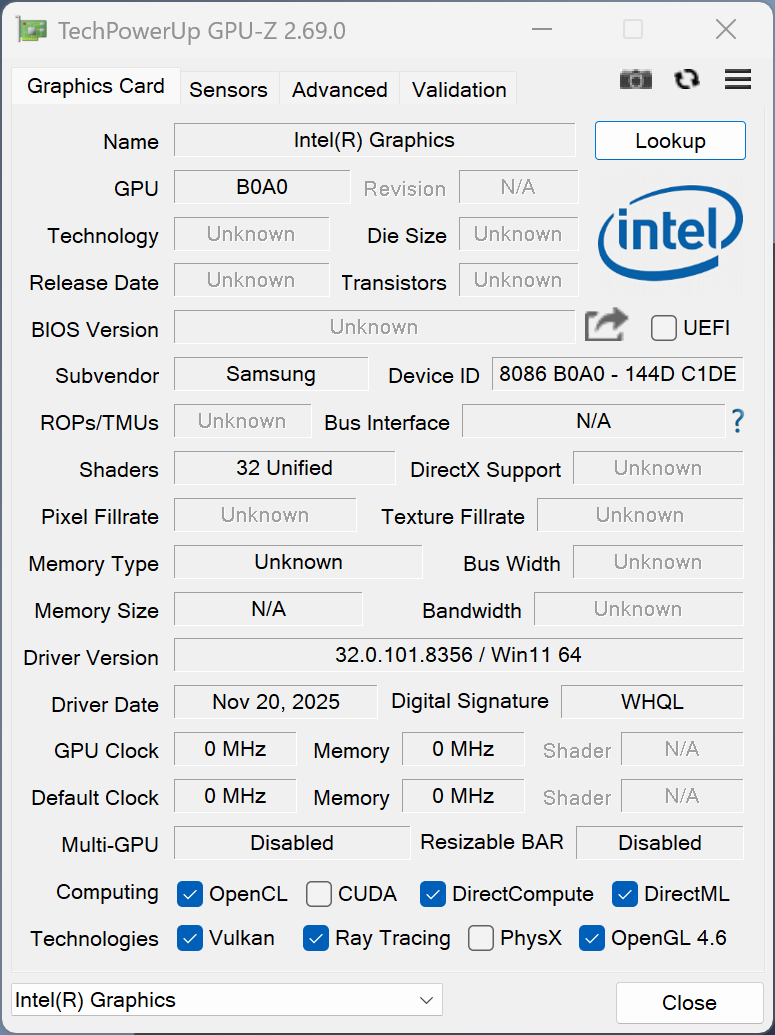
一些 Panther Lake 芯片配备了名为 Arc B370/B390 的强大 iGPU,但酷睿超神 7 356H 只配备了较慢的 Arc Graphics,只有 4 个Xe核心。这块 GPU 可以轻松处理日常任务,包括流式传输高清视频,但原始性能与旧版 Book4 Pro 中流星湖一代的 8 核 Arc iGPU 相比就更差了。 Galaxy Book4 Pro.如果你想玩一些游戏,我们绝对推荐配备酷睿 Ultra X7 358H 和 Arc B390 GPU 的Galaxy Book6 Pro。
| 3DMark 11 Performance | 8078 points | |
| 3DMark Fire Strike Score | 6513 points | |
| 3DMark Time Spy Score | 3395 points | |
| 3DMark Steel Nomad Score | 622 points | |
| 3DMark Steel Nomad Light Score | 2501 points | |
Help | ||
| Blender / v3.3 Classroom CPU | |
| Lenovo ThinkPad X9-15 Aura Edition | |
| Microsoft Surface Laptop 7 15 Lunar Lake | |
| Dell XPS 16 Core Ultra 5 325 | |
| Average Intel Graphics 4 Xe3 Panther Lake iGPU (332 - 569, n=9) | |
| Samsung Galaxy Book4 Pro 16 | |
| Average of class Multimedia (134.5 - 1042, n=67, last 2 years) | |
| Apple MacBook Air 15 M5 | |
| Samsung Galaxy Book6 Pro | |
| Asus ZenBook S16 UM5606GA | |
| Blender / v3.3 Classroom oneAPI/Intel | |
| Average Intel Graphics 4 Xe3 Panther Lake iGPU (235 - 257, n=5) | |
| Dell XPS 16 Core Ultra 5 325 | |
| Average of class Multimedia (105 - 401, n=17, last 2 years) | |
| Blender / v3.3 Classroom METAL | |
| Apple MacBook Air 15 M5 | |
| Average of class Multimedia (17.8 - 68, n=5, last 2 years) | |
* ... smaller is better
赛博朋克 2077》超 FPS 图表
| low | med. | high | ultra | |
|---|---|---|---|---|
| GTA V (2015) | 180.8 | 174.7 | 58.2 | 23.8 |
| Dota 2 Reborn (2015) | 109.6 | 91.5 | 81.8 | 77.4 |
| Final Fantasy XV Benchmark (2018) | 72.3 | 36.7 | 26.1 | |
| X-Plane 11.11 (2018) | 45.1 | 33 | 32.4 | |
| Strange Brigade (2018) | 197 | 70.5 | 59.1 | 51.1 |
| Baldur's Gate 3 (2023) | 31.5 | 23.9 | 21 | 20.3 |
| Cyberpunk 2077 (2023) | 36.8 | 28.2 | 24.4 | 20.5 |
| F1 24 (2024) | 66.8 | 64.3 | 46.5 | 14.8 |
排放与耗电量
系统噪音

Galaxy Book6 Pro 在日常轻负载情况下通常是非常安静或静音的伴侣。第一级风扇也相当安静,约为 27-32 dB(A),只有最大负载或游戏时才会高达 38.4 dB(A),因此它是我们对比组中最安静的机型之一(除了静音的 MacBook Air).在 "高性能"模式下,我们测得的噪音为 43.9 分贝(A),而在 "静音"模式下仅为 29.1 分贝(A)。我们没有发现任何电子噪音。
Noise level
| Idle |
| 25.3 / 25.3 / 25.3 dB(A) |
| Load |
| 31.8 / 38.4 dB(A) |
 | ||
30 dB silent 40 dB(A) audible 50 dB(A) loud |
||
min: | ||
| Samsung Galaxy Book6 Pro Ultra 7 356H, Intel Graphics 4 Xe3 PTL | Dell XPS 16 Core Ultra 5 325 Ultra 5 325, Intel Graphics 4 Xe3 PTL | Asus ZenBook S16 UM5606GA Ryzen AI 9 465, Radeon 880M | Apple MacBook Air 15 M5 M5 10-Core, M5 10-Core GPU | Microsoft Surface Laptop 7 15 Lunar Lake Core Ultra 7 268V, Arc 140V | Lenovo ThinkPad X9-15 Aura Edition Core Ultra 7 258V, Arc 140V | Samsung Galaxy Book4 Pro 16 Ultra 7 155H, Arc 8-Core | |
|---|---|---|---|---|---|---|---|
| Noise | 2% | -14% | 2% | -2% | -4% | ||
| off / environment * (dB) | 25.3 | 22.8 10% | 24.9 2% | 23.9 6% | 24.4 4% | 24.6 3% | |
| Idle Minimum * (dB) | 25.3 | 22.9 9% | 24.9 2% | 23.9 6% | 24.4 4% | 24.6 3% | |
| Idle Average * (dB) | 25.3 | 22.9 9% | 24.9 2% | 23.9 6% | 24.4 4% | 24.6 3% | |
| Idle Maximum * (dB) | 25.3 | 23.9 6% | 24.9 2% | 23.9 6% | 24.4 4% | 26.4 -4% | |
| Load Average * (dB) | 31.8 | 34.8 -9% | 45.7 -44% | 31.8 -0% | 35.8 -13% | 40 -26% | |
| Cyberpunk 2077 ultra * (dB) | 38.4 | 38 1% | 49 -28% | 38 1% | 39.4 -3% | ||
| Load Maximum * (dB) | 38.4 | 43.3 -13% | 50.4 -31% | 41.9 -9% | 45 -17% | 40 -4% | |
| Witcher 3 ultra * (dB) | 40 |
* ... smaller is better
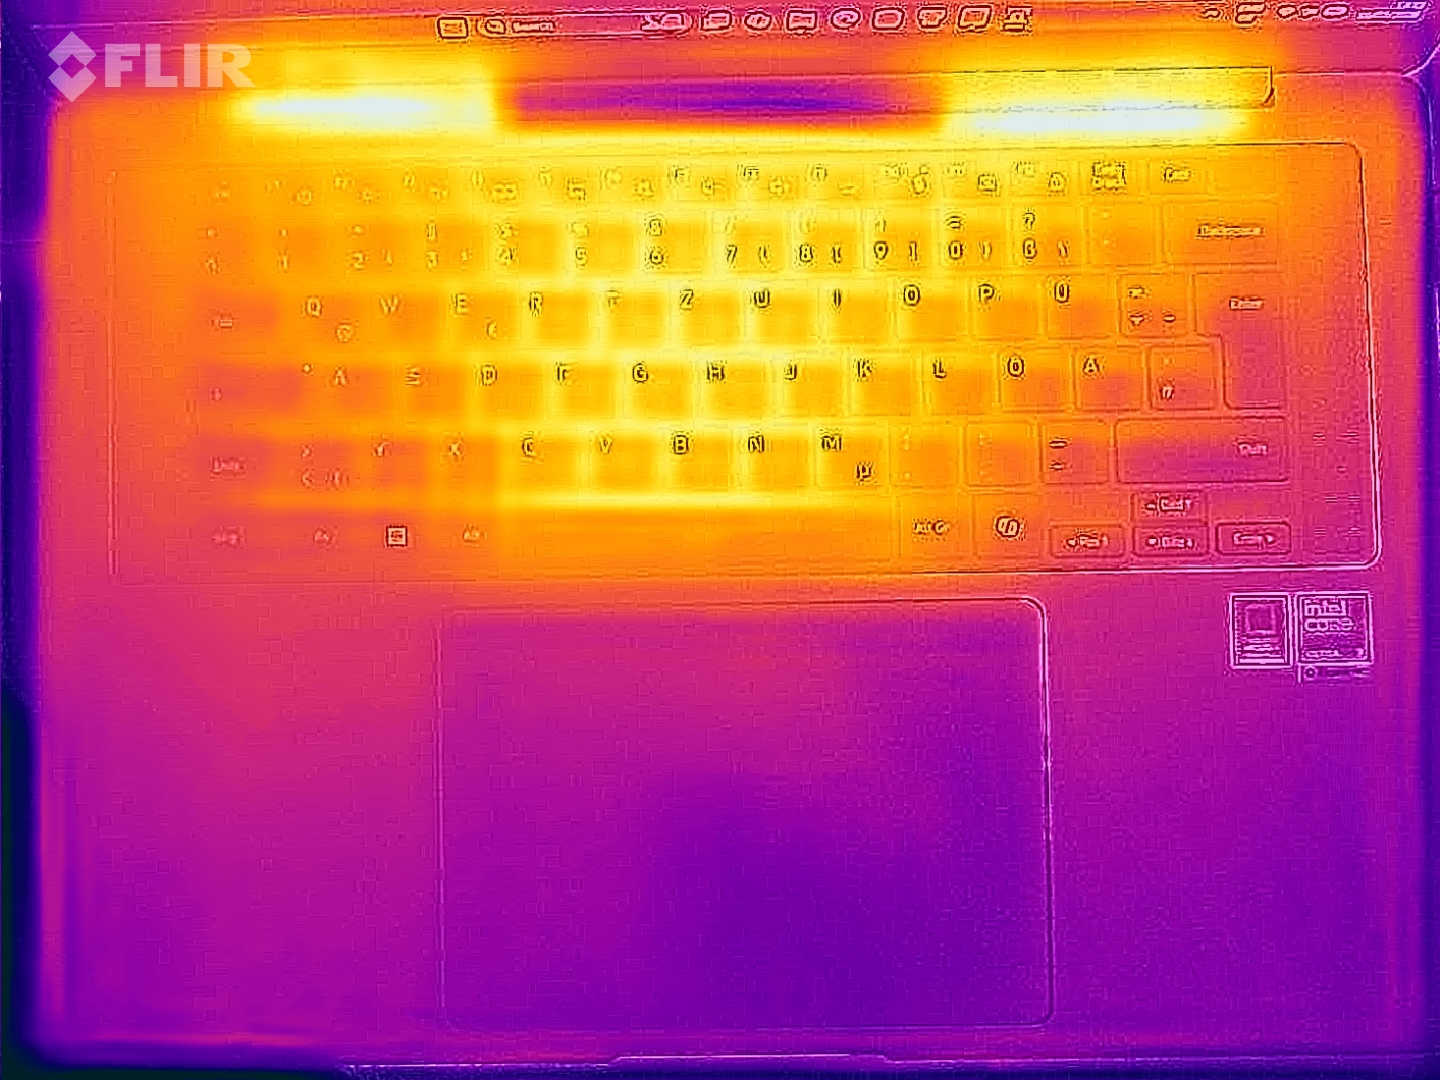
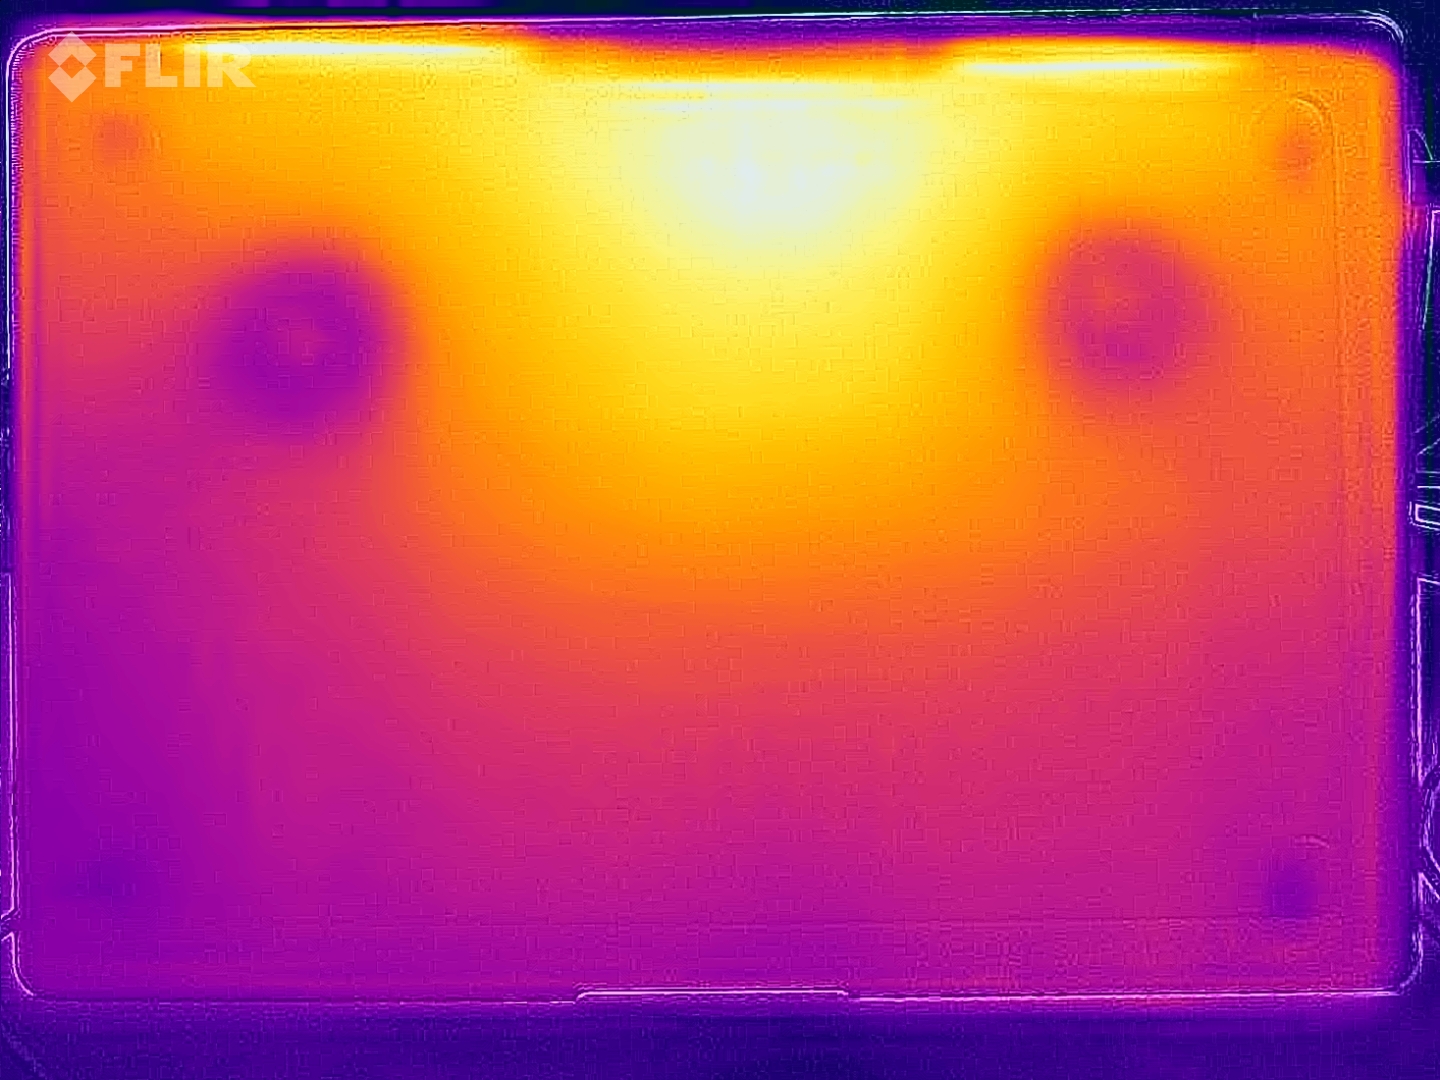
温度
在日常情况下,CPU 表面非常凉爽,我们只能测量到一个点的负载温度超过 40 °C,因此完全没有任何限制。在压力测试中,CPU 的功耗为 27 瓦。

(+) The maximum temperature on the upper side is 37.8 °C / 100 F, compared to the average of 36.8 °C / 98 F, ranging from 21 to 71 °C for the class Multimedia.
(±) The bottom heats up to a maximum of 40.1 °C / 104 F, compared to the average of 39.1 °C / 102 F
(+) In idle usage, the average temperature for the upper side is 22.4 °C / 72 F, compared to the device average of 31.3 °C / 88 F.
(±) 3: The average temperature for the upper side is 32.8 °C / 91 F, compared to the average of 31.3 °C / 88 F for the class Multimedia.
(+) The palmrests and touchpad are cooler than skin temperature with a maximum of 28.4 °C / 83.1 F and are therefore cool to the touch.
(±) The average temperature of the palmrest area of similar devices was 28.7 °C / 83.7 F (+0.3 °C / 0.6 F).
| Samsung Galaxy Book6 Pro Ultra 7 356H, Intel Graphics 4 Xe3 PTL | Dell XPS 16 Core Ultra 5 325 Ultra 5 325, Intel Graphics 4 Xe3 PTL | Asus ZenBook S16 UM5606GA Ryzen AI 9 465, Radeon 880M | Apple MacBook Air 15 M5 M5 10-Core, M5 10-Core GPU | Microsoft Surface Laptop 7 15 Lunar Lake Core Ultra 7 268V, Arc 140V | Lenovo ThinkPad X9-15 Aura Edition Core Ultra 7 258V, Arc 140V | |
|---|---|---|---|---|---|---|
| Heat | -7% | -16% | -9% | -8% | -6% | |
| Maximum Upper Side * (°C) | 37.8 | 43.8 -16% | 43.4 -15% | 44.1 -17% | 45.7 -21% | 42.1 -11% |
| Maximum Bottom * (°C) | 40.1 | 42 -5% | 46.2 -15% | 43.1 -7% | 42.9 -7% | 39.5 1% |
| Idle Upper Side * (°C) | 22.6 | 23.2 -3% | 26.5 -17% | 24 -6% | 23.6 -4% | 24.5 -8% |
| Idle Bottom * (°C) | 22.8 | 23.6 -4% | 27 -18% | 23.9 -5% | 23.1 -1% | 24.4 -7% |
* ... smaller is better
发言人
四扬声器系统提供了不错的音质,但竞争对手提供了更好甚至更出色的音响系统。Galaxy Book6 Pro 的模块明显缺少一些冲击力。
Samsung Galaxy Book6 Pro audio analysis
(±) | speaker loudness is average but good (81.1 dB)
Bass 100 - 315 Hz
(±) | reduced bass - on average 13.7% lower than median
(±) | linearity of bass is average (8.9% delta to prev. frequency)
Mids 400 - 2000 Hz
(+) | balanced mids - only 3.1% away from median
(+) | mids are linear (3.5% delta to prev. frequency)
Highs 2 - 16 kHz
(+) | balanced highs - only 1.3% away from median
(+) | highs are linear (2.7% delta to prev. frequency)
Overall 100 - 16.000 Hz
(+) | overall sound is linear (11% difference to median)
Compared to same class
» 16% of all tested devices in this class were better, 3% similar, 81% worse
» The best had a delta of 5%, average was 17%, worst was 45%
Compared to all devices tested
» 6% of all tested devices were better, 2% similar, 92% worse
» The best had a delta of 4%, average was 24%, worst was 134%
Dell XPS 16 Core Ultra 5 325 audio analysis
(+) | speakers can play relatively loud (85.3 dB)
Bass 100 - 315 Hz
(±) | reduced bass - on average 6.1% lower than median
(+) | bass is linear (5.6% delta to prev. frequency)
Mids 400 - 2000 Hz
(+) | balanced mids - only 3.2% away from median
(+) | mids are linear (4.6% delta to prev. frequency)
Highs 2 - 16 kHz
(+) | balanced highs - only 2.4% away from median
(+) | highs are linear (3.3% delta to prev. frequency)
Overall 100 - 16.000 Hz
(+) | overall sound is linear (7% difference to median)
Compared to same class
» 5% of all tested devices in this class were better, 1% similar, 94% worse
» The best had a delta of 5%, average was 17%, worst was 45%
Compared to all devices tested
» 1% of all tested devices were better, 0% similar, 99% worse
» The best had a delta of 4%, average was 24%, worst was 134%
Asus ZenBook S16 UM5606GA audio analysis
(±) | speaker loudness is average but good (78.2 dB)
Bass 100 - 315 Hz
(+) | good bass - only 4.6% away from median
(+) | bass is linear (6.2% delta to prev. frequency)
Mids 400 - 2000 Hz
(+) | balanced mids - only 1.9% away from median
(+) | mids are linear (5% delta to prev. frequency)
Highs 2 - 16 kHz
(+) | balanced highs - only 2.1% away from median
(+) | highs are linear (4.9% delta to prev. frequency)
Overall 100 - 16.000 Hz
(+) | overall sound is linear (7.6% difference to median)
Compared to same class
» 6% of all tested devices in this class were better, 2% similar, 92% worse
» The best had a delta of 5%, average was 17%, worst was 45%
Compared to all devices tested
» 1% of all tested devices were better, 0% similar, 98% worse
» The best had a delta of 4%, average was 24%, worst was 134%
Apple MacBook Air 15 M5 audio analysis
(+) | speakers can play relatively loud (84.8 dB)
Bass 100 - 315 Hz
(±) | reduced bass - on average 6.8% lower than median
(+) | bass is linear (6.6% delta to prev. frequency)
Mids 400 - 2000 Hz
(+) | balanced mids - only 2% away from median
(+) | mids are linear (3.3% delta to prev. frequency)
Highs 2 - 16 kHz
(+) | balanced highs - only 3.6% away from median
(+) | highs are linear (3.2% delta to prev. frequency)
Overall 100 - 16.000 Hz
(+) | overall sound is linear (7.7% difference to median)
Compared to same class
» 2% of all tested devices in this class were better, 0% similar, 98% worse
» The best had a delta of 5%, average was 18%, worst was 53%
Compared to all devices tested
» 1% of all tested devices were better, 0% similar, 98% worse
» The best had a delta of 4%, average was 24%, worst was 134%
Microsoft Surface Laptop 7 15 Lunar Lake audio analysis
(±) | speaker loudness is average but good (78.8 dB)
Bass 100 - 315 Hz
(±) | reduced bass - on average 9.3% lower than median
(±) | linearity of bass is average (8.4% delta to prev. frequency)
Mids 400 - 2000 Hz
(+) | balanced mids - only 4.4% away from median
(+) | mids are linear (3% delta to prev. frequency)
Highs 2 - 16 kHz
(+) | balanced highs - only 2.4% away from median
(+) | highs are linear (4.1% delta to prev. frequency)
Overall 100 - 16.000 Hz
(+) | overall sound is linear (11.4% difference to median)
Compared to same class
» 3% of all tested devices in this class were better, 2% similar, 95% worse
» The best had a delta of 7%, average was 21%, worst was 53%
Compared to all devices tested
» 7% of all tested devices were better, 2% similar, 91% worse
» The best had a delta of 4%, average was 24%, worst was 134%
Lenovo ThinkPad X9-15 Aura Edition audio analysis
(+) | speakers can play relatively loud (87.5 dB)
Bass 100 - 315 Hz
(±) | reduced bass - on average 12.5% lower than median
(+) | bass is linear (6.8% delta to prev. frequency)
Mids 400 - 2000 Hz
(+) | balanced mids - only 3.1% away from median
(+) | mids are linear (5.3% delta to prev. frequency)
Highs 2 - 16 kHz
(+) | balanced highs - only 2.4% away from median
(+) | highs are linear (3.3% delta to prev. frequency)
Overall 100 - 16.000 Hz
(+) | overall sound is linear (9.5% difference to median)
Compared to same class
» 1% of all tested devices in this class were better, 0% similar, 99% worse
» The best had a delta of 7%, average was 21%, worst was 53%
Compared to all devices tested
» 4% of all tested devices were better, 1% similar, 95% worse
» The best had a delta of 4%, average was 24%, worst was 134%
耗电量
新的 OLED 屏幕(2.8K、120 Hz)非常高效,最大闲置功耗仅为 4.6 瓦,与采用 60 Hz 劣质 FHD 面板的新 XPS 16 完全相同。在负载情况下,我们测得的功耗高达 71 瓦,尽管我们使用的是 180 瓦的 PSU,因为我们的设备出厂时没有 PSU。这似乎是一种限制,因为考虑到 CPU 的短期功耗为 80 瓦,短期功耗应该更高。在约 54 瓦时,功耗迅速趋于稳定。
| Off / Standby | |
| Idle | |
| Load |
|
Key:
min: | |
| Samsung Galaxy Book6 Pro Ultra 7 356H, Intel Graphics 4 Xe3 PTL, Samsung PM9C1b MZVL8512HFLU-00BLL, OLED, 2880x1800, 16" | Dell XPS 16 Core Ultra 5 325 Ultra 5 325, Intel Graphics 4 Xe3 PTL, SK hynix PVC10 HFS512GEM4X182N, IPS, 1920x1200, 16" | Asus ZenBook S16 UM5606GA Ryzen AI 9 465, Radeon 880M, SanDisk PC SN5100S, OLED, 2880x1800, 16" | Apple MacBook Air 15 M5 M5 10-Core, M5 10-Core GPU, Apple SSD AP2048Z, IPS, 2880x1864, 15.3" | Microsoft Surface Laptop 7 15 Lunar Lake Core Ultra 7 268V, Arc 140V, Samsung PM9C1a MZ9L81T0HDLB, IPS, 2496x1664, 15" | Lenovo ThinkPad X9-15 Aura Edition Core Ultra 7 258V, Arc 140V, WD PC SN740 SDDQMQD-1T00, OLED, 2880x1800, 15.3" | Samsung Galaxy Book4 Pro 16 Ultra 7 155H, Arc 8-Core, Samsung PM9B1 512GB MZVL4512HBLU, OLED, 2880x1800, 16" | Average Intel Graphics 4 Xe3 Panther Lake iGPU | Average of class Multimedia | |
|---|---|---|---|---|---|---|---|---|---|
| Power Consumption | 5% | -47% | -23% | -35% | 4% | -26% | -15% | -110% | |
| Idle Minimum * (Watt) | 2.5 | 1.3 48% | 3.7 -48% | 2.2 12% | 3.2 -28% | 2.4 4% | 3.6 -44% | 2.8 ? -12% | 5.69 ? -128% |
| Idle Average * (Watt) | 4.2 | 4.5 -7% | 7.4 -76% | 11.7 -179% | 8.7 -107% | 3.9 7% | 5.7 -36% | 5.08 ? -21% | 10.1 ? -140% |
| Idle Maximum * (Watt) | 4.6 | 4.6 -0% | 9.5 -107% | 11.8 -157% | 9 -96% | 5.1 -11% | 6.1 -33% | 6.68 ? -45% | 12.3 ? -167% |
| Load Average * (Watt) | 42.2 | 36.5 14% | 57.9 -37% | 36.2 14% | 44.7 -6% | 42.5 -1% | 52.5 -24% | 40.1 ? 5% | 65.3 ? -55% |
| Cyberpunk 2077 ultra external monitor * (Watt) | 40.6 | 45.4 -12% | 57 -40% | 21.7 47% | 49.3 -21% | 40.2 1% | |||
| Cyberpunk 2077 ultra * (Watt) | 52.7 | 47.9 9% | 58.5 -11% | 23.5 55% | 51.1 3% | 43.5 17% | |||
| Load Maximum * (Watt) | 70.8 | 82.8 -17% | 76.9 -9% | 37.4 47% | 64.6 9% | 64.4 9% | 64.7 9% | 72.3 ? -2% | 112.5 ? -59% |
| Witcher 3 ultra * (Watt) | 46.6 |
* ... smaller is better
功耗 赛博朋克/压力测试
外部显示器功耗
电池寿命
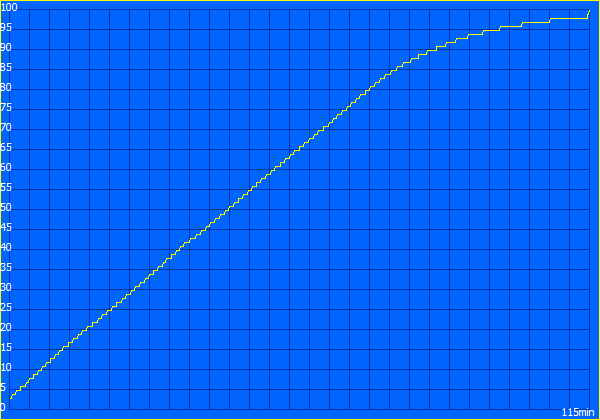
80 Wh 电池的续航时间不错,但要注意的是,我们的 Wi-Fi 测试主要使用明亮的网站,OLED 屏幕与 IPS 面板相比处于劣势。在 Wi-Fi 测试中,我们确定电池使用时间超过 16 小时,在全亮度下仍能使用近 9 小时。竞争对手的运行时间甚至更长,但通常使用的也是劣质屏幕。例外的是 ThinkPad X9 15而 Zenbook S16的续航时间则没有那么长。

| Samsung Galaxy Book6 Pro Ultra 7 356H, Intel Graphics 4 Xe3 PTL, 78 Wh | Dell XPS 16 Core Ultra 5 325 Ultra 5 325, Intel Graphics 4 Xe3 PTL, 70 Wh | Asus ZenBook S16 UM5606GA Ryzen AI 9 465, Radeon 880M, 83 Wh | Apple MacBook Air 15 M5 M5 10-Core, M5 10-Core GPU, 66.5 Wh | Microsoft Surface Laptop 7 15 Lunar Lake Core Ultra 7 268V, Arc 140V, 64 Wh | Lenovo ThinkPad X9-15 Aura Edition Core Ultra 7 258V, Arc 140V, 80 Wh | Samsung Galaxy Book4 Pro 16 Ultra 7 155H, Arc 8-Core, 76 Wh | Average of class Multimedia | |
|---|---|---|---|---|---|---|---|---|
| Battery Runtime | 63% | -16% | -9% | 5% | 8% | -25% | -24% | |
| WiFi Websurfing (h) | 16.3 | 26.6 63% | 13.1 -20% | 17.2 6% | 17.7 9% | 17.5 7% | 10.7 -34% | 12 ? -26% |
| WiFi Websurfing max. Brightness (h) | 8.8 | 7.8 -11% | 6.7 -24% | 8.8 0% | 9.5 8% | 7.5 -15% | 6.95 ? -21% |
笔记本检查评级
Samsung Galaxy Book6 Pro
- 03/31/2026 v8
Andreas Osthoff
 Total Sustainability Score:
 潜在竞争对手比较
Image | Model / Review | Price | Weight | Height | Display |
|---|---|---|---|---|---|
1. 86.3%  | Samsung Galaxy Book6 Pro Intel Core Ultra 7 356H ⎘ Intel Graphics 4 Xe3 Panther Lake iGPU ⎘ 32 GB Memory, 512 GB SSD | Amazon: List Price: 2199€ | 1.6 kg | 11.9 mm | 16.00" 2880x1800 212 PPI OLED |
2. 84.2%  | Dell XPS 16 Core Ultra 5 325 Intel Core Ultra 5 325 ⎘ Intel Graphics 4 Xe3 Panther Lake iGPU ⎘ 16 GB Memory, 512 GB SSD | Amazon: 1. $1,977.99 Dell Premium 16 (Previously ... 2. $2,599.00 Dell Premium 16 (XPS 16 2025... 3. $2,499.00 Dell Premium 16 (XPS 16 2025... List Price: 1600 USD | 1.7 kg | 15.4 mm | 16.00" 1920x1200 142 PPI IPS |
3. 86.6%  | Asus ZenBook S16 UM5606GA AMD Ryzen AI 9 465 ⎘ AMD Radeon 880M ⎘ 32 GB Memory, 1024 GB SSD | Amazon: List Price: 1799€ | 1.5 kg | 12.9 mm | 16.00" 2880x1800 212 PPI OLED |
4. 91.6%  | Apple MacBook Air 15 M5 Apple M5 10-Core ⎘ Apple M5 10-Core GPU ⎘ 32 GB Memory, 2048 GB SSD | Amazon: | 1.5 kg | 11.5 mm | 15.30" 2880x1864 224 PPI IPS |
5. 87.4% 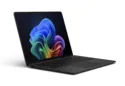 | Microsoft Surface Laptop 7 15 Lunar Lake Intel Core Ultra 7 268V ⎘ Intel Arc Graphics 140V ⎘ 32 GB Memory, 1024 GB SSD | Amazon: List Price: 2760€ | 1.7 kg | 18.3 mm | 15.00" 2496x1664 200 PPI IPS |
6. 90.1%  | Lenovo ThinkPad X9-15 Aura Edition Intel Core Ultra 7 258V ⎘ Intel Arc Graphics 140V ⎘ 32 GB Memory, 1024 GB SSD | Amazon: List Price: 1989€ | 1.4 kg | 17.7 mm | 15.30" 2880x1800 222 PPI OLED |
Transparency
The selection of devices to be reviewed is made by our editorial team. The test sample was provided to the author as a loan by the manufacturer or retailer for the purpose of this review. The lender had no influence on this review, nor did the manufacturer receive a copy of this review before publication. There was no obligation to publish this review. As an independent media company, Notebookcheck is not subjected to the authority of manufacturers, retailers or publishers.
This is how Notebookcheck is testing
Every year, Notebookcheck independently reviews hundreds of laptops and smartphones using standardized procedures to ensure that all results are comparable. We have continuously developed our test methods for around 20 years and set industry standards in the process. In our test labs, high-quality measuring equipment is utilized by experienced technicians and editors. These tests involve a multi-stage validation process. Our complex rating system is based on hundreds of well-founded measurements and benchmarks, which maintains objectivity. Further information on our test methods can be found here.

