联想Legion Y740-15ICH (i7-8750H, RTX 2070 Max-Q) 笔记本电脑评测

| Networking | |
| iperf3 transmit AX12 | |
| Lenovo Legion Y730-15ICH i5-8300H | |
| Acer Predator Triton 500 | |
| Gigabyte Aero 15-X9 | |
| Alienware m15 GTX 1070 Max-Q | |
| Razer Blade 15 RTX 2070 Max-Q | |
| HP Omen 15-dc0015ng | |
| Lenovo Legion Y740-15ICHg | |
| iperf3 receive AX12 | |
| Alienware m15 GTX 1070 Max-Q | |
| Razer Blade 15 RTX 2070 Max-Q | |
| Gigabyte Aero 15-X9 | |
| Acer Predator Triton 500 | |
| HP Omen 15-dc0015ng | |
| Lenovo Legion Y730-15ICH i5-8300H | |
| Lenovo Legion Y740-15ICHg | |
| |||||||||||||||||||||||||
Brightness Distribution: 85 %
Center on Battery: 320.4 cd/m²
Contrast: 763:1 (Black: 0.42 cd/m²)
ΔE ColorChecker Calman: 3.21 | ∀{0.5-29.43 Ø4.71}
calibrated: 2.36
ΔE Greyscale Calman: 3.6 | ∀{0.09-98 Ø4.96}
92% sRGB (Argyll 1.6.3 3D)
59% AdobeRGB 1998 (Argyll 1.6.3 3D)
64.7% AdobeRGB 1998 (Argyll 3D)
92.4% sRGB (Argyll 3D)
63.5% Display P3 (Argyll 3D)
Gamma: 2.27
CCT: 6503 K
| Lenovo Legion Y740-15ICHg LP156WFG-SPB2, IPS, 15.6", 1920x1080 | Gigabyte Aero 15-X9 LGD05C0, IPS, 15.6", 1920x1080 | Acer Predator Triton 500 AU Optronics B156HAN08.2 (AUO82ED), IPS, 15.6", 1920x1080 | Razer Blade 15 RTX 2070 Max-Q LG Philips LGD05C0, IPS, 15.6", 1920x1080 | Alienware m15 GTX 1070 Max-Q AU Optronics B156HAN, IPS, 15.6", 1920x1080 | |
|---|---|---|---|---|---|
| Display | 0% | 1% | 3% | -1% | |
| Display P3 Coverage (%) | 63.5 | 63.5 0% | 64.2 1% | 65.3 3% | 63.5 0% |
| sRGB Coverage (%) | 92.4 | 93.1 1% | 92.6 0% | 94.9 3% | 89.4 -3% |
| AdobeRGB 1998 Coverage (%) | 64.7 | 64.5 0% | 65.7 2% | 66.3 2% | 64.5 0% |
| Response Times | 5% | 36% | 12% | 7% | |
| Response Time Grey 50% / Grey 80% * (ms) | 18.8 ? | 16.4 ? 13% | 8 ? 57% | 16.8 ? 11% | 18 ? 4% |
| Response Time Black / White * (ms) | 13.2 ? | 13.6 ? -3% | 11.2 ? 15% | 11.6 ? 12% | 12 ? 9% |
| PWM Frequency (Hz) | |||||
| Screen | 18% | -5% | 9% | -3% | |
| Brightness middle (cd/m²) | 320.4 | 250 -22% | 304 -5% | 314.7 -2% | 353.6 10% |
| Brightness (cd/m²) | 298 | 235 -21% | 299 0% | 312 5% | 346 16% |
| Brightness Distribution (%) | 85 | 85 0% | 89 5% | 90 6% | 86 1% |
| Black Level * (cd/m²) | 0.42 | 0.29 31% | 0.27 36% | 0.38 10% | 0.3 29% |
| Contrast (:1) | 763 | 862 13% | 1126 48% | 828 9% | 1179 55% |
| Colorchecker dE 2000 * | 3.21 | 1.46 55% | 4.66 -45% | 2.56 20% | 4.55 -42% |
| Colorchecker dE 2000 max. * | 5.54 | 2.47 55% | 9.65 -74% | 4.89 12% | 7.91 -43% |
| Colorchecker dE 2000 calibrated * | 2.36 | 1.72 27% | 1.71 28% | 3.37 -43% | |
| Greyscale dE 2000 * | 3.6 | 1.27 65% | 5.53 -54% | 3.4 6% | 4.1 -14% |
| Gamma | 2.27 97% | 2.4 92% | 2.5 88% | 2.3 96% | 2.27 97% |
| CCT | 6503 100% | 6749 96% | 8028 81% | 6435 101% | 7434 87% |
| Color Space (Percent of AdobeRGB 1998) (%) | 59 | 60 2% | 60 2% | 60.7 3% | 57.9 -2% |
| Color Space (Percent of sRGB) (%) | 92 | 93 1% | 93 1% | 94.6 3% | 88.9 -3% |
| Total Average (Program / Settings) | 8% /
13% | 11% /
1% | 8% /
8% | 1% /
-2% |
* ... smaller is better
Display Response Times
| ↔ Response Time Black to White | ||
|---|---|---|
| 13.2 ms ... rise ↗ and fall ↘ combined | ↗ 8 ms rise | 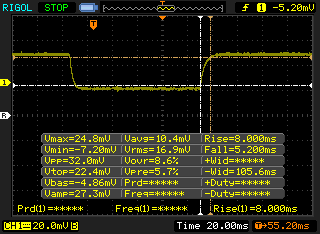 |
| ↘ 5.2 ms fall | ||
| The screen shows good response rates in our tests, but may be too slow for competitive gamers. In comparison, all tested devices range from 0.1 (minimum) to 240 (maximum) ms. » 34 % of all devices are better. This means that the measured response time is better than the average of all tested devices (19.8 ms). | ||
| ↔ Response Time 50% Grey to 80% Grey | ||
| 18.8 ms ... rise ↗ and fall ↘ combined | ↗ 11.6 ms rise | 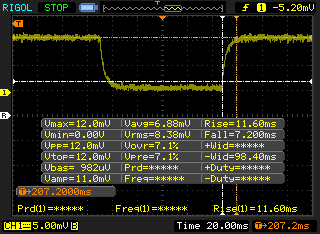 |
| ↘ 7.2 ms fall | ||
| The screen shows good response rates in our tests, but may be too slow for competitive gamers. In comparison, all tested devices range from 0.165 (minimum) to 636 (maximum) ms. » 32 % of all devices are better. This means that the measured response time is better than the average of all tested devices (30.9 ms). | ||
Screen Flickering / PWM (Pulse-Width Modulation)
| Screen flickering / PWM not detected | 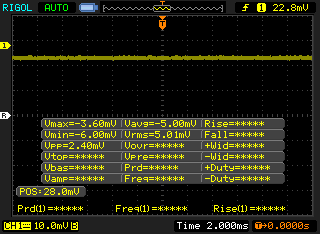 | ||
In comparison: 52 % of all tested devices do not use PWM to dim the display. If PWM was detected, an average of 7748 (minimum: 5 - maximum: 343500) Hz was measured. | |||
| Cinebench R11.5 | |
| CPU Single 64Bit | |
| Average of class Gaming (3.3 - 4.16, n=9, last 2 years) | |
| Acer Predator Triton 500 | |
| Average Intel Core i7-8750H (1.89 - 2, n=40) | |
| HP Omen 15-dc0015ng | |
| CPU Multi 64Bit | |
| Average of class Gaming (29.8 - 76.7, n=9, last 2 years) | |
| Average Intel Core i7-8750H (9.54 - 13.5, n=41) | |
| HP Omen 15-dc0015ng | |
| Acer Predator Triton 500 | |
| Cinebench R10 | |
| Rendering Multiple CPUs 32Bit | |
| Average of class Gaming (42932 - 102066, n=9, last 2 years) | |
| Gigabyte Aero 15-X9 | |
| Average Intel Core i7-8750H (29664 - 35307, n=25) | |
| HP Omen 15-dc0015ng | |
| Rendering Single 32Bit | |
| Average of class Gaming (7457 - 12575, n=9, last 2 years) | |
| Average Intel Core i7-8750H (6236 - 6645, n=25) | |
| HP Omen 15-dc0015ng | |
| Gigabyte Aero 15-X9 | |
| PCMark 8 Home Score Accelerated v2 | 5115 points | |
| PCMark 8 Work Score Accelerated v2 | 5852 points | |
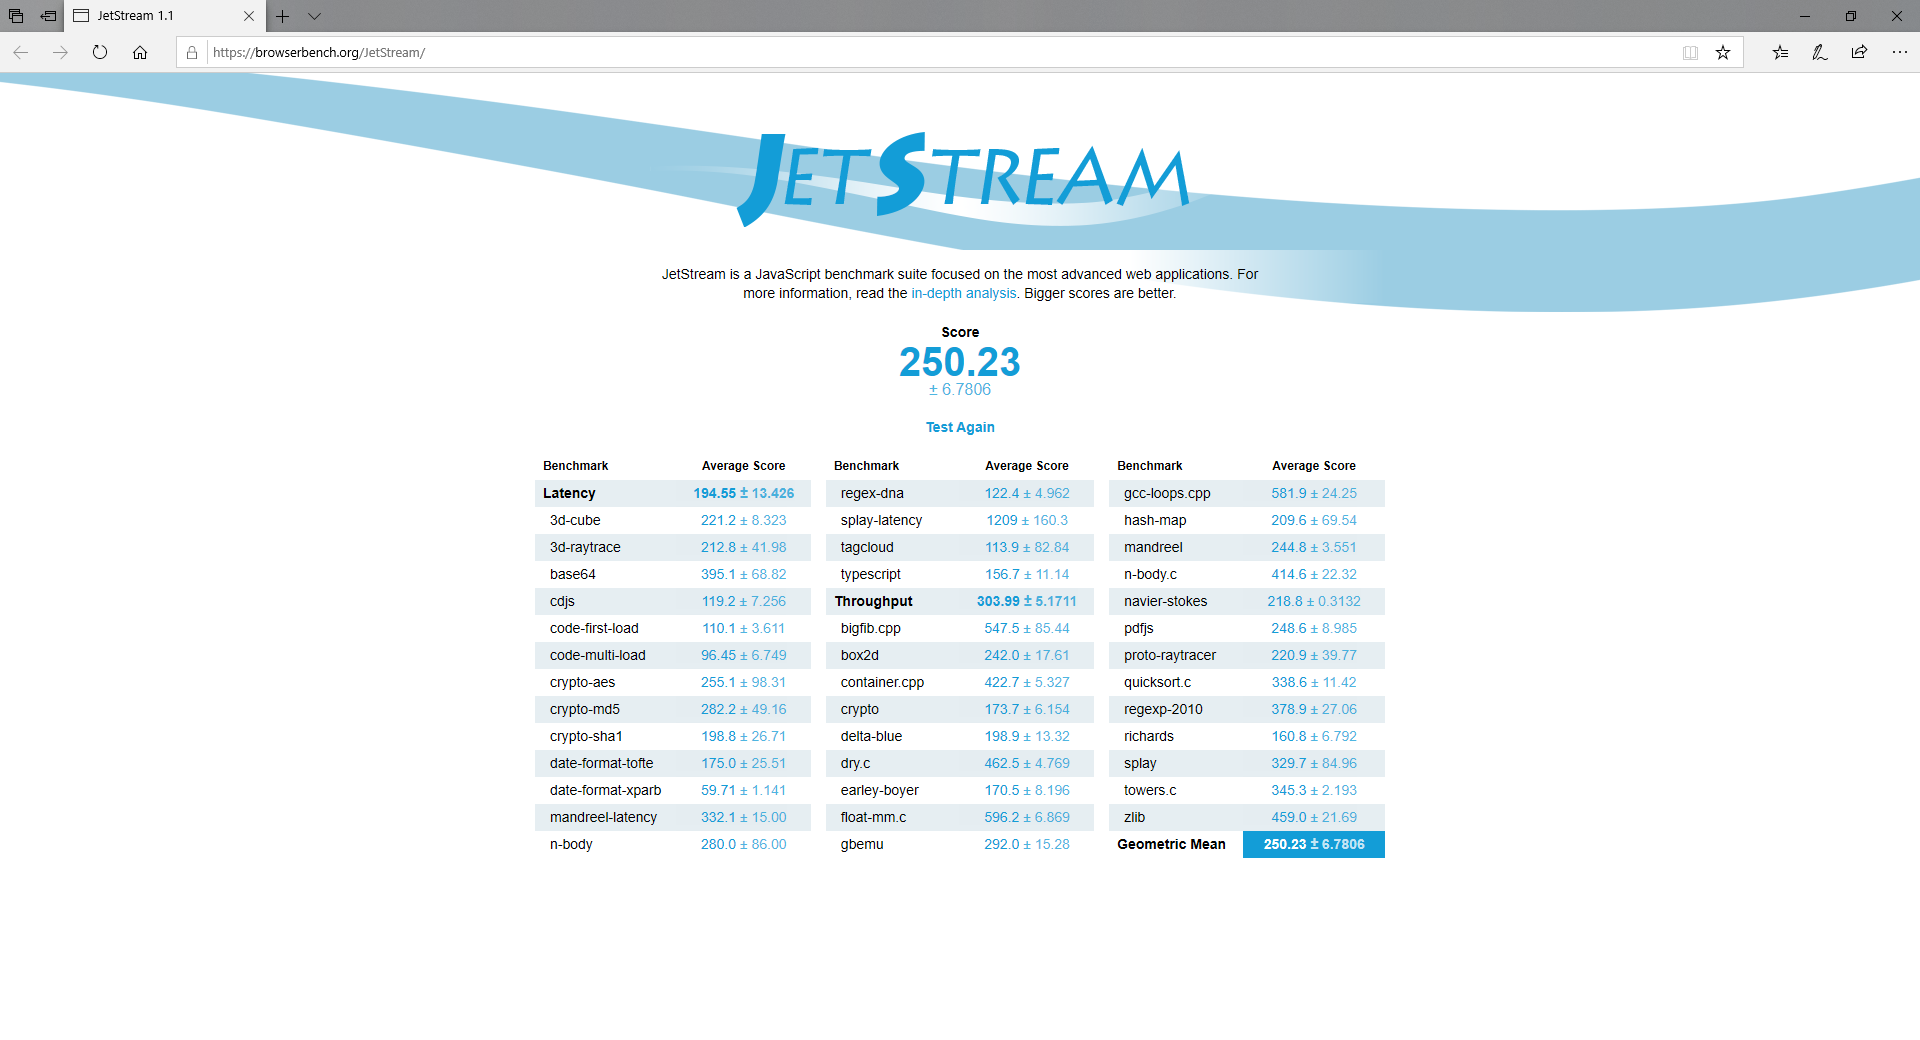
| PCMark 10 Score | 5941 points | |
Help | ||
| Lenovo Legion Y740-15ICHg Samsung SSD PM981 MZVLB256HAHQ | Gigabyte Aero 15-X9 Intel SSD 760p SSDPEKKW010T8 | Acer Predator Triton 500 2x WDC PC SN720 SDAPNTW-256G-1014 (RAID 0) | Razer Blade 15 RTX 2070 Max-Q Samsung SSD PM981 MZVLB512HAJQ | Alienware m15 GTX 1070 Max-Q Toshiba XG5 KXG50ZNV512G | |
|---|---|---|---|---|---|
| AS SSD | |||||
| Seq Read (MB/s) | 1953 | 2113 8% | 2913 49% | 1840 -6% | 1967 1% |
| Seq Write (MB/s) | 1629 | 1471 -10% | 2492 53% | 1822 12% | 1135 -30% |
| 4K Read (MB/s) | 33.2 | 55 66% | 38.7 17% | 52.3 58% | 29.17 -12% |
| 4K Write (MB/s) | 88.1 | 107.1 22% | 107.2 22% | 110.7 26% | 93.4 6% |
| 4K-64 Read (MB/s) | 757 | 914 21% | 1228 62% | 1126 49% | 995 31% |
| 4K-64 Write (MB/s) | 1501 | 703 -53% | 1079 -28% | 1717 14% | 656 -56% |
| Access Time Read * (ms) | 0.077 | 0.114 -48% | 0.047 39% | 0.116 -51% | |
| Access Time Write * (ms) | 0.043 | 0.034 21% | 0.035 19% | 0.033 23% | 0.063 -47% |
| Score Read (Points) | 985 | 1180 20% | 1558 58% | 1362 38% | 1221 24% |
| Score Write (Points) | 1752 | 957 -45% | 1435 -18% | 2010 15% | 862 -51% |
| Score Total (Points) | 3230 | 2722 -16% | 3770 17% | 4079 26% | 2667 -17% |
| Copy ISO MB/s (MB/s) | 1872 | 1864 0% | 1975 6% | 642 -66% | |
| Copy Program MB/s (MB/s) | 478.2 | 362.6 -24% | 526 10% | 431.5 -10% | |
| Copy Game MB/s (MB/s) | 1165 | 936 -20% | 1200 3% | 706 -39% | |
| CrystalDiskMark 5.2 / 6 | |||||
| Write 4K (MB/s) | 81 | 97.1 20% | 93.6 16% | 93.9 16% | 107.4 33% |
| Read 4K (MB/s) | 36.03 | 53.7 49% | 38.82 8% | 40.56 13% | 42.91 19% |
| Write Seq (MB/s) | 1687 | 1526 -10% | 2455 46% | 1468 -13% | 467.5 -72% |
| Read Seq (MB/s) | 1835 | 2020 10% | 2107 15% | 1540 -16% | 2335 27% |
| Write 4K Q32T1 (MB/s) | 205.3 | 285.6 39% | 298.7 45% | 293.5 43% | 289.7 41% |
| Read 4K Q32T1 (MB/s) | 229 | 321.8 41% | 338.7 48% | 346 51% | 354.4 55% |
| Write Seq Q32T1 (MB/s) | 1683 | 1533 -9% | 2902 72% | 1941 15% | 460.9 -73% |
| Read Seq Q32T1 (MB/s) | 3363 | 2351 -30% | 3536 5% | 3266 -3% | 3111 -7% |
* ... smaller is better

| 3DMark 06 Standard Score | 37344 points | |
| 3DMark 11 Performance | 18304 points | |
| 3DMark Ice Storm Standard Score | 162624 points | |
| 3DMark Cloud Gate Standard Score | 36817 points | |
| 3DMark Fire Strike Score | 15027 points | |
| 3DMark Fire Strike Extreme Score | 7614 points | |
| 3DMark Time Spy Score | 6540 points | |
Help | ||
| Batman: Arkham Knight | |
| 1280x720 Low / Off AF:Trilinear | |
| Lenovo Legion Y740-15ICHg | |
| Average NVIDIA GeForce RTX 2070 Max-Q (n=1) | |
| 1366x768 Normal / Off AF:4x | |
| Lenovo Legion Y740-15ICHg | |
| Average NVIDIA GeForce RTX 2070 Max-Q (n=1) | |
| 1920x1080 High / On (Interactive Smoke & Paper Debris Off) AA:SM AF:8x | |
| Lenovo Legion Y740-15ICHg | |
| Average NVIDIA GeForce RTX 2070 Max-Q (n=1) | |
| 1920x1080 High / On AA:SM AF:16x | |
| Lenovo Legion Y740-15ICHg | |
| Average NVIDIA GeForce RTX 2070 Max-Q (n=1) | |
| low | med. | high | ultra | |
|---|---|---|---|---|
| BioShock Infinite (2013) | 302 | 282 | 261 | 211 |
| The Witcher 3 (2015) | 57 | |||
| Batman: Arkham Knight (2015) | 163 | 153 | 129 | 87 |
| Rise of the Tomb Raider (2016) | 231 | 184 | 116 | 100 |
Noise level
| Idle |
| 32.6 / 32.7 / 32.7 dB(A) |
| Load |
| 33.3 / 45.2 dB(A) |
 | ||
30 dB silent 40 dB(A) audible 50 dB(A) loud |
||
min: | ||
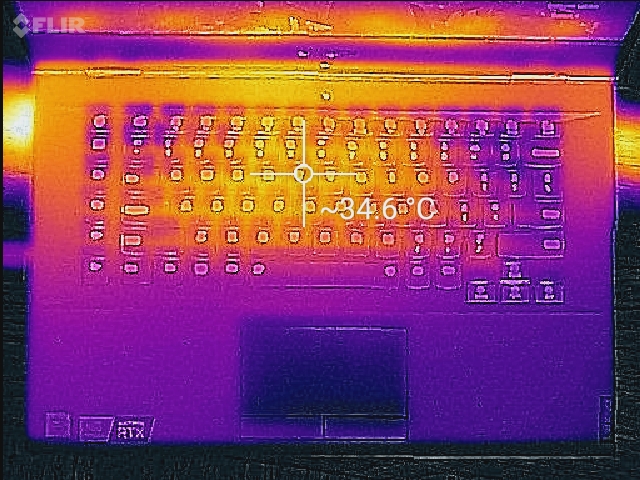
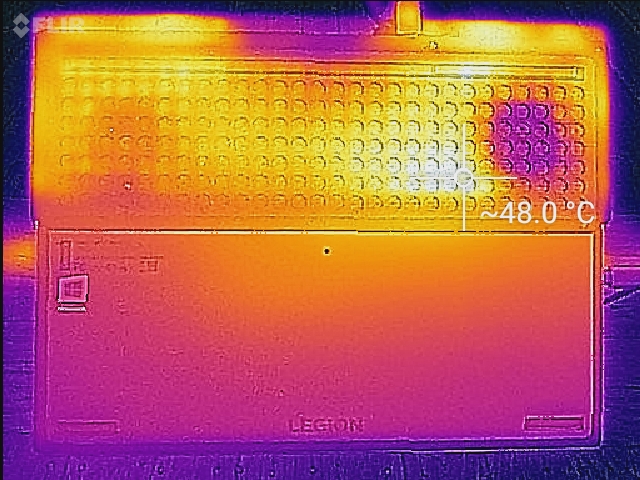
(+) The maximum temperature on the upper side is 37.6 °C / 100 F, compared to the average of 40.4 °C / 105 F, ranging from 21.2 to 68.8 °C for the class Gaming.
(-) The bottom heats up to a maximum of 45.2 °C / 113 F, compared to the average of 43.2 °C / 110 F
(+) In idle usage, the average temperature for the upper side is 28 °C / 82 F, compared to the device average of 33.9 °C / 93 F.
(+) Playing The Witcher 3, the average temperature for the upper side is 29.5 °C / 85 F, compared to the device average of 33.9 °C / 93 F.
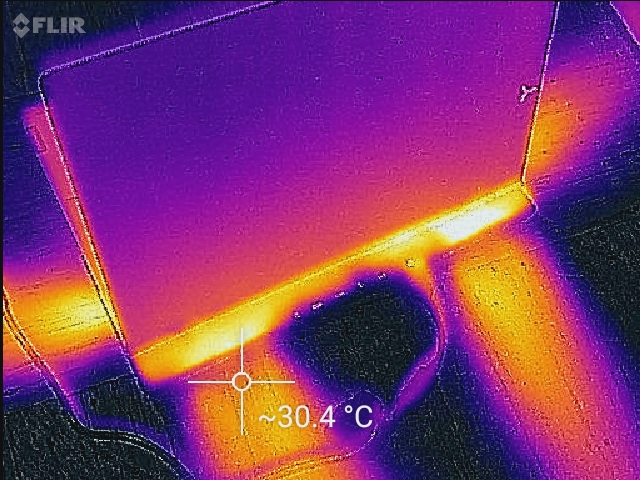
(+) The palmrests and touchpad are cooler than skin temperature with a maximum of 29.2 °C / 84.6 F and are therefore cool to the touch.
(±) The average temperature of the palmrest area of similar devices was 28.8 °C / 83.8 F (-0.4 °C / -0.8 F).
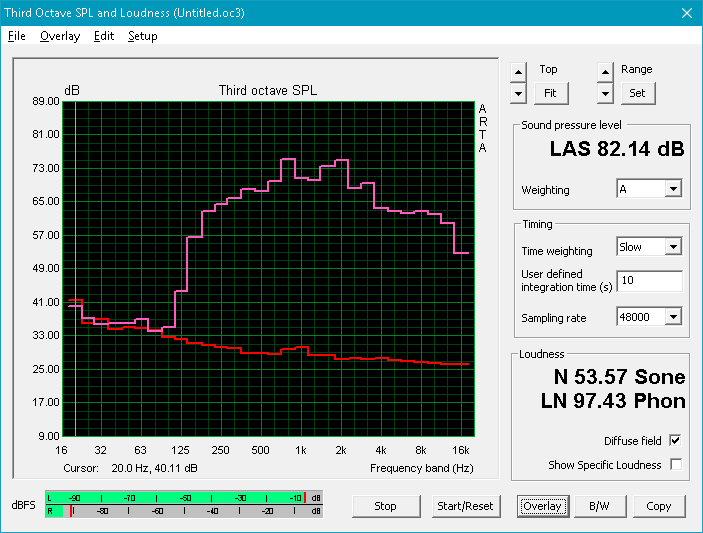
Lenovo Legion Y740-15ICHg audio analysis
(+) | speakers can play relatively loud (82.1 dB)
Bass 100 - 315 Hz
(±) | reduced bass - on average 10.2% lower than median
(±) | linearity of bass is average (14.7% delta to prev. frequency)
Mids 400 - 2000 Hz
(±) | higher mids - on average 6.7% higher than median
(±) | linearity of mids is average (7% delta to prev. frequency)
Highs 2 - 16 kHz
(+) | balanced highs - only 2.6% away from median
(+) | highs are linear (6.5% delta to prev. frequency)
Overall 100 - 16.000 Hz
(±) | linearity of overall sound is average (19.8% difference to median)
Compared to same class
» 70% of all tested devices in this class were better, 6% similar, 24% worse
» The best had a delta of 6%, average was 18%, worst was 132%
Compared to all devices tested
» 51% of all tested devices were better, 7% similar, 42% worse
» The best had a delta of 4%, average was 23%, worst was 134%
Razer Blade 15 RTX 2070 Max-Q audio analysis
(-) | not very loud speakers (71.6 dB)
Bass 100 - 315 Hz
(±) | reduced bass - on average 7.7% lower than median
(±) | linearity of bass is average (11.1% delta to prev. frequency)
Mids 400 - 2000 Hz
(±) | higher mids - on average 7.8% higher than median
(±) | linearity of mids is average (9.5% delta to prev. frequency)
Highs 2 - 16 kHz
(+) | balanced highs - only 3% away from median
(±) | linearity of highs is average (7.2% delta to prev. frequency)
Overall 100 - 16.000 Hz
(±) | linearity of overall sound is average (23.9% difference to median)
Compared to same class
» 86% of all tested devices in this class were better, 5% similar, 9% worse
» The best had a delta of 6%, average was 18%, worst was 132%
Compared to all devices tested
» 72% of all tested devices were better, 6% similar, 22% worse
» The best had a delta of 4%, average was 23%, worst was 134%
| Off / Standby | |
| Idle | |
| Load |
|
Key:
min: | |
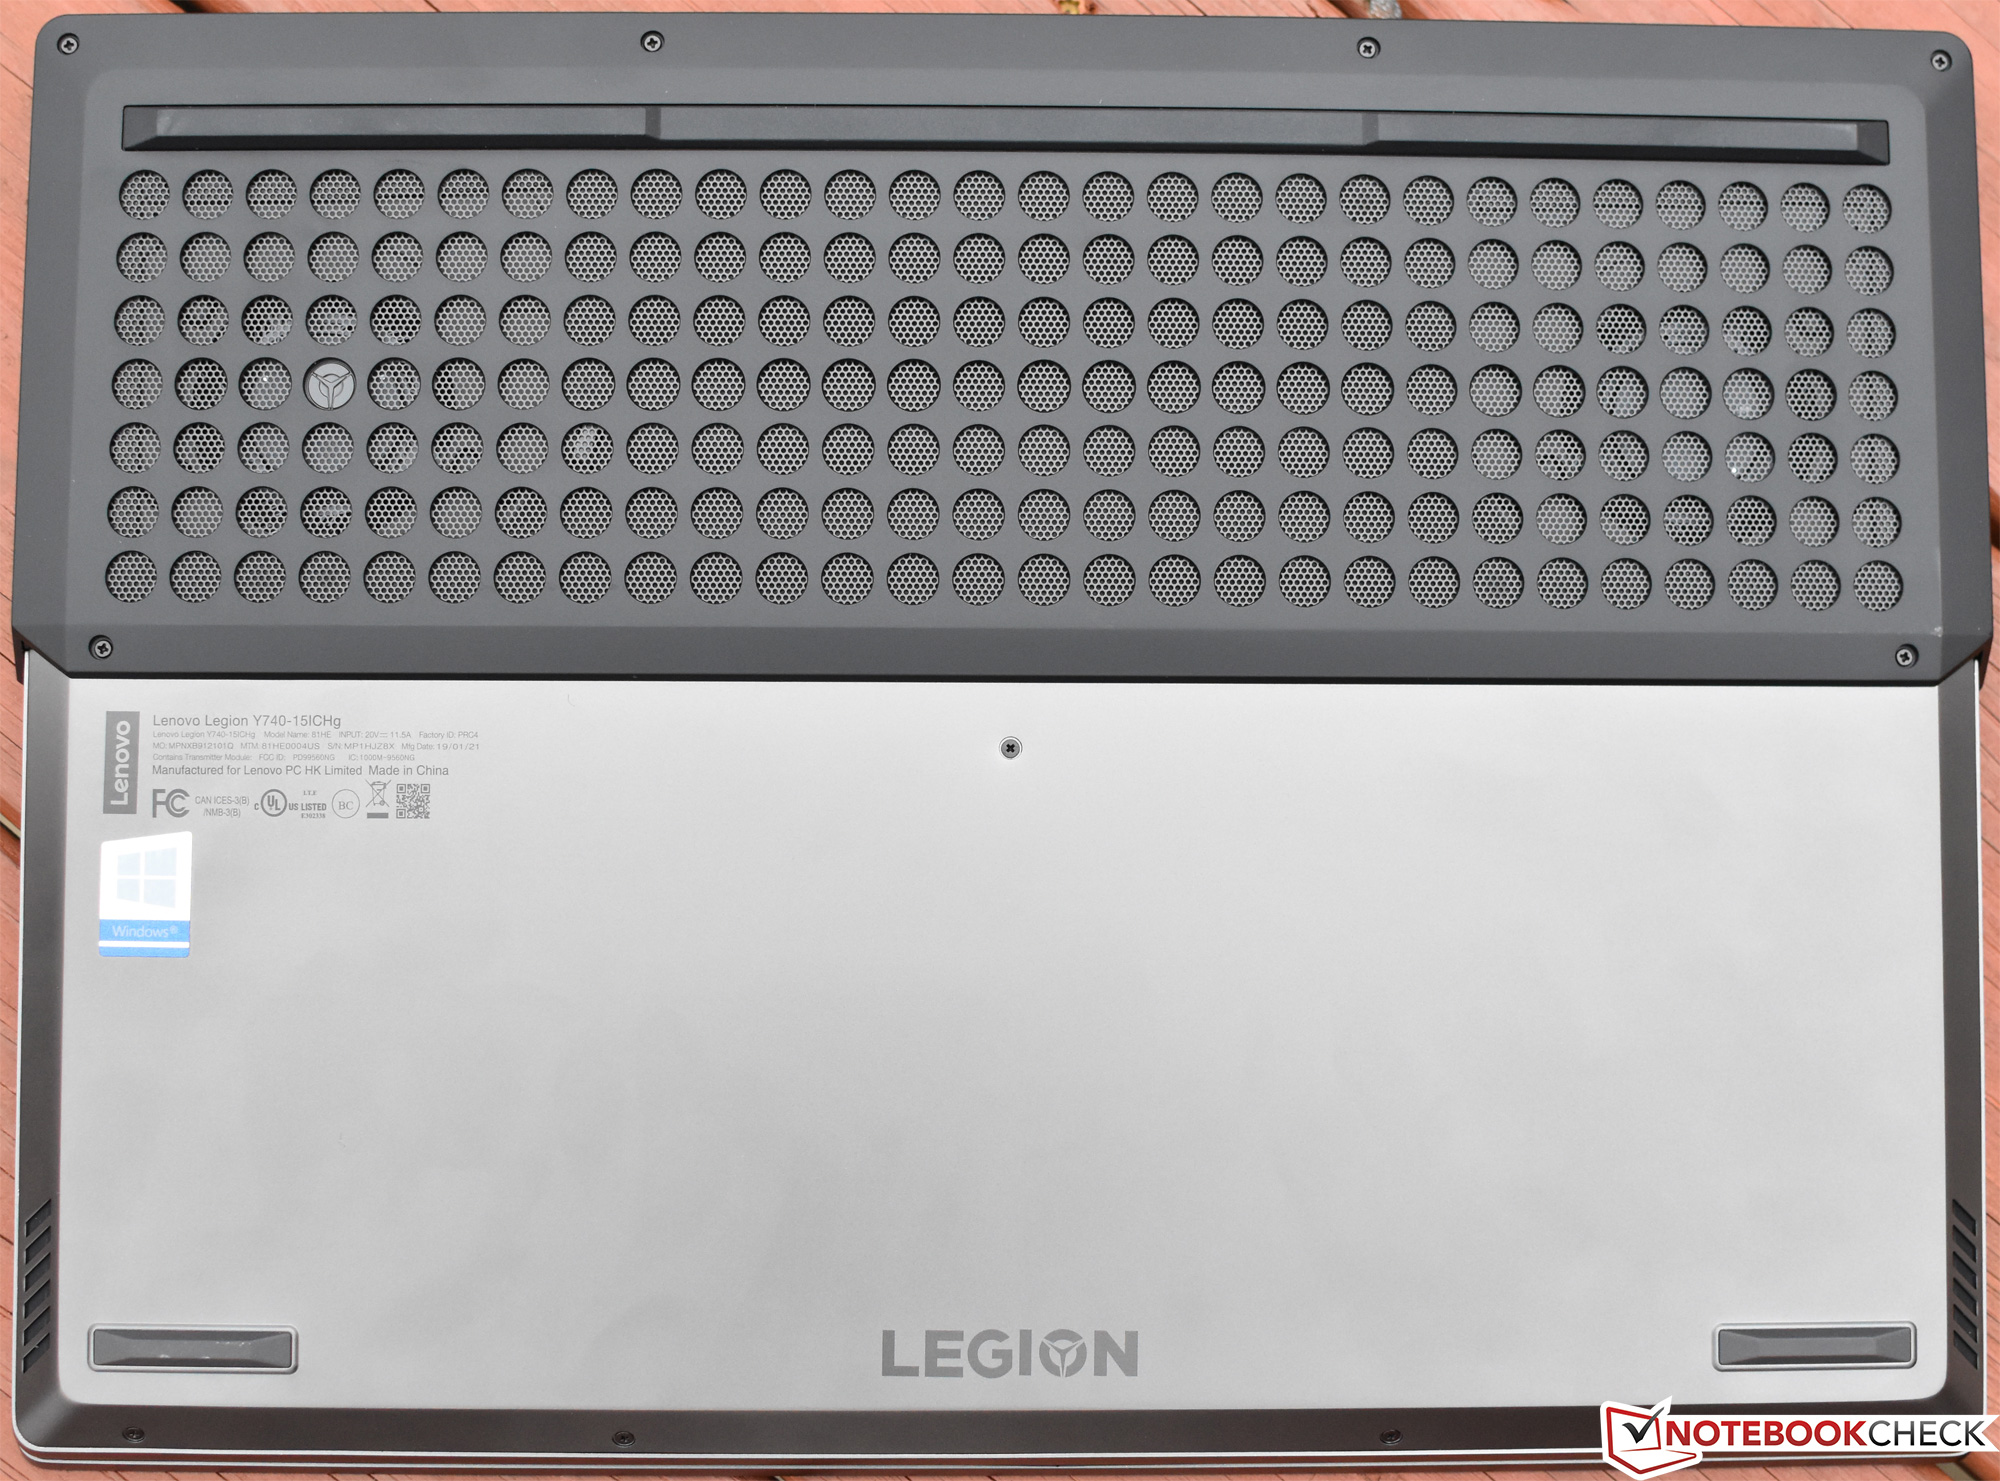
| Lenovo Legion Y740-15ICHg i7-8750H, GeForce RTX 2070 Max-Q, Samsung SSD PM981 MZVLB256HAHQ, IPS, 1920x1080, 15.6" | MSI GE75 8SF i7-8750H, GeForce RTX 2070 Mobile, Kingston RBUSNS8154P3256GJ1, IPS, 1920x1080, 17.3" | Gigabyte Aero 15-X9 i7-8750H, GeForce RTX 2070 Max-Q, Intel SSD 760p SSDPEKKW010T8, IPS, 1920x1080, 15.6" | Acer Predator Triton 500 i7-8750H, GeForce RTX 2080 Max-Q, 2x WDC PC SN720 SDAPNTW-256G-1014 (RAID 0), IPS, 1920x1080, 15.6" | Razer Blade 15 RTX 2070 Max-Q i7-8750H, GeForce RTX 2070 Max-Q, Samsung SSD PM981 MZVLB512HAJQ, IPS, 1920x1080, 15.6" | Alienware m15 GTX 1070 Max-Q i7-8750H, GeForce GTX 1070 Max-Q, Toshiba XG5 KXG50ZNV512G, IPS, 1920x1080, 15.6" | HP Omen 15-dc0015ng i7-8750H, GeForce GTX 1070 Max-Q, Toshiba XG5 KXG50ZNV512G, IPS, 1920x1080, 15.6" | Lenovo Legion Y730-15ICH i5-8300H i5-8300H, GeForce GTX 1050 Ti Mobile, Intel Optane 16 GB MEMPEK1J016GAL + HGST ST1000LM049 1 TB HDD, IPS, 1920x1080, 15.6" | |
|---|---|---|---|---|---|---|---|---|
| Power Consumption | -6% | 14% | 3% | 19% | 23% | 1% | 34% | |
| Idle Minimum * (Watt) | 22.9 | 16.4 28% | 16 30% | 16 30% | 10.4 55% | 7.6 67% | 14 39% | 8 65% |
| Idle Average * (Watt) | 27.2 | 21.9 19% | 18 34% | 22 19% | 14.6 46% | 13.8 49% | 18.2 33% | 11.8 57% |
| Idle Maximum * (Watt) | 27.5 | 25.4 8% | 23 16% | 32 -16% | 16.3 41% | 14.6 47% | 24 13% | 13.1 52% |
| Load Average * (Watt) | 83.4 | 90.7 -9% | 88 -6% | 89 -7% | 88.5 -6% | 97.6 -17% | 143 -71% | 90.2 -8% |
| Witcher 3 ultra * (Watt) | 143.6 | 203.3 -42% | 120 16% | 147 -2% | 155.4 -8% | 145.8 -2% | 126 12% | 107.8 25% |
| Load Maximum * (Watt) | 160.5 | 222.9 -39% | 167 -4% | 173 -8% | 182.4 -14% | 172.5 -7% | 190 -18% | 136.2 15% |
* ... smaller is better
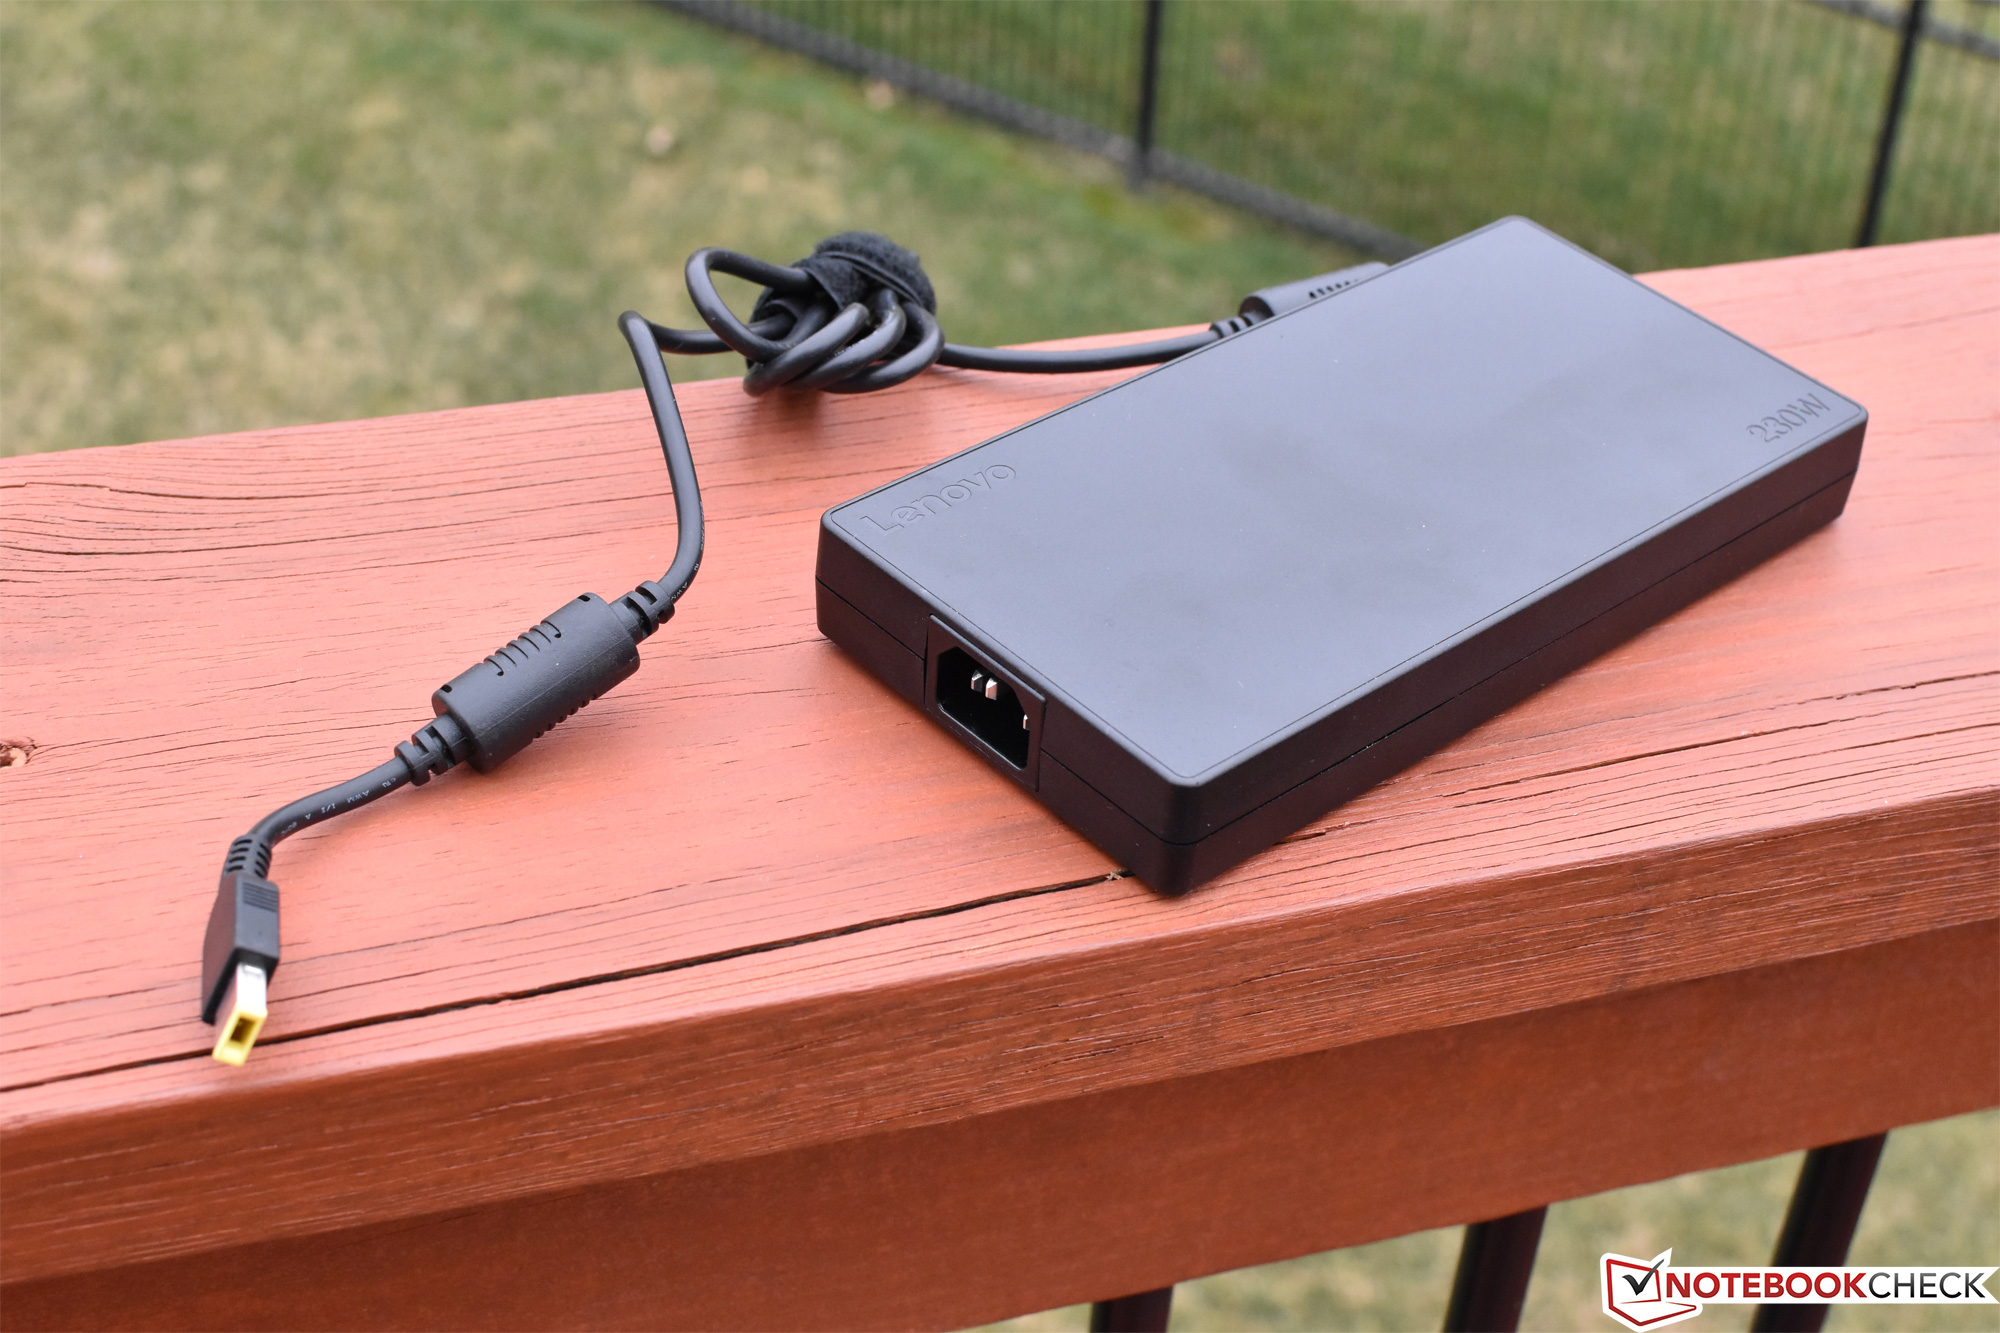
| Lenovo Legion Y740-15ICHg i7-8750H, GeForce RTX 2070 Max-Q, 57 Wh | MSI GE75 8SF i7-8750H, GeForce RTX 2070 Mobile, 65 Wh | Gigabyte Aero 15-X9 i7-8750H, GeForce RTX 2070 Max-Q, 94.24 Wh | Acer Predator Triton 500 i7-8750H, GeForce RTX 2080 Max-Q, 82 Wh | Razer Blade 15 RTX 2070 Max-Q i7-8750H, GeForce RTX 2070 Max-Q, 80 Wh | Alienware m15 GTX 1070 Max-Q i7-8750H, GeForce GTX 1070 Max-Q, 90 Wh | HP Omen 15-dc0015ng i7-8750H, GeForce GTX 1070 Max-Q, 70.07 Wh | Lenovo Legion Y730-15ICH i5-8300H i5-8300H, GeForce GTX 1050 Ti Mobile, 57 Wh | |
|---|---|---|---|---|---|---|---|---|
| Battery runtime | 25% | 176% | 44% | 137% | 152% | 104% | 87% | |
| Reader / Idle (h) | 3.9 | 9.2 136% | 5.6 44% | 11.4 192% | 10.5 169% | 7.7 97% | 9.6 146% | |
| WiFi v1.3 (h) | 2.8 | 3.5 25% | 6.4 129% | 3.2 14% | 6.5 132% | 7.7 175% | 4.6 64% | 5.3 89% |
| Load (h) | 0.8 | 2.9 262% | 1.4 75% | 1.5 88% | 1.7 113% | 2 150% | 1 25% |
Pros
Cons
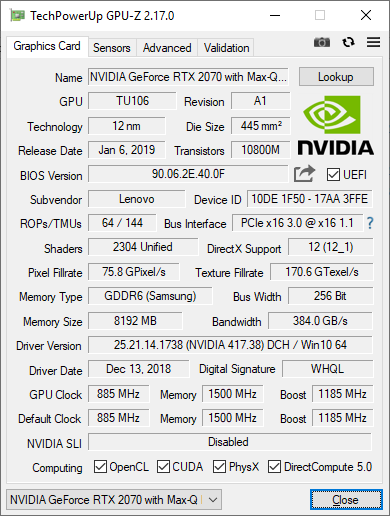
虽然Y740-15ICHg仍有其不足之处,但它消除了我们对其直接前身Y730-15ICH的一半不满。新的屏幕极大地改善了黑白响应时间,并具有144 Hz的刷新率(对于NVIDIA G-Sync)。此外,GPU也得到了巨大的升级; RTX 2070 Max-Q的性能是之前GTX 1050 Ti的两倍多。所有这一切都是在没有系统风扇噪音大幅增加的情况下实现的,尽管表面温度肯定会明显上升。
Y740-15ICHg的其他值得注意的优点包括非常强大且持续的CPU性能,以及快速的系统性能,这要归功于它的三星PM981 NVMe SSD。该机器难以负担双烤,但CPU和GPU单烤以及正常游戏运行没有问题。确实,游戏玩家不可能在大多数游戏中在不调低画质的情况下达到144 fps +的稳定帧率,但拥有该选项仍然很不错。
虽然它在便携性和输入设备方面不尽如人意,但联想Y740-15ICHg是对其前代产品的重大改进,可以轻松处理大多数游戏,而且价格合理。
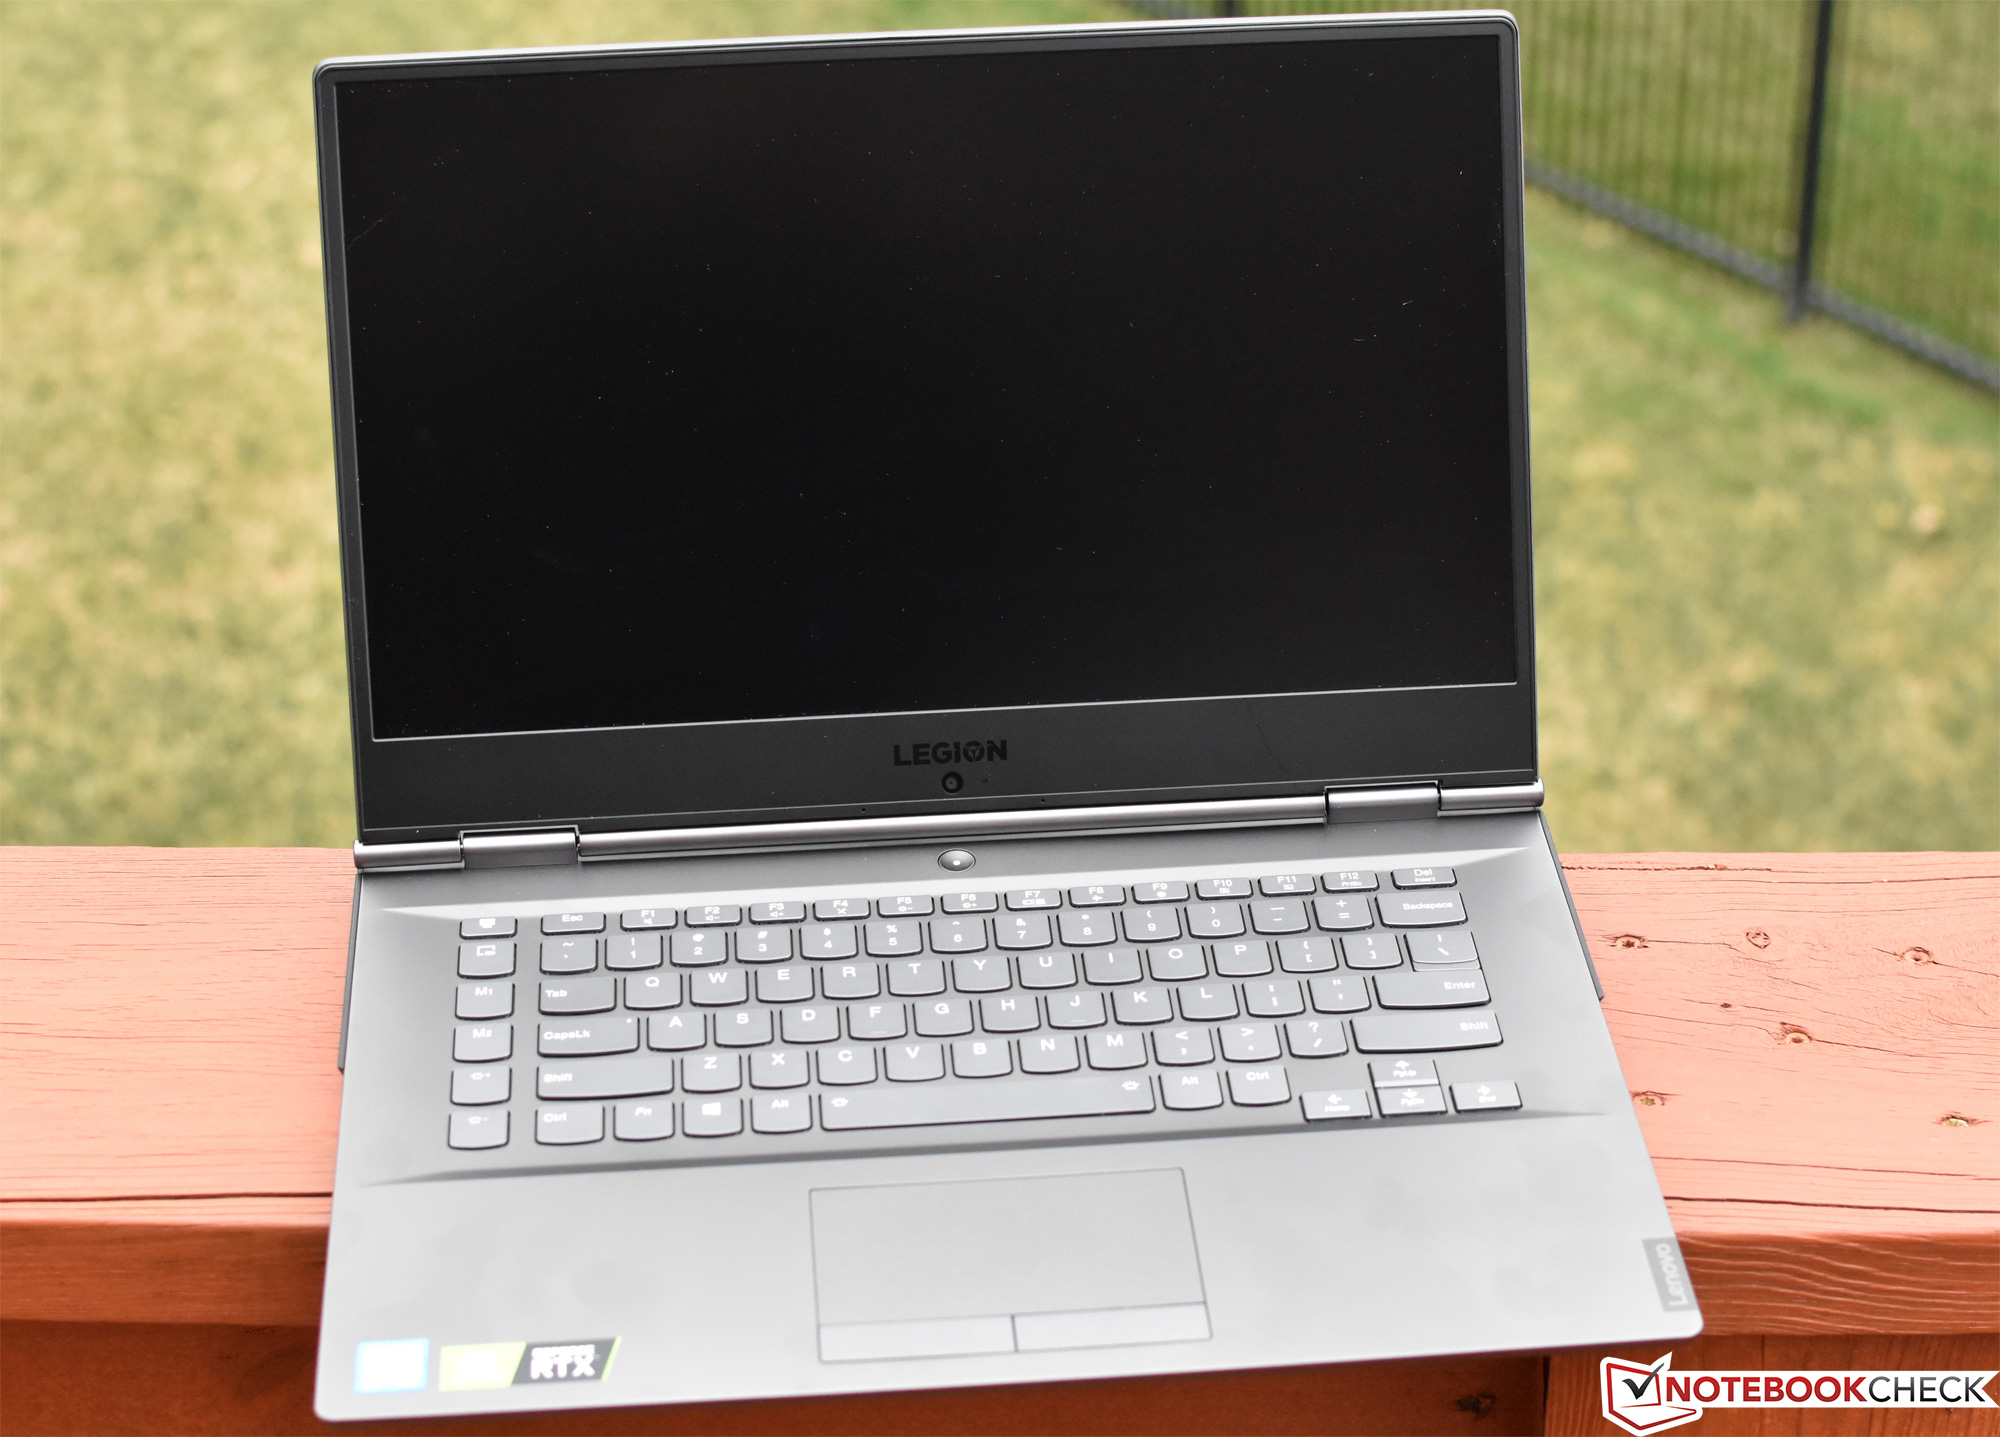
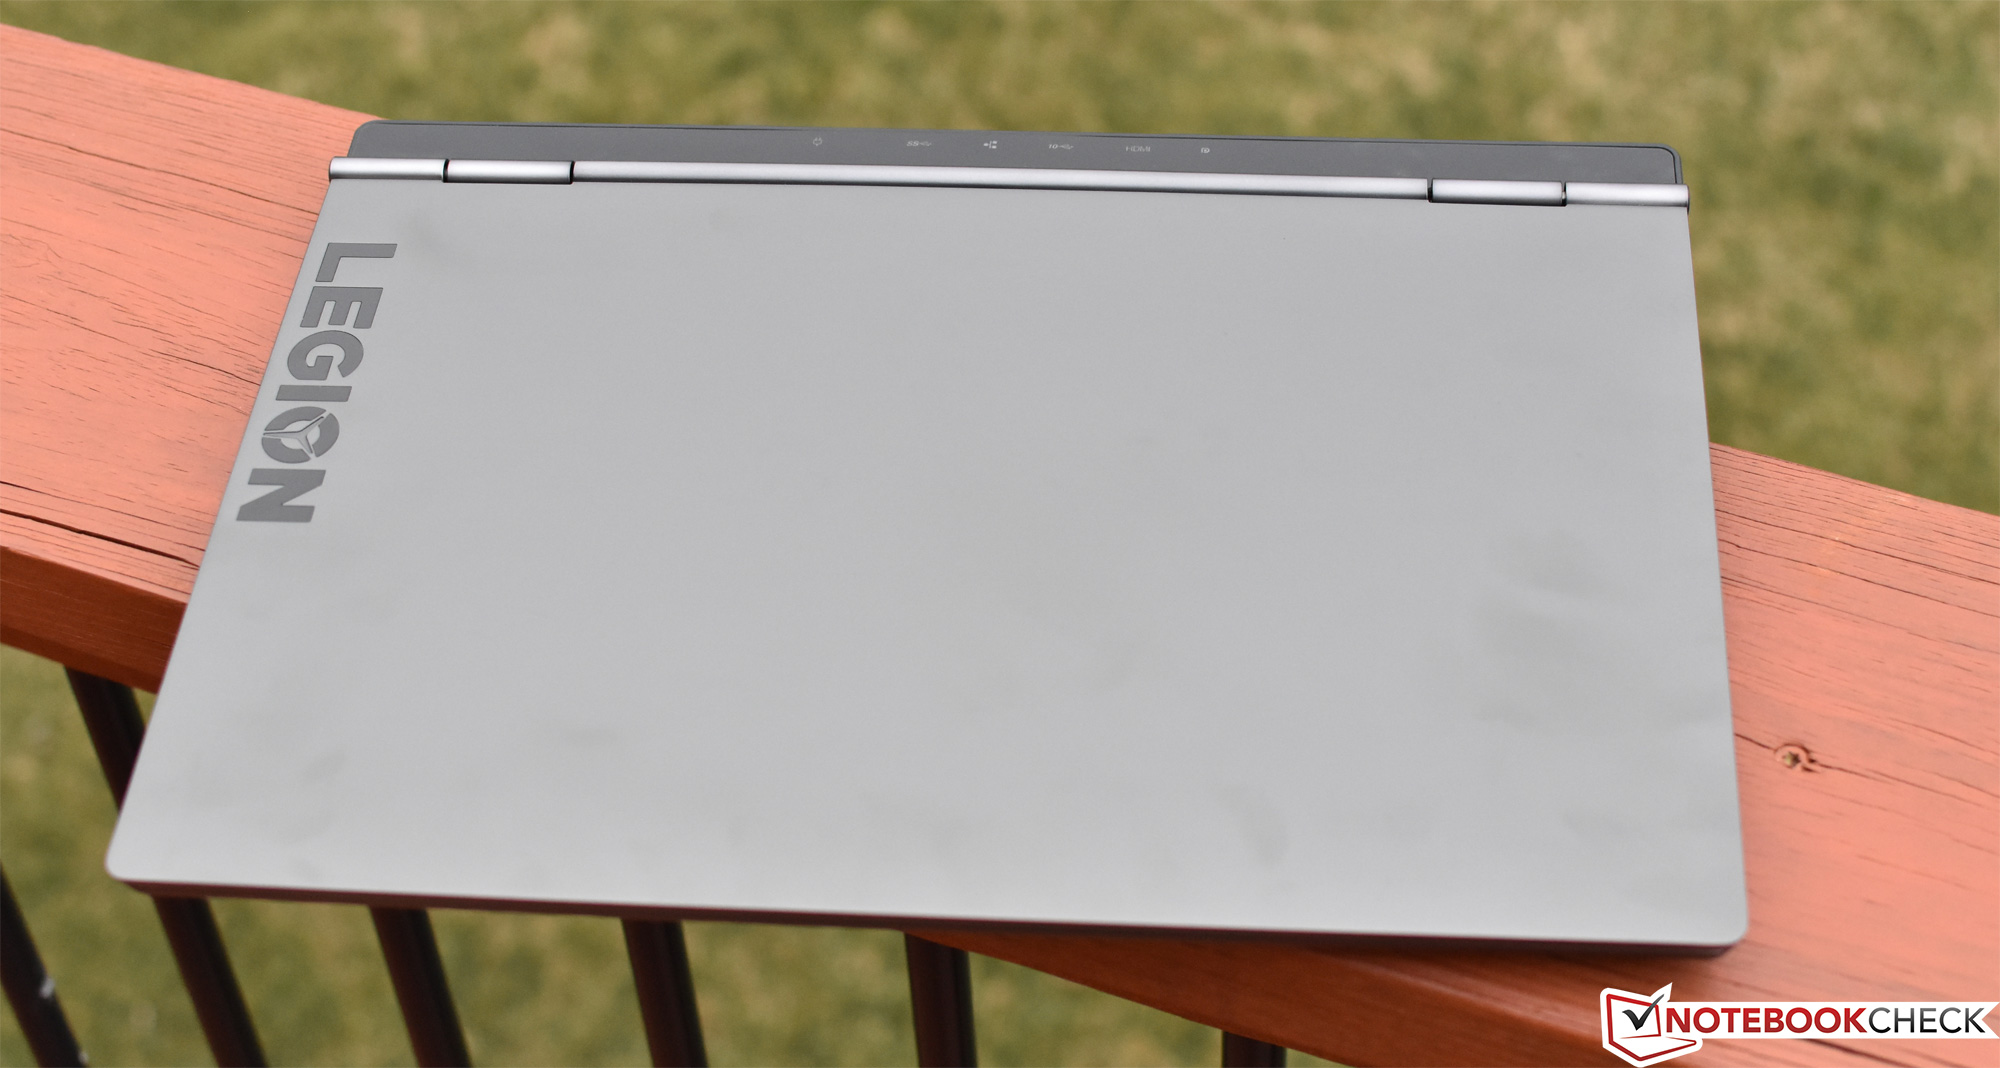
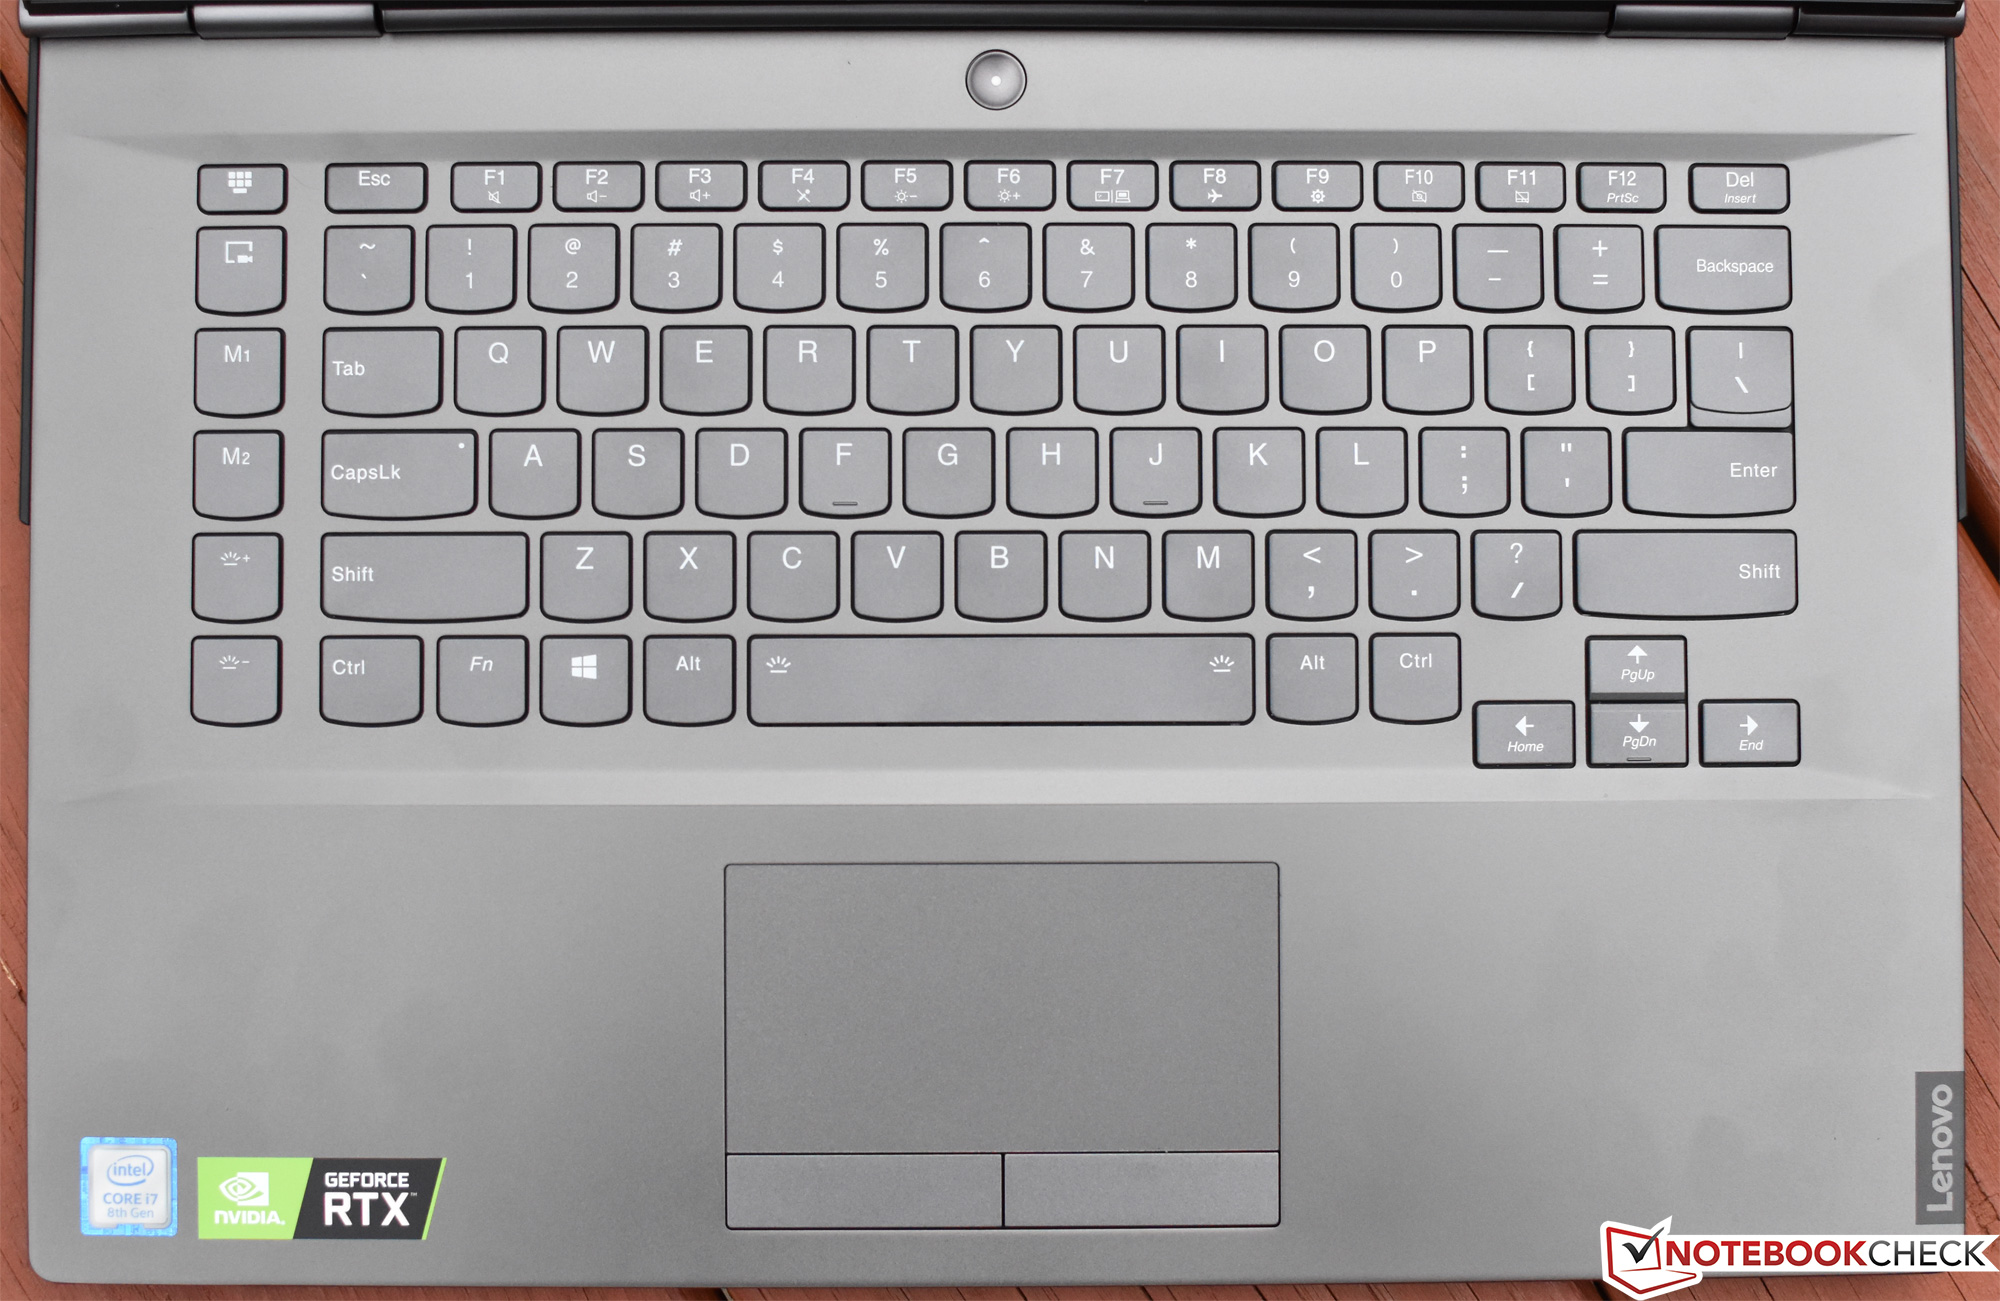
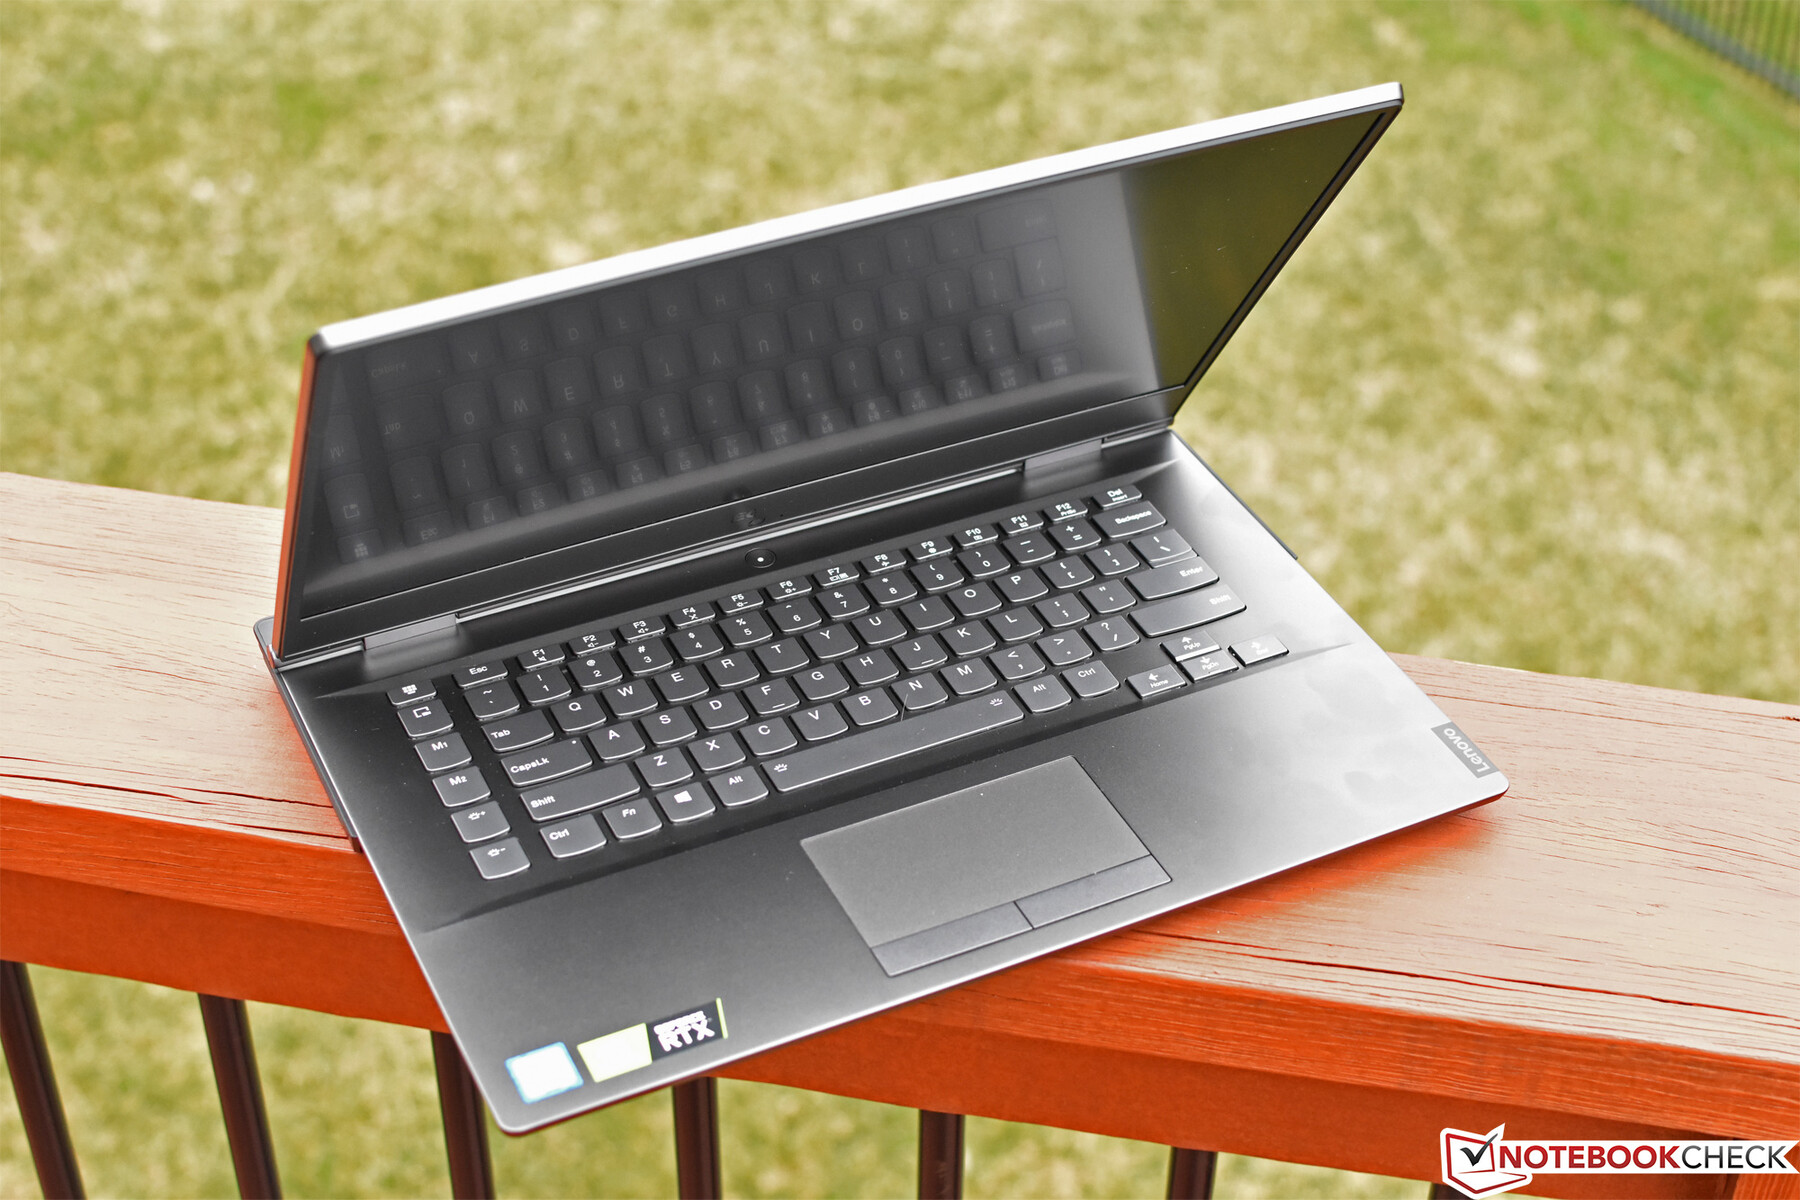
这种外观设计虽然非常规,但在美学和触觉方面都取得了成功,尽管从耐久性的角度来看,它确实留下了一些不足之处。特别是不够坚固的显示器盖,和受压能力一般的基座。输入设备只是够用;键盘的短行程和软绵绵的反馈以及触摸板按钮的令人厌烦的驱动很容易被其竞争对手(如XPS 15和MSI GS65)所超过。不过维护倒是很不错。
Y740-15ICHg价格合理,我们的配置价格为14899元。它的功能足以在高设置下以60FPS运行几乎所有现代游戏。竞争对手包括Alienware m15,Razer Blade 15,Acer Predator Triton 500和MSI GE75,他们都有其独特的优缺点。总而言之,Y740是对于其前身的重大改进,适合那些想在合理预算范围内寻找强大的游戏本的人。
Lenovo Legion Y740-15ICHg
- 09/20/2019 v7 (old)
Steve Schardein
Price comparison

