技嘉Aero 15-X9 (酷睿 i7-8750H, RTX 2070 Max-Q) 笔记本电脑评测
| SD Card Reader | |
| average JPG Copy Test (av. of 3 runs) | |
| Gigabyte Aero 15-X9 (Toshiba Exceria Pro SDXC 64 GB UHS-II) | |
| Gigabyte Aero 15X v8 (Toshiba Exceria Pro SDXC 64 GB UHS-II) | |
| Average of class Gaming (20.9 - 210, n=54, last 2 years) | |
| maximum AS SSD Seq Read Test (1GB) | |
| Gigabyte Aero 15X v8 (Toshiba Exceria Pro SDXC 64 GB UHS-II) | |
| Gigabyte Aero 15-X9 (Toshiba Exceria Pro SDXC 64 GB UHS-II) | |
| Average of class Gaming (25.5 - 261, n=51, last 2 years) | |
| Networking | |
| iperf3 transmit AX12 | |
| Asus Zephyrus S GX531GS | |
| Acer Predator Triton 500 | |
| Gigabyte Aero 15-X9 | |
| MSI GS65 8RF-019DE Stealth Thin | |
| Razer Blade 15 RTX 2070 Max-Q | |
| Gigabyte Aero 15X v8 | |
| iperf3 receive AX12 | |
| Razer Blade 15 RTX 2070 Max-Q | |
| Asus Zephyrus S GX531GS | |
| Gigabyte Aero 15X v8 | |
| Gigabyte Aero 15-X9 | |
| Acer Predator Triton 500 | |
| MSI GS65 8RF-019DE Stealth Thin | |
| |||||||||||||||||||||||||
Brightness Distribution: 85 %
Center on Battery: 250 cd/m²
Contrast: 862:1 (Black: 0.29 cd/m²)
ΔE ColorChecker Calman: 1.46 | ∀{0.5-29.43 Ø4.73}
ΔE Greyscale Calman: 1.27 | ∀{0.09-98 Ø4.97}
93% sRGB (Argyll 1.6.3 3D)
60% AdobeRGB 1998 (Argyll 1.6.3 3D)
64.5% AdobeRGB 1998 (Argyll 3D)
93.1% sRGB (Argyll 3D)
63.5% Display P3 (Argyll 3D)
Gamma: 2.4
CCT: 6749 K
| Gigabyte Aero 15-X9 LGD05C0, IPS, 1920x1080 | Gigabyte Aero 15X v8 LGD05C0, IPS, 1920x1080 | Asus Zephyrus S GX531GS AU Optronics B156HAN08.2 (AUO82ED), IPS, 1920x1080 | MSI GS65 8RF-019DE Stealth Thin AU Optronics B156HAN08.0 (AUO80ED), IPS, 1920x1080 | Razer Blade 15 RTX 2070 Max-Q LG Philips LGD05C0, IPS, 1920x1080 | Acer Predator Triton 500 AU Optronics B156HAN08.2 (AUO82ED), IPS, 1920x1080 | |
|---|---|---|---|---|---|---|
| Display | 1% | 2% | 2% | 3% | 1% | |
| Display P3 Coverage (%) | 63.5 | 63.6 0% | 66.7 5% | 66.2 4% | 65.3 3% | 64.2 1% |
| sRGB Coverage (%) | 93.1 | 93.8 1% | 91.2 -2% | 92.1 -1% | 94.9 2% | 92.6 -1% |
| AdobeRGB 1998 Coverage (%) | 64.5 | 64.9 1% | 66.7 3% | 67.2 4% | 66.3 3% | 65.7 2% |
| Response Times | 8% | 41% | -1% | 7% | 35% | |
| Response Time Grey 50% / Grey 80% * (ms) | 16.4 ? | 16.8 ? -2% | 7.4 ? 55% | 17.6 ? -7% | 16.8 ? -2% | 8 ? 51% |
| Response Time Black / White * (ms) | 13.6 ? | 11.2 ? 18% | 10 ? 26% | 12.8 ? 6% | 11.6 ? 15% | 11.2 ? 18% |
| PWM Frequency (Hz) | ||||||
| Screen | 12% | -18% | -10% | -31% | -75% | |
| Brightness middle (cd/m²) | 250 | 313 25% | 294 18% | 254 2% | 314.7 26% | 304 22% |
| Brightness (cd/m²) | 235 | 300 28% | 275 17% | 262 11% | 312 33% | 299 27% |
| Brightness Distribution (%) | 85 | 78 -8% | 84 -1% | 89 5% | 90 6% | 89 5% |
| Black Level * (cd/m²) | 0.29 | 0.33 -14% | 0.24 17% | 0.22 24% | 0.38 -31% | 0.27 7% |
| Contrast (:1) | 862 | 948 10% | 1225 42% | 1155 34% | 828 -4% | 1126 31% |
| Colorchecker dE 2000 * | 1.46 | 1.29 12% | 2.57 -76% | 2.37 -62% | 2.56 -75% | 4.66 -219% |
| Colorchecker dE 2000 max. * | 2.47 | 2.04 17% | 4.88 -98% | 4.71 -91% | 4.89 -98% | 9.65 -291% |
| Greyscale dE 2000 * | 1.27 | 0.69 46% | 2.41 -90% | 1.58 -24% | 3.4 -168% | 5.53 -335% |
| Gamma | 2.4 92% | 2.43 91% | 2.5 88% | 2.48 89% | 2.3 96% | 2.5 88% |
| CCT | 6749 96% | 6550 99% | 6370 102% | 6785 96% | 6435 101% | 8028 81% |
| Color Space (Percent of AdobeRGB 1998) (%) | 60 | 60 0% | 59 -2% | 60 0% | 60.7 1% | 60 0% |
| Color Space (Percent of sRGB) (%) | 93 | 94 1% | 91 -2% | 92 -1% | 94.6 2% | 93 0% |
| Colorchecker dE 2000 calibrated * | 2.14 | 1.84 | 1.71 | 1.72 | ||
| Total Average (Program / Settings) | 7% /
9% | 8% /
-6% | -3% /
-6% | -7% /
-19% | -13% /
-45% |
* ... smaller is better
Display Response Times
| ↔ Response Time Black to White | ||
|---|---|---|
| 13.6 ms ... rise ↗ and fall ↘ combined | ↗ 8.4 ms rise | 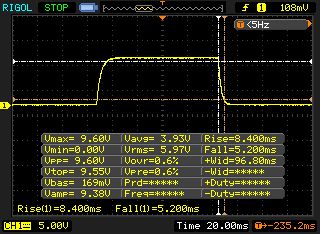 |
| ↘ 5.2 ms fall | ||
| The screen shows good response rates in our tests, but may be too slow for competitive gamers. In comparison, all tested devices range from 0.1 (minimum) to 240 (maximum) ms. » 34 % of all devices are better. This means that the measured response time is better than the average of all tested devices (19.9 ms). | ||
| ↔ Response Time 50% Grey to 80% Grey | ||
| 16.4 ms ... rise ↗ and fall ↘ combined | ↗ 8.8 ms rise | 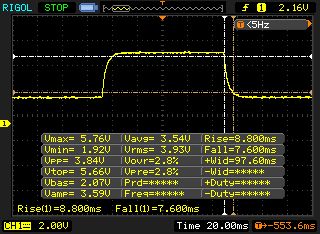 |
| ↘ 7.6 ms fall | ||
| The screen shows good response rates in our tests, but may be too slow for competitive gamers. In comparison, all tested devices range from 0.165 (minimum) to 636 (maximum) ms. » 30 % of all devices are better. This means that the measured response time is better than the average of all tested devices (31.1 ms). | ||
Screen Flickering / PWM (Pulse-Width Modulation)
| Screen flickering / PWM not detected |  | ||
In comparison: 52 % of all tested devices do not use PWM to dim the display. If PWM was detected, an average of 7798 (minimum: 5 - maximum: 343500) Hz was measured. | |||
| Cinebench R15 | |
| CPU Single 64Bit | |
| Average of class Gaming (188.8 - 343, n=111, last 2 years) | |
| Acer Predator Triton 500 | |
| Gigabyte Aero 15X v8 | |
| MSI GS65 8RF-019DE Stealth Thin | |
| Razer Blade 15 RTX 2070 Max-Q | |
| Asus Zephyrus S GX531GS | |
| Gigabyte Aero 15-X9 | |
| CPU Multi 64Bit | |
| Average of class Gaming (1578 - 6271, n=111, last 2 years) | |
| Gigabyte Aero 15-X9 | |
| Gigabyte Aero 15X v8 | |
| Asus Zephyrus S GX531GS | |
| MSI GS65 8RF-019DE Stealth Thin | |
| Acer Predator Triton 500 | |
| Razer Blade 15 RTX 2070 Max-Q | |
| Cinebench R10 | |
| Rendering Single 32Bit | |
| Average of class Gaming (7457 - 11779, n=8, last 2 years) | |
| Gigabyte Aero 15-X9 | |
| Rendering Multiple CPUs 32Bit | |
| Average of class Gaming (42932 - 81339, n=8, last 2 years) | |
| Gigabyte Aero 15-X9 | |
| Geekbench 3 | |
| 32 Bit Multi-Core Score | |
| Gigabyte Aero 15-X9 | |
| 32 Bit Single-Core Score | |
| Gigabyte Aero 15-X9 | |
| Geekbench 4.0 | |
| 64 Bit Multi-Core Score | |
| Average of class Gaming (40469 - 76142, n=4, last 2 years) | |
| Gigabyte Aero 15-X9 | |
| 64 Bit Single-Core Score | |
| Average of class Gaming (7589 - 9053, n=4, last 2 years) | |
| Gigabyte Aero 15-X9 | |
| Geekbench 4.4 | |
| 64 Bit Multi-Core Score | |
| Average of class Gaming (89200 - 97490, n=2, last 2 years) | |
| Gigabyte Aero 15-X9 | |
| 64 Bit Single-Core Score | |
| Average of class Gaming (9335 - 9492, n=2, last 2 years) | |
| Gigabyte Aero 15-X9 | |
| Mozilla Kraken 1.1 - Total | |
| Gigabyte Aero 15-X9 (Edge 44) | |
| Razer Blade 15 RTX 2070 Max-Q (Edge 44.17763.1.0) | |
| Average of class Gaming (391 - 590, n=105, last 2 years) | |
| Octane V2 - Total Score | |
| Average of class Gaming (87588 - 139447, n=30, last 2 years) | |
| Gigabyte Aero 15-X9 (Edge 44) | |
| Razer Blade 15 RTX 2070 Max-Q (Edge 44.17763.1.0) | |
| JetStream 1.1 - 1.1 Total | |
| Average of class Gaming (518 - 647, n=5, last 2 years) | |
| Razer Blade 15 RTX 2070 Max-Q (Edge 44.17763.1.0) | |
| Gigabyte Aero 15-X9 (Edge 44) | |
* ... smaller is better
| PCMark 7 Score | 6400 points | |
| PCMark 8 Home Score Accelerated v2 | 4338 points | |
| PCMark 8 Creative Score Accelerated v2 | 5111 points | |
| PCMark 8 Work Score Accelerated v2 | 5645 points | |
| PCMark 10 Score | 5353 points | |
Help | ||
| PCMark 8 | |
| Home Score Accelerated v2 | |
| Average of class Gaming (n=1last 2 years) | |
| MSI GS65 8RF-019DE Stealth Thin | |
| Asus Zephyrus S GX531GS | |
| Gigabyte Aero 15X v8 | |
| Gigabyte Aero 15-X9 | |
| Razer Blade 15 RTX 2070 Max-Q | |
| Work Score Accelerated v2 | |
| Asus Zephyrus S GX531GS | |
| Gigabyte Aero 15X v8 | |
| Gigabyte Aero 15-X9 | |
| MSI GS65 8RF-019DE Stealth Thin | |
| Razer Blade 15 RTX 2070 Max-Q | |
| Average of class Gaming (n=1last 2 years) | |

| Gigabyte Aero 15-X9 Intel SSD 760p SSDPEKKW010T8 | Gigabyte Aero 15X v8 Toshiba NVMe THNSN5512GPU7 | Asus Zephyrus S GX531GS WDC PC SN520 SDAPNUW-512G | MSI GS65 8RF-019DE Stealth Thin Samsung SSD PM981 MZVLB512HAJQ | Razer Blade 15 RTX 2070 Max-Q Samsung SSD PM981 MZVLB512HAJQ | Acer Predator Triton 500 2x WDC PC SN720 SDAPNTW-256G-1014 (RAID 0) | |
|---|---|---|---|---|---|---|
| CrystalDiskMark 5.2 / 6 | -10% | -14% | 1% | 3% | 23% | |
| Write 4K (MB/s) | 97.1 | 94.4 -3% | 98.2 1% | 95.3 -2% | 93.9 -3% | 93.6 -4% |
| Read 4K (MB/s) | 53.7 | 37.65 -30% | 39.43 -27% | 40.13 -25% | 40.56 -24% | 38.82 -28% |
| Write Seq (MB/s) | 1526 | 1335 -13% | 1386 -9% | 1883 23% | 1468 -4% | 2455 61% |
| Read Seq (MB/s) | 2020 | 1404 -30% | 1100 -46% | 1322 -35% | 1540 -24% | 2107 4% |
| Write 4K Q32T1 (MB/s) | 285.6 | 268.6 -6% | 270.3 -5% | 309.9 9% | 293.5 3% | 298.7 5% |
| Read 4K Q32T1 (MB/s) | 321.8 | 332.8 3% | 340.3 6% | 353.7 10% | 346 8% | 338.7 5% |
| Write Seq Q32T1 (MB/s) | 1533 | 1375 -10% | 1454 -5% | 1919 25% | 1941 27% | 2902 89% |
| Read Seq Q32T1 (MB/s) | 2351 | 2627 12% | 1681 -28% | 2466 5% | 3266 39% | 3536 50% |
| 3DMark 06 Standard Score | 34534 points | |
| 3DMark 11 Performance | 16608 points | |
| 3DMark Ice Storm Standard Score | 80496 points | |
| 3DMark Cloud Gate Standard Score | 31838 points | |
| 3DMark Fire Strike Score | 15587 points | |
| 3DMark Time Spy Score | 6400 points | |
Help | ||
| 3DMark | |
| 1920x1080 Fire Strike Graphics | |
| Average of class Gaming (12242 - 62849, n=120, last 2 years) | |
| Razer Blade 15 RTX 2070 Max-Q | |
| Gigabyte Aero 15-X9 | |
| Gigabyte Aero 15X v8 | |
| MSI GS65 8RF-019DE Stealth Thin | |
| 2560x1440 Time Spy Graphics | |
| Average of class Gaming (5012 - 26212, n=119, last 2 years) | |
| Razer Blade 15 RTX 2070 Max-Q | |
| Gigabyte Aero 15-X9 | |
| 2560x1440 Port Royal Graphics | |
| Average of class Gaming (4395 - 17286, n=70, last 2 years) | |
| Razer Blade 15 RTX 2070 Max-Q | |
| Gigabyte Aero 15-X9 | |
| 3DMark 11 - 1280x720 Performance GPU | |
| Average of class Gaming (21841 - 80022, n=108, last 2 years) | |
| Acer Predator Triton 500 | |
| Razer Blade 15 RTX 2070 Max-Q | |
| Gigabyte Aero 15-X9 | |
| Gigabyte Aero 15X v8 | |
| MSI GS65 8RF-019DE Stealth Thin | |
| Asus Zephyrus S GX531GS | |
| low | med. | high | ultra | |
|---|---|---|---|---|
| BioShock Infinite (2013) | 233.9 | 217.9 | 202.6 | 127.7 |
| GTA V (2015) | 133.1 | 123.1 | 92.9 | 54.2 |
| The Witcher 3 (2015) | 177.7 | 144.9 | 86.5 | 58.3 |
| Ashes of the Singularity (2016) | 60.2 | 53.1 | 52.6 | |
| Destiny 2 (2017) | 110.9 | 95.9 | 96.9 | 96.1 |
| X-Plane 11.11 (2018) | 84.6 | 70.2 | 61.6 | |
| Far Cry 5 (2018) | 94 | 73 | 70 | 67 |
| Darksiders III (2018) | 102.2 | 68.2 | 65.3 | 64.9 |
| The Witcher 3 - 1920x1080 Ultra Graphics & Postprocessing (HBAO+) | |
| Average of class Gaming (95 - 240, n=8, last 2 years) | |
| Acer Predator Triton 500 | |
| Razer Blade 15 RTX 2070 Max-Q | |
| Gigabyte Aero 15-X9 | |
| MSI GS65 8RF-019DE Stealth Thin | |
| Gigabyte Aero 15X v8 | |
| Asus Zephyrus S GX531GS | |
| BioShock Infinite - 1920x1080 Ultra Preset, DX11 (DDOF) | |
| Razer Blade 15 RTX 2070 Max-Q | |
| Gigabyte Aero 15-X9 | |
Noise level
| Idle |
| 32 / 34 / 36 dB(A) |
| Load |
| 42 / 48 dB(A) |
 | ||
30 dB silent 40 dB(A) audible 50 dB(A) loud |
||
min: | ||
| Gigabyte Aero 15-X9 i7-8750H, GeForce RTX 2070 Max-Q | Gigabyte Aero 15X v8 i7-8750H, GeForce GTX 1070 Max-Q | Asus Zephyrus S GX531GS i7-8750H, GeForce GTX 1070 Max-Q | MSI GS65 8RF-019DE Stealth Thin i7-8750H, GeForce GTX 1070 Max-Q | Razer Blade 15 RTX 2070 Max-Q i7-8750H, GeForce RTX 2070 Max-Q | Acer Predator Triton 500 i7-8750H, GeForce RTX 2080 Max-Q | Average of class Gaming | |
|---|---|---|---|---|---|---|---|
| Noise | -4% | -7% | 5% | 10% | 2% | 10% | |
| off / environment * (dB) | 30 | 29 3% | 29 3% | 30 -0% | 28.8 4% | 29 3% | 24.1 ? 20% |
| Idle Minimum * (dB) | 32 | 30 6% | 33 -3% | 30 6% | 28.8 10% | 30 6% | 25.8 ? 19% |
| Idle Average * (dB) | 34 | 31 9% | 34 -0% | 31 9% | 28.8 15% | 32 6% | 27.4 ? 19% |
| Idle Maximum * (dB) | 36 | 35 3% | 40 -11% | 34 6% | 29.4 18% | 34 6% | 30 ? 17% |
| Load Average * (dB) | 42 | 49 -17% | 47 -12% | 43 -2% | 35.7 15% | 44 -5% | 43 ? -2% |
| Witcher 3 ultra * (dB) | 44 | 51 -16% | 51 -16% | 42 5% | 42.5 3% | 46 -5% | |
| Load Maximum * (dB) | 48 | 54 -13% | 53 -10% | 44 8% | 45 6% | 47 2% | 54 ? -13% |
* ... smaller is better
(-) The maximum temperature on the upper side is 56 °C / 133 F, compared to the average of 40.4 °C / 105 F, ranging from 21.2 to 68.8 °C for the class Gaming.
(-) The bottom heats up to a maximum of 66 °C / 151 F, compared to the average of 43.2 °C / 110 F
(+) In idle usage, the average temperature for the upper side is 25.4 °C / 78 F, compared to the device average of 33.9 °C / 93 F.
(-) Playing The Witcher 3, the average temperature for the upper side is 44.3 °C / 112 F, compared to the device average of 33.9 °C / 93 F.
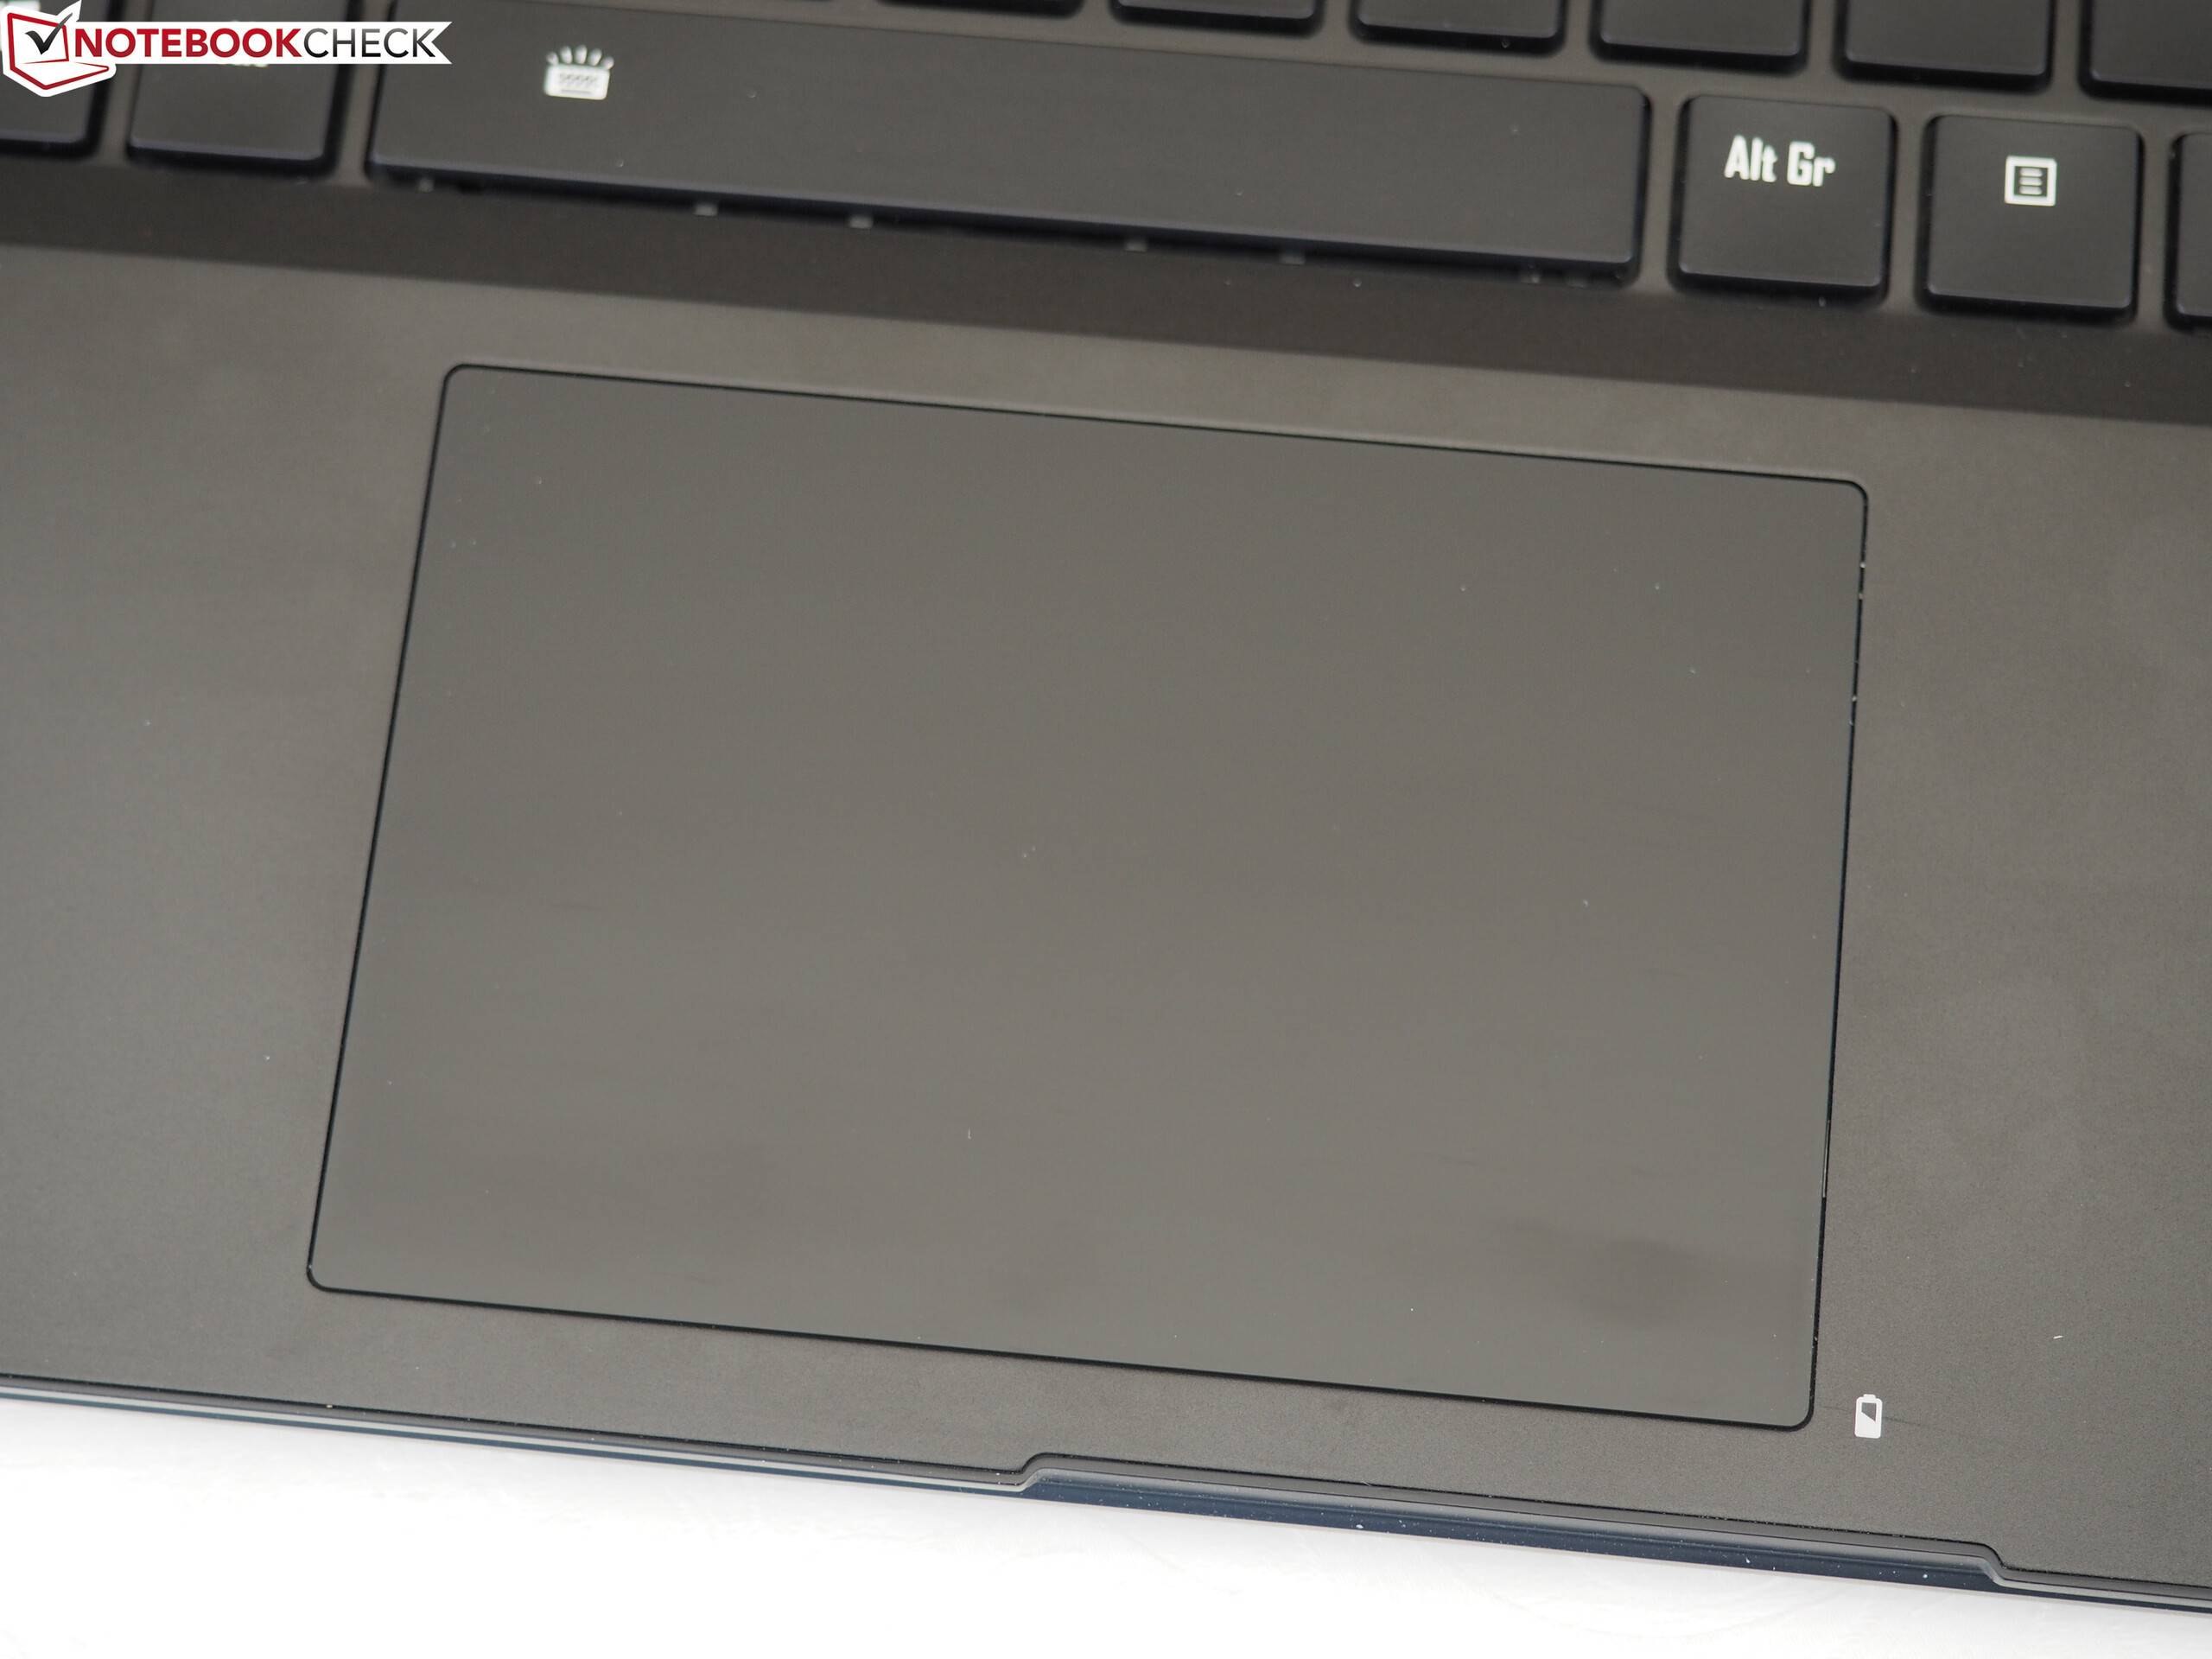
(±) The palmrests and touchpad can get very hot to the touch with a maximum of 38 °C / 100.4 F.
(-) The average temperature of the palmrest area of similar devices was 28.8 °C / 83.8 F (-9.2 °C / -16.6 F).
| Gigabyte Aero 15-X9 i7-8750H, GeForce RTX 2070 Max-Q | Gigabyte Aero 15X v8 i7-8750H, GeForce GTX 1070 Max-Q | Asus Zephyrus S GX531GS i7-8750H, GeForce GTX 1070 Max-Q | MSI GS65 8RF-019DE Stealth Thin i7-8750H, GeForce GTX 1070 Max-Q | Razer Blade 15 RTX 2070 Max-Q i7-8750H, GeForce RTX 2070 Max-Q | Acer Predator Triton 500 i7-8750H, GeForce RTX 2080 Max-Q | Average of class Gaming | |
|---|---|---|---|---|---|---|---|
| Heat | 0% | -2% | 9% | 11% | -5% | 1% | |
| Maximum Upper Side * (°C) | 56 | 53 5% | 54 4% | 49 12% | 49 12% | 49 12% | 45.2 ? 19% |
| Maximum Bottom * (°C) | 66 | 65 2% | 60 9% | 63 5% | 49 26% | 58 12% | 48 ? 27% |
| Idle Upper Side * (°C) | 27 | 26 4% | 30 -11% | 24 11% | 25.4 6% | 33 -22% | 31.1 ? -15% |
| Idle Bottom * (°C) | 27 | 30 -11% | 30 -11% | 25 7% | 27.2 -1% | 33 -22% | 34.2 ? -27% |
* ... smaller is better
Gigabyte Aero 15-X9 audio analysis
(±) | speaker loudness is average but good (81 dB)
Bass 100 - 315 Hz
(±) | reduced bass - on average 14% lower than median
(±) | linearity of bass is average (13.7% delta to prev. frequency)
Mids 400 - 2000 Hz
(±) | higher mids - on average 6.2% higher than median
(±) | linearity of mids is average (7.9% delta to prev. frequency)
Highs 2 - 16 kHz
(+) | balanced highs - only 4.4% away from median
(±) | linearity of highs is average (9.7% delta to prev. frequency)
Overall 100 - 16.000 Hz
(±) | linearity of overall sound is average (17.5% difference to median)
Compared to same class
» 49% of all tested devices in this class were better, 12% similar, 40% worse
» The best had a delta of 6%, average was 18%, worst was 132%
Compared to all devices tested
» 34% of all tested devices were better, 8% similar, 58% worse
» The best had a delta of 4%, average was 24%, worst was 134%
Gigabyte Aero 15X v8 audio analysis
(±) | speaker loudness is average but good (78 dB)
Bass 100 - 315 Hz
(-) | nearly no bass - on average 16.8% lower than median
(±) | linearity of bass is average (11.6% delta to prev. frequency)
Mids 400 - 2000 Hz
(+) | balanced mids - only 4.3% away from median
(+) | mids are linear (5% delta to prev. frequency)
Highs 2 - 16 kHz
(+) | balanced highs - only 3.6% away from median
(±) | linearity of highs is average (9.1% delta to prev. frequency)
Overall 100 - 16.000 Hz
(±) | linearity of overall sound is average (18.4% difference to median)
Compared to same class
» 59% of all tested devices in this class were better, 9% similar, 33% worse
» The best had a delta of 6%, average was 18%, worst was 132%
Compared to all devices tested
» 41% of all tested devices were better, 8% similar, 52% worse
» The best had a delta of 4%, average was 24%, worst was 134%
| Off / Standby | |
| Idle | |
| Load |
|
Key:
min: | |
| Gigabyte Aero 15-X9 i7-8750H, GeForce RTX 2070 Max-Q | Gigabyte Aero 15X v8 i7-8750H, GeForce GTX 1070 Max-Q | Asus Zephyrus S GX531GS i7-8750H, GeForce GTX 1070 Max-Q | MSI GS65 8RF-019DE Stealth Thin i7-8750H, GeForce GTX 1070 Max-Q | Razer Blade 15 RTX 2070 Max-Q i7-8750H, GeForce RTX 2070 Max-Q | Acer Predator Triton 500 i7-8750H, GeForce RTX 2080 Max-Q | Average of class Gaming | |
|---|---|---|---|---|---|---|---|
| Power Consumption | -2% | -21% | 13% | 7% | -15% | -14% | |
| Idle Minimum * (Watt) | 16 | 14 12% | 17 -6% | 7 56% | 10.4 35% | 16 -0% | 13.2 ? 17% |
| Idle Average * (Watt) | 18 | 18 -0% | 20 -11% | 11 39% | 14.6 19% | 22 -22% | 18.9 ? -5% |
| Idle Maximum * (Watt) | 23 | 22 4% | 29 -26% | 20 13% | 16.3 29% | 32 -39% | 24.3 ? -6% |
| Load Average * (Watt) | 88 | 91 -3% | 112 -27% | 98 -11% | 88.5 -1% | 89 -1% | 108 ? -23% |
| Witcher 3 ultra * (Watt) | 120 | 142 -18% | 152 -27% | 132 -10% | 155.4 -30% | 147 -23% | |
| Load Maximum * (Watt) | 167 | 173 -4% | 211 -26% | 182 -9% | 182.4 -9% | 173 -4% | 254 ? -52% |
* ... smaller is better
| Gigabyte Aero 15-X9 i7-8750H, GeForce RTX 2070 Max-Q, 94.24 Wh | Gigabyte Aero 15X v8 i7-8750H, GeForce GTX 1070 Max-Q, 94.24 Wh | Asus Zephyrus S GX531GS i7-8750H, GeForce GTX 1070 Max-Q, 50 Wh | MSI GS65 8RF-019DE Stealth Thin i7-8750H, GeForce GTX 1070 Max-Q, 82 Wh | Razer Blade 15 RTX 2070 Max-Q i7-8750H, GeForce RTX 2070 Max-Q, 80 Wh | Acer Predator Triton 500 i7-8750H, GeForce RTX 2080 Max-Q, 82 Wh | Average of class Gaming | |
|---|---|---|---|---|---|---|---|
| Battery runtime | 25% | -65% | -17% | -7% | -47% | -2% | |
| Reader / Idle (h) | 9.2 | 12.7 38% | 3.6 -61% | 8.5 -8% | 11.4 24% | 5.6 -39% | 8.71 ? -5% |
| H.264 (h) | 6.1 | 8.4 38% | 5.9 -3% | 8.26 ? 35% | |||
| WiFi v1.3 (h) | 6.4 | 8.6 34% | 2.6 -59% | 6 -6% | 6.5 2% | 3.2 -50% | 7.02 ? 10% |
| Load (h) | 2.9 | 2.6 -10% | 0.7 -76% | 1.4 -52% | 1.5 -48% | 1.4 -52% | 1.47 ? -49% |
Pros
Cons
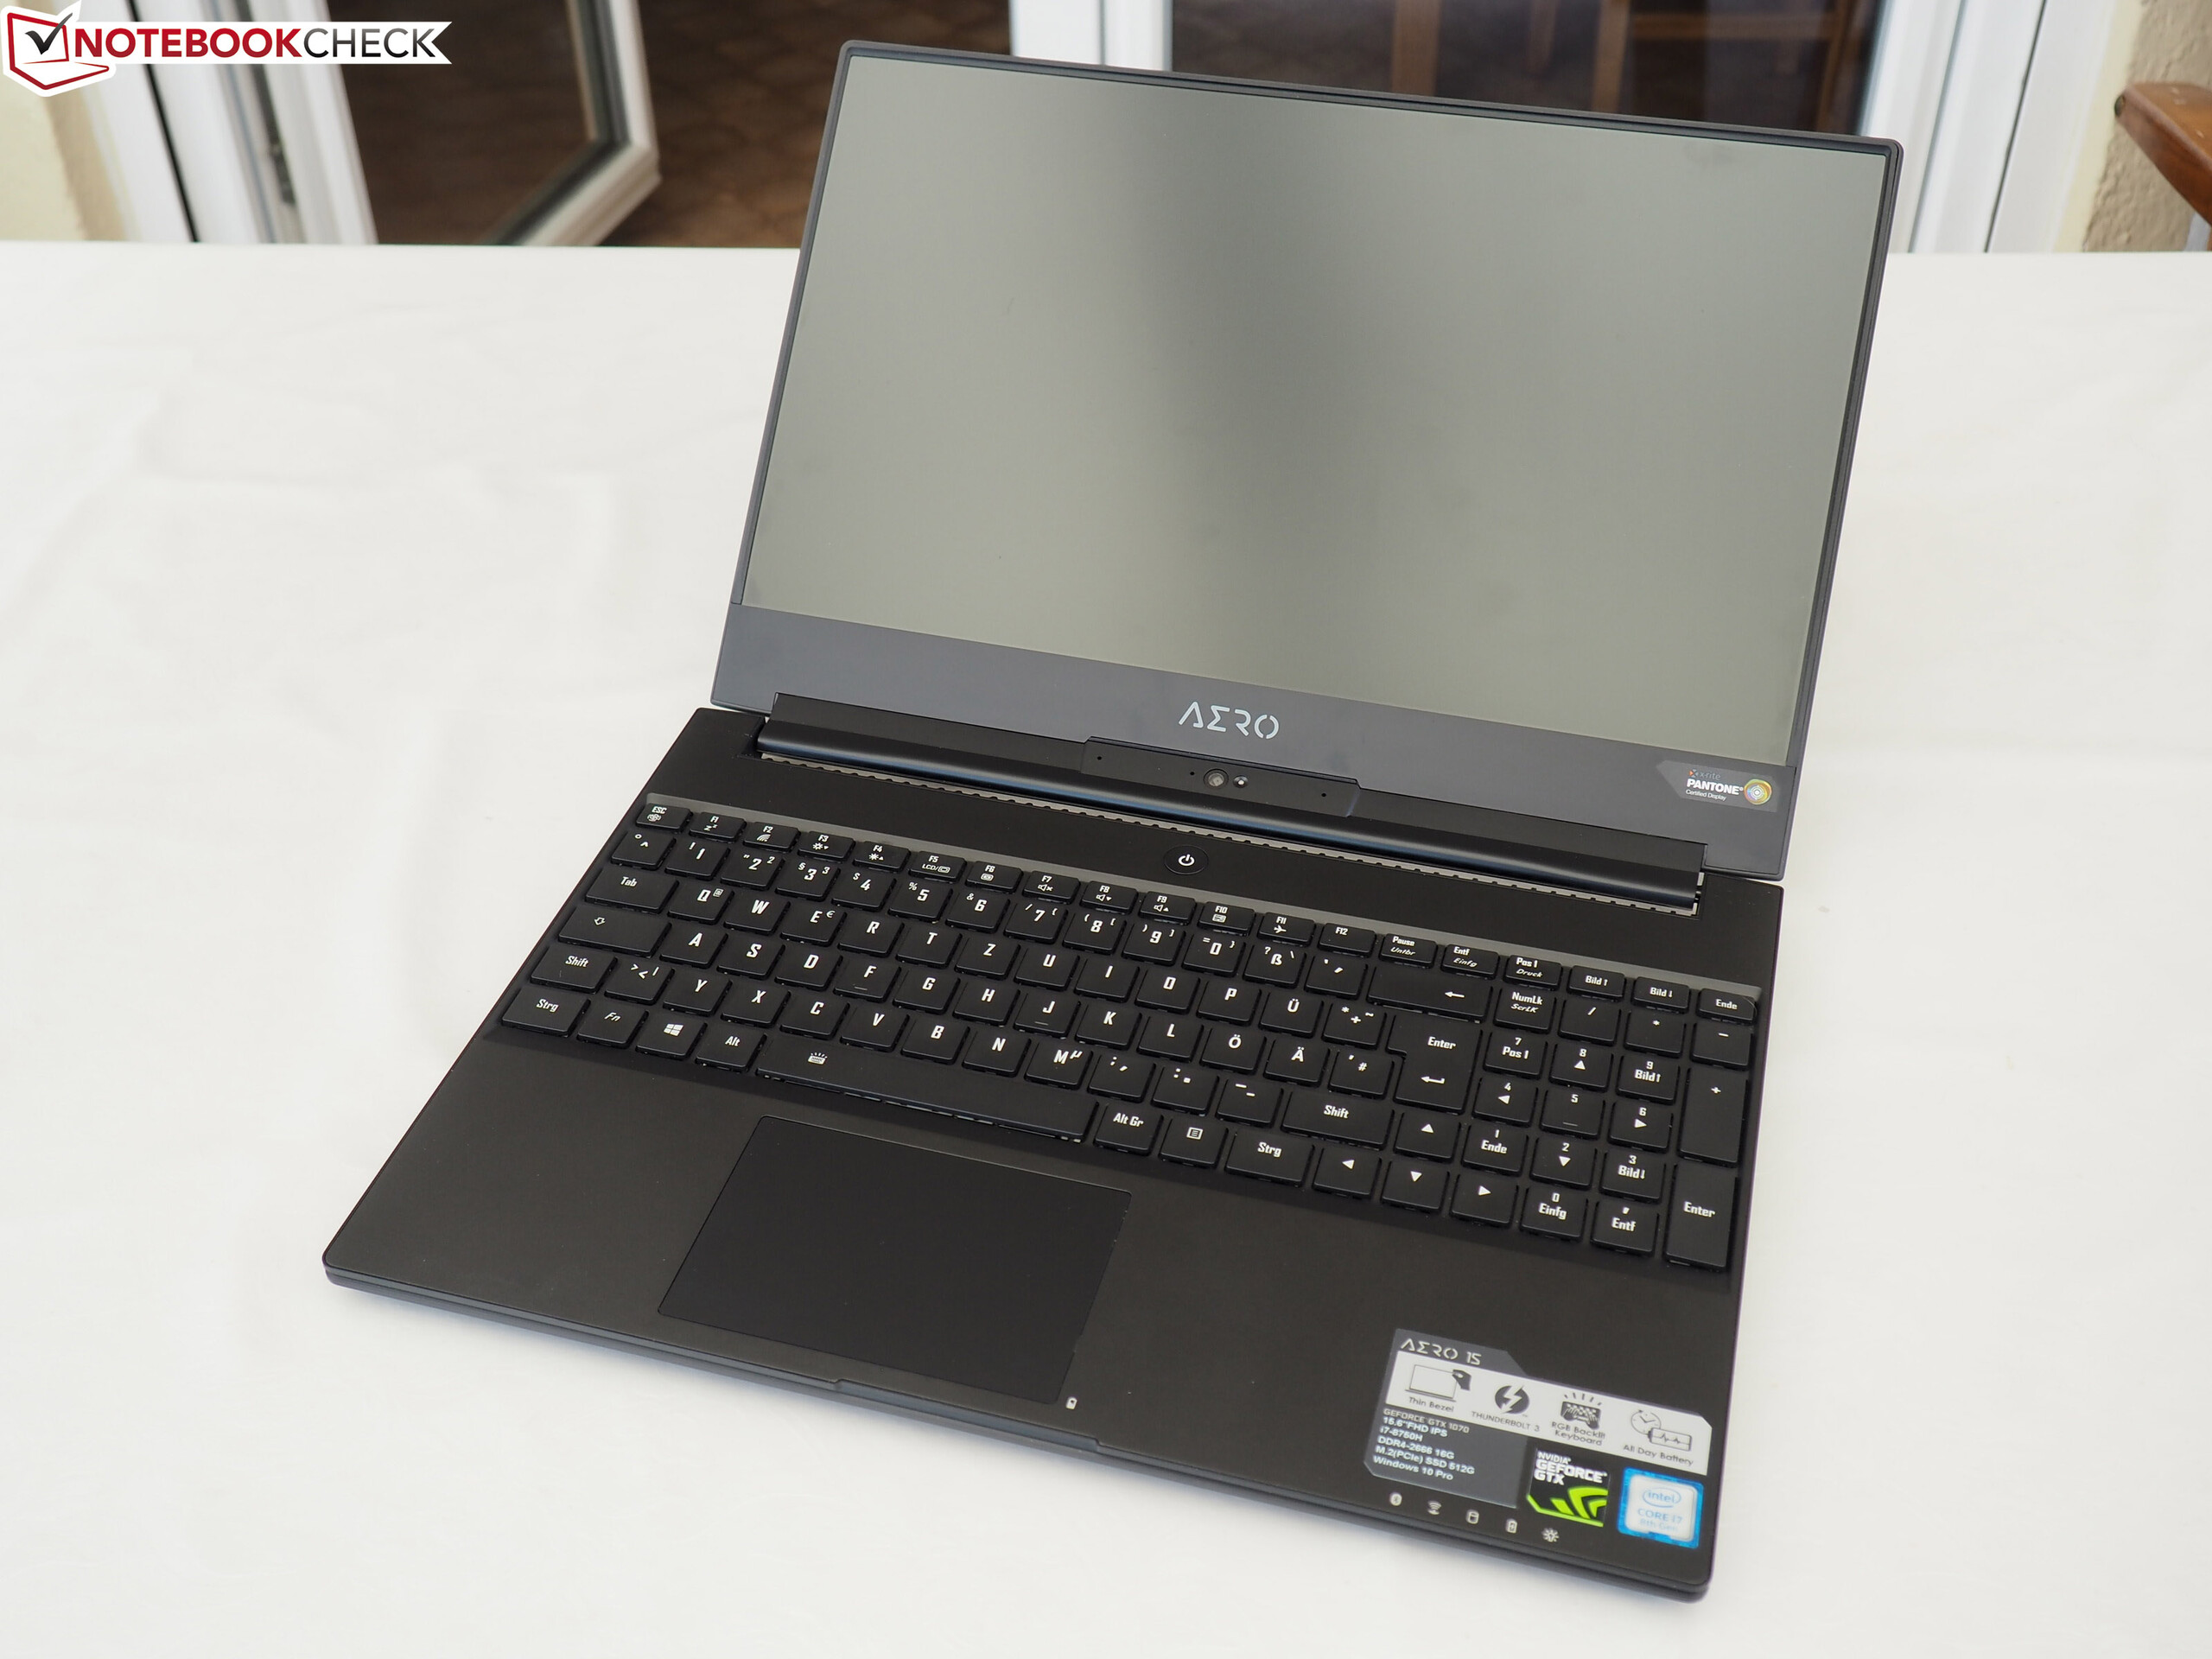
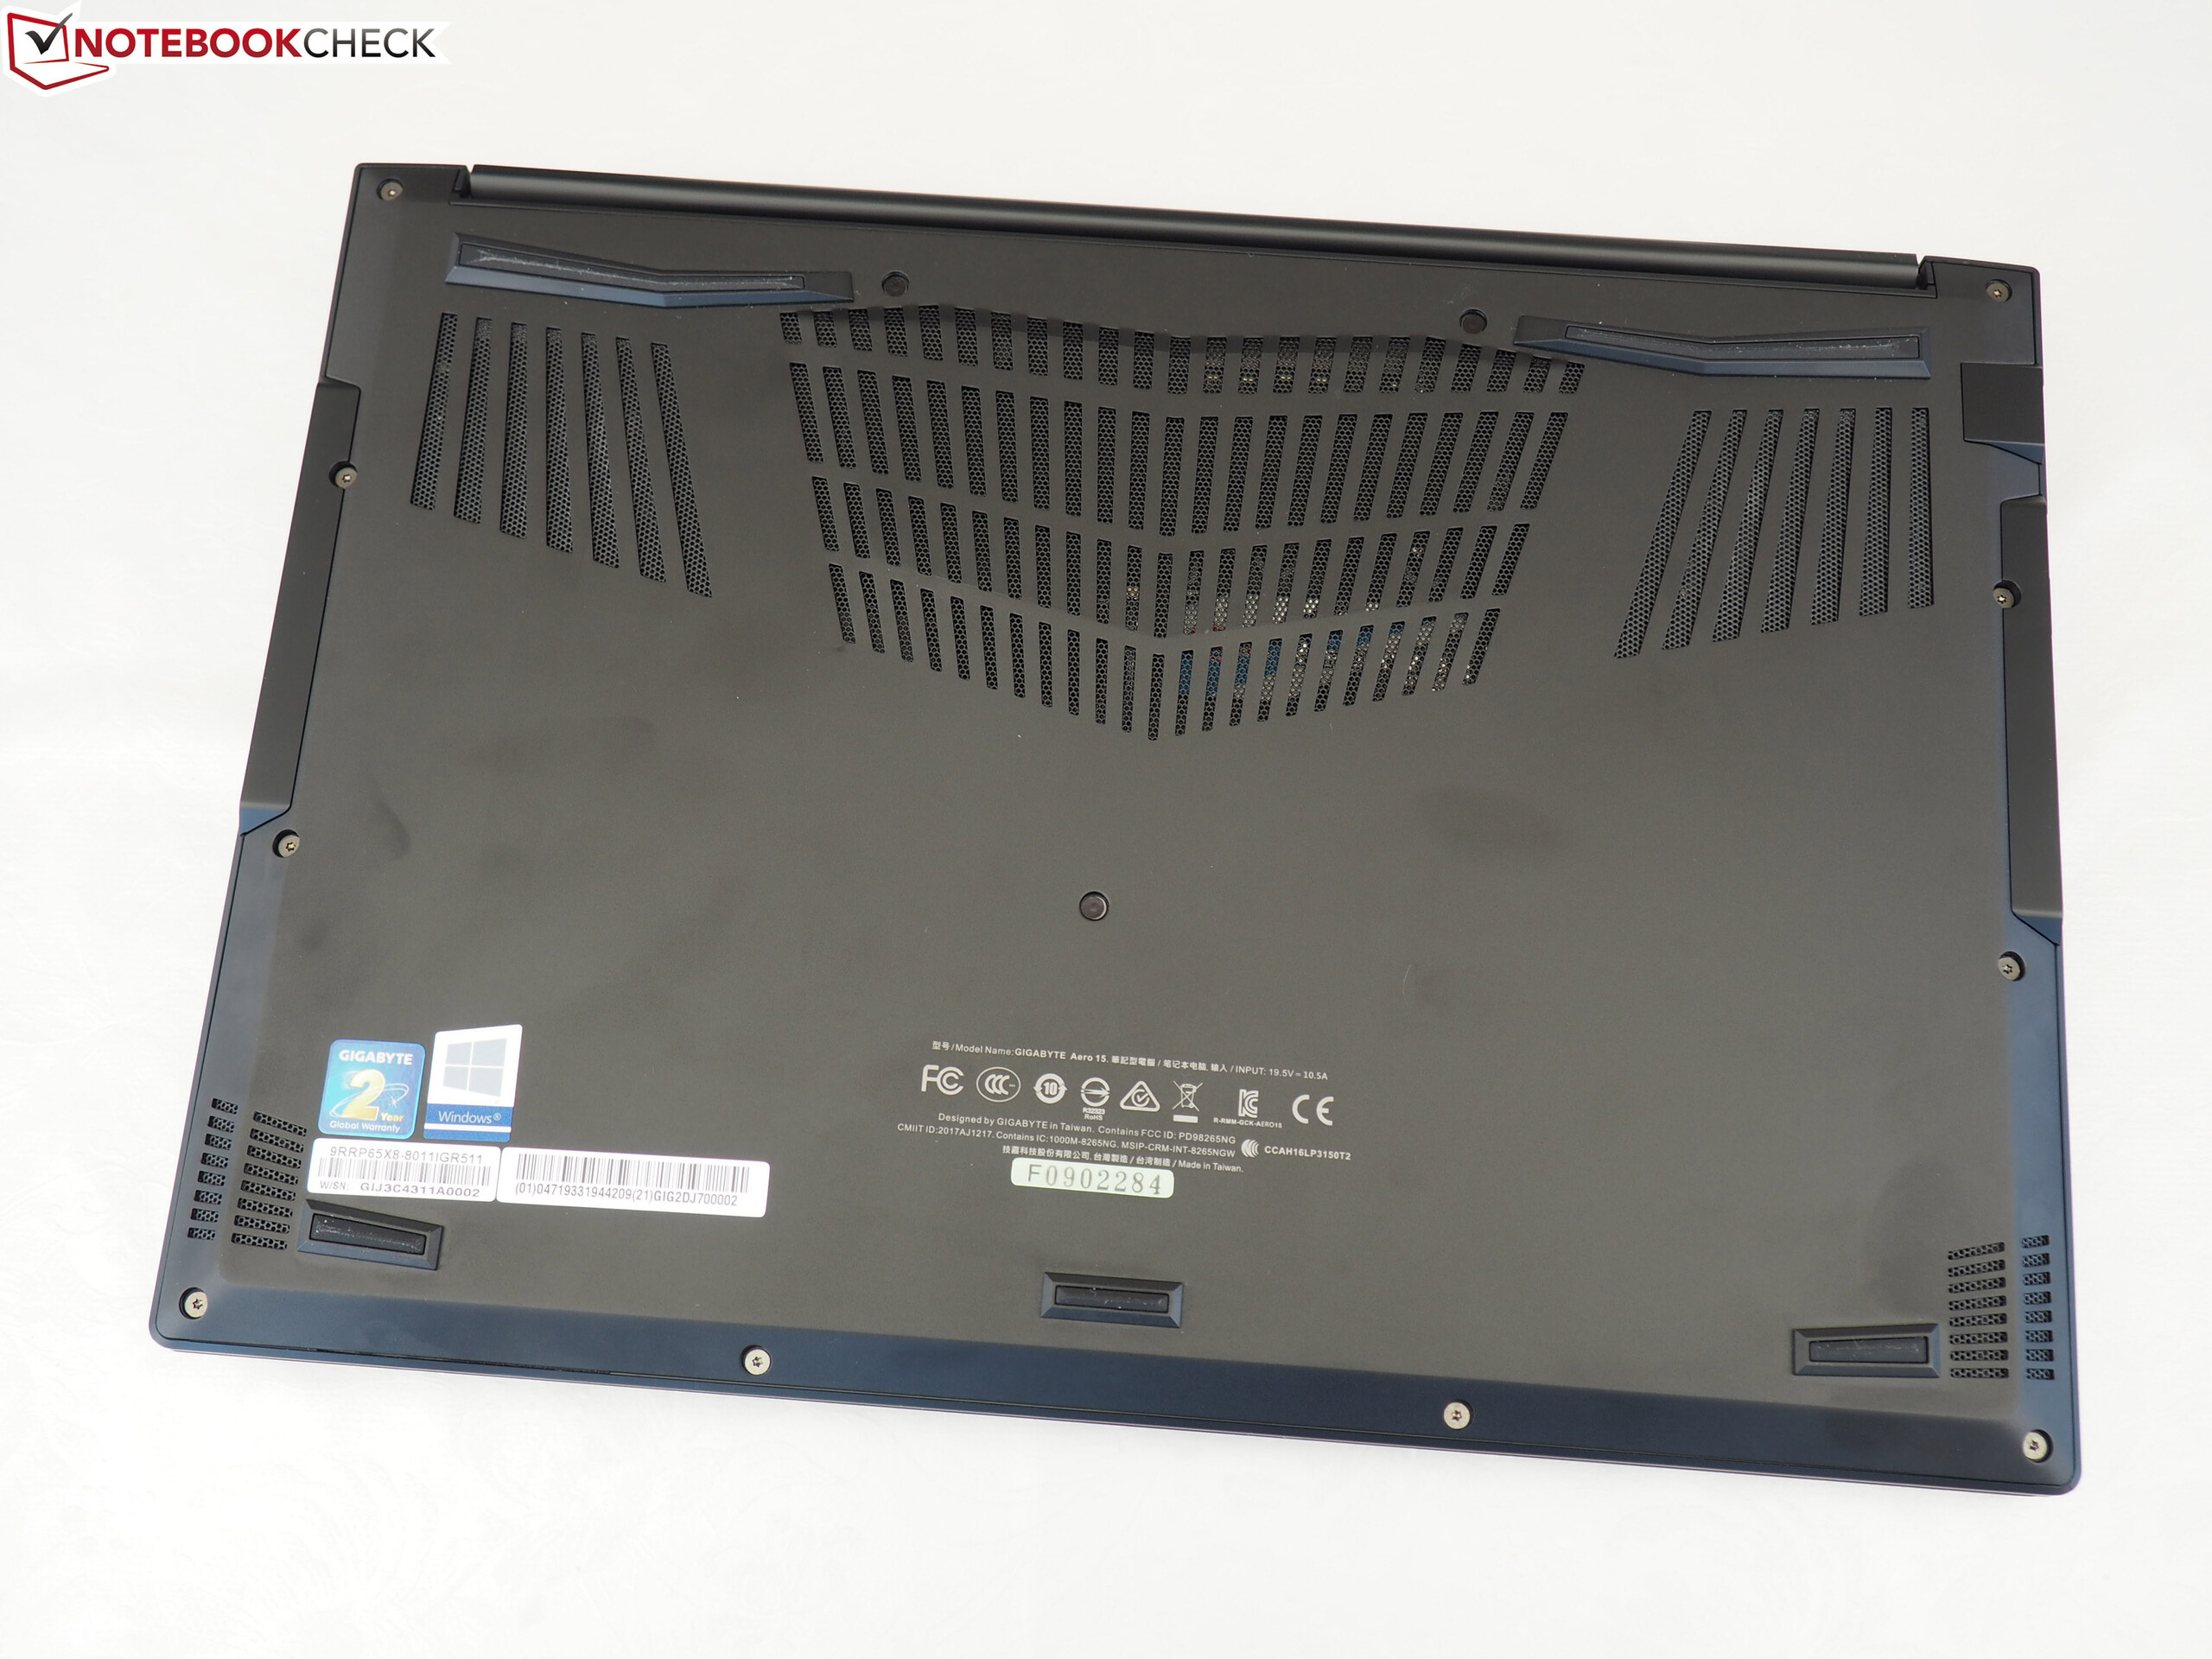
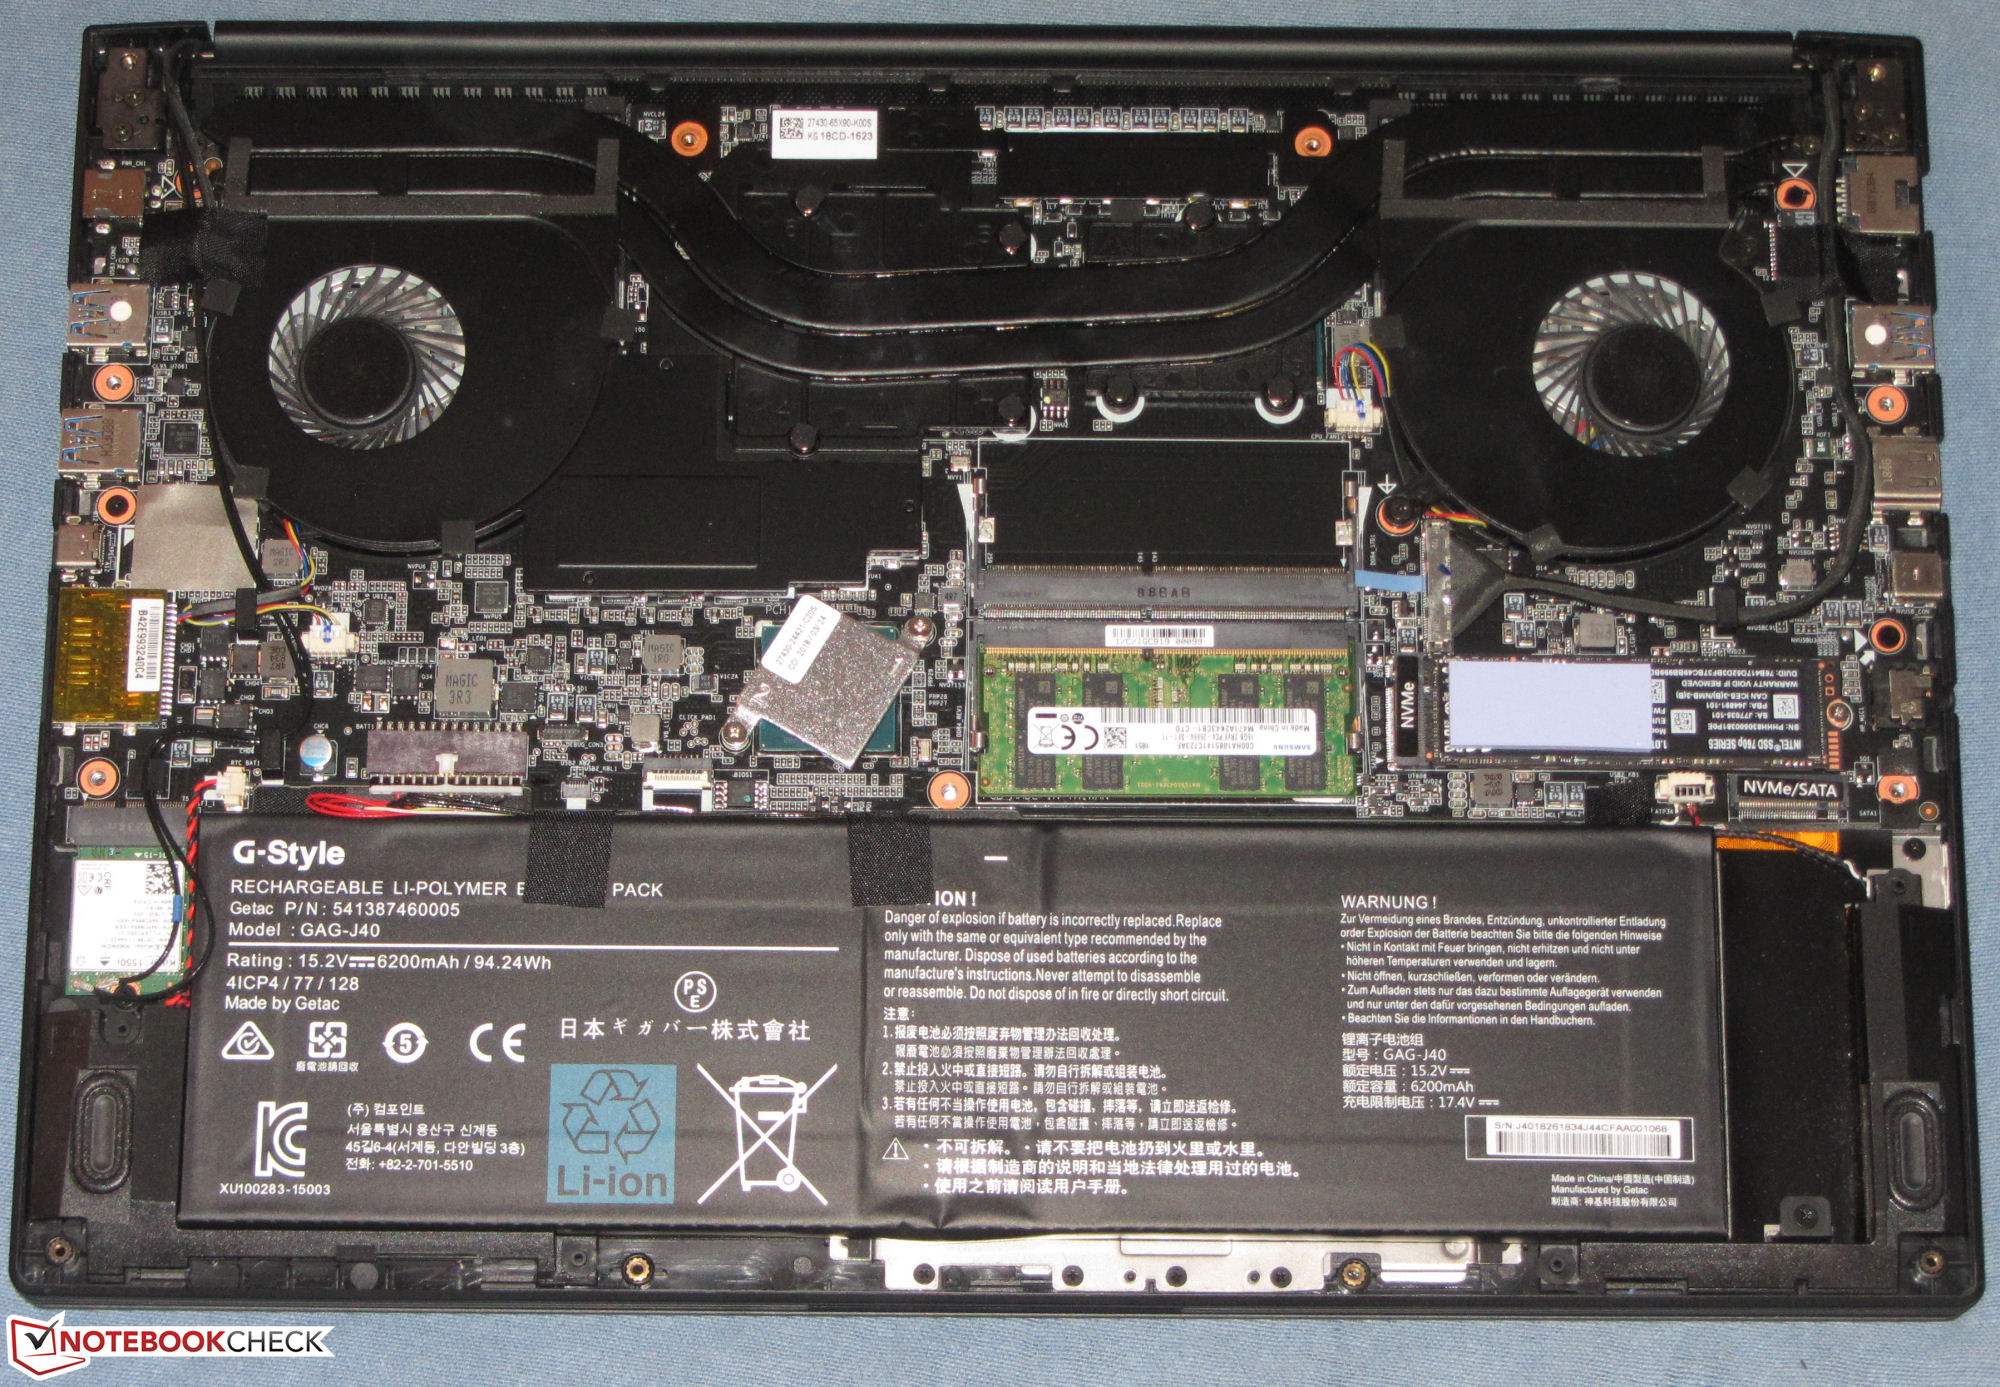
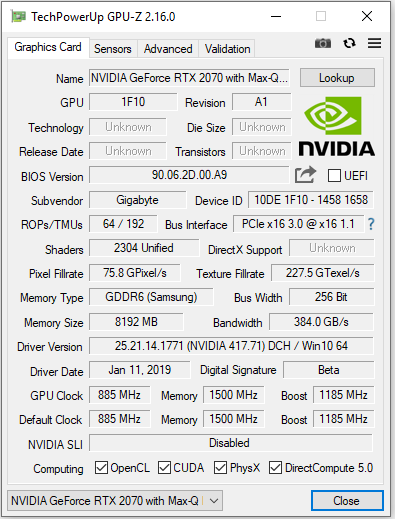
技嘉Aero 15-X9是一款出色的游戏笔记本电脑,相比较它的前身略有改进,但有一些额外的缺点。 Core i7-8750H处理器和RTX-2070 Max-Q GPU是一款成功的组合,性能强大,能够以最高特效1080p的运行所有3A游戏。此外,NVMe SSD确保即使在持续负载下工作,系统也能顺畅运行。该设备易于维护和升级,这是一个加分项。
技嘉Aero 15-X9是一款业界领先的轻薄游戏笔记本电脑,但它的并不像前身那样令人印象深刻。
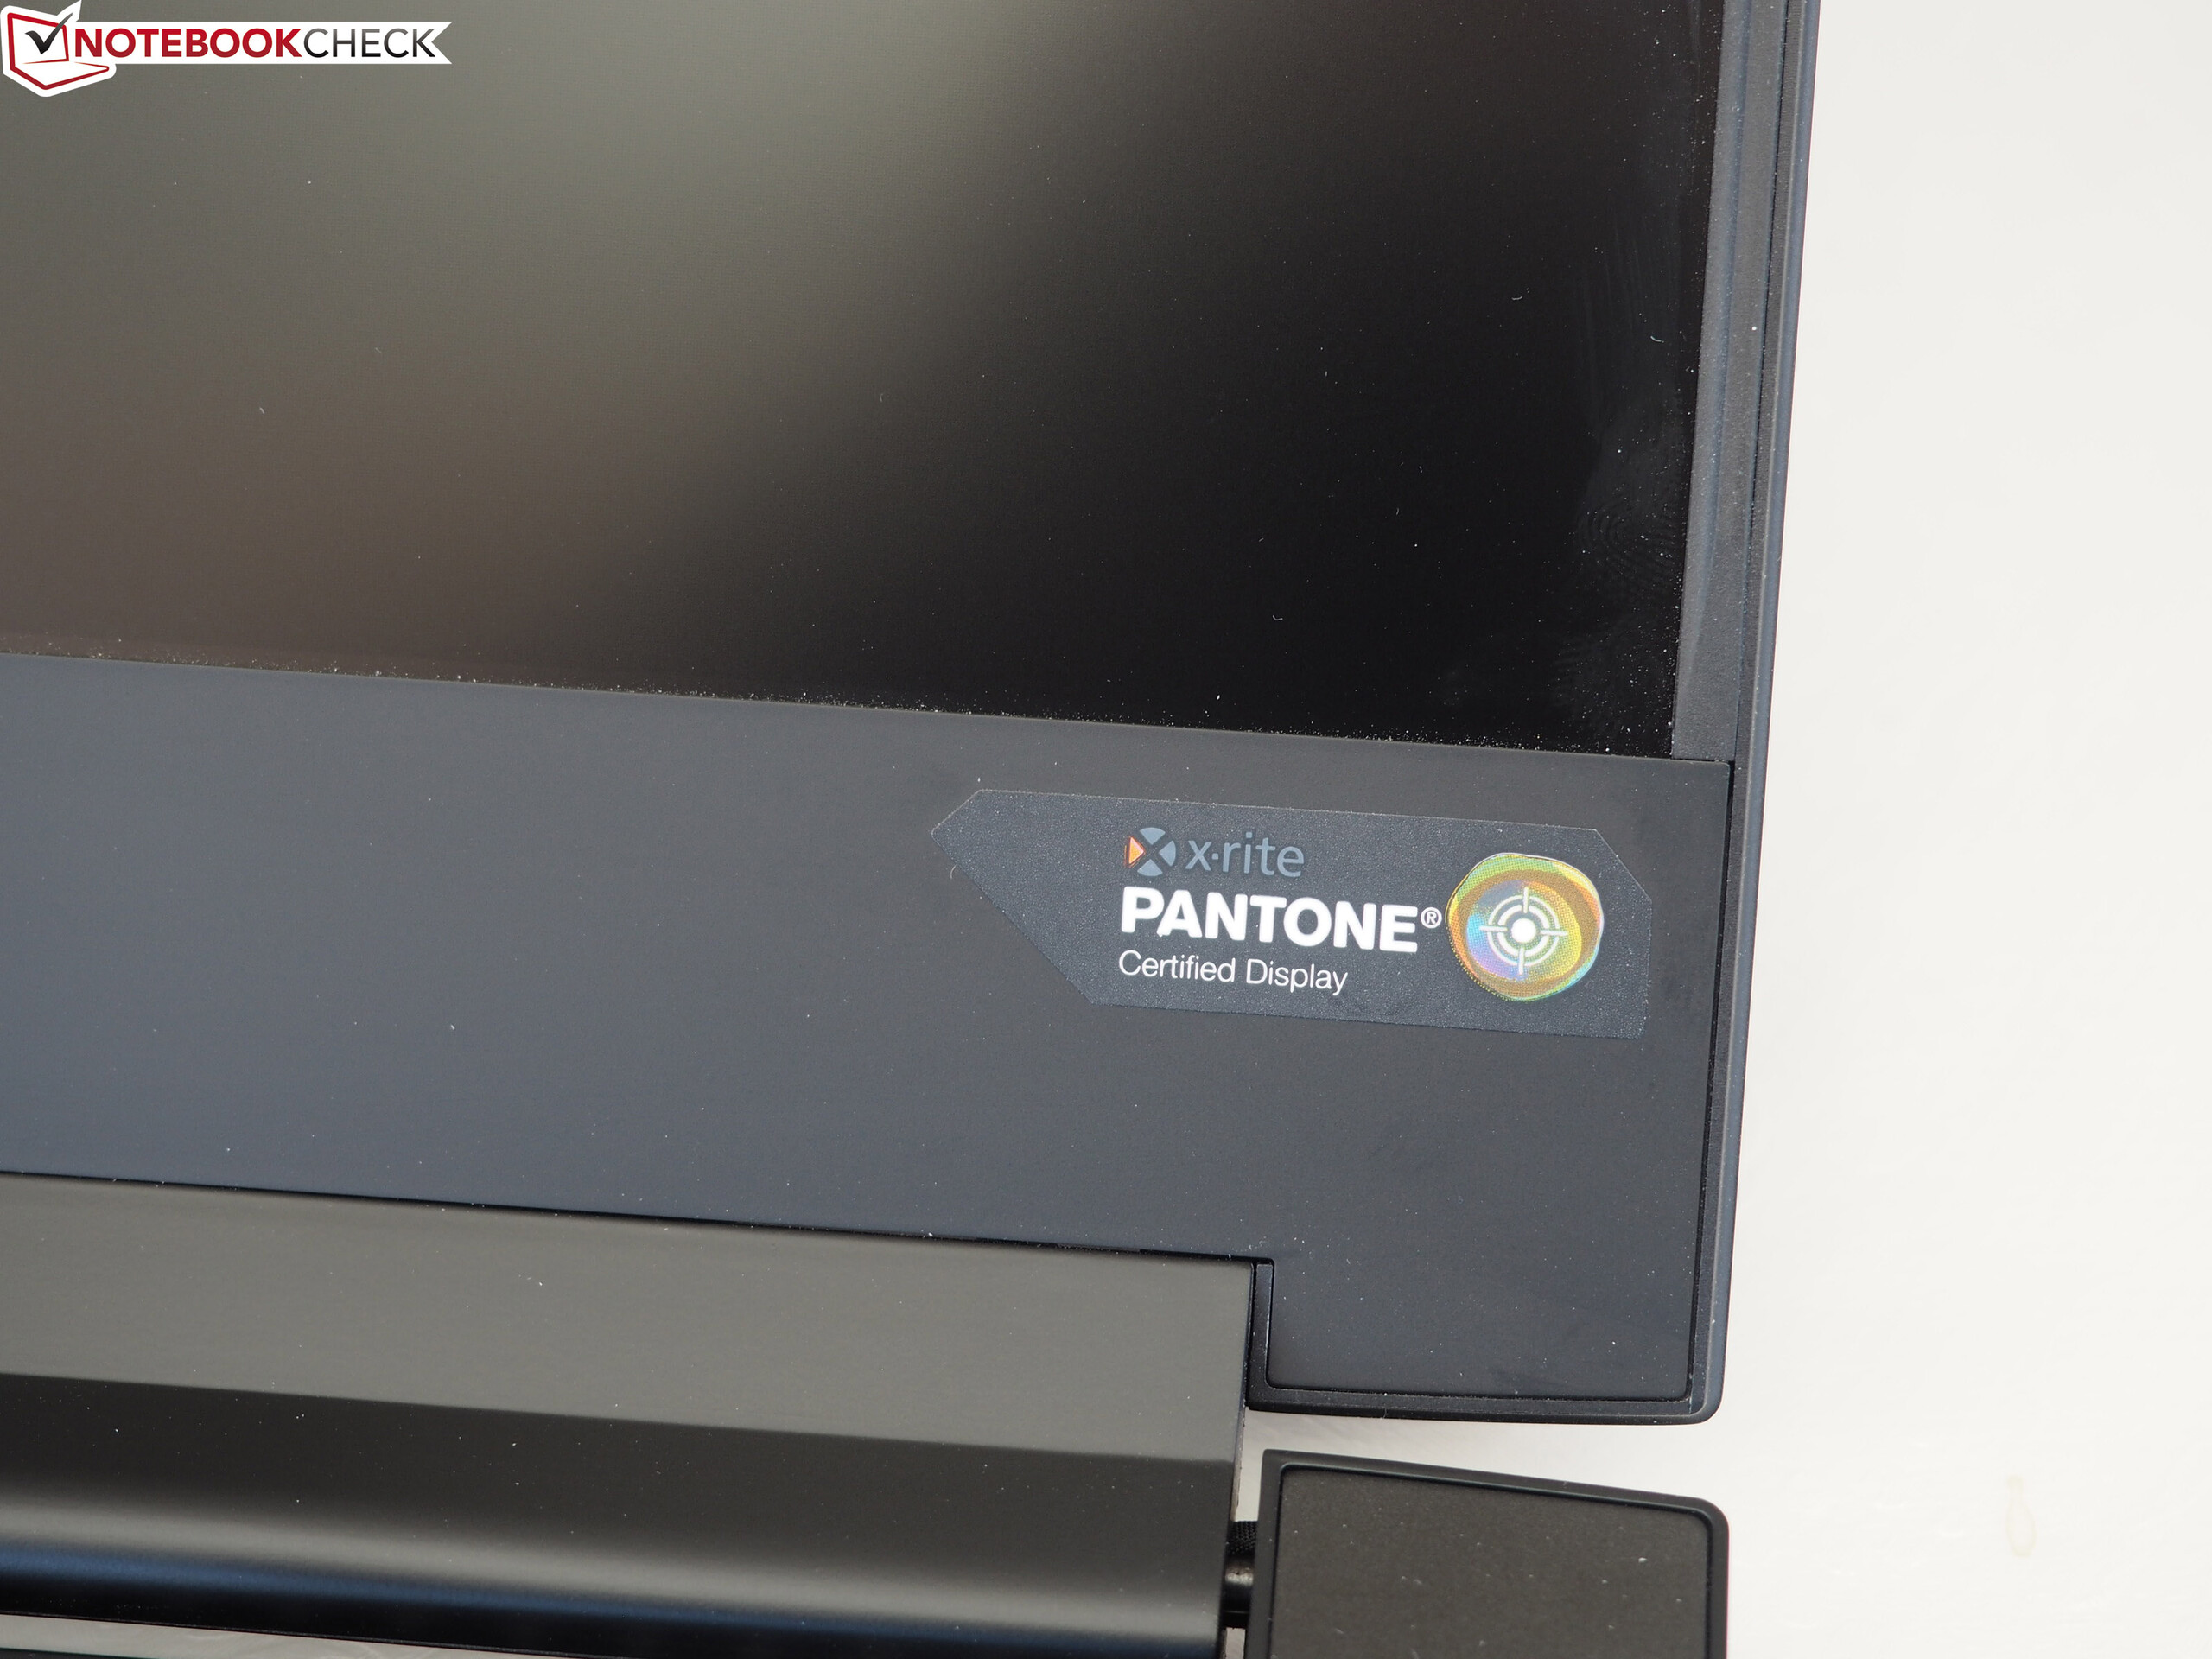
同样,144 Hz IPS屏幕继续以其X-Rite Pantone认证,稳定的视角和低响应时间令人印象深刻。但是,它亮度很暗,导致对比度差。
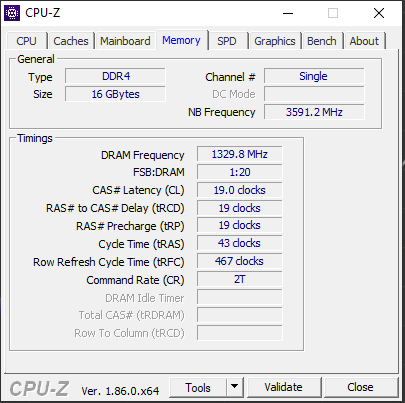
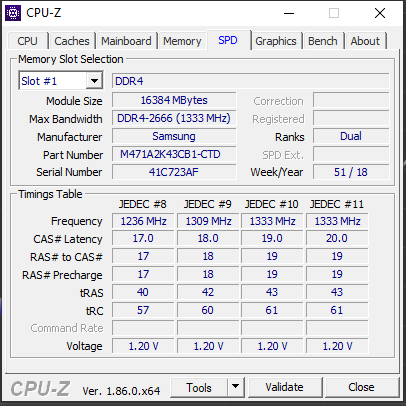
不幸的是,考虑到其前身设定的高标准,续航时间并不令人满意。我们希望这是技嘉可以解决的缺点。此外,功能更强大的GPU会产生更多热量,这使得设备在游戏或视频编辑时太热而无法放在膝盖上。单通道RAM对性能产生瓶颈,这似乎是不必要的缺点。幸运的是,除了高温之外,所有这些问题可以在后续得到解决。该设备目前的零售价比其前任产品高出数千元,并且只带来了微小的改进。简而言之,技嘉Aero 15-X9是您可以买到的最好的轻薄游戏笔记本电脑之一,但是在测试时它的高价格和问题意味着我们不能像它的前身一样高度推荐它。
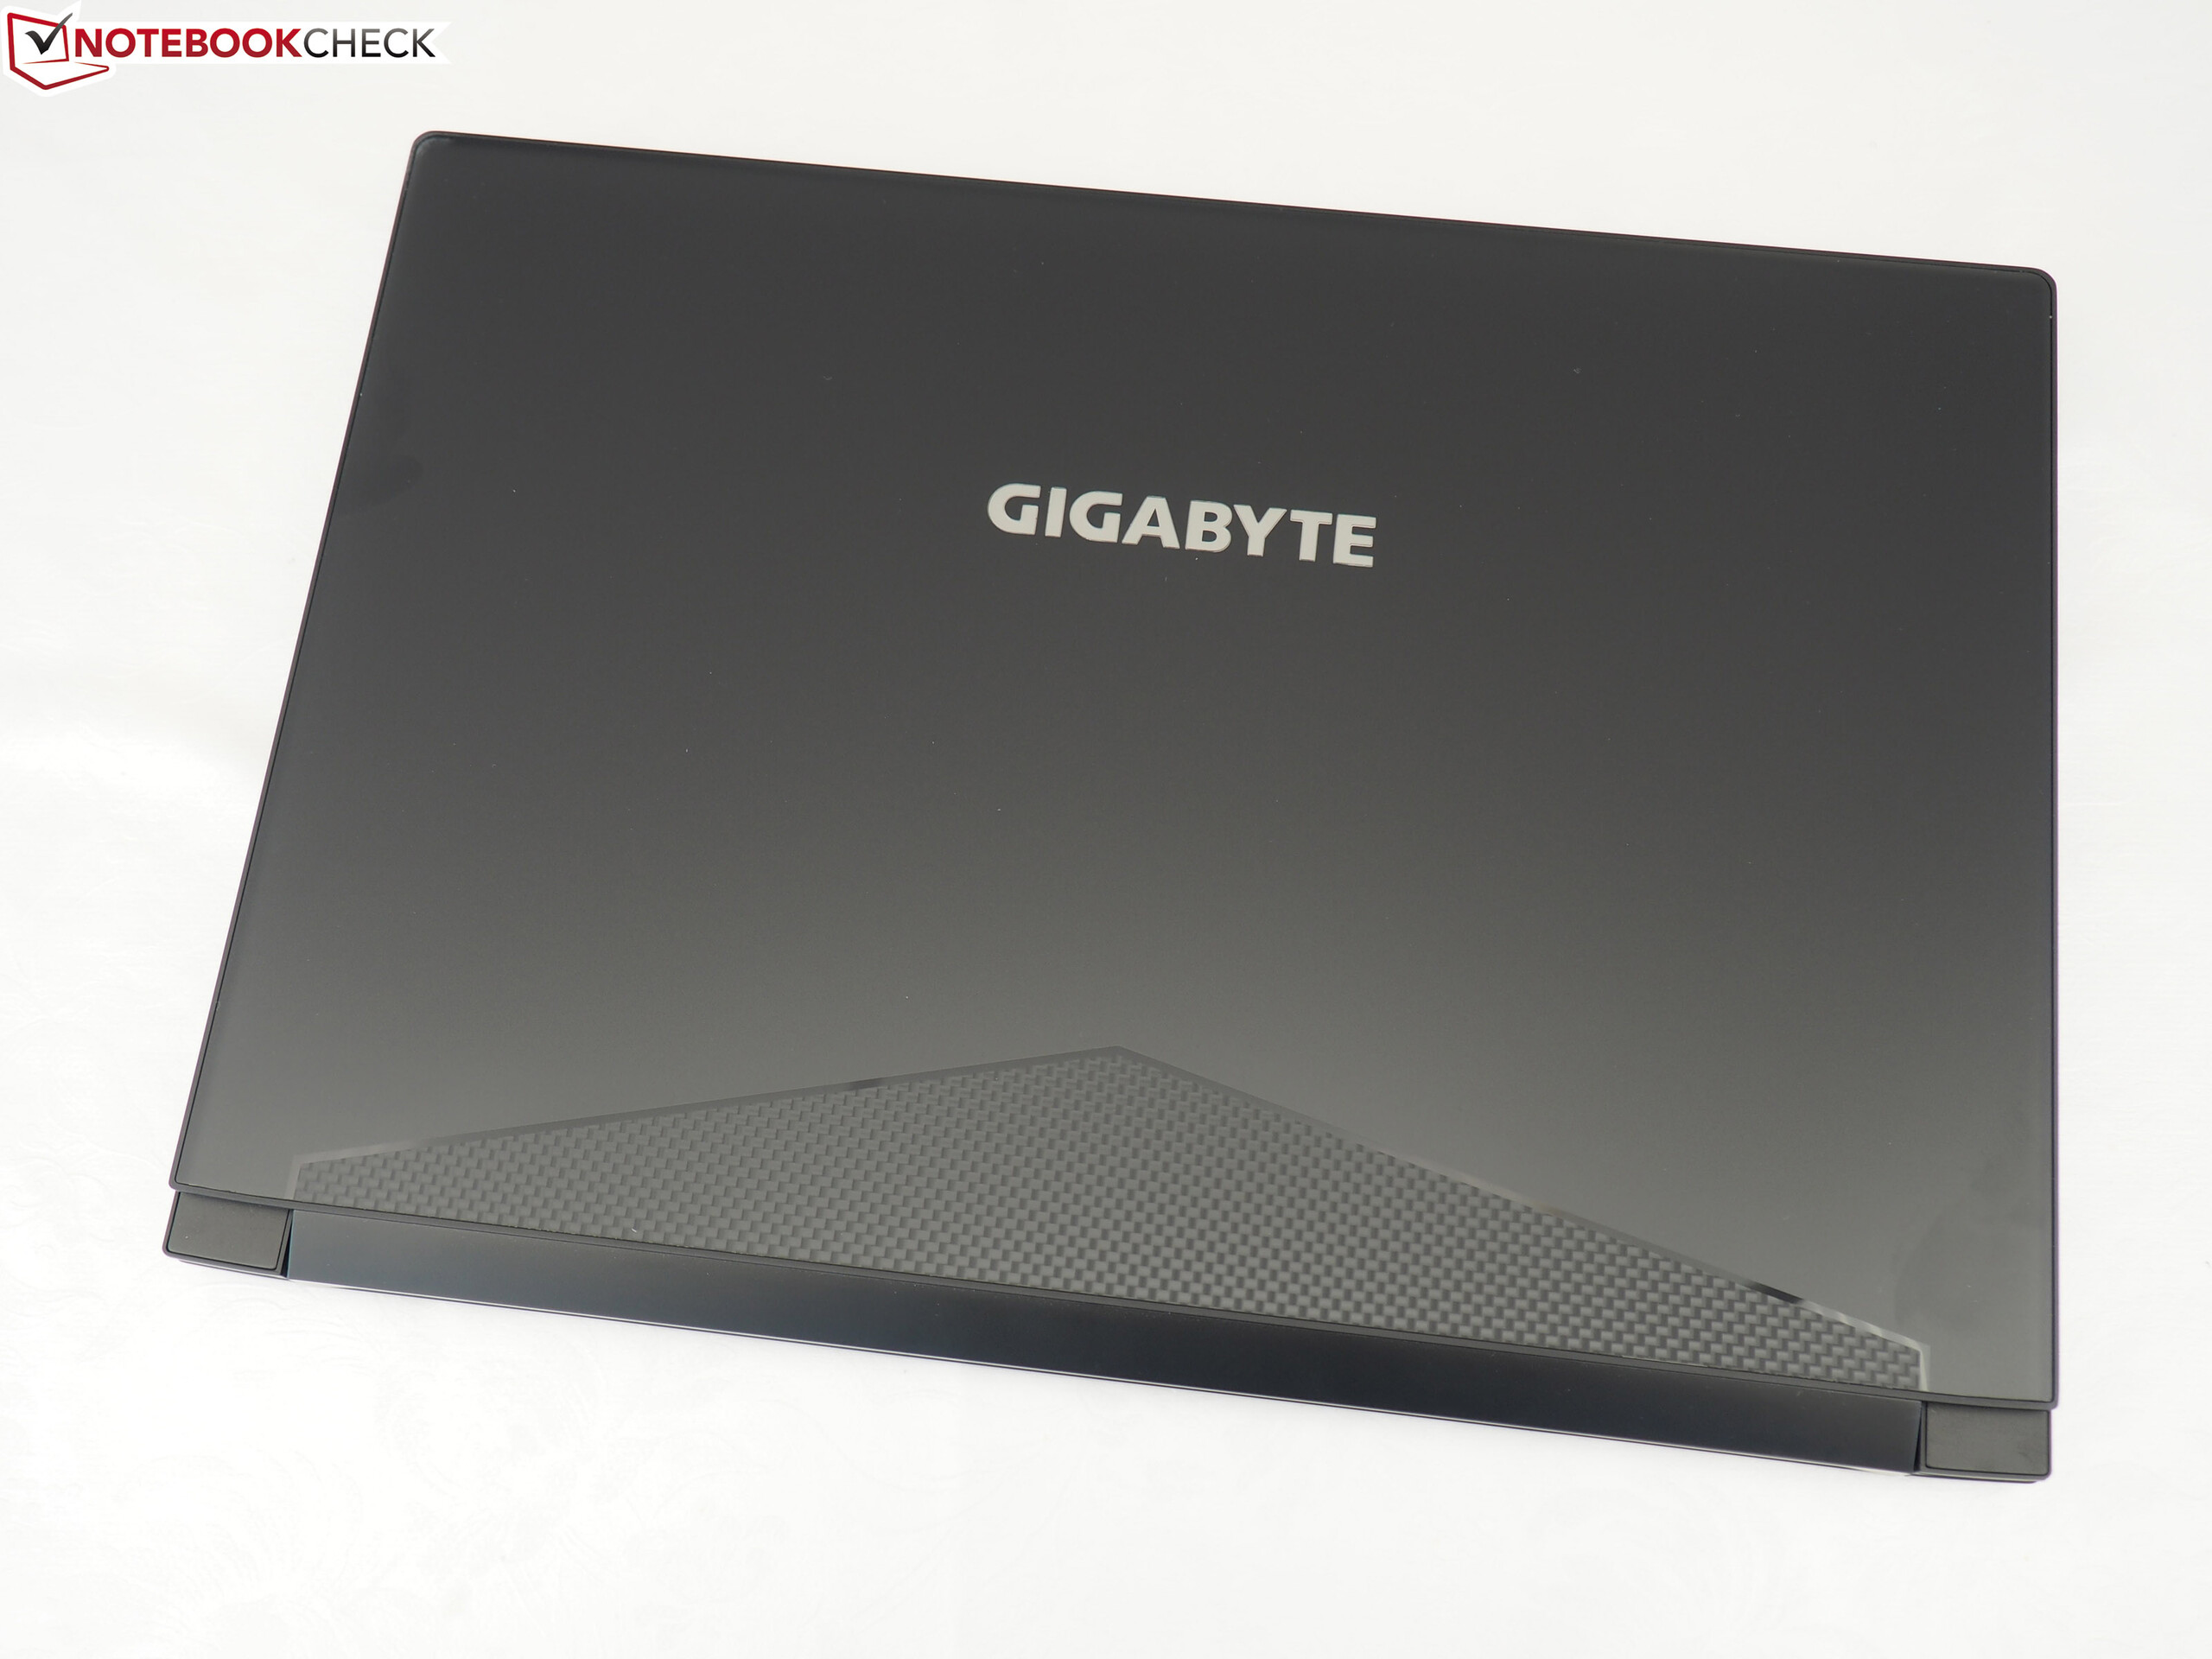
Gigabyte Aero 15-X9
- 02/25/2019 v6 (old)
Sascha Mölck
Price comparison

