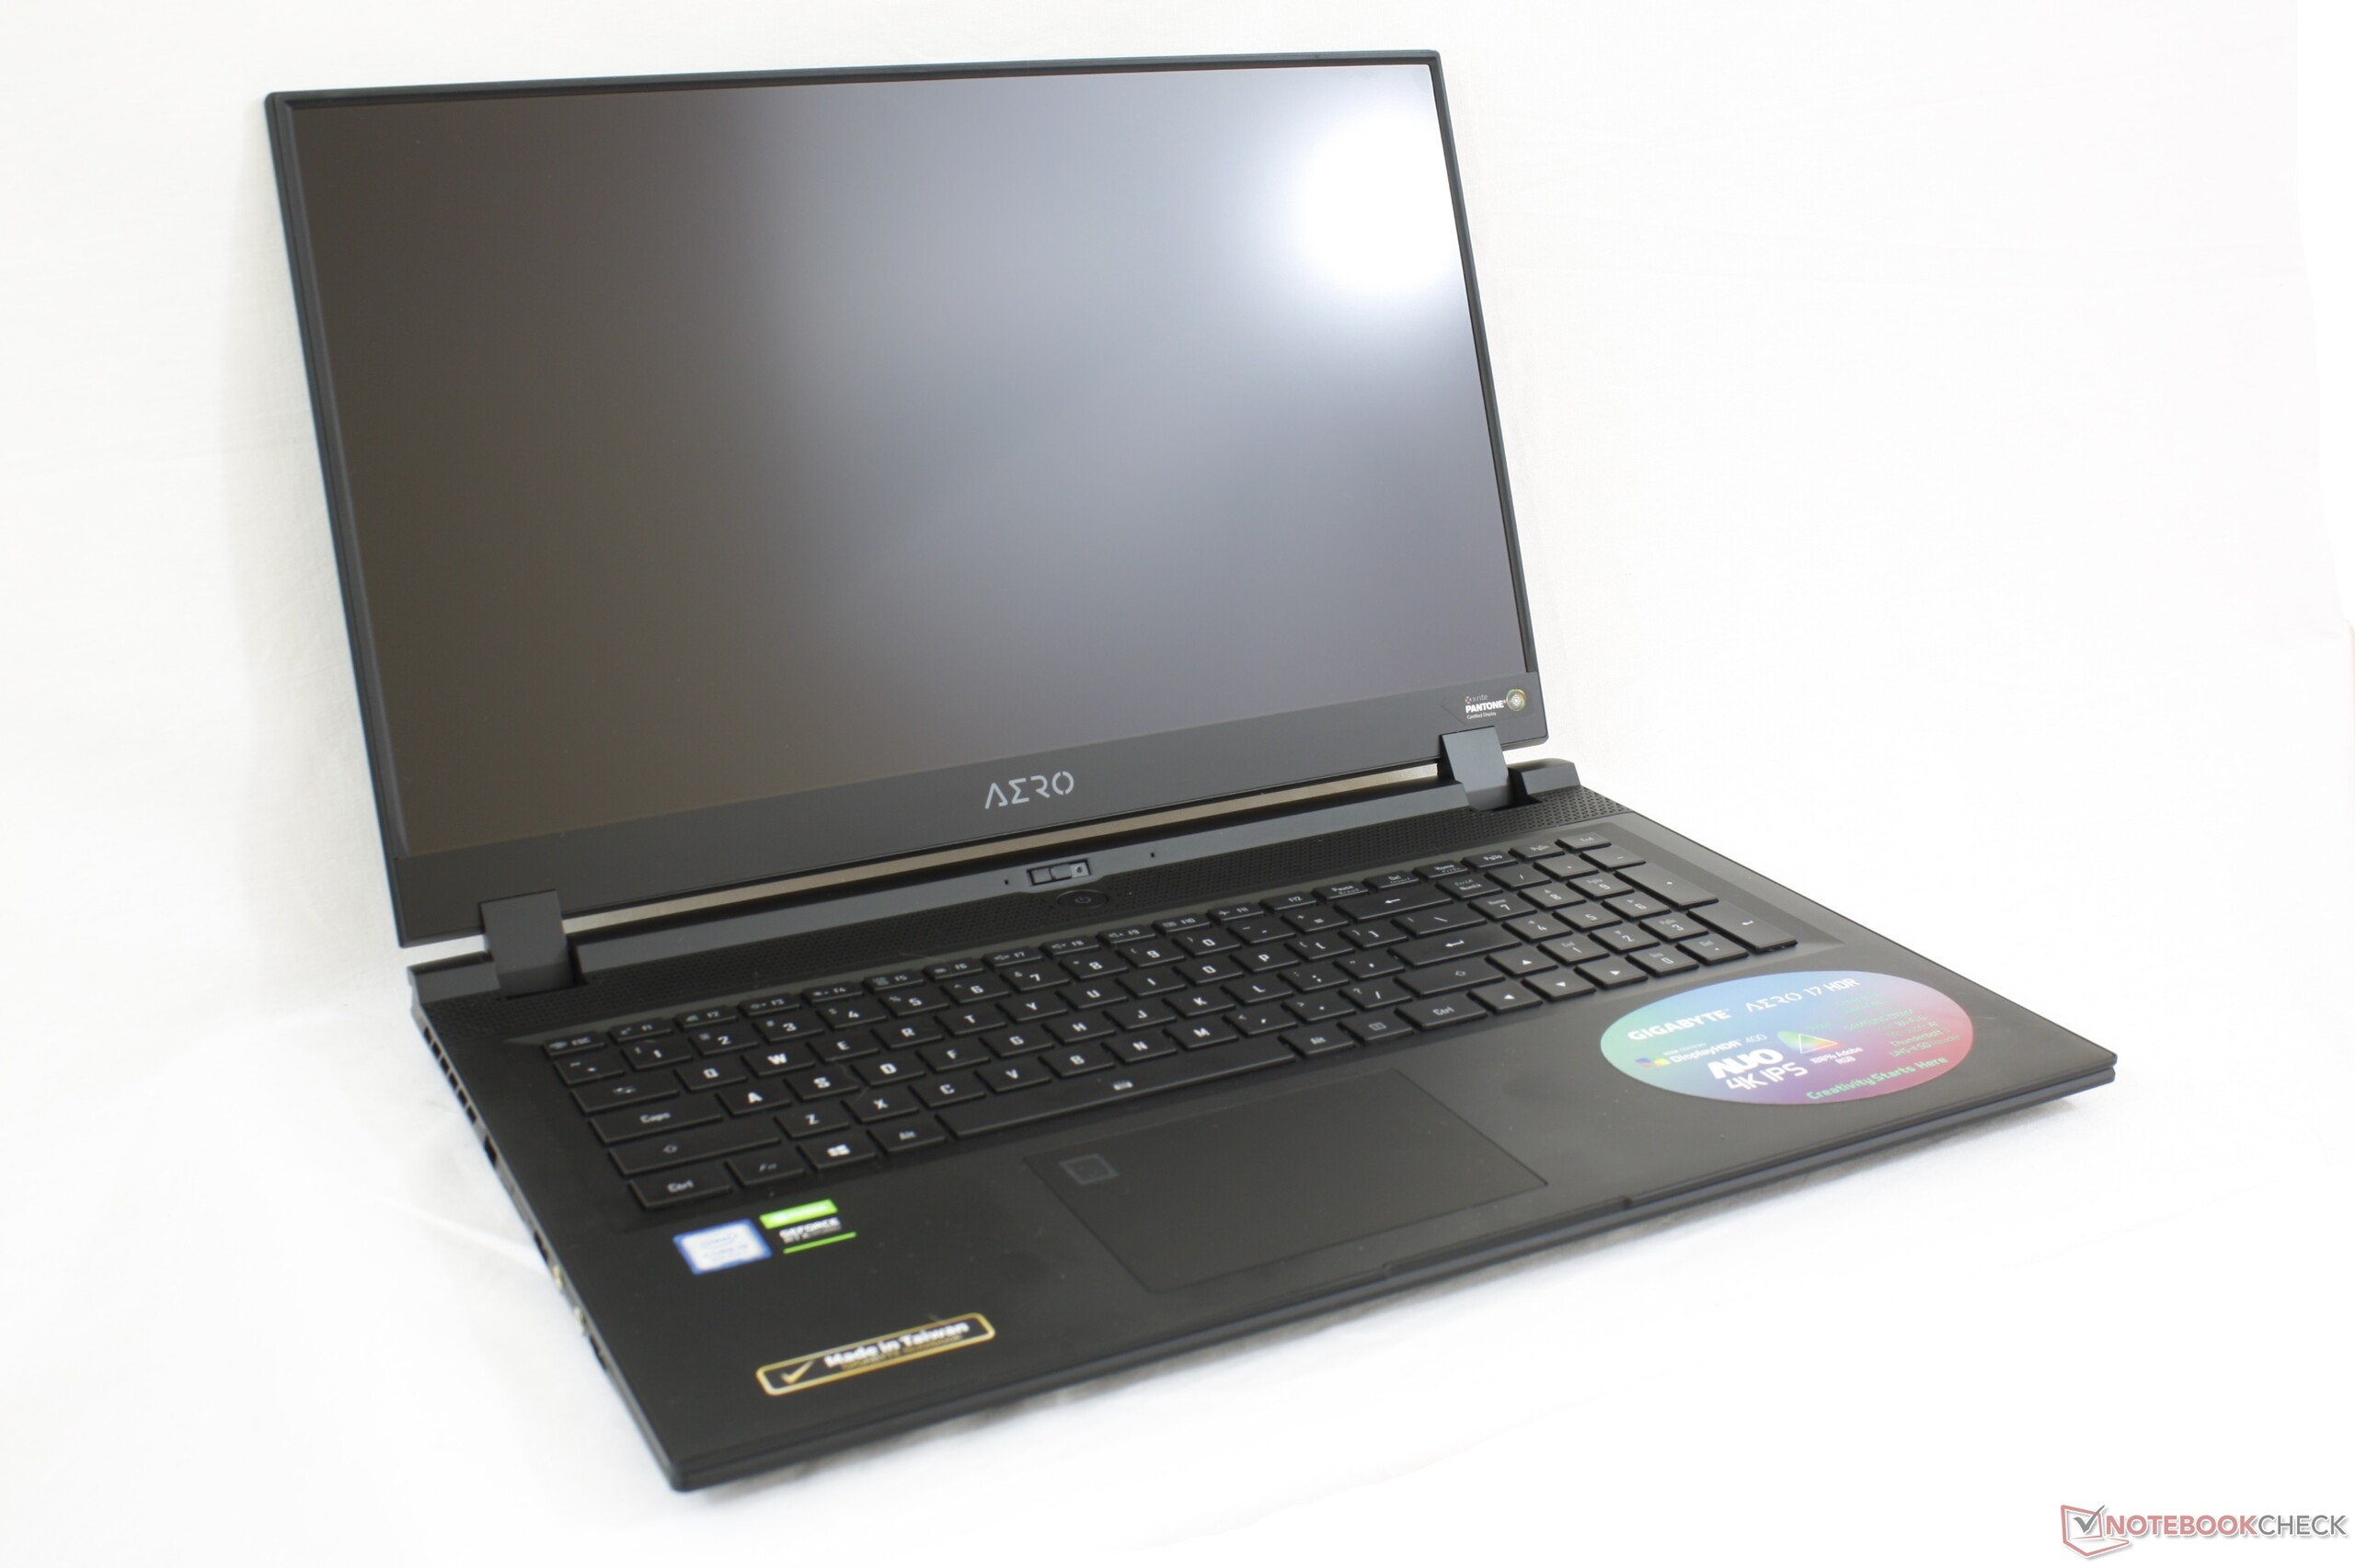
技嘉Aero 17 XA HDR笔记本电脑评测:这笔记本实在是好
| SD Card Reader | |
| average JPG Copy Test (av. of 3 runs) | |
| Gigabyte Aero 17 XA RP77 (Toshiba Exceria Pro SDXC 64 GB UHS-II) | |
| Aorus X7 DT v8 (Toshiba Exceria Pro SDXC 64 GB UHS-II) | |
| Razer Blade Pro 17 RTX 2080 Max-Q (Toshiba Exceria Pro SDXC 64 GB UHS-II) | |
| MSI GS73 Stealth 8RF-011 (Toshiba Exceria Pro SDXC 64 GB UHS-II) | |
| Dell Inspiron 7390 2-in-1 (Toshiba Exceria Pro M501 UHS-II) | |
| maximum AS SSD Seq Read Test (1GB) | |
| Aorus X7 DT v8 (Toshiba Exceria Pro SDXC 64 GB UHS-II) | |
| Gigabyte Aero 17 XA RP77 (Toshiba Exceria Pro SDXC 64 GB UHS-II) | |
| MSI GS73 Stealth 8RF-011 (Toshiba Exceria Pro SDXC 64 GB UHS-II) | |
| Razer Blade Pro 17 RTX 2080 Max-Q (Toshiba Exceria Pro SDXC 64 GB UHS-II) | |
| Dell Inspiron 7390 2-in-1 (Toshiba Exceria Pro M501 UHS-II) | |
| |||||||||||||||||||||||||
Brightness Distribution: 90 %
Center on Battery: 667.3 cd/m²
Contrast: 1451:1 (Black: 0.46 cd/m²)
ΔE ColorChecker Calman: 3.53 | ∀{0.5-29.43 Ø4.73}
calibrated: 3.79
ΔE Greyscale Calman: 0.9 | ∀{0.09-98 Ø4.97}
100% sRGB (Argyll 1.6.3 3D)
87.1% AdobeRGB 1998 (Argyll 1.6.3 3D)
99.5% AdobeRGB 1998 (Argyll 3D)
100% sRGB (Argyll 3D)
86.8% Display P3 (Argyll 3D)
Gamma: 2.17
CCT: 6533 K
| Gigabyte Aero 17 XA RP77 AU Optronics B173ZAN03.2, IPS, 17.3", 3840x2160 | Razer Blade Pro 17 RTX 2080 Max-Q AU Optronics B173HAN04.0, IPS, 17.3", 1920x1080 | Aorus X7 DT v8 AU Optronics B173HAN03.0 (AUO309D), IPS, 17.3", 1920x1080 | Alienware m17 P37E AU Optronics B173ZAN01.0, IPS, 17.3", 3840x2160 | Asus Zephyrus S GX701GX B173HAN04.0 (AUO409D), IPS, 17.3", 1920x1080 | Asus Strix Hero III G731GV AU Optronics AUO B173HAN04.0, IPS, 17.3", 1920x1080 | |
|---|---|---|---|---|---|---|
| Display | -26% | -22% | 0% | -25% | -26% | |
| Display P3 Coverage (%) | 86.8 | 60.6 -30% | 65.3 -25% | 86.4 0% | 62.9 -28% | 62.9 -28% |
| sRGB Coverage (%) | 100 | 89 -11% | 91.2 -9% | 99.9 0% | 87.8 -12% | 87.2 -13% |
| AdobeRGB 1998 Coverage (%) | 99.5 | 62.1 -38% | 66.3 -33% | 99.1 0% | 63.9 -36% | 63.8 -36% |
| Response Times | 77% | 61% | 15% | 76% | 73% | |
| Response Time Grey 50% / Grey 80% * (ms) | 45.6 ? | 6.8 ? 85% | 18 ? 61% | 35.6 ? 22% | 7.2 ? 84% | 6.8 ? 85% |
| Response Time Black / White * (ms) | 30.4 ? | 9.6 ? 68% | 12 ? 61% | 28 ? 8% | 9.6 ? 68% | 12 ? 61% |
| PWM Frequency (Hz) | ||||||
| Screen | -32% | -10% | -61% | -4% | -31% | |
| Brightness middle (cd/m²) | 667.3 | 299.3 -55% | 297 -55% | 357.9 -46% | 288 -57% | 312.3 -53% |
| Brightness (cd/m²) | 633 | 294 -54% | 281 -56% | 347 -45% | 287 -55% | 297 -53% |
| Brightness Distribution (%) | 90 | 94 4% | 84 -7% | 94 4% | 91 1% | 91 1% |
| Black Level * (cd/m²) | 0.46 | 0.29 37% | 0.23 50% | 0.33 28% | 0.2 57% | 0.21 54% |
| Contrast (:1) | 1451 | 1032 -29% | 1291 -11% | 1085 -25% | 1440 -1% | 1487 2% |
| Colorchecker dE 2000 * | 3.53 | 2.55 28% | 2.19 38% | 6.57 -86% | 2.33 34% | 3.6 -2% |
| Colorchecker dE 2000 max. * | 6.88 | 4.73 31% | 4.81 30% | 9.86 -43% | 5.34 22% | 6.74 2% |
| Colorchecker dE 2000 calibrated * | 3.79 | 2.9 23% | 6.74 -78% | 2.47 35% | 3.95 -4% | |
| Greyscale dE 2000 * | 0.9 | 3.5 -289% | 1.31 -46% | 4.3 -378% | 1.19 -32% | 3.1 -244% |
| Gamma | 2.17 101% | 2.28 96% | 2.42 91% | 2.6 85% | 2.41 91% | 2.26 97% |
| CCT | 6533 99% | 7101 92% | 6464 101% | 6403 102% | 6710 97% | 7002 93% |
| Color Space (Percent of AdobeRGB 1998) (%) | 87.1 | 57 -35% | 59 -32% | 88.4 1% | 57 -35% | 56.6 -35% |
| Color Space (Percent of sRGB) (%) | 100 | 88.7 -11% | 91 -9% | 100 0% | 88 -12% | 86.6 -13% |
| Total Average (Program / Settings) | 6% /
-17% | 10% /
-3% | -15% /
-40% | 16% /
2% | 5% /
-17% |
* ... smaller is better
Display Response Times
| ↔ Response Time Black to White | ||
|---|---|---|
| 30.4 ms ... rise ↗ and fall ↘ combined | ↗ 16.4 ms rise | 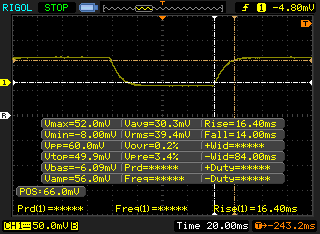 |
| ↘ 14 ms fall | ||
| The screen shows slow response rates in our tests and will be unsatisfactory for gamers. In comparison, all tested devices range from 0.1 (minimum) to 240 (maximum) ms. » 82 % of all devices are better. This means that the measured response time is worse than the average of all tested devices (19.9 ms). | ||
| ↔ Response Time 50% Grey to 80% Grey | ||
| 45.6 ms ... rise ↗ and fall ↘ combined | ↗ 24.4 ms rise | 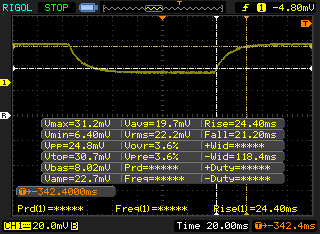 |
| ↘ 21.2 ms fall | ||
| The screen shows slow response rates in our tests and will be unsatisfactory for gamers. In comparison, all tested devices range from 0.165 (minimum) to 636 (maximum) ms. » 78 % of all devices are better. This means that the measured response time is worse than the average of all tested devices (31.1 ms). | ||
Screen Flickering / PWM (Pulse-Width Modulation)
| Screen flickering / PWM not detected | 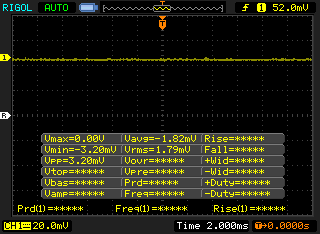 | ||
In comparison: 52 % of all tested devices do not use PWM to dim the display. If PWM was detected, an average of 7791 (minimum: 5 - maximum: 343500) Hz was measured. | |||
| Cinebench R15 | |
| CPU Single 64Bit | |
| Schenker XMG Ultra 15 Turing | |
| Eurocom Nightsky RX15 | |
| Gigabyte Aero 17 XA RP77 | |
| Average Intel Core i9-9980HK (181 - 215, n=13) | |
| Alienware m17 P37E | |
| MSI GE75 9SG | |
| Aorus X7 DT v8 | |
| Dell Inspiron 7390 2-in-1 | |
| Asus Strix Hero III G731GV | |
| MSI GS73 Stealth 8RF-011 | |
| Asus ROG Zephyrus G15 GA502DU | |
| CPU Multi 64Bit | |
| Eurocom Nightsky RX15 | |
| MSI GE75 9SG | |
| Average Intel Core i9-9980HK (1327 - 1930, n=14) | |
| Gigabyte Aero 17 XA RP77 | |
| Schenker XMG Ultra 15 Turing | |
| Aorus X7 DT v8 | |
| Alienware m17 P37E | |
| Asus Strix Hero III G731GV | |
| MSI GS73 Stealth 8RF-011 | |
| Asus ROG Zephyrus G15 GA502DU | |
| Dell Inspiron 7390 2-in-1 | |
| PCMark 10 | |
| Score | |
| Eurocom Sky X7C i9-9900K | |
| Gigabyte Aero 17 XA RP77 | |
| Razer Blade Pro 17 RTX 2080 Max-Q | |
| Alienware m17 P37E | |
| Asus Strix Hero III G731GV | |
| Aorus X7 DT v8 | |
| Essentials | |
| Eurocom Sky X7C i9-9900K | |
| Gigabyte Aero 17 XA RP77 | |
| Razer Blade Pro 17 RTX 2080 Max-Q | |
| Aorus X7 DT v8 | |
| Asus Strix Hero III G731GV | |
| Alienware m17 P37E | |
| Productivity | |
| Eurocom Sky X7C i9-9900K | |
| Gigabyte Aero 17 XA RP77 | |
| Alienware m17 P37E | |
| Asus Strix Hero III G731GV | |
| Razer Blade Pro 17 RTX 2080 Max-Q | |
| Aorus X7 DT v8 | |
| Digital Content Creation | |
| Eurocom Sky X7C i9-9900K | |
| Gigabyte Aero 17 XA RP77 | |
| Alienware m17 P37E | |
| Razer Blade Pro 17 RTX 2080 Max-Q | |
| Asus Strix Hero III G731GV | |
| Aorus X7 DT v8 | |
| PCMark 8 | |
| Home Score Accelerated v2 | |
| Aorus X7 DT v8 | |
| Eurocom Sky X7C i9-9900K | |
| Razer Blade Pro 17 RTX 2080 Max-Q | |
| Asus Strix Hero III G731GV | |
| Gigabyte Aero 17 XA RP77 | |
| Alienware m17 P37E | |
| Work Score Accelerated v2 | |
| Eurocom Sky X7C i9-9900K | |
| Razer Blade Pro 17 RTX 2080 Max-Q | |
| Asus Strix Hero III G731GV | |
| Alienware m17 P37E | |
| Gigabyte Aero 17 XA RP77 | |
| PCMark 8 Home Score Accelerated v2 | 3841 points | |
| PCMark 8 Work Score Accelerated v2 | 4668 points | |
| PCMark 10 Score | 5955 points | |
Help | ||
| Gigabyte Aero 17 XA RP77 Intel SSD 760p SSDPEKKW512G8 | Razer Blade Pro 17 RTX 2080 Max-Q Samsung SSD PM981 MZVLB512HAJQ | Aorus X7 DT v8 Toshiba NVMe THNSN5512GPU7 | Alienware m17 P37E SK Hynix PC401 512GB M.2 (HFS512GD9TNG) | Asus Zephyrus S GX701GX Samsung SSD PM981 MZVLB1T0HALR | Asus Strix Hero III G731GV Intel SSD 660p SSDPEKNW512G8 | |
|---|---|---|---|---|---|---|
| AS SSD | 66% | 8% | 9% | 91% | 0% | |
| Seq Read (MB/s) | 1812 | 1831 1% | 2182 20% | 1835 1% | 911 -50% | 940 -48% |
| Seq Write (MB/s) | 1512 | 1744 15% | 1342 -11% | 1121 -26% | 2347 55% | 921 -39% |
| 4K Read (MB/s) | 32.68 | 45.16 38% | 23.28 -29% | 23.98 -27% | 53 62% | 48.05 47% |
| 4K Write (MB/s) | 107.7 | 107.1 -1% | 89.9 -17% | 100 -7% | 122.5 14% | 104.3 -3% |
| 4K-64 Read (MB/s) | 504 | 1240 146% | 817 62% | 687 36% | 1577 213% | 320.1 -36% |
| 4K-64 Write (MB/s) | 534 | 1695 217% | 757 42% | 776 45% | 1734 225% | 703 32% |
| Access Time Read * (ms) | 0.05 | 0.064 -28% | 0.136 -172% | 0.047 6% | 0.08 -60% | 0.079 -58% |
| Access Time Write * (ms) | 0.227 | 0.037 84% | 0.044 81% | 0.053 77% | 0.031 86% | 0.046 80% |
| Score Read (Points) | 718 | 1468 104% | 1058 47% | 895 25% | 1721 140% | 462 -36% |
| Score Write (Points) | 793 | 1977 149% | 981 24% | 988 25% | 2091 164% | 900 13% |
| Score Total (Points) | 1871 | 4197 124% | 2539 36% | 2306 23% | 4771 155% | 1616 -14% |
| Copy ISO MB/s (MB/s) | 946 | 2086 121% | 773 -18% | 1416 50% | ||
| Copy Program MB/s (MB/s) | 414.3 | 425.5 3% | 493 19% | 569 37% | ||
| Copy Game MB/s (MB/s) | 1263 | 555 -56% | 647 -49% | 971 -23% |
* ... smaller is better

| 3DMark | |
| 1920x1080 Fire Strike Graphics | |
| MSI GE75 9SG | |
| Zotac GeForce RTX 2070 AMP Extreme | |
| Razer Blade Pro 17 RTX 2080 Max-Q | |
| Aorus X7 DT v8 | |
| Asus ASUS ROG Strix SCAR III G731GW-XB74 | |
| Alienware 17 R5 | |
| Average NVIDIA GeForce RTX 2070 Max-Q (11563 - 21191, n=31) | |
| Gigabyte Aero 17 XA RP77 | |
| Asus Strix Hero III G731GV | |
| Asus ROG Zephyrus G15 GA502DU | |
| Asus Zephyrus S GX531GM | |
| HP Omen 15-dc1020ng | |
| 2560x1440 Time Spy Graphics | |
| MSI GE75 9SG | |
| Zotac GeForce RTX 2070 AMP Extreme | |
| Razer Blade Pro 17 RTX 2080 Max-Q | |
| Asus ASUS ROG Strix SCAR III G731GW-XB74 | |
| Average NVIDIA GeForce RTX 2070 Max-Q (5948 - 8065, n=28) | |
| Gigabyte Aero 17 XA RP77 | |
| Asus Strix Hero III G731GV | |
| Alienware 17 R5 | |
| Asus ROG Zephyrus G15 GA502DU | |
| Asus Zephyrus S GX531GM | |
| HP Omen 15-dc1020ng | |
| 2560x1440 Port Royal Graphics | |
| MSI GE75 9SG | |
| Razer Blade Pro 17 RTX 2080 Max-Q | |
| Average NVIDIA GeForce RTX 2070 Max-Q (3240 - 4742, n=23) | |
| Gigabyte Aero 17 XA RP77 | |
| Asus Strix Hero III G731GV | |
| 3DMark 11 | |
| 1280x720 Performance GPU | |
| MSI GE75 9SG | |
| Razer Blade Pro 17 RTX 2080 Max-Q | |
| Zotac GeForce RTX 2070 AMP Extreme | |
| Aorus X7 DT v8 | |
| Asus ASUS ROG Strix SCAR III G731GW-XB74 | |
| Alienware 17 R5 | |
| Average NVIDIA GeForce RTX 2070 Max-Q (14723 - 27694, n=31) | |
| Gigabyte Aero 17 XA RP77 | |
| Asus Strix Hero III G731GV | |
| Asus ROG Zephyrus G15 GA502DU | |
| HP Omen 15-dc1020ng | |
| Asus Zephyrus S GX531GM | |
| 1280x720 Performance Combined | |
| MSI GE75 9SG | |
| Gigabyte Aero 17 XA RP77 | |
| Zotac GeForce RTX 2070 AMP Extreme | |
| Average NVIDIA GeForce RTX 2070 Max-Q (9107 - 17603, n=30) | |
| Asus Strix Hero III G731GV | |
| Razer Blade Pro 17 RTX 2080 Max-Q | |
| Aorus X7 DT v8 | |
| Alienware 17 R5 | |
| Asus ASUS ROG Strix SCAR III G731GW-XB74 | |
| HP Omen 15-dc1020ng | |
| Asus Zephyrus S GX531GM | |
| Asus ROG Zephyrus G15 GA502DU | |
| 3DMark 11 Performance | 19651 points | |
| 3DMark Cloud Gate Standard Score | 28855 points | |
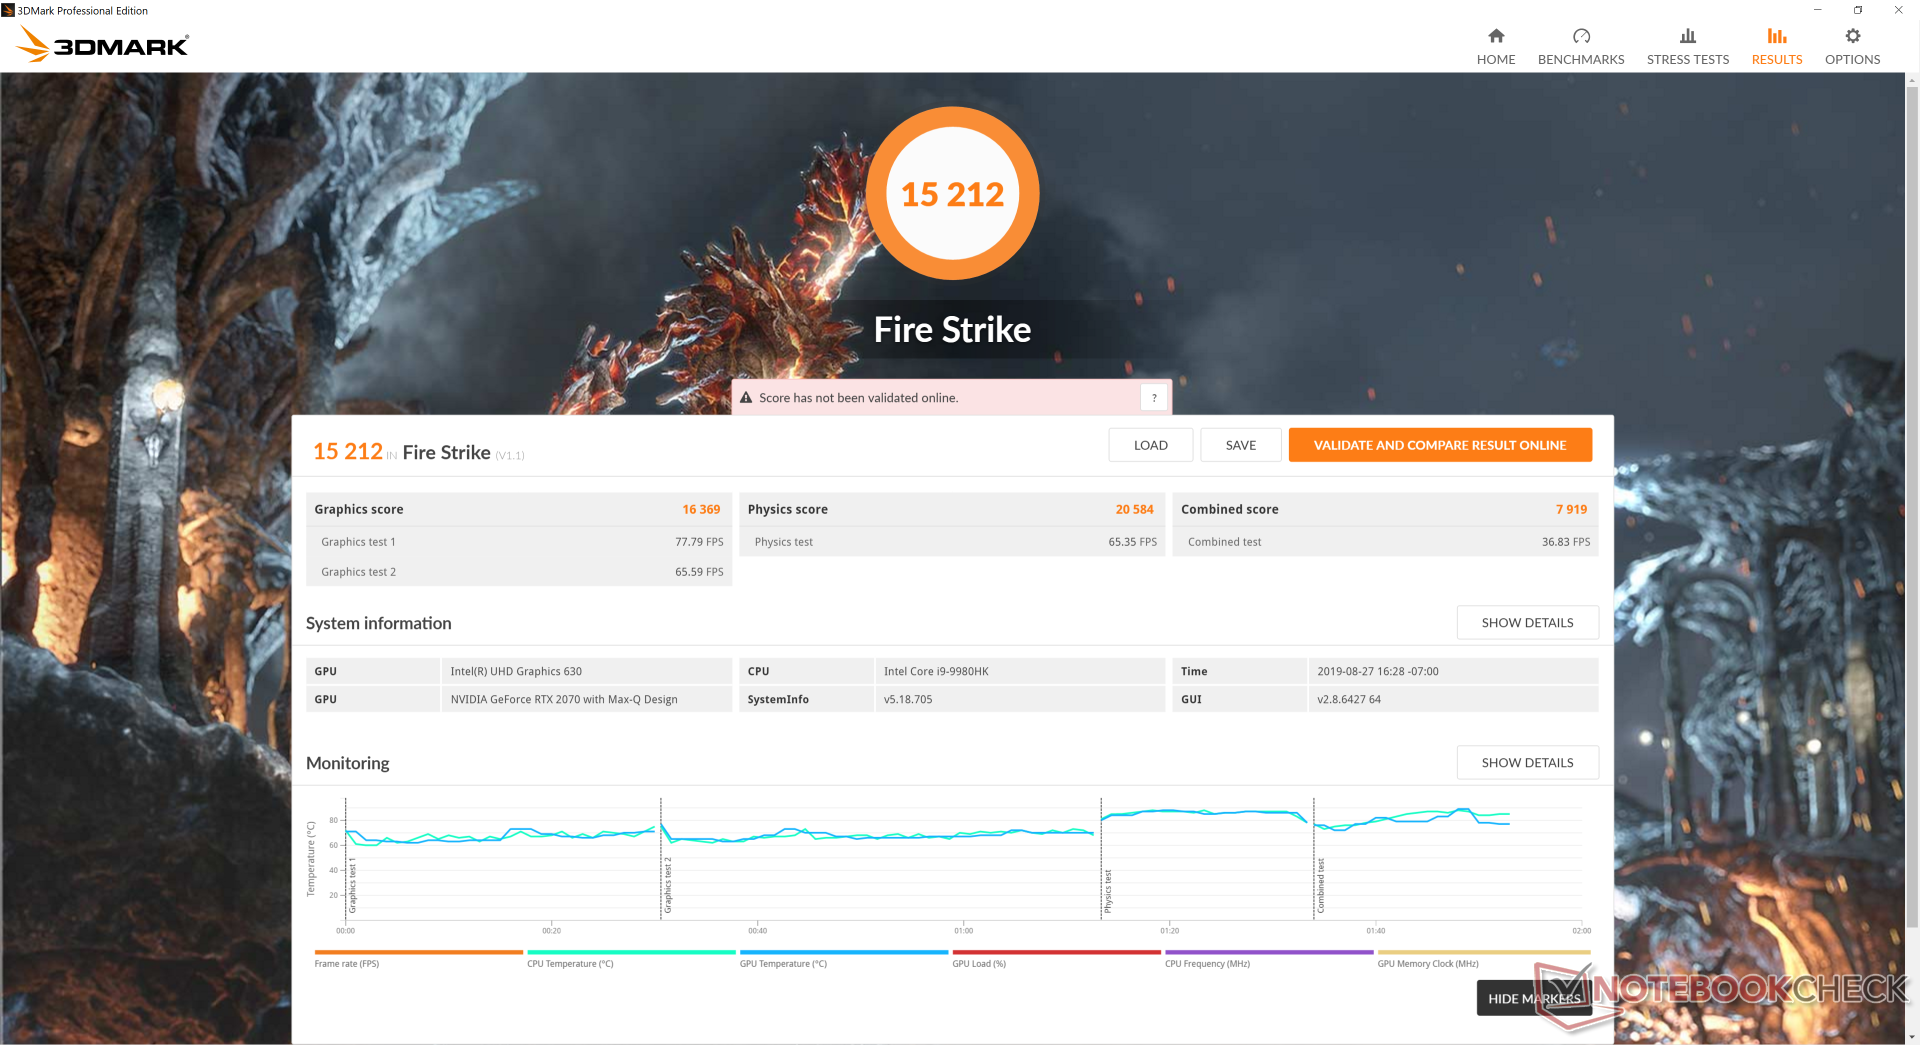
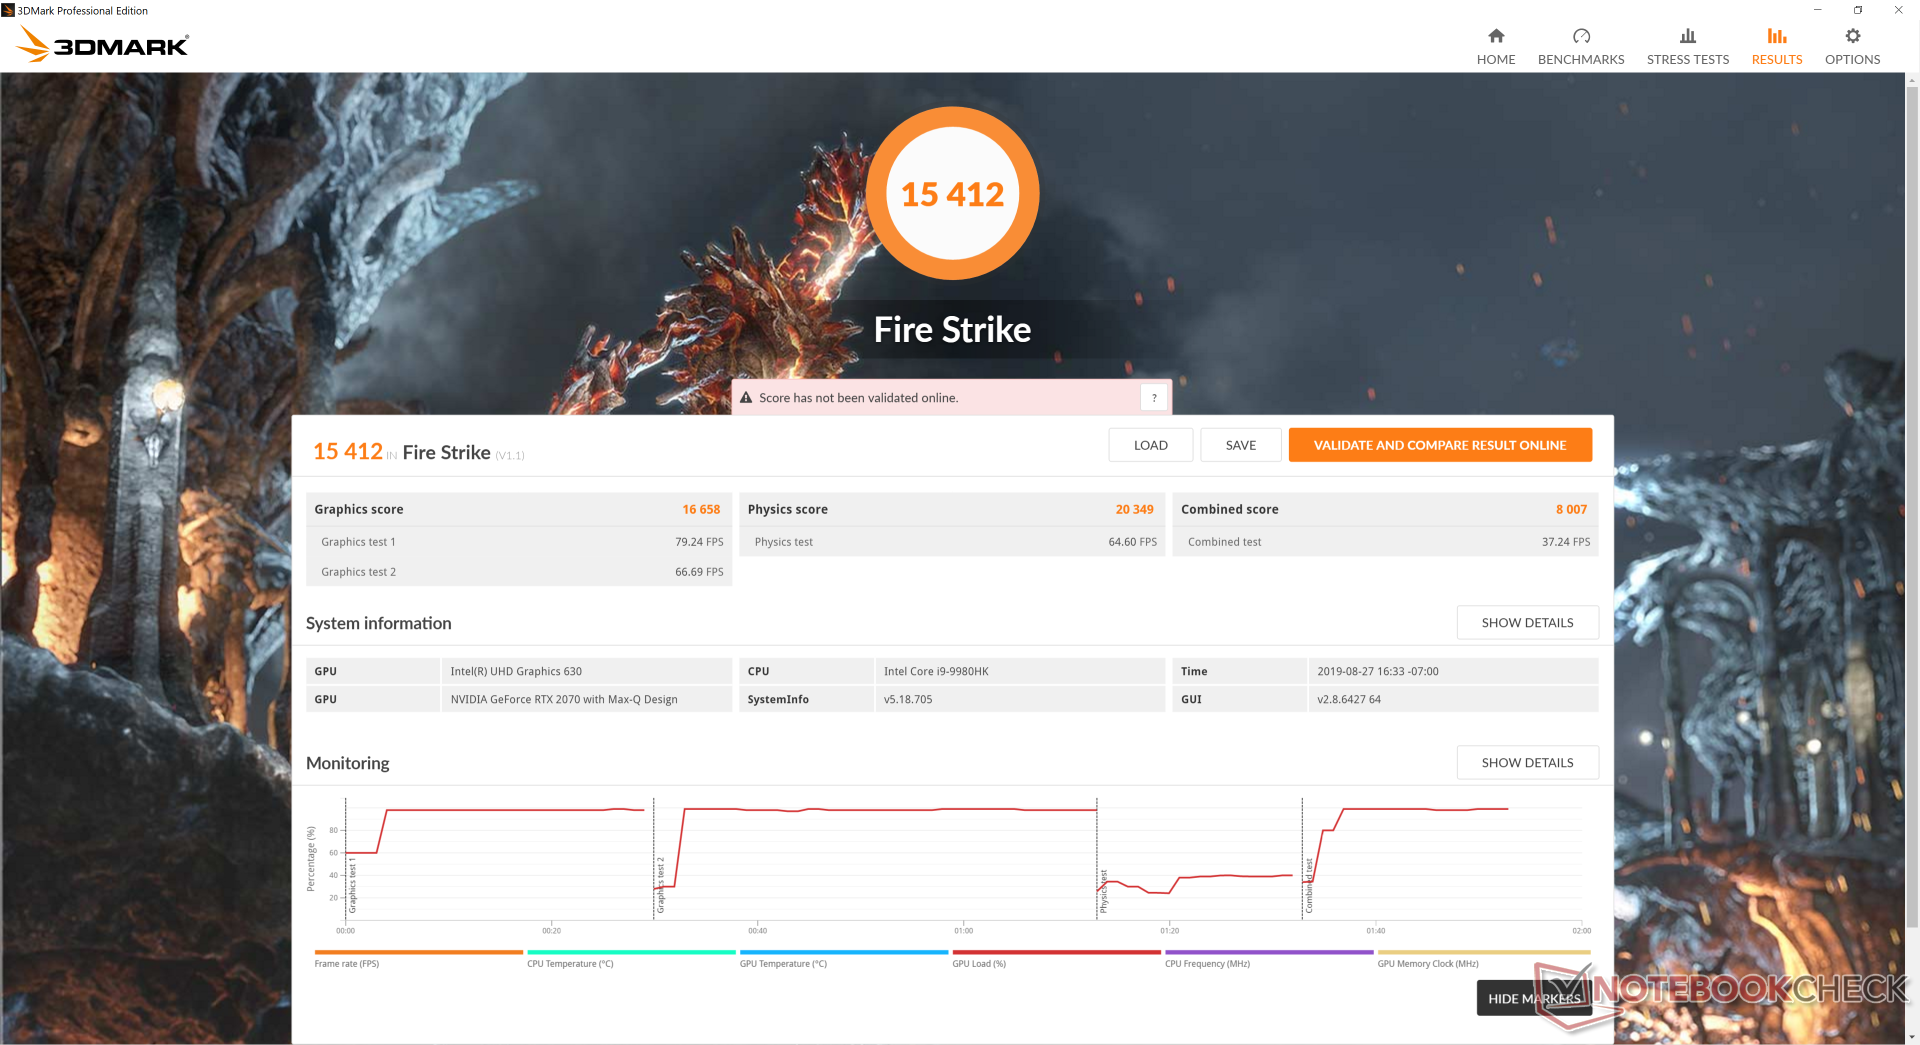
| 3DMark Fire Strike Score | 15412 points | |
| 3DMark Time Spy Score | 6722 points | |
Help | ||
| Shadow of the Tomb Raider - 1920x1080 Highest Preset AA:T | |
| MSI RTX 2080 Gaming X Trio | |
| MSI RTX 2070 Gaming Z 8G | |
| Origin PC EVO16-S i7-9750H RTX 2080 Max-Q | |
| Average NVIDIA GeForce RTX 2070 Max-Q (57 - 89, n=12) | |
| Gigabyte Aero 17 XA RP77 | |
| Eurocom Nightsky Ti15 | |
| Asus Strix Hero III G731GV | |
| Asus Zephyrus S GX531GS | |
| MSI GF75 Thin 9SC | |
| Asus G752VY | |
| The Witcher 3 - 1920x1080 Ultra Graphics & Postprocessing (HBAO+) | |
| MSI RTX 2080 Gaming X Trio | |
| MSI RTX 2070 Gaming Z 8G | |
| Origin PC EVO16-S i7-9750H RTX 2080 Max-Q | |
| Gigabyte Aero 17 XA RP77 | |
| Average NVIDIA GeForce RTX 2070 Max-Q (56 - 83.8, n=31) | |
| Eurocom Nightsky Ti15 | |
| Asus Strix Hero III G731GV | |
| Asus Zephyrus S GX531GS | |
| MSI GF75 Thin 9SC | |
| low | med. | high | ultra | 4K | |
|---|---|---|---|---|---|
| BioShock Infinite (2013) | 353.5 | 315.2 | 290.2 | 155.7 | |
| The Witcher 3 (2015) | 285.7 | 212.1 | 131.6 | 66.5 | 46.9 |
| Shadow of the Tomb Raider (2018) | 137 | 99 | 89 | 79 | 28 |
| Gigabyte Aero 17 XA RP77 GeForce RTX 2070 Max-Q, i9-9980HK, Intel SSD 760p SSDPEKKW512G8 | Razer Blade Pro 17 RTX 2080 Max-Q GeForce RTX 2080 Max-Q, i7-9750H, Samsung SSD PM981 MZVLB512HAJQ | Aorus X7 DT v8 GeForce GTX 1080 Mobile, i7-8850H, Toshiba NVMe THNSN5512GPU7 | Alienware m17 P37E GeForce RTX 2080 Max-Q, i9-8950HK, SK Hynix PC401 512GB M.2 (HFS512GD9TNG) | Asus Zephyrus S GX701GX GeForce RTX 2080 Max-Q, i7-8750H, Samsung SSD PM981 MZVLB1T0HALR | Asus Strix Hero III G731GV GeForce RTX 2060 Mobile, i7-9750H, Intel SSD 660p SSDPEKNW512G8 | |
|---|---|---|---|---|---|---|
| Noise | 5% | -8% | 2% | 0% | 1% | |
| off / environment * (dB) | 29.3 | 28.2 4% | 29 1% | 28.2 4% | 29 1% | 28.2 4% |
| Idle Minimum * (dB) | 33 | 28.2 15% | 35 -6% | 28.2 15% | 29 12% | 29.5 11% |
| Idle Average * (dB) | 33 | 28.2 15% | 36 -9% | 28.2 15% | 32 3% | 30.3 8% |
| Idle Maximum * (dB) | 33 | 30.8 7% | 41 -24% | 31 6% | 33 -0% | 31.9 3% |
| Load Average * (dB) | 42.5 | 42 1% | 43 -1% | 50.8 -20% | 47 -11% | 50.4 -19% |
| Witcher 3 ultra * (dB) | 42 | 51 -21% | 53 -26% | 50.8 -21% | 49 -17% | 50.1 -19% |
| Load Maximum * (dB) | 59.6 | 53 11% | 54 9% | 50.8 15% | 51 14% | 50.1 16% |
* ... smaller is better
Noise level
| Idle |
| 33 / 33 / 33 dB(A) |
| Load |
| 42.5 / 59.6 dB(A) |
 | ||
30 dB silent 40 dB(A) audible 50 dB(A) loud |
||
min: | ||
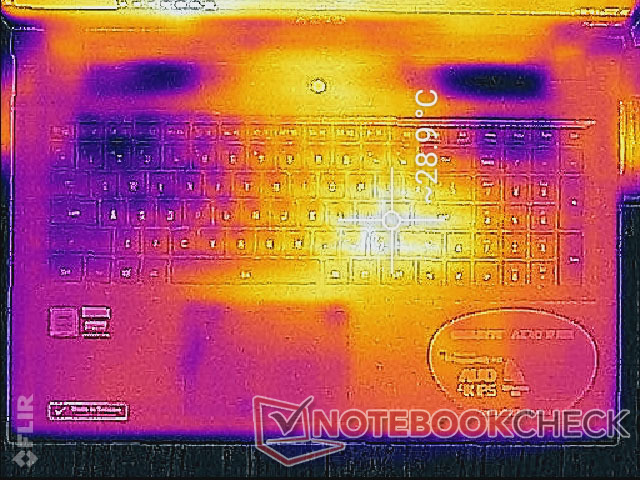
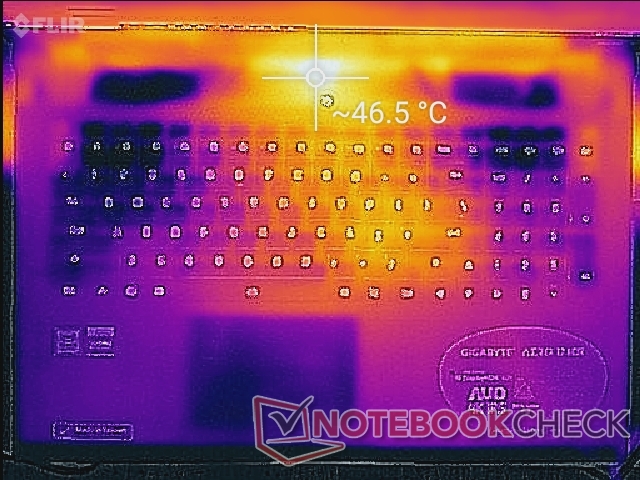
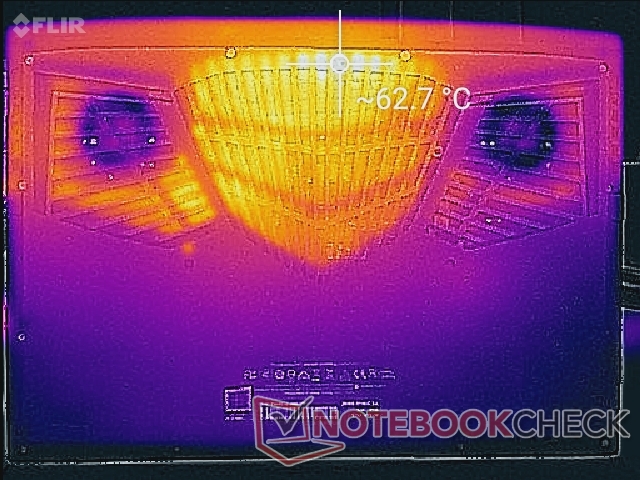
(-) The maximum temperature on the upper side is 46.8 °C / 116 F, compared to the average of 40.4 °C / 105 F, ranging from 21.2 to 68.8 °C for the class Gaming.
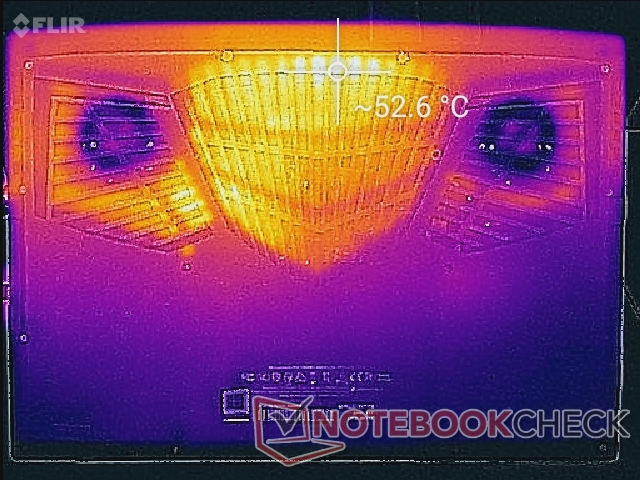
(-) The bottom heats up to a maximum of 62.2 °C / 144 F, compared to the average of 43.2 °C / 110 F
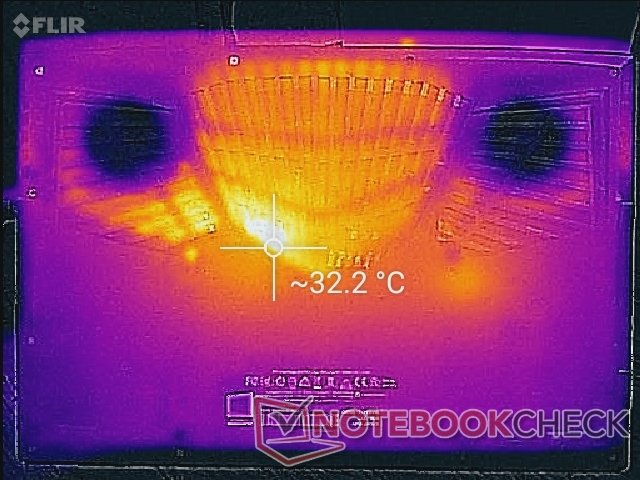
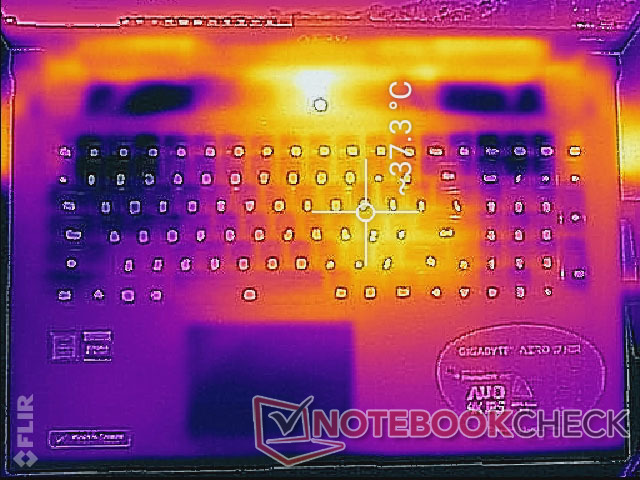
(+) In idle usage, the average temperature for the upper side is 26.5 °C / 80 F, compared to the device average of 33.9 °C / 93 F.
(±) Playing The Witcher 3, the average temperature for the upper side is 32.6 °C / 91 F, compared to the device average of 33.9 °C / 93 F.
(+) The palmrests and touchpad are cooler than skin temperature with a maximum of 30.2 °C / 86.4 F and are therefore cool to the touch.
(±) The average temperature of the palmrest area of similar devices was 28.8 °C / 83.8 F (-1.4 °C / -2.6 F).
| CPU Clock (GHz) | GPU Clock (MHz) | Average CPU Temperature (°C) | Average GPU Temperature (°C) | |
| System Idle | -- | -- | 35 | 35 |
| Prime95 Stress (Default fan) | 3.0 | -- | 68 | 54 |
| Prime95 Stress (Maximum fan) | 3.0 | -- | 56 | 43 |
| Prime95 + FurMark Stress (Maximum fan) | 3.3 | 1035 | 74 | 70 |
| Witcher 3 Stress (Default fan) | 4.5 | 1290 | 81 | 78 |
| Witcher 3 Stress (Maximum fan) | 4.5 | 1320 | 70 | 64 |
Gigabyte Aero 17 XA RP77 audio analysis
(±) | speaker loudness is average but good (75.9 dB)
Bass 100 - 315 Hz
(±) | reduced bass - on average 12.6% lower than median
(±) | linearity of bass is average (11.8% delta to prev. frequency)
Mids 400 - 2000 Hz
(+) | balanced mids - only 3.7% away from median
(±) | linearity of mids is average (8.6% delta to prev. frequency)
Highs 2 - 16 kHz
(+) | balanced highs - only 1.9% away from median
(+) | highs are linear (6.9% delta to prev. frequency)
Overall 100 - 16.000 Hz
(±) | linearity of overall sound is average (19.9% difference to median)
Compared to same class
» 70% of all tested devices in this class were better, 6% similar, 24% worse
» The best had a delta of 6%, average was 18%, worst was 132%
Compared to all devices tested
» 51% of all tested devices were better, 7% similar, 42% worse
» The best had a delta of 4%, average was 24%, worst was 134%
Apple MacBook 12 (Early 2016) 1.1 GHz audio analysis
(+) | speakers can play relatively loud (83.6 dB)
Bass 100 - 315 Hz
(±) | reduced bass - on average 11.3% lower than median
(±) | linearity of bass is average (14.2% delta to prev. frequency)
Mids 400 - 2000 Hz
(+) | balanced mids - only 2.4% away from median
(+) | mids are linear (5.5% delta to prev. frequency)
Highs 2 - 16 kHz
(+) | balanced highs - only 2% away from median
(+) | highs are linear (4.5% delta to prev. frequency)
Overall 100 - 16.000 Hz
(+) | overall sound is linear (10.2% difference to median)
Compared to same class
» 7% of all tested devices in this class were better, 2% similar, 91% worse
» The best had a delta of 5%, average was 18%, worst was 53%
Compared to all devices tested
» 5% of all tested devices were better, 1% similar, 94% worse
» The best had a delta of 4%, average was 24%, worst was 134%
| Off / Standby | |
| Idle | |
| Load |
|
Key:
min: | |
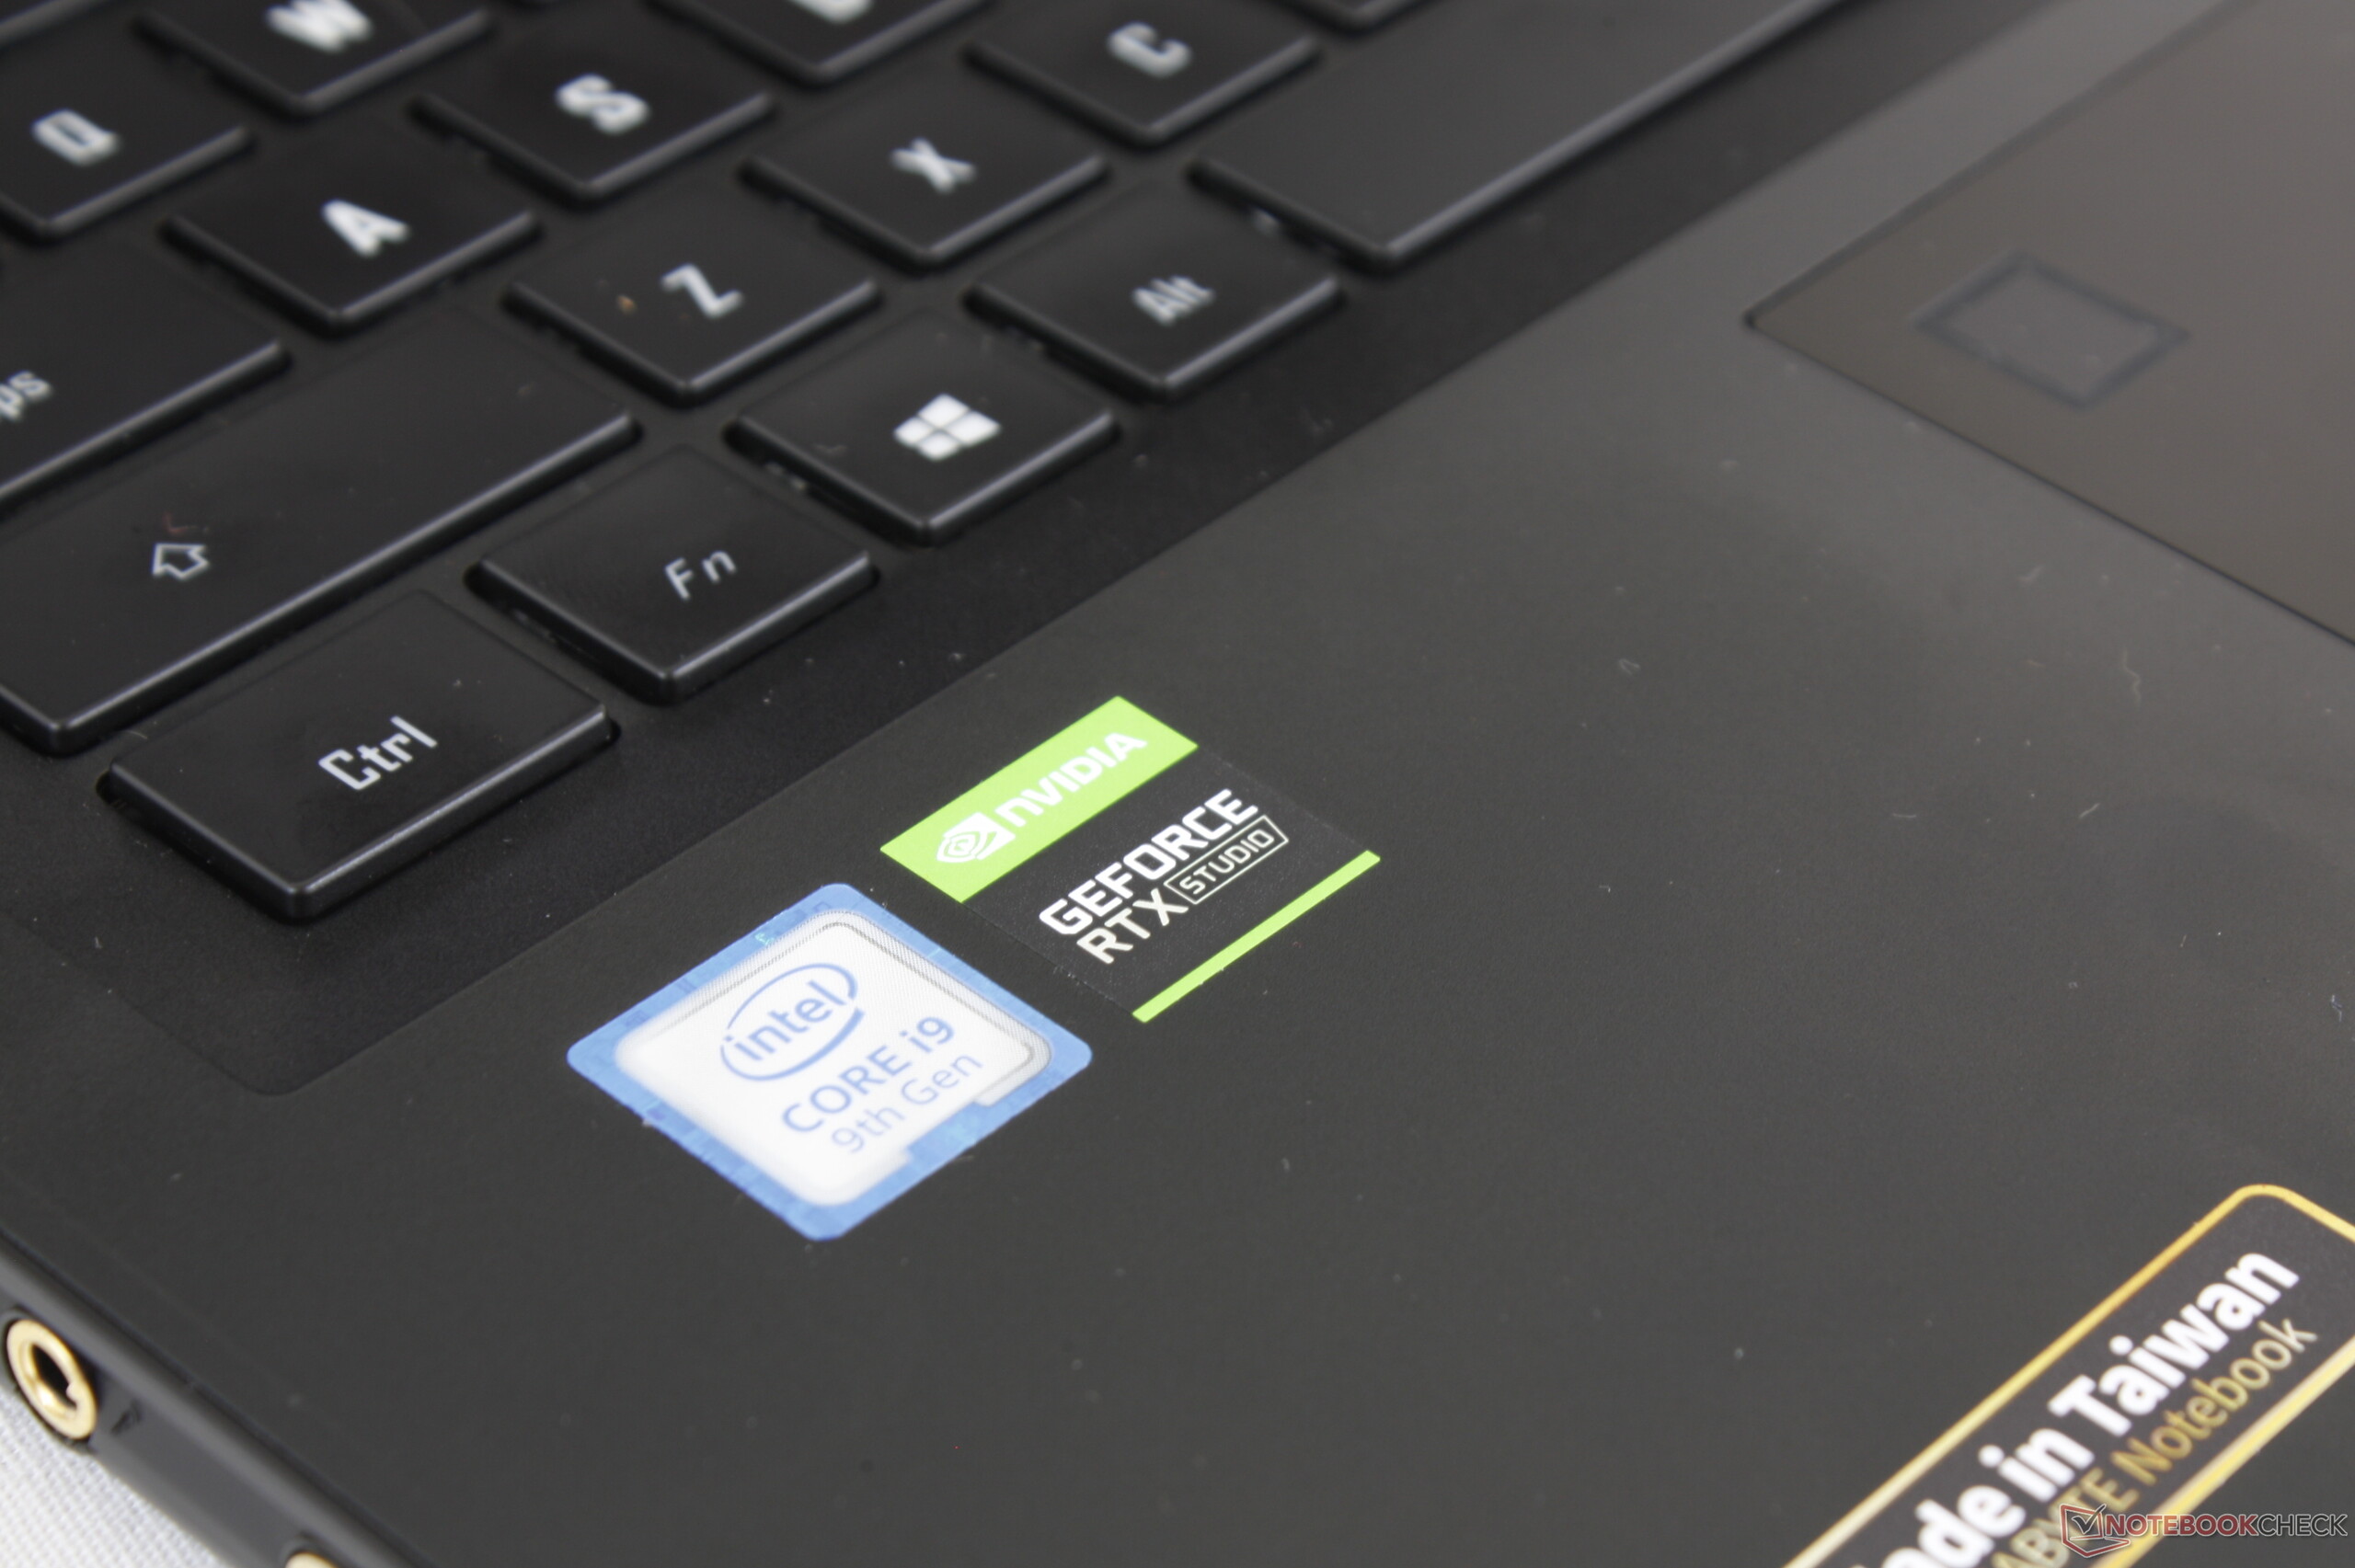
| Gigabyte Aero 17 XA RP77 i9-9980HK, GeForce RTX 2070 Max-Q, Intel SSD 760p SSDPEKKW512G8, IPS, 3840x2160, 17.3" | Razer Blade Pro 17 RTX 2080 Max-Q i7-9750H, GeForce RTX 2080 Max-Q, Samsung SSD PM981 MZVLB512HAJQ, IPS, 1920x1080, 17.3" | Aorus X7 DT v8 i7-8850H, GeForce GTX 1080 Mobile, Toshiba NVMe THNSN5512GPU7, IPS, 1920x1080, 17.3" | Asus Zephyrus S GX701GX i7-8750H, GeForce RTX 2080 Max-Q, Samsung SSD PM981 MZVLB1T0HALR, IPS, 1920x1080, 17.3" | Asus Strix Hero III G731GV i7-9750H, GeForce RTX 2060 Mobile, Intel SSD 660p SSDPEKNW512G8, IPS, 1920x1080, 17.3" | Asus ASUS ROG Strix SCAR III G731GW-XB74 i7-9750H, GeForce RTX 2070 Mobile, Intel SSD 660p 1TB SSDPEKNW010T8, IPS, 1920x1080, 17.3" | |
|---|---|---|---|---|---|---|
| Power Consumption | 7% | -26% | 2% | 3% | -7% | |
| Idle Minimum * (Watt) | 13.9 | 16.2 -17% | 23 -65% | 19 -37% | 16.2 -17% | 18.2 -31% |
| Idle Average * (Watt) | 24.3 | 20.4 16% | 33 -36% | 22 9% | 24.8 -2% | 23 5% |
| Idle Maximum * (Watt) | 35.5 | 26.1 26% | 37 -4% | 30 15% | 28.6 19% | 33.1 7% |
| Load Average * (Watt) | 127.6 | 96.5 24% | 115 10% | 104 18% | 127.6 -0% | 124.8 2% |
| Witcher 3 ultra * (Watt) | 158 | 182.9 -16% | 225 -42% | 167 -6% | 147.1 7% | 180.8 -14% |
| Load Maximum * (Watt) | 237.5 | 214.3 10% | 281 -18% | 203 15% | 212.7 10% | 263 -11% |
* ... smaller is better
| Gigabyte Aero 17 XA RP77 i9-9980HK, GeForce RTX 2070 Max-Q, 94.24 Wh | Razer Blade Pro 17 RTX 2080 Max-Q i7-9750H, GeForce RTX 2080 Max-Q, 70 Wh | Aorus X7 DT v8 i7-8850H, GeForce GTX 1080 Mobile, 94.24 Wh | Alienware m17 P37E i9-8950HK, GeForce RTX 2080 Max-Q, 90 Wh | Asus Zephyrus S GX701GX i7-8750H, GeForce RTX 2080 Max-Q, 76 Wh | Asus Strix Hero III G731GV i7-9750H, GeForce RTX 2060 Mobile, 66 Wh | |
|---|---|---|---|---|---|---|
| Battery runtime | -36% | -42% | -35% | -50% | -37% | |
| Reader / Idle (h) | 11.9 | 4.9 -59% | 4.9 -59% | 9.1 -24% | 5 -58% | |
| WiFi v1.3 (h) | 7.2 | 4.7 -35% | 3.8 -47% | 4.9 -32% | 3.8 -47% | 4.5 -37% |
| Load (h) | 1.6 | 1.4 -13% | 1.3 -19% | 0.8 -50% | 0.9 -44% |
Pros
Cons
总结
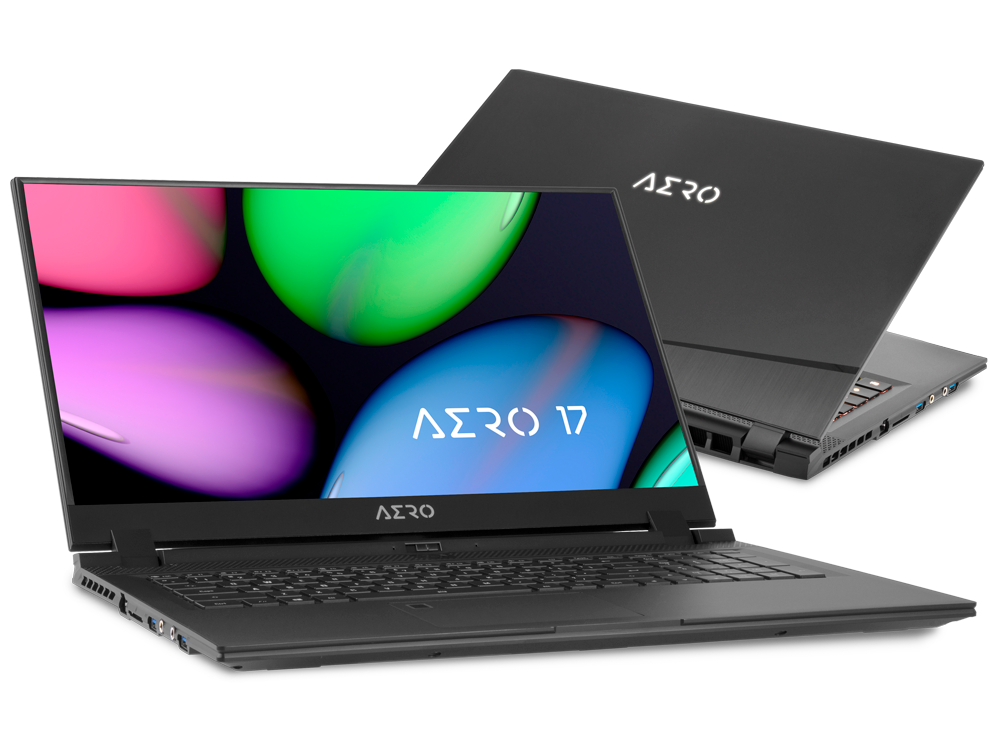

Aero 17使去年的Aorus X7 DT看起来彻底过时了。明显更轻,更强,更亮,更安静,更快,更冷静,更持久,更高效。如果您一直在考虑购买Aorus X笔记本电脑,那么几乎没有理由不去选择Aero 17。
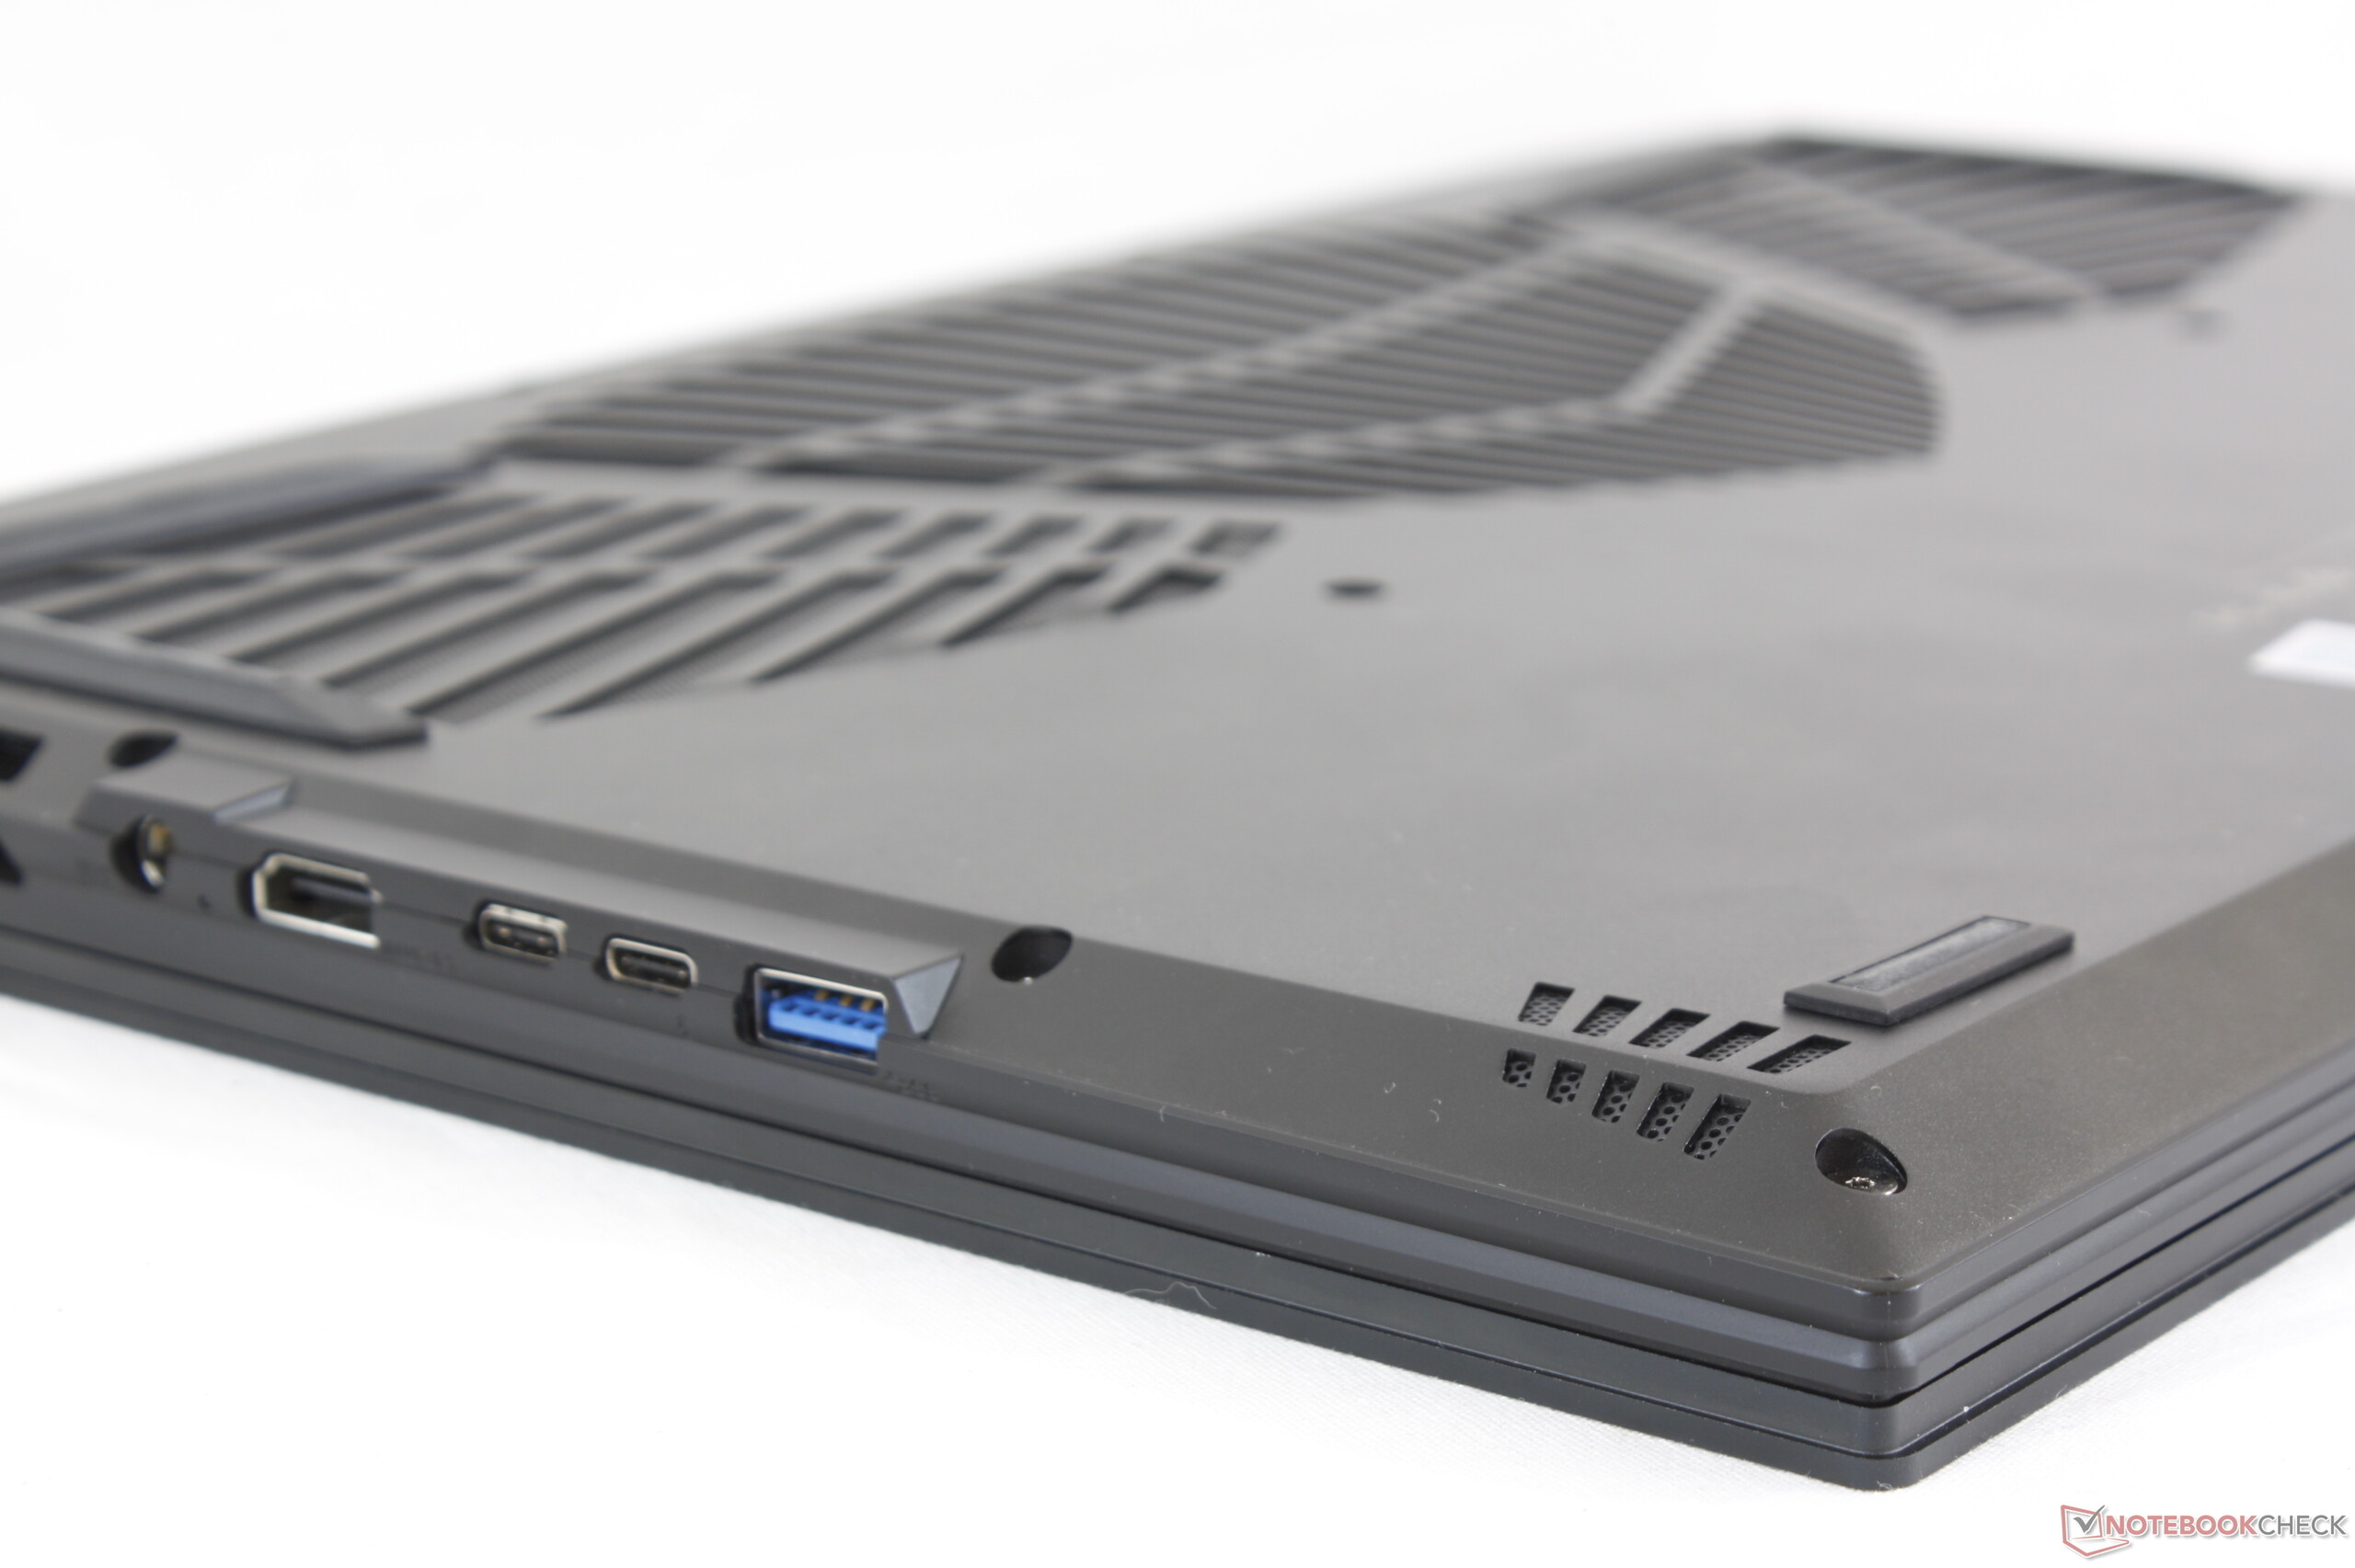
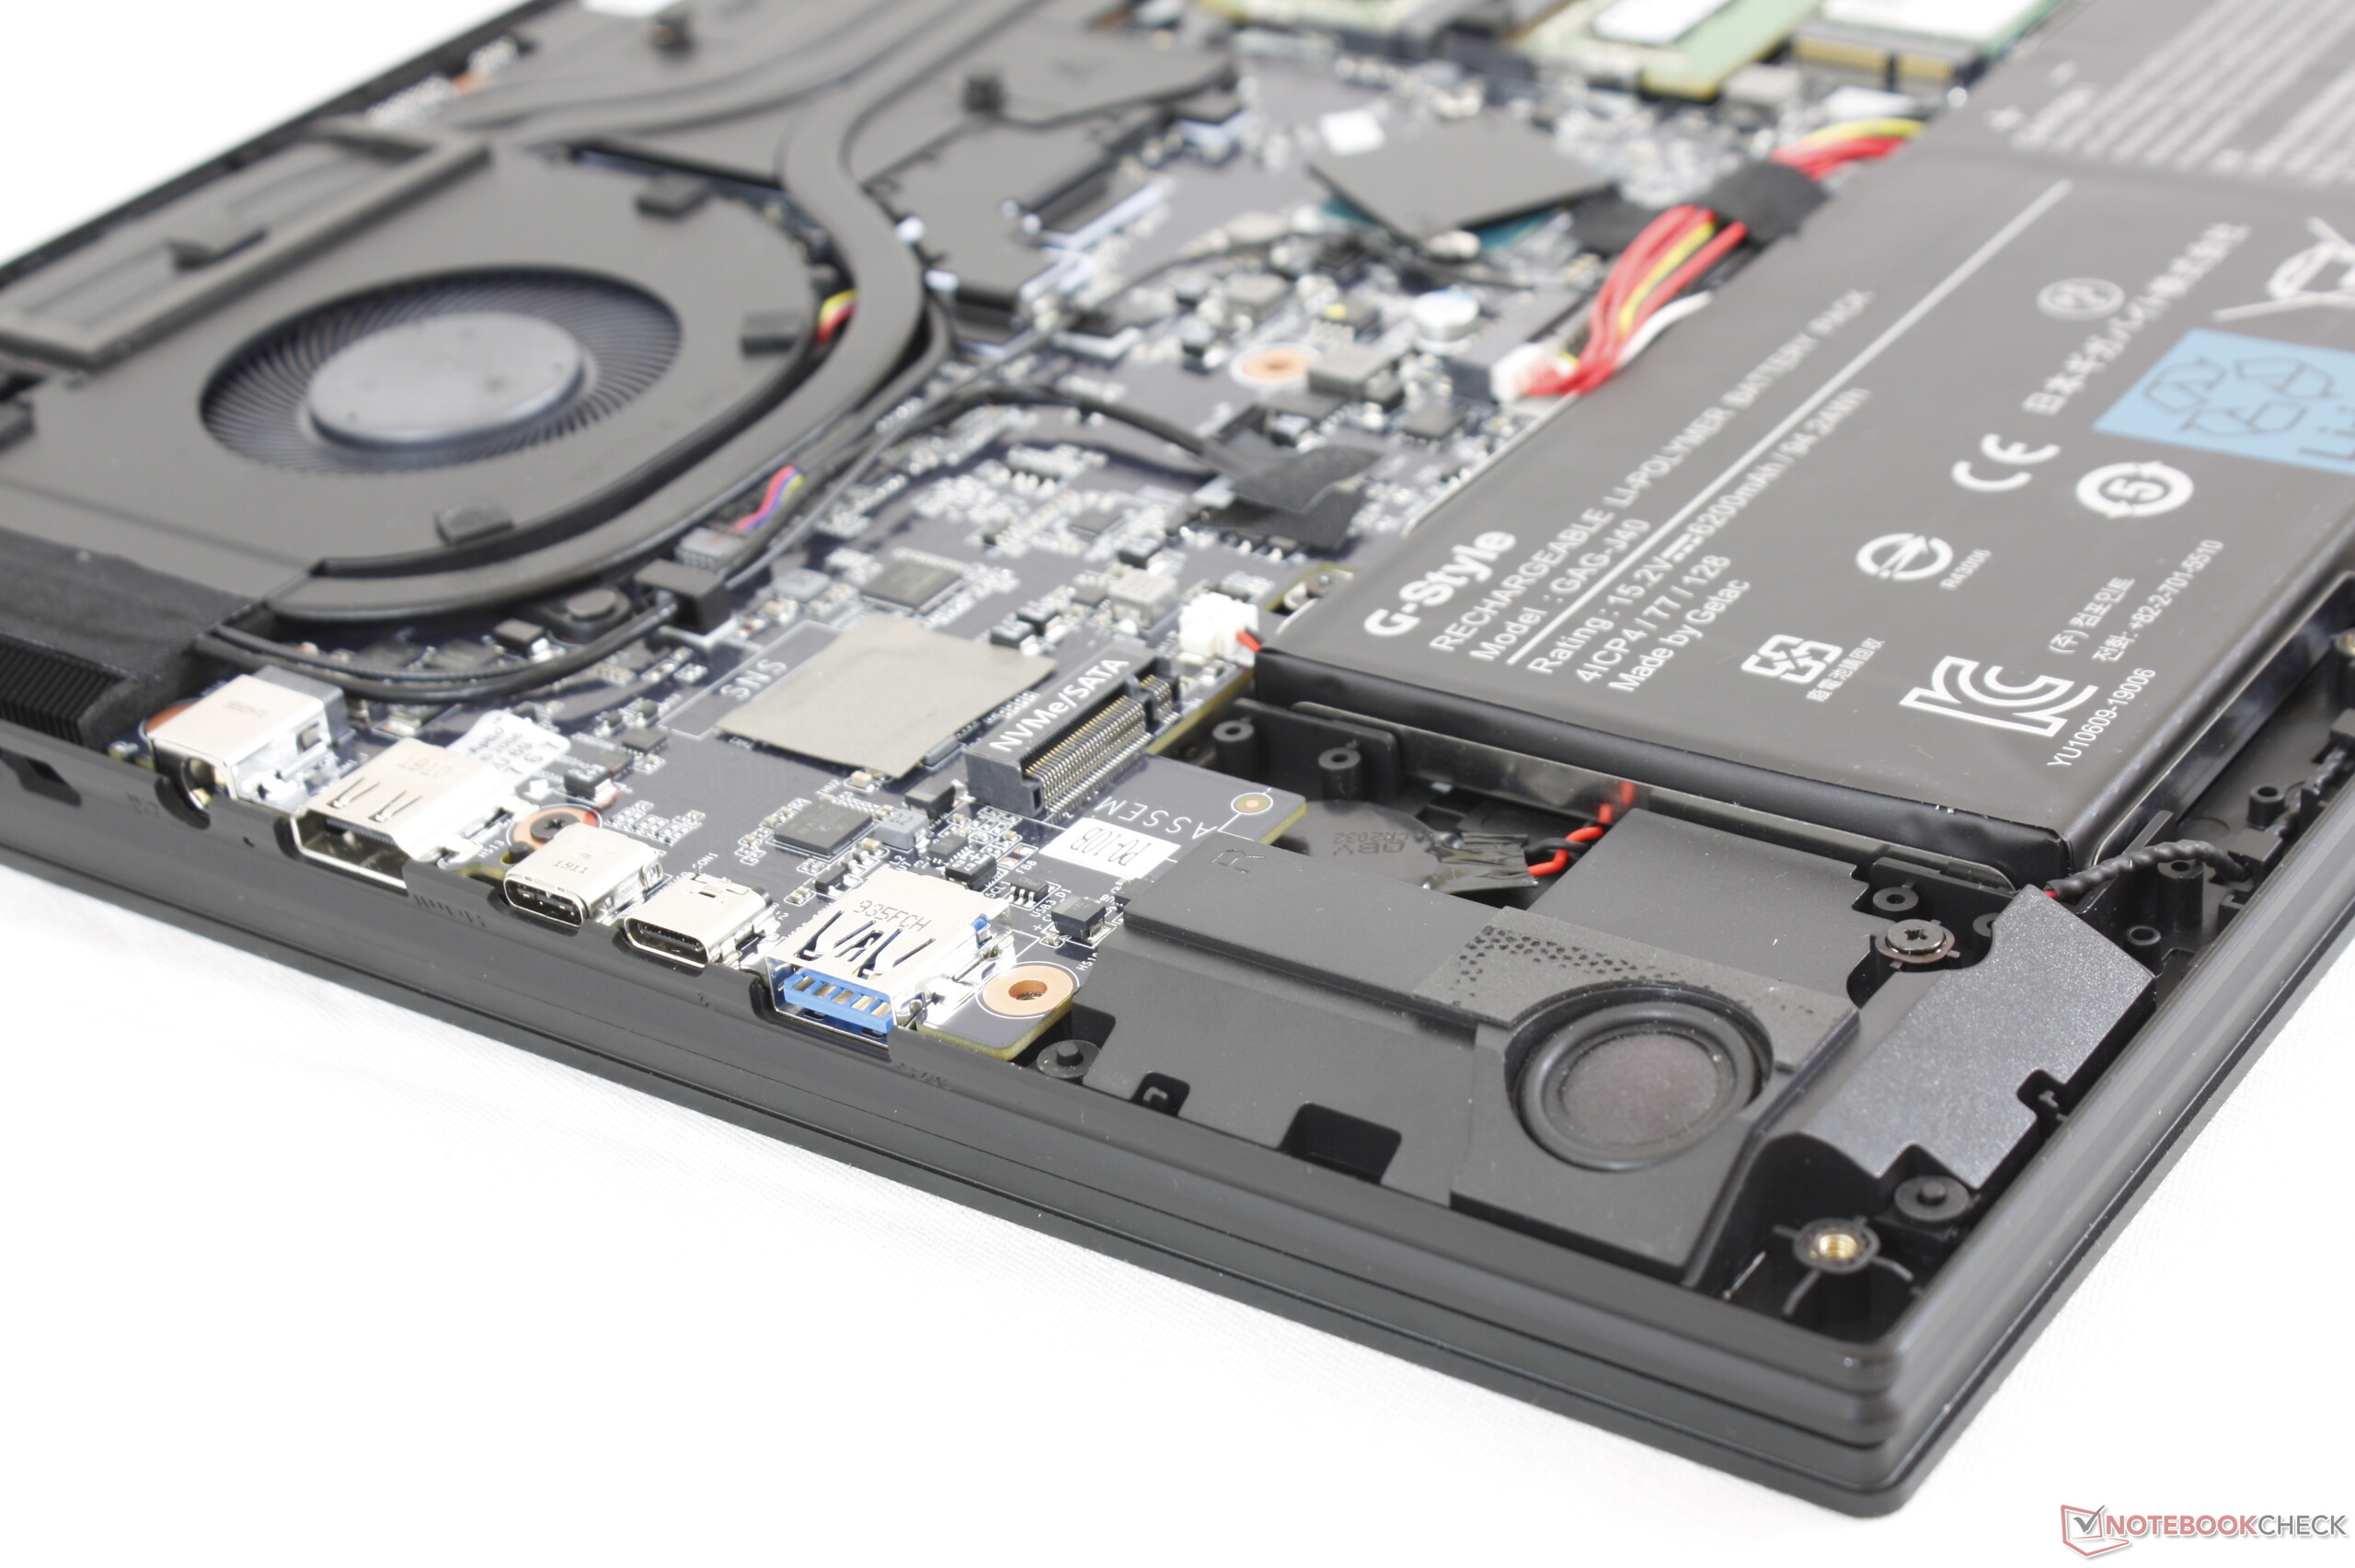
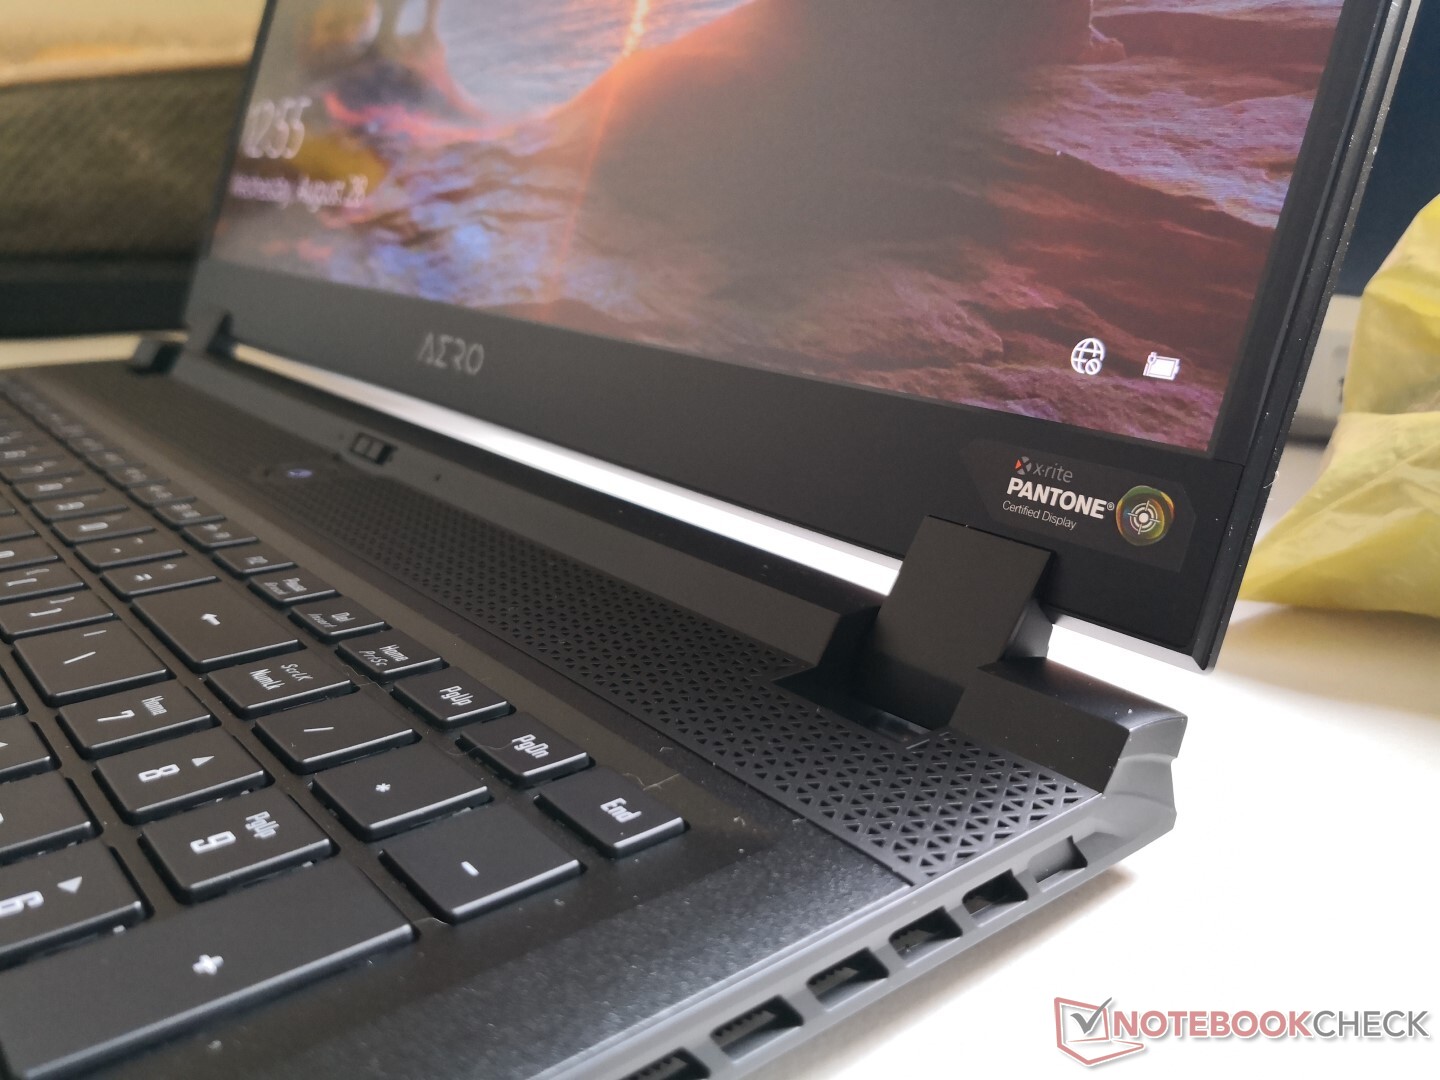
与同类尺寸的其他高性能超薄笔记本电脑相比,Aero 17结合了四个其他设备没有但值得注意的功能:Thunderbolt 3,SD卡读卡器,全尺寸NumPad和非常明亮的HDR400 Pantone校准显示。 MSI GS75,MSI P75,Asus Zephyrus GX701甚至Razer Blade Pro 17 / Blade Studio等竞争机型都至少缺少这些功能之一。 Aero 17感觉更像是为内容创作者和游戏玩家准备的二合一机器,而不是主要为那些对于专业功能需求可有可无的游戏玩家而设计的笔记本电脑。
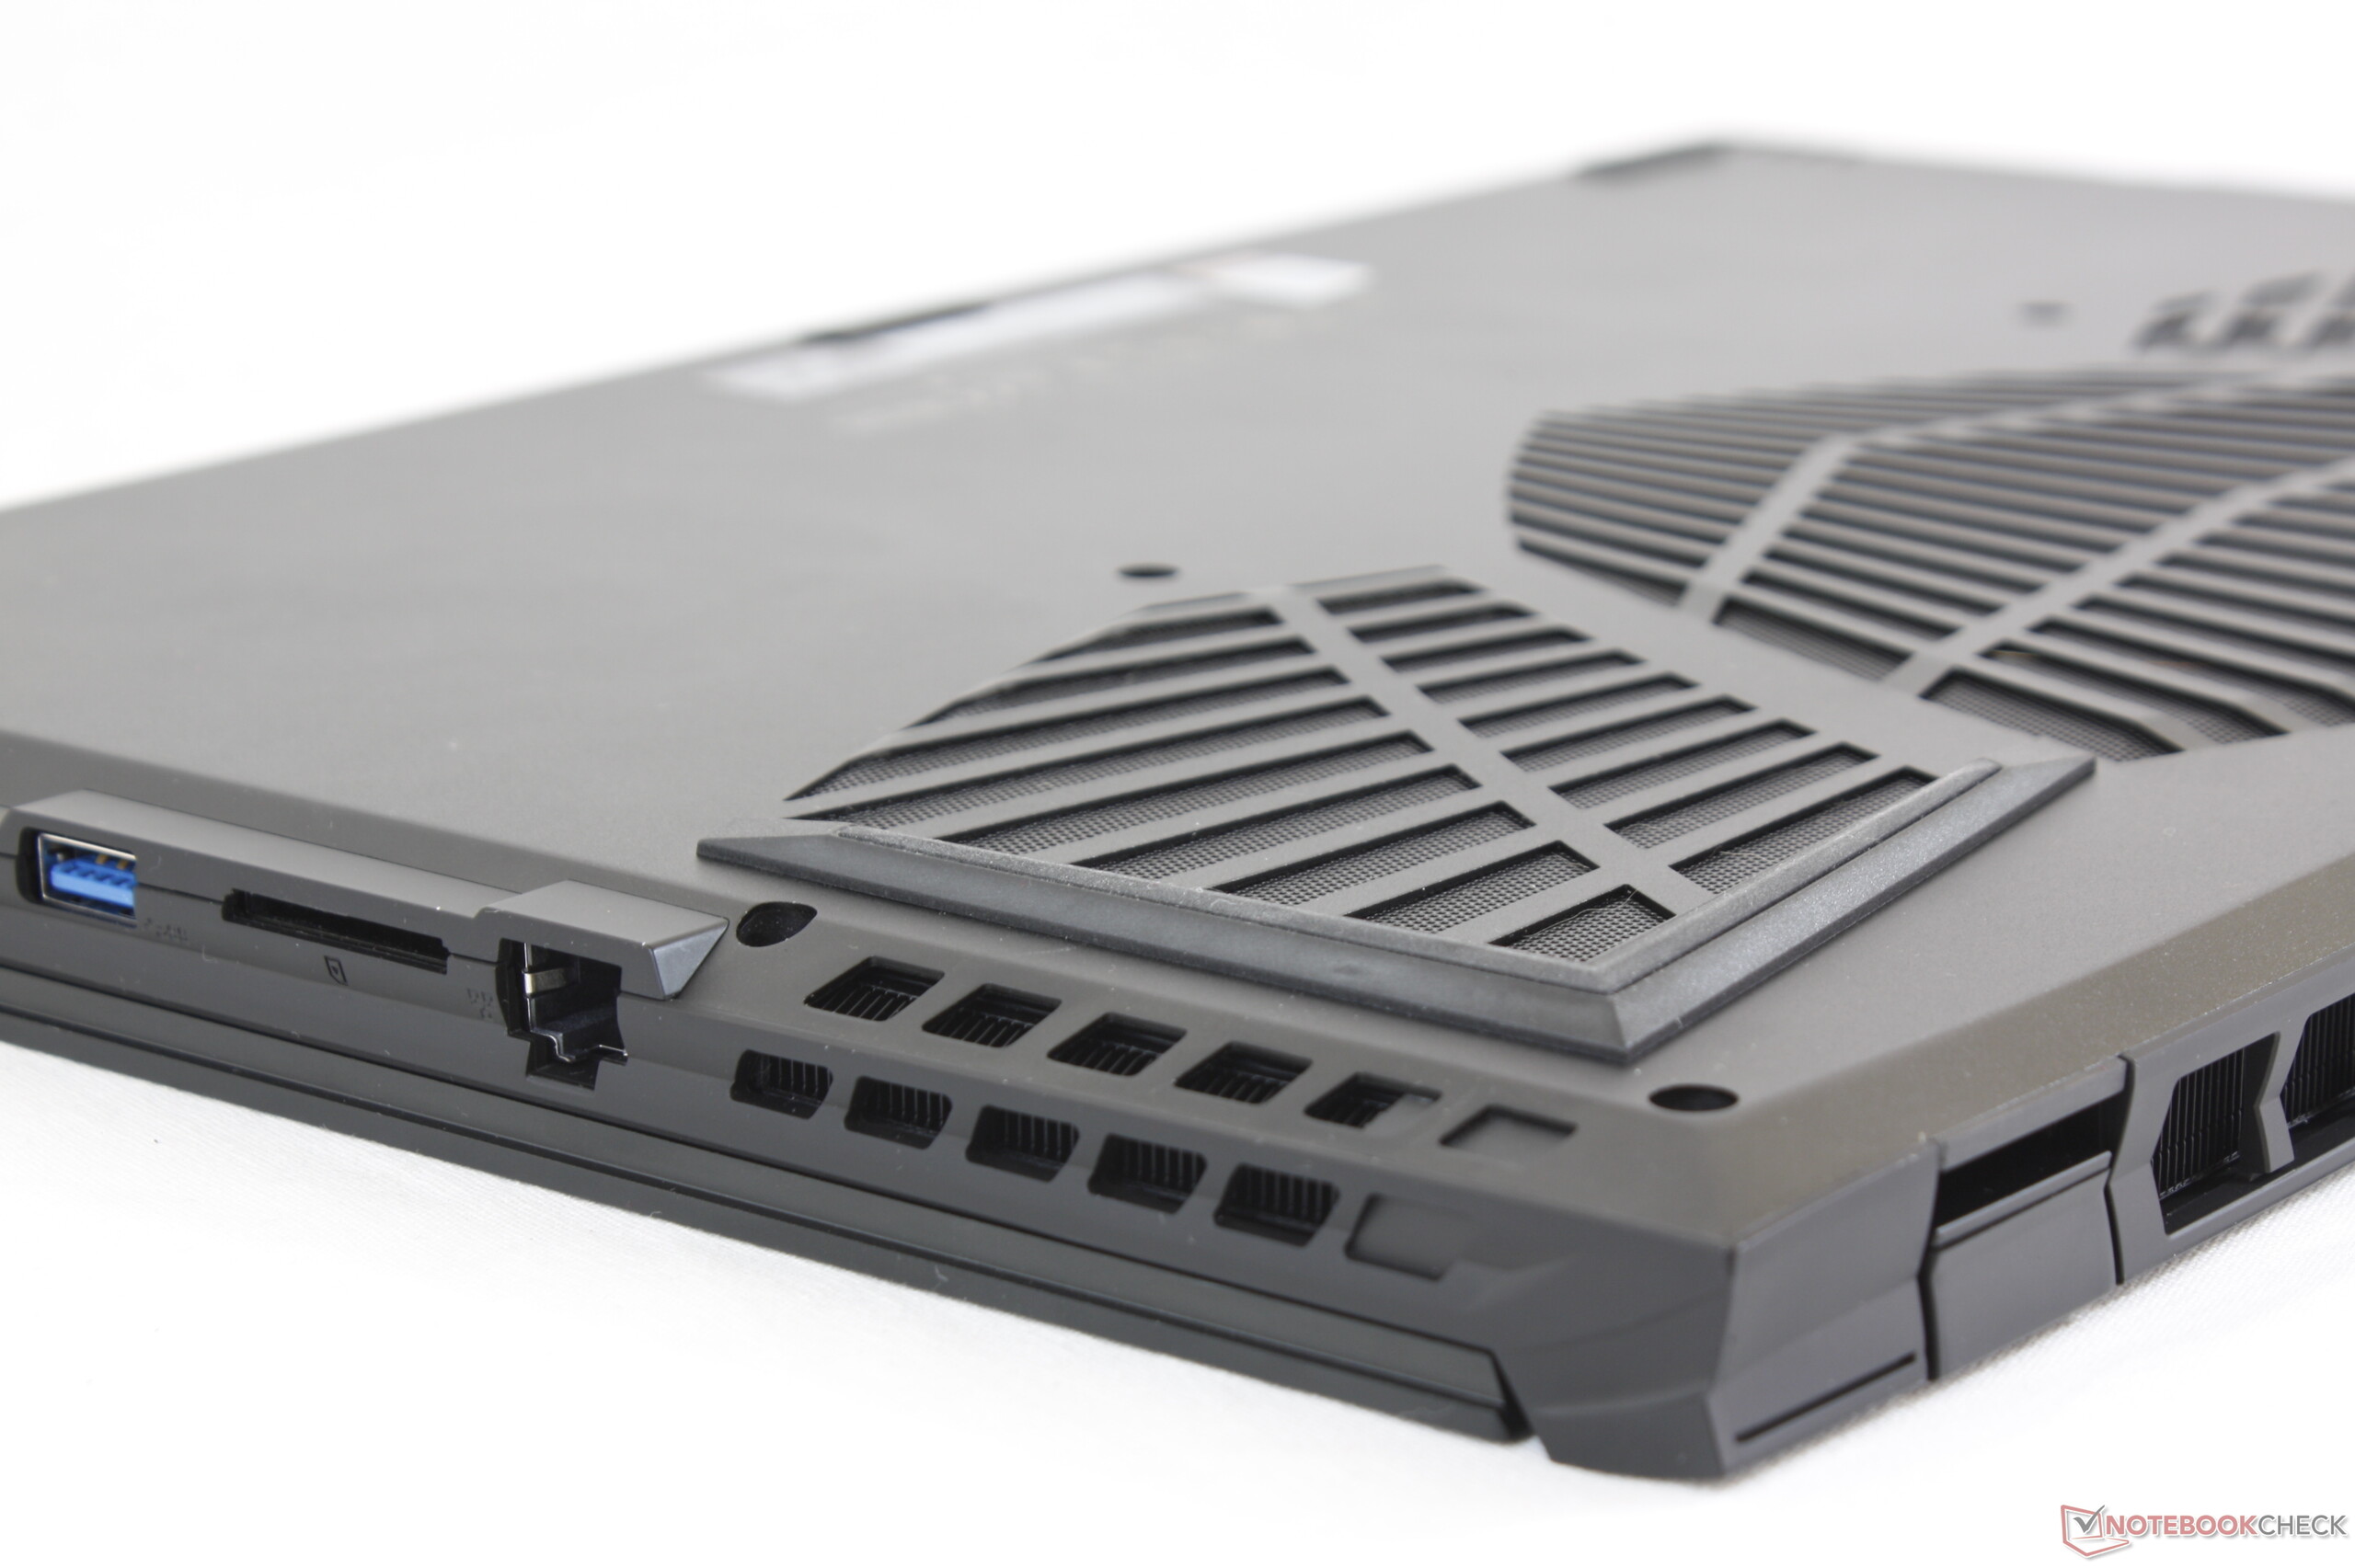
技嘉要使Aero 17成为更好的机器,还有很多工作要做。特别是键盘和触摸板的反馈不够更牢固。摄像头定位很差,并且不能选择使用IR人脸识别,这对于以专业人员为目标的笔记本电脑来说实在是可惜的。最好使用带弹簧的SD读卡器,Aero系列上的2.5 Gbit RJ-45和USB Type-C PD都可以带给您最独特的感觉。对于这台价格昂贵的笔记本电脑,我们期望它拥有一切黑科技。
高性能的Aero 17比其竞争对手安静,同时提供了更多针对内容创作者,专业人士和游戏玩家的硬件功能。高亮度的HDR400显示屏和全尺寸集成NumPad,这是Razer Blade Pro 17等许多其他轻薄笔记本电脑所没有的。
Gigabyte Aero 17 XA RP77
- 09/02/2019 v7 (old)
Allen Ngo
Price comparison

