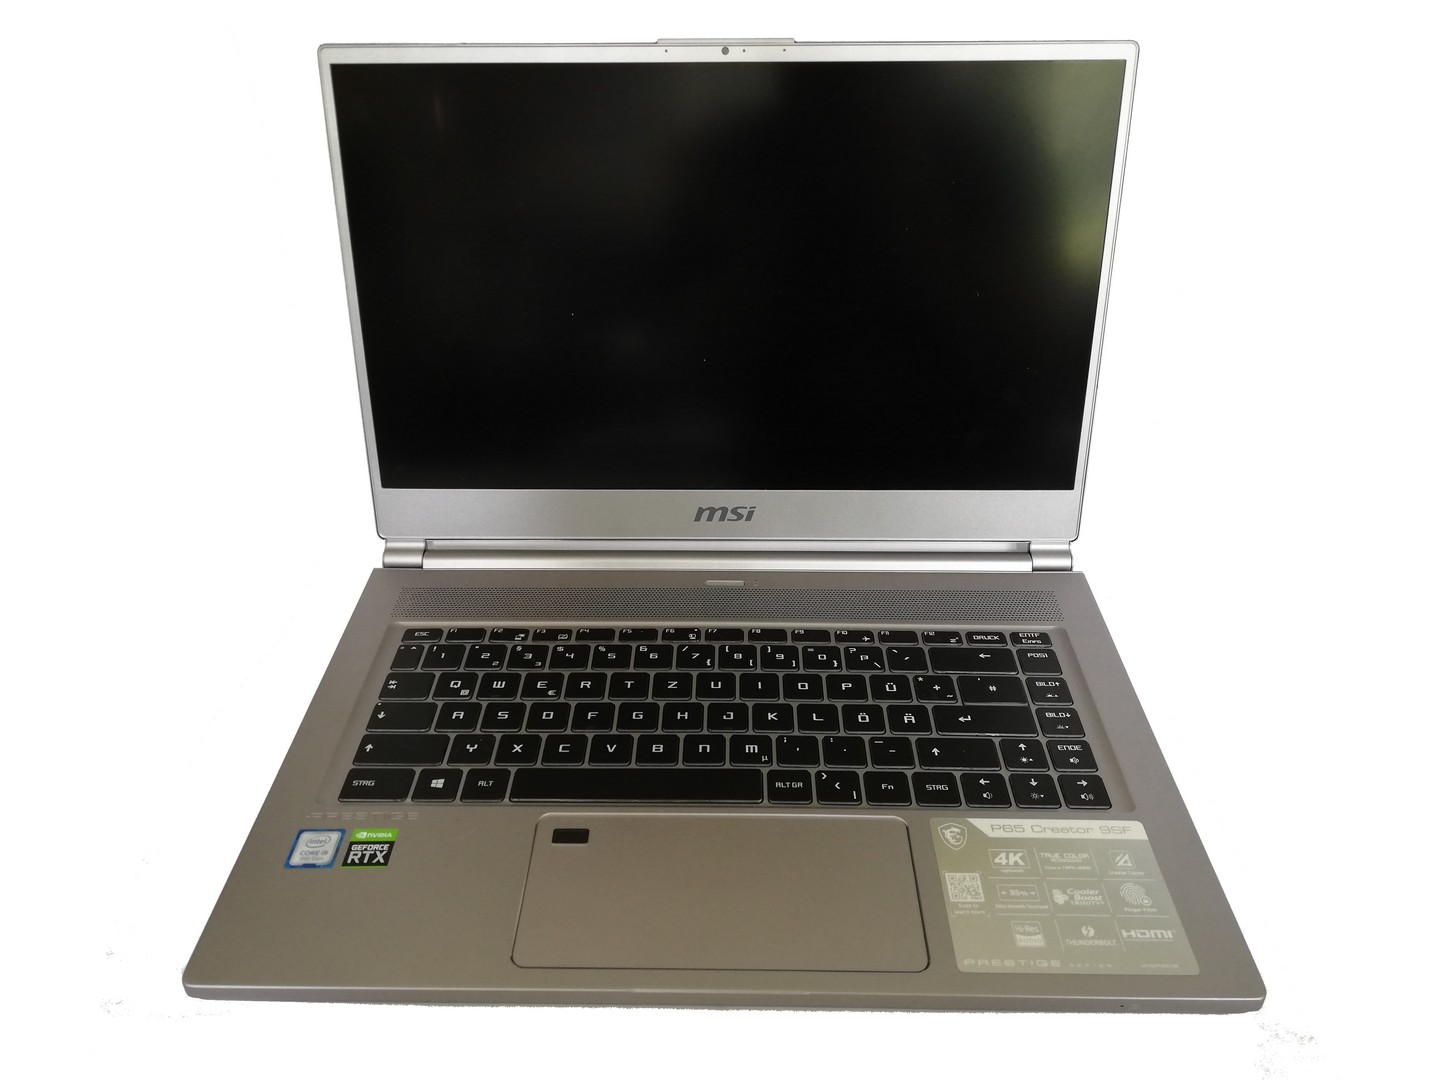
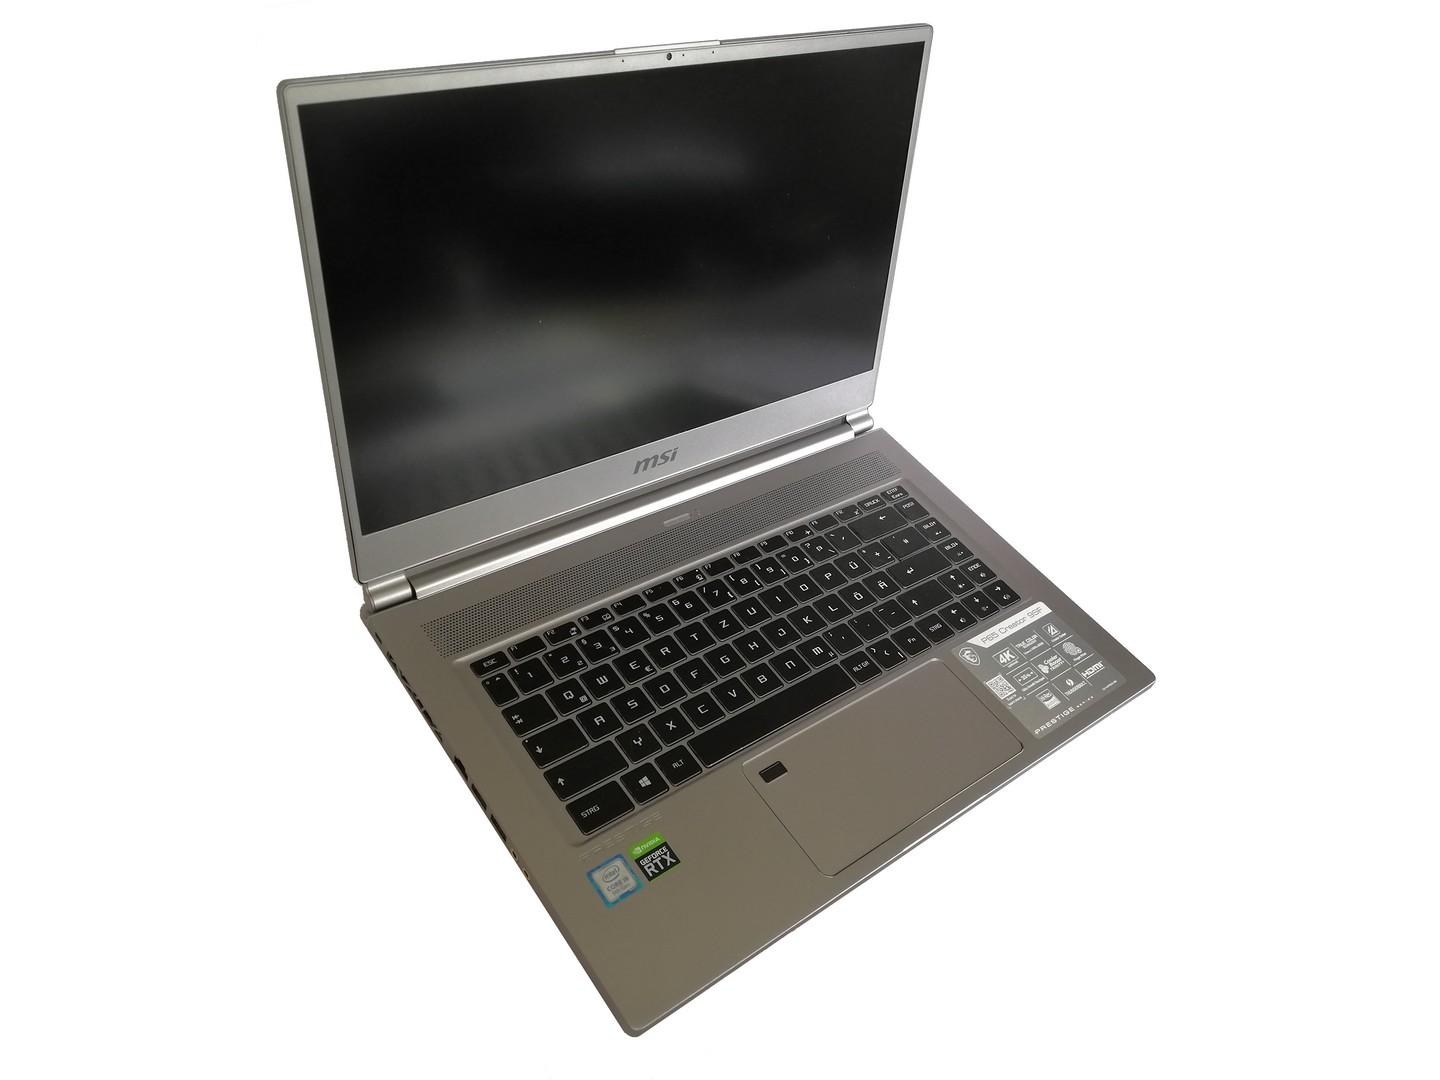
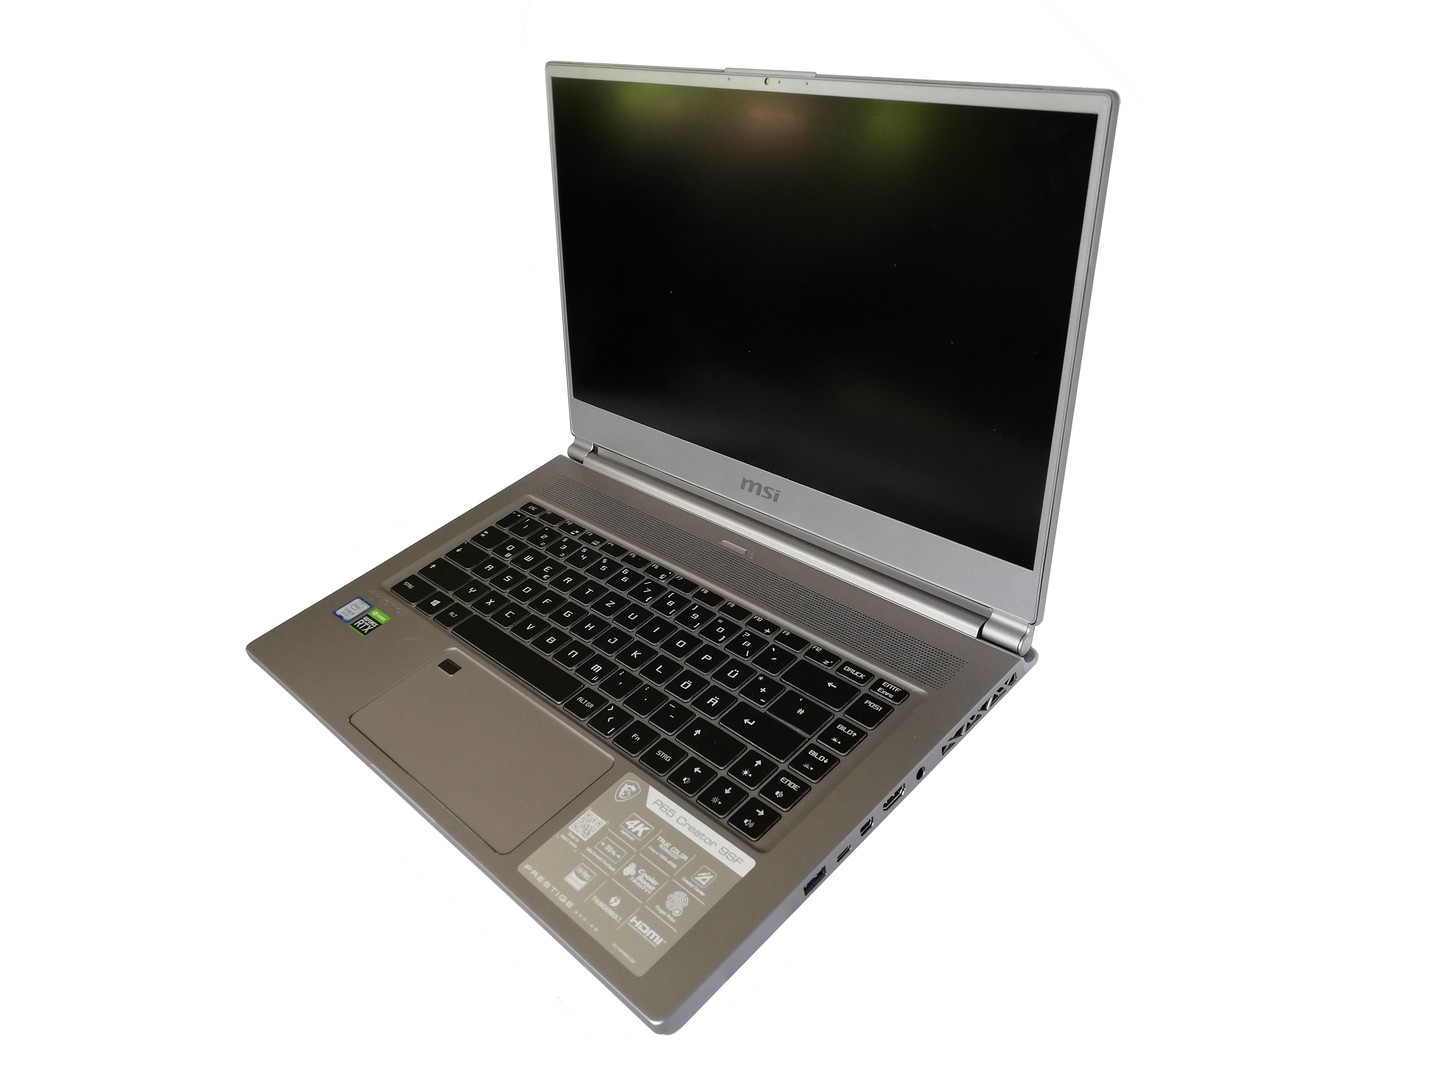
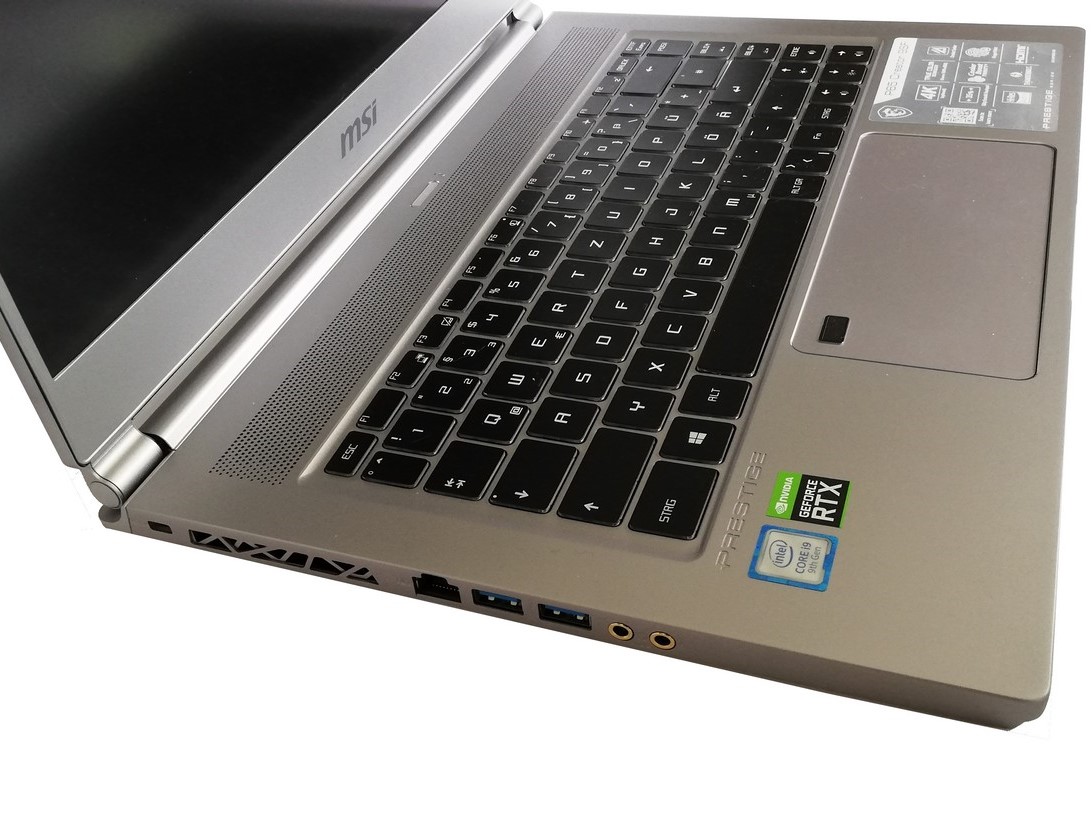
MSI P65 Creator 9SF (i9-9880H, RTX2070 Max-Q) 笔记本电脑评测
| Networking | |
| iperf3 transmit AX12 | |
| Asus Zephyrus S GX502GW | |
| Gigabyte Aero 15-X9 | |
| Razer Blade 15 RTX 2070 Max-Q | |
| Schenker XMG Ultra 15 Turing | |
| MSI P65 Creator 9SF-657 | |
| iperf3 receive AX12 | |
| Schenker XMG Ultra 15 Turing | |
| Razer Blade 15 RTX 2070 Max-Q | |
| Asus Zephyrus S GX502GW | |
| Gigabyte Aero 15-X9 | |
| MSI P65 Creator 9SF-657 | |
| |||||||||||||||||||||||||
Brightness Distribution: 83 %
Center on Battery: 476 cd/m²
Contrast: 890:1 (Black: 0.5 cd/m²)
ΔE ColorChecker Calman: 4.75 | ∀{0.5-29.43 Ø4.72}
ΔE Greyscale Calman: 4.49 | ∀{0.09-98 Ø4.97}
100% sRGB (Argyll 1.6.3 3D)
87% AdobeRGB 1998 (Argyll 1.6.3 3D)
98.5% AdobeRGB 1998 (Argyll 3D)
100% sRGB (Argyll 3D)
84.4% Display P3 (Argyll 3D)
Gamma: 2.49
CCT: 7374 K
| MSI P65 Creator 9SF-657 AU Optronics AUO41EB, , 3840x2160, 15.6" | Razer Blade 15 RTX 2070 Max-Q LG Philips LGD05C0, , 1920x1080, 15.6" | Asus Zephyrus S GX502GW AU Optronics B156HAN08.2 (AUO82ED), , 1920x1080, 15.6" | Schenker XMG Ultra 15 Turing AU Optronics B156HAN07.0 (AUO70ED), , 1920x1080, 15.6" | Gigabyte Aero 15-X9 LGD05C0, , 1920x1080, 15.6" | |
|---|---|---|---|---|---|
| Display | -20% | -22% | -20% | -22% | |
| Display P3 Coverage (%) | 84.4 | 65.3 -23% | 64.9 -23% | 66.1 -22% | 63.5 -25% |
| sRGB Coverage (%) | 100 | 94.9 -5% | 91 -9% | 92.6 -7% | 93.1 -7% |
| AdobeRGB 1998 Coverage (%) | 98.5 | 66.3 -33% | 65.9 -33% | 67.1 -32% | 64.5 -35% |
| Response Times | 65% | 79% | 62% | 62% | |
| Response Time Grey 50% / Grey 80% * (ms) | 51 ? | 16.8 ? 67% | 7.2 ? 86% | 17.6 ? 65% | 16.4 ? 68% |
| Response Time Black / White * (ms) | 31 ? | 11.6 ? 63% | 8.8 ? 72% | 12.8 ? 59% | 13.6 ? 56% |
| PWM Frequency (Hz) | |||||
| Screen | 4% | 5% | 2% | 12% | |
| Brightness middle (cd/m²) | 445 | 314.7 -29% | 286 -36% | 263 -41% | 250 -44% |
| Brightness (cd/m²) | 462 | 312 -32% | 275 -40% | 264 -43% | 235 -49% |
| Brightness Distribution (%) | 83 | 90 8% | 90 8% | 89 7% | 85 2% |
| Black Level * (cd/m²) | 0.5 | 0.38 24% | 0.37 26% | 0.17 66% | 0.29 42% |
| Contrast (:1) | 890 | 828 -7% | 773 -13% | 1547 74% | 862 -3% |
| Colorchecker dE 2000 * | 4.75 | 2.56 46% | 2.19 54% | 4.45 6% | 1.46 69% |
| Colorchecker dE 2000 max. * | 7.79 | 4.89 37% | 4.4 44% | 8.33 -7% | 2.47 68% |
| Greyscale dE 2000 * | 4.49 | 3.4 24% | 2.2 51% | 4.77 -6% | 1.27 72% |
| Gamma | 2.49 88% | 2.3 96% | 2.41 91% | 2.52 87% | 2.4 92% |
| CCT | 7374 88% | 6435 101% | 6405 101% | 7767 84% | 6749 96% |
| Color Space (Percent of AdobeRGB 1998) (%) | 87 | 60.7 -30% | 59 -32% | 60 -31% | 60 -31% |
| Color Space (Percent of sRGB) (%) | 100 | 94.6 -5% | 91 -9% | 93 -7% | 93 -7% |
| Colorchecker dE 2000 calibrated * | 1.71 | 2.27 | 1.93 | ||
| Total Average (Program / Settings) | 16% /
7% | 21% /
10% | 15% /
5% | 17% /
12% |
* ... smaller is better
Display Response Times
| ↔ Response Time Black to White | ||
|---|---|---|
| 31 ms ... rise ↗ and fall ↘ combined | ↗ 18 ms rise | 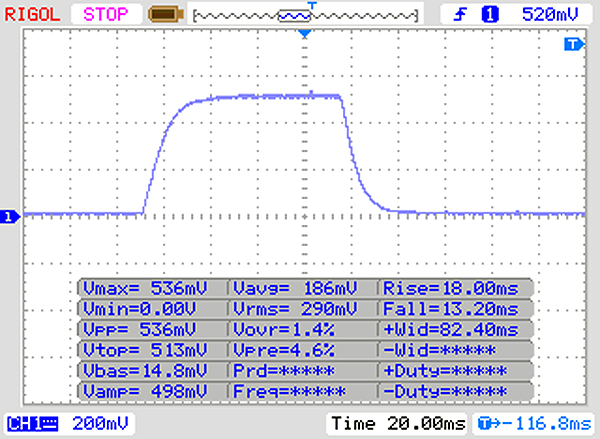 |
| ↘ 13 ms fall | ||
| The screen shows slow response rates in our tests and will be unsatisfactory for gamers. In comparison, all tested devices range from 0.1 (minimum) to 240 (maximum) ms. » 84 % of all devices are better. This means that the measured response time is worse than the average of all tested devices (19.8 ms). | ||
| ↔ Response Time 50% Grey to 80% Grey | ||
| 51 ms ... rise ↗ and fall ↘ combined | ↗ 24 ms rise | 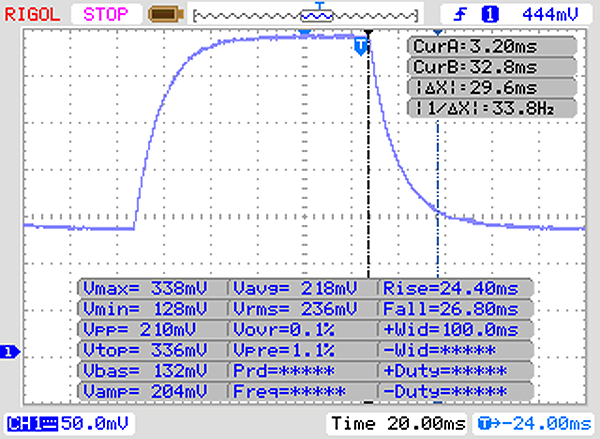 |
| ↘ 27 ms fall | ||
| The screen shows slow response rates in our tests and will be unsatisfactory for gamers. In comparison, all tested devices range from 0.165 (minimum) to 636 (maximum) ms. » 87 % of all devices are better. This means that the measured response time is worse than the average of all tested devices (31 ms). | ||
Screen Flickering / PWM (Pulse-Width Modulation)
| Screen flickering / PWM not detected | 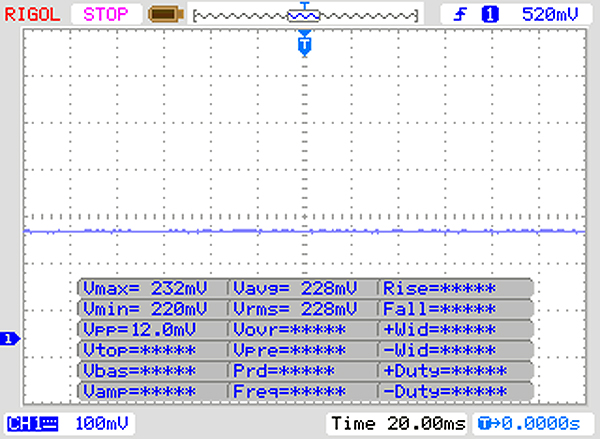 | ||
In comparison: 52 % of all tested devices do not use PWM to dim the display. If PWM was detected, an average of 7769 (minimum: 5 - maximum: 343500) Hz was measured. | |||
| Cinebench R15 | |
| CPU Single 64Bit | |
| Average of class Multimedia (184.8 - 326, n=66, last 2 years) | |
| Schenker XMG Ultra 15 Turing | |
| MSI P65 Creator 9SF-657 | |
| Average Intel Core i9-9880H (181 - 198, n=11) | |
| Asus Zephyrus S GX502GW | |
| Razer Blade 15 RTX 2070 Max-Q | |
| Gigabyte Aero 15-X9 | |
| CPU Multi 64Bit | |
| Average of class Multimedia (856 - 5224, n=68, last 2 years) | |
| MSI P65 Creator 9SF-657 | |
| Average Intel Core i9-9880H (1317 - 1721, n=11) | |
| Schenker XMG Ultra 15 Turing | |
| Asus Zephyrus S GX502GW | |
| Gigabyte Aero 15-X9 | |
| Razer Blade 15 RTX 2070 Max-Q | |
| PCMark 8 | |
| Home Score Accelerated v2 | |
| Average of class Multimedia (n=1last 2 years) | |
| Schenker XMG Ultra 15 Turing | |
| Gigabyte Aero 15-X9 | |
| Razer Blade 15 RTX 2070 Max-Q | |
| MSI P65 Creator 9SF-657 | |
| Average Intel Core i9-9880H, NVIDIA GeForce RTX 2070 Max-Q (n=1) | |
| Work Score Accelerated v2 | |
| Schenker XMG Ultra 15 Turing | |
| Gigabyte Aero 15-X9 | |
| Razer Blade 15 RTX 2070 Max-Q | |
| MSI P65 Creator 9SF-657 | |
| Average Intel Core i9-9880H, NVIDIA GeForce RTX 2070 Max-Q (n=1) | |
| PCMark 8 Home Score Accelerated v2 | 3505 points | |
| PCMark 8 Work Score Accelerated v2 | 4482 points | |
| PCMark 10 Score | 5211 points | |
Help | ||
| MSI P65 Creator 9SF-657 2x Samsung SSD PM981 MZVLB512HAJQ (RAID 0) | Razer Blade 15 RTX 2070 Max-Q Samsung SSD PM981 MZVLB512HAJQ | Asus Zephyrus S GX502GW 2x Intel SSD 660p SSDPEKNW512G8 (RAID 0) | Schenker XMG Ultra 15 Turing Samsung SSD 970 EVO Plus 1TB | Gigabyte Aero 15-X9 Intel SSD 760p SSDPEKKW010T8 | Average 2x Samsung SSD PM981 MZVLB512HAJQ (RAID 0) | |
|---|---|---|---|---|---|---|
| CrystalDiskMark 5.2 / 6 | -32% | -24% | -17% | -31% | -7% | |
| Write 4K (MB/s) | 105.6 | 93.9 -11% | 97 -8% | 129.9 23% | 97.1 -8% | 98.6 ? -7% |
| Read 4K (MB/s) | 46.32 | 40.56 -12% | 49.58 7% | 47.15 2% | 53.7 16% | 42.5 ? -8% |
| Write Seq (MB/s) | 2910 | 1468 -50% | 1838 -37% | 1840 -37% | 1526 -48% | 2804 ? -4% |
| Read Seq (MB/s) | 2820 | 1540 -45% | 2421 -14% | 1775 -37% | 2020 -28% | 2806 ? 0% |
| Write 4K Q32T1 (MB/s) | 545 | 293.5 -46% | 326.9 -40% | 294.5 -46% | 285.6 -48% | 446 ? -18% |
| Read 4K Q32T1 (MB/s) | 632 | 346 -45% | 372.9 -41% | 373.6 -41% | 321.8 -49% | 512 ? -19% |
| Write Seq Q32T1 (MB/s) | 3349 | 1941 -42% | 1894 -43% | 3295 -2% | 1533 -54% | 3252 ? -3% |
| Read Seq Q32T1 (MB/s) | 3333 | 3266 -2% | 2828 -15% | 3535 6% | 2351 -29% | 3324 ? 0% |
| AS SSD | -4% | -24% | 19% | -34% | -5% | |
| Seq Read (MB/s) | 2860 | 1840 -36% | 2506 -12% | 2739 -4% | 2113 -26% | 2811 ? -2% |
| Seq Write (MB/s) | 2604 | 1822 -30% | 1712 -34% | 2650 2% | 1471 -44% | 2627 ? 1% |
| 4K Read (MB/s) | 45.15 | 52.3 16% | 48.32 7% | 27.86 -38% | 55 22% | 42.4 ? -6% |
| 4K Write (MB/s) | 100.2 | 110.7 10% | 103.6 3% | 134.7 34% | 107.1 7% | 97.5 ? -3% |
| 4K-64 Read (MB/s) | 1428 | 1126 -21% | 624 -56% | 1651 16% | 914 -36% | 1382 ? -3% |
| 4K-64 Write (MB/s) | 1401 | 1717 23% | 1253 -11% | 2190 56% | 703 -50% | 1245 ? -11% |
| Access Time Read * (ms) | 0.049 | 0.047 4% | 0.08 -63% | 0.031 37% | 0.114 -133% | 0.05367 ? -10% |
| Access Time Write * (ms) | 0.037 | 0.033 11% | 0.04 -8% | 0.028 24% | 0.034 8% | 0.038 ? -3% |
| Score Read (Points) | 1759 | 1362 -23% | 923 -48% | 1953 11% | 1180 -33% | 1706 ? -3% |
| Score Write (Points) | 1762 | 2010 14% | 1528 -13% | 2590 47% | 957 -46% | 1605 ? -9% |
| Score Total (Points) | 4411 | 4079 -8% | 2896 -34% | 5529 25% | 2722 -38% | 4176 ? -5% |
| Copy ISO MB/s (MB/s) | 1975 | 2031 | 1864 | |||
| Copy Program MB/s (MB/s) | 526 | 452.1 | 362.6 | |||
| Copy Game MB/s (MB/s) | 1200 | 1043 | 936 | |||
| Total Average (Program / Settings) | -18% /
-15% | -24% /
-24% | 1% /
4% | -33% /
-32% | -6% /
-6% |
* ... smaller is better

| 3DMark 11 - 1280x720 Performance GPU | |
| Schenker XMG Ultra 15 Turing | |
| Asus Zephyrus S GX502GW | |
| Razer Blade 15 RTX 2070 Max-Q | |
| Average NVIDIA GeForce RTX 2070 Max-Q (14723 - 27694, n=31) | |
| Gigabyte Aero 15-X9 | |
| MSI P65 Creator 9SF-657 | |
| Average of class Multimedia (3749 - 60002, n=62, last 2 years) | |
| 3DMark | |
| 1280x720 Cloud Gate Standard Graphics | |
| Schenker XMG Ultra 15 Turing | |
| Asus Zephyrus S GX502GW | |
| Razer Blade 15 RTX 2070 Max-Q | |
| Average NVIDIA GeForce RTX 2070 Max-Q (39014 - 134255, n=28) | |
| Gigabyte Aero 15-X9 | |
| MSI P65 Creator 9SF-657 | |
| Average of class Multimedia (16765 - 143501, n=35, last 2 years) | |
| 1920x1080 Fire Strike Graphics | |
| Schenker XMG Ultra 15 Turing | |
| Asus Zephyrus S GX502GW | |
| Razer Blade 15 RTX 2070 Max-Q | |
| Gigabyte Aero 15-X9 | |
| Average NVIDIA GeForce RTX 2070 Max-Q (11563 - 21191, n=31) | |
| MSI P65 Creator 9SF-657 | |
| Average of class Multimedia (2328 - 48907, n=66, last 2 years) | |
| 3DMark 11 Performance | 19440 points | |
| 3DMark Cloud Gate Standard Score | 36379 points | |
| 3DMark Fire Strike Score | 14946 points | |
Help | ||
| Thief | |
| 1920x1080 Very High Preset AA:FXAA & High SS AF:8x | |
| Average NVIDIA GeForce RTX 2070 Max-Q (99 - 103, n=2) | |
| MSI P65 Creator 9SF-657 | |
| 1366x768 High Preset AA:FXAA & Low SS AF:4x | |
| MSI P65 Creator 9SF-657 | |
| Average NVIDIA GeForce RTX 2070 Max-Q (n=1) | |
| 1366x768 Normal Preset AA:FX | |
| MSI P65 Creator 9SF-657 | |
| Average NVIDIA GeForce RTX 2070 Max-Q (n=1) | |
| 1024x768 Very Low Preset | |
| MSI P65 Creator 9SF-657 | |
| Average NVIDIA GeForce RTX 2070 Max-Q (n=1) | |
| BioShock Infinite | |
| 1920x1080 Ultra Preset, DX11 (DDOF) | |
| Schenker XMG Ultra 15 Turing | |
| Razer Blade 15 RTX 2070 Max-Q | |
| Average NVIDIA GeForce RTX 2070 Max-Q (115.8 - 211, n=15) | |
| MSI P65 Creator 9SF-657 | |
| Gigabyte Aero 15-X9 | |
| 1366x768 High Preset | |
| Schenker XMG Ultra 15 Turing | |
| MSI P65 Creator 9SF-657 | |
| Average NVIDIA GeForce RTX 2070 Max-Q (203 - 297, n=14) | |
| Razer Blade 15 RTX 2070 Max-Q | |
| Gigabyte Aero 15-X9 | |
| 1366x768 Medium Preset | |
| Schenker XMG Ultra 15 Turing | |
| MSI P65 Creator 9SF-657 | |
| Average NVIDIA GeForce RTX 2070 Max-Q (218 - 318, n=14) | |
| Razer Blade 15 RTX 2070 Max-Q | |
| Gigabyte Aero 15-X9 | |
| 1280x720 Very Low Preset | |
| Schenker XMG Ultra 15 Turing | |
| MSI P65 Creator 9SF-657 | |
| Average NVIDIA GeForce RTX 2070 Max-Q (234 - 376, n=14) | |
| Razer Blade 15 RTX 2070 Max-Q | |
| Gigabyte Aero 15-X9 | |
| Dota 2 Reborn | |
| 1920x1080 ultra (3/3) best looking | |
| Average NVIDIA GeForce RTX 2070 Max-Q (105.8 - 126, n=13) | |
| MSI P65 Creator 9SF-657 | |
| Average of class Multimedia (29 - 179.9, n=68, last 2 years) | |
| 1920x1080 high (2/3) | |
| Average NVIDIA GeForce RTX 2070 Max-Q (111.4 - 135, n=13) | |
| MSI P65 Creator 9SF-657 | |
| Average of class Multimedia (31.1 - 196.9, n=68, last 2 years) | |
| 1366x768 med (1/3) | |
| Average NVIDIA GeForce RTX 2070 Max-Q (117.4 - 141, n=13) | |
| MSI P65 Creator 9SF-657 | |
| Average of class Multimedia (49.1 - 208, n=68, last 2 years) | |
| 1280x720 min (0/3) fastest | |
| Average NVIDIA GeForce RTX 2070 Max-Q (126.5 - 164, n=13) | |
| MSI P65 Creator 9SF-657 | |
| Average of class Multimedia (77.2 - 233, n=68, last 2 years) | |
| low | med. | high | ultra | 4K | |
|---|---|---|---|---|---|
| BioShock Infinite (2013) | 369.7 | 291.8 | 277.2 | 148.8 | |
| Thief (2014) | 134.8 | 131.6 | 128.7 | 99 | |
| The Witcher 3 (2015) | 295.7 | 205.8 | 116.5 | 80.8 | 42.3 |
| Dota 2 Reborn (2015) | 142.2 | 131.4 | 122.9 | 117.4 |
Noise level
| Idle |
| 32.8 / 32.8 / 33.6 dB(A) |
| Load |
| 40.9 / 42.7 dB(A) |
 | ||
30 dB silent 40 dB(A) audible 50 dB(A) loud |
||
min: | ||
(-) The maximum temperature on the upper side is 49.7 °C / 121 F, compared to the average of 36.8 °C / 98 F, ranging from 21 to 71 °C for the class Multimedia.
(-) The bottom heats up to a maximum of 60.4 °C / 141 F, compared to the average of 39.1 °C / 102 F
(+) In idle usage, the average temperature for the upper side is 26.8 °C / 80 F, compared to the device average of 31.3 °C / 88 F.
(+) The palmrests and touchpad are reaching skin temperature as a maximum (34.9 °C / 94.8 F) and are therefore not hot.
(-) The average temperature of the palmrest area of similar devices was 28.7 °C / 83.7 F (-6.2 °C / -11.1 F).
MSI P65 Creator 9SF-657 audio analysis
(±) | speaker loudness is average but good (77.4 dB)
Bass 100 - 315 Hz
(-) | nearly no bass - on average 23.6% lower than median
(±) | linearity of bass is average (9.9% delta to prev. frequency)
Mids 400 - 2000 Hz
(±) | higher mids - on average 8.4% higher than median
(±) | linearity of mids is average (7.8% delta to prev. frequency)
Highs 2 - 16 kHz
(±) | higher highs - on average 6% higher than median
(±) | linearity of highs is average (9.3% delta to prev. frequency)
Overall 100 - 16.000 Hz
(±) | linearity of overall sound is average (28.3% difference to median)
Compared to same class
» 94% of all tested devices in this class were better, 2% similar, 5% worse
» The best had a delta of 5%, average was 17%, worst was 45%
Compared to all devices tested
» 86% of all tested devices were better, 3% similar, 12% worse
» The best had a delta of 4%, average was 24%, worst was 134%
Apple MacBook 12 (Early 2016) 1.1 GHz audio analysis
(+) | speakers can play relatively loud (83.6 dB)
Bass 100 - 315 Hz
(±) | reduced bass - on average 11.3% lower than median
(±) | linearity of bass is average (14.2% delta to prev. frequency)
Mids 400 - 2000 Hz
(+) | balanced mids - only 2.4% away from median
(+) | mids are linear (5.5% delta to prev. frequency)
Highs 2 - 16 kHz
(+) | balanced highs - only 2% away from median
(+) | highs are linear (4.5% delta to prev. frequency)
Overall 100 - 16.000 Hz
(+) | overall sound is linear (10.2% difference to median)
Compared to same class
» 7% of all tested devices in this class were better, 2% similar, 91% worse
» The best had a delta of 5%, average was 18%, worst was 53%
Compared to all devices tested
» 5% of all tested devices were better, 1% similar, 94% worse
» The best had a delta of 4%, average was 24%, worst was 134%
| Off / Standby | |
| Idle | |
| Load |
|
Key:
min: | |
| MSI P65 Creator 9SF-657 i9-9880H, GeForce RTX 2070 Max-Q, 2x Samsung SSD PM981 MZVLB512HAJQ (RAID 0), IPS, 3840x2160, 15.6" | Razer Blade 15 RTX 2070 Max-Q i7-8750H, GeForce RTX 2070 Max-Q, Samsung SSD PM981 MZVLB512HAJQ, IPS, 1920x1080, 15.6" | Asus Zephyrus S GX502GW i7-9750H, GeForce RTX 2070 Mobile, 2x Intel SSD 660p SSDPEKNW512G8 (RAID 0), IPS, 1920x1080, 15.6" | Schenker XMG Ultra 15 Turing i7-9700K, GeForce RTX 2070 Mobile, Samsung SSD 970 EVO Plus 1TB, IPS, 1920x1080, 15.6" | Gigabyte Aero 15-X9 i7-8750H, GeForce RTX 2070 Max-Q, Intel SSD 760p SSDPEKKW010T8, IPS, 1920x1080, 15.6" | Average NVIDIA GeForce RTX 2070 Max-Q | Average of class Multimedia | |
|---|---|---|---|---|---|---|---|
| Power Consumption | 10% | -61% | -118% | -10% | -22% | 41% | |
| Idle Minimum * (Watt) | 9.4 | 10.4 -11% | 24 -155% | 35 -272% | 16 -70% | 15.4 ? -64% | 5.64 ? 40% |
| Idle Average * (Watt) | 17.4 | 14.6 16% | 27 -55% | 39 -124% | 18 -3% | 20 ? -15% | 10 ? 43% |
| Idle Maximum * (Watt) | 19.6 | 16.3 17% | 33 -68% | 47 -140% | 23 -17% | 26.7 ? -36% | 12.2 ? 38% |
| Load Average * (Watt) | 103 | 88.5 14% | 129 -25% | 117 -14% | 88 15% | 105.2 ? -2% | 64.8 ? 37% |
| Load Maximum * (Watt) | 216 | 182.4 16% | 216 -0% | 299 -38% | 167 23% | 201 ? 7% | 111.7 ? 48% |
| Witcher 3 ultra * (Watt) | 155.4 | 176 | 196 | 120 |
* ... smaller is better
| MSI P65 Creator 9SF-657 i9-9880H, GeForce RTX 2070 Max-Q, 82 Wh | Razer Blade 15 RTX 2070 Max-Q i7-8750H, GeForce RTX 2070 Max-Q, 80 Wh | Asus Zephyrus S GX502GW i7-9750H, GeForce RTX 2070 Mobile, 76 Wh | Schenker XMG Ultra 15 Turing i7-9700K, GeForce RTX 2070 Mobile, 82 Wh | Gigabyte Aero 15-X9 i7-8750H, GeForce RTX 2070 Max-Q, 94.24 Wh | Average of class Multimedia | |
|---|---|---|---|---|---|---|
| Battery runtime | 21% | -29% | -32% | 56% | 105% | |
| Reader / Idle (h) | 9.6 | 11.4 19% | 5.9 -39% | 3.2 -67% | 9.2 -4% | 25.2 ? 163% |
| WiFi v1.3 (h) | 6 | 6.5 8% | 3.7 -38% | 2.6 -57% | 6.4 7% | 12 ? 100% |
| Load (h) | 1.1 | 1.5 36% | 1 -9% | 1.4 27% | 2.9 164% | 1.675 ? 52% |
| H.264 (h) | 2.6 | 6.1 | 16.4 ? |
Pros
Cons
Verdict - compact multimedia notebook with a lot of power
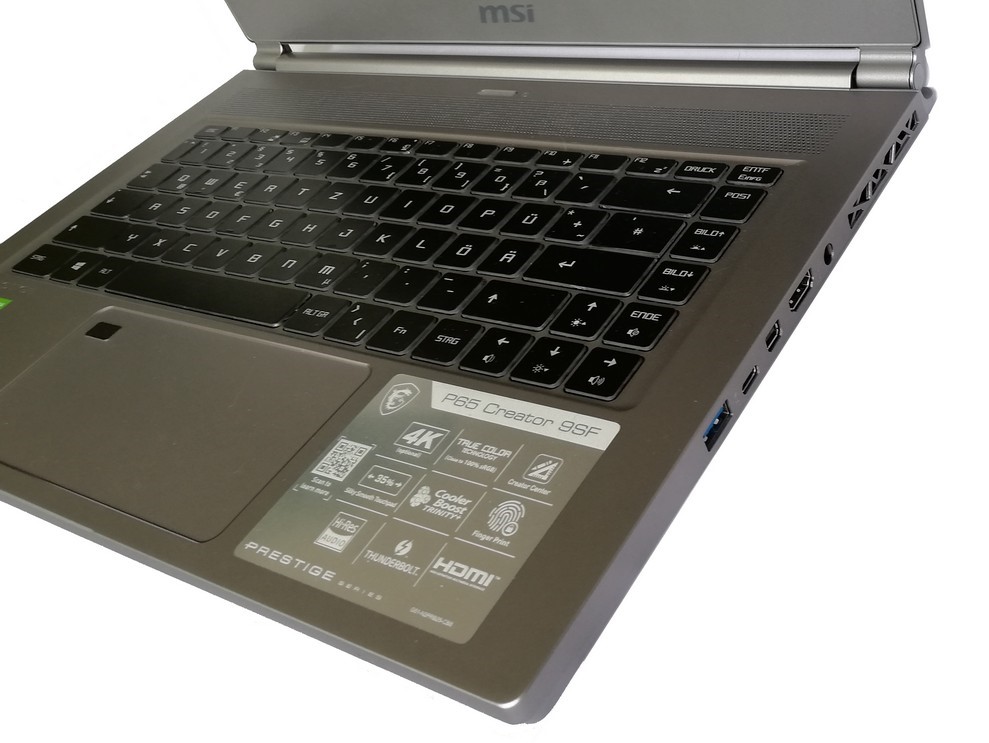
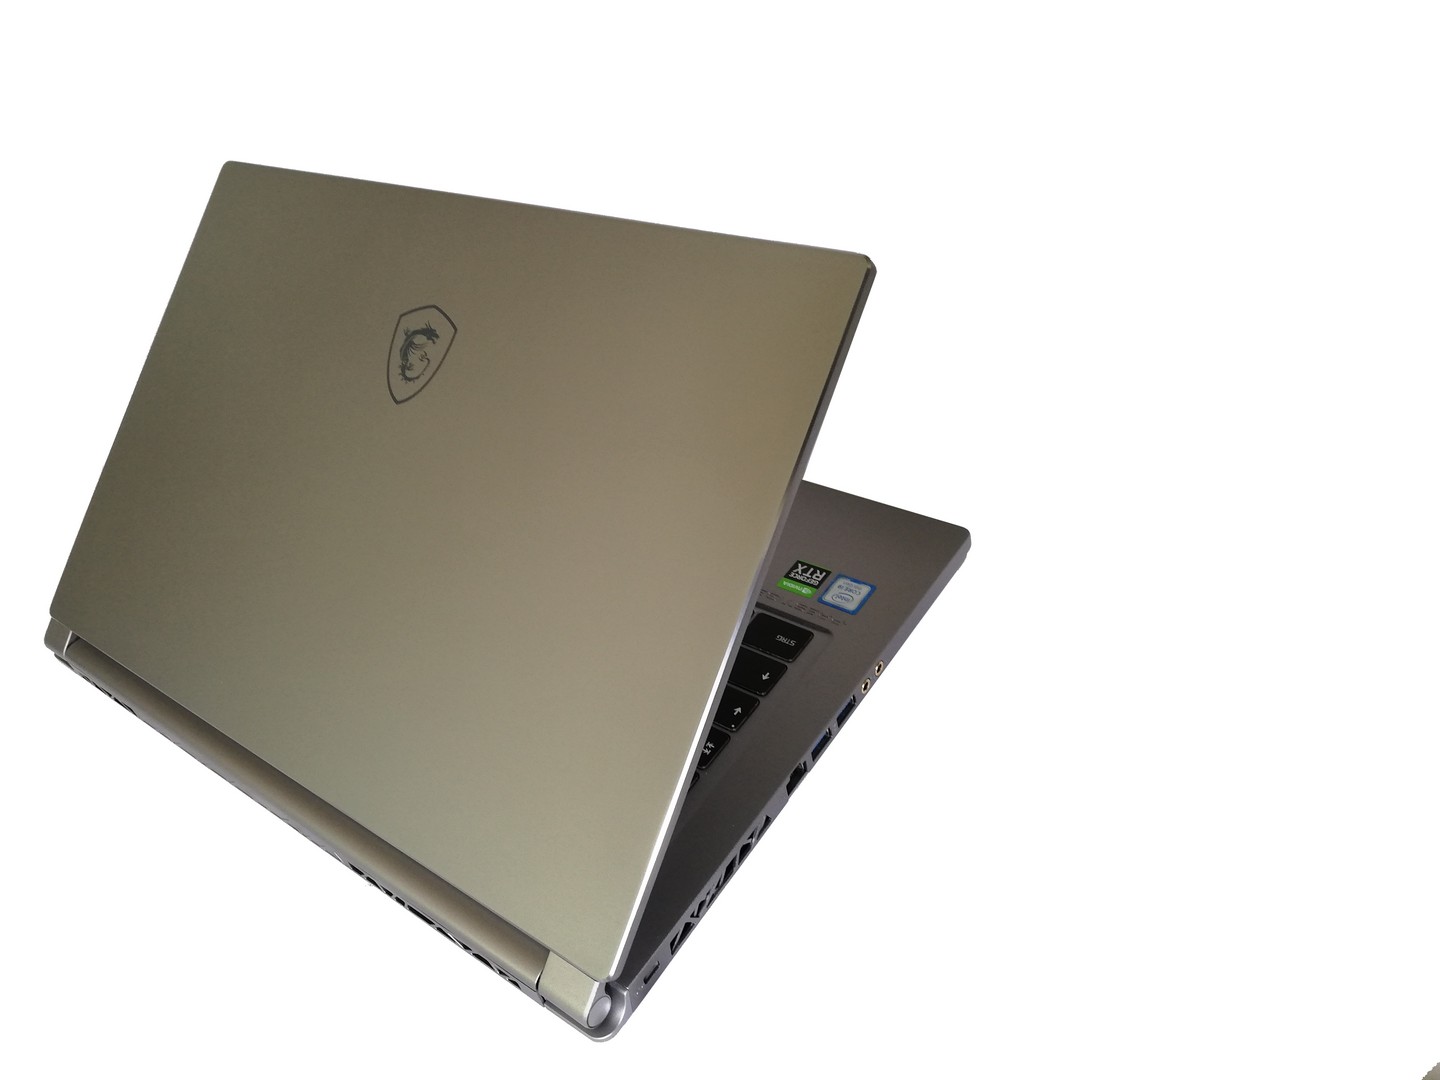
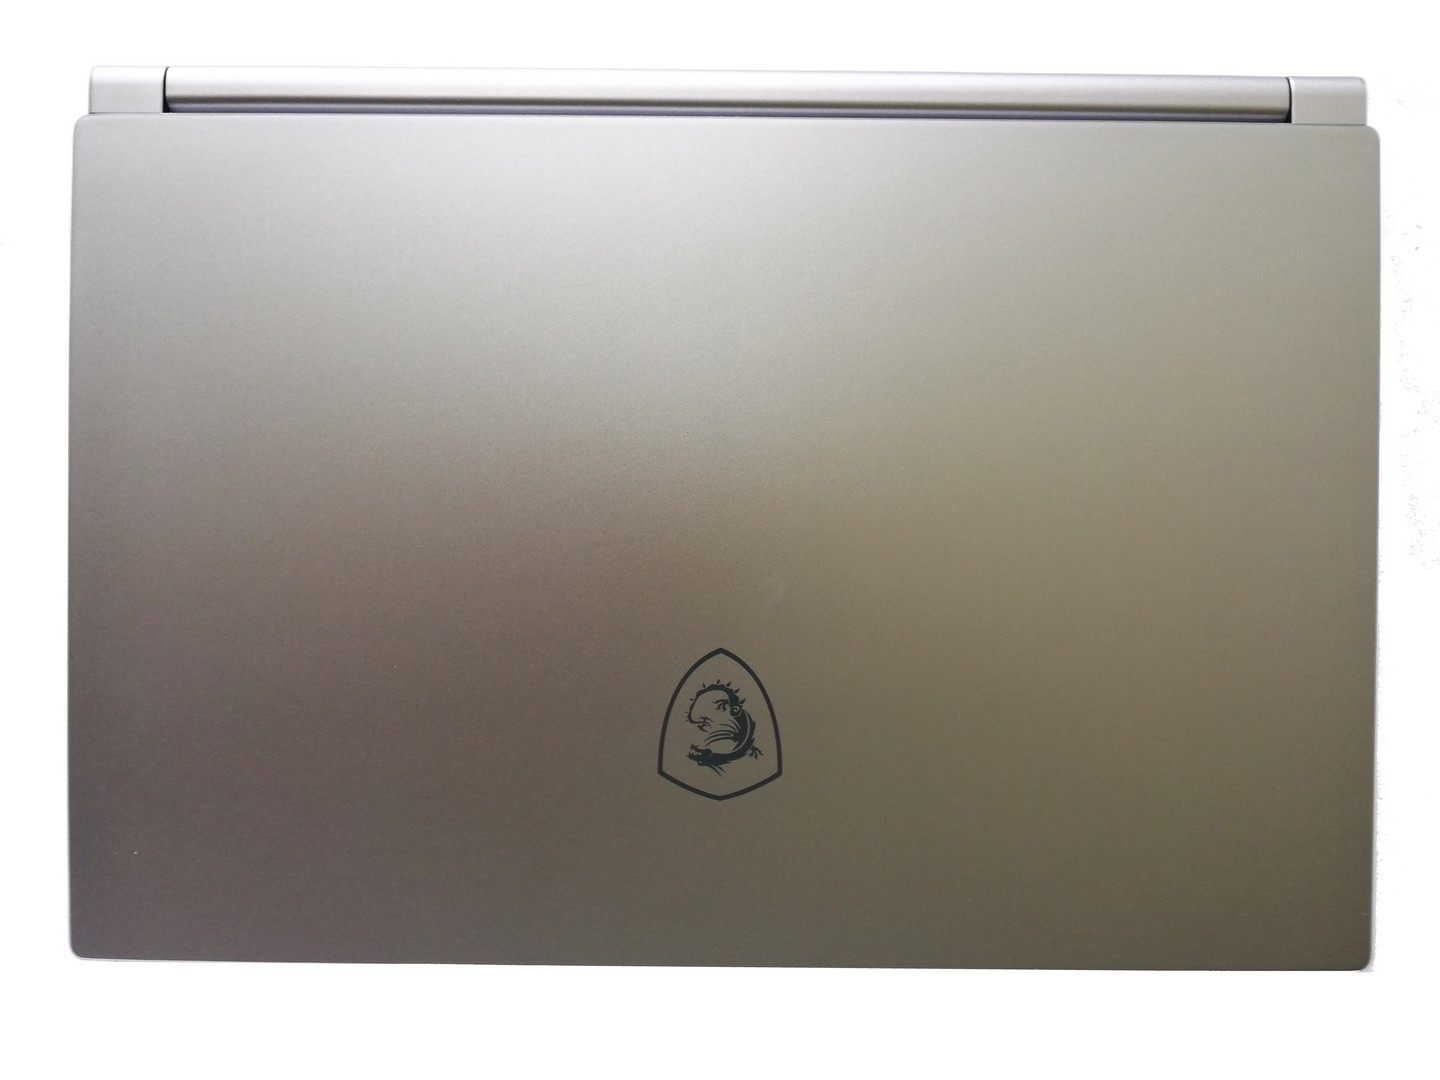
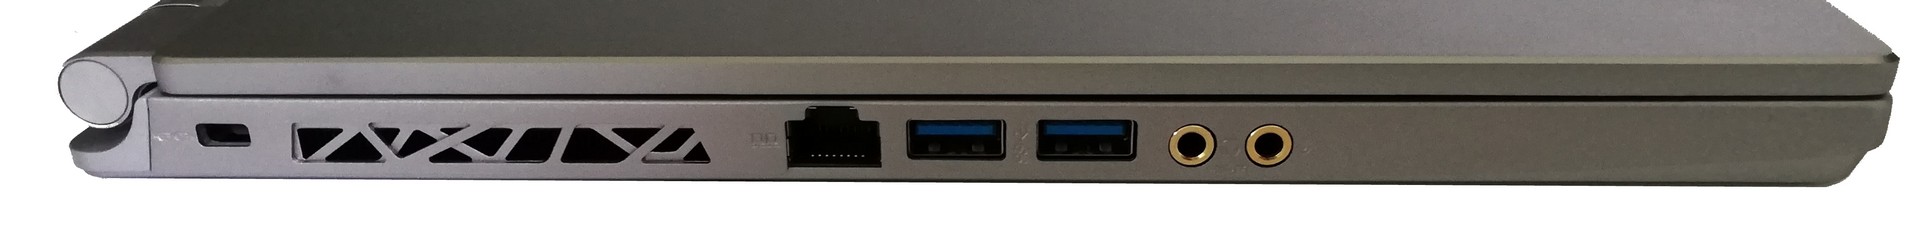
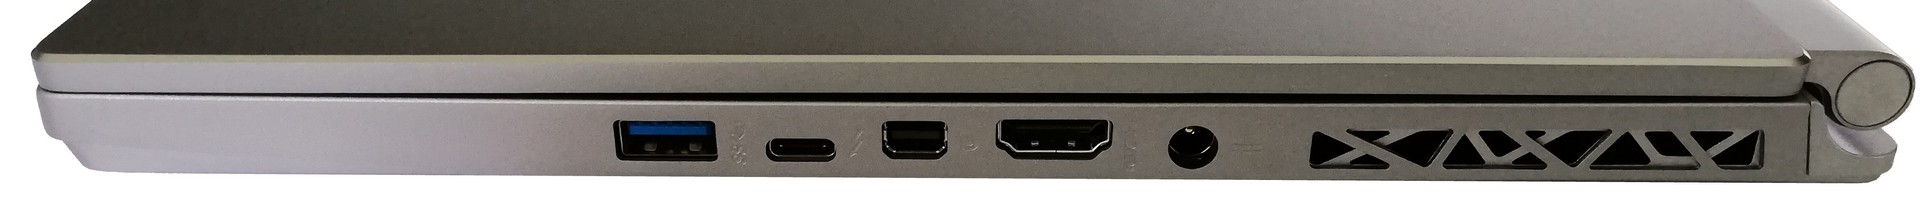
我们的评测显示,MSI P65 Creator 9SF是一款结构紧凑的高性能笔电。它的外观完全适合商务环境,做工精良。雷电3端口可确保用户能够继续满足未来的任何端口需求。
MSI P65 Creator 9SF以其迷人的设计和卓越的性能而引人注目。然而,制造商可以选择具有更高TDP的RTX 2070。
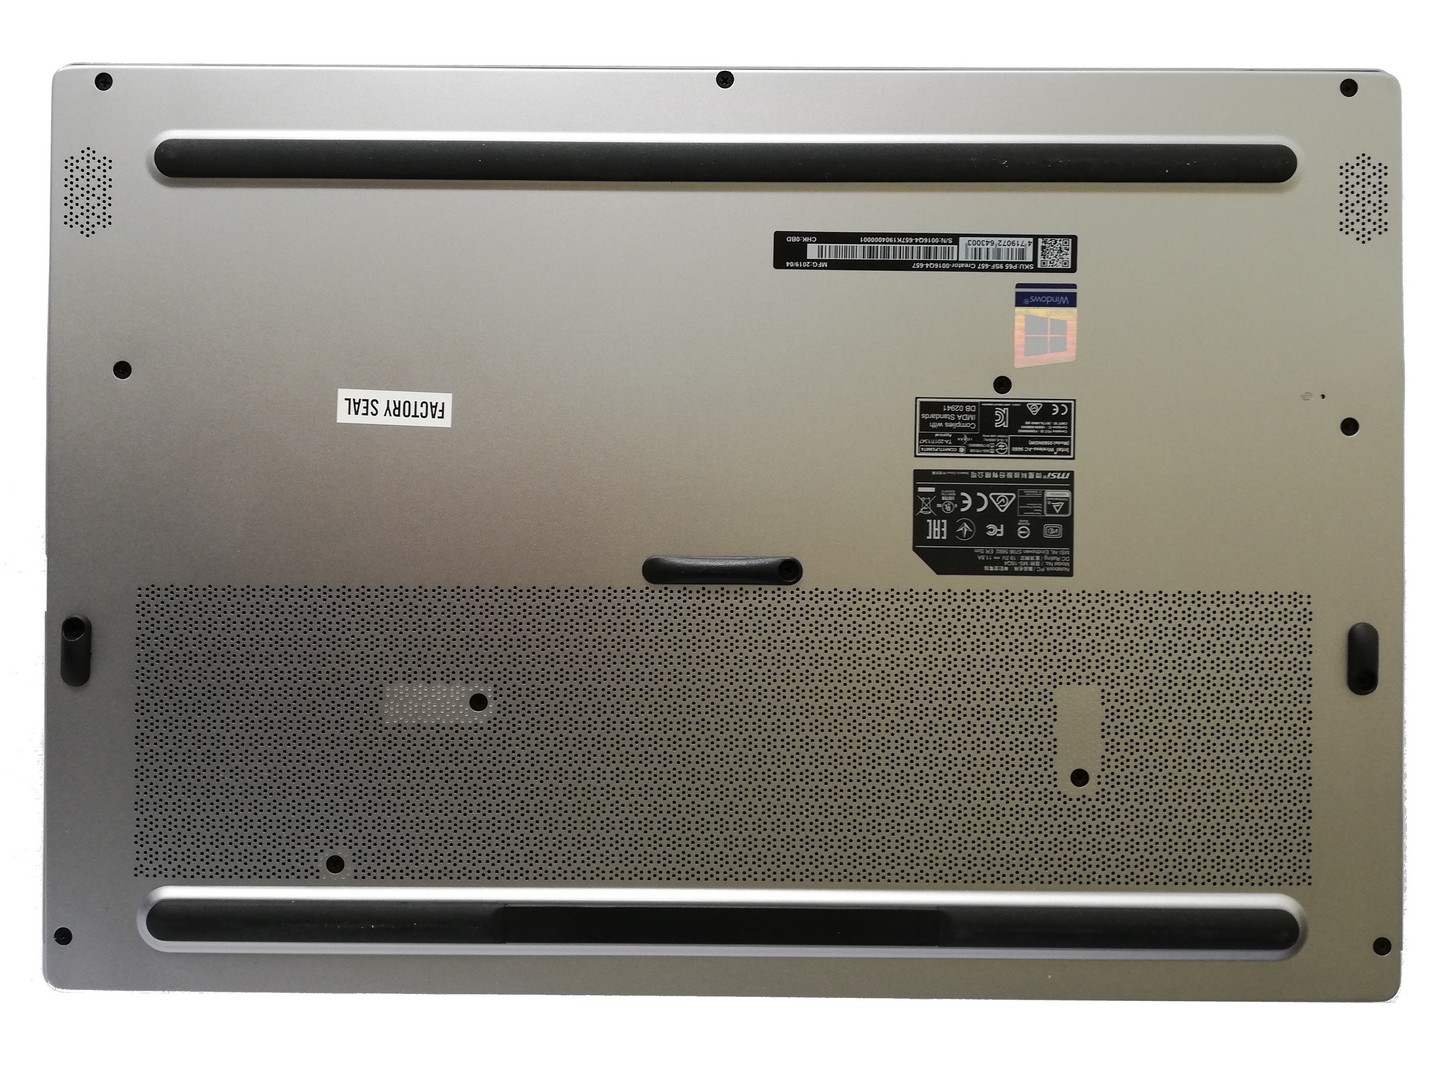
系统性能优秀,可以轻松跟上大多数竞争对手。然而,其他制造商却能设法从GPU中获得更多,P65 Creator则仅配备了RTX 2070 Max-Q的低TDP版本。与之前的型号一样,维护选项基本上不存在。我们的测试单元还继续采用集成在触摸板中的指纹识别器。后者比以前宽得多,因此为手势导航提供了更多空间。
MSI P65 Creator 9SF-657
- 10/25/2019 v7 (old)
Mike Wobker
Price comparison

