雷蛇灵刃15进阶版(RTX 2070 Max-Q,FHD)笔记本电脑评测
| |||||||||||||||||||||||||
Brightness Distribution: 90 %
Center on Battery: 314.7 cd/m²
Contrast: 828:1 (Black: 0.38 cd/m²)
ΔE ColorChecker Calman: 2.56 | ∀{0.5-29.43 Ø4.72}
calibrated: 1.71
ΔE Greyscale Calman: 3.4 | ∀{0.09-98 Ø4.97}
94.6% sRGB (Argyll 1.6.3 3D)
60.7% AdobeRGB 1998 (Argyll 1.6.3 3D)
66.3% AdobeRGB 1998 (Argyll 3D)
94.9% sRGB (Argyll 3D)
65.3% Display P3 (Argyll 3D)
Gamma: 2.3
CCT: 6435 K
| Razer Blade 15 RTX 2070 Max-Q LG Philips LGD05C0, IPS, 15.6", 1920x1080 | Alienware m15 GTX 1070 Max-Q AU Optronics B156HAN, IPS, 15.6", 1920x1080 | Razer Blade 15 2018 LGD05C0, IPS, 15.6", 1920x1080 | Apple MacBook Pro 15 2018 (2.6 GHz, 560X) APPA040, IPS, 15.4", 2880x1800 | MSI GS65 Stealth Thin 8RE-051US AUO80ED, IPS, 15.6", 1920x1080 | Gigabyte Aero 15X v8 LGD05C0, IPS, 15.6", 1920x1080 | |
|---|---|---|---|---|---|---|
| Display | -4% | -1% | 29% | -0% | -2% | |
| Display P3 Coverage (%) | 65.3 | 63.5 -3% | 64.3 -2% | 98.7 51% | 65.8 1% | 63.6 -3% |
| sRGB Coverage (%) | 94.9 | 89.4 -6% | 93.7 -1% | 99.9 5% | 92.1 -3% | 93.8 -1% |
| AdobeRGB 1998 Coverage (%) | 66.3 | 64.5 -3% | 65.5 -1% | 86.6 31% | 67 1% | 64.9 -2% |
| Response Times | -5% | -3% | -163% | -11% | 2% | |
| Response Time Grey 50% / Grey 80% * (ms) | 16.8 ? | 18 ? -7% | 17.2 ? -2% | 43.2 ? -157% | 20 ? -19% | 16.8 ? -0% |
| Response Time Black / White * (ms) | 11.6 ? | 12 ? -3% | 12 ? -3% | 31.2 ? -169% | 12 ? -3% | 11.2 ? 3% |
| PWM Frequency (Hz) | 117000 ? | |||||
| Screen | -17% | 2% | 43% | -12% | 20% | |
| Brightness middle (cd/m²) | 314.7 | 353.6 12% | 290 -8% | 520 65% | 250.9 -20% | 313 -1% |
| Brightness (cd/m²) | 312 | 346 11% | 281 -10% | 492 58% | 257 -18% | 300 -4% |
| Brightness Distribution (%) | 90 | 86 -4% | 82 -9% | 88 -2% | 83 -8% | 78 -13% |
| Black Level * (cd/m²) | 0.38 | 0.3 21% | 0.3 21% | 0.39 -3% | 0.32 16% | 0.33 13% |
| Contrast (:1) | 828 | 1179 42% | 967 17% | 1333 61% | 784 -5% | 948 14% |
| Colorchecker dE 2000 * | 2.56 | 4.55 -78% | 2.85 -11% | 1.2 53% | 2.77 -8% | 1.29 50% |
| Colorchecker dE 2000 max. * | 4.89 | 7.91 -62% | 6.27 -28% | 2.3 53% | 5.89 -20% | 2.04 58% |
| Colorchecker dE 2000 calibrated * | 1.71 | 3.37 -97% | 1.39 19% | 2.5 -46% | ||
| Greyscale dE 2000 * | 3.4 | 4.1 -21% | 2.4 29% | 1.3 62% | 4 -18% | 0.69 80% |
| Gamma | 2.3 96% | 2.27 97% | 2.34 94% | 2.18 101% | 2.27 97% | 2.43 91% |
| CCT | 6435 101% | 7434 87% | 6718 97% | 6738 96% | 6901 94% | 6550 99% |
| Color Space (Percent of AdobeRGB 1998) (%) | 60.7 | 57.9 -5% | 60 -1% | 60 -1% | 60 -1% | |
| Color Space (Percent of sRGB) (%) | 94.6 | 88.9 -6% | 94 -1% | 92 -3% | 94 -1% | |
| Total Average (Program / Settings) | -9% /
-13% | -1% /
1% | -30% /
8% | -8% /
-10% | 7% /
13% |
* ... smaller is better
Display Response Times
| ↔ Response Time Black to White | ||
|---|---|---|
| 11.6 ms ... rise ↗ and fall ↘ combined | ↗ 7.2 ms rise | 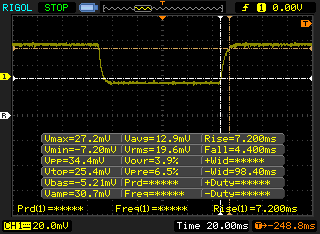 |
| ↘ 4.4 ms fall | ||
| The screen shows good response rates in our tests, but may be too slow for competitive gamers. In comparison, all tested devices range from 0.1 (minimum) to 240 (maximum) ms. » 31 % of all devices are better. This means that the measured response time is better than the average of all tested devices (19.8 ms). | ||
| ↔ Response Time 50% Grey to 80% Grey | ||
| 16.8 ms ... rise ↗ and fall ↘ combined | ↗ 9.2 ms rise | 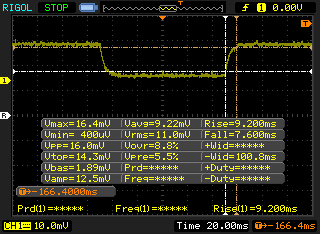 |
| ↘ 7.6 ms fall | ||
| The screen shows good response rates in our tests, but may be too slow for competitive gamers. In comparison, all tested devices range from 0.165 (minimum) to 636 (maximum) ms. » 31 % of all devices are better. This means that the measured response time is better than the average of all tested devices (31 ms). | ||
Screen Flickering / PWM (Pulse-Width Modulation)
| Screen flickering / PWM not detected | 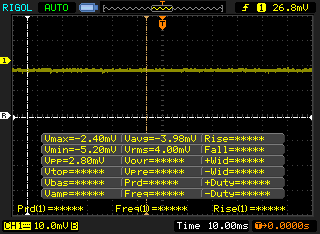 | ||
In comparison: 52 % of all tested devices do not use PWM to dim the display. If PWM was detected, an average of 7769 (minimum: 5 - maximum: 343500) Hz was measured. | |||
| Cinebench R11.5 | |
| CPU Single 64Bit | |
| no name | |
| Average Intel Core i7-8750H (1.89 - 2, n=40) | |
| Razer Blade Pro RZ09-0220 | |
| Asus GL702ZC-GC104T | |
| CPU Multi 64Bit | |
| Asus GL702ZC-GC104T | |
| no name | |
| Average Intel Core i7-8750H (9.54 - 13.5, n=41) | |
| Razer Blade Pro RZ09-0220 | |
| Cinebench R10 | |
| Rendering Multiple CPUs 32Bit | |
| no name | |
| Average Intel Core i7-8750H (29664 - 35307, n=25) | |
| Asus GL702ZC-GC104T | |
| Razer Blade Pro RZ09-0220 | |
| Rendering Single 32Bit | |
| no name | |
| Average Intel Core i7-8750H (6236 - 6645, n=25) | |
| Razer Blade Pro RZ09-0220 | |
| Asus GL702ZC-GC104T | |
| wPrime 2.10 - 1024m | |
| Razer Blade Pro RZ09-0220 | |
| Average Intel Core i7-8750H (125.5 - 180.5, n=6) | |
| no name | |
* ... smaller is better
| PCMark 8 Home Score Accelerated v2 | 4150 points | |
| PCMark 8 Work Score Accelerated v2 | 5607 points | |
| PCMark 10 Score | 5416 points | |
Help | ||
| Razer Blade 15 RTX 2070 Max-Q Samsung SSD PM981 MZVLB512HAJQ | Razer Blade 15 2018 Samsung PM961 NVMe MZVLW512HMJP | Apple MacBook Pro 15 2018 (2.6 GHz, 560X) Apple SSD AP0512 | Dell XPS 15 9570 Core i9 UHD Samsung SSD PM981 MZVLB1T0HALR | Alienware m15 GTX 1070 Max-Q Toshiba XG5 KXG50ZNV512G | |
|---|---|---|---|---|---|
| AS SSD | -7% | -78% | -6% | -45% | |
| Seq Read (MB/s) | 1840 | 2376 29% | 2239 22% | 1320 -28% | 1967 7% |
| Seq Write (MB/s) | 1822 | 1521 -17% | 1644 -10% | 1500 -18% | 1135 -38% |
| 4K Read (MB/s) | 52.3 | 46.45 -11% | 9.46 -82% | 30.73 -41% | 29.17 -44% |
| 4K Write (MB/s) | 110.7 | 93.6 -15% | 18.78 -83% | 94.4 -15% | 93.4 -16% |
| 4K-64 Read (MB/s) | 1126 | 1300 15% | 965 -14% | 1453 29% | 995 -12% |
| 4K-64 Write (MB/s) | 1717 | 1204 -30% | 163.5 -90% | 1815 6% | 656 -62% |
| Access Time Read * (ms) | 0.047 | 0.051 -9% | 0.225 -379% | 0.061 -30% | 0.116 -147% |
| Access Time Write * (ms) | 0.033 | 0.038 -15% | 0.044 -33% | 0.063 -91% | |
| Score Read (Points) | 1362 | 1584 16% | 1199 -12% | 1616 19% | 1221 -10% |
| Score Write (Points) | 2010 | 1450 -28% | 347 -83% | 2059 2% | 862 -57% |
| Score Total (Points) | 4079 | 3806 -7% | 2119 -48% | 4507 10% | 2667 -35% |
| Copy ISO MB/s (MB/s) | 1975 | 2577 30% | 642 -67% | ||
| Copy Program MB/s (MB/s) | 526 | 515 -2% | 431.5 -18% | ||
| Copy Game MB/s (MB/s) | 1200 | 1120 -7% | 706 -41% |
* ... smaller is better

| 3DMark | |
| 1280x720 Cloud Gate Standard Graphics | |
| Asus ROG Strix RTX 2070 OC | |
| Acer Triton 500 | |
| Asus Zephyrus GX501 | |
| Asus ROG G703GX | |
| Razer Blade Pro 2017 | |
| Razer Blade 15 RTX 2070 Max-Q | |
| Schenker XMG Ultra 15 | |
| Razer Blade 15 2018 | |
| Average NVIDIA GeForce RTX 2070 Max-Q (39014 - 134255, n=28) | |
| Razer Blade 15 Base Model | |
| Lenovo Legion Y730-15ICH i5-8300H | |
| Razer Blade (2017) UHD | |
| Dell XPS 15 9570 Core i9 UHD | |
| MSI GF63 8RC-040XPL | |
| 1920x1080 Fire Strike Graphics | |
| Asus ROG G703GX | |
| Asus ROG Strix RTX 2070 OC | |
| Acer Triton 500 | |
| Razer Blade Pro 2017 | |
| Asus Zephyrus GX501 | |
| Razer Blade 15 RTX 2070 Max-Q | |
| Average NVIDIA GeForce RTX 2070 Max-Q (11563 - 21191, n=31) | |
| Razer Blade 15 2018 | |
| Schenker XMG Ultra 15 | |
| Razer Blade 15 Base Model | |
| Razer Blade (2017) UHD | |
| Lenovo Legion Y730-15ICH i5-8300H | |
| Dell XPS 15 9570 Core i9 UHD | |
| MSI GF63 8RC-040XPL | |
| 2560x1440 Port Royal Graphics | |
| Asus ROG G703GX | |
| Acer Triton 500 | |
| Average NVIDIA GeForce RTX 2070 Max-Q (3240 - 4742, n=23) | |
| Razer Blade 15 RTX 2070 Max-Q | |
| Schenker XMG Ultra 15 | |
| 3DMark 11 Performance | 17689 points | |
| 3DMark Cloud Gate Standard Score | 29109 points | |
| 3DMark Fire Strike Score | 15428 points | |
| 3DMark Fire Strike Extreme Score | 8041 points | |
| 3DMark Time Spy Score | 6367 points | |
Help | ||
| The Witcher 3 - 1920x1080 Ultra Graphics & Postprocessing (HBAO+) | |
| Asus ROG G703GX | |
| Asus ROG Strix RTX 2070 OC | |
| Acer Triton 500 | |
| MSI GS75 8SG Stealth | |
| Razer Blade 15 RTX 2070 Max-Q | |
| Razer Blade Pro 2017 | |
| Asus Zephyrus GX501 | |
| Alienware 17 R5 | |
| Schenker XMG Ultra 15 | |
| Razer Blade 15 2018 | |
| Razer Blade 15 Base Model | |
| Razer Blade Pro RZ09-0220 | |
| Asus GL702ZC-GC104T | |
| Lenovo Legion Y730-15ICH i5-8300H | |
| Lenovo ThinkPad X1 Extreme-20MF000RGE | |
| Apple MacBook Pro 15 2018 (2.6 GHz, 560X) | |
| Rise of the Tomb Raider - 1920x1080 Very High Preset AA:FX AF:16x | |
| Asus ROG Strix RTX 2070 OC | |
| Asus Zephyrus GX501 | |
| Razer Blade 15 RTX 2070 Max-Q | |
| Razer Blade 15 Base Model | |
| Razer Blade Pro RZ09-0220 | |
| Asus GL702ZC-GC104T | |
| Lenovo Legion Y730-15ICH i5-8300H | |
| Apple MacBook Pro 15 2018 (2.6 GHz, 560X) | |
| low | med. | high | ultra | |
|---|---|---|---|---|
| BioShock Infinite (2013) | 290.8 | 260.1 | 246.1 | 152.5 |
| The Witcher 3 (2015) | 252.5 | 208.9 | 130.1 | 68.9 |
| Rise of the Tomb Raider (2016) | 204.2 | 157.8 | 121.9 | 103.9 |
| Razer Blade 15 RTX 2070 Max-Q GeForce RTX 2070 Max-Q, i7-8750H, Samsung SSD PM981 MZVLB512HAJQ | Razer Blade 15 2018 GeForce GTX 1070 Max-Q, i7-8750H, Samsung PM961 NVMe MZVLW512HMJP | Alienware m15 GTX 1070 Max-Q GeForce GTX 1070 Max-Q, i7-8750H, Toshiba XG5 KXG50ZNV512G | Dell XPS 15 9570 Core i9 UHD GeForce GTX 1050 Ti Max-Q, i9-8950HK, Samsung SSD PM981 MZVLB1T0HALR | Gigabyte Aero 15X v8 GeForce GTX 1070 Max-Q, i7-8750H, Toshiba NVMe THNSN5512GPU7 | MSI GS65 Stealth Thin 8RE-051US GeForce GTX 1060 Mobile, i7-8750H, Samsung SSD PM981 MZVLB256HAHQ | |
|---|---|---|---|---|---|---|
| Noise | -12% | -5% | -2% | -16% | -4% | |
| off / environment * (dB) | 28.8 | 29 -1% | 28.6 1% | 28.2 2% | 29 -1% | 28.4 1% |
| Idle Minimum * (dB) | 28.8 | 29 -1% | 28.6 1% | 28.5 1% | 30 -4% | 28.4 1% |
| Idle Average * (dB) | 28.8 | 30 -4% | 28.6 1% | 28.6 1% | 31 -8% | 28.4 1% |
| Idle Maximum * (dB) | 29.4 | 38 -29% | 28.6 3% | 28.8 2% | 35 -19% | 29.6 -1% |
| Load Average * (dB) | 35.7 | 46 -29% | 40.8 -14% | 36.2 -1% | 49 -37% | 43.5 -22% |
| Witcher 3 ultra * (dB) | 42.5 | 49 -15% | 49.6 -17% | 47.6 -12% | 51 -20% | 45.7 -8% |
| Load Maximum * (dB) | 45 | 46 -2% | 49.6 -10% | 47.6 -6% | 54 -20% | 45.7 -2% |
* ... smaller is better
Noise level
| Idle |
| 28.8 / 28.8 / 29.4 dB(A) |
| Load |
| 35.7 / 45 dB(A) |
 | ||
30 dB silent 40 dB(A) audible 50 dB(A) loud |
||
min: | ||
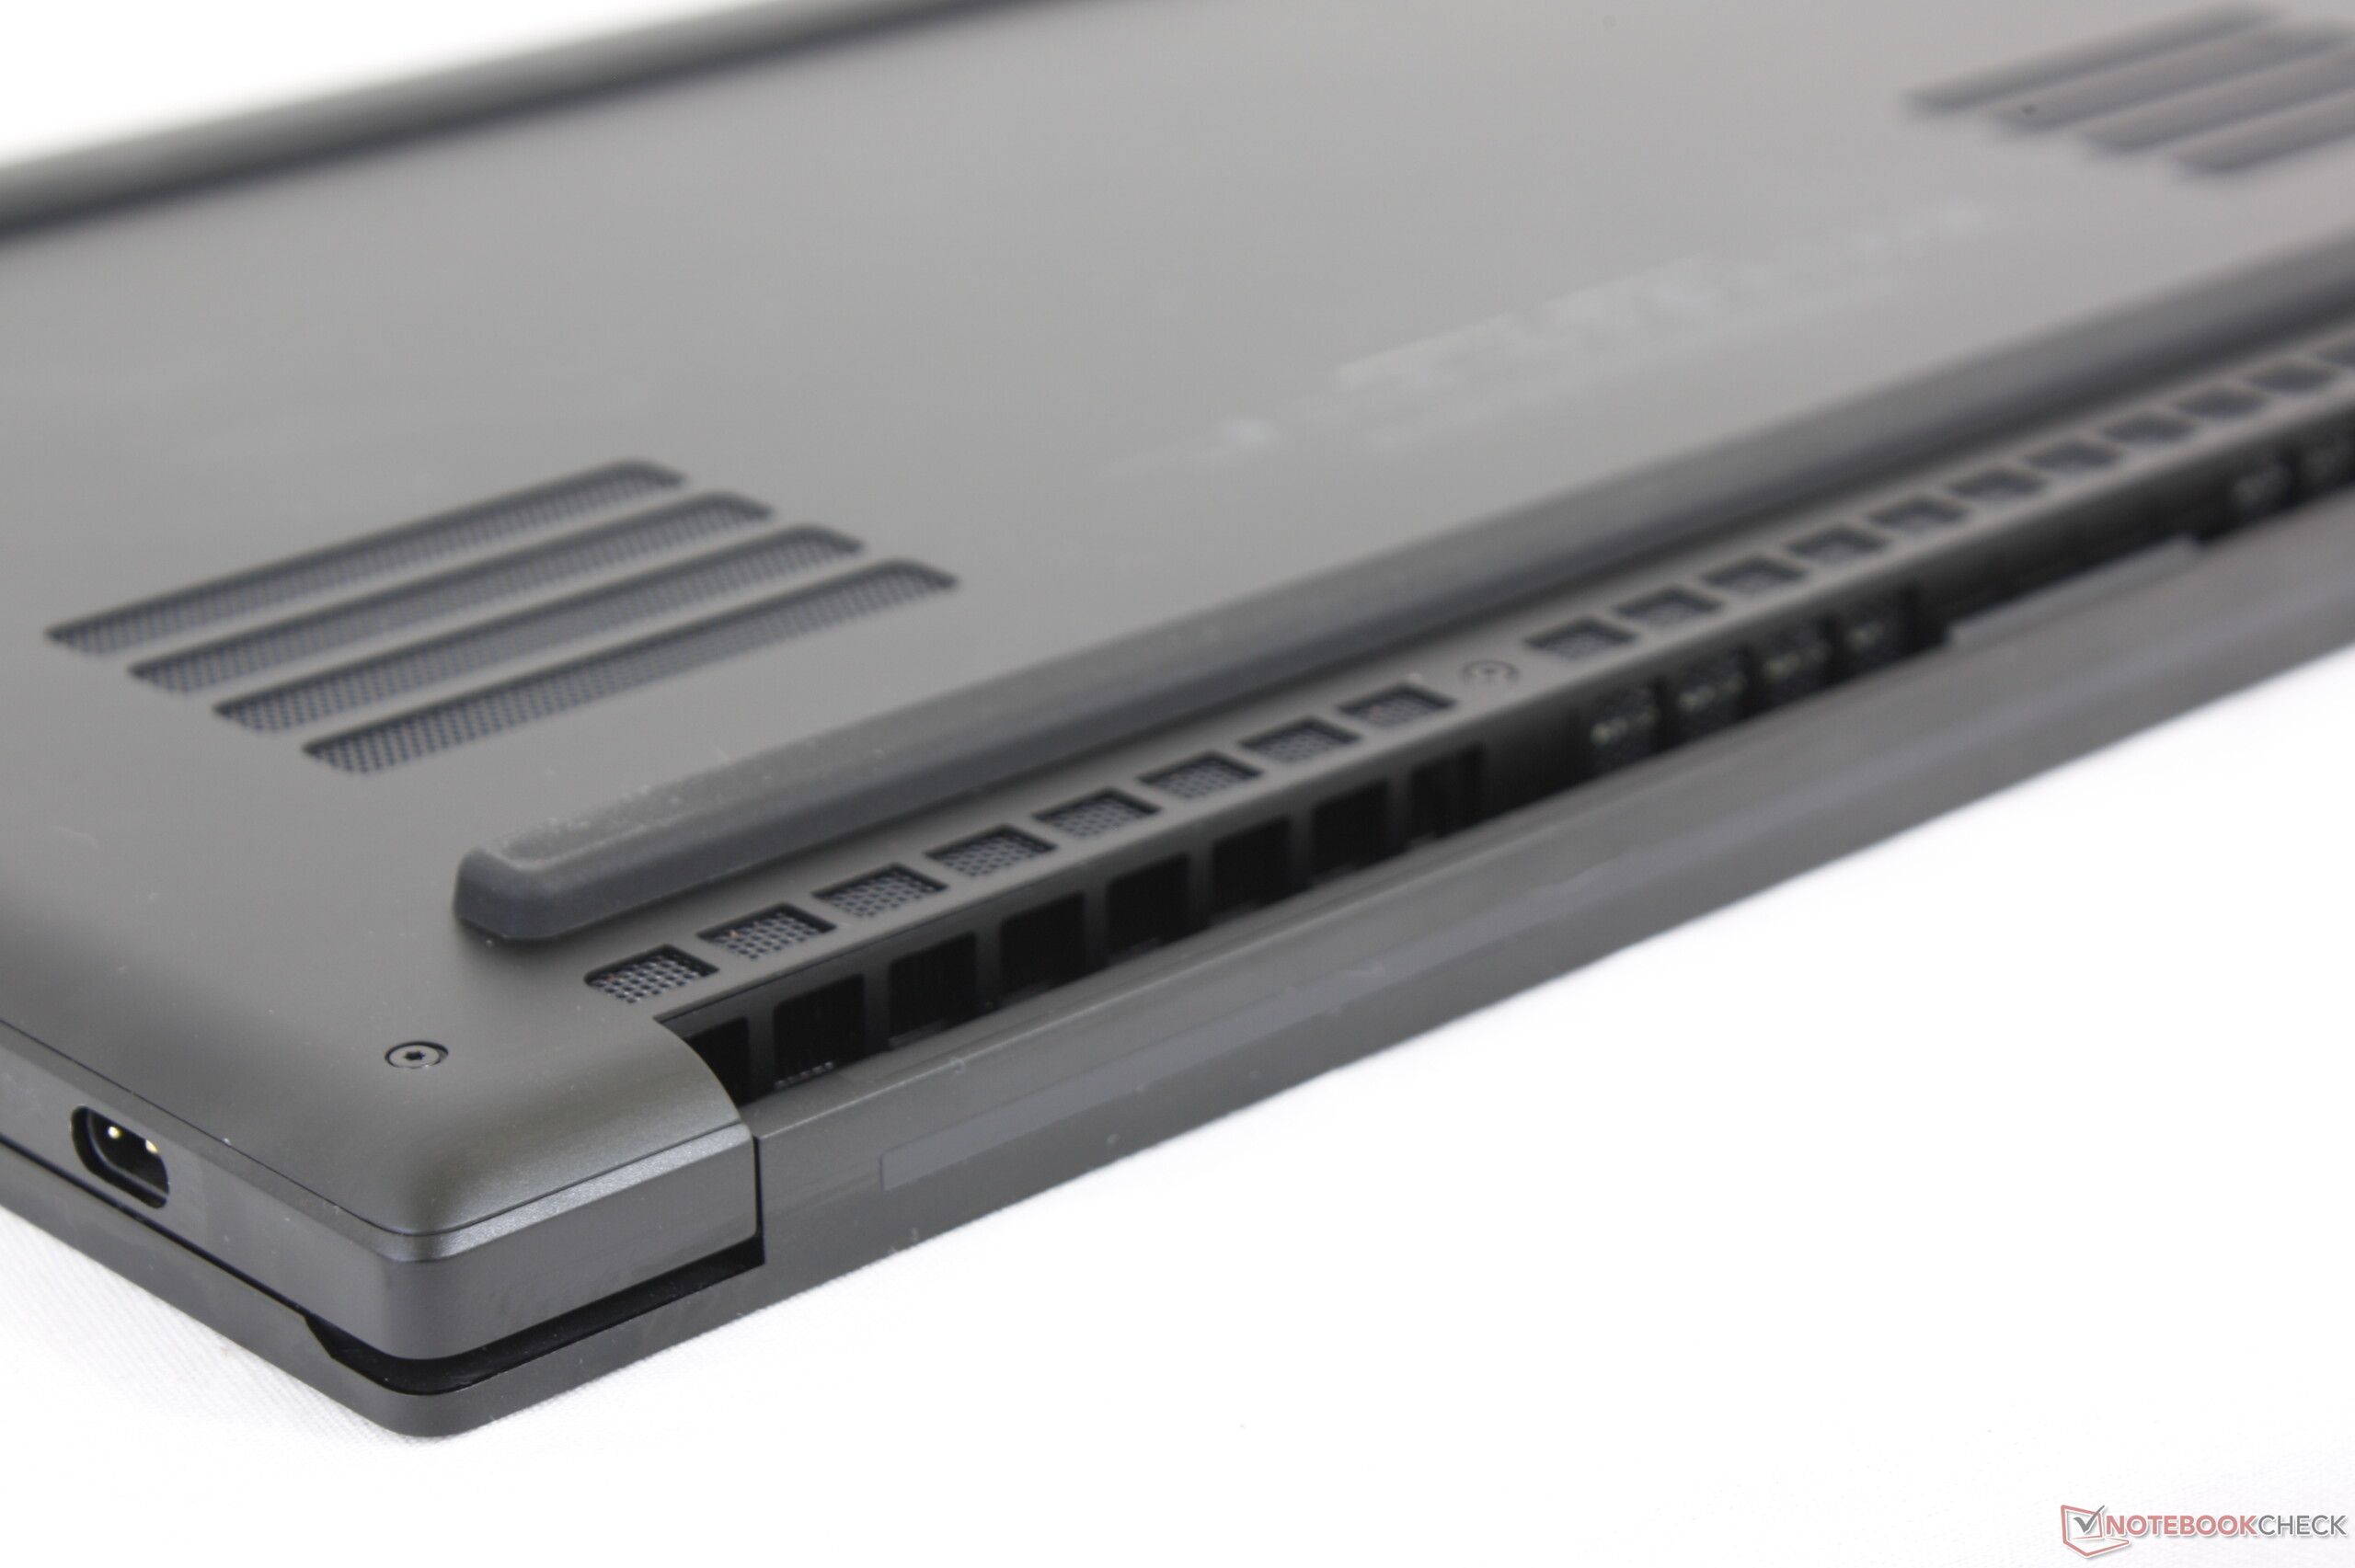
(-) The maximum temperature on the upper side is 49 °C / 120 F, compared to the average of 40.4 °C / 105 F, ranging from 21.2 to 68.8 °C for the class Gaming.
(-) The bottom heats up to a maximum of 49 °C / 120 F, compared to the average of 43.2 °C / 110 F
(+) In idle usage, the average temperature for the upper side is 24.9 °C / 77 F, compared to the device average of 33.9 °C / 93 F.
(±) Playing The Witcher 3, the average temperature for the upper side is 35.8 °C / 96 F, compared to the device average of 33.9 °C / 93 F.
(+) The palmrests and touchpad are reaching skin temperature as a maximum (34.2 °C / 93.6 F) and are therefore not hot.
(-) The average temperature of the palmrest area of similar devices was 28.8 °C / 83.8 F (-5.4 °C / -9.8 F).
Razer Blade 15 RTX 2070 Max-Q audio analysis
(-) | not very loud speakers (71.6 dB)
Bass 100 - 315 Hz
(±) | reduced bass - on average 7.7% lower than median
(±) | linearity of bass is average (11.1% delta to prev. frequency)
Mids 400 - 2000 Hz
(±) | higher mids - on average 7.8% higher than median
(±) | linearity of mids is average (9.5% delta to prev. frequency)
Highs 2 - 16 kHz
(+) | balanced highs - only 3% away from median
(±) | linearity of highs is average (7.2% delta to prev. frequency)
Overall 100 - 16.000 Hz
(±) | linearity of overall sound is average (23.9% difference to median)
Compared to same class
» 86% of all tested devices in this class were better, 5% similar, 9% worse
» The best had a delta of 6%, average was 18%, worst was 132%
Compared to all devices tested
» 72% of all tested devices were better, 6% similar, 22% worse
» The best had a delta of 4%, average was 24%, worst was 134%
Apple MacBook 12 (Early 2016) 1.1 GHz audio analysis
(+) | speakers can play relatively loud (83.6 dB)
Bass 100 - 315 Hz
(±) | reduced bass - on average 11.3% lower than median
(±) | linearity of bass is average (14.2% delta to prev. frequency)
Mids 400 - 2000 Hz
(+) | balanced mids - only 2.4% away from median
(+) | mids are linear (5.5% delta to prev. frequency)
Highs 2 - 16 kHz
(+) | balanced highs - only 2% away from median
(+) | highs are linear (4.5% delta to prev. frequency)
Overall 100 - 16.000 Hz
(+) | overall sound is linear (10.2% difference to median)
Compared to same class
» 7% of all tested devices in this class were better, 2% similar, 91% worse
» The best had a delta of 5%, average was 18%, worst was 53%
Compared to all devices tested
» 5% of all tested devices were better, 1% similar, 94% worse
» The best had a delta of 4%, average was 24%, worst was 134%
| Off / Standby | |
| Idle | |
| Load |
|
Key:
min: | |
| Razer Blade 15 RTX 2070 Max-Q i7-8750H, GeForce RTX 2070 Max-Q, Samsung SSD PM981 MZVLB512HAJQ, IPS, 1920x1080, 15.6" | Razer Blade 15 2018 i7-8750H, GeForce GTX 1070 Max-Q, Samsung PM961 NVMe MZVLW512HMJP, IPS, 1920x1080, 15.6" | Apple MacBook Pro 15 2018 (2.6 GHz, 560X) i7-8850H, Radeon Pro 560X, Apple SSD AP0512, IPS, 2880x1800, 15.4" | MSI GS65 Stealth Thin 8RE-051US i7-8750H, GeForce GTX 1060 Mobile, Samsung SSD PM981 MZVLB256HAHQ, IPS, 1920x1080, 15.6" | Gigabyte Aero 15X v8 i7-8750H, GeForce GTX 1070 Max-Q, Toshiba NVMe THNSN5512GPU7, IPS, 1920x1080, 15.6" | Alienware m15 GTX 1070 Max-Q i7-8750H, GeForce GTX 1070 Max-Q, Toshiba XG5 KXG50ZNV512G, IPS, 1920x1080, 15.6" | |
|---|---|---|---|---|---|---|
| Power Consumption | -13% | 32% | 9% | -14% | 7% | |
| Idle Minimum * (Watt) | 10.4 | 14 -35% | 3.4 67% | 8.7 16% | 14 -35% | 7.6 27% |
| Idle Average * (Watt) | 14.6 | 17 -16% | 11 25% | 13 11% | 18 -23% | 13.8 5% |
| Idle Maximum * (Watt) | 16.3 | 21 -29% | 14.9 9% | 14.3 12% | 22 -35% | 14.6 10% |
| Load Average * (Watt) | 88.5 | 95 -7% | 78.9 11% | 107.4 -21% | 91 -3% | 97.6 -10% |
| Witcher 3 ultra * (Watt) | 155.4 | 141 9% | 129 17% | 142 9% | 145.8 6% | |
| Load Maximum * (Watt) | 182.4 | 179 2% | 91.2 50% | 151.5 17% | 173 5% | 172.5 5% |
* ... smaller is better
| Razer Blade 15 RTX 2070 Max-Q i7-8750H, GeForce RTX 2070 Max-Q, 80 Wh | Razer Blade 15 2018 i7-8750H, GeForce GTX 1070 Max-Q, 80 Wh | Apple MacBook Pro 15 2018 (2.6 GHz, 560X) i7-8850H, Radeon Pro 560X, 83 Wh | MSI GS65 Stealth Thin 8RE-051US i7-8750H, GeForce GTX 1060 Mobile, 82 Wh | Alienware m15 GTX 1070 Max-Q i7-8750H, GeForce GTX 1070 Max-Q, 90 Wh | Gigabyte Aero 15X v8 i7-8750H, GeForce GTX 1070 Max-Q, 94.24 Wh | |
|---|---|---|---|---|---|---|
| Battery runtime | -27% | 57% | -13% | 8% | 39% | |
| Reader / Idle (h) | 11.4 | 6.4 -44% | 10.5 -8% | 12.7 11% | ||
| WiFi v1.3 (h) | 6.5 | 5.4 -17% | 10.2 57% | 6.2 -5% | 7.7 18% | 8.6 32% |
| Load (h) | 1.5 | 1.2 -20% | 1.2 -20% | 1.7 13% | 2.6 73% | |
| Witcher 3 ultra (h) | 1.5 |
Pros
Cons
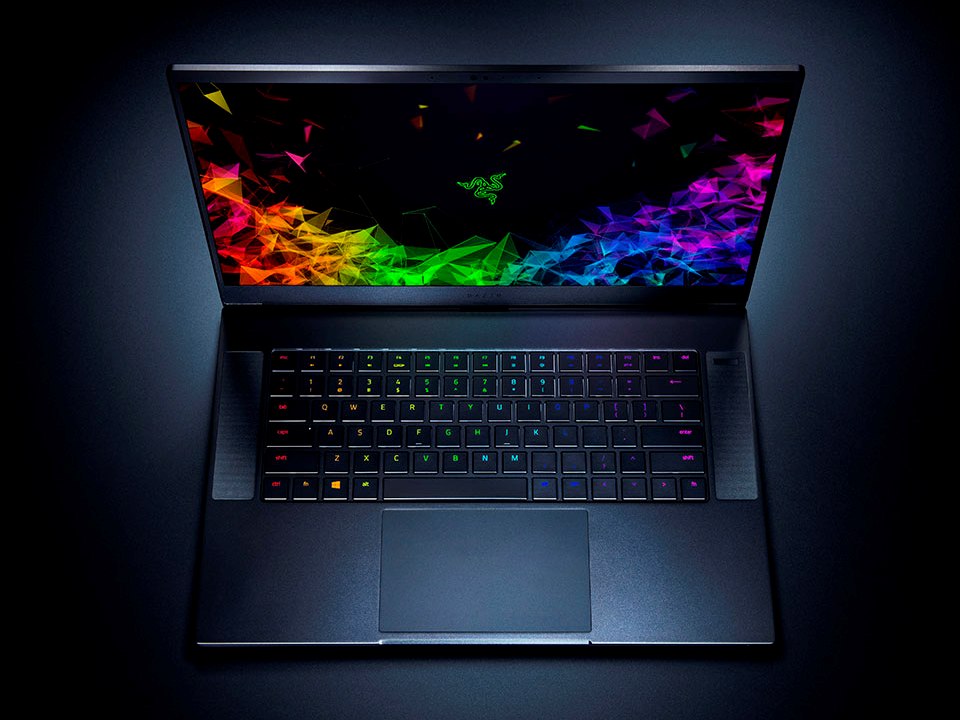
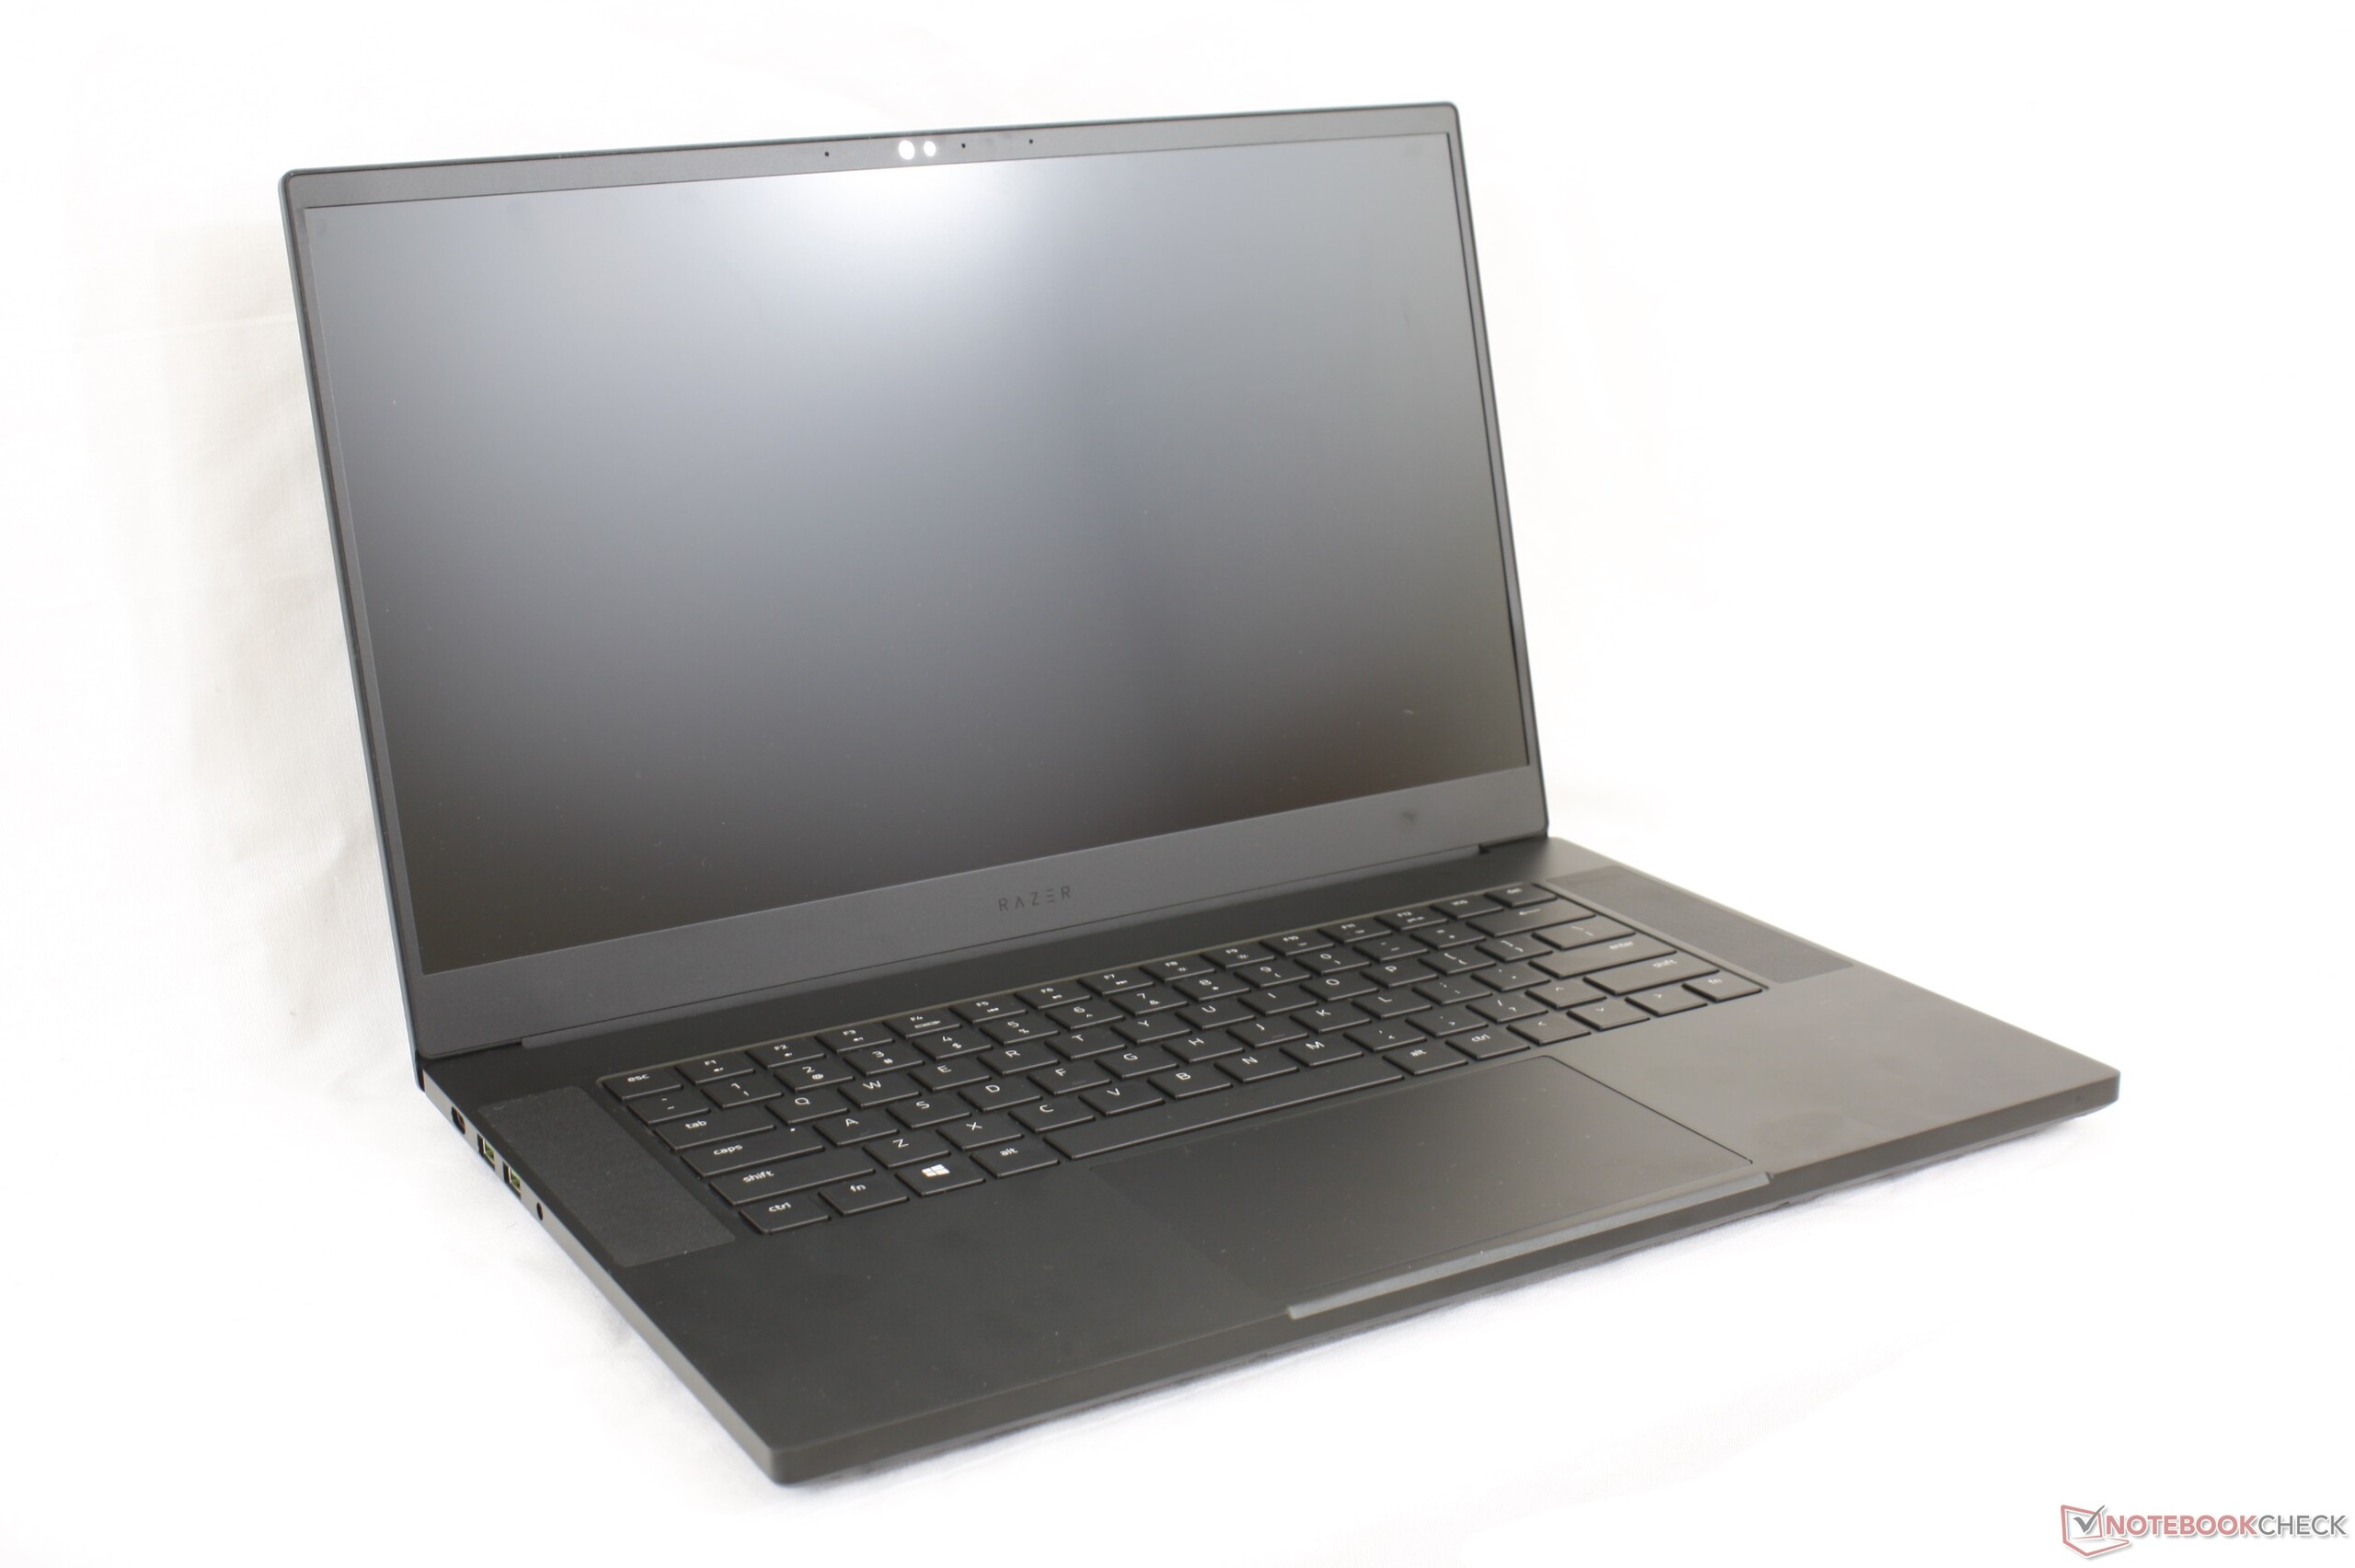
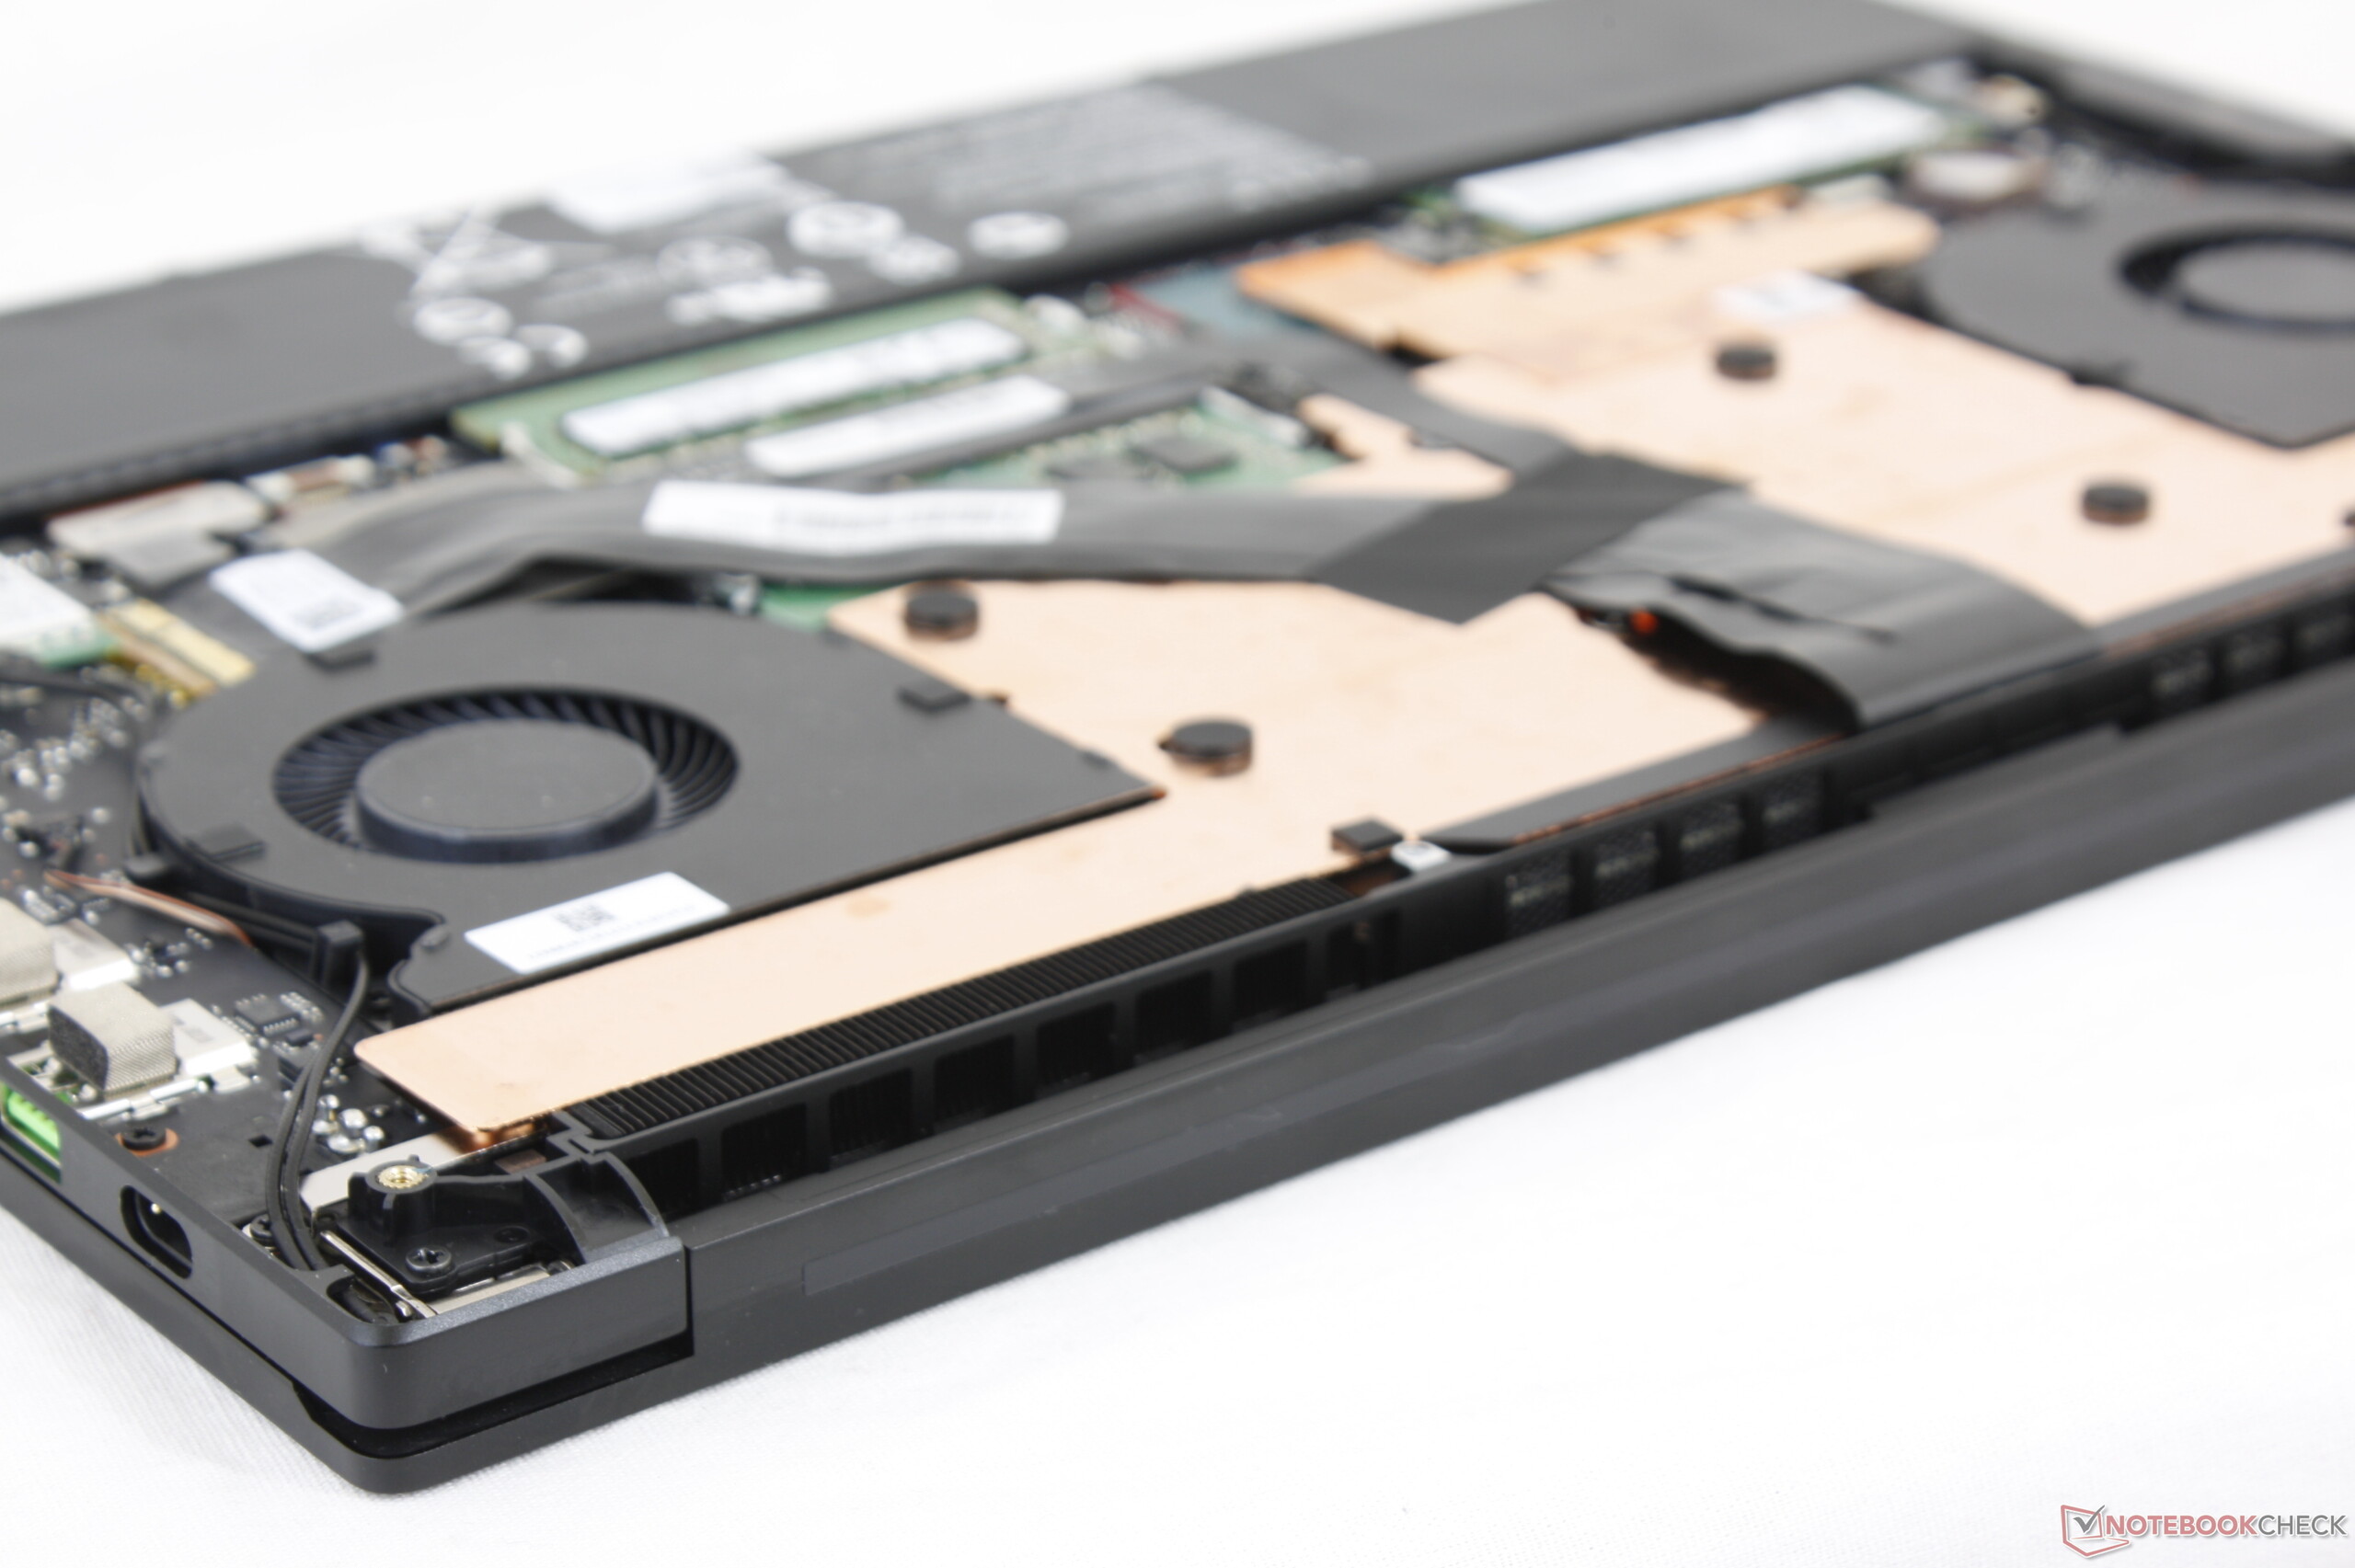
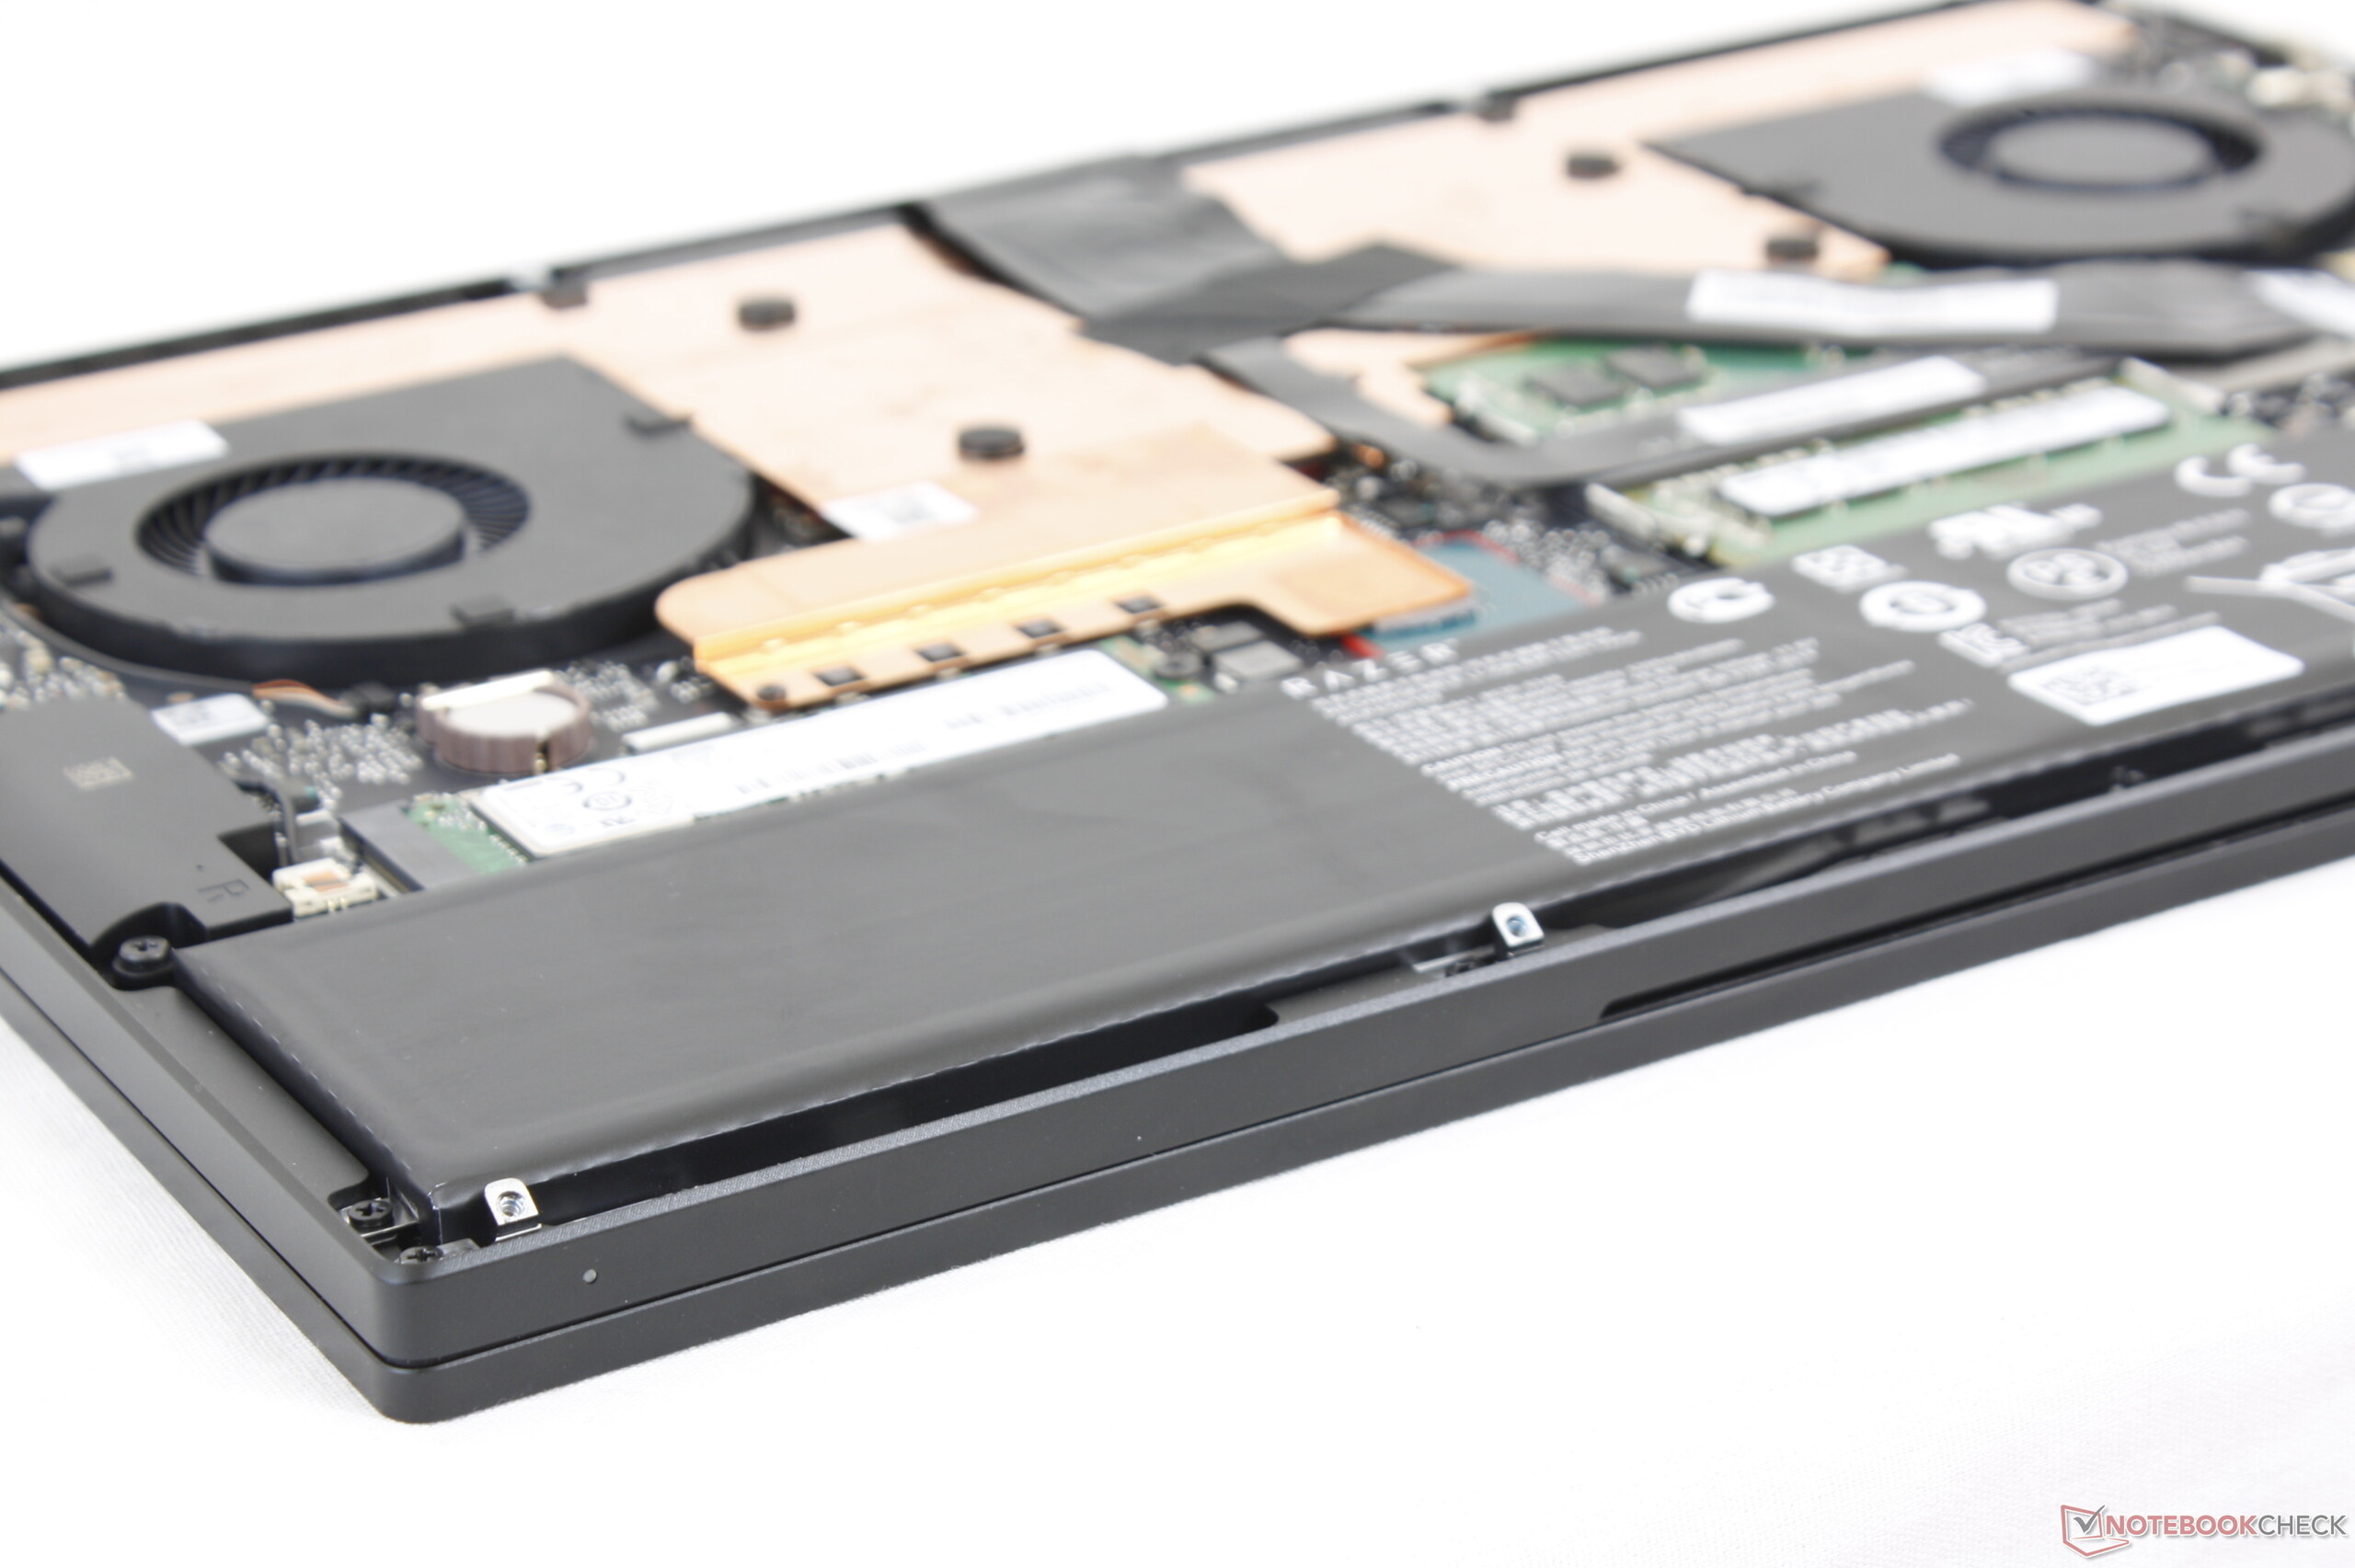
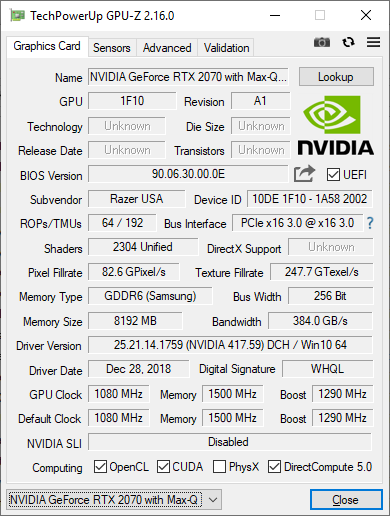
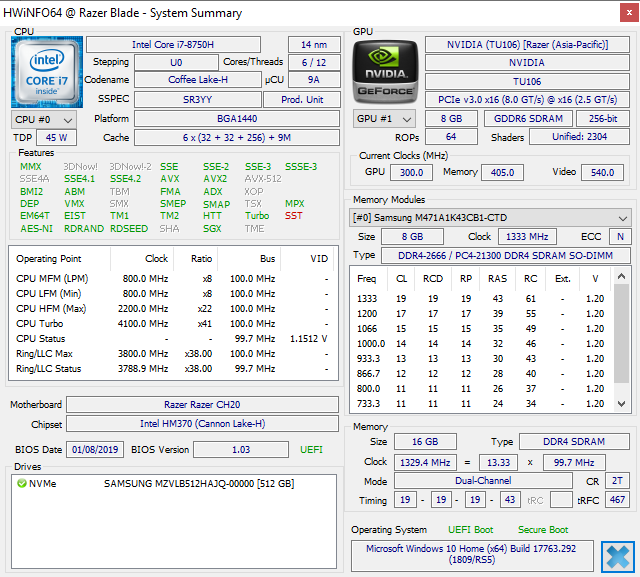
我们将2018年款Blade 15评为最好的超薄游戏笔记本电脑之一,这款早期的2019型号也不例外。去年的Blade 15高级型号的所有主要优点(轻薄而坚固的机身,窄边框,预校准显示)和缺点(短键程,有限的CPU Turbo Boost,无SD读卡器,RJ-45或二级存储)仍然存在新款上仍然存在。除了预期的GPU升级之外,Razer还默默地将WLAN和存储从Intel 9260更新到Intel 9560和从Samsung PM961升级到PM981。
就GPU而言,RTX 2070 Max-Q比GTX 1070 Max-Q更强,而不会运行更大声或是更热。在不考虑任何光线跟踪功能的情况下,整体游戏性能与GTX 1080 Max-Q笔记本电脑非常相近。因此,除非光线跟踪或DLSS是必备功能(让我们面对这样一个事实——99%的PC游戏仍然不支持这项技术),性能仅比便宜得多的Blade 15 GTX 1070 Max-Q强15%左右。超薄游戏笔记本电脑市场上的用户实际上会发现较旧的Blade 15高级版更加引人注目。
“没有太大改变,但它也没有什么必要。现在,使用Nvidia RTX显卡的型号拥有老款Blade 15的一切优点。如果对RTX技术不感兴趣,那么视觉上相同且更便宜的2018 Blade 15高级版在大多数情况下可以提供与RTX 2070 Max-Q几乎相同的游戏体验。”
Razer Blade 15 RTX 2070 Max-Q
- 09/20/2019 v7 (old)
Allen Ngo
Price comparison

