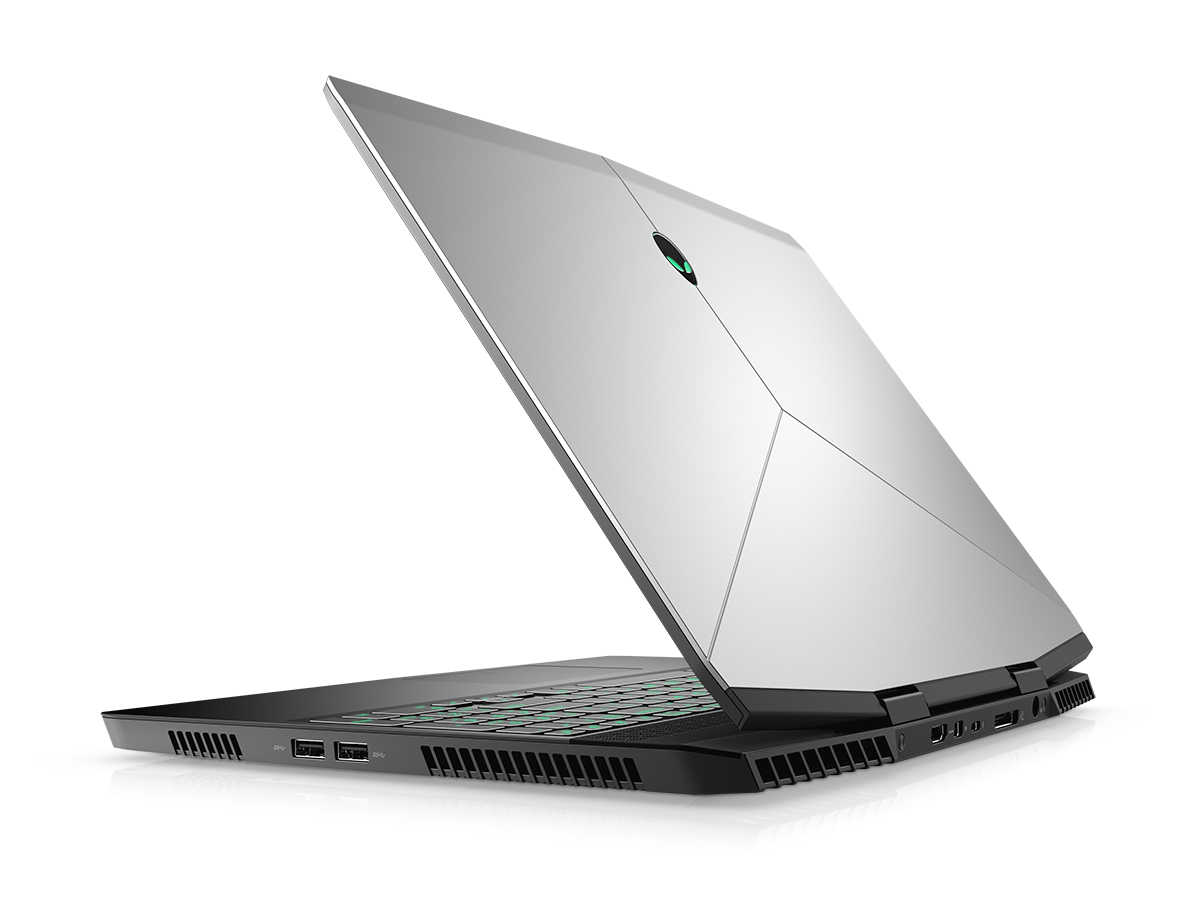
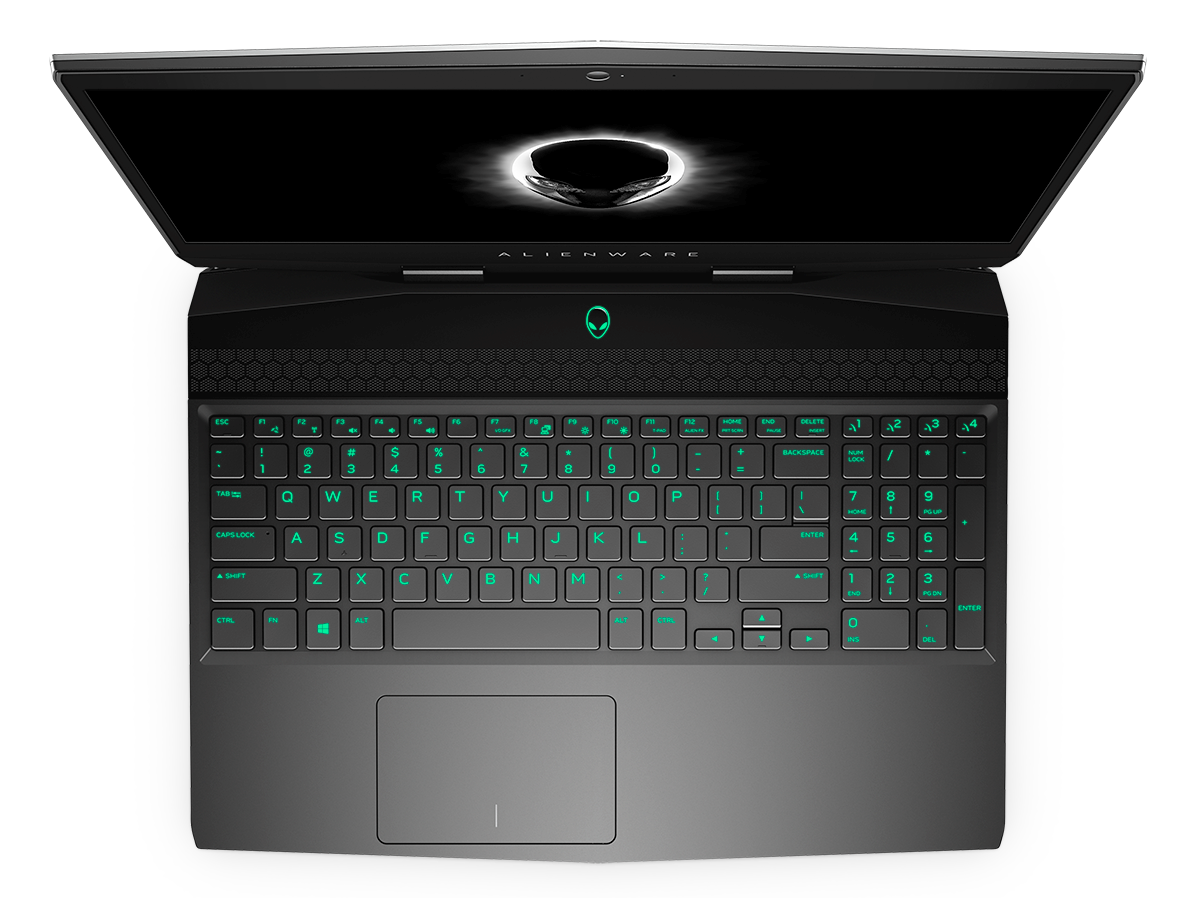
Alienware外星人m15 P79F (i7-8750H, RTX 2070 Max-Q, OLED) 笔记本电脑评测

| Networking | |
| iperf3 transmit AX12 | |
| Razer Blade 15 RTX 2080 Max-Q | |
| Asus Zephyrus S GX502GW | |
| Alienware m15 GTX 1070 Max-Q | |
| Alienware m15 P79F | |
| iperf3 receive AX12 | |
| Alienware m15 GTX 1070 Max-Q | |
| Razer Blade 15 RTX 2080 Max-Q | |
| Asus Zephyrus S GX502GW | |
| Alienware m15 P79F | |
| |||||||||||||||||||||||||
Brightness Distribution: 90 %
Center on Battery: 452.1 cd/m²
Contrast: ∞:1 (Black: 0 cd/m²)
ΔE ColorChecker Calman: 6.34 | ∀{0.5-29.43 Ø4.73}
ΔE Greyscale Calman: 2.8 | ∀{0.09-98 Ø4.97}
100% sRGB (Argyll 1.6.3 3D)
91% AdobeRGB 1998 (Argyll 1.6.3 3D)
100% AdobeRGB 1998 (Argyll 3D)
100% sRGB (Argyll 3D)
99.9% Display P3 (Argyll 3D)
Gamma: 2.21
CCT: 6114 K
| Alienware m15 P79F Samsung SDCA029, 156WR04, OLED, 15.6", 3840x2160 | Alienware m15 GTX 1070 Max-Q AU Optronics B156HAN, IPS, 15.6", 1920x1080 | Asus Zephyrus S GX502GW AU Optronics B156HAN08.2 (AUO82ED), IPS, 15.6", 1920x1080 | Aorus 15 W9 LG Philips LP156WFG-SPB2 (LGD05E8), IPS, 15.6", 1920x1080 | Dell XPS 15 9570 Core i9 UHD LQ156D1, IPS, 15.6", 3840x2160 | Lenovo Legion Y740-15ICHg LP156WFG-SPB2, IPS, 15.6", 1920x1080 | |
|---|---|---|---|---|---|---|
| Display | -27% | -26% | -25% | -14% | -26% | |
| Display P3 Coverage (%) | 99.9 | 63.5 -36% | 64.9 -35% | 64.3 -36% | 79.6 -20% | 63.5 -36% |
| sRGB Coverage (%) | 100 | 89.4 -11% | 91 -9% | 93.5 -6% | 98.4 -2% | 92.4 -8% |
| AdobeRGB 1998 Coverage (%) | 100 | 64.5 -35% | 65.9 -34% | 65.6 -34% | 79.7 -20% | 64.7 -35% |
| Response Times | -507% | -230% | -502% | -1595% | -549% | |
| Response Time Grey 50% / Grey 80% * (ms) | 2.6 ? | 18 ? -592% | 7.2 ? -177% | 16.8 ? -546% | 52.4 ? -1915% | 18.8 ? -623% |
| Response Time Black / White * (ms) | 2.3 ? | 12 ? -422% | 8.8 ? -283% | 12.8 ? -457% | 31.6 ? -1274% | 13.2 ? -474% |
| PWM Frequency (Hz) | 60.2 ? | 1000 ? | ||||
| Screen | -9% | 4% | -15% | -28% | -4% | |
| Brightness middle (cd/m²) | 452.1 | 353.6 -22% | 286 -37% | 295 -35% | 451.9 0% | 320.4 -29% |
| Brightness (cd/m²) | 452 | 346 -23% | 275 -39% | 292 -35% | 414 -8% | 298 -34% |
| Brightness Distribution (%) | 90 | 86 -4% | 90 0% | 80 -11% | 81 -10% | 85 -6% |
| Black Level * (cd/m²) | 0.3 | 0.37 | 0.34 | 0.36 | 0.42 | |
| Colorchecker dE 2000 * | 6.34 | 4.55 28% | 2.19 65% | 3.89 39% | 5.62 11% | 3.21 49% |
| Colorchecker dE 2000 max. * | 12.97 | 7.91 39% | 4.4 66% | 7.28 44% | 19.1 -47% | 5.54 57% |
| Greyscale dE 2000 * | 2.8 | 4.1 -46% | 2.2 21% | 4.98 -78% | 6.9 -146% | 3.6 -29% |
| Gamma | 2.21 100% | 2.27 97% | 2.41 91% | 2.45 90% | 2.2 100% | 2.27 97% |
| CCT | 6114 106% | 7434 87% | 6405 101% | 6407 101% | 6254 104% | 6503 100% |
| Color Space (Percent of AdobeRGB 1998) (%) | 91 | 57.9 -36% | 59 -35% | 60 -34% | 71.8 -21% | 59 -35% |
| Color Space (Percent of sRGB) (%) | 100 | 88.9 -11% | 91 -9% | 93 -7% | 98.5 -1% | 92 -8% |
| Contrast (:1) | 1179 | 773 | 868 | 1255 | 763 | |
| Colorchecker dE 2000 calibrated * | 3.37 | 2.27 | 1.44 | 2.69 | 2.36 | |
| Total Average (Program / Settings) | -181% /
-90% | -84% /
-39% | -181% /
-92% | -546% /
-266% | -193% /
-93% |
* ... smaller is better
Display Response Times
| ↔ Response Time Black to White | ||
|---|---|---|
| 2.3 ms ... rise ↗ and fall ↘ combined | ↗ 1 ms rise | 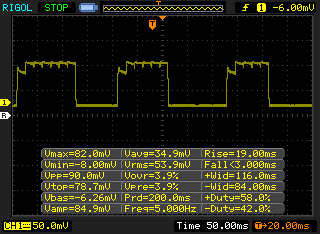 |
| ↘ 1.3 ms fall | ||
| The screen shows very fast response rates in our tests and should be very well suited for fast-paced gaming. In comparison, all tested devices range from 0.1 (minimum) to 240 (maximum) ms. » 12 % of all devices are better. This means that the measured response time is better than the average of all tested devices (19.9 ms). | ||
| ↔ Response Time 50% Grey to 80% Grey | ||
| 2.6 ms ... rise ↗ and fall ↘ combined | ↗ 1.2 ms rise | 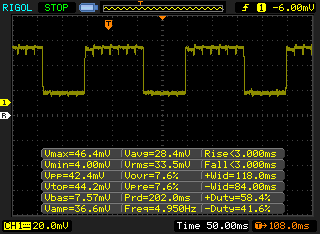 |
| ↘ 1.4 ms fall | ||
| The screen shows very fast response rates in our tests and should be very well suited for fast-paced gaming. In comparison, all tested devices range from 0.165 (minimum) to 636 (maximum) ms. » 12 % of all devices are better. This means that the measured response time is better than the average of all tested devices (31.1 ms). | ||
Screen Flickering / PWM (Pulse-Width Modulation)
| Screen flickering / PWM detected | 60.2 Hz | ≤ 100 % brightness setting | 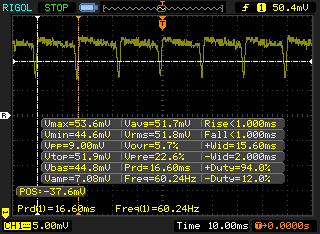 |
The display backlight flickers at 60.2 Hz (worst case, e.g., utilizing PWM) Flickering detected at a brightness setting of 100 % and below. There should be no flickering or PWM above this brightness setting. The frequency of 60.2 Hz is very low, so the flickering may cause eyestrain and headaches after extended use. In comparison: 52 % of all tested devices do not use PWM to dim the display. If PWM was detected, an average of 7798 (minimum: 5 - maximum: 343500) Hz was measured. | |||
| PCMark 8 Home Score Accelerated v2 | 3570 points | |
| PCMark 8 Work Score Accelerated v2 | 4465 points | |
| PCMark 10 Score | 5485 points | |
Help | ||
| Alienware m15 P79F Toshiba XG5 KXG50ZNV512G | Alienware m15 GTX 1070 Max-Q Toshiba XG5 KXG50ZNV512G | Razer Blade 15 RTX 2080 Max-Q Samsung SSD PM981 MZVLB512HAJQ | Asus Zephyrus S GX502GW 2x Intel SSD 660p SSDPEKNW512G8 (RAID 0) | Aorus 15 W9 Intel SSD 760p SSDPEKKW512G8 | Dell XPS 15 9570 Core i9 UHD Samsung SSD PM981 MZVLB1T0HALR | |
|---|---|---|---|---|---|---|
| AS SSD | -24% | 36% | 8% | 21% | 31% | |
| Seq Read (MB/s) | 1937 | 1967 2% | 1832 -5% | 2506 29% | 2611 35% | 1320 -32% |
| Seq Write (MB/s) | 1066 | 1135 6% | 1864 75% | 1712 61% | 1545 45% | 1500 41% |
| 4K Read (MB/s) | 31.76 | 29.17 -8% | 52.1 64% | 48.32 52% | 55.2 74% | 30.73 -3% |
| 4K Write (MB/s) | 102.6 | 93.4 -9% | 108.3 6% | 103.6 1% | 111.9 9% | 94.4 -8% |
| 4K-64 Read (MB/s) | 1140 | 995 -13% | 1159 2% | 624 -45% | 884 -22% | 1453 27% |
| 4K-64 Write (MB/s) | 938 | 656 -30% | 1807 93% | 1253 34% | 941 0% | 1815 93% |
| Access Time Read * (ms) | 0.058 | 0.116 -100% | 0.05 14% | 0.08 -38% | 0.045 22% | 0.061 -5% |
| Access Time Write * (ms) | 0.04 | 0.063 -58% | 0.034 15% | 0.04 -0% | 0.033 17% | 0.044 -10% |
| Score Read (Points) | 1366 | 1221 -11% | 1394 2% | 923 -32% | 1200 -12% | 1616 18% |
| Score Write (Points) | 1147 | 862 -25% | 2102 83% | 1528 33% | 1207 5% | 2059 80% |
| Score Total (Points) | 3168 | 2667 -16% | 4221 33% | 2896 -9% | 2982 -6% | 4507 42% |
| Copy ISO MB/s (MB/s) | 946 | 642 -32% | 2083 120% | 2131 125% | 2577 172% | |
| Copy Program MB/s (MB/s) | 452.8 | 431.5 -5% | 496.5 10% | 407.2 -10% | 515 14% | |
| Copy Game MB/s (MB/s) | 1013 | 706 -30% | 977 -4% | 1094 8% | 1120 11% |
* ... smaller is better

| 3DMark | |
| 1920x1080 Fire Strike Graphics | |
| MSI GE75 9SG | |
| Asus ROG Strix RTX 2070 OC | |
| Eurocom Sky X4C | |
| Razer Blade 15 RTX 2080 Max-Q | |
| Asus Zephyrus S GX502GW | |
| Alienware m15 P79F | |
| Alienware 15 R4 | |
| Average NVIDIA GeForce RTX 2070 Max-Q (11563 - 21191, n=31) | |
| Alienware m15 GTX 1070 Max-Q | |
| Aorus 15 W9 | |
| MSI GS63VR 7RG-005 | |
| Asus Strix GL703VM-DB74 | |
| Lenovo Legion Y730-15ICH i5-8300H | |
| Dell XPS 15 9570 Core i9 UHD | |
| Asus TUF FX705DY-AU072 | |
| Razer Blade Stealth i7-8565U | |
| 2560x1440 Time Spy Graphics | |
| MSI GE75 9SG | |
| Asus ROG Strix RTX 2070 OC | |
| Razer Blade 15 RTX 2080 Max-Q | |
| Asus Zephyrus S GX502GW | |
| Alienware m15 P79F | |
| Average NVIDIA GeForce RTX 2070 Max-Q (5948 - 8065, n=28) | |
| Aorus 15 W9 | |
| MSI GS63VR 7RG-005 | |
| Asus Strix GL703VM-DB74 | |
| Asus TUF FX705DY-AU072 | |
| Razer Blade Stealth i7-8565U | |
| 2560x1440 Port Royal Graphics | |
| MSI GE75 9SG | |
| Razer Blade 15 RTX 2080 Max-Q | |
| Asus Zephyrus S GX502GW | |
| Alienware m15 P79F | |
| Average NVIDIA GeForce RTX 2070 Max-Q (3240 - 4742, n=23) | |
| Aorus 15 W9 | |
| 3DMark 11 | |
| 1280x720 Performance GPU | |
| MSI GE75 9SG | |
| Asus ROG Strix RTX 2070 OC | |
| Razer Blade 15 RTX 2080 Max-Q | |
| Eurocom Sky X4C | |
| Asus Zephyrus S GX502GW | |
| Alienware m15 P79F | |
| Alienware 15 R4 | |
| Average NVIDIA GeForce RTX 2070 Max-Q (14723 - 27694, n=31) | |
| Alienware m15 GTX 1070 Max-Q | |
| Aorus 15 W9 | |
| MSI GS63VR 7RG-005 | |
| Asus Strix GL703VM-DB74 | |
| Lenovo Legion Y730-15ICH i5-8300H | |
| Dell XPS 15 9570 Core i9 UHD | |
| Asus TUF FX705DY-AU072 | |
| Razer Blade Stealth i7-8565U | |
| 1280x720 Performance Combined | |
| MSI GE75 9SG | |
| Asus ROG Strix RTX 2070 OC | |
| Eurocom Sky X4C | |
| Average NVIDIA GeForce RTX 2070 Max-Q (9107 - 17603, n=30) | |
| Razer Blade 15 RTX 2080 Max-Q | |
| Alienware m15 P79F | |
| Alienware m15 GTX 1070 Max-Q | |
| Asus Zephyrus S GX502GW | |
| Alienware 15 R4 | |
| Aorus 15 W9 | |
| Dell XPS 15 9570 Core i9 UHD | |
| Lenovo Legion Y730-15ICH i5-8300H | |
| MSI GS63VR 7RG-005 | |
| Asus Strix GL703VM-DB74 | |
| Asus TUF FX705DY-AU072 | |
| Razer Blade Stealth i7-8565U | |
| 3DMark 11 Performance | 19009 points | |
| 3DMark Cloud Gate Standard Score | 24876 points | |
| 3DMark Fire Strike Score | 16197 points | |
| 3DMark Time Spy Score | 6901 points | |
Help | ||
| Shadow of the Tomb Raider - 1920x1080 Highest Preset AA:T | |
| MSI GE75 9SG | |
| Alienware m15 P79F | |
| Average NVIDIA GeForce RTX 2070 Max-Q (57 - 89, n=12) | |
| Asus Zephyrus S GX502GW | |
| The Witcher 3 - 1920x1080 Ultra Graphics & Postprocessing (HBAO+) | |
| MSI GE75 9SG | |
| Razer Blade 15 RTX 2080 Max-Q | |
| Eurocom Sky X4C | |
| Asus Zephyrus S GX502GW | |
| Average NVIDIA GeForce RTX 2070 Max-Q (56 - 83.8, n=31) | |
| Alienware m15 P79F | |
| Alienware 15 R4 | |
| Aorus 15 W9 | |
| Alienware m15 GTX 1070 Max-Q | |
| Asus Strix GL703VM-DB74 | |
| Dell XPS 15 9570 i7 UHD | |
| Asus TUF FX705DY-AU072 | |
| Razer Blade Stealth i7-8565U | |
| low | med. | high | ultra | 4K | |
|---|---|---|---|---|---|
| BioShock Infinite (2013) | 296.7 | 261.5 | 243.7 | 153.7 | |
| The Witcher 3 (2015) | 261.8 | 200.6 | 123.8 | 64.4 | 47.2 |
| Rise of the Tomb Raider (2016) | 204.7 | 162.3 | 125.8 | 105.7 | 45.6 |
| Shadow of the Tomb Raider (2018) | 119 | 93 | 87 | 84 | 33 |
| Alienware m15 P79F GeForce RTX 2070 Max-Q, i7-8750H, Toshiba XG5 KXG50ZNV512G | Alienware m15 GTX 1070 Max-Q GeForce GTX 1070 Max-Q, i7-8750H, Toshiba XG5 KXG50ZNV512G | Razer Blade 15 RTX 2080 Max-Q GeForce RTX 2080 Max-Q, i7-9750H, Samsung SSD PM981 MZVLB512HAJQ | Asus Zephyrus S GX502GW GeForce RTX 2070 Mobile, i7-9750H, 2x Intel SSD 660p SSDPEKNW512G8 (RAID 0) | Aorus 15 W9 GeForce RTX 2060 Mobile, i7-8750H, Intel SSD 760p SSDPEKKW512G8 | Dell XPS 15 9570 Core i9 UHD GeForce GTX 1050 Ti Max-Q, i9-8950HK, Samsung SSD PM981 MZVLB1T0HALR | |
|---|---|---|---|---|---|---|
| Noise | 13% | 17% | 1% | -1% | 15% | |
| off / environment * (dB) | 28.2 | 28.6 -1% | 28.3 -0% | 30 -6% | 29 -3% | 28.2 -0% |
| Idle Minimum * (dB) | 30.3 | 28.6 6% | 28.8 5% | 31 -2% | 34 -12% | 28.5 6% |
| Idle Average * (dB) | 35.4 | 28.6 19% | 28.8 19% | 33 7% | 36 -2% | 28.6 19% |
| Idle Maximum * (dB) | 50.3 | 28.6 43% | 29 42% | 38 24% | 38 24% | 28.8 43% |
| Load Average * (dB) | 50.3 | 40.8 19% | 33.5 33% | 50 1% | 52 -3% | 36.2 28% |
| Witcher 3 ultra * (dB) | 50.2 | 49.6 1% | 45 10% | 53 -6% | 52 -4% | 47.6 5% |
| Load Maximum * (dB) | 50.2 | 49.6 1% | 45.2 10% | 56 -12% | 53 -6% | 47.6 5% |
* ... smaller is better
Noise level
| Idle |
| 30.3 / 35.4 / 50.3 dB(A) |
| Load |
| 50.3 / 50.2 dB(A) |
 | ||
30 dB silent 40 dB(A) audible 50 dB(A) loud |
||
min: | ||
(-) The maximum temperature on the upper side is 55.6 °C / 132 F, compared to the average of 40.4 °C / 105 F, ranging from 21.2 to 68.8 °C for the class Gaming.
(-) The bottom heats up to a maximum of 62.4 °C / 144 F, compared to the average of 43.2 °C / 110 F
(+) In idle usage, the average temperature for the upper side is 31.7 °C / 89 F, compared to the device average of 33.9 °C / 93 F.
(-) Playing The Witcher 3, the average temperature for the upper side is 43.6 °C / 110 F, compared to the device average of 33.9 °C / 93 F.
(+) The palmrests and touchpad are reaching skin temperature as a maximum (35.2 °C / 95.4 F) and are therefore not hot.
(-) The average temperature of the palmrest area of similar devices was 28.8 °C / 83.8 F (-6.4 °C / -11.6 F).
Alienware m15 P79F audio analysis
(±) | speaker loudness is average but good (75 dB)
Analysis not possible as minimum curve is missing or too high
Apple MacBook 12 (Early 2016) 1.1 GHz audio analysis
(+) | speakers can play relatively loud (83.6 dB)
Bass 100 - 315 Hz
(±) | reduced bass - on average 11.3% lower than median
(±) | linearity of bass is average (14.2% delta to prev. frequency)
Mids 400 - 2000 Hz
(+) | balanced mids - only 2.4% away from median
(+) | mids are linear (5.5% delta to prev. frequency)
Highs 2 - 16 kHz
(+) | balanced highs - only 2% away from median
(+) | highs are linear (4.5% delta to prev. frequency)
Overall 100 - 16.000 Hz
(+) | overall sound is linear (10.2% difference to median)
Compared to same class
» 7% of all tested devices in this class were better, 2% similar, 91% worse
» The best had a delta of 5%, average was 18%, worst was 53%
Compared to all devices tested
» 5% of all tested devices were better, 1% similar, 94% worse
» The best had a delta of 4%, average was 24%, worst was 134%
| Off / Standby | |
| Idle | |
| Load |
|
Key:
min: | |
| Alienware m15 P79F i7-8750H, GeForce RTX 2070 Max-Q, Toshiba XG5 KXG50ZNV512G, OLED, 3840x2160, 15.6" | Alienware m15 GTX 1070 Max-Q i7-8750H, GeForce GTX 1070 Max-Q, Toshiba XG5 KXG50ZNV512G, IPS, 1920x1080, 15.6" | Razer Blade 15 RTX 2080 Max-Q i7-9750H, GeForce RTX 2080 Max-Q, Samsung SSD PM981 MZVLB512HAJQ, IPS, 1920x1080, 15.6" | Asus Zephyrus S GX502GW i7-9750H, GeForce RTX 2070 Mobile, 2x Intel SSD 660p SSDPEKNW512G8 (RAID 0), IPS, 1920x1080, 15.6" | Aorus 15 W9 i7-8750H, GeForce RTX 2060 Mobile, Intel SSD 760p SSDPEKKW512G8, IPS, 1920x1080, 15.6" | Dell XPS 15 9570 Core i9 UHD i9-8950HK, GeForce GTX 1050 Ti Max-Q, Samsung SSD PM981 MZVLB1T0HALR, IPS, 3840x2160, 15.6" | |
|---|---|---|---|---|---|---|
| Power Consumption | 12% | -6% | -59% | -21% | 20% | |
| Idle Minimum * (Watt) | 10.9 | 7.6 30% | 12.5 -15% | 24 -120% | 18 -65% | 7.1 35% |
| Idle Average * (Watt) | 12.3 | 13.8 -12% | 15.3 -24% | 27 -120% | 20 -63% | 13.6 -11% |
| Idle Maximum * (Watt) | 19 | 14.6 23% | 20.7 -9% | 33 -74% | 28 -47% | 14.1 26% |
| Load Average * (Watt) | 96 | 97.6 -2% | 90.2 6% | 129 -34% | 87 9% | 103.9 -8% |
| Witcher 3 ultra * (Watt) | 161.7 | 145.8 10% | 162 -0% | 176 -9% | 135 17% | 103 36% |
| Load Maximum * (Watt) | 229.1 | 172.5 25% | 209.3 9% | 216 6% | 175 24% | 130.9 43% |
* ... smaller is better
| Alienware m15 P79F i7-8750H, GeForce RTX 2070 Max-Q, 90 Wh | Alienware m15 GTX 1070 Max-Q i7-8750H, GeForce GTX 1070 Max-Q, 90 Wh | Razer Blade 15 RTX 2080 Max-Q i7-9750H, GeForce RTX 2080 Max-Q, 80 Wh | Asus Zephyrus S GX502GW i7-9750H, GeForce RTX 2070 Mobile, 76 Wh | Aorus 15 W9 i7-8750H, GeForce RTX 2060 Mobile, 62 Wh | Dell XPS 15 9570 Core i9 UHD i9-8950HK, GeForce GTX 1050 Ti Max-Q, 97 Wh | |
|---|---|---|---|---|---|---|
| Battery runtime | 48% | 27% | -29% | -54% | 65% | |
| WiFi v1.3 (h) | 5.2 | 7.7 48% | 6.6 27% | 3.7 -29% | 2.4 -54% | 8.6 65% |
| Reader / Idle (h) | 10.5 | 15.9 | 5.9 | 2.9 | 15 | |
| Load (h) | 1.7 | 1.7 | 1 | 1.4 | 1 |
Pros
Cons
在相同的CPU和GPU的情况下,Alienware m15能够比其他游戏笔记本电脑提供更多性能。例如,Core i7-8750H和RTX 2070 Max-Q的性能比我们数据库中的平均i7-8750H或RTX 2070 Max-Q强8%到9%。如果您希望在轻薄设计中实现最快的性能,那么Alienware m15应该符合要求。
缺点是较高的核心温度和较大的风扇噪音。如果你想从Alienware m15中获得最大性能,那么CPU温度会高达90摄氏度,风扇也可以达到50分贝(A)。
然而,4K UHD OLED屏幕才是真正的不确定因素。虽然价格是1080p 144 Hz或240 Hz IPS面板的两倍以上,但我们要强调的是,它不能客观地提供更好的游戏体验。其更高的原始分辨率,更深的色彩,更亮的背光以及更快的响应时间确实使其具有优势,但其原始的60 Hz刷新率在某些游戏中是不利的。例如,Overwatch,Rocket League,CS:GO和Apex Legends在144hz屏幕下运行的更好,而像古墓丽影或Metro Exodus这样的单机游戏可能会从OLED屏幕中受益更多。虽然可能令人印象深刻,但OLED目前并不适合每个人,特别是因为IPS选项越来越诱人。
根据您最常玩的游戏,您可能需要明智地选择1080p 144/240 Hz IPS或2160p 60 Hz OLED。这是OLED在笔记本上的一个很好的开端,但它仍然是一个利基选择,直到它有可比拟IPS的刷新率。
Alienware m15 P79F
- 06/13/2019 v6 (old)
Allen Ngo
Price comparison

