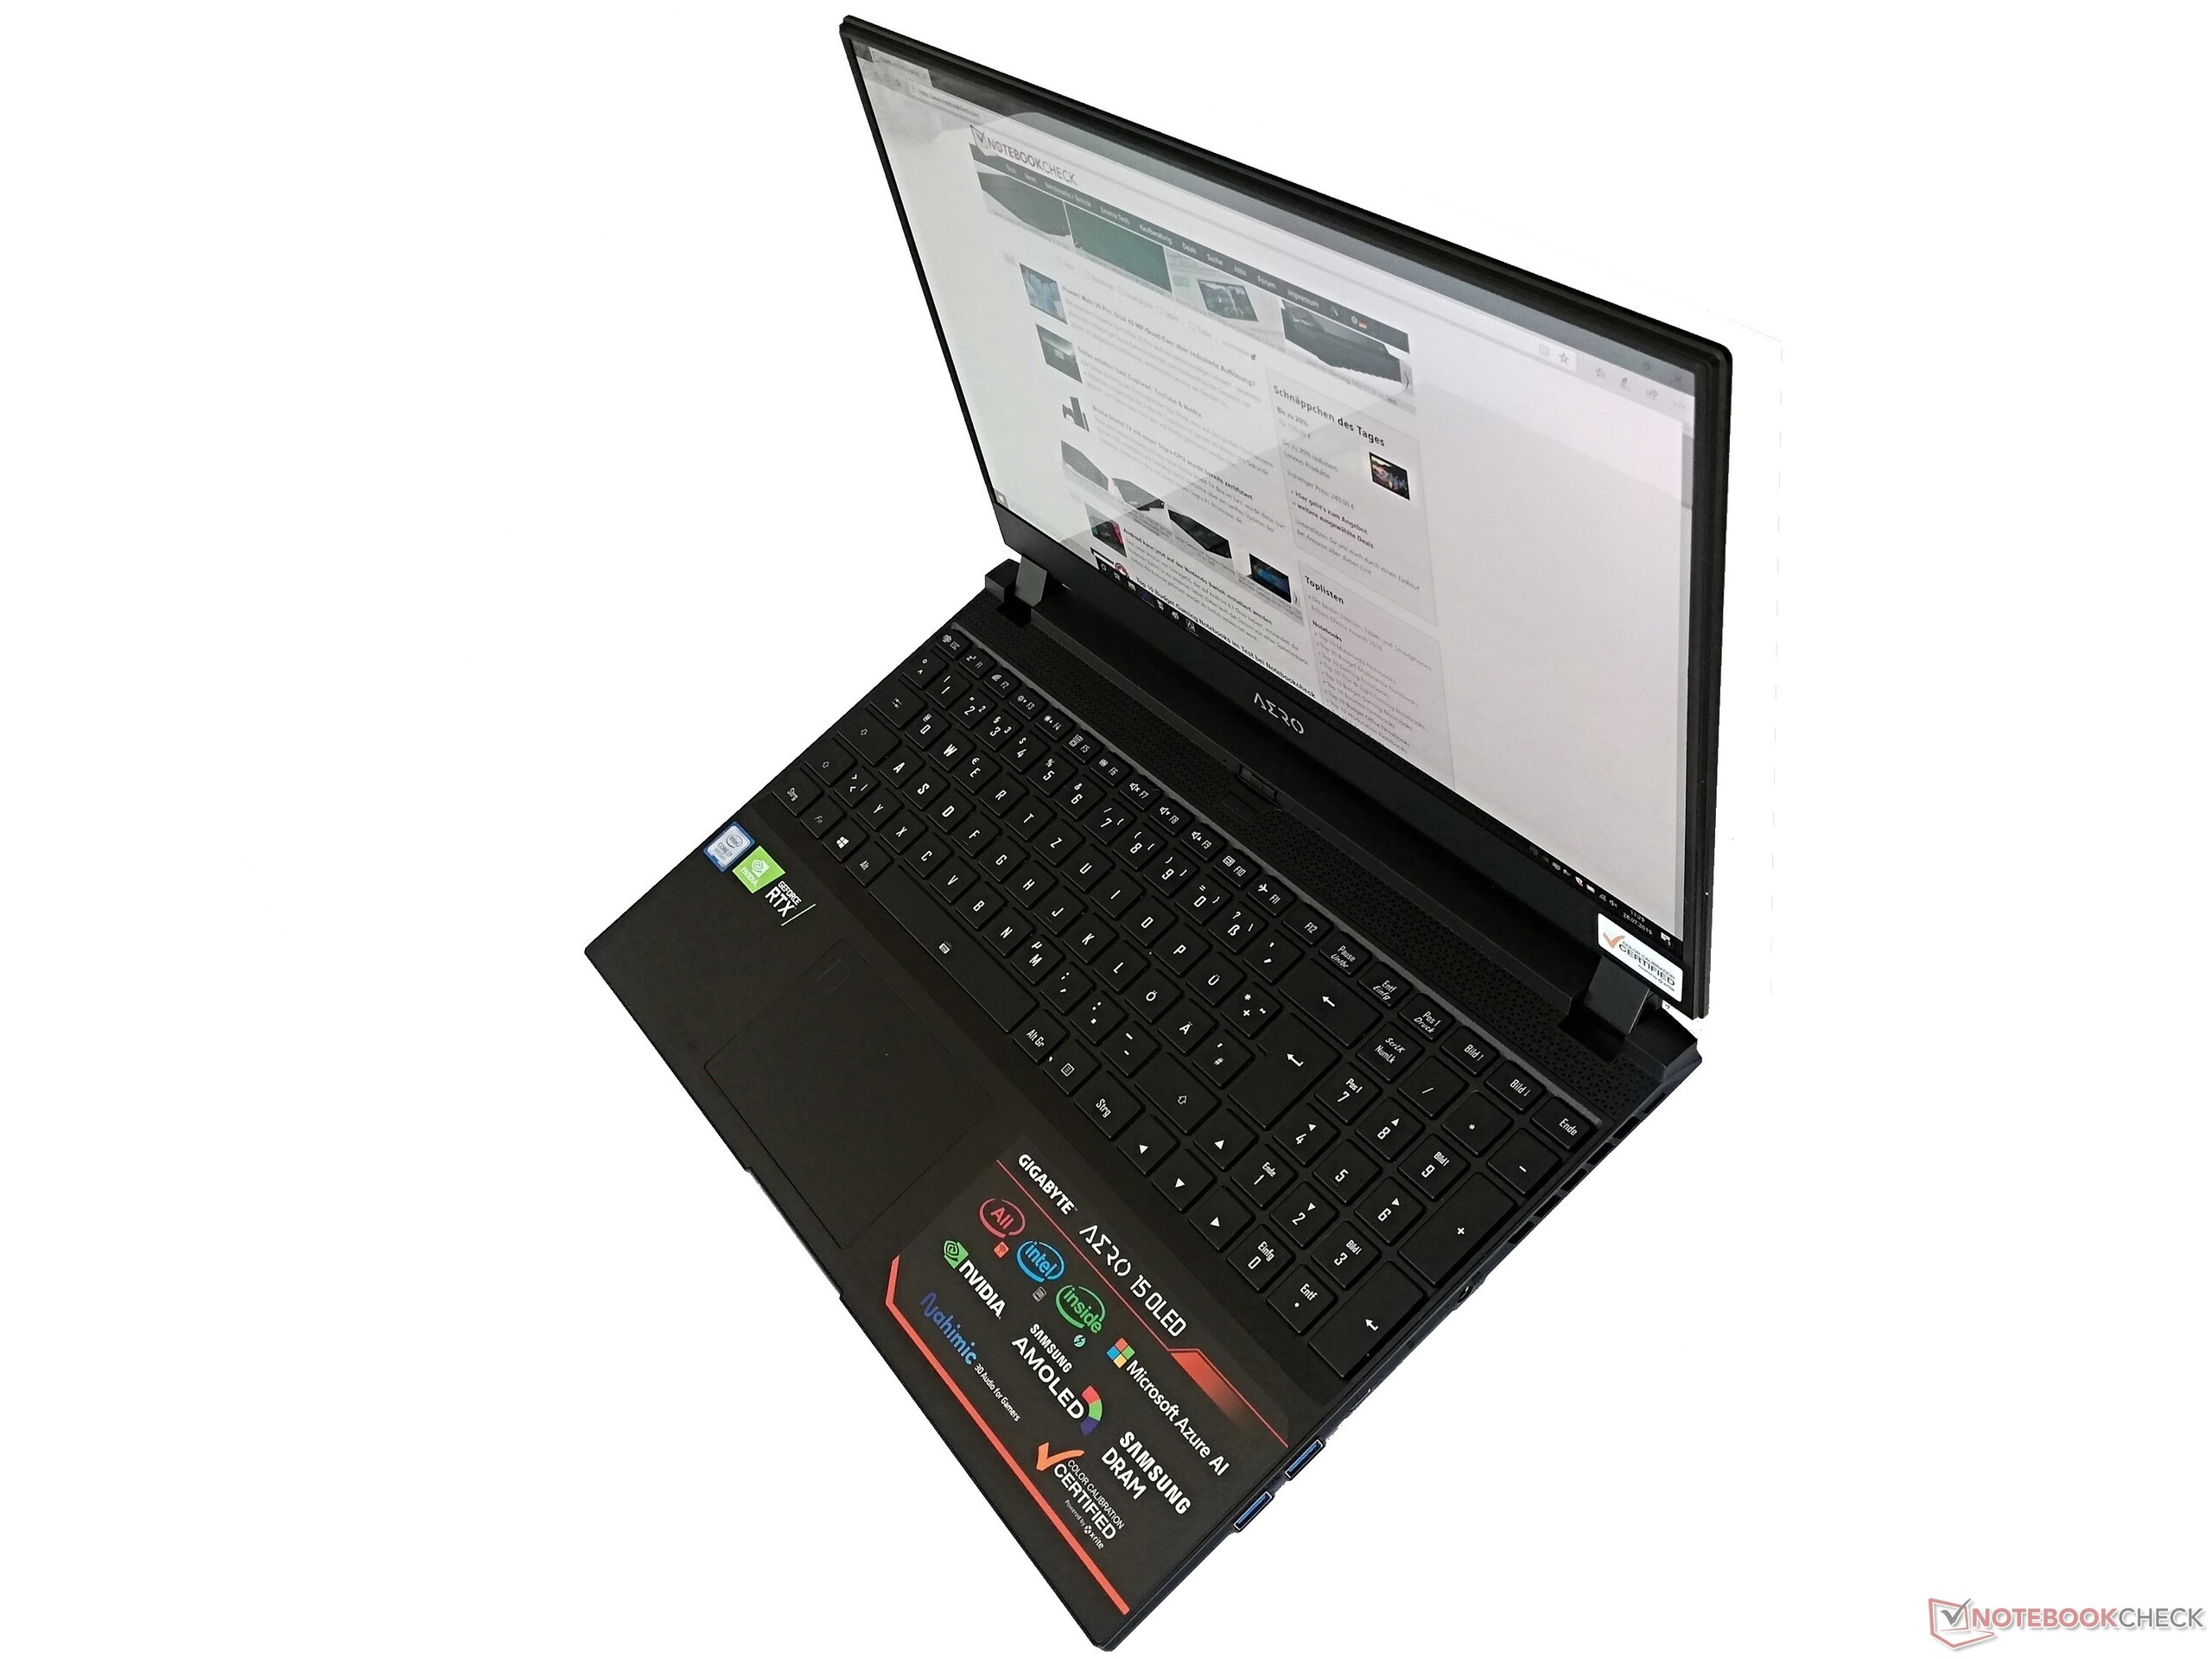
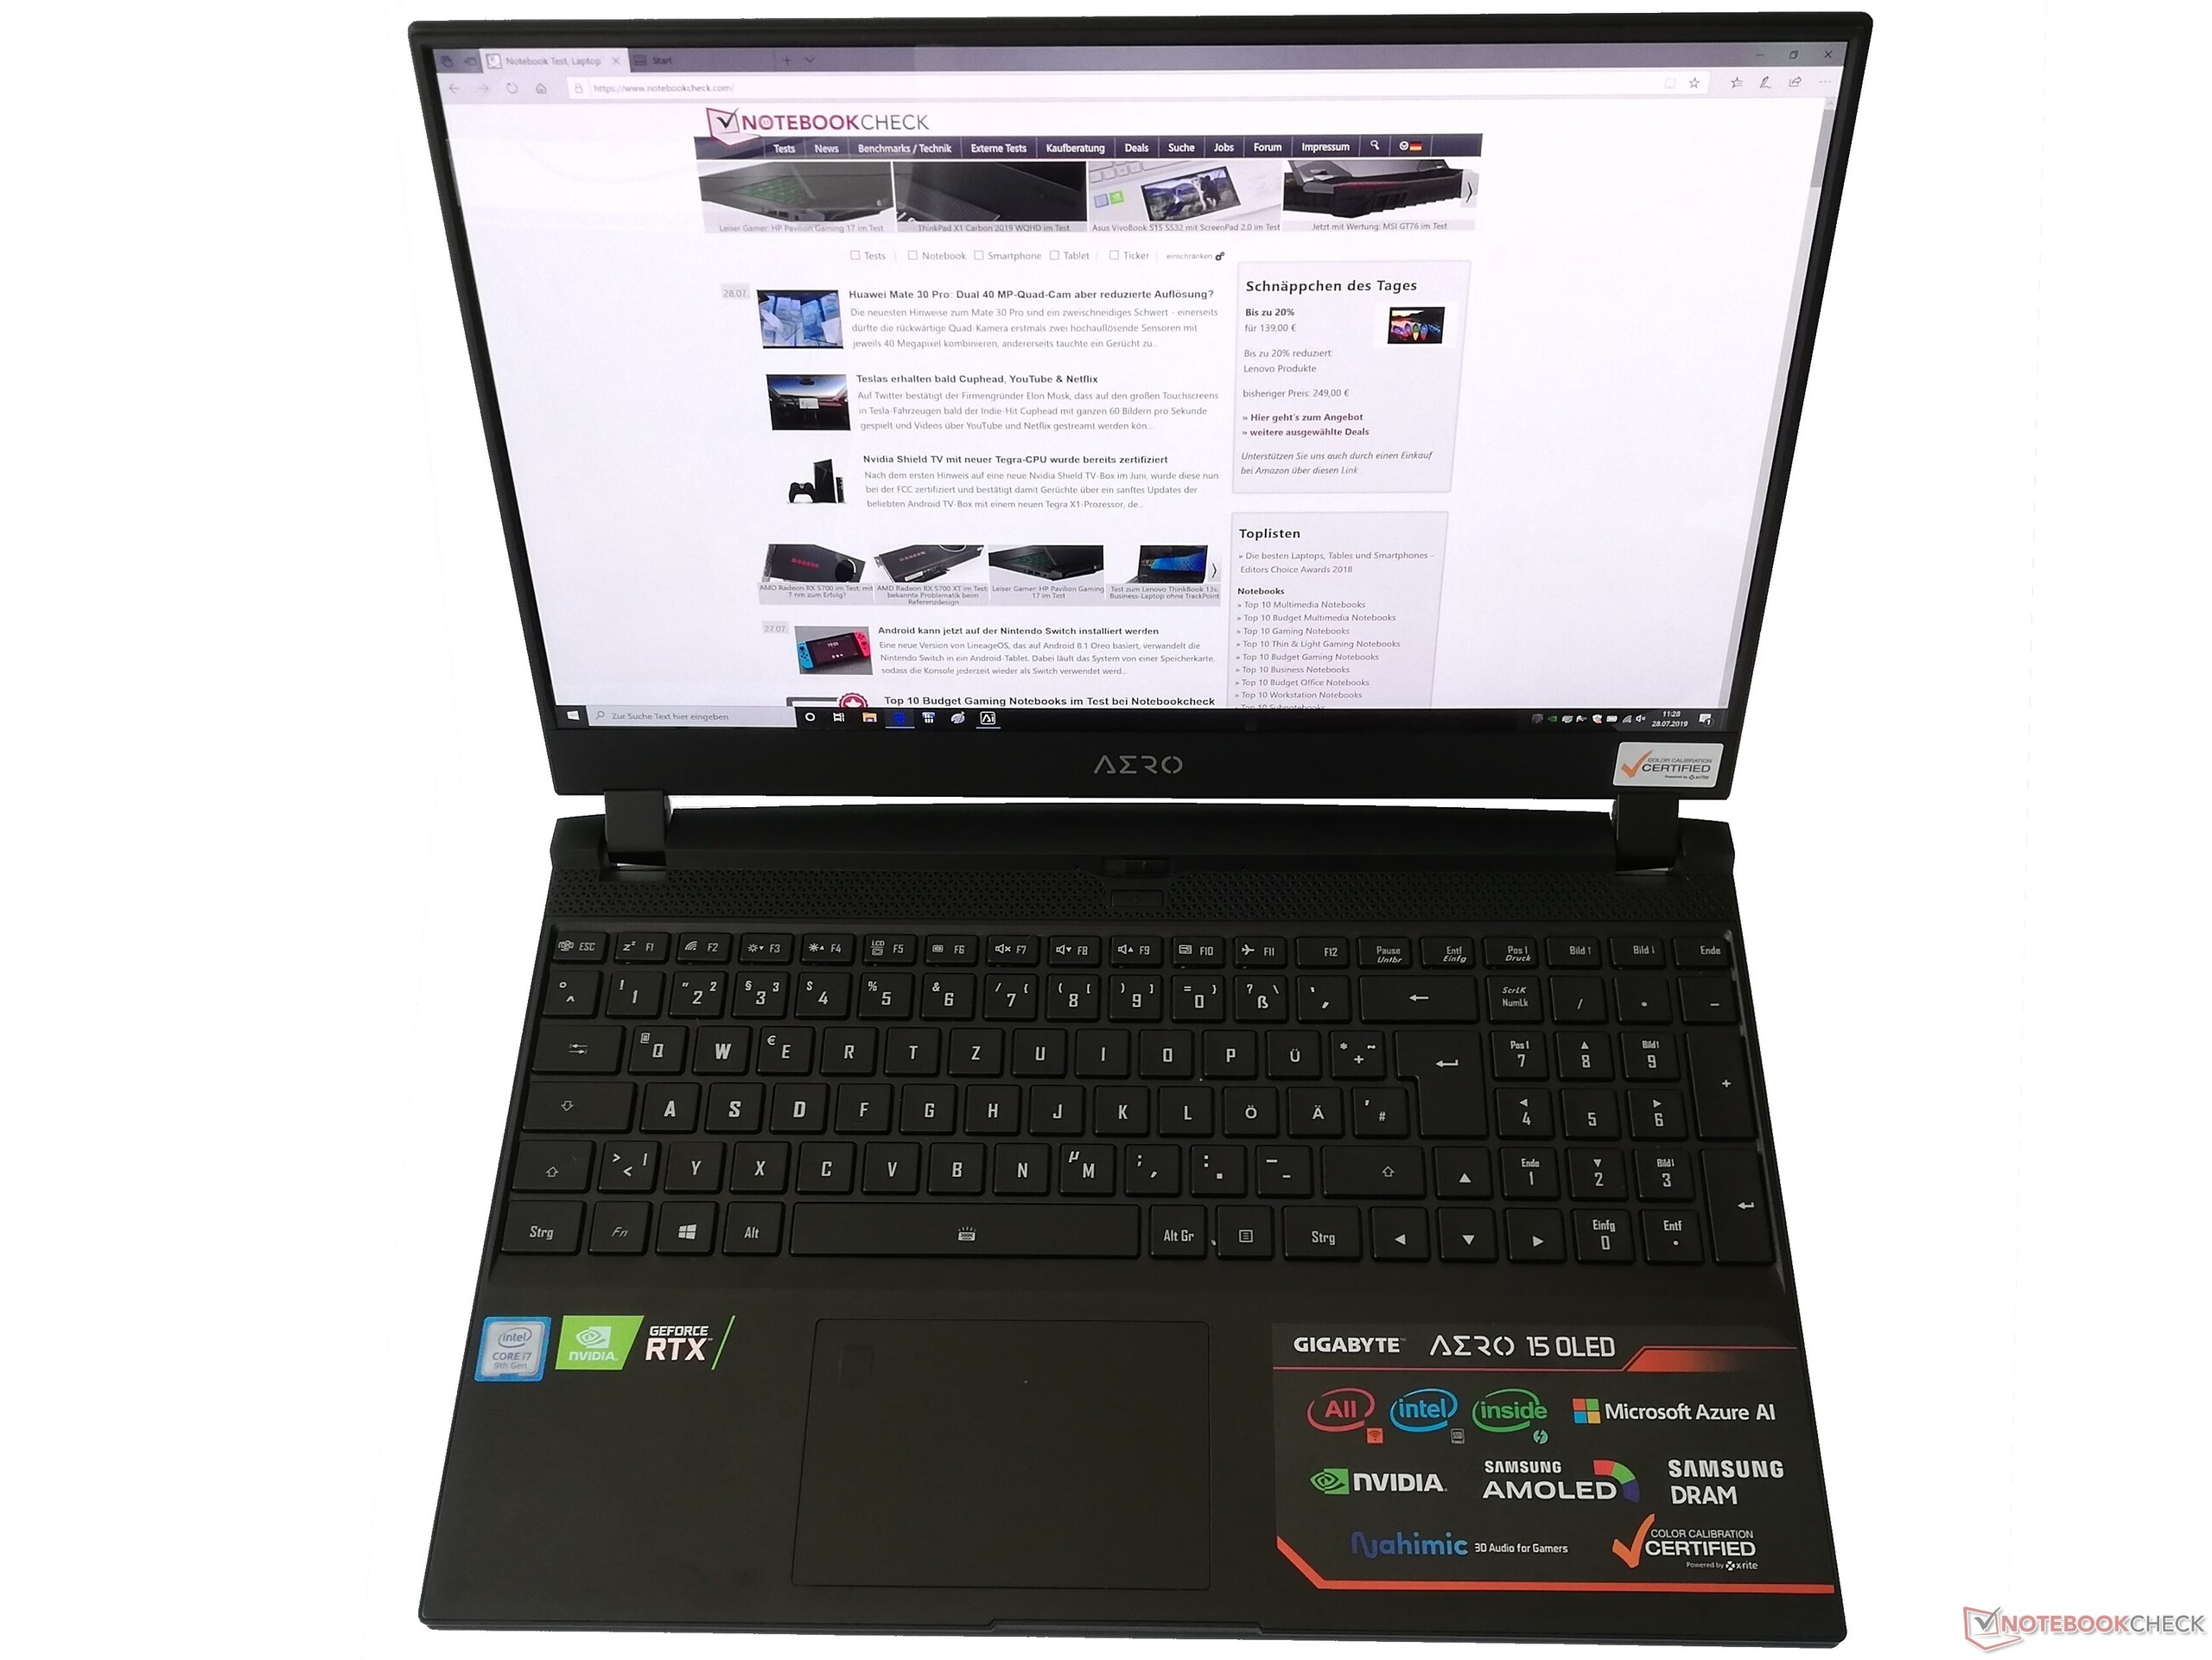
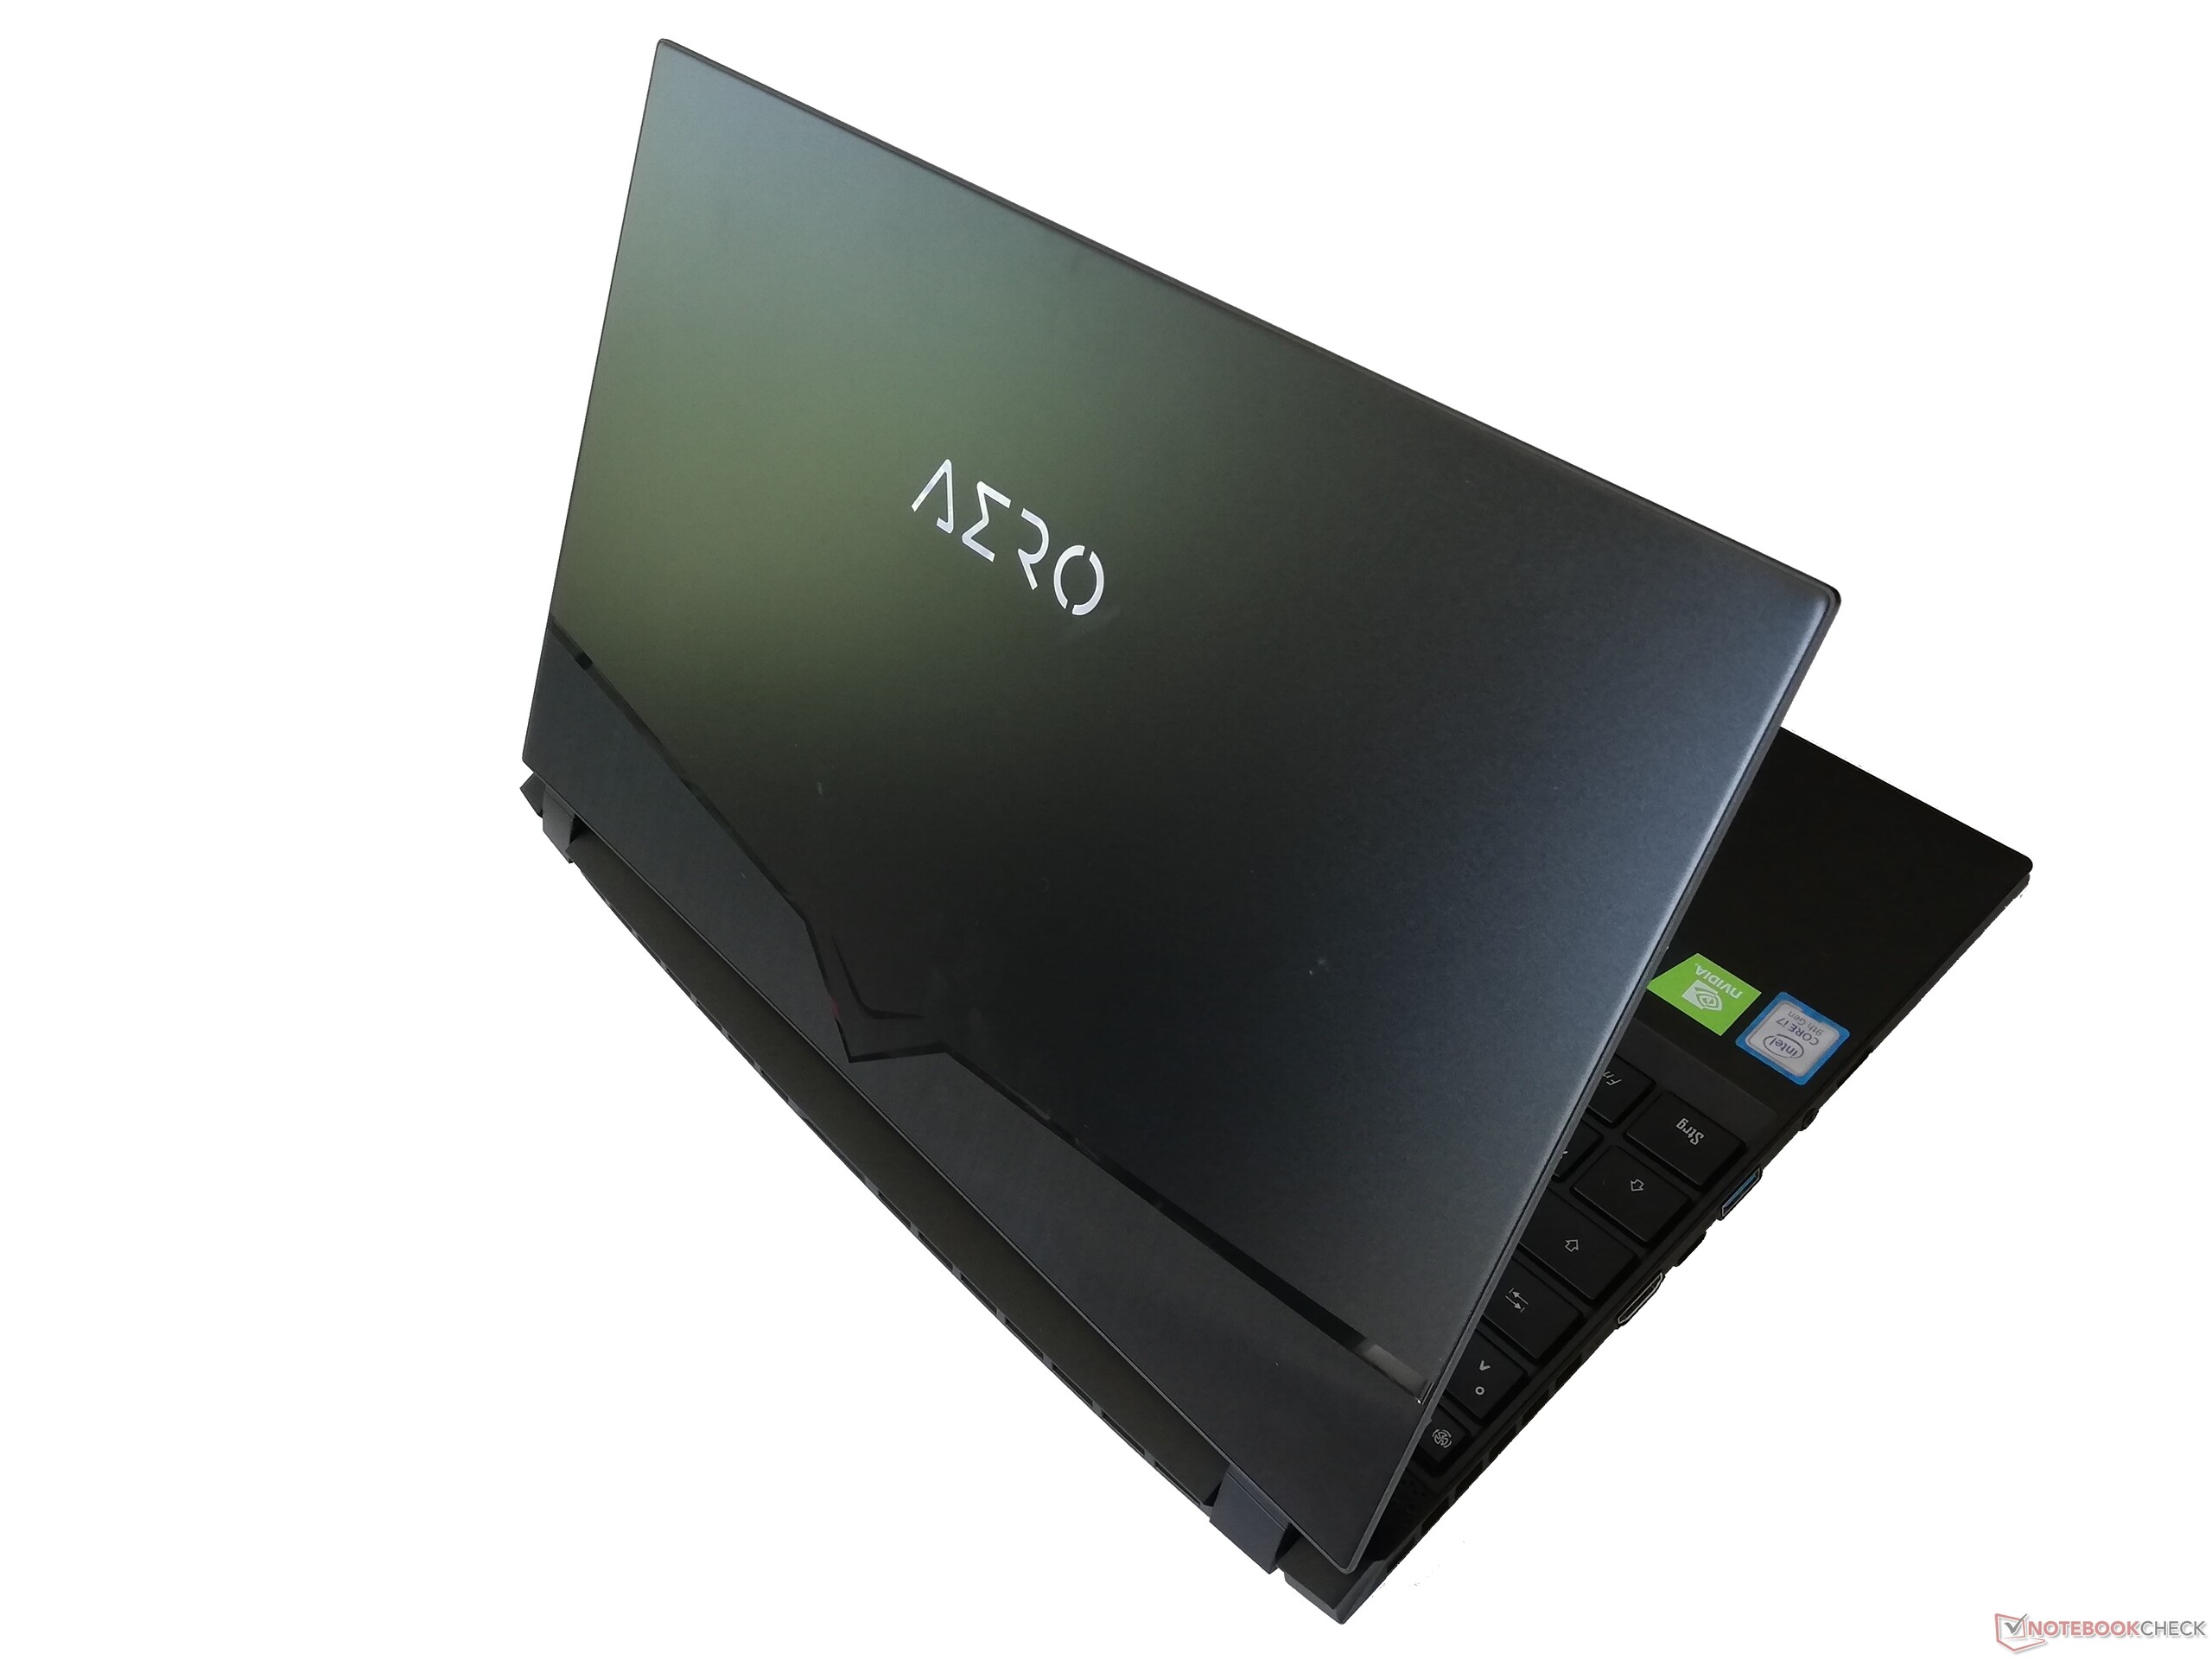
技嘉Aero 15-XA笔记本电脑评测:OLED面板4K屏幕加上新模具
| SD Card Reader | |
| average JPG Copy Test (av. of 3 runs) | |
| Gigabyte Aero 15 Classic-XA (Toshiba Exceria Pro SDXC 64 GB UHS-II) | |
| Gigabyte Aero 15 OLED XA (Toshiba Exceria Pro SDXC 64 GB UHS-II) | |
| Average of class Gaming (20.9 - 210, n=54, last 2 years) | |
| Medion Erazer X15805 (Toshiba Exceria Pro SDXC 64 GB UHS-II) | |
| maximum AS SSD Seq Read Test (1GB) | |
| Gigabyte Aero 15 Classic-XA (Toshiba Exceria Pro SDXC 64 GB UHS-II) | |
| Gigabyte Aero 15 OLED XA (Toshiba Exceria Pro SDXC 64 GB UHS-II) | |
| Average of class Gaming (25.5 - 261, n=51, last 2 years) | |
| Medion Erazer X15805 (Toshiba Exceria Pro SDXC 64 GB UHS-II) | |
| |||||||||||||||||||||||||
Brightness Distribution: 93 %
Center on Battery: 373 cd/m²
Contrast: ∞:1 (Black: 0 cd/m²)
ΔE ColorChecker Calman: 3.98 | ∀{0.5-29.43 Ø4.71}
ΔE Greyscale Calman: 2.81 | ∀{0.09-98 Ø4.96}
97% sRGB (Argyll 1.6.3 3D)
78% AdobeRGB 1998 (Argyll 1.6.3 3D)
Gamma: 2.62
CCT: 6434 K
| Gigabyte Aero 15 OLED XA Samsung SDCA029, OLED, 3840x2160 | Medion Erazer X15805 LG Philips LP156WFG-SPB2, IPS, 1920x1080 | Gigabyte Aero 15 Classic-XA Sharp LQ156M1JW03 (SHP14C5), IGZO, 1920x1080 | Asus Zephyrus S GX502GW AU Optronics B156HAN08.2 (AUO82ED), IPS, 1920x1080 | MSI GS65 Stealth 9SG Sharp LQ156M1JW03 (SHP14C5), IPS, 1920x1080 | Aorus 15 W9 LG Philips LP156WFG-SPB2 (LGD05E8), IPS, 1920x1080 | |
|---|---|---|---|---|---|---|
| Display | ||||||
| Display P3 Coverage (%) | 61.7 | 65.3 | 64.9 | 67.6 | 64.3 | |
| sRGB Coverage (%) | 91.9 | 95.5 | 91 | 97.5 | 93.5 | |
| AdobeRGB 1998 Coverage (%) | 63 | 66.5 | 65.9 | 68.9 | 65.6 | |
| Response Times | -396% | -471% | -250% | -456% | -541% | |
| Response Time Grey 50% / Grey 80% * (ms) | 2.4 ? | 14 ? -483% | 15.2 ? -533% | 7.2 ? -200% | 13.6 ? -467% | 16.8 ? -600% |
| Response Time Black / White * (ms) | 2.2 ? | 9 ? -309% | 11.2 ? -409% | 8.8 ? -300% | 12 ? -445% | 12.8 ? -482% |
| PWM Frequency (Hz) | 60 ? | 23580 ? | 23260 ? | |||
| Screen | -24% | -10% | 2% | 13% | -22% | |
| Brightness middle (cd/m²) | 373 | 343 -8% | 266 -29% | 286 -23% | 282.3 -24% | 295 -21% |
| Brightness (cd/m²) | 375 | 290 -23% | 248 -34% | 275 -27% | 269 -28% | 292 -22% |
| Brightness Distribution (%) | 93 | 74 -20% | 89 -4% | 90 -3% | 90 -3% | 80 -14% |
| Black Level * (cd/m²) | 0.37 | 0.31 | 0.37 | 0.32 | 0.34 | |
| Colorchecker dE 2000 * | 3.98 | 4.22 -6% | 2.78 30% | 2.19 45% | 1.17 71% | 3.89 2% |
| Colorchecker dE 2000 max. * | 6.28 | 7.83 -25% | 5.96 5% | 4.4 30% | 3.29 48% | 7.28 -16% |
| Greyscale dE 2000 * | 2.81 | 5.1 -81% | 3.58 -27% | 2.2 22% | 1.3 54% | 4.98 -77% |
| Gamma | 2.62 84% | 2.2 100% | 2.46 89% | 2.41 91% | 2.2 100% | 2.45 90% |
| CCT | 6434 101% | 6970 93% | 7186 90% | 6405 101% | 6643 98% | 6407 101% |
| Color Space (Percent of AdobeRGB 1998) (%) | 78 | 58 -26% | 62 -21% | 59 -24% | 63.8 -18% | 60 -23% |
| Color Space (Percent of sRGB) (%) | 97 | 92 -5% | 96 -1% | 91 -6% | 97.5 1% | 93 -4% |
| Contrast (:1) | 927 | 858 | 773 | 882 | 868 | |
| Colorchecker dE 2000 calibrated * | 1.33 | 0.91 | 2.27 | 1.06 | 1.44 | |
| Total Average (Program / Settings) | -210% /
-99% | -241% /
-102% | -124% /
-49% | -222% /
-81% | -282% /
-126% |
* ... smaller is better
Display Response Times
| ↔ Response Time Black to White | ||
|---|---|---|
| 2.2 ms ... rise ↗ and fall ↘ combined | ↗ 1.2 ms rise | 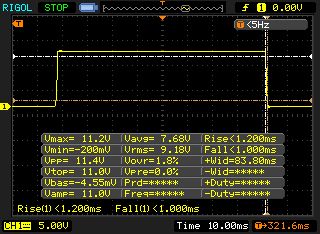 |
| ↘ 1 ms fall | ||
| The screen shows very fast response rates in our tests and should be very well suited for fast-paced gaming. In comparison, all tested devices range from 0.1 (minimum) to 240 (maximum) ms. » 12 % of all devices are better. This means that the measured response time is better than the average of all tested devices (19.8 ms). | ||
| ↔ Response Time 50% Grey to 80% Grey | ||
| 2.4 ms ... rise ↗ and fall ↘ combined | ↗ 1 ms rise | 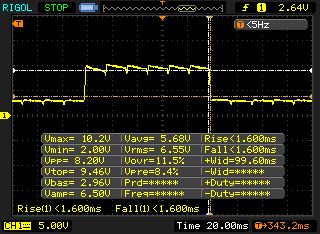 |
| ↘ 1.4 ms fall | ||
| The screen shows very fast response rates in our tests and should be very well suited for fast-paced gaming. In comparison, all tested devices range from 0.165 (minimum) to 636 (maximum) ms. » 11 % of all devices are better. This means that the measured response time is better than the average of all tested devices (31 ms). | ||
Screen Flickering / PWM (Pulse-Width Modulation)
| Screen flickering / PWM detected | 60 Hz | ≤ 80 % brightness setting | 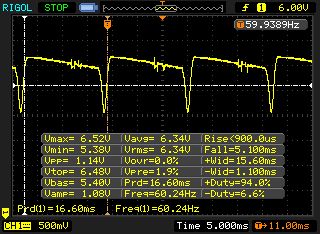 |
The display backlight flickers at 60 Hz (worst case, e.g., utilizing PWM) Flickering detected at a brightness setting of 80 % and below. There should be no flickering or PWM above this brightness setting. The frequency of 60 Hz is very low, so the flickering may cause eyestrain and headaches after extended use. In comparison: 52 % of all tested devices do not use PWM to dim the display. If PWM was detected, an average of 7754 (minimum: 5 - maximum: 343500) Hz was measured. | |||
| PCMark 8 Home Score Accelerated v2 | 3638 points | |
| PCMark 8 Work Score Accelerated v2 | 4520 points | |
| PCMark 10 Score | 5439 points | |
Help | ||
| Gigabyte Aero 15 OLED XA Intel SSD 600p SSDPEKKW512G8L | Medion Erazer X15805 Samsung SSD PM981 MZVLB512HAJQ | Gigabyte Aero 15 Classic-XA Intel SSD 760p SSDPEKKW512G8 | Asus Zephyrus S GX502GW 2x Intel SSD 660p SSDPEKNW512G8 (RAID 0) | MSI GS65 Stealth 9SG Samsung SSD PM981 MZVLB512HAJQ | Aorus 15 W9 Intel SSD 760p SSDPEKKW512G8 | |
|---|---|---|---|---|---|---|
| CrystalDiskMark 5.2 / 6 | 2% | -4% | -6% | -6% | -14% | |
| Write 4K (MB/s) | 126.7 | 116.8 -8% | 115.5 -9% | 97 -23% | 91.3 -28% | 99.2 -22% |
| Read 4K (MB/s) | 66.1 | 41.42 -37% | 58 -12% | 49.58 -25% | 40.73 -38% | 54.1 -18% |
| Write Seq (MB/s) | 1538 | 1994 30% | 1555 1% | 1838 20% | 1915 25% | 1524 -1% |
| Read Seq (MB/s) | 2269 | 2392 5% | 2590 14% | 2421 7% | 2051 -10% | 2325 2% |
| Write 4K Q32T1 (MB/s) | 456.7 | 394.9 -14% | 369.3 -19% | 326.9 -28% | 308.3 -32% | 259.2 -43% |
| Read 4K Q32T1 (MB/s) | 554 | 438.2 -21% | 441.7 -20% | 372.9 -33% | 417.4 -25% | 328.9 -41% |
| Write Seq Q32T1 (MB/s) | 1541 | 1987 29% | 1547 0% | 1894 23% | 1922 25% | 1566 2% |
| Read Seq Q32T1 (MB/s) | 2567 | 3457 35% | 2969 16% | 2828 10% | 3395 32% | 2767 8% |

| 3DMark 11 Performance | 19110 points | |
| 3DMark Cloud Gate Standard Score | 29711 points | |
| 3DMark Fire Strike Score | 16110 points | |
| 3DMark Time Spy Score | 6512 points | |
Help | ||
| The Witcher 3 - 1920x1080 Ultra Graphics & Postprocessing (HBAO+) | |
| Average of class Gaming (104.7 - 240, n=7, last 2 years) | |
| Asus Zephyrus S GX502GW | |
| MSI GS65 Stealth 9SG | |
| Gigabyte Aero 15 Classic-XA | |
| Medion Erazer X15805 | |
| Gigabyte Aero 15 OLED XA | |
| Aorus 15 W9 | |
| BioShock Infinite - 1920x1080 Ultra Preset, DX11 (DDOF) | |
| MSI GS65 Stealth 9SG | |
| Gigabyte Aero 15 OLED XA | |
| Medion Erazer X15805 | |
| Gigabyte Aero 15 Classic-XA | |
| Aorus 15 W9 | |
| Thief - 1920x1080 Very High Preset AA:FXAA & High SS AF:8x | |
| Gigabyte Aero 15 OLED XA | |
| Rise of the Tomb Raider - 3840x2160 High Preset AA:FX AF:4x | |
| Gigabyte Aero 15 OLED XA | |
| low | med. | high | ultra | 4K | |
|---|---|---|---|---|---|
| BioShock Infinite (2013) | 152 | ||||
| Thief (2014) | 103 | ||||
| GTA V (2015) | 173 | 165 | 136 | 77 | 69 |
| The Witcher 3 (2015) | 63.5 | ||||
| Rise of the Tomb Raider (2016) | 43.4 | ||||
| Shadow of the Tomb Raider (2018) | 119.4 | 94.6 | 89.6 | 80.6 | 28.3 |
| Metro Exodus (2019) | 123 | 78 | 58 | 46 | 22 |
| The Division 2 (2019) | 150 | 105 | 86 | 63 | 23 |
| Anno 1800 (2019) | 36.4 | 21.6 | |||
| Control (2019) | 220 | 81 | 59.3 | 18.1 |
Noise level
| Idle |
| 34 / 35 / 45 dB(A) |
| Load |
| 43 / 54 dB(A) |
 | ||
30 dB silent 40 dB(A) audible 50 dB(A) loud |
||
min: | ||
(-) The maximum temperature on the upper side is 49 °C / 120 F, compared to the average of 40.4 °C / 105 F, ranging from 21.2 to 68.8 °C for the class Gaming.
(-) The bottom heats up to a maximum of 59 °C / 138 F, compared to the average of 43.2 °C / 110 F
(+) In idle usage, the average temperature for the upper side is 30.6 °C / 87 F, compared to the device average of 33.9 °C / 93 F.
(-) Playing The Witcher 3, the average temperature for the upper side is 42.1 °C / 108 F, compared to the device average of 33.9 °C / 93 F.
(-) The palmrests and touchpad can get very hot to the touch with a maximum of 41 °C / 105.8 F.
(-) The average temperature of the palmrest area of similar devices was 28.8 °C / 83.8 F (-12.2 °C / -22 F).
Gigabyte Aero 15 OLED XA audio analysis
(+) | speakers can play relatively loud (84 dB)
Bass 100 - 315 Hz
(-) | nearly no bass - on average 19.7% lower than median
(±) | linearity of bass is average (12.5% delta to prev. frequency)
Mids 400 - 2000 Hz
(±) | higher mids - on average 7% higher than median
(+) | mids are linear (6.8% delta to prev. frequency)
Highs 2 - 16 kHz
(+) | balanced highs - only 2.7% away from median
(+) | highs are linear (5.7% delta to prev. frequency)
Overall 100 - 16.000 Hz
(±) | linearity of overall sound is average (18.8% difference to median)
Compared to same class
» 62% of all tested devices in this class were better, 8% similar, 30% worse
» The best had a delta of 6%, average was 18%, worst was 132%
Compared to all devices tested
» 43% of all tested devices were better, 8% similar, 49% worse
» The best had a delta of 4%, average was 23%, worst was 134%
Gigabyte Aero 15 Classic-XA audio analysis
(+) | speakers can play relatively loud (82 dB)
Bass 100 - 315 Hz
(-) | nearly no bass - on average 17% lower than median
(±) | linearity of bass is average (10.2% delta to prev. frequency)
Mids 400 - 2000 Hz
(+) | balanced mids - only 4.7% away from median
(+) | mids are linear (6.2% delta to prev. frequency)
Highs 2 - 16 kHz
(+) | balanced highs - only 2.3% away from median
(+) | highs are linear (5.5% delta to prev. frequency)
Overall 100 - 16.000 Hz
(±) | linearity of overall sound is average (15.5% difference to median)
Compared to same class
» 35% of all tested devices in this class were better, 7% similar, 58% worse
» The best had a delta of 6%, average was 18%, worst was 132%
Compared to all devices tested
» 23% of all tested devices were better, 4% similar, 73% worse
» The best had a delta of 4%, average was 23%, worst was 134%
| Off / Standby | |
| Idle | |
| Load |
|
Key:
min: | |
| Gigabyte Aero 15 OLED XA i7-9750H, GeForce RTX 2070 Max-Q | Medion Erazer X15805 i9-8950HK, GeForce RTX 2070 Max-Q | Gigabyte Aero 15 Classic-XA i7-9750H, GeForce RTX 2070 Max-Q | Asus Zephyrus S GX502GW i7-9750H, GeForce RTX 2070 Mobile | MSI GS65 Stealth 9SG i7-9750H, GeForce RTX 2080 Max-Q | Aorus 15 W9 i7-8750H, GeForce RTX 2060 Mobile | Average of class Gaming | |
|---|---|---|---|---|---|---|---|
| Power Consumption | 14% | 4% | -10% | 9% | 16% | 9% | |
| Idle Minimum * (Watt) | 23 | 15.1 34% | 21 9% | 24 -4% | 18.3 20% | 18 22% | 13 ? 43% |
| Idle Average * (Watt) | 25 | 19.2 23% | 23 8% | 27 -8% | 22 12% | 20 20% | 19 ? 24% |
| Idle Maximum * (Watt) | 33 | 22.9 31% | 32 3% | 33 -0% | 28.8 13% | 28 15% | 24.6 ? 25% |
| Load Average * (Watt) | 96 | 107 -11% | 97 -1% | 129 -34% | 93 3% | 87 9% | 110.7 ? -15% |
| Witcher 3 ultra * (Watt) | 168 | 148 12% | 176 -5% | 142.6 15% | 135 20% | ||
| Load Maximum * (Watt) | 197 | 213 -8% | 213 -8% | 216 -10% | 215.9 -10% | 175 11% | 259 ? -31% |
* ... smaller is better
| Gigabyte Aero 15 OLED XA i7-9750H, GeForce RTX 2070 Max-Q, 94.24 Wh | Medion Erazer X15805 i9-8950HK, GeForce RTX 2070 Max-Q, 46.74 Wh | Gigabyte Aero 15 Classic-XA i7-9750H, GeForce RTX 2070 Max-Q, 94.24 Wh | Asus Zephyrus S GX502GW i7-9750H, GeForce RTX 2070 Mobile, 76 Wh | MSI GS65 Stealth 9SG i7-9750H, GeForce RTX 2080 Max-Q, 82 Wh | Aorus 15 W9 i7-8750H, GeForce RTX 2060 Mobile, 62 Wh | Average of class Gaming | |
|---|---|---|---|---|---|---|---|
| Battery runtime | -46% | 12% | -45% | 5% | -58% | -10% | |
| Reader / Idle (h) | 9.9 | 9.1 -8% | 5.9 -40% | 2.9 -71% | 8.27 ? -16% | ||
| WiFi v1.3 (h) | 5.7 | 3.1 -46% | 7 23% | 3.7 -35% | 6 5% | 2.4 -58% | 7.11 ? 25% |
| Load (h) | 2.5 | 3 20% | 1 -60% | 1.4 -44% | 1.502 ? -40% |
Pros
Cons
Verdict - Gigabyte improves the Aero 15 discreetly, but it also inherits some old weaknesses
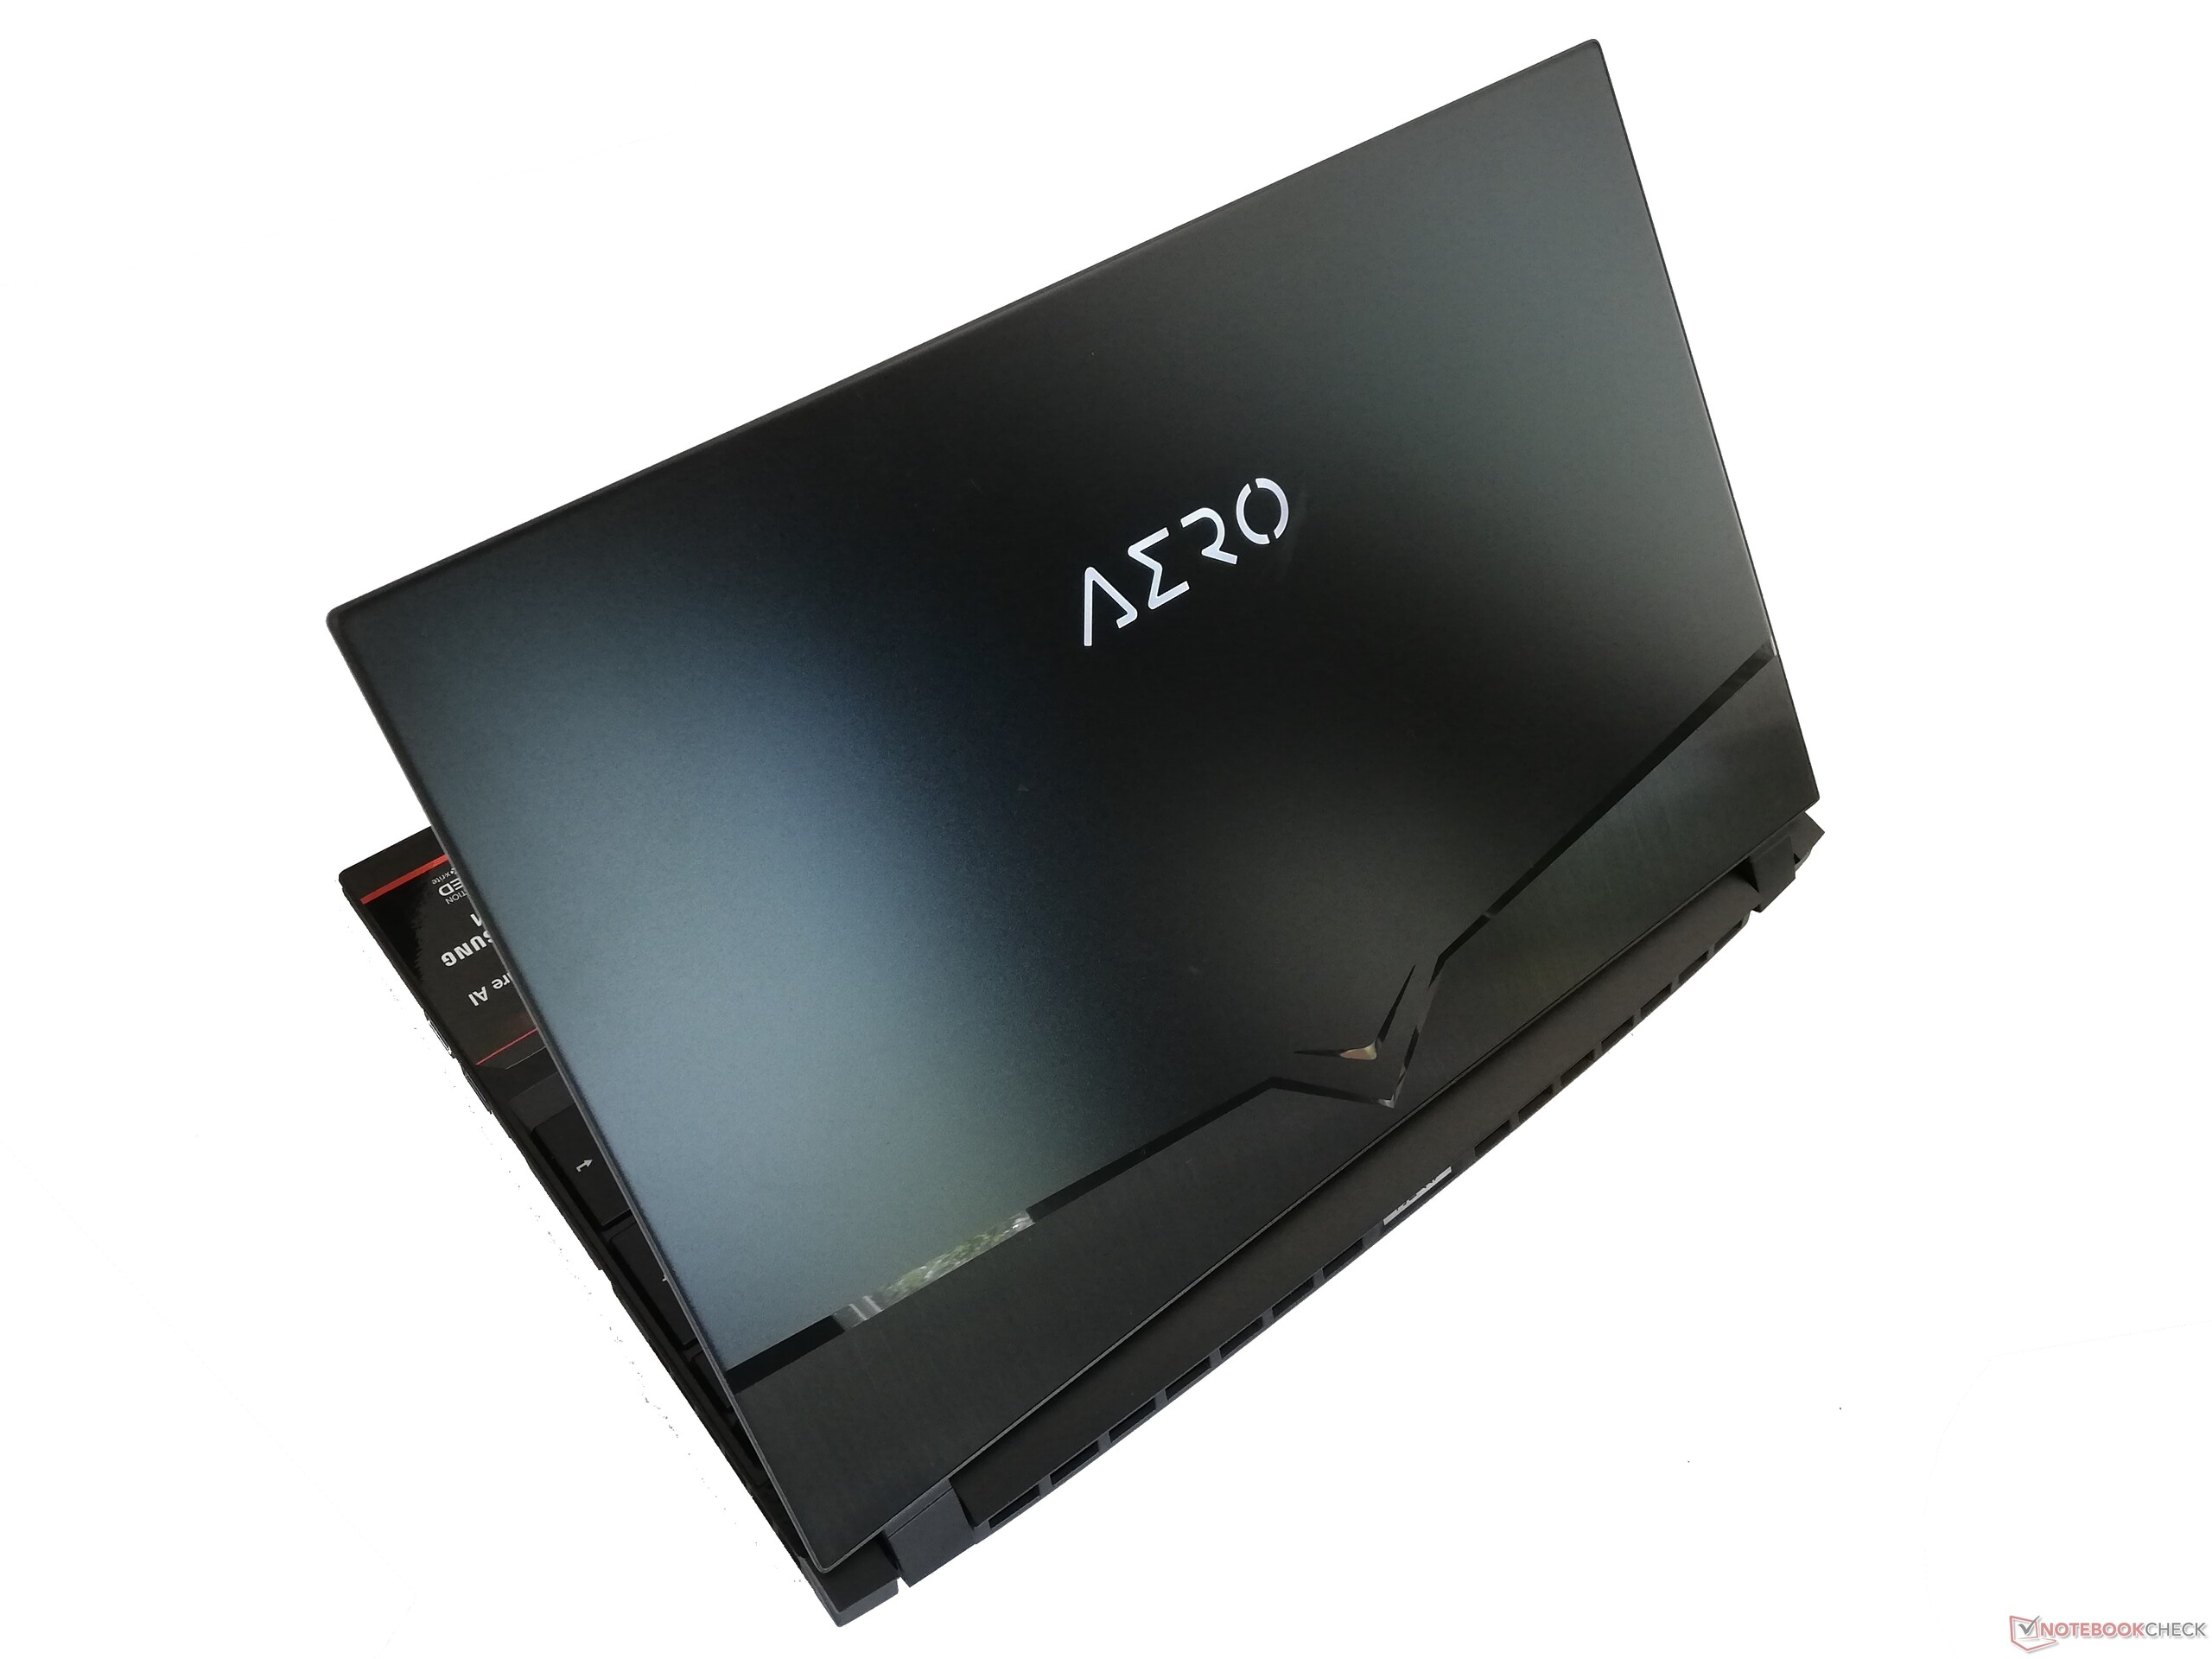
在我们的测试中,技嘉Aero 15 OLED XA在同类设备中表现出了出色的性能。尽管综合基准测试中的系统性能仍略落后于竞争对手,但处理器,图形和存储性能并未引起任何不满。此外,还有良好的连接设备和具有WiFi 6以及802.11 ax标准的先进WLAN适配器。经过重新设计的机身基于先前型号的优势,但仍然容易受到灰尘和指纹的影响。
技嘉精心改进了Aero 15,并继续提供具有纤薄设计和出色性能的值得推荐的笔记本电脑。
亮点当然是4K OLED面板。对比度和黑值的优势不可否认。但是弱点也很明显,例如PWM,这对于眼睛敏感的用户来说尤其困难。另外,由于反射性的显示表面,在户外使用该电脑变得困难。最后,我们应该给良好的冷却系统和续航时间一个好评,因此技嘉Aero 15 OLED XA值得任何想要轻薄而强劲的笔记本电脑的人。
Gigabyte Aero 15 OLED XA
- 08/31/2022 v7 (old)
Mike Wobker
Price comparison

