技嘉Aero 15Classic-XA(酷睿 i7-9750H, RTX 2070 Max-Q)笔记本电脑评测
| SD Card Reader | |
| average JPG Copy Test (av. of 3 runs) | |
| Gigabyte Aero 15-X9 (Toshiba Exceria Pro SDXC 64 GB UHS-II) | |
| Gigabyte Aero 15 Classic-XA (Toshiba Exceria Pro SDXC 64 GB UHS-II) | |
| Average of class Gaming (20.9 - 210, n=54, last 2 years) | |
| Schenker XMG Neo 15 Turing (Toshiba Exceria Pro SDXC 64 GB UHS-II) | |
| maximum AS SSD Seq Read Test (1GB) | |
| Gigabyte Aero 15-X9 (Toshiba Exceria Pro SDXC 64 GB UHS-II) | |
| Gigabyte Aero 15 Classic-XA (Toshiba Exceria Pro SDXC 64 GB UHS-II) | |
| Average of class Gaming (25.5 - 261, n=51, last 2 years) | |
| Schenker XMG Neo 15 Turing (Toshiba Exceria Pro SDXC 64 GB UHS-II) | |
| |||||||||||||||||||||||||
Brightness Distribution: 89 %
Center on Battery: 266 cd/m²
Contrast: 858:1 (Black: 0.31 cd/m²)
ΔE ColorChecker Calman: 2.78 | ∀{0.5-29.43 Ø4.73}
calibrated: 0.91
ΔE Greyscale Calman: 3.58 | ∀{0.09-98 Ø4.97}
96% sRGB (Argyll 1.6.3 3D)
62% AdobeRGB 1998 (Argyll 1.6.3 3D)
66.5% AdobeRGB 1998 (Argyll 3D)
95.5% sRGB (Argyll 3D)
65.3% Display P3 (Argyll 3D)
Gamma: 2.46
CCT: 7186 K
| Gigabyte Aero 15 Classic-XA Sharp LQ156M1JW03 (SHP14C5), IGZO, 1920x1080, | Gigabyte Aero 15-X9 LGD05C0, IPS, 1920x1080, | Razer Blade 15 RTX 2070 Max-Q LG Philips LGD05C0, IPS, 1920x1080, | Asus Zephyrus S GX531GX AU Optronics B156HAN08.2, IPS, 1920x1080, | Schenker XMG Neo 15 Turing BOEhydis NV156FHM-N4G (BOE07AF), IPS, 1920x1080, | Acer Predator Triton 500 AU Optronics B156HAN08.2 (AUO82ED), IPS, 1920x1080, | Lenovo Legion Y740-15ICHg LP156WFG-SPB2, IPS, 1920x1080, | |
|---|---|---|---|---|---|---|---|
| Display | -3% | -0% | -1% | -3% | -2% | -3% | |
| Display P3 Coverage (%) | 65.3 | 63.5 -3% | 65.3 0% | 65.6 0% | 63.5 -3% | 64.2 -2% | 63.5 -3% |
| sRGB Coverage (%) | 95.5 | 93.1 -3% | 94.9 -1% | 92.2 -3% | 92.3 -3% | 92.6 -3% | 92.4 -3% |
| AdobeRGB 1998 Coverage (%) | 66.5 | 64.5 -3% | 66.3 0% | 66.9 1% | 65 -2% | 65.7 -1% | 64.7 -3% |
| Response Times | -15% | -8% | 34% | 27% | 24% | -21% | |
| Response Time Grey 50% / Grey 80% * (ms) | 15.2 ? | 16.4 ? -8% | 16.8 ? -11% | 7 ? 54% | 8.8 ? 42% | 8 ? 47% | 18.8 ? -24% |
| Response Time Black / White * (ms) | 11.2 ? | 13.6 ? -21% | 11.6 ? -4% | 9.6 ? 14% | 10 ? 11% | 11.2 ? -0% | 13.2 ? -18% |
| PWM Frequency (Hz) | 23580 ? | 1000 ? | |||||
| Screen | 16% | -4% | -11% | -18% | -18% | -17% | |
| Brightness middle (cd/m²) | 266 | 250 -6% | 314.7 18% | 323.6 22% | 268 1% | 304 14% | 320.4 20% |
| Brightness (cd/m²) | 248 | 235 -5% | 312 26% | 315 27% | 270 9% | 299 21% | 298 20% |
| Brightness Distribution (%) | 89 | 85 -4% | 90 1% | 91 2% | 84 -6% | 89 0% | 85 -4% |
| Black Level * (cd/m²) | 0.31 | 0.29 6% | 0.38 -23% | 0.29 6% | 0.24 23% | 0.27 13% | 0.42 -35% |
| Contrast (:1) | 858 | 862 0% | 828 -3% | 1116 30% | 1117 30% | 1126 31% | 763 -11% |
| Colorchecker dE 2000 * | 2.78 | 1.46 47% | 2.56 8% | 3.31 -19% | 4.51 -62% | 4.66 -68% | 3.21 -15% |
| Colorchecker dE 2000 max. * | 5.96 | 2.47 59% | 4.89 18% | 5.74 4% | 9.58 -61% | 9.65 -62% | 5.54 7% |
| Colorchecker dE 2000 calibrated * | 0.91 | 1.71 -88% | 2.73 -200% | 1.57 -73% | 1.72 -89% | 2.36 -159% | |
| Greyscale dE 2000 * | 3.58 | 1.27 65% | 3.4 5% | 2.9 19% | 5.36 -50% | 5.53 -54% | 3.6 -1% |
| Gamma | 2.46 89% | 2.4 92% | 2.3 96% | 2.29 96% | 2.51 88% | 2.5 88% | 2.27 97% |
| CCT | 7186 90% | 6749 96% | 6435 101% | 6765 96% | 7826 83% | 8028 81% | 6503 100% |
| Color Space (Percent of AdobeRGB 1998) (%) | 62 | 60 -3% | 60.7 -2% | 59.7 -4% | 59 -5% | 60 -3% | 59 -5% |
| Color Space (Percent of sRGB) (%) | 96 | 93 -3% | 94.6 -1% | 91.8 -4% | 92 -4% | 93 -3% | 92 -4% |
| Total Average (Program / Settings) | -1% /
8% | -4% /
-4% | 7% /
-3% | 2% /
-10% | 1% /
-10% | -14% /
-15% |
* ... smaller is better
Display Response Times
| ↔ Response Time Black to White | ||
|---|---|---|
| 11.2 ms ... rise ↗ and fall ↘ combined | ↗ 6.8 ms rise | 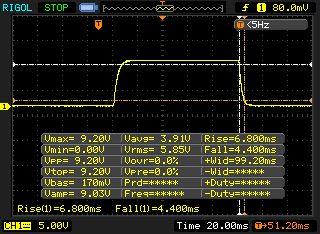 |
| ↘ 4.4 ms fall | ||
| The screen shows good response rates in our tests, but may be too slow for competitive gamers. In comparison, all tested devices range from 0.1 (minimum) to 240 (maximum) ms. » 30 % of all devices are better. This means that the measured response time is better than the average of all tested devices (19.9 ms). | ||
| ↔ Response Time 50% Grey to 80% Grey | ||
| 15.2 ms ... rise ↗ and fall ↘ combined | ↗ 7.6 ms rise | 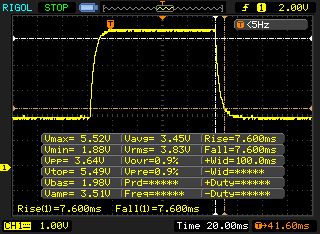 |
| ↘ 7.6 ms fall | ||
| The screen shows good response rates in our tests, but may be too slow for competitive gamers. In comparison, all tested devices range from 0.165 (minimum) to 636 (maximum) ms. » 29 % of all devices are better. This means that the measured response time is better than the average of all tested devices (31.1 ms). | ||
Screen Flickering / PWM (Pulse-Width Modulation)
| Screen flickering / PWM detected | 23580 Hz | ≤ 24 % brightness setting | 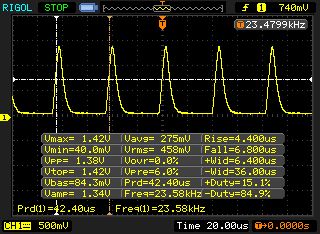 |
The display backlight flickers at 23580 Hz (worst case, e.g., utilizing PWM) Flickering detected at a brightness setting of 24 % and below. There should be no flickering or PWM above this brightness setting. The frequency of 23580 Hz is quite high, so most users sensitive to PWM should not notice any flickering. In comparison: 52 % of all tested devices do not use PWM to dim the display. If PWM was detected, an average of 7794 (minimum: 5 - maximum: 343500) Hz was measured. | |||
| Cinebench R10 | |
| Rendering Single 32Bit | |
| Average of class Gaming (7457 - 11779, n=8, last 2 years) | |
| Gigabyte Aero 15 Classic-XA | |
| Schenker XMG Neo 15 Turing | |
| Gigabyte Aero 15-X9 | |
| Rendering Multiple CPUs 32Bit | |
| Average of class Gaming (42932 - 81339, n=8, last 2 years) | |
| Gigabyte Aero 15-X9 | |
| Gigabyte Aero 15 Classic-XA | |
| Schenker XMG Neo 15 Turing | |
| Cinebench R20 | |
| CPU (Single Core) | |
| Average of class Gaming (442 - 895, n=111, last 2 years) | |
| Gigabyte Aero 15 Classic-XA | |
| Schenker XMG Neo 15 Turing | |
| CPU (Multi Core) | |
| Average of class Gaming (4029 - 16108, n=111, last 2 years) | |
| Gigabyte Aero 15 Classic-XA | |
| Schenker XMG Neo 15 Turing | |
| Geekbench 3 | |
| 32 Bit Multi-Core Score | |
| Gigabyte Aero 15 Classic-XA | |
| Schenker XMG Neo 15 Turing | |
| Gigabyte Aero 15-X9 | |
| 32 Bit Single-Core Score | |
| Gigabyte Aero 15 Classic-XA | |
| Schenker XMG Neo 15 Turing | |
| Gigabyte Aero 15-X9 | |
| Geekbench 4.4 | |
| 64 Bit Multi-Core Score | |
| Average of class Gaming (89200 - 97490, n=2, last 2 years) | |
| Gigabyte Aero 15 Classic-XA | |
| Schenker XMG Neo 15 Turing | |
| Gigabyte Aero 15-X9 | |
| 64 Bit Single-Core Score | |
| Average of class Gaming (9335 - 9492, n=2, last 2 years) | |
| Gigabyte Aero 15 Classic-XA | |
| Schenker XMG Neo 15 Turing | |
| Gigabyte Aero 15-X9 | |
| Mozilla Kraken 1.1 - Total | |
| Gigabyte Aero 15-X9 (Edge 44) | |
| Razer Blade 15 RTX 2070 Max-Q (Edge 44.17763.1.0) | |
| Schenker XMG Neo 15 Turing (Edge 44) | |
| Lenovo Legion Y740-15ICHg (Microsoft Edge 44.17763.1.0) | |
| Asus Zephyrus S GX531GX (Edge 42.17134.1.0) | |
| Gigabyte Aero 15 Classic-XA (Edge 44) | |
| Average of class Gaming (391 - 590, n=105, last 2 years) | |
| Octane V2 - Total Score | |
| Average of class Gaming (87588 - 139447, n=30, last 2 years) | |
| Gigabyte Aero 15 Classic-XA (Edge 44) | |
| Schenker XMG Neo 15 Turing (Edge 44) | |
| Lenovo Legion Y740-15ICHg (Microsoft Edge 44.17763.1.0) | |
| Gigabyte Aero 15-X9 (Edge 44) | |
| Asus Zephyrus S GX531GX (Edge 42.17134.1.0) | |
| Razer Blade 15 RTX 2070 Max-Q (Edge 44.17763.1.0) | |
| WebXPRT 3 - Overall | |
| Average of class Gaming (242 - 532, n=100, last 2 years) | |
| Gigabyte Aero 15 Classic-XA (Edge 44) | |
| JetStream 1.1 - 1.1 Total | |
| Average of class Gaming (518 - 647, n=5, last 2 years) | |
| Razer Blade 15 RTX 2070 Max-Q (Edge 44.17763.1.0) | |
| Schenker XMG Neo 15 Turing (Edge 44) | |
| Asus Zephyrus S GX531GX (Edge 42.17134.1.0) | |
| Lenovo Legion Y740-15ICHg (Microsoft Edge 44.17763.1.0) | |
| Gigabyte Aero 15 Classic-XA (Edge 44) | |
| Gigabyte Aero 15-X9 (Edge 44) | |
* ... smaller is better
| PCMark 7 Score | 6854 points | |
| PCMark 8 Home Score Accelerated v2 | 4851 points | |
| PCMark 8 Creative Score Accelerated v2 | 5574 points | |
| PCMark 8 Work Score Accelerated v2 | 6035 points | |
| PCMark 10 Score | 5697 points | |
Help | ||

| Gigabyte Aero 15 Classic-XA Intel SSD 760p SSDPEKKW512G8 | Gigabyte Aero 15-X9 Intel SSD 760p SSDPEKKW010T8 | Razer Blade 15 RTX 2070 Max-Q Samsung SSD PM981 MZVLB512HAJQ | Asus Zephyrus S GX531GX Intel SSD 660p SSDPEKNW512G8 | Schenker XMG Neo 15 Turing Samsung SSD 970 EVO Plus 1TB | Acer Predator Triton 500 2x WDC PC SN720 SDAPNTW-256G-1014 (RAID 0) | Lenovo Legion Y740-15ICHg Samsung SSD PM981 MZVLB256HAHQ | |
|---|---|---|---|---|---|---|---|
| CrystalDiskMark 5.2 / 6 | -15% | -13% | -33% | -6% | 7% | -20% | |
| Write 4K (MB/s) | 115.5 | 97.1 -16% | 93.9 -19% | 93.9 -19% | 92.5 -20% | 93.6 -19% | 81 -30% |
| Read 4K (MB/s) | 58 | 53.7 -7% | 40.56 -30% | 46.29 -20% | 40.45 -30% | 38.82 -33% | 36.03 -38% |
| Write Seq (MB/s) | 1555 | 1526 -2% | 1468 -6% | 974 -37% | 1197 -23% | 2455 58% | 1687 8% |
| Read Seq (MB/s) | 2590 | 2020 -22% | 1540 -41% | 1425 -45% | 1018 -61% | 2107 -19% | 1835 -29% |
| Write 4K Q32T1 (MB/s) | 369.3 | 285.6 -23% | 293.5 -21% | 259.4 -30% | 288.6 -22% | 298.7 -19% | 205.3 -44% |
| Read 4K Q32T1 (MB/s) | 441.7 | 321.8 -27% | 346 -22% | 296.5 -33% | 332 -25% | 338.7 -23% | 229 -48% |
| Write Seq Q32T1 (MB/s) | 1547 | 1533 -1% | 1941 25% | 977 -37% | 3317 114% | 2902 88% | 1683 9% |
| Read Seq Q32T1 (MB/s) | 2969 | 2351 -21% | 3266 10% | 1666 -44% | 3515 18% | 3536 19% | 3363 13% |
| 3DMark 06 Standard Score | 35193 points | |
| 3DMark 11 Performance | 18171 points | |
| 3DMark Ice Storm Standard Score | 113186 points | |
| 3DMark Cloud Gate Standard Score | 35891 points | |
| 3DMark Fire Strike Score | 15494 points | |
| 3DMark Time Spy Score | 6639 points | |
Help | ||
| The Witcher 3 - 1920x1080 Ultra Graphics & Postprocessing (HBAO+) | |
| Average of class Gaming (95 - 240, n=8, last 2 years) | |
| Asus Zephyrus S GX531GX | |
| Acer Predator Triton 500 | |
| Razer Blade 15 RTX 2070 Max-Q | |
| Gigabyte Aero 15 Classic-XA | |
| Schenker XMG Neo 15 Turing | |
| Gigabyte Aero 15-X9 | |
| Lenovo Legion Y740-15ICHg | |
| BioShock Infinite - 1920x1080 Ultra Preset, DX11 (DDOF) | |
| Lenovo Legion Y740-15ICHg | |
| Asus Zephyrus S GX531GX | |
| Razer Blade 15 RTX 2070 Max-Q | |
| Gigabyte Aero 15 Classic-XA | |
| Schenker XMG Neo 15 Turing | |
| Gigabyte Aero 15-X9 | |
| Far Cry 5 - 1920x1080 Ultra Preset AA:T | |
| Average of class Gaming (70 - 151, n=10, last 2 years) | |
| Gigabyte Aero 15 Classic-XA | |
| Gigabyte Aero 15-X9 | |
| low | med. | high | ultra | |
|---|---|---|---|---|
| BioShock Infinite (2013) | 321.3 | 279.3 | 238 | 150.3 |
| The Witcher 3 (2015) | 273.1 | 189.2 | 113.2 | 64.1 |
| Final Fantasy XV Benchmark (2018) | 117.6 | 87.9 | 62.9 | |
| World of Tanks enCore (2018) | 490.3 | 218.9 | 129.1 | |
| Far Cry 5 (2018) | 127 | 100 | 95 | 89 |
| Forza Horizon 4 (2018) | 150 | 121 | 118 | 98 |
| Far Cry New Dawn (2019) | 113 | 93 | 87 | 79 |
| Metro Exodus (2019) | 128.8 | 79.8 | 56.3 | 47.7 |
| The Division 2 (2019) | 147 | 108 | 87 | 70 |
| Anno 1800 (2019) | 92 | 82.1 | 68.1 | 34 |
Noise level
| Idle |
| 31 / 34 / 39 dB(A) |
| Load |
| 46 / 55 dB(A) |
 | ||
30 dB silent 40 dB(A) audible 50 dB(A) loud |
||
min: | ||
| Gigabyte Aero 15 Classic-XA i7-9750H, GeForce RTX 2070 Max-Q | Gigabyte Aero 15-X9 i7-8750H, GeForce RTX 2070 Max-Q | Razer Blade 15 RTX 2070 Max-Q i7-8750H, GeForce RTX 2070 Max-Q | Asus Zephyrus S GX531GX i7-8750H, GeForce RTX 2080 Max-Q | Schenker XMG Neo 15 Turing i7-8750H, GeForce RTX 2070 Max-Q | Acer Predator Triton 500 i7-8750H, GeForce RTX 2080 Max-Q | Lenovo Legion Y740-15ICHg i7-8750H, GeForce RTX 2070 Max-Q | |
|---|---|---|---|---|---|---|---|
| Noise | 6% | 16% | 3% | 2% | 8% | 13% | |
| off / environment * (dB) | 30 | 30 -0% | 28.8 4% | 28.7 4% | 30 -0% | 29 3% | 28 7% |
| Idle Minimum * (dB) | 31 | 32 -3% | 28.8 7% | 29.8 4% | 30 3% | 30 3% | 32.6 -5% |
| Idle Average * (dB) | 34 | 34 -0% | 28.8 15% | 32.4 5% | 32 6% | 32 6% | 32.7 4% |
| Idle Maximum * (dB) | 39 | 36 8% | 29.4 25% | 38 3% | 35 10% | 34 13% | 32.7 16% |
| Load Average * (dB) | 46 | 42 9% | 35.7 22% | 38.2 17% | 47 -2% | 44 4% | 33.3 28% |
| Witcher 3 ultra * (dB) | 53 | 44 17% | 42.5 20% | 56.6 -7% | 53 -0% | 46 13% | 41.6 22% |
| Load Maximum * (dB) | 55 | 48 13% | 45 18% | 56.6 -3% | 55 -0% | 47 15% | 45.2 18% |
* ... smaller is better
(-) The maximum temperature on the upper side is 58 °C / 136 F, compared to the average of 40.4 °C / 105 F, ranging from 21.2 to 68.8 °C for the class Gaming.
(-) The bottom heats up to a maximum of 64 °C / 147 F, compared to the average of 43.2 °C / 110 F
(+) In idle usage, the average temperature for the upper side is 28.1 °C / 83 F, compared to the device average of 33.9 °C / 93 F.
(-) Playing The Witcher 3, the average temperature for the upper side is 45.4 °C / 114 F, compared to the device average of 33.9 °C / 93 F.
(-) The palmrests and touchpad can get very hot to the touch with a maximum of 40 °C / 104 F.
(-) The average temperature of the palmrest area of similar devices was 28.8 °C / 83.8 F (-11.2 °C / -20.2 F).
| Gigabyte Aero 15 Classic-XA i7-9750H, GeForce RTX 2070 Max-Q | Gigabyte Aero 15-X9 i7-8750H, GeForce RTX 2070 Max-Q | Razer Blade 15 RTX 2070 Max-Q i7-8750H, GeForce RTX 2070 Max-Q | Asus Zephyrus S GX531GX i7-8750H, GeForce RTX 2080 Max-Q | Schenker XMG Neo 15 Turing i7-8750H, GeForce RTX 2070 Max-Q | Acer Predator Triton 500 i7-8750H, GeForce RTX 2080 Max-Q | Lenovo Legion Y740-15ICHg i7-8750H, GeForce RTX 2070 Max-Q | |
|---|---|---|---|---|---|---|---|
| Heat | 6% | 17% | 10% | -2% | 2% | 9% | |
| Maximum Upper Side * (°C) | 58 | 56 3% | 49 16% | 47 19% | 58 -0% | 49 16% | 37.6 35% |
| Maximum Bottom * (°C) | 64 | 66 -3% | 49 23% | 48.6 24% | 68 -6% | 58 9% | 45.2 29% |
| Idle Upper Side * (°C) | 30 | 27 10% | 25.4 15% | 28.8 4% | 30 -0% | 33 -10% | 32.2 -7% |
| Idle Bottom * (°C) | 31 | 27 13% | 27.2 12% | 33.2 -7% | 31 -0% | 33 -6% | 37.2 -20% |
* ... smaller is better
Gigabyte Aero 15 Classic-XA audio analysis
(+) | speakers can play relatively loud (82 dB)
Bass 100 - 315 Hz
(-) | nearly no bass - on average 17% lower than median
(±) | linearity of bass is average (10.2% delta to prev. frequency)
Mids 400 - 2000 Hz
(+) | balanced mids - only 4.7% away from median
(+) | mids are linear (6.2% delta to prev. frequency)
Highs 2 - 16 kHz
(+) | balanced highs - only 2.3% away from median
(+) | highs are linear (5.5% delta to prev. frequency)
Overall 100 - 16.000 Hz
(±) | linearity of overall sound is average (15.5% difference to median)
Compared to same class
» 35% of all tested devices in this class were better, 7% similar, 58% worse
» The best had a delta of 6%, average was 18%, worst was 132%
Compared to all devices tested
» 23% of all tested devices were better, 4% similar, 73% worse
» The best had a delta of 4%, average was 24%, worst was 134%
Razer Blade 15 RTX 2070 Max-Q audio analysis
(-) | not very loud speakers (71.6 dB)
Bass 100 - 315 Hz
(±) | reduced bass - on average 7.7% lower than median
(±) | linearity of bass is average (11.1% delta to prev. frequency)
Mids 400 - 2000 Hz
(±) | higher mids - on average 7.8% higher than median
(±) | linearity of mids is average (9.5% delta to prev. frequency)
Highs 2 - 16 kHz
(+) | balanced highs - only 3% away from median
(±) | linearity of highs is average (7.2% delta to prev. frequency)
Overall 100 - 16.000 Hz
(±) | linearity of overall sound is average (23.9% difference to median)
Compared to same class
» 86% of all tested devices in this class were better, 5% similar, 9% worse
» The best had a delta of 6%, average was 18%, worst was 132%
Compared to all devices tested
» 72% of all tested devices were better, 6% similar, 22% worse
» The best had a delta of 4%, average was 24%, worst was 134%
| Off / Standby | |
| Idle | |
| Load |
|
Key:
min: | |
| Gigabyte Aero 15 Classic-XA i7-9750H, GeForce RTX 2070 Max-Q | Gigabyte Aero 15-X9 i7-8750H, GeForce RTX 2070 Max-Q | Razer Blade 15 RTX 2070 Max-Q i7-8750H, GeForce RTX 2070 Max-Q | Asus Zephyrus S GX531GX i7-8750H, GeForce RTX 2080 Max-Q | Schenker XMG Neo 15 Turing i7-8750H, GeForce RTX 2070 Max-Q | Acer Predator Triton 500 i7-8750H, GeForce RTX 2080 Max-Q | Lenovo Legion Y740-15ICHg i7-8750H, GeForce RTX 2070 Max-Q | |
|---|---|---|---|---|---|---|---|
| Power Consumption | 21% | 26% | 6% | 23% | 9% | 5% | |
| Idle Minimum * (Watt) | 21 | 16 24% | 10.4 50% | 16.1 23% | 13 38% | 16 24% | 22.9 -9% |
| Idle Average * (Watt) | 23 | 18 22% | 14.6 37% | 20.9 9% | 16 30% | 22 4% | 27.2 -18% |
| Idle Maximum * (Watt) | 32 | 23 28% | 16.3 49% | 27 16% | 21 34% | 32 -0% | 27.5 14% |
| Load Average * (Watt) | 97 | 88 9% | 88.5 9% | 93.4 4% | 84 13% | 89 8% | 83.4 14% |
| Witcher 3 ultra * (Watt) | 148 | 120 19% | 155.4 -5% | 168.2 -14% | 135 9% | 147 1% | 143.6 3% |
| Load Maximum * (Watt) | 213 | 167 22% | 182.4 14% | 215.3 -1% | 183 14% | 173 19% | 160.5 25% |
* ... smaller is better
| Gigabyte Aero 15 Classic-XA i7-9750H, GeForce RTX 2070 Max-Q, 94.24 Wh | Gigabyte Aero 15-X9 i7-8750H, GeForce RTX 2070 Max-Q, 94.24 Wh | Gigabyte Aero 15X v8 i7-8750H, GeForce GTX 1070 Max-Q, 94.24 Wh | Razer Blade 15 RTX 2070 Max-Q i7-8750H, GeForce RTX 2070 Max-Q, 80 Wh | Asus Zephyrus S GX531GX i7-8750H, GeForce RTX 2080 Max-Q, 50 Wh | Schenker XMG Neo 15 Turing i7-8750H, GeForce RTX 2070 Max-Q, 62.3 Wh | Acer Predator Triton 500 i7-8750H, GeForce RTX 2080 Max-Q, 82 Wh | Lenovo Legion Y740-15ICHg i7-8750H, GeForce RTX 2070 Max-Q, 57 Wh | |
|---|---|---|---|---|---|---|---|---|
| Battery runtime | -5% | 19% | -11% | -57% | -32% | -48% | -63% | |
| Reader / Idle (h) | 9.1 | 9.2 1% | 12.7 40% | 11.4 25% | 6.9 -24% | 5.6 -38% | 3.9 -57% | |
| H.264 (h) | 6.8 | 6.1 -10% | 8.4 24% | 4.9 -28% | ||||
| WiFi v1.3 (h) | 7 | 6.4 -9% | 8.6 23% | 6.5 -7% | 3 -57% | 5.1 -27% | 3.2 -54% | 2.8 -60% |
| Load (h) | 3 | 2.9 -3% | 2.6 -13% | 1.5 -50% | 1.6 -47% | 1.4 -53% | 0.8 -73% |
Pros
Cons
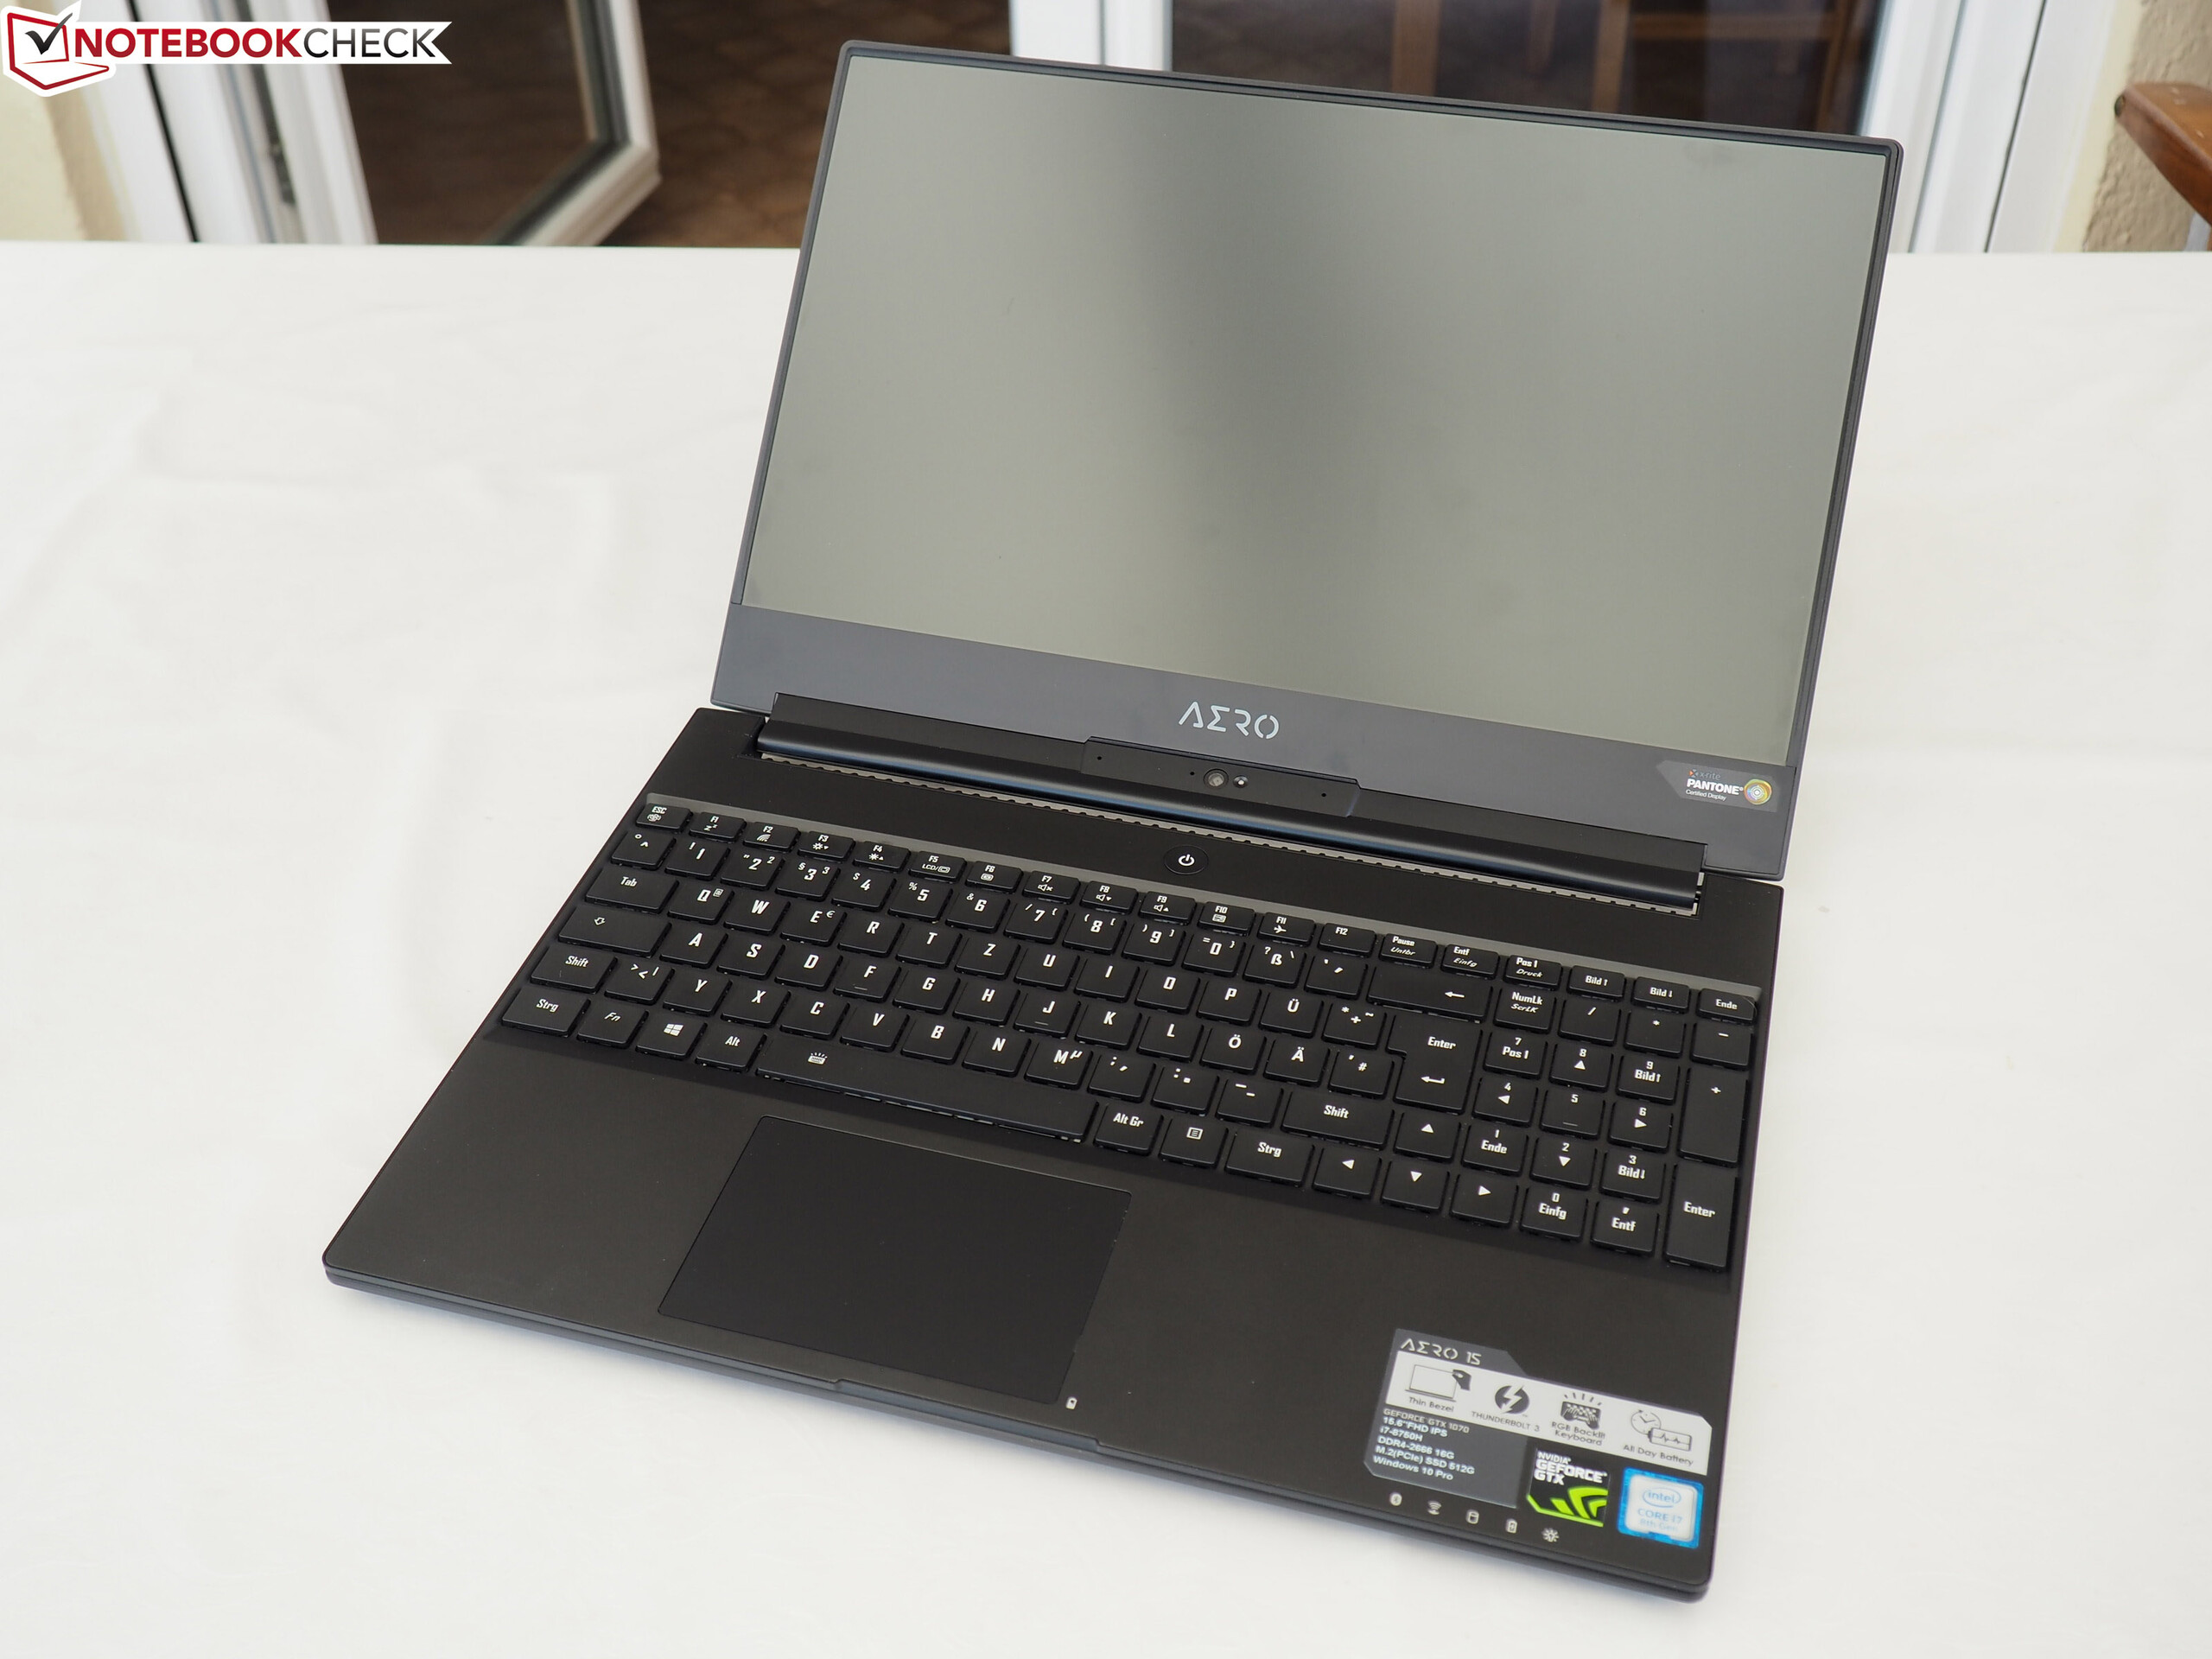
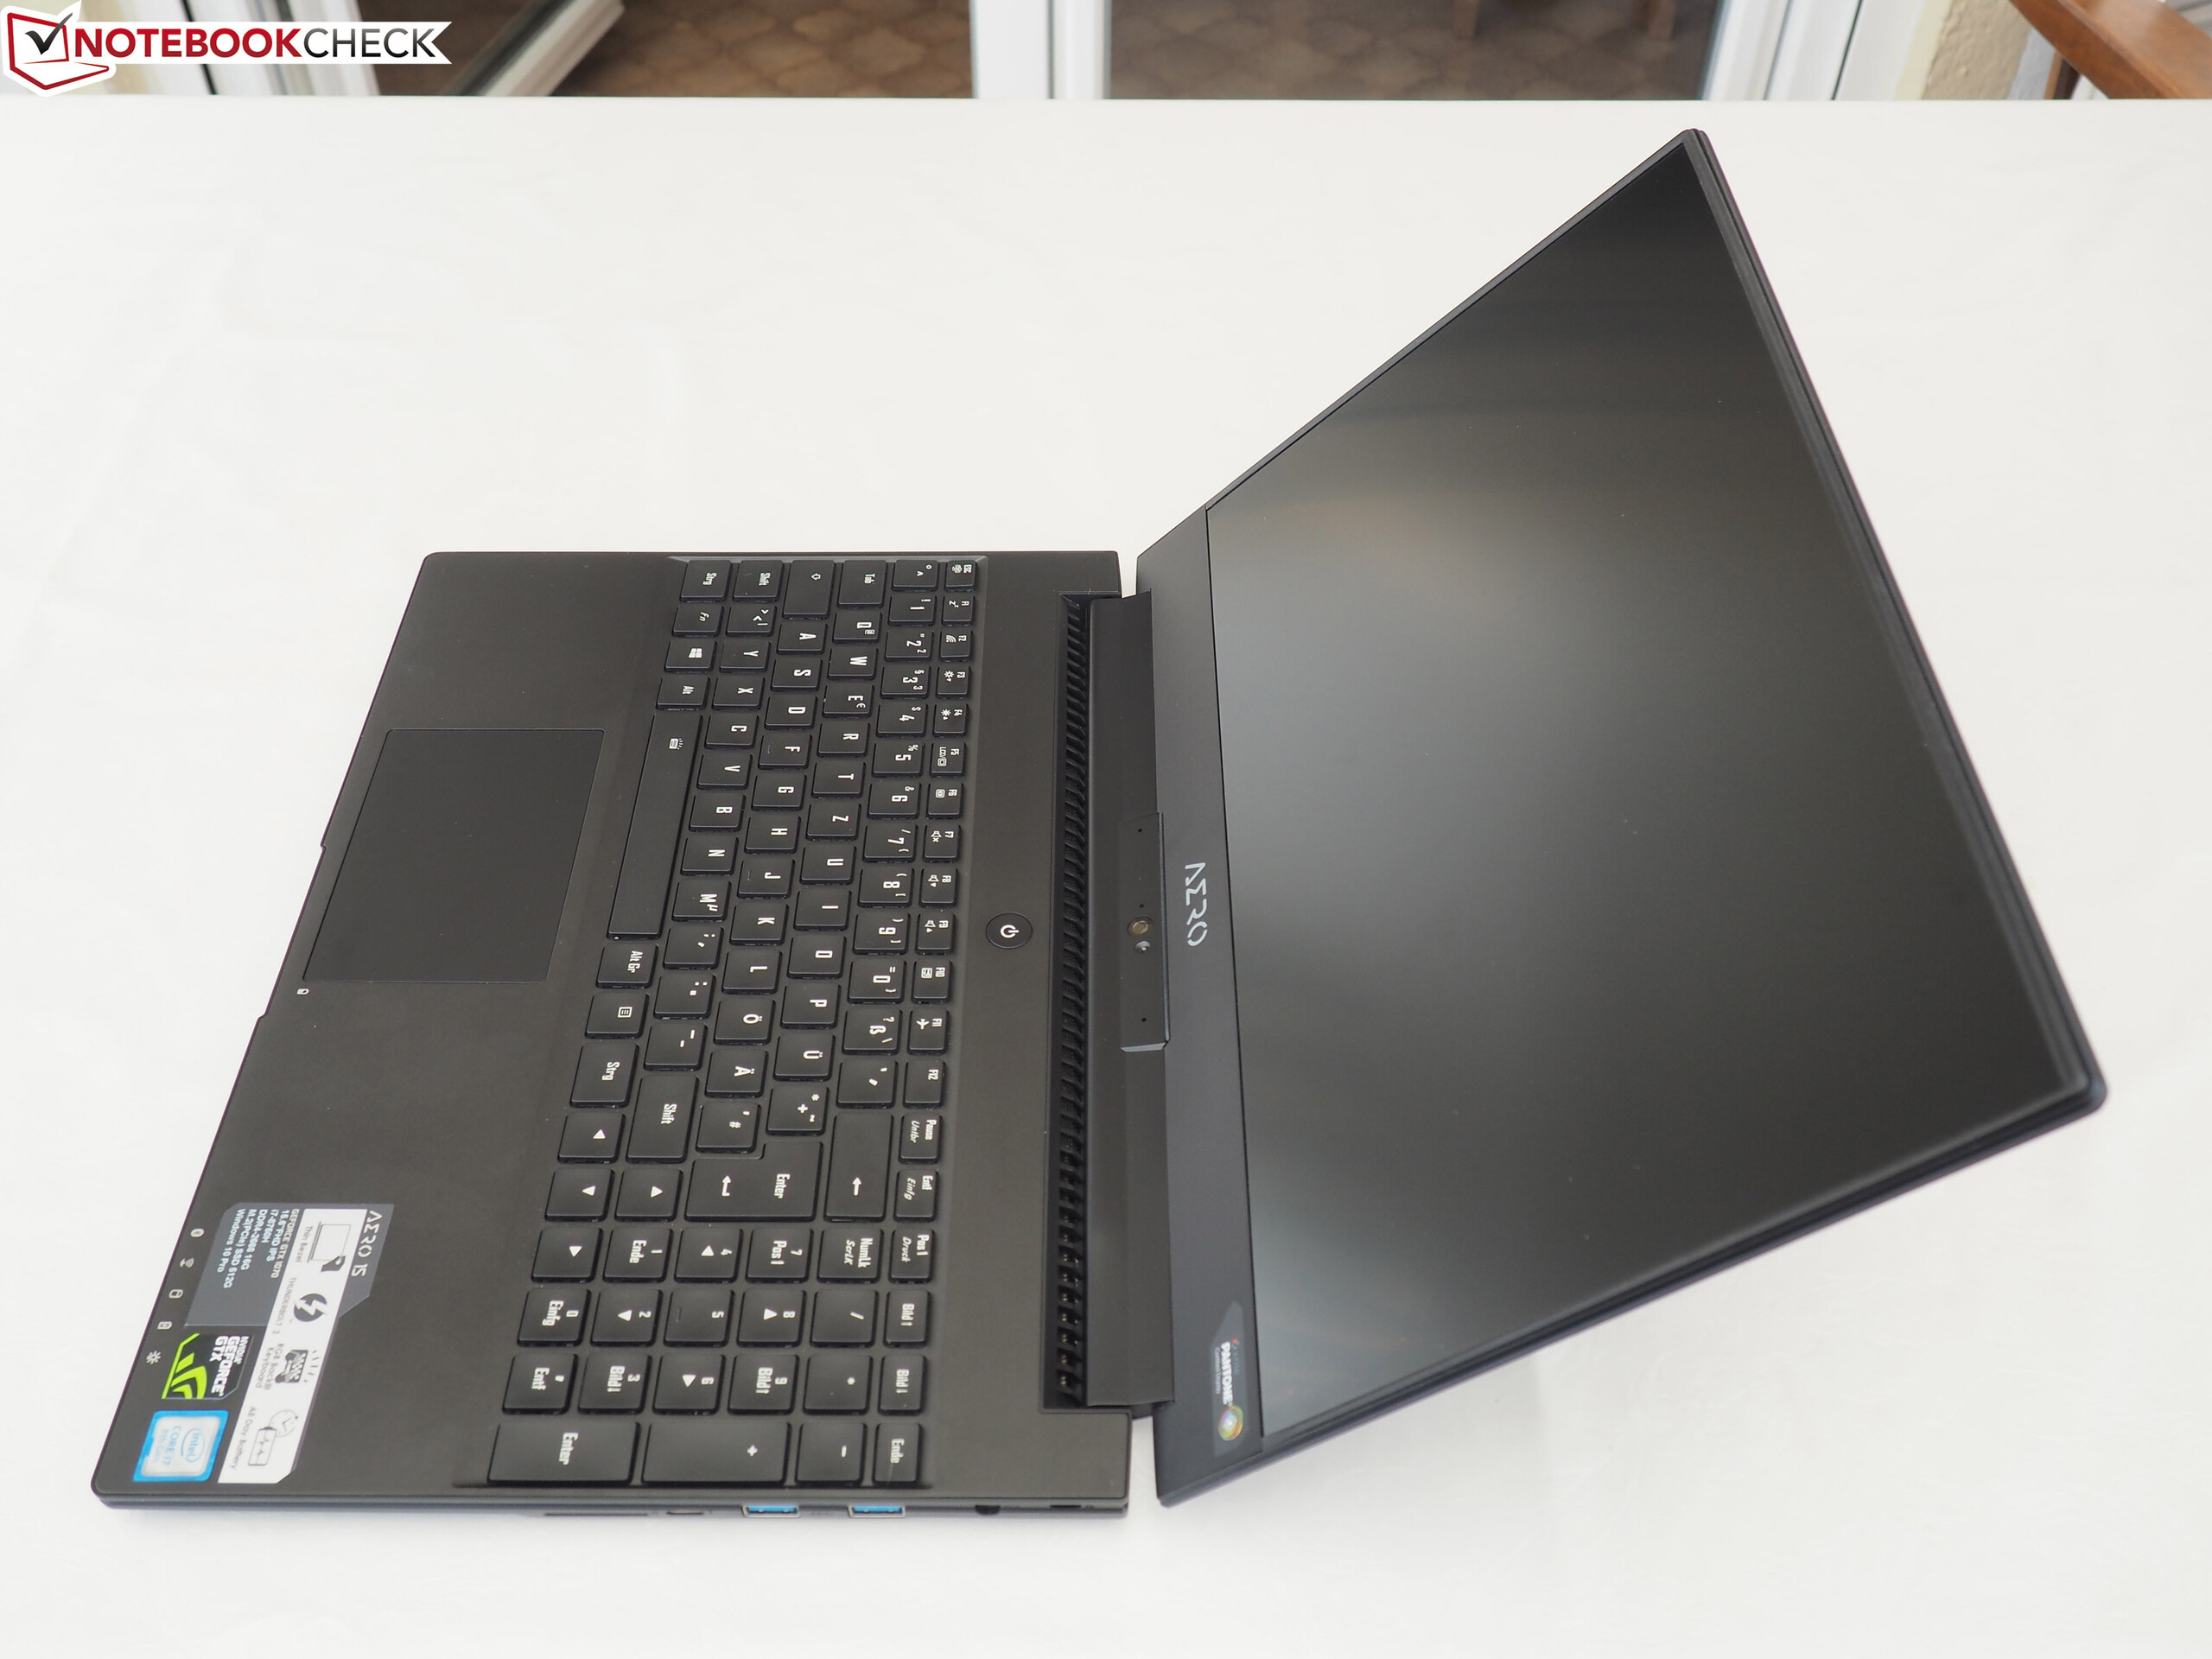
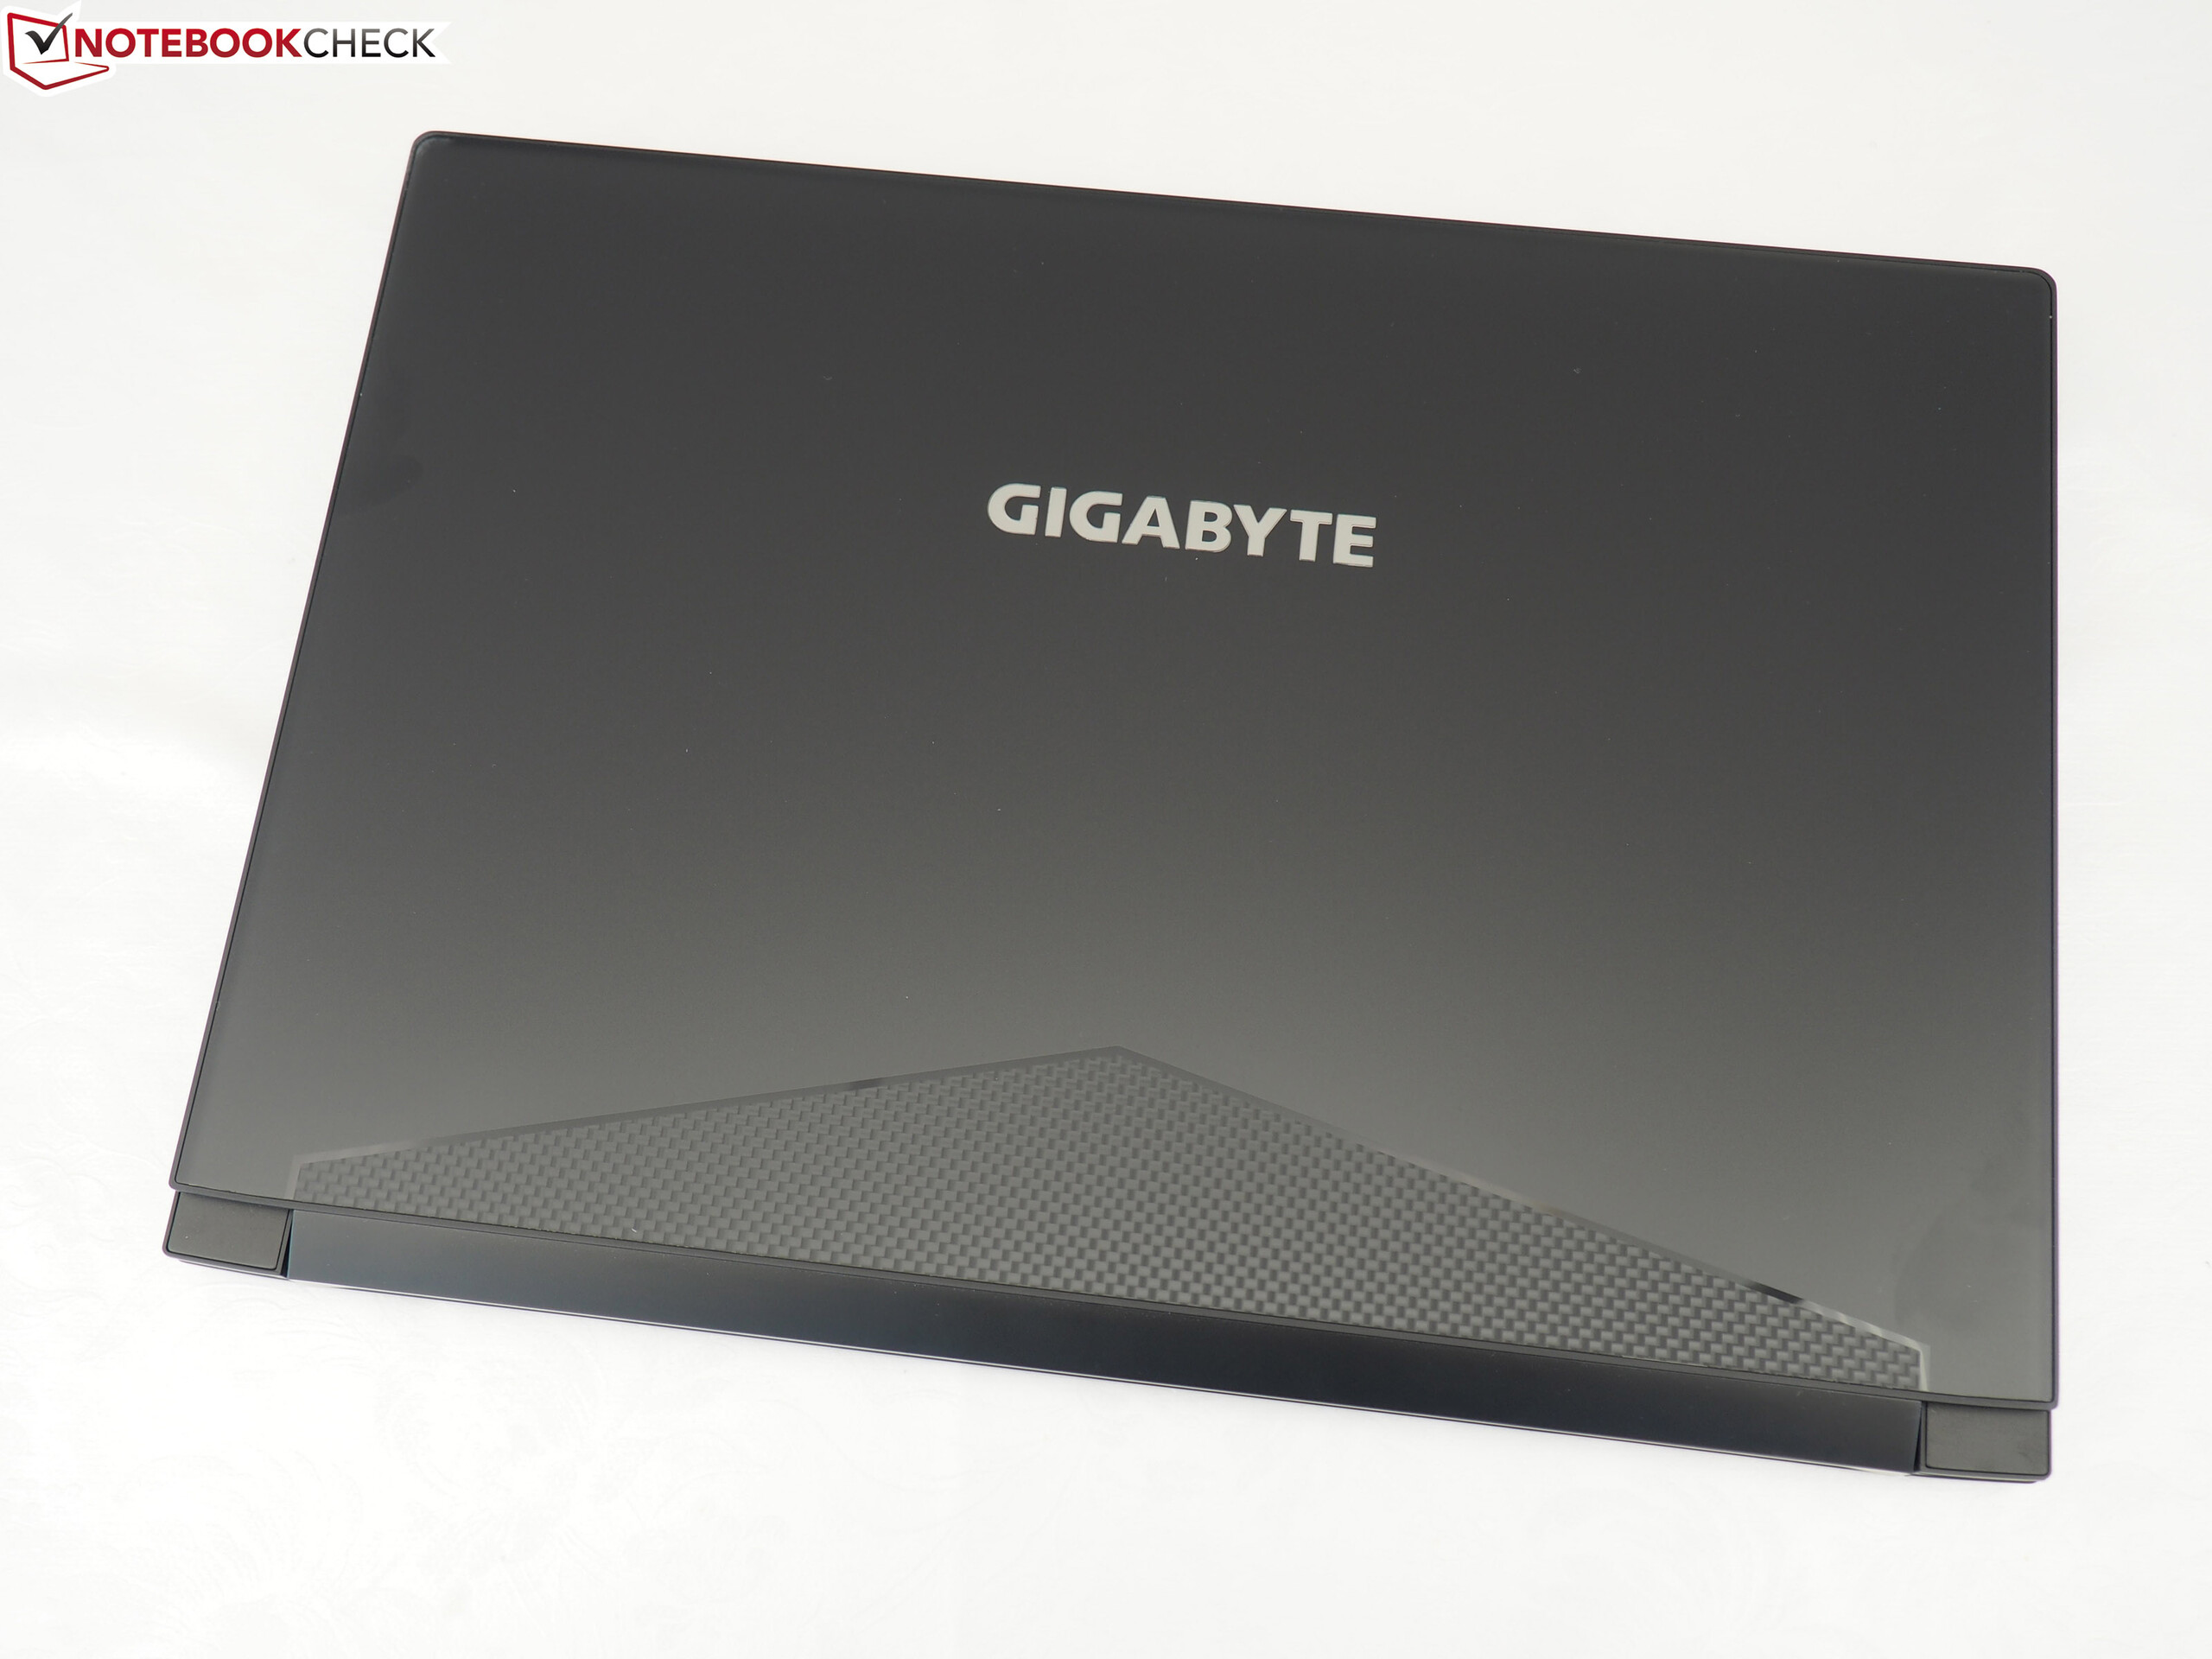
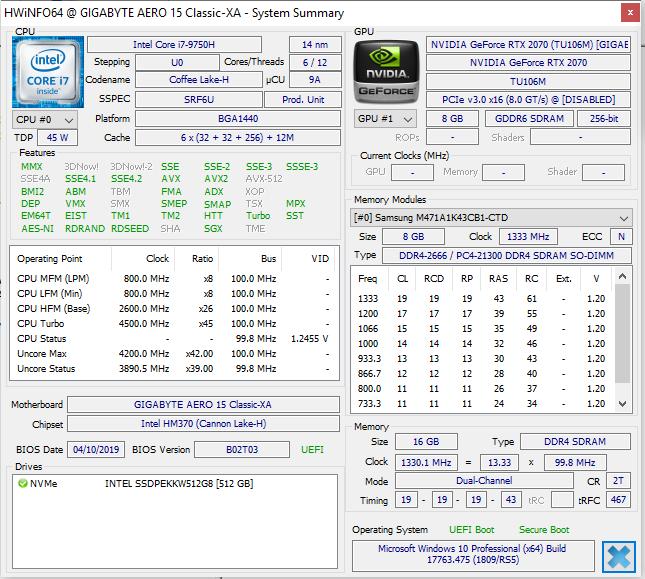
从外观来看,与其前代Aero 15-X9相比,Aero 15 Classic并没有真正的改变。所有的变化在于内部:笔记本电脑配备了全新的六核Core i7-9750H,Core i7-8750H的后续产品。
不过新的Core i7-9750H无法提供任何实质性的改进。
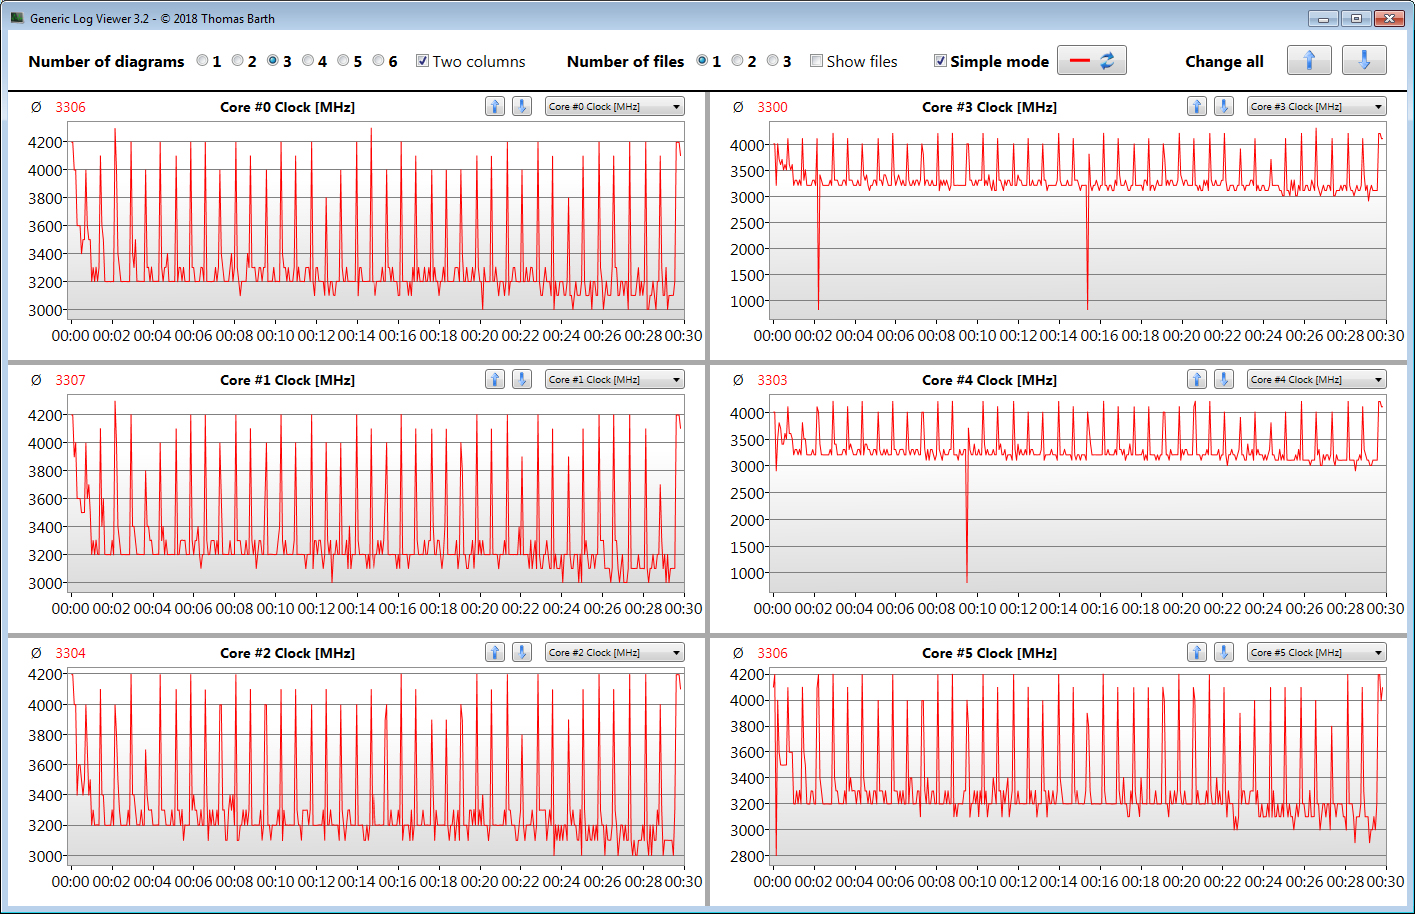
它无法真正利用其略高的内存,测试结果通常与i7-8750H相当。最重要的是,在高负载下性能会持续下降,我们使用CineBench R15进行循环测量。我们认为这台机子的散热压不住这块CPU。
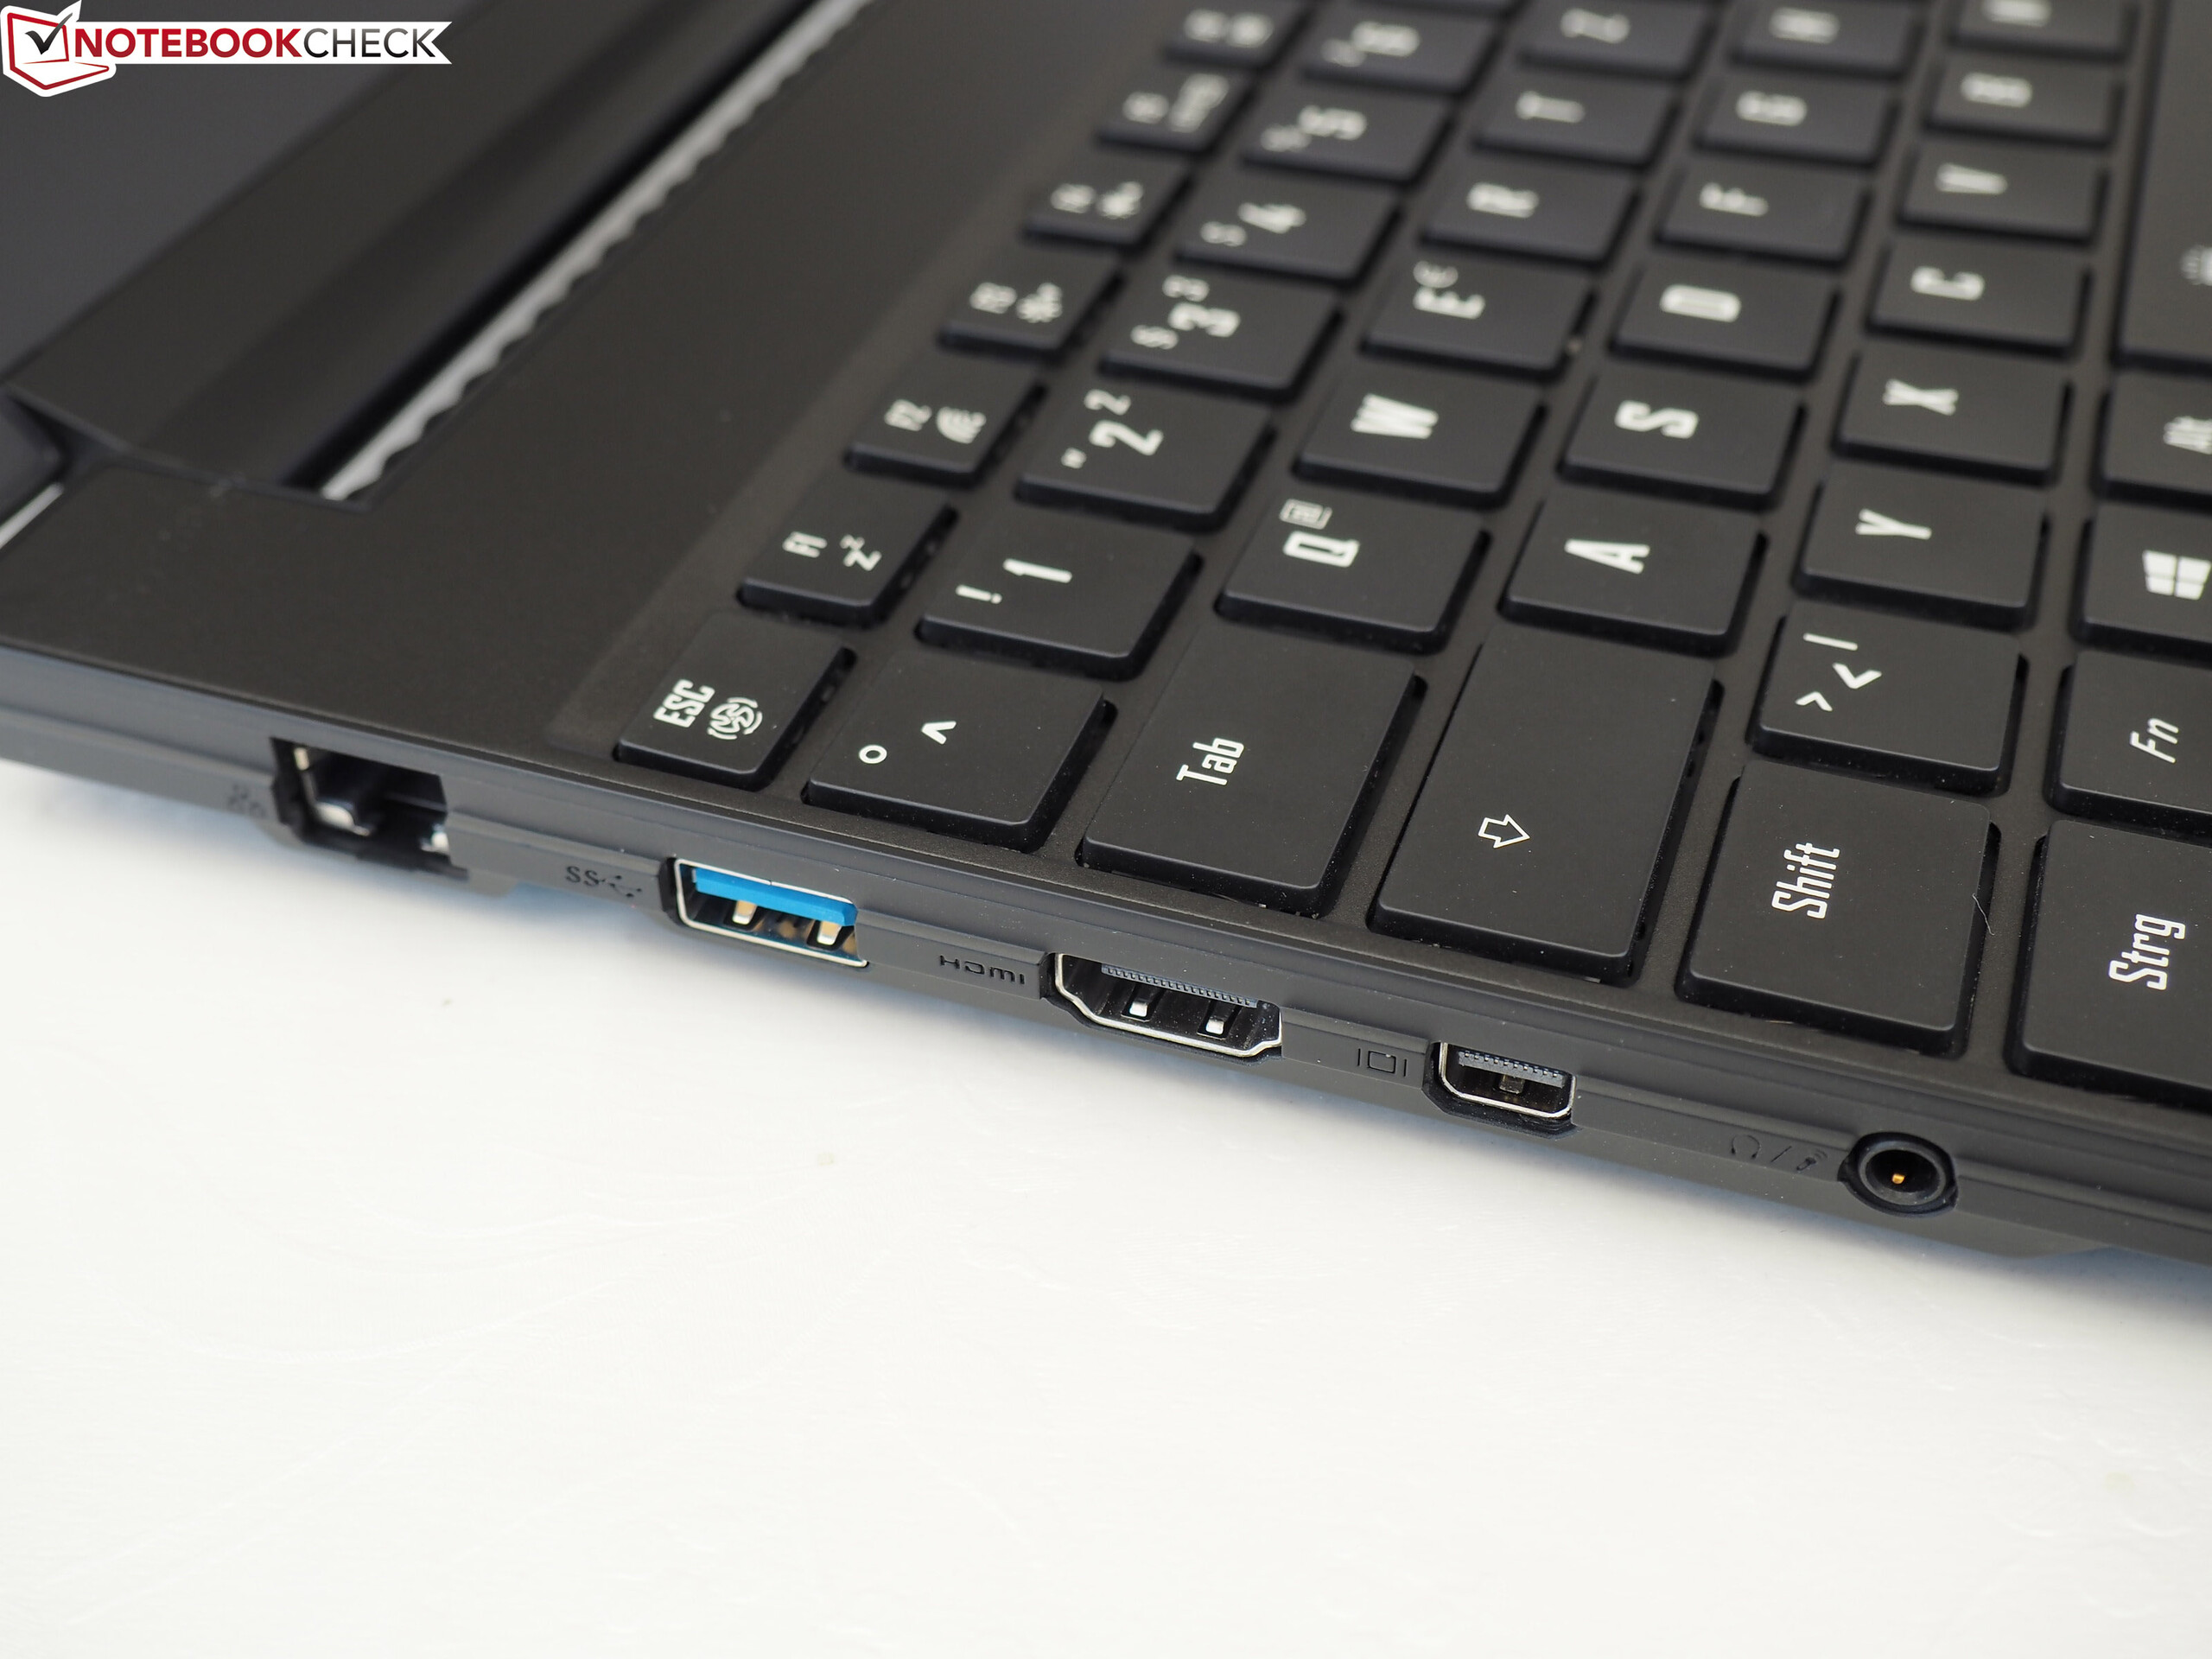
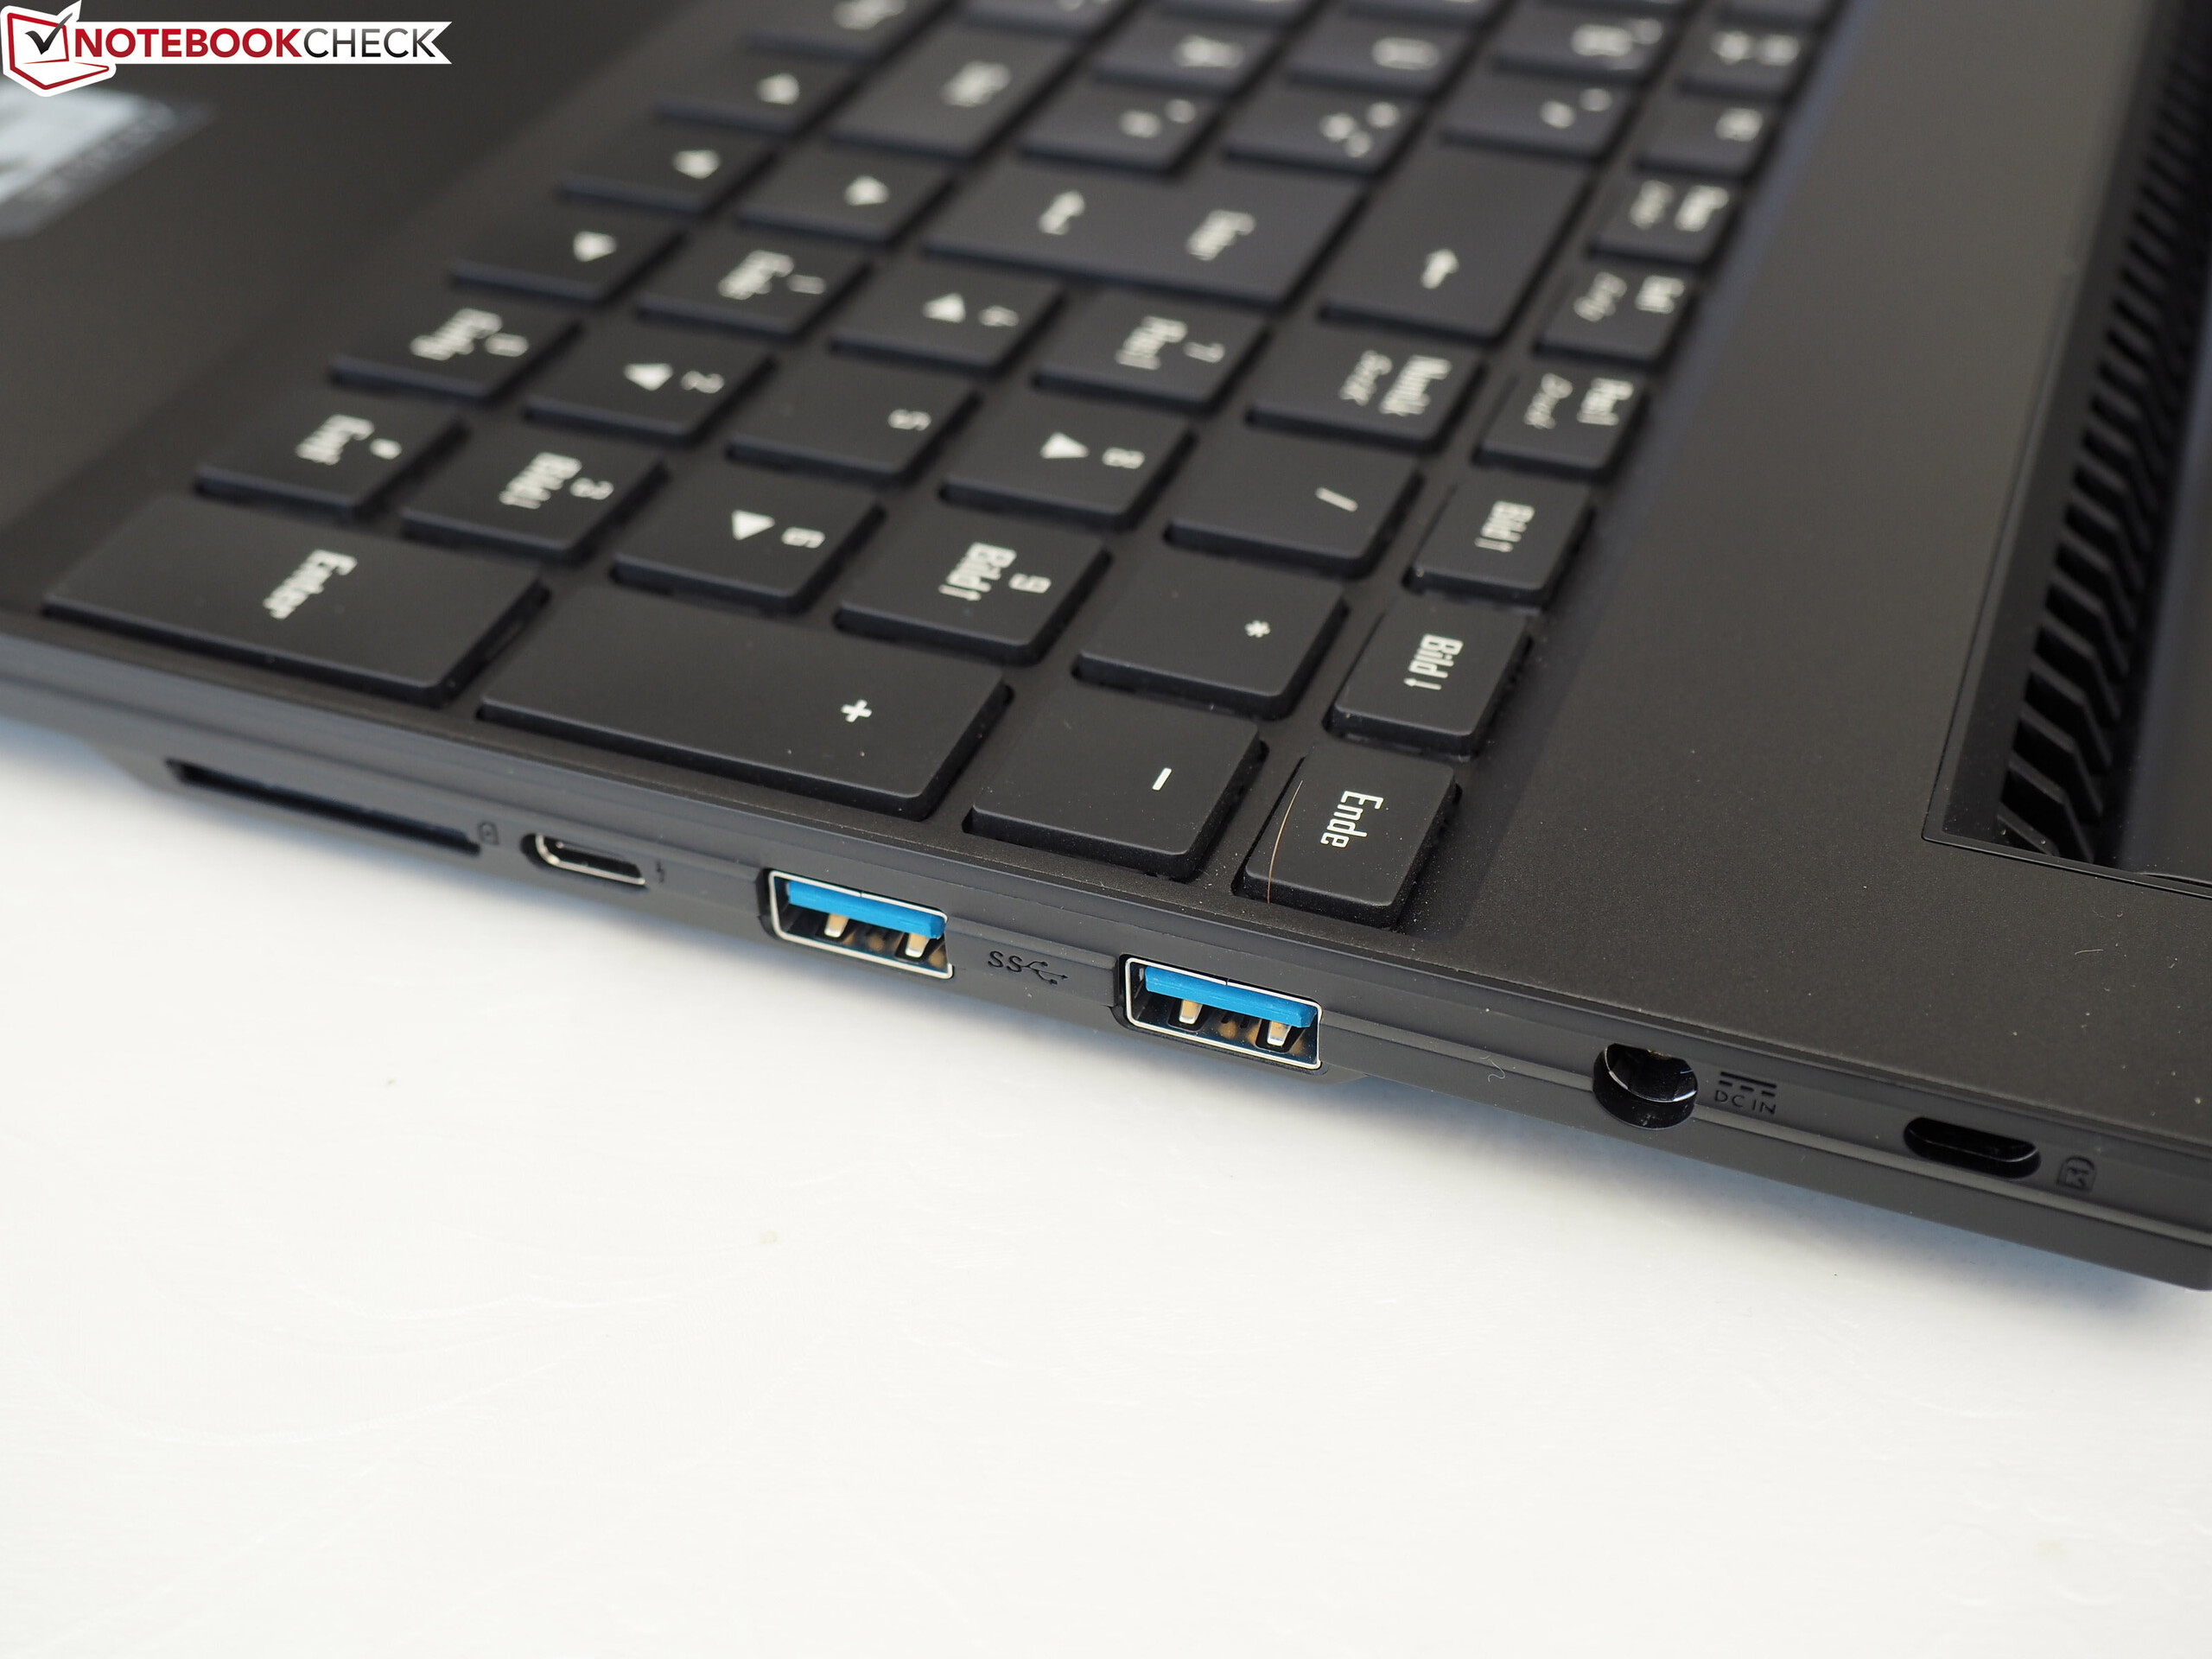
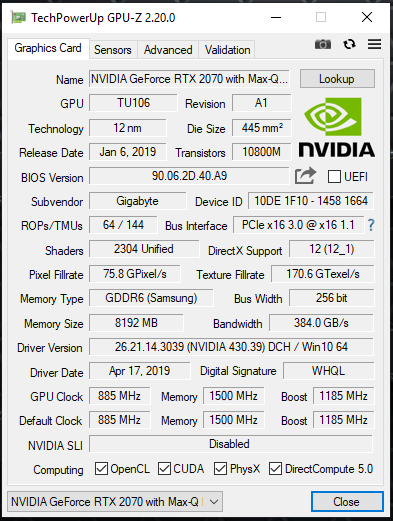
尽管如此,Core i7-9750H和GeForce RTX 2070 Max-Q的组合可以在1080p高画质下流畅的运行所有游戏。高速的NVMe SSD可实现流畅的系统性能,并且该设备还具有第二个M.2 2280 SSD的空闲插槽。
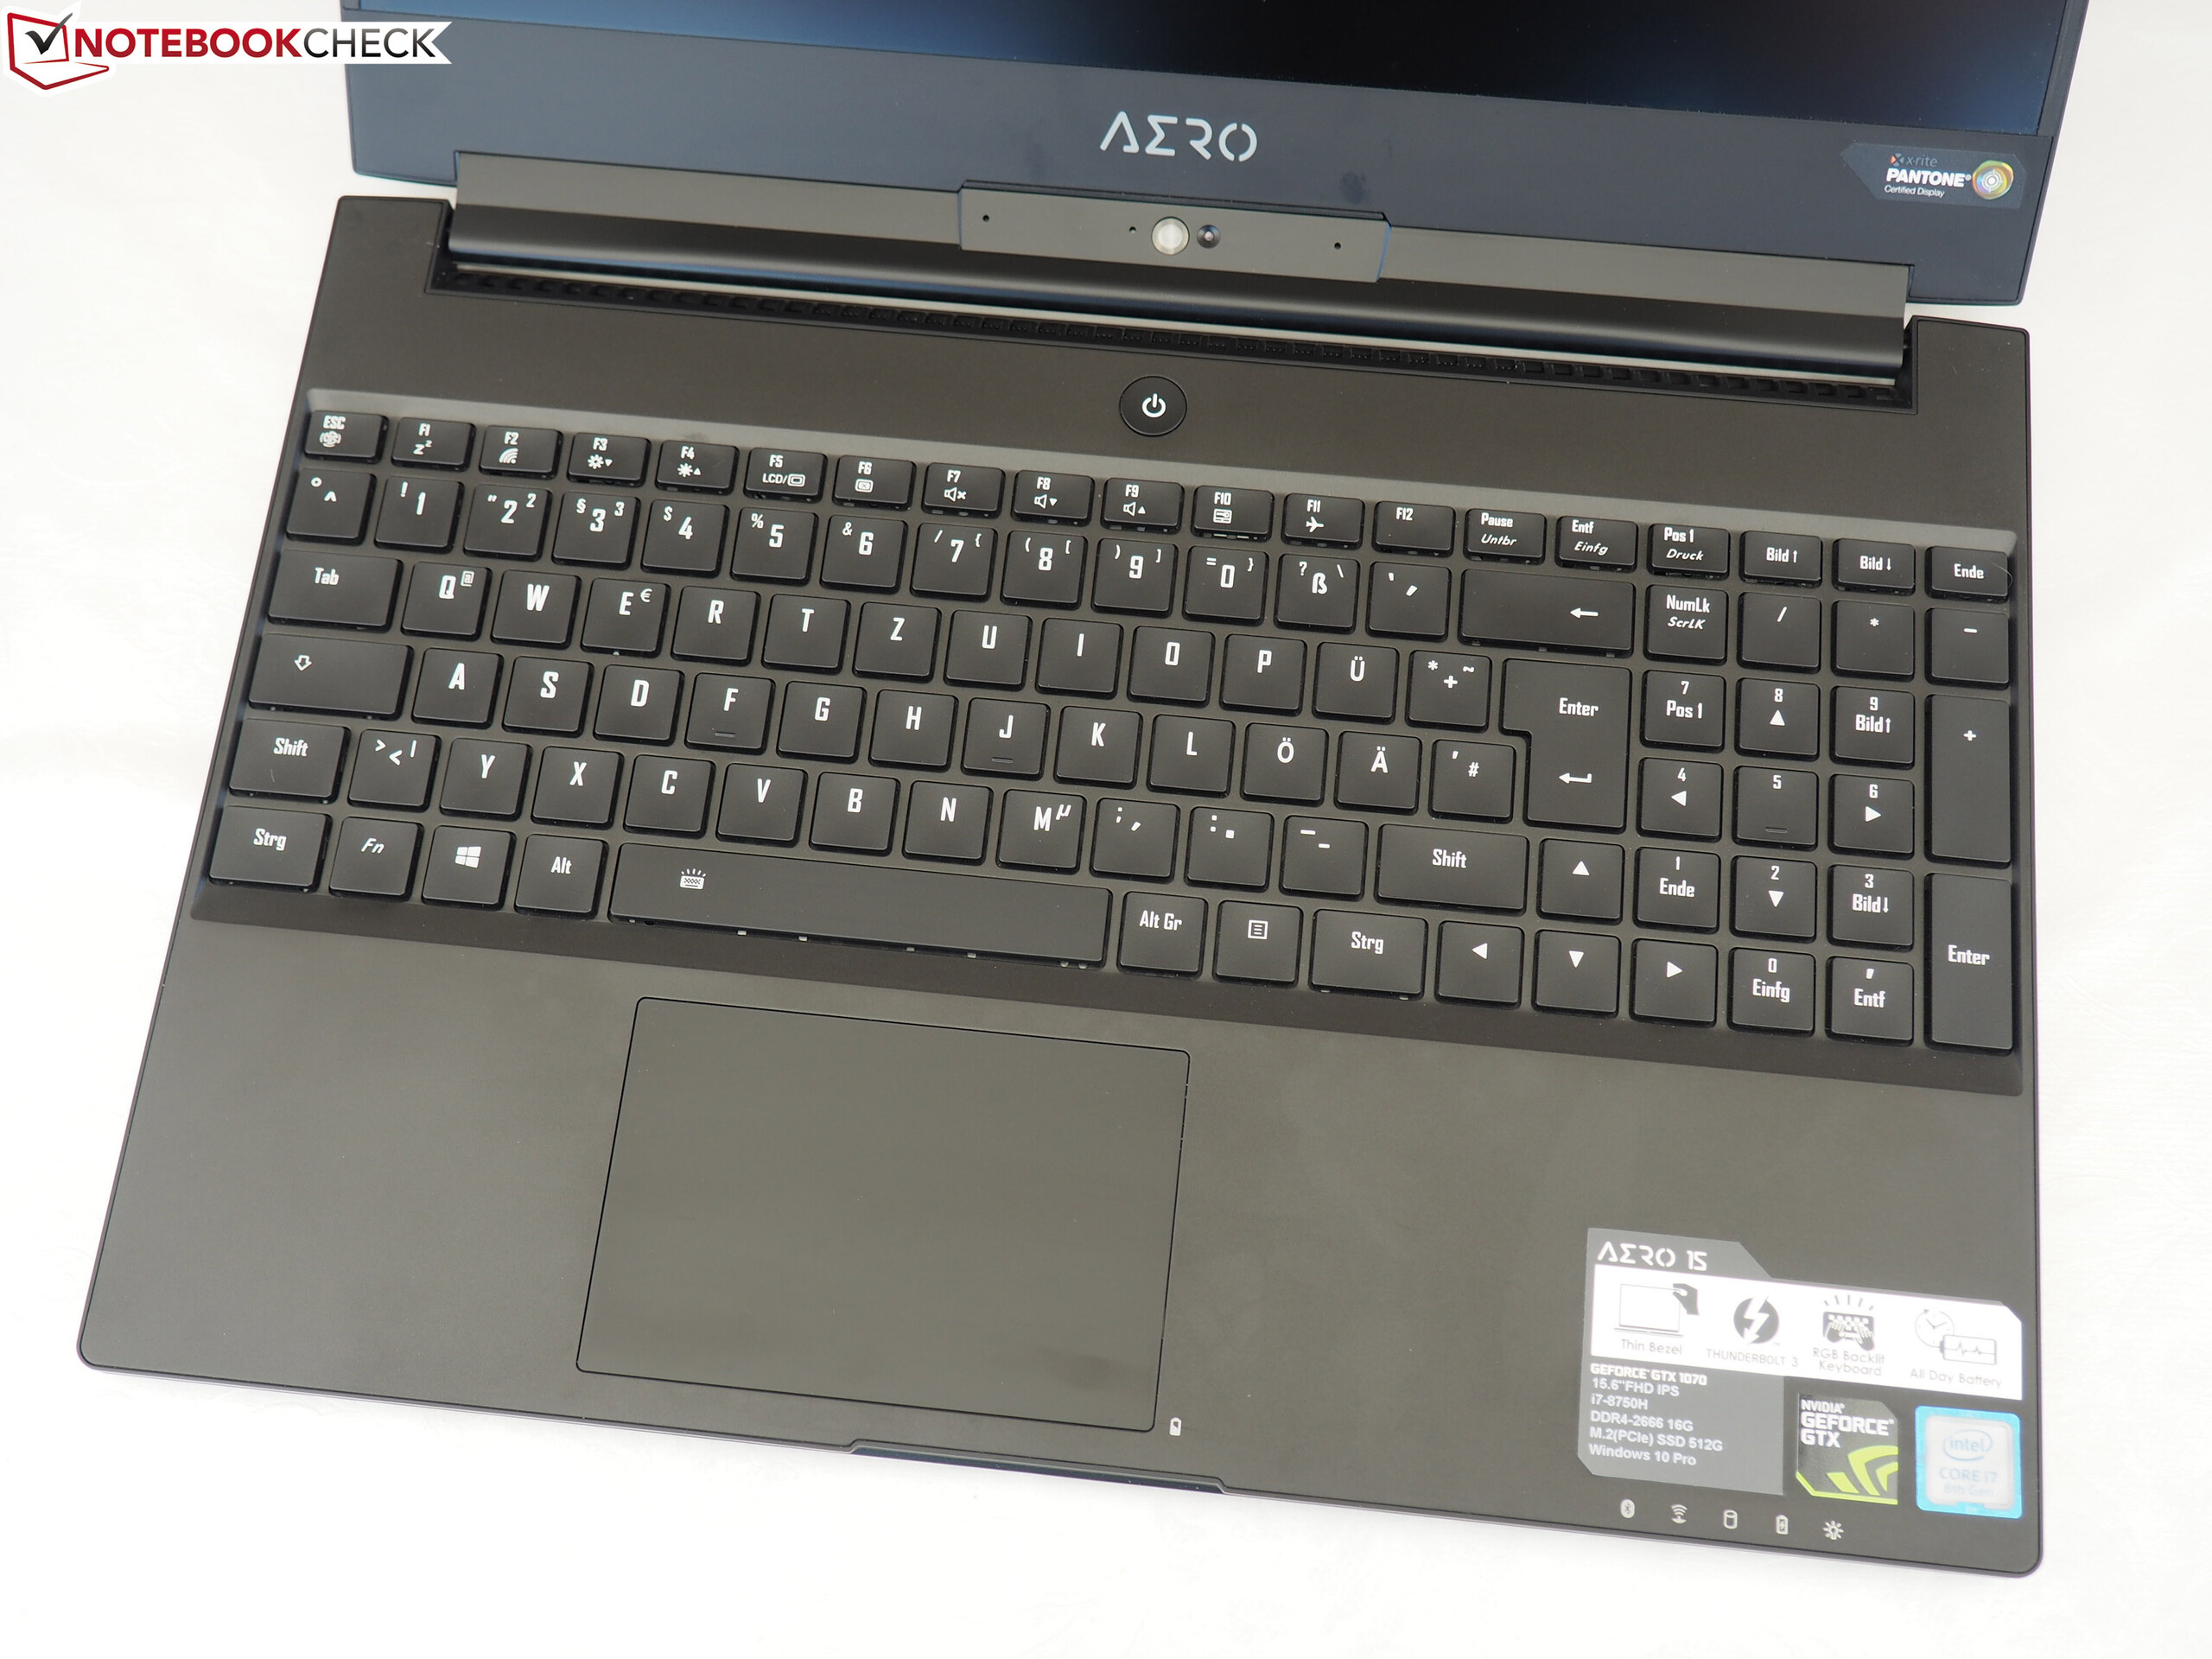
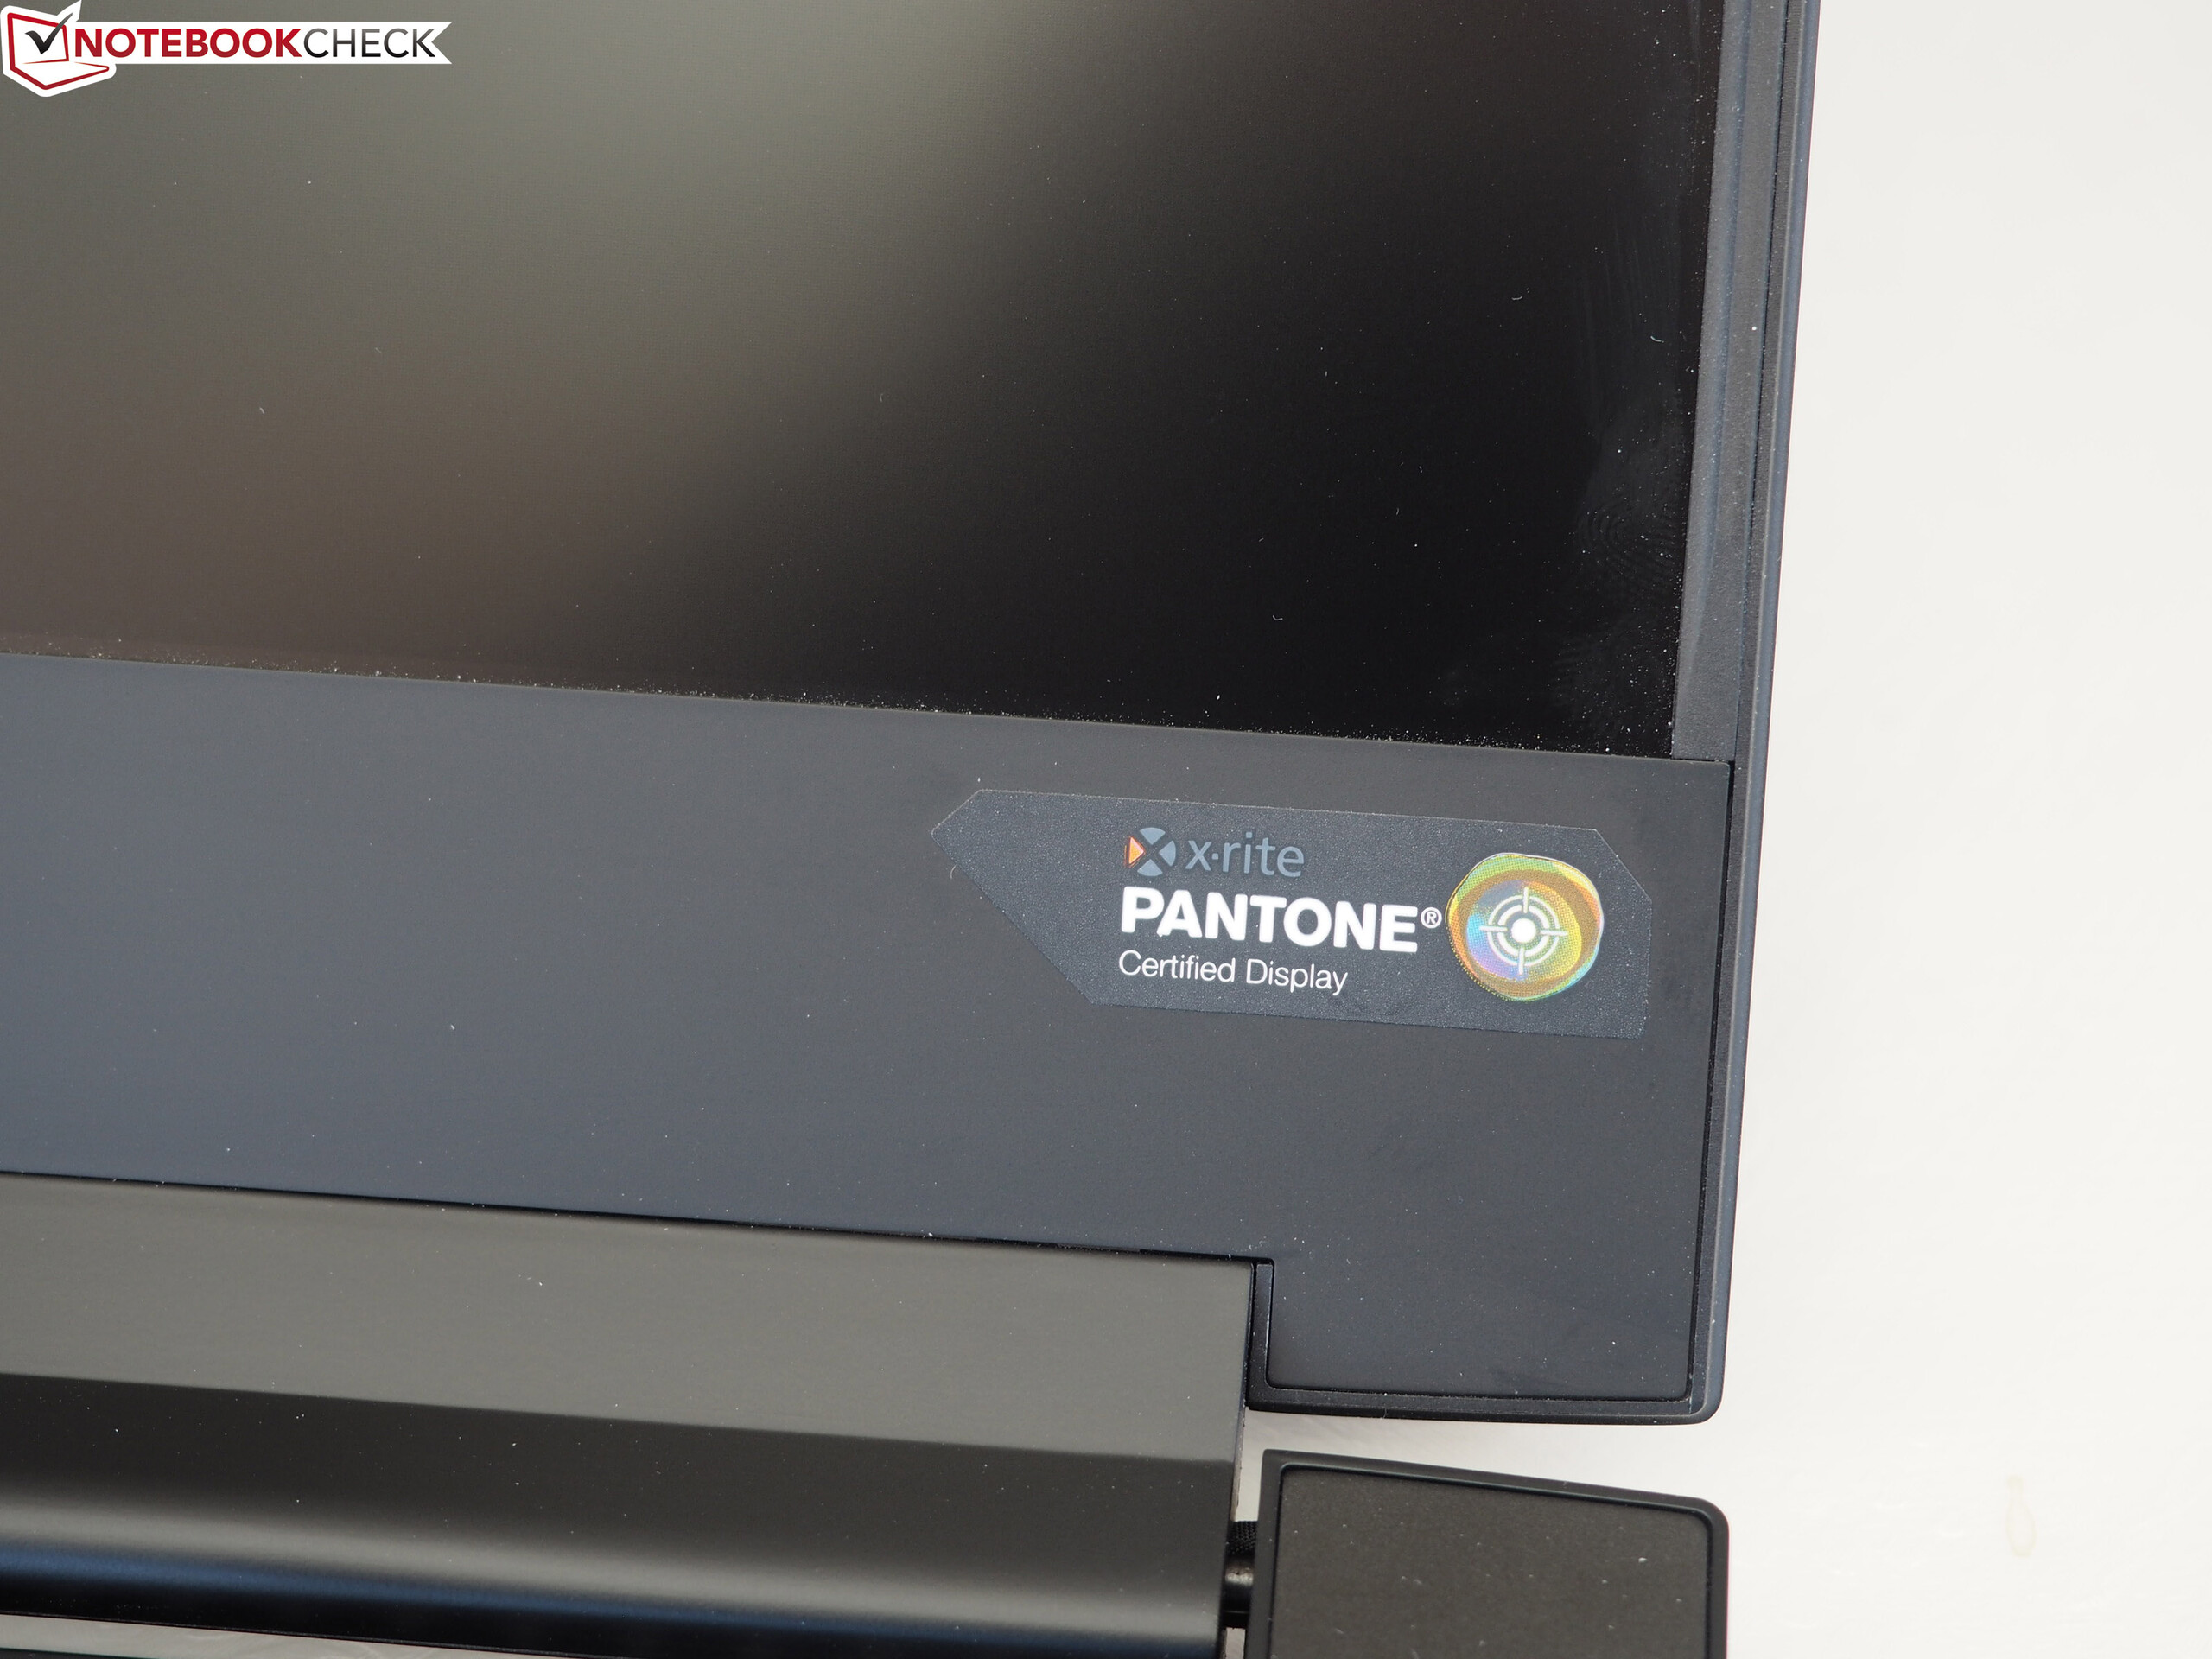
另一个改进是Aero 15 Classic的屏幕。虽然Aero 15-X9已经配备了144-Hz IPS显示屏,但技嘉为Aero 15 Classic提供了由夏普制造的240-Hz IGZO面板。这款新面板提供稳定的视角,快速的响应时间,当然还有很棒的色彩。然而,我们对亮度和对比度感到失望。考虑到这台设备的价格,这两项的表现算不上出色。续航时间对于游戏本来说非常棒。
Gigabyte Aero 15 Classic-XA
- 05/14/2020 v7 (old)
Sascha Mölck
Price comparison

